As filed with Securities and Exchange Commission on April 19, 201824, 2019
UNITED STATES SECURITIES AND EXCHANGE COMMISSION Washington, D.C. 20549 FORM 20-F SECURITIES AND EXCHANGE COMMISSION
|
Washington, D.C. 20549 |
|
FORM 20-F |
| |
| ☐ | REGISTRATION STATEMENT PURSUANT TO SECTION 12(b) OR (g) OF THE SECURITIES EXCHANGE ACT OF 1934 |
| OR |
| ☒ | ANNUAL REPORT PURSUANT TO SECTION 13 OR 15(d) OF THE SECURITIES EXCHANGE ACT OF 1934 For the fiscal year ended December 31, 20172018 |
| OR |
| ☐ | TRANSITION REPORT PURSUANT TO SECTION 13 or 15(d) OF THE SECURITIES EXCHANGE ACT OF 1934 |
| OR |
| ☐ | SHELL COMPANY REPORT PURSUANT TO SECTION 13 OR 15(d) OF THE SECURITIES EXCHANGE ACT OF 1934 Date of event requiring this shell company report _____________ For the transition period from __________ to __________ |
| |
Commission file number 001-15264 |
|
  |
(Exact name of Registrant as specified in its charter) |
|
| ALUMINUM CORPORATION OF CHINA LIMITED |
| (Translation of Registrant’s name into English) |
| |
People’s Republic of China
(Jurisdiction of incorporation or organization) |
| |
No. 62 North Xizhimen Street, Haidian District, Beijing People’s Republic of China (100082) (Address of principal executive offices) Yu DehuiLu Dongliang
No. 62 North Xizhimen Street, Haidian District, Beijing People’s Republic of China (100082) (86) 10 8229 8322 ir@chalco.com.cn |
| (Name, Telephone, Email and/or Facsimile number and Address of Company Contact Person) |
|
| Securities registered or to be registered pursuant to Section 12(b) of the Act. |
| |
Title of each class | Name of each exchange on which registered |
| American Depositary Shares* | New York Stock Exchange, Inc. |
| Class H Ordinary Shares** | |
| | | |
_______________________ |
| * | Evidenced by American Depositary Receipts. Each American Depositary Share represents 25 H Shares. |
| ** | Not for trading, but only in connection with the listing of American Depositary Shares, pursuant to the requirements of the Securities and Exchange Commission. |
| | |
Securities registered or to be registered pursuant to Section 12(g) of the Act.
None
(Title of Class)
Securities for which there is a reporting obligation pursuant to Section 15(d) of the Act.
None
(Title of Class)
Indicate the number of outstanding shares of each of the issuer’s classes of capital or common stock as of the close of the period covered by the annual report.
As of December 31, 2017: | 2018: | |
| Domestic Shares, par value RMB1.00 per share | 10,959,832,268 | |
| H Shares, par value RMB1.00 per share | 3,943,965,968 | |
Indicate by check mark if the registrant is a well-known seasoned issuer, as defined in Rule 405 of the Securities Act. Yesü ☑ No __☐
If this report is an annual or transition report, indicate by check mark if the registrant is not required to file reports pursuant to Section 13 or 15(d) of the Securities Exchange Act of 1934. Yes __☐ Noü ☑
Note – checkingChecking the box above will not relieve any registrant required to file reports pursuant to Section 13 or 15(d) of the Securities Exchange Act of 1934 from their obligations under those Sections.
Indicate by check mark whether the registrant (1) has filed all reports required to be filed by Section 13 or 15(d) of the Securities Exchange Act of 1934 during the preceding 12 months (or for such shorter period that the registrant was required to file such reports), and (2) has been subject to such filing requirements for the past 90 days. Yesü ☑ No __☐
Indicate by check mark whether the registrant has submitted electronically and posted on its corporate Web site, if any, every Interactive Data File required to be submitted and posted pursuant to Rule 405 of Regulation S-T (§232.405 of this chapter) during the preceding 12 months (or for such shorter period that the registrant was required to submit and post such files). Yesü ☑ No _☐
Indicate by check mark whether the registrant is a large accelerated filer, an accelerated filer, a non-accelerated filer, or an emerging growth company. See the definition of “large accelerated filer,” “accelerated filer,” and “emerging growth company” in Rule 12b-2 of the Exchange Act.
Large accelerated filerü ☑ | Accelerated filer ___☐ | Non-accelerated filer __☐ | Emerging growth company __☐ |
If an emerging growth company that prepares its financial statements in accordance with U.S. GAAP, indicate by check mark if the registrant has elected not to use the extended transition period for complying with any new or revised financial accounting standards† provided pursuant to Section 13(a) of the Exchange Act. __☐
†The term “new or revised financial accounting standard” refers to any update issued by the Financial Accounting Standards Board to its Accounting Standards Codification after April 5, 2012.
Indicate by check mark which basis of accounting the registrant has used to prepare the financial statements included in this filing:
U.S. GAAP __☐
International Financial Reporting Standards as issued by the International Accounting Standards Boardü ☑
Other __☐
If “Other” has been checked in response to the previous question, indicate by check mark which financial statement item the registrant has elected to follow.
Item 17 __☐ Item 18 __☐
If this is an annual report, indicate by check mark whether the registrant is a shell company (as defined in Rule 12b-2 of the Exchange Act).
Yes __☐ Noü ☑
(APPLICABLEONLYTO ISSUERSINVOLVEDIN BANKRUPTCY PROCEEDINGS DURING THEPASTFIVE YEARS)
Indicate by check mark whether the registrant has filed all documents and reports required to be filed by Sections 12, 13 or 15(d) of the Securities Exchange Act of 1934 subsequent to the distribution of securities under a plan confirmed by a court.
Yes __☐ No __
☐
TABLE OF CONTENTS
Forward-Looking Statements
Certain information contained in this annual report, which does not relate to historical information, may be deemed to constitute forward-looking statements. The words or phrases “will likely result,” “are expected to,” “will continue,” “is anticipated,” “estimate,” “project,” “believe” or similar expressions are intended to identify “forward-looking statements” within the meaning of Section 27A of the Securities Act of 1933, as amended, and Section 21E of the Securities Exchange Act of 1934, as amended. Such statements are subject to certain risks and uncertainties that could cause actual results to differ materially from historical results and those presently anticipated or projected. You should not place undue reliance on any such forward-looking statements, which speak only as of the date made. These forward-looking statements include, without limitation, statements relating to:
future general economic conditions;
future conditions in the international and China capital markets;
future conditions in the financial and credit markets;
future prices and demand for our products;
future PRC tariff levels for alumina and primary aluminum;
sales of our products;
the extent and nature of, and potential for, future developments;
production, consumption and demand forecasts of bauxite, coal, alumina and primary aluminum;
expansion, consolidation or other trends in the primary aluminum industry;
the effectiveness of our cost-saving measures;
future expansion, investment and acquisition plans and capital expenditures;
our proposed asset restructuring;
competition;
changes in legislation, regulations and policies;
estimates of proven and probable bauxite reserves;
our research and development plans; and
our dividend policy.
| ● | future general economic conditions; |
| ● | future conditions in the international and China capital markets; |
| ● | future conditions in the financial and credit markets; |
| ● | future prices and demand for our products; |
| ● | future PRC tariff levels for alumina and primary aluminum; |
| ● | the extent and nature of, and potential for, future developments; |
| ● | production, consumption and demand forecasts of bauxite, coal, alumina and primary aluminum; |
| ● | expansion, consolidation or other trends in the primary aluminum industry; |
| ● | the effectiveness of our cost-saving measures; |
| ● | future expansion, investment and acquisition plans and capital expenditures; |
| ● | our proposed asset restructuring; |
| ● | changes in legislation, regulations and policies; |
| ● | estimates of proven and probable bauxite reserves; |
| ● | our research and development plans; and |
These statements are based on assumptions and analyses made by us in light of our experience and our perception of historical trends, current conditions and future developments, as well as other factors we believe are appropriate in particular circumstances. However, whether actual results and developments will meet our expectations and predictions depends on a number of risks and uncertainties, which could cause actual results to differ materially from our expectations. These risks are more fully described in the section headed “Item 3. Key Information - D. Risk Factors.”
Consequently, all of the forward-looking statements made in this annual report are qualified by these cautionary statements. We cannot assure you that the actual results or developments anticipated by us will be realized or, even if substantially realized, that they will have the expected effect on us or our business or operations.
Certain Terms and Conventions
“Chalco,” “the Company,” “the Group,” “our Company,” “our Group,” “we,” “our” and “us” refer to Aluminum Corporation of China Limited and its subsidiaries and, where appropriate, to its predecessors;
“A SharesShare(s)” and “domestic sharesshare(s)” refer to our domestic ordinary shares,share(s), with a par value of RMB1.00 each, which are listed on the Shanghai Stock Exchange;
“ADR(s)” refers to the American Depositary Receipt(s);
“ADS(s)” refers to the American Depositary Share(s);
“alumina-to-silica ratio” refers to the ratio of alumina to silica in bauxite by weight;
“aluminum fabrication” refers to the process of converting primary aluminum or recycled aluminum materials into plates, strips, bars, tubes and other fabricated products;
“Australian dollar” refers to the lawful currency of the Commonwealth of Australia;
“Baotou Aluminum” refers to Baotou Aluminum Company Limited, 74.33%our wholly-owned subsidiary established under the PRC law;
“Baotou Aluminum Group” refers to Baotou Aluminum (Group) Co., Ltd., a subsidiary of the equity interest of which is owned by us;Chinalco;
“bauxite” refers to a mineral ore that is principally composed of aluminum;
“Bayer process” refers to a refining process that employs a strong solution of caustic soda at an elevated temperature to extract alumina from ground bauxite;
“Bayer-sintering combined process” and “Bayer-sintering series process” refer to the two methods of refining process developed in China which involve the combined application of the Bayer process and the sintering process to extract alumina from bauxite;
“Board” refers to our board of directors;
“Boffa Project” refers to the project to develop and operate a bauxite mine located in Boffa, Guinea, in accordance with a mining convention entered into by Chalco Hong Kong, Chalco Guinea Company S.A. and the Guinean government on June 8, 2018;
“CBEX” refers to China Beijing Equity Exchange, an approved equity exchange for the transfer of state-owned assets;
“Chinalco Assets” refers to Chinalco Assets Operation and Management Co., Ltd., a wholly-owned subsidiary of Chinalco;
“Chalco Energy” refers to Chalco Energy Co., Ltd., our wholly-owned subsidiary established under the PRC law;
“Chalco Hong Kong” refers to Chalco Hong Kong Limited, our wholly-owned subsidiary established under Hong Kong Law;
“Chalco Iron Ore” refers to Chalco Iron Ore Holding Limited, our subsidiary until December 2013 when we disposed of 65% of its equity interest to Chinalco;
“Chalco Liupanshui” refers to Chalco Liupanshui Hengtaihe Mining Co., Ltd., 49% of the equity interest of which is owned by us;
“Chalco Logistics” refers to Chalco Logistics Group Co., Ltd., our wholly-owned subsidiary established under the PRC law;
“Chalco Mining” refers to Chalco Mining Co., Ltd., 18.86% of the equity interest of which is owned by us;
“Chalco Nanhai” refers to Chalco Nanhai Alloy Company, our wholly-owned subsidiary established under the PRC law;
“Chalco Ruimin” refers to Chalco Ruimin Company Limited, our subsidiary until June 2013 when we disposed of 93.30% of its equity interest to Chinalco;
“Chalco Shandong” refers to Chalco Shandong Co., Ltd., 69.20% ofour wholly-owned subsidiary established under the equity interest of which is owned by us;PRC law;
“Chalco Shanghai” or “Chinalco Shanghai” refers to Chalco Shanghai Company Limited, our wholly-owned subsidiary established under the PRC law;
“Chalco Southwest Aluminum” refers to Chalco Southwest Aluminum Company Limited, our subsidiary until June 2013 when we disposed of 60% of its equity interest to Chinalco;
“Chalco Southwest Aluminum Cold Rolling” refers to Chalco Southwest Aluminum Cold Rolling Company Limited, our wholly-owned subsidiary until June 2013 when we disposed of its entire equity interest to Chinalco;
“Chalco Trading” refers to China Aluminum International Trading Co., Ltd., our wholly-owned subsidiary established under the PRC law;
“Chalco Xing County Alumina Project” refers to the Bayer process production system and ancillary facilities at Xing County, Lv LiangLvliang City of Shanxi Province with production capacity of 800,000 tonnes of metallurgical grade alumina per year;
“Chalco Zhongzhou” refers to Chalco Zhongzhou Aluminum Co., Ltd., 63.10% of the equity interest of which is owned by us;
“China” and the “PRC” refer to the People’s Republic of China, excluding, for purposes of this annual report, Hong Kong Special Administrative Region, Macao Special Administrative Region and Taiwan;
“China Copper” refers to China Copper Co., Ltd., a wholly-owned subsidiary of Chinalco;
“China United Assets Appraisal” refers to China United Assets Appraisal Group Co., Ltd., a PRC qualified valuer;
“Chinalco” and “Chinalco Group” refer to our controlling shareholder, Aluminum Corporation of China and its subsidiaries (other than Chalco and its subsidiaries) and, where appropriate, to its predecessors;
“Chinalco Finance” refers to Chinalco Finance Co., Ltd.;
“CSRC” refers to China Securities Regulatory Commission;
“Dongdong Coal” refers to Shaanxi Chengcheng Dongdong Coal Co., Ltd., 45% of the equity interest of which is owned by us;
“Energy-Saving and Emission Reduction Goals” refers to the energy-saving and emission reduction goals set out in China’s 13th Five-Year Plan for National Economic and Social Development laid out in 2016, in accordance with which China expects to, by the end of 2020, reduce its per unit GDP energy consumption by 15% compared with the 2015 level;
“Exchange Act” refers to the U.S. Securities Exchange Act of 1934, as amended;
“Euro” refers to the lawful currency of the Eurozone;
“Fushun Aluminum” refers to Fushun Aluminum Company Limited, our wholly-owned subsidiary established under the PRC law;
“Gansu Hualu” refers to Gansu Hualu Aluminum Company Limited, 51% of the equity interest of which is owned by us;
“Gansu Huayang” refers to Gansu Huayang Mining Development Company Limited, 70% of the equity interest of which is owned by us;
“GNF” refers to Guinea franc, the lawful currency of the Republic of Guinea;
“Guangxi Investment” refers to Guangxi Investment (Group) Co., Ltd., formerly known as Guangxi Development and Investment Co., Ltd., a PRC state-owned enterprise;
“Guizhou Development” refers to Guizhou Provincial Materials Development and Investment Corporation, a PRC state-owned enterprise and one of our promoters and shareholders;
“Guizhou Huajin” refers to Guizhou Huajin Aluminum Co., Ltd., 60% of the equity interest of which is owned by us;
“Guizhou Huaren” refers to Guizhou Huaren New Materials Co., Ltd., 40% of the equity interest of which is owned by us;
“Guizhou Yuneng” refers to Guizhou Yuneng Mining Co., Ltd., 25% of the equity interest of which is owned by us;
“H SharesShare(s)” refers to overseas listed foreign sharesshare(s) with a par value of RMB1.00 each, which are listed on the Hong Kong Stock Exchange;
“Henan Aluminum” refers to Chalco Henan Aluminum Company Limited, our subsidiary until June 2013 when we disposed of 90.03% of its equity interest to Chinalco;
“HK$” and “HK dollars” refer to Hong Kong dollars, the lawful currency of the Hong Kong Special Administrative Region of the PRC;
“Hong Kong Stock Exchange” refers to The Stock Exchange of Hong Kong Limited;
“Huaxi Aluminum” refers to Huaxi Aluminum Company Limited, our subsidiary until June 2013 when we disposed of 56.86% of its equity interest to Chinalco;
“Inner Mongolia Huayun” refers to Inner Mongolia Huayun New Materials Co., Ltd., a subsidiary50% of the equity interest of which is owned by Baotou Aluminum;
“IRS” refers to Internal Revenue Service of the United States federal government;
“Japanese Yen” refers to the lawful currency of Japan;
“Jiaozuo Wanfang” refers to Jiaozuo Wanfang Aluminum Manufacturing Co. Ltd.;
“Ka” refers to kiloamperes, a unit for measuring the strength of an electric current, with one kiloampere equaling 1,000 amperes;
“kWh” refers to kilowatt-hours, a unit of electrical power, meaning one kilowatt of power for one hour;
“Lanzhou Aluminum” refers to Lanzhou Aluminum Co., Ltd., our wholly-owned subsidiary from April 2007 until July 2007 when itsince January 2019, which was divided into two wholly-owned entities: Lanzhou branch and Northwest Aluminum;
“Liancheng branch” refers topreviously our wholly-owned branch, which was formerly known as Lanzhou Liancheng Longxing Aluminum Company Limited, before we acquired 100% of its equity interest;branch;
“Listing Rules” and “Hong Kong Listing Rules” refer to the Rules Governing the Listing of Securities on the Hong Kong Stock Exchange, as amended;
“LME” refers to the London Metal Exchange Limited;
“MIIT” refers to Ministry of Industry and Information Technology of the PRC;
“MOF” refers to Ministry of Finance of the PRC;
“Nanchu” refers to ENanchu (http://www.enanchu.com/), ana nonferrous metal-related portal site in PRC;
“NDRC” refers to China National Development and Reform Commission;
“Ningxia Energy” refers to China Aluminum Ningxia Energy Group Co., Ltd., formerly known as Ningxia Electric Power Group Co., Ltd., before we acquired 70.82% of its equity interest in January 2013;
“Northwest Aluminum” refers to Northwest Aluminum Fabrication Branch, our wholly-owned branch until June 2013 when we disposed of all its assets to a subsidiary of Chinalco;
“NYSE” and“New York Stock Exchange” refer to the New York Stock Exchange Inc.;
“ore-dressing Bayer process” refers to a refining process we developed to increase the alumina-to-silica ratio of bauxite;
“PBOC” refers to People’s Bank of China;
“Qingdao Light Metal” refers to Chalco Qingdao Light Metal Company Limited, our wholly-owned subsidiary until June 2013 when we disposed of its entire equity interest to Chinalco. In December 2017, we acquired 100% of the equity interest in Qingdao Light Metal through Chalco Shandong at a consideration of RMB300.4 million to further our prospective strategic layout on secondary aluminum;
“Qinghai Energy” refers to Qinghai Province Energy Development (Group) Co., Ltd., 21% of the equity interest of which is owned by us;
“refining” refers to the chemical process used to produce alumina from bauxite;
“Rio Tinto” refers to Rio Tinto plc, a company incorporated in England and Wales, the shares of which are listed on the London Stock Exchange and the New York Stock Exchange;
“RMB” and “Renminbi”refer to the lawful currency of the PRC;
“SAT” refers State Administration of Taxation of the PRC;
“SAFE” refers to State Administration of Foreign Exchange of the PRC;
“SASAC” refers to State-owned Assets Supervision and Administration Commission of the State Council of China;
“SEC” refers to the U.S. Securities and Exchange Commission;
“Securities Act” refers to the U.S. Securities Act of 1933, as amended;
“Shandong Huayu” refers to Shandong Huayu Alloy Material Co., Ltd., 55% of the equity interest of which is owned by us;
“Shanxi Jiexiu” refers to Shanxi Jiexiu Xinyugou Coal Industry Co., Ltd., 34% of the equity interest of which is owned by us;
“Shanxi Huasheng” refers to Shanxi Huasheng Aluminum Company Limited, 51% of the equity interest of which is owned by us;
“Shanxi Huaxing” refers to Shanxi Huaxing Aluminum Co., Ltd., formerly a wholly-owned subsidiary of our Group. We disposed of 50% ofestablished under the equity interest in Shanxi Huaxing in 2015, and as a result Shanxi Huaxing has become our joint venture in accordance with relevant accounting standards;PRC law.
“Shanxi New Material” or “Shanxi Huaze” refers to Chalco Shanxi New Material Co., Ltd., formerly known as Shanxi Huaze Aluminum and Power Co., Limited, 85.98% of the equity interest of which is owned by us;
“Shanxi Other Mines” refers to the seveneight mines to which we entrusted another party to conduct mining activities, including Changjialing mine (with Shangtan mine consolidated), Guxian mine (with Jindui mine consolidated), Loufan mine (with Shicao mine consolidated), Nanpo mine, Xishan mine, Yangjiashan mine, Niucaogou mine and Xiwupu mine in Shanxi Province;
“Shanxi Zhongrun” refers to Shanxi China Huarun Co., Ltd., 40% of the equity interest of which is owned by us;
“SHFE” refers to the Shanghai Futures Exchange;
“Simandou Project” refers to the project to develop and operate the Simandou iron ore mine located in Guinea in West Africa as further described in the Simandou joint development agreement dated July 29, 2010, entered into among Rio Tinto, Rio Tinto Iron Ore Atlantic Limited and us for the purpose of development of the Simandou Project;
“sintering process” refers to a refining process employed to extract alumina from bauxite by mixing ground bauxite with supplemental materials and burning the mixture in a coal-fired kiln;
“smelting” refers to the electrolytic process used to produce molten aluminum from alumina;
“tonne” refers to the metric ton, a unit of weight, that is equivalent to 1,000 kilograms or 2,204.6 pounds;
“US$,” “dollars” and “U.S. dollars” refer to the lawful currency of the United States;
“Xinghua Technology” refers to Chinalco Shanxi Jiaokou Xinghua Technology Ltd.,66% of the equity interest of which is owned by us;
“Yangtze” refers to the Shanghai Changjiang Nonferrous Metals Spot Market;
“Yunnan SASAC” refers to the State-owned Assets Supervision and Administration Commission of Yunnan Provincial People’s Government;
“Zhangze Electric Power” refers to Shanxi Zhangze Electric Power Co., Ltd., which owns 14.02% of equity interest in Shanxi New Material;
“Zhengzhou Institute” refers to Chalco Zhengzhou Research Institute of Non-ferrous Metal Co., Ltd., our wholly-owned subsidiary, which primarily provides research and development services;
“Zhongzhou Aluminum” refers to Chalco Zhongzhou Aluminum Co., Ltd., our wholly-owned subsidiary established under the PRC law;
“Zunyi Alumina” refers to Chalco Zunyi Alumina Co., Ltd., 73.28% of the equity interest of which is owned by us;was merged intoZunyi Aluminum in June 2018; and
“Zunyi Aluminum” refers to Zunyi Aluminum Co., Ltd., 62.10%67.445% of the equity interest of which is owned by us.
Translations of amounts in this annual report from Renminbi to U.S. dollars and vice versa have been made at the rate of RMB6.5063RMB6.8755 to US$1.00, the exchange rate as set forth in the H.10 statistical release of the Federal Reserve Board for December 29, 2017.31, 2018. We make no representation that any Renminbi or U.S. dollar amounts could have been, or could be, converted into U.S. dollars or Renminbi, as the case may be, at any particular rate, the rates stated below, or at all. See “Item 3. Key Information - A. Selected Financial Data - Exchange Rate Information” for historical exchange rates between Renminbi and U.S. dollar.
Any discrepancies in any table between the amounts identified as total amounts and the sum of the amounts listed therein are due to rounding.
PART I
| Item 1.Identity of Directors, Senior Management and Advisors | Identity of Directors, Senior Management and Advisors |
Not applicable.
| Item 2.Offer Statistics and Expected Timetable | Offer Statistics and Expected Timetable |
Not applicable.
Item 3. Key Information
| A. | Selected Financial Data |
Historical Financial Information
The following table presents our selected financial data. The selected consolidated statements of financial position data as of December 31, 20162017 and 2017,2018, and the selected consolidated statements of comprehensive income (except for earnings per ADS) and consolidated cash flow data for the years ended December 31, 2015, 2016, 2017 and 2017,2018, are derived from our audited consolidated financial statements included elsewhere in this annual report, and should be read in conjunction with those consolidated financial statements. The selected consolidated statements of financial position data as of December 31, 2013, 2014, 2015 and 20152016 and the selected consolidated statements of comprehensive income (except for earnings per ADS) and consolidated cash flow data for the years ended December 31, 20132014 and 20142015 are derived from our consolidated financial statements which are not included in this annual report. Our consolidated financial statements are prepared in accordance with International Financial Reporting Standards, or IFRS, as issued by the International Accounting Standards Board.
We disposed of substantially all of our aluminum fabrication operations to Chinalco in June 2013. As a result, the operating results of our aluminum fabrication segment were presented as a discontinued operation in our consolidated statement of comprehensive income for the year ended December 31, 2013.
As the business combination under common control incurred in the years ended December 31, 2015, 2016, 2017 and 2017,2018, the comparative financial data for the years ended December 31, 2013, 2014, 2015, 2016 and 20162017 are revised to reflect the business combination under common control.
| | | For the Year Ended December 31, |
| | | 2013 | | 2014 | | 2015 | | 2016 | | 2017 | | 2017 |
| | | RMB | | RMB | | RMB | | RMB | | RMB | | US$ |
| | | (in thousands, except per share and per ADS data) |
| Consolidated Statements of Comprehensive Income Data |
| Revenue | | | 169,941,495 | | | | 142,244,119 | | | | 123,667,667 | | | | 144,228,916 | | | | 180,080,750 | | | | 27,677,904 | |
| Continuing Operations | | | | | | | | | | | | | | | | | | | | | | | | |
| Cost of sales | | | (167,201,987 | ) | | | (141,617,985 | ) | | | (121,172,307 | ) | | | (133,674,345 | ) | | | (165,675,021 | ) | | | (25,463,784 | ) |
| Gross profit | | | 2,739,508 | | | | 626,134 | | | | 2,495,360 | | | | 10,554,571 | | | | 14,405,729 | | | | 2,214,120 | |
| Selling and distribution expenses | | | (1,878,719 | ) | | | (1,770,459 | ) | | | (1,787,815 | ) | | | (2,069,430 | ) | | | (2,342,484 | ) | | | (360,033 | ) |
| General and administrative expenses | | | (2,959,390 | ) | | | (4,854,547 | ) | | | (2,358,789 | ) | | | (3,360,710 | ) | | | (4,568,246 | ) | | | (702,127 | ) |
| Research and development expenses | | | (193,620 | ) | | | (293,766 | ) | | | (168,870 | ) | | | (168,862 | ) | | | (494,590 | ) | | | (76,017 | ) |
| Impairment loss on property, plant and equipment | | | (501,159 | ) | | | (5,679,521 | ) | | | (10,011 | ) | | | (57,080 | ) | | | (15,632 | ) | | | (2,403 | ) |
| Other income | | | 805,882 | | | | 832,239 | | | | 1,787,774 | | | | 745,269 | | | | 342,171 | | | | 52,591 | |
| Other gains, net | | | 7,399,252 | | | | 356,045 | | | | 5,023,553 | | | | 166,383 | | | | 319,996 | | | | 49,182 | |
| Operating profit/(losses) from continuing operations | | | 5,411,754 | | | | (10,783,875 | ) | | | 4,981,202 | | | | 5,810,141 | | | | 7,646,944 | | | | 1,175,313 | |
| Finance costs, net | | | (5,278,318 | ) | | | (5,705,117 | ) | | | (5,167,030 | ) | | | (4,204,179 | ) | | | (4,483,630 | ) | | | (689,121 | ) |
| Operating profit/(loss) from continuing operations less finance costs | | | 133,436 | | | | (16,488,992 | ) | | | (185,828 | ) | | | 1,605,962 | | | | 3,163,314 | | | | 486,192 | |
| Share of profits and losses of joint ventures | | | 148,749 | | | | 89,510 | | | | 23,238 | | | | (95,508 | ) | | | 8,151 | | | | 1,253 | |
| Share of profits and losses of associates | | | 511,869 | | | | 350,575 | | | | 284,531 | | | | 115,091 | | | | (165,249 | ) | | | (25,398 | ) |
| Profit/(loss) before income tax from continuing operations | | | 794,054 | | | | (16,048,907 | ) | | | 121,941 | | | | 1,625,545 | | | | 3,006,216 | | | | 462,047 | |
| Income tax (expense)/benefit from continuing operations | | | (339,551 | ) | | | (1,076,973 | ) | | | 225,961 | | | | (404,172 | ) | | | (642,267 | ) | | | (98,715 | ) |
| Profit/(loss) for the year from continuing operations | | | 454,503 | | | | (17,125,880 | ) | | | 347,902 | | | | 1,221,373 | | | | 2,363,949 | | | | 363,332 | |
| | | For the Year Ended December 31, |
| | | 2013 | | 2014 | | 2015 | | 2016 | | 2017 | | 2017 |
| | | RMB | | RMB | | RMB | | RMB | | RMB | | US$ |
| | | (in thousands, except per share and per ADS data) |
| Profit/(loss)per share from continuing operations | | | 0.05 | | | | (1.20 | ) | | | 0.01 | | | | 0.02 | | | | 0.09 | | | | 0.0138 | |
| Discontinued operation (loss)/profit for the year from discontinued operation | | | 228,334 | | | | — | | | | — | | | | — | | | | — | | | | — | |
| Profit/(loss)for the year | | | 682,837 | | | | (17,125,880 | ) | | | 347,902 | | | | 1,221,373 | | | | 2,363,949 | | | | 363,332 | |
| Profit/(loss)attributable to: | | | | | | | | | | | | | | | | | | | | | | | | |
| Owners of the parent | | | 907,249 | | | | (16,293,309 | ) | | | 129,511 | | | | 368,412 | | | | 1,378,435 | | | | 211,862 | |
| Non-controlling interests | | | (224,412 | ) | | | (832,571 | ) | | | 218,391 | | | | 852,961 | | | | 985,514 | | | | 151,471 | |
| Dividends | | | — | | | | — | | | | — | | | | — | | | | — | | | | — | |
| Basic and diluted earnings/(loss) per share | | | 0.07 | | | | (1.20 | ) | | | 0.01 | | | | 0.02 | | | | 0.09 | | | | 0.0138 | |
| Earnings/(loss) per ADS | | | 1.68 | | | | (30.12 | ) | | | 0.22 | | | | 0.43 | | | | 2.13 | | | | 0.3270 | |
| Dividends (expressed in RMB and US$ per share and per ADS) | | | | | | | | | | | | | | | | | | | | | | | | |
| Final dividends per share | | | — | | | | — | | | | — | | | | — | | | | — | | | | — | |
| Final dividends per ADS | | | — | | | | — | | | | — | | | | — | | | | — | | | | — | |
| Proposed dividends per share | | | — | | | | — | | | | — | | | | — | | | | — | | | | — | |
| Proposed dividends per ADS | | | — | | | | — | | | | — | | | | — | | | | — | | | | — | |
| | | For the Year Ended December 31, |
| | | 2014 | | 2015 | | 2016 | | 2017 | | 2018 | | 2018 |
| | | RMB | | RMB | | RMB | | RMB | | RMB | | US$ |
| | | (in thousands, except per share and per ADS data) |
| Consolidated Statements of Comprehensive Income Data |
| Revenue | | | 142,419,555 | | | | 123,922,795 | | | | 144,854,582 | | | | 181,020,428 | | | | 180,240,154 | | | | 26,214,843 | |
| Continuing Operations | | | | | | | | | | | | | | | | | | | | | | | | |
Cost of sales | | | (141,797,923 | ) | | | (121,408,135 | ) | | | (133,700,192 | ) | | | (166,290,235 | ) | | | (167,029,416 | ) | | | (24,293,421 | ) |
| Gross profit | | | 621,632 | | | | 2,514,660 | | | | 11,154,390 | | | | 14,730,193 | | | | 13,210,738 | | | | 1,921,422 | |
| Selling and distribution expenses | | | (1,772,525 | ) | | | (1,798,154 | ) | | | (2,111,787 | ) | | | (2,372,966 | ) | | | (2,496,933 | ) | | | (363,164 | ) |
| General and administrative expenses | | | (4,874,342 | ) | | | (2,386,950 | ) | | | (3,336,095 | ) | | | (4,549,206 | ) | | | (3,958,067 | ) | | | (575,677 | ) |
| Research and development expenses | | | (293,766 | ) | | | (168,870 | ) | | | (168,862 | ) | | | (498,234 | ) | | | (626,873 | ) | | | (91,175 | ) |
| Impairment loss on property, plant and equipment | | | (5,679,521 | ) | | | (10,011 | ) | | | (57,080 | ) | | | (16,200 | ) | | | (7,450 | ) | | | (1,084 | ) |
| Impairment losses on financial assets | | | — | | | | — | | | | — | | | | — | | | | (107,841 | ) | | | (15,685 | ) |
| Impairment losses on investments in joint ventures | | | — | | | | — | | | | — | | | | — | | | | (216,953 | ) | | | (31,555 | ) |
| Other income | | | 832,239 | | | | 1,787,774 | | | | 155,576 | | | | 89,873 | | | | 135,367 | | | | 19,688 | |
| Other gains, net | | | 362,407 | | | | 5,027,661 | | | | 169,143 | | | | 319,382 | | | | 921,904 | | | | 134,085 | |
| Operating profit/(losses) from continuing operations | | | (10,803,876 | ) | | | 4,966,110 | | | | 5,805,285 | | | | 7,702,842 | | | | 6,853,892 | | | | 996,855 | |
| Finance costs, net | | | (5,705,117 | ) | | | (5,167,030 | ) | | | (4,204,179 | ) | | | (4,496,734 | ) | | | (4,390,264 | ) | | | (638,538 | ) |
| Operating profit/(loss) from continuing operations less finance costs | | | (16,508,993 | ) | | | (200,920 | ) | | | 1,601,106 | | | | 3,206,108 | | | | 2,463,628 | | | | 358,318 | |
| Share of profits and losses of joint ventures | | | 89,510 | | | | 23,238 | | | | (95,508 | ) | | | 8,151 | | | | (199,452 | ) | | | (29,009 | ) |
| Share of profits and losses of associates | | | 350,575 | | | | 284,531 | | | | 115,091 | | | | (165,249 | ) | | | 39,335 | | | | 5,721 | |
| Profit/(loss) before income tax from continuing operations | | | (16,068,908 | ) | | | 106,849 | | | | 1,620,689 | | | | 3,049,010 | | | | 2,303,511 | | | | 335,029 | |
| Income tax (expense)/benefit from continuing operations | | | (1,076,559 | ) | | | 226,220 | | | | (403,899 | ) | | | (643,734 | ) | | | (822,499 | ) | | | (119,628 | ) |
| Profit/(loss) for the year from continuing operations | | | (17,145,467 | ) | | | 333,069 | | | | 1,216,790 | | | | 2,405,276 | | | | 1,481,012 | | | | 215,401 | |
| Profit/(loss) per share from continuing operations | | | (1.21 | ) | | | 0.01 | | | | 0.02 | | | | 0.09 | | | | 0.04 | | | | 0.01 | |
| | | As of December 31, |
| | | 2013 | | 2014 | | 2015 | | 2016 | | 2017 | | 2017 |
| | | RMB | | RMB | | RMB | | RMB | | RMB | | US$ |
| | | (in thousands, except per share and per ADS data) |
| Consolidated Statements of Financial Position Data |
| Total current assets | | | 63,487,130 | | | | 63,725,469 | | | | 64,489,886 | | | | 66,486,679 | | | | 68,349,306 | | | | 10,505,096 | |
| Total non-current assets | | | 138,281,995 | | | | 131,498,619 | | | | 127,930,459 | | | | 124,024,763 | | | | 131,797,310 | | | | 20,256,876 | |
| Total assets | | | 201,769,125 | | | | 195,224,088 | | | | 192,420,345 | | | | 190,511,442 | | | | 200,146,616 | | | | 30,761,972 | |
| Total current liabilities | | | 97,295,050 | | | | 105,020,284 | | | | 82,128,972 | | | | 83,179,841 | | | | 89,976,902 | | | | 13,829,197 | |
| Total non-current liabilities | | | 49,092,354 | | | | 48,839,310 | | | | 58,357,586 | | | | 51,544,793 | | | | 44,655,835 | | | | 6,863,476 | |
| Total liabilities | | | 146,387,404 | | | | 153,859,594 | | | | 140,486,558 | | | | 134,724,634 | | | | 134,632,737 | | | | 20,692,673 | |
| Net assets | | | 55,381,721 | | | | 41,364,494 | | | | 51,933,787 | | | | 55,786,808 | | | | 65,513,879 | | | | 10,069,299 | |
| Long-term interest bearing loans and borrowings (excluding current portion) | | | 46,294,828 | | | | 44,774,211 | | | | 54,000,874 | | | | 47,322,748 | | | | 40,289,703 | | | | 6,192,414 | |
| Capital stock | | | 13,524,488 | | | | 13,524,488 | | | | 14,903,798 | | | | 14,903,798 | | | | 14,903,798 | | | | 2,290,672 | |
| | | For the Year Ended December 31, |
| | | 2013 | | 2014 | | 2015 | | 2016 | | 2017 | | 2017 |
| | | RMB | | RMB | | RMB | | RMB | | RMB | | US$ |
| | | (in thousands) |
| OTHER FINANCIAL DATA |
| Net cash flows generated from operating activities | | | 8,298,677 | | | | 13,729,139 | | | | 7,317,746 | | | | 11,530,400 | | | | 13,127,777 | | | | 2,017,702 | |
| Net cash flows (used in)/generated from investing activities | | | (8,530,126 | ) | | | (5,140,277 | ) | | | 2,392,555 | | | | (4,998,596 | ) | | | (7,133,382 | ) | | | (1,096,381 | ) |
| Net cash flows generated from/(used in) financing activities | | | 2,533,315 | | | | (3,805,258 | ) | | | (5,448,013 | ) | | | (3,671,920 | ) | | | (1,835,878 | ) | | | (282,169 | ) |
| Net increase in cash and cash equivalents | | | 2,301,866 | | | | 4,833,604 | | | | 4,262,288 | | | | 2,859,884 | | | | 4,158,517 | | | | 639,152 | |
| | | For the Year Ended December 31, | |
| | | 2014 | | | 2015 | | | 2016 | | | 2017 | | | 2018 | | | 2018 | |
| | | RMB | | | RMB | | | RMB | | | RMB | | | RMB | | | US$ | |
| | | (in thousands, except per share and per ADS data) | |
| Discontinued operation (loss)/profit for the year from discontinued operation | | | — | | | | — | | | | — | | | | — | | | | — | | | | — | |
| Profit/(loss) for the year | | | (17,145,467 | ) | | | 333,069 | | | | 1,216,790 | | | | 2,405,276 | | | | 1,481,012 | | | | 215,401 | |
| Profit/(loss) attributable to: | | | | | | | | | | | | | | | | | | | | | | | | |
| Owners of the parent | | | (16,308,391 | ) | | | 118,029 | | | | 365,697 | | | | 1,413,028 | | | | 746,477 | | | | 108,567 | |
| Non-controlling interests | | | (837,076 | ) | | | 215,040 | | | | 851,093 | | | | 992,248 | | | | 734,535 | | | | 106,834 | |
| Dividends | | | — | | | | — | | | | — | | | | — | | | | — | | | | — | |
| Basic and diluted earnings/(loss) per share | | | (1.21 | ) | | | 0.01 | | | | 0.02 | | | | 0.09 | | | | 0.04 | | | | 0.01 | |
| Earnings/(loss) per ADS | | | (30.15 | ) | | | 0.20 | | | | 0.61 | | | | 2.37 | | | | 1.25 | | | | 0.02 | |
| Dividends (expressed in RMB and US$ per share and per ADS) | | | | | | | | | | | | | | | | | | | | | | | | |
| Final dividends per share | | | — | | | | — | | | | — | | | | — | | | | — | | | | — | |
| Final dividends per ADS | | | — | | | | — | | | | — | | | | — | | | | — | | | | — | |
| Proposed dividends per share | | | — | | | | — | | | | — | | | | — | | | | — | | | | — | |
| Proposed dividends per ADS | | | — | | | | — | | | | — | | | | — | | | | — | | | | — | |
Exchange Rate Information
The following table sets forth information concerning exchange rates between Renminbi and U.S. dollar for the periods indicated. These rates are provided solely for your convenience and are not necessarily the exchange rates that we used in this annual report or will use in the preparation of our periodic reports or any other information to be provided to you. The source of these rates is the Federal Reserve H.10 Statistical Release. On April 13, 2018, the exchange rate for Renminbi was US$1.00 = RMB6.2725.
| Period | Period End | | Average(1) | | High | | Low |
| | | | (RMB per US$1.00) | | |
| 2013 | | 6.0537 | | | 6.1412 | | | 6.2438 | | | 6.0537 | |
| 2014 | | 6.2046 | | | 6.1704 | | | 6.2591 | | | 6.0402 | |
| 2015 | | 6.4778 | | | 6.2869 | | | 6.4896 | | | 6.1870 | |
| 2016 | | 6.9430 | | | 6.6549 | | | 6.9580 | | | 6.4480 | |
| 2017 | | 6.5063 | | | 6.7569 | | | 6.9575 | | | 6.4773 | |
| September | | 6.6533 | | | 6.5690 | | | 6.6591 | | | 6.4773 | |
| October | | 6.6328 | | | 6.6254 | | | 6.6533 | | | 6.5712 | |
| November | | 6.6090 | | | 6.6200 | | | 6.6385 | | | 6.5967 | |
| December | | 6.5063 | | | 6.5932 | | | 6.6210 | | | 6.5063 | |
| 2018 | | | | | | | | | | | | |
| January | | 6.2841 | | | 6.4233 | | | 6.5263 | | | 6.2841 | |
| February | | 6.3280 | | | 6.3183 | | | 6.3471 | | | 6.2649 | |
| March | | 6.2726 | | | 6.3174 | | | 6.3565 | | | 6.2685 | |
| April (through April 13, 2018) | | 6.2725 | | | 6.2889 | | | 6.3045 | | | 6.2655 | |
| | | As of December 31, |
| | | 2014 | | 2015 | | 2016 | | 2017 | | 2018 | | 2018 |
| | | RMB | | RMB | | RMB | | RMB | | RMB | | US$ |
| | | (in thousands, except per share and per ADS data) |
| Consolidated Statements of Financial Position Data |
| Total current assets | | | 63,952,859 | | | | 64,760,095 | | | | 66,865,293 | | | | 68,644,310 | | | | 58,895,234 | | | | 8,565,957 | |
| Total non-current assets | | | 131,687,008 | | | | 128,177,237 | | | | 124,362,584 | | | | 131,172,489 | | | | 141,980,880 | | | | 20,650,263 | |
| Total assets | | | 195,639,867 | | | | 192,937,332 | | | | 191,227,877 | | | | 199,816,799 | | | | 200,876,114 | | | | 29,216,220 | |
| Total current liabilities | | | 105,163,379 | | | | 82,397,015 | | | | 83,664,323 | | | | 90,337,098 | | | | 74,748,557 | | | | 10,871,727 | |
| Total non-current liabilities | | | 49,013,787 | | | | 58,496,815 | | | | 51,670,923 | | | | 43,737,105 | | | | 58,458,355 | | | | 8,502,415 | |
| Total liabilities | | | 154,177,166 | | | | 140,893,830 | | | | 135,335,246 | | | | 134,074,203 | | | | 133,206,912 | | | | 19,374,142 | |
| Net assets | | | 41,462,701 | | | | 52,043,502 | | | | 55,892,631 | | | | 65,742,596 | | | | 67,669,202 | | | | 9,842,078 | |
| Long-term interest bearing loans and borrowings (excluding current portion) | | | 44,870,211 | | | | 54,065,874 | | | | 47,376,748 | | | | 40,289,703 | | | | 54,207,386 | | | | 7,884,137 | |
| Capital stock | | | 13,524,488 | | | | 14,903,798 | | | | 14,903,798 | | | | 14,903,798 | | | | 14,903,798 | | | | 2,167,668 | |
| | | For the Year Ended December 31, |
| | | 2014 | | 2015 | | 2016 | | 2017 | | 2018 | | 2018 |
| | | RMB | | RMB | | RMB | | RMB | | RMB | | US$ |
| | | (in thousands) |
| OTHER FINANCIAL DATA |
| Net cash flows generated from operating activities | | | 13,734,366 | | | | 7,339,238 | | | | 11,609,309 | | | | 13,205,572 | | | | 13,018,176 | | | | 1,893,415 | |
| Net cash flows (used in)/generated from investing activities | | | (5,140,277 | ) | | | 2,392,555 | | | | (2,626,858 | ) | | | (5,597,489 | ) | | | (5,528,369 | ) | | | (804,070 | ) |
| Net cash flows generated from/(used in) financing activities | | | (3,805,258 | ) | | | (5,448,013 | ) | | | (6,105,257 | ) | | | (3,398,994 | ) | | | (16,266,476 | ) | | | (2,365,860 | ) |
| Net increase/(decrease) in cash and cash equivalents | | | (8,945,535 | ) | | | 4,283,780 | | | | 2,877,194 | | | | 4,209,089 | | | | (8,776,669 | ) | | | (1,276,515 | ) |
| B. | |
(1) | Annual average is calculated by averaging the rates on the last business day of each month during the annual period. Monthly averages are calculated by averaging the rates on each business day during the month. |
B. | Capitalization and Indebtedness |
Not applicable.
| |
| C. | Not applicable. |
| |
C. | Reasons for the Offer and Use of Proceeds |
| |
| Not applicable. |
| |
D. | Risk Factors |
Not applicable.
Our business and financial condition and results of operations are subject to various changing business, competitive, economic, political and social conditions in China and worldwide. In addition to the factors discussed elsewhere in this annual report, the following are some of the important factors that could cause our actual results to differ materially from those projected in any forward-looking statements.
Our business is vulnerable to downturns in the general economy and industries in which we operate or which we serve. A significant reduction in demand could materially and adversely affect our business, financial condition and results of operations.
Demand for our products depends on the general economy and level of activity and growth in the industries where we operate or serve. Adverse development in economic and market conditions, such as a significant economic downturn or a downturn in the commodity sector or the financial markets, could have a material adverse effect on our business and financial condition and results of operations. Development of the relevant industries is subject to various factors, including but not limited to market fluctuations of prices of commodities, general political or economic conditions, technology development, government regulations and investment plans and fluctuation in domestic and global production capacity, many of which are beyond our control.
We are unable to predict cycles of the global and domestic economies. Concerns over inflation, energy costs, geopolitical issues, the availability and cost of credit, unemployment, consumer confidence, declining asset values, capital market volatility and liquidity issues have created difficult operating conditions for us in the past and may continue to do so in the future. Furthermore, the PRC government has, from time to time, adjusted its monetary, fiscal and other policies and measures to manage the rate of growth of the economy or the overheating and overcapacity in certain industries or markets. As a result, the global and domestic economic conditions or any particular industry in which we operate or which we serve may grow at a lower-than-expected rate or even experience a downturn. Uncertainty about future economic conditions makes it challenging for us to forecast our results of operations, make business decisions and identify risks that may affect our business. If we are not able to timely and appropriately adapt to changes resulting from the difficult macroeconomic environment, our business, financial condition and results of operations may be materially and adversely affected.
Volatility in the prices of alumina, primary aluminum, other non-ferrous metal and other commodities may adversely affect our business, financial condition and results of operations.
The prices of the products we produce and trade, including alumina, primary aluminum, other non-ferrous metal and coal products, have experienced significant fluctuation historically fluctuated and are expected to continue fluctuatingcontinually fluctuate in response to general economic conditions, supply and demand and the level of global inventories, which are beyond our control.
We price our alumina and primary aluminum products by reference to international and domestic market prices, and domestic supply and demand, each of which may fluctuate beyond our control. We may not be able to effectively respond to a sudden fluctuation in alumina or primary aluminum prices. For example, due to the general slowdown of the global economy and overcapacity of global aluminum industry beginning in 2015, the range for the high and low prices for the Australian FOB spot price for alumina and the international cash price for primary aluminum on the LME declined in 20152016 to a high of US$354.5 per tonne and a low of US$200 per tonne and a high of US$1,959.1 per tonne and a low of US$1,423.5 per tonne, respectively, and further declined in 2016 to US$350.5 per tonne and a low of US$197.0 per tonne and a high of US$1,778 per tonne and a low of US$1,449 per tonne, respectively. However, due to global economic recovery and adjustment of production capacity in the PRC primary aluminum industry as a result of the supply-side structural reform carried out by the PRC government, the range for the high and low prices for the Australian FOB spot price for alumina and the international cash price for primary aluminum on the LME increased in 2017 to a high of US$484 per tonne and a low of US$272 per tonne and a high of US$2,256 per tonne and a low of US$1,700 per tonne, respectively. AsDue to supply shortage in the global aluminum and alumina market, the range for the high and low prices for the Australian FOB spot price for alumina and the international cash price for primary aluminum on the LME further increased in 2018 to a result,high of US$710 per tonne and a low of US$357 per tonne and a high of US$2,603 per tonne and a low of US$1,869 per tonne, respectively. In 2018, the average external selling prices for our self-produced alumina and primary aluminum were RMB2,875RMB2,923 per tonne and RMB14,629RMB14,364 per tonne respectively in 2017, which increased2018, representing an increase by approximately 43%1.7% and 20%a decrease by 1.8%, respectively, as compared to the prices in 2016.2017. Because our prices are affected by a variety of factors, most of which are beyond our control, we may not be able to respond promptly to the fluctuation in alumina or primary aluminum prices in international market or domestic market. There is no assurance that there will not be any further and significant fluctuations in prices of our key products, including alumina and primary aluminum, which may materially and adversely affect our business, financial condition and results of operations.
In addition, since our profit margin for trading non-ferrous metal products and coal products is based on price fluctuations in the short term, we need to make the correct prediction of the price fluctuations of these commodities on the markets to maintain our profit margin. If market price fluctuations on the market do not match our prediction, we may incur substantial losses.
In addition, as we generate profit from the differences between the purchase and sales prices of the non-ferrous metal products and the coal products we deal in, significant fluctuations in these prices may cause the value of the outsourced products in transit or in inventory to decline, and if the carrying value of our existing inventories exceeds the market price in the future periods, we may need to make additional provisions for our inventories’ value. As a result, any significant fluctuation in international market prices for these commodities could materially and adversely affect our business, financial condition and results of operations.
Our business requires substantial capital expenditures that we may not always be able to obtain at reasonable costs and on acceptable terms.
Our plans to upgrade and expand our production capacity will require substantial capital expenditures. See “Item 4. Information on the Company - D. Property, Plants and Equipment - Our Expansion” and “Item 5. Operating and Financial Review and Prospects - B. Liquidity and Capital Resources - Capital Expenditures and Capital Commitments.” We may also need additional funding for debt servicing, working capital, other investments, potential acquisitions and joint ventures and other corporate requirements.
We may need to seek external financing, such as bank and other loans as well as bond offerings, to satisfy our capital needs if cash generated from our operations is insufficient to fund our capital expenditures or if our actual capital expenditures and investments exceed our plans. Our ability to obtain external financing at reasonable costs and on acceptable terms is subject to a variety of factors, including our credit ratings. Rating agencies may downgrade or withdraw our ratings or place us on “credit watch” based on their assessment of a wide range of factors. For example, records of net losses may result in a deterioration of our credit ratings. Although we were profitable in the recent period including 2015, 2016, 2017 and 2017,2018, we recorded a net loss of approximately RMB17.1 billion in 2014, and we could incur losses in the future, which may adversely affect our corporate ratings and increase our borrowing costs and limit our access to capital markets. Failure to obtain sufficient funding at reasonable costs and on acceptable terms for our development plans could adversely affect our business and prospects.
Our previous adjustments of our business segments and historical results may not be indicative of our future prospects.
In the past few years, we have entered into a new business segment, the energy segment, through acquisition of Ningxia Energy and streamlined our existing business to focus on the productions of alumina and primary aluminum. For instance, in 2013, wesince August 2018, the Company has acquired an aggregate of 70.82% of the equity interest in Ningxia Energy, an integrated power generation company with coal mines located in Ningxia Autonomous Region. Its principal business includes conventional coal-fire power generation and renewable energy generation. After the acquisition of Ningxia Energy, we established an energy segment in January 2013 to include (i) operations of Ningxia Energy and (ii) our other energy related operations that were formerly included in our corporate and other operating segment. In November 2015, we acquired relevantcertain carbon assets and liabilities of High-Purity Aluminum Plant and Light Metal Material Plant of Baotou Aluminum Group. Baotou Aluminum Group is a subsidiary of Chinalco. In addition, in line with our development strategy to focus onequity interests from the development of our core business in alumina and primary aluminum production, where we have an established leading market positions, and to reduce future capital expenditures on iron ore development, improve asset-to-debt ratio and generate expected cash flows, we disposed of our 65% equity interest in Chalco Iron Ore to a wholly-owned subsidiaryaffiliated enterprises of Chinalco on December 26, 2013.Assets, through which we are able to consummate our industrial chain as carbon products are one of major raw materials for production of primary aluminum. In December 2015,2018, we transferred aacquired 50% equity interests in Shanxi Huaxing a wholly owned subsidiary of our Company, through the Shanghai United Assets and Equity Exchange at a price of RMB2,351 million. Pursuant to a resolution passed at the 2015 second general meetingapproximately RMB2,665.2 million from Baotou Transportation Investment Group Co., Ltd. Upon completion of the Company held on December 29, 2015, the proceeds raised from the disposalacquisition, Shanxi Huaxing became a wholly-owned subsidiary of the equity interestsCompany. The acquisition is conducted for purposes of enhancing our profitability and is in line with our strategic layout of alumina and aluminum business, as the increase of our shareholding in Shanxi Huaxing, would be used for permanent replenishment of liquidity required foran alumina plant, is expected to enhance the operation of the Company. In May 2017, we and Chinalco entered into an equity transfer agreement pursuant to whichsynergy with our primary aluminum production in Shanxi, where we have agreed to acquire Chinalco’s 40% equity interests in Chinalco Shanghai, which primarily engages in trading and managementnewly added production capacity of engineering projects, to implement our strategic layout and business development plan. Chinalco Shanghai became our wholly-owned subsidiary upon completion of the transfer.primary aluminum. For further details of these acquisitions, please see “Item 4. Information on the Company - A. History and Development of the Company.”
There is no assurance that we will enter into a new business segment or continue to streamline our existing business as we have done so in the past. In addition,Moreover, we cannot assure you that the benefit of entering into a new business segment or streamlining our existing business will be fully realized as expected or at all.
In addition, we have experienced growth in recent years. For example, our revenues for 2016, 2017 and 2018 were RMB144,854.6 million, RMB181,020.4 million and RMB180,240.2 million, respectively. However, such performance was driven by a wide range of factors, many of which are out of our control or may not be sustainable or indicative of future growth or performance, such as the prices of coal, electricity and other raw materials. No assurance can be given that our financial conditions or results of operations will be maintained at any level. As a result, our historical results may not be indicative of our future prospects and results of operations.
Our failure to successfully manage our business expansion, including our expansion into new areas of business, would have a material adverse effect on our results of operations and prospects.
We have investedmade investments in business expansion in line with our development strategy through organic growth, acquisitions and joint ventures.ventures in the past. In addition, we may, from time to time and when we deem appropriate, expand into new industries which we believe have synergies with our existing operations. For example, we have successfully enhanced our energy-related operations through the acquisition of Ningxia Energy in 2013 and participation in joint ventures and strategic investments in coal mining since 2010.
Our expansion has created, and will continue to place, substantial demand on our resources. Managing our growth and integrating the acquired businesses will require us to, among other things:
comply with the laws, regulations and policies applicable to the acquired businesses, including obtaining timely approval for the construction or expansion of production and mining facilities as required under the relevant PRC laws;
maintain adequate control on our business expansion to prevent, among other things, project delays or cost overruns;
gain market acceptance for new products and services and establish relationships with new customers and suppliers;
achieve sufficient utilization of new production facilities to recover costs;
manage relationships with employees, customers and business partners during the course of our business expansion and integration of new businesses;
attract, train and motivate members of our management and qualified workforce to support successful business expansion;
access debt, equity or other capital resources to fund our business expansion, which may divert financial resources otherwise available for other purposes;
divert significant management attention and resources from our other businesses; and
strengthen our operational, financial and management controls, particularly those of our newly acquired subsidiaries, to maintain the reliability of our reporting processes.
| ● | comply with the laws, regulations and policies applicable to the acquired businesses, including obtaining timely approval for the construction or expansion of production and mining facilities as required under the relevant PRC laws; |
| ● | maintain adequate control on our business expansion to prevent, among other things, project delays or cost overruns; |
| ● | accumulate expertise and experience in managing the new businesses; |
| ● | gain market acceptance for new products and services and establish relationships with new customers and suppliers; |
| ● | achieve sufficient utilization of new production facilities to recover costs; |
| ● | manage relationships with employees, customers and business partners during the course of our business expansion and integration of new businesses; |
| ● | attract, train and motivate members of our management and qualified workforce to support successful business expansion; |
| ● | access debt, equity or other capital resources to fund our business expansion, which may divert financial resources otherwise available for other purposes; |
| ● | divert significant management attention and resources from our other businesses; and |
| ● | strengthen our operational, financial and management controls, particularly those of our newly acquired subsidiaries, to maintain the reliability of our reporting processes. |
Any significant difficulty in meeting the foregoing or similar requirements could delay or otherwise constrain our ability to implement our expansion plans, or result in failure to achieve the expected benefits of the combination or acquisition or write-offs of acquired assets or investments, which in turn would limit our ability to increase operational efficiency, reduce marginal manufacturing costs or otherwise strengthen our market position. Failure to obtain the intended economic benefits from the business expansion could adversely affect our business, financial condition, results of operations and prospects. In addition, we may also experience mixed results from our expansion plans in the short term.
Furthermore, there is no assurance that we will be able to identify attractive acquisition targets, obtain favorable deal terms in any acquisition, secure applicable governmental approvals for any proposed investments, accurately estimate the mineral resources and reserves of these acquisition targets or obtain the necessary funding to complete such acquisitions on commercially acceptable terms or at all. Acquisitions may result in the incurrence and inheritance of debts and other liabilities, assumption of potential legal liabilities in respect of the acquired businesses, and incurrence of impairment charges related to goodwill and other intangible assets, any of which could harm our business, financial condition and results of operations. In particular, if any of the acquired businesses fail to perform as we expect, we may be required to recognize a significant impairment charge, which may materially and adversely affect our business, financial condition and results of operations. As a result, there can be no assurance that we will be able to achieve the strategic purpose of any acquisition, the desired level of operational integration or our investment return target.
Our joint ventures and strategic investment may not be successful.
We may from time to time enter into joint ventures or make strategic investment to grow our business and operations. For example, since 2010, we have participated in joint ventures and strategic investment in coal mining, in line with our development strategy to diversify our product offering and partially offset our future energy costs, as well as supply a portion of the coal we consume in our operations. In addition, we have acted as joint venture partner or strategic investor in certain projects which engage in primary aluminum, aluminum alloy and light alloy manufacturing to diversify our product offering, strategically position ourselves along the industrial chain and facilitate our enterprise transformation and upgrade. For further details of these projects,certain of our joint ventures and strategic investment, please see “Item 4. Information on the Company - A. History and Development of the Company” and “Item 4. Information on the Company - D. Property, Plants and Equipment – Our Expansion.”
We have non-controlling interests in a number of joint ventures. Although we have not been materially constrained by the nature of our ownership interests, no assurance can be given that our joint venture partners will not exercise their power of veto or their controlling influence in any of our joint ventures in a way that will hinder our corporate objectives and reduce any anticipated cost savings or revenue enhancement resulting from these joint ventures. In addition, whether or not we hold majority interests or maintain operational control in such joint ventures, such arrangements necessarily involve special risks and our joint venture partners may:
have economic or business interests or goals that are inconsistent with or opposed to ours;
exercise veto rights so as to block actions that we believe to be in our or the joint venture’s best interests;
take action contrary to our policies or objectives with respect to the investments; or
as a result of financial or other difficulties, be unable or unwilling to fulfill their obligations under the joint venture, other agreements, such as contributing capital to expansion or maintenance projects.
| ● | have economic or business interests or goals that are inconsistent with or opposed to ours; |
| ● | exercise veto rights so as to block actions that we believe to be in our or the joint venture’s best interests; |
| ● | take action contrary to our policies or objectives with respect to the investments; or |
| ● | as a result of financial or other difficulties, be unable or unwilling to fulfill their obligations under the joint venture, other agreements, such as contributing capital to expansion or maintenance projects. |
In addition, our joint ventures which operate coal mines were facing increasing risks in recent years. Due to more stringent regulations on environmental protection, imbalances between supply and demand in the coal market and level of inventory, the coal prices declined in 2015. In the first half of 2016 the coal prices continued their downward trend and reached their lowest point in August 2016. The coal prices then rebounded after August 2016 as a result of the PRC government’s policy of cutting excessive coal production capacity as well as decrease in hydroelectricity and increase in transportation costs. The coal prices in 2017, with seasonal fluctuations, were generally higher than the prices in 2016. In 2018, the coal prices fluctuated at a relatively high price level. However, we cannot assure you the coal price will continue to increase or maintain at the current price level in the future. If coal prices decrease in the future, the business, financial condition and results of operations of these joint ventures which operate coal mines may be adversely affected.
We are implementing the proposed asset restructuring, the finalization of which is still subject to uncertainty.
We are in the process of implementing the proposed asset restructuring. On December 4, 2017, we entered into certain investment and debt conversion agreements with several investors (the “Restructuring Investors”). Pursuant to these agreements, in December 2017, certain of the Restructuring Investors made cash contributions to our subsidiaries, Chalco Shandong, Chalco Zhongzhou, Baotou Aluminum and Chalco Mining (together the “Target Subsidiaries”), while the principal of loans owed by Chalco Mining to some of the Restructuring Investors prior to signing of the investment and debt conversion agreements was converted into equity interest in Chalco Mining held by these investors. Subsequently, on January 31, 2018, we entered into equity purchase agreements with the Restructuring Investors pursuant to which we have agreed to purchase all their equity interest in the Target Subsidiaries with consideration in the form of our A shares to be issued to the Restructuring Investors. Cash contributions received from the investors have been used by us for the repayment of loans. The proposed asset restructuring has helped reduce the gearing ratios of these subsidiaries and the Group as a whole.
The completion of the issuance of additional A Shares to these investors is still conditioned upon various factors, including the approval by SASAC and CSRC, and the general and class approvals by shareholders of the Company. Please refer to “Item 4. Information on the Company - A. History and Development of the Company – Subscription of Equity Interest of Certain Subsidiaries and Subsequent Issuance of Additional A Shares” for further details.
There is no assurance as to whether and when these approvals will be obtained, or whether the asset restructuring can be completed without undue delays or at all. In addition, we may continue to incur high gearing ratios in the future and our exposure to liquidity risk may restrict our ability to make capital expenditure or develop business opportunities in the future, which may adversely affect our results of operations and financial positions.
Failure to maintain optimal utilization of our production facilities will adversely affect our gross and operating margins.
During the past few years, we expanded the production capacity by completing our construction, upgrading or remouldingremolding of some of our alumina and primary aluminum production facilities. If we are able to maintain satisfactory facility utilization rates and increase our production output, this increase in our production capacity would enable us to reduce our unit costs through economies of scale, as fixed costs will be spread over a higher volume of output units. Conversely, underutilization of our existing and newly acquired or constructed production facilities may increase our marginal production costs and prevent us from realizing the intended economic benefits of our expansion.
Since 2013, we have implemented flexible production arrangements from time to time for certain alumina and primary aluminum production facilities in response to prevailing market conditions. In February 2017, the PRCconditions and government issued the 2017 Working Plan of Air Pollution Prevention and Controlpolicies. For example, due to local environmental requirements for Beijing-Tianjin-Hebei and Surrounding Areas to improve regional air quality and strengthen air pollution control in the winter heating season. Accordingly,season, the output of and the utilization rates of production facilities at Chalco Shandong Chalco Mining and Chalco ZhongzhouHuayu in the winter heating season have been reduced. In addition, we may increase our external purchases of alumina and primary aluminum for trading purposes to capitalize on fluctuating market prices and to enhance resource planning to achieve cost savings in our production. The increase in our external purchases will reduce our utilization of certain production facilities, but may not result in a proportionate decrease in fixed costs such as leases and depreciation of plant, property and equipment.
If we fail to maintain optimal utilization rates and spread fixed costs over a high volume of output units, our gross and operating margins may be adversely affected.
We may be required to record impairment charges in the future.
If business conditions deteriorate, long lived assets need to be reviewed for possible impairment. Impairment loss needs to be recognized to the extent that the carrying amount exceeds the recoverable amount. In 20152016, 2017 and 2016,2018, we recorded impairment loss of property, plant and equipment of RMB10.0RMB57.1 million, RMB16.2 million and RMB57.1RMB7.5 million, respectively. In 2017, weWe also recorded impairment loss of property, plant and equipment of RMB15.6 million and impairment losses of intangible assets of RMB8.1 million.million in 2017. We cannot guarantee that we will not incur any impairment loss or our impairment loss will not increase in the future due to various reasons including, but are not limited to, strategic decisions made in response to changes in economic and competitive conditions, the impact of the economic environment on our customer base and material adverse changes in our relationship with significant customers. If we record significant impairment charges, our results of operations may be materially and adversely affected.
Our operations consume substantial amounts of electricity, and our profitability may decline if electricity costs rise or if our electricity supplies are interrupted.
Our operations consume substantial amounts of electricity. Although we generally expect to meet the electricity consumption requirements for our alumina refineries and primary aluminum smelters from a combination of internal and external sources, our results of operations may be materially and adversely affected by any significant increase in electricity costs or interruptions in electricity supply.
Cost of electricity is the principal production cost in our primary aluminum operations. The priceDue to the increase in volume of electricity soldgenerated by grid operators is set by the PRC government. In recent years, the PRC government has implemented various rules and measures in relation to the electricity system reform. Pursuant to these rules, we have been authorized to purchase electricity we consume directly fromour own electric power plants at negotiated prices, which have been lower thanand its proportion in the pricetotal volume of electricity purchased from grid operators. However, due to the increase of coal price in 2017 which has resulted in a general increase of price of electricity in the same period,that we consumed, our average electricity cost per kWh of our primary aluminum smelters still increaseddecreased by approximately 21% in2% from 2017 from the level in 2016. Thereto 2018. However, there is no assurance that we will continuously increase the PRC government will not introduce further changes to these rules and measures from time to time which may affect the priceconsumption of electricity and increasegenerated by our average electricity cost,own electric power plants, or that other factorsany factor beyond our control will not result in any increase in the price of electricity. If we are unable to pass on increases in energy costs to our customers, our operating margin, financial condition and results of operations could be materially and adversely affected.
In addition, interruptions in the supply of electricity can result in costly production shutdowns, increased costs associated with restarting production and the waste of production in progress. A sudden loss of electricity, if prolonged, can cause damage to or the destruction of production equipment and facilities. In such an event, we may need to expend significant capital and resources to repair or replace the affected production equipment to restore our production capacity. In the past, various regions across China experienced shortages and disruptions in electricity supply, especially during peak demand summer season or under severe weather conditions. We cannot assure you that our operations will not suffer from shortages or disruptions in electricity supply, the occurrence of which could have a material adverse impact on our business, financial condition and results of operations.
Our operations consume substantial amounts of coal, and our operations may be adversely affected if we are not able to procure sufficient coal or if coal prices rise significantly.
We rely heavily on coal as our energy and fuel source in our operations. As we increase our alumina refining capacity, our consumption of coal will increase accordingly. If we are not able to obtain the amount of coal needed for our production due to a shortage of coal, constraints on coal transportation or any other reason, we may be forced to reduce our production output or suspend our alumina refining operations, which could materially and adversely affect our financial condition and results of operations. Although we have acquired equity interest in a number of coal mines, we expect to continue to rely substantially on third-party coal suppliers for the supply of coal. In addition, ourOur average purchase price per unit tonne of thermal coal used in our alumina production increased by approximately 42%3% in 20172018 from the level in 2016.2017. If we are unable to pass on increases or otherwise significant fluctuations in coal prices to our customers or offset price increases through productivity improvements, our operating margin, financial condition and results of operations could be adversely affected.
Our business and industry may be affected by the development of alternative energy sources and climate change.
Our operations consume substantial amounts of coal. Coal combustion generates significant greenhouse gas and other pollutants, and the effects of climate change resulting from global warming and increased pollution levels may provide incentives for governments to promote or invest in “green” energy technologies such as wind, solar, nuclear and biomass power plants, or to reduce their consumption of conventional energy sources such as coal. A number of governments or governmental bodies have introduced or are contemplating legislative and regulatory changes in response to the potential impacts of climate change. These regulatory mechanisms may impact our operations directly or indirectly through our customers or supply chain. We may have to increase our capital expenditures in order to comply with such revised or new legislation or regulations, and may realize changes to profit or loss arising from increased or decreased demand for our products and indirectly, from changes in costs of goods sold, which may adversely affect our results of operations and financial condition.
In addition, we have invested in coal mining operations. Although revenues attributable to our energy segment accounted for only approximately 3.2%3.9% of our total revenues in 20172018 (after elimination of inter-segment sales), we might still be affected by the growth of the PRC thermal power industry, which relies on coal as main source of fuel. The PRC thermal power industry may be affected by the development of alternative energy sources, climate change and global environmental factors. In particular, pursuant to China’s 13th Five-Year Plan for Environmental Protection, the PRC government plans to continue to encourage the development of alternative energy sources, such as wind power, solar power, biomass and geothermal energy, from 2016 to 2020. As such, alternative energy industries may rapidly develop and gradually gain mainstream acceptance in the PRC and the rest of the world. If alternative energy technologies continue to develop and prove suitable for wide commercial application in the PRC and overseas, demand for conventional energy sources, such as coal, could be reduced. Such reduction in demand for coal could have a material adverse effect on the coal mining industry and, consequently, negatively affect our business, results of operations and financial condition.
We may not be able to continue competing successfully in the markets in which we operate.
In 2017,2018, we sold all of our self-produced alumina and self-produced primary aluminum to domestic customers. Our alumina (with chemical alumina products included) and primary aluminum production represented approximately 20.5%21.2% and 9.8%11.4%, respectively, of total domestic production in China in 2017.2018. We face competition from both domestic and international alumina and primary aluminum producers. Our principal competitors are major domestic refineries and smelters. These producers compete with our alumina and primary aluminum operations on the basis of product cost, quality and pricing. In addition, we face increasing competition from international alumina and primary aluminum suppliers as a result of the elimination of tariffs on imports of primary aluminum and alumina into China. See “Item 4. Information on the Company - B. Business Overview - Competition” for further details.
Increasing competition in our product markets may reduce our selling prices or sales volumes, which will have a material adverse effect on our financial condition and results of operations. If we are unable to price our products competitively, maintain or increase our current share of China’s alumina and primary aluminum markets or otherwise maintain our competitiveness, our financial condition, results of operations and profitability could be materially and adversely affected.
Our overseas expansion exposes us to political and economic risks, commercial instability and events beyond our control in the countries in which we plan to operate.
We are currently undertaking a couple of overseas projects, including the bauxite mining projects in Laos, Indonesia and Indonesia.Guinea. Due to uncertainties involved in the overseas projects, we cannot assure you that our overseas expansion or investments will be successful or that we will not suffer foreign exchange losses in connection with our overseas investment.
In addition, operations in the overseas markets also expose us to a number of risks including expropriation and nationalization of our assets in foreign countries, civil unrest, acts of terrorism, war, or other armed conflict; shortages of construction equipment and materials; severe weather conditions; epidemic diseases and infectious diseases; natural disasters; inflation; currency fluctuations, devaluations and conversion restrictions; confiscatory taxation or other adverse tax policies, governmental activities that limit or disrupt markets, restrict payments or limit the movement of funds, governmental activities that may result in the deprivation of contractual rights; lack of a well-developed legal system that makes it difficult to enforce our contractual rights; and governmental activities that may result in the inability to obtain or retain licenses required for operations.
Our profitability and operations could be adversely affected if we are unable to obtain a steady supply of raw materials at competitive prices.
Historically, the price for bauxite, our most important raw material for alumina production, has been volatile. We obtain bauxite for our operations from our mines and external suppliers. See “Item 4. Information on the Company - B. Business Overview - Raw Materials - Alumina - Supply.” The extents to which we procure bauxite from each of these sources affect the security of our supply or cost of bauxite. The supply of bauxite could be affected by various factors, including geographic conditions of bauxite mines, government policies, market prices and competition, many of which are beyond our control. We rely on overseas suppliers to obtain a portion of bauxite we use for production. Indonesia used to be a major source of our imported bauxite. As a result of the ban imposed by the Indonesia Government of Indonesia on the exportation of unprocessed bauxite and nickel, since January 2014, we have not been able to export the bauxite produced by our bauxite mines in Indonesia for the use of our alumina refineries in China, and our operation of bauxite mining in Indonesia has been suspended since September 2014. See “Item 4. Information on the Company - B. Business Overview - Raw Materials - Alumina – Own Mines” for more details of our bauxite mines in Indonesia. If we exhaust our stockpiles or our procurement of bauxite from external suppliers are interrupted for any reasons, and cannot find an alternative source of bauxite at competitive prices, our financial condition, results of operations and profitability could be adversely affected.
In addition, our results of operations can be affected by increases in the cost of other raw materials and other key inputs such as energy. If we cannot obtain a steady supply of key raw materials at competitive prices, our financial condition and results of operations could be materially and adversely affected.
Any transportation interruption or any material increase in our transportation costs could have a material adverse effect on our business, financial condition and results of operations.
Our operations require the reliable transportation of raw materials and supplies to our refining and smelting sites and finished products to our customers. Our alumina products are mainly transported by rail or trucks and our primary aluminum products are delivered to our customers primarily by rail. There is no assurance that we can always enjoy sufficient transportation capacity or we will not experience transportation interruption in the future. Furthermore, natural disasters may cause interruption to the transportation system, which could in turn affect the transportation of our products. In addition, any changes in fuel prices or fuel supply may be unpredictable and beyond our control. There is no assurance that shortage of fuel will not occur in the future. Any surge in fuel prices or shortage of fuel supply may lead to increases in our operation and transportation costs. If we are unable to make timely deliveries due to logistical and transportation disruptions, or transfer the increased costs to our customers, our production, reputation and results of operations may be adversely affected.
The bauxite reserve data in this annual report are only estimates, which may prove to be inaccurate.
The bauxite reserve data based on which we prepare our production and expenditure plans are only estimates that we have developed internally and may prove to be inaccurate. There are numerous uncertainties inherent in estimating quantities and qualities of reserves, including many factors beyond our control. If these estimates are inaccurate or the indicated tonnages are not recovered, our business, financial condition, and results of operations may be materially and adversely affected.
Our mining operations have limited mine lives and eventual closure of these operations will entail costs and risks regarding ongoing monitoring, rehabilitation and compliance with environmental standards.
Our existing mining operations in the PRC and overseas have limited mine lives and will eventually be depleted. We need to perform certain procedures to remedy and rehabilitate the environmental and social impact that our mining operations have had on local communities and the environment. Remediation, rehabilitation, closure and removal of our facilities will incur various costs and are subject to various risks. The key costs and risks for mine closures include, among others, (i) long-term management of permanent engineered structures and acid rock drainage; (ii) closure in accordance with local or international environmental standards; (iii) orderly retrenchment of employees and third-party contractors; and (iv) orderly transfer of the site, its associated permanent structures and community development infrastructure and programmesprograms to new owners. There is no assurance that such closure of mines will be successful and without delays or additional costs, in which case we may be subject to increased costs, penalties or other legal or administrative actions, damages to reputation, or even suspension and cancellation of mining permits, the occurrence of which would cause a material adverse effect on our business, financial condition and results of operations.
Failure to discover new reserves or resources, maintain or enhance existing reserves or resources, develop new mining operations or expand our current mining operations could negatively affect our business, financial condition and results of operations.
Mining exploration is unpredictable in nature. The success of any mining exploration programmeprogram depends on various factors, many of which are beyond our control. Due to the unpredictable and speculative nature of the mining industry, there is no assurance that any exploration programmeprogram that we are currently undertaking or may undertake in the future will result in the discovery of valuable reserves or resources. There is no assurance that reported resources can be converted into reserves. Furthermore, actual results upon production may differ from those anticipated at the time of discovery. To access additional reserves in explored areas, we will need to successfully complete development projects, including but not limited to extending existing mines and developing new mines. There are a number of uncertainties inherent in the development and construction of any new mine or an extension of an existing mine, including but not limited to (i) the availability and timing of necessary governmental approvals; (ii) the timing and cost necessary to construct mining and processing facilities; (iii) the availability and cost of labor, utilities, auxiliary materials and other supplies and the accessibility of transportation and other infrastructure; and (iv) the availability of funds to finance construction and production activities. There is no assurance that any future exploration activities or development projects will extend the life of our existing mining operations or result in any new economic mining operations and such failure may have a material adverse effect on our business, financial condition and results of operations.
Our indebtedness could adversely affect our business, financial condition and results of operations.
We have relied, and expect to continue to rely, on both short-term and long-term borrowings to fund a significant portion of our capital requirements. As of December 31, 2017,2018, we had approximately RMB62.8RMB47.5 billion in outstanding short-term bonds and short-term bank borrowings (including the current portion of long-term bank and other borrowings) and RMB40.3RMB54.2 billion in outstanding long and medium-term bonds and long-term bank and other borrowings (excluding the current portion of these borrowings). Please see Note 19 to our audited consolidated financial statements for more detailed information about our borrowings. This level of debt could have significant consequences on our operations, including:
making it more difficult for us to fulfill payment and other obligations under our outstanding debt, including repayment of our debt and credit facilities should we be unable to obtain extensions for any such debt or credit facilities before they mature. Please see “Item 5 - Operating and Financial Review and Prospects - B. Liquidity and Capital Resources” for maturities of our outstanding long-term borrowings;
reducing the availability of cash flows to fund working capital, capital expenditures, acquisitions and other general corporate purposes;
exposing us to interest rates fluctuations on our borrowings and the risk of being unable to rollover, extend or refinance our borrowings as necessary;
potentially increasing the cost of additional financing and making it more difficult for us to conduct equity financings in the capital markets or obtain government approvals to seek additional financing; and
putting pressure on our ADS price due to concerns of our ability to repay our debt.
| ● | making it more difficult for us to fulfill payment and other obligations under our outstanding debt, including repayment of our debt and credit facilities should we be unable to obtain extensions for any such debt or credit facilities before they mature. Please see “Item 5 - Operating and Financial Review and Prospects - B. Liquidity and Capital Resources” for maturities of our outstanding long-term borrowings; |
| ● | reducing the availability of cash flows to fund working capital, capital expenditures, acquisitions and other general corporate purposes; |
| ● | exposing us to interest rates fluctuations on our borrowings and the risk of being unable to rollover, extend or refinance our borrowings as necessary; |
| ● | potentially increasing the cost of additional financing and making it more difficult for us to conduct equity financings in the capital markets or obtain government approvals to seek additional financing; and |
| ● | putting pressure on our ADS price due to concerns of our ability to repay our debt. |
Our ability to meet our payment and other obligations under our outstanding debt depends on our ability to generate cash flows in the future or to refinance such debt. We cannot assure you that our business will generate sufficient cash flows from operations to satisfy our obligations under our outstanding debt and to fund other liquidity needs. If we are not able to generate sufficient cash flows to meet such obligations, we may need to refinance or restructure our debt, reduce or delay capital investments, or seek additional equity or debt financing. The sale of additional equity securities could result in dilution to our ADS holders. A shortage of financing could in turn impose limitations on our ability to plan for, or react effectively to, changing market conditions or to expand through organic and acquisitive growth, thereby reducing our competitiveness. We cannot assure you that future financing will be available in amounts or on terms acceptable to us, if at all.
The instruments governing our senior debt contain a number of significant financial and other covenants that restrict our ability to raise further debt, take certain corporate actions and pay dividends.
We completed the issuance of US$350 million in aggregate principal amount of 6.625% senior perpetual capital securities and US$500 million in aggregate principal amount of 4.25% senior perpetual capital securities (altogether, the(the “Securities”) in October 2013 and November 2016, respectively, through Chalco Hong Kong Investment Company Limited (the “Bond Issuer”) with guarantees to the repayment obligations of the Securities provided by Chalco Hong Kong and its certain subsidiaries (the “Subsidiary Guarantors”Guarantor”). Please refer to “Item 4. Information on the Company - A. History and Development of the Company - Senior Perpetual Capital Securities Offering” for further details.
The indentures governing the Securities contain a number of significant financial and other covenants. Such covenants restrict, subject to certain exceptions, among other things, our and our subsidiaries’ ability to create, or have outstanding, any security interest upon our or our subsidiaries’ present or future undertaking, assets or revenues to secure any indebtedness which is in the form of bonds, notes, debentures, loan stock or other securities which for the time being are, or are intended to be or capable of being, quoted, listed or dealt in or traded on any stock exchange or over-the-counter or other securities market (“Relevant Indebtedness”) which is issued outside the PRC, our ability to create or have any Relevant Indebtedness which is issued outside the PRC, our ability to create or have outstanding any guarantee or indemnity in respect of any Relevant Indebtedness which is issued outside the PRC and the Bond Issuer’s, Subsidiary Guarantors’Guarantor’s and their respective subsidiaries’ ability to create, or have outstanding, any security interest upon their present or future undertaking, assets or revenues to secure any Relevant Indebtedness or any guarantee or indemnity in respect of any Relevant Indebtedness or to sell or otherwise dispose of capital stock held or controlled by it in any direct or indirect subsidiary of Chalco Hong Kong which is not a Subsidiary Guarantor. These covenants restrict our ability to raise additional funds in the future through issuing Relevant Indebtedness which is issued outside the PRC or creating or having any guarantee or indemnity in respect of any Relevant Indebtedness which is issued outside the PRC and may restrict our ability to engage in some transactions that we expect to be of benefit to us.
The Securities are guaranteed by Chalco Hong Kong and its certain subsidiaries.Kong. A breach of any of the covenants in the indenture governing the Securities could result in redemption of the Securities at our discretion or an increase of coupon rate if we do not redeem the Securities upon a breach of such covenants. If we default under the Securities in the future, the holders may enforce their claims against the guarantors to satisfy our obligations to them. In addition, such default may result in a default and acceleration of our senior debt and the holders of our senior debt could gain ownership of the capital stock of certain of our wholly ownedwholly-owned subsidiaries (if such capital stock is pledged for such senior debt) and/or enforce their claims against the assets of the guarantors (if guarantee is provided for such senior debt). Consequently, we could lose control or ownership of certain of our assets and operations of these subsidiary guarantorsthe Subsidiary Guarantor or pledgers.
In addition to the Securities, in October 2015 and October 2018, our Company issued RMB2,000 million in aggregate principal amount of 5.50% perpetual medium-term notes (the “2015 Perpetual Medium-term Notes”) and RMB2,000 million in aggregate principal amount of 5.10% perpetual medium-term notes (the “2018 Perpetual Medium-term Notes”), respectively, in China. Pursuant to the terms of the 2015 Perpetual Medium-term Notes and the 2018 Perpetual Medium-term Notes, while any coupon distribution payments are unpaid or deferred, the headquarters of the Company cannot declare or pay dividends to shareholders or decrease the share capital, or make material fixed asset investments of the headquarters of the Company. Therefore, our ability to pay dividends in respect of our ordinary shares and the ADSs may be limited under certain circumstances.
The interests of our controlling shareholder who exerts significant influence over us may conflict with ours.
As of December 31, 2017,2018, our largest shareholder, Chinalco, directly owned 32.81%33.89% of our issued share capital and indirectly owned an additional 1.96%2.73% of our issued share capital through its controlled entities. The interests of Chinalco may conflict or even compete with our interests and those of our public shareholders. Chinalco may take actions that are in the interest of its subsidiaries, associates and other related entities to our detriment. For example, Chinalco may seek to influence our decision as to the amount of dividends we declare and distribute. Any increase in our dividend payout would reduce funds otherwise available for reinvestment in our businesses and thus may adversely affect our future prospects and financial condition.
In addition, Chinalco and a number of its subsidiaries and associates provide a range of services to us, including engineering and construction services, social services, land and property leasing as well as the supply of raw and supplemental materials. It would be difficult to find an alternative source for some services that we receive from Chinalco. Our cost of operations may increase if Chinalco, its subsidiaries and associates are unable to continue providing such services to us.
In January 2019, Yunnan SASAC gratuitously transferred its 51% equity interest in Yunnan Metallurgical Group Co., Ltd. to China Copper, a wholly-owned subsidiary of Chinalco. As Yunnan Aluminum Co., Ltd., an affiliated company of Yunnan Metallurgical Group Co., Ltd., competes with us in the business segments of alumina and primary aluminum, Chinalco, as the indirect controlling shareholder of Yunnan Aluminum Co., Ltd. and our direct controlling shareholder, issued a letter of undertakings on non-competition to us, according to which Chinalco undertook to start in 2019 planning the integration of the businesses in which Yunnan Aluminum Co., Ltd. and we compete with each other, and address such business competition within five years. For further details, please see “Item 4. Information on the Company - A. History and Development of the Company.” While we intend to closely monitor Chinalco’s planning and implementation of such business integration and make timely public disclosure about significant progress made, due to the uncertainties involved in such business integration, however, we cannot assure you that business competition between Yunnan Aluminum Co., Ltd. and us would be addressed without undue delays or at all, or the plan of such business integration or the implementation thereof would be viewed by you or other investors as most favorable to us or our shareholders.
We are subject to, and incur costs to comply with, environmental laws and regulations.
As we produce air emissions, discharge waste water, and handle hazardous substances at our bauxite mines, alumina refineries and primary aluminum smelters, we are subject to, and incur costs to comply with, environmental laws and regulations.
Given the magnitude, complexity and continuous amendments to these laws and regulations, compliance therewith may be onerous or may involve substantial financial and other resources to establish efficient compliance and monitoring systems. The liabilities, costs, obligations and requirements associated with these laws and regulations may therefore be substantial and may delay the commencement of, or cause interruptions to, our operations. Non-compliance with the relevant laws and regulations applicable to our operations may even result in substantial penalties or fines, suspension or revocation of our relevant licenses or permits, termination of government contracts or suspension of our operations. For example, in November 2017, our Lanzhou branch received an administrative penalty of RMB100,000 from Lanzhou Municipal Environmental Protection Bureauwas fined by the local environmental protection authorities due to the fact that our Lanzhou branch did not conduct the application registration for storage of residues generated from overhaul of electrobath according to relevant requirements. We paid such penalty in full in November 2017. In December 2017, the Ministry of Environmental Protection of China posted on its website request for our Lanzhou branch to complete the rectification process by March 31, 2018. We started the rectification process in December 2017 and completed as requested through a series of measures, including, among others, relocation of the non-compliantly-stowed overhaul residues to plants in compliance with applicable requirements, construction at our Lanzhou branch of a production line with environmentally-sound treatment of overhaul residues which began operation in March 2018, restoration of the sites previously used to store overhaul residue by Lanzhou branch and improving internal management measures on solid waste treatment by including more stringent requirements.
We However, we cannot assure you that the similar events would not occur in the future, if such incidents were to occur, it could impact our operating results, financial condition and reputation, all of which could adversely affect our profitability and ability to retain existing customers and to attract new customers.
In addition, the environmental laws and regulations in the PRC and other jurisdictions in which we operate continue to evolve. As a result, we may incur significant additional costs if relevant laws and regulations change or enforcement of existing laws and regulations becomes more rigorous. For instance, to comply with the requirement of desulphurization and denitration in China, we were requested to invest in upgrading or remouldingremolding certain production facilities. Due to serious haze hovering in certain areas in China, the PRC government of the PRC has issued and may continue to issue rules and regulations to restrict production of certain industries in certain areas to alleviate air pollution. For example, in February 2017, the PRC government issued the 2017 Working Plan of Air Pollution Prevention and Control for Beijing-Tianjin-Hebei and Surrounding Areaspollution, pursuant to improve regional air quality and strengthen air pollution control in the winter heating season. Accordingly,which we have reduced themay reduce output of Chalco Shandong, Chalco Mining and Chalco Zhongzhou in the winter heating season.our relevant plants from time to time. Further, our overseas expansion projects are subject to foreign environmental laws and regulations. Failure to comply with environmental laws and regulations may trigger a variety of administrative, civil and criminal enforcement measures, including the assessment of monetary penalties, the imposition of remedial requirements and the issuance of orders enjoining future operations, all of which may materially and adversely affect our business operations.
We are subject to administrative policies and orders relating to China’s Energy-Saving and Emission Reduction Goals that could adversely affect our production.
We are subject to administrative energy-saving and emission reduction policies and orders carried out by the central and provincial governments in accordance with China’s Energy-Saving and Emission Reduction Goals. On July 18, 2013, the Ministry of Industry and Information Technology of the PRC (“MIIT”)MIIT issued the Standard Conditions for Aluminum Industry, which sets forth various standards for existing and new projects, including standards for environment protection, energy consumption, and utilization of resources. Although we have been in compliance with the Standard Conditions for Aluminum Industry since its issuance, we cannot assure you that the relevant government authorities will not issue more stringent standards or rules, which may require us to incur additional costs or expenses to comply with these standards or rules, and our existing production may be delayed for facility upgrading or suspended before full compliance with these standards or rules. The occurrence of any of the foregoing could have an adverse effect on our business, results of operations and financial condition.
We are subject to accidents and natural disasters that may adversely affect our performance.
We may experience accidents and natural disasters in the course of our operations, which may cause significant property damage and personal injuries. Significant accidents and natural disasters may cause interruptions to our operations or result in property or environmental damage, increase in operating expenses or loss of revenues.
The occurrence of accidents, natural disasters and the resulting consequences may not be covered adequately, or at all, by the insurance policies we carry. Losses or payments incurred by us as a result of major accidents or natural disasters may have a material adverse effect on our results of operations.
We have not obtained valid titles or land use rights to certain properties or land parcels that we occupy.
We have not obtained valid ownership certificates to certain properties that we occupy. These properties are used primarily for production plants and daily operations management. As of December 31, 2017,2018, the book value of our properties with defective titles is RMB6,942RMB5,639 million, which represents approximately 3.47%2.81% of our total asset value. In addition, we had not obtained land use rights to certain land parcels, which we use primarily for our production plants. As of December 31, 2017,2018, the book value of these land parcels is RMB516RMB687 million, representing approximately 0.26%0.34% of our total asset value. We have applied to the appropriate authorities to obtain the relevant ownership certificates. We cannot give any assurance that ownership dispute will not occur or that third parties will not assert any claims against us for compensation in respect of any use of these properties or land parcels.
Our business involves inherent risks and occupational hazards, which could damage our reputation, subject us to liability claims and cause substantial costs to us.
Our business involves inherent risks and occupational hazards. Under our mining operations, we engage or may engage in certain inherently risky and hazardous activities, including, among others, operations at height or on dangerous terrains, underground excavation and construction, use of heavy machinery, mining and handling of flammable and explosive materials, and we are therefore subject to risks associated with these activities, including, among others, geological catastrophes, toxic gas and liquid leakages, equipment failures, industrial accidents, fire, explosions and underground water leakages. Although we conduct geological assessments on mining conditions and adapt our mining plans to the mining conditions at each mine, we cannot assure you that adverse mining conditions will not endanger our workforce, increase our production costs, reduce our bauxite or coal output or temporarily suspend our operations. The occurrence of any of the foregoing events or conditions could have a material adverse impact on our business and results of operations. Additionally, we are exposed to operational risks associated with industrial or engineering activities, such as maintenance problems or equipment failures. These risks and hazards may result in personal injury and fatal casualties, damage to or destruction of properties or production facilities, and pollution and other environmental damage. Any of these consequences, to the extent they are significant, could result in business interruption, possible legal liability and damage to our business reputation and corporate image.
Our mines and operating facilities may be damaged by water, gas, fire or cave-ins due to unstable geological structures. Any significant accident, business disruption or safety incident could result in substantial uninsured costs and the diversion of our resources, which could materially and adversely affect our business operations and financial condition.
We may be subject to product liability claims.
Some of the products we sell or manufacture may expose us to product liability claims relating to property damage or personal injury. The successful assertion of product liability claims against us could result in significant damage payments and harm to our reputation, which in turn could have a material adverse effect on our business, financial condition and results of operations.
We are subject to risks normally associated with cross-border transactions, and our export products have been and may become subject to anti-dumping or countervailing duty proceedings.
During the past few years, we generated marginal revenue from exports of certain chemical alumina products and also from time to time from exports of certain non-ferrous metals and minerals products to foreign jurisdictions. In 2017, we only engaged in the export of certain chemical alumina products to foreign countries including South Korea and India and revenues generated from such export accounted for approximately 0.5% of our total revenues in 2017. Such foreign jurisdictions and other countries, such as the United States, may take restrictive measures, including, among others, imposition of tariffs, anti-dumping duties and other non-tariff barriers, to protect their own markets. Our sales in overseas markets may be adversely affected by increases in or new impositions of anti-dumping duties, countervailing duties, quotas or tariffs imposed on our exports. Further increases in or new imposition of anti-dumping duties, countervailing duties, quotas or tariffs on our sales in these markets could adversely affect the exports to these regions in the future. By virtue of our transactions with parties outside the PRC, we will be subject to the risks normally associated with cross-border business transactions and activities. We will also be exposed to the risk of changes in social, legal, political and economic conditions in the foreign jurisdictions. In particular, unexpected changes in regulatory requirements, tariffs and other trade barriers and price or exchange controls could limit our operations and make the repatriation of profits difficult.
We are subject to litigation risks.
In the ordinary course of business, claims involving project owners, customers, suppliers and subcontractors may be brought against us and by us in connection with our operations. If we were found to be liable on any of the claims, we would have to incur a charge against earnings to the extent a reserve had not been established for the matter in our accounts, or to the extent the claims were not sufficiently covered by our insurance coverage. Both claims brought against us and by us, if not resolved through negotiations, are often subject to lengthy and expensive litigation or arbitration proceedings. Charges associated with claims brought against us and write-downs associated with claims brought by us could have a material adverse impact on our business, financial condition, results of operations and cash flow. Moreover, legal proceedings resulting in judgments or findings against us may harm our reputation and damage our prospects for future contract or business awards.
We face counterparty risks.
While we generally sell goods and provide services to reputable customers and evaluate the customers’ credit in accordance with our internal risk management criteria, such as their credit history and likelihood of default, we have limited access to information about our customers and we may encounter difficulties in the collection of receivables in certain countries that we have less experience in our dealings. Therefore, we cannot guarantee that all of our customers will fully perform their obligations under their respective contracts with us, and the deterioration of any customers’ credit or payment conditions may result in those customers defaulting on their contractual obligations, which could materially and adversely affect our business, financial condition and results of operations. In addition, disputes with governmental entities and other public organizations could potentially lead to contract termination if these remain unresolved or may take a considerably longer period of time to resolve than disputes with counterparties in the private sector, and payments from these entities and organizations may be delayed as a result.
We may face challenges to our intellectual property rights which could adversely affect our reputation, business and financial position.
We own important intellectual property, including patents and trademarks. Our intellectual property plays an important role in maintaining our competitive position in a number of the markets that we serve. Our competitors may develop technologies that are similar or superior to our proprietary technologies or design around the patents we own or license. Developments or assertions by or against us relating to intellectual property rights, and any inability to protect or enforce these rights, could adversely affect our business and competitive position.
We may be exposed to claims in relation to the unsatisfactory performance of third-party service providers, and disputes with business partners may also adversely affect our business.
We rely on third-party service providers for certain services, including but not limited to mining infrastructure construction, logistics services or warehouse management. Therefore, we are exposed to the risk that our third-party service providers may fail to perform their obligations, which may adversely affect our business operations. In addition, from time to time, we co-operate with business partners to develop our business, including acquiring strategic mining resources or businesses that complement our own business line. Furthermore, we operate certain projects through joint venture arrangements and may enter into further joint ventures in the future along with the expansion of our operations. We may have disputes with these business partners or joint venture partners over various aspects, such as performance of each party’s obligations, scope of each party’s responsibilities, product quality and logistics services. If such disputes cannot be settled in a timely manner, our financial condition and business may be adversely affected.
Failure to hire and retain management executives and other qualified personnel could adversely affect our business and prospects.
The growth of our business operations depends on the continued services of our senior management team. The industry experience, expertise and contributions of our executives and other members of our senior management are essential to our continued success. We will require an increasing number of experienced and competent executives in the future to implement our growth plans. If we were to lose the services of any of our key management members and were unable to recruit and retain personnel with equivalent qualifications at any time, the management and growth of our business could be adversely affected.
Competition for qualified personnel in general is intense in the PRC and other markets where we operate. We cannot guarantee that we will be able to maintain an adequately skilled labor force necessary for us to execute our projects or to perform other corporate activities, nor can we guarantee that staff costs will not increase as a result of a shortage in the supply of skilled personnel. If we fail to attract and retain personnel with suitable managerial, technical or marketing expertise or maintain an adequate labor force on a continuous basis, our business operations could be adversely affected and our future growth and expansions may be inhibited.
We may not be able to detect and prevent fraud or other misconduct committed by our employees, representatives, agents, customers, affiliates or other third parties.
We may be exposed to fraud or other misconduct committed by our employees, representatives, agents, customers, affiliates or other third parties that could subject us to litigation, financial losses and sanctions imposed by governmental authorities, as well as adversely affect our reputation, business, financial condition, results of operations and ADS trading prices. Such misconduct may include, among others:
hiding unauthorized or unsuccessful activities, resulting in unknown and unmanaged risks or losses;
intentionally concealing material facts, or failing to adequately perform necessary due diligence or risk analysis procedures designed to identify potential risks;
improperly using or disclosing confidential information;
engaging in improper activities or activities that might be subject to penalties, fines or sanctions;
misappropriation of funds;
conducting transactions that exceed authorized limits;
engaging in misrepresentation or fraudulent, deceptive or otherwise improper or illegal activities;
engaging in unauthorized or excessive transactions to the detriment of our customers; or
otherwise not complying with applicable laws or our internal policies and procedures.
| ● | hiding unauthorized or unsuccessful activities, resulting in unknown and unmanaged risks or losses; |
| ● | intentionally concealing material facts, or failing to adequately perform necessary due diligence or risk analysis procedures designed to identify potential risks; |
| ● | improperly using or disclosing confidential information; |
| ● | engaging in improper activities or activities that might be subject to penalties, fines or sanctions; |
| ● | misappropriation of funds; |
| ● | conducting transactions that exceed authorized limits; |
| ● | engaging in misrepresentation or fraudulent, deceptive or otherwise improper or illegal activities; |
| ● | engaging in unauthorized or excessive transactions to the detriment of our customers; or |
| ● | otherwise not complying with applicable laws or our internal policies and procedures. |
Our internal control procedures are designed to monitor our operations and ensure overall compliance. However, such internal control procedures may be unable to identify, detect or prevent all incidents of non-compliance or suspicious transactions in a timely manner, if at all. In addition, we do not have control over the activities conducted on their own by those of our customers, affiliates or other third parties.
There is no assurance that fraud or other misconduct by our employees, representatives, agents, customers, affiliates or other third parties will not occur in the future. If such fraud or other misconduct does occur and to the extent that our employees, representatives, agents, customers, affiliates or other third parties are penalized for any of their non-compliance activities or are otherwise subject to any sanctions laws of foreign jurisdictions, it may causenegative publicity of us as a result, and could have a material adverse effect on our business, financial condition, results of operations and our ADS trading prices.
Cyber attacks and security breaches may threaten the integrity of our intellectual property and other sensitive information and disrupt our business operations, which could adversely affect our reputation, business and financial position.
We face global cybersecurity threats, which may range from uncoordinated individual attempts to sophisticated and targeted measures directed at us. Cyber attacks and security breaches may include, but are not limited to, attempts to access information, computer viruses, denial of service and other electronic security breaches. Cyber attacks and security breaches may cause equipment failures, loss of information and limited access to systems. For manufacturing companies, cyber attacks and security breaches may result in the theft of sensitive data, including valuable technical and marketing information, disruptions to operations and breakdown of industrial control system. The economic costs to us to eliminate or alleviate cyber attacks and security breaches could be significant and may be difficult to estimate or calculate because the loss may differ based on the identity and motive of the programmer or hacker, which are often difficult to identify. Further, the perpetrators of cyber attacks and security breaches are not restricted to specific groups or persons. These attacks may be committed by company employees or external actors operating in any geography, including jurisdictions where law enforcement measures to address such attacks are unavailable or ineffective, and may even be launched by or at the behest of nation states.
Although we have not experienced any material cybersecurity incidents in the past, we cannot assure you that we will not experience them in the future. Due to the evolving nature of cybersecurity threats, the scope and impact of any future incident cannot be predicted. While we continually workdevote significant resources to security measures to safeguard our systems and mitigate potential risks, such as deploying network protection devices and performing regular security assessment, there is no assurance that such actions will be sufficient to prevent cyber attacks or security breaches that manipulate or improperly use our systems or networks, compromise confidential or otherwise protected information, destroy or corrupt data, or otherwise disrupt our operations. The occurrence of such events could negatively impact our reputation and our competitive position and could result in litigation with third parties, regulatory action, loss of business, potential liability and increased remediation costs, any of which could have an adverse effect on our financial condition and results of operations.
We are subject to risks normally associated with cross-border transactions, and our export products have been and may become subject to anti-dumping or countervailing duty proceedings.
During the past few years, we generated marginal revenue from exports of certain chemical alumina products and also from time to time from exports of certain non-ferrous metals and minerals products to foreign jurisdictions. In 2018, we only engaged in the export of certain chemical alumina products to foreign countries including, among others, South Korea, Japan and countries in Southeast Asia, and revenue generated from such export accounted for approximately 0.5% of our total revenues in 2018. Such foreign jurisdictions and other countries may take restrictive measures, including, among others, imposition of tariffs, anti-dumping duties and other non-tariff barriers, to protect their own markets. The sales of our product in overseas markets may be adversely affected by increases in or new impositions of anti-dumping duties, countervailing duties, quotas or tariffs imposed on our exports. Further increases in or new imposition of anti-dumping duties, countervailing duties, quotas or tariffs on our sales in these markets could adversely affect the exports to these regions in the future. For example, since October 1, 2018, the U.S. government has imposed a 10% tariff on various aluminum products imported from China, including chemical alumina products. In 2018, we exported 26,000 tonnes of chemical alumina products to the United States, representing less than 0.1% of our total revenues in 2018. Other than exports of chemical alumina products, we did not have any exports to the United States in 2018. However, if there is any escalation in trade frictions, we cannot assure you whether such development would not have a material adverse effect on the business environment in general, global economic conditions and the stability of global financial markets. Any of these factors affected by the developments in trade barriers could in turn have a material adverse effect on our business, financial condition and results of operations.
By virtue of our transactions with parties outside the PRC, we will be subject to the risks normally associated with cross-border business transactions and activities. We will also be exposed to the risk of changes in social, legal, political and economic conditions in the foreign jurisdictions. In particular, unexpected changes in regulatory requirements, tariffs and other trade barriers and price or exchange controls could limit our operations and make the repatriation of profits difficult.
Our operations are affected by a number of risks relating to conducting business in the PRC.
As a significant majority of our assets and operations are located in the PRC, we are subject to a number of risks relating to conducting business in the PRC, including the following:
| ● | The central and local PRC government continues to exercise a substantial degree of control and influence over the aluminum industry in China and shape the structure and development of the industry through the imposition of industry policies governing major project approvals and safety, environmental and quality regulations. If the PRC government changes its current policies or the interpretation of those policies that are currently beneficial to us, we may face pressure on profit margins and significant constraints on our ability to expand our business operations. |
The central and local PRC government continues to exercise a substantial degree of control and influence over the aluminum industry in China and shape the structure and development of the industry through the imposition of industry policies governing major project approvals and safety, environmental and quality regulations. If the PRC government changes its current policies or the interpretation of those policies that are currently beneficial to us, we may face pressure on profit margins and significant constraints on our ability to expand our business operations.
Although the PRC has been one of the world’s fastest growing economies in terms of GDP growth in the past 30 years, the global financial crisis that unfolded in 2008 and continued in the past few years, coupled with the on-going structural reform of the PRC economy, has led to a marked slowdown in the economic growth of the PRC. For example, the GDP growth rate of the PRC decreased from 11.4% in 2007 to 6.9% in 2017. There is no assurance that the GDP growth rate of the PRC will not further decline. A slowdown in economic growth could reduce business activities and demand for our products. In addition, the PRC government exercises control over China’s economic growth through the allocation of resources, control of payments of obligations denominated in foreign currencies and monetary and tax policies. Some of these measures benefit the overall economy of China, but may have a materially adverse impact on us.
In 2005, China adopted a managed floating exchange rate system to allow the value of the Renminbi to fluctuate within a regulated band based on supply and demand with reference to a basket of currencies. Since then the exchange rate between the U.S. dollar and Renminbi has fluctuated and become increasingly unpredictable following the global financial crisis with increasing pressure on the Renminbi to appreciate. In April 2012, the PRC government took a milestone step in turning the Renminbi into a global currency by doubling the size of its trading band against the U.S. dollar, pushing through a crucial reform that further liberalizes its financial markets. The People’s Bank of China further allows the Renminbi to rise or fall 2% from a mid-point every day, effective on March 17, 2014, compared with its previous 1% limit. It is difficult to predict how market forces or PRC or U.S. government policy may impact the exchange rate between the RMB and the U.S. dollar in the future. Any appreciation or depreciation of the Renminbi will affect the value of our U.S. dollar-denominated borrowings and overseas investments, the prices of our export sales denominated in foreign currencies and the Renminbi equivalent value of our trade and notes receivable denominated in foreign currencies, which may affect our financial condition and results of operations. Our financial condition and operating performance may also be affected by changes in the value of currencies other than Renminbi in which our earnings and obligations are denominated.
| ● | Although the PRC has been one of the world’s fastest growing economies in terms of GDP growth in the past 30 years, the global financial crisis that unfolded in 2008, coupled with the on-going structural reform of the PRC economy in the past few years, has led to a marked slowdown in the economic growth of the PRC. For example, the GDP growth rate of the PRC decreased from 11.4% in 2007 to 6.6% in 2018. There is no assurance that the GDP growth rate of the PRC will be maintained at the current level. A slowdown in economic growth could reduce business activities and demand for our products. In addition, the PRC government exercises control over China’s economic growth through the allocation of resources, control of payments of obligations denominated in foreign currencies and monetary and tax policies. Some of these measures benefit the overall economy of China, but may have a materially adverse impact on us. |
| ● | We are subject to reviews and inspections by various governmental authorities and regulatory agencies. These reviews and inspections could cover a broad range of aspects in relation to our business and operations, including financial reporting, tax reporting, internal control and compliance with applicable laws, rules and regulations. We cannot predict the impact of any findings of these reviews and inspections to be carried out by governmental authorities and regulatory agencies in the future, and we cannot assure you that the outcome of any such reviews and inspections would not have a material adverse effect on our business, financial condition, results of operations and prospects. |
| ● | In 2005, China adopted a managed floating exchange rate system to allow the value of the Renminbi to fluctuate within a regulated band based on supply and demand with reference to a basket of currencies. Since then the exchange rate between the U.S. dollar and Renminbi has fluctuated and become increasingly unpredictable following the global financial crisis with increasing pressure on the Renminbi to appreciate. In April 2012, the PRC government took a milestone step in turning the Renminbi into a global currency by doubling the size of its trading band against the U.S. dollar, pushing through a crucial reform that further liberalizes its financial markets. The PBOC further allows the Renminbi to rise or fall 2% from a mid-point every day, effective on March 17, 2014, compared with its previous 1% limit. In recent years, the Renminbi has fluctuated against the U.S. dollar, at times significantly. For example, the Renminbi continuously appreciated in 2017 and the first quarter of 2018, reversing three consecutive years of depreciation. However, starting from the second quarter of 2018, the Renminbi depreciated significantly. Since early 2019, the Renminbi has appreciated. It is difficult to predict how market forces or PRC or U.S. government policy may impact the exchange rate between the Renminbi and the U.S. dollar in the future. Any appreciation or depreciation of the Renminbi will affect the value of our U.S. dollar-denominated borrowings and overseas investments, the prices of our export sales denominated in foreign currencies and the Renminbi equivalent value of our trade and notes receivable denominated in foreign currencies, which may affect our financial condition and results of operations. Our financial condition and operating performance may also be affected by changes in the value of currencies other than Renminbi in which our earnings and obligations are denominated. |
| ● | There might be uncertainties regarding the interpretation and enforcement of PRC laws, rules and regulations. The Chinese legal system is a civil law system based on written statutes. Unlike common law systems, it is a system in which decided legal cases may be cited for reference but have limited precedential value. Over the past decades, the PRC government has promulgated a comprehensive system of laws, rules and regulations governing economic matters. The overall effect of legislation over the past decades has significantly enhanced the protections afforded to foreign investors in general. However, because these laws, rules and regulations are relatively new, and because of the relatively limited volume of published cases and their non-binding nature, and because the laws, rules and regulations often give the relevant administrative and court authorities certain discretion in how to interpret and enforce them, uncertainties regarding the interpretation and enforcement of these laws, rules and regulations may adversely affect our operations. |
You may experience difficulties in effecting service of legal process and enforcing judgments against us and our management.
Substantially all of our assets and our subsidiaries are located in the PRC. In addition, most of our directors and officers reside within the PRC, and most of the assets of our directors and officers are located within the PRC. As a result, it may not be possible to effect service of process within the United States or elsewhere outside the PRC upon most of our directors or officers, including with respect to matters arising under applicable laws and regulations. Moreover, the PRC does not have treaties providing for the reciprocal recognition and enforcement of judgments of courts with the United States, the United Kingdom or most other Western countries, and Hong Kong has no arrangement for the reciprocal enforcement of judgments with the United States.
As a result, recognition and enforcement in the PRC laws, rulesor Hong Kong of judgments of a court in the United States and regulations. The Chinese legal system isany of the other jurisdictions mentioned above in relation to any matter not subject to a civil law system based on written statutes. Unlike common law systems, it is a system in which decided legal casesbinding arbitration provision may be cited for reference but have limited precedential value. Over the past decades, the PRC government has promulgated a comprehensive system of laws, rules and regulations governing economic matters. The overall effect of legislation over the past decades has significantly enhanced the protections afforded to foreign investors in general. However, because these laws, rules and regulations are relatively new, and because of the relatively limited volume of published cases and their non-binding nature, and because the laws, rules and regulations often give the relevant administrative and court authorities significant discretion in how to interpret and enforce them, uncertainties regarding the interpretation and enforcement of these laws, rules and regulations may adversely affect our operations.
difficult or impossible.
The audit reports included in this annual report are prepared by auditors who are not inspected fully by the Public Company Accounting Oversight Board and, as such, you are deprived of the benefits of such inspection.
Auditors of companies that are registered with the SEC and traded publicly in the United States, including our independent registered public accounting firms, must be registered with the US Public Company Accounting Oversight Board (United States) (the “PCAOB”) and are required by the laws of the United States to undergo regular inspections by the PCAOB to assess their compliance with the laws of the United States and professional standards. Because we have substantial operations within the PRC and the PCAOB is currently unable to conduct full inspections of the work of our auditors as they relate to those operations without the approval of the Chinese authorities, our auditors’ work related to our operations in China is not currently inspected by the PCAOB.
This lack of PCAOB inspections of audit work performed in China prevents the PCAOB from regularly evaluating audit work of any auditor that was performed in China including that performed by our auditors. As a result, investors may be deprived of the full benefits of PCAOB inspections.
The inability of the PCAOB to conduct inspections of audit work performed in China makes it more difficult to evaluate the effectiveness of our auditors’ audit procedures as compared to auditors in other jurisdictions that are subject to PCAOB inspections on all of their work. Investors may lose confidence in our reported financial information and procedures and the quality of our financial statements.
Proceedings instituted recently by the SEC against five PRC-based accounting firms could result in our financial statements being determined to not be in compliance with the requirements of the Exchange Act.
In December 2012, the SEC brought administrative proceedings against five accounting firms in China, alleging that they had refused to produce audit work papers and other documents related to certain other China-based companies under investigation by the SEC for potential accounting fraud. On January 22, 2014, an initial administrative law decision was issued, censuring these accounting firms and suspending four of the five firms from practicing before the SEC for a period of six months. The four firms appealed to the SEC against this decision and, on February 6, 2015, each of the four accounting firms agreed to a censure and to pay a fine to the SEC to settle the dispute and avoid suspension of their ability to practice before the SEC. The firms’ ability to continue to serve all their respective clients is not affected by the settlement. The settlement requires the firms to follow detailed procedures to seek to provide the SEC with access to Chinese firms’ audit documents via the CSRC. If the firms do not follow these procedures, the SEC could impose penalties such as suspensions, or it could restart the administrative proceedings. The settlement did not require the firms to admit to any violation of law and preserves the firms’ legal defenses in the event the administrative proceeding is restarted.
We were not and are not subject to any SEC investigations, nor are we involved in the proceedings brought by the SEC against the accounting firms. However, the independent registered public accounting firms that issue the audit reports included in our annual reports filed with the SEC is affiliated to one of the four accounting firms above.
In the event that the SEC restarts the administrative proceedings, depending upon the final outcome, listed companies in the United States with major PRC operations may find it difficult or impossible to retain auditors in respect of their operations in the PRC, which could result in financial statements being determined to not be in compliance with the requirements of the Exchange Act, including possible delisting. Moreover, any negative news about the proceedings against these audit firms may cause investor uncertainty regarding China-based, United States-listed companies and the market price of our ADSs may be adversely affected.
If our independent registered public accounting firms were denied, temporarily, the ability to practice before the SEC and we were unable to timely find another registered public accounting firm to audit and issue an opinion on our financial statements, our financial statements could be determined to not be in compliance with the requirements of the Exchange Act. Such a determination could ultimately lead to the delisting from the NYSE or deregistration from the SEC, or both, which would substantially reduce or effectively terminate the trading of our ADSs in the United States.
Item 4. Information on the Company
| A.Item 4. | Information on the Company |
| A. | History and Development of the Company |
We were incorporated as a joint stock limited company under the Company Law of the PRC on September 10, 2001 under the corporate name Aluminum Corporation of China Limited. Our principal executive and registered office is located in the People’s Republic of China at No. 62 North Xizhimen Street, Haidian District, Beijing, China 100082, and our telephone number is (86) 10 8229 8322. Our website address iswww.chalco.com.cn. The information on our website does not constitute a part of this annual report. Our U.S. public filings are available at the website maintained by the SEC atwww.sec.gov, which contains reports, proxies and information statements, and other information regarding issuers that file electronically with the SEC.
Pursuant to a reorganization agreement entered into among Chinalco, Guangxi Investment and Guizhou Development in 2001, substantially all of Chinalco’s alumina and primary aluminum production operations, as well as a research institute and other related assets and liabilities, were transferred to us upon our formation. We acquired our bauxite mining operations and associated mining rights from Chinalco in a separate mining rights agreement.
Our A Shares have been listed on the Shanghai Stock Exchange since April 2007. Our H Shares and our ADSs, each representing 25 H Shares, have been listed on the Hong Kong Stock Exchange and New York Stock Exchange, respectively, since December 2001.
We are a vertically integrated aluminum producer with operations in bauxite and coal mining, alumina refining and primary aluminum smelting. We also produce ancillary products and services derived from or related to our aluminum operations. In addition, we are engaged in trading and logistics of alumina, primary aluminum, other non-ferrous metal products, coal products and raw and ancillary materials in bulk domestically and internationally. Since 2013, we have expanded our operations into power generation. See “– B. Business Overview” for more details.
We have substantially increased the size and scope of our operations through organic growth as well as selective acquisitions and joint ventures. Our key operating assets currently include seven subsidiaries mainly engaged in bauxite mining; onetwo integrated alumina and primary aluminum production plant; eight stand-alone alumina refineries; eightnine stand-alone primary aluminum smelters; twothree stand-alone carbon production plants; one integrated power generation company with coal mining operations and one institute providing research and development services. All of our principal alumina and primary aluminum production facilities are operated in accordance with ISO14001 standards.
Disposal of Aluminum Fabrication Business
We disposed of substantially all of our aluminum fabrication operations to Chinalco pursuant to the approval of shareholders at the 2012 annual general meeting on June 27, 2013.
On May 13, 2013, we submitted the tender notice to CBEX to dispose of the equity interest we held in eight aluminum fabrication enterprises, including Henan Aluminum, Chalco Southwest Aluminum, Chalco Southwest Aluminum Cold Rolling, Huaxi Aluminum, Qingdao Light Metal, Chalco Ruimin, Chalco Sapa Aluminum Products (Chongqing) Co., Ltd. and Guizhou Chalco Aluminum Co., Ltd. (collectively, “Aluminum Fabrication Interests”) through open tender. Chinalco participated in and won the bid for the Aluminum Fabrication Interests on June 7, 2013. We entered into an agreement (the “Aluminum Fabrication Interests Transfer Agreement”) with Chinalco on June 9, 2013 for the disposal of Aluminum Fabrication Interests for a consideration of RMB3,242.2 million. Such consideration was the initial bidding price, which was determined with reference to the appraised value of the Aluminum Fabrication Interests. Pursuant to the Aluminum Fabrication Interests Transfer Agreement, Chinalco agreed to pay the consideration in cash in two installments, namely, 30% of the consideration to be paid within five business days after the effective date of the agreement and 70% of the consideration to be paid by June 30, 2014. Chinalco must pay interest for the second installment for the period starting from the date immediately after the effective date until the payment date at the one-year lending rate set by the PBOC. The disposal was approved at the 2012 annual general meeting held on June 27, 2013 and we completed the disposal on June 27, 2013. Chinalco paid the consideration in full in June 2014.
As a condition of the disposal of the Aluminum Fabrication Interests, on June 9, 2013, we entered into an agreement with Chinalco to transfer the outstanding entrusted loans we provided to Henan Aluminum and Qingdao Light Metal as of December 31, 2012 to Chinalco for a consideration of RMB1,756.0 million. Such consideration was determined based on negotiations between the parties, with reference to the appraised total value of the loans. Pursuant to the agreement, Chinalco agreed to pay the consideration in cash in five equal installments of RMB351.2 million, with the last installment, together with the relevant interests at the one-year lending rate set by the PBOC, to be paid by June 30, 2017. The transfer was approved at the 2012 annual general meeting held on June 27, 2013 and we completed the transfer on June 27, 2013. As of the date of this annual report, theThe payment had beenwas fully settled by Chinalco.Chinalco in accordance with the agreement.
In addition, we entered into an agreement with Northwest Aluminum Fabrication Plant, a subsidiary of Chinalco, on June 6, 2013 to dispose of all the assets of Northwest Aluminum for RMB1,659.6 million. Such consideration was determined based on negotiations between the parties, with reference to the appraised net asset value of Northwest Aluminum. Pursuant to the agreement, Northwest Aluminum Fabrication Plant agreed to pay the consideration in cash in five equal installments of RMB331.9 million, with the last installment, together with the relevant interests at the one-year lending rate set by the PBOC, to be paid by June 30, 2017. The disposal was approved at the 2012 annual general meeting held on June 27, 2013 and we completed the disposal on June 27, 2013. As of the date of this annual report, theThe payment had beenwas fully settled by Northwest Aluminum Fabrication Plant.Plant in accordance with the agreement.
Disposal of Assets of Alumina Production Line of Guizhou Branch
On June 6, 2013, we entered into an agreement with Guizhou Aluminum Plant, a subsidiary of Chinalco, to dispose of the assets of the alumina production line of our Guizhou branch for a consideration of RMB4,429.0 million. Such consideration was determined based on negotiations between the parties, with reference to the appraised net asset value of such alumina assets of our Guizhou branch. Pursuant to the agreement, Guizhou Aluminum Plant agreed to pay the consideration in cash in five equal installments of RMB885.8 million, with the last installment, together with the relevant interests at the one-year lending rate set by the PBOC, to be paid by June 30, 2017. The disposal was approved at the 2012 annual general meeting held on June 27, 2013 and we completed the disposal on June 27, 2013. As of the date of this annual report, theThe payment had beenwas fully settled by Guizhou Aluminum Plant.Plant in accordance with the agreement.
We decided to dispose of the assets of the alumina production line of Guizhou branch because the district in which they were located had been changed from an industrial district to a commercial district based on the local urban plan, which will significantly increase Guizhou branch’s environmental compliance costs. We built a new alumina refinery, Guizhou Huajin, in an area relatively close to major bauxite and coal mines in Guizhou Province, which commenced production with an annual capacity of 1.6 million tonnes of alumina in 2015.
DisposalTransfer of Equity Interest in Shanxi Huaxing
The proceeds from the private placement of A Shares was proposed to invest in Chalco Xing County Alumina Project, the Chalco Zhongzhou Bayer Ore-dressing Process Expansion Construction Project, and the replenishment of our working capital.
The Chalco Xing County Alumina Project, which was carried out by Shanxi Huaxing, commenced construction in May 2011 and undertook full operation in 2014. After the completion of private placement of A Shares in June 2015, the Board resolved to replace the funds which have been invested by us in advance with the proceeds raised from the private placement of A Shares. In light of our strategic blueprint for the development of Shanxi aluminum recycle industrial park, we planned to introduce strategic investors for joint investment and cooperation to develop a new model of integrated coal, electricity and aluminum operations. In December 2015, the Group entered into an equity transfer agreement with Shenzhen CR Yuanta Asset Management Co., Ltd., a state- owned entity, to transfer 50% equity interests in Shanxi Huaxing, a wholly ownedwholly-owned subsidiary, through the Shanghai United Assets and Equity Exchange at a price of RMB2,351 million.million (the “2015 Equity Transfer Agreement”). The price was determined based on the appraisal value provided by an independent qualified appraisal company. According to the 2015 Equity Transfer Agreement, 30% of the consideration amounting to RMB705 million has been received by us in December 2015. In December 2016, Shenzhen CR Yuanta Asset Management Co., Ltd. transferred the 50% of equity interest in Shanxi Huaxing to Baotou Transportation Investment Group Co., Ltd. As agreed among Shenzhen CR Yuanta Asset Management Co., Ltd., Baotou Transportation Investment Group Co., Ltd. and the Company, Baotou Transportation Investment Group Co., Ltd., shall assume the payment obligation on the outstanding consideration of RMB1,646,035,160 payable by Shenzhen CR Yuanta Asset Management Co., Ltd. to the Company under the 2015 Equity Transfer Agreement and settle the outstanding consideration in full together with interest accrued thereon from January 1, 2017 to the date of payment before March 31, 2017. The payment was fully settled by Baotou Transportation Investment Group Co., Ltd. in March 2017.
In December 2018, we entered into an equity transfer agreement with Baotou Transportation Investment Group Co., Ltd., pursuant to which we agreed to acquire 50% equity interest in Shanxi Huaxing through the Shanghai United Assets and Equity Exchange at a price of approximately RMB2,665.2 million, which we paid in full in December 2018. Upon completion of the acquisition, Shanxi Huaxing became a wholly-owned subsidiary of the Company. The acquisition is conducted for the purpose of enhancing our profitability and is in line with our strategic layout of alumina and aluminum business, as the increase of our shareholding in Shanxi Huaxing, an alumina plant, is expected to enhance the synergy with our primary aluminum production in Shanxi, where we have newly added production capacity of primary aluminum.
Transfer of Shares of Jiaozuo Wanfang
On January 22, 2015 and January 23, 2015, we decreased our shareholding in Jiaozuo Wanfang by 4,758,858 shares through the securities exchange system of the Shenzhen Stock Exchange. In March 2015, we transferred 100,000,000 shares of Jiaozuo Wanfang to Geo-Jade Petroleum Corporation by way of agreement after the public solicitation for potential transferees. On June 25, 2015, we further transferred 42,550,900 shares of Jiaozuo Wanfang by way of block trading through the securities exchange system of the Shenzhen Stock Exchange. On December 18, 21 and 22, 2015, we reduced our shareholding in Jiaozuo Wanfang by 16,695,100 shares through the centralized bidding trading system of the Shenzhen Stock Exchange. From December 23 to 25, 2015, we reduced our shareholding in Jiaozuo Wanfang by 13,865,000 shares through the centralized bidding trading system of the Shenzhen Stock Exchange and block trading. As a result, we held 29,582,057 shares of Jiaozuo Wanfang as of December 31, 2015, representing 2.46% of the total share capital of Jiaozuo Wanfang. During the period from July 8, 2016 to September 27, 2016, we reduced our shareholding of Jiaozuo Wanfang by an aggregate of 16,628,098 shares via the Shanghai Stock Exchange centralized bidding trading system, representing approximately 1.39% of the total share capital of Jiaozuo Wanfang. The average price of reduction was approximately RMB8.73 per share. After the reduction, the Company remained holding 12,953,959 shares of Jiaozuo Wanfang, representing approximately 1.09% of its total share capital. During the period from September 29, 2016 to January 26, 2017, we reduced our shareholding of Jiaozuo Wanfang by an aggregate of 12,953,959 shares via the Shanghai Stock Exchange centralized bidding trading system, representing approximately 1.09% of the total share capital of Jiaozuo Wanfang. The average price of reduction was approximately RMB10.19 per share. After such reduction in our shareholding, we no longer hold any shares of Jiaozuo Wanfang.
Disposal of Certain Assets of Guizhou Branch
Guizhou branch entered into a land reserve acquisition cooperation agreement with the People’s Government of the Baiyun District of Guiyang, Guiyang Land Reserve Center, and Guizhou Aluminum Plant on November 13, 2015. As the land of Guizhou Aluminum Plant occupied by the electrolyticprimary aluminum plant of Guizhou branch shall be transferred to the respective land resources and reserve authorities, Guizhou branch agreed to sellsold the relevant assets, including buildings and structures located on the land occupied by the electrolyticprimary aluminum plant of Guizhou branch, to the Guiyang Land Reserve Center for a total consideration of RMB1.95 billion. The consideration was determined based on the asset appraisal conducted by an independent asset appraisal firm.
Disposal of the Environmental Protection Business
On May 30, 2016, the Board approved the transfer of the environmental protection assets in relation to the desulfurization, denitration and dedusting of the coal-fired generating units of five entities, namely Lanzhou branch, Baotou Aluminum, Shandong Huayu, Maliantai Power Station and Liupanshan Power Station of Ningxia Energy, by way of public bidding. On June 29, 2016, the assets transfer agreement in relation to disposal of the above environmental protection assets were entered into between Beijing Aluminum SPC Environment Protection Tech Co., Ltd., which had won the bid for the acquisition of the assets, and us. Pursuant to the asset transfer agreement, the aggregate consideration for the above environmental protection assets disposal was RMB1,754 million which was paid in two installments in June 2016 and December 2016, respectively.
We decided to dispose the environmental protection assets to reduce our capital investments and generate cash flows. We have been complying with the relevant standards of environmental protection through professional services rendered by specialized environmental protection companies.
Development of Gold Leasing Financing
On May 30, 2016, the Board resolved to develop gold leasing business to financing working capital. In 2016, 2017 and 2017,2018, we entered into several agreements with Bank of Communications Co., Ltd., China Everbright Bank and Agriculture Bank of China to finance working capital via gold leasing. In 2016 and 2017, the totalAs of December 31, 2018, our remaining proceeds from gold leasing financing,amounted to RMB 1.6 billion, which will behas been used to replenish working capital for our production and operation, amounted to RMB10.8billion.operation.
Construction Projects
As of the date of this annual report, we have undertaken a number of facility expansion projects in China. See “- D. Property, Plants and Equipment - Our Expansion.”
Overseas Development
Boffa Project
On July 29, 2010, weJune 8, 2018, Chalco Hong Kong and Chalco Guinea Company S.A., a wholly-owned subsidiary of Chalco Hong Kong, entered into a joint development agreementmining convention (the “Mining Convention”) with Rio Tintothe Guinean government, pursuant to which Chalco Hong Kong agreed to provide investment funds while the Guinean government agreed to provide mining licenses and Rio Tinto Iron Ore Atlantic Limited, an affiliate of Rio Tinto,rights to transport mining products for the development and operation of the SimandouBoffa Project, a premium open-pit iron oreproject for the construction and development of a bauxite mine located in Guinea, West Africa. This agreement provides that we (viaBoffa, Guinea.
Based on our subsidiary) would acquire 47%previous research and preliminary analysis and after taking into account various factors, including but not limited to (i) the bauxite reserve and the minable quantity in the mining area of the equity interest in a joint venture companyBoffa Project; (ii) the advancement and effectiveness of the existing development technologies; (iii) labor cost, transportation expense and other development costs and other factors, the total investment of the Boffa Project is estimated to be incorporated by Rio Tinto for an earn-in payment ofapproximately US$1.35 billion, and Rio Tinto would transfer its entire 95% of the equity interest in its project company for the Simandou Project, Simfer S.A.,706 million, subject to adjustment pursuant to the joint venture company.actual needs, which will be mainly allocated in the construction of mines, ports and lightering system and is expected to be funded through capital investment together with shareholders’ loans or bank loans. As of December 31, 2018, an aggregate of US$64 million of capital expenditure had been incurred for Boffa Project.
On April 22, 2011, Rio Tinto
In accordance with the Mining & Exploration Limited,Convention, a wholly-owned subsidiary of Rio Tinto, Simfer S.A.mining company (the “Mining Company”) and a port company (the “Port Company”) are established to act as the main operating bodies for mines construction and ports construction, respectively. In accordance with the Mining Convention, we own 85% and 95% equity interests in the Mining Company and the Government of Guinea entered into a settlement agreement, which, amongst other things, provided thatPort Company, respectively, while the Government of Guinea would be entitledGuinean government and its wholly-owned companies collectively own 15% and 5% equity interests in the Mining Company and the Port Company, respectively. Pursuant to acquire up to 35% of the equity interest in Simfer S.A. On November 28, 2011, we, throughMining Convention, Chalco Hong Kong established Chalco Iron Ore undershall grant the laws of Hong Kong with the China-Africa Development Fund and three leading PRC enterprisesGuinean government and/or its wholly-owned companies an option to obtain additional equity interests in the steel, port buildingMining Company and railway construction industriesgrant Societe Guineenne de Patrimoine Minier, a company wholly owned by the Guinean government, an option to serve as an investment vehicle for investingobtain additional equity interests in the Simandou Project. We, through Chalco Hong Kong, holdPort Company (together, the “Options”). If the Options are exercised in full, our equity interests in the Mining Company and Ports Company will reduce to 65% and 90%, respectively.
With a large reserve of resources, we believe the other investors collectively hold 35%Boffa Project would provide sustainable bauxite resources for our alumina production and its high ore grades would help reduce alkali and energy consumption in our alumina production. In addition, as the mines are close to port, we are able to consolidate inland waterway transportation and maritime transportation, which benefits long-term development of the equity interestproject and effectively controls investment risks at the early stage.
The Boffa Project commenced construction in Chalco Iron Ore.
Following the approvals of the relevant PRC authorities in MarchSeptember 2018 and April 2012, Chalco Hong Kong contributed approximately US$878 million to Chalco Iron Ore, representing 65% of the US$1.35 billion earn-inplanned to be paidput into operation by Chalco Iron Ore to Simfer Jersey Limited, the joint venture company incorporated by Rio Tinto under the laws of Jersey to implement the joint development agreement, as amended. On April 24, 2012, Chalco Iron Ore paid in full the total earn-in payment of US$1.35 billion to Rio Tinto and acquired its 47% equity interest in Simfer Jersey Limited. Simfer Jersey Limited currently holds 95% of the equity interest in Simfer S.A., with the remaining 5% being held by International Finance Corporation. In addition, during the period from May 2012 to the end of 2013, Chalco Iron Ore injected approximately US$561.5March 2020 with an expected annual bauxite output of 12 million in the form of capital contribution based on its proportion of equity interest to Simfer Jersey Limited for the development and operation of the Simandou Project pursuant to the joint development agreement, as amended. Meanwhile, the other shareholder of Simfer Jersey Limited also injected the capital contribution based on its proportion of equity interest to Simfer Jersey Limited. On October 18, 2013, we entered into a share purchase agreement with Chinalco and its wholly-owned subsidiary, Aluminum Corporation of China Overseas Holdings Limited (“Chinalco Overseas Holdings”), to dispose of 65% of the equity interest in Chalco Iron Ore and transfer outstanding bank loans provided by China Development Bank Corporation (“CDB”) to Chinalco Overseas Holdings for a consideration of US$2,066.5 million (the “Equity Interest”) and US$438.8 million (the “Loan Consideration”), respectively. The bank loans were used for Chalco Hong Kong’s capital contribution in Chalco Iron Ore. The Equity Interest was determined with reference to 65% of the valuation of Chalco Iron Ore and the Loan Consideration was determined based on the principal amount of such outstanding bank loans as shown in the financial statements of Chalco Hong Kong.
tonnes.
We believe that such disposal will enable us to focus on the development of our core business of alumina and primary aluminum operations, where we have established leading market positions, and to reduce future capital expenditures on iron ore development and to improve asset-to-debt ratio and generate expected cash flows. Pursuant to the agreement, in the event that we obtain the consent from CDB on the transfer of the bank loans, Chinalco agreed to pay the consideration for the Equity Interest in five installments, namely, US$438.8 million (which will be net off by the Loan Consideration), US$387.9 million, US$413.3 million, US$413.3 million and US$413.3 million, with the relevant interests at the London Interbank Offered Rate plus 0.9%, with the last installment to be paid by December 31, 2017. The transactions were approved at the 2013 second extraordinary general meeting held on November 29, 2013. We obtained the consent from Rio Tinto relating to such disposal on December 19, 2013. We completed the transactions on December 26, 2013. As of the date of this annual report, the bank loans had been transferred to net off the first installment and Chinalco had paid all five installments.
Private Placement of A Shares
On March 8, 2012, our Board resolved to issue up to 1.25 billion A Shares in the PRC. The A Share issue plans previously proposed by our Board on June 30, 2009 and January 30, 2011 and approved by our shareholders at the extraordinary general meeting, A Share class meeting and H Share class meeting held on August 24, 2009 and on April 14, 2011, respectively, ceased. Pursuant to the new issue plan approved by our Board on March 8, 2012, we planned to issue up to 1.25 billion A Shares, with a nominal value of RMB1.00 each, by way of private placement for expected proceeds not exceeding RMB8 billion. We intended to issue the A Shares to no more than ten specific target subscribers within six months of obtaining the approval of the CSRC. The issue price of A Shares to be offered shall be not less than 90% of the average trading price of our A Shares in twenty trading days immediately preceding the pricing determination date. We intended to apply proceeds from this private placement to finance Chalco Xing County Alumina Project, Chalco Zhongzhou branch Ore-dressing Bayer Process expansion construction project and to supplement working capital. The issue plan was approved by the SASAC on April 5, 2012 and by our shareholders at the extraordinary general meeting, A Share class meeting and H Share class meeting held on May 4, 2012. On August 24, 2012, our Board resolved to adjust the issue plan by proposing, among others, to increase the number of A Shares to be issued to up to 1.45 billion A Shares. The adjusted issue plan was approved by the SASAC and our shareholders at an extraordinary general meeting, A Share class meeting and the H Share class meeting on October 12, 2012 and by the CSRC on December 7, 2012. On March 14, 2013, we obtained the approval from the CSRC on our proposed private placement of A Shares under such adjusted issue plan, with effective period of six months after the approval date. However, the CSRC temporarily retrieved its approval in July 2013 due to its on-going investigation of the sponsor of our proposed private placement of A Shares. The period of authorization to the Board relating to the adjusted issue plan was extended by our shareholders at the 2013 annual general meeting, A Share class meeting held on June 27, 2014 and H Share class meeting held on June 27, 2014, with an effective period of 12 months after the approval date. On January 4, 2015, we submitted the “Report regarding the resumption of the approval of non-public offering of shares of Aluminum Corporation of China Limited” to the CSRC. On April 24, 2015, we received the Approval in Relation to the Non-public Issuance of Shares by Aluminum Corporation of China Limited issued by the CSRC, pursuant to which we were approved to issue no more than 1,450,000,000 new shares. We completed the non-public issuance of A sharesShares on June 15, 2015 and issued an additional 1,379,310,344 A Shares pursuant to the specific mandate as approved at the annual general meeting of the Company on June 27, 2014. On June 15, 2015, we completed the non-public issuance of 1,379,310,344 A Shares. Upon completion, the total number of A Shares of the Company was increased from 13,524,487,892 to 14,903,798,236. Please refer to “- Subscription of Equity Interest of Certain Subsidiaries and Subsequent Issuance of Additional A Shares” for further changes of our issuance of A Shares.
Senior Perpetual Capital Securities Offering
In October 2013, we completed the issuance of US$350 million in aggregate principal amount of 6.625% senior perpetual capital securities (the “2013 Senior Perpetual Securities”) through Chalco Hong Kong Investment Company Limited (the “Bond Issuer”), our wholly-owned subsidiary, which was exempted from, and not subject to, registration under the Securities Act. The 2013 Senior Perpetual Securities are guaranteed by Chalco Hong Kong and its certain subsidiaries. The 2013 Senior Perpetual Securities also have the benefit of a keepwell deed dated October 29, 2013 entered into by the Issuer, the Company, Chalco Hong Kong and the trustee and a deed of equity interest purchase undertaking dated on October 29, 2013 entered into by the Company and the trustee, both deeds being executed in favor of the trustee. The 2013 Senior Perpetual Securities were listed on the Hong Kong Stock Exchange on October 30, 2013. The net proceeds from the issue of the 2013 Senior Perpetual Securities after deduction of issuance costs are RMB2,122.6 million and have been on-lent to the Company or any of its subsidiaries for general corporate use. Coupon payments of 6.625% per annum on the 2013 Senior Perpetual Securities are paid semi-annually in arrears from October 29, 2013, and may be deferred at our discretion unless, during the six-month period ending on the day before the relevant scheduled coupon payment date, we have, or the Bond Issuer or Chalco Hong Kong has, declared or paid a discretionary dividend, distribution or other discretionary payment on or in respect of, or have/has at its discretion repurchased, redeemed or otherwise acquired, any securities of lower or equal rank, subject to certain exceptions. The 2013 Senior Perpetual Securities have no fixed maturity and are callable only at our option on or after October 29, 2018, at their principal amounts together with any accrued, unpaid or deferred coupon interest payments. After October 29, 2018, the coupon rate willwould be reset every five calendar years to a rate of interest expressed as a percentage per annum equal to the sum of (a) the initial spread of 5.312 per cent, (b) the U.S. Treasury Rate, and (c) a margin of 5.00 per cent per annum. While any coupon interest payments are unpaid or deferred, we, Chalco Hong Kong, and the Bond Issuer shall not, subject to certain exceptions, declare or pay any discretionary dividends or make distributions or similar discretionary payments in respect of, or at its discretion repurchase, redeem or otherwise acquire for any consideration any securities of lower or equal rank. We redeemed the 2013 Senior Perpetual Securities in October 2018.
In April 2014, we completed the issuance of US$400 million in aggregate principal amount of 6.25% senior perpetual capital securities (the “2014 Senior Perpetual Securities”) through the Bond Issuer, which was exempted from, and not subject to, registration under the Securities Act. The 2014 Senior Perpetual Securities are guaranteed by Chalco Hong Kong and its certain subsidiaries. The 2014 Senior Perpetual Securities also have the benefit of a keepwell deed entered into by the Bond Issuer, the Company, Chalco Hong Kong and the trustee and a deed of equity interest purchase undertaking entered into by the Company and the trustee, both deeds being executed in favor of the trustee. The 2014 Senior Perpetual Securities were listed on the Hong Kong Stock Exchange on April 22, 2014. The net proceeds from the issue of the 2014 Senior Perpetual Securities after deduction of issuance costs are RMB2,461.8 million and have been on-lent to the Company or any of its subsidiaries for general corporate use. Coupon payments of 6.25% per annum on the 2014 Senior Perpetual Securities are paid semi-annually on April 29 and October 29 in arrears from April 17, 2014, and may be deferred at the discretion of the Group. The first coupon payment date was April 29, 2014. The 2014 Senior Perpetual Securities have no fixed maturity and are callable only at our option on or after April 17, 2017 at their principal amounts together with any accrued, unpaid or deferred coupon interest payments. While any coupon interest payments are unpaid or deferred, we, the subsidiary guarantors and the Bond Issuer cannot declare or pay dividends or make distributions or similar discretionary payments in respect of, or repurchase, redeem or otherwise acquire any securities of lower or equal rank. After April 17, 2017, the coupon rate waswould be reset to a percentage per annum equal to the sum of (a) the initial spread of 5.423 per cent, (b) the U.S. Treasury Rate, and (c) a margin of 5.00 per cent, per annum. We redeemed the 2014 Senior Perpetual Securities in April 2017.
On October 27, 2015, our Company issued RMB2,000 million perpetual medium-term notes at an initial distribution rate of 5.50% (the “2015 Perpetual Medium-term Notes”). The proceeds from the issuance waswere RMB2,000 million and will bewere used for repayments of interest-bearing loans and borrowings. Coupon payments of 5.50% per annum on the 2015 Perpetual Medium-term Notes are paid annually in arrears from October 29, 2015 and may be deferred at the discretion of our Company. The 2015 Perpetual Medium-term Notes have no fixed maturity and are callable only at the Group’s option on October 29, 2020 or any coupon distribution date after October 29, 2020 at their principal amounts together with any accrued, unpaid or deferred coupon distribution payments. The coupon distribution rate will be reset to a percentage per annum equal to the sum of (a) the initial spread of 2.61 per cent, (b) the China Treasury Rate, and (c) a margin of 300 Bps every five years after October 29, 2020. While any coupon distribution payments are unpaid or deferred, the headquarters of the Company cannot declare or pay dividends to shareholders or decrease the share capital, or make material fixed asset investments of the headquarters of the Company.
On November 7, 2016, the Bond Issuer issued US$500 million senior perpetual securities (the “2016 Senior Perpetual Securities”) at a rate of 4.25%. The 2016 Senior Perpetual Securities are guaranteed by one of our subsidiaries, Chalco Hong Kong. The 2016 Senior Perpetual Securities also have the benefit of a keepwell deed entered into by the Bond Issuer, the Company, Chalco Hong Kong and the trustee. The 2016 Senior Perpetual Securities were listed on the Hong Kong Stock Exchange on November 7, 2016. The net proceeds from the issue of the 2016 Senior Perpetual Securities were on-lent to the Company or any of its subsidiaries for general corporate use. Coupon payments of 4.25% per annum on the 2016 Senior Perpetual Securities have been made semi-annually on April 29 and October 29 in arrears from November 7, 2016 and may be deferred at the discretion of the Group. The first coupon payment date was April 29, 2017. The 2016 Senior Perpetual Securities have no fixed maturity date and are callable only at the Group’s option on or after November 7, 2021 at their principal amounts together with any accrued, unpaid or deferred coupon distribution payments. After November 7, 2021, the coupon distribution rate will be reset to a percentage per annum equal to the sum of (a) the initial spread of 2.931 per cent, (b) the U.S. Treasury Rate, and (c) a margin of 5.00 per cent per annum. While any coupon distribution payments are unpaid or deferred, the Group, the wholly-owned subsidiaries of Chalco Hong Kong as guarantors, and the Bond Issuer cannot declare or pay dividends or make distributions or similar discretionary payments in respect of, or repurchase, redeem or otherwise acquire any securities of lower or equal rank.
On October 19, 2018, we issued RMB2,000 million perpetual medium-term notes with an initial distribution rate at 5.10% (the “2018 Perpetual Medium-term Notes”). The proceeds from the issuance were RMB2,000 million. The proceeds were used for the repayment of interest-bearing loans and borrowings. Coupon payments of 5.10% per annum on the 2018 Perpetual Medium-term Notes are made annually in arrears from October 19, 2018 and may be deferred at our discretion. The 2018 Perpetual Medium-term Notes have no fixed maturity date and are callable only at our option on October 23, 2021 or any coupon distribution date after October 23, 2021 at their principal amounts together with any accrued, unpaid or deferred coupon distribution payments. The coupon distribution rate will be reset to a percentage per annum equal to the sum of (a) the initial spread of 1.90 per cent, (b) the China Treasury Rate, and (c) a margin of 500 Bps after October 23, 2021. While any coupon distribution payments are unpaid or deferred, we cannot declare or pay dividends to shareholders or decrease the share capital, or make material fixed asset investments.
Proposed Issuance of H Shares
On June 28, 2017,26, 2018, our shareholders at the 20162017 annual general meeting passed a special resolution, which will remain valid until the earliest of (i) the conclusion of our next annual general meeting, (ii) the expiration of 12 months following the date of passing the resolution, or (iii) the date on which the authority set out in this resolution is revoked or varied by a special resolution at a general meeting. The resolution authorizes us to issue up to 20% of the total nominal value of H Shares in issue as of the resolution date. Our Board has been authorized to determine the use of the proceeds. The proposed issuance is subject to all the necessary approval by the CSRC and/or other relevant PRC government authorities.
Merger and Reorganization of Shanxi Branch and Shanxi Huaze
On August 8, 2017, we entered into a reorganization agreement with Zhangze Electric Power, pursuant to which we contributed certain assets related to alumina production of our Shanxi branch, with an appraised net value of RMB3,425.7 million equaling the appraised net value of the assets and liabilities of Shanxi branch, to Shanxi Huaze. The assets injected into Shanxi Huaze included, among others, inventories, buildings, structures, machinery and equipment. Upon completion of our asset contribution in 2017, our shareholding in Shanxi Huaze increased from 60% to 85.98% and Shanxi Huaze was renamed to Shanxi New Material.
Establishment of Industry Investment Fund
On May 23, 2017, the Company, Bank of Communications International Trust Co., Ltd. (“BOCOMMTRUST”) and Chinalco Jianxin Investment Fund Management (Beijing) Company Limited (“Chinalco Jianxin”) entered into a partnership agreement in relation to the establishment of Beijing Chalco Bocom Size Industry Investment Fund Management Partnership (Limited Partnership) (the “Industry Fund”). On September 27, 2017, the Company, BOCOMMTRUST, Chinalco Jianxin and Bocommtrust Asset Management Co., Ltd. (“Bocommtrust Asset”) entered into certain agreements with respect to Chinalco Jianxin’s withdrawal from and Bocommtrust Asset’s participation in the Industry Fund. On the same day, the Company, BOCOMMTRUST and Bocommtrust Asset entered into a capital contribution agreement and a new partnership agreement in relation to the Industry Fund. Pursuant to these agreements, the general partner of the Industry Fund changed from Chinalco Jianxin to Bocommtrust Asset while Chinalco Jianxin remained as the manager of the Industry Fund.
The Industry Fund would provide funding for the construction of our major projects, replenish our working capital and support our structural adjustment, transformation and upgrade.As of December 31, 2017,2018, the Industry Fund had made debt investments in twocertain of our associatessubsidiaries and two of our joint ventures with a total amount of RMB5,600RMB5,000 million, of which we had contributed RMB1,848RMB1,650 million.
Acquisition of Carbon Assets and Equity Interests
On August 30, 2018, our Group and the affiliates of Chinalco Assets entered into a series of assets transfer agreements and equity transfer agreements for the acquisition of certain carbon assets and equity interests from the affiliates of Chinalco Assets, including: (i) the assets of the carbon plant under Shandong Aluminum Industry Co., Ltd; (ii) the assets of the carbon plant under Pingguo Aluminum Company Limited; (iii) 49% equity interests of Baotou Sendu Carbon Company Limited; and (iv) 57.69% and 19.96% equity interests of Chibi Great Wall Carbon Products Company Limited from two separate shareholders. Upon completion of the acquisition, we expect this acquisition would help us consummate our industrial chain, ensure our steady production, and improve our competitiveness and anti-risk capabilities, as carbon products are one of major raw materials for production of primary aluminum. As of December 2018, we had paid the total consideration of RMB735.6 million in full and the closing had been completed.
Merger and Reorganization of Zunyi Alumina and Zunyi Aluminum
On June 21, 2018, in order to streamline our production chains, enhance synergistic effects and control operating costs, we entered into a contribution agreement with other shareholders of Zunyi Aluminum, pursuant to which we contributed all assets in Zunyi Alumina to Zunyi Aluminum. The appraised net value of Zunyi Alumina, equaling the appraised net value of its assets and liabilities, was RMB2,311 million. Upon completion of the merger, our shareholding in Zunyi Aluminum increased from 62.1% to 67.445%.
Gratuitous Transfer Between China Copper and Yunnan SASAC
On November 13, 2018, China Copper, a wholly-owned subsidiary of our controlling shareholder, entered into a gratuitous transfer agreement with Yunnan SASAC, pursuant to which Yunnan SASAC shall gratuitously transfer its 51% equity interest in Yunnan Metallurgical Group Co., Ltd. to China Copper. The gratuitous transfer was approved by the SASAC on December 19, 2018, by the State Administration for Market Regulation on December 20, 2018 and by the CSRC on December 29, 2018. Chinalco completed the gratuitous transfer on January 8, 2019. As Yunnan Aluminum Co., Ltd., an affiliated company of Yunnan Metallurgical Group Co., Ltd., competes with us in the business segments of alumina and primary aluminum, on January 2, 2019, Chinalco, as the indirect controlling shareholder of Yunnan Aluminum Co., Ltd. and our direct controlling shareholder, issued a letter of undertakings on non-competition to us in order to address business competition and safeguard the legitimate interests of the Company and our minority shareholders. According to the letter of undertakings, Chinalco undertook to start in 2019 planning the integration of the businesses in which Yunnan Aluminum Co., Ltd. and we compete with each other, and address business competition between Yunnan Aluminum Co., Ltd. and us within five years.
Subscription of Equity Interest of Certain Subsidiaries and Subsequent Issuance of Additional A Shares (“Asset Restructuring”)
On December 4, 2017, we entered into certain investment and debt conversion agreements (the “Initial Agreements”) with Huarong Ruitong Equity Investment Management Co., Ltd. (“Huarong Ruitong”), China Life Insurance Company Limited (“China Life”), Shenzhen Zhaoping Chalco Investment Center LLP (“Zhaoping Investment”), China Pacific Life Insurance Co., Ltd. (“CPIC Life”), China Cinda Asset Management Co., Ltd. (“China Cinda”), BOC Financial Asset Investment Co., Ltd. (“BOC Financial”), ICBC Financial Asset Investment Co., Ltd. (“ICBC Financial”) and ABC Financial Asset Investment Company Limited (“ABC Financial”) (collectively, the “Restructuring Investors”). Pursuant to the Initial Agreements, Huarong Ruitong, China Life, Zhaoping Investment, CPIC Life, BOC Financial, ICBC Financial and ABC Financial have agreed to make cash contributions to our wholly-owned subsidiaries, Chalco Shandong, Chalco Zhongzhou Aluminum, Baotou Aluminum and Chalco Mining (collectively, the “Target Subsidiaries”), while the principal of loans owed by Chalco Mining to Huarong Ruitong, Zhaoping Investment, China Cinda and BOC Financial prior to signing of the Initial Agreements would be treated as capital contribution to Chalco Mining and converted into equity interest in Chalco Mining held by Huarong Ruitong, Zhaoping Investment, China Cinda and BOC Financial. The Restructuring Investors have agreed to acquire 30.80%, 36.90%, 25.67% and 81.14% of equity interest of Chalco Shandong, Chalco Zhongzhou Aluminum, Baotou Aluminum and Chalco Mining, respectively, with an aggregate capital contribution of approximately RMB12.6 billion. Under the Initial Agreements, we have also agreed to acquire equity interest held by the Restructuring Investors in the Target Subsidiaries with consideration in the form of our A Shares to be issued to the Restructuring Investors within 12 months after signing of the Initial Agreements based on terms to be further negotiated and agreed upon.Investors. On December 20, 2017, the Initial Agreements and the transactions contemplated thereunder were approved at our 2017 second extraordinary general meeting. In December 2017, the capital contribution to the Target Subsidiaries by the Restructuring Investors was completed in accordance with the terms of the Initial Agreements.
Subsequently, on January 31, 2018, we entered into equity acquisition agreements (the “Further Agreements”) with the Restructuring Investors. Pursuant to the Further Agreements, we have agreed to acquire all the equity interest held by the Restructuring Investors in the Target Subsidiaries with consideration in the form of A sharesShares of the Company to be issued to the Restructuring Investors (the “Proposed Issuance”). The number of A Shares in issue pursuant to the Proposed Issuance would equal the appraised value of equity interest held by Restructuring Investors in Target Subsidiaries as of December 31, 2017 determined by China United Assets Appraisal divided by the issue price. The aforementioned appraised value may be subject to further adjustment by competent PRC authorities upon filing of the valuation report by China United Assets Appraisal. The issue price has been set at RMB6.00 per A shareShare with reference to 90% of the average trading price of our A Shares during the last 60 trading days prior to January 31, 2018 (i.e., the last 60 trading days prior to the suspension of trading of our A shares)Shares) in accordance with rules and regulations of the PRC applicable to transaction of this kind. The appraised value, subject to further adjustment, was RMB12.7 billion and therefore we would issue to the Restructuring Investors approximately 2.1 billion A sharesShares in aggregate, representing approximately 14.2% of the total issued share capital of the Company as of January 31, 2018 and approximately 12.4% of the enlarged total issued share capital of the Company upon completion of the Proposed Issuance. On July 30, 2018, we entered supplemental equity acquisition agreements with the Restructuring Investors, amending, among others, the final consideration of the proposed acquisition and the number of the consideration shares to be issued from approximately RMB12,703.7 million and approximately 2,117,280,800 to approximately RMB12,713.2 million and 2,118,874,715, respectively. The Proposed Issuance is subject towas approved by our shareholders, the SASAC and the CSRC approvalsin 2018. In February 2019, all equity interests of Target Subsidiaries held by the Restructuring Investors were transferred to us, which resulted in us holding 100% equity interests of all Target Subsidiaries. On February 25, 2019, we issued an aggregate of 2,118,874,715 A Shares to the Restructuring Investors. The Restructuring Investors shall not transfer the shares issued thereto within twelve months from the completion date of the issuance of the shares and the generalshares may be listed and class approvals by shareholderstraded on the Shanghai Stock Exchange upon expiry of the Company.lock-up period.
Cash contributions received from the Restructuring Investors have been used by us for the repayment of loans. The Asset Restructuring has helped to reduce the gearing ratios of these subsidiaries and the Group as a whole.
Our Principal Products
We are a leading enterprise in the non-ferrous metal industry in China. In terms of comprehensive scale, we ranked among the top enterprises in the global aluminum industry. We have benefited from the strong growth of the PRC aluminum market, one of the world’s fastest growing major aluminum markets. We refine bauxite into alumina, which is then smelted into primary aluminum. In addition to alumina and primary aluminum, we also produce and sell a relatively small amount of chemical alumina products (alumina hydrate and alumina-based industrial chemical products), carbon products (carbon anodes and cathodes) and gallium. We are also engaged in the trading and logistics of alumina, primary aluminum, other non-ferrous metal products, coal products and raw and ancillary materials in bulk both manufactured by us and sourced from external suppliers domestically and abroad. In addition, we are engaged in coal mining and power generation. The remainder of our revenues was derived from research and development activities and other products and services. Accordingly, we organize and manage our operations in five business segments: alumina segment, primary aluminum segment, trading segment, energy segment and corporate and other operating segment. After elimination of inter-segment sales, revenues attributable to our alumina segment, primary aluminum segment, energytrading segment, tradingenergy segment, and corporate and other operating segment accounted for approximately 7.6%8.2%, 20.3%22.9%, 3.2%64.7%, 68.6%3.9% and 0.3%, respectively, of our total revenues in 2017.2018.
Our alumina segment includes the mining and purchasing of bauxite and other raw materials, and production and sale of alumina as well as alumina-related products, such aschemical alumina hydrate, alumina-based chemical products and metal gallium. Alumina accounted for approximately 81.8%88.88% of our total production volume for this segment in 2017.2018. Chemical alumina products are used in the production of chemical, pharmaceutical, ceramic and construction materials. In the process of refining bauxite into alumina, we also produce gallium as a by-product. Gallium is a rare, high value metal with applications in the electronics and telecommunication industries.
Our primary aluminum segment includes the procurement of alumina, other raw materials, supplemental materials and electrical power, the production and sale of primary aluminum and aluminum-related products, such as carbon products, aluminum alloy products and other electrolytic aluminum products. Our principal primary aluminum products are ingots, molten aluminum and aluminum alloys, which accounted for approximately 24%29%, 44%39% and 32%, respectively, of our total production volume of primary aluminum in 2017.2018. Our standard 20 kilogram remelt ingots are used for general aluminum fabrication in the construction, electricity, electronics, transportation, packaging, machinery and durable goods industries. We internally produce substantially all the carbon products used at our smelters and sell our remaining carbon products to external customers.
Our trading segment is mainly engaged in the trading of alumina, primary aluminum, aluminum fabrication products, other non-ferrous metal products, and crude fuels such as coal products, as well as supplemental materials and logistics and transport services to our internal manufacturing plants and external customers. We established our trading business under Chalco Trading as a separate segment in July 2010 as a result of our operational structural adjustment. Since 2014, we have established China Aluminum International Trading Group Co. Ltd., Chalco Materials Co. Ltd. and China Aluminum Logistics Group Corporation Co., Ltd. to continuously promote and deepen development of our trading business, jointly constituting our trading segment.
Our energy segment includes the research and development, production and operation of energy products, including coal mining and power generation, including conventional coal-fire power generation andas well as renewable energy generation such as wind power and photovoltaicsolar power. We are also engaged in new energy equipment production. We established our energy segment in January 2013 as a result of our acquisition of Ningxia Energy in line with our development strategy to partially offset our future energy costs and secure a portion of the coal we consume in our operations. In 2017,2018, we supplied the majority of the electricity we generated for our own production use, supplied a portion of the coal output to our own electric power plant and sold the remaining portion to external customers, including power generation enterprises and cement plants.customers.
Our corporate and other operating segment mainly includes corporate and other aluminum-related research, development, and other activities of the Group.
Our Production Capacity
As of December 31, 2017,2018, our annual alumina production capacity and primary aluminum production capacity was approximately 16.8618.86 million tonnes and 3.934.78 million tonnes, respectively. The following table sets forth the production capacity of each of our principal plants by business segment as of the indicated date:
| As of December 31, 2017
|
Plant | Alumina
| Primary
Aluminum
|
| (in thousand tonnes)(1) |
Guangxi branch | 2,210 | - |
| | | As of December 31, 2018 |
| Plant | | Alumina | | Primary
Aluminum |
| | | (in thousand tonnes)(1) | |
| Guangxi branch | | | 2,210 | | | | — | |
| Zhongzhou Aluminum | | | 3,050 | | | | — | |
| Qinghai branch | | | — | | | | 420 | |
| Guizhou branch | | | — | | | | 0 | |
| Chalco Mining | | | 2,410 | | | | — | |
| Chalco Shandong | | | 2,270 | | | | — | |
| Shanxi New Material | | | 2,600 | | | | 424 | |
| Chongqing branch | | | 800 | | | | — | |
| Lanzhou Aluminum | | | — | | | | 450 | |
| Shanxi Huasheng | | | — | | | | 190 | |
| Zunyi Aluminum | | | 1,000 | | | | 375 | |
| Shandong Huayu | | | — | | | | 200 | |
| Baotou Aluminum(2) | | | — | | | | 1,340 | |
| Zhengzhou Institute | | | 20 | | | | — | |
| Liancheng branch | | | — | | | | 550 | |
| Guizhou Huajin | | | 1,600 | | | | — | |
| Xinghua Technology | | | 900 | | | | — | |
| Shanxi Huaxing | | | 2,000 | | | | — | |
| Guizhou Huaren | | | — | | | | 400 | |
| Shanxi Zhongrun | | | — | | | | 432 | |
| Total | | | 18,860 | | | | 4,781 | |
| | As of December 31, 2017 |
| Plant | Alumina | Primary
Aluminum |
| | (in thousand tonnes)(1) |
| Chalco Zhongzhou | 3,050 | - |
| Qinghai branch | - | 420 |
| Guizhou branch | - | 170 |
| Chalco Mining | 2,410 | - |
| Chalco Shandong | 2,270 | - |
| Zunyi Alumina | 1,000 | - |
| Chongqing branch | 800 | - |
| Shanxi New Material | 2,600 | 424 |
| Lanzhou branch | - | 450 |
| Shanxi Huasheng | - | 240 |
| Zunyi Aluminum | - | 375 |
| Shandong Huayu | - | 200 |
| Baotou Aluminum(2) | - | 1,100 |
| Zhengzhou Institute | 20 | - |
| Liancheng branch | - | 550 |
| Guizhou Huajin | 1,600 | - |
| Xinghua Technology | 900 | - |
| Total | 16,860 | 3,929 |
| | |
| (1) | Production capacity is calculated based on designed capacity, which accounts for various assumptions including downtime for ordinary maintenance and repairs, the ore grade of bauxite feedstock and subsequent capacity modifications. |
| (2) | Including the primary aluminum production capacity of Inner Mongolia Huayun,, a subsidiary of Baotou Aluminum. |
In 2017,2018, we produced approximately 12.8113.51 million tonnes of alumina and 3.614.17 million tonnes of primary aluminum. Our production of alumina (with chemical alumina products included) and primary aluminum represented approximately 20.5%21.2% and 9.8%11.4%, respectively, of the total output of alumina (with chemical alumina products included) and primary aluminum in China in 2017.2018.
The following table sets forth a breakdown of our production volume by product segment for the periods indicated:
| | Year Ended December 31, |
| Production Volume by Product | 2015 | 2016 | 2017 |
| | (in thousand tonnes, except Gallium) |
| Alumina segment | | | |
| Alumina | 13,296 | 12,027 | 12,810 |
| Chemical alumina products | 1,959 | 2,479 | 2,853 |
| Gallium (in tonnes) | 121 | 71 | 72 |
| Primary aluminum segment | | | |
| Primary aluminum(1) | 3,308 | 2,953 | 3,607 |
| Carbon | 1,787 | 1,680 | 1,962 |
| | | Year Ended December 31, |
| Production Volume by Product | | 2016 | | 2017 | | 2018 |
| | | | (in thousand tonnes, except Gallium) | |
| Alumina segment | | | | | | | | | | | | |
| Alumina | | | 12,027 | | | | 12,810 | | | | 13,510 | |
| Chemical alumina products | | | 2,479 | | | | 2,853 | | | | 3,240 | |
| Gallium (in tonnes) | | | 71 | | | | 72 | | | | 136 | |
| Primary aluminum segment | | | | | | | | | | | | |
| Primary aluminum(1) | | | 2,953 | | | | 3,607 | | | | 4,166 | |
| Carbon | | | 1,680 | | | | 1,962 | | | | 2,010 | |
| | |
| (1) | Including ingots, molten aluminum and aluminum alloys. |
Production Process
Alumina
Alumina is refined from bauxite, an aluminum-bearing ore, through a chemical refining process. The refining process applied is determined by the mineral composition of the bauxite used in production. Our refineries may employ the Bayer process, the Bayer-sintering series process, the Bayer-sintering combined process or the ore-dressing Bayer process. Most of the bauxite reserves in China contain diasporic bauxite, which contains high alumina content but relatively high silica content, resulting in bauxite reserves with low alumina-to-silica ratio. The Bayer process cannot efficiently refine diasporic bauxite that has not undergone processing to increase its alumina-to-silica ratio. The Bayer-sintering process and the Bayer-sintering combined process are suitable for refining low alumina-to-silica ratio bauxite. We have developed and improved these processes to increase our refining yield. When we refine alumina using the Bayer process, we produce gallium as a by-product, which undergoes further processing before sale. In addition, we also produce some chemical alumina products (alumina hydrate and alumina-based industrial chemical products).
Primary Aluminum
We smelt alumina into primary aluminum through electrolytic reduction. The electrolytic process takes place in a reduction cell, or pot, a steel shell lined with carbon cathodes and refractory materials. Powerful electric currents are passed through the pot to produce molten aluminum. The molten aluminum is transferred to holding furnaces and then poured directly into molds to produce foundry ingots, or further refined to form fabricating ingots, which may be used directly in the aluminum fabrication process. The primary aluminum we produce is in the form of ingots, molten aluminum and aluminum alloys.
All of our primary aluminum smelters use pre-bake anode reduction pot-lines. In the pre-bake reduction process, the anodes are pre-formed in a separate facility where pollutants can be contained. The cells themselves are enclosed with removable panels so that the waste gas produced during the process can be extracted using large exhaust fans. Our waste gas is treated and purified to reduce dust and fluoride emissions to acceptable levels set by state environmental protection agencies.
Production Facilities
Alumina
We currently operate nineten alumina refineries and one research institute with a total designed annual production capacity of approximately 16.8618.86 million tonnes as of December 31, 2017. One2018. Two of our refineries isare integrated with primary aluminum smelters. In 2017,2018, we produced approximately 12.8113.51 million tonnes of alumina, approximately 2.853.24 million tonnes of chemical alumina products and approximately 72136 tonnes of gallium. The overall utilization rate for our refineries was 81%91% as of December 31, 2017. 2018.
In 2017,2018, we supplied approximately 5.716.06 million tonnes, or 45%, of our total production of alumina to our own smelters and sold all of the remaining alumina to other domestic smelters.customers. All of the chemical alumina products that we produced in 20172018 were sold by alumina refineries directly to external customers or internally to Chalco Trading for subsequent external trading.
The following table sets forth the annual production capacity, output of alumina and chemical alumina products, utilization rate of and production process applied in each of our alumina refineries and our Zhengzhou Institute:
| | As of December 31, 2017 | For the Year Ended December 31, 2017 |
| | Annual
Production
Capacity(1) | Utilization
Rate(2) | Alumina
Production
Output | Chemical
Alumina
Products
Output | Production Process |
| | (in thousand tonnes, except percentages) |
| Shanxi New Material | 2,600 | 100% | 1,845.97 | 68.35 | Bayer-sintering |
| Chalco Mining | 2,410 | 71% | 1,627.82 | 130.35 | Bayer-sintering |
| Chalco Shandong | 2,270 | 70% | 1,780.75 | 1,798.15 | Sintering and Bayer |
| Chalco Zhongzhou | 3,050 | 70% | 1,929.87 | 581.80 | Sintering and Bayer |
| Guangxi branch | 2,210 | 100% | 2,462.12 | 112.92 | Bayer |
| Zunyi Alumina | 1,000 | 100% | 1,080.01 | 0.28 | Bayer |
| Chongqing branch | 800 | - | - | - | Bayer-sintering |
| Zhengzhou Institute(3) | 20 | - | - | 41.58 | Bayer |
| | | As of December 31, 2018 | | | For the Year Ended December 31, 2018 |
| | | Annual
Production
Capacity(1) | | | Utilization
Rate(2) | | | Alumina
Production
Output | | | Chemical
Alumina
Products
Output | | | Production Process |
| | | (in thousand tonnes, except percentages) |
| Shanxi New Material | | | 2,600 | | | | 100 | % | | | 2,129 | | | | 73 | | | Bayer-sintering |
| Chalco Mining | | | 2,410 | | | | 81 | % | | | 1,748 | | | | 95 | | | Bayer-sintering |
| Chalco Shandong | | | 2,270 | | | | 100 | % | | | 1,715 | | | | 2,105 | | | Sintering and Bayer |
| Zhongzhou Aluminum | | | 3,050 | | | | 84 | % | | | 1,913 | | | | 637 | | | Sintering and Bayer |
| Guangxi branch | | | 2,210 | | | | 100 | % | | | 2,486 | | | | 97 | | | Bayer |
| Zunyi Aluminum | | | 1,000 | | | | 100 | % | | | 1,110 | | | | 3 | | | Bayer |
| Chongqing branch | | | 800 | | | | — | | | | — | | | | — | | | Bayer-sintering |
| Zhengzhou Institute(3) | | | 20 | | | | — | | | | — | | | | 43 | | | Bayer |
| Guizhou Huajin | | | 1,600 | | | | 100 | % | | | 1,514 | | | | — | | | Bayer |
| Xinghua Technology | | | 900 | | | | 100 | % | | | 778 | | | | 189 | | | Bayer |
| Shanxi Huaxing | | | 2,000 | | | | 100 | % | | | 117 | (4) | | | — | | | Bayer |
| Total | | | 18,860 | | | | 91 | % | | | 13,510 | | | | 3,243 | | | |
| | As of December 31, 2017 | For the Year Ended December 31, 2017 |
| | Annual
Production
Capacity(1) | Utilization
Rate(2) | Alumina
Production
Output | Chemical
Alumina
Products
Output | Production Process |
| | (in thousand tonnes, except percentages) |
| Guizhou Huajin | 1,600 | 100% | 1,600.85 | - | Bayer |
| Xinghua Technology | 900 | 100% | 482.39 | 119.76 | Bayer |
| Total | 16,860 | 81% | 12,809.78 | 2,853.18 | |
| | |
| (1) | Production capacity is calculated based on designed capacity, which accounts for various assumptions including downtime for ordinary maintenance and repairs, the ore grade of bauxite feedstock and subsequent capacity modifications. |
| (2) | Capacity utilization rate is calculated by dividing our utilized production capacity as of the date indicated by our total designed annual production capacity. |
| (3) | The chemical alumina products produced at our Zhengzhou Institute are sold commercially and such sales are included in our total revenues. |
| (4) | Shanxi Huaxing became our wholly-owned subsidiary via acquisition in December 2018. The alumina production output of Shanxi Huaxing in 2018 refers to its output of alumina in December 2018. Please see “- A. History and Development of the Company - Transfer of Equity Interest in Shanxi Huaxing” for more details about the transfer of equity interest. |
Primary Aluminum
We operate nineeleven primary aluminum smelters in China. Our smelters had an aggregate annual production capacity of approximately 3.934.78 million tonnes as of December 31, 2017.2018.
In 2017,2018, we produced approximately 3.614.17 million tonnes of primary aluminum and the average utilization rate for our smelters was 98%82% as of December 31, 2017.2018. The following table sets forth the annual production capacity, aluminum output, utilization rate and smelting equipment used in each of our aluminum smelters:
| | As of December 31, 2017 | For the Year Ended December 31, 2017 |
| Plant(1) | Annual
Production
Capacity(2) | Utilization
Rate(3) | Aluminum
Output(4) | Smelting Equipment |
| | (in thousand tonnes, except percentages) |
| Baotou Aluminum(5) | 1,100 | 98% | 812.86 | 200Ka, 240Ka, 400Ka and 500Ka pre-bake |
| Guizhou branch | 170 | 96% | 282.09 | 230Ka pre-bake |
| Lanzhou branch | 450 | 98% | 390.99 | 200Ka and 350Ka pre-bake |
| Qinghai branch | 420 | 99% | 401.46 | 180Ka and 210Ka pre-bake |
| Shandong Huayu | 200 | 92% | 212.82 | 240Ka pre-bake |
| Shanxi Huasheng | 240 | 99% | 224.83 | 300Ka pre-bake |
| Shanxi New Material | 424 | 99% | 436.73 | 300Ka pre-bake |
| Zunyi Aluminum | 375 | 100% | 331.16 | 200Ka and 400Ka pre-bake |
| Liancheng branch | 550 | 97% | 514.45 | 200Ka and 500Ka pre-bake |
| Total | 3,929 | 98% | 3,607.40 | |
| | | As of December 31, 2018 | | | For the Year Ended December 31, 2018 |
| Plant(1) | | Annual
Production
Capacity(2) | | | Utilization
Rate(3) | | | Aluminum
Output(4) | | | Smelting Equipment |
| | | (in thousand tonnes, except percentages) |
| Baotou Aluminum(5) | | | 1,340 | | | | 100 | % | | | 1,234 | | | 200Ka, 240Ka, 400Ka and 500Ka pre-bake |
| Guizhou branch | | | — | | | | — | | | | 36 | | | 230Ka pre-bake and secondary aluminum processing |
| Lanzhou Aluminum | | | 450 | | | | 99 | % | | | 399 | | | 200Ka and 350Ka pre-bake |
| Qinghai branch | | | 420 | | | | 99 | % | | | 404 | | | 180Ka and 210Ka pre-bake |
| Shandong Huayu | | | 200 | | | | 45 | % | | | 197 | | | 240Ka pre-bake |
| Shanxi Huasheng | | | 190 | | | | 100 | % | | | 225 | | | 300Ka pre-bake |
| Shanxi New Material | | | 424 | | | | 99 | % | | | 431 | | | 300Ka pre-bake |
| Zunyi Aluminum | | | 375 | | | | 100 | % | | | 403 | | | 200Ka and 400Ka pre-bake |
| Liancheng branch | | | 550 | | | | 28 | % | | | 438 | | | 200Ka and 500Ka pre-bake |
| Guizhou Huaren | | | 400 | | | | 94 | % | | | 345 | | | 500Ka |
| | | As of December 31, 2018 | | | For the Year Ended December 31, 2018 |
| Plant(1) | | Annual
Production
Capacity(2) | | | Utilization
Rate(3) | | | Aluminum
Output(4) | | | Smelting Equipment |
| | | (in thousand tonnes, except percentages) |
| Shanxi Zhongrun | | | 432 | | | | 25 | % | | | 53 | | | 500Ka |
| Total | | | 4,781 | | | | 82 | % | | | 4,166 | | | |
| | |
| (1) | As of December 31, 2017,2018, the primary aluminum production facilities in Fushun Aluminum, Gansu Hualu and Chalco Shandong had been or were in the process of being disposed of by us. These plants did not have annual primary aluminum production capacity as of December 31, 2017.2018. We did not produce any primary aluminum at these plants in 2017.2018. |
| (2) | Production capacity takes into account designed capacity, downtime for ordinary maintenance and repairs and subsequent capacity modifications. |
| (3) | Capacity utilization rate is calculated by dividing our utilized production capacity as of the date indicated by our total designed annual production capacity. |
| (4) | Includes ingots, molten aluminum and aluminum alloys. |
| (5) | Including the primary aluminum production facilities at Inner Mongolia Huayun, a subsidiary of Baotou Aluminum. |
Raw Materials
Alumina
Bauxite is the principal raw material in alumina production. Most of the bauxite in China is monohydrate, consisting mainly of Aluminosilicate compounds. Bauxite deposits have been discovered across a broad area of central China and are especially abundant in the southern and northern parts of central China. The largest bauxite deposit in China lies in the Shanxi Province.
Rock Formation and Mineralization.Except for our Guangxi Pingguo mine which is an accumulation deposit due to original erosion, the bauxite deposits of our mines in China usually have similar stratigraphic sequences. Primary bauxite deposit, as a type of sedimentary boehmite (Al2O3.H2O)(Al2O3.H2O) the Carboniferous or Permian age, is contained in clay rock, limestone or coal seams. A zonary red shale is usually located at the bottom of the bauxite and the red seam distributes over the irregular “karst-type” erosion face on the top of Ordovician limestone. Aluminum deposits in northern China are usually covered with a very thick Quaternary weathering.
The thickness and quality of deposits vary with our mine locations. Quality is usually consistent in smooth sections but changes sharply in karst “billabong” terrain. The level of hardness of minerals also varies. A sequence that includes a seam of hard bauxite of fine quality in the middle and soft bauxite of inferior quality on the bottom and top seams is common in deposits.
Generally, deposits are horizontal or with an obliquity of 0 to 8 degrees, but there are also steep deposits at an angle of 75 degrees, such as in our Guizhou No. 2 mine. Most of the original mineralization is not influenced by folds and faults, and some fractures of a low obliquity and folds emerge in certain deposits, which is evident in the Guizhou No. 2 mine area where the underground mining method must be used due to the obliquity of its bauxite body reaching 70 degrees with the influence of folds and several meters of dislocation arising from partial faults.
Economic Significance. Our bauxite deposits in China are divided into three groups. They are primarily distinguished by drill hole spacing and the composition of the deposit, which can encompass rock formations such as intercalated clays, bauxite, footwall iron clay or Ordovician limestone. Bauxite deposit groups vary in the thickness and mineral quality of its reserves.
We use the Chinese bauxite deposit estimation method, which is calculated using cut-off grades and thickness to outline continuous areas within the limits defined by samples of marginal grade. We utilize actual limiting sample points that are joined to create a polygonal outline, and grades are then calculated using a length weighted arithmetic average. We believe that the Chinese bauxite deposit estimation method of test boring, inspection pit, trial trench, density, tonnage analysis and calculation applied to the geological work of bauxite in China is an appropriate method to analyze these types of deposits.
Supply.To support the growth of our alumina production, we continuously seek opportunities to streamline and optimize our bauxite procurement. Except for Chalco Shandong, all of our refineries are located in the four provinces where over 90% of China’s potentially mineable bauxite has been found. We generally source our bauxite from mines close to our refineries to control transportation costs. Historically, we have procured our bauxite supply principally from three sources:
our own bauxite mining operations;
jointly-operated mines; and
other suppliers, which principally include small independent mines in China and, to a lesser extent, international suppliers.
| ● | our own bauxite mining operations; |
| ● | jointly-operated mines; and |
| ● | other suppliers, which principally include small independent mines in China and, to a lesser extent, international suppliers. |
On average, our refineries consumed approximately 2.262.29 tonnes of bauxite to produce one tonne of alumina in 2017.2018. Our mines supplied approximately 14.6815.50 million tonnes of bauxite to our refineries in 2017.2018. We purchase bauxite from a number of suppliers and do not depend on any supplier for our bauxite requirements. In 2017,2018, bauxite secured from other suppliers accounted for approximately 53.0%56.4% of our total bauxite supply, primarily because our demand for bauxite exceeded the production of our mines.
The following table sets forth the volumes and percentages of bauxite supplied by our mines and other suppliers for the periods indicated:
| | Year Ended December 31, |
| | 2015 | 2016 | 2017 |
| | Bauxite
Supply | Percentage
of Bauxite
Supply | Bauxite
Supply | Percentage
of Bauxite
Supply | Bauxite
Supply | Percentage
of Bauxite
Supply |
| | | % | | % | | % |
| | (in thousand tonnes, except percentages) |
| Own mines | 17,930.2 | 55.4 | 13,603.5 | 46.9 | 14,679.6 | 47.0 |
| Other suppliers | 14,452.0 | 44.6 | 15,384.3 | 53.1 | 16,566.5 | 53.0 |
| Total | 32,382.2 | 100.0 | 28,987.8 | 100.0 | 31,246.1 | 100.0 |
| | | Year Ended December 31, | |
| | | 2016 | | | 2017 | | | 2018 | |
| | | Bauxite
Supply | | | Percentage
of Bauxite
Supply | | | Bauxite
Supply | | | Percentage
of Bauxite
Supply | | | Bauxite
Supply | | | Percentage
of Bauxite
Supply | |
| | | | | | % | | | | | | % | | | | | | % | |
| | | (in thousand tonnes, except percentages) | |
| Own mines | | | 13,603.5 | | | | 46.9 | | | | 14,679.6 | | | | 47.0 | | | | 15,498.0 | | | | 43.6 | |
| Other suppliers | | | 15,384.3 | | | | 53.1 | | | | 16,566.5 | | | | 53.0 | | | | 20,043.6 | | | | 56.4 | |
| Total | | | 28,987.8 | | | | 100.0 | | | | 31,246.1 | | | | 100.0 | | | | 35,541.6 | | | | 100.0 | |
Own Mines. As of December 31, 2017,2018, we owned and operated 1819 mines in China that had approximately 249235 million tonnes of aggregate bauxite reserves and we continue to explore new bauxite reserves to replenish our reserves. We also own a bauxite mine in Laos through Lao Service Mining Co., Ltd., in which we held 60% of the equity interest. We also hold the requisite mining permit or exploration permit for twoall the three bauxite mines and are in the process of applying for mining right for PT VISITAMA in West Kalimantan, Indonesia through our 96.28% owned subsidiary, PT Nusapati Prima. Our bauxite deposits in Indonesia are lateritic gibbsite and were formed by weathering and leaching of aluminum-rich silicate rock in tropical climates. We have suspended our bauxite mining since September 2014 due to restraints on export of bauxite imposed by the Government of Indonesia.Indonesian government. In 2017 and 2018, the Government of IndonesiaIndonesian government issued relevant rules pursuant to which export of bauxite may be allowed upon satisfaction of certain requirements. We have been actively exploring the possibility of meeting these requirements. In addition, we own a bauxite mine and have the mining permit through Chalco Guinea Company S.A., in which we indirectly held 85% of the equity interest.
For the years ended December 31, 2015, 2016, 2017 and 2017,2018, we extracted approximately 17.9 million tonnes, 14.5 million tonnes, 17.0 million tonnes and 17.017.3 million tonnes, respectively, of bauxite from our mines. Our reported bauxite reserves for our mines in China do not exceed the quantities that we estimate could be extracted economically if future prices were at similar levels to average historical prices for bauxite or aluminum for the years ended December 31, 2015, 2016, 2017 and 2017,2018, or the three year historical contracted prices for such commodities. However, we do not use the three year historical bauxite or aluminum price to determine bauxite reserves, nor did we utilize any currency conversion factors or pricing related mechanisms. Instead, the primary criteria are the specifications required by our aluminum refineries, as well as certain modifying factors that are dependent on reserve quality.
The following table sets forth information for our mines as of December 31, 2017:2018:
| Mine | Location | Nature of
ownership | Mining
method | Permit
Renewal(1) | Present
Condition/
Current State
of Exploration | Bauxite
Production
(in thousand
tonnes) |
| Pingguo mine | Guangxi Zhuang Autonomous Region, China | 100% owned and operated by Chalco | Open pit | October 2030 - April 2036 | Fully developed and operational | 5,6685,674 |
| Guizhou mine(2) | Guizhou Province, China | 100% owned and operated by Chalco | Open pit/underground | March 2019 - December 2038 | Partly developed and operational | 1,4102,092 |
| Zunyi mine | Guizhou Province, China | 100% owned and operated by Chalco | Open pit/underground | February 2020 – August 2027 | Partly developed and operational | 496715 |
| Xiaoyi mine | Shanxi Province, China | 100% owned and operated by Chalco | Open pit | December 2017(3) - May 2035September 2031 | Fully developed and operational | 1,7711,747 |
| Shanxi Other Mines | Shanxi Province, China | 100% owned and operated by Chalco | Open pit/underground | September 2017(3) - July 2035 | Fully developed and operational | 2891,320 |
| Mianchi mine | Henan Province, China | 100% owned and operated by Chalco | Open pit/underground | MayDecember 2018(3) - October 2031 | Partly developed and operational | 408405 |
| Luoyang mine | Henan Province, China | 100% owned and operated by Chalco | Open pit/underground | December 2015(3)- October 2031 | Partly developed and operational | 779 |
Mine | Location | Nature of
ownership | Mining
method | Permit
Renewal(1) | Present
Condition/
Current State
of Exploration | Bauxite
Production
(in thousand
tonnes)460 |
| Xiaoguan mine | Henan Province, China | 100% owned and operated by Chalco | Open pit/underground | August 2018(3) - October 2031 | Fully developed and operational | 640955 |
| Gongyi mine | Henan Province, China | 100% owned and operated by Chalco | Open pit/underground | August 2017June 2018(3)- April 2029 | Fully developed and operational | 668230 |
| Dengfeng mine | Henan Province, China | 100% owned and operated by Chalco | Open pit/underground | July 2016(3) - July 2019 | Partly developed and operational | 423314 |
| Xinmi mine | Henan Province, China | 100% owned and operated by Chalco | Open pit/underground | July 2017June 2018(3) - JulyFebruary 2020 | Fully developed and operational | 4220 |
| Sanmenxia mine | Henan Province, China | 100% owned and operated by Chalco | Underground | November 2018December 2020 - April 2027 | Fully developed and operational | 4681,060 |
| Xuchang mine | Henan Province, China | 100% owned and operated by Chalco | Open pit/underground | February 2017July 2018(3) - August 2024 | Partly developed and operational | 90190 |
| Jiaozuo mine | Henan Province, China | 100% owned and operated by Chalco | Open pit/underground | September 2018(3) - October 2024 | Partly developed and operational | 430360 |
Pingdingshan mine(4) | Henan Province, China | 100% owned and operated by Chalco | Open pit/underground | June 2017February 2018(3) - October 2024 | Partly developed and operational | 521110 |
| Yangquan mine | Shanxi Province, China | 100% owned and operated by Chalco | Open pit | September 2031 - May 2036 | Fully developed and operational | 2,8801,439 |
| Nanchuan mine | Chongqing Municipality, China | 100% owned and operated by Chalco | Underground | May 2017(3) - November 2026 | Suspended productionIn preparation for restarting operation | -— |
| Huaxing mine | Shanxi Province, China | 100% owned and operated by Chalco | Underground | August 2020– September 2020 | Fully developed and operational | 218 |
| PT ALUSENTOSA | West Kalimantan, Indonesia | Owned and operated by PT Nusapati Prima, a 96.28% subsidiary of Chalco | Open pit | December 2027 | Suspended production | -— |
| PT KALMIN | West Kalimantan, Indonesia | Owned and operated by PT Nusapati Prima, a 96.28% subsidiary of Chalco | Open pit | December 2027 | Suspended production | -— |
| PT VISITAMA | West Kalimantan, Indonesia | Owned and operated by PT Nusapati Prima, a 96.28% subsidiary of Chalco | Open pit | December 2015November 2038 | In the process of acquiring mining rightPending production commencement | -— |
| Laos bauxite mine | Attapeu Province and Sekong Province, Laos | Owned and operated by Lao Service Mining Co., Ltd., a 60% subsidiary of Chalco | Open pit | June 2017(4) | Exploration completed | -— |
| Boffa bauxite mine | Boffa, Guinea | Owned and operated by Chalco Guinea Company S.A., an 85% subsidiary of Chalco | Open pit | July 2033 | Under construction | — |
| | |
| (1) | All conditions to retain our properties or leases have been fulfilled as of December 31, 2017.2018. Each mine may be covered by one or more mining permits or exploration permits and the range of permit renewal dates is set forth above. |
| (2) | Including both Guizhou No. 1 mine and Guizhou No. 2 mine. |
| (3) | We are in the process of renewing these permits. |
| (4) | We are applying for extension to the mineral right to the Laos bauxite mine. |
We are required to obtain mining rights permits to conduct mining activities. Under PRC laws and regulations, a mining enterprise must prepare and submit exploration reports for a mine to the local government to obtain a mining rights permit for a mine. A mining right owner is also permitted to lease the mining right through a lease arrangement. The mining rights permit is subject to renewal on a regular basis.
Furthermore, the mining right owner is required to obtain land use rights on the land in order to operate the mines. We lease the land use rights relating to our mines in China from Chinalco pursuant to a land use rights lease agreement that became effective upon our formation. Chinalco’s land use rights relating to over 90% of our mining properties in China are for 50-year terms beginning on July 1, 2001. The remaining land use rights relating to other mines in China are for shorter terms, some as short as one year. All of our land use rights lease agreements end on the expiry date of the mining rights or the end of the working life of the mine, whichever is earlier. Both the land use rights and land use rights lease agreements are renewable.
For our mines in Indonesia, Laos and Laos,Guinea, neither proven nor probable reserves have been established as of the date of this annual report. The following table sets forth certain estimated details of the reserves for our mines in China as of December 31, 2017:2018:
| Mine | Reserves(1)(2)
(million tonnes) | Al2O3 | S1O2 | Ratio of
Average A/S(3) |
| Pingguo mine | 48.01 | 53.47 | 4.76 | 11.23 |
| Guizhou No. 1 mine | 1.23 | 65.47 | 10.02 | 6.53 |
| Guizhou No. 2 mine | 39.74 | 65.16 | 8.80 | 7.40 |
| Zunyi mine | 8.20 | 60.13 | 11.06 | 5.44 |
| Xiaoyi mine | 11.65 | 65.77 | 11.92 | 5.52 |
| Shanxi Other Mines | 10.61 | 65.16 | 12.74 | 5.12 |
| Mianchi mine | 2.88 | 63.24 | 12.33 | 5.13 |
| Luoyang mine | 2.99 | 61.27 | 10.14 | 6.04 |
| Xiaoguan mine | 19.95 | 63.70 | 14.94 | 4.26 |
| Gongyi mine | 2.30 | 64.89 | 13.02 | 4.98 |
| Dengfeng mine | 1.24 | 61.85 | 13.23 | 4.67 |
| Xinmi mine | 2.59 | 65.38 | 12.02 | 5.44 |
| Sanmenxia mine | 42.98 | 63.34 | 12.73 | 4.98 |
| Xuchang mine | 1.09 | 62.94 | 9.08 | 6.93 |
| Jiaozuo mine | 1.27 | 58.76 | 14.95 | 3.93 |
| Pingdingshan mine | 1.76 | 62.08 | 12.13 | 5.12 |
| Yangquan mine | 2.63 | 58.82 | 13.37 | 4.40 |
| Nanchuan mine | 29.09 | 60.60 | 13.84 | 4.38 |
| Huaxing Mine | 4.74 | 63.27 | 9.62 | 6.58 |
| Total (average) reserves | 234.95 | 61.34 | 10.54 | 5.82 |
| By reserve type | | | | |
| Proven reserve | 70.35 | 61.92 | 10.93 | 5.67 |
| Probable reserve | 164.60 | 61.09 | 10.38 | 5.88 |
| Total (average) reserves | 234.95 | 61.34 | 10.54 | 5.82 |
| Mine | Reserves (1)(2)
(million tonnes) | Al2O3 | S1O2 | Ratio of
Average A/S(3) |
| Pingguo mine | 52.21 | 53.65 | 4.80 | 11.18 |
| Guizhou No. 1 mine | 1.23 | 65.08 | 11.30 | 5.76 |
| Guizhou No. 2 mine | 43.38 | 64.17 | 9.12 | 7.04 |
| Zunyi mine | 8.46 | 59.98 | 10.99 | 5.46 |
| Xiaoyi mine | 12.63 | 65.09 | 12.47 | 5.22 |
| Shanxi Other Mines | 8.95 | 65.82 | 11.97 | 5.50 |
| Mianchi mine | 2.99 | 62.59 | 12.91 | 4.85 |
| Luoyang mine | 3.30 | 61.04 | 10.18 | 6.00 |
| Xiaoguan mine | 25.36 | 63.65 | 15.05 | 4.23 |
| Gongyi mine | 2.34 | 64.21 | 13.59 | 4.73 |
| Dengfeng mine | 1.43 | 62.11 | 12.82 | 4.84 |
| Xinmi mine | 2.27 | 65.95 | 11.40 | 5.79 |
| Sanmenxia mine | 46.78 | 63.27 | 12.79 | 4.95 |
| Xuchang mine | 1.30 | 62.76 | 9.33 | 6.73 |
| Jiaozuo mine | 1.27 | 58.76 | 14.95 | 3.93 |
| Pingdingshan mine | 1.69 | 61.19 | 12.33 | 4.96 |
| Yangquan mine | 4.40 | 59.04 | 13.51 | 4.37 |
| Nanchuan mine | 29.09 | 60.60 | 13.84 | 4.38 |
| Total (average) reserves | 249.08 | 61.09 | 10.68 | 5.72 |
| By reserve type | | | | |
| Proven reserve | 75.05 | 61.12 | 10.58 | 5.78 |
| Probable reserve | 174.03 | 61.08 | 10.72 | 5.70 |
| Total (average) reserves | 249.08 | 61.09 | 10.68 | 5.72 |
| | |
| (1) | Our reserves take into consideration mining dilution and loss factors, which generally vary from 5% to 10% and are based on the planned mining method and selected drill data for each site. |
| (2) | Our metallurgical recovery factors are calculated in accordance with the relevant PRC mining standards and vary from mine to mine. |
| (3) | Refers to the ratio of average grade of Al2O3Al2O3 to the average grade of SiO2SiO2 of the reserves. |
We have been in compliance with the National Mining Safety Law and related rules and regulations in China. We closely supervise and routinely inspect mining conditions with continual implementation of safety measures and procedures at our own bauxite mines and safety training for our mining personnel. In 2017,2018, we extracted approximately 17.017.3 million tonnes of bauxite from our mines and did not experience any mining operation related accidents that involved serious work injuries or death.
Other Suppliers.In addition to our mines, we also source bauxite from other suppliers. The majority of other suppliers are small independent mines. Small independent mines are not affiliated with us and generally have annual bauxite production capacities not exceeding 200,000 tonnes. These mines have been an important source of bauxite for our operations. We purchase bauxite directly from small independent mines or through local distributors that procure bauxite from these mines. In addition, we also secure a portion of bauxite overseas. Bauxite secured from other suppliers accounted for 53%56.4% of our total bauxite supply in 2017.2018.
Bauxite Procurement. The corporate management department at our headquarters is responsible for the oversight and coordination of our supply of bauxite. To determine how our bauxite requirement will be allocated among our principal sources each year, we first estimate our total bauxite needs for the year. Based on market conditions, production costs and other factors, we determine the amount of bauxite that we wish to source from our mines, and the remaining requirements from other suppliers.
Alumina-to-Silica Ratio.The production method for alumina refining is determined by the mineral composition of the bauxite, in particular, its alumina-to-silica ratio. Most of the bauxite reserves in China are diasporic with low alumina-to-silica ratios. Based on our current technology, an efficient application of the Bayer process requires bauxite with an alumina-to-silica ratio of 10:5:1 or higher, while the Bayer-sintering process can refine bauxite with an alumina-to-silica ratio as low as 4:1. In 2017,2018, the average alumina-to-silica ratio of the proven and probable reserves of our mines ranges from approximately 3.93:1 to 11.18:11.23:1.
Prices.There is neither governmental regulation on bauxite prices nor an official trading market for bauxite in China. We negotiate bauxite prices with our suppliers based on ore quality, mining costs, market conditions, transportation costs and various governmental taxes or levies, including a resource tax imposed by local governments. Our total bauxite cost is currently influenced by the following factors:
the cost of our mining operations;
the market conditions relating to purchases from small independent mines; and
the market conditions relating to purchases from overseas.
| ● | the cost of our mining operations; |
| ● | the market conditions relating to purchases from small independent mines; and |
| ● | the market conditions relating to purchases from overseas. |
The average purchase price of bauxite per tonne from our other suppliers in 2015, 2016, 2017 and 20172018 was approximately RMB383, RMB328, RMB369 and RMB369,RMB413 respectively. The average cost of bauxite per tonne from our mines in 2015, 2016, 2017 and 20172018 was approximately RMB251.6, RMB219.0, RMB226.2 and RMB226.2,RMB245.5, respectively.
We purchase a substantial amount of bauxite to satisfy our alumina production needs. Additionally, to fully utilize the bauxite from our mines, we refine all bauxite that meets the minimum technical requirements for our production of alumina. We also purchase higher grade ore from other suppliers and blend the ore of various grades to meet the technical requirements for our alumina production. This practice allows for flexibility and the inclusion of lower grade bauxite to optimize the use of bauxite deposits available to us. We do not use our historical average purchase prices or any other historical index to estimate our bauxite reserves.
The following table sets forth our capital expenditures for our bauxite mines for the periods indicated:
| | Year Ended December 31, |
| | 2015 | 2016 | 2017 |
| | (RMB in thousands) |
| Capital Expenditures | | | |
| Infrastructure construction | 950,980.6 | 478,024.6 | 405,920.0 |
| Facility upgrade | 62,910.9 | 35,222.9 | 24,016.9 |
| Total | 1,013,891.5 | 513,247.5 | 429,936.9 |
| | | Year Ended December 31, | |
| | | 2016 | | | 2017 | | | 2018 | |
| | | (RMB in thousands) | |
| Capital Expenditures | | | | | | | | | | | | |
| Infrastructure construction | | | 478,024.6 | | | | 405,920.0 | | | | 368,357.4 | |
| Facility upgrade | | | 35,222.9 | | | | 24,016.9 | | | | 74,632.7 | |
| Total | | | 513,247.5 | | | | 429,936.9 | | | | 442,990.1 | |
Primary Aluminum
An average of approximately 1.9111.912 tonnes of alumina and 13,41113,408 kWh of electricity was required to produce one tonne of primary aluminum ingots in 2017.2018.
Alumina and electricity, the two principal components of costs in the smelting process, accounted for approximately 43% and 34%33%, respectively, of our unit primary aluminum production costs in 2017.2018. Apart from alumina and electricity, we also require carbon anodes, carbon cathodes, fluoride salt and cryolite for our smelting operations.
Alumina is the main raw material used in the production of primary aluminum. Our primary aluminum plants that do not have integrated alumina refining operations onsite obtain alumina internally from our alumina refineries located elsewhere or externally on the market.
Supplemental Materials, Electricity and Fuel
The marketing and procurement department at our headquarters coordinates and manages our supply chain for all our major raw materials in conjunction with the procurement center at each production facility, which manages the logistics and inventory of raw materials locally. We are able to purchase diesel, the main fuel used by our mining and manufacturing equipment, from the public markets, and we source our water from local rivers, lakes or underground sources.
Alumina
Electricity, coal, alkali (caustic soda or soda ash) and natural gas are the principal materials and energy used in our alumina production. Electricity is one of the principal cost components in our refining process. We generate electricity at a number of refineries and purchase our remaining electric power requirements from regional power grids at government-mandated rates or directly from power generation enterprises. Most of our power supply agreements have a term of one year and are renewed by mutual agreement. Power prices in China can vary, sometimes substantially, from one region to another, based on demand and power production costs in the region. Power costs for our various alumina refineries vary accordingly.
Large quantities of coal are used as a reducing agent and fuel to produce steam and gas in the alumina refining process. As of December 31, 2017,2018, we held minority interests in a number of coal mining enterprises, including Shanxi Jiexiu, Qinghai Energy, Xuehugou Coal Industry Co., Ltd., Datong Coal Group Huasheng Wanjie Coal Co., Ltd., Dongdong Coal, Chalco Liupanshui, Huozhou Coal Group Xingshengyuan Coal Co., Ltd., and Guizhou Yuneng. We hold 70% of the equity interest in Gansu Huayang, which holds mining rights for coal deposits in the Luochuan mining area, Gansu Province. We have also acquired 70.82% of the equity interest in the Ningxia Energy, which holds mining rights for coal deposits in Ningxia Autonomous Region.
Guizhou Yuneng, an associate company in which we hold 25% of the equity interest, ishas been under development.development, and in September 2018, portion of the coal mines were put into production. The production of Huozhou Coal Group Xingshengyuan Coal Co., Ltd. and one of the mines owned by Chalco Liupanshui is currently suspended due to production technology renovation. The rest of the coal mining enterprises in which we directly or indirectly have minority equity interests are currently in the extraction or trial production stage. See “- D. Property, Plants and Equipment” for details of coal mines that we operate. By investing in coal mining enterprises and acquiring mining rights for coal deposits, we plan to partially offset our future energy costs, and secure a portion of the coal we consume in our operations.
Alkali is used as a supplemental material in alumina refining. The Bayer-sintering process and the Bayer-sintering combined process require soda ash while caustic soda is used in the Bayer process. Our alumina refineries use natural gas and coal gas as fuel to refine alumina. There is no governmental regulation of the prices of coal, alkali or fuel. We purchase these raw materials from external suppliers under negotiated supply contracts, which we believe are competitively priced. We have not experienced difficulty in obtaining these materials in sufficient quantity and at acceptable prices.
Primary Aluminum
Electricity, carbon anodes and cathodes are the principal materials and energy used in our smelting process. Smelting primary aluminum requires a substantial and continuous supply of electricity. The availability and price of electricity are key factors in our primary aluminum production. See “Item 5. Operating and Financial Review and Prospects - A. Operating Results - Overview - Factors Affecting Our Results of Operations - Manufacturing Costs.”
We generate electricity at four of our smelters to supply a portion of the electricity consumed by these smelters. We purchase our remaining electric power requirements directly from power generation enterprises. As of December 31, 2017, eight2018, ten of our smelters had direct purchase arrangement with power generation enterprises. Direct purchase transactions are normally organized by the local government and the direct purchase agreements are entered into annually. Because power prices in China vary from one region to another, power costs for our various smelters could vary substantially. The average electricity cost (including tax) of our smelters was approximately RMB0.35/RMB0.34/kWh in 2017,2018, which increaseddecreased by 21%2% compared to 2016,2017, primarily due to the increase of coal price in 2017 which resulted in a general increase of pricevolume of electricity generated by our own electric power plants and its proportion in the same period.total volume of electricity that we consumed.
Carbon anodes and cathodes are key raw materials in the smelting process. EachWe are generally able to manufacture carbon anodes necessary for the operations of our smelterssmelters. In addition, our Qinghai branch possesses production capacity of carbon cathodes and is able to producemanufacture carbon products necessary for its operations other than carbon cathodes. Guizhou branch is able to produce carbon cathodes.cathodes products.
Sales and Marketing
We coordinate substantially all of our sales and marketing activities for our self-produced alumina products and some of our sales and marketing activities for our self-produced primary aluminum products through Chalco Trading. Our subsidiaries and branches sell some of our self-produced primary aluminum products directly to external customers. Our alumina refineries sell our self-produced chemical alumina products directly to external customers or indirectly through Chalco Trading for subsequent external trading. For all of our self-produced products that are sold either through Chalco Trading for subsequent external sale or directly to external customers, our subsidiaries and branches play an important role in providing after-sale services and strengthening our presence in the marketplace. Since late 2009, we also have been engaged substantially in the trading of non-ferrous metal products including alumina, primary aluminum, copper, zinc and lead as well as coal products that we source from third-party suppliers through Chalco Trading.
Alumina
We sell our self-produced alumina to customers primarily through Chalco Trading, giving priority to customers with whom we have long-standing relationships and who have established a strong credit history, after reserving sufficient alumina for our forecasted primary aluminum production. In 2017,2018, we supplied approximately 5.716.06 million tonnes of alumina produced at our refineries to our smelters, which represented approximately 45% of our total alumina production, and sold the remainder to our customers. In addition, we also procure and sell outsourced alumina under long-term agreements or on the spot market through Chalco Trading. We sold approximately 2.051.03 million tonnes of outsourced alumina in 2017.2018.
The sales prices of alumina that our alumina refineries sell internally to Chalco Trading are determined based on our budgeted sale prices, spot market prices and the prices of primary aluminum on SHFE. Chalco Trading coordinates the external negotiation and execution of sales contracts of our alumina products. Chalco Trading sells our self-produced alumina and alumina sourced from third-party suppliers to smelterscustomers throughout China. AllMost of our major customers in the past three years have been domestic smelters. We primarily sourced alumina from third-party suppliers on the spot market, and we are normally required to pay the full price of the outsourced alumina before each delivery.
Chalco Trading sells our self-produced alumina and outsourced alumina under spot sales agreements and long-term sales agreements with terms ranging from one year to three years. Our long-term sales agreement for alumina normally sets forth the quantity of alumina to be sold by us in each month and each year, the price determination mechanism, payment method, place of delivery and delivery method. Places of delivery under our sales agreements are arranged to be where we could efficiently manage the transportation of alumina and help reduce logistics cost. Our customers are normally required to pay for their procurement before each delivery. As a result, the spot price of alumina and fluctuations of primary aluminum prices on the SHFE affect the alumina prices at which we sell.
Chalco Trading sets the price for the external sales of alumina products after taking into account the following factors:
international and domestic supply-demand situation;
CIF Chinese ports prices for alumina imports into China and other relevant import expenses;
international and domestic alumina transportation costs;
effects of the PRC Government’s policies on raw materials required by our alumina refineries; and
our short-term and mid-term projections for alumina prices.
| ● | international and domestic supply-demand situation; |
| ● | CIF Chinese ports prices for alumina imports into China and other relevant import expenses; |
| ● | international and domestic alumina transportation costs; |
| ● | effects of the PRC government’s policies on raw materials required by our alumina refineries; and |
| ● | our short-term and mid-term projections for alumina prices. |
Primary Aluminum
We sell all of our self-produced and outsourced primary aluminum to domestic customers. We expect China to remain our key market for primary aluminum for the foreseeable future. Customers of our primary aluminum products principally consist of aluminum fabricators and distributors that resell our primary aluminum products to aluminum fabricators or other purchasers.
To improve the efficiency of our distribution, we divide our China market into the following regions: southern China (including Guangdong and Fujian Provinces); eastern China (including Jiangsu and Zhejiang Provinces and Shanghai Municipality); southwestern China (including Sichuan Province and Chongqing Municipality); the Beijing-Tianjin-Tanggu area; and central China. In general, we satisfy each purchase order with products from our nearest smelter to minimize transportation costs.
Our primary aluminum smelting subsidiaries and branches sell a portion of our primary aluminum output directly to external customers. Each of our smelters is normally responsible for the sale of products to the customers from neighbouringneighboring markets, negotiating the pricing and delivery terms based on market conditions.
Our primary aluminum smelting subsidiaries and branches also sell a portion of our primary aluminum output internally to Chalco Trading at prices based on the spot prices of primary aluminum on Yangtze or Nanchu. We establish pricing guidelines for Chalco Trading to conduct external domestic sales of our self-produced primary aluminum products, taking into account four main factors: the primary aluminum spot prices and futures price on the SHFE; spot prices in the regions of eastern China and southern China; our production costs and expected profit margins; and supply and demand. Chalco Trading then coordinates the external sales of primary aluminum. Chalco Trading sells our self-produced primary aluminum products to external customers through the following three channels:
Contract sales. Most of our primary aluminum sales are made pursuant to contracts entered into directly with our long-standing customers. The terms for our sales contracts for primary aluminum are typically one year. We price our primary aluminum products based on the SHFE prices and spot market prices for primary aluminum.
Sales on the SHFE. As part of our effort to manage market risk, we sell a portion of our primary aluminum products on the SHFE through futures contracts with terms ranging from one month to twelve months to hedge against declines in primary aluminum prices.
Sales on the spot market. We also sell our primary aluminum products on the spot market at prices with reference to various factors, such as market spot prices and transportation costs.
| ● | Contract sales. Most of our primary aluminum sales are made pursuant to contracts entered into directly with our long-standing customers. The terms for our sales contracts for primary aluminum are typically one year. We price our primary aluminum products based on the SHFE prices and spot market prices for primary aluminum. |
| ● | Sales on the SHFE. As part of our effort to manage market risk, we sell a portion of our primary aluminum products on the SHFE through futures contracts with terms ranging from one month to twelve months to hedge against declines in primary aluminum prices. |
| ● | Sales on the spot market. We also sell our primary aluminum products on the spot market at prices with reference to various factors, such as market spot prices and transportation costs. |
In addition, we also procure and sell outsourced primary aluminum on the spot market or through short-term futures and options transactions. We determine our sales prices of the outsourced primary aluminum through negotiations with our customers, taking into consideration factors including our procurement prices and the prevailing market conditions. We sold approximately 2.021.74 million tonnes of outsourced primary aluminum in 2017.2018.
Chemical alumina products and Gallium
Chemical alumina products and gallium are derived from our alumina production. We adjust our production of these products based on market demand. Our alumina refineries sell our chemical alumina products directly to external customers or indirectly to external customers through Chalco Trading for subsequent external trading.
We sell most of our chemical alumina products and all of gallium in China. Prices for our chemical alumina products and gallium are determined through negotiations with our customers, taking into consideration the market conditions. Our total sales of gallium in 2015, 2016, 2017 and 20172018 amounted to approximately RMB28 million, RMB108 million, and RMB74 million and RMB147 million, respectively.
Coal
Ningxia Energy sells a portion of its self-produced coal directly to external customers through short-term contracts at prices determined through negotiations with our customers, taking into consideration factors including our procurement prices and prevailing market conditions. Ningxia Energy consumes the rest of its self-produced coal at its own electric power plant.
In addition, we also procure and sell outsourced coal under long-term agreements or on the spot market through Chalco Trading. We sold approximately 6.305.25 million tonnes of outsourced coal in 2017.2018.
Trading of Outsourced Non-ferrous Metal Products and Other Materials
Since late 2009, we have been actively engaged in the trading of alumina and primary aluminum sourced from third-party suppliers. Please see “- Alumina” and “- Primary Aluminum” for more details. Through Chalco Trading, we also sell other non-ferrous metal products such as copper, zinc and lead as well as coal products that we procure from our third-party suppliers to external customers on the spot market or under long-term sales agreements. Please see “- Coal.” In 2017,2018, we sold approximately 1.510.44 million tonnes of outsourced copper, zinc and lead. In addition, we also sell outsourced raw and ancillary materials such as iron ore, charred coal and cathode copper in bulk to customers such as steel manufacturers and copper processing companies on the spot market.
Chalco Trading has a team with trading expertise to conduct research on the markets of non-ferrous metal products and other materials. From time to time, we may enter into futures and options transactions to hedge against price fluctuations in the non-ferrous metal product market.
Delivery
We rely on rail shipping and trucks for the delivery of products within China.
Our alumina is transported by rail or trucks, and transportation costs are generally borne by our customers and excluded from our sales prices. For long-distance deliveries, we maintain spur lines connecting our plants to the national railway routes.
Most of our primary aluminum products are transported by rail, and our coal products are transported both by trucks and by rail.
Rail shipping on the PRC national railway system is subject to government mandated pricing.
Principal Facilities
Our principal facilities include 2122 principal production plants and our Zhengzhou Institute. Set forth below is a description of our principal production plants.
Guangxi Branch
Our Guangxi branch commenced operations in 1994 and is located in Guangxi Zhuang Autonomous Region in southwestern China, an area rich in bauxite reserves. Our Guangxi branch obtains bauxite delivered via highway from our Pingguo mine, one of our wholly-owned mines, located less than 17 kilometers from our Guangxi branch.
Our Pingguo mine contains large, easily exploitable bauxite reserves with high alumina-to-silica ratios. Our Guangxi branch is our only principal refinery that exclusively uses the Bayer process. With technology and production equipment imported from Europe, the Guangxi refinery features a high level of automation and energy efficiency. Since its inception, we have continually increased the designed production capacity at this branch by overcoming production bottlenecks and investing in capacity expansions. Guangxi branch had an annual alumina production capacity of approximately 2,210,000 tonnes as of December 31, 2017.2018. In 2017,2018, our Guangxi branch produced approximately 2,462,1202,486,180 tonnes of alumina, along with approximately 112,92096,520 tonnes of chemical alumina products.
Guizhou Branch
Our Guizhou branch commenced its smelting operations in 1966 and was subsequently expanded to include alumina refining operations in 1978. Our Guizhou branch usesuses 160Ka and 230Ka pre-bake reduction pot-lines in its primary aluminum production. The smelter in our Guizhou branch has undergone technological innovations and overhauls since its inception. Since November 2017, we have been engaged in the gradual closing down of the 160Ka pre-bake reduction pot-lines and, subsequently, the closing down of the 230Ka pre-bake reduction pot-lines. As of December 31, 2017, ourJanuary 2018, the production in Guizhou branch had an annual primary aluminum production capacity of approximately 170,000 tonnes.been fully shut down. In 2017,2018, our Guizhou branch produced approximately 282,09035,830 tonnes of primary aluminum.aluminum products.
Our Guizhou branch also contains a modern carbon production facility, which produces carbon cathodes and carbon anodes.
Chalco Mining
Chalco Mining was incorporated as one of our subsidiaries in the PRC in 2007. Due to the proposed Asset Restructuring, we2007 and is currently hold 18.86% of the equity interest in Chalco Mining. Please see “– A. History and Development of the Company – Subscription of Equity Interest of Certain Subsidiaries and Subsequent Issuance of Additional A Shares” for further details.our wholly owned subsidiary. To optimize the allocation of our resources and further consolidate our operations, we transferred all of the assets and liabilities of our Henan branch to Chalco Mining in August 2017. Henan branch commenced its alumina refining operation in 1966 and primary aluminum smelting operation in 1967 in Henan Province, a province rich in bauxite reserves. It was the first refinery in China to develop the Bayer-sintering combined process. Bauxite is delivered to Chalco Mining via railway and highway from our following mines: Xiaoguan mine, Gongyi mine and Dengfeng mine located in Zhengzhou, Luoyang mine in Luoyang, Mianchi mine in Mianchi, Xuchang mine in Zhengzhou, Sanmenxia mine in Sanmenxia and Jiaozuo mine in Jiaozuo. The alumina production line that we put into operation at Chalco Mining uses the ore-dressing Bayer process, which we developed to refine low alumina-to-silica ratio bauxite. Chalco Mining’s production facilities have been substantially upgraded with equipment imported from Germany and Denmark. The refinery has also benefited from its access to high alumina-to-silica ratio bauxite from certain of our mines and through purchases on the market. Chalco Mining had an annual alumina production capacity of approximately 2,410,000 tonnes as of December 31, 2017.2018. In 2017,2018, Chalco Mining produced approximately 1,627,8201,747,860 tonnes of alumina and 130,35095,300 tonnes of chemical alumina products.
Chalco Shandong
Chalco Shandong was incorporated as one of our subsidiaries in the PRC in 2015.2015 and is currently our wholly owned subsidiary. The predecessor of Chalco Shandong was our Shandong branch, which commenced operations in 1954. Due to the proposed Asset Restructuring, we currently hold 69.2% of the equity interest in Chalco Shandong. Please see “– A. History and Development of the Company – Subscription of Equity Interest of Certain Subsidiaries and Subsequent Issuance of Additional A Shares” for further details. Chalco Shandong has the capacity to produce alumina and chemical alumina products. Bauxite is delivered to Chalco Shandong via railway and highway from the Yangquan mine in Yangquan, Shanxi Province. Its alumina refinery was China’s first production facility for alumina. It produces its alumina through the Bayer-sintering process and the Bayer process. In 2018, through technology renovation, Chalco Shandong has the capacity to produce high-quality alumina products used for the production of refined aluminum and high-purity aluminum. Chalco Shandong purchases some bauxite from overseas and the rest from small third-party mines in Henan and Shanxi Provinces. Chalco Shandong had an annual alumina production capacity of approximately 2,270,000 tonnes as of December 31, 2017.2018. It produced approximately 1,780,7501,714,700 tonnes of alumina in 2017.2018.
In addition, Chalco Shandong produces substantial amount of chemical alumina products. In 2017,2018, it produced approximately 1,798,1502,105,480 tonnes of chemical alumina products. It is the largest and most technologically advanced production facility for chemical alumina products in China with the ability to produce a wide variety of chemical alumina products.
Chalco Shandong had engaged in primary aluminum production before we suspended the operations of its primary aluminum production facilities in June 2013. In 2017, the disposal of Chalco Shandong’s primary aluminum production facilities werewas completed. Chalco Shandong did not have any annual primary aluminum production capacity as of December 31, 20172018 and did not produce any primary aluminum in 2017.2018.
Qinghai Branch
Located in Qinghai Province, our Qinghai branch is a stand-alone primary aluminum production facility. This branch commenced operations in1987 and is one of the most technologically advanced primary aluminum smelters in China. It operates 180Ka and 210Ka automated pre-bake anode reduction pot-lines that were developed domestically. ItIn addition, our Qinghai branch also possesses production capacity of carbon cathodes and is able to manufacture carbon cathodes products.Our Qinghai branch benefits from relatively low electricity costs in Qinghai Province due to the hydroelectric power stations in the region. The Qinghai branch sources alumina from Shanxi New Material, Chalco Shandong, Chalco Mining and Chalco Zhongzhou Aluminum and incurs higher transportation costs for both raw materials and its primary aluminum products than our other branches.
Our Qinghai branch had an annual primary aluminum production capacity of approximately 420,000 tonnes as of December 31, 2017.2018. It produced approximately 401,460403,890 tonnes of primary aluminum in 2017.2018.
Chalco
Guizhou Huaren
Established in May 2017 and located in Qingzhen, Guizhou Province, Guizhou Huaren is a stand-alone primary aluminum production facility and commenced full operation in September 2018. Guizhou Huaren had an annual primary aluminum production capacity of approximately 400,000 tonnes as of December 31, 2018. It produced approximately 344,600 tonnes of primary aluminum products in 2018.
Shanxi Zhongrun
Established in November 2015 and located in Lvliang, Shanxi Province, Shanxi Zhongrun specializes in producing primary aluminum products. The first batch of electrolytic cells of Shangxi Zhongrun was put into operations in May 2018. Shanxi Zhongrun had an annual primary aluminum production capacity of approximately 432,000 tonnes as of December 31, 2018. It produced approximately 53,470 tonnes of primary aluminum products in 2018.
Zhongzhou Aluminum
Located in Henan Province, Chalco Zhongzhou Aluminum is a stand-alone alumina plant, located near abundant bauxite, coal and water supplies. Chalco Zhongzhou Aluminum was incorporated as one of our subsidiaries in the PRC in 2015.2015 and is currently our wholly owned subsidiary. The predecessor of Chalco Zhongzhou Aluminum was our Zhongzhou branch. Due to the proposed Asset Restructuring, we currently hold 63.1% of the equity interest in Chalco Zhongzhou. Please see “– A. History and Development of the Company – Subscription of Equity Interest of Certain Subsidiaries and Subsequent Issuance of Additional A Shares” for further details. Chalco Zhongzhou Aluminum commenced operations in 1993 and is equipped with imported and self-developed technology and has undergone various improvements and upgrades, in particular to its Bayer-sintering process and Bayer process. Chalco Zhongzhou Aluminum obtains bauxite supplies partly from extractions of our mines, and partly from external suppliers in Henan and Shanxi Provinces and overseas.
Chalco
Zhongzhou Aluminum had an annual alumina production capacity of approximately 3,050,000 tonnes as of December 31, 2017. Chalco2018. Zhongzhou Aluminum produced approximately 1,929,8701,913,240 tonnes of alumina and approximately 581,800637,200 tonnes of chemical alumina products in 2017.2018.
Zunyi Alumina
Zunyi Alumina is located in Zunyi, Guizhou Province. In April 2006, we entered into a joint venture agreement with Guizhou Wujiang Hydroelectric Co., Ltd., to establish a joint venture company, Zunyi Alumina. We held a 73.28% equity interest in Zunyi Alumina. Zunyi Alumina completed the construction of alumina production facilities and commenced operations in 2010. Zunyi Alumina had an annual alumina production capacity of approximately 1,000,000 tonnes as of December 31, 2017. Zunyi Alumina produced approximately 1,080,010 tonnes of alumina and 280 tonnes of chemical alumina products in 2017.
Chongqing Branch
Our Chongqing branch is located in Chongqing. Chongqing branch completed the construction of alumina production facilities in 2010 and its annual alumina production capacity was approximately 800,000 tonnes as of December 31, 2017.2018. Chongqing branch did not produce any alumina or chemical alumina products in 2017.2018. We have suspended production in Chongqing branch since July 2014 due to the relatively significant decrease in the price of alumina as compared with the price of alumina during the construction period, large negative variation of mineral resources and the high costs of natural gas and other energy at the time of suspension. In 2018, we utilized the alumina assets of Chongqing branch through public external leasing.
Guizhou Huajin
Established in July 2014 and located in Qingzhen, Guizhou Province, Guizhou Huajin specializes in producing alumina products. Guizhou Huajin had an annual alumina production capacity of approximately 1,600,000 tonnes as of December 31, 2017.2018. Guizhou Huajin produced approximately 1,600,8501,514,370 tonnes of alumina products in 2017.2018.
Shanxi Huaxing
Located in Shanxi Province, Shanxi Huaxing is a stand-alone alumina plant which commenced trial production in October 2013. Shanxi Huaxing obtains bauxite supplies from our own mines delivered primarily via highway and is located near abundant coal and water supplies.
In December 2015, we transferred out 50% of our equity interests in Shanxi Huaxing, a then wholly-owned subsidiary of our Company, through the Shanghai United Assets and Equity Exchange. In December 2018, we acquired the 50% equity interests in Shanxi Huaxing through the Shanghai United Assets and Equity Exchange from Baotou Transportation Investment Group Co., Ltd. Upon completion of the acquisition, Shanxi Huaxing became a wholly-owned subsidiary of the Group. Please see “- A. History and Development of the Company - Transfer of Equity Interest in Shanxi Huaxing” for more details about the transfer of equity interest.
Shanxi Huaxing had an annual alumina production capacity of approximately 2,000,000 tonnes as of December 31, 2018. 116,570 tonnes of alumina produced by Shanxi Huaxing in 2018 was recorded as our production volume, being the output of alumina of Shanxi Huaxing in December 2018, as Shanxi Huaxing became our wholly-owned subsidiary in December 2018.
Lanzhou BranchAluminum
Located in Lanzhou city in Gansu Province, our Lanzhou branchAluminum is a stand-alone primary aluminum plant. It was part ofIn April 2007, we acquired a primary aluminum plant in Lanzhou, Aluminum before July 2007 and was acquired by us through share exchange in April 2007. In July 2007, Lanzhou Aluminumwhich was divided intoin to two entities:parts in July 2007: our Lanzhou branch and Northwest Aluminum. OurIn January 2019, we turned the Lanzhou branch into our wholly-owned subsidiary, Lanzhou Aluminum, in order to promote its business vitality. Lanzhou Aluminum owns a primary aluminum smelting plant with a designed annual primary aluminum production capacity of approximately 450,000 tonnes as of December 31, 2017.2018. It produced approximately 390,990398,790 tonnes of primary aluminum in 2017.2018.
Shanxi New Material (formerly known as Shanxi Huaze)
Shanxi New Material is situated in Shanxi Province. In March 2003, we established the joint venture company, Shanxi Huaze, with Zhangze Electric Power to commence the construction of a primary aluminum production facility. In 2017, we contributed certain assets related to alumina production of our Shanxi branch to Shanxi Huaze. Upon completion of our asset contribution, our shareholding in Shanxi Huaze increased from 60% to 85.98% and Shanxi Huaze was renamed to Shanxi New Material. Shanxi New Material had an annual alumina production capacity of approximately 2,600,000 tonnes as of December 31, 20172018 and produced approximately 1,845,9702,129,130 tonnes of alumina and 68,35073,050 tonnes of chemical alumina products in 2017.2018. Its designed annual production capacity of primary aluminum was approximately 424,000 tonnes as of December 31, 20172018 and it produced approximately 436,730431,360 tonnes of primary aluminum in 2017.2018. Please see “- A. History and Development of the Company - Merger and Reorganization of Shanxi Branch and Shanxi Huaze” for more details about the reorganization.
Shanxi Huasheng
Shanxi Huasheng is situated in Shanxi Province. In December 2005, we entered into a joint venture agreement with Shanxi Guan Lv Company Limited to establish a joint venture company, Shanxi Huasheng. Shanxi Huasheng commenced operations in March 2006 and had a designed annual production capacity for primary aluminum of approximately 240,000190,000 tonnes as of December 31, 2017. In 2017, Shanxi Huasheng produced approximately 224,830 tonnes of primary aluminum.2018. We currently hold 51% equity interest in Shanxi Huasheng. In 2018, Shanxi Huasheng produced approximately 225,390 tonnes of primary aluminum.
Zunyi Aluminum
Zunyi Aluminum is situated in Guizhou Province. We currently hold 62.1% equity interestIn 2018, we merged Zunyi Alumina into Zunyi Aluminum. Upon the completion of the merger, our shareholding in Zunyi Aluminum.Aluminum increased from 62.1% to 67.445%. After the merger, Zunyi Aluminum’sAluminum had an annual alumina production capacity of approximately 1,000,000 tonnes as of December 31, 2018 and the aggregate production of Zunyi Aluminum was approximately 1,110,000 tonnes of alumina and 3,170 tonnes of chemical alumina products in 2018. Its post-merger designed annual production capacity of primary aluminum production capacity was approximately 375,000 tonnes as of December 31, 2017. In 2017,2018 and it produced approximately 331,160402,940 tonnes of primary aluminum.aluminum in 2018. Please see “- A. History and Development of the Company - Merger and Reorganization of Zunyi Alumina and Zunyi Aluminum” for more details about the merger.
Fushun Aluminum
Fushun Aluminum is situated in Liaoning Province, and is a stand-alone primary aluminum plant. In March 2006, we entered into a share transfer agreement with Liaoning Fushun Aluminum Plant to acquire 100% of the equity interests in Fushun Aluminum for a consideration of RMB500 million. Fushun Aluminum’s primary business was the production of primary aluminum and carbon products. We suspendedstopped production of primary aluminum in Fushun Aluminum in October 2015 due to the relatively significant decrease in the price of primary aluminum and high costs of electricity at the time of suspension. In 2017,2018, we disposed of the primary aluminum production facilities in Fushun Aluminum. Fushun Aluminum did not have any annual primary aluminum production capacity as of December 31, 20172018 and did not produce any primary aluminum in 2017.2018.
Fushun Aluminum had an annual anode carbon production capacity of approximately 180,000 tonnes as of December 31, 2018 and it produced approximately 117,387 tonnes of baked carbon anodes in 2018.
Shandong Huayu
Shandong Huayu is situated in Shandong Province and is a stand-alone primary aluminum plant. We currently hold 55% equity interest in Shandong Huayu. Shandong Huayu had an annual primary aluminum productioncapacity of approximately 200,000 tonnes as of December 31, 2017.2018. Shandong Huayu also has supporting facilities and coal-fired generators. In 2017,2018, Shandong Huayu produced approximately 212,820197,280 tonnes of primary aluminum. Since November 2018, we have gradually suspended production of aluminum at Shandong Huayu due to market environment and production restriction for environmental protection. We are considering the plan of transformation, upgrading and development of Shandong Huayu.
Gansu Hualu
Gansu Hualu is situated in Gansu Province, and is a stand-alone primary aluminum plant. In August 2006, we entered into a share transfer agreement with Baiyin Nonferrous Metal (Group) Co., Ltd. (“Baiyin Nonferrous”) and Baiyin Ibis Aluminum Co., Ltd. (“Baiyin Ibis”). Baiyin Nonferrous contributed 127,000 tonnes of primary aluminum smelting and supporting facilities owned by Baiyin Ibis as capital contribution and holds a 49% equity interest in Gansu Hualu. We hold a 51% equity interest in Gansu Hualu. Since November 2015, the production of primary aluminum has been suspended. In 2017,2018, the primary aluminum production facilities in Gansu Hualu has been disposed or in the process of disposal. Gansu Hualu had no annual primary aluminum production capacity as of December 31, 20172018 and did not produce any primary aluminum in 2017.2018.
In addition, Gansu Hualu also possesses production capacity of carbon products. Its designed annual production capacity of anode carbon products was approximately 150,000 tonnes as of December 31, 2018 and it produced approximately 113,595 tonnes of calcined petroleum coke in 2018.
Baotou Aluminum
Baotou Aluminum is located in the Inner Mongolia Autonomous Region, and is a stand-alone primary aluminum plant. On December 28, 2007, through A Shares issuance and exchange for Baotou Aluminum shares, we acquired 100% of the equity interest of Baotou Aluminum.Due to the proposed Asset Restructuring, we Baotou Aluminum is currently hold 74.33% of the equity interest in Baotou Aluminum. Please see “– A. History and Development of the Company – Subscription of Equity Interest of Certain Subsidiaries and Subsequent Issuance of Additional A Shares” for further details. our wholly owned subsidiary.In April 2015, Baotou Aluminum and Baotou Transportation Investment Group Co., Ltd. established Inner Mongolia Huayun.Inner Mongolia Huayuncommenced operations in 2017. Togetherwith the primary aluminum production facilities at Inner Mongolia Huayun, Baotou Aluminum had a consolidated annual primary aluminum production capacity of approximately 1,100,0001,340,000 tonnes as of December 31, 20172018 and a consolidated output of approximately 812,8601,234,240 tonnes of primary aluminum in 2017.2018.
Liancheng Branch
Our
Liancheng branch is located in Gansu Province. In late May 2008, we acquired 100% of the equity interest in Liancheng Longxing Aluminum Company Limited from Chinalco on the China Beijing Equity Exchange and subsequently turned it into our Liancheng branch which specializes in producing primary aluminum. OurTo better transform its management mechanisms, energize its business vitality and improve its market competitiveness, in September 2018, we decided to convert it into our wholly-owned subsidiary. We are in the process of completing such conversion. Liancheng branch had an annual primary aluminum production capacity of approximately 550,000 tonnes as of December 31, 2017.2018. It produced approximately 514,450438,230 tonnes of primary aluminum in 2017.2018.
Chalco Nanhai
Established in June 2007 and located in Foshan, Chalco Nanhai specializes in aluminum fabrication. Chalco Nanhai commenced its commercial operation in 2011 and had an annual aluminum fabrication production capacity of approximately 110,000 tonnes as of December 31, 2017. Since 2015, we suspended production and have not produced any aluminum fabrication products at Chalco Nanhai.
Ningxia Energy
We acquired a 70.82% equity interest
Ningxia Energy is an integrated power generation company with coal mines located in Ningxia Energy in January 2013. Please see “Item 3. Key Information - D. Risk Factors - Our historical results may not be indicative of our future prospects.”Autonomous Region. Its principal business includes conventional coal-fire power generation and renewable energy generation. Ningxia Energy was established in June 2003. It isIn January 2013, we acquired an integrated power generation company withaggregate of 70.82% of the equity interest in Ningxia Energy. Ningxia Energy had a total installed capacity of 4,2994,249.13 MW as of December 31, 2017.2018. It also operates coal mines located in the Ningxia Autonomous Region. Please see “- D. Property, Plants and Equipment - Mines-Mines - Coal Mines.” Its principal business includes conventional coal-fire power generation and renewable energy generation. In 2017,2018, Ningxia Energy produced approximately 9.9910.8 million tonnes of coal and approximately 15.8515.9 billion kWh of electricity.
Zhengzhou Institute
The Zhengzhou Institute, located in Zhengzhou, Henan Province, was incorporated as our subsidiaries in 2015. Its predecessor was established in August 1965 and has served as the center for our research and development efforts. The Zhengzhou Institute specializes in the research and development of technologies for primary aluminum smelting, alumina refining and the development of new products of chemical alumina. Zhengzhou Institute is the only institute in China dedicated to light metals research and has played a key role in bringing about technological innovations in China’s aluminum industry. The Zhengzhou Institute was approved by the Ministry of Science and Technology of the PRC in 2003 to establish the National Research Center of Aluminum Refinery Technologies and Engineering. As of December 31, 2017,2018, the Zhengzhou Institute had a limited production capacity for chemical alumina products, which it uses in connection with its research and development efforts.
Xinghua Technology
We acquired a 66% equity interest in Xinghua Technology in December 2016. Located at Shanxi Province, Xinghua Technology is an alumina plant with an annual alumina production capacity of approximately 900,000 tonnes as of December 31, 2017.2018. It produced approximately 482,390778,300 tonnes of alumina and approximately 119,760189,430 tonnes of chemical alumina in 2017.2018.
Competition
Competition from Domestic Competitors
Alumina
We sold all of our self-produced alumina to domestic customers in 2017.2018. Our competitors mainly include other domestic and international alumina producers that conduct sales in China. In 2017,2018, our alumina production (with chemical alumina products included) represented approximately 20.5%21.2% of total domestic production in China.
The Group is a leading enterprise in non-ferrous metal industry in China. As of December 31, 2017, 172018, 18 alumina producers in China (including Chalco) each had annual production capacity of 500,000 tonnes or above, which collectively represented approximately 96%97.59% of the total alumina production capacity in China. As of the same date, among these 1718 alumina producers, 1416 alumina producers (including Chalco) each had annual production capacity of one million tonnes or above, which collectively represented approximately 94%95.84% of the total alumina production capacity in China. In order to improve the efficiency and competitiveness of the Chinese alumina industry as well as to protect the environment, MIIT published “Standard Conditions for Aluminum Industry” (the “Standard Conditions”) in July 2013, which established a high entry barrier for new alumina producers in China and imposed stringent requirement for existing alumina companies.
Although we face competition from other domestic and international refineries, we have several advantages over such competitors, including:
we have access to a substantial and stable supply of bauxite;
we are experienced in alumina production and our production technologies are specifically adapted to the particular chemical composition of bauxite found in China;
we have strong capabilities in technology research and hold certain proprietary technologies and patents; and
we have a substantial workforce that has extensive experience in production and management.
| ● | we have access to a substantial and stable supply of bauxite; |
| ● | we are experienced in alumina production and our production technologies are specifically adapted to the particular chemical composition of bauxite found in China; |
| ● | we have strong capabilities in technology research and hold certain proprietary technologies and patents; and |
| ● | we have a substantial workforce that has extensive experience in production and management. |
Primary Aluminum
We derived all of our primary aluminum revenues from domestic sales in 2017.2018. Our competitors include other domestic and international primary aluminum producers that conduct sales in China. In 2017,2018, our primary aluminum production represented approximately 9.8%11.4% of total domestic production in China.
We are a leading enterprise in non-ferrous metal industry in China. As of December 31, 2017, 192018, 20 primary aluminum producers in China (including Chalco) each had annual production capacity of 500,000 tonnes or above, which collectively represented approximately 86%88.57% of the total primary aluminum production capacity in China. As of the same date, among these 1920 primary aluminum producers, 1211 primary aluminum producers (including Chalco) each had annual production capacity of one million tonnes or above, which collectively represented approximately 74%72.73% of the total primary aluminum production capacity in China. The PRC government encourages consolidation in the Chinese primary aluminum industry to create larger, more efficient producers that are better positioned to implement measures to reduce emissions. Moreover, according to the Standard Conditions and other administrative regulations, new primary aluminum projects for expanding production capacity must be approved by the relevant administrative departments and must have stable supply of alumina. In addition, pursuant to relevant PRC regulations, the construction of new primary aluminum projects and the reconstruction or expansion of existing primary aluminum projects would be approved only if such projects would introduce new primary aluminum production capacity in an amount equal to or smaller than the amount of existing production capacity to be replaced.
Although we face competition from other domestic and international smelters, we have several advantages over such competitors, including:
Scale of production. With nine primary aluminum smelters, we can achieve significant economies of scale. In addition, our scale of production enables us to achieve high production volumes to fill large customer orders and maintain a large customer base. Through our national distribution network, we are able to make timely deliveries to customers from our local warehouses.
Technology. We believe we have more sophisticated and efficient technology than most of our domestic competitors. The FHEST technology developed and employed by us is currently the most advanced energy saving technology in primary aluminum smelting in China. In addition, in terms of technological support and research and development capabilities, we are equipped with the most advanced research and development institute within the aluminum industry in China and enjoy advantages over other domestic smelters in technology advancement.
Vertical integration. As a leading integrated alumina and primary aluminum producer in China, we are able to supply alumina internally to our primary aluminum plants. As a result, we save on transportation, warehousing and related costs. In addition, because we operate our own alumina refineries, we are able to assure a stable supply of alumina for our primary aluminum smelting operations.
Quality. We have maintained and will continue to improve on the high quality standards for our primary aluminum which has satisfied national and industrial standards and customers’ need.
| ● | Scale of production. With eleven primary aluminum smelters, we can achieve significant economies of scale. In addition, our scale of production enables us to achieve high production volumes to fill large customer orders and maintain a large customer base. Through our national distribution network, we are able to make timely deliveries to customers from our local warehouses. |
| ● | Technology. We believe we have more sophisticated and efficient technology than most of our domestic competitors. The FHEST technology developed and employed by us is currently the most advanced energy saving technology in primary aluminum smelting in China. In addition, in terms of technological support and research and development capabilities, we are equipped with the most advanced research and development institute within the aluminum industry in China and enjoy advantages over other domestic smelters in technology advancement. |
| ● | Vertical integration. As a leading integrated alumina and primary aluminum producer in China, we are able to supply alumina internally to our primary aluminum plants. As a result, we save on transportation, warehousing and related costs. In addition, because we operate our own alumina refineries, we are able to assure a stable supply of alumina for our primary aluminum smelting operations. |
| ● | Quality. We have maintained and will continue to improve on the high quality standards for our primary aluminum which has satisfied national and industrial standards and customers’ need. |
The primary aluminum produced by most of our smelters satisfies the quality standards of the LME.
Competition from International Competitors
The tariff rate for alumina and primary aluminum imports was eliminated on January 1, 2008 and August 1, 2007, respectively. In 2017,2018, China had net importexport of approximately 2.810.95 million tonnes of alumina (with chemical alumina products included), representing approximatelycompared to a 4% decrease from 2016.net import of 2.81 million tonnes in 2017, primarily due to supply shortage in international market in 2018. China had net import of approximately 101,90069,600 tonnes of primary aluminum in 2017,2018, which represented a 44%31.7% decrease from 2016.2017. The decrease in net import of primary aluminum in 20172018 was primarily due to a sharp decreaseslowed growth of aluminum consumption in import, since the price of primary aluminum generally showed a stronger trend of increase in the international market than in the domestic market, while the amount of export from China remained relatively stable in the same period.China.
We expect to continue to face competition from international suppliers of alumina and primary aluminum which are large international companies. Some competitors may also consider establishing joint venture companies with local producers in China to gain access to the resources in China and to lower transportation costs. However, we expect we will continue to benefit from certain PRC governmental policies that promote large domestic smelters.aluminum enterprises.
Research and Development
Our research and development efforts over the years have facilitated the expansion of our production capacity and reduced our unit costs. We have successfully commercialized our previous research and development results in various technologies. In 2017,2018, we completed 13935 technological projects, including 70 independentnine research and development projects 57undertaken independently by our branches or subsidiaries, 21 special key science and technology projects and 12five science and technology application projects. In addition, we filed a total of 105122 patent applications in 2017.2018.
As of December 31, 2017,2018, we owned 1,4031,267 patents, which were primarily related to technologies and processes, equipment and new products. Once registered, a patent in China for an invention is valid for 20 years and for a utility model or a design 10 years from the date of the patent application. As of December 31, 2017,2018, we owned 25 trademarks, each of which had a term of 10 years.
We do not regard any single patent, license, or trademark to be material to our sales and operations as a whole. We are neithernot involved in any material intellectual property disputes against us nor are we pursuing any legislation relating to intellectual property rights against any party.disputes.
Environmental Protection
Our operations are subject to a wide variety of PRC national and local environmental laws and regulations, including thoselaws and regulations governing waste discharge, waste generation, treatment and disposal of hazardous materials, land reclamation, air and waterpollutant emissions and mining matters. For example, the PRC government has set discharge standards for air and water emissions to air and water. To enforce these standards, national environmental protection authorities imposed discharge fees in proportion to the amount of discharge prior to January 1, 2018. The relevant PRC government agencies are authorized to order any operations that exceed discharge limits to take remediation measures as approved by the relevant agency, or order the closure of any operations that fail to complyissues associated with applicable regulations. In December 2016, the PRC government promulgated the Environmental Protection Tax Law which became effective from January 1, 2018. The Environmental Protection Tax Law has replaced discharge fees with environmental protection tax levy, which is calculated based on the pollution equivalents converted from pollutant emissions.mining.
The pollutants discharged from our alumina refining process include red mud, waste water and gas emissions and particulates. Our primary aluminum production process generates fluorides, pitch fume and particulates. It is illegal to release these pollutants untreated. The discharge of these pollutants after treatment must comply with national and local discharge limits.
Each of our alumina refineries, primary aluminum smelters and other production plants has its own waste treatment facilities onsite or has developed other methods to dispose of industrial waste in compliance with applicable environmental laws and regulations. We were granted ISO14001 accreditations issued by China Quality Certification Center and the International Certification Network in 2004. In 2017,2018, we passed the annual review and these accreditations were renewed.
We have increased our energy-efficiency by implementing new production techniques and technologies, upgrading our production facilities, optimizing our production process and enhancing our logistics and operations management. We have incorporated clean technology and processes into our operations with a view to promoting the concept of “zero emission” plants. Since 2009, we have achieved our targetIn 2018, the emission of zeroall industrial waste water emission in the course of our alumina and primary aluminum production.production met the standards under relevant regulations.
Our total expenditures for maintaining compliance with environmental laws and regulations were RMB627.3 million, RMB657.5 million, and RMB691.9 million and RMB777.6 million, for 2015, 2016, 2017 and 2017,2018, respectively. In 2017,2018, we did not have any major environmental pollution incidents.
Insurance
We maintain insurance coverage for our fixed assets such as plant, machinery, equipment, office facilities and transportation vehicles against accidents or natural disasters such as typhoons, hurricanes, floods, landslides and lightning strikes. However, there are certain types of losses, such as losses from war, acts of terrorism and nuclear radiation, for which we cannot obtain insurance at a reasonable cost or at all.
We are covered under the work-related injury insurance required by the relevant local government labor departments, and we have procured additional business accidental insurance for our employees. More extensive insurance is either unavailable in China or would impose a cost on our operations that would reduce our competitiveness.
Our insurance premiums were RMB33.2 million, RMB35.8 million, and RMB44.1 million and RMB49.6 million in 2015, 2016, 2017 and 2017,2018, respectively.
Seasonality
Our business is not subject to seasonality.
Cyber Security
With respect to our internal internet policies on cyber-security, we have established an information safety management system and issued internal regulations on cyber-security, internal hardware and data safety systems and we are gradually implementing measures relating to the office environment information safety management, information system access control, protection from any malicious software, and internal review and audit of information safety risks, in order to prevent loss of information due to cyber-security incidents, network outages or hardware incidents. In 2017,2018, we did not experience any material cyber-security incidents or related losses.
Regulatory Overview
Producers of alumina and primary aluminum are subject to national industrial policies and relevant laws and regulations in areas of environmental protection, import and export, land use, foreign investment regulation and taxation. We are also subject to regulations relating to activities such as mining.
We are principally subject to governmental supervision and regulation by four agencies of the PRC government:
the NDRC, which sets and implements the major policies concerning China’s economic and social development, approves investments exceeding certain amounts, coordinates and improves the reform of the economic system;
the Ministry of Land and Resources of China, which has the authority to grant land use rights and mining right permits;
the MIIT, which formulates industrial policies and investment guidelines for all industries including the aluminum industry; and
the CSRC, the securities regulatory commission of China.
| ● | the NDRC, which sets and implements the major policies concerning China’s economic and social development, approves investments exceeding certain amounts, coordinates and improves the reform of the economic system; |
| ● | the Ministry of Natural Resources of China, which has the authority to grant land use rights and mining right permits; |
| ● | the MIIT, which formulates industrial policies and investment guidelines for all industries including the aluminum industry; and |
| ● | the CSRC, the securities regulatory commission of China. |
The following is a brief summary of the principal laws, regulations, policies and administrative directives to which we are subject.
Requirements for Capital Investments
Anycapital markets financing activities by an enterprise or company incorporated in the PRC such as those to finance capital projects, are subject to approval by the CSRC and/or other relevant authorities in China, regardless of whether the funds are raised in China or on the international capital markets. An issuer incorporated in the PRC must obtain prior approval from the CSRC for issuance of equity securities or equity-linked securities. Offering of corporate bonds in the PRC is also subject to supervision of the CSRC. Offering of bonds by a PRC-incorporated company outside the PRC shall be filed with NDRC. For all overseas financing activities by an enterprise or company incorporated in the PRC, the issuer must register with and obtain prior approval from the administrative authorities of foreign exchange. Foreign investmentinvestment in the exploring and mining of alumina and primary aluminum is permitted by the PRC government.
Standard Conditions for Aluminum Industry
The Standard Conditions provides that bauxite mining, alumina and primary aluminum projects must comply with the state industry policies and overall plans on the development of aluminum industry, land use, urban planning and designation of functional zones. Aluminum smelting enterprises must be appropriately distributed across the relevant regions according to certain conditions including availability of resources, energy and environment. Pursuant to the Standard Conditions, aluminum smelting enterprises located in regions lacking competitive production elements should be gradually moved to more competitive region, and the amount of newly increased production capacity shall be strictly controlled to prevent excessive capacity caused by over-investing. The Standard Conditions further sets standards for production scale and major external conditions for newly established bauxite mining, alumina, electrolytic aluminum and recycled aluminum projects. The MIIT promulgated on April 4, 2014, January 4, 2015 and February 14, 2016, respectively, the first, the second and the third lists of enterprises that meet the Standard Conditions for the aluminum industry. Most of our production branches and subsidiaries have met the Standard Conditions and are included on these lists.
Pricing
The PRC government does not impose any limitations with respect to the pricing of alumina, primary aluminum and related products. Thus, alumina and primary aluminum producers are free to set prices for their products. All the raw materials, supplemental materials and other supplies that we purchase are based on market prices. Freight transportation on the national railway system is subject to government mandated pricing.
Electricity Supply and Price
The State Electricity Regulatory Commission of China is responsible for the supervision and administration of the power industry in China. The NDRC and local governments regulate electricity pricing.
The Electric Power Law of China and related rules and regulations govern construction, generation, supply and consumption of electric power. Currently, China’s state-owned power companies, through their respective local subsidiaries, operate all the regional power grids in China from which we obtain a part of our electricity requirements. In October 2007, ChinesePRC government issued “Notice on Further Solutions of the Difference in Electricity Rates,” according to which the preferential electricity prices originally enjoyed by Chinese primary aluminum enterprises have been gradually abolished. In December 2007, ChinesePRC government issued “Notice of Eliminating Preferential Electricity Rate for High Energy Consuming Enterprises and Related Matters,” which further eliminated the preferential electricity price arrangement enjoyed by Chinese primary aluminum enterprises. In December 2013, the NDRC and MIIT issued the “Circular on the Policies for Tiered Pricing of Electricity Used by Electrolytic Aluminum Enterprises” (the “Electricity Tiered Pricing Circular”), which became effective on January 1, 2014, to impose tiers of electricity prices on primary aluminum smelters. Specifically, if the alternating current consumed by any smelter is more than 13,700 kWh per tonne of molten aluminum but less than 13,800 kWh per tonne of molten aluminum, such smelter must pay additional RMB0.02 per kWh for the electricity used. If the alternating current consumed by any smelter is more than 13,800 kWh per tonne of molten aluminum, such smelter must pay additional RMB0.08 for per kWh for the electricity used.
In March 2015, new policies and reforms relating to electricity generation, retail, usage, and other related sectors were introduced. Under “Several Opinions of the CPC Central Committee and the State Council on Further Deepening the Reform of the Electric Power System,” a series of reforms relating to electricity pricing, distribution and retail segments, electricity trading, distributed generation, and other aspects has been put forward. In November 2015, NDRC and the National Energy Administration of the PRC jointly issued further supplemental measures, including “Implementation Opinions on Promoting Transmission-Distribution Price Reform,” “Implementation Opinions on Promoting Power Market Construction,” “Implementation Opinions on Establishing Power Trading Institutions and Their Normative Operation,” “Implementation Opinions on Orderly Releasing Plans of Power Generation and Power Utilization,” “Implementation Opinions on Promoting Power-Sales Side Reform,” and “Guidance Opinions on Reinforcing and Regulating Supervision and Management of Coal-Fired Self-Generation Power Plants,” which set out further requirements and implementation steps in relation to the reform of electric power system. Towards the end of 2016, NDRC promulgated “Measures of Electricity Pricing for Transmission-Distribution Grid at the Provincial Level,” which established a regulatory framework of electricity transmission and distribution pricing.
Regulations Concerning Imports and Exports of Alumina and Primary Aluminum
Import taxes on alumina and primary aluminum have been eliminated. The export tariff on certain primary aluminum products has been 15% since August 1, 2007.
Environmental Protection Laws and Regulations
The Ministry of Environmental ProtectionEcology and Environment of China is responsible for supervision and administration of environmental protection in China. It formulates national environmental quality and discharge standards and monitors China’s environmental system. Environmental protection bureausBureau of Ecology and Environment at the countymunicipal level or above are responsible for environmental protection within their respective jurisdictions.
Environmental regulations require each enterprise to file an environmental impact report with the relevant environmental bureauBureau of Ecology and Environment for approval before undertaking the construction of a new production facility or any major expansion or renovation of an existing production facility. New facilities built pursuant to this approval are not permitted to operate until the relevant environmental bureau has performed an inspection and concluded that the facilities are in compliance with environmental standards.
The Environmental Protection Law requires any facility that produces pollutants or other hazards to incorporate environmental protection measures in its operations and establish an environmental protection responsibility system. Such system includes adoption of effective measures to control and properly dispose of waste gases, waste water, waste residue, dust or other waste materials. Any entity that discharges pollution must register with the relevant environmental protection authority. In 2016, Circular of the General Office of the State Council on the Implementing Plan for the Permit System for Controlling the Discharge of Pollutants was issued, pursuant to which enterprises that discharge pollutants need to obtain permits from relevant environment authority.
Penalties for breaches of the Environmental Protection Law include warning, payment of damages and imposition of fines. Any entity undertaking a construction project that fails to install pollution prevention and control facilities in compliance with environmental standards for a construction project may be ordered to suspend production or operations or to cease operations and may be fined. Criminal liability may be imposed for a material violation of environmental laws and regulations that causes any significant loss of property or personal injuries or death.
On December 25, 2016, the PRC government promulgated the Environmental Protection Tax Law, which became effective from January 1, 2018. The Environmental Protection Tax Law imposes environmental protection tax to enterprises, entities, producers or operators which discharge taxable pollutants into air, water or lands. Taxable pollutants include air pollutants, water pollutants, solid wastes and noises. The environmental protection tax is collected by tax authority and levied in accordance with a table attached to the Environmental Protection Tax Law. However, enterprises, entities, producers or operators that directly emit taxable pollutants into the centralized sewage and domestic waste treatment facilities or store or dispose of solid wastes in facilities or places that meet the national or local environmental protection standard are exempted from the Environment Protection Tax.
Mineral Resources Laws and Regulations
All mineral resources in China are owned by the state under the current Mineral Resources Law. Exploration, exploitation and mining operations must comply with the relevant provisions of the Mineral Resources Law and are under the supervision of the Ministry of Land andNatural Resources. Exploration and exploitation of mineral resources are also subject to examination and approval by the Ministry of Land andNatural Resources or relevant local authorities. Upon approval, the relevant administrative authorities, which are responsible for supervision and inspection of mining exploitation in their jurisdiction, will issue an exploration permit or mining permit. The holders of mining rights are required to file with the relevant administrative authorities annually.
The PRC government permits mine operators of collectively owned mines to exploit mineral resources in designated areas and individuals to mine scattered mineral resources. Such mine operators and individuals are subject to government regulation. Mining activities by individuals are restricted. Individuals are not permitted to exploit mineral reserves allocated for exploitation by a mining enterprise or company, or specified minerals prescribed by the state for protective mining. Indiscriminate mining that damages mineral resources is prohibited.
If mining activities result in damage to arable land, grassland or afforested area, the mining operator must take measures to return the land to an arable state within the prescribed time frame. Any entity or individual which fails to fulfil its remediation obligations may be fined and denied application for land use rights for new land by the relevant land and natural resources authorities.
It is unlawful for an entity or individual to conduct mining operations in areas designated for other legal mining operators. A mining operator whose exploitation causes harm to others in terms of production or in terms of living standards is liable for compensation and is required to take necessary remedial measures. When a mine is closed, a mine closure report and information concerning the mining facilities, hidden dangers, remediation and environmental protection must be submitted for examination and approval in accordance with the relevant PRC law and regulations.
Mineral products that have been illegally extracted and the related income derived from such activities may be confiscated and may result in fines, revocation of the mining permit and, in serious circumstances, criminal liability.
Energy Conservation Law
The amended Energy Conservation Law came into effect on July 2, 2016.October 26, 2018. It sets out the general principles for reducing energy waste and improving efficiency of energy consumption. It urges the adjustment of industry structure and replacement of high energy consumption projects with new energy or renewable energy resources. It provides that an energy conservation assessment and review system shall apply to newly investment projects and where a project does not meet the mandatory energy conservation standards, the project cannot be constructed. If a project that does not meet the mandatory energy conservation standards has been completed, it cannot be put into use.
In March 2014, the MIIT issued a regulation, the “Opinion on Implementing Supervision of Industrial Energy Conservation,” which lists the primary aluminum smelting as one of the high energy consumption operations that will be strictly monitored. In December 2014, the MIIT issued the Guidance for National Industrial Efficiency, which sets forth industrial efficiency standards for producers of major products in industries that involve high energy consumption, which included electrolyticprimary aluminum and aluminum oxidealumina products.
Regulations Concerning Electrolytic Aluminum Industry
In June 2016, the General Office of the State Council promulgated “Guiding Opinions on Creating a Favorable Market Environment and Promoting the Non-Ferrous Metals Industry to Adjust Structure, Advance Transformation and Increase Efficiency,” under which the construction of new electrolytic aluminum projects and the reconstruction or expansion of existing electrolytic aluminum projects would be approved only if such construction, reconstruction or expansion would introduce new electrolytic aluminum production capacity in an amount equal to or smaller than the amount of existing electrolytic aluminum production capacity to be replaced by such construction, reconstruction or expansion.
In April 2017, NDRC, MIIT, the Ministry of Land and Resources (now known as Ministry of Natural Resources) and the Ministry of Environmental Protection (now known as Ministry of Ecology and Environment) jointly issued the “Notice Regarding the Plan on Special Action for Clean-up and Rectification of Projects in Violation of Laws and Regulations in the Electrolytic Aluminum Industry,” which sets forth a comprehensive plan to inspect electrolytic aluminum projects and rectify violations of applicable laws or regulations revealed in the inspection.
On January 1, 2018, MITT issued the “Notice Regarding Electrolytic Aluminum Enterprises to Realize Capacity Replacement by Acquisition, Merger and Restructure”, which requires electrolytic aluminum enterprises to achieve capacity replacement by acquisition, merger or capacity transferring and exchange of capacity quotas with its group companies.
Tax Laws and Regulation
In March 2007, the PRC government promulgated the Enterprise Income Tax Law which became effective from January 1, 2008. The Enterprise Income Tax Law imposes a single income tax rate of 25% on both domestic and foreign invested enterprises. Pursuant to the Enterprise Income Tax Law, important high- and new-tech enterprises that are necessary to be supported by the state are subject to a reduced enterprise income tax rate of 15%. Certain branches and subsidiaries of us were granted tax concessions including preferential tax rates of 15%. On December 6, 2007, PRC government promulgated the Enterprise Income Tax Law Implementation Rules which also became effective on January 1, 2008.
In March 2016, the Ministry of Finance (the “MOF”)MOF and the State Administration of Taxation (the “SAT”)SAT jointly promulgated “Notice“Circular on ImplementingComprehensively Promoting the Pilot Program of Replacingthe Collection of Value-added Tax in Lieu of Business Tax, with Value-Added Tax in an All-round Manner,” pursuant to which we are allowed to deduct input tax from output tax according to the amount set forth in the special value-added tax invoices obtained from our purchases of services, intangible assets or real estate. On April 4, 2018, the MOF and the SAT issued the Circular on Adjusting Value-added Tax Rates, which became effective on May 1, 2018. Pursuant to this circular, for sale or import of goods, the previous applicable value-added tax rate 17% and 11% were adjusted to 16% and 10% respectively.
C. | Organizational Structure |
On March 20, 2019, the MOF, the SAT and the General Administration of Customs jointly issued the Announcement on Policies for Deepening Reform of Value-added Tax, which became effective on April 1, 2019. Pursuant to this announcement, for sales or import of goods by a general taxpayer that were previously subject to value added tax at the rate of 16%, the applicable tax rate has been adjusted to 13%, and for those previously subject to value added tax at the rate of 10%, the applicable tax rate has been adjusted to 9%.
C. Organizational Structure
Set out below is a chart illustrating our corporate structure as of March 31, 2018:2019:

Below sets forth further information of our principal subsidiaries as of December 31, 2017:2018:
Company | Percentage of
ownership interest
attributable to the
Company | Principal activities |
| Baotou Aluminum Co., Ltd. | 74.33% | Manufacture and distribution of primary aluminum, aluminum alloy and related fabricated products and carbon products |
Company | Percentage of ownership interest attributable to the Company | Principal activities |
| Chalco Hong Kong Ltd.(1) | 100.00% | Overseas investments and alumina import and export activities |
Chalco Zunyi Alumina Co., Ltd. | 73.28% | Manufacture and distribution of alumina |
| China Aluminum International Trading Co., Ltd. | 100.00% | Trading, importImport and export activities |
| Chalco Mining Co., Ltd. | 18.86% | Manufacture, acquisition and distribution of bauxite mines, limestone ore, manufacturing and distribution of alumina |
Company
| Percentage of
ownership interest
attributable to the
Company
| Principal activities
and carbon products |
| Shandong Huayu Alloy Materials Co., Ltd. | 55.00% | Manufacture and distribution of aluminum alloy |
| Chinalco Shanxi Jiaokou Xinghua Technology Ltd.(2) | 66%66.00% | Manufacture and distribution of aluminaprimary aluminum |
| Chalco Shanghai Company Limited | 100.00% | Trading and engineering project management |
| Shanxi Huasheng Aluminum Co., Ltd. | 51.00% | Manufacture and distribution of primary aluminum, aluminum alloy and carbon-related products |
| Chalco Shanxi New Material Co., Ltd. | 85.98% | Manufacture and distribution of alumina, primary aluminum alloy and anode carbon products and electricity generation and supply |
| Zunyi Aluminum Co., Ltd. | 62.10%67.445% | Manufacture and distribution of primary aluminum and alumina |
| Chalco Energy Co., Ltd. | 100.00% | Thermoelectric supply and investment management |
| China Aluminum Ningxia Energy Group Co., Ltd. | 70.82% | Thermal power, wind power and solar power generation, coal mining, and power related equipment manufacturing |
| Guizhou Huajin Aluminum Co., Ltd. | 60.00% | Manufacture and distribution of alumina |
| Chalco Zhengzhou Research Institute of Non-ferrous Metal Co., Ltd. | 100.00% | Research and development services |
| Chalco Shandong Co., Ltd. | 69.20% | Manufacture and distribution of alumina |
| Chalco Zhongzhou Aluminum Co., Ltd. | 63.10% | Manufacture and distribution of alumina |
| China Aluminum Logistics Group Corporation Co., Ltd. | 100.00% | Logistic transportation |
| Shanxi Huaxing Aluminum Co., Ltd.(3) | 100.00% | Manufacture and distribution of alumina |
| Shanxi China Huarun Co., Ltd. | 40.00% | Manufacture and distribution of primary aluminum |
| Guizhou Huaren New Material Co., Ltd. | 40.00% | Manufacture and distribution of primary aluminum |
| China Aluminum International Trading Group Co. Ltd. | 100.00% | Import and export activities |
| Chalco Materials Co. Ltd. | 100.00% | Purchase of materials |
| | |
| (1) | Chalco Hong Kong Ltd. is incorporated in Hong Kong. All other principal subsidiaries are incorporated in the PRC. |
| (2) | We directly hold 33% shares and indirectly hold 33% shares, through Chalco Shandong Co., Ltd. |
D. | Property, Plants(3) | We directly hold 60% shares and Equipmentindirectly hold 40% shares, through Chalco Hong Kong Ltd. |
D. Property, Plants and Equipment
Mines
Bauxite Mines
The following map sets forth details of the area surrounding our largest bauxite mine in China, the Pingguo mine:
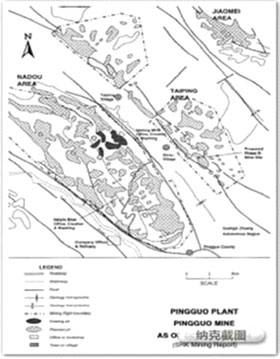
The Guangxi Pingguo plant, located in the Guangxi Zhuang Autonomous Region, commenced operations in 1994. The surrounding infrastructure includes roadways and waterways.
Modernization and Physical Condition, Equipment, Infrastructure and Other Facilities
We have modern facilities at our mines in China, which were designed by professional PRC mine design institutes and adhere to international standards. Our mines are either open pit or underground. Our mines generally have mining offices and transportation facilities that have access to local roads and highways. In addition, we utilize advanced heavy equipment such as bulldozers and scrapers.
Source of Power and Water
All of our mining facilities in China are connected to the local or regional electric power grids. In addition, our mining facilities are connected to reliable water sources, all of which were sufficient for the requirements of each individual mine.
Our mines in Indonesia have access to local roads. Prior to suspension of productions, the two mines were powered by diesel fuel and are equipped with washing machines.
Coal Mines
We acquired 70% of the equity interest in Gansu Huayang in March 2011, which holds exploration rights for Luochuan mine. TheWe renewed the exploration permit in March 2019, which will expire in October 2018.2020. Luochuan mine is an underground mine. We have completed the exploration but have not commenced development of Luochuan mine. As of the date of this annual report, neither proven nor probable reserves have been established in accordance with United States Securities and Exchange Commission Industry Guide 7 (“Industry Guide 7”).
We acquired the mining rights for Laodonghe mine, in January 2013 through Chalco Guizhou Mining Co., Ltd. We hold 80.0% of the equity interest of Laodonghe mine. The mining permit will expireexpired in December 2018. We have completed the exploration but have not commenced development of Laodonghe mine. Laodonghe mine is an underground mine. As of the date of this annual report, neither proven nor probable reserves have been established in accordance with Industry Guide 7.
We completed the acquisition of 70.82% of the equity interest in Ningxia Energy in January 2013, which holds mining rights or exploration rights for certain coal deposits in Ningxia Autonomous Region. The coal mines owned and operated by Ningxia Energy include Wangwa mine, Wangwa No.2 mine, Yindonggou mine and Yinxingyijing mine, all of which are underground thermal coal mines. The operations at these coal mines are powered by electricity from local power grids and are accessible by public roads. As of the date of this annual report, neither proven nor probable reserves have been established in accordance with Industry Guide 7.
Wangwa mine, Wangwa No. 2 mine and Yindonggou mine are currently in extraction stage. We primarily use comprehensive mechanized longwall mining method to extract coal from Wangwa mine, Wangwa No. 2 mine and Yindonggou mine and we use advanced coal mining equipment including hydraulic roof supports and shearers. In addition, Ningxia Energy holds 50% of interest in Yinxingyijing mine while the other joint owner in Yinxingyijing mine does not participate in its operation. Yinxingyijing mine is currently in trial production. The exploration permit of Yinxingyijing mine will expireexpired in August 2018. We2018 and we obtained the mining permit in February 2018, and itwhich will expire in February 2048.
The following table sets forth detailed information on Wangwa mine, Wangwa No. 2 mine and Yindonggou mine:
| | Wangwa mine | Wangwa No. 2 mine | Yindonggou mine |
Nature of Ownership | Owned and operated by
Ningxia Energy, a
70.82% subsidiary of Chalco | Owned and operated by
Ningxia Energy, a
70.82% subsidiary of Chalco | Owned and operated by
Ningxia Energy, a
70.82% subsidiary of Chalco |
| Commencement of construction | 1984(1) | 2007 | 2010 |
| Commencement of extraction | 1990(1) | 2010 | 2016 |
| Permit renewal | November 2046 | June 2032 | July 2036 |
| Mining recovery rate(%)(2) | 78 | 81 | 76 |
| Depth of mine(meters underground) | 400 | 400 | 478 |
| Average thickness of main coal seam(meters) | 6-11 | 8-10 | 2-8 |
| Calorific value(Kcal/kg) | 4,900-5,100 | 4,800-5,000 | 4,600-4,900 |
| Sulphur content(%) | 1.1 | 1.2 | 1.12 |
| Average ash content(%) | 14.2 | 15.3 | 12.2 |
| | Wangwa mine | Wangwa No. 2 mine | Yindonggou mine |
Nature of Ownership | Owned and operated by Ningxia Energy, a 70.82% subsidiary of Chalco | Owned and operated by Ningxia Energy, a 70.82% subsidiary of Chalco | Owned and operated by Ningxia Energy, a 70.82% subsidiary of Chalco |
| Commencement of construction | 1984(1) | 2007 | 2010 |
| Commencement of extraction | 1990(1) | 2010 | 2016 |
| Permit renewal | November 2046 | June 2032 | July 2036 |
| Mining recovery rate(%)(2) | 78 | 81 | 76 |
| Depth of mine(meters underground) | 400 | 400 | 478 |
| Average thickness of main coal seam(meters) | 6-11 | 8-10 | 2-8 |
| Calorific value(Kcal/kg) | 4,900-5,100 | 4,800-5,000 | 4,600-4,900 |
| Sulphur content(%) | 1.1 | 1.2 | 1.12 |
| Average ash content(%) | 14.2 | 15.3 | 12.2 |
| | |
| (1) | Wangwa mine is currently under construction for expansion, the original production capacity of which was 1.5 million tonnes.expansion. |
| (2) | The mining recovery rate is the rate of the amount of coal recovered from a determined amount of reserves, which is calculated by dividing the actual volume of coal recovered in a year by the volume of reserves mined and consumed in the same year. |
For the year ended December 31, 2017,2018, Ningxia Energy incurred capital expenditures of approximately RMB1,385 millionRMB1.2 billion on infrastructure construction.
Land
Chinalco leases to us 401414 pieces or parcels of land, located in eight provinces, covering an aggregate area of approximately 47.3953.56 million square meters for any purpose related to our operations and businesses. Currently, all leases for our properties are valid and have not expired. The leased land mainly consists of:
389 pieces of allocated land with an area of approximately 46.09 million square meters. Chinalco has obtained authorization from the relevant administrative authorities to manage and lease the land use rights for such land; and
12 pieces of land with an area of approximately 1.3 million square meters. Chinalco has paid the land premiums and obtained land use rights certificates.
| ● | 402 pieces of allocated land with an area of approximately 52.26 million square meters. Chinalco has obtained authorization from the relevant administrative authorities to manage and lease the land use rights for such land; and |
| ● | 12 pieces of land with an area of approximately 1.30 million square meters. Chinalco has paid the land premiums and obtained land use rights certificates. |
The land is leased for the following terms:
allocated land: 50 years commencing from July 1, 2001 (except for land use rights of mines operated by us, whose leased terms shall end on the expiration date of the mining rights or at the end of the actual mine life, whichever is earlier);
granted land: until expiration of the relevant land use right permits; and
for both allocated or granted land: normal commercial terms that stipulate, among other conditions, the terms of use, monthly or annual rental amounts payable in RMB and a six-month notification provision for termination of any lease agreement.
| ● | allocated land: 50 years commencing from July 1, 2001 (except for land use rights of mines operated by us, whose leased terms shall end on the expiration date of the mining rights or at the end of the actual mine life, whichever is earlier); |
| ● | granted land: until expiration of the relevant land use right permits; and |
| ● | for both allocated or granted land: normal commercial terms that stipulate, among other conditions, the terms of use, monthly or annual rental amounts payable in Renminbi and a six-month notification provision for termination of any lease agreement. |
Buildings
Our principal executive offices, which we lease from Chinalco, are located at No. 62 North Xizhimen Street, Haidian District, Beijing, People’s Republic of China, 100082.
Pursuant to the reorganization in connection with our initial public offering in 2001, Chinalco transferred to us, among other operating assets, ownership of the buildings and properties for the operation of our core businesses. Chinalco retained its remaining buildings and properties for its operations. The buildings transferred to us comprise 4,631 buildings with an aggregate gross area of approximately 4.2 million square meters. These buildings may be sold or transferred only with the consent of Chinalco and in accordance with applicable land transfer procedures. Chinalco has undertaken to provide its consent and the necessary assistance to affect land grant procedures to ensure that our buildings can be legally transferred or sold.
We and Chinalco also lease to each other a number of other buildings and properties for ancillary uses, which comprise mainly buildings for offices, dormitory, canteen and storage purposes. As of the date of this annual report, we leased 302129 buildings to Chinalco, with an aggregate gross area of approximately 301,671549,407 square meters, while Chinalco leased 10992 buildings to us, with an aggregate gross area of approximately 222,588163,437 square meters. In March 2016,June 2018, we and China Aluminum Investment and Development Co., Ltd,Ltd., a wholly-owned subsidiary of Chinalco, renewed a tenancy agreement pursuant to which we would lease from Chinalco the office premises at 12th to 16th floors and 18th to 31stcertain floors of No. 62 North Xizhimen Street, Haidian District, Beijing, PRC, with an aggregate gross floor area of 22,28522,303 square meters. This agreement expiredwill expire on December 31, 2017. We are in the process of renewing the tenancy agreement with China Aluminum Investment and Development Co., Ltd.2021.
Our Expansion
Our expansion projects in 20172018 primarily include:
| ● | Capacity expansion and technology upgrade of Wangwa mine: The project is planned to have a total annual capacity of 6 million tonnes. We expect to invest a total amount of approximately RMB3,063 million in this project. By the end of 2018, investment in project construction amounted to RMB1,462 million. The construction of the project is under the final acceptance procedures by the end of 2018 and is expected to be officially completed by the end of 2019. |
Capacity expansion and technology upgrade of Wangwa mine: The project is planned to have a total annual capacity of 6 million tonnes. We expect to invest a total amount of approximately RMB3,063 million in this project. By the end of 2017, investment in project construction amounted to RMB1,175 million. The project is under construction and planned to be completed by the end of 2018.
The 500,000-tonne aluminum alloy product structure adjustment, upgrade and technical innovation project of Inner Mongolia Huayun: We expect to invest a total amount of approximately RMB6,450 million in this project. By the end of 2017, an aggregate of RMB3,375 million of capital expenditure had been incurred. The project has been officially put into operation.
The 400,000-tonne light alloy material project of Guangxi Hualei New Material Co., Ltd.: We expect to invest a total amount of approximately RMB6,200 million in this project. By the end of 2017, an aggregate of RMB5,132 million of capital expenditure had been incurred. Production facilities relating to light alloy manufacturing and power generation was put into operation in batches towards the end of 2017.
The 400,000-tonne project of Guizhou Huaren New Materials Company Limited: We expect to invest a total amount of approximately RMB2,957 million in this project. By the end of 2017, an aggregate of RMB2,897 million of capital expenditure had been incurred. Production capacity of 300,000 tonnes has been put into operation and another 100,000 tonnes of production capacity is expected to be put into operation in the first half of 2018.
| ● | The 400,000-tonne light alloy material project of Guangxi Hualei New Material Co., Ltd.: We expect to invest a total amount of approximately RMB5,939 million in this project. By the end of 2018, an aggregate of RMB5,174 million of capital expenditure had been incurred. The project has been completed and put into operation with all of the three units connected to the grid to start power generation by the end of 2018. |
| ● | The Boffa Project: The total investment of this project is currently expected to be US$706 million. By the end of 2018, an aggregate of US$64 million of capital expenditure had been incurred. The project commenced construction in September 2018 and planned to be put into operation by the end of March 2020 with an expected annual bauxite output of 12 million tonnes. |
| ● | The 2,000,000-tonne alumina project of Guangxi Huasheng New Material Co., Ltd.: We expect to invest a total amount of approximately RMB5,805 million in this project. By the end of 2018, an aggregate of RMB330 million of capital expenditure had been incurred. The thermoelectric and finished products warehousing area, the decomposition and sedimentation area, the evaporation and recycled water area and the fundamental civil engineering in front of plant are under construction. We plan to put the project into operation by mid-2020. |
| ● | The 500,000-tonne aluminum alloy product structure adjustment, upgrade and technical innovation project of Inner Mongolia Huayun: We expect to invest a total amount of approximately RMB6,450 million in this project. By the end of 2018, an aggregate of RMB5,640 million of capital expenditure had been incurred. The project has been officially put into operation. |
| ● | The 432,000-tonne light alloy project of Shanxi Zhongrun: We expect to invest a total amount of approximately RMB3,909 million in this project. By the end of 2018, an aggregate of RMB2,660 million of capital expenditure had been incurred. As of the end of 2018, the project had been completed and partially put into operation. |
Item 4A. Unresolved Staff Comments
None.
Item 5.Operating and Financial Review and Prospects
The following discussion and analysis should be read in conjunction with our audited consolidated financial statements and selected historical financial data, in each case together with the accompanying notes included elsewhere in this annual report. This section contains certain “forward-looking statements” within the meaning of the United States Private Securities Litigation Reform Act of 1995. Forward-looking statements are not guarantees of our future performance or results and our actual results could materially differ from those disclosed in the forward-looking statements. In evaluating our business, you should carefully consider the information provided in “Item 3. Key Information - D. Risk Factors.”
As the business combination under common control incurred in the years ended December 31, 2015, 2016, 2017 and 2017,2018, the comparative financial data for the years ended December 31, 2013, 2014, 2015, 2016 and 20162017 are revised to reflect the business combination under common control. Unless otherwise indicated in this section, our financial data for the years ended December 31, 20152016 and 20162017 are presented based on those revised amounts. Please see Note 38 to our audited consolidated financial statements.
Overview
We are a leading enterprise in the non-ferrous metal industry in China. We are engaged principally in alumina refining, primary aluminum smelting, and trading of non-ferrous metal products, coal products and other products. In addition, we are engaged in coal mining and power generation. The remainder of our revenues was derived from research and development activities and other products and services. We organize and manage our operations according to the following key segments:
Our alumina segment, which consists of the mining and purchasing of bauxite and other raw materials, and production and sale of alumina as well as alumina-related products, such as alumina hydrate, alumina-based chemical products and gallium. Alumina accounted for approximately 81.8% of the total production volume for this segment in 2017. Chemical alumina products are used in the production of chemical, pharmaceutical, ceramic and construction materials. In the process of refining bauxite into alumina, we also produce gallium as a by-product. Gallium is a rare, high-value metal with applications in the electronics and telecommunication industries.
Our primary aluminum segment, which consists of the procurement of alumina, other raw materials, supplemental materials and electrical power, the production and sale of primary aluminum and aluminum-related products, such as carbon products, aluminum alloy products and other electrolytic aluminum products. Our principal primary aluminum products are ingots, molten aluminum and aluminum alloys which accounted for approximately 24%, 44% and 32%, respectively, of our total production volume of primary aluminum in 2017. Our standard 20 kilogram remelt ingots are used for general aluminum fabrication in the construction, electricity, electronics, transportation, packaging, machinery and durable goods industries. We internally produce substantially all the carbon products used at our smelters and sell our remaining carbon products to external customers.
Our trading segment, which mainly consists of the trading of alumina, primary aluminum, other non-ferrous metal products, and crude fuels such as coal products, as well as supplemental materials to our internal manufacturing plants and external customers. We established our trading business under Chalco Trading as a separate segment in July 2010 as a result of our operational structural adjustment.
Our energy segment, which consists of coal mining and power generation, including conventional coal-fire power generation and renewable energy generation such as wind power and photovoltaic power. We are also engaged in new energy equipment production. We established our energy segment in January 2013 as a result of our acquisition of Ningxia Energy in line with our development strategy to partially offset our future energy costs and secure a portion of the coal we consume in our operations. In 2017, we supplied the majority of the electricity we generated for our own production use, supplied a portion of the coal output to our own electric power plant and sold the remaining portion to external customers, including power generation enterprises and cement plants.
Our corporate and other operating segment, which consists of corporate and other aluminum-related research, development, and other activities of the Group.
| ● | Our alumina segment, which consists of the mining and purchasing of bauxite and other raw materials, and production and sale of alumina as well as chemical alumina and metal gallium. Alumina accounted for approximately 88.88% of the total production volume for this segment in 2018. Chemical alumina products are used in the production of chemical, pharmaceutical, ceramic and construction materials. In the process of refining bauxite into alumina, we also produce gallium as a by-product. Gallium is a rare, high-value metal with applications in the electronics and telecommunication industries. |
| ● | Our primary aluminum segment, which consists of the procurement of alumina, other raw materials, supplemental materials and electrical power, the production and sale of primary aluminum and aluminum-related products, such as carbon products, aluminum alloy products and other aluminum products. Our principal primary aluminum products are ingots, molten aluminum and aluminum alloys, which accounted for approximately 29%, 39% and 32%, respectively, of our total production volume of primary aluminum in 2018. Our standard 20 kilogram remelt ingots are used for general aluminum fabrication in the construction, electricity, electronics, transportation, packaging, machinery and durable goods industries. We internally produce substantially all the carbon products used at our smelters and sell our remaining carbon products to external customers. |
| ● | Our trading segment, which mainly consists of the trading of alumina, primary aluminum, aluminum fabrication products, other non-ferrous metal products, and crude fuels such as coal products, as well as supplemental materials and logistics and transport services to our internal manufacturing plants and external customers. We established our trading business under Chalco Trading as a separate segment in July 2010 as a result of our operational structural adjustment. Since 2014, we have established China Aluminum International Trading Group Co. Ltd., Chalco Materials Co. Ltd. and China Aluminum Logistics Group Corporation Co., Ltd. to continuously promote and deepen development of our trading business, jointly constituting our trading segment. |
| ● | Our energy segment, which consists of the research and development, production and operation of energy products, including coal mining and conventional coal-fire power generation as well as renewable energy generation such as wind power and solar power. We are also engaged in new energy equipment production. We established our energy segment in January 2013 as a result of our acquisition of Ningxia Energy in line with our development strategy to partially offset our future energy costs and secure a portion of the coal we consume in our operations. In 2018, we supplied the majority of the electricity we generated for our own production use, supplied a portion of the coal output to our own electric power plant and sold the remaining portion to external customers. |
| ● | Our corporate and other operating segment, which consists of corporate and other aluminum-related research, development, and other activities of the Group. |
We used to be engaged in aluminum fabrication operations, where we processed primary aluminum for the production and sales of various aluminum fabrication products. As approved at our 2012 annual general meeting held on June 27, 2013, we disposed of substantially all of our aluminum fabrication operations to Chinalco. As a result, we ceased to have ouroperate aluminum fabrication business as a separate segment in June 2013.
Critical Accounting Policies
We prepare our consolidated financial statements in accordance with IFRS as issued by the IASB,International Accounting Standards Board, which requires the use of certain critical accounting estimates. It also requires management to exercise its judgment in the process of applying the accounting policies. The areas in our financial reporting involving a higher degree of judgment or complexity, or areas where assumptions and estimates are significant to the consolidated financial statements, are disclosed in Note 3 to our consolidated financial statements. We have established procedures and processes to facilitate the making of such judgments in the preparation of our consolidated financial statements. Management has used the best information available but actual performance may differ from our management’s estimates and future changes in key variables could change future reported amounts in our consolidated financial statements.
Property, Plant and Equipment - recoverable amount
Property, plant and equipment, other than construction in progress (“CIP“CIP”), are stated at cost less accumulated depreciation and any impairment losses. When an item of property, plant and equipment is classified as held for sale or when it is part of a disposal group classified as held for sale, it is not depreciated and is accounted for in accordance with IFRS 5. The cost of an item of property, plant and equipment comprises its purchase price and any directly attributable costs of bringing the asset to its working condition and location for its intended use.
Expenditure incurred after items of property, plant and equipment have been put into operation, such as repairs and maintenance, is normally charged to profit or loss in the period in which it is incurred. In situations where the recognition criteria are satisfied, the expenditure for a major inspection is capitalized in the carrying amount of the asset as a replacement. Where significant parts of property, plant and equipment are required to be replaced at intervals, we recognize such parts as individual assets with specific useful lives and depreciatesdepreciate them accordingly.
We calculate depreciation on the straight-line basis to write off the cost of each item of property, plant and equipment to its residual value over its estimated useful life. The principal annual rates used for this purpose are as follows:
| Buildings | 8-45 years |
| Machinery | 3-30 years |
| Transportation facilities | 6-10 years |
| Office and other equipment | 3-10 years |
We reviewed and adjusted the assets’ depreciation method, residual values and useful lives, if appropriate, at the end of each reporting period. An item of property, plant and equipment including any significant part initially recognized is derecognized upon disposal or when no future economic benefits are expected from its use or disposal. Any gain or loss on disposal or retirement recognized in profit or loss in the year the asset is derecognized is the difference between the net sales proceeds and the carrying amount of the relevant asset.
CIPrepresents buildings under construction, and plant and equipment pending for installation, and is stated at cost less any impairment losses. Cost comprises construction expenditures, other expenditures necessary for the purpose of preparing the CIP for its intended use and those borrowing costs incurred before the assets are ready for their intended use that is eligible for capitalization. CIP is transferred to property, plant and equipment when the CIP is ready for its intended use.
Intangible assets - goodwill
Goodwill is initially measured at cost, being the excess of the aggregate of the consideration transferred, the amount recognized for non-controlling interests and any fair value of our previously held equity interests in the acquiree over the identifiable net assets acquired and liabilities assumed. If the sum of this consideration and other items is lower than the fair value of the net assets acquired, the difference is, after reassessment, recognized in profit or loss as a gain on bargain purchase.
For the purposes of impairment testing, goodwill acquired in a business combination is allocated to each of the cash-generating units, or groups of cash-generating units, that is expected to benefit from the synergies of the combination. Each unit or group of units to which the goodwill is allocated represents the lowest level within the entity at which the goodwill is monitored for internal management purposes. Goodwill is monitored at the operating segment level.
Goodwill impairment reviews are undertaken annually or more frequently if events or changes in circumstances indicate a potential impairment. Impairment is determined by assessing the recoverable amount of the cash-generating unit to which the goodwill relates. Where the recoverable amount of the cash-generating unit is less than the carrying amount, an impairment loss is recognized. An impairment loss recognized for goodwill is not reversed in a subsequent period. Any impairment is recognized immediately as an expense and is not subsequently reversed.
Intangible assets - mining rights and mineral exploration rights
Our mineral exploration rights and mining rights relate to coal, bauxite and other mines.
| (i) | Recognition |
| | |
| | Mineral exploration rights and mining rights are initially recorded at the cost which includes the acquisition consideration, qualifying exploration and other direct costs. The mineral exploration rights are stated at cost less any impairment, and the mining rights are stated at cost less any amortization and impairment. |
| | |
Mineral exploration rights and mining rights are initially recorded at the cost which includes the acquisition consideration, qualifying exploration and other direct costs. The mineral exploration rights are stated at cost less any impairment, and the mining rights are stated at cost less any amortization and impairment.
Mineral exploration rights are converted to mining rights when technical feasibility and commercial viability of extracting a mineral resource are demonstrable. Mineral exploration rights are subject to amortization when commercial production has commenced.
We assess the stage of each mine under construction to determine when a mine moves into the production stage. The criteria used to assess the start date are determined based on the unique nature of each mine construction project. We consider various relevant criteria, such as completion of a reasonable period of testing of the mine and equipment, ability to produce in saleable form (within specifications) and ability to sustain ongoing production to assess when a mine is substantially complete and ready for its intended use.
| | Mineral exploration rights are converted to mining rights when technical feasibility and commercial viability of extracting a mineral resource are demonstrable. Mineral exploration rights are subject to amortization when commercial production has commenced. |
| | |
| | We assess the stage of each mine under construction to determine when a mine moves into the production stage. The criteria used to assess the start date are determined based on the unique nature of each mine construction project. We consider various relevant criteria, such as completion of a reasonable period of testing of the mine and equipment, ability to produce in saleable form (within specifications) and ability to sustain ongoing production to assess when a mine is substantially complete and ready for its intended use. |
| | |
| (iii) | Amortization |
Amortization of bauxite and other mining rights (except for coal mining rights) is provided on a straight-line basis according to the shorter of the expiration date of the mining certificate and the mineable period of natural resources. Estimated mineable periods of the majority of the mining rights range from 3 to 30 years.
Coal mining rights are amortized on a unit-of-production basis over the economically recoverable reserves evaluated based on the reserves estimated in accordance with the standards in the Solid Mineral Resource/Reserve Classification of the PRC (GB/T17766-1999) of the mine concerned.
| | |
| | Amortization of bauxite and other mining rights (except for coal mining rights) is provided on a straight-line basis according to the shorter of the expiration date of the mining certificate and the mineable period of natural resources. Estimated mineable periods of the majority of the mining rights range from 3 to 30 years. |
| | |
| | Coal mining rights are amortized on a unit-of-production basis over the economically recoverable reserves evaluated based on the reserves estimated in accordance with the standards in the Solid Mineral Resource/Reserve Classification of the PRC (GB/T17766-1999) of the mine concerned. |
| | |
| (iv) | Impairment |
| | |
| | An impairment review is performed when there are indicators that the carrying amount of the mineral exploration rights and mining rights may exceed their recoverable amounts. To the extent that this occurs, the excess is fully provided as an impairment loss. |
An impairment review is performed when there are indicators that the carrying amount of the mineral exploration rights and mining rights may exceed their recoverable amounts. To the extent that this occurs, the excess is fully provided as an impairment loss.
Non-current assets and disposal groups held for sale
Non-current assets and disposal groups are classified as held for sale if their carrying amounts will be recovered principally through a sales transaction rather than through continuing use. For this to be the case, the asset or disposal group must be available for immediate sale in its present condition subject only to terms that are usual and customary for the sale of such assets or disposal groups and its sale must be highly probable. All assets and liabilities of a subsidiary classified as a disposal group are reclassified as held for sale regardless of whether the Group retains a non-controlling interest in its former subsidiary after the sale.
Non-current assets and disposal groups (other than financial assets) classified as held for sale are measured at the lower of their carrying amounts and fair values less costs to sell. Property, plant and equipment and intangible assets classified as held for sale are not depreciated or amortized.
Provision for expected credit losses on trade receivables
We use a provision matrix to calculate expected credit losses for trade receivables. The provision rates are based on days past due for groupings of various customer segments that have similar loss patterns (i.e., by product type, customer type, and coverage by letters of credit and other forms of credit insurance).
The provision matrix is initially based on our historical observed default rates. We will calibrate the matrix to adjust the historical credit loss experience with forward-looking information. For instance, if forecast economic conditions (i.e. gross domestic products) are expected to deteriorate over the next year which can lead to an increased number of defaults in the manufacturing sector, the historical default rates are adjusted. At each reporting date, the historical observed default rates are updated and changes in the forward-looking estimates are analyzed.
The assessment of the correlation among historical observed default rates, forecast economic conditions and expected credit losses is a significant estimate. The amount of expected credit losses is sensitive to changes in circumstances and forecast economic conditions. Our historical credit loss experience and forecast of economic conditions may also not be representative of the customer’s actual default in the future. The information about the expected credit losses on our trade receivables is disclosed in Note 14 to our consolidated financial statements.
Estimated impairment of trade and other receivables and inventories
A provision for impairment of trade and other receivables is established when there is objective evidence that we will not be able to collect all amounts due according to the original repayment terms of the receivables. Significant financial difficulties of the debtor, probability that the debtor will enter bankruptcy or financial reorganization, and default or delinquency in payments are considered as indicators that a trade receivable is impaired. The amount of provision is the difference between the asset’s carrying amount and the present value of estimated future cash flows, discounted at the original effective interest rate. Cash flows relating to trade and other receivables are discounted if the effect of discounting is material. The carrying amount of the asset is reduced through the use of an allowance account and the amount of the loss is recognized in profit or loss. When a trade and other receivable is uncollectible, it is written-off against the allowance account for trade and other receivables. Subsequent recoveries of amounts previously written-off are recognized as income in profit or loss. The impairment is subject to our management’s assessment at the end of the reporting period, and hence, the provision amount is subject to uncertainty.
In accordance with our accounting policy, ourour management tests whether inventories suffered any impairment based on estimates of the net realizable amount of the inventories. For different types of inventories, it requires the estimation on selling prices, costs of conversion, selling expenses and the related tax expense to calculate their net recoverable amount of inventories. For inventories held for executed sales contracts, our management estimates the net recoverable amount based on the contracted price; for other inventories, our management estimates the realizable future price based on the actual prices during the period from the end of the reporting period to the date that these financial statements were approved for issuance by our Board, taking into account the nature and balance of inventories and future estimated price trends. For raw materials and work-in-progress, our management has established a model in estimating the net recoverable amount at which the inventories can be realized in the normal course of business after considering our manufacturing cycles, production capacity and forecasts, estimated future conversion costs and selling prices. The management also takes into account the price or cost fluctuations and other related matters occurring after the end of the reporting period which reflect conditions that existed at the end of the reporting period.
It is reasonably possible that if there is a significant change in circumstances, including our business and the external environment, outcomes within the next financial year would be significantly affected.
Coal reserve estimates and units-of-production depreciation for coal mining rights
External qualified valuation professionals evaluate “economically recoverable reserves” based on reserves estimated by external qualified exploration engineers in accordance with the PRC standards. The estimates of our coal reserves are inherently imprecise and represent only the approximate amounts of the coal reserves because of the subjective judgments involved in developing such information. Economically recoverable reserve estimates are evaluated on a regular basis and have taken into account recent production and technical information about each mine.
Income Tax
We estimate our income tax provision and deferred income taxation in accordance with the prevailing tax rules and regulations, taking into account any special approvals obtained from the relevant tax authorities and any preferential tax treatment to which we are entitled in each location or jurisdiction in which we operate. There are many transactions and calculations for which the ultimate tax determination is uncertain during the ordinary course of business. We recognize liabilities for anticipated tax audit issues based on estimates of whether additional taxes will be due. Where the final tax outcome of these matters is different from the amounts that were initially recorded, such differences will impact the income tax and deferred income tax provisions in the period in which such determination is made.
Deferred tax assets are recognized for unused tax losses and deductible temporary differences, such as the provision for impairment of receivables, inventories and property, plant and equipment and accruals of expenses not yet deductible for tax purposes, to the extent that it is probable that taxable profits will be available against which the losses deductible temporary difference can be utilized. Significant management judgment is required to determine the amount of deferred tax assets that can be recognized, based upon the likely timing and level of future taxable profits together with future tax planning strategies. The carrying value of our deferred tax assets as of December 31, 20172018 was RMB1,661RMB1,542.6 million, compared with approximately RMB1,687RMB1,606.2 million as of December 31, 2016,2017, without taking into consideration the offsetting of the balances within the same tax jurisdiction. The amount of unrecognized tax losses as of December 31, 2017,2018, was RMB18,214RMB11,387.5 million, compared with approximately RMB21,991RMB18,213.6 million as of December 31, 2016.2017.
An entity shall recognize a deferred tax liability for all taxable temporary differences associated with investments in subsidiaries, associates and joint ventures, except to the extent that both of the following conditions are satisfied: (a) the parent, investor or joint venturer is able to control the timing of the reversal of the temporary difference; and (b) it is probable that the temporary difference will not reverse in the foreseeable future.
We believe that we have recorded adequate current tax provision and deferred taxes based on the prevailing tax rules and regulations and our current best estimates and assumptions. In the event that future tax rules and regulations or related circumstances change, adjustments to current and deferred taxation may be necessary which would impact our results or financial position.
Revenue recognition
| (i) | Applicable from January 1, 2018 - revenue from contracts with customers |
Revenue from contracts with customers is recognized when control of goods or services is transferred to the customers at an amount that reflects the consideration to which we expect to be entitled in exchange for those goods or services.
| ● | Revenue from the sales (including sales of scrap and other materials). Revenue from the sale of industrial products or scrap and other materials is recognized at the point in time when control of the asset is transferred to the customer, generally on delivery of the industrial products. |
| ● | Rendering of services. We recognize revenue from services over time, using an input method to measure progress towards complete satisfaction of the service, because the customer simultaneously receives and consumes the benefits we provide. Revenue is recognized on a straight-line basis because the entity’s inputs are expended evenly throughout the performance period. |
| (ii) | Applicable before January 1, 2018 |
We recognize revenue when the amount of revenue can be reliably measured, it is probable that future economic benefits will flow to us and specific criteria have been met for each of our activities (see descriptions below).
| (i)● | Sales of goods |
| | |
| | goods. Revenue from the sales of goods is recognized when we have already transferred the significant risks and rewards of ownership of the goodshave been transferred to the buyers,buyer, provided that we maintain neither managerial involvement to the degree usually associated with ownership, nor effective control over the goods sold. |
| | |
| | If we are acting solely as an agent, the related revenue is reported on a net basis. |
| | |
| (ii)● | Rendering of services |
| | |
| | services. We provide machinery processing, transportation and packaging services and other services to third-third party customers. These services are recognized in the period when the related services are provided. |
InvestmentInvestments in joint ventures and associates -– recoverable amount
In accordance with the Group’sour accounting policy, each investment in a joint venturesventure and associatesan associate is evaluated in every reporting period to determine whether there are any indicationsindicators of impairment. If any such indicationindicator exists, an estimate of the recoverable amount is performed and an impairment loss is recognized to the extent that the carrying amount exceeds the recoverable amount. The recoverable amount of the investment in a joint venture and an associate is measured at the higher of fair value less costs of disposal and value in use.
A fair value measurement of a non-financial asset takes into account a market participant’s ability to generate economic benefits by using the asset in its highest and best use or by selling it to another market participant that would use the asset in its highest and best use.
Value in use is also generally determined as the present value of the estimated future cash flows of those expected to arise from the continued use of the asset in its present form and its eventual disposal. Present values are determined using a risk-adjusted pre-tax discount rate appropriate to the risks inherent in the asset. Future cash flow estimates are based on expected production and sales volumes, commodityselling prices (considering current and historical prices, price trends and related factors) and operating costs. This policy requires management to make these estimates and assumptions which are subject to risk and uncertainty; hence there is a possibility that changes in circumstances will alter these projections, which may impact on the recoverable amounts of the investments. In such circumstances, some or all of the carrying value of the investments may be impaired and the impairment would be charged against profit or loss.
New IFRS Pronouncements
For a detailed discussion of new accounting pronouncements, please see Note 2 to our audited consolidated financial statements.
Factors Affecting Our Results of Operations
We believe that the following factors which impact our various revenue and expense items (as described below) have had, and will continue to have, a significant effect on the development of our business, financial position and results of operation.
Economic Condition of China and the World
As the major aluminum product market is globalized, the demand for and prices of our products are highly correlated with the general economic condition of China and the world and the performance of the major aluminum and related product markets. In recent years, China’s economy continued to experience growth despite the negative effects of the global financial crisis beginning in the second half of 2008 and economic recession in 2009, as well as general market volatility and changing macroeconomic conditions. However, the growth of China’s economy has shown signs of slowing down since 2014, with GDP growth of 6.9% from 2014 to 2015, 6.7% from 2015 to 2016, and 6.9% from 2016 to 2017 and 6.6% from 2017 to 2018, as compared to 7.5% from 2013 to 2014.
The global output of alumina (with chemical alumina products included) in 2017 increased2018 decreased by approximately 7.7%4.5% from 20162017 to approximately 130.50124.69 million tonnes. The global alumina consumption (with chemical alumina products included) in 2017 increased2018 decreased approximately 6.6%by 1.5% from 20162017 to approximately 130.32128.40 million tonnes. In 2017,2018, the domestic output of alumina (with chemical alumina products included) increased approximately 16.8%by 1.9% from 20162017 to approximately 70.2571.61 million tonnes and the domestic consumption for alumina (with chemical alumina products included) increased by approximately 12.6%0.3% from 20162017 to approximately 72.4972.70 million tonnes.
The global output of primary aluminum in 20172018 increased approximately 7.5%by 1.5% from 20162017 to approximately 63.2864.21 million tonnes. The global consumption of primary aluminum in 20172018 increased approximately 6.7%3.3% from 20162017 to approximately 63.5965.70 million tonnes. In 2017,2018, the domestic output of primary aluminum increaseddecreased approximately 12.8%by 0.5% from 20162017 to approximately 36.6636.48 million tonnes and the domestic consumption of primary aluminum increased approximately 8.3%by 4.9% from 20162017 to approximately 35.4037.13 million tonnes.
Mix and Pricing of Our Products
We are engaged principally in alumina refining, primary aluminum smelting and sales of these products and trading of non-ferrous metal products and other products. In addition, we are engaged in coal mining and power generation. We sell most of our self-produced products through Chalco Trading, taking into account the spot market prices and SHFE prices. In 2017,2018, revenues generated from alumina, primary aluminum, trading and energy segments (after elimination of inter-segment sales) accounted for 7.6%8.2%, 20.3%22.9%, 68.6%64.7% and 3.2%3.9%, respectively, of our consolidated total revenues after elimination of inter-segment sales. We apply different policies to price different products. For information on our pricing of different products, please see the section headed “Item 4. Information of the Company - B. Business Overview - Sales and Marketing.”
The sales prices of alumina that our alumina refineries sell internally to Chalco Trading are determined based on our budgeted sale prices, spot market prices and the prices of primary aluminum on SHFE. Chalco Trading coordinates the external negotiation and execution of sales contracts of our alumina products. The alumina prices in both domestic and international market have shown a generalincreased in 2018 when compared to that of 2017. The increase trend in 2017sales price in international market was attributable to the supply shortage in global alumina market, as a result of decreases in production of, and sanctions and labor strikes faced by, certain main players in the increaseoverseas market in primary aluminum price and a tight2018. China’s export volume of alumina also increased in 2018 due to such supply shortage in international market. In addition, the tightened environmental protection regulatory inspection restrained the supply of bauxite in China.certain areas, which further contributed to the increase in sales price in domestic market. Accordingly, in 2018, the sales price of alumina in the domestic market fluctuated at a relatively high price level. In 2017,2018, the spot price of alumina in the international market reached a high of approximately US$484710 per tonne and bottomed out at approximately US$272357 per tonne. The average spot price of alumina in the international market was approximately US$354473 per tonne, representing an increase of 39%33.6% from 2016.2017. The spot price of alumina in the domestic market reached a high of RMB3,805RMB3,291 per tonne and bottomed out at RMB2,215RMB2,691 per tonne. The average spot price of alumina in the domestic market was approximately RMB2,909RMB2,992 per tonne, representing an increase of 41%2.9% from 2016.2017. Our average selling price of alumina increased by 41%2.6% from RMB2,016 per tonne in 2016 to RMB2,845 per tonne in 2017.2017 to RMB2,918 per tonne in 2018.
Like most primary aluminum producers in China, we price our primary aluminum products by reference to the primary aluminum spot prices and futures price on the SHFE. In 2017,2018, three month aluminum futures prices reached a high of USD2,290.5US$2,718 per tonne and a low of USD1,676.5US$1,830 per tonne on LME; and a high of RMB17,320RMB15,650 per tonne and a low of RMB12,505RMB13,505 per tonne on SHFE. The average three-month aluminum futures prices at SHFE increaseddecreased by 22%2.4% from RMB12,101 per tonne in 2016 to RMB14,731 per tonne in 2017.2017 to RMB14,375 per tonne in 2018. Our average selling price of primary aluminum increaseddecreased by 17%1.7% from RMB12,496 per tonne in 2016 to RMB14,567 per tonne in 2017.2017 to RMB 14,313 per tonne in 2018. In 2017, recovery of2018, the world’s major economies boosted the demand for primary aluminum, while the PRC government advanced the supply-side structural reform by closing down production capacity of primary aluminum in violation of applicable rules and regulations, and restricted the output of primary aluminum in Beijing-Tianjin-Hebei and surrounding areas (“2+26” cities) in the winter heating season. The prices of various raw materials also increased in 2017. All these factors contributed to the significant increase of primary aluminum prices in global market experienced significant fluctuations, as the prices first increased due to supply shortage in the global aluminum industry and sanctions faced by a main player in the overseas market, but then followed by a price decrease partially due to mitigation of impacts of factors that previously drove up the prices, as well as the impact of the China-U.S. trade tension. Meanwhile, the primary aluminum prices in domestic marketsmarket generally declined in 2017.2018 due to the slowdown in growth of demand for primary aluminum, in spite of the impact of the decrease in aluminum production.
Price Volatility of Non-ferrous Metal and Coal Products
Since late 2009, as a result of the implementation of our operational structural adjustment, we have been engaged substantially in the trading of outsourced non-ferrous metal products to increase our profit. In 2012, we began to engage in the trading of significant amounts of outsourced coal products to diversify our product portfolio. Although the profit margin of sales of outsourced products is typically lower than that of our self-produced products, we generated substantial revenues and profit from the trading of outsourced products during the past few years due to our significant trading volumes. Our revenue generated from external sales of products purchased from external sources in 20172018 was approximately RMB100,496RMB82,192.6 million, representing approximately 81.3%70.5% of total revenue from external sales in our trading segment. From time to time, we may enter into futures and option transactions in addition to the simple buy-low-sell-high trading model to hedge against price fluctuations in the non-ferrous metal and coal products market. However, short-term price volatility of these products remains a key factor affecting our operation results, as we need to make the correct prediction concerning the price trends of these products on the markets to ensure substantial revenues through large trading volume. If the market price trend does not match our prediction, we may be forced to sell trading products at low prices or to purchase trading products at high prices, which may adversely affect gross margins and profitability.
Manufacturing Costs
Our cost of revenues consists primarily of the costs of raw materials, overhead cost and electric power cost. Our principal raw material is bauxite. For the years ended December 31, 2015, 2016, 2017 and 2017,2018, bauxite supplied by our mines accounted for 55%47%, 47% and 47%44%, respectively, of our total bauxite used in the production of alumina. The unit cost of bauxite produced by us is generally lower than the unit cost of bauxite procured from external suppliers. In 2017,2018, as a result of increasesthe increase in pricesthe costs of raw materials, fuelpurchasing bauxite and electricity,caustic soda, our average cost of alumina per tonne increased by approximately 22%9.5% from that in 2016.2017.
Primary aluminum is one of our major aluminum products and is produced by smelting operations. Smelting operations require a substantial and continuous supply of electricity. Electricity cost is the most significant component of our primary aluminum production cost and accounted for approximately 34%33% of our unit production cost for primary aluminum in 2017.2018. The availability and price of electricity are key considerations in our primary aluminum operations. Interruptions of electricity supply can result in lengthy production shutdowns, increased costs associated with restarting production and waste of production in progress, and prolonged interruptions can cause damage to, or the destruction of, production equipment and facilities. Our average annual electricity price per kWh decreased by 16% from 2015 to 2016 and increased by 21% from 2016 to 2017.2017 and decreased by 2% from 2017 to 2018.
Given our high proportion of fixed costs, we must generate sufficient sales to absorb our fixed costs to maintain or increase our operating margins. Our acquisitions and production expansion in recent years have significantly increased our costs that are relatively fixed in nature, such as leases and depreciation of property, plant and equipment and employee benefit expenses. If we are able to maintain satisfactory facility utilization rates and productivity, our production capacity expansion will enable us to reduce our unit costs through economies of scale and recover associated increased costs through higher output. In 2017,2018, we continued to focus on lowering production costs and increasing production efficiency through reducing raw material consumption by improving technology and internal management.
Availability and Costs of Financing
We require a significant amount of capital to fund our operations. For example, we need substantial amounts of funds for expanding our operations, purchasing and maintaining equipment and procuring commodities. We have in the past funded our capital expenditures primarily with bank loans and the issuance of medium-term notes and bonds and long-term bonds. The availability of financing is subject to various factors, including our credit history and the prevailing credit policy adopted by the PRC government’s policy on credit markets.government. Over the years, we have maintained good relationships with the commercial banks in China, which enables us to access bank financing at relatively low costs. In recent years,Any change of lending policies adopted by the PRC government had tightened its monetary policies to control inflation, including increasing interest rates on bank loans and deposits and tightening the money supply. Any change towards stricter lending policies in the future may, among other things, affect our ability to obtain financing and may in turn adversely affect our operating results.
Our finance costs increaseddecreased by 3.4%6.2% from 20162017 to 2017,2018, primarily due to the increasedecrease in exchange loss.interest-bearing loans and borrowings during the year. If we are unable to secure sufficient external funding when required, we may not be able to fund our working capital requirements and necessary capital expenditures, which could adversely affect our business, financial performance and prospects.
In addition, our borrowing costs and access to debt financing depend significantly on our credit ratings. These ratings, including long-term corporate credit ratings and financing bond credit ratings, are assigned by rating agencies, which may lower or withdraw their ratings. Any change in our credit ratings or average interest rate could have negative implications, which may increase our finance costs and affect our financial results.
Regulatory Environment
The central and local governments in the PRC continues to exercise a substantial degree of control and influence over the aluminum and other non-ferrous metal products industry in China and shape the structure and development of the industry through the imposition of industry policies governing major project approvals and safety, environmental and quality regulations. If the PRC government changes its current policies or the interpretation of those policies that are currently beneficial to us, we may face pressure on profit margins and significant constraints on our ability to expand our business operations.
Selected Statement of Operation Items
Revenue
Our revenue is primarily generated from sales of alumina, primary aluminum, other non-ferrous metal products and coal products. In addition, we are engaged in coal mining and power generation. The remainder of our revenues was derived from research and development activities and other products and services. In 2010, weWe established our trading businessand energy businesses as a new business segment.segments in 2010 and 2013, respectively.
Cost of Sales
Our cost of sales consists primarily of the purchase of inventories in relation to trading activities, cost of raw materials, consumables and electric power used in manufacturing, the fixed cost of and employee benefit expenses. For the years ended December 31, 2015, 2016, 2017 and 2017,2018, our cost of sales was RMB121,172.3RMB133,700.2 million, RMB133,674.3RMB166,290.2 million and RMB165,675.0RMB167,029.4 million, respectively, and accounted for 98.0%92.3%, 92.7%91.9% and 92.0%92.7%, respectively, of the total consolidated revenues for those periods.
Operating Expenses
Selling and Distribution Expenses.Our selling and distribution expenses consist primarily of transportation and loading expenses, packaging expense and, to a lesser extent, port expenses, employee benefit expenses for employees in selling and distribution department, warehouse and other storage fees, depreciation of non-production property, plant and equipment, sales commissions and other handling fees, marketing and advertising expenses, among others. Selling and distribution expenses accounted for 41.4%37.2%, 36.6%31.9% and 31.5%33.7% of our total operating expenses for the years ended December 31, 2015, 2016, 2017 and 2017,2018, respectively.
General and Administrative Expenses.Our general and administrative expenses consist primarily of early retirement benefit expenses, employee benefit expenses for directors and officers and employees in administrative department and, to a lesser extent, taxes other than income tax expenses, impairment of intangible assets, depreciation of non-production property, plant and equipment, provision for impairment of receivables, termination benefit expenses, operating lease rental expenses, travelling and entertainment, legal and other professional fees, amortization of land use rights and leasehold land, utilities and office supplies, insurance expense, pollutants discharge fees, repairs and maintenance expenses, auditors’ remuneration, amortization of intangible assets, and others. General and administrative expenses accounted for 54.5%58.8%, 59.4%61.2% and 61.6%53.4% of our total operating expenses for the years ended December 31, 2015, 2016, 2017 and 2017,2018, respectively. Employee benefit expenses, including salaries and bonus, housing fund, staff welfare and other expenses, employment expense in relation to early retirement schemes, termination benefit and retirement benefit cost-defined contribution schemes, comprise a significant component of our general and administrative expenses, accounting for 43.3%51.0%, 51.0%51.3% and 51.3%40.1% of our total general and administrative expenses for the years ended December 31, 2015, 2016, 2017 and 2017,2018, respectively.
Research and Development Expenses.Our research and development expenses accounted for 3.9%3.0%, 3.0%6.7% and 6.7%8.5% of our total operating expenses for the years ended December 31, 2015, 2016, 2017 and 2017,2018, respectively.
Impairment loss on property, plant and equipment.Our impairment loss on property, plant and equipment accounted for 0.2%1.0%, 1.0%0.2% and 0.2%0.1% of our total operating expenses for the years ended December 31, 2015, 2016, 2017 and 2017,2018, respectively.
Impairment losses on financial assets.Our impairment losses on financial assets accounted for 1.5% of our total operating expenses for the year ended December 31, 2018.
Impairment losses on investments in joint ventures.Our impairment losses on investments in joint ventures accounted for 2.9% of our total operating expenses for the year ended December 31, 2018.
Other Income
Other
Our other income consists primarily of research subsidies, grants on energy saving, environment protection projects and industrial development support from the government. For the year ended December 31, 2018, our other income was RMB135.4 million, and accounted for 0.1% of the total consolidated revenues.
Other Gains, net
Our other net gains in 2017 were RMB320.0 million, which consisted primarily of gains on deemed disposal and disposal of subsidiaries and gains on previously held equity interest remeasured at acquisition-date fair value, partially offset by losses and unrealisedunrealized losses on future, forward and option contracts. For the year ended December 31, 2018, our other net gains were RMB921.9 million, and accounted for 0.5% of the total consolidated revenues.
Finance Income
Our finance income consists primarily of interest income. For the year ended December 31, 2017,2018, our finance income was RMB706.3RMB492.2 million, and accounted for 0.4%0.3% of the total consolidated revenues.
Finance Costs
Our financing costs consist primarily of interest expense on our borrowings, which we have incurred mainly to fund our capital expenditures. Interest rates on loans related to capital expenditures and working capital set by banks generally follow guidelines issued by the People’s Bank of China.PBOC. The People’s Bank of ChinaPBOC regulates the interest rates for commercial loans charged by state-owned banks from time to time as part of the PRC government’s efforts to regulate the PRC economy. In 2017,2018, we incurred interest expense (net of capitalized interest) of RMB4,817.2RMB4,685.1 million on our borrowings.
Share of Profits and Losses of Joint Ventures
Our share of profits and losses of joint ventures is the profit attributable to us from our joint ventures, based on our equity interests in such joint ventures. A joint venture is a type of joint arrangement whereby the parties that have joint control of the arrangement have rights to the net assets of the joint venture. Joint control is the contractually agreed sharing of control of an arrangement, which exists only when decisions about the relevant activities require unanimous consent of the parties sharing control.
Share of Profits and Losses of Associates
Our share of profits and losses of associates is the profit attributable to us from our associates, based on our equity interests in such associates. An associate is an entity over which we have significant influence but not control.
Consolidated Results of Operations
The following table sets forth certain income and expense items as a percentage of our revenues from our consolidated statements of comprehensive income for the periods indicated:
| | Year Ended December 31, |
| | 2015 | 2016 | 2017 |
| | RMB | (%) | RMB | (%) | RMB | US$ | (%) |
| | (in millions, except percentage) |
| Revenue | 123,667.7 | 100.0 | 144,228.9 | 100.0 | 180,080.8 | 27,677.9 | 100.0 |
| Cost of Sales | (121,172.3) | (98.0) | (133,674.3) | (92.7) | (165,675.0) | (25,463.8) | (92.0) |
| Gross Profit | 2,495.4 | 2.0 | 10,554.6 | 7.3 | 14,405.8 | 2,214.1 | 8.0 |
| Selling and distribution expenses | (1,787.8) | (1.4) | (2,069.4) | (1.4) | (2,342.5) | (360.0) | (1.3) |
| General and administrative expenses | (2,358.8) | (1.9) | (3,360.7) | (2.3) | (4,568.2) | (702.1) | (2.5) |
| Research and development expenses | (168.9) | (0.1) | (168.9) | (0.1) | (494.6) | (76.0) | (0.3) |
| Impairment loss on property, plant and equipment | (10.0) | <0.1 | (57.1) | <0.1 | (15.6) | (2.4) | <0.1 |
| Other income | 1787.7 | 1.4 | 745.2 | 0.5 | 342.0 | 52.6 | 0.2 |
| Other gains, net | 5,023.6 | 4.1 | 166.4 | 0.1 | 320.0 | 49.1 | 0.2 |
| Operating profit | 4,981.2 | 4.0 | 5,810.1 | 4.0 | 7646.9 | 1,175.3 | 4.2 |
| Finance Income | 812.5 | 0.7 | 815.8 | 0.6 | 706.3 | 108.6 | 0.4 |
| Finance cost | (5,979.5) | (4,8) | (5,019.9) | (3.5) | (5,189.9) | (797.8) | (2.9) |
| Share of profits and losses of joint ventures | 23.2 | <0.1 | (95.5) | (0.1) | 8.2 | 1.3 | <0.1 |
| Share of profits and losses of associates | 284.5 | 0.2 | 115.0 | 0.1 | (165.3) | (25.4) | (0.1) |
| Profit before income tax | 121.9 | 0.1 | 1,625.5 | 1.1 | 3,006.2 | 462.0 | 1.7 |
| Income tax benefit/(expense) | 226.0 | 0.2 | (404.1) | (0.3) | (642.3) | (98.7) | (0.4) |
| Profit for the year | 347.9 | 0.3 | 1,221.4 | 0.8 | 2,363.9 | 363.3 | 1.3 |
| | | Year Ended December 31, | |
| | | 2016 | | | 2017 | | | 2018 | |
| | | RMB | | | (%) | | | RMB | | | (%) | | | RMB | | | US$ | | | (%) | |
| | | (in millions, except percentage) | |
| Revenue | | | 144,854.6 | | | | 100.0 | | | | 181,020.4 | | | | 100.0 | | | | 180,240.2 | | | | 26,214.8 | | | | 100.0 | |
| Cost of Sales | | | (133,700.2 | ) | | | (92.3 | ) | | | (166,290.2 | ) | | | (91.9 | ) | | | (167,029.4 | ) | | | (24,293.4 | ) | | | (92.7 | ) |
| Gross Profit | | | 11,154.4 | | | | 7.7 | | | | 14,730.2 | | | | 8.1 | | | | 13,210.8 | | | | 1,921.4 | | | | 7.3 | |
| Selling and distribution expenses | | | (2,111.8 | ) | | | (1.5 | ) | | | (2,373.0 | ) | | | (1.3 | ) | | | (2,496.9 | ) | | | (363.2 | ) | | | (1.4 | ) |
| General and administrative expenses | | | (3,336.1 | ) | | | (2.3 | ) | | | (4,549.2 | ) | | | (2.5 | ) | | | (3,958.1 | ) | | | (575.7 | ) | | | (2.2 | ) |
| Research and development expenses | | | (168.9 | ) | | | (0.1 | ) | | | (498.2 | ) | | | (0.3 | ) | | | (626.9 | ) | | | (91.2 | ) | | | (0.3 | ) |
| Impairment loss on property, plant and equipment | | | (57.1 | ) | | | <0.1 | | | | (16.2 | ) | | | <0.1 | | | | (7.5 | ) | | | (1.1 | ) | | | <0.1 | |
| Impairment losses on financial assets | | | — | | | | — | | | | — | | | | — | | | | (107.8 | ) | | | (15.7 | ) | | | (0.1 | ) |
| Impairment losses on investments in joint ventures | | | — | | | | — | | | | — | | | | — | | | | (217.0 | ) | | | (31.6 | ) | | | (0.1 | ) |
| Other income | | | 155.6 | | | | 0.1 | | | | 89.9 | | | | <0.1 | | | | 135.4 | | | | 19.7 | | | | 0.1 | |
| Other gains, net | | | 169.2 | | | | 0.1 | | | | 319.3 | | | | 0.2 | | | | 921.9 | | | | 134.1 | | | | 0.5 | |
| Operating profit | | | 5,805.3 | | | | 4.0 | | | | 7,702.8 | | | | 4.3 | | | | 6,853.9 | | | | 996.9 | | | | 3.8 | |
| Finance Income | | | 815.7 | | | | 0.6 | | | | 706.7 | | | | 0.4 | | | | 492.2 | | | | 71.6 | | | | 0.3 | |
| Finance cost | | | (5,019.9 | ) | | | (3.5 | ) | | | (5,203.4 | ) | | | (2.9 | ) | | | (4,882.5 | ) | | | (710.1 | ) | | | (2.7 | ) |
| Share of profits and losses of joint ventures | | | (95.5 | ) | | | (0.1 | ) | | | 8.2 | | | | <0.1 | | | | (199.5 | ) | | | (29.0 | ) | | | (0.1 | ) |
| Share of profits and losses of associates | | | 115.1 | | | | 0.1 | | | | (165.2 | ) | | | (0.1 | ) | | | 39.3 | | | | 5.7 | | | | <0.1 | |
| Profit before income tax | | | 1,620.7 | | | | 1.1 | | | | 3,049.0 | | | | 1.7 | | | | 2,303.5 | | | | 335.0 | | | | 1.3 | |
| Income tax benefit/(expense) | | | (403.9 | ) | | | (0.3 | ) | | | (643.7 | ) | | | (0.4 | ) | | | (822.5 | ) | | | (119.6 | ) | | | (0.5 | ) |
| Profit for the year | | | 1,216.8 | | | | 0.8 | | | | 2,405.3 | | | | 1.3 | | | | 1,481.0 | | | | 215.4 | | | | 0.8 | |
No customer individually accounted for more than 10% of our total salesrevenue for the year ended December 31, 2017.2018. Sales to Chinalco and its subsidiaries, joint ventures, associates and other related parties accounted for approximately 11.6%9.0%, 9.0%8.2% and 8.3%11.2% of consolidated revenues for the years ended December 31, 2015, 2016, 2017 and 2017,2018, respectively. For information on related party transactions, see “Item 7 - Major Shareholders and Related Party Transactions - B. Related Party Transactions” and Note 35 to our audited consolidated financial statements.
Year Ended December 31, 2018 Compared with Year Ended December 31, 2017
Revenue
Our revenue remained stable from RMB181,020.4 million for the year ended December 31, 2017, to RMB180,240.2 million for the year ended December 31, 2018, mainly because the increases in the revenue generated from external sales of our primary aluminum segment and energy segment were offset by the decrease in the revenue generated from external sales of our trading segment. Please see “- Discussion of Segment Operations - Year Ended December 31, 2018 Compared with Year Ended December 31, 2017” for discussion regarding segment revenues in 2018 as compared to 2017.
Cost of Sales
Our cost of sales remained stable from RMB166,290.2 million for the year ended December 31, 2017, to RMB167,029.4 million for the year ended December 31, 2018, mainly because the increases in the cost of sales incurred from external sales of our primary aluminum segment and energy segment were offset by the decrease in the cost of sales incurred from external sales of our trading segment. Please see “- Discussion of Segment Operations - Year Ended December 31, 2018 Compared with Year Ended December 31, 2017” for discussion regarding segment cost and expenses in 2018 as compared to 2017.
Selling and Distribution Expenses
Our selling and distribution expenses increased by 5.2% from RMB2,373.0 million for the year ended December 31, 2017, to RMB2,496.9 million for the year ended December 31, 2018, primarily due to the increase of freight charges arising from increased sales.
General and Administrative Expenses
Our general and administrative expensesdecreased by 13.0% from RMB4,549.2 million for the year ended December 31, 2017, to RMB3,958.1million for the year ended December 31, 2018, primarily attributable to the non-recurring provisions for early retirement benefits for certain employees made in 2017.
Research and Development Expenses
Our research and development expensesincreased by 25.8% from RMB498.2 million in the year ended December 31, 2017 to RMB626.9 million for the year ended December 31, 2018, primarily due to increase in the research and development investment in high-quality alumina, premium aluminum alloy and upgrading of production technology.
Other Income
Other income increased by 50.6% from RMB89.9 million in the year ended December 31, 2017 to RMB135.4 million for the year ended December 31, 2018, primarily due to the increases in the government grants recorded under other income.
Other Gains, Net
Our net other gains increased significantly from RMB319.4 million for the year ended December 31, 2017 to RMB921.9 million for the year ended December 31, 2018, primarily due to the increase in our equity value in certain entities that were converted from joint ventures and associates to our subsidiaries during the year and were therefore re-measured in connection with such conversion.
Finance Income
Our finance income decreased by 30.4% from RMB706.7 million for the year ended December 31, 2017 to RMB492.2 million for the year ended December 31, 2018, primarily due to decreases in the interest received from unpaid disposal proceeds and interest income from our related party loans.
Finance Costs
Our finance costsdecreased by 6.2% from RMB5,203.4 million for the year ended December 31, 2017 to RMB4,882.5 million for the year ended December 31, 2018, primarily due to decrease in interest-bearing loans and borrowings during the year.
67
Share of Profits and Losses of Joint Ventures
We incurred a loss of RMB199.5 million in our share of profits and losses of joint venture for the year ended December 31, 2018, whereas we had a profit of RMB8.2 million in our share of profits and losses of joint venture for the year ended December 31, 2017. This was primarily attributable to the decrease in profitability of our major joint ventures.
Share of Profits and Losses of Associates
We had a profit of RMB39.3 million in our share of profits and losses of associates for the year ended December 31, 2018, whereas we incurred a loss of RMB165.2 million in our share of profits and losses of associates for the year ended December 31, 2017. This was primarily attributable to improved operations of our associates which experienced losses in 2017.
Income Tax
Ourincome tax expense increased by 27.8% from RMB643.7 million for the year ended December 31, 2017 to RMB822.5 million for the year ended December 31, 2018. This was mainly because we had deferred tax benefits in 2017 but deferred tax expenses in 2018.
Results of Operations
Our net profit decreased by 38.4% from RMB2,405.3 million for the year ended December 31, 2017 to RMB1,481.0 million for the year ended December 31, 2018. This was primarily due to decrease of our gross profit, which mainly resulted from the decrease in sales price of primary aluminum and the increase in prices of raw materials.
Year Ended December 31, 2017 Compared with Year Ended December 31, 2016
Revenue
Our revenue increased by 24.9%25.0% from RMB144,228.9RMB144,854.6 million for the year ended December 31, 2016, to RMB180,080.8RMB181,020.4 million for the year ended December 31, 2017, primarily due to the increase in prices and trading volume of various products. Specifically, influenced by the improvement in the supply and demand of the global aluminum market and China’s environmental policies, the prices and sales volume of alumina, primary aluminum, coal and other products we produced increased in 2017. The sales, purchase prices and purchase quantities of alumina, primary aluminum, copper, lead and zinc in the trading segment also increased.
Cost of Sales
Our cost of sales increased by 23.9%24.4% from RMB133,674.3RMB133,700.2 million for the year ended December 31, 2016, to RMB165,675.0RMB166,290.2 million for the year ended December 31, 2017, primarily due to the increase in the prices of raw materials and energy consumed as well as the increase in trading volume of products.
Selling and Distribution Expenses
Our selling and distribution expenses amounted to RMB2,342.5RMB2,373.0 million for the year ended December 31, 2017, representing an increase from RMB2,069.4RMB2,111.8 million for the year ended December 31, 2016, primarily due to the increase of trading volume of products.
General and Administrative Expenses
Our general and administrative expenses increased by 35.9%36.4% from RMB3,360.7RMB3,336.1 million for the year ended December 31, 2016, to RMB4,568.2RMB4,549.2 million for the year ended December 31, 2017, primarily attributable to the provision for the early retirement benefits for certain employees and the increase in tax expenses.
Research and Development Expenses
Our research and development expenses significantly increased from RMB168.9 million in the year ended December 31, 2016 to RMB494.6RMB498.2 million for the year ended December 31, 2017, primarily due to an increase in the research and development investment in advanced techonologiestechnologies relating to aluminum alloy and alumina.
Other Income
Other income decreased from RMB745.2RMB155.6 million in the year ended December 31, 2016 to RMB342.0RMB89.9 million for the year ended December 31, 2017, primarily due to a decrease in government grants.grants recorded under other income.
Other Gains, Net
Our net other gains increased from RMB166.4RMB169.2 million for the year ended December 31, 2016 to RMB320.0RMB319.3 million for the year ended December 31, 2017, primarily due to gains on deemed disposal and disposal of subsidiaries.
Finance Income
Our finance income decreased from RMB815.8RMB815.7 million for the year ended December 31, 2016 to RMB706.3RMB706.7 million for the year ended December 31, 2017, primarily due to a decrease in the interest received from unpaid disposal proceeds.
Finance Costs
Our finance costs increased by 3.4%3.7% from RMB5,019.9 million for the year ended December 31, 2016 to RMB5,189.9RMB5,203.4 million for the year ended December 31, 2017, primarily due to the increase in exchange loss.
Share of Profits and Losses of Joint Ventures
We had a profit of RMB8.2 million in our share of profits and losses of joint venture for the year ended December 31, 2017, whereas we incurred a loss of RMB95.5 million in our share of profits and losses of joint venture for the year ended December 31, 2016. This was primarily attributable to the improved results of operation of our joint ventures.
Share of Profits and Losses of Associates
We had a profit of RMB115.0RMB115.1 million in our share of profits and losses of associates for the year ended December 31, 2016, whereas we incurred a loss of RMB165.3RMB165.2 million in our share of profits and losses of associates for the year ended December 31, 2017. This was primarily attributable to the decrease in the profits of our associates.
Income Tax
Our income tax expense increased from RMB404.1RMB403.9 million for the year ended December 31, 2016 to RMB642.3RMB643.7 million for the year ended December 31, 2017. This was mainly attributable to more income taxes recognized as a result of increase in profit for the year 2017.
Results of Operations
As a result of the foregoing, our net profit increased from RMB1,221.4RMB1,216.8 million for the year ended December 31, 2016 to RMB2,363.9RMB2,405.3 million for the year ended December 31, 2017.
Year Ended December 31, 2016 Compared with Year Ended December 31, 2015
Revenue
Our revenue increased by 16.6% from RMB123,667.7 million for the year ended December 31, 2015, to RMB144,228.9 million for the year ended December 31, 2016, primarily due to the increase of trading volume during the year.
Cost of Sales
Our cost of sales increased by 10.3% from RMB121,172.3 million for the year ended December 31, 2015, to RMB133,674.3 million for the year ended December 31, 2016, primarily due to the increase of trading volume during the year.
Selling and Distribution Expenses
Our selling and distribution expenses amounted to RMB2,069.4 million for the year ended December 31, 2016, representing an increase by 15.8% from RMB1,787.8 million for the year ended December 31, 2015.
General and Administrative Expenses
Our general and administrative expenses increased by 42.5% from RMB2,358.8 million for the year ended December 31, 2015, to RMB3,360.7 million for the year ended December 31, 2016, primarily attributable to costs incurred for the reposition of certain redundant personnel for the purpose of enhancing productivity.
Research and Development Expenses
Our research and development expenses remain relatively stable around RMB168.9 million from 2015 to 2016.
Other Income
Other income decreased from RMB1,787.7 million in the year ended December 31, 2015 to RMB745.2 million for the year ended December 31, 2016, primarily due to changing of the way that the government provided support for our Group.
Other Gains, Net
Our net other gains decreased from RMB5,023.6 million for the year ended December 31, 2015 to RMB166.4 million for the year ended December 31, 2016, primarily due to relatively more gains generated from disposal of property, plant and equipment and land use rights and equity interests in Jiaozuo Wanfang and Shanxi Huaxing in 2015.
Finance Income
Our finance income slightly increased from RMB812.5 million for the year ended December 31, 2015 to RMB815.8 million for the year ended December 31, 2016.
Finance Costs
Our finance costs decreased by 16.0% from RMB5,979.5 million for the year ended December 31, 2015 to RMB5,019.9 million for the year ended December 31, 2016, primarily due to decline in lending rates and adjustment to the size of interest-bearing liabilities.
Share of Profits and Losses of Joint Ventures
We incurred a loss of RMB95.5 million in our share of profits and losses of joint venture for the year ended December 31, 2016, whereas we had a profit of RMB23.2 million in our share of profits and losses of joint venture for the year ended December 31, 2015. This was primarily attributable to decrease in the profits of our joint ventures.
Share of Profits and Losses of Associates
Our share of profits and losses of associates decreased by 59.6% from RMB284.5 million for the year ended December 31, 2015 to RMB115.0 million for the year ended December 31, 2016, primarily attributable to the decrease in the profit of our associates.
Income Tax
Our income tax benefit was RMB226.0 million for the year ended December 31, 2015, whereas we had income tax expense of RMB404.1 million for the year ended December 31, 2016. This was mainly attributable to more income taxes recognized as a result of increase in profit for the year 2016.
Results of Operations
As a result of the foregoing, our net profit increased from RMB347.9 million for the year ended December 31, 2015 to RMB1,221.4 million for the year ended December 31, 2016.
Discussion of Segment Operations
We account for our operations on a segmental basis; that is, separately preparing the accounting for our alumina, primary aluminum, trading, energy and corporate and other operating segments. Unless otherwise indicated, also included in these segments are other revenues derived from activities such as supplying electricity, gas, heat and water to our affiliates, selling scrap and other materials and providing services including transportation and research and development to third parties. For additional information relating to our business segments and segment presentation, see Note 4 to our consolidated financial statements.
The following table sets forth a breakdown of our revenues by segment and the contribution of external sales and inter-segment sales for the periods indicated:
| | Year Ended December 31, |
| | 2015 | 2016 | 2017 | 2017 | 2017 | 2017 |
| | RMB | RMB | RMB | US$ | % | % |
| | (in millions, except percentage) |
| Revenue | | | | | | |
| Alumina: | | | | | | |
| External sales | 6,853.5 | 9,518.9 | 13,665.9 | 2,100.4 | 5.7 | 7.6 |
| Inter-segment sales | 26,643.8 | 20,508.3 | 24,413.3 | 3,752.2 | 10.2 | |
| Total | 33,497.3 | 30,027.2 | 38,079.2 | 5,852.6 | 15.9 | |
| Primary aluminum: | | | | | | |
| External sales | 28,111.8 | 29,482.3 | 36,552.0 | 5,617.9 | 15.3 | 20.3 |
| Inter-segment sales | 8,861.4 | 4,981.9 | 10,693.6 | 1,643.6 | 4.5 | |
| Total | 36,973.2 | 34,464.2 | 47,245.6 | 7,261.5 | 19.8 | |
| Trading | | | | | | |
| External sales | 84,222.2 | 100,439.4 | 123,655.4 | 19,005.5 | 51.7 | 68.6 |
| Inter-segment sales | 9,908.9 | 13,906.5 | 23,159.1 | 3,559.5 | 9.7 | |
| Total | 94,131.1 | 114,345.9 | 146,814.5 | 22,565.0 | 61.4 | |
| Energy | | | | | | |
| External sales | 4,192.8 | 4,382.3 | 5,733.7 | 881.3 | 2.4 | 3.2 |
| Inter-segment sales | 98.1 | 137.5 | 517.3 | 79.5 | 0.2 | |
| Total | 4,290.9 | 4,519.8 | 6,251.0 | 960.8 | 2.6 | |
| Corporate and others | | | | | | |
| External sales | 287.4 | 406.0 | 473.8 | 72.8 | 0.2 | 0.3 |
| Inter-segment sales | 15.0 | 98.4 | 171.5 | 26.4 | 0.1 | |
| Total | 302.4 | 504.4 | 645.3 | 99.2 | 0.3 | |
| Total Revenues before inter-segment eliminations | 169,194.9 | 183,861.5 | 239,035.6 | 36,739.1 | 100.0 | |
| Eliminations of inter-segment sales | (45,527.2) | (39,632.6) | (58,954.8) | (9,061.2) | (24.7) | |
| Consolidated total revenues | 123,667.7 | 144,228.9 | 180,080.8 | 27,677.9 | 75.3 | 100.0 |
| | | Year Ended December 31, | |
| | | 2016 | | | 2017 | | | 2018 | | | 2018 | | | 2018 | | | 2018 | |
| | | RMB | | | RMB | | | RMB | | | US$ | | | % | | | % | |
| | | (in millions, except percentage) | |
| Revenue | | | | | | | | | | | | | | | | | | |
| Alumina: | | | | | | | | | | | | | | | | | | |
| External sales | | | 9,518.8 | | | | 14,565.4 | | | | 14,758.4 | | | | 2,146.5 | | | | 6.0 | | | | 8.2 | |
| Inter-segment sales | | | 20,508.5 | | | | 24,431.9 | | | | 29,392.5 | | | | 4,275.0 | | | | 11.9 | | | | | |
| Total | | | 30,027.3 | | | | 38,997.3 | | | | 44,150.9 | | | | 6,421.5 | | | | 17.9 | | | | | |
| Primary aluminum: | | | | | | | | | | | | | | | | | | | | | | | | |
| External sales | | | 30,108.0 | | | | 36,551.9 | | | | 41,344.3 | | | | 6,013.3 | | | | 16.7 | | | | 22.9 | |
| Inter-segment sales | | | 4,981.9 | | | | 10,693.7 | | | | 12,457.9 | | | | 1,811.9 | | | | 5.0 | | | | | |
| Total | | | 35,089.9 | | | | 47,245.6 | | | | 53,802.2 | | | | 7,825.2 | | | | 21.7 | | | | | |
| Trading | | | | | | | | | | | | | | | | | | | | | | | | |
| External sales | | | 100,439.5 | | | | 123,695.6 | | | | 116,646.3 | | | | 16,965.5 | | | | 47.0 | | | | 64.7 | |
| Inter-segment sales | | | 13,906.4 | | | | 23,159.1 | | | | 25,370.3 | | | | 3,690.0 | | | | 10.2 | | | | | |
| Total | | | 114,345.9 | | | | 146,854.7 | | | | 142,016.6 | | | | 20,655.5 | | | | 57.2 | | | | | |
| Energy | | | | | | | | | | | | | | | | | | | | | | | | |
| External sales | | | 4,382.3 | | | | 5,733.7 | | | | 7,037.0 | | | | 1,023.5 | | | | 2.8 | | | | 3.9 | |
| Inter-segment sales | | | 137.5 | | | | 517.3 | | | | 198.3 | | | | 28.8 | | | | 0.1 | | | | | |
| Total | | | 4,519.8 | | | | 6,251.0 | | | | 7,235.3 | | | | 1,052.3 | | | | 2.9 | | | | | |
| Corporate and others | | | | | | | | | | | | | | | | | | | | | | | | |
| External sales | | | 406.0 | | | | 473.8 | | | | 454.2 | | | | 66.0 | | | | 0.2 | | | | 0.3 | |
| Inter-segment sales | | | 98.3 | | | | 171.5 | | | | 213.0 | | | | 31.0 | | | | 0.1 | | | | | |
| Total | | | 504.3 | | | | 645.3 | | | | 667.2 | | | | 97.0 | | | | 0.3 | | | | | |
| Total Revenues before inter-segment eliminations | | | 184,487.2 | | | | 239,993.9 | | | | 247,872.2 | | | | 36,051.5 | | | | 100 | | | | | |
| Eliminations of inter-segment sales | | | (39,632.6 | ) | | | (58,973.5 | ) | | | (67,632.0 | ) | | | (9,836.7 | ) | | | (27.3 | ) | | | | |
| Consolidated total revenues | | | 144,854.6 | | | | 181,020.4 | | | | 180,240.2 | | | | 26,214.8 | | | | 72.7 | | | | 100.0 | |
The following table sets forth segment results before income tax by segment for the periods indicated:
| | Year Ended December 31, |
| | 2015 | 2016 | 2017 | 2017 |
| | RMB | RMB | RMB | US$ |
| | (in millions) |
| Alumina: | | | | |
| Revenues | 33,497.3 | 30,027.3 | 38,079.1 | 5,852.7 |
| Cost and expenses(1) | (31,601.6) | (29,116.9) | (34,827.3) | (5,352.9) |
| Segment results(2) | 1,895.7 | 910.4 | 3,251.8 | 499.8 |
| Primary aluminum: | | | | |
| Revenues | 36,973.2 | 34,464.2 | 47,245.6 | 7,261.5 |
| | | Year Ended December 31, | |
| | | 2016 | | | 2017 | | | 2018 | | | 2018 | |
| | | RMB | | | RMB | | | RMB | | | US$ | |
| | | (in millions) | |
| Alumina: | | | | | | | | | | | | |
| Revenues | | | 30,027.3 | | | | 38,997.3 | | | | 44,150.9 | | | | 6,421.5 | |
| Cost and expenses(1) | | | (29,116.9 | ) | | | (35,706.4 | ) | | | (40,654.5 | ) | | | (5,913.0 | ) |
| Segment results(2) | | | 910.4 | | | | 3,290.9 | | | | 3,496.4 | | | | 508.5 | |
| Primary aluminum: | | | | | | | | | | | | | | | | |
| Revenues | | | 35,089.9 | | | | 47,245.6 | | | | 53,802.2 | | | | 7,825.2 | |
| Cost and expenses(1) | | | (32,906.1 | ) | | | (46,419.0 | ) | | | (54,731.5 | ) | | | (7,960.4 | ) |
| Segment results(2) | | | 2,183.8 | | | | 826.6 | | | | (929.3 | ) | | | (135.2 | ) |
| Trading: | | | | | | | | | | | | | | | | |
| Revenues | | | 114,345.9 | | | | 146,854.7 | | | | 142,016.6 | | | | 20,655.5 | |
| Cost and expenses(1) | | | (113,541.7 | ) | | | (146,121.0 | ) | | | (141,237.1 | ) | | | (20,542.1 | ) |
| Segment results(2) | | | 804.2 | | | | 733.7 | | | | 779.5 | | | | 113.4 | |
| Energy: | | | | | | | | | | | | | | | | |
| Revenues | | | 4,519.8 | | | | 6,251.0 | | | | 7,235.3 | | | | 1,052.3 | |
| Cost and expenses(1) | | | (4,486.4 | ) | | | (6,422.3 | ) | | | (7,209.3 | ) | | | (1,048.5 | ) |
| Segment results(2) | | | 33.4 | | | | (171.3 | ) | | | 26.0 | | | | 3.8 | |
| Corporate and others | | | | | | | | | | | | | | | | |
| Revenues | | | 504.3 | | | | 645.3 | | | | 667.2 | | | | 97.0 | |
| Cost and expenses(1) | | | (2,497.5 | ) | | | (2,373.9 | ) | | | (1,934.3 | ) | | | (281.3 | ) |
| Segment results(2) | | | (1,993.2 | ) | | | (1,728.6 | ) | | | (1,267.1 | ) | | | (184.3 | ) |
| Elimination(3) | | | (318.0 | ) | | | 97.6 | | | | 198.1 | | | | 28.8 | |
| Total (loss)/profit before income tax | | | 1,620.7 | | | | 3,049.0 | | | | 2,303.5 | | | | 335.0 | |
| | Year Ended December 31, |
| | 2015 | 2016 | 2017 | 2017 |
| | RMB | RMB | RMB | US$ |
| | (in millions) |
| Cost and expenses(1) | (38,360.1) | (32,280.4) | (46,419.0) | (7,134.5) |
| Segment results(2) | (1,386.9) | 2,183.8 | 826.6 | 127.0 |
| Trading: | | | | |
| Revenues | 94,131.1 | 114,345.9 | 146,814.5 | 22,565.0 |
| Cost and expenses(1) | (95,365.7) | (113,536.8) | (146,084.4) | (22,452.8) |
| Segment results(2) | (1,234.6) | 809.1 | 730.1 | 112.2 |
| Energy: | | | | |
| Revenues | 4,290.9 | 4,519.8 | 6,251.0 | 960.8 |
| Cost and expenses(1) | (4,365.1) | (4,486.4) | (6,422.3) | (987.1) |
| Segment results(2) | (74.2) | 33.4 | (171.3) | (26.3) |
| Corporate and others | | | | |
| Revenues | 302.4 | 504.4 | 645.3 | 99.2 |
| Cost and expenses(1) | 431.4 | (2,497.6) | (2,373.9) | (364.9) |
| Segment results(2) | 733.8 | (1,993.2) | (1,728.6) | (265.7) |
| Elimination(3) | 188.1 | (318.0) | 97.6 | 15.0 |
| Total (loss)/profit before income tax | 121.9 | 1,625.5 | 3,006.2 | 462.0 |
| | |
| (1) | Consist of cost of sales, operating expenses, other income, other gains, finance income, finance costs and others attributable to each segment. |
| (2) | Segment results refer to profit/(loss) before income tax. |
| (3) | Elimination refers to the aggregate inter-segment eliminations of segment results of each segment. |
Year Ended December 31, 2018 Compared with Year Ended December 31, 2017
Alumina Segment
Revenues.Total revenue generated by the alumina segment increased by 13.2% from RMB38,997.3 million for the year ended December 31, 2017, to RMB44,150.9 million for the year ended December 31, 2018, primarily due to increases in the sales price and trading volume of alumina in 2018 by 2.6% and 5.0%, respectively, in comparison with 2017.
Revenue from external sales of the alumina segment increased by 1.3% from RMB14,565.4 million for the year ended December 31, 2017, to RMB14,758.4 million for the year ended December 31, 2018, primarily due to increase in the sales prices of the external sales of alumina.
Revenue from inter-segment sales of the alumina segmentincreased by 20.3% from RMB24,431.9 million for the year ended December 31, 2017, to RMB29,392.5 million for the year ended December 31, 2018, primarily due to an increasing demand of alumina by our primary aluminum smelters resulting from the increase in target production volume of our primary aluminum segment in 2018.
Cost and expenses.The total cost and expenses for our alumina segment increased by 13.9% from RMB35,706.4 million for the year ended December 31, 2017, to RMB40,654.5 million for the year ended December 31, 2018, primarily due to the increase in trading volume of alumina.
Segment results.As a result of the foregoing, the segment profit for our alumina segment increased by 6.2% from RMB3,290.9 million for the year ended December 31, 2017 to RMB3,496.4 million for the year ended December 31, 2018.
Primary Aluminum Segment
Revenues.Total revenue generated by the primary aluminum segment increased by 13.9% from RMB47,245.6 million for the year ended December 31, 2017, to RMB53,802.2 million for the year ended December 31, 2018, primarily due to the increase in the trading volume of primary aluminum, partially offset by the decrease in the sales price of primary aluminum. In comparison with 2017, the trading volume and sales price of primary aluminum increased by 15.5% and decreased by 1.7%, respectively, in 2018.
Revenue from external sales of the primary aluminum segment increased by 13.1% from RMB36,551.9 million for the year ended December 31, 2017, to RMB41,344.3 million for the year ended December 31, 2018, primarily due to the increase in the trading volume for external sales of primary aluminum.
Revenue from inter-segment sales of primary aluminum segment increased by 16.5% from RMB10,693.7 million for the year ended December 31, 2017, to RMB12,457.9 million for the year ended December 31, 2018, primarily due to the increase in the trading volume for inter-segment sales of primary aluminum.
Cost and expenses.The total cost and expenses for our primary aluminum segment increased by 17.9% from RMB46,419.0 million for the year ended December 31, 2017, to RMB54,731.5 million for the year ended December 31, 2018, primarily due to the increase in the trading volume of primary aluminum. In addition, the increases in the purchase prices of alumina and anode also contributed to the increases in cost and expenses. In comparison with 2017, the purchase prices of alumina and anode increased by 3.5% and 11.5%, respectively, in 2018.
Segment results.We had a segment profit of RMB826.6 million for the year ended December 31, 2017, whereas we incurred a segment loss of RMB929.3 million for the year ended December 31, 2018. This was mainly attributable to the increases in purchase prices of alumina and anode and the decrease in the sales price of primary aluminum.
Trading Segment
Revenues.Total revenue generated by the trading segment decreased by 3.3% from RMB146,854.7 million for the year ended December 31, 2017 to RMB142,016.6 million for the year ended December 31, 2018, primarily due to the decrease in the revenue generated from the external sales of our trading segment.
Revenue from external sales of the trading segment decreased by 5.7% from RMB123,695.6 million for the year ended December 31, 2017 to RMB116,646.3 million for the year ended December 31, 2018, mainly due to conversion of certain trading segment subsidiaries making external sales or their businesses into joint ventures.
Revenue from internal sales of the trading segment increased by 9.5% from RMB23,159.1 million for the year ended December 31, 2017 to RMB25,370.3 million for the year ended December 31, 2018, primarily due to the increase in the inter-segment trading volume of alumina and primary aluminum as a result of the increase in target production volume of our primary aluminum segment.
Cost and expenses.The total cost and expenses for our trading segment decreased by 3.3% from RMB146,121.0 million for the year ended December 31, 2017 to RMB141,237.1 million for the year ended December 31, 2018, mainly due to the conversion of certain trading segment subsidiaries or their businesses into joint ventures.
Segment results.As a result of the foregoing, the segment profit for our trading segment decreased by 6.2% from RMB733.7 million for the year ended December 31, 2017 to RMB779.5 million for the year ended December 31, 2018.
Energy Segment
Revenues.Total revenue generated by the energy segment increased by 15.7% from RMB6,251.0 million for the year ended December 31, 2017 to RMB7,235.3 million for the year ended December 31, 2018, primarily due to the increases in revenues of coal and electricity by 9.22% and 40.45%, respectively, in comparison with 2017.
Revenue from external sales of the energy segment increased by 22.7% from RMB5,733.7 million for the year ended December 31, 2017 to RMB7,037.0 million for the year ended December 31, 2018, primarily due to the increase in trading volume of electricity resulting from the acquisition of an electricity plant by Ningxia Energy in September 2017.
Revenue from internal sales of the energy segment decreased by 61.7% from RMB517.3 million for the year ended December 31, 2017 to RMB198.3 million for the year ended December 31, 2018, primarily due to a reduction of inter-company services provided by our energy segment subsidiaries and a decrease in the inter-segment trading volume of coals.
Cost and expenses.The total cost and expenses for our energy segment increased by 12.3% from RMB6,422.3 million for the year ended December 31, 2017 to RMB7,209.3 million for the year ended December 31, 2018, primarily due to the increase in trading volume of electricity.
Segment results.We recorded a segment loss of RMB171.3 million for the year ended December 31, 2017, whereas we had a segment profit of RMB26.0 million for the year ended December 31, 2018. This was mainly attributable to the increase in revenue generated from external sales of the energy segment following acquisition of a new electricity plant in September 2017.
Corporate and Other Operating Segment
Revenues. Revenue from the corporate and other operating segment remained stable from RMB645.3 million for the year ended December 31, 2017 to RMB667.2 million for the year ended December 31, 2018.
Segment results. The segment loss for our corporate and other operate segment decreased from RMB1,728.6 million for the year ended December 31, 2017 to RMB1,267.1 million for the year ended December 31, 2018, primarily due to gains resulted from the increase in our equity value in certain entities that were converted from joint ventures and associates to our subsidiaries during the year and were therefore re-measured in connection with such conversion.
Year Ended December 31, 2017 Compared with Year Ended December 31, 2016
Alumina Segment
Revenues.Total revenue generated by the alumina segment increased by 26.8%29.9% from RMB30,027.3 million for the year ended December 31, 2016 to RMB38,079.1RMB 38,997.3 million for the year ended December 31, 2017, primarily due to the increase in the price and trading volume of alumina. Specifically, the revenue of alumina, the main product of alumina segment, increased by RMB9,061.8 million, partially offset by the decrease of revenue of other products amounting to RMB1,010.0 million. The sales price and volume of alumina in 2017 increased by 38.6% and 3.4%, respectively, in comparison with 2016.
Revenue from external sales of the alumina segment increased by 43.6%53.0% from RMB9,518.9RMB9,518.8 million for the year ended December 31, 2016, to RMB13,665.8RMB 14,565.4 million for the year ended December 31, 2017, primarily due to the increase in the price of the external sales of alumina.
Revenue from inter-segment sales of the alumina segment increased from RMB20,508.4RMB20,508.5 million for the year ended December 31, 2016, to RMB24,413.3RMB 24,431.9 million for the year ended December 31, 2017.
Cost and expenses.The total cost and expenses for our alumina segment increased from RMB29,116.9 million for the year ended December 31, 2016, to RMB34,827.3RMB35,706.4 million for the year ended December 31, 2017, primarily due to the increase in the prices of bauxite, other raw materials and energy.
Segment results.The segment profit for our alumina segment significantly increased from RMB910.4 million for the year ended December 31, 2016 to RMB3,251.8RMB3,290.9 million for the year ended December 31, 2017, primarily due to the increase in profit margin and trading volume.
Primary Aluminum Segment
Revenues.Total revenue generated by the primary aluminum segment increased by 37.1%34.6% from RMB34,464.2RMB 35,089.9 million for the year ended December 31, 2016 to RMB47,245.6RMB 47,245.6 million for the year ended December 31, 2017, primarily due to the increase in trading volume and price of primary aluminum. Specifically, the revenue of primary aluminum and aluminum alloy increased by RMB7,415.5 million and RMB4,182.8 million, respectively. The sales price and volume of primary aluminum increased by 16.5% and 14.8%, and the sales price and volume of aluminum alloy products increased by 16.0% and 17.5% in comparison with 2016.
Revenue from external sales of the primary aluminum segment increased by 24.0% from RMB29,482.3 million for the year ended December 31, 2016 to RMB36,552.0 million for the year ended December 31, 2017, primarily due to increase in the price and trading voulmevolume for the external sales of primary aluminum. Specifically, the sales price and volume of primary aluminum increased by 16.5% and 6.8%, respectively, and the sales price and volume of aluminum alloy products increased by 16.0% and 13.3%, respectively, in comparison with 2016.
Revenue from inter-segment sales of primary aluminum segment increased from RMB4,981.9 million for the year ended December 31, 2016, to RMB10,693.6RMB10,693.7 million for the year ended December 31, 2017, primarily due to the increase in price of inter-segment sales of primary aluminum.
Cost and expenses.The total cost and expenses for our primary aluminum segment increased from RMB32,280.4RMB32,906.1 million for the year ended December 31, 2016, to RMB46,419.0 million for the year ended December 31, 2017, primarily due to the increase in the prices of alumina and electricity and trading volume of primary aluminum.
Segment results.The segment profit for our primary aluminum segment decreased from RMB2,183.8 million for the year ended December 31, 2016 to RMB826.6 million for the year ended December 31, 2017, primarily due to the increase in the price of alumina and the costs of electricity consumed in primary aluminum smelting.
Trading Segment
Revenues.Total revenue generated by the trading segment increased from RMB114,345.9 million for the year ended December 31, 2016 to RMB146,814.5RMB146,854.7 million for the year ended December 31, 2017, primarily due to the increase in prices and trading volume and prices of main products, such as alumina, aluminum alloy, copper and zinc. Specifically, the sales volume of our trading segment is large, and there are many types of products, including nearly 20 types of products, such as alumina, primary aluminum, aluminum alloy, coal, copper, lead and zinc. As our sales and purchasing platform, the trading segment has frequent transactions with both internal enterprises and external customers. In 2017, influenced by the market condition, the sales prices increased. Meanwhile, sales volume of most products increased. For example, the sales prices of alumina, copper and zinc increased by more than 20%, the prices of raw and auxiliary materials, such as caustic soda and petroleum coke, increased by more than 50%, and the sales volume of aluminum alloy, copper, lead, iron ore and anode products also increased.
Revenue from external sales of the trading segment increased from RMB100,439.4RMB100,439.5 million for the year ended December 31, 2016 to RMB123,655.4RMB123,695.6 million for the year ended December 31, 2017, primarily due to the increase in prices and trading volume of the external trading of main products, such as alumina, aluminum alloy, copper and zinc.
Revenue from internal sales of the trading segment increased from RMB13,906.5RMB13,906.4 million for the year ended December 31, 2016 to RMB23,159.1 million for the year ended December 31, 2017, primarily due to the increase in prices and trading volume of the inter-segment trading of main products, such as alumina and coal.
Cost and expenses.The total cost and expenses for our trading segment increased from RMB113,536.8RMB113,541.7 million for the year ended December 31, 2016 to RMB146,084.4RMB146,121.0 million for the year ended December 31, 2017, primarily due to the increase in purchasing prices and trading volume.
Segment results.The segment profit for our trading segment decreased from RMB809.1RMB804.2 million for the year ended December 31, 2016 to RMB730.1RMB733.7 million for the year ended December 31, 2017. This was mainly attributable to the decrease in profit margin.
Energy Segment
Revenues.Total revenue generated by the energy segment increased from RMB4,519.8 million for the year ended December 31, 2016 to RMB6,251.0 million for the year ended December 31, 2017, primarily due to the increase in the price and trading volume of coal.
Revenue from external sales of the energy segment increased from RMB4,382.3 million for the year ended December 31, 2016 to RMB5,733.7 for the year ended December 31, 2017, primarily due to the increase in the price and trading volume of the external sales of coal.
Revenue from internal sales of the energy segment increased from RMB137.5 million for the year ended December 31, 2016 to RMB517.3 million for the year ended December 31, 2017, primarily due to the increase in price and trading volume of the inter-segment sales of coal.
Cost and expenses.The total cost and expenses for our energy segment increased from RMB4,486.4 million for the year ended December 31, 2016 to RMB6,422.3 million for the year ended December 31, 2017, primarily due to the increase in trading volume of coal.
Segment results.We had a segment profit of RMB33.4 million for the year ended December 31, 2016, whereas we recorded a segment loss of RMB171.3 million for the year ended December 31, 2017. This was mainly because we incurred gains on disposal of non-current assets in 2016.
Corporate and Other Operating Segment
Revenues. Revenue from the corporate and other operating segment increased from RMB504.4RMB504.3 million for the year ended December 31, 2016 to RMB645.3 million for the year ended December 31, 2017.
Segment results. The segment loss for our corporate and other operate segment decreased from RMB1,993.2 million for the year ended December 31, 2016 to RMB1,728.6 million for the year ended December 31, 2017.
Year Ended December 31, 2016, Compared with Year Ended December 31, 2015
Alumina Segment
Revenues.B. Total revenue generated by the alumina segment decreased by 10.4% from RMB33,497.3 million for the year ended December 31, 2015, to RMB30,027.3 million for the year ended December 31, 2016, primarily due to a decrease in average selling price of alumina.Liquidity and Capital Resources
Revenue from external sales of the alumina segment increased by 38.9% from RMB6,853.4 million for the year ended December 31, 2015, to RMB9,518.9 million for the year ended December 31, 2016, primarily due to the increase in the external sales volume of alumina.
Revenue from inter-segment sales of the alumina segment decreased from RMB26,643.9 million for the year ended December 31, 2015, to RMB20,508.4 million for the year ended December 31, 2016.
Cost and expenses.The total cost and expenses for our alumina segment decreased from RMB31,601.6 million for the year ended December 31, 2015, to RMB29,116.9 million for the year ended December 31, 2016, primarily due to a decrease in the prices of materials and energy and improvement in energy efficiency during the manufacturing process.
Segment results.The segment profit for our alumina segment decreased from RMB1,895.7 million for the year ended December 31, 2015 to RMB910.4 million for the year ended December 31, 2016, primarily due to gains from remeasurement of remaining equity interest in Shanxi Huaxing recognized in 2015 and a decrease of approximately 15% in the price of alumina, partially offset by the decrease of approximate 12% in cost.
Primary Aluminum Segment
Revenues.Total revenue generated by the primary aluminum segment decreased from RMB36,973.2 million for the year ended December 31, 2015, to RMB34,464.2 million for the year ended December 31, 2016, primarily due to decreases in the sales volume of our primary aluminum products.
Revenue from external sales of the primary aluminum segment increased from RMB28,111.8 million for the year ended December 31, 2015, to RMB29,482.3 million for the year ended December 31, 2016, primarily due to increase in the average external selling price in our primary aluminum products.
Revenue from inter-segment sales of primary aluminum segment decreased from RMB8,861.4 million for the year ended December 31, 2015, to RMB4,981.9 million for the year ended December 31, 2016.
Cost and expenses.The total cost and expenses for our primary aluminum segment decreased from RMB38,360.1 million for the year ended December 31, 2015, to RMB32,280.4 million for the year ended December 31, 2016, primarily due to the decreases in prices of raw materials and electricity and sales volume of our primary aluminum products.
Segment results.Segment loss for our primary aluminum segment was RMB1,386.9 million for the year ended December 31, 2015 whereas we had a segment profit of RMB2,183.8 million for our primary aluminum segment for the year ended December 31, 2016. This was mainly attributable to a year-on-year decrease of approximately 17% in the costs of primary aluminum products.
Trading Segment
Revenues.Total revenue generated by the trading segment increased from RMB94,131.1 million for the year ended December 31, 2015 to RMB114,345.9 million for the year ended December 31, 2016, primarily due to increase in trading volume.
Revenue from external sales of the trading segment increased from RMB84,222.2 million for the year ended December 31, 2015 to RMB100,439.4 million for the year ended December 31, 2016, primarily due to increase in trading volume.
Revenue from internal sales of the trading segment increased from RMB9,908.9 million for the year ended December 31, 2015 to RMB13,906.5 million for the year ended December 31, 2016.
Cost and expenses.The total cost and expenses for our trading segment increased from RMB95,365.7 million for the year ended December 31, 2015 to RMB113,536.8 million for the year ended December 31, 2016, primarily due to increase in trading volume.
Segment results.We incurred segment loss for our trading segment of RMB1,234.6 million for the year ended December 31, 2015 whereas we had a segment profit of RMB809.1 million for the year ended December 31, 2016. This was mainly attributable to the increase in selling prices of the products and timely destocking.
Energy Segment
Revenues.Total revenue generated by the energy segment slightly increased from RMB4,290.9 million for the year ended December 31, 2015 to RMB4,519.8 million for the year ended December 31, 2016.
Revenue from external sales of the energy segment slightly increased from RMB4,192.8 million for the year ended December 31, 2015 to RMB4,382.3 million for the year ended December 31, 2016.
Revenue from internal sales of the energy segment increased from RMB98.1 million for the year ended December 31, 2015 to RMB137.5 million for the year ended December 31, 2016.
Cost and expenses.The total cost and expenses for our energy segment slightly increased from RMB4,365.1 million for the year ended December 31, 2015 to RMB4,486.4 million for the year ended December 31, 2016.
Segment results.We incurred a segment loss of RMB74.2 million for the year ended December 31, 2015, whereas we had a segment profit of RMB33.4 million for the year ended December 31, 2016. This was mainly attributable to gains on disposal of environmental protection business.
Corporate and Other Operating Segment
Revenues. Revenue from the corporate and other operating segment increased from RMB302.4 million for the year ended December 31, 2015 to RMB504.4 million for the year ended December 31, 2016.
Segment results. We had segment profit of RMB733.8 million for the year ended December 31, 2015 whereas we incurred a segment loss of RMB1,993.2 million for the year ended December 31, 2016. This was mainly attributable to gains from capital operation in 2015, while it did not occur in 2016.
B. | Liquidity and Capital Resources |
Historically, our primary sources of funding have been cash generated from operating activities, prepayments and deposits from customers, bank and other loans and proceeds from equity or notes and bonds offerings. Our primary uses of funds have been working capital for production, capital expenditures and repayments of short-term, medium-term and long-term borrowings.
As of December 31, 2017,2018, our current assets amounted to RMB68,349.3RMB58,895.2 million, representing an increasea decrease of 2.8%14.2% from RMB66,486.7RMB68,644.3 million as of December 31, 2016.2017, primarily because we strengthened capital turnover and reduced monetary capital reserves. As of December 31, 2017,2018, our trade and notes receivable amounted to RMB8,026.2RMB8,100.5 million, representing an increase of 9.2%1.1% from RMB7,349.6RMB8,008.9 million as of December 31, 2016.2017. As of December 31, 2017,2018, our restricted cash and time deposits and cash and cash equivalents balance amounted to RMB29,903.2RMB2,165.3 million, representing an increase of 15.5% from RMB25,901.2remaining stable as compared to RMB2,168.2 million as of December 31, 2016, primarily due to an increase in cash and cash equivalents.2017.
As of December 31, 2017,2018, our current liabilities amounted to RMB89,976.9RMB74,748.6 million, representing an increasea decrease of 8.2%17.3% from RMB83,179.8RMB90,337.1 million as of December 31, 2016,2017, primarily due to the increasedecrease in our bonds payable and long-term borrowings reclassified to be due within one year.short-term interest-bearing liabilities resulting from optimizing debt structure.
As of December 31, 2017,2018, our net current liabilities amounted to RMB21,627.6RMB15,853.4 million, representing an increasea decrease of 29.6%26.9% from RMB16,693.1RMB21,692.8 million as of December 31, 2016.2017. As of December 31, 2017,2018, our current ratio (current assets/current liabilities) was 0.76,0.79, compared with 0.800.76 as of December 31, 2016.2017. Our quick ratio ((current assets - inventories - prepayments)/current liabilities) was 0.49 as of December 31, 2018, compared with 0.52 as of December 31, 2017, compared with 0.55 as of December 31, 2016.2017.
We have considered our available sources of funds as follows:
Our expected net cash inflows from operating activities in 2018;
As of December 31, 2017, we had total banking facilities of approximately RMB152,080 million, of which RMB69,414 million had been utilized and unutilized banking facilities amounted to RMB82,666 million as of December 31, 2017, among which, banking facilities of approximately RMB56,104 million will be subject to renewal during the next 12 months from January 1, 2018. We are confident that all banking facilities could be renewed upon their expiration based on our past experience with banks and our good credit standing; and
Other available sources of financing from banks and other financial institutions based on our good credit history.
| ● | Our expected net cash inflows from operating activities in 2019; |
| ● | As of December 31, 2018, we had total banking facilities of approximately RMB183,129 million, of which RMB61,611 million had been utilized and unutilized banking facilities amounted to RMB121,518 million as of December 31, 2018, among which, banking facilities of approximately RMB92,582 million will be subject to renewal during the next 12 months from January 1, 2019. We are confident that all banking facilities could be renewed upon their expiration based on our past experience with banks and our good credit standing; and |
| ● | Other available sources of financing from banks and other financial institutions based on our good credit history. |
We believe that we have adequate resources to continue in operational existence for the foreseeable future not less than 12 months from December 31, 2017.2018. The Board therefore continues to adopt the going concern basis in preparing these financial statements.
Cash Flows and Working Capital
The following table sets forth a condensed summary of our statement of cash flows for the periods indicated:
| | Year Ended December 31, |
| | 2015 | 2016 | 2017 | 2017 |
| | RMB | RMB | RMB | US$ |
| | (in millions) |
| Net cash flows generated from operating activities | 7,317.7 | 11,530.4 | 13,127.8 | 2,017.7 |
| Net cash flows generated from/(used in) investing activities | 2,392.6 | (4,998.6) | (7,133.4) | (1,096.4) |
| Net cash flows used in financing activities | (5,448.0) | (3,671.9) | (1,835.9) | (282.2) |
| | Year Ended December 31, |
| | 2015 | 2016 | 2017 | 2017 |
| | RMB | RMB | RMB | US$ |
| | (in millions) |
| Net increase in cash and cash equivalents | 4,262.3 | 2,859.9 | 4,158.5 | 639.1 |
| | | Year Ended December 31, | |
| | | 2016 | | | 2017 | | | 2018 | | | 2018 | |
| | | RMB | | | RMB | | | RMB | | | US$ | |
| | | (in millions) | |
| Net cash flows generated from operating activities | | | 11,609.3 | | | | 13,205.6 | | | | 13,018.2 | | | | 1,893.4 | |
| Net cash flows used in investing activities | | | (2,626.9 | ) | | | (5,597.5 | ) | | | (5,528.4 | ) | | | (804.1 | ) |
| Net cash flows used in financing activities | | | (6,105.2 | ) | | | (3,399.0 | ) | | | (16,266.5 | ) | | | (2,365.9 | ) |
| Net increase/(decrease) in cash and cash equivalents | | | 2,877.2 | | | | 4,209.1 | | | | (8,776.7 | ) | | | (1,276.5 | ) |
Net Cash Flows Generated from Operating Activities
For the year ended December 31, 2018, we had cash inflows before changes in working capital but after adjustment for non-cash items and non-operating cash items of RMB14,230.4 million and net cash generated from operating activities of RMB13,018.2 million. The adjustment primarily consisted of non-cash and non-operating activities items such as depreciation of property, plant and equipment of RMB7,499.3 million and finance cost of RMB4,882.5 million, and outflows of RMB264.6 million for changes in working capital and outflows of income tax of RMB947.7 million. The outflows from changes in working capital consisted primarily of (i) an increase in trade and notes receivables of RMB2,486.2 million and (ii) a decrease in other payables and accrued liabilities of RMB945.3 million, and partially offset by (i) a decrease in inventories of RMB1,194.5 million and (ii) a decrease in other current assets of RMB916.7 million.
For the year ended December 31, 2017, we had cash inflows before changes in working capital but after adjustment for non-cash items and non-operating cash outflowsitems of RMB14,708.4RMB14,710.6 million and net cash generated from operating activities of RMB13,127.8RMB13,205.6 million. The adjustment primarily consisted of non-cash and non-operating activities items such as depreciation of property, plant and equipment of RMB6,606.3RMB6,554.8 million and finance cost of RMB5,189.9RMB5,203.4 million, and outflows of RMB632.7RMB555.7 million for changes in working capital and outflows of income tax of RMB947.9RMB949.4 million. The outflows from changes in working capital consisted primarily of (i) an increase in inventories of RMB2,605.9RMB2,656.0 million and (ii) an increase in trade and notes receivables of RMB2,123.2RMB1,962.0 million, and partially offset by (i) an increase in other payables and accrued liabilities of RMB1,875.0RMB1,672.7 million, (ii) an increase in trade and notes payables of RMB1,511.9RMB1,599.3 million and (iii) a decrease in other current assets of RMB1,275.5 million.
For the year ended December 31, 2016, we had cash inflows before changes in working capital but after adjustment for non-cash items and non-operating cash outflowsitems of RMB13,160.4RMB13,177.1 million and net cash generated from operating activities of RMB11,530.4RMB11,609.3 million. The adjustment consisted primarily of non-cash and non-operating activities items such as realized and unrealized loss on futures, option and forward contracts of RMB1,135.7 million, finance cost of RMB5,019.9 million, net gains on disposal of other property, plant and equipment and land use rights of RMB816.7 million and depreciation of property, plant and equipment of RMB6,577.5RMB6,590.2 million and outflows of RMB1,575.1RMB1,511.9 million for changes in working capital and outflows of income tax of RMB54.9RMB55.9 million. The outflows from changes in working capital consisted primarily of (i) an increase in trade and notes receivables of RMB3,679.8RMB3,655.7 million and (ii) a decrease in trade and notes payable of RMB3,401.5RMB3,405.7 million, and partially offset by (i) a decrease in inventories of RMB2,412.8RMB2,398.0 million and (ii) a decrease in other current assets of RMB3,466.5RMB3,463.8 million.
For the year ended December 31, 2015, we had cash inflows before changes in working capital but after adjustment for non-cash items and non-operating cash outflows of RMB7,395.7 million and net cash generated from operating activities of RMB7,317.7 million. The adjustment consisted primarily of non-cash and non-operating activities items such as finance cost of RMB5,979.5 million, gains on disposal and deemed disposal of RMB2,569.3 million, net gains on disposal of other property, plant and equipment and land use rights of RMB2,317.9 million and depreciation of property, plant and equipment of RMB6,945.0 million and inflows of RMB199.4 million for changes in working capital and outflows of income tax of RMB277.4 million. The inflows from changes in working capital consisted primarily of (i) a decrease in inventories of RMB1,805.1 million and (ii) an increase in other payables and accrued liabilities of RMB1,024.2 million, partially offset by an increase in other current assets of RMB804.8 million.
Net Cash Flows Generated from /(Used in)in Investing Activities
The net cash flows used in investing activities was RMB7,133.4remained stable from RMB5,597.5 million for the year ended December 31, 2017 whereasto RMB5,528.4 for the year ended December 31, 2018. In 2016, we had net cash flows used in investing activities was RMB4,998.6 million for the year ended December 31, 2016. This was mainly attributable to an increase in our capital expenditure. In 2015, we had net cash flows generated from investing activities of RMB2,392.6RMB2,626.9 million.
Net Cash Flows Used in Financing Activities
The net cash flows used in financing activities were RMB1,835.9RMB16,266.5 for the year ended December 31, 2018, representing an increase of RMB12,867.5 million from the net outflows of RMB3,399.0 million for the year ended December 31, 2017, mainly because we received capital injection from non-controlling shareholders in 2017 resulting from the Asset Restructuring and the net cash outflow from the proceeds and repayments of our major debts increased in 2018 as compared to 2017. Our net cash used in financing activities for the year ended December 31, 2018, consisted primarily of repayments of short-term and long-term loans of RMB70,546.5 million, repayments of bonds and notes of RMB21,815.0 million and repayments of gold leasing arrangement of RMB7,519.3 million, partially offset by drawdown of short-term and long-term loans of RMB76,899.6 million and proceeds from issuance of short-term bonds and medium-term notes (net of issuance costs) of RMB13,185.0 million.
The net cash flows used in financing activities were RMB3,399.0 for the year ended December 31, 2017, representing a decrease of net cash outflows of RMB1,836.0RMB2,706.3 million from the net outflows of RMB3,671.9RMB6,105.3 million for the year ended December 31, 2016, mainly because of the capital injection from non-controlling shareholders of RMB12,717.8RMB12,718.8 million and that we incurred net cash inflows from the drawdown and repayment of interest-bearing loans in 2017 whereas we incurred net cash outflows from the same activities in 2016. Our net cash used in financing activities for the year ended December 31, 2017, consisted primarily of repayments of short-term and long-term loans of RMB78,673.5RMB78,866.5 million, repayments of short-term bonds and medium-term notes of RMB16,300.0 million and interest payments of RMB5,217.0RMB5,233.0 million, partially offset by drawdown of short-term and long-term loans of RMB83,523.7RMB83,758.7 million and capital injection from non-controlling shareholders of RMB12,717.8RMB12,718.8 million.
The net cash flows used in financing activities were RMB3,671.9 million for the year ended December 31, 2016, representing a decrease of net cash outflows of RMB1,776.1 million from the net outflows of RMB5,448.0 million for the year ended December 31, 2015, mainly attributable to decrease in cash outflow for repayments of short-term and long-term loans. Our net cash used in financing activities for the year ended December 31, 2016, consisted primarily of repayments of short-term and long-term loans of RMB48,648.6 million, repayments of short-term bonds and medium-term notes of RMB13,500.0 million and interest payments of RMB5,128.4 million, partially offset by drawdown of short-term and long-term loans of RMB44,691.9 million and proceeds from issuance of bonds and notes, net of issuance costs, of RMB11,070.7 million.
Loans and Borrowings
During the past years, we engaged in debt financing to fund our operations and business expansion. As of December 31, 20162017 and 2017,2018, our gearing ratio (net debts/total capital attributable to owners of the parent as defined in Note 36.3 to our audited consolidated financial statements) was approximately 74%72% and 72%68%, respectively.
| | As of December 31, |
| | 2016 | 2017 | 2017 |
| | RMB | RMB | US$ |
| | (in millions) |
| Short-term loans and borrowings | | | |
| Short-term bank and other loans | 32,321.8 | 30,834.4 | 4,739.2 |
| Short-term bonds | 8,020.0 | 3,601.6 | 553.6 |
| Gold leasing arrangements | 2,990.6 | 6,818.4 | 1,048.0 |
| Current portion of finance lease payable | 2,008.7 | 2,115.6 | 325.2 |
| Current portion of medium-term notes | 8,393.1 | 12,492.4 | 1,920.0 |
| Current portion of long-term bank and other loans | 4,725.2 | 6,890.2 | 1,058.9 |
| Sub-total | 58,459.4 | 62,752.6 | 9,644.9 |
| Long-term loans and borrowings | | | |
| Finance lease payable | 6,692.3 | 5,607.6 | 861.9 |
| Long-term bank and other loans | 31,700.3 | 40,483.3 | 6,222.2 |
Medium-term notes and bonds and
long-term bonds | 24,057.1 | 15,697.0 | 2,412.6 |
| Less: | | | |
| Current portion of medium-term notes | (8,393.1) | (12,492.4) | (1,920.0) |
| Current portion of long-term bank and other loans | (4,725.2) | (6,890.2) | (1,059.1) |
| Current portion of finance lease payable | (2,008.7) | (2,115.6) | (325.2) |
| Sub-total | 47,322.7 | 40,289.7 | 6,192.4 |
| Total borrowings | 105,782.1 | 103,042.3 | 15,837.3 |
| Less: Bank balances and cash | 25,901.1 | 29,903.2 | 4,596.0 |
| Net | 79,881.0 | 73,139.1 | 11,241.3 |
| | | As of December 31, | |
| | | 2017 | | | 2018 | | | 2018 | |
| | | RMB | | | RMB | | | US$ | |
| | | (in millions) | |
| Short-term loans and borrowings | | | | | | | | | | | | |
| Short-term bank and other loans | | | 31,041.4 | | | | 39,296.2 | | | | 5,715.4 | |
| Short-term bonds | | | 3,601.6 | | | | 500.0 | | | | 72.7 | |
| Gold leasing arrangements | | | 6,818.4 | | | | 1,607.9 | | | | 233.9 | |
| Current portion of finance lease payable | | | 2,115.6 | | | | 2,328.4 | | | | 338.7 | |
| Current portion of medium-term notes | | | 12,492.4 | | | | 396.7 | | | | 57.7 | |
| Current portion of long-term bank and other loans | | | 6,911.7 | | | | 3,384.4 | | | | 492.2 | |
| Sub-total | | | 62,981.1 | | | | 47,513.6 | | | | 6,910.6 | |
| Long-term loans and borrowings | | | | | | | | | | | | |
| Finance lease payable | | | 5,607.6 | | | | 4,081.3 | | | | 593.6 | |
| Long-term bank and other loans | | | 40,504.8 | | | | 46,140.7 | | | | 6,710.9 | |
Medium-term notes and bonds and
long-term bonds | | | 15,697.0 | | | | 10,094.9 | | | | 1,468.2 | |
| Less: | | | | | | | | | | | | |
| Current portion of medium-term notes and long-term bonds | | | (12,492.4 | ) | | | (396.7 | ) | | | (57.7 | ) |
| Current portion of long-term bank and other loans | | | (6,911.7 | ) | | | (3,384.4 | ) | | | (492.2 | ) |
| Current portion of finance lease payable | | | (2,115.6 | ) | | | (2,328.4 | ) | | | (338.7 | ) |
| Sub-total | | | 40,289.7 | | | | 54,207.4 | | | | 7,884.1 | |
| Total borrowings | | | 103,270.8 | | | | 101,721.0 | | | | 14,794.7 | |
| Less: Bank balances and cash | | | 30,004.1 | | | | 21,296.0 | | | | 3,097.4 | |
| Net | | | 73,266.7 | | | | 80,425.0 | | | | 11,697.3 | |
Bank and Other Loans
The weighted average annual interest rate of short-term bank and other loans for the year end December 31, 2017,2018 was 4.43%4.52%. Our short-term bank and other loans will mature within one year.
The weighted average annual interest rate of long-term bank and other loans for the years ended December 31, 2017,2018 was 5.67%4.78%. The following table sets forth the aggregate maturities of our outstanding long-term bank and other loans as of December 31, 2017:2018:
| | As of December 31, 2017 | | As of December 31, 2018 | |
| | RMB | US$ | | RMB | | US$ | |
| | (in millions) | | (in millions) | |
| Within 1 year | 6,890.1 | 1,059.1 | | | 3,382.3 | | | | 492.0 | |
| Between 1 and 2 years | 5,174.0 | 795.2 | | | 7,375.6 | | | | 1,072.7 | |
| Between 2 and 5 years | 8,673.8 | 1,333.1 | | | 16,586.4 | | | | 2,412.4 | |
| Over 5 years | 19,745.4 | 3,034.8 | | | 18,777.3 | | | | 2,731.0 | |
| Total | 40,483.3 | 6,222.2 | | | 46,121.5 | | | | 6,708.1 | |
As of December 31, 2017,2018, we had secured loans of RMB16,008.2RMB13,829.4 million (including long-term and short-term loans). As of December 31, 2017,2018, long-term loans and borrowings amounting to RMB11,932RMB11,509 million (current portion of RMB997RMB1,354 million and non-current portion of RMB10,935RMB10,155 million) were secured by the contractual right to charge users for electricity generated in the future and no short-term loans and borrowings were secured by letters of credit.
As of December 31, 2017,2018, we had foreign currency denominated loans with a principal amount of RMB21RMB19 million in Japanese Yen and RMB1,860RMB1,259 million in U.S. dollars.
Notes and Bonds
The following table sets forth the face value, maturity, effective interest rate and outstanding amount of our outstanding long-term bonds and medium-term notes as of December 31, 2017:2018:
| | Face value/maturity | Effective
interest rate | December 31,
2017 |
| | (RMB in thousands) |
| 2015 medium-term notes | 3,000,000/2018 | 5.53% | 2,999,030 |
| 2015 medium-term notes | 1,500,000/2018 | 5.01% | 1,496,503 |
| 2013 medium-term bonds | 3,000,000/2018 | 5.99% | 2,999,211 |
| 2015 medium-term bonds | 3,000,000/2018 | 6.11% | 2,999,359 |
| 2015 medium-term bonds | 2,000,000/2018 | 6.08% | 1,998,275 |
| 2016 private placement notes | 3,215,000/2019 | 5.12% | 3,204,583 |
| Total | | | 15,696,961 |
| | | Face value/maturity | | | Effective
interest rate | | | December 31,
2018 | |
| | | (RMB in thousands) | |
| 2016 private placement notes | | | 3,215,000/2019 | | | | 5.12 | % | | | 396,727 | |
| 2018 medium-term notes | | | 2,000,000/2021 | | | | 5.84 | % | | | 1,986,418 | |
| 2018 medium-term bonds | | | 1,100,000/2021 | | | | 4.66 | % | | | 1,097,003 | |
| 2018 medium-term bonds | | | 900,000/2023 | | | | 5.06 | % | | | 897,820 | |
| 2018 medium-term bonds | | | 1,400,000/2021 | | | | 4.30 | % | | | 1,395,970 | |
| 2018 medium-term bonds | | | 1,600,000/2023 | | | | 4.57 | % | | | 1,595,311 | |
| 2018 US dollar medium-term bonds | | | 2,785,840/2021 | | | | 5.25 | % | | | 2,725,612 | |
| Total | | | | | | | | | | | 10,094,861 | |
The following table sets forth face value, maturity, effective interest rate and outstanding amount of our outstanding short-term bonds as of December 31, 2017:2018:
| | Face value /maturity | Effective
interest rate | December 31,
2017 |
| | (RMB in thousands) |
| 2017 short-term bonds | 3,000,000/2018 | 4.30% | 3,101,573 |
| 2017 short-term bonds | 500,000/2018 | 4.90% | 500,000 |
| Total | | | 3,601,573 |
| | Face value /maturity | | | Effective
interest rate | | | December 31,
2018 | |
| | (RMB in thousands) | |
| 2018 Ningxia short-term bonds | | | 500,000/2019 | | | | 5.00 | % | | | 500,000 | |
| Total | | | | | | | | | | | 500,000 | |
Senior Perpetual Capital Securities
Please refer to “Item 4. Information on the Company - A. History and Development of the Company - Senior Perpetual Capital Securities Offering” for further details.
Restriction on Cash Dividends
Our PRC subsidiaries are required to set aside a certain amount of their retained profits each year, if any, to fund certain statutory reserves and these reserves may not be distributed as cash dividends. In addition, when our subsidiaries incur debts on their own behalf, the instruments governing the debt may restrict their ability to pay dividends or make other distributions to us. Our directors are of the view that we will continue to be able to meet our borrowing payment obligations as they fall due from cash generated from our operating activities.
Capital Expenditures and Capital Commitments
The following table sets forth our capital expenditures for the years ended 2015, 2016, 2017 and 2017,2018, and the capital expenditures of each segment as a percentage of our total capital expenditures for the periods indicated:
| | | Year Ended December 31 | |
| | | 2015 | | | 2016 | | | 2017 | |
| | | | RMB | | | | % | | | | RMB | | | | % | | | | RMB | | | | % | |
| | | (in millions, except percentage) | |
| Alumina | | | 5,528.3 | | | | 53.2 | | | | 2,842.0 | | | | 32.4 | | | | 2,558.7 | | | | 25.5 | |
| Primary aluminum | | | 1,997.2 | | | | 19.3 | | | | 4,121.9 | | | | 46.8 | | | | 5,533.4 | | | | 55.2 | |
| Trading | | | 17.5 | | | | 0.2 | | | | 81.6 | | | | 0.9 | | | | 86.4 | | | | 0.9 | |
| Energy | | | 2,411.6 | | | | 23.3 | | | | 1,609.8 | | | | 18.3 | | | | 1,580.5 | | | | 15.8 | |
| Corporate and others | | | 412.7 | | | | 4.0 | | | | 143.9 | | | | 1.6 | | | | 262.2 | | | | 2.6 | |
| Total | | | 10,367.3 | | | | 100.0 | | | | 8,799.2 | | | | 100.0 | | | | 10,021.2 | | | | 100.0 | |
| | | Year Ended December 31 | |
| | | 2016 | | | 2017 | | | 2018 | |
| | | RMB | | | % | | | RMB | | | % | | | RMB | | | % | |
| | | (in millions, except percentage) | |
| Alumina | | | 2,842.0 | | | | 32.4 | | | | 2,642.4 | | | | 26.1 | | | | 2,665.9 | | | | 29.2 | |
| Primary aluminum | | | 4,121.9 | | | | 46.8 | | | | 5,533.4 | | | | 54.7 | | | | 4,603.3 | | | | 50.4 | |
| Trading | | | 81.6 | | | | 0.9 | | | | 89.6 | | | | 0.9 | | | | 101.9 | | | | 1.1 | |
| Energy | | | 1,609.8 | | | | 18.3 | | | | 1,580.5 | | | | 15.6 | | | | 1,613.2 | | | | 17.7 | |
| Corporate and others | | | 143.9 | | | | 1.6 | | | | 262.2 | | | | 2.6 | | | | 144.0 | | | | 1.6 | |
| Total | | | 8,799.2 | | | | 100.0 | | | | 10,108.0 | | | | 100.0 | | | | 9,128.4 | | | | 100.0 | |
In 2017,2018, we spent approximately RMB10,021RMB9,128.4 million of our capital expenditures (excluding equity interest investments) primarily in investments in energy saving and consumption reduction, environmental governance, resources acquisition and technological research and development.
Our
We expect our estimated capital expansion plan for 2018 requiresexpenditures in 2019 to be a total of approximately RMB12.5 billion, in capital expendituresprimarily for infrastructure and technology upgrading.
As of December 31, 2017,2018, our Group’s contractual but not provided capital commitment to fixed assets investment amounted to RMB2,967.5RMB3,942.9 million.
As of December 31, 2017,2018, our commitment under operating leases amounted to RMB15,315.5RMB12,989.5 million, of which the amount payable within one year was RMB658.6RMB541.5 million, the amount payable from one to five years was RMB2,112.8RMB1,880.1 million and the amount payable after five years was RMB12,544.1RMB10,567.9 million.
As of December 31, 2017,2018, our commitments to make capital contribution to our associates and joint ventures amounted to RMB374.8RMB542.8 million, comprised of the capital contributions of RMB320.0RMB450.0 million to Huaneng Ningxia EnergyChinalco Overseas Development Co., Ltd., RMB21.0RMB10.0 million to Chalco Shituo Intelligence Technology Company Limited,Loudi Zhongyu New Materials Co., Ltd., RMB49.0 million to Zhaoshang Wuchan (Tianjin) Co., Ltd., RMB6.0 million to Chinalco Tendering Co., Ltd. and RMB27.8 million to Shanxi Chalco Taiyue New Materials Co., Ltd. and RMB6.0 million to Chinalco Tendering Company Limited,, respectively.
We expect to use primarily operating cash flow in meeting such commitments with the shortfall to be satisfied by proceeds of bank loans, short-term and long-term bonds and medium-term notes.
C. | Research and Development |
C. Research and Development
Our department of science and technology management is responsible for organizing and coordinating the research and development efforts of the Company. The Zhengzhou Institute, the only organization in China dedicated to aluminum smelting research, is responsible for taking the lead in the research and development of important and key technologies for our operations and providing technology services for our plants. The technology centers at our plants focus on providing solutions for specific issues of each plant and applying our developed technologies. Each of the plants also has opportunities to participate in operational testing and pilot industralizationindustrialization relating to research and development of important and key technologies. We also collaborate with universities and other research institutions in China on some of our complicated projects.
Our total expenditure for research and development was approximately RMB168.9 million, RMB168.9 million and RMB494.6 million in 2015 and 2016 and 2017, respectively.
D. Trend Information
Other than as disclosed elsewhere in this annual report, we are not aware of any trends, uncertainties, demands, commitments or events for the period from January 1, 2017,2018, to December 31, 2017,2018, that are reasonably likely to have a material effect on our revenue, profitability, liquidity or capital resources, or that caused the disclosed financial information to be not necessarily indicative of future operating results or financial conditions.
E. | Off-Balance-Sheet Arrangements |
E. Off-Balance-Sheet Arrangements
There are no off-balance sheet arrangements material to investors that have or are reasonably likely to have a current or future effect on our financial condition, our changes in financial condition, revenue or expenses, results of operations, liquidity, capital expenditures or capital resources.
F. | Tabular Disclosure of Contractual Obligations |
F. Tabular Disclosure of Contractual Obligations
The following table summarizes our contractual obligations and commercial commitments for the periods indicated as of December 31, 2017:2018:
| | Payment due by period |
| | Total | Within 1 year | 1 to 2 years | 2 to 5 years | Thereafter |
| | (RMB in millions) |
| Finance lease payable, including current portion | 6,098.5 | 2,372.0 | 1,762.6 | 1,890.3 | 73.6 |
| Long-term bank and other loans, including current portion | 40,483.3 | 6,890.1 | 5,174.0 | 8,673.8 | 19,745.4 |
| | | | | | |
| Medium-term notes and bonds, including current portion | 15,715.0 | 12,500.0 | 3,215.0 | – | – |
| Short-term bonds | 3,500.0 | 3,500.0 | – | – | – |
| Gold leasing arrangement | 6,818.4 | 6,818.4 | – | – | – |
| Short-term bank and other loans | 30,834.4 | 30,834.4 | – | – | – |
| Interest payables for borrowings | 12,559.9 | 5,282.0 | 2,123.2 | 4,106.0 | 1,048.7 |
| Financial liabilities at fair value through profit or loss | 89.4 | 89.4 | – | – | – |
| Financial liabilities included in other payables and accrued liabilities, excluding accrued interest | 10,307.3 | 10,307.3 | – | – | – |
| Financial liabilities included in other non-current liabilities | 804.4 | – | 107.8 | 108.9 | 587.7 |
| Trade and notes payables | 12,322.0 | 12,322.0 | – | – | – |
| Subtotal | 139,532.6 | 90,915.6 | 12,382.6 | 14,779.0 | 21,455.4 |
| Capital commitments | 2,967.5 | N/A | N/A | N/A | N/A |
| Commitments for capital contribution | 374.8 | N/A | N/A | N/A | N/A |
| Commitments under operating lease | 15,315.5 | 658.6 | 643.8 | 1,469.0 | 12,544.1 |
| Total | 18,657.8 | | | | |
| | | Payment due by period |
| | | Total | | Within 1 year | | 1 to 2 years | | 2 to 5 years | | Thereafter |
| | | (RMB in millions) |
| Finance lease payable, including current portion | | | 4,401.1 | | | | 2,518.7 | | | | 1,161.5 | | | | 707.7 | | | | 13.2 | |
| Long-term bank and other loans, including current portion | | | 46,140.7 | | | | 3,384.4 | | | | 7,378.0 | | | | 16,593.6 | | | | 18,784.8 | |
| Medium-term notes and bonds, including current portion | | | 10,185.8 | | | | 400.0 | | | | — | | | | 9,785.8 | | | | — | |
| Short-term bonds | | | 500.0 | | | | 500.0 | | | | — | | | | — | | | | — | |
| Gold leasing arrangement | | | 1,607.9 | | | | 1,607.9 | | | | — | | | | — | | | | — | |
| Short-term bank and other loans | | | 39,296.2 | | | | 39,296.2 | | | | — | | | | — | | | | — | |
| Interest payables for borrowings | | | 12,547.9 | | | | 4,849.0 | | | | 2,602.8 | | | | 4,197.4 | | | | 898.8 | |
| Financial liabilities at fair value through profit or loss | | | 1.8 | | | | 1.8 | | | | — | | | | — | | | | — | |
| Financial liabilities included in other payables and accrued liabilities, excluding accrued interest | | | 8,855.6 | | | | 8,855.6 | | | | — | | | | — | | | | — | |
| Financial liabilities included in other non-current liabilities | | | 862.5 | | | | — | | | | 108.9 | | | | 333.4 | | | | 420.3 | |
| Trade and notes payables | | | 14,007.6 | | | | 14,007.6 | | | | — | | | | — | | | | — | |
| Subtotal | | | 138,407.2 | | | | 75,421.1 | | | | 11,251.1 | | | | 31,617.9 | | | | 20,117.1 | |
| Capital commitments | | | 3,942.9 | | | | N/A | | | | N/A | | | | N/A | | | | N/A | |
| Commitments for capital contribution | | | 542.8 | | | | N/A | | | | N/A | | | | N/A | | | | N/A | |
| Commitments under operating lease | | | 12,989.5 | | | | 541.5 | | | | 507.6 | | | | 1,372.5 | | | | 10,567.9 | |
| Total | | | 155,852.4 | | | | | | | | | | | | | | | | | |
G. Safe Harbor
See “Forward-Looking Statements” at the beginning of this annual report.
Item 6.Directors, Senior Management and Employees
A. Directors and Senior Management
A. | Directors and Senior Management |
Directors
The sixth session of our Board currently consists of nineeight directors, including three executive directors, threetwo non-executive directors and three independent non-executive directors. In accordance with our Articles of Association, our affairs are managed by our Board. The business address of each of our directors is No. 62 North Xizhimen Street, Hai Dian District, Beijing, People’s Republic of China, 100082.
We follow our home country practice in relation to the composition of our Board in reliance on the exemption provided under Section 303A.00 of the NYSE Corporate Governance Rules available to foreign private issuers. Our home country practice does not require a majority of directors of a listed company to be independent directors. As such, the majority of our directors are not independent within the meaning of NYSE Corporate Governance Rules.
The table and discussion below set forth information concerning our directors who served on our Board during the year ended December 31, 2017,2018, and up to date of this Annual Report.annual report.
Name | Age | Positions with the Company |
| Executive Directors(1) | | |
Yu DehuiLu Dongliang(2) | 5845 | Executive Director and Chairman of the Board |
| Ao Hong(3) | 5657 | Executive Director (re-designated to a non-executive director) |
| Yu Dehui(4) | 59 | Executive Director and PresidentChairman of the Board (resigned) |
Lu Dongliang(4)Name | 44Age | Positions with the Company |
| Jiang Yinggang | 55 | Executive Director and Senior Vice President |
Jiang YinggangZhu Runzhou(5) | 54 | Executive Director and Vice President |
Non-executive Directors(5)(6) | | |
| Ao Hong(3) | 5657 | Non-executive Director |
| Liu Caiming(7) | 5556 | Non-executive Director (resigned) |
| Wang Jun | 53 | Non-executive Director |
Wang Jun | 52 | Non-executive Director |
| Independent Non-executive Directors(8) | | |
| Chen Lijie | 6364 | Independent Non-executive Director |
| Hu Shihai | 6364 | Independent Non-executive Director |
| Lie-A-Cheong Tai Chong, David | 5859 | Independent Non-executive Director |
| | |
| (1) | Mr. Yu Dehui was re-designated by the Board from a non-executive director to an executive director of the Company on August 17, 2017. Mr. Ao Hong resigned from the position of the President of the Company and was re-resigned by the Board from an executive director to a non-executive director on February 13, 2018. As of the date of this annual report, we had three executive directors. |
(2) | On August 17, 2017, Mr. Yu Dehui was re-designated by the Board from a non-executive director to an executive director of the Company. |
(3) | Due to other work commitment, Mr. Ao Hong resigned from the position of the President of the Company at the twentieth meeting of the sixth session of the Board, with effect from February 13, 2018. On the same date, Mr. Ao was re-designated by the Board from an executive director to a non-executive director of the Company. |
(4)(2) | On February 13, 2018, Mr. Lu Dongliang was appointed by the Board as the Presidentpresident of the Company and dismissed from the original position of senior vice president of the Company. |
(5) | On February 13, 2018,21, 2019, Mr. Lu was elected as the chairman of the sixth session of the Board resolvedand resigned from the position of the president of the Company. |
| (3) | Mr. Ao Hong was dismissed from the position of the president of the Company due to re-designate Mr. Aowork engagements and was re-designated by the Board from an executive director to a non-executive director. director at the twentieth meeting of the sixth session of the Board held on February 13, 2018. |
| (4) | On February 21, 2019, Mr. Yu Dehui resigned from the positions of the chairman of the Board and the executive director of the Company and from all other positions in each of the special committees under the Board. |
| (5) | Mr. Zhu Runzhou was elected as an executive director of the Company at the 2018 second extraordinary general meeting of the Company held on December 11, 2018 and appointed as the vice president of the Company at the 24th meeting of the sixth session of the Board of the Company on May 25, 2018. |
| (6) | As of the date of this annual report, we had two non-executive directors. |
| (7) | Mr. Liu Caiming resigned as a non-executive director of the Company on May 25, 2018. |
| (8) | As of the date of this annual report, we had three independent non-executive directors. |
Executive Directors
Yu Dehui, aged 58, currently serves as an executive director and the Chairman of our Board. Mr. Yu graduated from Ecole des Hautes Etudes en Sciences Sociales (EHESS) and School of Economics of Paris University Nanterre, majoring in development economics, with a doctoral degree in economics, and he has been a professor. Mr. Yu has extensive experience in various areas such as energy, non-ferrous metals, economics and management. He successively served as the general director for technology of SPEIC, the general director of the department of science, technology and standards of the State Environmental Protection Administration. He also served as a deputy mayor of Baotou City, a vice governor of the government of the Inner Mongolia Autonomous Region, a vice president of China Power Investment Corporation, and a vice president of State Power Investment Corporation. Mr. Yu currently also serves as the president, a director and the deputy secretary of the Communist Party Committee of Chinalco. Mr. Yu served as a non-executive director on our Board from April 8, 2016 to August 16, 2017, and has been serving as the Chairman of our Board since April 8, 2016 and as an executive director of the Company since August 17, 2017.
Lu Dongliang,aged 44,45, is currently an executive director and the Presidentchairman of the Board of the Company. Mr. Lu graduated from North China University of Technology majoring in accounting. He holds a bachelor’s degree in economics and is an accountant. Mr. Lu has more than 20 years of work experience in financial management and in the non-ferrous metals industry. He successively served as the cadre in the audit department of China Non-ferrousNonferrous Metals Industry Corporation, the officer-in-charge of the capital division of the finance department of China Copper Lead& Zinc Group Corporation, the head of the accounting division and the capital division of the finance department of Chinalco, the deputy manager and manager of the treasure management division of the finance department, the manager of the general management office, the deputy general manager and general manager of the finance department of the Company, the chief financial officer of Chalco Gansu Aluminum Electricity Co., Ltd., the assistant to the president of the Company and the general manager of Lanzhou branch of the Company, thean executive director and president of Chalco Gansu Aluminum Electricity Co., Ltd., and aan Executive Director, senior vice president and president of the Company. Currently, Mr. Lu also serves as the deputy general manager of Chinalco.
Jiang Yinggang, aged 54,55, is currently an executive director and a senior vice president of the Company. Graduating from Central South University of Mining and Metallurgy majoring in the metallurgy of nonferrous metals, Mr. Jiang holds a master degree in metallurgy engineering of non-ferrous metals and is a professor-grade senior engineer. Mr. Jiang has long been engaged in production operation and corporate management of production enterprises and has extensive and professional experience. He formerly served as deputy head and then head of the Corporate Management Department of Qinghai Aluminum Plant; head of Qinghai Aluminum Smelter, deputy manager and manager of Qinghai Aluminum Company Limited, and general manager of the Qinghai branch of the Company, and an executive director and a vice president of the Company.
Zhu Runzhou, aged 54, is currently an executive director and a vice president of the Company. Mr. Zhu graduated from Wuhan University, majoring in software engineering, with a master’s degree in engineering. He is a senior engineer of outstanding performance. Mr. Zhu has extensive experience in energy, technologies on power plants and corporate operation and management. He had successively served as the inspection director, operation director and director of the fuel division of Gansu Jingyuan Power Plant, the deputy chief engineer, director of the inspection department and director of the first repairing department of Gansu Jingyuan Power Plant* as well as the manager of Huaming Branch of Gansu Guangming Supervisory Engineering Company. Mr. Zhu also served as the chairman of the labor union, the standing director of the employee stock holding committee and the deputy general manager of Gansu Jingyuan First Power Co., Ltd., the chairman of Baiyin Huadian Water Supply Co., Ltd., head of Guodian Kaili Power Plant, director of the preparatory office of the technical transformation program of Guodian in Duyun City, deputy general manager of Guodian Guizhou Branch, deputy general manager of Guodian Yunnan Branch and general manager of Guodian Power Xuanwei Power Generation Co., Ltd., deputy general manager and general manager of Guodian Guangxi Branch, deputy general manager of the energy management department of the Company and deputy general manager of Chalco Energy, a director and the general manager of Ningxia Energy, the general manager of Chalco Xinjiang Aluminum Power Co., Ltd., the chairman of Ningxia Energy and the general manager of Chalco Xinjiang Aluminum Power Co., Ltd.
Non-Executive Directors
Ao Hong, aged 56,57, currently serves as a non-executive director on our Board. Mr. Ao graduated from Central South University with a doctoral degree in management science and engineering. He is a professor-grade senior engineer with over 30 years of work experience in enterprises of the non-ferrous metals industry. He successively served as the deputy dean of Beijing General Research Institute for Non-ferrous Metals and was concurrently the chairman of GRINM Semiconductor Materials Co., Ltd., the chairman of Guorui Electronics Co., Ltd., the chairman of Guowei Silver Anticorrosive Materials CompanyGuo Jing Micro-electronic Holding, Limited in Hong Kong, and a deputy general manager of Chinalco. During this period, he also successively served as the chairman of the supervisory committee of the Company, chairman of the labor union of Chinalco, the dean of Chinalco Research Institute of Science and Technology and the chairman of China Rare Earth Co., Ltd. Mr. Ao served as the President of the Company from November 20, 2015 to February 13, 2018, and as an executive director and president of the Company from December 29, 2015 to February 13, 2018.Company. Mr. Ao is currently the full-time deputy secretary of the Communist Party Committee of Chinalco.
Liu Caiming, aged 55, serves as a non-executive director on our Board. He graduated from Fudan University majoring in political economics and obtained a doctoral degree in Economics. He is a senior accountant and engaged in the financial and accounting industry for more than 30 years. Mr. Liu has extensive experience in corporate management and financial management. He had subsequently served as deputy head and head of theFinance Department of China Non-ferrous Metals Foreign Engineering Corporation, deputy general manager of China Non-ferrous Metals Construction Group Limited, deputy general manager of China Nonferrous Construction Group Limited, director and deputy general manager of China Non-ferrous Metal Industry’s Foreign Engineering and Construction Co., Ltd., and deputy general manager of China Nonferrous Metal Mining and Construction (Group) Co., Ltd. Mr. Liu has also acted as titular deputy head of Department of Finance of Yunnan Province, director of SASAC of Yunnan Provincial People’s Government and assistant to the governor of Yunnan Province and director of SASAC Yunnan. From January 2007 to February 2011, Mr. Liu acted as deputy general manager of Chinalco, during which time he acted as chairman of Yunnan Copper Industry (Group) Co., Ltd., and president of China Copper Co., Ltd. He acted as our senior vice president and chief financial officer since February 23, 2011 and as our executive director since May 31, 2011. Mr. Liu resigned as our executive director, chief financial officer and senior vice president and was re-designated as non-executive Director on March 8, 2013. He resigned as our non-executive director on March 18, 2014 and was re-appointed as non-executive director on our Board on February 26, 2015. Mr. Liu currently serves as the vice president of Chinalco and a non-executive director of Aluminum Corporation of China Overseas Holdings Limited.
Wang Jun, aged 52,53, has been serving as a non-executive director on our Board since June 27, 2013. Mr. Wang graduated from Huazhong Institute of Engineering with a degree of industrial and civil construction. He is an engineer. He has extensive experience in financial and corporate management. Mr. Wang formerly served as an engineer in the engineering department of Babcock & Wilcox Beijing Company Ltd., deputy manager of the real estate development department of China Yanxing Company, senior deputy manager of the equity management department, and senior manager of the business management department, senior manager, deputy general manager and general manager of the custody and settlement department in China Cinda Asset Management Co., Ltd. and general manager of the equity management department of China Cinda Asset Management Co. Ltd. Mr. Wang currently serves as the business director of China Cinda Asset Management Co., Ltd.
Independent Non-Executive Directors
Chen Lijie, aged 63,64, has been serving as an independent non-executive director on our Board since February 26, 2015. Ms. Chen graduated from Renmin University of China Law School and obtained a doctoral degree in Laws. Ms. Chen Lijie has more than 30 years of experience in law. She successively acted as director and deputy director of Commercial Affairs of the Office of Legislative Affairs of the State Council, deputy director of Department of Policies and Laws of the National Economic and Trade Commission, patrol officer of Bureau of Policies, Laws and Regulations of SASAC and chief legal consultant of China Mobile Communications Corporation.
Hu Shihai, aged 63,64, has been serving as an independent non-executive director on our Board since June 25, 2015. Mr. Hu graduated from Shanghai Jiao Tong University majoring in thermal energy engineering. He is a professor-level senior engineer with more than 40 years of working experience in the power industry. Mr. Hu has extensive experience in corporate management and technical management and successively served as the supervisor, director and deputy head of the Huaneng Shanghai Shidongkou No. 2 Power Plant, deputy director of the preparatory office of the Shanghai Waigaoqiao No. 2 Power Plant, manager of the production department and assistant to the general manager of Huaneng Power International, Inc. and assistant to the general manager and director of the safety production department, and chief engineer of China Huaneng Group.
Lie-A-Cheong Tai Chong, David, aged 58,59, has been serving as an independent non-executive director on our Board since December 29, 2015. He is honored with the Silver Bauhinia Star (SBS), Officier de l’Ordre National du Merite and Justice of Peace. Mr. Lie is the executive chairman of Newpower International (Holdings) Co., Ltd. and China Concept Consulting Ltd. He was selected as a member of the National Committee of the 8th, 9th, 10th and 11th Chinese People’s Political Consultative Conference since 1993. From 2007 to 2013, he acted as a panel convener cum member of the Financial Reporting Review Panel of Hong Kong Special Administrative Region (“HKSAR”). Mr. Lie is currently the honorary consul of the Hashemite Kingdom of Jordan in the HKSAR, the chairman of the Hong Kong-Taiwan Economic and Cultural Cooperation and Promotion Council, the chairman of the Hong Kong-Taiwan Business Co-operation Committee, a member of the Commission on Strategic Development of the HKSAR, a standing committee member of the China Overseas Friendship Association, a standing director of China Council for the Promotion of Peaceful National Reunification, and a member of the Hong Kong General Chamber of Commerce (HKGCC). Currently, Mr. Lie is also an independent non-executive director of Herald Holdings Limited aand Harbor Center Development Limited, both of which are listed companycompanies in Hong Kong.
Supervisors
Our supervisors are elected to represent our employees and shareholders and serve a term of three years or until the election of their respective successors, whichever is earlier. Our supervisors currently comprise Mr. Liu Xiangmin, Mr. Wang Jun andYe Guohua, Mr. Wu Zuoming.Zuoming and Ms. Shan Shulan.
The table and discussion below set forth certain information concerning our supervisors who served on our supervisory committee during the year ended December 31, 2017,2018, and up to the date of this Annual Report.annual report.
Name(1) | Age | Positions with the Company |
Liu XiangminYe Guohua(2) | 5550 | Chairman of Supervisory Committee |
Wang JunLiu Xiangmin(3) | 56 | Chairman of Supervisory Committee (resigned) |
| Wu Zuoming | 52 | Supervisor |
| Shan Shulan(4) | 47 | Supervisor |
Wu ZuomingWang Jun(5) | 5148 | Supervisor (resigned) |
| (1) | As of the date of this annual report, we had three supervisors. |
| (2) | Mr. Ye Guohua was elected as a supervisor of the Company at the 2018 second extraordinary general meeting of the Company held on December 11, 2018 and on the same day, elected as the chairman of the supervisory committee at the 15th meeting of the sixth session of the supervisory committee of the Company. |
| (3) | Mr. Liu Xiangmin resigned from the position of the chairman of supervisory committee and ceased to be a supervisor of the Company on December 11, 2018. |
| (4) | Ms. Shan Shulan was elected as a supervisor of the Company at the 2019 first extraordinary general meeting of the Company held on February 20, 2019. |
| (5) | Mr. Wang Jun resigned as a supervisor of the Company and was re-designated as the chief financial officer and the secretary to the Board of the Company on February 20, 2019. |
Liu XiangminYe Guohua, aged 55,50, is currently the Chairmanchairman of the Supervisory Committeesupervisory committee of the Company. Mr. LiuYe graduated from Central SouthShanghai University of Finance and Economics, majoring in non-ferrous metallurgy. He hasaccounting, with a doctoratebachelor degree in engineeringeconomics and is a professor-grade senior engineer.accountant. Mr. Liu has long engaged in non-ferrous metal metallurgy research and corporate management and has accumulated extensive and professional experience. He previously served as the deputy head and head of the Alumina branch of Zhongzhou Aluminum Plant, deputy head of Zhongzhou Aluminum Plant, general manager of Zhongzhou branch of the Company as well as an executive director, vice president and a senior vice president of the Company.
Wang Jun, aged 47, is currently a supervisor of Supervisory Committee of the Company. He obtained a master’s degree in business administration from Tsinghua University. He is a senior accountant andYe has extensive experience in corporate financial accounting, fund management and auditing. Mr. Wangaccounting. He had successively served as the deputy manager and managerdirector of accounting department of the treasure management divisionrefinery of Shanghai Gaoqiao Petrochemical Company, the financedeputy chief accountant and head of accounting department of Chinalco, the general representative of the Peru office of Chinalco, a director and senior auditing manager of Minera Chinalco Perú S.A.,Sinopec Shanghai Gaoqiao Branch, the chief financial officer, andexecutive director, a member of the Party Committee, deputy general manager of Sinopec Shanghai Petrochemical Company Limited, the financedirector of accounting department of Chinalco ResourcesChina Petroleum & Chemical Group Corporation, the chief financial officerchairman of China AluminumCentury Bright International EngineeringInvestment Company, the chairman of Sinopec Insurance Limited, the vice chairman of Taiping & Sinopec Financial Leasing Co., Ltd., an executivea director the chief financial officerof Sinopec Finance Co., Ltd., and the secretary to the boarda director of directors of China Aluminum International Engineering Corporation Limited.Sinopec Oilfield Service Corporation. Mr. Wang currently serves as the deputy chief accountant, general manager of the finance department and capital operating department of Chinalco. HeYe is also a director of China Aluminum International Engineering Corporation Limited and a director and the president of Aluminum Corporation of China Overseas Holdings Limited.
Wu Zuoming, aged 51, is currently a Supervisor of the Company, the deputy secretarymember of the Communist Party Committee and deputy general manager and the chairmanchief accountant of the labor union of the Guangxi branchChinalco.
Wu Zuoming, aged 52, is currently a supervisor of the Company. Mr. Wu holds an MBA degree from Renmin University of China. He is a senior engineer. Mr. Wu has extensive experience in human resource management. He successively acted as the deputy manager of the Personnel Division, Human Resource Department of China Aluminum Corporation;Chinalco, the person in charge of the Personnel Division, Human Resource Department for the Preparatory Team of Chinalco;Chinalco, the deputy manager of the Personnel Division (Training Division), of Human Resource Department of Chinalco;Chinalco, the deputy manager of Assessment and Training Division, the manager of Employee Management Division and the manager of General Division of the Company;Company, the senior manager of the Human Resource Department (Retired Cadres Department) and the manager of the General Division of Chinalco; andChinalco, the deputy general manager and general manager of the Human Resource Department of the Company, and the deputy secretary of the Communist Party Committee, deputy general manager and the chairman of the labor union of our Guangxi branch. Currently, Mr. Wu also serves as the deputy secretary of the Communist Party Committee and a general manager of Shanxi New Material.
Shan Shulan, aged 47, is currently a supervisor of the Company. Ms. Shan graduated from Beijing Institute of Light Industry, majoring in industrial corporate management, with a bachelor degree in engineering. She is a certified public accountant and statistician. Ms. Shan has extensive experience in accounting, finance management and other fields. She successively served as an economic analyst at the economic research office of Beijing Glass Instruments Plant, the financial manager of Beijing CEMFIL Glass Fiber Co. Ltd. under Saint-Gobain in China, the financial manager for Beijing region of Carrefour (China) Co., Ltd., the financial manager for China region of Baker Hughes Centrilift, the financial manager for China region of Microsoft Research Asia (China), and the business director and deputy head of budget division and the head of budget assessment division of the finance department of Chinalco. Ms. Shan currently serves as the deputy director of the finance department of Chinalco. She also concurrently serves as a supervisor of Chinalco Innovative Development Investment Company Limited and a director of Aluminum Corporation of China Overseas Holdings Limited and China Aluminum Insurance Broker (Beijing) Co., Ltd.
Senior Management
The table and discussion below set forth certain information concerning other membermembers of senior management during the year ended December 31, 2017,2018, and up to the date of this Annual Report.annual report.
Name | Age | Positions with the Company |
Xu BoHe Zhihui(1) | 5356 | President |
| Tian Yong(2) | 59 | Vice President |
Zhang ZhankuiWu Maosen(3) | 5955 | Vice President |
| Xu Bo(4) | 54 | Vice President (resigned) |
| Leng Zhengxu(5) | 58 | Vice President (resigned) |
| Wang Jun(6) | 48 | Chief Financial Officer and Secretary to the Board |
| Zhang Zhankui(7) | 60 | Chief Financial Officer and Secretary to the Board (resigned) |
| (1) | On February 21, 2019, Mr. He Zhihui was appointed as the president of the Company and nominated as a candidate for an executive director of the sixth session of the Board at the 39th meeting of the sixth session of the Board of the Company. |
| (2) | On June 6, 2018, Mr. Tian Yong was appointed at the 25th meeting of the sixth session of the Board as the vice president of the Company. |
| (3) | On March 21, 2019, Mr. Wu Maosen was appointed at the 40th meeting of the sixth session of the Board as the vice president of the Company. |
| (4) | Mr. Xu Bo was dismissed from the position of the vice president of the Company due to job re-designation on June 6, 2018. |
| (5) | Mr. Leng Zhengxu | 57 | Vice President was dismissed from the position of the vice president of the Company due to job re-designation on October 26, 2018. |
| (6) | On February 20, 2019, Mr. Wang Jun resigned as a supervisor of the Company and was re-designated as the chief financial officer and the secretary to the Board of the Company at the 38th meeting of the sixth session of the Board of the Company, effective on the same day and from the date on which he has obtained the certificate of the qualifications as a secretary to the board of directors from the Shanghai Stock Exchange, respectively. |
| (7) | Mr. Zhang Zhankui was dismissed from the position of the chief financial officer and the secretary to the Board of the Company due to reaching statutory retirement age on February 20, 2019. |
Xu Bo,He Zhihui, aged 53,56, is currently the president of the Company. Mr. He graduated from Huazhong Institute of Technology with a master’s degree in engineering and is a senior engineer with outstanding performance. Mr. He successively served as an engineer and a deputy director of the power control office, the head of the electric automation institution and the dean of the electric automation branch of Guiyang Aluminum Magnesium Design & Research Institute, the deputy dean and dean of Guiyang Aluminum Magnesium Design & Research Institute, the deputy general manager and general manager of China Aluminum International Engineering Co., Ltd., the chairman of China Nonferrous Metals Processing Technology Co., Ltd., the secretary of the Communist Party Committee, chairman, executive director, president and chairman of the labor union of China Aluminum International Engineering Corporation Limited and an assistant to the general manager of Chinalco.
Tian Yong, aged 59, is currently a vice president of the Company. Mr. XuTian graduated from North ChinaKunming University of Water ResourcesScience and Electric Power,Technology, majoring in hydraulic structuremetallurgical engineering, with a master degree in engineering, and obtained a master’s degree in engineering. He also obtained a Ph.D. degree in economics from Renmin University of China. He iswith a senior engineer.engineer of outstanding performance. Mr. XuTian has extensive experience in mergerssmelting and acquisitions, capital operation, corporation management,production of non-ferrous metals and enjoyscorporate management. He successively served as a high reputation in energy sectors such as coaltechnician and electric power. He formerly served as: deputy director of the smelting workshop, and the acting director of No. 2 smelting workshop of Yunnan Aluminum Plant, the chief dispatcher and the head of the hydro powerdispatching office of Yunnan Aluminum Plant, the head of the fabrication factory, the deputy head and operationshead of the production department andas well as the head of the production dispatching office, manager of Power and Machinery Bureau; general manager andthe assistant to the head of the bureau in Steel Structure Departmentfactory and chief dispatcher, and the head of China Huadian Power Station Equipment Engineering Group Corporation;the production division of Yunnan Aluminum Plant, the deputy head and head of Yunnan Aluminum Plant, the vice chairman and general manager of China Huadian Power Station Equipment Engineering Group Corporation, standingYunnan Aluminum Co., Ltd., deputy general manager and general manager of China Huadian EngineeringYunnan Metallurgical Group Corporation and the general manager and chairman of Yunnan Metallurgical Group Co., Ltd.; deputy general manager of Huadian Coal Industry Group Company Limited; head of China Huadian Corporation Shaanxi Office; general manager of China Huadian Corporation Shaanxi Branch; executive director and general manager of Huadian Shaanxi Energy Company, the assistant to the president of the Company and executive director and general manager of Chalco Energy, a vice president and Company Secretary (Secretary to the Board) of the Company.
Zhang Zhankui,aged 59, is currently the Chief Financial Officer and Company Secretary (Secretary to the Board) of the Company. Mr. Zhang is a postgraduate in economic management and a senior accountant. He has extensive experience in corporate financial accounting, fund management and auditing. Mr. Zhang formerly served as: deputy head, the head of the Finance Division and then the head of the Audit Division of China General Design and Research Institute for Non-ferrous metallurgy; deputy general manager of Beijing Enfei Tech-industry Group; the head of the Accounting Division of the Finance Department and deputy head of the Finance Department of China Copper Lead & Zinc Group Corporation; officer-in-charge of the Company’s assets and finance in the Listing Office of the Company; head of the Fund Management Division of the Finance Department of Company and manager of the General Division of the Finance Department of the Company as well as deputy head and head of the Finance Department of Chinalco; and a Supervisor of the Company.
Leng ZhengxuWu Maosen, aged 57,55, is currently a vice president of the Company. Mr. LengWu graduated from Guizhou IndustrialDalian Railway College with a bachelor’s degree in engineering, majoring in non-ferrous metallurgy.welding technology and equipment. He is a bachelor of engineering and a professor-level senior engineer.engineer with excellent performance. Mr. LengWu has over 30 years of workingextensive experience in the non-ferrous metals industry and has extensive experiences in corporate management and production technology.management. He had successively served as the deputy head of the alumina branch, the deputy head of the overhauling branch and the director of the No.1 workshop and deputy secretarytransport department of Chinese Communist Party of No.2 Aluminum Smelter of GuizhouShanxi Aluminum Plant, directorthe assistant to the general manager of our Shanxi branch, the deputy commander-in-chief of the No.2 workshopengineering and construction command department of No.3 Aluminum Smelter of Guizhou Aluminum Plant, chief engineer of No. 1 Aluminum Smelter of Guizhou Aluminum Plant, chief engineer of Guizhou Aluminum Plant,Chalco Shanxi, a deputy general manager of Guizhou Branch of Chinalco, general manager ofShanxi Huaze, the production departmentdeputy head and general manager of corporate management department of the Company, general manager of Shanxi Branch of Chinalco, head of Shanxi Aluminum Plant, executivea director of Shanxi Huaxing Alumina Co., Ltd.,and a general manager of Guizhou Branch of Chinalco, head and deputythe secretary of the Chinese Communist Party Committee of Guizhou Aluminum Plant, chairman of Guizhou Huajin Alumina Co., Ltd., chairman of ZunyiQinghai Huanghe Hydropower Regeneration Aluminum Co., Ltd., the secretary of the Party Committee, an executive director and general manager of Chalco Asset Operation and Management Company and successively served as an executive director of Chinalco Shanghai, an executive director and the general manager of Chalco Industrial Development Co., Ltd., the chairman of the board of Huaxi Aluminum, the chairman of the board and the general manager of Chalco Zunyi AluminaInvestment and Development Co., Ltd., the deputy team-leader of the team aiming at making up deficits and shaking off dilemma, transforming and upgrading of our Shanxi branch and Shanxi Aluminum Plant and the chairman of the board of Chinalco Research Institute of Science and Technology Co., Ltd. Mr. Wu currently also serves as the chairman of the board of Chalco Investment and Development Co., Ltd., the deputy team-leader of the team aiming at making up deficits and shaking off dilemma, transforming and upgrading of our Shanxi branch and Shanxi Aluminum Plant and an executive director of Chinalco Research Institute of Science and Technology Co., Ltd.
Wang Jun, aged 48, resigned as a supervisor of the Company on 20 February 2019 and was appointed as the chief financial officer and secretary to the Board (company secretary) of the Company on the same day. Mr. Wang obtained a master’s degree in business administration from Tsinghua University. He is a senior accountant and a member of the Chartered Institute of Management Accountants (CIMA). He has also been admitted to the National Training Program for Accounting Leading Talent Backup. Mr. Wang has worked in grassroots units, overseas companies, listed companies and various departments of the group, and has extensive experience in financial accounting, fund management and capital operation. Mr. Wang successively served as the deputy manager and manager of treasury management division of finance department of Chinalco, the general representative of the Peru office of Chinalco, a director and senior auditing manager of Minera Chinalco Perú S.A., the chief financial officer and the manager of finance department of Chinalco Resources Corporation, the chief financial officer of China Aluminum International Engineering Co., Ltd., an executive director, the chief financial officer and the secretary to the board of directors of China Aluminum International Engineering Corporation Limited, the deputy chief accountant, general manager of finance department and capital operating department of Chinalco and a supervisor of the Company. Mr. Wang is currently the chairman of the supervisory committee of China Rare Earth Holdings Limited and a director of China Aluminum International Engineering Corporation Limited, Chinalco Assets Operation and Management Co., Ltd., Chinalco Capital Holdings Co., Ltd. and assistant toChinalco Finance. He is also a director and the president of the Company.Aluminum Corporation of China Overseas Holdings Limited.
B. Compensation
Executive Compensation
Executive directors are entitled to a director’s fee, performance bonuses and welfare benefits provided under the relevant PRC laws and regulations. Non-executive directors are entitled only to a director’s fees. In 2017,2018, the aggregate amount of cash compensation paid by us to our directors, supervisors and ourother members of senior management who are not members of our Board for services performed in connection with their respective capacities above was approximately RMB1.67RMB2.1 million, RMB0.7 million and RMB2.71RMB2.4 million, respectively. Our executive directors and supervisors who are employees also receive compensation in the form of housing allowances, other allowances and benefits and contributions to their pension plans. None of the service contracts of our directors provide benefits to our directors upon their termination.
Details of the emoluments paid to our directors and supervisors during the year ended December 31, 20172018 are as follows:
| Name of Directors and Supervisors | Fees | Salary | Bonus | Pension | Total |
| | RMB(ʼ000) | RMB(ʼ000) | RMB(ʼ000) | RMB(ʼ000) | RMB(ʼ000) |
| Executive Directors | | | | | |
| Yu Dehui | - | - | - | - | - |
| Ao Hong(1) | - | - | - | - | - |
| Lu Dongliang | - | - | - | - | - |
| Jiang Yinggang | - | 822 | - | 83 | 905 |
| | | | | | |
| Non-Executive Directors | | | | | |
| Liu Caiming | - | - | - | - | - |
| Wang Jun | 150 | - | - | - | 150 |
| | | | | | |
| Independent Non-Executive Directors | | | | | |
| Lie-A-Cheong Tai Chong, David | 206 | - | - | - | 206 |
| Chen Lijie | 206 | - | - | - | 206 |
| Hu Shihai | 206 | - | - | - | 206 |
| | 768 | 822 | - | 83 | 1,673 |
| Supervisors | | | | | |
| Liu Xiangmin | - | - | - | - | - |
| Wang Jun | - | - | - | - | - |
| Wu Zuoming | - | 548 | - | 83 | 631 |
| | - | 548 | - | 83 | 631 |
| Total | 768 | 1,370 | - | 166 | 2,304 |
| | |
(1) | As of the date of this annual report, Mr. Ao Hong served as a non-executive director on our Board. |
| Name of Directors and Supervisors | | Fees | | | Salary | | | Bonus | | | Pension | | | Total | |
| | | | RMB(ʼ000) | | | | RMB(ʼ000) | | | | RMB(ʼ000) | | | | RMB(ʼ000) | | | | RMB(ʼ000) | |
| Directors | | | | | | | | | | | | | | | | | | | | |
| Executive Directors | | | | | | | | | | | | | | | | | | | | |
| Yu Dehui | | | — | | | | — | | | | — | | | | — | | | | — | |
| Lu Dongliang | | | — | | | | — | | | | — | | | | — | | | | — | |
| Jiang Yinggang | | | — | | | | 762 | | | | — | | | | 90 | | | | 852 | |
| Zhu Runzhou | | | — | | | | 438 | | | | — | | | | 54 | | | | 492 | |
| | | | | | | | | | | | | | | | | | | | | |
| Non-Executive Directors | | | | | | | | | | | | | | | | | | | | |
| Ao Hong | | | — | | | | — | | | | — | | | | — | | | | — | |
| Wang Jun | | | 150 | | | | — | | | | — | | | | — | | | | 150 | |
| | | | | | | | | | | | | | | | | | | | | |
| Independent Non-Executive Directors | | | | | | | | | | | | | | | | | | | | |
| Lie-A-Cheong Tai Chong, David | | | 202 | | | | — | | | | — | | | | — | | | | 202 | |
| Chen Lijie | | | 202 | | | | — | | | | — | | | | — | | | | 202 | |
| Hu Shihai | | | 202 | | | | — | | | | — | | | | — | | | | 202 | |
| Subtotal | | | 756 | | | | 1,200 | | | | — | | | | 144 | | | | 2,100 | |
| | | | | | | | | | | | | | | | | | | | | |
| Supervisors | | | | | | | | | | | | | | | | | | | | |
| Ye Guohua | | | — | | | | — | | | | — | | | | — | | | | — | |
| Wu Zuoming | | | — | | | | 649 | | | | — | | | | 90 | | | | 739 | |
| Wang Jun | | | — | | | | — | | | | — | | | | — | | | | — | |
| Subtotal | | | — | | | | 649 | | | | — | | | | 90 | | | | 739 | |
| Total | | | 756 | | | | 1,849 | | | | — | | �� | | 234 | | | | 2,839 | |
Senior Management Incentive System
In order to better provide incentives for our senior management and improve our shareholders’ value, we adopted a special compensation system for our senior management designed to align our senior management’s financial interests with our operating performance. Under this system, the senior management’s compensation consists of the following components:
| ● | basic salaries; performance bonuses;
welfare benefits; and
incentive bonuses.
C. Board Practices Board of Directors All of our directors and supervisors serve a term of three years or until such later date as their successors are elected or appointed. Directors and supervisors may serve consecutive terms. Each of our directors and supervisors has entered into a service contract with us, none of which can be terminated by us within one year without payment of compensation (other than statutory compensation). There were no arrangements providing for benefits upon termination of directors, supervisors or other senior management personnel. One of the supervisors is an employee representative appointed by our employees and the rest are appointed by the shareholders. The following table sets forth the number of years our current directors have held their positions and the expiration of their current term. Name | Held Position Since | Expiration of Term | Yu Dehui | June 28, 2016 | June 30, 2019 | Ao Hong | June 28, 2016 | June 30, 2019 | | Lu Dongliang | June 28, 2016 | June 30, 2019 | | Jiang Yinggang | June 28, 2016 | June 30, 2019 | Liu CaimingZhu Runzhou | December 11, 2018 | June 30, 2019 | | Ao Hong | June 28, 2016 | June 30, 2019 | | Wang Jun | June 28, 2016 | June 30, 2019 | | Chen Lijie | June 28, 2016 | June 30, 2019 | | Hu Shihai | June 28, 2016 | June 30, 2019 | | Lie-A-Cheong Tai Chong, David | June 28, 2016 | June 30, 2019 |
Audit Committee As at the date of this Annual Report,annual report, our audit committee consists of three independent non-executive directors, namely, Ms. Chen Lijie, Mr. Hu Shihai and Mr. Lie-A-Cheong Tai Chong, David. Mr. Lie-A-Cheong Tai Chong, David is the chairman of the audit committee. The primary duties of our audit committee as set out in the committee charter include proposing to engage or replace the auditor, supervising our internal audit and its implementation, being responsible for the communication between the internal audit and external audit, auditing our financial information and its disclosure, reviewing the Company’s financial control, internal control and risk management systems, studying on our other relevant professional matters, and putting forward suggestions for the decisions of the Board for reference. Remuneration Committee As at the date of this Annual Report,annual report, our remuneration committee consists of two independent non-executive directors, Mr. Hu Shihai and Mr. Lie-A-Cheong Tai Chong, David and a non-executive director, Mr. Liu Caiming.David. Mr. Hu Shihai is the chairman of the remuneration committee. In 2018, Mr. Liu Caiming was also a member of our remuneration committee until his resignation as a non-executive director of the Company on May 25, 2018. The primary duties of our remuneration committee as set out in the committee charter include: preparing the remuneration management scheme and remuneration proposal for directors, employee-representative supervisors and senior management, and providing suggestions to the Board; preparing measures on performance evaluation of senior management, performance assessment procedures and relevant rewards and punishments, and providing suggestions to the Board; monitoring the implementation of the remuneration system of our Company; reviewing senior management’s fulfilment of duties and conducting performance assessments; and other functions and authorities delegated by the Board. In 2017,2018, the remuneration committee convened one meeting, to consider and approve remuneration standards for 20172018 for our directors, supervisors and other senior management members.
We follow our home country practice in relation to the composition of our remuneration committee in reliance on the exemption provided under NYSE Corporate Governance Rule 303A.00 available to foreign private issuers. Our home country practice does not require us to establish a remuneration committee which must be composed entirely of independent directors. Nomination Committee As at the date of this Annual Report,annual report, our nomination committee consists of one executive director, namely Mr. Yu Dehui, one non-executive director, namely Mr. Ao Hong, and three independent non-executive directors, namely Mr. Lie-A-Cheong Tai Chong, David.,David, Mr. Hu Shihai and Ms. Chen Lijie. In 2018, Mr. Yu Dehui iswas also a member and the chairman of our nomination committee. Mr. Yu Dehui resigned from the positions of the chairman of the nomination committee.Board and the executive director of the Company and from all other positions in each of the special committees under the Board on February 21, 2019. The primary duties of our nomination committee as set out in the committee charter include: studying the selection standards and procedures for directors, senior management and members of special committees under the Board and providing suggestions to the Board; reviewing the qualification of candidates for directors, senior management and members of special committees under the Board and providing advice on inspection and appointment; assessing the independence of independent non-executive directors; and other functions and authorities delegated by the Board. We follow our home country practice in relation to the composition of our nomination committee in reliance on the exemption provided under NYSE Corporate Governance Rule 303A.00 available to foreign private issuers. Our home country practice does not require us to establish a nomination committee which must be composed entirely of independent directors. Development and Planning Committee As at the date of this Annual Report,annual report, our development and planning committee consists of twoone executive directors,director, namely Mr. Yu Dehui and Mr. Jiang Yinggang, one non-executive director, namelyMr. Ao Hong, and one independent non-executive director, namely Mr. Hu Shihai.In 2018, Mr. Yu Dehui iswas also a member and the chairman of our development and planning committee. Mr. Yu Dehui resigned from the positions of the chairman of the developmentBoard and planning committee. the executive director of the Company and from all other positions in each of the special committees under the Board on February 21, 2019.In accordance with the committee charter, the committee reviews and assesses our strategic plans for long-term development, fiscal budgeting, investment, business operations and investmentsinvestments returns. Occupational Health and Safety and Environmental Committee Our
As at the date of this annual report, our occupational health and safety and environmental committee consists of two executive directors, namely Mr. Lu Dongliang and Mr. Jiang Yinggang, and one non-executive director, namely Mr. Wang Jun, with Mr. Jiang Yinggang as the chairman. This committee considers our annual planning on health, environmental protection and safety, supervises our implementation of the planning on health, environmental protection and safety initiatives, makes inquiries into serious incidents and inspects and supervises the handling of such incidents and makes recommendations to the Board on major decisions on health, environmental protection and safety. Supervisory Committee Our
As at the date of this annual report,our supervisory committee consists of three supervisors, namely Mr. Liu XiangminYe Guohua and Mr. Wang JunMs. Shan Shulan as our shareholder representative supervisors and Mr. Wu Zuoming as the employee representative supervisor. Mr. Liu XiangminYe Guohua is the Chairmanchairman of our supervisory committee. During 2018, Mr. Liu Xiangmin and Mr. Wang Jun were our shareholders representative supervisors and Mr. Liu Xiangmin was the chairman of our supervisory committee. Mr. Liu Xiangmin resigned from the position of a supervisor of the Company and the chairman of supervisory committee on December 11, 2018. Mr. Wang Jun resigned as a supervisor of the Company on February 20, 2019. The term of all members of the supervisory committee of our Company will expire upon conclusion of the 2018 annual general meeting. The primary duties of our supervisory committee include: inspecting implementation of resolutions of the general meetings; inspecting legal compliance of our operations; inspecting our financial activities; inspecting the utilization of proceeds raised by us; inspecting the acquisitions and disposals of our assets; inspecting our connected transactions; and reviewing self-assessment report on internal control.
As of December 31, 2015, 2016, 2017 and 2017,2018, we had 70,368, 65,755, 64,794 and 64,79465,211 employees, respectively. The number of our employees decreasedincreased from 20162017 to 2017,2018, which was mainly due to the termination of labor relationship through negotiation and retirement.increasing demand for human resources arising from our newly completed projects. The table below sets forth the number of our employees by function and location as of the periods indicated: | | As of December 31, | | | 2015 | 2016 | 2017 | | Function | | (%) | | (%) | | | | Alumina production | 29,347 | 41.71 | 29,783 | 45.29 | 27,808 | 42.91 | | Primary aluminum production | 26,224 | 37.27 | 22,473 | 34.18 | 23,648 | 36.50 | | Mining operation | 2,885 | 4.10 | 2,696 | 4.10 | 2,657 | 4.10 | | Research and development | 1,056 | 1.50 | 986 | 1.50 | 991 | 1.53 | | Sales and marketing | 521 | 0.74 | 487 | 0.74 | 544 | 0.84 | | Energy | 6,543 | 9.30 | 5,792 | 8.81 | 5,790 | 8.94 | | Management and others(1) | 3,792 | 5.38 | 3,538 | 5.38 | 3,356 | 5.18 | | Total | 70,368 | 100.00 | 65,755 | 100.00 | 64,794 | 100.00 |
| | | As of December 31, | | | | | 2016 | | | 2017 | | | 2018 | | | Function | | | | | (%) | | | | | | (%) | | | | | | (%) | | | Alumina production | | | 29,783 | | | | 45.29 | | | | 27,808 | | | | 42.91 | | | | 28,038 | | | | 43.00 | | | Primary aluminum production | | | 22,473 | | | | 34.18 | | | | 23,648 | | | | 36.50 | | | | 23,630 | | | | 36.24 | | | Mining operation | | | 2,696 | | | | 4.10 | | | | 2,657 | | | | 4.10 | | | | 2,700 | | | | 4.14 | | | Research and development | | | 986 | | | | 1.50 | | | | 991 | | | | 1.53 | | | | 1,024 | | | | 1.57 | | | Sales and marketing | | | 487 | | | | 0.74 | | | | 544 | | | | 0.84 | | | | 548 | | | | 0.84 | | | Energy | | | 5,792 | | | | 8.81 | | | | 5,790 | | | | 8.94 | | | | 5,997 | | | | 9.20 | | | Management and others(1) | | | 3,538 | | | | 5.38 | | | | 3,356 | | | | 5.18 | | | | 3,274 | | | | 5.02 | | | Total | | | 65,755 | | | | 100.00 | | | | 64,794 | | | | 100.00 | | | | 65,211 | | | | 100.0 | |
| | | | (1) | Excluding our management personnel for alumina production, and primary aluminum production. |
| Location | | Employees | | | % of Total | | | Shandong | | | 7,593 | | | | 11.64 | | | Chalco Shandong | | | 5,809 | | | | 8.91 | | | Shandong Huayu | | | 1,784 | | | | 2.74 | | | Henan | | | 11,193 | | | | 17.16 | | | Chalco Mining | | | 6,209 | | | | 9.52 | | | Zhongzhou Aluminum | | | 4,317 | | | | 6.62 | | | Zhengzhou Institute | | | 667 | | | | 1.02 | | | Guizhou | | | 7,268 | | | | 11.15 | | | Guizhou Huajin | | | 795 | | | | 1.22 | | | Guizhou branch | | | 3,784 | | | | 5.80 | | | Zunyi Aluminum | | | 2,045 | | | | 3.14 | | | Guizhou Huaren | | | 644 | | | | 0.99 | | | Guangxi | | | 2,569 | | | | 3.94 | | | Guangxi branch | | | 2,569 | | | | 3.94 | | | Shanxi | | | 10,624 | | | | 16.29 | | | Shanxi branch | | | 2,604 | | | | 3.99 | | | Shanxi Huasheng | | | 1,659 | | | | 2.54 | | | Shanxi New Material | | | 5,147 | | | | 7.89 | | | Shanxi Xinghua Technology | | | 458 | | | | 0.70 | | | Shanxi Huaxing | | | 74 | | | | 0.11 | | | Shanxi Zhongrun | | | 682 | | | | 1.05 | | | Gansu | | | 6,494 | | | | 9.96 | | | Lanzhou Aluminum | | | 3,033 | | | | 4.65 | | | Gansu Hualu | | | 1,266 | | | | 1.94 | | | Liancheng branch | | | 2,195 | | | | 3.37 | | | Liaoning | | | 1,342 | | | | 2.06 | | | Fushun Aluminum | | | 1,342 | | | | 2.06 | | | Qinghai | | | 3,389 | | | | 5.20 | | | Qinghai branch | | | 3,389 | | | | 5.20 | | | Chongqing | | | 219 | | | | 0.34 | | | Chongqing branch | | | 219 | | | | 0.34 | | | Inner Mongolia | | | 5,661 | | | | 8.68 | | | Baotou Aluminum | | | 5,661 | | | | 8.68 | |
Location | Employees | % of Total | | Shandong | 8,339 | 12.87 | | Chalco Shandong | 6,569 | 10.14 | | Shandong Huayu | 1,770 | 2.73 | | Henan | 11,009 | 16.99 | | Chalco Mining | 5,962 | 9.20 | | Chalco Zhongzhou | 4,377 | 6.76 | | Zhengzhou Institute | 670 | 1.03 | | Guizhou | 6,790 | 10.48 | | Guizhou Huajin | 780 | 1.20 | | Guizhou branch | 4,183 | 6.46 | | Zunyi Aluminum | 983 | 1.52 | | Zunyi Alumina | 844 | 1.30 | | Guangxi | 2,714 | 4.19 | | Guangxi branch | 2,714 | 4.19 | | Shanxi | 9,910 | 15.30 | | Shanxi branch | 2,699 | 4.17 | | Shanxi Huasheng | 1,663 | 2.57 | | Shanxi New Material | 5,153 | 7.96 | | Shanxi Xinghua Technology | 388 | 0.60 | | Gansu | 6,492 | 10.02 | | Lanzhou branch | 2,973 | 4.59 | | Gansu Hualu | 1,329 | 2.05 | | Liancheng branch | 2,190 | 3.38 | | Liaoning | 1,446 | 2.23 | | Fushun Aluminum | 1,446 | 2.23 | | Qinghai | 3,318 | 5.12 | | Qinghai branch | 3,318 | 5.12 | | Chongqing | 609 | 0.94 | | Chongqing branch | 609 | 0.94 | | Inner Mongolia | 5,578 | 8.61 | | Baotou Aluminum | 5,578 | 8.61 | | Ningxia | 5,457 | 8.42 | | Ningxia Energy | 5,457 | 8.42 | | Shanghai | 22 | 0.03 | | Chalco Shanghai | 22 | 0.03 | | Others (including employees of subsidiaries under construction) | 2,832 | 4.37 | | Headquarters | 278 | 0.43 | | Total | 64,794 | 100.00 |
| Location | | Employees | | | % of Total | | | Ningxia | | | 5,646 | | | | 8.66 | | | Ningxia Energy | | | 5,646 | | | | 8.66 | | | Shanghai | | | 22 | | | | 0.03 | | | Chalco Shanghai | | | 22 | | | | 0.03 | | | Beijing | | | 2,938 | | | | 4.51 | | | Chalco Trading | | | 349 | | | | 0.54 | | | Chalco Energy | | | 351 | | | | 0.54 | | | Chalco Logistics | | | 2,238 | | | | 3.43 | | | Others | | | 32 | | | | 0.05 | | | Headquarters | | | 221 | | | | 0.34 | | | Total | | | 65,211 | | | | 100.00 | |
We have workers’ unions at the plant level that protect employees’ rights and welfare benefits, organize educational programs, encourage employee participation in management decisions and mediate disputes between individual employees and us. All employees are union members. We have not experienced any strikes or other labor disturbances that have interfered with our operations and we believe that we maintain good relationships with our employees. The remuneration package of our employees includes salary, bonuses and allowances. Employees also receive welfare benefits including medical care, housing subsidies, childcare and education, retirement and other miscellaneous items. In accordance with applicable PRC regulations, we participate in pension contribution plans organized by provincial and municipal governments, under which each of our plants is required to contribute an amount equal to a specified percentage of its employees’ salaries, bonuses and various allowances. The amount of contribution as a percentage of the employees’ salary is, on average, approximately 20% depending in part on the location of the plant. We have made all required pension contributions up to December 31, 2017.2018. Retirees who retired prior to the date of the reorganization will have their pensions paid out of the pension plans established by the PRC government. We provide to our employees various social welfare benefits through various institutions owned by Chinalco and its other affiliates or through third parties. As of the date of this annual report, the following directors, supervisors or senior management own an interest in shares of our Company: Name | Position
| Position | | Share class | | | Number of shares | | | % of respective share class | | | Jiang Yinggang | executive director | Domestic SharesExecutive Director and Senior Vice President | | | A Share | | | | 10,000 | | | | <0.1% | |
| Item 7. | Major Shareholders and Related Party Transactions |
Item 7. Major Shareholders and Related Party Transactions
We are a joint stock limited company organized under the laws of the PRC. Our parent company, Chinalco, a state-owned enterprise, beneficially owns34.77% 32.06% of our outstanding ordinary Shares directly and indirectly through its controlled entities as of March 31, 2018.2019. Chinalco holds a significant portion of our domestic shares in the form of state legal person shares, which do not have voting rights different from our other shares. Chinalco has substantial influence over our management, policies and corporate actions and can exercise all rights as our controlling shareholder subject to the relevant laws, rules and regulations. As of March 31, 2018,2019, approximately 65.23%67.94% of our total outstanding ordinary Shares are held by public shareholders, of which 26.15%45.72% and 39.08%22.22% are owned by holders of HA Shares and AH Shares, respectively. The following table sets forth information regarding ownership of our issued and outstanding capital stock as of March 31, 2018.2019. The table includes all persons who are known by us to own, either as beneficial owners or holders of record, five percent or more of any class of shares. | | | March 31, 2018 | | March 31, 2019 | | Holders of A Shares and H Shares | | Number of
shares
(in millions) | | % of
respective
share class(3) | | % of issued
total share
capital(4) | | Number of
shares | | % of
respective
share class(1) | | % of issued
total share
capital(2) | Chinalco(1)(3) | | | | | | | | | | | | | | | | | | | | A Shares | | 5,135.38 | (L)(2) | | 46.86 | (L) | | 34.46 | (L) | | | 5,295,895,019 | (L)(4) | | | 40.49 | (L) | | | 31.11 | (L) | | H Shares | | | 47.00 | (L) | | | 1.19 | (L) | | | 0.31 | (L) | | | 162,276,000 | (L) | | | 4.11 | (L) | | | 0.95 | (L) | | JP Morgan Chase & Co. | | | | | | | | | | H Shares | | 592.75 | (L) | | 15.02 | (L) | | 3.98 | (L) | | | | | 33.85 | (S)(5)(7) | | 0.85 | (S) | | 0.23 | (S) | | | | | | 524.04 | (P)(6)(7) | | | 13.28 | (P) | | | 3.52 | (P) | | | Templeton Asset Management Ltd. | | | | | | | | | | H Shares | | | 511.14 | (L) | | | 12.96 | (L) | | | 3.43 | (L) | | | The Capital Group Companies, Inc. | | | | | | | | | | H Shares | | | 436.32 | (L)(8) | | | 11.06 | (L) | | | 2.93 | (L) | | | The Goldman Sachs Group, Inc. | | | | | | | | | | H Shares | | 246.63 | (L)(9) | | 6.25 | (L) | | 1.65 | (L) | | | | | | 262.00 | (S)(9) | | | 6.64 | (S) | | | 1.76 | (S) | | | | | | | | | | | | | | BlackRock, Inc. | | | | | | | | | | | | | | | | | | | | | H Shares | | 201.59 | (L)(10) | | 5.11 | (L) | | 1.35 | (L) | | | 314,898,217 | (L)(5) | | | 7.98 | (L) | | | 1.85 | (L) | | | | | 3.10 | (S)(10) | | | 0.08 | (S) | | | 0.02 | (S) | | | 1,590,000 | (S)(5)(6) | | | 0.04 | (S) | | | <0.01 | (S) | | The Capital Group Companies, Inc. | | | | | | | | | | | | | | | H Shares | | | | 275,175,500 | (L)(7) | | | 6.98 | (L) | | | 1.62 | (L) | | | | | | | | | | | | | | | | | Citigroup Inc. | | | | | | | | | | | | | | | H Shares | | | | 198,266,233 | (L)(8) | | | 5.02 | (L) | | | 1.16 | (L) | | | | | | 31,557,010 | (S)(8) | | | 0.80 | (S) | | | 0.19 | (S) | | | | | | 160,214,084 | (P)(8)(9) | | | 4.06 | (P) | | | 0.94 | (P) |
| | | | (1) | The total number of our A Shares is 13,078,706,983 and the total number of our H Shares is 3,943,965,968. |
| (2) | The number of our total issued shares is 17,022,672,951 shares. |
| (3) | Including 4,889,864,0065,050,376,970 A Shares directly held by Chinalco, and an aggregate interest of 245,518,049 A Shares and 47,000,000 H sharesdirectly held by various controlled subsidiaries of Chinalco, comprising 238,377,795 A Shares held by Baotou Aluminum (Group) Co., Ltd.,Group and 7,140,254 A Shares held by Chalco Shanxi Aluminum Co., Ltd. and 47,000,000an interest of 162,276,000 H sharesShares directly held by Aluminum Corporation of China Overseas Holdings Limited.Limited, a subsidiary of Chinalco. |
(2) | (4) | The letter “L” denotes a long position. |
(3) | The total number of our A Shares is 10,959,832,268 and the total number of our H shares is 3,943,965,968. | (4) | The number of our total issued shares is 14,903,798,236 shares. | | (5) | The letter “S” denotes a short position. | (6) | The letter “P” denotes a lending pool. | (7) | These interests were held directly by various corporations controlled by JP Morgan Chase & Co.. Among the aggregate interests in the long position in H shares, 16,761,975 H shares were held as derivatives. Among the aggregate interests in the short position in H shares, 11,336,981 H shares were held as derivatives. | (8) | These interests were held directly by Capital Research and Management Companycontrolled by The Capital Group Companies, Inc.. | (9) | These interests were held directly by various corporations controlled by The Goldman Sachs Group, Inc.. Among the aggregate interests in the long position in H shares, 57,551,268 H shares were held as derivatives. Among the aggregate interests in the short position in H shares, 51,440,000 H shares were held as derivatives. | (10) | These interests were held directly by various corporations controlled by BlackRock, Inc.. Among the aggregateInc. |
| (6) | The letter “S” denotes a short position. |
| (7) | These interests in the short position in H shares, 2,132,000 H shares were held as derivatives.directly by Capital Research and Management Company controlled by The Capital Group Companies, Inc. |
| (8) | These interests were held directly by various corporations controlled by Citigroup Inc. |
| (9) | The letter “P” denotes a lending pool. |
We are not aware of any arrangement that may on a subsequent date result in a change of control of Chalco. We are inhave completed the process of implementing the proposed Asset Restructuring through capital contributions by several investors to our subsidiaries and subsequent issuance of additional A Shares to these investors to purchase their entire stake in these subsidiaries. Upon the completion of the Asset Restructuring,On February 25, 2019, we would issueissued to the investors approximately 2.1 billion A sharesShares in aggregate, representing approximately 12.4%12.45% of the enlarged total issued share capital of the Company. See “Item 4. Information on the Company - A. History and Development of the Company - Subscription of Equity Interest of Certain Subsidiaries and Subsequent Issuance of Additional A Shares” for detailed information of the Asset Restructuring. As of March 31, 2018,2019, there were 5245 registered holders of American depositary receiptsADRs evidencing 5,259,2515,346,033 of our ADSs. As an owner of at least 30% of our issued and outstanding shares, the parent company is deemed a controlling shareholder and therefore may not exercise its voting rights with respect to various matters related to our shares in a manner prejudicial to the interests of our other shareholders. See “Item 10. Additional Information - B. Memorandum and Articles of Association.” In accordance with our Articles of Association, each share of our capital stock has one vote and the shares of the same class have the same rights. Other than the foregoing restrictions, the voting rights of our major holders of domestic and H Shares are identical to those of any other holders of the same class of shares. Holders of domestic shares and H Shares are deemed to be shareholders of different classes for some matters, which may affect their respective interests. Other than the foregoing, holders of H Shares and domestic shares are entitled to the same voting rights.
B. | B. | Related Party Transactions |
Connected Transactions under Hong Kong Listing Rules Under the Listing Rules, transactions between connected persons and us, or connected transactions, generally must be reported to the Hong Kong Stock Exchange, announced to the public and/or approved by shareholders unless the foregoing requirements are waived by the Hong Kong Stock Exchange or exempted under the Listing Rules. Each year our independent non-executive directors must review our non-exempt continuing transactions and confirm that these transactions have been entered into: | (i) | in the ordinary and usual course of our business; |
| (ii) | with the terms of the transaction being fair and reasonable as far as our shareholders are concerned; |
| (iii) | either on normal commercial terms or, if there are not sufficient comparable transactions to judge whether they are on normal commercial terms, on terms no less favorable to us than terms available to or from (as appropriate) independent third parties; and |
| (iv) | in accordance with the relevant agreement governing them on terms that are fair and reasonable and in the interests of our shareholders as a whole. |
Although the definition of connected transactions is not synonymous with the definition of related party transactions, the concepts are sufficiently similar that the description of our connected transactions would satisfy disclosure requirements under U.S. securities laws. The following table sets forth the details of our material connected transactions for the year ended December 31, 2017.2018. Agreement | Nature | Term of the Agreement | Transaction
Amount
in 2017 | Annual
Cap
for 2017 | | Continuing Connected Transactions | | | (RMB in millions) | (RMB in millions) | | Comprehensive Social and Logistics Services Agreement (Counterparty: Chinalco) | Chinalco provides us with a broad range of social and logistics services including education and schooling, public transportation and property management. | The original agreement was entered on November 5, 2001, and expired on December 31, 2012. Pursuant to the supplementary agreement entered into in 2012, the term was renewed and expired on December 31, 2015. Pursuant to the supplementary agreement entered into in 2015, the term was renewed for three years from January 1, 2016 to December 31, 2018. | 327 | 550 | | | | | | | | General Agreement on Mutual Provision of Production Supplies and Ancillary Services (Counterparty: Chinalco) | We purchase from Chinalco ancillary production supplies and services which include, among other things, various raw materials required in alumina and primary aluminum production, transportation and loading services and production supporting services. | The original agreement was entered on into November 5, 2001, and expired on December 31, 2012. Pursuant to the supplementary agreement entered into in 2012, the term was renewed and entered on December 31, 2015. Pursuant to the supplementary agreement entered into in 2015, the term was renewed for three years from January, 1 2016 to December 31, 2018. | 5,198 | 6,420 | | | | | | | | Mineral Supply Agreement (Counterparty: Chinalco) | Chinalco provides us with bauxite and limestone from several mines that it operates. Chinalco must not provide bauxite and limestone to bauxite and limestone requirements. | The original agreement was entered on November 5, 2001, and expired on December 31, 2012. Pursuant to the supplementary agreement entered into in 2012, the term was renewed and expired in December 31, 2015. Pursuant to the supplementary agreement entered into in 2015, the term was renewed for three years from January 1, 2016 to December 31, 2018. | 49 | 360 | | | | | | |
Agreement | Nature | Term of the Agreement | Transaction
Amount
in 2017 | Annual
Cap
for 2017 | | Continuing Connected Transactions | | | (RMB in millions) | (RMB in millions) | | Provision of Engineering, Construction and Supervisory Services Agreement (Counterparty: Chinalco) | Chinalco provides us with certain engineering, construction and supervisory services at the state guidance price and, where there is no state guidance price, at market price. Such services are mainly provided by subsidiaries of Chinalco including China Aluminum International Engineering Corporation Limited. | The original agreement was entered on November 5, 2001, and expired on December 31, 2012. Pursuant to the supplementary agreement entered into in 2012, the term was renewed and expired on December 31, 2015. Pursuant to the supplementary agreement entered into in 2015, the term was renewed for three years from January 1, 2016 to December 31, 2018. | 1,205 | 10,000 | | | | | | | | Land Use Rights Leasing Agreement (Counterparty: Chinalco) | Chinalco leases 470 parcels of land covering an aggregate area of approximately 61.2 million square meters and spanning across eight provinces in the PRC to us. | The original agreement was entered on November 5, 2001, for a term of 50 years, expiring on June 30, 2051. | 412 | 1,200 | | | | | | | | Fixed Assets Leases Framework Contract (Counterparty: Chinalco) | We have agreed with Chinalco to provide leases to each other regarding buildings, constructions, machinery, apparatus, transportation facilities as well as equipment, appliance or tools and other fixed assets owned by either party in relation to production and operation | Pursuant to the agreement entered into on April 28, 2015, the term is from January 1, 2016 to December 31, 2018, for a term of three years. | 63 | 110 | | | | | | | | Financial Services Agreement (Counterparty: Chinalco Finance) | Chinalco Finance has agreed with Chinalco to provide us with deposit services, credit services and miscellaneous financial services. We have the right to choose the financial institution for financial services and the financial institution for deposit services and loan services as well as the | The original agreement expired on August 25, 2012, for a term of 1 year. Pursuant to the financial services agreement renewed on August 24, 2012, the term was extended and expired on August 25, 2015. Pursuant to the financial services agreement renewed on April 28, 2015, the term was renewed for a term of 3 years from August 26, 2015, and was | 6,951 | Daily cap of deposit balance (including accrued interests) from January 1, 2017 to October 25, 2017: 8,000 | | | | | | | | | amounts of loans and deposits with reference to our own needs. Chinalco Finance undertakes that the terms for the provision of financial services to us at any time would be no less favorable than those of the same type of financial services provided by Chinalco Finance to | amended and replaced as a whole by a new financial services agreement. The new financial services agreement was entered on October 26, 2017, for a term of 3 years, expiring on October 25, 2020. | 8,948 | Daily cap of deposit balance (including accrued interests) from October 26, 2017 to December 31, 2017: 12,000 |
Agreement | Nature | Term of the Agreement | Transaction
Amount
in 20172018 | Annual
Cap
for 20172018
| Continuing Connected Transactions | | | (RMB in millions) | (RMB in millions) | | Comprehensive Social and Logistics Services Agreement (Counterparty: Chinalco) | Chinalco provides us with a broad range of social and logistics services including education and schooling, public transportation and property management. | The original agreement was entered on November 5, 2001, and expired on December 31, 2012. Pursuant to the supplementary agreement entered into in 2012, the term was renewed and expired on December 31, 2015. Pursuant to the supplementary agreement entered into in 2015, the term was renewed for three years from January 1, 2016 to December 31, 2018. Pursuant to the supplementary agreement entered into in 2018, the term was renewed for three years from January 1, 2019 to December 31, 2021. | 312 | Annual cap: 550 | | | | | | | General Agreement on Mutual Provision of Production Supplies and Ancillary Services (Counterparty: Chinalco) | We purchase from Chinalco ancillary production supplies and services which include, among other things, various raw materials required in alumina and primary aluminum production, transportation and loading services and production supporting services. | The original agreement was entered on into November 5, 2001, and expired on December 31, 2012. Pursuant to the supplementary agreement entered into in 2012, the term was renewed and entered on December 31, 2015. Pursuant to the supplementary agreement entered into in 2015, the term was renewed for three years from January, 1 2016 to December 31, 2018. Pursuant to the supplementary agreement entered into in 2018, the term was renewed for three years from January 1, 2019 to December 31, 2021. | 4,495 | Annual cap: 6,950 | | | | | |
Agreement | Nature | Term of the Agreement | Transaction
Amount
in 2018 | Cap
for 2018 | | Connected Transactions | | | (RMB in millions) | (RMB in millions) | | Mineral Supply Agreement (Counterparty: Chinalco) | Chinalco provides us with bauxite and limestone from several mines that it operates. Chinalco must not provide bauxite and limestone to bauxite and limestone requirements. | The original agreement was entered on November 5, 2001, and expired on December 31, 2012. Pursuant to the supplementary agreement entered into in 2012, the term was renewed and expired in December 31, 2015. Pursuant to the supplementary agreement entered into in 2015, the term was renewed for three years from January 1, 2016 to December 31, 2018. Pursuant to the supplementary agreement entered into in 2018, the term was renewed for three years from January 1, 2019 to December 31, 2021. | 11 | Annual cap: 360 | | | | | | | Provision of Engineering, Construction and Supervisory Services Agreement (Counterparty: Chinalco) | Chinalco provides us with certain engineering, construction and supervisory services at the state guidance price and, where there is no state guidance price, at market price. Such services are mainly provided by subsidiaries of Chinalco or those ofincluding China Aluminum International Engineering Corporation Limited. | The original agreement was entered on November 5, 2001, and expired on December 31, 2012. Pursuant to the same type of financial services that may be providedsupplementary agreement entered into in 2012, the term was renewed and expired on December 31, 2015. Pursuant to us by other financial institutions. | | 4,990
| Daily cap of loan balance (including
accrued interests)the supplementary agreement entered into in 2015, the term was renewed for three years from
January 1, 20172016 to October 25, 2017:December 31, 2018. Pursuant to the supplementary agreement entered into in 2018, the term was renewed for three years from January 1, 2019 to December 31, 2021. | 1,993 | Annual cap: 10,000 | | | | | | | | Land Use Rights Leasing Agreement (Counterparty: Chinalco) | Chinalco leases 470 parcels of land covering an aggregate area of approximately 61.2 million square meters and spanning across eight provinces in the PRC to us. | The original agreement was entered on November 5, 2001, for a term of 50 years, expiring on June 30, 2051. | 4,635412 | Daily cap of loan balance (including accrued interests) from October 26, 2017 to December 31, 2017: 15,000Annual cap: 1,200 | | | | | | |
Agreement | Nature | Term of the Agreement | Transaction
Amount
in 2018 | Cap
for 2018 | | Connected Transactions | | | (RMB in millions) | (RMB in millions) | | Fixed Assets Leases Framework Contract (Counterparty: Chinalco) | We have agreed with Chinalco to provide leases to each other regarding buildings, constructions, machinery, apparatus, transportation facilities as well as equipment, appliance or tools and other fixed assets owned by either party in relation to production and operation. | The original agreement was entered into on April 28, 2015 and expired on December 31, 2018. Pursuant to the supplementary agreement entered into in 2018, the term was renewed for three years from January 1, 2019 to December 31, 2021. | 34 | Annual cap: 110 | | | | | | | | Financial Services Agreement (Counterparty: Chinalco Finance) | Chinalco Finance has agreed with Chinalco to provide us with deposit services, credit services and miscellaneous financial services. We have the right to choose the financial institution for financial services and the financial institution for deposit services and loan services as well as the amounts of loans and deposits with reference to our own needs. Chinalco Finance undertakes that the terms for the provision of financial services to us at any time would be no less favorable than those of the same type of financial services provided by Chinalco Finance to Chinalco and other subsidiaries of Chinalco or those of the same type of financial services that may be provided to us by other financial institutions. | The original agreement expired on August 25, 2012, for a term of 1 year. Pursuant to the financial services agreement renewed on August 24, 2012, the term was extended and expired on August 25, 2015. Pursuant to the financial services agreement renewed on April 28, 2015, the term was renewed for a term of 3 years from August 26, 2015, and was amended and replaced as a whole by a new financial services agreement. The new financial services agreement was entered on October 26, 2017, for a term of 3 years, expiring on October 25, 2020. | 9,102 3,755
— | Daily cap of deposit balance (including accrued interests): 12,000 Daily cap of loan balance (including accrued interests): 15,000 Other financial services: 50 | | | | | | | | Finance Lease Agreement (Counterparty: Chinalco Finance Lease Co., Ltd.) | Chinalco Finance Lease Co., Ltd. provides finance lease services to the Group. | The original finance lease framework agreement was entered into between the Company and Chinalco Lease on August 27, 2015, with a term from August 27, 2015, to December 31, 2016. A new finance lease framework agreement was entered into between the Company and Chinalco Lease on November 13,2015, with a term of 3 years from January 1, 2016, to December 31, 2018. Pursuant to the supplementary agreement entered into in 2018, the term was renewed for three years from January 1, 2019 to December 31, 2021. | 1,088 | 10,000 | | | | | | |
Agreement | Nature | Term of the Agreement | Transaction
Amount
in 2018 | Cap
for 2018 | | Connected Transactions | | | 1 | Daily cap of other financial services from January 1, 2017 to October 25, 2017: 50 | | | | | | | | | 0 | Daily cap of other financial services from October 26, 2017 to December 31, 2017: 50 | | | | | | Finance Lease Agreement (Counterparty: Chinalco Finance Lease Co., Ltd.) | Chinalco Finance Lease Co., Ltd. provides finance lease services to the Group. | The finance lease framework agreement was entered into between the Company and Chinalco Lease on August 27, 2015, with a term from August 27, 2015, to December 31, 2016. A new finance lease framework agreement was entered into between the Company and Chinalco Lease on November 13,2015, with a term of 3 years from January 1, 2016, to December 31, 2018. | 1,519(RMB in millions) | Daily cap of finance lease balance:(RMB in millions) 10,000 | | | | | | Factoring Cooperation Agreement (Counterparty: Chinalco Commercial Factoring (Tianjin) Co., Ltd.) | Chinalco Commercial Factoring (Tianjin) Co., Ltd. provides factoring financing services to the Company. | The original agreement was entered on September 27, 2017, and will expireexpired on December 31, 2018. Pursuant to the supplementary agreement entered into in 2018, the term was renewed for three years from January 1, 2019 to December 31, 2021. | 1,000 | Daily capAnnual cap: 1,300 | | | | | | General Agreement on Mutual Provision of factoringProduction Supplies And Ancillary Services (Counterparty: Chinalco) | Supplies and ancillary services. | The original agreement was entered into on November 5, 2001, and expired on December 31, 2012. Pursuant to the supplementary agreement entered into in 2012, the term was renewed and expired on December 31, 2015. Pursuant to the supplementary agreement entered into in 2015, the term was renewed for three years from January 1, 2016 to December 31, 2018. Pursuant to the supplementary agreement entered into in 2018, the term was renewed for three years from January 1, 2019 to December 31, 2021. | 11,867 | Annual cap: 16,400 | | | | | | | Fixed Assets Leases Framework Agreement (Counterparty: Chinalco) | We have agreed to provide leases to each other regarding buildings, constructions, machinery, apparatus, transportation facilities as well as equipment, appliance or tools and other fixed assets owned by either party in relation to production and operation. | Pursuant to the original agreement entered into on April 28, 2015, the term is from January 1, 2016 to December 31 2018, for a term of three years. Pursuant to the supplementary agreement entered into in 2018, the term was renewed for three years from January 1, 2019 to December 31, 2021. | 32 | Annual cap: 100 | | | | | | | Labor Services and Engineering Services Agreement (Counterparty: Chinalco) | Services provided by the Company to Chinalco: engineering design services, balance: 1,300equipment repairs, logistics management services, etc. | The original agreement expired in June 27, 2016. Pursuant to the supplementary agreement entered into in 2016, the term was renewed for three years from January 1, 2016 to December 31, 2018. | 6 | Annual cap: 500 | | | | | | | Labor Services and Engineering Services Framework Agreement (Counterparty: Chalco Steering Intelligent Technology Co., Ltd.) | Chalco Steering Intelligent Technology Co., Ltd. provides us with engineering services and labor services which include, among other things, equipment repairs, intelligent industrial design and maintenance. | Pursuant to the agreement entered into on September 17, 2018, the term is from January 1, 2018 to December 31, 2020, for a term of three years. | 2 | Annual cap: 56 | | | | | | |
Agreement | Nature | Term of the Agreement | Transaction
Amount
in 2017 | Annual
Cap
for 2017 | | Continuing Connected Transactions | | | (RMB in millions) | (RMB in millions) | | General Agreement on Mutual Provision of Production Supplies And Ancillary Services (Counterparty: Chinalco) | Supplies and ancillary services | The original agreement was entered into on November 5, 2001, and expired on December 31, 2012. Pursuant to the supplementary agreement entered into in 2012, the term was renewed and expired on December 31, 2015. Pursuant to the supplementary agreement entered into in 2015, the term was renewed for three years from January 1, 2016 to December 31, 2018. | 11,194 | 15,300 | | | | | | | | Fixed Assets Leases Framework Agreement ( Counterparty: Chinalco) | We have agreed to provide leases to each other regarding buildings, constructions, machinery, apparatus, transportation facilities as well as equipment, appliance or tools and other fixed assets owned by either party in relation to production and operation | Pursuant to the agreement entered into on April 28, 2015, the term is from January 1, 2016 to December 31 2018, for a term of three years. | 41 | 100 | | | | | | | | Labor Services and Engineering Services Agreement (Counterparty: Chinalco) | Services provided by the Company to Chinalco: engineering design services, equipment repairs, logistics management services, etc. | The original agreement expired in June 27, 2016. Pursuant to the supplementary agreement entered into in 2016, the term was renewed for three years from January 1, 2016 to December 31, 2018. | 77 | 400 | | | | | | |
All transactions with related parties are conducted at prices and terms mutually agreed by the parties involved, which are determined as follows: | (a) | Sales of materials and finished goods comprised sales of alumina, primary aluminum, copper and scrap materials. Transactions entered are covered by general agreements on mutual provision of production supplies and ancillary services. The pricing policy is summarized below: |
| (1) | The price prescribed by the PRC government (“State-prescribed price”) is adopted; |
| (2) | If there is neither a state-prescribed price nor a state-guidance price, then the market price (being price charged to and from independent third parties) is adopted; and |
| (3) | If none of the above is available, then the adoption of a contractual price (being reasonable costs incurred in providing the relevant services plus not more than 5% of such costs is adopted). |
| (b) | Utility services, including electricity, gas, heat and water, are supplied at State-prescribed prices. |
| (c) | Engineering, project construction and supervisory services were provided for construction projects of the Group. The state-guidance price or prevailing market price (including the tender price where by way of tender) is adopted for pricing purposes. |
| (d) | The pricing policy for purchases of key and auxiliary materials (including bauxite, limestone, carbon, cement and coal) is the same as that set out in (i) above. |
| (e) | Social services and logistics services provided by Chinalco Group cover public security, fire services, education and training, school and hospital services, cultural and physical education, newspaper and magazines, broadcasting and printing as well as property management, environmental and hygiene, greenery, nurseries and kindergartens, sanatoriums, canteens and offices, public transport and retirement management and other services. Provisions of these services are covered by the Comprehensive Social and Logistics Services Agreement. The pricing policy is the same as that set out in (a) above. |
| (f) | Pursuant to the Land Use Rights Lease Agreements entered into between Chinalco Group and us, operating leases for industrial or commercial land are charged at the market rent rate. The Group also entered into a building rental agreement with Chinalco Group and pays rent based on the market rate for its lease of buildings owned by Chinalco. |
| (g) | The pricing policy for product processing services is the same as that set out in (a) above. |
During the years ended December 31, 2015, 2016, 2017 and 2017,2018, our significant transactions with other state-owned enterprises (excluding Chinalco and its subsidiaries) constituted a large portion of our sales of goods and purchases of raw materials, electricity, property, plant and equipment and services. In addition, substantially all restricted cash, time deposits, cash and cash equivalents and borrowings as of December 31, 2015, 2016, 2017 and 20172018 and the relevant interest earned or paid during the year are transacted with banks and other financial institutions which are controlled by the PRC government.
We provide the following additional information on material related party transactions during the periods indicated: | (a) | Significant related party transactions |
| | | For the year ended December 31 | | | For the year ended December 31 | | | | | | 2015 | | | | 2016 | | | | 2017 | | | 2016 | | | 2017 | | | 2018 | | | | | (RMB in thousands) | | | (RMB in thousands) | | | Sales of goods and services rendered: | | | | | | | | | | | | | | | | | | | | | Sales of materials and finished goods to: | | | | | | | | | | | | | | | | | | | | | Chinalco and its subsidiaries | | | 10,998,505 | | | | 10,311,722 | | | | 10,612,330 | | | | 10,319,958 | | | | 10,658,507 | | | | 11,248,625 | | | Associates of Chinalco | | | 703,628 | | | | 688,308 | | | | 682,992 | | | | 688,308 | | | | 682,992 | | | | 897,642 | | | Joint ventures | | | 79,034 | | | | 648,145 | | | | 2,031,159 | | | | 648,145 | | | | 2,031,159 | | | | 4,462,670 | | | Associates | | | 2,165,445 | | | | 605,449 | | | | 705,052 | | | | 605,449 | | | | 724,658 | | | | 2,626,780 | | | | | | 13,946,612 | | | | 12,253,624 | | | | 14,031,533 | | | | 12,261,860 | | | | 14,097,316 | | | | 19,235,717 | | | Provision of utility services to: | | | | | | | | | | | | | | | | | | | | | | | | | | Chinalco and its subsidiaries | | | 314,544 | | | | 567,628 | | | | 581,566 | | | | 567,628 | | | | 581,566 | | | | 620,552 | | | Associates of Chinalco | | | 14,803 | | | | 4,444 | | | | 8,776 | | | | 4,444 | | | | 8,776 | | | | 15,719 | | | Joint Ventures | | | — | | | | 3,031 | | | | 118,280 | | | | 3,031 | | | | 118,280 | | | | 186,672 | | | Associates | | | 553 | | | | 584 | | | | 1,122 | | | | 584 | | | | 1,122 | | | | 24,309 | | | | | | 329,900 | | | | 575,687 | | | | 709,744 | | | | 575,687 | | | | 709,744 | | | | 847,252 | | | Provision of engineering, construction and supervisory services to: | | | | | | | | | | | | | | | | | | | | | | | | | | Chinalco and its subsidiaries | | | 46,328 | | | | 101,323 | | | | 77,095 | | | | 101,323 | | | | 77,095 | | | | 5,981 | | | Joint ventures | | | — | | | | 41,423 | | | | 2,046 | | | | 41,423 | | | | 2,046 | | | | — | | | Associates | | | | — | | | | — | | | | 1,725 | | | | | | | 142,746 | | | | 79,141 | | | | 7,706 | | | Rental revenue of land use rights and buildings to: | | | | | | | | | | | | | | | Chinalco and its subsidiaries | | | | 33,231 | | | | 40,875 | | | | 31,551 | | | Associates of Chinalco | | | | — | | | | 426 | | | | 1,545 | | | Associates | | | | — | | | | — | | | | 1,511 | | | | | | | 33,231 | | | | 41,301 | | | | 34,607 | | | Purchase of goods and services: | | | | | | | | | | | | | | | Purchases of engineering, construction and supervisory services from: | | | | | | | | | | | | | | | Chinalco and its subsidiaries | | | | 1,525,349 | | | | 1,071,283 | | | | 2,088,338 | | | Joint ventures | | | | — | | | | — | | | | 2,100 | | | Associates | | | | — | | | | 134,072 | | | | 405,993 | | | | | | | 1,525,349 | | | | 1,205,355 | | | | 2,496,431 | | | | | | | | | | | | | | | | | | Purchases of key and auxiliary materials and finished goods from: | | | | | | | | | | | | | | | Chinalco and its subsidiaries | | | | 1,660,529 | | | | 3,850,073 | | | | 3,513,420 | | | Associates of Chinalco | | | | — | | | | — | | | | 18,917 | | | Joint ventures | | | | 3,799,116 | | | | 6,516,087 | | | | 8,182,251 | | | Associates | | | | 31,413 | | | | 1,175 | | | | 2,108,072 | | | | | | | 5,491,058 | | | | 10,367,335 | | | | 13,822,660 | | | | | | | | | | | | | | | | | | Provision of social services and logistics services by: Chinalco and its subsidiaries | | | | 307,354 | | | | 326,830 | | | | 312,062 | | | | | | | | | | | | | | | | | Provision of utilities services by:
Chinalco and its subsidiaries | | | | 686,474 | | | | 1,412,722 | | | | 992,827 | | | Associates of Chinalco | | | | — | | | | — | | | | 96,510 | | | Joint Ventures | | | | 3,386 | | | | 19,537 | | | | 26,269 | |
| | | For the year ended December 31 | | | | | | 2015 | | | | 2016 | | | | 2017 | | | | | (RMB in thousands) | | | |
| | | | 46,328 | | | | 142,746 | | | | 79,141 | | | Rental revenue of land use rights and buildings to: | | | | | | | | | | | | | | Chinalco and its subsidiaries | | | 34,476 | | | | 33,231 | | | | 40,875 | | | Associates of Chinalco | | | 249 | | | | — | | | | 426 | | | | | | 34,725 | | | | 33,231 | | | | 41,301 | | | Purchase of goods and services: | | | | | | | | | | | | | | Purchases of engineering, construction and supervisory services from: | | | | | | | | | | | | | | Chinalco and its subsidiaries | | | 1,737,344 | | | | 1,525,349 | | | | 1,205,355 | | | | | | | | | | | | | | | | | Purchases of key and auxiliary materials and finished goods from: | | | | | | | | | | | | | | Chinalco and its subsidiaries | | | 1,640,051 | | | | 1,626,782 | | | | 3,849,889 | | | Joint ventures | | | 1,276,078 | | | | 3,799,116 | | | | 6,516,087 | | | Associates | | | 414,539 | | | | 31,413 | | | | 1,175 | | | | | | 3,330,668 | | | | 5,457,311 | | | | 10,367,151 | | | Provision of social services and logistics services by: Chinalco and its subsidiaries | | | 324,872 | | | | 307,354 | | | | 326,830 | | | | | | | | | | | | | | | | Provision of utilities services by:
Chinalco and its subsidiaries | | | 643,597 | | | | 686,474 | | | | 1,397,346 | | | Joint Ventures | | | — | | | | 3,386 | | | | 19,537 | | | | | | 643,597 | | | | 689,860 | | | | 1,416,883 | | Provision of products processing services by:
Chinalco and its subsidiaries | | | 62,623 | | | | — | | | | — | | | Provision of other services by: | | | | | | | | | | | | | | Ajoint venture | | | — | | | | 151,552 | | | | 269,204 | | | Rental expenses for buildings and land use rights charged by: Chinalco and its subsidiaries | | | 590,657 | | | | 509,558 | | | | 474,567 | | | Joint ventures | | | — | | | | 126 | | | | — | | | | | | 590,657 | | | | 509,684 | | | | 474,567 | | | Other significant related party transactions: | | | | | | | | | | | | | | Borrowing from a subsidiary of Chinalco | | | 5,929,000 | | | | 5,145,959 | | | | 3,901,000 | | | Interest expense on borrowings, discounted notes and factoring arrangement from subsidiaries of Chinalco | | | 149,213 | | | | 226,118 | | | | 225,934 | | | Entrusted loan and other borrowings to: | | | | | | | | | | | | | | Joint ventures | | | 140,000 | | | | 212,400 | | | | 500,000 | | | An associte | | | — | | | | — | | | | 1,100,000 | | | | | | 140,000 | | | | 212,400 | | | | 1,600,000 | | | Interest income on entrusted loan and other borrowings to: | | | | | | | | | | | | | | Joint ventures | | | 14,061 | | | | 31,373 | | | | 41,005 | | | An associate | | | — | | | | — | | | | 24,425 | | | | | | 14,061 | | | | 31,373 | | | | 65,430 | | | Interest income from the unpaid disposal proceeds from: Chinalco and its subsidiaries | | | 326,217 | | | | 246,149 | | | | 117,587 | | | Disposal of assets under a sale and leaseback contract to a subsidiary of Chinalco | | | 1,150,000 | | | | 1,040,000 | | | | 600,000 | | | Finance lease under a sale and leaseback contract from a subsidiary of Chinalco | | | 1,150,064 | | | | 1,040,036 | | | | 600,036 | | | Provision of financial guarantees to: | | | | | | | | | | | | | | Joint ventures | | | 340,900 | | | | 24,245 | | | | 18,350 | |
| | | For the year ended December 31 | | | | | | 2015 | | | | 2016 | | | | 2017 | | | | | (RMB in thousands) | | |
| An associate | | | 17,470 | | | | — | | | | — | | | | | | 358,370 | | | | 24,245 | | | | 18,350 | | Financial guarantees provided by:
Subsidiaries of Chinalco | | | 27,000 | | | | 23,000 | | | | 4,000 | | | Discounted notes receivable to a subsidiary of Chinalco | | | 122,000 | | | | 40,200 | | | | 523,253 | |
| | | For the year ended December 31 | | | | | 2016 | | | 2017 | | | 2018 | | | | | (RMB in thousands) | | | Associates | | | — | | | | — | | | | 77,432 | | | | | | 689,860 | | | | 1,432,259 | | | | 1,193,038 | | | | | | | | | | | | | | | | | Provision of other services by: | | | | | | | | | | | | | | A joint venture | | | 151,552 | | | | 269,204 | | | | 226,280 | | | Rental expenses for buildings and land use rights charged by: | | | | | | | | | | | | | | Chinalco and its subsidiaries | | | 511,001 | | | | 509,848 | | | | 501,866 | | | Joint ventures | | | 126 | | | | — | | | | — | | | | | | 511,127 | | | | 509,848 | | | | 501,866 | | | | | | | | | | | | | | | | | Other significant related party transactions: | | | | | | | | | | | | | | Borrowing from a subsidiary of Chinalco | | | 5,145,959 | | | | 4,010,000 | | | | 6,525,000 | | | Interest expense on borrowings, discounted notes and factoring arrangement from subsidiaries of Chinalco | | | 226,118 | | | | 225,934 | | | | 143,415 | | | Entrusted loan and other borrowings to: | | | | | | | | | | | | | | Joint ventures | | | 212,400 | | | | 500,000 | | | | — | | | An associate | | | — | | | | 1,100,000 | | | | — | | | | | | 212,400 | | | | 1,600,000 | | | | — | | | Interest income on entrusted loan and other borrowings to: | | | | | | | | | | | | | | Joint ventures | | | 31,373 | | | | 41,005 | | | | — | | | An associate | | | — | | | | 24,425 | | | | — | | | | | | 31,373 | | | | 65,430 | | | | — | | | Interest income from the unpaid disposal proceeds from: Chinalco and its subsidiaries | | | 246,149 | | | | 117,587 | | | | — | | | Disposal of assets under a sale and leaseback contract to a subsidiary of Chinalco | | | 1,040,000 | | | | 600,000 | | | | 224,000 | | | Finance lease under a sale and leaseback contract from a subsidiary of Chinalco | | | 1,040,036 | | | | 600,036 | | | | 224,000 | | | Trade receivable factoring arrangement from a subsidiary of Chinalco | | | — | | | | 1,570,000 | | | | 470,101 | | | Discounted notes receivable to a subsidiary of Chinalco | | | 40,200 | | | | 523,253 | | | | 756,000 | | | Provision of financial guarantees to: | | | | | | | | | | | | | | Joint ventures | | | 24,245 | | | | 18,350 | | | | 12,450 | | | | | | | | | | | | | | | | Financial guarantees provided by:
Subsidiaries of Chinalco | | | 23,000 | | | | 4,000 | | | | — | |
| (b) | Balances with related parties |
| | | As ofDecember 31, | | | | 2016 | | 2017 | | | | (RMB in thousands) | | Cash and cash equivalents deposited with | | | | | | | | | | A subsidiary of Chinalco | | | 7,073,289 | | | | 7,679,806 | | | Trade and notes receivables | | | | | | | | | | Chinalco and its subsidiaries | | | 1,086,014 | | | | 1,475,477 | | | Associates of Chinalco | | | 10,200 | | | | 2,000 | | | Joint ventures | | | 38,055 | | | | 591,488 | | | Associates | | | — | | | | 96,574 | | | | | | 1,134,269 | | | | 2,165,539 | | | Provision for impairment of receivables | | | (78,262 | ) | | | (78,388 | ) | | | | | 1,056,007 | | | | 2,087,151 | | | Other current assets | | | | | | | | | | Chinalco and its subsidiaries | | | 5,065,890 | | | | 623,254 | | | Joint ventures | | | 2,092,369 | | | | 1,737,644 | | | Associates | | | 73,546 | | | | 1,132,138 | | | | | | 7,231,805 | | | | 3,493,036 | | | Provision for impairment of other current assets | | | (48,510 | ) | | | (48,166 | ) | | | | | 7,182,994 | | | | 3,444,870 | | | Other non-current assets | | | | | | | | | | Chinalco and its subsidiaries | | | 27,946 | | | | — | | | Joint ventures | | | 112,403 | | | | 97,103 | | | Associates | | | 111,846 | | | | 111,845 | | | | | | 252,195 | | | | 208,948 | | | Borrowings and finance lease payable | | | | | | | | | | Subsidiaries of Chinalco | | | 6,051,288 | | | | 3,329,807 | | | A joint venture | | | 190,000 | | | | 190,000 | | | | | | 6,241,288 | | | | 3,519,807 | | | Trade and notes payables | | | | | | | | | | Chinalco and its subsidiaries | | | 374,325 | | | | 331,682 | | | Joint ventures | | | 300 | | | | 413,533 | | | Associates | | | — | | | | 7,222 | | | | | | 374,625 | | | | 752,437 | | | Other payables and accrued liabilities | | | | | | | | | | Chinalco and its subsidiaries | | | 1,540,119 | | | | 2,652,249 | | | Associates of Chinalco | | | 1,149 | | | | 5,030 | | | Associates | | | 53,000 | | | | 218,560 | | | Joint ventures | | | 159,669 | | | | 101,828 | | | | | | 1,753,937 | | | | 2,977,667 | |
| | | December 31, 2017 | | | December 31, 2018 | | | Cash and cash equivalents deposited with | | | | | | | | | | A subsidiary of Chinalco | | | 7,679,806 | | | | 9,101,541 | | | Trade and notes receivables | | | | | | | | | | Chinalco and its subsidiaries | | | 1,483,984 | | | | 1,278,715 | | | Associates of Chinalco | | | 2,000 | | | | 18,655 | | | Joint ventures | | | 591,488 | | | | 819,878 | | | Associates | | | 96,574 | | | | 6,615 | | | | | | 2,174,046 | | | | 2,123,863 | | | Provision for impairment of receivables | | | (78,388 | ) | | | (77,657 | ) | | | | | 2,095,658 | | | | 2,046,206 | | | Other current assets | | | | | | | | | | Chinalco and its subsidiaries | | | 623,254 | | | | 830,615 | |
| | | December 31, 2017 | | | December 31, 2018 | | | Joint ventures | | | 1,737,644 | | | | 1,424,678 | | | Associates | | | 1,132,138 | | | | 29,701 | | | | | | 3,493,036 | | | | 2,284,994 | | | Provision for impairment of other current assets | | | (48,166 | ) | | | (40,830 | ) | | | | | 3,444,870 | | | | 2,244,164 | | | Other non-current assets | | | | | | | | | | Joint ventures | | | 97,103 | | | | — | | | Associates | | | 111,845 | | | | 111,845 | | | | | | 208,948 | | | | 111,845 | | | Borrowings and finance lease payable | | | | | | | | | | Subsidiaries of Chinalco | | | 3,329,807 | | | | 4,373,033 | | | A joint venture | | | 190,000 | | | | — | | | | | | 3,519,807 | | | | 4,373,033 | | | Trade and notes payables | | | | | | | | | | Chinalco and its subsidiaries | | | 332,701 | | | | 404,278 | | | Joint ventures | | | 413,533 | | | | 631,570 | | | Associates | | | 7,222 | | | | 13,033 | | | Associates of Chinalco | | | — | | | | 4,012 | | | | | | 753,456 | | | | 1,052,893 | | | Other payables and accrued liabilities | | | | | | | | | | Chinalco and its subsidiaries | | | 2,652,249 | | | | 1,887,010 | | | Associates of Chinalco | | | 5,030 | | | | 17,128 | | | Associates | | | 218,560 | | | | 148,978 | | | Joint ventures | | | 101,828 | | | | 8,860 | | | | | | 2,977,667 | | | | 2,061,976 | | | Contract liabilities | | | | | | | | | | Chinalco and its subsidiaries | | | — | | | | 22,307 | | | Associates of Chinalco | | | — | | | | 20 | | | Associates | | | — | | | | 12,451 | | | Joint ventures | | | — | | | | 94,367 | | | | | | — | | | | 129,145 | | | | | | | | | | | |
Guarantees We provided guarantees to our related parties to guarantee their loans during the period from January 1, 20172018 to March 31, 2018.2019. The outstanding balance of the loans we guaranteed was RMB18.35RMB12.45 million as of March 31, 20182019 and the largest amount outstanding of the loans we guaranteed during the period from January 1, 20172018 to March 31, 20182019 was RMB2.229RMB18.35 million. The interest rates on such loans range from 4.9%2.3% to 6.765%6.53% per annum. Our related parties also provided guarantees to us to guarantee our loans during the period from January 1, 20172018 to March 31, 2018.2019. The outstanding balance of the loans guaranteed by our related parties was RMB23RMB668 million as of March 31, 20182019 and the largest amount outstanding of the loans guaranteed by our related parties during the period from January 1, 20172018 to March 31, 20182019 was RMB23RMB668 million. The interest rate on such loan range from 2.3%6.4% to 6.53%6.4125% per annum. Loans We provided several entrusted loans to our related parties mainly for the purpose of supplementing working capital during the period from January 1, 20172018 to March 31, 2018.2019. The outstanding balance of such entrusted loans was mainly RMB629RMB675 million as of March 31, 20182019 and the largest amount outstanding of the entrusted loans during the period from January 1, 20172018 to March 31, 20182019 was RMB2,229RMB675 million. The interest rates on such entrusted loans range from 4.35%4.3% to 10% per annum.
Our related party also provided several loans to us mainly for the purpose of supplementing working capital during the period from January 1, 20172018 to March 31, 2018.2019. The outstanding balance of such loans was RMB3.52RMB4.14 billion as of March 31, 20182019 and the largest amount outstanding of the loans during the period from January 1, 20172018 to March 31, 20182019 was RMB6.05RMB4.74 billion. The interest rates on such loans range from 4.13%4.35% to 6.7%5.23% per annum. C. | C. | Interests of Experts and Counsel |
Not applicable. Item 8. Financial Information
| A.Item 8. | Financial Information |
| A. | Consolidated Statements and Other Financial Information |
We have appended our consolidated financial statements filed as part of this annual report on Form 20-F. Legal Proceedings We are not currently a party to any pending legal proceedings which are expected to have a significant effect on our financial position or results of operations, nor are we aware of any proceedings that are pending or threatened which may have a significant effect on our financial position or results of operations. We may from time to time become a party to various legal or administrative proceedings arising in the ordinary course of our business. Dividend Policy Our Board declares dividends, if any, in Renminbi with respect to H Shares on a per share basis and pays such dividends in HK dollars. Any final dividend for a fiscal year is subject to shareholders’ approval. The Bank of New York Mellon, as depositary, converts the HK dollar dividend payments and distributes them to holders of ADSs in U.S. dollars, less expenses of conversion.
Under the Company Law of the PRC and our Articles of Association, all of our shareholders have equal rights to dividends and distributions. The holders of the H Shares share proportionately on a per share basis in all dividends and other distributions declared by our Board. Any final dividend for a fiscal year is subject to shareholders’ approval. Cash dividends, if made, are declared in Renminbi with respect to H Shares on a per share basis and paid in HK dollars. The Bank of New York Mellon, as depositary, converts the HK dollar dividend payments and distributes them to holders of ADSs in U.S. dollars, less expenses of conversion. We believe that our dividend policy strikes a balance between two important goals of providing our shareholders with a competitive return on investment and assuring sufficient reinvestment of profits to enable us to achieve our strategic objectives. The declaration of dividends is subject to the discretion of our Board, which takes into account the following factors: our financial results; capital requirements; contractual restrictions on the payment of dividends by us to our shareholders or by our subsidiaries to us; our shareholders’ interests; the effect on our creditworthiness; general business conditions; and other factors our Board may deem relevant. Under our current profit distribution policy as set forth in our Articles of Association, the basic principles of such policy include (i) giving adequate consideration to return to investors and making dividend to shareholders in an applicable percentage of the distributable profits, (ii) maintaining the continuity and stability of our dividend policy, while taking into consideration of our interests in the long term and the overall interests of all shareholders, as well as our sustainable development; and (iii) giving priority to dividend in cash. More specifically, under such policy, we may make dividends in cash, in shares or in a combination of both cash and shares. Subject to conditions, we may make interim profit distributions. Save in exceptional circumstances , if our profit for the year and our cumulative undistributed profit are positive, we may make dividend in cash and (i) the profit to be distributed in cash per annum will not be less than 10% of the distributable profit realized for that year, or (ii) the total profit to be distributed in cash in the past three years will not be less than 30% of the average annual distributable profit realized in the past three years. Pursuant to PRC laws and regulations, dividends may only be distributed after allowance has been made for: (1) recovery of losses, if any and (2) allocations to the statutory surplus reserve. The allocations to the statutory surplus reserve is 10% of our net profit determined in accordance with PRC Generally Accepted Accounting Principles, unless the accumulated statutory surplus reserve exceeds 50% of our registered share capital, in which case the surplus reserve is discretional. Our distributable profits for the current fiscal year will be equal to our net profits determined in accordance with IFRS, less allocations to the statutory surplus reserve. See “Item 10. Additional Information - E. Taxation” for a discussion of the tax consequences of receipt of dividends. Except as disclosed elsewhere in this annual report, we have not experienced any significant changes since the date of our audited consolidated financial statements which is included in this annual report. Item 9. The Offer and Listing
| Item 9. | The Offer and Listing |
TheOur A Shares are traded under the stock code “601600” in the Shanghai Stock Exchange, isas our principal host market, while our H Shares are traded under the principal trading market for our A Shares, andstock code “02600” in the Hong Kong Stock Exchange isas the principal trading market for our H Shares. The ADSs have been issued by the Bank of New York Mellon, acting as depositary bank, and are listed on the New York Stock Exchange under the symbol “ACH” with each ADS representing 25 H Shares.
The following table sets forth, for the periods indicated, the reported high and low market prices for our shares on the New York Stock Exchange, the Hong Kong Stock Exchange and the Shanghai Stock Exchange:
| | NYSE | Hong Kong Stock Exchange | Shanghai Stock Exchange | | Calendar Period | High | Low | High | Low | High | Low | | | (US$ per ADS) | (HK$ per H Share) | (RMB per A Share) | | 2013 | 13.29 | 7.25 | 4.21 | 2.20 | 5.37 | 3.01 | | 2014 | 12.6 | 8.25 | 3.85 | 2.54 | 6.66 | 2.97 | | 2015 | 17.44 | 7.01 | 5.62 | 2.13 | 10.8 | 4.53 | | First Quarter | 13.51 | 10.75 | 4.28 | 3.33 | 6.97 | 4.73 | | Second Quarter | 17.44 | 12.32 | 5.62 | 3.70 | 10.8 | 6.25 | | Third Quarter | 12.46 | 7.20 | 3.92 | 2.26 | 9.21 | 4.53 | | Fourth Quarter | 9.32 | 7.01 | 2.94 | 2.13 | 5.77 | 4.67 | | 2016 | 11.78 | 6.87 | 3.74 | 2.16 | 5.05 | 3.49 | | First Quarter | 9.50 | 6.87 | 3.05 | 2.16 | 5.00 | 3.49 | | Second Quarter | 8.93 | 7.28 | 2.81 | 2.25 | 4.89 | 3.66 | | Third Quarter | 9.48 | 8.01 | 3.00 | 2.35 | 4.19 | 3.71 |
| | NYSE | Hong Kong Stock Exchange | Shanghai Stock Exchange | | Calendar Period | High | Low | High | Low | High | Low | | | (US$ per ADS) | (HK$ per H Share) | (RMB per A Share) | | Fourth Quarter | 11.78 | 9.16 | 3.74 | 2.82 | 5.05 | 3.75 | | 2017 | 23.54 | 10.23 | 7.55 | 3.14 | 8.32 | 4.04 | | First Quarter | 13.85 | 10.23 | 4.45 | 3.14 | 5.42 | 4.22 | | Second Quarter | 13.29 | 11.01 | 4.18 | 3.43 | 5.21 | 4.04 | | Third Quarter | 23.46 | 12.95 | 7.55 | 3.98 | 8.32 | 4.49 | | Fourth Quarter | 23.54 | 15.05 | 7.38 | 4.70 | - | - | | September | 23.46 | 18.39 | 7.55 | 5.70 | 8.32 | 7.36 | | October | 23.54 | 19.18 | 7.38 | 5.89 | - | - | | November | 19.71 | 16.16 | 6.34 | 4.85 | - | - | | December | 18.65 | 15.05 | 5.78 | 4.70 | - | - | | 2018 | | | | | | | | First Quarter | 19.41 | 13.04 | 6.27 | 4.01 | 7.28 | 4.65 | | January | 19.41 | 16.79 | 6.27 | 5.19 | - | - | | February | 17.04 | 14.08 | 5.47 | 4.46 | 7.28 | 5.90 | | March | 15.17 | 13.04 | 4.81 | 4.01 | 5.64 | 4.65 | | April (through April 13, 2018) | 16.00 | 13.51 | 5.08 | 4.18 | 4.88 | 4.42 |
In connection with the proposed Asset Restructuring, the trading of A Shares of the Company on the Shanghai Stock Exchange was suspended from September 12, 2017 to February 25, 2018. For more information regarding the Asset Restructuring, see “Item 4. Information on the Company - A. History and Development of the Company - Subscription of Equity Interest of Certain Subsidiaries and Subsequent Issuance of Additional A Shares.” Item 10. Additional Information
A. | Share CapitalItem 10. | Additional Information |
A. Share Capital Not applicable. B. | Memorandum and Articles of Association |
B. Memorandum and Articles of Association The following is a summary of certain provisions of our Articles of Association, as amended. Such summary does not purport to be complete. For further information, you and your advisors should refer to the text of our Articles of Association, as amended, and to the texts of applicable laws and regulations. A copy of our Articles of Association is filed as an exhibit to this annual report. Our objects and purposes Our Articles of Association as amended from time to time are filed with the Hong Kong Companies Registrar. Our business purpose and business scope can be found in Article 13 and Article 14, respectively, of our Articles of Association. Directors’ power to vote on matters in which he or she has an interest Under Article 174, a director shall not vote in any resolution of the board of directors for approving any contract, transaction or arrangement in which such director or any of his associates (as defined in the applicable rules governing the listing of securities amended from time to time) is materially interested, and shall not be counted into the quorum of the meeting either. Unless the interested director has disclosed his or her interest to the board of directors in accordance with the Article 174 and the contract, transaction or arrangement has been approved by the board of directors at a meeting in which the interested director is not counted in the quorum and has refrained from voting, a contract, transaction or arrangement in which such director is materially interested is voidable at the instance of our Company except as against a bona fide party thereto acting without notice of the breach of duty by such director. Borrowing powers Subject to compliance with applicable laws and regulations of the PRC, we have the power to raise and borrow money which power includes (without limitation) the issuance of debentures and the charging or mortgaging of part or whole of our business or properties and other rights permitted. The Articles of Association do not contain any specific provision in respect of the manner in which borrowing powers may be exercised by the directors nor do they contain any specific provision in respect of the manner in which such powers may be varied, other than (a) provisions which give the directors the power to formulate proposals for the issuance of debentures by us; (b) Article 87(2), which provides that the issuance of bonds must be approved by the shareholders in a general meeting by way of a special resolution; and (c) Article 112(4), which provides that the directors have the power to formulate our annual final financial budgets and final accounts which shall be passed by over half of the directors.
Age limit for retirement There is no provision pertaining to the retirement of directors pursuant to an age limit requirement in our Articles of Association. Directors’ qualifying shares Under Article 107, the directors are not required to hold any qualifying shares. Dividend rights Article 55(1) provides that holders of our ordinary shares have the right to receive dividends and distribution of profits in other forms, in proportion to the number of shares held. Under Article 49, when we convene a general shareholders’ meeting, allocate dividends, liquidate or perform other activities that require the verification of equity rights, the Board or the general meeting convener must specify a date as the record date. The shareholders registered in the shareholder register after closing as at the record date are the Company’s shareholders entitled to appropriate rights and interests. Voting rights Article 55(2) provides that holders of our ordinary shares have the right to lawfully request, convene, chair, attend in person or appoint a proxy to attend and vote at general meetings of shareholders in respect of the number of shares held. Rights to share profits Article 61(7) provides that a plan for profit distribution and a plan for making up for losses formulated by the Board in accordance with Article 112(6) must be approved by way of the shareholders’ general meeting. Rights to share surplus in the event of liquidation Article 55(6) provides that the holders of ordinary shares have the right to participate in the distribution of our surplus assets in proportion to the number of shares held in the event of the termination or liquidation of us. Redemption provisions; sinking fund provisions and liability to further capital calls Article 30 provides that we may repurchase issued shares in accordance with the procedures provided in the Articles of Association and with the approvals from the relevant governing authorities of PRC under the following circumstances: (1) cancellation of shares for the purpose of reducing our capital; (2) merger with another company which owns our shares; (3) granting bonus shares to our employees; (4) shareholders disagreeing with our general meeting’s resolution on merger or division and requiring us to acquire the shares in their possession; and (5) other circumstances permitted by law and administrative regulations. No securities issued by us are redeemable, entitled to a sinking fund or subject to liability for further capital calls. Actions necessary to change the rights of holders of our shares or holders of a class of shares Under Article 87(5), revision of any rights of class shareholders, e.g., rights to dividends, share profits or surplus in the event of liquidation or voting rights, requires a special resolution of the shareholders’ general meeting. Under Article 80, a special resolution must be passed by votes representing more than two-thirds of the voting rights represented by the shareholders (including proxies) present at the meeting.
The rights attached to any class of shares may be varied or abrogated only with the sanction of a special resolution passed at the shareholders’ general meeting and by holders of shares of the affected class passed at a separate general meeting of the class convened in accordance with Articles 98 to Article 102 respectively. The circumstances which are deemed to be a variation or abrogation of the class rights are set forth under Article 96. Except for the circumstances under Article 97 (1), (9) and (10), shareholders of the affected class, whether or not otherwise having the right to vote at shareholders’ general meetings, have the right to vote at class meetings but Interested Shareholders (as defined under Article 98) are not entitled to vote at class meetings. Resolutions of a class meeting shall be passed by two-thirds or more of the shares with voting rights held by the class shareholders who, according to Article 98, are entitled to vote at that class meeting. Written notice must be given to all shareholders who are registered as holders of that class in the register of shareholders 45 days (inclusive of date of meeting) before the date of the class meeting. Such notice must contain the matters to be considered at such meeting, the date and the place of meeting. Those shareholders of the class who intend to attend shall send the written reply to us 20 days before the class meeting according to Article. The proceedings of class meetings shall be conducted as near as possible to those of shareholders’ general meetings. The provisions in the Articles of Association relating to the proceedings of shareholders’ general meetings shall apply to class meetings. The special procedures for approval by a class of shareholders do not apply where we issue, upon approval by special resolution of shareholders in general meeting, either separately or concurrently once every 12 months, not more than 20% of each of our existing issued Domestic-Invested Shares and Overseas-Listed Foreign-Invested Shares (as defined under Article 18). Provisions discriminating against any existing or prospective shareholder as a result of owning a substantial number of shares Chinalco, as our controlling shareholder, shall not exercise its voting rights in a manner prejudicial to the interest of all or some part of the shareholders when making decisions: to relieve a director or supervisor of his duty to act honestly in our best interest;
to approve the expropriation by a director or supervisor (for his own benefit or for the benefit of another) of our assets, in any manner, including but not limited to an opportunity beneficial to us; or
to approve the expropriation by a director or supervisor (for his own benefit or for the benefit of another) the individual rights of other shareholders, including but not limited to rights to distributions and voting rights save and except for our restructuring, submitted for approval by the shareholders in general meeting in accordance with the Articles of Association.
| ● | to relieve a director or supervisor of his duty to act honestly in our best interest; |
| ● | to approve the expropriation by a director or supervisor (for his own benefit or for the benefit of another) of our assets, in any manner, including but not limited to an opportunity beneficial to us; or |
| ● | to approve the expropriation by a director or supervisor (for his own benefit or for the benefit of another) the individual rights of other shareholders, including but not limited to rights to distributions and voting rights save and except for our restructuring, submitted for approval by the shareholders in general meeting in accordance with the Articles of Association. |
Conditions governing the manner in which annual general meetings and extraordinary general meetings of shareholders are convoked Shareholders’ general meetings can be held as annual general meetings or extraordinary general meetings. Annual general meetings are held once a year within six months after the end of the preceding fiscal year. The Board is required to convene an extraordinary general meeting within two months of the occurrence of any of the following circumstances: | (1) | the number of directors falls below the number required by the PRC Company Law or two-thirds of the number required by the Articles of Association; |
| (2) | our unrecovered losses amount to one-third of the total amount of its paid-in-capital; |
| (3) | upon the request of shareholder(s) holding 10ten percent or more of our shares for more than ninety consecutive days (the number of shares held shall be the figures as of the date of the written request from the shareholder); and |
| (4) | whenever the Board deems necessary or the supervisory committee proposes to convene the same. |
We shall, within 45 days (inclusive of date of meeting) before the date of meeting, send written notices of the shareholders’ general meeting and inform all registered shareholders of the matters to be considered at the meeting and the date and venue of the meeting. Those shareholders who intend to attend the meeting shall send the written reply to the Company 20 days before the meeting. Motions put forward at the general meeting shall be specific and shall relate to the matters to be considered at a shareholders’ general meeting. Motions raised at a general meeting shall: | (1) | be free of conflicts with the provision of laws, administrative regulations and Articles of Association, and fall within our business scope and the terms of the reference of the shareholders’ general meeting; |
| (2) | have definite topics to discuss and specific matters to resolve; and |
| (3) | be submitted in writing or served to the board of directors. |
Limitations on the rights to own securities Under Article 19, the shares issued to domestic investors and denominated in Renminbi are Domestic-Invested Shares whereas the shares issued to overseas investors and denominated in foreign currency are Foreign-Invested Shares. Under Article 18, our Domestic-Invested Shares can be held only by PRC shareholders and our Foreign-Invested Shares, such as H Shares and ADSs, can be held only by foreign shareholders and other shareholders from regions of Hong Kong, Macau and Taiwan. Provisions having an effect of delaying, deferring or preventing a change in control Under Article 116, decisions in respect of market development, merger and acquisition, and investment in a new field, where the consideration to be paid or the assets to be acquired exceed 10% of our total assets, the Board is required to engage relevant professional consultants to provide professional opinions, which shall serve as the key reference for the decision of the Board concerning such investment, merger or acquisition. Under Article 87(3), division, merger, dissolution and liquidation of us and material acquisitions and disposals by us must be approved by a special resolution at a shareholders’ general meeting. There are no provisions under the Articles of Association pertaining to the ownership threshold above which shareholder ownership must be disclosed. Conditions governing changes in registered capital Under Article 112(7), any proposal for the increase or decrease of our registered capital must be formulated by the BoardBoard. Article 87(1) further provides that any increase or reduction in share capital requires adoption of a special resolution at a shareholders’ general meeting.
For the two years immediately preceding the date of this annual report, we have not entered into any additional material contracts other than in the ordinary course of business and other than those described in “Item 4. Information on the Company - A. History and Development of the Company” and “Item 7. Major Shareholders and Related Party Transactions - B. Related Party Transactions.” The existing foreign exchange regulations have significantly reduced government foreign exchange controls for transactions under the current account, including trade and service-related foreign exchange transactions and payment of dividends. We may undertake current account foreign exchange transactions without prior approval from the SAFE by producing commercial documents evidencing such transactions, provided that they are processed through Chinese banks licensed to engage in foreign exchange transactions. The PRC government has stated publicly that it intends to make the Renminbi freely convertible in the future. However, we cannot predict whether the PRC government will continue its existing foreign exchange policy and when the PRC government will allow free conversion of Renminbi to foreign currency. Foreign exchange transactions under the capital account, including principal payments in respect of foreign currency-denominated obligations, continue to be subject to significant foreign exchange controls and require the approval of the SAFE. These limitations could affect our ability to obtain foreign exchange through debt or equity financing, or to obtain foreign exchange for capital expenditures. Since 1994, the conversion of Renminbi into HK and U.S. dollars has been based on rates set by the People’s Bank of China (the “PBOC”),PBOC, which are set daily based on the previous day’s PRC interbank foreign exchange market rate and current exchange rates on the world financial markets. From 1994 to July 20, 2005, the official exchange rate for the conversion of Renminbi to U.S. dollars was generally stable. On July 21, 2005, the PRC government introduced a managed floating exchange rate system to allow the value of the Renminbi to fluctuate within a regulated band based on market supply and demand and by reference to a basket of currencies. Since then, the PRC government has made, and may in the future make, further adjustments to the exchange rate system. In April 2012, the PRC government took a milestone step in turning the Renminbi into a global currency by doubling the size of its trading band against the U.S. dollar, pushing through a crucial reform that further liberalizes its financial markets. The PBOC allows the Renminbi to rise or fall 1% from a mid-point every day, effective April 16, 2012, compared with its previous 0.5% limit. The PBOC further allows the Renminbi to rise or fall 2% from a mid-point every day, effective March 17, 2014. The PBOC announces the closing price of a foreign currency traded against the Renminbi in the inter-bank foreign exchange market after the closing of the market on each working day, and makes it the central parity for trading against the Renminbi on the following working day. Fluctuations in exchange rates may adversely affect the value, translated or converted into U.S. dollars or HK dollars, of our net assets, earnings and any declared dividends. We cannot give any assurance that any future movements in the exchange rate of the Renminbi against the U.S. dollar and other foreign currencies will not adversely affect our results of operations and financial condition. PRC Taxation The following summary of the material PRC and United States federal income tax provisions relating to the ownership and disposition of H Shares or ADSs held by the investor as capital assets is based upon laws and relevant interpretations thereof in effect as of the date of this annual report, all of which are subject to change, and does not constitute legal or tax advice. This summary does not deal with all possible tax consequences relating to an investment in our ordinary shares, such as the tax consequences under state, local and other tax laws. Dividends Paid to Individual Investors For a foreign
Any shares registered in the name of our depositary bank will be deemed as being held by non-resident enterprise shareholders and the dividends attributable to the corresponding ADSs will be subject to the withholding of the PRC corporate income tax. We are therefore required to withhold 10% corporate income tax when we make dividend distributions to the investors of our ADSs. Investors of our ADSs will not be subject to further PRC individual whoincome tax or PRC corporate income tax. The 10% dividend withholding tax rate is not a resident of China, the receipt of dividends from a foreign-invested company in China is normally not subject to individual income tax, unless otherwise stipulated by tax law or regulations. In 2011, SAT issuedany reduction under the “Circular on1984 Agreement between the Issues ConcerningUnited States and the Collection and AdministrationPeople’s Republic of Individual Income Tax Following the Repeal of Circular 45 (No. 348),” under which dividends paid by a non-foreign-invested and PRC incorporated company listed in Hong Kong will generally be subject to a withholding tax of 20% and will be adjusted pursuant to the arrangementChina for the avoidanceAvoidance of double taxation signed betweenDouble Taxation, or the PRC and the country where theTreaty.
Capital Gains With respect to foreign individual is a resident. Dividends Paid to Non-PRC Enterprises
According to the Enterprise Income Tax Law and its implementation rules, which became effective on January 1, 2008, dividends derived from the revenues accumulated from January 1, 2008 and are paid by Chinese companies to non-resident enterprises which are established under the laws of non-PRC jurisdictions and have no establishment or residence in China or whose dividendscapital gains from China do not relate to their establishment or residence in China (“non-resident foreign enterprises”), according to the Enterprise Income Tax Law and its implementation rules, which became effective on January 1, 2008, capital gains realized by non-resident foreign enterprises are ordinarily subject to a Chinese withholdingcapital gains tax levied at a flatthe rate of 10%, unless exempted or reduced pursuant to an applicable double-taxation treaty. Dividends paidtreaty or other exemptions. The capital gains realized by PRC companies to resident enterprises, including enterprises established under the laws of non-PRC jurisdictions but whose “de facto management body” is located in the PRC, upon the sales of overseas-listed shares are not subject to anythe PRC enterprise income tax.
With respect to foreign individual investors, the Provisions for Implementation of Individual Income Tax Law of China, as amended, stipulated that individual income tax unlesson gains realized on the dividendssale of equity shares shall be regulated in separate rules to be drafted by the State Council of China. However, as of the date of this annual report, there are no such rules enacted by the State Council yet. On March 30, 1998, the MOF and the SAT jointly issued the “Circular of Taxation Regarding the Continued Exemption of Individual Income Taxes Levied on Income Obtained from the Transfer of Shares,” which provided that income derived from the publicly tradedtransfer of shares issued by listed companies shall not be taxed as income for the purposes of levying individual income taxes after July 1, 1997. For PRC mainland investors, on October 31, 2014, the SAT issued “Circular on Tax Policies Relating to the Pilot Program of Shanghai-Hong Kong Stock Connect,” which have been held continuouslyprovided that any capital gain from transferring stocks listed on the Hong Kong Stock Exchange by a PRC mainland investor would not be subject to tax during the residentperiod from November 17, 2014 to November 16, 2017. For mainland enterprises, for less than twelve months. However,such capital gains would be included in its income and subject to income tax. On November 1, 2017, the withholdingMOF, the SAT and the CSRC jointly issued “Circular on Extending Individual Income Tax Policies Relating to the Shanghai-Hong Kong Stock Connect,” which provided that income generated from price differences through investment in stocks listed on the Hong Kong Stock Exchange by PRC mainland individual investors via the Shanghai-Hong Kong Stock Connect would be exempt from individual income tax rate could be reduced under an applicable double-taxation treaty.from November 17, 2017 to December 4, 2019. Tax Treaties China currently has such treaties with more than one hundred countries and regions, including the following countries: the United States;
Australia;
Canada;
France;
Germany;
Japan;
Malaysia;
Singapore;
the United Kingdom; and
the Netherlands.
Under most treaties, the rate of withholding tax imposed by China’s taxation authorities remains 10%. The double taxation treaty between China and the United States provides that 10% withholding tax rate will be applied to the gross amount of dividends repatriated to an eligible U.S. holder. Under the treaty, an eligible U.S. holder is a person who, by reason of domicile, residence, place of head office, place of incorporation or any other criterion of similar nature is subject to taxation in the United States, as applicable under the treaty’s “treaty shopping provisions.” Capital Gains
According to the Enterprise Income Tax Law and its implementation rules, which became effective on January 1, 2008, capital gains realized by foreign enterprises, which are established under the laws of non-PRC jurisdictions and have no establishment or residence in China or whose capital gains from China do not relate to their establishment or residence in China, are ordinarily subject to capital gains tax at the rate of 10%. The capital gains realized by resident enterprises, including enterprises established under the laws of non-PRC jurisdictions but whose “de facto management body” is located in the PRC, upon the sales of overseas-listed shares are subject to the PRC enterprise income tax.
With respect to individual holders of H Shares, the Provisions for Implementation of Individual Income Tax Law of China, as amended, stipulated that income tax on gains realized on the sale of equity shares shall be regulated in separate rules to be drafted by the MOF. On March 30, 1998, the MOF and the SAT jointly issued the “Circular of Taxation Regarding the Continued Exemption of Individual Income Taxes Levied on Income Obtained from the Transfer of Shares,” which provided that income derived from the transfer of shares issued by listed companies shall not be taxed as income for the purposes of levying individual income taxes after July 1, 1997.
On October 31, 2014, the SAT issued “Circular on Tax Policies Relating to the Pilot Program of Shanghai-Hong Kong Stock Connect,” which provided that any capital gain from transferring stocks listed on the Hong Kong Stock Exchange by a PRC mainland investor would not be subject to tax during the period from November 17, 2014 to November 16, 2017. For mainland enterprises, such capital gains would be included in its income and subject to income tax.
On November 1, 2017, MOF, SAT and CSRC jointly issued “Circular on Extending Individual Income Tax Policies Relating to the Shanghai-Hong Kong Stock Connect,” which provided that income generated from price differences through investment in stocks listed on the Hong Kong Stock Exchange by PRC mainland individual investors via the Shanghai-Hong Kong Stock Connect would be exempt from individual income tax from November 17, 2017 to December 4, 2019.
Additional China Tax Considerations Pursuant to the prevailing stamp duty regulations, a stamp duty is not imposed by China on the transfer of shares, such as the H Shares or ADSs, of Chinese publicly traded companies that take place outside of China. United States Federal Income Taxation Each potential investor is strongly urged to consult its own tax advisor to determine the particular U.S. federal, state, local, treaty and foreign tax consequences of acquiring, owning or disposing of the H Shares or ADSs. The following summary describes the principal U.S. federal income tax consequences of purchasing, owning and disposing of the H Shares or ADSs. This summary only applies to U.S. holders, as defined below, who hold the H Shares or ADSs as capital assets within the meaning of Section 1221 of the Internal Revenue Code of 1986 as amended (the “Code”). This discussion does not address all of the tax consequences relating to the purchase, ownership and disposition of the H Shares or ADSs, and does not take into account U.S. holders that may be subject to special rules, including: | ● | tax-exempt organizations; |
| ● | real estate investment trusts, regulated investment companies, grantor trusts; |
| ● | persons that have a functional currency other than the U.S. dollar; |
| ● | persons that will own H Shares or ADSs through partnerships or other pass-through entities; |
| ● | persons that actually or constructively own 10% or more of the combined voting power of our voting stock or of the total value of our stock; |
| ● | dealers or traders in securities or currencies; |
| ● | certain former citizens or long-term residents of the United States; |
| ● | persons that will hold the H Shares or ADSs as a position in a “straddle” or as part of a “hedging” or “conversion” or other risk reduction transaction for U.S. federal income tax purposes; |
financial institutions;
insurance companies;
tax-exempt organizations;
real estate investment trusts, regulated investment companies, grantor trusts;
persons that have a functional currency other than the U.S. dollar;
persons that will own H Shares or ADSs through partnerships or other pass-through entities;
persons that actually or constructively own 10% or moreof the combined voting power of our voting stock or of the total value of our stock;
dealers or traders in securities or currencies;
certain former citizens or long-term residents of the United States;
persons that will hold the H Shares or ADSs as a position in a “straddle” or as part of a “hedging” or “conversion” or other risk reduction transaction for U.S. federal income tax purposes;
persons who receive the H Shares or ADSs as compensation for services;
“dual resident” corporations;
persons that generally mark their securities to market for U.S. federal income tax purposes;
persons who are residents of the People’s Republic of China or who are subject to Hong Kong profits tax; or
persons who purchase or sell the H shares or ADSs as part of a wash sale for U.S. federal tax purposes.
| ● | persons who receive the H Shares or ADSs as compensation for services; |
| ● | “dual resident” corporations; |
| ● | persons that generally mark their securities to market for U.S. federal income tax purposes; |
| ● | persons who are residents of the People’s Republic of China or who are subject to Hong Kong profits tax; or |
| ● | persons who purchase or sell the H Shares or ADSs as part of a wash sale for U.S. federal tax purposes. |
Moreover, this description does not address U.S. federal estate, gift or alternative minimum taxes, the U.S. federal unearned income Medicare contribution tax, or any foreign state or local tax consequences of the acquisition, ownership and disposition of the H Shares or ADSs. Each U.S. holder should consult its tax advisor with respect to the U.S. federal, state, local and foreign tax consequences of acquiring, owning and disposing of H Shares or ADSs. This discussion is based on the Code, its legislative history, final, temporary and proposed U.S. Treasury regulations promulgated thereunder, published rulings and court decisions as in effect on the date hereof, as well as on the agreement between the United States and the People’s Republic of China for the avoidance of double taxation (the “Treaty”), all of which are subject to change, or change in interpretation, possibly with retroactive effect. In addition, this discussion is based in part upon representations of the depositary and the assumption that each obligation in the deposit agreement and any related agreements will be performed according to its terms. You are a “U.S. holder” if you are a beneficial owner of H Shares or ADSs and, for U.S. federal income tax purposes, are: an individual citizen or resident of the United States;
a corporation created or organized under the laws of the United States or any political subdivision thereof;
an estate the income of which is subject to U.S. federal income tax without regard to its source; or
a trust: (i) subject to the primary supervision of a U.S. court and one or more U.S. persons (within the meaning of the Code) have the authority to control all substantial decisions of the trust; or (ii) that has validly elected to be treated as a U.S. person under applicable U.S. Treasury Regulations.
| ● | an individual citizen or resident of the United States; |
| ● | a corporation created or organized under the laws of the United States or any political subdivision thereof; |
| ● | an estate the income of which is subject to U.S. federal income tax without regard to its source; or |
| ● | a trust: (i) subject to the primary supervision of a U.S. court and one or more U.S. persons (within the meaning of the Code) have the authority to control all substantial decisions of the trust; or (ii) that has validly elected to be treated as a U.S. person under applicable U.S. Treasury Regulations. |
If a partnership (including any entity treated as a partnership for U.S. federal tax purposes) holds H Shares or ADSs, the tax treatment of the partnership and a partner in such partnership will generally depend upon the status of the partner and the activities of the partnership. If an investor is a partner in a partnership that holds H Shares or ADSs, such investor should consult its tax advisor. In general, if you hold ADRsADSs evidencing H Shares, you will be treated as the owner of the H Shares represented by the ADSs. Exchanges of H Shares for ADRs,ADSs, and ADRsADSs for H Shares, generally will not be subject to United States federal income tax. The tax treatment of your H Shares or ADSs will depend in part on whether or not we are classified as a passive foreign investment company, or PFIC, for United States federal income tax purposes. Except as discussed below under “—Passive Foreign Investment Company”, this discussion assumes that we are not classified as a PFIC for U.S. federal income tax purposes. INVESTORS SHOULD CONSULT THEIR TAX ADVISORS AS TO THE PARTICULAR TAX CONSIDERATIONS APPLICABLE TO THEM RELATING TO THE PURCHASE, OWNERSHIP AND DISPOSITION OF THE H SHARES OR ADSs, INCLUDING THE APPLICABILITY OF U.S. FEDERAL, STATE AND LOCAL TAX LAWS OR NON-U.S. TAX LAWS, ANY CHANGES IN APPLICABLE TAX LAWS AND ANY PENDING OR PROPOSED LEGISLATION OR REGULATIONS.
Distributions on the H Shares or ADSs Subject to the discussions below under “- Passive Foreign Investment Company,” the
The gross amount of any distribution (without reduction for any PRC tax withheld) we make on the H Shares or ADSs, other than certain pro-rata distributions of the H Shares, will be includible in income as dividend income when you, in the case of the H Shares, or the depositary, in the case of ADSs, receive the distribution, is actually or constructively received by you.constructively. Because we do not calculate earnings and profits in accordance with U.S. tax principles, all distributions by us to U.S. holders will generally be treated as dividends. Any dividend will not be eligible for the dividends-received deduction allowed to certain U.S. corporations in respect of dividends received from U.S. corporations. If you are a noncorporate U.S. holder, dividends that constitute qualified dividend income will be taxable to you at the preferential rates applicable to long-term capital gains provided that you hold the H sharesShares or ADSs for more than 60 days during the 121-day period beginning 60 days before the ex-dividend date and meet other holding period requirements. Dividends we pay with respect to the H shares or ADSs generally will be qualified dividend income. Dividends that we pay with respect to the H Shares will be qualified dividend income if we are eligible for the benefits of the Treaty. We believe that we are currently eligible for the benefits of the Treaty, and we therefore believe that dividends that we currently distribute on the H Shares constitute qualified dividend income. However, there can be no assurance that we will be eligible for the benefits of the Treaty in future taxable years, and there can therefore be no assurance that dividends that we distribute on the H Shares will continue to constitute qualified dividend income in such years. The amount of the dividend distribution that you must include in your income as a U.S. holder will be the U.S. dollar value of the HK dollar payments made, determined at the spot HK dollar/U.S. dollar rate on the date the dividend distribution is includible in your income, regardless of whether the payment is in fact converted into U.S. dollars. Generally, any gain or loss resulting from currency exchange fluctuations during the period from the date you include the dividend payment in income to the date you convert the payment into U.S. dollars will be treated as ordinary income or loss and will not be eligible for the special tax rate applicable to qualified dividend income.Dividendsincome. Dividends paid by us generally will constitute income from sources outside the United States for U.S. foreign tax credit limitation purposes and will generally be categorized as “passive income” for U.S. foreign tax credit purposes. We may be required to withhold PRC income tax on dividends paid to U.S. holders on the H Shares or ADSs. Subject to various limitations, any PRC tax withheld from distributions in accordance with the Treaty will be deductible or creditable against your U.S. federal income tax liability. You may not be able to claim a foreign tax credit (and instead may qualify to claim a deduction) for non-U.S. taxes imposed on dividends paid on the H Shares or ADSs if you (i) have held the H Shares or ADSs for less than a specified minimum period, or (ii) are obligated to make related payments with respect to positions in substantially similar or related property (for example, pursuant to a short sale). The rules relating to the U.S. foreign tax credit are complex and U.S. holders may be subject to various limitations on the amount of foreign tax credits that are available. In addition, in the case of a noncorporate U.S. holder, rules similar to the special rules that apply in determining the foreign tax credit limitation when the taxpayer has foreign source capital gains that are taxed in the US at the lower capital gains rate apply in determining the noncorporate US holder’s foreign tax credit limitation arising from dividends that are taxed at the capital gains rate. Sale, Exchange or Other Disposition Subject to the discussions below under “- Passive Foreign Investment Company,” upon
Upon a sale, exchange or other disposition of the H Shares, or ADSs, you will generally recognize capital gain or loss for U.S. federal income tax purposes in an amount equal to the difference between the U.S. dollar value of the amount realized and your tax basis, determined in U.S. dollars, in such H Shares or ADSs.Shares. Generally, gain or loss recognized upon the sale or other disposition of H Shares or ADSs will be capital gain or loss, will be long-term capital gain or loss if the U.S. holder’s holding period for such H Shares or ADSs exceeds one year, and will be income or loss from sources within the United States for foreign tax credit limitation purposes. Long-term capital gains of a noncorporate U.S. holders isare generally taxed at preferential rates. The deductibility of capital losses is subject to significant limitations.
With respect to the sale or exchange of H Shares, or ADSs, the amount realized upon a sale of H Shares generally will be the U.S. dollar value on the settlement date for the sale in the case of a cash basis U.S. holder (or an accrual basis U.S. Holder that so elects). If H Shares or ADSs are traded on an “established securities market,” a cash basis taxpayer or, if it so elects, an accrual basis taxpayer, will determine the U.S. dollar value of the amount realized by translating the amount received at the spot rate of exchange on the settlement date of the sale. A U.S. holder will have a tax basis in the foreign currency received equal to the U.S. dollar amount realized. Any currency exchange gain or loss realized on a subsequent conversion of the foreign currency into U.S. dollars for a different amount generally will be treated as ordinary income or loss from sources within the United States. However, if such foreign currency is converted into U.S. dollars on the date received by the U.S. holder, a cash basis or electing accrual basis U.S. holder should not recognize any gain or loss on such conversion. The rules relating to the U.S. foreign tax credit are complex. U.S. holders should consult their own tax advisors regarding the effect of these rules in their particular circumstances.
Any gain or loss that you recognize upon a sale of the H Shares or ADSs will generally be U.S. source gain or loss for foreign tax credit limitation purposes and, as a result of the U.S. foreign tax credit limitation, foreign taxes, if any, imposed upon capital gains in respect of H Shares or ADSs may not be currently creditable. Under the Treaty, however, if any PRC tax were to be imposed on any gain from the disposition of H Shares or ADSs, the gain could be treated as PRC source income. U.S. holders are urged to consult their tax advisors regarding the tax consequences if a foreign withholding tax is imposed on a disposition of H Shares or ADSs, including the availability of the foreign tax credit under their particular circumstances. Any Hong Kong stamp duty paid will not be a creditable tax for United States federal income tax purposes, although the proceeds that you are treated as receiving upon a sale of the H Shares will be reduced by the amount of the stamp duty. Passive Foreign Investment Company A non-U.S. corporation is a PFIC for any taxable year in which, after applying relevant look-through rules with respect to the income and assets of subsidiaries: 75% or more of its gross income consists of passive income, such as dividends, interest, rents, royalties, and gains from the sale of assets that give rise to such income; or
50% or more of the average quarterly value of its gross assets consists of assets that produce, or are held for the production of, passive income.
| ● | 75% or more of its gross income consists of passive income, such as dividends, interest, rents, royalties, and gains from the sale of assets that give rise to such income; or |
| ● | 50% or more of the average quarterly value of its gross assets consists of assets that produce, or are held for the production of, passive income. |
Passive income does not include certain rents and royalties derived from the active conduct of a trade or business. If the stock of a non-U.S. corporation is publicly traded for the taxable year, the asset test is applied using the fair market value of the assets for purposes of measuring such corporation’s assets. If we own at least 25% (by value) of the stock of another corporation, we will be treated, for purposes of the PFIC tests, as owning our proportionate share of the other corporation’s assets and receiving our proportionate share of the other corporation’s income for purposes of the PFIC income and asset tests. Based on the composition of our assets and income and the current expectations regarding the price of the H Shares and ADSs, we believe that we were not a PFIC for U.S. federal income tax purposes with respect to our 20172018 taxable year and we do not intend or anticipate becoming a PFIC for any future taxable year.in the foreseeable future. However, the determination of PFIC status is a factual determination that must be made annually at the close of each taxable year and, therefore, there can be no certainty as to our status in this regard until the close of the current or any future taxable year. Changes in the nature of our income or assets or a decrease in the trading price of our shares may cause us to be considered a PFIC in the current or any subsequent year. If we were a PFIC in any year during a U.S. holder’s holding period for the H Shares or ADSs, we would ordinarily continue to be treated as a PFIC for each subsequent year during which the U.S. holder owned the H Shares or ADSs. If we were a PFIC in any taxable year that you held the H Shares or ADSs, you generally would be subject to special rules with respect to “excess distributions” made by us on the H Shares or ADSs and with respect to gain from your disposition of the H Shares or ADSs. An “excess distribution” generally is defined as the excess of the distributions you receive with respect to the H Shares or ADSs in any taxable year, other than the taxable year in which your holding period in the H Shares or ADSs begins, over 125% of the average annual distributions you have received from us during the shorter of the three preceding years, or your holding period for the H Shares or ADSs.ADSs that preceded the taxable year in which you receive the distribution. Generally, you would be required to allocate any excess distribution or gain from the disposition of the H Shares or ADSs ratably over your holding period for the H Shares or ADSs. The portion of the excess distribution or gain allocated to a prior taxable year, other than a year prior to the first year in which we became a PFIC, would be taxed at the highest U.S. federal income tax rate in effect for such taxable year, and you would be subject to an interest charge on the resulting tax liability, determined as if the tax liability had been due with respect to such particular taxable years. The portion of the excess distribution or gain that is not allocated to prior taxable years, together with the portion allocated to the years prior to the first year in which we became a PFIC, would be included in your gross income for the taxable year of the excess distribution or disposition and taxed as ordinary income.
These adverse tax consequences may be mitigated if the U.S. holder is eligible to and does elect to annually mark-to-market the H Shares or ADSs. If a U.S. holder makes a mark-to-market election, such holder will generally include as ordinary income the excess, if any, of the fair market value of the H Shares or ADSs at the end of each taxable year over its adjusted basis, and will be permitted an ordinary loss in respect of the excess, if any, of the adjusted basis of the H Shares or ADSs over their fair market value at the end of the taxable year (but only to the extent of the net amount of income previously included in income as a result of the mark-to-market election). Any gain recognized on the sale or other disposition of the H Shares or ADSs will be treated as ordinary income. The mark-to-market election is available only for “marketable stock,” which is stock that is traded in other thande minimis quantities on at least 15 days during each calendar quarter on a qualified exchange or other market, as defined in the applicable Treasury regulations. The H Shares or ADSs may qualify as “marketable stock” because the ADSs are listed on the New York Stock Exchange. A U.S. holder’s adjusted tax basis in the H Shares or ADSs will be increased by the amount of any income inclusion and decreased by the amount of any deductions under the mark-to-market rules. If a U.S. holder makes a mark-to-market election it will be effective for the taxable year for which the election is made and all subsequent taxable years unless the H Shares or ADSs are no longer regularly traded on a qualified exchange or the IRS consents to the revocation of the election. U.S. holders are urged to consult their tax advisors about the availability of the mark-to-market election, and whether making the election would be advisable in their particular circumstances. However, the stock of any of our subsidiaries that were PFICs would not be eligible for the mark-to-market election. Alternatively, a timely election to treat us as a qualified electing fund could be made to avoid the foregoing rules with respect to excess distributions and dispositions. You should be aware, however, that if we become a PFIC, we do not intend to satisfy the recordkeeping requirements that would permit you to make a qualified electing fund election. If we were regarded as a PFIC, a U.S. holder of H Shares or ADSs may be required to file an information return on IRS Form 8621. U.S. holders should consult their tax advisors concerning the U.S. federal income tax consequences of holding the H Shares or ADSs if we were considered to be a PFIC. Information with Respect to Foreign Financial Assets Owners of “specified foreign financial assets” with an aggregate value in excess of $50,000 (and in some circumstances, a higher threshold) may be required to file an information report with respect to such assets with their tax returns. “Specified foreign financial assets” may include financial accounts maintained by foreign financial institutions, as well as the following, but only if they are held for investment and not held in accounts maintained by financial institutions: (i) stocks and securities issued by non-United States persons, (ii) financial instruments and contracts that have non-United States issuers or counterparties, and (iii) interests in foreign entities. Holders are urged to consult their tax advisors regarding the application of this reporting requirement to their ownership of the H sharesShares or ADSs.
Backup Withholding and Information Reporting If you are a noncorporate U.S. holder, information reporting requirements, on IRS Form 1099, generally will apply to dividend payments or other taxable distributions made to you within the United States, and the payment of proceeds to you from the sale of the H sharesShares or ADSs effected at a United States office of a broker. Additionally, backup withholding may apply to such payments if you fail to comply with applicable certification requirements or (in the case of dividend payments) are notified by the IRS that you have failed to report all interest and dividends required to be shown on your federal income tax returns. Payment of the proceeds from the sale of the H sharesShares or ADSs effected at a foreign office of a broker generally will not be subject to information reporting or backup withholding. However, a sale effected at a foreign office of a broker could be subject to information reporting in the same manner as a sale within the United States (and in certain cases may be subject to backup withholding as well) if (i) the broker has certain connections to the United States, (ii) the proceeds or confirmation are sent to the United States or (iii) the sale has certain other specified connections with the United States. You generally may obtain a refund of any amounts withheld under the backup withholding rules that exceed your income tax liability by filing a refund claim with the IRS. Hong Kong Taxation The following discussion summarizes the material Hong Kong tax provisions relating to the ownership of H Shares or ADSs held by you. Dividends Under current Hong Kong Inland Revenue Department practice, no Hong Kong tax is payable by the recipient in respect of dividends paid by us, either by withholding or otherwise, unless such dividends are attributable to a trade, profession or business carried on in Hong Kong. Taxation of Capital Gains Hong Kong profits tax is currently charged at a flat rate of 16.5% for corporations and 15% for unincorporated businesses and individuals, except that the respective half-rates of 8.25% and 7.5% apply for the first HK$2 million of assessable profits for years of assessment beginning on or after April 1, 2018. No Hong Kong tax is imposed on capital gains arising from the sale of property (such as H Shares) acquired and held as a capital investment. However, if a person carries on a business in Hong Kong that includes trading and dealing in securities, and derives trading gains from such activities or from other Hong Kong sources, Hong Kong profits tax will be payable. Gains from sales of H Shares effected on the Hong Kong Stock Exchange are considered to be from a Hong Kong source for this purpose. The source of gains from off-exchange transactions is less clear and, generally, will depend on whether the purchase and sale contracts were negotiated and, in substance, concluded in Hong Kong. In addition, exemption from profits tax is available for certain classes of taxpayers, notably non-Hong Kong residents who do not otherwise carry on business in Hong Kong (such as offshore funds), subject to compliance with various other requirements. The Hong Kong tax position with respect to gains from the disposal of ADSs is similar. However, no Hong Kong tax will apply on trading gains arising from the sale of ADSs where the purchase and sale were effected on the NYSE. Hong Kong Stamp Duty Hong Kong stamp duty is payable by each seller and purchaser for every sold note and every bought note created for every sale and purchase of “Hong Kong stock” (which means stock the transfer of which is required to be registered in Hong Kong), including the H Shares. Stamp duty is charged at the total rate of 0.2% of the value of the H Shares transferred (the buyer and seller each paying half of such stamp duty). In addition, a fixed duty of HK$5 is currently payable on an instrument of transfer of H Shares. If one of the parties to a sale is a non-resident of Hong Kong and does not pay the required stamp duty, the unpaid stamp duty will be assessed on the instrument of transfer (if any), and the transferee will be liable for the full payment of such amount.
If the withdrawal of H Shares when ADSs are surrendered or the issuance of ADSs when H Shares are deposited results in a change of beneficial ownership in the H Shares under Hong Kong law, Hong Kong stamp duty at the rate described above for sale and purchase transactions will apply. The issuance of ADSs for deposited H Shares issued directly to the depositary or for the account of the depositary should not lead to a Hong Kong stamp duty liability. Holders of the ADSs are not liable for the Hong Kong stamp duty on transfers of ADSs outside of Hong Kong so long as the transfers do not result in a change of beneficial interest in the H Shares under Hong Kong law. Estate Duty The Revenue (Abolition of Estate Duty) Ordinance 2005 came into effect on February 11, 2006 in Hong Kong. No Hong Kong estate duty is payable and no estate duty clearance papers are needed for an application for a grant of representation in respect of holders of H Shares or ADSs whose death occurs on or after February 11, 2006. F. | F. | Dividends and Paying Agents |
Not applicable. Not applicable. We are subject to the periodic reporting and other informational requirements of the Exchange Act. Under the Exchange Act, we are required to file reports and other information with the SEC. Specifically, we are required to file an annual report under Form 20-F no later than four months after the close of each of our fiscal years, which is December 31, for fiscal years ended after December 15, 2011. Copies of reports and other information, when so filed, may be inspected without charge and may be obtained at prescribed rates at the SEC’s public reference room located at 100 F Street, NE, Washington, D.C. 20549. The public may obtain information regarding the Washington, D.C. Public Reference Room by calling the SEC at 1-800-SEC-0330. The SEC also maintains a website atwww.sec.gov that contains reports and other information regarding registrants that make electronic filings with the SEC using its EDGAR filing system. As a foreign private issuer, we are exempt from the rules under the Exchange Act prescribing the furnishing and content of quarterly reports and proxy statements, and officers, directors and principal shareholders of ours are exempt from the reporting and short-swing profit recovery provisions contained in Section 16 of the Exchange Act. Not applicable. | I.Item 11. | Subsidiary Information Quantitative and Qualitative Disclosures about Market Risk |
Not applicable.
Item 11. Quantitative and Qualitative Disclosures about Market Risk
We are exposed to various types of market risks, including credit risk relating to financial assets and changes in foreign exchange rates, interest rates and the prices of alumina and primary aluminum, in the normal course of business. We borrow short-term, medium-term and long-term funds, including variable rate debts, principally denominated in Renminbi. We hedge a limited amount of our sales through the trade of futures contracts on the SHFE and LME. Our hedging activities are subject to policies approved by our senior management. Substantially all of the financial instruments we hold are for purposes other than trading.
The following discussion, which contains “forward-looking statements” that involve risks and uncertainties, summarize our market-sensitive financial instruments. Such discussions address markets risk only and do not present other risks, which we face in the normal course of business. Credit Risk Credit risk arises from balances with banks and financial institutions, short-term investments, trade and notes receivables, other current and non-current receivables as well as credit exposures of customers, including outstanding receivables and committed transactions. We also provide financial guarantees to certain subsidiaries and a joint venture and a third party entity.venture. The carrying amounts of these receivables and amounts of financial guarantees represent our maximum exposure to credit risk in relation to our financial assets and guarantees. We maintain a significant majoritysubstantially all of our bank balances and cash and short-term investments in several major state-owned banks in the PRC. TheOur directors are of the opinion that these assets are not exposed to significant credit risk. With regard to receivables, the marketing department assesses the credit quality of the customers and related parties, taking into account their financial positions, past experience and other factors. We perform periodic credit evaluations of our customers and believe that adequate provisions for impairment of receivables have been made in the financial statements. Management does not expect any further losses from non-performance by these counterparties. For the year ended December 31, 2017,2018, revenues of approximately RMB39,759RMB32,852 million are derived from entities directly or indirectly owned or controlled by the PRC government including Chinalco. There were no other individual customers from whom we have derived revenue of more than 10% of our revenue during the year ended December 31, 2015, 2016, 2017 and 2017.2018. Thus, theour directors are of the opinion that we were not exposed to any significant concentration of credit risk as atof December 31, 2015, 2016, 2017 and 2017.2018. Foreign Exchange Rate Risk We conduct our business primarily in Renminbi, which is our functional and reporting currency. We convert a portion of our Renminbi revenues into other currencies to meet foreign currency obligations and to pay for imported equipment and materials. Many foreign currency exchange transactions involving Renminbi, including foreign exchange transactions under our capital account, are subject to foreign exchange controls and require the approval of the SAFE. Actions taken by the PRC government could cause future exchange rates to vary significantly from current or historical exchange rates. On July 21, 2005, the People’s Bank of ChinaPBOC announced a reform of its exchange rate system. Under the reform, the RMBRenminbi is no longer effectively linked to the U.S. dollar but instead is allowed to fluctuate within a narrow and managed band against a basket of foreign currencies, according to market demand and supply conditions. In April 2012, the PRC government took a milestone step in turning the Renminbi into a global currency by doubling the size of its trading band against the U.S. dollar, pushing through a crucial reform that further liberalizes its financial markets. The People’s Bank of ChinaPBOC allows the Renminbi to rise or fall 1% from a mid-point every day, effective on April 16, 2012, compared with its previous 0.5% limit. The People’s Bank of ChinaPBOC allows the Renminbi to rise or fall 2% from a mid-point every day, effective on March 17, 2014, compared with its previous 1% limit. Any appreciation of the Renminbi will increase the prices of our export sales denominated in foreign currencies and reduce the Renminbi equivalent value of our trade and notes receivable denominated in foreign currencies, which may adversely affect our financial condition and results of operations. Our financial condition and operating performance may also be affected by changes in the value of currencies other than Renminbi in which our earnings and obligations are denominated.
Our bank balances and cash on hand as of December 31, 20172018 amounted to RMB29,903.2RMB21,295.9 million, including Renminbi balances and foreign currency deposits of U.S. dollar, HK dollar, Euro, and Australian dollar and Indonesian rupiah, which translated into RMB3,045.2RMB3,256.6 million, RMB7.0RMB8.3 million, RMB56RMB371 thousand, RMB2.6 million and RMB2.7RMB2.0 million, respectively. Most of our sales are domestic and as such we have a limited amount of foreign currency denominated tradereceivables and notes receivable.payables. As of December 31, 2017,2018, we had foreign currency denominated loans with principal amount of RMB21RMB19 million in Japanese Yen and RMB1,860RMB1,259 million in U.S. dollars. In addition, as of December 31, 2017,2018, our trade and notes receivables, other receivables and trade and notes payables denominated in U.S. dollars amounted to RMB1,094 million.RMB1,403 million, RMB48 million and RMB213 million, respectively; our other payables and accrued liabilities denominated in U.S. dollars and HK dollars amounted to RMB240 million and RMB0.27 million, respectively. As of December 31, 2017,2018, if RMBRenminbi had strengthened/weakenedweakened/strengthened by 5% against USDU.S. dollars with all other variables held constant, the profittotal comprehensive income for the year would have been approximately RMB21RMB10 million lower/higher,higher/lower, mainly as a result of foreign exchange gains and losses arising from the translation of USD-denominatedU.S.-dollar-denominated borrowings, cash and receivables. Profit was lessmore sensitive to the fluctuation in the RMB/USDU.S. dollars exchange rates in 20172018 than in 2016 and 2015,2017, mainly due to the decreaseincrease in the USD denominatedU.S.-dollar-denominated cash and receivables. As the assets and liabilities denominated in other foreign currencies other than USDU.S. dollars were relatively smallminimal to theour total assets and liabilities, of the Group, theour directors of the Company are of the opinion that the Group waswe were not exposed to any significant foreign currency risk arising from these foreign currency denominated assets and liabilities as atof December 31, 20162017 and 2017.2018. Interest Rate Risk As of December 31, 2017,2018, as our Groupwe had no significant interest-bearing assets except for bank deposits and entrusted loans, receivables arising from disposal of subsidiaries, business and assets and a prepayment paid to a supplier, our Group’s income and operating cash flows are substantially independent of changes in market interest rates. Most of the bank deposits are maintained in savings and time deposit accounts in the PRC. The interest rates are regulated by the People’s Bank of ChinaPBOC and theour Group Treasurytreasury closely monitors the fluctuation on such rates periodically. The interest rates of entrusted loans and a deposit paid to a supplier are fixed, the interest rate of the receivables from disposal of businesses to Chinalco is at the rate of one-year bank loan determined by the People’s Bank of China at the payment date and the interest rate of the receivables from disposal of an entity to a subsidiary of Chinalco is LIBOR plus 0.9%.fixed. As the interest rates applied to the deposits and receivables from disposal of subsidiaries, business and assets were relatively low and the interest rates applied to the entrusted loans and a prepayment paid to a supplier were fixed, our directors are of the opinion that our Groupwe was not exposed to any significant interest rate risk for itsour financial assets held as of December 31, 20162017 and 2017.2018. The interest rate risk for our Group’s financial liabilities primarily arises from interest-bearing loans. Loans borrowed at floating interest rates expose us to cash flow interest rate risk. We enter into debt obligations to support general corporate purposes including capital expenditures and working capital needs. Our Group treasury closely monitors market interest rates and maintains a balance between variable rate and fixed rate borrowings in order to reduce the exposures to the interest rate risk described above. As atof December 31, 2017,2018, if interest rates had been 100 basis points higher/lower for bank and other loans borrowed at floating interest rates with all other variables held constant, net profit for the year would have been RMB535RMB641 million lower/higher, respectively, mainly as a result of the higher/lower interest expense on floating rate borrowings. Our interest rate risk for our financial liabilities also arises from medium-term notes and short-term bonds issued at fixed rates. As the fluctuation of comparable interest rates of corporate bonds with similar terms was relatively low, our directors are of the opinion that we are not exposed to any significant fair value interest rate risk for its fixed interest rate borrowings held as of December 31, 2017 and 2018. Commodity Price Risk We are exposed to fluctuations in the prices of alumina, primary aluminum and other products. We import a small portion of our alumina supply from suppliers outside China. Such purchases are made at market prices. In addition, all our sales of alumina, primary aluminum and other products are made at market prices. Therefore, fluctuations in the prices of alumina and primary aluminum have a significant effect on our operating performances.
We use mainly futures contracts and option contracts traded on the Shanghai Futures ExchangeSHFE and London Metal Exchangethe LME to hedge against fluctuations in primary aluminum prices. We use the futures contract for hedging other than speculation. As atof December 31, 2017,2018, the fair values of the outstanding futures contracts amounting to RMB10RMB16 million and RMB89RMB2 million were recognized in financial assets and financial liabilities at fair value through profit or loss, respectively. As atof December 31, 2017,2018, we did not hold any option contracts. The fair value of futures contracts are based on quoted market prices.
As of December 31, 20162017 and 2017, our position in2018, if the commodity futures contracts was as follows:prices had increased/decreased by 3% and all other variables were held constant, the profit for the respective year would have changed by the amounts shown below: | | 2016 | 2017 | | Primary aluminum | Decrease/increase RMB7 million | Decrease/increase RMB46 million | | Copper | Decrease/increase RMB4 million | Increase/decrease RMB0.3 million | | Zinc | Decrease/increase RMB1 million | Decrease/increase RMB7 million | | Lead | Increase/decrease RMB0.1 million | - | | Coal | Decrease/increase RMB1 million | Decrease/increase RMB0.2 million |
| | 2017 | 2018 | | Primary aluminum | Decrease/increase RMB46 million | Decrease/increase RMB14 million | | Copper | Increase/decrease RMB0.3 million | Increase/decrease RMB0.9 million | | Zinc | Decrease/increase RMB7 million | Decrease/increase RMB1.0 million | | Coal | Decrease/increase RMB0.2 million | Decrease/increase RMB2.7 million |
Liquidity risk We monitor rolling forecasts of our liquidity requirements to ensure we have sufficient cash to meet operational needs while maintaining sufficient headroom on our undrawn committed borrowing facilities at all times so that we do not breach borrowing limits or covenants (where applicable) on any of our borrowing facilities. Such forecast takes into consideration our debt financing plans, covenant compliance, compliance with internal balance sheet ratio targets and, if applicable, external regulatory or legal requirements. Our management also monitors rolling forecasts of our liquidity reserve on the basis of expected cash flows. As of December 31, 2017,2018, we had total banking facilities of approximately RMB152,080RMB183,129 million, of which RMB69,414RMB61,611 million had been utilized, and unutilized banking facilities amounted to RMB82,666RMB121,518 million as of December 31, 2017,2018, among which, banking facilities of approximately RMB56,104RMB92,582 million will be subject to renewal during the next 12 months from January 1, 2018.2019. Our directors are confident that allsuch banking facilities could be renewed upon their expiration based on our past experience with banks and our good credit standing. In addition, as of December 31, 2017,2018, we had credit facilities through our futures agent at LME amounting to US$2012 million, of which approximately US$21 million has been utilized. The futures agent has the right to adjust the related credit facilities. The following table sets forth the maturity profile of our financial liabilities as of December 31, 2017:2018: | | Within 1 year | 1 to 2 years | 2 to 5 years | Over 5 years | Total | | | (RMB in millions) | | Finance lease payable, including current portion | 2,371,917 | 1,762,618 | 1,890,329 | 73,603 | 6,098,467 | | Long-term bank and other loans, including current portion | 6,890,140 | 5,174,015 | 8,673,794 | 19,745,385 | 40,483,334 | | Medium-term notes and bonds, including current portion | 12,500,000 | 3,215,000 | - | - | 15,715,000 | | Short-term bonds | 3,500,000 | - | - | - | 3,500,000 | | Gold leasing arrangement | 6,818,393 | - | - | - | 6,818,393 | | Short-term bank and other loans | 30,834,442 | - | - | - | 30,834,442 | | Interest payables for borrowings | 5,282,030 | 2,123,149 | 4,106,037 | 1,048,728 | 12,559,944 | | Financial liabilities at fair value through profit or loss | 89,426 | - | - | - | 89,426 | | Financial liabilities included in other payables and accrued liabilities, excluding accrued interest | 10,307,315 | - | - | - | 10,307,315 | | Financial liabilities included in other non-current liabilities | - | 107,785 | 108,896 | 587,668 | 804,349 | | Trade and notes payables | 12,321,970 | - | - | - | 12,321,970 | | Total | 90,915,633 | 12,382,567 | 14,779,056 | 21,455,384 | 139,532,640 |
| | | Within 1 year(1) | | | 1 to 2 years(1) | | | 2 to 5 years(1) | | | Over 5 years(1) | | | Total(1) | | | | | (RMB in millions) | | | Finance lease payable, including current portion | | | 2,518.7 | | | | 1,161.5 | | | | 707.7 | | | | 13.2 | | | | 4,401.1 | | | Long-term bank and other loans, including current portion | | | 3,384.4 | | | | 7,378.0 | | | | 16,593.6 | | | | 18,784.8 | | | | 46,140.7 | | | Medium-term notes and bonds, including current portion | | | 400.0 | | | | — | | | | 9,785.8 | | | | — | | | | 10,185.8 | | | Short-term bonds | | | 500.0 | | | | — | | | | — | | | | — | | | | 500.0 | | | Gold leasing arrangement | | | 1,607.9 | | | | — | | | | — | | | | — | | | | 1,607.9 | | | Short-term bank and other loans | | | 39,296.2 | | | | — | | | | — | | | | — | | | | 39,296.2 | | | Interest payables for borrowings | | | 4,849.0 | | | | 2,602.8 | | | | 4,197.4 | | | | 898.8 | | | | 12,547.9 | | | Financial liabilities at fair value through profit or loss | | | 1.8 | | | | — | | | | — | | | | — | | | | 1.8 | | | Financial liabilities included in other payables and accrued liabilities, excluding accrued interest | | | 8,855.6 | | | | — | | | | — | | | | — | | | | 8,855.6 | | | Financial liabilities included in other non-current liabilities(2) | | | — | | | | 108.9 | | | | 333.4 | | | | 420.3 | | | | 862.5 | | | Trade and notes payables | | | 14,007.6 | | | | — | | | | — | | | | — | | | | 14,007.6 | | | Total | | | 75,421.1 | | | | 11,251.1 | | | | 31,617.9 | | | | 20,117.1 | | | | 138,407.2 | |
Item 12. Description of Securities Other Than Equity Securities
A. | Debt Securities(1) | The amounts disclosed are the contractual undiscounted cash flows. |
| (2) | As of December 31, 2018, the carrying value of financial liabilities included in other non-current liabilities was RMB841 million. |
| Item 12. | Description of Securities Other Than Equity Securities |
Not applicable. Not applicable. Not applicable. D. | D. | American Depositary Shares |
The following table summarizes the fees and charges that a holder of our ADSs may have to pay, directly or indirectly, in connection with the ownership of Chalco’s American Depositary Receipts.ADRs. | Persons depositing or withdrawing shares must pay: | For: | | | $5.00 (or less) per 100 ADSs (or portion of 100 ADSs) $0.02 (or less) per ADS | •● Issuance of ADSs, including issuances resulting from a distribution of shares or rights or other property | | | • | | ● Cancellation of ADSs for the purpose of withdrawal, including if the deposit agreement terminates | | | • | $0.02 (or less) per ADS $5.00 (or less) per 100 ADSs (or portion of 100 ADSs) | ● Any cash distribution to ADS registered holders ● Any distribution other than cash |
A fee equivalent to the fee that would be payable if securities distributed to you had Distribution of securities distributed to holders of deposited securities
| | $0.02 (or less) per ADS per calendar year Registration or transfer fees | •● Depositary services | | | • | | As necessary | ● Transfer and registration of shares on ourthe depositary’s share register to or from the name of the depositary or its agent when you deposit or withdraw shares | Expenses of the depositary | • | | As necessary | ● Cable, telex and facsimile transmissions (when expressly provided in the deposit agreement) |
| Persons depositing or withdrawing shares must pay: | For: | | | • | | ● Converting foreign currency to U.S. dollars | | | | As necessary | ● Taxes and other governmental charges that the depositary or the custodian have to pay on any ADS or share underlying an ADS, for example, stock transfer taxes, stamp duty or withholding taxes | | • | | As necessary | | ● Any charges incurred by the depositary or its agents for servicing the deposited securities | • As necessary |
The Bank of New York Mellon, as depositary, has agreed to reimburse certain expenses related to the administration and maintenance of our ADR program incurred by us in connection with the program. From January 1, 20172018 to December 31, 2017,2018, we received from the depositary reimbursements of US$145,183.98907,015.67 for our continuing annual stock exchange listing fees and our expenses incurred in connection with investor relationship programs. The depositary has also agreed to waive certain standard out-of-pocket administrative, maintenance and shareholder services expenses related to our ADR program. From January 1, 20172018 to December 31, 2017,2018, the total amount of the fees that were waived was US$130,943.24.131,639.30. PART II Item 13.Defaults, Dividend Arrearages and Delinquencies
| Item 13. | Defaults, Dividend Arrearages and Delinquencies |
None.
Item 14.Material Modifications to the Rights of Security Holders and Use of Proceeds
None. Item 15.Controls and Procedures
| Item 14. | Material Modifications to the Rights of Security Holders and Use of Proceeds |
None. | Item 15. | Controls and Procedures |
Our management, with the participation of our principal executive officer and principal financial officer, after evaluating the effectiveness of our disclosure controls and procedures (as defined in Rules 13a-15(e) and 15(d)-15(e) of the Exchange Act) as of the end of the period covered by this annual report, have concluded that, as of such date, our disclosure controls and procedures were effective. Management’s Report on Internal Control over Financial Reporting Our management is responsible for establishing and maintaining adequate internal control over financial reporting as defined in Rules 13a-15(f) and 15d- 15(f) under the Exchange Act. Our internal control over financial reporting is a process designed to provide reasonable assurance regarding the reliability of financial reporting and the preparation of financial statements for external purposes in accordance with generally accepted accounting principles. Our internal control over financial reporting includes those policies and procedures that (1) pertain to the maintenance of records that, in reasonable detail, accurately and fairly reflect the transactions and dispositions of a company’s assets, (2) provide reasonable assurance that transactions are recorded as necessary to permit preparation of consolidated financial statements in accordance with generally accepted accounting principles, and that receipts and expenditures are being made only in accordance with authorizations of our management and directors, and (3) provide reasonable assurance regarding prevention or timely detection of unauthorized acquisition, use, or disposition of our assets that could have a material effect on the consolidated financial statements. Because of its inherent limitations, internal control over financial reporting may not prevent or detect misstatements. Also, projections of any evaluation of effectiveness to future periods are subject to the risk that controls may become inadequate because of changes in conditions, or that the degree of compliance with the policies or procedures may deteriorate.
Under the supervision of and with the participation of the principal executive officer and principal financial officer, our management conducted an evaluation of the effectiveness of our internal control over financial reporting as of December 31, 2017,2018, based on the framework in the Internal Control-Integrated Framework (2013 Framework) issued by the Committee of Sponsoring Organizations of the Treadway Commission in May 2013. Based on our evaluation under the framework in Internal Control-Integrated Framework (2013 Framework) issued by the Committee of Sponsoring Organizations of the Treadway Commission, our management concluded that, as of December 31, 2017,2018, our internal control over financial reporting was effective to provide reasonable assurance regarding the reliability of financial reporting and the preparation of financial statements for external purposes in accordance with the IFRS. The effectiveness of our internal controls over financial reporting as of December 31, 20172018 has been audited by Ernst & Young Hua Ming LLP, an independent registered public accounting firm, as stated in their report which is included herein. Changes in Internal Control over Financial Reporting During 2017,2018, there have been no material changes in our internal control over financial reporting that occurred during the fiscal year covered by this annual report that have materially affected, or are reasonably likely to materially affect, our internal control over financial reporting. Item 16A. Audit Committee Financial Expert Our audit committee members are Ms. Chen Lijie, Mr. Hu Shihai and Mr. Lie-A-Cheong Tai Chong, David. Our Board has determined that Mr. Lie-A-Cheong Tai Chong, David, the chairman of the audit committee, qualifies as an “audit committee financial expert” as defined in Item 16A of Form 20-F and is the financial expert serving on our audit committee. See “Item 6. Directors, Senior Management and Employees.” Item 16B. Code of Ethics We have adopted a code of ethics that applies to our chief executive officer, chief financial officer, other directors, independent non-executive directors, senior management and employees. We have posted our code of ethics on our website:www.chalco.com.cn. http://www.chalco.com.cn/chalcoen/whzr/ddgf/A130516web_1.htm. A hard copy of this code of ethics is available to investors free of charge upon written request to the address on the cover of this annual report on Form 20-F. Item 16C. Principal Accountant Fees and Services Ernst & Young Hua Ming LLP served as our independent auditor for the fiscal yearyears ended December 31, 20162017 and 2017.2018. A description of the fees billed to us by Ernst & Young Hua Ming LLP, Ernst & Young and Ernst & Young (China) Advisory Limited for professional services in each of the last two fiscal years is set forth below: | | Year ended December 31 | | | 2016 | 2017 | | | (RMB in thousands) | | Audit fee(1) | 22,295 | 21,800 | | Audit-related fees(2) | 1,180 | 625 | | Tax service fees | - | - | | Other fees(3) | 250 | 655 |
| | | Year ended December 31 | | | | | 2017 | | | 2018 | | | | | (RMB in thousands) | | | Audit fee(1) | | | 21,800 | | | | 25,329 | | | Audit-related fees(2) | | | 625 | | | | 1,130 | | | Tax fees | | | — | | | | — | | | Other fees(3) | | | 655 | | | | 240 | |
| | | | (1) | “Audit fee” represents the fee obtained from annual audit work charged by Ernst & Young Hua Ming LLP and Ernst & Young for the years ended December 31, 20162017 and 2017.2018. |
| (2) | “Audit-related fees” represent aggregate fees charged by Ernst & Young Hua Ming LLP and Ernst & Young for permissible professional services rendered in connection withcomfort letters about acquisitions, debt issuance of USD senior perpetual securities, auditors’ letters on calculation accuracy of profit forecast in relation to transactions such as disposal of environmental protection assets, investment in Maochang mine and acquisition of equity interests of Chinalco Shanxi Jiaokou Xinghua Technology Co., Ltd. for the year ended December 31, 2016, and comfort letter issued to China Alcoa Wancheng Shandong Construction Co., Ltd. to assess the equity value of itself and comfort letter on profit forecast and the statement of debt in relation to the Asset Restructuring for the yearyears ended December 31, 2017.2017 and 2018. |
| (3) | “Other fees” represent the fees charged by Ernst & Young (China) Advisory Limited for permissible professional services rendered in connection with the environmental, social and governance report and overseas investment consultation for the years ended December 31, 20162017 and 2017. 2018. |
Our audit committee pre-approves all audit, audit-related services and other services performed by Ernst & Young Hua Ming LLP, Ernst & Young and Ernst & Young (China) Advisory Limited, for the years ended December 31, 20162017 and 2017.2018. Item 16D. Exemptions From the Listing Standards for Audit Committees Not applicable. Item 16E. Purchase of Equity Securities by the Issuer and Affiliated Purchasers We do not have an equity securities repurchase program and did not repurchase any of our equity securities during the year ended December 31, 2017.2018. Item 16F. Change in Registrant’s Certifying Accountant Not applicable. Item 16G. Corporate Governance The NYSE has imposed a series of corporate governance standards for companies listed on the NYSE in Section 303A of the NYSE Listed Company Manual. However, the NYSE provides that listed companies that are foreign private issuers, subject to certain limitations and conditions, are permitted to follow “home country” practice in lieu of the provisions of Section 303A of the NYSE Listed Company Manual. As a foreign private issuer listed on the NYSE, we are required to disclose a summary of the significant differences between our corporate governance practice and NYSE corporate governance rules that apply to U.S. domestic issuers. | | NYSE Listed Company Manual Requirements on Corporate Governance | Our Practice | | Majority of independent directors | NYSE requires that the board of a listed company must comprise a majority of independent directors. | Under applicable PRC and Hong Kong laws and regulations, our Board is not required to be formed with a majority of independent directors. The Listing Rules require that every board of directors of a listed company must include at least three independent non-executive directors and at least one third of the board of directors of a listed company are independent non-executive directors. Our Board currently comprises three independent directors and sixfive non-independent directors, which is in compliance with the requirement by the PRC securities regulatory authorities and of the Listing Rules. | | | | | | Nominating/Corporate Governance Committee | NYSE requires U.S. domestic issuers to have only independent directors on their nominating/corporate governance committees. | The Listing Rules require that listed companies should establish a nomination committee which consists of a majority of independent non-executive directors. We have a nomination committee that consists of twoa non-independent directorsdirector and three independent directors, which is in compliance with the requirement of the Listing Rules. | | | | | | Compensation Committee | NYSE requires U.S. domestic issuers to have a compensation committee composed entirely of independent directors. | The Listing Rules contain a code provision that the listed companies should establish a remuneration committee which consists of a majority of independent non-executive directors. We have a remuneration committee that consists of two independent directors, and a non-independent director, which is in compliance with the requirement of the Listing Rules. |
Item 16H. Mine Safety Disclosure As of the date of this annual report, we do not own or operate any mine in the United States. For details of the mining safety control of our bauxite mines in China, see “Item 4. Information on the Company - B. Business Overview - Raw Materials - Alumina - Own Mines.” PART III Item 17. Financial Statements We have elected to provide the financial statements and related information specified in Item 18 in lieu of Item 17. Item 18. Financial Statements The audited Consolidated Financial Statements as required under Item 18 are attached hereto starting on page F-1 of this Form 20-F.
Item 19. Exhibits
Exhibit Number | | Description
| | 101.INS* | | XBRL Instance Document | | | | | 101.SCH* | | XBRL Taxonomy Extension Schema Document | | | | | 101.CAL* | | XBRL Taxonomy Extension Calculation Linkbase Document | | | | | 101.DEF* | | XBRL Taxonomy Extension Definition Linkbase Document | | | | | 101.LAB* | | XBRL Taxonomy Extension Label Linkbase Document | | | | | 101.PRE* | | XBRL Taxonomy Extension Presentation Linkbase Document |
_______________
* Filed with this annual report on Form 20-F SIGNATURES The registrant hereby certifies that it meets all of the requirements for filing on Form 20-F and that it has duly caused and authorized the undersigned to sign this annual report on its behalf. | | | | ALUMINUM CORPORATION OF CHINA LIMITED | | | | | | By: | /s/ YU DehuiLu Dongliang | | | | Name: YU DehuiLu Dongliang | | | | Title: Executive Director and Chairman of the Board | | | | Date: April 19, 201824, 2019 |
ALUMINUM CORPORATION OF CHINA LIMITED AND ITS SUBSIDIARIES Consolidated Financial Statements For the Years Ended December 31, 2015, 2016, 2017 and 20172018 Together with Reports of Independent Public Accounting Firm INDEX TO THE CONSOLIDATED FINANCIAL STATEMENTS ALUMINUM CORPORATION OF CHINA LIMITED AND ITS SUBSIDIARIES | | Pages | | | | | Reports of the Independent Registered Public Accounting Firm | F3-F5F3-F4 | | | | Consolidated Statements of Financial Position as of December 31, 20162017 and 20172018 | F6-F7F5-F6 | | | | Consolidated Statements of Profit or Loss and Other Comprehensive Income for the Years Ended December 31, 2015, 2016, 2017 and 20172018 | F8-F9F7-F8 | | | | Consolidated Statements of Shareholders’Changes in Equity for the Years Ended December 31, 2015, 2016, 2017 and 20172018 | F10-F12F9-F11 | | | | Consolidated Statements of Cash Flows for the Years Ended December 31, 2015, 2016, 2017 and 20172018 | F13-F14F12-F13 | | | | | Notes to the Consolidated Financial Statements | F15-F194F14-F214 |
Report of Independent Registered Public Accounting FirmREPORT OF INDEPENDENT REGISTERED PUBLIC ACCOUNTING FIRM
To the Shareholders and the Board of Directors and Shareholders of Aluminum Corporation of China Limited (Incorporated in the People’s Republic of China with limited liability)
Opinion on the Financial Statements We have audited the accompanying consolidated statements of financial position of Aluminum Corporation of China Limited and its subsidiaries (the "Group"“Group”) as of December 31, 20162017 and 2017,2018, and the related consolidated statements of profit or loss and other comprehensive income, shareholders'changes in equity and cash flows for each of the three years in the period ended December 31, 2017,2018, and the related notes (collectively referred to as the “financial“consolidated financial statements”). In our opinion, the consolidated financial statements present fairly, in all material respects, the financial position of the Group at December 31, 20162017 and 2017,2018, and the results of its operations and its cash flows for each of the three years in the period ended December 31, 2017,2018, in conformity with International Financial Reporting Standards as issued by the International Accounting Standards Board. We also have audited, in accordance with the standards of the Public Company Accounting Oversight Board (United States) (“PCAOB”), the Group'sGroup’s internal control over financial reporting as of December 31, 2017,2018, based on criteria established in Internal Control-Integrated Framework issued by the Committee of Sponsoring Organizations of the Treadway Commission (2013 framework), and our report dated April 19, 201824, 2019 expressed an unqualified opinion thereon. Adoption of New Accounting Standards As discussed in Note 2.2 (b) and Note 2.2 (c) to the consolidated financial statements, the Group has changed its method for accounting for revenue from contracts with customers using a modified retrospective approach, and its method for accounting for the classification, measurement, presentation and disclosure of financial instruments during the year ended December 31, 2018. Change in Accounting Policy As discussed in Note 2.2 (d) to the consolidated financial statements, the Group has elected to change its method of presenting government grants during the year ended December 31, 2018. The Group applied this change in accounting principle retrospectively to all prior periods presented. Basis for Opinion These financial statements are the responsibility of the Group'sGroup’s management. Our responsibility is to express an opinion on the Group'sGroup’s financial statements based on our audits. We are a public accounting firm registered with the PCAOB and are required to be independent with respect to the Group in accordance with the U.S.US federal securities laws and the applicable rules and regulations of the Securities and Exchange Commission and the PCAOB. We conducted our audits in accordance with the standards of the PCAOB and International Standards on Auditing. Those standards require that we plan and perform the audit to obtain reasonable assurance about whether the financial statements are free of material misstatement, whether due to error or fraud. Our audits included performing procedures to assess the risks of material misstatement of the financial statements, whether due to error or fraud, and performing procedures that respond to those risks. Such procedures includedinclude examining, on a test basis, evidence regarding the amounts and disclosures in the financial statements. Our audits also included evaluating the accounting principles used and significant estimates made by management, as well as evaluating the overall presentation of the financial statements. We believe that our audits provide a reasonable basis for our opinion. /s/ Ernst & Young Hua Ming LLP We have served as the Group’s auditor since 2012. Beijing, the People’s Republic of China April 19, 2018 24, 2019
Report of Independent Registered Public Accounting FirmREPORT OF INDEPENDENT REGISTERED PUBLIC ACCOUNTING FIRM
To the Shareholders and the Board of Directors and Shareholders of Aluminum Corporation of China Limited
(Incorporated in the People’s Republic of China with limited liability)
Opinion on Internal Control over Financial Reporting We have audited Aluminum Corporation of China Limited and its subsidiaries’ (the “Group”) internal control over financial reporting as of December 31, 2017,2018, based on criteria established in Internal Control—Integrated Framework issued by the Committee of Sponsoring Organizations of the Treadway Commission (2013 framework), (the “COSO criteria”). In our opinion, the Group maintained, in all material respects, effective internal control over financial reporting as of December 31, 2017,2018, based on the COSO criteria. We also have audited, in accordance with the standards of the Public Company Accounting Oversight Board (United States) (“PCAOB”) and International Standards on Auditing,, the consolidated statements of financial position of the Group as of December 31, 20162017 and 2017,2018, and the related consolidated statements of profit or loss and other comprehensive income, shareholders’changes in equity and cash flows for each of the three years in the period ended December 31, 2017,2018, and the related notes of the Group and our report dated April 19, 201824, 2019 expressed an unqualified opinion thereon. Basis for Opinion The Group’s management is responsible for maintaining effective internal control over financial reporting and for its assessment of the effectiveness of internal control over financial reporting included in the accompanying Management’s Report on Internal Control over Financial Reporting. Our responsibility is to express an opinion on the Group’s internal control over financial reporting based on our audit. We are a public accounting firm registered with the PCAOB and are required to be independent with respect to the Group in accordance with the U.S. federal securities laws and the applicable rules and regulations of the Securities and Exchange Commission and the PCAOB. We conducted our audit in accordance with the standards of the PCAOB. Those standards require that we plan and perform the audit to obtain reasonable assurance about whether effective internal control over financial reporting was maintained in all material respects. Our audit included obtaining an understanding of internal control over financial reporting, assessing the risk that a material weakness exists, testing and evaluating the design and operating effectiveness of internal control based on the assessed risk, and performing such other procedures as we considered necessary in the circumstances. We believe that our audit provides a reasonable basis for our opinion. Definition and Limitations of Internal Control Over Financial Reporting A company’s internal control over financial reporting is a process designed to provide reasonable assurance regarding the reliability of financial reporting and the preparation of financial statements for external purposes in accordance with generally accepted accounting principles. A company’s internal control over financial reporting includes those policies and procedures that (1) pertain to the maintenance of records that, in reasonable detail, accurately and fairly reflect the transactions and dispositions of the assets of the company; (2) provide reasonable assurance that transactions are recorded as necessary to permit preparation of financial statements in accordance with generally accepted accounting principles, and that receipts and expenditures of the company are being made only in accordance with authorizations of management and directors of the company; and (3) provide reasonable assurance regarding prevention or timely detection of unauthorized acquisition, use, or disposition of the company’sGroup’s assets that could have a material effect on the financial statements. Report of Independent Registered Public Accounting Firm(Continued)
Because of its inherent limitations, internal control over financial reporting may not prevent or detect misstatements. Also, projections of any evaluation of effectiveness to future periods are subject to the risk that controls may become inadequate because of changes in conditions, or that the degree of compliance with the policies or procedures may deteriorate. /s/ Ernst & Young Hua Ming LLP Beijing, the People’s Republic of China April 19, 201824, 2019
ALUMINUM CORPORATION OF CHINA LIMITED AND ITS SUBSIDIARIES CONSOLIDATED STATEMENTS OF FINANCIAL POSITION As of December 31, 20162017 and 20172018 (Amounts expressed in thousands of RMB unless otherwise stated)
| | | | | | December 31, 2016 | | | | December 31, 2017 | | | | | Notes | | | RMB’000 | | | | RMB’000 | | | | USD’000 | | | ASSETS | | | | | | | | | | | | | | | | Non-current assets | | | | | | | | | | | | | | | | Intangible assets | | 5 | | | 10,608,791 | | | | 10,653,175 | | | | 1,637,363 | | | Property, plant and equipment | | 6 | | | 90,868,235 | | | | 96,096,715 | | | | 14,769,795 | | | Investment properties | | 7 | | | 1,255,775 | | | | 1,332,370 | | | | 204,782 | | | Land use rights | | 8 | | | 3,346,008 | | | | 3,720,478 | | | | 571,827 | | | Investments in joint ventures | | 9 (a) | | | 6,240,200 | | | | 6,007,624 | | | | 923,355 | | | Investments in associates | | 9 (b) | | | 5,926,533 | | | | 6,935,030 | | | | 1,065,895 | | | Available-for-sale financial investments | | 10 | | | 164,393 | | | | 1,928,201 | | | | 296,359 | | | Deferred tax assets | | 11 | | | 1,426,707 | | | | 1,602,825 | | | | 246,350 | | | Other non-current assets | | 12 | | | 4,188,121 | | | | 3,520,892 | | | | 541,150 | | | | | | | | | | | | | | | | | | | Total non-current assets | | | | | 124,024,763 | | | | 131,797,310 | | | | 20,256,876 | | | | | | | | | | | | | | | | | | | Current assets | | | | | | | | | | | | | | | | Inventories | | 13 | | | 17,933,432 | | | | 20,346,709 | | | | 3,127,232 | | | Trade and notes receivables | | 14 | | | 7,349,563 | | | | 8,026,209 | | | | 1,233,606 | | | Other current assets | | 15 | | | 15,247,745 | | | | 10,063,676 | | | | 1,546,759 | | | Financial assets at fair value through profit or loss | | 36.1, 36.2 | | | 54,756 | | | | 9,534 | | | | 1,465 | | | Restricted cash and time deposits | | 16 | | | 2,087,447 | | | | 2,152,492 | | | | 330,832 | | | Cash and cash equivalents | | 16 | | | 23,813,736 | | | | 27,750,686 | | | | 4,265,202 | | | | | | | | | | | | | | | | | | | Total current assets | | | | | 66,486,679 | | | | 68,349,306 | | | | 10,505,096 | | | | | | | | | | | | | | | | | | | Total assets | | | | | 190,511,442 | | | | 200,146,616 | | | | 30,761,972 | | | | | | | | | | | | | | | | | |
| | | | | December 31, 2017 | | December 31, 2018 | | | | Notes | | RMB’000 | | RMB’000 | | USD’000 | | ASSETS | | | | | | | | | | Non-current assets | | | | | | | | | | | | | | | | | | Intangible assets | | | 5 | | | | 10,637,633 | | | | 12,879,365 | | | | 1,873,226 | | | Property, plant and equipment | | | 6 | | | | 95,627,577 | | | | 106,193,369 | | | | 15,445,185 | | | Investment properties | | | 7 | | | | 1,332,370 | | | | 1,156,006 | | | | 168,134 | | | Land use rights | | | 8 | | | | 3,577,012 | | | | 4,280,291 | | | | 622,543 | | | Investments in joint ventures | | | 9 (a) | | | | 6,007,624 | | | | 3,393,349 | | | | 493,542 | | | Investments in associates | | | 9 (b) | | | | 6,935,030 | | | | 6,363,462 | | | | 925,527 | | | Available-for-sale investments | | | 10 | | | | 1,928,201 | | | | — | | | | — | | | Equity investments designated at fair value through other comprehensive income | | | 10 | | | | — | | | | 1,729,825 | | | | 251,593 | | | Deferred tax assets | | | 11 | | | | 1,606,150 | | | | 1,542,569 | | | | 224,357 | | | Other non-current assets | | | 12 | | | | 3,520,892 | | | | 4,442,644 | | | | 646,156 | | | | | | | | | | | | | | | | | | | | | Total non-current assets | | | | | | | 131,172,489 | | | | 141,980,880 | | | | 20,650,263 | | | | | | | | | | | | | | | | | | | | | Current assets | | | | | | | | | | | | | | | | | | Inventories | | | 13 | | | | 20,547,556 | | | | 20,459,668 | | | | 2,975,735 | | | Trade and notes receivables | | | 14 | | | | 8,008,937 | | | | 8,100,532 | | | | 1,178,174 | | | Other current assets | | | 15 | | | | 10,074,225 | | | | 9,022,953 | | | | 1,312,334 | | | Financial assets at fair value through profit or loss | | | 36.1, 36.2 | | | | 9,534 | | | | 16,141 | | | | 2,348 | | | Restricted cash | | | 16 | | | | 2,168,192 | | | | 2,165,288 | | | | 314,928 | | | Cash and cash equivalents | | | 16 | | | | 27,835,866 | | | | 19,130,652 | | | | 2,782,438 | | | | | | | | | | | | | | | | | | | | | Total current assets | | | | | | | 68,644,310 | | | | 58,895,234 | | | | 8,565,957 | | | | | | | | | | | | | | | | | | | | | Total assets | | | | | | | 199,816,799 | | | | 200,876,114 | | | | 29,216,220 | |
ALUMINUM CORPORATION OF CHINA LIMITED AND ITS SUBSIDIARIES CONSOLIDATED STATEMENTS OF FINANCIAL POSITION(Continued) As of December 31, 20162017 and 20172018 (Amounts expressed in thousands of RMB unless otherwise stated)
| | | | | | December 31, 2016 | | | | December 31, 2017 | | | | | December 31, 2017 | | December 31, 2018 | | | | Notes | | | RMB’000 | | | | RMB’000 | | | | USD’000 | | | Notes | | | RMB’000 | | | | RMB’000 | | | | USD’000 | | | EQUITY AND LIABILITIES | | | | | | | | | | | | | | | | | EQUITY | | | | | | | | | | | | | | | | | | | | | | | | | | | | | | | | | | | EQUITY AND LIABILITIES EQUITY | | | | | | | | | | | | | | | | | | | Equity attributable to owners of the parent | | | | | | | | | | | | | | | | | | | | | | | | | | | | | | | | Share capital | | 17 | | | 14,903,798 | | | | 14,903,798 | | | | 2,290,672 | | | | 17 | | | | 14,903,798 | | | | 14,903,798 | | | | 2,167,668 | | | Other reserves | | 18 | | | 27,901,030 | | | | 27,942,747 | | | | 4,294,722 | | | | 18 | | | | 28,116,602 | | | | 40,327,573 | | | | 5,865,402 | | | Accumulated losses | | 33 | | | (4,636,530 | ) | | | (3,368,095 | ) | | | (517,667 | ) | | | | | | | (3,332,371 | ) | | | (2,816,481 | ) | | | (409,640 | ) | | | | | | | 38,168,298 | | | | 39,478,450 | | | | 6,067,727 | | | | | | | | 39,688,029 | | | | 52,414,890 | | | | 7,623,430 | | | | | | | | | | | | | | | | | | | | | | | | | | | | | | | | | | | Non-controlling interests | | | | | 17,618,510 | | | | 26,035,429 | | | | 4,001,572 | | | | | | | | 26,054,567 | | | | 15,254,312 | | | | 2,218,648 | | | | | | | | | | | | | | | | | | | | | | | | | | | | | | | | | | | Total equity | | | | | 55,786,808 | | | | 65,513,879 | | | | 10,069,299 | | | | | | | | 65,742,596 | | | | 67,669,202 | | | | 9,842,078 | | | | | | | | | | | | | | | | | | | | | | | | | | | | | | | | | | | LIABILITIES | | | | | | | | | | | | | | | | | | | | | | | | | | | | | | | | Non-current liabilities | | | | | | | | | | | | | | | | | | | | | | | | | | | | | | | | Interest-bearing loans and borrowings | | 19 | | | 47,322,748 | | | | 40,289,703 | | | | 6,192,414 | | | | 19 | | | | 40,289,703 | | | | 54,207,386 | | | | 7,884,137 | | | Other non-current liabilities | | 21 | | | 3,237,741 | | | | 3,372,390 | | | | 518,327 | | | | 21 | | | | 2,453,660 | | | | 2,438,164 | | | | 354,616 | | | Deferred tax liabilities | | 11 | | | 984,304 | | | | 993,742 | | | | 152,735 | | | | 11 | | | | 993,742 | | | | 1,812,805 | | | | 263,662 | | | | | | | | | | | | | | | | | | | | | | | | | | | | | | | | | | | Total non-current liabilities | | | | | 51,544,793 | | | | 44,655,835 | | | | 6,863,476 | | | | | | | | 43,737,105 | | | | 58,458,355 | | | | 8,502,415 | | | | | | | | | | | | | | | | | | | | | | | | | | | | | | | | | | | Current liabilities | | | | | | | | | | | | | | | | | | | | | | | | | | | | | | | | Trade and notes payables | | 23 | | | 11,342,870 | | | | 12,321,970 | | | | 1,893,852 | | | | 23 | | | | 12,360,441 | | | | 14,007,600 | | | | 2,037,321 | | | Other payables and accrued liabilities | | 22 | | | 13,017,319 | | | | 14,602,731 | | | | 2,244,399 | | | | 22 | | | | 14,692,899 | | | | 11,532,504 | | | | 1,677,333 | | | Contract liabilities | | | | | | | | — | | | | 1,579,322 | | | | 229,703 | | | Financial liabilities at fair value through profit or loss | | 36.1, 36.2 | | | 3,575 | | | | 89,426 | | | | 13,745 | | | | 36.1, 36.2 | | | | 89,426 | | | | 1,766 | | | | 257 | | | Income tax payable | | | | | 356,683 | | | | 210,205 | | | | 32,308 | | | | | | | | 213,262 | | | | 113,783 | | | | 16,549 | | | Interest-bearing loans and borrowings | | 19 | | | 58,459,394 | | | | 62,752,570 | | | | 9,644,893 | | | | 19 | | | | 62,981,070 | | | | 47,513,582 | | | | 6,910,564 | | | | | | | | | | | | | | | | | | | | | | | | | | | | | | | | | | | Total current liabilities | | | | | 83,179,841 | | | | 89,976,902 | | | | 13,829,197 | | | | | | | | 90,337,098 | | | | 74,748,557 | | | | 10,871,727 | | | | | | | | | | | | | | | | | | | | | | | | | | | | | | | | | | | Total liabilities | | | | | 134,724,634 | | | | 134,632,737 | | | | 20,692,673 | | | | | | | | 134,074,203 | | | | 133,206,912 | | | | 19,374,142 | | | | | | | | | | | | | | | | | | | | | | | | | | | | | | | | | | | Total equity and liabilities | | | | | 190,511,442 | | | | 200,146,616 | | | | 30,761,972 | | | | | | | | 199,816,799 | | | | 200,876,114 | | | | 29,216,220 | | | | | | | | | | | | | | | | | | | | | | | | | | | | | | | | | | | Net current liabilities | | | | | 16,693,162 | | | | 21,627,596 | | | | 3,324,101 | | | | | | | | 21,692,788 | | | | 15,853,323 | | | | 2,305,770 | | | | | | | | | | | | | | | | | | | | | | | | | | | | | | | | | | | Total assets less current liabilities | | | | | 107,331,601 | | | | 110,169,714 | | | | 16,932,775 | | | | | | | | 109,479,701 | | | | 126,127,557 | | | | 18,344,493 | |
The accompanying notes are an integral part of these financial statements. | Lu Dongliang | | | Yu Dehui | | Zhang ZhankuiWang Jun | | Director | | Chief Financial Officer |
ALUMINUM CORPORATION OF CHINA LIMITED AND ITS SUBSIDIARIES CONSOLIDATED STATEMENTS OF PROFIT OR LOSS AND OTHER COMPREHENSIVE INCOME For the years ended December 31, 2015, 2016 and 2017
(Amounts expressed in thousands of RMB unless otherwise stated)
| | | | | | | 2015 | | | | 2016 | | | | 2017 | | | | | Note | | | | RMB’000 | | | | RMB’000 | | | | RMB’000 | | | | USD’000 | | | Continuing Operations | | | | | | | | | | | | | | | | | | | | | Revenue | | 4 | | | | 123,667,667 | | | | 144,228,916 | | | | 180,080,750 | | | | 27,677,904 | | | Cost of sales | | | | | | (121,172,307 | ) | | | (133,674,345 | ) | | | (165,675,021 | ) | | | (25,463,784 | ) | | | | | | | | | | | | | | | | | | | | | | | Gross profit | | | | | | 2,495,360 | | | | 10,554,571 | | | | 14,405,729 | | | | 2,214,120 | | | | | | | | | | | | | | | | | | | | | | | | Selling and distribution expenses | | | | | | (1,787,815 | ) | | | (2,069,430 | ) | | | (2,342,484 | ) | | | (360,033 | ) | | General and administrative expenses | | | | | | (2,358,789 | ) | | | (3,360,710 | ) | | | (4,568,246 | ) | | | (702,127 | ) | | Research and development expenses | | | | | | (168,870 | ) | | | (168,862 | ) | | | (494,590 | ) | | | (76,017 | ) | | Impairment loss on property, plant and equipment | | 6 | | | | (10,011 | ) | | | (57,080 | ) | | | (15,632 | ) | | | (2,403 | ) | | Other income | | 26 | | | | 1,787,774 | | | | 745,269 | | | | 342,171 | | | | 52,591 | | | Other gains, net | | 27 | | | | 5,023,553 | | | | 166,383 | | | | 319,996 | | | | 49,182 | | | Finance income | | 28 | | | | 812,459 | | | | 815,729 | | | | 706,299 | | | | 108,556 | | | Finance costs | | 28 | | | | (5,979,489 | ) | | | (5,019,908 | ) | | | (5,189,929 | ) | | | (797,677 | ) | | Share of profits and losses of: | | | | | | | | | | | | | | | | | | | | | Joint ventures | | 9 (a) | | | | 23,238 | | | | (95,508 | ) | | | 8,151 | | | | 1,253 | | Associates | | 9 (b) | | | | 284,531 | | | | 115,091 | | | | (165,249 | ) | | | (25,398 | ) | | | | | | | | | | | | | | | | | | | | | | | Profit before income tax | | 25 | | | | 121,941 | | | | 1,625,545 | | | | 3,006,216 | | | | 462,047 | | | | | | | | | | | | | | | | | | | | | | | | Income tax benefit/(expense) | | 31 | | | | 225,961 | | | | (404,172 | ) | | | (642,267 | ) | | | (98,715 | ) | | | | | | | | | | | | | | | | | | | | | | | Profit for the year | | | | | | 347,902 | | | | 1,221,373 | | | | 2,363,949 | | | | 363,332 | | | | | | | | | | | | | | | | | | | | | | |
ALUMINUM CORPORATION OF CHINA LIMITED AND ITS SUBSIDIARIES
CONSOLIDATED STATEMENTS OF COMPREHENSIVE INCOME(Continued)
For the years ended December 31, 2015, 2016, 2017 and 20172018 (Amounts expressed in thousands of RMB unless otherwise stated) | | | | | | | | 2015 | | | | 2016 | | | | 2017 | | | | | | Note | | | | RMB’000 | | | | RMB’000 | | | | RMB’000 | | | | USD’000 | | | Profit attributable to: | | | | | | | | | | | | | | | | | | | | | | Owners of the parent | | | | | | | 129,511 | | | | 368,412 | | | | 1,378,435 | | | | 211,862 | | | Non-controlling interests | | | | | | | 218,391 | | | | 852,961 | | | | 985,514 | | | | 151,470 | | | | | | | | | | | | | | | | | | | | | | | | | | | | | | | | 347,902 | | | | 1,221,373 | | | | 2,363,949 | | | | 363,332 | | | | | | | | | | | | | | | | | | | | | | | | | Other comprehensive income, net of tax: | | | | | | | | | | | | | | | | | | | | | | Other comprehensive income to be reclassified to profit or loss in subsequent periods: | | | | | | | | | | | | | | | | | | | | | | Available-for-sale investments: | | | | | | | | | | | | | | | | | | | | | | Changes in fair value | | | | | | | 57,940 | | | | 104,103 | | | | (5,206 | ) | | | (800 | ) | | Reclassification adjustments for gains included in profit or loss | | | | | | | | | | | | | | | | | | | | | | -Gain on disposal | | | | | | | — | | | | (102,854 | ) | | | (45,039 | ) | | | (6,922 | ) | | Income tax effect | | | | | | | — | | | | (13,288 | ) | | | 11,180 | | | | 1,718 | | | Share of /(transfer out) other comprehensive income of an associate | | | | | | | 4,658 | | | | (4,658 | ) | | | — | | | | — | | | Exchange differences on translation of foreign operations | | | | | | | 499,837 | | | | 657,531 | | | | (634,793 | ) | | | (97,566 | ) | | | | | | | | | | | | | | | | | | | | | | | | Net other comprehensive income/(loss) to be reclassified to profit or loss in subsequent periods | | | | | | | 562,435 | | | | 640,834 | | | | (673,858 | ) | | | (103,570 | ) | | | | | | | | | | | | | | | | | | | | | | | | Total other comprehensive income/(loss), net of tax | | | | | | | 562,435 | | | | 640,834 | | | | (673,858 | ) | | | (103,570 | ) | | | | | | | | | | | | | | | | | | | | | | | | Total comprehensive income for the year | | | | | | | 910,337 | | | | 1,862,207 | | | | 1,690,091 | | | | 259,762 | | | | | | | | | | | | | | | | | | | | | | | | | Total comprehensive income for the year attributable to: | | | | | | | | | | | | | | | | | | | | | | Owners of the parent | | | | | | | 691,946 | | | | 1,009,246 | | | | 704,577 | | | | 108,292 | | | Non-controlling interests | | | | | | | 218,391 | | | | 852,961 | | | | 985,514 | | | | 151,470 | | | | | | | | | | | | | | | | | | | | | | | | | | | | | | | | 910,337 | | | | 1,862,207 | | | | 1,690,091 | | | | 259,762 | | | | | | | | | | | | | | | | | | | | | | | | Basic and diluted earnings per share attributable to ordinary equity holders of the parent (expressed in RMB per share) | | | 33 | | | | 0.01 | | | | 0.02 | | | | 0.09 | | | | 0.0138 | |
| | | | | | 2016 | | | 2017 | | | 2018 | | | | | Note | | | RMB’000 | | | RMB’000 | | | RMB’000 | | | USD’000 | | | Continuing Operations | | | | | | | | | | | | | | | | | | | | | | Revenue | | | 4 | | | | 144,854,582 | | | | 181,020,428 | | | | 180,240,154 | | | | 26,214,843 | | | Cost of sales | | | | | | | (133,700,192 | ) | | | (166,290,235 | ) | | | (167,029,416 | ) | | | (24,293,421 | ) | | | | | | | | | | | | | | | | | | | | | | | | Gross profit | | | | | | | 11,154,390 | | | | 14,730,193 | | | | 13,210,738 | | | | 1,921,422 | | | | | | | | | | | | | | | | | | | | | | | | | Selling and distribution expenses | | | | | | | (2,111,787 | ) | | | (2,372,966 | ) | | | (2,496,933 | ) | | | (363,164 | ) | | General and administrative expenses | | | | | | | (3,336,095 | ) | | | (4,549,206 | ) | | | (3,958,067 | ) | | | (575,677 | ) | | Research and development expenses | | | | | | | (168,862 | ) | | | (498,234 | ) | | | (626,873 | ) | | | (91,175 | ) | | Impairment loss on property, plant and equipment | | | 6 | | | | (57,080 | ) | | | (16,200 | ) | | | (7,450 | ) | | | (1,084 | ) | | Impairment losses on financial assets | | | | | | | — | | | | — | | | | (107,841 | ) | | | (15,685 | ) | | Impairment losses on investments in joint ventures | | | | | | | — | | | | — | | | | (216,953 | ) | | | (31,555 | ) | | Other income | | | 26 | | | | 155,576 | | | | 89,873 | | | | 135,367 | | | | 19,688 | | | Other gains, net | | | 27 | | | | 169,143 | | | | 319,382 | | | | 921,904 | | | | 134,085 | | | Finance income | | | 28 | | | | 815,729 | | | | 706,690 | | | | 492,232 | | | | 71,592 | | | Finance costs | | | 28 | | | | (5,019,908 | ) | | | (5,203,424 | ) | | | (4,882,496 | ) | | | (710,130 | ) | | Share of profits and losses of: | | | | | | | | | | | | | | | | | | | | | Joint ventures | | | 9 (a) | | | | (95,508 | ) | | | 8,151 | | | | (199,452 | ) | | | (29,009 | ) | | Associates | | | 9 (b) | | | | 115,091 | | | | (165,249 | ) | | | 39,335 | | | | 5,721 | | | | | | | | | | | | | | | | | | | | | | | | | Profit before income tax | | | 25 | | | | 1,620,689 | | | | 3,049,010 | | | | 2,303,511 | | | | 335,029 | | | | | | | | | | | | | | | | | | | | | | | | | Income tax expense | | | 31 | | | | (403,899 | ) | | | (643,734 | ) | | | (822,499 | ) | | | (119,628 | ) | | | | | | | | | | | | | | | | | | | | | | | | Profit for the year | | | | | | | 1,216,790 | | | | 2,405,276 | | | | 1,481,012 | | | | 215,401 | |
ALUMINUM CORPORATION OF CHINA LIMITED CONSOLIDATED STATEMENTS OF PROFIT OR LOSS AND OTHER COMPREHENSIVE INCOME(Continued) For the years ended December 31, 2016, 2017 and 2018 (Amounts expressed in thousands of RMB unless otherwise stated) | | | | | | 2016 | | | 2017 | | | 2018 | | | | | Note | | | RMB’000 | | | RMB’000 | | | RMB’000 | | | USD’000 | | | Profit attributable to: | | | | | | | | | | | | | | | | | | | | | | Owners of the parent | | | | | | | 365,697 | | | | 1,413,028 | | | | 746,477 | | | | 108,567 | | | Non-controlling interests | | | | | | | 851,093 | | | | 992,248 | | | | 734,535 | | | | 106,834 | | | | | | | | | | | | | | | | | | | | | | | | | | | | | | | | 1,216,790 | | | | 2,405,276 | | | | 1,481,012 | | | | 215,401 | | | | | | | | | | | | | | | | | | | | | | | | | Other comprehensive income, net of tax: | | | | | | | | | | | | | | | | | | | | | | Other comprehensive income that may be reclassified to profit or loss in subsequent periods: | | | | | | | | | | | | | | | | | | | | | | Available-for-sale investments: | | | | | | | | | | | | | | | | | | | | | | Changes in fair value | | | | | | | 104,103 | | | | (5,206 | ) | | | — | | | | — | | | Reclassification adjustments for gains included in profit or loss -Gain on disposal | | | | | | | (102,854 | ) | | | (45,039 | ) | | | — | | | | — | | | Income tax effect | | | | | | | (13,288 | ) | | | 11,180 | | | | — | | | | — | | | Transfer out other comprehensive income of an associate | | | | | | | (4,658 | ) | | | — | | | | — | | | | — | | | Exchange differences on translation of foreign operations | | | | | | | 657,531 | | | | (634,793 | ) | | | (120,756 | ) | | | (17,563 | ) | | | | | | | | | | | | | | | | | | | | | | | | Net other comprehensive income that may be reclassified to profit or loss in subsequent periods | | | | | | | 640,834 | | | | (673,858 | ) | | | (120,756 | ) | | | (17,563 | ) | | | | | | | | | | | | | | | | | | | | | | | | Other comprehensive income that will not be reclassified to profit or loss in subsequent periods | | | | | | | | | | | | | | | | | | | | | | Equity investments designated at fair value through other comprehensive income: | | | | | | | | | | | | | | | | | | | | | | Changes in fair value | | | | | | | — | | | | — | | | | (15,491 | ) | | | (2,253 | ) | | Income tax effect | | | | | | | — | | | | — | | | | 3,769 | | | | 548 | | | Net other comprehensive income that will not be reclassified to profit or loss in subsequent periods | | | | | | | — | | | | — | | | | (11,722 | ) | | | (1,705 | ) | | | | | | | | | | | | | | | | | | | | | | | | Total other comprehensive income/(loss), net of tax | | | | | | | 640,834 | | | | (673,858 | ) | | | (132,478 | ) | | | (19,268 | ) | | | | | | | | | | | | | | | | | | | | | | | | Total comprehensive income for the year | | | | | | | 1,857,624 | | | | 1,731,418 | | | | 1,348,534 | | | | 196,133 | | | | | | | | | | | | | | | | | | | | | | | | | Total comprehensive income for the year attributable to: | | | | | | | | | | | | | | | | | | | | | | Owners of the parent | | | | | | | 1,006,531 | | | | 739,170 | | | | 614,638 | | | | 89,395 | | | Non-controlling interests | | | | | | | 851,093 | | | | 992,248 | | | | 733,896 | | | | 106,738 | | | | | | | | | | | | | | | | | | | | | | | | | | | | | | | | 1,857,624 | | | | 1,731,418 | | | | 1,348,534 | | | | 196,133 | | | | | | | | | | | | | | | | | | | | | | | | | Basic and diluted earnings per share attributable to ordinary equity holders of the parent | | | | | | | | | | | | | | | | | | | | | | (expressed in RMB per share) | | | 32 | | | | 0.017 | | | | 0.087 | | | | 0.037 | | | | 0.0054 | |
Details of the dividends payable and proposed for the year are disclosed in note 33 to the financial statements. The accompanying notes are an integral part of these financial statements.
ALUMINUM CORPORATION OF CHINA LIMITED AND ITS SUBSIDIARIES CONSOLIDATED STATEMENTS OF SHAREHOLDERS’CHANGES IN EQUITY For the years ended December 31, 2015, 2016, 2017 and 2017 (Amounts expressed in thousands of RMB unless otherwise stated)
| | | Attributable to owners of the parent | | | | | | | | | | | | Capital reserves | | | | | | | | | | | | | | | | | | | | | | | | | | | | | | | | | | | | | | | | | | Share capital | | | | Share premium | | | | Other capital reserves | | | | Statutory surplus reserve | | | | Special reserve | | | | Gain on available-for-sale financial assets | | | | Other equity instruments | | | | Foreign currency translation reserve | | | | Accumulated losses | | | | Total | | | | Non- controlling interests | | | | Total equity | | | | | | | | | | | | | | | | | | | | | | | | | | | | | | | | | | | | | | | | | | | | | | | | | | | | | At January 1, 2015 | | | 13,524,488 | | | | 14,059,029 | | | | 932,588 | | | | 5,867,557 | | | | 187,858 | | | | — | | | | — | | | | (187,299 | ) | | | (4,910,418 | ) | | | 29,473,803 | | | | 11,832,257 | | | | 41,306,060 | | | Add: Adjustment due to business combinations under common control | | | — | | | | 208,310 | | | | — | | | | — | | | | — | | | | — | | | | — | | | | — | | | | (94,747 | ) | | | 113,563 | | | | — | | | | 113,563 | | | At January 1, 2015 | | | 13,524,488 | | | | 14,267,339 | | | | 932,588 | | | | 5,867,557 | | | | 187,858 | | | | — | | | | — | | | | (187,299 | ) | | | (5,005,165 | ) | | | 29,587,366 | | | | 11,832,257 | | | | 41,419,623 | | | Profit for the year | | | — | | | | — | | | | — | | | | — | | | | — | | | | — | | | | — | | | | — | | | | 129,511 | | | | 129,511 | | | | 218,391 | | | | 347,902 | | | | | | | | | | | | | | | | | | | | | | | | | | | | | | | | | | | | | | | | | | | | | | | | | | | | | Other comprehensive income for the year | | | | | | | | | | | | | | | | | | | | | | | | | | | | | | | | | | | | | | | | | | | | | | | | | | Gain on available-for-sale financial assets | | | — | | | | — | | | | — | | | | — | | | | — | | | | 57,940 | | | | — | | | | — | | | | — | | | | 57,940 | | | | — | | | | 57,940 | | | Share of other comprehensive income of an associate | | | — | | | | — | | | | — | | | | — | | | | — | | | | 4,658 | | | | — | | | | — | | | | — | | | | 4,658 | | | | — | | | | 4,658 | | | Exchange differences related to foreign operations | | | — | | | | — | | | | — | | | | — | | | | — | | | | — | | | | — | | | | 499,837 | | | | — | | | | 499,837 | | | | — | | | | 499,837 | | | Total comprehensive income for the year | | | — | | | | — | | | | — | | | | — | | | | — | | | | 62,598 | | | | — | | | | 499,837 | | | | 129,511 | | | | 691,946 | | | | 218,391 | | | | 910,337 | | | | | | | | | | | | | | | | | | | | | | | | | | | | | | | | | | | | | | | | | | | | | | | | | | | | | Issuance of A shares | | | 1,379,310 | | | | 6,518,162 | | | | — | | | | — | | | | — | | | | — | | | | — | | | | — | | | | — | | | | 7,897,472 | | | | — | | | | 7,897,472 | | | Business combination under common control | | | — | | | | (37,662 | ) | | | — | | | | — | | | | — | | | | — | | | | — | | | | — | | | | — | | | | (37,662 | ) | | | — | | | | (37,662 | ) | | Disposal of subsidiaries | | | — | | | | — | | | | — | | | | — | | | | (5,405 | ) | | | — | | | | — | | | | — | | | | — | | | | (5,405 | ) | | | 5,686 | | | | 281 | | | Issuance of perpetual medium-term notes | | | — | | | | — | | | | — | | | | — | | | | — | | | | — | | | | 2,000,000 | | | | — | | | | — | | | | 2,000,000 | | | | — | | | | 2,000,000 | | | Capital injection from non-controlling shareholders | | | — | | | | — | | | | — | | | | — | | | | — | | | | — | | | | — | | | | — | | | | — | | | | — | | | | 261,000 | | | | 261,000 | | | Other appropriation | | | — | | | | — | | | | — | | | | — | | | | (80,364 | ) | | | — | | | | — | | | | — | | | | — | | | | (80,364 | ) | | | (16,081 | ) | | | (96,445 | ) | | Share of reserves of joint ventures and associates | | | — | | | | — | | | | — | | | | — | | | | 11,878 | | | | — | | | | — | | | | — | | | | — | | | | 11,878 | | | | — | | | | 11,878 | | | Partial disposal of Jiaozuo Wangfang | | | — | | | | — | | | | — | | | | — | | | | (13,949 | ) | | | — | | | | — | | | | — | | | | — | | | | (13,949 | ) | | | — | | | | (13,949 | ) | | Dividends distributed by subsidiaries to non-controlling shareholders | | | — | | | | — | | | | — | | | | — | | | | — | | | | — | | | | — | | | | — | | | | — | | | | — | | | | (65,853 | ) | | | (65,853 | ) | | Other equity instruments’ distribution | | | — | | | | — | | | | — | | | | — | | | | — | | | | — | | | | 19,288 | | | | — | | | | (19,288 | ) | | | — | | | | (297,766 | ) | | | (297,766 | ) | | At December 31, 2015 | | | 14,903,798 | | | | 20,747,839 | | | | 932,588 | | | | 5,867,557 | | | | 100,018 | | | | 62,598 | | | | 2,019,288 | | | | 312,538 | | | | (4,894,942 | ) | | | 40,051,282 | | | | 11,937,634 | | | | 51,988,916 | |
ALUMINUM CORPORATION OF CHINA LIMITED AND ITS SUBSIDIARIES
CONSOLIDATED STATEMENTS OF SHAREHOLDERS’ EQUITY(Continued)
For the years ended December 31, 2015, 2016 and 2017
(Amounts expressed in thousands of RMB unless otherwise stated)
| | | Attributable to owners of the parent | | | | | | | | | | | | Capital reserves | | | | | | | | | | | | | | | | | | | | | | | | | | | | | | | | | | | | | | | | | | Share capital (note 17) | | | | Share premium | | | | Other capital reserves | | | | Statutory surplus reserve | | | | Special reserve | | | | Gain on available-for-sale financial assets | | | | Other equity instruments | | | | Foreign currency translation reserve | | | | Accumulated losses | | | | Total | | | | Non- controlling interests | | | | Total equity | | | | | | | | | | | | | | | | | | | | | | | | | | | | | | | | | | | | | | | | | | | | | | | | | | | | | At January 1, 2016 | | | 14,903,798 | | | | 20,539,529 | | | | 932,588 | | | | 5,867,557 | | | | 99,080 | | | | 62,598 | | | | 2,019,288 | | | | 312,538 | | | | (4,781,084 | ) | | | 39,955,892 | | | | 11,937,634 | | | | 51,893,526 | | | Add: Adjustment due to business combinations under common control | | | — | | | | 208,310 | | | | — | | | | — | | | | 938 | | | | — | | | | — | | | | — | | | | (113,858 | ) | | | 95,390 | | | | — | | | | 95,390 | | | At January 1, 2016 | | | 14,903,798 | | | | 20,747,839 | | | | 932,588 | | | | 5,867,557 | | | | 100,018 | | | | 62,598 | | | | 2,019,288 | | | | 312,538 | | | | (4,894,942 | ) | | | 40,051,282 | | | | 11,937,634 | | | | 51,988,916 | | | Profit for the year | | | — | | | | — | | | | — | | | | — | | | | — | | | | — | | | | — | | | | — | | | | 368,412 | | | | 368,412 | | | | 852,961 | | | | 1,221,373 | | | | | | | | | | | | | | | | | | | | | | | | | | | | | | | | | | | | | | | | | | | | | | | | | | | | | Other comprehensive income for the year | | | | | | | | | | | | | | | | | | | | | | | | | | | | | | | | | | | | | | | | | | | | | | | | | | Changes in fair value of available-for-sale financial assets | | | — | | | | — | | | | — | | | | — | | | | — | | | | 90,815 | | | | — | | | | — | | | | — | | | | 90,815 | | | | — | | | | 90,815 | | | Disposal of available-for-sale financial assets, net of tax | | | — | | | | — | | | | — | | | | — | | | | — | | | | (102,854 | ) | | | — | | | | — | | | | — | | | | (102,854 | ) | | | — | | | | (102,854 | ) | | Transfer out of share of other comprehensive income of an associate | | | — | | | | — | | | | — | | | | — | | | | — | | | | (4,658 | ) | | | — | | | | — | | | | — | | | | (4,658 | ) | | | — | | | | (4,658 | ) | | Exchange differences related to foreign operations | | | — | | | | — | | | | — | | | | — | | | | — | | | | — | | | | — | | | | 657,531 | | | | — | | | | 657,531 | | | | — | | | | 657,531 | | | Total comprehensive income for the year | | | — | | | | — | | | | — | | | | — | | | | — | | | | (16,697 | ) | | | — | | | | 657,531 | | | | 368,412 | | | | 1,009,246 | | | | 852,961 | | | | 1,862,207 | | | | | | | | | | | | | | | | | | | | | | | | | | | | | | | | | | | | | | | | | | | | | | | | | | | | | Release of deferred government subsidies | | | — | | | | — | | | | 20,290 | | | | — | | | | — | | | | — | | | | — | | | | — | | | | — | | | | 20,290 | | | | — | | | | 20,290 | | | Business combination under common control | | | — | | | | (3,010,627 | ) | | | — | | | | — | | | | — | | | | — | | | | — | | | | — | | | | — | | | | (3,010,627 | ) | | | — | | | | (3,010,627 | ) | | Dividends distributed by subsidiaries to non-controlling shareholders | | | — | | | | — | | | | — | | | | — | | | | — | | | | — | | | | — | | | | — | | | | — | | | | — | | | | (8,941 | ) | | | (8,941 | ) | | Issuance of senior perpetual securities | | | — | | | | — | | | | — | | | | — | | | | — | | | | — | | | | — | | | | — | | | | — | | | | — | | | | 3,513,068 | | | | 3,513,068 | | | Capital injection from non-controlling shareholders | | | — | | | | 176,615 | | | | — | | | | — | | | | — | | | | — | | | | — | | | | — | | | | — | | | | 176,615 | | | | 1,661,925 | | | | 1,838,540 | | | Other appropriations | | | — | | | | — | | | | — | | | | — | | | | 22,523 | | | | — | | | | — | | | | — | | | | — | | | | 22,523 | | | | (13,375 | ) | | | 9,148 | | | Share of reserves of joint ventures and associates | | | — | | | | — | | | | — | | | | — | | | | 8,969 | | | | — | | | | — | | | | — | | | | — | | | | 8,969 | | | | — | | | | 8,969 | | | Other equity instruments’ distribution | | | — | | | | — | | | | — | | | | — | | | | — | | | | — | | | | — | | | | — | | | | (110,000 | ) | | | (110,000 | ) | | | (324,762 | ) | | | (434,762 | ) | | At December 31, 2016 | | | 14,903,798 | | | | 17,913,827 | | | | 952,878 | | | | 5,867,557 | | | | 131,510 | | | | 45,901 | | | | 2,019,288 | | | | 970,069 | | | | (4,636,530 | ) | | | 38,168,298 | | | | 17,618,510 | | | | 55,786,808 | |
ALUMINUM CORPORATION OF CHINA LIMITED AND ITS SUBSIDIARIES
CONSOLIDATED STATEMENTS OF SHAREHOLDERS’ EQUITY(Continued)
For the years ended December 31, 2015, 2016 and 2017
(Amounts expressed in thousands of RMB unless otherwise stated)
| | | Attributable to owners of the parent | | | | | | | | | | | | Capital reserves | | | | | | | | | | | | | | | | | | | | | | | | | | | | | | | | | | | | | | | | | | Share capital (note 17) | | | | Share premium | | | | Other capital reserves | | | | Statutory surplus reserve | | | | Special reserve | | | | Gain on available-for-sale financial assets | | | | Other equity instruments | | | | Foreign currency translation reserve | | | | Accumulated losses | | | | Total | | | | Non- controlling interests | | | | Total equity | | | | | | | | | | | | | | | | | | | | | | | | | | | | | | | | | | | | | | | | | | | | | | | | | | | | | At January 1, 2017 | | | 14,903,798 | | | | 17,705,517 | | | | 952,878 | | | | 5,867,557 | | | | 131,231 | | | | 45,901 | | | | 2,019,288 | | | | 970,069 | | | | (4,488,590 | ) | | | 38,107,649 | | | | 17,479,840 | | | | 55,587,489 | | | Add: Adjustment due to business combinations under common control (note 38) | | | — | | | | 208,310 | | | | — | | | | — | | | | 279 | | | | — | | | | — | | | | — | | | | (147,940 | ) | | | 60,649 | | | | 138,670 | | | | 199,319 | | | At January 1, 2017 | | | 14,903,798 | | | | 17,913,827 | * | | | 952,878 | * | | | 5,867,557 | * | | | 131,510 | * | | | 45,901 | * | | | 2,019,288 | * | | | 970,069 | * | | | (4,636,530 | ) | | | 38,168,298 | | | | 17,618,510 | | | | 55,786,808 | | | Profit for the year | | | — | | | | — | | | | — | | | | — | | | | — | | | | — | | | | — | | | | — | | | | 1,378,435 | | | | 1,378,435 | | | | 985,514 | | | | 2,363,949 | | | | | | | | | | | | | | | | | | | | | | | | | | | | | | | | | | | | | | | | | | | | | | | | | | | | | Other comprehensive income for the year | | | | | | | | | | | | | | | | | | | | | | | | | | | | | | | | | | | | | | | | | | | | | | | | | | Changes in fair value of available-for-sale financial assets, net of tax | | | — | | | | — | | | | — | | | | — | | | | — | | | | (4,758 | ) | | | — | | | | — | | | | — | | | | (4,758 | ) | | | — | | | | (4,758 | ) | | Disposal of available-for-sale financial assets, net of tax | | | — | | | | — | | | | — | | | | — | | | | — | | | | (34,307 | ) | | | — | | | | — | | | | — | | | | (34,307 | ) | | | — | | | | (34,307 | ) | | Exchange differences on translation of foreign operations | | | — | | | | — | | | | — | | | | — | | | | — | | | | — | | | | — | | | | (634,793 | ) | | | — | | | | (634,793 | ) | | | — | | | | (634,793 | ) | | Total comprehensive income for the year | | | — | | | | — | | | | — | | | | — | | | | — | | | | (39,065 | ) | | | — | | | | (634,793 | ) | | | 1,378,435 | | | | 704,577 | | | | 985,514 | | | | 1,690,091 | | | | | | | | | | | | | | | | | | | | | | | | | | | | | | | | | | | | | | | | | | | | | | | | | | | | | Business combinations under common control | | | — | | | | (242,564 | ) | | | — | | | | — | | | | — | | | | — | | | | — | | | | — | | | | — | | | | (242,564 | ) | | | — | | | | (242,564 | ) | | Disposal of subsidiaries | | | — | | | | — | | | | — | | | | — | | | | (6,149 | ) | | | — | | | | — | | | | — | | | | — | | | | (6,149 | ) | | | 6,929 | | | | 780 | | | Disposal of equity interest in subsidiaries without loss of control | | | — | | | | 38,189 | | | | — | | | | — | | | | — | | | | — | | | | — | | | | — | | | | — | | | | 38,189 | | | | (38,189 | ) | | | — | | | Deemed disposal of a subsidiary | | | — | | | | — | | | | — | | | | — | | | | — | | | | — | | | | — | | | | — | | | | — | | | | — | | | | (96,568 | ) | | | (96,568 | ) | | Dividends distribution by subsidiaries to non-controlling shareholders | | | — | | | | — | | | | — | | | | — | | | | — | | | | — | | | | — | | | | — | | | | — | | | | — | | | | (311,911 | ) | | | (311,911 | ) | | Capital injection from non-controlling shareholders | | | — | | | | 1,887,824 | | | | — | | | | — | | | | — | | | | — | | | | — | | | | — | | | | — | | | | 1,887,824 | | | | 10,829,937 | | | | 12,717,761 | | | Acquisition of non-controlling interests | | | — | | | | (980,725 | ) | | | — | | | | — | | | | — | | | | — | | | | — | | | | — | | | | — | | | | (980,725 | ) | | | (432,564 | ) | | | (1,413,289 | ) | | Acquisition of a subsidiary | | | — | | | | — | | | | — | | | | — | | | | — | | | | — | | | | — | | | | — | | | | — | | | | — | | | | 416,353 | | | | 416,353 | | | Other appropriations | | | — | | | | — | | | | — | | | | — | | | | 22,696 | | | | — | | | | — | | | | — | | | | — | | | | 22,696 | | | | 34,033 | | | | 56,729 | | | Share of reserves of joint ventures and associates (note 9) | | | — | | | | — | | | | — | | | | — | | | | (3,696 | ) | | | — | | | | — | | | | — | | | | — | | | | (3,696 | ) | | | — | | | | (3,696 | ) | | Repayment of senior perpetual securities | | | — | | | | — | | | | — | | | | — | | | | — | | | | — | | | | — | | | | — | | | | — | | | | — | | | | (2,584,682 | ) | | | (2,584,682 | ) | | Other equity instruments’ distribution | | | — | | | | — | | | | — | | | | — | | | | — | | | | — | | | | — | | | | — | | | | (110,000 | ) | | | (110,000 | ) | | | (391,933 | ) | | | (501,933 | ) | | At December 31, 2017 | | | 14,903,798 | | | | 18,616,551 | * | | | 952,878 | * | | | 5,867,557 | * | | | 144,361 | * | | | 6,836 | * | | | 2,019,288 | * | | | 335,276 | * | | | (3,368,095 | ) | | | 39,478,450 | | | | 26,035,429 | | | | 65,513,879 | |
* | These reserves accounts comprise the consolidated other reserves of RMB27,943 million (December 31, 2016: RMB27,901 million) in the consolidated statement of financial position. |
The accompanying notes are an integral part of these consolidated financial statements.
ALUMINUM CORPORATION OF CHINA LIMITED AND ITS SUBSIDIARIES
CONSOLIDATED STATEMENTS OF CASH FLOWS
For the years ended December 31, 2015, 2016 and 20172018
(Amounts expressed in thousands of RMB unless otherwise stated) | | | Note | | | 2015 | | | | 2016 | | | | 2017 | | | | | | | | RMB’000 | | | | RMB’000 | | | | RMB’000 | | | | USD’000 | | | | | | | | | | | | | | | | | | | | | | | Net cash flows from operating activities | | 34 | | | 7,317,746 | | | | 11,530,400 | | | | 13,127,777 | | | | 2,017,702 | | | | | | | | | | | | | | | | | | | | | | | Investing activities | | | | | | | | | | | | | | | | | | | | Purchases of intangible assets | | | | | (34,610 | ) | | | (286,282 | ) | | | (418,203 | ) | | | (64,277 | ) | | Purchases of property, plant and equipment | | | | | (9,198,815 | ) | | | (6,242,999 | ) | | | (8,837,523 | ) | | | (1,358,304 | ) | | Purchases of land use rights | | | | | (139,624 | ) | | | (20,963 | ) | | | (59,215 | ) | | | (9,101 | ) | | Purchases of investment properties | | | | | — | | | | (41,982 | ) | | | — | | | | — | | | Proceeds from disposal of property, plant and equipment | | | | | 805,764 | | | | 271,609 | | | | 460,955 | | | | 70,847 | | | Proceeds from disposal of intangible assets | | | | | — | | | | — | | | | 11,730 | | | | 1,803 | | | Proceeds from disposal of land use rights | | | | | 554,554 | | | | — | | | | 5,824 | | | | 895 | | | Proceeds from disposal of an associate | | | | | 1,857,993 | | | | — | | | | — | | | | — | | | Cash consideration paid for business combinations under common control | | | | | (30,000 | ) | | | (2,456,512 | ) | | | (176,848 | ) | | | (27,181 | ) | | Proceeds from disposal and deemed disposal of subsidiaries and business, net of cash | | | | | 4,839,699 | | | | 6,200,670 | | | | 5,631,298 | | | | 865,515 | | | Interest received from unpaid disposal proceeds | | | | | 389,758 | | | | 353,665 | | | | 117,586 | | | | 18,073 | | | Interest received from loans and borrowings to others | | | | | 14,639 | | | | 31,657 | | | | 118,015 | | | | 18,139 | | | Acquisition of a subsidiary | | 38 | | | — | | | | — | | | | 255,152 | | | | 39,216 | | | Investments in joint ventures | | | | | (10,263 | ) | | | (1,134,512 | ) | | | (15,414 | ) | | | (2,369 | ) | | Investments in associates | | | | | (1,365,230 | ) | | | (30,000 | ) | | | (857,317 | ) | | | (131,767 | ) | | Prepaid equity investment | | | | | (150,000 | ) | | | — | | | | — | | | | — | | | Purchase of available for sale equity investments | | 10 | | | — | | | | — | | | | (1,848,000 | ) | | | (284,032 | ) | | Purchase of non-controlling interests | | 17 | | | — | | | | — | | | | (1,413,289 | ) | | | (217,219 | ) | | Proceeds from dividends and disposal of available-for-sale investments | | | | | 4,449,249 | | | | 490,309 | | | | 124,536 | | | | 19,141 | | | Dividend received | | | | | 320,857 | | | | 65,083 | | | | 44,960 | | | | 6,910 | | | (Increase)/ decrease in time deposits | | | | | (42,500 | ) | | | (21,700 | ) | | | 72,700 | | | | 11,174 | | | Cash paid for settlement of futures, options and forward foreign exchange contracts | | | | | (680,685 | ) | | | (2,006,583 | ) | | | 93,677 | | | | 14,398 | | | Loans to related parties | | 35 | | | (140,000 | ) | | | (547,957 | ) | | | (1,600,000 | ) | | | (245,915 | ) | | Loans repaid by related parties | | | | | 111,000 | | | | 213,354 | | | | 1,010,169 | | | | 155,260 | | | Asset-related government grants received | | | | | 840,769 | | | | 164,547 | | | | 145,825 | | | | 22,413 | | | | | | | | | | | | | | | | | | | | | | | Net cash flows from/(used in) investing activities | | | | | (2,392,555) | | | | (4,998,596 | ) | | | (7,133,382 | ) | | | (1,096,381 | ) |
| | | Attributable to owners of the parent | | | | | | | | | | | | Capital reserves | | | | | | | | | | | | | | | | | | | | | | | | | | | | | | | | | | | | | | Share capital | | | Share premium | | Other capital reserves | | Statutory surplus reserve | | | | Special reserve | | | Gain on available-for-sale financial assets | | | Other equity instruments | | Foreign currency translation reserve | | Accumulated losses | | | Total | | | Non- controlling interests | | | Total equity | | | | | | | | | | | | | | | | | | | | | | | | | | | | | | | | | | | | | | | | | | | | | | | | | At January 1, 2016 | | | 14,903,798 | | | | 20,747,839 | | | 932,588 | | | 5,867,557 | | | | 100,018 | | | | 62,598 | | | | 2,019,288 | | | 312,538 | | | (4,894,942 | ) | | | 40,051,282 | | | | 11,937,634 | | | | 51,988,916 | | | Add: Adjustment due to business combinations under common control | | | — | | | | 169,242 | | | — | | | — | | | | — | | | | — | | | | — | | | — | | | 4,626 | | | | 173,868 | | | | 12,404 | | | | 186,272 | | | At January 1, 2016 | | | 14,903,798 | | | | 20,917,081 | | | 932,588 | | | 5,867,557 | | | | 100,018 | | | | 62,598 | | | | 2,019,288 | | | 312,538 | | | (4,890,316 | ) | | | 40,225,150 | | | | 11,950,038 | | | | 52,175,188 | | | Profit for the year | | | — | | | | — | | | — | | | — | | | | — | | | | — | | | | — | | | — | | | 365,697 | | | | 365,697 | | | | 851,093 | | | | 1,216,790 | | | | | | | | | | | | | | | | | | | | | | | | | | | | | | | | | | | | | | | | | | | | | | | | | Other comprehensive income for the year | | | | | | | | | | | | | | | | | | | | | | | | | | | | | | | | | | | | | | | | | | | | | Changes in fair value of available-for-sale financial assets | | | — | | | | — | | | — | | | — | | | | — | | | | 90,815 | | | | — | | | — | | | — | | | | 90,815 | | | | — | | | | 90,815 | | | Disposal of available-for-sale financial assets | | | | | | | | | | | | | | | | | | | | | (102,854 | ) | | | | | | | | | | | | | (102,854 | ) | | | | | | | (102,854 | ) | Transfer out of share of other comprehensive income of an associate | | | — | | | | — | | | — | | | — | | | | — | | | | (4,658 | ) | | | — | | | — | | | — | | | | (4,658 | ) | | | — | | | | (4,658 | ) | | Exchange differences related to foreign operations | | | — | | | | — | | | — | | | — | | | | — | | | | — | | | | — | | | 657,531 | | | — | | | | 657,531 | | | | — | | | | 657,531 | | | Total comprehensive income for the year | | | — | | | | — | | | — | | | — | | | | — | | | | (16,697 | ) | | | — | | | 657,531 | | | 365,697 | | | | 1,006,531 | | | | 851,093 | | | | 1,857,624 | | | | | | | | | | | | | | | | | | | | | | | | | | | | | | | | | | | | | | | | | | | | | | | | | Release of deferred government subsidies | | | — | | | | — | | | 20,290 | | | — | | | | — | | | | — | | | | — | | | — | | | — | | | | 20,290 | | | | — | | | | 20,290 | | | Business combination under common control | | | — | | | | (3,010,627 | ) | | — | | | — | | | | — | | | | — | | | | — | | | — | | | — | | | | (3,010,627 | ) | | | — | | | | (3,010,627 | ) | | Dividends distributed by subsidiaries to non-controlling shareholders | | | — | | | | — | | | — | | | — | | | | — | | | | — | | | | — | | | — | | | — | | | | — | | | | (8,941 | ) | | | (8,941 | ) | | Capital injection from non-controlling shareholders | | | — | | | | 176,615 | | | — | | | — | | | | — | | | | — | | | | — | | | — | | | — | | | | 176,615 | | | | 1,661,925 | | | | 1,838,540 | | | Other appropriation | | | — | | | | — | | | — | | | — | | | | 23,215 | | | | — | | | | — | | | — | | | — | | | | 23,215 | | | | (13,376 | ) | | | 9,839 | | | Share of reserves of joint ventures and associates | | | — | | | | — | | | — | | | — | | | | 8,969 | | | | — | | | | — | | | — | | | — | | | | 8,969 | | | | — | | | | 8,969 | | | Issuance of perpetual medium-term notes | | | — | | | | — | | | — | | | — | | | | — | | | | — | | | | — | | | — | | | — | | | | — | | | | 3,513,068 | | | | 3,513,068 | | | Perpetual medium-term notes’ dividends | | | — | | | | — | | | — | | | — | | | | — | | | | — | | | | — | | | — | | | — | | | | — | | | | (324,762 | ) | | | (324,762 | ) | | Other equity instruments’ distribution | | | | | | | | | | | | | | | | | | | | | | | | | — | | | — | | | (110,000 | ) | | | (110,000 | ) | | | — | | | | (110,000 | ) | | At December 31, 2016 | | | 14,903,798 | | | | 18,083,069 | | | 952,878 | | | 5,867,557 | | | | 132,202 | | | | 45,901 | | | | 2,019,288 | | | 970,069 | | | (4,634,619 | ) | | | 38,340,143 | | | | 17,629,045 | | | | 55,969,188 | |
ALUMINUM CORPORATION OF CHINA LIMITED AND ITS SUBSIDIARIES CONSOLIDATED STATEMENTS OF CASH FLOWSCHANGES IN EQUITY(Continued) For the years ended December 31, 2015, 2016, 2017 and 20172018 (Amounts expressed in thousands of RMB unless otherwise stated) | | | | Note | | | | 2015 | | | | 2016 | | | | 2017 | | | | | | | | | | | | | | RMB’000 | | | | RMB’000 | | | | RMB’000 | | | | USD’000 | | | | | | | | | | | | | | | | | | | | | | | | | Financing activities | | | | | | | | | | | | | | | | | | | | | | Proceeds from a gold leasing arrangement | | | | | | | — | | | | 3,000,000 | | | | 7,804,083 | | | | 1,199,466 | | | Repayments of gold leasing arrangement | | | | | | | — | | | | — | | | | (4,000,000 | ) | | | (614,789 | ) | | Proceeds from issuance of bonds and notes, net of issuance costs | | | | | | | 20,988,166 | | | | 11,070,660 | | | | 3,478,550 | | | | 534,643 | | | Repayments of senior perpetual securities | | | | | | | — | | | | — | | | | (2,895,910 | ) | | | (445,093 | ) | | Proceeds from issuance of perpetual securities, net of issuance costs | | | | | | | 2,000,000 | | | | 3,513,068 | | | | — | | | | — | | | Repayments of bonds and notes | | | | | | | (32,000,000 | ) | | | (13,500,000 | ) | | | (16,300,000 | ) | | | (2,505,264 | ) | | Distribution paid for other equity instruments | | | | | | | (297,766 | ) | | | (434,762 | ) | | | (501,933 | ) | | | (77,146 | ) | | Drawdown of short-term and long-term loans | | | | | | | 56,113,052 | | | | 44,691,924 | | | | 83,523,749 | | | | 12,837,365 | | | Repayments of short-term and long-term loans | | | | | | | (59,503,290 | ) | | | (48,648,566 | ) | | | (78,673,459 | ) | | | (12,091,889 | ) | | Proceeds from sale and leaseback finance leases, net of deposit and transaction costs | | | | | | | 5,657,694 | | | | 1,527,085 | | | | 1,000,036 | | | | 153,703 | | | Finance lease instalment paid | | | | | | | (472,902 | ) | | | (1,580,986 | ) | | | (2,462,250 | ) | | | (378,441 | ) | | Proceeds from issuance of A shares, net of issuance cost | | | | | | | 7,897,472 | | | | — | | | | — | | | | — | | | Capital injection from non-controlling shareholders | | | | | | | 261,000 | | | | 1,838,540 | | | | 12,717,761 | | | | 1,954,684 | | | Dividends paid by subsidiaries to non-controlling shareholders | | | | | | | (20,045 | ) | | | (20,481 | ) | | | (309,465 | ) | | | (47,564 | ) | | Interest paid | | | | | | | (6,071,394 | ) | | | (5,128,402 | ) | | | (5,217,040 | ) | | | (801,844 | ) | | | | | | | | | | | | | | | | | | | | | | | | Net cash flows used in financing activities | | | | | | | (5,448,013 | ) | | | (3,671,920 | ) | | | (1,835,878 | ) | | | (282,169 | ) | | | | | | | | | | | | | | | | | | | | | | | | Net increase in cash and cash equivalents | | | | | | | 4,262,288 | | | | 2,859,884 | | | | 4,158,517 | | | | 639,152 | | | Cash and cash equivalents at beginning of year | | | | | | | 16,385,252 | | | | 20,762,306 | | | | 23,813,736 | | | | 3,660,104 | | | Effect of foreign exchange rate changes, net | | | | | | | 114,766 | | | | 191,546 | | | | (221,567 | ) | | | (34,054 | ) | | | | | | | | | | | | | | | | | | | | | | | | Cash and cash equivalents at December 31 | | | 16 | | | | 20,762,306 | | | | 23,813,736 | | | | 27,750,686 | | | | 4,265,202 | |
| | | Attributable to owners of the parent | | | | | | | | | | Capital reserves | | | | | | | | | | | | | | | | | | | | | | | | | | | | | | | | | | Share
capital
(note 17) | | | Share
premium | | Other
capital
reserves | | Statutory
surplus
reserve | | | Special
reserve | | | Gain on available-for-sale financial assets | | Other
equity
instruments | | Foreign currency
translation
reserve | | Accumulated
losses | | Total | | | Non-
controlling
interests | | Total
equity | | | | | | | | | | | | | | | | | | | | | | | | | | | | | | | | | | | | | | | | | | | | At January 1, 2017 | | | 14,903,798 | | | | 17,913,827 | | | 952,878 | | | 5,867,557 | | | | 131,510 | | | | 45,901 | | | 2,019,288 | | | 970,069 | | | (4,636,530) | | | 38,168,298 | | | | 17,618,510 | | | 55,786,808 | | Adjustment due to business combinations under common control (note 38) | | | — | | | | 169,242 | | | — | | | — | | | | 692 | | | | — | | | — | | | — | | | 1,911 | | | 171,845 | | | | 10,535 | | | 182,380 | | At January 1, 2017 | | | 14,903,798 | | | | 18,083,069 | | | 952,878 | | | 5,867,557 | | | | 132,202 | | | | 45,901 | | | 2,019,288 | | | 970,069 | | | (4,634,619) | | | 38,340,143 | | | | 17,629,045 | | | 55,969,188 | | Profit for the year | | | — | | | | — | | | — | | | — | | | | — | | | | — | | | — | | | — | | | 1,413,028 | | | 1,413,028 | | | | 992,248 | | | 2,405,276 | | | | | | | | | | | | | | | | | | | | | | | | | | | | | | | | | | | | | | | | | | | | Other comprehensive income for the year | | | | | | | | | | | | | | | | | | | | | | | | | | | | | | | | | | | | | | | | | | Changes in fair value of available-for-sale financial assets, net of tax | | | — | | | | — | | | — | | | — | | | | — | | | | (4,758 | ) | | — | | | — | | | — | | | (4,758 | ) | | | — | | | (4,758) | | Disposal of available-for-sale financial assets, net of tax | | | — | | | | — | | | — | | | — | | | | — | | | | (34,307 | ) | | — | | | — | | | — | | | (34,307 | ) | | | — | | | (34,307) | | Exchange differences on translation of foreign operations | | | — | | | | — | | | — | | | — | | | | — | | | | — | | | — | | | (634,793 | ) | | — | | | (634,793 | ) | | | — | | | (634,793) | | Total comprehensive income for the year | | | — | | | | — | | | — | | | — | | | | — | | | | (39,065 | ) | | — | | | (634,793 | ) | | 1,413,028 | | | 739,170 | | | | 992,248 | | | 1,731,418 | | | | | | | | | | | | | | | | | | | | | | | | | | | | | | | | | | | | | | | | | | | | Business combinations under common control (note 38) | | | — | | | | (242,564 | ) | | — | | | — | | | | — | | | | — | | | — | | | — | | | — | | | (242,564 | ) | | | — | | | (242,564) | | Disposal of subsidiaries | | | — | | | | — | | | — | | | — | | | | (6,149 | ) | | | — | | | — | | | — | | | — | | | (6,149 | ) | | | 6,929 | | | 780 | | Disposal of equity interest in subsidiaries without loss of control | | | — | | | | 38,189 | | | — | | | — | | | | — | | | | — | | | — | | | — | | | — | | | 38,189 | | | | (38,189 | ) | | — | | Deemed disposal of a subsidiary | | | — | | | | — | | | — | | | — | | | | — | | | | — | | | — | | | — | | | — | | | — | | | | (96,568 | ) | | (96,568) | | Capital injection from non-controlling shareholders | | | — | | | | 1,887,824 | | | — | | | — | | | | — | | | | — | | | — | | | — | | | — | | | 1,887,824 | | | | 10,831,897 | | | 12,719,721 | | Capital injection from the parent company | | | — | | | | 2,040 | | | — | | | | | | | | | | | | | | | | | | | | | | | 2,040 | | | | — | | | 2,040 | | Acquisition of non-controlling interests | | | — | | | | (980,725 | ) | | | | | | | | | | | | | | | | | | | | | | | | | (980,725 | ) | | | (432,564 | ) | | (1,413,289) | | Acquisition of a subsidiary | | | — | | | | — | | | — | | | — | | | | — | | | | — | | | — | | | — | | | — | | | — | | | | 416,353 | | | 416,353 | | Other appropriations | | | — | | | | — | | | — | | | — | | | | 24,577 | | | | — | | | — | | | — | | | — | | | 24,577 | | | | 34,166 | | | 58,743 | | Share of reserves of joint ventures and associates | | | — | | | | — | | | — | | | — | | | | (3,696 | ) | | | — | | | — | | | — | | | — | | | (3,696 | ) | | | — | | | (3,696) | | Repayment of senior perpetual securities | | | — | | | | — | | | — | | | — | | | | — | | | | — | | | — | | | — | | | — | | | — | | | | (2,584,682 | ) | | (2,584,682) | | Other equity instruments’ distribution | | | — | | | | — | | | — | | | — | | | | — | | | | — | | | — | | | — | | | (110,000) | | | (110,000 | ) | | | (391,933 | ) | | (501,933) | | Dividends distributed by subsidiaries to non-controlling shareholders | | | — | | | | — | | | — | | | — | | | | — | | | | — | | | — | | | — | | | — | | | — | | | | (312,135 | ) | | (312,135) | | Dividends distribution before business under common control | | | — | | | | — | | | — | | | — | | | | — | | | | — | | | — | | | — | | | (780) | | | (780 | ) | | | — | | | (780) | | At December 31, 2017 | | | 14,903,798 | | | | 18,787,833 | | | 952,878 | | | 5,867,557 | | | | 146,934 | | | | 6,836 | | | 2,019,288 | | | 335,276 | | | (3,332,371) | | | 39,688,029 | | | | 26,054,567 | | | 65,742,596 |
ALUMINUM CORPORATION OF CHINA LIMITED CONSOLIDATED STATEMENTS OF CHANGES IN EQUITY(Continued) For the years ended December 31, 2016, 2017 and 2018 (Amounts expressed in thousands of RMB unless otherwise stated) | | | Attributable to owners of the parent | | | | | | | | | | Capital reserves | | | | | | | | | | | | | | | | | | | | | | | | | | | | | | | | | | Share
capital
(note 17) | | | Share
premium | | Other
capital
reserves | | Statutory
surplus
reserve | | | Special
reserve | | | Gain on available-for-sale
financial assets/fair value reserve | | Other
equity
instruments | | Foreign currency
translation
reserve | | Accumulated
losses | | Total | | Non–
controlling
interests | | Total
equity | | | At December 31, 2017 | | | 14,903,798 | | | | 18,616,551 | | | 952,878 | | | 5,867,557 | | | | 144,361 | | | | 6,836 | | | 2,019,288 | | | 335,276 | | | (3,368,095) | | | 39,478,450 | | | 26,035,429 | | | 65,513,879 | | | Adjustment due to business combinations under common control (note 38) | | | — | | | | 171,282 | | | — | | | — | | | | 2,573 | | | | — | | | — | | | — | | | 35,724 | | | 209,579 | | | 19,138 | | | 228,717 | | | Effect of adoption of IFRS 9 (note 2.2) | | | — | | | | — | | | — | | | — | | | | — | | | | 10,835 | | | — | | | — | | | (133,346) | | | (122,511 | ) | | (16,925) | | | (139,436 | ) | | At January 1, 2018 | | | 14,903,798 | | | | 18,787,833 | | | 952,878 | | | 5,867,557 | | | | 146,934 | | | | 17,671 | | | 2,019,288 | | | 335,276 | | | (3,465,717) | | | 39,565,518 | | | 26,037,642 | | | 65,603,160 | | | Profit for the year | | | — | | | | — | | | — | | | — | | | | — | | | | — | | | — | | | — | | | 746,477 | | | 746,477 | | | 734,535 | | | 1,481,012 | | | | | | | | | | | | | | | | | | | | | | | | | | | | | | | | | | | | | | | | | | | | | Other comprehensive income for the year | | | | | | | | | | | | | | | | | | | | | | | | | | | | | | | | | | | | | | | | | | Changes in fair value of equity investments at fair value through other comprehensive income, net of tax | | | — | | | | — | | | — | | | — | | | | — | | | | (11,083 | ) | | — | | | — | | | — | | | (11,083 | ) | | (639) | | | (11,722 | ) | | Exchange differences on translation of foreign operations | | | — | | | | — | | | — | | | — | | | | — | | | | — | | | — | | | (120,756 | ) | | — | | | (120,756 | ) | | — | | | (120,756 | ) | | Total comprehensive income for the year | | | — | | | | — | | | — | | | — | | | | — | | | | (11,083 | ) | | — | | | (120,756 | ) | | 746,477 | | | 614,638 | | | 733,896 | | | 1,348,534 | | | | | | | | | | | | | | | | | | | | | | | | | | | | | | | | | | | | | | | | | | | | | Business combinations under common control (note 38) | | | — | | | | (443,582 | ) | | — | | | — | | | | — | | | | — | | | — | | | — | | | — | | | (443,582 | ) | | — | | | (443,582 | ) | | Capital injection from non-controlling shareholders | | | — | | | | 78,271 | | | — | | | — | | | | — | | | | — | | | — | | | — | | | — | | | 78,271 | | | 759,350 | | | 837,621 | | | Capital injection from the parent company | | | — | | | | 69,885 | | | — | | | — | | | | — | | | | — | | | — | | | — | | | — | | | 69,885 | | | — | | | 69,885 | | | Acquisition of non-controlling interests | | | — | | | | (218 | ) | | — | | | — | | | | — | | | | — | | | — | | | — | | | — | | | (218 | ) | | (3,547) | | | (3,765 | ) | | Restructure of subsidiaries | | | — | | | | (77,511 | ) | | — | | | — | | | | — | | | | — | | | — | | | — | | | — | | | (77,511 | ) | | 77,511 | | | — | | | Disposal of subsidiaries | | | — | | | | — | | | — | | | — | | | | — | | | | — | | | — | | | — | | | — | | | — | | | (1,160) | | | (1,160 | ) | | Issuance of senior perpetual securities | | | — | | | | — | | | — | | | — | | | | — | | | | — | | | 1,988,000 | | | — | | | — | | | 1,988,000 | | | — | | | 1,988,000 | | | Release of deferred government subsidies | | | — | | | | — | | | 2,200 | | | — | | | | — | | | | — | | | — | | | — | | | — | | | 2,200 | | | — | | | 2,200 | | | Equity exchange arrangement | | | — | | | | — | | | 10,735,214 | | | — | | | | — | | | | — | | | — | | | — | | | — | | | 10,735,214 | | | (10,735,214) | | | — | | | Other appropriations | | | — | | | | — | | | — | | | — | | | | 8,119 | | | | — | | | — | | | — | | | — | | | 8,119 | | | (1,514) | | | 6,605 | | | Share of reserves of joint ventures and associates | | | — | | | | — | | | — | | | — | | | | 2,051 | | | | — | | | — | | | — | | | — | | | 2,051 | | | — | | | 2,051 | | | Other equity instruments’ distribution | | | — | | | | — | | | — | | | — | | | | — | | | | — | | | (19,288) | | | — | | | (90,722) | | | (110,010 | ) | | (300,538) | | | (410,548 | ) | | Dividends distribution before business combinations under common control | | | — | | | | — | | | — | | | — | | | | — | | | | — | | | — | | | — | | | (6,519) | | | (6,519 | ) | | — | | | (6,519 | ) | | Dividends distributed by subsidiaries to non-controlling shareholders | | | — | | | | — | | | — | | | — | | | | — | | | | — | | | — | | | — | | | — | | | — | | | (605,416) | | | (605,416 | ) | | Acquisition of subsidiaries | | | — | | | | — | | | — | | | — | | | | (11,166 | ) | | | — | | | — | | | — | | | — | | | (11,166 | ) | | 1,468,435 | | | 1,457,269 | | | Repayment of senior perpetual securities by a subsidiary | | | — | | | | — | | | — | | | — | | | | — | | | | — | | | — | | | — | | | — | | | — | | | (2,175,133) | | | (2,175,133 | ) | | At December 31, 2018 | | | 14,903,798 | | | | 18,414,678 | * | | 11,690,292 | * | | 5,867,557 | * | | | 145,938 | * | | | 6,588 | * | | 3,988,000 | * | | 214,520 | * | | (2,816,481) | | | 52,414,890 | | | 15,254,312 | | | 67,669,202 | |
*These reserves accounts comprise the consolidated other reserves of RMB40,328 million (December 31, 2017: RMB28,117 million) in the consolidated statement of financial position. The accompanying notes are an integral part of these financial statements.
ALUMINUM CORPORATION OF CHINA LIMITED CONSOLIDATED STATEMENTS OF CASH FLOWS For the years ended December 31, 2016, 2017 and 2018 (Amounts expressed in thousands of RMB unless otherwise stated) | | | Note | | | 2016 | | | 2017 | | | 2018 | | | | | | | | | | RMB’000 | | | | RMB’000 | | | | RMB’000 | | | | USD’000 | | | | | | | | | | | | | | | | | | | | | | | | | Net cash flows from operating activities | | | 34 | | | | 11,609,309 | | | | 13,205,572 | | | | 13,018,176 | | | | 1,893,415 | | | | | | | | | | | | | | | | | | | | | | | | | Investing activities | | | | | | | | | | | | | | | | | | | | | | Purchases of intangible assets | | | | | | | (286,282 | ) | | | (418,203 | ) | | | (103,304 | ) | | | (15,025 | ) | | Purchases of property, plant and equipment | | | | | | | (6,327,839 | ) | | | (8,891,794 | ) | | | (6,745,880 | ) | | | (981,148 | ) | | Purchases of land use rights | | | | | | | (20,963 | ) | | | (59,215 | ) | | | (2,838 | ) | | | (413 | ) | | Purchases of investment properties | | | | | | | (41,982 | ) | | | — | | | | — | | | | — | | | Proceeds from disposal of property, plant and equipment | | | | | | | 271,609 | | | | 460,982 | | | | 564,791 | | | | 82,145 | | | Proceeds from disposal of intangible assets | | | | | | | — | | | | 11,730 | | | | — | | | | — | | | Proceeds from disposal of land use rights | | | | | | | — | | | | 5,824 | | | | — | | | | — | | | Proceeds from disposal of a joint venture and an associate | | | | | | | — | | | | — | | | | 30,816 | | | | 4,482 | | | Acquisition of subsidiaries | | | 38 | | | | — | | | | 255,152 | | | | 255,650 | | | | 37,183 | | | Proceeds from disposal and deemed disposal of subsidiaries and business, net of cash | | | | | | | 6,200,670 | | | | 5,631,298 | | | | 6,558 | | | | 954 | | | Interest received from unpaid disposal proceeds | | | | | | | 353,665 | | | | 117,586 | | | | — | | | | — | | | Interest received from loans and borrowings to others | | | | | | | 31,723 | | | | 118,015 | | | | — | | | | — | | | Investments in joint ventures | | | | | | | (1,134,512 | ) | | | (15,414 | ) | | | (90,000 | ) | | | (13,090 | ) | | Investments in associates | | | | | | | (30,000 | ) | | | (857,317 | ) | | | (266,300 | ) | | | (38,732 | ) | | (Purchase of)/return of investment from equity investments | | | 10 | | | | — | | | | (1,848,000 | ) | | | 198,000 | | | | 28,798 | | | Proceeds from dividends and disposal of equity investments | | | | | | | 490,309 | | | | 124,536 | | | | 109,914 | | | | 15,986 | | | Dividend received | | | | | | | 65,083 | | | | 44,960 | | | | 327,983 | | | | 47,703 | | | Decrease in time deposits | | | | | | | (21,700 | ) | | | 72,700 | | | | — | | | | — | | | Cash paid for settlement of futures, options and forward contracts | | | | | | | (2,006,583 | ) | | | 93,677 | | | | (13,288 | ) | | | (1,933 | ) | | Loans to related parties | | | 35 | | | | (547,957 | ) | | | (1,600,000 | ) | | | — | | | | — | | | Loans repaid by related parties | | | | | | | 213,354 | | | | 1,010,169 | | | | 32,215 | | | | 4,685 | | | Asset-related government grants received | | | | | | | 164,547 | | | | 145,825 | | | | 167,314 | | | | 24,335 | | | | | | | | | | | | | | | | | | | | | | | | | Net cash flows used in investing activities | | | | | | | (2,626,858 | ) | | | (5,597,489 | ) | | | (5,528,369 | ) | | | (804,070 | ) |
ALUMINUM CORPORATION OF CHINA LIMITED CONSOLIDATED STATEMENTS OF CASH FLOWS(Continued) For the years ended December 31, 2016, 2017 and 2018 (Amounts expressed in thousands of RMB unless otherwise stated) | | | Note | | | 2016 | | | 2017 | | | 2018 | | | | | | | | | | RMB’000 | | | | RMB’000 | | | | RMB’000 | | | | USD’000 | | | | | | | | | | | | | | | | | | | | | | | | | Financing activities | | | | | | | | | | | | | | | | | | | | | | Proceeds from gold leasing arrangements | | | | | | | 3,000,000 | | | | 7,804,083 | | | | 2,323,105 | | | | 337,882 | | | Repayments of gold leasing arrangements | | | | | | | — | | | | (4,000,000 | ) | | | (7,519,283 | ) | | | (1,093,634 | ) | | Purchase of non-controlling interests | | | | | | | — | | | | (1,413,289 | ) | | | (3,765 | ) | | | (548 | ) | | Proceeds from issuance of bonds and notes, net of issuance costs | | | | | | | 11,070,660 | | | | 3,478,550 | | | | 13,185,034 | | | | 1,917,684 | | | Repayments of senior perpetual securities | | | | | | | — | | | | (2,895,910 | ) | | | (2,417,758 | ) | | | (351,648 | ) | | Proceeds from issuance of perpetual securities, net of issuance costs | | | | | | | 3,513,068 | | | | — | | | | 1,988,000 | | | | 289,143 | | | Repayments of bonds and notes | | | | | | | (13,500,000 | ) | | | (16,300,000 | ) | | | (21,815,000 | ) | | | (3,172,860 | ) | | Senior perpetual securities’ distribution paid | | | | | | | (434,762 | ) | | | (501,933 | ) | | | (410,548 | ) | | | (59,712 | ) | | Drawdown of short-term and long-term loans | | | | | | | 44,733,924 | | | | 83,758,749 | | | | 76,899,591 | | | | 11,184,582 | | | Repayments of short-term and long-term loans | | | | | | | (48,659,566 | ) | | | (78,866,459 | ) | | | (70,546,537 | ) | | | (10,260,568 | ) | | Cash consideration paid for business combination under common control | | | | | | | (2,456,512 | ) | | | (176,848 | ) | | | (373,495 | ) | | | (54,323 | ) | | Proceeds from sale and leaseback finance leases, net of deposit and transaction costs | | | | | | | 1,527,085 | | | | 1,000,036 | | | | 1,204,843 | | | | 175,237 | | | Capital injection from the parent company to the entity acquired under common control | | | | | | | — | | | | — | | | | 69,885 | | | | 10,164 | | | Finance lease instalment paid | | | | | | | (1,580,986 | ) | | | (2,462,250 | ) | | | (3,915,404 | ) | | | (569,472 | ) | | Capital injection from non-controlling shareholders | | | | | | | 1,838,540 | | | | 12,718,761 | | | | 837,621 | | | | 121,827 | | | Dividends paid by subsidiaries to non-controlling shareholders | | | | | | | (20,481 | ) | | | (309,465 | ) | | | (327,645 | ) | | | (47,654 | ) | | Interest paid | | | | | | | (5,136,227 | ) | | | (5,233,019 | ) | | | (5,445,120 | ) | | | (791,960 | ) | | | | | | | | | | | | | | | | | | | | | | | | Net cash flows used in financing activities | | | | | | | (6,105,257 | ) | | | (3,398,994 | ) | | | (16,266,476 | ) | | | (2,365,860 | ) | | | | | | | | | | | | | | | | | | | | | | | | Net increase/(decrease) in cash and cash equivalents | | | | | | | 2,877,194 | | | | 4,209,089 | | | | (8,776,669 | ) | | | (1,276,515 | ) | | Cash and cash equivalents at beginning of year | | | | | | | 20,779,604 | | | | 23,848,344 | | | | 27,835,866 | | | | 4,048,559 | | | Effect of foreign exchange rate changes, net | | | | | | | 191,546 | | | | (221,567 | ) | | | 71,455 | | | | 10,394 | | | | | | | | | | | | | | | | | | | | | | | | | Cash and cash equivalents at December 31 | | | 16 | | | | 23,848,344 | | | | 27,835,866 | | | | 19,130,652 | | | | 2,782,438 | |
The accompanying notes are an integral part of these consolidated financial statements. ALUMINUM CORPORATION OF CHINA LIMITED AND ITS SUBSIDIARIES NOTES TO THE CONSOLIDATED FINANCIAL STATEMENTS(Continued) For the years ended December 31, 2015, 2016, 2017 and 20172018 (Amounts expressed in thousands of RMB unless otherwise stated)
| 1. | GENERAL INFORMATION | | | | Aluminum Corporation of China Limited (the “Company”) (中國鋁業股份有限公司) and its subsidiaries (together the “Group”) are principally engaged in the manufacture and distribution of alumina, primary aluminum and energy products. The Group is also engaged in the development of bauxite related resources, the production, fabrication and distribution of bauxite, carbon and relevant non-ferrous metal products and the trading and logistics and transport services of non-ferrous metal products and coal products. | | | | The Company is a joint stock company which is domiciled and was established on -September 10, 2001 in the People’s Republic of China (the “PRC”) with limited liability. The address of its registered office is No. 62 North Xizhimen Street, Haidian District, Beijing, the PRC. | | | | The Company’s shares have been listed on the Main Board of the Hong Kong Stock Exchange and the New York Stock Exchange since 2001. The Company also listed its A shares on the Shanghai Stock Exchange in 2007. | | | | In the opinion of the directors, the ultimate holding company and parent of the Company is Aluminum Corporation of China (“Chinalco”) (中國鋁業集團有限公司), a company incorporated and domiciled in the PRC and wholly owned by the State-owned Assets Supervision and Administration Commission of the State Council. | | | | Information about subsidiaries | | | | As at December 31, 2017, particulars of the Company’s principal subsidiaries are as follows: |
| Name | | Place of
registration and
business | | Registered
capital | | Principal activities | Percentage of
equity
attributable to
the Company | | Direct | Indirect | | Baotou Aluminum Co., Ltd. (“Baotou Aluminum“) (包頭鋁業有限公司) | | PRC/Mainland China | | 2,245,510 | | Manufacture and distribution of primary aluminum, aluminum alloy and related fabricated products and carbon products | 74.33% | - | | China Aluminum International Trading Co., Ltd. (“Chalco Trading”) (中鋁國際貿易有限公司) | | PRC/Mainland China | | 1,731,111 | | Import and export activities | 100.00% | - | | Shanxi Huasheng Aluminum Co., Ltd. (“Shanxi Huasheng“) (山西華聖鋁業有限公司) | | PRC/Mainland China | | 1,000,000 | | Manufacture and distribution of primary aluminum, aluminum alloy and carbon-related products | 51.00% | - | | Chalco Shanxi New Material Co., Ltd.(“Shanxi New Material”) (中鋁山西新材料有限公司) | | PRC/Mainland China | | 4,279,601 | | Manufacture and distribution of alumina, primary aluminum and anode carbon products and electricity generation and supply | 85.98% | - |
Aluminum Corporation of China Limited (the “Company”) (中 國 鋁 業 股 份 有 限 公 司 ) and its subsidiaries (together the “Group”) are principally engaged in the manufacture and distribution of alumina, primary aluminum and energy products. The Group is also engaged in the development of bauxite-related resources, the production, fabrication and distribution of bauxite, carbon and relevant non-ferrous metal products and the trading and logistics and transport services of non-ferrous metal products and coal products. The Company is a joint stock company which is domiciled and was established on 10 September 2001 in the People’s Republic of China (the “PRC”) with limited liability. The address of its registered office is No. 62 North Xizhimen Street, Haidian District, Beijing, the PRC. The Company’s shares have been listed on the Main Board of the Hong Kong Stock Exchange and the New York Stock Exchange since 2001. The Company also listed its A shares on the Shanghai Stock Exchange in 2007. In the opinion of the directors, the ultimate holding company and the parent of the Company is Aluminum Corporation of China (“Chinalco”) (中國鋁業集团有限公司), a company incorporated and domiciled in the PRC and wholly owned by the State-owned Assets Supervision and Administration Commission of the State Council. Information about subsidiaries Particulars of the Company’s principal subsidiaries are as follows: | Name | | Place of
registration and
business | | Registered
capital | | | Principal activities | | Percentage of equity
attributable to the
Company | | | | | | | | | | | | Direct | | | Indirect | | | Shanxi Huaxing Aluminum Co. Ltd. (“Shanxi Huaxing”) (山西華興鋁業有限公司) | | PRC/Mainland China | | | 1,850,000 | | | Manufacture and distribution of alumina | | | 60.00 | % | | | 40.00 | % | | Baotou Aluminum Co., Ltd. (“Baotou Aluminum”) (包頭鋁業有限公司) | | PRC/Mainland China | | | 2,245,510 | | | Manufacture and distribution of primary aluminum, aluminum alloy and related fabricated products and carbon products | | | 74.33 | % | | | — | | | China Aluminum International Trading Co., Ltd. (“Chalco Trading”) (中鋁國際貿易有限公司) | | PRC/Mainland China | | | 1,731,111 | | | Import and export activities | | | 100.00 | % | | | — | | | Shanxi Huasheng Aluminum Co., Ltd. (“Shanxi Huasheng”) (山西華聖鋁業有限公司) | | PRC/Mainland China | | | 1,000,000 | | | Manufacture and distribution of primary aluminum, aluminum alloy and carbon-related products | | | 51.00 | % | | | — | |
ALUMINUM CORPORATION OF CHINA LIMITED AND ITS SUBSIDIARIES NOTES TO THE CONSOLIDATED FINANCIAL STATEMENTS(Continued) For the years ended December 31, 2015, 2016, 2017 and 20172018 (Amounts expressed in thousands of RMB unless otherwise stated)
| 1. | GENERAL INFORMATION(Continued) | | | | Information about subsidiaries(Continued) |
| Name | | Place of
registration and
business | | Registered
capital | | Principal activities | Percentage of
equity attributable to
the Company | | Direct | Indirect | | Zunyi Aluminum Co., Ltd. (遵義鋁業股份有限公司) | | PRC/Mainland China | | 600,970 | | Manufacture and distribution of primary aluminum | 62.10% | - | | Chalco Zunyi Alumina Co., Ltd. (“Zunyi Alumina“) (中國鋁業遵義氧化鋁有限公司) | | PRC/Mainland China | | 1,400,000 | | Manufacture and distribution of alumina | 73.28% | - | | Shandong Huayu Alloy Materials Co., Ltd. (“Shandong Huayu”) (山東華宇铝合金材料有限公司) | | PRC/Mainland China | | 1,627,697 | | Manufacture and distribution of aluminum alloy | 55.00% | - | | Chalco Hong Kong Ltd. (“Chalco Hong Kong”) (中國鋁業香港有限公司) | | Hong Kong | | HKD849,940 in thousand | | Overseas investments and alumina import and export activities | 100.00% | - | | Chalco Mining Co., Ltd. (“Chalco Mining“) (中鋁礦業有限公司) | | PRC/Mainland China | | 4,028,859 | | Manufacture, acquisition and distribution of bauxite mines, limestone ore, manufacturing and distribution of alumina | 18.86% | - | | Chalco Energy Co., Ltd. (中鋁能源有限公司) | | PRC/Mainland China | | 819,993 | | Thermoelectric supply and investment management | 100.00% | - | | China Aluminum Ningxia Energy Group Co., Ltd. (“Ningxia Energy“) (中鋁寧夏能源集���) | | PRC/Mainland China | | 5,025,800 | | Thermal power, wind power and solar power generation, coal mining, and power-related equipment manufacturing | 70.82% | - | Guizhou Huajin Aluminum Co., Ltd. (“Guizhou Huajin“)
(貴州華錦鋁業有限公司) | | PRC/Mainland
China | | 1,000,000 | | Manufacture and distribution of alumina | 60.00% | - |
Information about subsidiaries(Continued) | | Name | | Place of registration and business | | Registered capital | | Principal activities | | Percentage of equity attributable to the Company | | | | | | | | | | | Direct | Indirect | | | Chalco Shanxi New Material Co., Ltd. (“Shanxi New Material”) (中鋁山西新材料有限公司) | | PRC/Mainland China | | 4,279,601 | | Manufacture and distribution of alumina, primary aluminum and anode carbon products and electricity generation and supply | | 85.98% | — | | | Zunyi Aluminum Co., Ltd. (遵義鋁業股份有限公司) | | PRC/Mainland China | | 3,204,899 | | Manufacture and distribution of primary aluminum and alumina | | 67.445% | — | | | Shandong Huayu Alloy Materials Co., Ltd. (“Shandong Huayu”) (山東華宇合金材料有限公司) | | PRC/Mainland China | | 1,627,697 | | Manufacture and distribution of aluminum alloy | | 55.00% | — | | | Chalco Hong Kong Ltd. (“Chalco Hong Kong”) (中國鋁業香港有限公司) | | Hong Kong | | HKD849,940 in thousand | | Overseas investments and alumina import and export activities | | 100.00% | — | | | Chalco Mining Co., Ltd. (“Chalco Mining”) (中鋁礦業有限公司) | | PRC/Mainland China | | 4,028,859 | | Manufacture, acquisition and distribution of bauxite mines, limestone ore, manufacturing and distribution of alumina | | 18.86% | — | | | Chalco Energy Co., Ltd. (中鋁能源有限公司) | | PRC/Mainland China | | 819,993 | | Thermoelectric supply and investment management | | 100.00% | — | | | China Aluminum Ningxia Energy Group Co., Ltd. (“Ningxia Energy”) (中鋁寧夏能源集團) | | PRC/Mainland China | | 5,025,800 | | Thermal power, wind power and solar power generation, coal mining, and power-related equipment manufacturing | | 70.82% | — | | | Guizhou Huajin Aluminum Co., Ltd. (“Guizhou Huajin”) (貴州華錦鋁業有限公司) | | PRC/Mainland
China | | 1,000,000 | | Manufacture and distribution of alumina | | 60.00% | — | | | Chalco Zhengzhou Research Institute of Non-ferrous Metal Co., Ltd. (中國鋁業鄭州有色金屬研究院有限公司) | | PRC/Mainland
China | | 214,858 | | Research and development services | | 100.00% | — | | | Chalco Shandong Co., Ltd. (“Chalco Shandong”) (中鋁山東有限公司) | | PRC/Mainland
China | | 3,808,995 | | Manufacture and distribution of alumina | | 69.20% | — |
ALUMINUM CORPORATION OF CHINA LIMITED AND ITS SUBSIDIARIES NOTES TO THE CONSOLIDATED FINANCIAL STATEMENTS(Continued) For the years ended December 31, 2015, 2016, 2017 and 20172018 (Amounts expressed in thousands of RMB unless otherwise stated)
| 1. | GENERAL INFORMATION(Continued) | | | | |
Information about subsidiaries(Continued) |
| Name | | Place of
registration and
business | | Registered
capital | | Principal activities | Percentage of
equity
attributable to
the Company |
| Direct | Indirect |
| Chalco Zhengzhou Research Institute of Non-ferrous Metal Co., Ltd. (中國鋁業鄭州有色金屬研究院有限公司) | | PRC/Mainland
China | | 214,858 | | Research and development services | 100.00% | - |
| Chalco Shandong Co., Ltd. ("Chalco Shandong“) (中鋁山東有限公司) | | PRC/Mainland
China | | 3,808,995 | | Manufacture and distribution of alumina | 69.20% | - |
| Chalco Zhongzhou Aluminum Co., Ltd. ("Zhongzhou Aluminum“) (中鋁中州鋁業有限公司) | | PRC/Mainland
China | | 5,071,235 | | Manufacture and distribution of alumina | 63.10% | - |
| China Aluminum Logistics Group Corporation Co., Ltd. (中鋁物流集團有限公司) | | PRC/Mainland
China | | 558,752 | | Logistic transportation | 100.00% | - |
| Chinalco Shanxi Jiaokou Xinghua Technology Ltd.(“Xinghua Technology“) (中鋁集團山西交口興華科技股份有限公司) | | PRC/Mainland
China | | 270,000 | | Manufacture and distribution of primary aluminum | 33.00% | 33.00% |
| Chinalco Shanghai Company Limited (“Chinalco Shanghai“) (中鋁(上海)有限公司) | | PRC/Mainland
China | | 968,300 | | Trading and engineering project management | 100.00% | - |
| | Name | | Place of registration and business | | Registered capital | | Principal activities | | Percentage of equity attributable to the Company |
| | | | | | | | | | Direct | Indirect |
| | Chalco Zhongzhou Aluminum Co., Ltd. (“Zhongzhou Aluminum”) (中鋁中州鋁業有限公司) | | PRC/Mainland
China | | 5,071,235 | | Manufacture and distribution of alumina | | 63.10% | — |
| | China Aluminum Logistics Group Corporation Co., Ltd. (中鋁物流集團有限公司) | | PRC/Mainland
China | | 558,752 | | Logistic transportation | | 100.00% | — |
| | Chinalco Shanxi Jiaokou Xinghua Technology Ltd. (“Xinghua Technology”) (中鋁集團山西交口興華科技股份有限公司) | | PRC/Mainland
China | | 270,000 | | Manufacture and distribution of primary aluminum | | 33.00% | 33.00% |
| | Chinalco Shanghai Company Limited (“Chinalco Shanghai”) (中鋁(上海)有限公司) | | PRC/Mainland
China | | 968,300 | | Trading and engineering project management | | 100.00% | — |
| | Shanxi China Huarun Co., Ltd. (“Shanxi Huarun”) (山西中鋁華潤有限公司) | | PRC/Mainland
China | | 1,641,750 | | Manufacture and distribution of primary aluminum | | 40.00% | — |
| | Guizhou Huaren New Material Co., Ltd. (“Guizhou Huaren”) (貴州華仁新材料有限公司) | | PRC/Mainland
China | | 1,200,000 | | Manufacture and distribution of primary aluminum | | 40.00% | — |
| | China Aluminum International Trading Group Co. Ltd. (中鋁國際貿易集團有限公司) | | PRC/Mainland
China | | 1,030,000 | | Import and export activities | | 100.00% | — |
| | Chalco Materials Co. Ltd. (中鋁物資有限公司) | | PRC/Mainland
China | | 1,000,000 | | Purchase materials | | 100.00% | — |
The above table lists the subsidiaries of the Company which, in the opinion of the directors, principally affected the results of the year or formed a substantial part of the net assets of the Group. To give details of the other subsidiaries would, in the opinion of the directors, result in particulars of excessive length.
| * | The above table listsEnglish names represent the subsidiariesbest effort made by management of the Company which,Group in translating the opinion of the directors, principally affected the results of the year or formed a substantial part of the net assets of the Group. To give details of the other subsidiaries would, in the opinion of the directors, result in particulars of excessive of length.subsidiaries’ Chinese name as they do not have any official English names. |
ALUMINUM CORPORATION OF CHINA LIMITED AND ITS SUBSIDIARIES
NOTES TO THE CONSOLIDATED FINANCIAL STATEMENTS(Continued)
For the years ended December 31, 2015, 2016, 2017 and 20172018
(Amounts expressed in thousands of RMB unless otherwise stated)
| 2. | BASIS OF PREPARATION AND SIGNIFICANT ACCOUNTING POLICIES |
The principal accounting policies applied in the preparation of these financial statements are set out below. These policies have been consistently applied to all the years presented, unless otherwise stated.
| | |
| The principal accounting policies applied in the preparation of these financial statements are set out below. These policies have been consistently applied to all the years presented, unless otherwise stated. |
| | |
| 2.1 | Basis of preparation |
| | |
| | The consolidated financial statements have been prepared in accordance with International Financial Reporting Standards (“IFRSs“) issued by the International Accounting Standards Board (the “IASB“) and the disclosure requirements of the Hong Kong Companies Ordinance. They have been prepared on a historical cost basis, except for available-for-sale financial investments and financial assets and liabilities at fair value through profit or loss which have been measured at fair value. |
| | |
| | These financial statements are presented in thousands of Chinese Renminbi (“RMB“) unless otherwise stated. |
The consolidated financial statements have been prepared in accordance with International Financial Reporting Standards (“IFRSs”) issued by the International Accounting Standards Board (the “IASB”) and the disclosure requirements of the Hong Kong Companies Ordinance. They have been prepared under the historical cost convention, except for equity investments at fair value through other comprehensive income and financial assets and liabilities at fair value through profit or loss which have been measured at fair value.
These financial statements are presented in thousands of Chinese Renminbi (“RMB”) unless otherwise stated.
ALUMINUM CORPORATION OF CHINA LIMITED AND ITS SUBSIDIARIES
NOTES TO THE CONSOLIDATED FINANCIAL STATEMENTS(Continued)
For the years ended December 31, 2015, 2016, 2017 and 20172018
(Amounts expressed in thousands of RMB unless otherwise stated)
| 2. | BASIS OF PREPARATION AND SIGNIFICANT ACCOUNTING POLICIES(Continued) |
| | | |
| 2.1 | Basis of preparation(Continued) |
Going concern
As at December 31, 2018, the Group’s current liabilities exceeded its current assets by approximately RMB15,853 million (December 31, 2017: RMB21,693 million). The directors of the Company have considered the Group’s available sources of funds as follows:
| | | |
| | Going concern |
| | | |
| | As at December 31, 2017, the Group’s current liabilities exceeded its current assets by approximately RMB21,628 (December 31, 2016: RMB16,693 million). The directors of the Company have considered the Group’s available sources of funds as follows: |
| | | |
| | •● | The Group’s expected net cash inflows from operating activities in 2018;2019; |
| | | |
| | •● | Unutilized banking facilities of approximately RMB82,666RMB121,518 million as at December 31, 2017,2018, of which amounts totaling RMB56,104totalling RMB92,582 million will be subject to renewal during the next 12 months. The directors of the Company are confident that these banking facilities could be renewed upon expiration based on the Group’s past experience and good credit standing; and |
| | | |
| | •● | Other available sources of financing from banks and other financial institutions given the Group’s credit history. |
The directors of the Company believe that the Group has adequate resources to continue operations for the foreseeable future of not less than 12 months from December 31, 2018. The directors of the Company therefore are of the opinion that it is appropriate to adopt the going concern basis in preparing the consolidated financial statements.
Consolidation
The consolidated financial statements comprise the financial statements of the Company and all of its subsidiaries for the year ended December 31, 2018. Control is achieved when the Group is exposed, or has rights, to variable returns from its involvement with the investee and has the ability to affect those returns through its power over the investee. Specifically, the Group controls an investee if and only if the Group has:
| | | |
| | The directors of the Company believe that the Group has adequate resources to continue operation for the foreseeable future of not less than 12 months from December 31, 2017. The directors of the Company therefore are of the opinion that it is appropriate to adopt the going concern basis in preparing the consolidated financial statements. |
| | | |
| | Consolidation |
| | | |
| | The consolidated financial statements comprise the financial statements of the Company and all of its subsidiaries for the year ended December 31, 2017. Control is achieved when the Group is exposed, or has rights, to variable returns from its involvement with the investee and has the ability to affect those returns through its power over the investee. Specifically, the Group controls an investee if and only if the Group has: |
| | | |
| | •● | Power over the investee (i.e.(i.e, existing rights that give it the current ability to direct the relevant activities of the investee); |
| | | |
| | •● | Exposure, or rights, to variable returns from its involvement with the investee; and |
| | | |
| | •● | The ability to use its power over the investee to affect its returns. |
ALUMINUM CORPORATION OF CHINA LIMITED AND ITS SUBSIDIARIES
NOTES TO THE CONSOLIDATED FINANCIAL STATEMENTS(Continued)
For the years ended December 31, 2015, 2016, 2017 and 20172018
(Amounts expressed in thousands of RMB unless otherwise stated)
| 2. | BASIS OF PREPARATION AND SIGNIFICANT ACCOUNTING POLICIES(Continued) |
| | | |
| 2.1 | Basis of preparation(Continued) |
Consolidation(Continued)
Generally, there is a presumption that a majority of voting rights result in control. To support this presumption and when the Group has less than a majority of the voting or similar rights of an investee, the Group considers all relevant facts and circumstances in assessing whether it has power over an investee, including:
| | | |
| | Consolidation(Continued) |
| | | |
| | Generally, there is a presumption that a majority of voting rights result in control. To support this presumption and when the Group has less than a majority of the voting or similar rights of an investee, the Group considers all relevant facts and circumstances in assessing whether it has power over an investee, including: |
| | | |
| | •● | The contractual arrangement with the other vote holders of the investee; |
| | | |
| | •● | Rights arising from other contractual arrangements; and |
| | | |
| | •● | The Group’s voting rights and potential voting rights. |
| | | |
| | The Group reassesses whether or not it controls an investee if facts and circumstances indicate that there are changes to one or more of the three elements of control. Consolidation of a subsidiary begins when the Group obtains control over the subsidiary and ceases when the Group loses control of the subsidiary. Assets, liabilities, income and expenses of a subsidiary acquired or disposed of during the year are included in the consolidated statement of comprehensive income from the date the Group gains control until the date the Group ceases to control the subsidiary. |
| | | |
| | Profit or loss and each component of other comprehensive income (“OCI“) are attributed to the equity holders of the parent of the Group and to the non-controlling interests, even if this results in the non-controlling interests having a deficit balance. When necessary, adjustments are made to the financial statements of subsidiaries to bring their accounting policies into line with the Group’s accounting policies. All intra-group assets and liabilities, equity, income, expenses and cash flows relating to transactions between members of the Group are eliminated in full on consolidation. |
The Group reassesses whether or not it controls an investee if facts and circumstances indicate that there are changes to one or more of the three elements of control. Consolidation of a subsidiary begins when the Group obtains control over the subsidiary and ceases when the Group loses control of the subsidiary. The financial statements of the subsidiaries are prepared for the same reporting period as the Company using consistent accounting policies. Assets, liabilities, income and expenses of a subsidiary acquired or disposed of during the year are included in the consolidated statement of financial position and consolidated statement of profit or loss and other comprehensive income from the date the Group gains control until the date the Group ceases to control the subsidiary.
Profit or loss and each component of other comprehensive income (“OCI”) are attributed to the equity holders of the parent of the Group and to the non-controlling interests, even if this results in the non-controlling interests having a deficit balance. All intra-group assets and liabilities, equity, income, expenses and cash flows relating to transactions between members of the Group are eliminated in full on consolidation.
ALUMINUM CORPORATION OF CHINA LIMITED AND ITS SUBSIDIARIES
NOTES TO THE CONSOLIDATED FINANCIAL STATEMENTS(Continued)
For the years ended December 31, 2015, 2016, 2017 and 20172018
(Amounts expressed in thousands of RMB unless otherwise stated)
| 2. | BASIS OF PREPARATION AND SIGNIFICANT ACCOUNTING POLICIES(Continued) |
| | | |
| 2.1 | Basis of preparation(Continued) |
Consolidation(Continued)
A change in the ownership interest of a subsidiary, without a loss of control, is accounted for as an equity transaction. If the Group loses control over a subsidiary, it:
| | | |
| | Consolidation(Continued) |
| | | |
| | A change in the ownership interest of a subsidiary, without a loss of control, is accounted for as an equity transaction. If the Group loses control over a subsidiary, it: |
| | | |
| | •● | Derecognizes the assets (including goodwill) and liabilities of the subsidiary; |
| | | |
| | •● | Derecognizes the carrying amount of any non-controlling interests; |
| | | |
| | •● | Derecognizes the cumulative translation differences recorded in equity; |
| | | |
| | •● | Recognizes the fair value of the consideration received; |
| | | |
| | •● | Recognizes the fair value of any investment retained; |
| | | |
| | •● | Recognizes any surplus or deficit in profit or loss; and |
| | | |
| | •● | Reclassifies the parent’s share of components previously recognized in OCI to profit or loss or retained earnings, as appropriate, as would be required if the Group had directly disposed of the related assets or liabilities. |
| (a) | | |
| | (a) | Merger accounting for business combinations under common control |
| | | |
| | | The consolidated financial statements incorporate the financial statements of the combining entities or businesses in which the common control combination occurs as if they had been combined from the date when the combining entities or businesses first came under the control of the ultimate holding company. |
| | | |
| | | The net assets of the combining entities or businesses are combined using the carrying amount from the ultimate holding company’s perspective. No amount is recognized in consideration for goodwill or excess of the acquirers’ interest in the book value of the net assets over cost at the time of the common control combination, to the extent of the continuation of the ultimate holding company’s interest. |
The consolidated financial statements incorporate the financial statements of the combining entities or businesses in business combinations under common control as if they had been combined from the date when the combining entities or businesses first came under the control of the ultimate holding company.
The net assets of the combining entities or businesses are consolidated using the carrying amount from the ultimate holding company’s perspective . No amount is recognized for goodwill or the excess of the Group’s interest in the book value of the net assets over cost at the time of the common control combination, to the extent of the continuation of the ultimate holding company’s interest.
ALUMINUM CORPORATION OF CHINA LIMITED AND ITS SUBSIDIARIES
NOTES TO THE CONSOLIDATED FINANCIAL STATEMENTS(Continued)
For the years ended December 31, 2015, 2016, 2017 and 20172018
(Amounts expressed in thousands of RMB unless otherwise stated)
2. | BASIS OF PREPARATION AND SIGNIFICANT ACCOUNTING POLICIES(Continued) |
| | | |
| 2.1 | Basis of preparation(Continued) |
| | | |
| | Consolidation(Continued) |
| | | |
| | (a) | Merger accounting for business combinations under common control(Continued) |
| | | |
| | | The consolidated statement of comprehensive income includes the results of each of the combining entities or businesses from the earliest date presented or since the date when the combining entities or businesses first came under common control, where this is a shorter period, regardless of the date of the common control combination. |
| | | |
| | | The comparative financial data have been retrospectively adjusted to reflect the business combinations under common control occurred during this year as disclosed in note 38. |
| | | |
| | | Transaction costs, including professional fees, registration fees, costs of furnishing information to shareholders, costs or losses incurred in combining operations of the previously separate businesses and etc., incurred in relation to the common control combination that is to be accounted for by using the merger accounting method are recognized as expenses in the period in which they are incurred. |
| | | |
| | (b) | Acquisition method of accounting for other business combinations |
| | | |
| | | The acquisition method of accounting is used to account for the acquisition of subsidiaries by the Group, other than common control combinations. The considerations transferred for the acquisition of a subsidiary are the fair values of the assets transferred, the liabilities incurred to the former owners of the acquiree and the equity interests issued by the Group. The consideration transferred includes the fair value of any asset or liability resulting from a contingent consideration arrangement. Acquisition-related costs are expensed as incurred. Identifiable assets acquired and liabilities and contingent liabilities assumed in a business combination are measured initially at their fair values at the acquisition date. On an acquisition-by-acquisition basis, the Group recognizes any non-controlling interest in the acquiree at the non-controlling interest’s proportionate share of the recognized amounts of the acquiree’s identifiable net assets. The excess of the consideration transferred, the amount recognized for non-controlling interest in the acquiree and the acquisition-date fair value of any previous equity interest in the acquiree over the fair value of the identifiable net assets acquired is recorded as goodwill. |
ALUMINUM CORPORATION OF CHINA LIMITED AND ITS SUBSIDIARIES
NOTES TO THE CONSOLIDATED FINANCIAL STATEMENTS(Continued)
For the years ended December 31, 2015, 2016 and 2017
(Amounts expressed in thousands of RMB unless otherwise stated)
2. | BASIS OF PREPARATION AND SIGNIFICANT ACCOUNTING POLICIES(Continued) |
| | | | |
| 2.1 | Basis of preparation(Continued) |
| | | | |
| | Consolidation(Continued) |
| | | | |
| | (c) | Subsidiaries |
| | | | |
| | | A subsidiary is an entity, directly or indirectly, controlled by the Company. Control is achieved when the Group is exposed, or has rights, to variable returns from its involvement with the investee and has the ability to affect those returns through its power over the investee (i.e., existing rights that give the Group the current ability to direct the relevant activities of the investee). |
| | | | |
| | | When the Company has, directly or indirectly, less than a majority of the voting or similar rights of an investee, the Group considers all relevant facts and circumstances in assessing whether it has power over an investee, including: |
| | | | |
| | | (a) | the contractual arrangement with the other vote holders of the investee; |
| | | | |
| | | (b) | rights arising from other contractual arrangements; and |
| | | | |
| | | (c) | the Group’s voting rights and potential voting rights. |
| | | | |
| | | Subsidiaries are fully consolidated from the date on which control is transferred to the Group. They are de-consolidated from the date that control ceases. |
| | | | |
| | | Inter-company transactions, balances, income and expenses on transactions between group companies are eliminated. Profits and losses resulting from inter-company transactions that are recognized in assets are also eliminated. Amounts reported by subsidiaries have been changed where necessary in the consolidated financial statements to conform with the policies adopted by the Group. |
| | | | |
| | | In the Company’s statement of financial position, as permitted under IFRS 1, the investments in subsidiaries acquired prior to January 1, 2008, being the date of transition to IFRS, are stated at deemed cost as required under the previously adopted accounting standards. Subsidiaries acquired after that date that are not classified as held for sale in accordance with IFRS 5Non-current Assets Held for Sale and Discontinued Operations are stated at cost less provision for impairment losses. The results of subsidiaries are accounted for by the Company on the basis of dividends received and receivable. |
ALUMINUM CORPORATION OF CHINA LIMITED AND ITS SUBSIDIARIES
NOTES TO THE CONSOLIDATED FINANCIAL STATEMENTS(Continued)
For the years ended December 31, 2015, 2016 and 2017
(Amounts expressed in thousands of RMB unless otherwise stated)
2. | BASIS OF PREPARATION AND SIGNIFICANT ACCOUNTING POLICIES(Continued) |
| | |
| 2.2 | Changes in accounting policies and disclosures |
| | |
| | The Group has adopted the following revised IFRSs for the first time for the current year’s financial statements. |
Amendments to IAS 7 | Disclosure Initiative |
Amendments to IAS 12 | Recognition of Deferred Tax Assets for Unrealized Losses |
Amendments to IFRS 12 included inAnnual Improvements to IFRSs 2014-2016 Cycle | Disclosure of Interests in Other Entities: Clarification of the Scope of IFRS 12 |
| None of the above amendments to IFRSs has had a significant financial effect on these financial statements. Disclosure has been made in note 34(b) to the financial statements upon the adoption of amendments to IAS 7, which require an entity to provide disclosures that enable users of financial statements to evaluate changes in liabilities arising from financing activities, including both changes arising from cash flows and non-cash changes. |
| |
| The nature and the impact of the amendments are described below: |
| |
| Amendments to IAS 7Disclosure Initiative |
| |
| Amendments to IAS 7 require an entity to provide disclosures that enable users of financial statements to evaluate changes in liabilities arising from financing activities, including both changes arising from cash flows and non-cash changes. Disclosure of the changes in liabilities arising from financing activities is provided in note 34 to the financial statements. |
ALUMINUM CORPORATION OF CHINA LIMITED AND ITS SUBSIDIARIES
NOTES TO THE CONSOLIDATED FINANCIAL STATEMENTS(Continued)
For the years ended December 31, 2015, 2016 and 2017
(Amounts expressed in thousands of RMB unless otherwise stated)
2. | BASIS OF PREPARATION AND SIGNIFICANT ACCOUNTING POLICIES(Continued) |
| | |
| 2.2 | Changes in accounting policies and disclosures(Continued) |
| | |
| | Amendments to IAS 12Recognition of Deferred Tax Assets for Unrealized Losses |
| | |
| | Amendments to IAS 12 clarify that an entity, when assessing whether taxable profits will be available against which it can utilize a deductible temporary difference, needs to consider whether tax law restricts the sources of taxable profits against which it may make deductions on the reversal of that deductible temporary difference. Furthermore, the amendments provide guidance on how an entity should determine future taxable profits and explain the circumstances in which taxable profit may include the recovery of some assets for more than their carrying amount. The amendments have had no impact on the financial position or performance of the Group as the Group has no deductible temporary differences or assets that are in the scope of the amendments. |
| | |
| | Amendments to IFRS 12 included in Annual Improvements to IFRSs 2014-2016 CycleDisclosure of Interests in Other Entities: Clarification of the Scope of IFRS 12 |
| | |
| | Amendments to IFRS 12 clarify that the disclosure requirements in IFRS 12, other than those disclosure requirements in paragraphs B10 to B16 of IFRS 12, apply to an entity’s interest in a subsidiary, a joint venture or an associate, or a portion of its interest in a joint venture or an associate that is classified as held for sale or included in a disposal group classified as held for sale. The amendments have had no impact on the Group’s financial statements as the Group did not have any disposal group held for sale at the end of the year. |
ALUMINUM CORPORATION OF CHINA LIMITED AND ITS SUBSIDIARIES
NOTES TO THE CONSOLIDATED FINANCIAL STATEMENTS(Continued)
For the years ended December 31, 2015, 2016 and 2017
(Amounts expressed in thousands of RMB unless otherwise stated)
| 2. | BASIS OF PREPARATION AND SIGNIFICANT ACCOUNTING POLICIES(Continued) |
| 2.32.1 | Issued but not yet effective financial reporting standardsBasis of preparation(Continued) |
| | |
| | The Group has not applied the following new and revised IFRSs that have been issued but are not yet effective, in these financial statements: |
Consolidation(Continued)
| (a) | Merger accounting for business combinations under common control (Continued) |
The consolidated statement of profit or loss and other comprehensive income includes the results of each of the combining entities or businesses from the earliest date presented or since the date when the combining entities or businesses first came under common control, where this is a shorter period, regardless of the date of the common control combination.
The comparative financial data have been restated to reflect the business combinations under common control which occurred during this year as disclosed in note 38.
Transaction costs, including professional fees, registration fees, costs of furnishing information to shareholders, costs or losses incurred in combining operations of the previously separate businesses and other costs incurred in relation to the common control combination that is to be accounted for by using the merger accounting method are recognized as expenses in the period in which they are incurred.
| (b) | Acquisition method of accounting for other business combinations |
The acquisition method of accounting is used to account for the acquisition of subsidiaries by the Group, other than common control combinations. The considerations transferred for the acquisition of a subsidiary are the fair values of the assets transferred, the liabilities incurred to the former owners of the acquiree and the equity interests issued by the Group. The consideration transferred includes the fair value of any asset or liability resulting from a contingent consideration arrangement. Acquisition-related costs are expensed as incurred. Identifiable assets acquired and liabilities and contingent liabilities assumed in a business combination are measured initially at their fair values at the acquisition date. On an acquisition-by-acquisition basis, the Group recognizes any non-controlling interest in the acquiree at the non-controlling interest’s proportionate share of the recognized amounts of the acquiree’s identifiable net assets. The excess of the consideration transferred, the amount recognized for non-controlling interest in the acquiree and the acquisition-date fair value of any previous equity interest in the acquiree over the fair value of the identifiable net assets acquired is recorded as goodwill.
For each business combination, the Group elects whether to measure the non-controlling interests in the acquiree that are present ownership interests and entitle their holders to a proportionate share of net assets in the event of liquidation at fair value or at the proportionate share of the acquiree’s identifiable net assets. All other components of non-controlling interests are measured at fair value. Acquisition-related costs are expensed as incurred.
When the Group acquires a business, it assesses the financial assets and liabilities assumed for appropriate classification and designation in accordance with the contractual terms, economic circumstances and pertinent conditions as at the acquisition date. This includes the separation of embedded derivatives in host contracts of the acquiree.
If the business combination is achieved in stages, the previously held equity interest is remeasured at its acquisition date fair value and any resulting gain or loss is recognized in profit or loss.
Any contingent consideration to be transferred by the acquirer is recognized at fair value at the acquisition date. Contingent consideration classified as an asset or liability is measured at fair value with changes in fair value recognized in profit or loss. Contingent consideration that is classified as equity is not remeasured and subsequent settlement is accounted for within equity.
ALUMINUM CORPORATION OF CHINA LIMITED AND ITS SUBSIDIARIES
NOTES TO THE CONSOLIDATED FINANCIAL STATEMENTS(Continued)
For the years ended December 31, 2016, 2017 and 2018
(Amounts expressed in thousands of RMB unless otherwise stated)
| 2. | BASIS OF PREPARATION AND SIGNIFICANT ACCOUNTING POLICIES(Continued) |
| 2.1 | Basis of preparation(Continued) |
Consolidation(Continued)
A subsidiary is an entity, directly or indirectly, controlled by the Company. Control is achieved when the Group is exposed, or has rights, to variable returns from its involvement with the investee and has the ability to affect those returns through its power over the investee (i.e., existing rights that give the Group the current ability to direct the relevant activities of the investee).
When the Company has, directly or indirectly, less than a majority of the voting or similar rights of an investee, the Group considers all relevant facts and circumstances in assessing whether it has power over an investee, including:
| (a) | the contractual arrangement with the other vote holders of the investee; |
| (b) | rights arising from other contractual arrangements; and |
| (c) | the Group’s voting rights and potential voting rights. |
Subsidiaries are fully consolidated from the date on which control is transferred to the Group. They are de-consolidated from the date that control ceases.
Inter-company transactions, balances, income and expenses on transactions between group companies are eliminated. Profits and losses resulting from inter-company transactions that are recognized in assets are also eliminated. Amounts reported by subsidiaries have been adjusted where necessary in the consolidated financial statements to conform with the policies adopted by the Group.
In the Company’s statement of financial position, as permitted under IFRS 1, the investments in subsidiaries acquired prior to January 1, 2008, being the date of transition to IFRS, are stated at deemed cost as required under the previously adopted accounting standards. Subsidiaries acquired after that date that are not classified as held for sale in accordance with IFRS 5Non-current Assets Held for Sale and Discontinued Operations are stated at cost less provision for impairment losses. The results of subsidiaries are accounted for by the Company on the basis of dividends received and receivable.
ALUMINUM CORPORATION OF CHINA LIMITED AND ITS SUBSIDIARIES
NOTES TO THE CONSOLIDATED FINANCIAL STATEMENTS(Continued)
For the years ended December 31, 2016, 2017 and 2018
(Amounts expressed in thousands of RMB unless otherwise stated)
| 2. | BASIS OF PREPARATION AND SIGNIFICANT ACCOUNTING POLICIES(Continued) |
| 2.2 | Changes in accounting policies and disclosures |
The Group has adopted the following new and revised IFRSs for the first time for the current year’s financial statements.
| Amendments to IFRS 2 | Classification and Measurement of Share-based Payment Transactions1 |
| Amendments to IFRS 4 | Applying IFRS 9 Financial Instruments with IFRS 4 Insurance Contracts1 |
| IFRS 9 | Financial Instruments1 |
Amendments to IFRS 9 | Prepayment Features with Negative Compensation2 |
Amendments to IFRS 10 and IAS 28 | Sale or Contribution of Assets between an Investor and its Associate or Joint Venture4 |
| IFRS 15 | Revenue from Contracts with Customers1 |
| Amendments to IFRS 15 | Clarifications to IFRS 15 Revenue from Contracts with Customers1 |
IFRS 16 | Leases2 |
IFRS 17 | Insurance Contracts3 |
Amendments to IAS 19 | Employee Benefits2 |
Amendments to IAS 28 | Long-term Interests in Associates and Joint Ventures2 |
| Amendments to IAS 40 | Transfers of Investment Property1 |
IFRIC-Int | IFRIC 22 | Foreign Currency Transactions and Advance Consideration1 |
IFRIC-Int 23 | Uncertainty over Income Tax Treatments2 |
| Annual Improvements 2014-2016 Cycle | Amendments to IFRS 1 and IAS 281 |
Except for the amendments to IFRS 4 and Annual Improvements 2014-2016 Cycle, which are not relevant to the preparation of the Group’s financial statements, the nature and the impact of the new and revised IFRSs are described below:
Annual Improvements2015-2017 Cycle
| (a) | Amendments to IFRS 3, IFRS 11, IAS 122 address three main areas: the effects of vesting conditions on the measurement of a cash-settled share-based payment transaction; the classification of a share-based payment transaction with net settlement features for withholding a certain amount in order to meet an employee’s tax obligation associated with the share-based payment; and IAS 232 |
| accounting where a modification to the terms and conditions of a share-based payment transaction changes its classification from cash-settled to equity-settled. The amendments clarify that the approach used to account for vesting conditions when measuring equity-settled share-based payments also applies to cash-settled share-based payments. The amendments introduce an exception so that a share-based payment transaction with net share settlement features for withholding a certain amount in order to meet the employee’s tax obligation is classified in its entirety as an equity-settled share-based payment transaction when certain conditions are met. Furthermore, the amendments clarify that if the terms and conditions of a cash-settled share-based payment transaction are modified, with the result that it becomes an equity-settled share-based payment transaction, the transaction is accounted for as an equity-settled transaction from the date of the modification. The amendments have had no impact on the financial position or performance of the Group as the Group does not have any cash-settled share-based payment transactions and has no share-based payment transactions with net settlement features for withholding tax. |
1 | Effective(b) | IFRS 9 Financial Instruments replaces IAS 39 Financial Instruments: Recognition and Measurement for annual periods beginning on or after January 1, 2018, |
2 | Effective bringing together all three aspects of the accounting for annual periods beginning on or after January 1, 2019 |
3 | Effective for annual periods beginning on or after January 1, 2021 |
4 | No mandatory effective date yet determined but available for adoptionfinancial instruments: classification and measurement, impairment and hedge accounting. |
The Group has recognized the transition adjustments against the applicable opening balances in equity at January 1, 2018. Therefore, the comparative information was not restated and continues to be reported under IAS 39.
Classification and measurement
The following information sets out the impacts of adopting IFRS 9 on the consolidated statement of financial position, including the effect of replacing IAS 39’s incurred credit loss calculations with IFRS 9’s expected credit losses (“ECLs”).
ALUMINUM CORPORATION OF CHINA LIMITED AND ITS SUBSIDIARIES
NOTES TO THE CONSOLIDATED FINANCIAL STATEMENTS(Continued)
For the years ended December 31, 2015, 2016, 2017 and 20172018
(Amounts expressed in thousands of RMB unless otherwise stated)
| 2. | BASIS OF PREPARATION AND SIGNIFICANT ACCOUNTING POLICIES(Continued) |
| | | |
| 2.32.2 | Issued but not yet effective financial reporting standardsChanges in accounting policies and disclosures(Continued) |
| | | |
| | Further information about those IFRSs that are expected to be applicable to the Group is described below. Of those standards, IFRS 9 and IFRS 15 will be applicable for the Group’s financial year ending December 31, 2018 and are expected to have some impact upon adoption. Whilst management has performed a detailed assessment of the estimated impacts of these standards, that assessment is based on the information currently available to the Group. The actual impacts upon adoption could be different to those below, depending on additional reasonable and supportable information being made available to the Group at the time of applying the standards. |
| | | |
| | IFRS 9Financial Instruments |
| | | |
| | In July 2014, the IASB issued the final version of IFRS 9, bringing together all phases of the financial instruments project to replace IAS 39 and all previous versions of IFRS 9. The standard introduces new requirements for classification and measurement, impairment and hedge accounting. The Group will adopt IFRS 9 from January 1, 2018. The Group will not restate comparative information and will recognize any transition adjustments against the opening balance of equity at January 1, 2018. During 2017, the Group has performed a detailed assessment of the impact of the adoption of IFRS 9. The expected impacts relate to the classification and measurement and the impairment requirements and are summarized as follows: |
| | | |
| | (a) | Classification and measurement |
| | | |
| | | The Group does not expect that the adoption of IFRS 9 will have a significant impact on the classification and measurement of its financial assets. It expects to continue measuring at fair value all financial assets currently held at fair value. Equity investments currently held as available for sale will be measured at fair value through other comprehensive income as the investments are intended to be held for the foreseeable future and the Group expects to apply the option to present fair value changes in other comprehensive income. Gains and losses recorded in other comprehensive income for the equity investments cannot be recycled to profit or loss when the investments are derecognized. |
| | | |
| | (b) | Impairment |
| | | |
| | | IFRS 9 requires an impairment on debt instruments recorded at amortized cost or at fair value through other comprehensive income, lease receivables, loan commitments and financial guarantee contracts that are not accounted for at fair value through profit or loss under IFRS 9, to be recorded based on an expected credit loss model either on a twelve-month basis or a lifetime basis. The Group will apply the simplified approach and record lifetime expected losses that are estimated based on the present value of all cash shortfalls over the remaining life of all of its trade receivables. Furthermore, the Group will apply the general approach and record twelve-month expected credit losses that are estimated based on the possible default events on its other receivables within the next twelve months. The effect of adoption on the Group’s financial statements is not expected to be material. |
(b)(Continued)
A reconciliation between the carrying amounts under IAS 39 and the balances reported under IFRS 9 as at January 1, 2018 is as follows:
| | | | | IAS 39 | | | | | | | | | | | | IFRS 9 | |
| | | | | measurement | | | | | | | | | | | | measurement | |
| | | Notes | | Category | | Amount | | | Re-classification | | | ECL | | | Fair value
adjustment | | | Amount | | | Category | |
| | | | | | | | RMB’000 | | | | RMB’000 | | | | RMB’000 | | | | RMB’000 | | | | RMB’000 | | | | |
| Assets | | | | | | | | | | | | | | | | | | | | | | | | | | | |
| Financial assets | | | | | | | | | | | | | | | | | | | | | | | | | | | |
| Trade and notes receivables | | | | L&R | | | 8,008,937 | | | | — | | | | (112,407 | ) | | | — | | | | 7,896,530 | | | AC | |
| Other current assets | | | | L&R | | | 6,487,548 | | | | — | | | | (38,502 | ) | | | — | | | | 6,449,046 | | | AC | |
| Other non-current assets | | | | L&R | | | 261,156 | | | | — | | | | — | | | | — | | | | 261,156 | | | AC | |
| Financial Assets at fair value through profit or loss | | | | FVPL | | | 9,534 | | | | — | | | | — | | | | — | | | | 9,534 | | | FVPL | |
| Cash and cash equivalents | | | | L&R | | | 27,835,866 | | | | — | | | | — | | | | — | | | | 27,835,866 | | | AC | |
| Restricted cash | | | | L&R | | | 2,168,192 | | | | — | | | | — | | | | — | | | | 2,168,192 | | | AC | |
| Available-for-sale financial investments | | (i) | | AFS | | | 1,928,201 | | | | (1,928,201 | ) | | | — | | | | — | | | | — | | | N/A | |
| Equity investments designated at fair value through other comprehensive income | | (i) | | N/A | | | — | | | | 1,928,201 | | | | — | | | | 15,114 | | | | 1,943,315 | | | FVOCI
(Equity) | |
| | | | | | | | 46,699,434 | | | | — | | | | (150,909 | ) | | | 15,114 | | | | 46,563,639 | | | | |
| | | | | | | | | | | | | | | | | | | | | | | | | | | | |
| Total assets | | | | | | | 199,816,799 | | | | — | | | | (150,909 | ) | | | 15,114 | | | | 199,681,004 | | | | |
| Liabilities | | | | | | | | | | | | | | | | | | | | | | | | | | | |
| Other liabilities | | | | | | | | | | | | | | | | | | | | | | | | | | | |
| Deferred tax liabilities | | | | | | | 993,742 | | | | — | | | | — | | | | 3,641 | | | | 997,383 | | | | |
| | | | | | | | | | | | | | | | | | | | | | | | | | | | |
| Total Liabilities | | | | | | | 134,074,203 | | | | — | | | | — | | | | 3,641 | | | | 134,077,844 | | | | |
1L&R: Loans and receivables
2AC: Financial assets or financial liabilities at amortized cost
3FVPL: Financial assets at fair value through profit or loss
4AFS: Available-for-sale investments
5FVOCI: Financial assets at fair value through other comprehensive income
ALUMINUM CORPORATION OF CHINA LIMITED AND ITS SUBSIDIARIES
NOTES TO THE CONSOLIDATED FINANCIAL STATEMENTS(Continued)
For the years ended December 31, 2015, 2016, 2017 and 20172018
(Amounts expressed in thousands of RMB unless otherwise stated)
| 2. | BASIS OF PREPARATION AND SIGNIFICANT ACCOUNTING POLICIES(Continued) |
| 2.2 | Changes in accounting policies and disclosures(Continued) |
(b) (Continued)
Notes:
The Group has elected the option to irrevocably designate certain of its previous available-for-sale equity investments as equity investments at fair value through other comprehensive income.
Impairment
The following table reconciles the aggregate opening impairment allowances under IAS 39 to the ECL allowances under IFRS 9. Re-measurement equals to the effect of adoption of IFRS 9 in note 14 and note 15.
| | | Impairment allowances
under IAS 39
at December 31, 2017 | | | Re-measurement (note 14/note 15) | | | ECL allowances
under IFRS 9
at January 1, 2018 | |
| | | RMB’000 | | | RMB’000 | | | RMB’000 | |
| Trade receivables | | | 546,102 | | | | 112,407 | | | | 658,509 | |
| Other current assets | | | 1,673,122 | | | | 38,502 | | | | 1,711,624 | |
| | | | 2,219,224 | | | | 150,909 | | | | 2,370,133 | |
Impact on reserves and accumulated losses
The impact of transition to IFRS 9 on reserves and accumulated losses is as follows:
| | | |
| 2.3 | Issued but not yet effective financial reporting standards(Continued) |
| Reserves and
accumulated losses | |
| | | Amendments toRMB’000 | |
Fair value reserve under IFRS 10 and9 (gain on available-for-sale financial assets under IAS 28 (2011)Sale or Contribution of Assets between an Investor and its Associate or Joint Venture39) |
| | | |
| Balance as at December 31, 2017 under IAS 39 | | | 6,836 | |
| Remeasurement of equity investments designated at fair value through other comprehensive income previously measured at cost under IAS 39 | | | 14,263 | |
| Deferred tax in relation to the above | | | (3,428 | ) |
| Balance as at January 1, 2018 under IFRS 9 | | | 17,671 | |
| | | Amendments | | |
| Accumulated losses | | | | |
| Balance as at December 31, 2017 under IAS 39 | | | (3,368,095 | ) |
| Adjustment due to business combinations under common control (note 38) | | | 35,724 | |
Recognition of expected credit losses for trade receivables under IFRS 10 and IAS 28 address an inconsistency between the requirements in9 | | | (94,844 | ) |
Recognition of expected credit losses for current financial assets at amortized cost under IFRS 10 and in IAS 28 in dealing with the sale or contribution of assets between an investor and its associate or joint venture. The amendments require a full recognition of a gain or loss when the sale or contribution of assets between an investor and its associate or joint venture constitutes a business. For a transaction involving assets that do not constitute a business, a gain or loss resulting from the transaction is recognized in the investor’s profit or loss only to the extent of the unrelated investor’s interest in that associate or joint venture. The amendments are to be applied prospectively. The previous mandatory effective date of amendments to9 | | | (38,502 | ) |
Balance as at January 1, 2018 under IFRS 10 and IAS 28 was removed by the IASB in January 2016 and a new mandatory effective date will be determined after the completion of a broader review of accounting for associates and joint ventures. However, the amendments are available for adoption now.9 | | | (3,465,717 | ) |
| | | |
| | | IFRS 15Revenue from Contracts with Customersand Amendments to IFRS 15Clarifications to IFRS 15 Revenue from Contracts with Customers |
| Non-controlling interests | | | | |
| Balance as at December 31, 2017 under IAS 39 | | | 26,035,429 | |
| Adjustment due to business combinations under common control (note 38) | | | 19,138 | |
| Remeasurement of equity investments designated at fair value through other comprehensive income previously measured at cost under IAS 39 | | | 851 | |
| Recognition of expected credit losses for trade receivables under IFRS 9 | | | (17,563 | ) |
| Deferred tax in relation to the above | | | (213 | ) |
| Balance as at January 1, 2018 under IFRS 9 | | | 26,037,642 | |
ALUMINUM CORPORATION OF CHINA LIMITED AND ITS SUBSIDIARIES
NOTES TO THE CONSOLIDATED FINANCIAL STATEMENTS(Continued)
For the years ended December 31, 2016, 2017 and 2018
(Amounts expressed in thousands of RMB unless otherwise stated)
| 2. | BASIS OF PREPARATION AND SIGNIFICANT ACCOUNTING POLICIES(Continued) |
| 2.2 | Changes in accounting policies and disclosures(Continued) |
| (c) | IFRS 15 issued in May 2014,and its amendments replace IAS 11Construction Contracts, IAS 18Revenueand related interpretations and it applies, with limited exceptions, to all revenue arising from contracts with customers. IFRS 15 establishes a new five-step model to account for revenue arising from contracts with customers. Under IFRS 15, revenue is recognized at an amount that reflects the consideration to which an entity expects to be entitled in exchange for transferring goods or services to a customer. The principles in IFRS 15 provide a more structured approach for measuring and recognising revenue. The standard also introduces extensive qualitative and quantitative disclosure requirements, including disaggregation of total revenue, information about performance obligations, changes in contract asset and liability account balances between periods and key judgements and estimates. The standard will supersede all current revenue recognition requirements under IFRSs. Eitherdisclosures are included in note 4 to the financial statements. As a full retrospective application or a modified retrospective adoption is required onresult of the initial application of the standard. In April 2016, the IASB issued amendments to IFRS 15, to address the implementation issues on identifying performance obligations, application guidance on principal versus agent and licences of intellectual property, and transition. The amendments are also intended to help ensure a more consistent application when entities adopt IFRS 15 and decrease the cost and complexity of applying the standard. The Group plans to adopt the transitional provisions in IFRS 15 to recognize the cumulative effect of initial adoption as an adjustment to the opening balance of accumulated losses at January 1, 2018. The Group’s principal activities consist of the manufacture and sale of alumina, the manufacture and sale of primary aluminium and aluminum alloy products, trading and logistics of non-ferrous metal products, coal, electric power and other energy businesses. During 2017, the Group has performed a detailed assessment onchanged the impact ofaccounting policy with respect to revenue recognition in note 2.27 to the adoption of IFRS 15 including completing a review of its customer contracts. Based on the contracts outstanding as of December 31, 2017, the Group expects that the transitional adjustment to be made on January 1, 2018 upon initial adoption of IFRS 15 will not be material. This is mainly because the Group recognizes revenue upon the transfer of significant risks and rewards, which coincides with the fulfilment of performance obligations. Additionally, the Group’s contracts with customers generally has only one performance obligation. However, the Group is in the process of identifying appropriate changes to its business processes and controls to ensure that all future customer contracts are properly evaluated under the new standard.financial statements. |
The Group has adopted IFRS 15 using the modified retrospective method of adoption. The Group applied IFRS 15 to contracts that are initiated after the effective date and contracts that had remaining obligations as of the effective date. In respect of the prior periods, the Group retained prior period’s figures as reported under the previous standards, recognising the cumulative effect of applying IFRS 15 as an adjustment to the opening balance of equity as at January 1, 2018. The Group concluded that the transitional adjustment to be made on January 1, 2018 to accumulated losses upon initial adoption of IFRS 15 is nil. It is because the Group recognizes revenue upon the transfer of significant risks and rewards, which coincides with the fulfilment of performance obligations. Additionally, the Group’s contracts with customers generally has only one performance obligation.
The nature of the adjustments as at January 1, 2018 and the reasons for the significant changes in the consolidated statement of financial position as at December 31, 2018 are described below:
Consideration received from customers in advance
Before the adoption of IFRS 15, the Group recognized consideration received from customers in advance as other payables. Under IFRS 15, the amount is classified as contract liabilities.
Therefore, upon adoption of IFRS 15, the Group reclassified RMB1,372 million from other payables to contract liabilities as at January 1, 2018 in relation to the consideration received from customers in advance as at January 1, 2018.
As at December 31, 2018, under IFRS 15, RMB1,579 million was recorded as contract liabilities in relation to the consideration received from customers in advance for the sale of industrial products.
ALUMINUM CORPORATION OF CHINA LIMITED AND ITS SUBSIDIARIES
NOTES TO THE CONSOLIDATED FINANCIAL STATEMENTS(Continued)
For the years ended December 31, 2015, 2016, 2017 and 20172018
(Amounts expressed in thousands of RMB unless otherwise stated)
| 2. | BASIS OF PREPARATION AND SIGNIFICANT ACCOUNTING POLICIES(Continued) |
| | |
| 2.32.2 | Issued but not yet effective financial reporting standardsChanges in accounting policies and disclosures(Continued) |
| (d) | |
| | Presentation and disclosure |
| | |
| | The presentation and disclosure requirementsVoluntary change in IFRS 15 are more detailed than those under the current IAS 18. The presentation requirements represent a significant change from current practice and will significantly increase the volume of disclosures required in the Group’s financial statements. Many of the disclosure requirements in IFRS 15 are new. In particular, the Group expects that the notes to the financial statements will be expanded because of the disclosure of significant judgements made on, how the transaction prices have been allocated to the performance obligations, and the assumptions made to estimate the stand-alone selling price of each performance obligation. In addition, as required by IFRS 15, the Group will disaggregate revenue recognized from contracts with customers into categories that depict how the nature, amount, timing and uncertainty of revenue and cash flows are affected by economic factors. It will also disclose information about the relationship between the disclosure of disaggregated revenue and revenue information disclosedaccounting policies for each reportable segment.government grants |
In 2018, the management of the Group performed an analysis on the nature of the Group’s government grants. After reassessing the gross vs. net presentation policy, management considered that presenting government grants in the net method can provide reliable and more relevant information about the effects of transactions to the users of the financial statements. As such, the Company proposed a voluntary change in the accounting policy.
Up to the year of 2017, the Group recognized and measured government grants according to the gross method:
Asset-related government grants are recognized when the government document designates that the government grants are used for constructing or forming long-term assets. Asset-related government grants are recognized as deferred income and are amortized evenly in profit or loss over the useful lives of the related assets. Income-related government grants that are used to compensate subsequent related expenses or losses of the Group are recognized as deferred income and recorded in profit or loss when the related expenses or losses are incurred. When the grants are used to compensate expenses or losses that were already incurred, they are directly recognized in profit or loss for the current period.
After the voluntary change in the accounting policy, the Group recognized government grants according to the net method. For asset related government grants, had the asset already existed upon receiving the government grant, the Group directly deducted the grant amount from the book value of the assets related to the government grant instead of recording the government grants as deferred income. For government grants related to income and expenses already incurred by the Group, which are specific to compensate certain cost and expenses, the Group would directly offset the grant amount against the related cost or expense.
ALUMINUM CORPORATION OF CHINA LIMITED AND ITS SUBSIDIARIES
NOTES TO THE CONSOLIDATED FINANCIAL STATEMENTS(Continued)
For the years ended December 31, 2015, 2016, 2017 and 20172018
(Amounts expressed in thousands of RMB unless otherwise stated)
| 2. | BASIS OF PREPARATION AND SIGNIFICANT ACCOUNTING POLICIES(Continued) |
| | |
| 2.32.2 | Issued but not yet effective financial reporting standardsChanges in accounting policies and disclosures(Continued) |
| | |
| | IFRS 16Leases |
| | |
| | IFRS 16, issued in January 2016, replaces IAS 17Leases, IFRIC Interpretation 4Determining whether an Arrangement contains a Lease, SIC-15Operating Leases - Incentives and SIC-27Evaluating the Substance of Transactions Involving the Legal Form of a Lease. The standard sets out the principles for the recognition, measurement, presentation and disclosure of leases and requires lessees to recognize assets and liabilities for most leases. The standard includes two recognition exemptions for lessees – leases of low-value assets and short-term leases. At the commencement date of a lease, a lessee will recognize a liability to make lease payments and an asset representing the right to use the underlying asset during the lease term. The right-of-use asset is subsequently measured at cost less accumulated depreciation and any impairment losses unless the right-of-use asset meets the definition of investment property in IAS 40, or relates to a class of property, plant and equipment to which the revaluation model is applied. The lease liability is subsequently increased to reflect the interest on the lease liability and reduced for the lease payments. Lessees will be required to separately recognize the interest expense on the lease liability and the depreciation expense on the right-of-use asset. Lessees will also be required to remeasure the lease liability upon the occurrence of certain events, such as change in the lease term and change in future lease payments resulting from a change in an index or rate used to determine those payments. Lessees will generally recognize the amount of the remeasurement of the lease liability as an adjustment to the right-of-use asset. Lessor accounting under IFRS 16 is substantially unchanged from the accounting under IAS 17. Lessors will continue to classify all leases using the same classification principle as in IAS 17 and distinguish between operating leases and finance leases. IFRS 16 requires lessees and lessors to make more extensive disclosures than under IAS 17. Lessees can choose to apply the standard using either a full retrospective or a modified retrospective approach. The Group expects to adopt IFRS 16 from January 1, 2019 and is currently assessing the impact of IFRS 16 upon adoption and is considering whether it will choose to take advantage of the practical expedients available and which transition approach and reliefs will be adopted. As disclosed in note 42(b) to the financial statements, as at December 31, 2017, the Group had future minimum lease payments under non-cancellable operating leases in aggregate of approximately RMB15,315 million. Upon adoption of IFRS 16, certain amounts included therein may need to be recognized as new right-of-use assets and lease liabilities. Further analysis, however, will be needed to determine the amount of new rights of use assets and lease liabilities to be recognized, including, but not limited to, any amounts relating to leases of low-value assets and short term leases, other practical expedients and reliefs chosen, and new leases entered into before the date of adoption. |
(d)(Continued)
The main effects of retrospective adjustments caused by the above accounting policy change on financial statements are as follows:
| | | | | | | | | | |
| Consolidated statement of financial position | | Before change in
accounting policy December 31, 2017 | | | Reclassification on change in accounting policy | | | After change in
accounting policy December 31, 2017 | |
| Assets: | | | | | | | | | |
| Property, plant and equipment | | | 96,430,815 | | | | (803,238 | ) | | | 95,627,577 | |
| Land use rights | | | 3,746,602 | | | | (169,590 | ) | | | 3,577,012 | |
| Intangible Assets | | | 10,653,175 | | | | (15,542 | ) | | | 10,637,633 | |
| | | | 110,830,592 | | | | (988,370 | ) | | | 109,842,222 | |
| | | | | | | | | | | | | |
| Total assets | | | 200,805,169 | | | | (988,370 | ) | | | 199,816,799 | |
| | | | | | | | | | | | | |
| Liabilities: | | | | | | | | | | | | |
| Other non-current liabilities | | | 3,442,030 | | | | (988,370 | ) | | | 2,453,660 | |
| | | | | | | | | | | | | |
| Total liabilities | | | 135,062,573 | | | | (988,370 | ) | | | 134,074,203 | |
| Consolidated statement of profit or loss and other comprehensive income | | Before change in
accounting policy December 31, 2017 | | | Reclassification on change in accounting policy | | | After change in accounting policy December 31, 2017 | |
| Cost of sales | | | (166,494,842 | ) | | | 204,607 | | | | (166,290,235 | ) |
| General and administration expenses | | | (4,604,055 | ) | | | 54,849 | | | | (4,549,206 | ) |
| Other income | | | 349,329 | | | | (259,456 | ) | | | 89,873 | |
| | | | (170,749,568 | ) | | | — | | | | (170,749,568 | ) |
| | | | | | | | | | | | | |
| Profit before tax | | | 3,049,010 | | | | — | | | | 3,049,010 | |
ALUMINUM CORPORATION OF CHINA LIMITED AND ITS SUBSIDIARIES
NOTES TO THE CONSOLIDATED FINANCIAL STATEMENTS(Continued)
For the years ended December 31, 2015, 2016, 2017 and 20172018
(Amounts expressed in thousands of RMB unless otherwise stated)
| 2. | BASIS OF PREPARATION AND SIGNIFICANT ACCOUNTING POLICIES(Continued) |
| | |
| 2.32.2 | Issued but not yet effective financial reporting standardsChanges in accounting policies and disclosures(Continued) |
(d)(Continued)
| | | | | | | | | | |
| Consolidated statement of financial position | | Before change in
accounting policy
December 31, 2018 | | | Reclassification on change in accounting policy | | | After change in
accounting policy
December 31, 2018 | |
| Assets: | | | | | | | | | |
| Property, plant and equipment | | | 107,066,073 | | | | (872,704 | ) | | | 106,193,369 | |
| Land use rights | | | 4,484,055 | | | | (203,764 | ) | | | 4,280,291 | |
| Intangible Assets | | | 12,881,804 | | | | (2,439 | ) | | | 12,879,365 | |
| Other non-current assets | | | 4,446,938 | | | | (4,294 | ) | | | 4,442,644 | |
| | | | 128,878,870 | | | | (1,083,201 | ) | | | 127,795,669 | |
| | | | | | | | | | | | | |
| Total assets | | | 201,959,315 | | | | (1,083,201 | ) | | | 200,876,114 | |
| | | | | | | | | | | | | |
| Liabilities: | | | | | | | | | | | | |
| Other non-current liabilities | | | 3,521,365 | | | | (1,083,201 | ) | | | 2,438,164 | |
| | | | | | | | | | | | | |
| Total liabilities | | | 134,290,113 | | | | (1,083,201 | ) | | | 133,206,912 | |
| Consolidated statement of profit or loss and other comprehensive income | | Before change in
accounting policy
December 31, 2018 | | | Reclassification on
change in
accounting policy | | | After change in
accounting policy
December 31, 2018 | |
| Cost of sales | | | (167,254,868 | ) | | | 225,452 | | | | (167,029,416 | ) |
| General and administration expenses | | | (4,540,590 | ) | | | 582,523 | | | | (3,958,067 | ) |
| Research and development expenses | | | (630,815 | ) | | | 3,942 | | | | (626,873 | ) |
| Selling and distribution expenses | | | (2,496,977 | ) | | | 44 | | | | (2,496,933 | ) |
| Other income | | | 947,328 | | | | (811,961 | ) | | | 135,367 | |
| | | | (173,975,922 | ) | | | — | | | | (173,975,922 | ) |
| | | | | | | | | | | | | |
| Profit before tax | | | 2,303,511 | | | | — | | | | 2,303,511 | |
ALUMINUM CORPORATION OF CHINA LIMITED AND ITS SUBSIDIARIES
NOTES TO THE CONSOLIDATED FINANCIAL STATEMENTS(Continued)
For the years ended December 31, 2016, 2017 and 2018
(Amounts expressed in thousands of RMB unless otherwise stated)
| | |
| | Amendments to IAS 402. | BASIS OF PREPARATION AND SIGNIFICANT ACCOUNTING POLICIESTransfers of Investment Property(Continued) |
| 2.2 | Changes in accounting policies and disclosures(Continued) |
| (e) | Amendments to IAS 40 issued in December 2016, clarify when an entity should transfer property, including property under construction or development, into or out of investment property. The amendments state that a change in use occurs when the property meets, or ceases to meet, the definition of investment property and there is evidence of the change in use. A mere change in management’s intentions for the use of a property does not provide evidence of a change in use. The amendments should be applied prospectively to the changes in use that occur on or after the beginning of the annual reporting period in which the entity first applies the amendments. An entity should reassess the classification of property held at the date that it first applies the amendments and, if applicable, reclassify property to reflect the conditions that exist at that date. Retrospective application is only permitted if it is possible without the use of hindsight. The Group expects to adopt the amendments prospectively from January 1, 2018. The amendments are not expected to have any significanthad no impact on the Group’s financial statements.position or performance of the Group. |
| (f) | |
| | IFRIC Int 22Foreign Currency Transactions and Advance Consideration |
| | |
| | IFRIC-Int 22, issued in December 2016, provides guidance on how to determine the date of the transaction when applying IAS 21 to the situation where an entity receives or pays advance consideration in a foreign currency and recognizes a non-monetary asset or liability. The interpretation clarifies that the date of the transaction for the purpose of determining the exchange rate to use on initial recognition of the related asset, expense or income (or part of it) is the date on which an entity initially recognizes the non-monetary asset (such as a prepayment) or non-monetary liability (such as deferred income) arising from the payment or receipt of the advance consideration. If there are multiple payments or receipts in advance of recognising the related item, the entity must determine the transaction date for each payment or receipt of the advance consideration. Entities may apply theThe interpretation on a full retrospective basis or on a prospective basis, either from the beginning of the reporting period in which the entity first applies the interpretation or the beginning of the prior reporting period presented as comparative information in the financial statements of the reporting period in which the entity first applies the interpretation. The Group expects to adopt the interpretation prospectively from January 1, 2018. The amendments are not expected to have any significanthas had no impact on the Group’s financial statements.statements as the Group’s accounting policy for the determination of the exchange rate applied for initial recognition of non-monetary assets or non-monetary liabilities is consistent with the guidance provided in the interpretation. |
ALUMINUM CORPORATION OF CHINA LIMITED AND ITS SUBSIDIARIES
NOTES TO THE CONSOLIDATED FINANCIAL STATEMENTS(Continued)
For the years ended December 31, 2015, 2016, 2017 and 20172018
(Amounts expressed in thousands of RMB unless otherwise stated)
| 2. | BASIS OF PREPARATION AND SIGNIFICANT ACCOUNTING POLICIES(Continued) |
| 2.3 | Issued but not yet effective International Financial Reporting Standards |
The Group has not applied the following new and revised IFRSs that have been issued but are not yet effective, in these financial statements.
| Amendments to IFRS 3 | Definition of a Business2 |
| Amendments to IFRS 9 | Prepayment Features with Negative Compensation1 |
| Amendments to IFRS 10 and IAS 28 | Sale or Contribution of Assets between an Investor and its Associate or Joint Venture4 |
| IFRS 16 | Leases1 |
| IFRS 17 | Insurance Contracts3 |
| Amendments to IAS 1 and IAS 8 | Definition of Material2 |
| Amendments to IAS 19 | Plan Amendment, Curtailment or Settlement1 |
| Amendments to IAS 28 | Long-term Interests in Associates and Joint Ventures1 |
| IFRIC 23 | Uncertainty over Income Tax Treatments1 |
| Annual Improvements 2015-2017 Cycle | Amendments to IFRS 3, IFRS 11, IAS 12 and IAS 231 |
| |
| 1Effective for annual periods beginning on or after January 1, 2019 |
| 2Effective for annual periods beginning on or after January 1, 2020 |
| 3Effective for annual periods beginning on or after January 1, 2021 |
| 4 No mandatory effective date yet determined but available for adoption |
ALUMINUM CORPORATION OF CHINA LIMITED AND ITS SUBSIDIARIES
NOTES TO THE CONSOLIDATED FINANCIAL STATEMENTS(Continued)
For the years ended December 31, 2016, 2017 and 2018
(Amounts expressed in thousands of RMB unless otherwise stated)
| 2. | BASIS OF PREPARATION AND SIGNIFICANT ACCOUNTING POLICIES(Continued) |
| | |
| 2.3 | Issued but not yet effective International Financial Reporting Standardsfinancial reporting standards(Continued) |
| | |
| | IFRIC-Int 23Uncertainty over Income Tax Treatments |
| | |
| | IFRIC-Int 23, issued in June 2017, addresses the accounting for income taxes (current and deferred) when tax treatments involve uncertainty that affects the application of IAS 12 (often referred to as “uncertain tax positions”). The interpretation does not apply to taxes or levies outside the scope of IAS 12, nor does it specifically include requirements relating to interest and penalties associated with uncertain tax treatments. The interpretation specifically addresses (i) whether an entity considers uncertain tax treatments separately; (ii) the assumptions an entity makes about the examination of tax treatments by taxation authorities; (iii) how an entity determines taxable profits or tax losses, tax bases, unused tax losses, unused tax credits and tax rates; and (iv) how an entity considers changes in facts and circumstances. The interpretation is to be applied retrospectively, either fully retrospectively without the use of hindsight or retrospectively with the cumulative effect of application as an adjustment to the opening equity at the date of initial application, without the restatement of comparative information. The Group expects to adopt the interpretation from January 1, 2019. The amendments are not expected to have any significant impact on the Group’s financial statements. |
| | |
| | Annual Improvements to IFRSs 2014-2016 Cycle |
| | |
| | Annual Improvements to IFRSs 2014-2016 Cycle, issued in December 2016, sets out amendments to IFRS 1, IFRS 12 and IAS 28. Except for the amendments to IFRS 12 which have been adopted by the Group for the current year’s financial statements, the Group expects to adopt the amendments from January 1, 2018. None of the amendments are expected to have a significant financial impact on the Group. Details of the amendments to IFRS 1 and IAS 28 are as follows: |
| | |
| | IFRS 1First-time Adoption of International Financial Reporting Standards |
| | |
| | Deletes the short-term exemptions for first-time adopters because the reliefs provided in the exemptions are no longer applicable. |
| | |
| | IAS 28Investments in Associates and Joint Ventures |
| | |
| | Clarifies that an entity that is a venture capital organisation, or other qualifying entity, may elect, at initial recognition on an investment-by-investment basis, to measure its investments in associates and joint ventures at fair value through profit or loss. If an entity that is not itself an investment entity has an interest in an associate or joint venture that is an investment entity, the entity may elect to retain the fair value measurement applied by that investment entity associate or joint venture to the investment entity associate’s or joint venture’s interests in subsidiaries when applying the equity method. This election is made separately for each investment entity associate or joint venture, at the later of the date on which (i) the investment entity associate or joint venture is initially recognized; (ii) the associate or joint venture becomes an investment entity; and (iii) the investment entity associate or joint venture first becomes a parent. These amendments should be applied retrospectively. |
Further information about those IFRSs that are expected to be applicable to the Group is described below.
Amendments to IFRS 3 clarify and provide additional guidance on the definition of a business. The amendments clarify that for an integrated set of activities and assets to be considered a business, it must include, at a minimum, an input and a substantive process that together significantly contribute to the ability to create output. A business can exist without including all of the inputs and processes needed to create outputs. The amendments remove the assessment of whether market participants are capable of acquiring the business and continue to produce outputs. Instead, the focus is on whether acquired inputs and acquired substantive processes together significantly contribute to the ability to create outputs. The amendments have also narrowed the definition of outputs to focus on goods or services provided to customers, investment income or other income from ordinary activities. Furthermore, the amendments provide guidance to assess whether an acquired process is substantive and introduce an optional fair value concentration test to permit a simplified assessment of whether an acquired set of activities and assets is not a business. The Group expects to adopt the amendments prospectively from January 1, 2020.
Amendments to IFRS 10 and IAS 28 address an inconsistency between the requirements in IFRS 10 and in IAS 28 in dealing with the sale or contribution of assets between an investor and its associate or joint venture. The amendments require a full recognition of a gain or loss when the sale or contribution of assets between an investor and its associate or joint venture constitutes a business. For a transaction involving assets that do not constitute a business, a gain or loss resulting from the transaction is recognized in the investor’s profit or loss only to the extent of the unrelated investor’s interest in that associate or joint venture. The amendments are to be applied prospectively. The previous mandatory effective date of amendments to IFRS 10 and IAS 28 was removed by the IASB in January 2016 and a new mandatory effective date will be determined after the completion of a broader review of accounting for associates and joint ventures. However, the amendments are available for adoption now.
ALUMINUM CORPORATION OF CHINA LIMITED AND ITS SUBSIDIARIES
NOTES TO THE CONSOLIDATED FINANCIAL STATEMENTS(Continued)
For the years ended December 31, 2015, 2016, 2017 and 20172018
(Amounts expressed in thousands of RMB unless otherwise stated)
| 2. | BASIS OF PREPARATION AND SIGNIFICANT ACCOUNTING POLICIES(Continued) |
| 2.3 | |
| 2.4 | Investments in joint ventures and associates |
| | |
| | A joint venture is a type of joint arrangement whereby the parties that have joint control of the arrangement have rights to the net assets of the joint venture. Joint control is the contractually agreed sharing of control of an arrangement, which exists only when decisions about the relevant activities require unanimous consent of the parties sharing control. |
| | |
| | An associate is an entity over which the Group has significant influence. Significant influence is the power to participate in theIssued but not yet effective financial and operating policy decisions of the investee, but is not control or joint control over those policies. |
| | |
| | The Group’s investments in associates and joint ventures are accounted for using the equity method. |
| | |
| | Under the equity method, the investment in an associate or a joint venture is initially recognized at cost. The carrying amount of the investment is adjusted to recognize changes in the Group’s share of net assets of the associate or joint venture since the acquisition date. Goodwill relating to the associate or joint venture is included in the carrying amount of the investment, and tested for impairment when any indicators of impairment are identified. |
| | |
| | The consolidated statement of comprehensive income includes the Group’s share of the results of operations of the associate or joint venture. Any change in OCI of those investees is presented as part of the Group’s OCI. In addition, when there has been a change recognized directly in the equity of the associate or joint venture, the Group recognizes its share of any changes, when applicable, in the consolidated statement of shareholders’ equity. Unrealized gains and losses resulting from transactions between the Group and the associate or joint venture are eliminated to the extent of the interest in the associate or joint venture. |
| | |
| | The aggregate of the Group’s share of profit or loss of an associate and a joint venture is shown on the face of the consolidated statement of comprehensive income and represents profit or loss after tax and non-controlling interests in the subsidiaries of the associate or joint venture.reporting standards(Continued) |
IFRS 16 replaces IAS 17Leases, IFRIC Interpretation 4Determining whether an Arrangement contains a Lease, SIC-15Operating Leases - Incentives and SIC-27Evaluating the Substance of Transactions Involving the Legal Form of a Lease. The standard sets out the principles for the recognition, measurement, presentation and disclosure of leases and requires lessees to recognize assets and liabilities for most leases. The standard includes two elective recognition exemptions for lessees – leases of low-value assets and short-term leases. At the commencement date of a lease, a lessee will recognize a liability to make lease payments and an asset representing the right to use the underlying asset during the lease term. The right-of-use asset is subsequently measured at cost less accumulated depreciation and any impairment losses unless the right-of-use asset meets the definition of investment property in IAS 40, or relates to a class of property, plant and equipment to which the revaluation model is applied. The lease liability is subsequently increased to reflect the interest on the lease liability and reduced for the lease payments. Lessees will be required to separately recognize the interest expense on the lease liability and the depreciation expense on the right-of-use asset. Lessees will also be required to remeasure the lease liability upon the occurrence of certain events, such as change in the lease term and change in future lease payments resulting from a change in an index or rate used to determine those payments. Lessees will generally recognize the amount of the remeasurement of the lease liability as an adjustment to the right-of-use asset. Lessor accounting under IFRS 16 is substantially unchanged from the accounting under IAS 17. Lessors will continue to classify all leases using the same classification principle as in IAS 17 and distinguish between operating leases and finance leases. IFRS 16 requires lessees and lessors to make more extensive disclosures than under IAS 17. Lessees can choose to apply the standard using either a full retrospective or a modified retrospective approach. The Group will adopt IFRS 16 from January 1, 2019. The Group plans to adopt the transitional provisions in IFRS 16 to recognize the cumulative effect of initial adoption as an adjustment to the opening balance of accumulated losses at January 1, 2019 and will not restate the comparatives. In addition, the Group plans to apply the new requirements to contracts that were previously identified as leases applying IAS 17 and measure the lease liability at the present value of the remaining lease payments, discounted using the Group’s incremental borrowing rate at the date of initial application. The right-of-use asset will be measured at the amount of the lease liability, adjusted by the amount of any prepaid or accrued lease payments relating to the lease recognized in the statement of financial position immediately before the date of initial application. The Group plans to use the exemptions allowed by the standard on lease contracts whose lease terms end within 12 months as of the date of initial application. During 2018, the Group has performed a detailed assessment on the impact of adoption of IFRS 16. The Group has estimated that right-of-use assets of RMB6,929 million and lease liabilities of RMB6,929 million will be recognized at January 1, 2019.
Amendments to IAS 1 and IAS 8 provide a new definition of material. The new definition states that information is material if omitting, misstating or obscuring it could reasonably be expected to influence decisions that the primary users of general purpose financial statements make on the basis of those financial statements. The amendments clarify that materiality will depend on the nature or magnitude of information. A misstatement of information is material if it could reasonably be expected to influence decisions made by the primary users. The Group expects to adopt the amendments prospectively from January 1, 2020. The amendments are not expected to have any significant impact on the Group’s financial statements.
ALUMINUM CORPORATION OF CHINA LIMITED AND ITS SUBSIDIARIES
NOTES TO THE CONSOLIDATED FINANCIAL STATEMENTS(Continued)
For the years ended December 31, 2015, 2016, 2017 and 20172018
(Amounts expressed in thousands of RMB unless otherwise stated)
| 2. | BASIS OF PREPARATION AND SIGNIFICANT ACCOUNTING POLICIES(Continued) |
| | |
| 2.4 | Investments in joint ventures and associates2.3 | Issued but not yet effective financial reporting standards(Continued) |
| | |
| | The financial statements of the associate or joint venture are prepared for the same reporting period as the Group. When necessary, adjustments are made to bring the accounting policies in line with those of the Group. |
| | |
| | After application of the equity method, the Group determines whether it is necessary to recognize an impairment loss on its investment in its associate or joint venture. At each reporting date, the Group determines whether there is objective evidence that the investment in the associate or joint venture is impaired. If there is such evidence, the Group calculates the amount of impairment as the difference between the recoverable amount of the associate or joint venture and its carrying value, then recognizes the loss in profit or loss. |
| | |
| | If an investment in an associate becomes an investment in a joint venture or vice versa, the retained interest is not remeasured. Instead, the investment continues to be accounted for under the equity method. In all other cases, upon loss of significant influence over the associate or joint control over the joint venture, the Group measures and recognizes any retained investment at its fair value. Any difference between the carrying amount of the associate or joint venture upon loss of significant influence or joint control and the fair value of the retained investment and the proceeds from disposal is recognized in profit or loss. |
| | |
| | When an investment in an associate or a joint venture is classified as held for sale, it is accounted for in accordance with IFRS 5Non-current Assets Held for Sale and Discontinued Operations. |
| | |
| 2.5 | Segment reporting |
| | |
| | Operating segments are reported in a manner consistent with the internal reporting provided to the chief operating decision-makers. The chief operating decision-makers, who are responsible for allocating resources and assessing the performance of the operating segments, have been identified as the presidents of the Company that make strategic decisions. |
Amendments to IAS 28 clarify that the scope exclusion of IFRS 9 only includes interests in an associate or joint venture to which the equity method is applied and does not include long-term interests that in substance form part of the net investment in the associate or joint venture, to which the equity method has not been applied. Therefore, an entity applies IFRS 9, rather than IAS 28, including the impairment requirements under IFRS 9, in accounting for such long-term interests. IAS 28 is then applied to the net investment, which includes the long-term interests, only in the context of recognising losses of an associate or joint venture and impairment of the net investment in the associate or joint venture. The Group expects to adopt the amendments on January 1, 2019 and will assess its business model for such long-term interests based on the facts and circumstances that exist on January 1, 2019 using the transitional requirements in the amendments. The Group also intends to apply the relief from restating comparative information for prior periods upon adoption of the amendments.
IFRIC-Int 23 addresses the accounting for income taxes (current and deferred) when tax treatments involve uncertainty that affects the application of IAS 12 (often referred to as “uncertain tax positions”). The interpretation does not apply to taxes or levies outside the scope of IAS 12, nor does it specifically include requirements relating to interest and penalties associated with uncertain tax treatments. The interpretation specifically addresses (i) whether an entity considers uncertain tax treatments separately; (ii) the assumptions an entity makes about the examination of tax treatments by taxation authorities; (iii) how an entity determines taxable profits or tax losses, tax bases, unused tax losses, unused tax credits and tax rates; and (iv) how an entity considers changes in facts and circumstances. The interpretation is to be applied retrospectively, either fully retrospectively without the use of hindsight or retrospectively with the cumulative effect of application as an adjustment to the opening equity at the date of initial application, without the restatement of comparative information. The Group expects to adopt the interpretation from January 1, 2019. The interpretation is not expected to have any significant impact on the Group’s financial statements.
ALUMINUM CORPORATION OF CHINA LIMITED AND ITS SUBSIDIARIES
NOTES TO THE CONSOLIDATED FINANCIAL STATEMENTS(Continued)
For the years ended December 31, 2015, 2016, 2017 and 20172018
(Amounts expressed in thousands of RMB unless otherwise stated)
| 2. | BASIS OF PREPARATION AND SIGNIFICANT ACCOUNTING POLICIES(Continued) |
| 2.4 | Investments in joint ventures and associates |
A joint venture is a type of joint arrangement whereby the parties that have joint control of the arrangement have rights to the net assets of the joint venture. Joint control is the contractually agreed sharing of control of an arrangement, which exists only when decisions about the relevant activities require unanimous consent of the parties sharing control.
An associate is an entity over which the Group has significant influence. Significant influence is the power to participate in the financial and operating policy decisions of the investee, but is not control or joint control over those policies.
The Group’s investments in associates and joint ventures are accounted for using the equity method, less any impairment losses
Under the equity method, the investment in an associate or a joint venture is initially recognized at cost. The carrying amount of the investment is adjusted to recognize changes in the Group’s share of net assets of the associate or joint venture since the acquisition date. Goodwill relating to the associate or joint venture is included in the carrying amount of the investment, and tested for impairment when any indicators of impairment are identified.
The consolidated statement of profit or loss and other comprehensive income includes the Group’s share of the results of operations of the associate or joint venture. Any change in OCI of those investees is presented as part of the Group’s OCI. In addition, when there has been a change recognized directly in the equity of the associate or joint venture, the Group recognizes its share of any changes, when applicable, in the consolidated statement of changes in equity. Unrealized gains and losses resulting from transactions between the Group and the associate or joint venture are eliminated to the extent of the interest in the associate or joint venture.
The aggregate of the Group’s share of profit or loss of an associate and a joint venture is shown in the consolidated statement of profit or loss and other comprehensive income and represents profit or loss after tax and non-controlling interests in the subsidiaries of the associate or joint venture.
ALUMINUM CORPORATION OF CHINA LIMITED AND ITS SUBSIDIARIES
NOTES TO THE CONSOLIDATED FINANCIAL STATEMENTS(Continued)
For the years ended December 31, 2016, 2017 and 2018
(Amounts expressed in thousands of RMB unless otherwise stated)
| 2. | BASIS OF PREPARATION AND SIGNIFICANT ACCOUNTING POLICIES(Continued) |
| 2.4 | Investments in joint ventures and associates(Continued) |
The financial statements of the associate or joint venture are prepared for the same reporting period as the Group. When necessary, adjustments are made to bring the accounting policies in line with those of the Group.
After application of the equity method, the Group determines whether it is necessary to recognize an impairment loss on its investment in its associate or joint venture. At each reporting date, the Group determines whether there is objective evidence that the investment in the associate or joint venture is impaired. If there is such evidence, the Group calculates the amount of impairment as the difference between the recoverable amount of the associate or joint venture and its carrying value, then recognizes the loss in profit or loss.
If an investment in an associate becomes an investment in a joint venture or vice versa, the retained interest is not remeasured. Instead, the investment continues to be accounted for under the equity method. In all other cases, upon loss of significant influence over the associate or joint control over the joint venture, the Group measures and recognizes any retained investment at its fair value. Any difference between the carrying amount of the associate or joint venture upon loss of significant influence or joint control and the fair value of the retained investment and the proceeds from disposal is recognized in profit or loss.
When an investment in an associate or a joint venture is classified as held for sale, it is accounted for in accordance with IFRS 5 Non-current Assets Held for Sale and Discontinued Operations.
Operating segments are reported in a manner consistent with the internal reporting provided to the chief operating decision-makers. The chief operating decision-makers, who are responsible for allocating resources and assessing the performance of the operating segments, have been identified as the presidents of the Company that make strategic decisions.
ALUMINUM CORPORATION OF CHINA LIMITED AND ITS SUBSIDIARIES
NOTES TO THE CONSOLIDATED FINANCIAL STATEMENTS(Continued)
For the years ended December 31, 2016, 2017 and 2018
(Amounts expressed in thousands of RMB unless otherwise stated)
| 2. | BASIS OF PREPARATION AND SIGNIFICANT ACCOUNTING POLICIES(Continued) |
A party is considered to be related to the Group if:
| | | | |
| | A party is considered to be related to the Group if: |
| | | | |
| | (a) | the party is a person or a close member of that person’s family and that person: |
| | | | |
| | | (i) | has control or joint control over the Group; |
| | | | |
| | | (ii) | has a significant influence over the Group; or |
| | | | |
| | | (iii) | is a member of the key management personnel of the Group or of a parent of the Group; |
or
| | | | |
| | or |
| | | | |
| | (b) | the party is an entity where any of the following conditions applies: |
| | | | |
| | | (i) | the entity and the Group are members of the same group; |
| | | | |
| | | (ii) | one entity is an associate or joint venture of the other entity (or of a parent, subsidiary or fellow subsidiary of the other entity); |
| | | | |
| | | (iii) | the entity and the Group are joint ventures of the same third party; |
| | | | |
| | | (iv) | one entity is a joint venture of a third entity and the other entity is an associate of the third entity; |
| | | | |
| | | (v) | the entity is a post-employment benefit plan for the benefit of employees of either the Group or an entity related to the Group; |
| | | | |
| | | (vi) | the entity is controlled or jointly controlled by a person identified in (a); |
| | | | |
| | | (vii) | a person identified in (a) (i) has significant influence over the entity or is a member of the key management personnel of the entity (or of a parent of the entity); and |
| | | | |
| | | (viii) | the entity, or any member of a group of which it is a part, provides key management personnel services to the Group or to the parent of the Group. |
| | | | |
| 2.7 | Fair value measurement |
| | |
| | The Group measures its future contracts and available-for-sale financial investments at fair value at the end of each reporting period. Also, the fair values of financial instruments measured at amortized cost are disclosed in note 36. |
The Group measures its futures, options and forward contracts and equity investments at fair value at the end of each reporting period. Also, the fair values of financial instruments measured at amortized cost are disclosed in note 36.
ALUMINUM CORPORATION OF CHINA LIMITED AND ITS SUBSIDIARIES
NOTES TO THE CONSOLIDATED FINANCIAL STATEMENTS(Continued)
For the years ended December 31, 2015, 2016, 2017 and 20172018
(Amounts expressed in thousands of RMB unless otherwise stated)
| 2. | BASIS OF PREPARATION AND SIGNIFICANT ACCOUNTING POLICIES(Continued) |
| | | | |
| 2.7 | Fair value measurement(Continued) |
Fair value is the price that would be received to sell an asset or paid to transfer a liability in an orderly transaction between market participants at the measurement date. The fair value measurement is based on the presumption that the transaction to sell the asset or transfer the liability takes place either:
| | | | |
| | Fair value is the price that would be received to sell an asset or paid to transfer a liability in an orderly transaction between market participants at the measurement date. The fair value measurement is based on the presumption that the transaction to sell the asset or transfer the liability takes place either: |
| | | | |
| | •● | In the principal market for the asset or liability; or |
| | | | |
| | •● | In the absence of a principal market, in the most advantageous market for the asset or liability. |
The principal or the most advantageous market must be accessible by the Group. The fair value of an asset or a liability is measured using the assumptions that market participants would use when pricing the asset or liability, assuming that market participants act in their economic best interest.
A fair value measurement of a non-financial asset takes into account a market participant’s ability to generate economic benefits by using the asset in its highest and best use or by selling it to another market participant that would use the asset in its highest and best use.
The Group uses valuation techniques that are appropriate in the circumstances and for which sufficient data are available to measure fair value, maximising the use of relevant observable inputs and minimising the use of unobservable inputs.
All assets and liabilities for which fair value is measured or disclosed in the financial statements are categorised within the fair value hierarchy, described as follows, based on the lowest level input that is significant to the fair value measurement as a whole:
| | | | |
| | The principal or the most advantageous market must be accessible by the Group. The fair value of an asset or a liability is measured using the assumptions that market participants would use when pricing the asset or liability, assuming that market participants act in their economic best interest. |
| | | | |
| | A fair value measurement of a non-financial asset takes into account a market participant’s ability to generate economic benefits by using the asset in its highest and best use or by selling it to another market participant that would use the asset in its highest and best use. |
| | | | |
| | The Group uses valuation techniques that are appropriate in the circumstances and for which sufficient data are available to measure fair value, maximising the use of relevant observable inputs and minimising the use of unobservable inputs. |
| | | | |
| | All assets and liabilities for which fair value is measured or disclosed in the financial statements are categorised within the fair value hierarchy, described as follows, based on the lowest level input that is significant to the fair value measurement as a whole: |
| | | | |
| | Level 1 — | Based on quoted (unadjusted) prices in active markets for identical assets or liabilities |
| | | | |
| | Level 2 — | Based on valuation techniques for which the lowest level input that is significant to the fair value measurement is directly or indirectly observable |
| | | | |
| | Level 3 — | Based on valuation techniques for which the lowest level input that is significant to the fair value measurement is unobservable |
| | | | |
| | For assets and liabilities that are recognized in the financial statements on a recurring basis, the Group determines whether transfers have occurred between levels in the hierarchy by re-assessing categorisation (based on the lowest level input that is significant to the fair value measurement as a whole) at the end of each reporting period. |
For assets and liabilities that are recognized in the financial statements on a recurring basis, the Group determines whether transfers have occurred between levels in the hierarchy by re-assessing categorisation (based on the lowest level input that is significant to the fair value measurement as a whole) at the end of each reporting period.
ALUMINUM CORPORATION OF CHINA LIMITED AND ITS SUBSIDIARIES
NOTES TO THE CONSOLIDATED FINANCIAL STATEMENTS(Continued)
For the years ended December 31, 2015, 2016, 2017 and 20172018
(Amounts expressed in thousands of RMB unless otherwise stated)
| 2. | BASIS OF PREPARATION AND SIGNIFICANT ACCOUNTING POLICIES(Continued) |
| | | |
| 2.8 | Foreign currency translation |
Functional and presentation currency
Items included in the financial statements of each of the Group’s entities are measured using the currency of the primary economic environment in which the entity operates (the “functional currency”). The consolidated financial statements are presented in RMB, which is the Company’s functional currency and the Group’s presentation currency.
Transactions and balances
Foreign currency transactions recorded by the entities in the Group are initially recorded using their respective functional currency rates prevailing at the dates of the transactions. Monetary assets and liabilities denominated in foreign currencies are translated at the functional currency rates of exchange ruling at the end of the reporting period. Differences arising on settlement or translation of monetary items are recognized in profit or loss.
Non-monetary items that are measured in terms of historical cost in a foreign currency are translated using the exchange rates at the dates of the initial transactions. Non-monetary items measured at fair value in a foreign currency are translated using the exchange rates at the date when the fair value was measured. The gain or loss arising on translation of a non-monetary item measured at fair value is treated in line with the recognition of the gain or loss on change in fair value of the item.
In determining the exchange rate on initial recognition of the related asset, expense or income on the derecognition of a non-monetary asset or non-monetary liability relating to an advance consideration, the date of initial transaction is the date on which the Group initially recognizes the non-monetary asset or non-monetary liability arising from the advance consideration. If there are multiple payments or receipts in advance, the Group determines the transaction date for each payment or receipt of the advance consideration.
Group companies
The results and financial positions of all the group entities (none of which has the currency of a hyper-inflationary economy) that has a functional currency different from the presentation currency are translated into the presentation currency as follows:
| | | |
| | Functional and presentation currency |
| | | |
| | Items included in the financial statements of each of the Group’s entities are measured using the currency of the primary economic environment in which the entity operates (the “functional currency“). The consolidated financial statements are presented in RMB, which is the Company’s functional currency and the Group’s presentation currency. |
| | | |
| | Currency Translation for Financial Statements Presentation |
| | | |
| | Translations of amounts from RMB into US$ for the convenience of the reader have been calculated at the exchange rate of RMB 6.5063 per US$1.00 on December 29, 2017, the last business day in fiscal year 2017, as published on the website of the United States Federal Reserve Board. No representation is made that the RMB amounts could have been, or could be, converted into U.S. dollars at such rate. |
| | | |
| | Transactions and balances |
| | | |
| | Foreign currency transactions recorded by the entities in the Group are initially recorded using their respective functional currency rates prevailing at the dates of the transactions. Monetary assets and liabilities denominated in foreign currencies are translated at the functional currency rates of exchange ruling at the end of the reporting period. Differences arising on settlement or translation of monetary items are recognized in profit or loss. |
| | | |
| | Non-monetary items that are measured in terms of historical cost in a foreign currency are translated using the exchange rates at the dates of the initial transactions. Non-monetary items measured at fair value in a foreign currency are translated using the exchange rates at the date when the fair value was measured. The gain or loss arising on translation of a non-monetary item measured at fair value is treated in line with the recognition of the gain or loss on change in fair value of the item. |
| | | |
| | Group companies |
| | | |
| | The results and financial positions of all the group entities (none of which has the currency of a hyper-inflationary economy) that has a functional currency different from the presentation currency are translated into the presentation currency as follows: |
| | | |
| | (i) | assets and liabilities in each statement of financial position presented are translated at the closing rates at the end of the reporting period; |
| | | |
| | (ii) | income and expenses in each statement of comprehensive income are translated at average exchange rates (unless this average is not a reasonable approximation of the cumulative effect of the rates prevailing on the transaction dates, in which case income and expenses are translated at the rates at the dates of the transactions); and |
| | | |
| | (iii) | all resulting exchange differences are recognized in other comprehensive income. Upon disposal of a foreign operation, the other comprehensive income related to the foreign operation is reclassified to profit or loss. |
| | | |
| | Goodwill and fair value adjustments to the carrying amounts of assets and liabilities arising on the acquisition of a foreign entity are treated as assets and liabilities of the foreign entity and translated at the closing rate. Exchange differences arising are recognized in other comprehensive income. |
Goodwill and fair value adjustments to the carrying amounts of assets and liabilities arising on the acquisition of a foreign entity are treated as assets and liabilities of the foreign entity and translated at the closing rate. Exchange differences arising are recognized in other comprehensive income.
ALUMINUM CORPORATION OF CHINA LIMITED AND ITS SUBSIDIARIES
NOTES TO THE CONSOLIDATED FINANCIAL STATEMENTS(Continued)
For the years ended December 31, 2015, 2016, 2017 and 20172018
(Amounts expressed in thousands of RMB unless otherwise stated)
| 2. | BASIS OF PREPARATION AND SIGNIFICANT ACCOUNTING POLICIES(Continued) |
| | |
| 2.9 | Property, plant and equipment |
| | |
| | Property, plant and equipment, other than construction in progress (“CIP“), are stated at cost less accumulated depreciation and any impairment losses. When an item of property, plant and equipment is classified as held for sale or when it is part of a disposal group classified as held for sale, it is not depreciated and is accounted for in accordance with IFRS 5. The cost of an item of property, plant and equipment comprises its purchase price and any directly attributable costs of bringing the asset to its working condition and location for its intended use. |
| | |
| | Expenditure incurred after items of property, plant and equipment have been put into operation, such as repairs and maintenance, is normally charged to profit or loss in the period in which it is incurred. In situations where the recognition criteria are satisfied, the expenditure for a major inspection is capitalised in the carrying amount of the asset as a replacement. Where significant parts of property, plant and equipment are required to be replaced at intervals, the Group recognizes such parts as individual assets with specific useful lives and depreciates them accordingly. |
| | |
| | |
Property, plant and equipment, other than construction in progress, are stated at cost less accumulated depreciation and any impairment losses. When an item of property, plant and equipment is classified as held for sale or when it is part of a disposal group classified as held for sale, it is not depreciated and is accounted for in accordance with IFRS 5. The cost of an item of property, plant and equipment comprises its purchase price and any directly attributable costs of bringing the asset to its working condition and location for its intended use.
Expenditure incurred after items of property, plant and equipment have been put into operation, such as repairs and maintenance, is normally charged to profit or loss in the period in which it is incurred. In situations where the recognition criteria are satisfied, the expenditure for a major inspection is capitalized in the carrying amount of the asset as a replacement. Where significant parts of property, plant and equipment are required to be replaced at intervals, the Group recognizes such parts as individual assets with specific useful lives and depreciates them accordingly.
Depreciation is calculated on the straight-line basis to write off the cost of each item of property, plant and equipment to its residual value over its estimated useful life. The principal annual rates used for this purpose are as follows:
| Transportation facilities | 6 -10 years |
| Office and other equipment | 3 - 10 years |
| The depreciation method, residual values and useful lives are reviewed and adjusted, if appropriate, at the end of each reporting period. An item of property, plant and equipment including any significant part initially recognized is derecognized upon disposal or when no future economic benefits are expected from its use or disposal. Any gain or loss on disposal or retirement recognized in profit or loss in the year the asset is derecognized is the difference between the net sales proceeds and the carrying amount of the relevant asset. |
| |
| CIP represents buildings under construction, and plant and equipment pending for installation, and is stated at cost less any impairment losses. Cost comprises construction expenditures, other expenditures necessary for the purpose of preparing the CIP for its intended use and those borrowing costs incurred before the asset is ready for its intended use that is eligible for capitalization. CIP is transferred to property, plant and equipment when the CIP is ready for its intended use. |
The depreciation method, residual values and useful lives are reviewed and adjusted, if appropriate, at the end of each reporting period. An item of property, plant and equipment including any significant part initially recognized is derecognized upon disposal or when no future economic benefits are expected from its use or disposal. Any gain or loss on disposal or retirement recognized in profit or loss in the year the asset is derecognized is the difference between the net sales proceeds and the carrying amount of the relevant asset.
Construction in progress (“CIP”) represents buildings under construction, and plant and equipment pending for installation, and is stated at cost less any impairment losses. Cost comprises construction expenditures, other expenditures necessary for the purpose of preparing the CIP for its intended use and those borrowing costs incurred before the asset is ready for its intended use that is eligible for capitalisation. CIP is transferred to property, plant and equipment when the CIP is ready for its intended use.
ALUMINUM CORPORATION OF CHINA LIMITED AND ITS SUBSIDIARIES
NOTES TO THE CONSOLIDATED FINANCIAL STATEMENTS(Continued)
For the years ended December 31, 2015, 2016, 2017 and 20172018
(Amounts expressed in thousands of RMB unless otherwise stated)
| 2. | BASIS OF PREPARATION AND SIGNIFICANT ACCOUNTING POLICIES(Continued) |
| | | |
| | (a) | Goodwill |
| | | |
| | | Goodwill is initially measured at cost, being the excess of the aggregate of the consideration transferred, the amount recognized for non-controlling interests and any fair value of the Group’s previously held equity interests in the acquiree over the identifiable net assets acquired and liabilities assumed. If the sum of this consideration and other items is lower than the fair value of the net assets acquired, the difference is, after reassessment, recognized in profit or loss as a gain on bargain purchase. |
| | | |
| | | For the purpose of impairment testing, goodwill acquired in a business combination is allocated to each of the cash-generating units, or groups of cash-generating units, that is expected to benefit from the synergies of the combination. Each unit or group of units to which the goodwill is allocated represents the lowest level within the entity at which the goodwill is monitored for internal management purposes. Goodwill is monitored at the operating segment level. |
| | | |
| | | Goodwill impairment reviews are undertaken annually or more frequently if events or changes in circumstances indicate a potential impairment. Impairment is determined by assessing the recoverable amount of the cash-generating unit to which the goodwill relates. Where the recoverable amount of the cash-generating unit is less than the carrying amount, an impairment loss is recognized. An impairment loss recognized for goodwill is not reversed in a subsequent period. Any impairment is recognized immediately as an expense and is not subsequently reversed. |
| | | |
| | (b) | Mining rights and mineral exploration rights |
| | | |
| | | The Group's mineral exploration rights and mining rights relate to coal, bauxite and other mines. |
Goodwill is initially measured at cost, being the excess of the aggregate of the consideration transferred, the amount recognized for non-controlling interests and any fair value of the Group’s previously held equity interests in the acquiree over the identifiable net assets acquired and liabilities assumed. If the sum of this consideration and other items is lower than the fair value of the net assets acquired, the difference is, after reassessment, recognized in profit or loss as a gain on bargain purchase.
After initial recognition, goodwill is measured at cost less any accumulated impairment losses. Goodwill is tested for impairment annually or more frequently if events or changes in circumstances indicate that the carrying value may be impaired. The Group performs its annual impairment test of goodwill as at December 31. For the purpose of impairment testing, goodwill acquired in a business combination is, from the acquisition date, allocated to each of the Group’s cash-generating units, or groups of cash-generating units, that are expected to benefit from the synergies of the combination, irrespective of whether other assets or liabilities of the Group are assigned to those units or groups of units.
For the purpose of impairment testing, goodwill acquired in a business combination is allocated to each of the cash-generating units, or groups of cash-generating units, that is expected to benefit from the synergies of the combination. Each unit or group of units to which the goodwill is allocated represents the lowest level within the entity at which the goodwill is monitored for internal management purposes. Goodwill is monitored at the operating segment level.
Goodwill impairment reviews are undertaken annually or more frequently if events or changes in circumstances indicate a potential impairment. Impairment is determined by assessing the recoverable amount of the cash-generating unit to which the goodwill relates. Where the recoverable amount of the cash-generating unit is less than the carrying amount, an impairment loss is recognized. An impairment loss recognized for goodwill is not reversed in a subsequent period. Any impairment is recognized immediately as an expense and is not subsequently reversed.
Where goodwill has been allocated to a cash-generating unit (or group of cash-generating units) and part of the operation within that unit is disposed of, the goodwill associated with the operation disposed of is included in the carrying amount of the operation when determining the gain or loss on the disposal. Goodwill disposed of in these circumstances is measured based on the relative value of the operation disposed of and the portion of the cash-generating unit retained.
ALUMINUM CORPORATION OF CHINA LIMITED AND ITS SUBSIDIARIES
NOTES TO THE CONSOLIDATED FINANCIAL STATEMENTS(Continued)
For the years ended December 31, 2015, 2016, 2017 and 20172018
(Amounts expressed in thousands of RMB unless otherwise stated)
| 2. | BASIS OF PREPARATION AND SIGNIFICANT ACCOUNTING POLICIES(Continued) |
| | | | |
| 2.10 | Intangible assets(Continued) |
| | | | |
| | (b) | Mining rights and mineral exploration rights(Continued) |
The Group’s mineral exploration rights and mining rights relate to coal, bauxite and other mines.
Mineral exploration rights and mining rights are initially recorded at cost which includes the acquisition consideration, qualifying exploration and other direct costs. The mineral exploration rights are stated at cost less any impairment, and the mining rights are stated at cost less any amortization and impairment.
| | | | |
| | | | Mineral exploration rights and mining rights are initially recorded at cost which includes the acquisition consideration, qualifying exploration and other direct costs. The mineral exploration rights are stated at cost less any impairment, and the mining rights are stated at cost less any amortization and impairment. |
| | | | |
| | | (ii) | Reclassification |
Mineral exploration rights are converted to mining rights when technical feasibility and commercial viability of extracting a mineral resource are demonstrable, and are subject to amortization when commercial production has commenced.
The Group assesses the stage of each mine under construction to determine when a mine moves into the production stage. The criteria used to assess the start date are determined based on the unique nature of each mine construction project. The Group considers various relevant criteria, such as completion of a reasonable period of testing of the mine and equipment, ability to produce in saleable form (within specifications) and ability to sustain ongoing production to assess when a mine is substantially complete and ready for its intended use.
| | | | |
| | | | Mineral exploration rights are converted to mining rights when technical feasibility and commercial viability of extracting a mineral resource are demonstrable, and are subject to amortization when commercial production has commenced. |
| | | | |
| | | | The Group assesses the stage of each mine under construction to determine when a mine moves into the production stage. The criteria used to assess the start date are determined based on the unique nature of each mine construction project. The Group considers various relevant criteria, such as completion of a reasonable period of testing of the mine and equipment, ability to produce in saleable form (within specifications) and ability to sustain ongoing production to assess when a mine is substantially complete and ready for its intended use. |
| | | | |
| | | (iii) | Amortization |
Amortization of bauxite and other mining rights (except for coal mining rights) is provided on a straight-line basis according to the shorter of the expiration date of the mining certificate and the mineable period of natural resources. Estimated mineable periods of the majority of the mining rights range from 3 to 30 years.
Coal mining rights are amortized on a unit-of-production basis over the economically recoverable reserves evaluated based on the reserves estimated in accordance with the standards in the Solid Mineral Resource/Reserve Classification of the PRC (GB/T17766-1999) of the mine concerned.
| | | | |
| | | | Amortization of bauxite and other mining rights (except for coal mining rights) is provided on a straight-line basis according to the shorter of the expiration date of the mining certificate and the mineable period of natural resources. Estimated mineable periods of the majority of the mining rights range from 3 to 30 years. |
| | | | |
| | | | Coal mining rights are amortized on a unit-of-production basis over the economically recoverable reserves evaluated based on the reserves estimated in accordance with the standards in the Solid Mineral Resource/Reserve Classification of the PRC (GB/T17766-1999) of the mine concerned. |
| | | | |
| | | (iv) | Impairment |
| | | | |
| | | | An impairment review is performed when there are indicators that the carrying amount of the mineral exploration rights and mining rights may exceed their recoverable amounts. To the extent that this occurs, the excess is fully provided as an impairment loss. |
An impairment review is performed when there are indicators that the carrying amount of the mineral exploration rights and mining rights may exceed their recoverable amounts. To the extent that this occurs, the excess is fully provided as an impairment loss.
ALUMINUM CORPORATION OF CHINA LIMITED AND ITS SUBSIDIARIES
NOTES TO THE CONSOLIDATED FINANCIAL STATEMENTS(Continued)
For the years ended December 31, 2015, 2016, 2017 and 20172018
(Amounts expressed in thousands of RMB unless otherwise stated)
| 2. | BASIS OF PREPARATION AND SIGNIFICANT ACCOUNTING POLICIES(Continued) |
| | | |
| 2.10 | Intangible assets(Continued) |
Acquired computer software licences are capitalized on the basis of the costs incurred to acquire and bring to use specific software. These costs are amortized over their estimated useful lives, which do not exceed 10 years. Costs associated with maintaining computer software programmes are recognized as an expense as incurred.
| | | |
| | | Acquired computer software licences are capitalised on the basis of the costs incurred to acquire and bring to use specific software. These costs are amortized over their estimated useful lives, which do not exceed 10 years. Costs associated with maintaining computer software programmes are recognized as an expense as incurred. |
| | | |
| | (d) | Primary aluminum production quota |
Primary aluminum production quota are initially recorded at purchased costs incurred to acquire the quota. Amortization is calculated on the straight-line basis over the expected production period.
| (e) | Other intangible assets |
Other intangible assets mainly include profit-sharing rights of Maochang mine, which are initially recorded at costs incurred to acquire the specific right. Amortization is calculated on the straight-line basis over its estimated useful life. The estimated useful live of profit-sharing rights of Maochang mine is 22.5 years.
| | | |
| | | Other intangible assets mainly include profit-sharing rights of Maochang mine, which are initially recorded at costs incurred to acquire the specific right. Amortization is calculated on the straight-line basis over its estimated useful life. The estimated useful live of profit-sharing rights of Maochang mine is 22.5 years. |
| | | |
| | (e)(f) | Periodic review of the useful lives and amortization method |
For intangible assets with finite useful lives, the estimated useful lives and amortization method are reviewed annually at the end of each reporting period and adjusted when necessary.
| | | |
| | | For intangible assets with finite useful lives, the estimated useful lives and amortization method are reviewed annually at the end of each reporting period and adjusted when necessary. |
| | | |
| 2.11 | Research and development costs |
Research and development expenditures are classified as research expenditures and development expenditures according to the nature of the expenditures and whether there is significant uncertainty of development activities transforming to assets.
Research expenditures are recognized in profit or loss for the current period. Development expenditures are recognized as assets when all of the following criteria are met:
| | | |
| | Research and development expenditures are classified as research expenditures and development expenditures according to the nature of the expenditures and whether there is significant uncertainty of development activities transforming to assets. |
| | | |
| | Research expenditures are recognized in profit or loss for the current period. Development expenditures are recognized as assets when all of the following criteria are met: |
| | | |
| | (i) | it is technically feasible to complete the asset so that it will be available for use or sale; |
| | | |
| | (ii) | management intends to complete the asset and intends and has the ability to use or sell it; |
| | | |
| | (iii) | it can be demonstrated that the asset will generate probable future economic benefits; |
| | | |
| | (iv) | there are adequate technical, financial and other resources to complete the development of the asset and management has the ability to use or sell the asset; and |
| | | |
| | (v) | the expenditure attributable to the asset during its development phase can be reliably measured. |
| | | |
| | |
Development expenditures that do not meet the criteria above are recorded in profit or loss for the current period as incurred. Development expenditures that have been recorded in profit or loss in previous periods will be not recognized as assets in subsequent periods. The Group has not had any development expenditure capitalized.
ALUMINUM CORPORATION OF CHINA LIMITED AND ITS SUBSIDIARIES
NOTES TO THE CONSOLIDATED FINANCIAL STATEMENTS(Continued)
For the years ended December 31, 2016, 2017 and 2018
(Amounts expressed in thousands of RMB unless otherwise stated)
| 2. | BASIS OF PREPARATION AND SIGNIFICANT ACCOUNTING POLICIES(Continued) |
| 2.12 | Impairment of non-financial assets |
Where an indication of impairment exists, or when annual impairment testing for an asset is required (other than inventories, for example, goodwill or intangible assets with an indefinite useful life), the asset’s recoverable amount is estimated. An asset’s recoverable amount is the higher of the asset’s or cash-generating unit’s value in use and its fair value less costs of disposal, and is determined for an individual asset, unless the asset does not generate cash inflows that are largely independent of those from other assets or groups of assets, in which case the recoverable amount is determined for the cash-generating unit to which the asset belongs.
An impairment loss is recognized only if the carrying amount of an asset exceeds its recoverable amount. In assessing value in use, the estimated future cash flows are discounted to their present value using a pre-tax discount rate that reflects current market assessments of the time value of money and the risks specific to the asset. An impairment loss is charged to profit or loss in the period in which it arises.
An assessment is made at the end of each reporting period as to whether there is an indication that previously recognized impairment losses may no longer exist or may have decreased. If such an indication exists, the recoverable amount is estimated. A previously recognized impairment loss of an asset other than goodwill is reversed only if there has been a change in the estimates used to determine the recoverable amount of that asset, but not to an amount higher than the carrying amount that would have been determined (net of any depreciation/amortization) had no impairment loss been recognized for the asset in prior years. A reversal of such an impairment loss is credited to profit or loss in the period in which it arises.
ALUMINUM CORPORATION OF CHINA LIMITED AND ITS SUBSIDIARIES
NOTES TO THE CONSOLIDATED FINANCIAL STATEMENTS(Continued)
For the years ended December 31, 2016, 2017 and 2018
(Amounts expressed in thousands of RMB unless otherwise stated)
| 2. | BASIS OF PREPARATION AND SIGNIFICANT ACCOUNTING POLICIES(Continued) |
| 2.13 | Investment properties |
Investment properties are interests in land and buildings (including the leasehold interest under an operating lease for a property which would otherwise meet the definition of an investment property) held to earn rental income and/or for capital appreciation, rather than for use in the production or supply of goods or services or for administrative purposes; or for sale in the ordinary course of business. Such properties are measured initially at cost, including transaction costs. After initial recognition, the Group uses the cost model to measure all of its investment properties.
Depreciation is calculated on the straight-line basis to write off the cost to investment property’s residual value over its estimated useful life. The estimated useful lives are as follows:
| Land use rights | 40-70 years |
The carrying amounts of investment properties measured using the cost method are reviewed for impairment when events or changes in circumstances indicate that the carrying amounts may not be recoverable.
Any gains or losses on the retirement or disposal of an investment property are recognized in profit or loss in the year of the retirement or disposal.
| 2.14 | Non-current assets and disposal groups held for sale |
Non-current assets and disposal groups are classified as held for sale if their carrying amounts will be recovered principally through a sales transaction rather than through continuing use. For this to be the case, the asset or disposal group must be available for immediate sale in its present condition subject only to terms that are usual and customary for the sale of such assets or disposal groups and its sale must be highly probable. All assets and liabilities of a subsidiary classified as a disposal group are reclassified as held for sale regardless of whether the Group retains a non-controlling interest in its former subsidiary after the sale.
Non-current assets and disposal groups (other than financial assets) classified as held for sale are measured at the lower of their carrying amounts and fair values less costs to sell. Property, plant and equipment and intangible assets classified as held for sale are not depreciated or amortized.
ALUMINUM CORPORATION OF CHINA LIMITED AND ITS SUBSIDIARIES
NOTES TO THE CONSOLIDATED FINANCIAL STATEMENTS(Continued)
For the years ended December 31, 2016, 2017 and 2018
(Amounts expressed in thousands of RMB unless otherwise stated)
| 2. | BASIS OF PREPARATION AND SIGNIFICANT ACCOUNTING POLICIES(Continued) |
Policies under IFRS 9 applicable from January 1, 2018
Initial recognition and measurement
Financial assets are classified, at initial recognition, as subsequently measured at amortized cost, fair value through other comprehensive income, and fair value through profit or loss.
The classification of financial assets at initial recognition depends on the financial asset’s contractual cash flow characteristics and the Group’s business model for managing them. With the exception of trade receivables that do not contain a significant financing component or for which the Group has applied the practical expedient of not adjusting the effect of a significant financing component, the Group initially measures a financial asset at its fair value, plus in the case of a financial asset not at fair value through profit or loss, transaction costs. Trade receivables that do not contain a significant financing component or for which the Group has applied the practical expedient are measured at the transaction price determined under IFRS 15 in accordance with the policies set out for “Revenue recognition (applicable from January 1, 2018)” below.
In order for a financial asset to be classified and measured at amortized cost or fair value through other comprehensive income, it needs to give rise to cash flows that are solely payments of principal and interest (“SPPI”) on the principal amount outstanding.
The Group’s business model for managing financial assets refers to how it manages its financial assets in order to generate cash flows. The business model determines whether cash flows will result from collecting contractual cash flows, selling the financial assets, or both.
All regular way purchases and sales of financial assets are recognized on the trade date, that is, the date that the Group commits to purchase or sell the asset. Regular way purchases or sales are purchases or sales of financial assets that require delivery of assets within the period generally established by regulation or convention in the marketplace.
Subsequent measurement
The subsequent measurement of financial assets depends on their classification as follows:
ALUMINUM CORPORATION OF CHINA LIMITED AND ITS SUBSIDIARIES
NOTES TO THE CONSOLIDATED FINANCIAL STATEMENTS(Continued)
For the years ended December 31, 2016, 2017 and 2018
(Amounts expressed in thousands of RMB unless otherwise stated)
| 2. | BASIS OF PREPARATION AND SIGNIFICANT ACCOUNTING POLICIES(Continued) |
| 2.15 | Financial assets (continued) |
Policies under IFRS 9 applicable from January 1, 2018 (continued)
Financial assets at amortized cost (debt instruments)
The Group measures financial assets at amortized cost if both of the following conditions are met:
| ● | Financial asset is held within a business model with the objective to hold financial assets in order to collect contractual cash flows. |
| ● | Contractual terms of the financial asset give rise on specified dates to cash flows that are solely payments of principal and interest on the principal amount outstanding. |
Financial assets at amortized cost are subsequently measured using the effective interest method and are subject to impairment. Gains and losses are recognized in the consolidated statement of profit or loss and other comprehensive income when the asset is derecognized, modified or impaired.
Financial assets designated at fair value through other comprehensive income (equity investments)
Upon initial recognition, the Group can elect to classify irrevocably its equity investments as equity investments designated at fair value through other comprehensive income when they meet the definition of equity under IAS 32 Financial Instruments: Presentation and are not held for trading. The classification is determined on an instrument-by-instrument basis.
Gains and losses on these financial assets are never recycled to the statement of profit or loss. Dividends are recognized as other gains in the consolidated statement of profit or loss and other comprehensive income when the right of payment has been established, it is probable that the economic benefits associated with the dividend will flow to the Group and the amount of the dividend can be measured reliably, except when the Group benefits from such proceeds as a recovery of part of the cost of the financial asset, in which case, such gains are recorded in other comprehensive income. Equity investments designated at fair value through other comprehensive income are not subject to impairment assessment.
ALUMINUM CORPORATION OF CHINA LIMITED AND ITS SUBSIDIARIES
NOTES TO THE CONSOLIDATED FINANCIAL STATEMENTS(Continued)
For the years ended December 31, 2016, 2017 and 2018
(Amounts expressed in thousands of RMB unless otherwise stated)
| 2. | BASIS OF PREPARATION AND SIGNIFICANT ACCOUNTING POLICIES(Continued) |
| 2.15 | Financial assets(Continued) |
Policies under IFRS 9 applicable from January 1, 2018 (continued)
Financial assets at fair value through profit or loss
Financial assets at fair value through profit or loss include financial assets held for trading, financial assets designated upon initial recognition at fair value through profit or loss, or financial assets mandatorily required to be measured at fair value. Financial assets are classified as held for trading if they are acquired for the purpose of selling or repurchasing in the near term. Derivatives, including separated embedded derivatives, are also classified as held for trading unless they are designated as effective hedging instruments. Financial assets with cash flows that are not solely payments of principal and interest are classified and measured at fair value through profit or loss, irrespective of the business model. Notwithstanding the criteria for debt instruments to be classified at amortized cost or at fair value through other comprehensive income, as described above, debt instruments may be designated at fair value through profit or loss on initial recognition if doing so eliminates, or significantly reduces, an accounting mismatch.
Financial assets at fair value through profit or loss are carried in the statement of financial position at fair value with net changes in fair value recognized in profit or loss.
This category includes derivative instruments and equity investments which the Group had not irrevocably elected to classify at fair value through other comprehensive income. Dividends on equity investments classified as financial assets at fair value through profit or loss are also recognized as other gains in profit or loss when the right of payment has been established, it is probable that the economic benefits associated with the dividend will flow to the Group and the amount of the dividend can be measured reliably.
A derivative embedded in a hybrid contract, with a financial liability or non-financial host, is separated from the host and accounted for as a separate derivative if the economic characteristics and risks are not closely related to the host; a separate instrument with the same terms as the embedded derivative would meet the definition of a derivative; and the hybrid contract is not measured at fair value through profit or loss. Embedded derivatives are measured at fair value with changes in fair value recognized in profit or loss. Reassessment only occurs if there is either a change in the terms of the contract that significantly modifies the cash flows that would otherwise be required or a reclassification of a financial asset out of the fair value through profit or loss category.
A derivative embedded within a hybrid contract containing a financial asset host is not accounted for separately. The financial asset host together with the embedded derivative is required to be classified in its entirety as a financial asset at fair value through profit or loss.
ALUMINUM CORPORATION OF CHINA LIMITED AND ITS SUBSIDIARIES
NOTES TO THE CONSOLIDATED FINANCIAL STATEMENTS(Continued)
For the years ended December 31, 2016, 2017 and 2018
(Amounts expressed in thousands of RMB unless otherwise stated)
| 2. | BASIS OF PREPARATION AND SIGNIFICANT ACCOUNTING POLICIES(Continued) |
| 2.15 | Financial assets(Continued) |
Policies under IFRS 9 applicable from January 1, 2018 (continued)
Impairment of financial assets
The Group recognizes an allowance for ECLs for all debt instruments not held at fair value through profit or loss. ECLs are based on the difference between the contractual cash flows due in accordance with the contract and all the cash flows that the Group expects to receive, discounted at an approximation of the original effective interest rate. The expected cash flows will include cash flows from the sale of collateral held or other credit enhancements that are integral to the contractual terms.
General approach
ECLs are recognized in two stages. For credit exposures for which there has not been a significant increase in credit risk since initial recognition, ECLs are provided for credit losses that result from default events that are possible within the next 12 months (a 12-month ECL). For those credit exposures for which there has been a significant increase in credit risk since initial recognition, a loss allowance is required for credit losses expected over the remaining life of the exposure, irrespective of the timing of the default (a lifetime ECL).
At each reporting date, the Group assesses whether the credit risk on a financial instrument has increased significantly since initial recognition. When making the assessment, the Group compares the risk of a default occurring on the financial instrument as at the reporting date with the risk of a default occurring on the financial instrument as at the date of initial recognition and considers reasonable and supportable information that is available without undue cost or effort, including historical and forward-looking information.
The Group considers a financial asset to be in default when internal or external information indicates that the Group is unlikely to receive the outstanding contractual amounts in full before taking into account any credit enhancements held by the Group. A financial asset is written off when there is no reasonable expectation of recovering the contractual cash flows.
Debt investments at fair value through other comprehensive income and financial assets at amortized cost are subject to impairment under the general approach and they are classified within the following stages for measurement of ECLs except for trade receivables and contract assets which apply the simplified approach as detailed below.
ALUMINUM CORPORATION OF CHINA LIMITED AND ITS SUBSIDIARIES
NOTES TO THE CONSOLIDATED FINANCIAL STATEMENTS(Continued)
For the years ended December 31, 2016, 2017 and 2018
(Amounts expressed in thousands of RMB unless otherwise stated)
| 2. | BASIS OF PREPARATION AND SIGNIFICANT ACCOUNTING POLICIES(Continued) |
| 2.15 | Financial assets(Continued) |
Policies under IFRS 9 applicable from January 1, 2018 (continued)
Impairment of financial assets (continued)
| Stage 1 - | Financial instruments for which credit risk has not increased significantly since initial recognition and for which the loss allowance is measured at an amount equal to 12-month ECLs |
| Stage 2 - | Financial instruments for which credit risk has increased significantly since initial recognition but that are not credit-impaired financial assets and for which the loss allowance is measured at an amount equal to lifetime ECLs |
| Stage 3 - | Financial assets that are credit-impaired at the reporting date (but that are not purchased or originated credit-impaired) and for which the loss allowance is measured at an amount equal to lifetime ECLs |
Simplified approach
For trade receivables and contract assets that do not contain a significant financing component or when the Group applies the practical expedient of not adjusting the effect of a significant financing component, the Group applies the simplified approach in calculating ECLs. Under the simplified approach, the Group does not track changes in credit risk, but instead recognizes a loss allowance based on lifetime ECLs at each reporting date. The Group has established a provision matrix that is based on its historical credit loss experience, adjusted for forward-looking factors specific to the debtors and the economic environment.
For trade receivables and contract assets that contain a significant financial component and lease receivable, the Group chooses as its accounting policy to adopt the simplified approach in calculating ECLs with policies as described above.
ALUMINUM CORPORATION OF CHINA LIMITED AND ITS SUBSIDIARIES
NOTES TO THE CONSOLIDATED FINANCIAL STATEMENTS(Continued)
For the years ended December 31, 2016, 2017 and 2018
(Amounts expressed in thousands of RMB unless otherwise stated)
| 2. | BASIS OF PREPARATION AND SIGNIFICANT ACCOUNTING POLICIES(Continued) |
| 2.15 | Financial assets(Continued) |
Policies under IAS 39 applicable before January 1, 2018
Classification
The Group classifies its financial assets in the following categories: financial assets at fair value through profit or loss, loans and receivables and available-for-sale financial investments. The classification depends on the purpose for which the financial assets were acquired. Management determines the classification of its financial assets at initial recognition.
| (i) | Financial assets at fair value through profit or loss for the current period as incurred. Development expenditures that have been recorded in profit or loss in previous periods will be not recognized as assets in subsequent periods. The Group has not had any development expenditure capitalised. |
Financial assets at fair value through profit or loss include financial assets held for trading and financial assets designated upon initial recognition as at fair value through profit or loss. Financial assets are classified as held for trading if they are acquired for the purposes of sale in the near term. Derivatives, including separated embedded derivatives, are also classified as held for trading unless they are designated as effective hedging instruments as defined by IAS 39.
Financial assets at fair value through profit or loss are carried in the consolidated statement of financial position at fair value with positive net changes in fair value presented as other income and gains and negative net changes in fair value presented as finance costs in profit or loss. These net fair value changes do not include any dividends or interest earned on these financial assets, which are recognized in accordance with the policies set out for “Revenue recognition” (applicable before January 1, 2018) below.
Financial assets designated upon initial recognition as at fair value through profit or loss are designated at the date of initial recognition and only if the criteria in IAS 39 are satisfied.
Derivatives embedded in host contracts are accounted for as separate derivatives and recorded at fair value if their economic characteristics and risks are not closely related to those of the host contracts and the host contracts are not held for trading or designated as at fair value through profit or loss. These embedded derivatives are measured at fair value with changes in fair value recognized in profit or loss. Reassessment only occurs if there is either a change in the terms of the contract that significantly modifies the cash flows that would otherwise be required or a reclassification of a financial asset out of the fair value through profit or loss category.
ALUMINUM CORPORATION OF CHINA LIMITED AND ITS SUBSIDIARIES
NOTES TO THE CONSOLIDATED FINANCIAL STATEMENTS(Continued)
For the years ended December 31, 2016, 2017 and 2018
(Amounts expressed in thousands of RMB unless otherwise stated)
| 2. | BASIS OF PREPARATION AND SIGNIFICANT ACCOUNTING POLICIES(Continued) |
| 2.15 | Financial assets(Continued) |
Policies under IAS 39 applicable before January 1, 2018 (continued)
Classification (continued)
| (ii) | Loans and receivables |
Loans and receivables are non-derivative financial assets with fixed or determinable payments that are not quoted in an active market. After initial measurement, such assets are subsequently measured at amortized cost using the effective interest rate method less any allowance for impairment. Amortized cost is calculated by taking into account any discount or premium on acquisition and includes fees or costs that are an integral part of the effective interest rate. The effective interest rate amortization is included in other income and gains in profit or loss. The loss arising from impairment is recognized in profit or loss in finance costs for loans and in impairment losses of financial assets for receivables.
| (iii) | Available-for-sale financial investments |
Available-for-sale financial investments are non-derivative financial assets in listed and unlisted equity investments and debt securities. Equity investments classified as available for sale are those which are neither classified as held for trading nor designated as at fair value through profit or loss. Debt securities in this category are those which are intended to be held for an indefinite period of time and which may be sold in response to needs for liquidity or in response to changes in market conditions.
After initial recognition, available-for-sale financial investments are subsequently measured at fair value, with unrealized gains or losses recognized as other comprehensive income in the available-for-sale investment revaluation reserve until the investment is derecognized, at which time the cumulative gain or loss is recognized in profit or loss in other income, or until the investment is determined to be impaired, when the cumulative gain or loss is reclassified from the available-for-sale investment revaluation reserve to profit or loss in other gains. Interest and dividends earned whilst holding the available-for-sale financial investments are reported as interest income and dividend income, respectively and are recognized in profit or loss as other gains in accordance with the policies set out for “Interest income” and “Dividend income” below.
F-42
ALUMINUM CORPORATION OF CHINA LIMITED AND ITS SUBSIDIARIES
NOTES TO THE CONSOLIDATED FINANCIAL STATEMENTS(Continued)
For the years ended December 31, 2016, 2017 and 2018
(Amounts expressed in thousands of RMB unless otherwise stated)
| 2. | BASIS OF PREPARATION AND SIGNIFICANT ACCOUNTING POLICIES(Continued) |
| 2.15 | Financial assets(Continued) |
Policies under IAS 39 applicable before January 1, 2018 (continued)
Classification (continued)
| (iii) | Available-for-sale financial investments (continued) |
When the fair value of unlisted equity investments cannot be reliably measured because (a) the variability in the range of reasonable fair value estimates is significant for that investment or (b) the probabilities of the various estimates within the range cannot be reasonably assessed and used in estimating fair value, such investments are stated at cost less any impairment losses.
The Group evaluates whether the ability and intention to sell its available-for-sale financial assets in the near term are still appropriate. When, in rare circumstances, the Group is unable to trade these financial assets due to inactive markets, the Group may elect to reclassify these financial assets if management has the ability and intention to hold the assets for the foreseeable future or until maturity.
For a financial asset reclassified from the available-for-sale category, the fair value carrying amount at the date of reclassification becomes its new amortized cost and any previous gain or loss on that asset that has been recognized in equity is amortized to profit or loss over the remaining life of the investment using the effective interest rate. Any difference between the new amortized cost and the maturity amount is also amortized over the remaining life of the asset using the effective interest rate. If the asset is subsequently determined to be impaired, then the amount recorded in equity is reclassified to profit or loss.
ALUMINUM CORPORATION OF CHINA LIMITED AND ITS SUBSIDIARIES
NOTES TO THE CONSOLIDATED FINANCIAL STATEMENTS(Continued)
For the years ended December 31, 2016, 2017 and 2018
(Amounts expressed in thousands of RMB unless otherwise stated)
| 2. | BASIS OF PREPARATION AND SIGNIFICANT ACCOUNTING POLICIES(Continued) |
| 2.15 | Financial assets(Continued) |
Policies under IAS 39 applicable before January 1, 2018 (continued)
Recognition and measurement
All regular purchases and sales of financial assets are recognized on the trade date, that is the date that the Group commits to purchase or sell the asset. Regular way purchases or sales are purchases or sales of financial assets that require delivery of assets within the period generally established by regulation or convention in the marketplace. Investments are initially recognized at fair value plus transaction costs, except in the case of financial assets recorded at fair value through profit or loss. Financial assets carried at fair value through profit or loss are initially recognized at fair value and transaction costs are expensed in profit or loss. Financial assets are derecognized when the rights to receive cash flows from the investments have expired or have been transferred and the Group has transferred substantially all risks and rewards of ownership. Available-for-sale financial investments and financial assets at fair value through profit or loss are subsequently carried at fair value. Loans and receivables are subsequently carried at amortized cost using the effective interest method.
Impairment of financial assets
The Group assesses at the end of each reporting period whether there is objective evidence that a financial asset or a group of financial assets is impaired. An impairment exists if one or more events that occurred after the initial recognition of the asset have an impact on the estimated future cash flows of the financial asset or the group of financial assets that can be reliably estimated. Evidence of impairment may include indications that a debtor or a group of debtors is experiencing significant financial difficulty, default or delinquency in interest or principal payments, the probability that they will enter bankruptcy or other financial reorganisation and observable data indicating that there is a measurable decrease in the estimated future cash flows, such as changes in arrears or economic conditions that correlate with defaults.
Financial assets carried at amortized cost
For financial assets carried at amortized cost, the Group assesses whether impairment exists individually for financial assets.
The amount of any impairment loss identified is measured as the difference between the asset’s carrying amount and the present value of estimated future cash flows (excluding future credit losses that have not yet been incurred). The present value of the estimated future cash flows is discounted at the financial asset’s original effective interest rate (i.e., the effective interest rate computed at initial recognition).
The carrying amount of the asset is reduced through the use of an allowance account and the loss is recognized in profit or loss. Interest income continues to be accrued on the reduced carrying amount using the rate of interest used to discount the future cash flows for the purpose of measuring the impairment loss. Loans and receivables together with any associated allowance are written off when there is no realistic prospect of future recovery and all collateral has been realized or has been transferred to the Group.
If, in a subsequent period, the amount of the estimated impairment loss increases or decreases because of an event occurring after the impairment was recognized, the previously recognized impairment loss is increased or reduced by adjusting the allowance account. If a write-off is later recovered, the recovery is credited to other gains in profit or loss.
ALUMINUM CORPORATION OF CHINA LIMITED AND ITS SUBSIDIARIES
NOTES TO THE CONSOLIDATED FINANCIAL STATEMENTS(Continued)
For the years ended December 31, 2015, 2016, 2017 and 20172018
(Amounts expressed in thousands of RMB unless otherwise stated)
| 2. | BASIS OF PREPARATION AND SIGNIFICANT ACCOUNTING POLICIES(Continued) |
| 2.15 | |
| 2.12 | Impairment of non-financialFinancial assets |
| | |
| | Where an indication of impairment exists, or when annual impairment testing for an asset is required (other than inventories, for example goodwill or intangible assets with indefinite useful life), the asset's recoverable amount is estimated. An asset's recoverable amount is the higher of the asset's or cash-generating unit's value in use and its fair value less costs of disposal, and is determined for an individual asset, unless the asset does not generate cash inflows that are largely independent of those from other assets or groups of assets, in which case the recoverable amount is determined for the cash-generating unit to which the asset belongs. |
| | |
| | An impairment loss is recognized only if the carrying amount of an asset exceeds its recoverable amount. In assessing value in use, the estimated future cash flows are discounted to their present value using a pre-tax discount rate that reflects current market assessments of the time value of money and the risks specific to the asset. An impairment loss is charged to profit or loss in the period in which it arises in those expense categories consistent with the function of the impaired asset. |
| | |
| | An assessment is made at the end of each reporting period as to whether there is an indication that previously recognized impairment losses may no longer exist or may have decreased. If such an indication exists, the recoverable amount is estimated. A previously recognized impairment loss of an asset other than goodwill is reversed only if there has been a change in the estimates used to determine the recoverable amount of that asset, but not to an amount higher than the carrying amount that would have been determined (net of any depreciation/amortization) had no impairment loss been recognized for the asset in prior years. A reversal of such an impairment loss is credited to profit or loss in the period in which it arises.(Continued) |
Policies under IAS 39 applicable before January 1, 2018 (continued)
Impairment of financial assets (Continued)
Available-for-sale financial investments
For available-for-sale financial investments, the Group assesses at the end of each reporting period whether there is objective evidence that an investment or a group of investments is impaired.
If an available-for-sale asset is impaired, an amount comprising the difference between its cost (net of any principal payment and amortization) and its current fair value, less any impairment loss previously recognized in profit or loss, is removed from other comprehensive income and recognized in profit or loss.
In the case of equity investments classified as available-for-sale financial investments, a significant or prolonged decline in the fair value of the security below its cost is considered as an indicator that the securities are impaired. If any such evidence exists for available-for-sale financial investments, the cumulative loss – measured as the difference between the acquisition cost and the current fair value, less any impairment loss on that financial asset previously recognized in other comprehensive income – is removed from other comprehensive income and recognized in profit or loss. Impairment losses recognized in profit or loss on equity instruments are not reversed through profit or loss.
ALUMINUM CORPORATION OF CHINA LIMITED AND ITS SUBSIDIARIES
NOTES TO THE CONSOLIDATED FINANCIAL STATEMENTS(Continued)
For the years ended December 31, 2015, 2016, 2017 and 20172018
(Amounts expressed in thousands of RMB unless otherwise stated)
| 2. | BASIS OF PREPARATION AND SIGNIFICANT ACCOUNTING POLICIES(Continued) |
| | |
| 2.13 | Investment properties |
| | |
| | Investment properties are interests in land and buildings (including the leasehold interest under an operating lease for a property which would otherwise meet the definition of an investment property) held to earn rental income and/or for capital appreciation, rather than for use in the production or supply of goods or services or for administrative purposes; or for sale in the ordinary course of business. Such properties are measured initially at cost, including transaction costs. After initial recognition, the Group uses the cost model to measure all of its investment properties. |
| | |
| | Depreciation is calculated on the straight-line basis to write off the cost to investment property’s residual value over its estimated useful life. The estimated useful lives are as follows: |
| Buildings2.15 | 50 years |
| Land use rights | 40-70 yearsFinancial assets(Continued) |
Policies under IAS 39 applicable before January 1, 2018 (continued)
| | The carrying amounts of investment properties measured using the cost method are reviewed for impairment when events or changes in circumstances indicate that the carrying amounts may not be recoverable. |
| | |
| | Any gains or losses on the retirement or disposal of an investment property are recognized in profit or loss in the year of the retirement or disposal. |
| | |
| 2.14 | Non-current assets and disposal groups held for sale |
| | |
| | Non-current assets and disposal groups are classified as held for sale if their carrying amounts will be recovered principally through a sales transaction rather than through continuing use. For this to be the case, the asset or disposal group must be available for immediate sale in its present condition subject only to terms that are usual and customary for the sale of such assets or disposal groups and its sale must be highly probable. All assets and liabilities of a subsidiary classified as a disposal group are reclassified as held for sale regardless of whether the Group retains a non-controlling interest in its former subsidiary after the sale. |
| | |
| | Non-current assets and disposal groups (other than financial assets) classified as held for sale are measured at the lower of their carrying amounts and fair values less costs to sell. Property, plant and equipment and intangible assets classified as held for sale are not depreciated or amortized. |
Impairment of financial assets (continued)
Available-for-sale financial investments (continued)
The determination of what is “significant” or “prolonged” requires judgement. In making this judgement, the Group evaluates, among other factors, the duration or extent to which the fair value of an investment is less than its cost.
In the case of debt instruments classified as available for sale, impairment is assessed based on the same criteria as financial assets carried at amortized cost. However, the amount recorded for impairment is the cumulative loss measured as the difference between the amortized cost and the current fair value, less any impairment loss on that investment previously recognized in profit or loss. Future interest income continues to be accrued based on the reduced carrying amount of the asset and is accrued using the rate of interest used to discount the future cash flows for the purpose of measuring the impairment loss. The interest income is recorded as part of finance income. Impairment losses on debt instruments are reversed through profit or loss if the subsequent increase in fair value of the instruments can be objectively related to an event occurring after the impairment loss was recognized in profit or loss.
ALUMINUM CORPORATION OF CHINA LIMITED AND ITS SUBSIDIARIES
NOTES TO THE CONSOLIDATED FINANCIAL STATEMENTS(Continued)
For the years ended December 31, 2015, 2016 and 2017
(Amounts expressed in thousands of RMB unless otherwise stated)
2. | BASIS OF PREPARATION AND SIGNIFICANT ACCOUNTING POLICIES(Continued) |
| | | | |
| 2.15 | Financial assets |
| | | | |
| | (a) | Classification |
| | | | |
| | | The Group classifies its financial assets in the following categories: at fair value through profit or loss, loans and receivables and available-for-sale financial investments. The classification depends on the purpose for which the financial assets were acquired. Management determines the classification of its financial assets at initial recognition. |
| | | | |
| | | (i) | Financial assets at fair value through profit or loss |
| | | | |
| | | | Financial assets at fair value through profit or loss include financial assets held for trading and financial assets designated upon initial recognition as at fair value through profit or loss. Financial assets are classified as held for trading if they are acquired for the purposes of sale in the near term. Derivatives, including separated embedded derivatives, are also classified as held for trading unless they are designated as effective hedging instruments as defined by IAS 39. |
| | | | |
| | | | Financial assets at fair value through profit or loss are carried in the consolidated statement of financial position at fair value with positive net changes in fair value presented as other income and gains and negative net changes in fair value presented as finance cost in profit or loss. These net fair value changes do not include any dividends or interest earned on these financial assets, which are recognized in accordance with the policies set out for “Revenue recognition“ below. |
| | | | |
| | | | Financial assets designated upon initial recognition as at fair value through profit or loss are designated at the date of initial recognition and only if the criteria in IAS 39 are satisfied. |
| | | | |
| | | | Derivatives embedded in host contracts are accounted for as separate derivatives and recorded at fair value if their economic characteristics and risks are not closely related to those of the host contracts and the host contracts are not held for trading or designated as at fair value through profit or loss. These embedded derivatives are measured at fair value with changes in fair value recognized in profit or loss. Reassessment only occurs if there is either a change in the terms of the contract that significantly modifies the cash flows that would otherwise be required or a reclassification of a financial asset out of the fair value through profit or loss category. |
ALUMINUM CORPORATION OF CHINA LIMITED AND ITS SUBSIDIARIES
NOTES TO THE CONSOLIDATED FINANCIAL STATEMENTS(Continued)
For the years ended December 31, 2015, 2016, 2017 and 20172018
(Amounts expressed in thousands of RMB unless otherwise stated)
| 2. | BASIS OF PREPARATION AND SIGNIFICANT ACCOUNTING POLICIES(Continued) |
| | | | |
| 2.15 | Financial assets(Continued) |
| | | | |
| | (a) | Classification(Continued) |
| | | | |
| | | (ii) | Loans and receivables |
| | | | |
| | | | Loans and receivables are non-derivative financial assets with fixed or determinable payments that are not quoted in an active market. After initial measurement, such assets are subsequently measured at amortized cost using the effective interest rate method less any allowance for impairment. Amortized cost is calculated by taking into account any discount or premium on acquisition and includes fees or costs that are an integral part of the effective interest rate. The effective interest rate amortization is included in other income and gains in profit or loss. The loss arising from impairment is recognized in profit or loss in finance costs for loans and in other expenses for receivables. |
| | | | |
| | | (iii) | Available-for-sale financial investments |
| | | | |
| | | | Available-for-sale financial investments are non-derivative financial assets in listed and unlisted equity investments and debt securities. Equity investments classified as available for sale are those which are neither classified as held for trading nor designated as at fair value through profit or loss. Debt securities in this category are those which are intended to be held for an indefinite period of time and which may be sold in response to needs for liquidity or in response to changes in market conditions. |
| | | | |
| | | | After initial recognition, available-for-sale financial investments are subsequently measured at fair value, with unrealized gains or losses recognized as other comprehensive income in the available-for-sale investment revaluation reserve until the investment is derecognized, at which time the cumulative gain or loss is recognized in profit or loss in other income, or until the investment is determined to be impaired, when the cumulative gain or loss is reclassified from the available-for-sale investment revaluation reserve to profit or loss in other gains or losses. Interest and dividends earned whilst holding the available-for-sale financial investments are reported as interest income and dividend income, respectively and are recognized in profit or loss as other income in accordance with the policies set out for “Interest income“ and “Dividend income” below. |
Policies under IAS 39 applicable before January 1, 2018 (continued)
ALUMINUM CORPORATION OF CHINA LIMITED AND ITS SUBSIDIARIESDerecognition of financial assets
NOTES TO THE CONSOLIDATED FINANCIAL STATEMENTS(Continued)
ForA financial asset (or, where applicable, a part of a financial asset or part of a group of similar financial assets) is primarily derecognized (i.e. removed from the years ended December 31, 2015, 2016 and 2017Group’s consolidated statement of financial position) when:
(Amounts expressed in thousands of RMB unless otherwise stated)
2. | BASIS OF PREPARATION AND SIGNIFICANT ACCOUNTING POLICIES(Continued) |
| | | | |
| 2.15 | Financial assets(Continued) |
| | | | |
| | (a) | Classification(Continued) |
| | | | |
| | | (iii) | Available-for-sale financial investments (Continued) |
| | | | |
| | | | When the fair value of unlisted equity investments cannot be reliably measured because (a) the variability in the range of reasonable fair value estimates is significant for that investment or (b) the probabilities of the various estimates within the range cannot be reasonably assessed and used in estimating fair value, such investments are stated at cost less any impairment losses. |
| | | | |
| | | | The Group evaluates whether the ability and intention to sell its available-for-sale financial assets in the near term are still appropriate. When, in rare circumstances, the Group is unable to trade these financial assets due to inactive markets, the Group may elect to reclassify these financial assets if management has the ability and intention to hold the assets for the foreseeable future or until maturity. |
| | | | |
| | | | For a financial asset reclassified from the available-for-sale category, the fair value carrying amount at the date of reclassification becomes its new amortized cost and any previous gain or loss on that asset that has been recognized in equity is amortized to profit or loss over the remaining life of the investment using the effective interest rate. Any difference between the new amortized cost and the maturity amount is also amortized over the remaining life of the asset using the effective interest rate. If the asset is subsequently determined to be impaired, then the amount recorded in equity is reclassified to profit or loss. |
| | | | |
| | (b) | Recognition and measurement |
| | | | |
| | | All regular purchases and sales of financial assets are recognized on the trade date, that is the date that the Group commits to purchase or sell the asset. Regular way purchases or sales are purchases or sales of financial assets that require delivery of assets within the period generally established by regulation or convention in the marketplace. Investments are initially recognized at fair value plus transaction costs, except in the case of financial assets recorded at fair value through profit or loss. Financial assets carried at fair value through profit or loss are initially recognized at fair value and transaction costs are expensed in profit or loss. Financial assets are derecognized when the rights to receive cash flows from the investments have expired or have been transferred and the Group has transferred substantially all risks and rewards of ownership. Available-for-sale financial investments and financial assets at fair value through profit or loss are subsequently carried at fair value. Loans and receivables are subsequently carried at amortized cost using the effective interest method. |
ALUMINUM CORPORATION OF CHINA LIMITED AND ITS SUBSIDIARIES
NOTES TO THE CONSOLIDATED FINANCIAL STATEMENTS(Continued)
For the years ended December 31, 2015, 2016 and 2017
(Amounts expressed in thousands of RMB unless otherwise stated)
2. | BASIS OF PREPARATION AND SIGNIFICANT ACCOUNTING POLICIES(Continued) |
| | | | |
| 2.15 | Financial assets(Continued) |
| | | | |
| | (c) | Derecognition of financial assets |
| | | | |
| | | A financial asset (or, where applicable, a part of a financial asset or part of a group of similar financial assets) is primarily derecognized (i.e. removed from the Group’s consolidated statement of financial position) when: |
| | | | |
| | | •● | the rights to receive cash flows from the asset have expired; or |
| | | | |
| | | •● | the Group has transferred its rights to receive cash flows from the asset or has assumed an obligation to pay the received cash flows in full without material delay to a third party under a “pass-through““pass-through” arrangement; and either (a) the Group has transferred substantially all the risks and rewards of the asset, or (b) the Group has neither transferred nor retained substantially all the risks and rewards of the asset, but has transferred control of the asset. |
| | | | |
| | | When the Group has transferred its rights to receive cash flows from an asset or has entered into a pass-through arrangement, it evaluates if and to what extent it has retained the risk and rewards of ownership of the asset. When it has neither transferred nor retained substantially all the risks and rewards of the asset nor transferred control of the asset, the Group continues to recognize the transferred asset to the extent of the Group’s continuing involvement. In that case, the Group also recognizes an associated liability. The transferred asset and the associated liability are measured on a basis that reflects the rights and obligations that the Group has retained. |
| | | | |
| | | Continuing involvement that takes the form of a guarantee over the transferred asset is measured at the lower of the original carrying amount of the asset and the maximum amount of consideration that the Group could be required to repay. |
When the Group has transferred its rights to receive cash flows from an asset or has entered into a pass-through arrangement, it evaluates if, and to what extent, it has retained the risk and rewards of ownership of the asset. When it has neither transferred nor retained substantially all the risks and rewards of the asset nor transferred control of the asset, the Group continues to recognize the transferred asset to the extent of the Group’s continuing involvement. In that case, the Group also recognizes an associated liability. The transferred asset and the associated liability are measured on a basis that reflects the rights and obligations that the Group has retained.
Continuing involvement that takes the form of a guarantee over the transferred asset is measured at the lower of the original carrying amount of the asset and the maximum amount of consideration that the Group could be required to repay.
ALUMINUM CORPORATION OF CHINA LIMITED AND ITS SUBSIDIARIES
NOTES TO THE CONSOLIDATED FINANCIAL STATEMENTS(Continued)
For the years ended December 31, 2015, 2016, 2017 and 20172018
(Amounts expressed in thousands of RMB unless otherwise stated)
| 2. | BASIS OF PREPARATION AND SIGNIFICANT ACCOUNTING POLICIES(Continued) (CONTINUED) |
| | | |
| 2.15 | Financial assets(Continued) |
| | | |
| | (d) | Impairment of financial assets |
| | | |
| | | The Group assesses at the end of each reporting period whether there is objective evidence that a financial asset or a group of financial assets is impaired. An impairment exists if one or more events that occurred after the initial recognition of the asset have an impact on the estimated future cash flows of the financial asset or the group of financial assets that can be reliably estimated. Evidence of impairment may include indications that a debtor or a group of debtors is experiencing significant financial difficulty, default or delinquency in interest or principal payments, the probability that they will enter bankruptcy or other financial reorganisation and observable data indicating that there is a measurable decrease in the estimated future cash flows, such as changes in arrears or economic conditions that correlate with defaults. |
| | | |
| | | Financial assets carried at amortized cost |
| | | |
| | | For financial assets carried at amortized cost, the Group assesses whether impairment exists individually for financial assets. |
| | | |
| | | The amount of any impairment loss identified is measured as the difference between the asset’s carrying amount and the present value of estimated future cash flows (excluding future credit losses that have not yet been incurred). The present value of the estimated future cash flows is discounted at the financial asset’s original effective interest rate (i.e., the effective interest rate computed at initial recognition). |
| 2.16 | Financial liabilities (continued) |
Policies under IFRS 9 from January 1, 2018 and policies under IAS 39 applicable before January 1, 2018
Initial recognition and measurement
Financial liabilities are classified, at initial recognition, as financial liabilities at fair value through profit or loss, loans and borrowings, payables, or as derivatives designated as hedging instruments in an effective hedge, as appropriate.
All financial liabilities are recognized initially at fair value and, in the case of loans and borrowings and payables, net of directly attributable transaction costs.
The Group’s financial liabilities include financial liabilities at fair value through profit or loss, loans and borrowings, trade and notes payables and other financial liabilities.
Subsequent measurement
The subsequent measurement of financial liabilities depends on their classification as follows:
Loans and borrowings
After initial recognition, interest-bearing loans and borrowings are subsequently measured at amortized cost, using the effective interest rate method unless the effect of discounting would be immaterial, in which case they are stated at cost. Gains and losses are recognized in the consolidated statement of profit or loss and other comprehensive income when the liabilities are derecognized as well as through the effective interest rate amortization process.
Amortized cost is calculated by taking into account any discount or premium on acquisition and fees or costs that are an integral part of the effective interest rate. The effective interest rate amortization is included in finance costs in profit or loss.
Financial liabilities at fair value through profit or loss (policies under IFRS 9 applicable from January 1, 2018)
Financial liabilities at fair value through profit or loss include financial liabilities held for trading and financial liabilities designated upon initial recognition as at fair value through profit or loss.
ALUMINUM CORPORATION OF CHINA LIMITED AND ITS SUBSIDIARIES
NOTES TO THE CONSOLIDATED FINANCIAL STATEMENTS(Continued)
For the years ended December 31, 2015, 2016, 2017 and 20172018
(Amounts expressed in thousands of RMB unless otherwise stated)
| 2. | BASIS OF PREPARATION AND SIGNIFICANT ACCOUNTING POLICIES(Continued) (CONTINUED) |
| | | |
| 2.15 | Financial assets(Continued) |
| | | |
| | (d) | Impairment of financial assets(Continued) |
| | | |
| | | Financial assets carried at amortized cost (Continued) |
| | | |
| | | The carrying amount of the asset is reduced through the use of an allowance account and the loss is recognized in profit or loss. Interest income continues to be accrued on the reduced carrying amount using the rate of interest used to discount the future cash flows for the purpose of measuring the impairment loss. Loans and receivables together with any associated allowance are written off when there is no realistic prospect of future recovery and all collateral has been realized or has been transferred to the Group. |
| | | |
| | | If, in a subsequent period, the amount of the estimated impairment loss increases or decreases because of an event occurring after the impairment was recognized, the previously recognized impairment loss is increased or reduced by adjusting the allowance account. If a write-off is later recovered, the recovery is credited to other expenses in profit or loss. |
| | | |
| | | Available-for-sale financial investments |
| | | |
| | | For available-for-sale financial investments, the Group assesses at the end of each reporting period whether there is objective evidence that an investment or a group of investments is impaired. |
| | | |
| | | If an available-for-sale asset is impaired, an amount comprising the difference between its cost (net of any principal payment and amortization) and its current fair value, less any impairment loss previously recognized in profit or loss, is removed from other comprehensive income and recognized in profit or loss. |
| | | |
| | | In the case of equity investments classified as available-for-sale financial investments, a significant or prolonged decline in the fair value of the security below its cost is considered as an indicator that the securities are impaired. If any such evidence exists for available-for-sale financial investments, the cumulative loss — measured as the difference between the acquisition cost and the current fair value, less any impairment loss on that financial asset previously recognized in other comprehensive income — is removed from other comprehensive income and recognized in profit or loss. Impairment losses recognized in profit or loss on equity instruments are not reversed through profit or loss. |
| 2.16 | Financial liabilities |
Policies under IFRS 9 from January 1, 2018 and policies under IAS 39 applicable before January 1, 2018 (continued)
Subsequent measurement (continued)
Financial liabilities at fair value through profit or loss (policies under IFRS 9 applicable from January 1, 2018) (continued)
Financial liabilities are classified as held for trading if they are incurred for the purpose of repurchasing in the near term. This category also includes derivative financial instruments entered into by the Group that are not designated as hedging instruments in hedge relationships as defined by IFRS 9. Separated embedded derivatives are also classified as held for trading unless they are designated as effective hedging instruments. Gains or losses on liabilities held for trading are recognized in the statement of profit or loss and other comprehensive income. The net fair value gain or loss recognized in the consolidated statement of profit or loss and other comprehensive income does not include any interest charged on these financial liabilities.
Financial liabilities designated upon initial recognition as at fair value through profit or loss are designated at the initial date of recognition, and only if the criteria in IFRS 9 are satisfied. Gains or losses on liabilities designated at fair value through profit or loss are recognized in profit or loss, except for the gains or losses arising from the Group’s own credit risk which are presented in other comprehensive income with no subsequent reclassification to t profit or loss. The net fair value gain or loss recognized in profit or loss does not include any interest charged on these financial liabilities.
ALUMINUM CORPORATION OF CHINA LIMITED AND ITS SUBSIDIARIES
NOTES TO THE CONSOLIDATED FINANCIAL STATEMENTS(Continued)
For the years ended December 31, 2015, 2016, 2017 and 20172018
(Amounts expressed in thousands of RMB unless otherwise stated)
| 2. | BASIS OF PREPARATION AND SIGNIFICANT ACCOUNTING POLICIES(Continued) (CONTINUED) |
| | | |
| 2.15 | Financial assets(Continued) |
| | | |
| | (d) | Impairment of financial assets(Continued) |
| | | |
| | | Available-for-sale financial investments (Continued) |
| | | |
| | | The determination of what is “significant“ or “prolonged“ requires judgement. In making this judgement, the Group evaluates, among other factors, the duration or extent to which the fair value of an investment is less than its cost. |
| | | |
| | | In the case of debt instruments classified as available for sale, impairment is assessed based on the same criteria as financial assets carried at amortized cost. However, the amount recorded for impairment is the cumulative loss measured as the difference between the amortized cost and the current fair value, less any impairment loss on that investment previously recognized in profit or loss. Future interest income continues to be accrued based on the reduced carrying amount of the asset and is accrued using the rate of interest used to discount the future cash flows for the purpose of measuring the impairment loss. The interest income is recorded as part of finance income. Impairment losses on debt instruments are reversed through profit or loss if the subsequent increase in fair value of the instruments can be objectively related to an event occurring after the impairment loss was recognized in profit or loss. |
| | | |
| 2.16 | Financial liabilities |
| | | |
| | (a) | Initial recognition and measurement |
| | | |
| | | Financial liabilities are classified, at initial recognition, as financial liabilities at fair value through profit or loss, loans and borrowings as appropriate. |
| | | |
| | | All financial liabilities are recognized initially at fair value plus, in the case of loans and borrowings, directly attributable transaction costs. |
| | | |
| | | The Group’s financial liabilities include financial liabilities at fair value through profit or loss, loans and borrowings and financial guarantee contracts. (continued) |
Policies under IFRS 9 from January 1, 2018 and policies under IAS 39 applicable before January 1, 2018 (continued)
Subsequent measurement (continued)
Financial liabilities at fair value through profit or loss (policies under IAS 39 applicable before January 1, 2018)
Financial liabilities at fair value through profit or loss include financial liabilities held for trading and financial liabilities designated upon initial recognition as at fair value through profit or loss.
Financial liabilities are classified as held for trading if they are acquired for the purpose of repurchasing in the near term. This category includes derivative financial instruments entered into by the Group that are not designated as hedging instruments in hedge relationships as defined by IAS 39. Separated embedded derivatives are also classified as held for trading unless they are designated as effective hedging instruments. Gains or losses on liabilities held for trading are recognized in the statement of profit or loss and other comprehensive income. The net fair value gain or loss recognized in the consolidated statement of profit or loss and other comprehensive income does not include any interest charged on these financial liabilities.
Financial liabilities designated upon initial recognition as at fair value through profit or loss are designated at the date of initial recognition and only if the criteria in IAS 39 are satisfied.
ALUMINUM CORPORATION OF CHINA LIMITED AND ITS SUBSIDIARIES
NOTES TO THE CONSOLIDATED FINANCIAL STATEMENTS(Continued)
For the years ended December 31, 2015, 2016, 2017 and 2017
2018
(Amounts expressed in thousands of RMB unless otherwise stated)
| 2. | BASIS OF PREPARATION AND SIGNIFICANT ACCOUNTING POLICIES(Continued) (CONTINUED) |
| | |
| 2.16 | Financial liabilities(Continued) |
| | | |
| | (b) | Subsequent measurement |
| | | |
| | | The subsequent measurement of financial liabilities depends on their classification as follows: |
| | | |
| | | Loans and borrowings |
| | | |
| | | After initial recognition, loans and borrowings are subsequently measured at amortized cost, using the effective interest rate method unless the effect of discounting would be immaterial, in which case they are stated at cost. Gains and losses are recognized in profit or loss when the liabilities are derecognized as well as through the effective interest rate amortization process. |
| | | |
| | | Amortized cost is calculated by taking into account any discount or premium on acquisition and fees or costs that are an integral part of the effective interest rate. The effective interest rate amortization is included in finance costs in profit or loss. |
| | | |
| | | Financial liabilities at fair value through profit or loss |
| | | |
| | | Financial liabilities at fair value through profit or loss include financial liabilities held for trading and financial liabilities designated upon initial recognition as at fair value through profit or loss. |
| | | |
| | | Financial liabilities are classified as held for trading if they are acquired for the purpose of repurchasing in the near term. This category includes derivative financial instruments entered into by the Group that are not designated as hedging instruments in hedge relationships as defined by IAS 39. Separated embedded derivatives are also classified as held for trading unless they are designated as effective hedging instruments. Gains or losses on liabilities held for trading are recognized in profit or loss. The net fair value gain or loss recognized in profit or loss does not include any interest charged on these financial liabilities. |
| | | |
| | | Financial liabilities designated upon initial recognition at fair value through profit or loss are designated at the date of initial recognition and only if the criteria of IAS 39 are satisfied. |
| | | |
| | | Financial guarantee contracts |
| | | |
| | | Financial guarantee contracts issued by the Group are those contracts that require a payment to be made to reimburse the holder for a loss it incurs because the specified debtor fails to make a payment when due in accordance with the terms of a debt instrument. A financial guarantee contract is recognized initially as a liability at its fair value, adjusted for transaction costs that are directly attributable to the issuance of the guarantee. Subsequent to initial recognition, the Group measures the financial guarantee contract at the higher of: (i) the amount of the best estimate of the expenditure required to settle the present obligation at the end of the reporting period; and (ii) the amount initially recognized less, when appropriate, cumulative amortization.(continued) |
Policies under IFRS 9 from January 1, 2018 and policies under IAS 39 applicable before January 1, 2018 (continued)
Subsequent measurement (continued)
Financial guarantee contracts (policies under IFRS 9 applicable from January 1, 2018)
Financial guarantee contracts issued by the Group are those contracts that require a payment to be made to reimburse the holder for a loss it incurs because the specified debtor fails to make a payment when due in accordance with the terms of a debt instrument. A financial guarantee contract is recognized initially as a liability at its fair value, adjusted for transaction costs that are directly attributable to the issuance of the guarantee. Subsequent to initial recognition, the Group measures the financial guarantee contracts at the higher of: (i) the ECL allowance determined in accordance with the policy as set out in “Impairment of financial assets (policies under IFRS 9 applicable from January 1, 2018)”; and (ii) the amount initially recognized less, when appropriate, the cumulative amount of income recognized.
Financial guarantee contracts (policies under IAS 39 applicable before January 1, 2018)
A financial guarantee contract is recognized initially as a liability at its fair value, adjusted for transaction costs that are directly attributable to the issuance of the guarantee. Subsequent to initial recognition, the Group measures the financial guarantee contract at the higher of (i) the amount of the best estimate of the expenditure required to settle the present obligation at the end of the reporting period; and (ii) the amount initially recognized less, when appropriate, cumulative amortization.
Derecognition of financial liabilities (policies under IFRS 9 applicable from January 1, 2018 and IAS 39 applicable before January 1, 2018)
A financial liability is derecognized when the obligation under the liability is discharged or cancelled, or expires.
When an existing financial liability is replaced by another from the same lender on substantially different terms, or the terms of an existing liability are substantially modified, such an exchange or modification is treated as a derecognition of the original liability and a recognition of a new liability, and the difference between the respective carrying amounts is recognized in profit or loss.
ALUMINUM CORPORATION OF CHINA LIMITED AND ITS SUBSIDIARIES
NOTES TO THE CONSOLIDATED FINANCIAL STATEMENTS(Continued)
For the years ended December 31, 2015, 2016, 2017 and 2017
2018
(Amounts expressed in thousands of RMB unless otherwise stated)
| 2. | BASIS OF PREPARATION AND SIGNIFICANT ACCOUNTING POLICIES(Continued) (CONTINUED) |
| | | |
| 2.16 | Financial liabilities(Continued) |
| | | |
| | (c) | Derecognition of financial liabilities |
| | | |
| | | A financial liability is derecognized when the obligation under the liability is discharged or cancelled, or expires. |
| | | |
| | | When an existing financial liability is replaced by another from the same lender on substantially different terms, or the terms of an existing liability are substantially modified, such an exchange or modification is treated as a derecognition of the original liability and a recognition of a new liability, and the difference between the respective carrying amounts is recognized in profit or loss. |
| | | |
| 2.17 | Offsetting financial instruments |
| | | |
| | Financial assets and liabilities are offset and the net amount reported in the consolidated statement of financial position when there is a legally enforceable right to offset the recognized amounts and there is an intention to settle on a net basis or realize the asset and settle the liability simultaneously. |
| | | |
| 2.18 | Derivative financial instruments |
| | | |
| | Initial recognition and subsequent measurement |
| | | |
| | The Group uses derivative financial instruments, such as forward currency contracts and interest rate swaps, to hedge its foreign currency risk and interest rate risk, respectively. Such derivative financial instruments are initially recognized at fair value on the date on which a derivative contract is entered into and are subsequently remeasured at fair value. Derivatives are carried as assets when the fair value is positive and as liabilities when the fair value is negative. |
| | |
| | Any gains or losses arising from changes in fair value of derivatives are taken directly to profit or loss. |
| | |
| 2.19 | Inventories |
| | |
| | Inventories comprise raw materials, work-in-progress, finished goods, spare parts and packaging materials and others, and are stated at the lower of cost and net realisable amount. Cost is determined using the weighted average method. Work-in-progress and finished goods comprise materials, direct labour and an appropriate proportion of all production overhead expenditure (based on the normal operating capacity). Borrowing costs are excluded. |
| | | |
| | Provision for impairment of inventories is usually determined by the excess of cost over net recoverable amount and recorded in profit or loss. Net realisable amounts are determined based on the estimated selling price less estimated conversion costs, selling expenses and related taxes in the ordinary course of business. Provision for or reversal of provision for impairment of inventories is recognized within “cost of sales” in profit or loss. |
| 2.17 | Offsetting financial instruments |
Policies under IFRS 9 from January 1, 2018 and policies under IAS 39 applicable before January 1, 2018
Financial assets and liabilities are offset and the net amount reported in the consolidated statement of financial position when there is a legally enforceable right to offset the recognized amounts and there is an intention to settle on a net basis or realize the asset and settle the liability simultaneously.
| 2.18 | Derivative financial instruments |
Policies under IFRS 9 from January 1, 2018 and policies under IAS 39 applicable before January 1, 2018
Initial recognition and subsequent measurement
The Group uses derivative financial instruments, such as futures and option contracts, to reduce its exposure to fluctuation in the price of primary aluminum and other products, to hedge its foreign currency risk and interest rate risk, respectively. Such derivative financial instruments are initially recognized at fair value on the date on which a derivative contract is entered into and are subsequently remeasured at fair value. Derivatives are carried as assets when the fair value is positive and as liabilities when the fair value is negative.
Any gains or losses arising from changes in fair value of derivatives are taken directly to profit or loss.
ALUMINUM CORPORATION OF CHINA LIMITED AND ITS SUBSIDIARIES
NOTES TO THE CONSOLIDATED FINANCIAL STATEMENTS(Continued)
For the years ended December 31, 2015, 2016, 2017 and 2017
2018
(Amounts expressed in thousands of RMB unless otherwise stated)
| 2. | BASIS OF PREPARATION AND SIGNIFICANT ACCOUNTING POLICIES(Continued) (CONTINUED) |
Inventories comprise raw materials, work-in-progress, finished goods, spare parts and packaging materials and others, and are stated at the lower of cost and net realisable amount. Cost is determined using the weighted average method. Work-in-progress and finished goods comprise materials, direct labour and an appropriate proportion of all production overhead expenditure (based on the normal operating capacity). Borrowing costs are excluded.
Provision for impairment of inventories is usually determined by the excess of cost over the net realisable amount and recorded in profit or loss. Net realisable amounts are determined based on the estimated selling price less estimated conversion costs, selling expenses and related taxes in the ordinary course of business. The provision for or the reversal of provision for impairment of inventories is recognized within “Cost of sales” in profit or loss.
| 2.20 | Trade and notes receivables and other receivables |
| | |
| | Trade and notes receivables and other receivables are amounts due from customers for merchandise sold or services performed in the ordinary course of business. If collection of these receivables is expected in one year or less (or in the normal operating cycle of the business if longer), they are classified as current assets. |
| | |
| | Trade and notes receivables and other receivables are recognized initially at fair value and subsequently measured at amortized cost using the effective interest method, less provision for impairment. |
| | |
| 2.21 | Cash and cash equivalents |
| | |
| | For the purpose of the consolidated statement of cash flows, cash and cash equivalents comprise cash on hand and demand deposits, and short term highly liquid investments that are readily convertible into known amounts of cash, are subject to an insignificant risk of changes in value, and have a short maturity of generally within three months when acquired, less bank overdrafts which are repayable on demand and form an integral part of the Group's cash management. |
| | |
| | For the purpose of the consolidated statement of financial position, cash and cash equivalents comprise cash on hand and at banks, including term deposits, and assets similar in nature to cash, which are not restricted as to use. |
| | | |
| 2.22 | Other income |
| | | |
| | Other income mainly includes government grants, which are recognized when the Group fulfils the conditions attached to them and there is reasonable assurance that the grant will be received. When the government grant is in the form of monetary assets, it is measured at the actual amount received. When the grant is provided based on a pre-determined rate, it is measured at the fair value of the amount receivable. |
| | | |
| | Asset-related government grants are recognized when the government document designates that the government grants are used for constructing or forming long-term assets. If the government document is inexplicit, the Group should make a judgement based on the basic conditions to obtain the government grants, and recognizes them as asset-related government grants if the conditions are to construct or to form long-term assets. Otherwise, the government grants should be income-related. |
| | |
| | Asset-related government grants are recognized as deferred income and are amortized evenly in profit or loss over the useful lives of the related assets. |
| | |
| | Income-related government grants that are used to compensate subsequent related expenses or losses of the Group are recognized as deferred income and recorded in profit or loss when the related expenses or losses are incurred. When the grants are used to compensate expenses or losses that were already incurred, they are directly recognized in profit or loss for the current period. |
| | | |
| 2.23 | Trade and notes payables and other payables |
| | |
| | Trade and notes payables and other payables are mainly obligations to pay for goods, equipment or services that have been acquired in the ordinary course of business from suppliers and service providers. These payables are classified as current liabilities if they are due within one year or less (or in the normal operating cycle of the business if longer). |
Trade and notes receivables are amounts due from customers for merchandise sold or services performed in the ordinary course of business. If collection of these receivables is expected in one year or less (or in the normal operating cycle of the business if longer), they are classified as current assets.
Trade and notes receivables are recognized initially at fair value and subsequently measured at amortized cost using the effective interest method, less provision for impairment.
ALUMINUM CORPORATION OF CHINA LIMITED AND ITS SUBSIDIARIES
NOTES TO THE CONSOLIDATED FINANCIAL STATEMENTS(Continued)
For the years ended December 31, 2015, 2016, 2017 and 2017
2018
(Amounts expressed in thousands of RMB unless otherwise stated)
| 2. | BASIS OF PREPARATION AND SIGNIFICANT ACCOUNTING POLICIES(Continued) (CONTINUED) |
| |
| 2.24 | Employee benefits |
| | |
| | Employee benefits mainly include salaries, bonuses, allowances and subsidies, pension insurance, social insurance and housing funds, labour union fees, employees’ education fees and other expenses related to the employees for their services. The Group recognizes employee benefits as liabilities during the accounting period when employees rendered the services and allocates the related cost of assets and expenses based on different beneficiaries. |
| | |
| | (a) | Bonus plans |
| | | |
| | | The expected cost of bonus plans is recognized as a liability when the Group has a present legal or constructive obligation as a result of services rendered by employees and a reliable estimate of the obligation can be made. |
| | | |
| | (b) | Retirement benefit obligations |
| | | |
| | | The Group primarily pays contributions on a monthly basis to participate in a pension plan organised by the relevant municipal and provincial governments in the PRC. In 2017, the Group made monthly contributions at the rate of 20% (2016: 20%) of the qualified employees’ salaries. The municipal and provincial governments undertake to assume the retirement benefit obligations of all existing and future retired employees payable under these plans. The Group has no legal or constructive obligations for further contributions if the fund does not hold sufficient assets to pay all employees the benefit relating to their current and past services. |
| | | |
| | (c) | Other social insurance and housing funds |
| | | |
| | | The Group provides other social insurance and housing funds to the qualified employees in the PRC based on certain percentages of their salaries. These percentages are not to exceed the upper limits of the percentages prescribed by the Ministry of Human Resources and Social Security of the PRC. These benefits are paid to social security organisations and the amounts are expensed as incurred. The Group has no legal or constructive obligations for further contributions if the fund does not hold sufficient assets to pay all employees the benefit relating to their current and past services. |
| | | |
| | (d) | Termination benefit obligations and early retirement benefit obligations |
| | | |
| | | Termination and early retirement benefit obligations are payable when employment is terminated by the Group before the normal retirement date, or whenever an employee accepts voluntary redundancy and/or early retirement in exchange for these benefits. The Group recognizes termination and early retirement benefit obligations when it is demonstrably committed to either: terminating the employment of current employees according to a detailed formal plan without possibility of withdrawal; or providing termination benefits as a result of an offer made to encourage voluntary redundancy and/or early retirement. The specific terms vary among the terminated and early retired employees depending on various factors including position, length of service and district of the employees concerned. Benefits falling due for more than 12 months after the end of the reporting period are discounted to their present values. |
| 2.21 | Cash and cash equivalents |
For the purpose of the consolidated statement of cash flows, cash and cash equivalents comprise cash on hand and demand deposits, and short term highly liquid investments that are readily convertible into known amounts of cash, are subject to an insignificant risk of changes in value, and have a short maturity of generally within three months when acquired, less bank overdrafts which are repayable on demand and form an integral part of the Group’s cash management.
For the purpose of the consolidated statement of financial position, cash and cash equivalents comprise cash on hand and at banks, including term deposits, and assets similar in nature to cash, which are not restricted as to use.
Government grants are recognized when the Group fulfils the conditions attached to them and there is reasonable assurance that the grant will be received. When the government grant is in the form of monetary assets, it is measured at the actual amount received. When the government grant is in the form of non-monetary assets, the grant is recorded at the fair value of the non-monetary assets.
Asset-related government grants are recognized when the government document designates that the government grants are used for constructing or forming long-term assets. If the government document is inexplicit, the Group should make a judgement based on the basic conditions to obtain the government grants, and recognizes them as asset-related government grants if the conditions are to construct or to form long-term assets. Otherwise, the government grants should be income-related.
As described in note 2.2 (d), the Group has voluntarily changed the accounting policy for government grants on the presentation in the consolidated statement of financial position and the consolidated statement of profit or loss and other comprehensive income. The revised accounting policies are as follows:
For asset-related government grants that are related to non-current assets that already exist at the time of recognising the government grant, the grant is deducted from the carrying amount of the asset. The grant is recognized in profit or loss over the life of a depreciable asset by way of a reduced depreciation charge. If the asset is not yet purchased or constructed at the time of recognising the government grant, the grant is recognized as deferred income and will be deducted from the cost of the asset once the asset is recognized.
Income-related government grants that are specific to compensate expenses or costs that have already incurred directly recognized in profit or loss for the current period as deduction of the related expenses or costs. If the income-related government grants are specific to compensate future expenses or costs of the Group, they are recognized as deferred income and will be deducted from the related expenses or costs when the related expenses or costs are incurred.
ALUMINUM CORPORATION OF CHINA LIMITED AND ITS SUBSIDIARIES
NOTES TO THE CONSOLIDATED FINANCIAL STATEMENTS(Continued)
For the years ended December 31, 2015, 2016, 2017 and 2017
2018
(Amounts expressed in thousands of RMB unless otherwise stated)
| 2. | BASIS OF PREPARATION AND SIGNIFICANT ACCOUNTING POLICIES (CONTINUED) |
| 2.23 | Trade and notes payables and other payables |
Trade and notes payables and other payables are mainly obligations to pay for goods, equipment or services that have been acquired in the ordinary course of business from suppliers and service providers. These payables are classified as current liabilities if they are due within one year or less (or in the normal operating cycle of the business if longer).
Employee benefits mainly include salaries, bonuses, allowances and subsidies, pension insurance, social insurance and housing funds, labour union fees, employees’ education fees and other expenses related to the employees for their services. The Group recognizes employee benefits as liabilities during the accounting period when employees rendered the services and allocates the related cost of assets and expenses based on different beneficiaries.
The expected cost of bonus plans is recognized as a liability when the Group has a present legal or constructive obligation as a result of services rendered by employees and a reliable estimate of the obligation can be made.
| (b) | Retirement benefit obligations |
The Group primarily pays contributions on a monthly basis to participate in a pension plan organised by the relevant municipal and provincial governments in the PRC. In 2018, the Group made monthly contributions at the rate of 20% (2017: 20%) of the qualified employees’ salaries. The municipal and provincial governments undertake to assume the retirement benefit obligations of all existing and future retired employees payable under these plans. The Group has no legal or constructive obligations for further contributions if the fund does not hold sufficient assets to pay all employees the benefit relating to their current and past services.
ALUMINUM CORPORATION OF CHINA LIMITED AND ITS SUBSIDIARIES
NOTES TO THE CONSOLIDATED FINANCIAL STATEMENTS(Continued)
For the years ended December 31, 2016, 2017 and 2018
(Amounts expressed in thousands of RMB unless otherwise stated)
| 2. | BASIS OF PREPARATION AND SIGNIFICANT ACCOUNTING POLICIES(Continued) (CONTINUED) |
| 2.24 | Employee benefits (continued) |
| (c) | Other social insurance and housing funds |
The Group provides other social insurance and housing funds to the qualified employees in the PRC based on certain percentages of their salaries. These percentages are not to exceed the upper limits of the percentages prescribed by the Ministry of Human Resources and Social Security of the PRC. These benefits are paid to social security organisations and the amounts are expensed as incurred. The Group has no legal or constructive obligations for further contributions if the fund does not hold sufficient assets to pay all employees the benefit relating to their current and past services.
| (d) | Termination benefit obligations and early retirement benefit obligations |
Termination and early retirement benefit obligations are payable when employment is terminated by the Group before the normal retirement date, or whenever an employee accepts voluntary redundancy and/or early retirement in exchange for these benefits. The Group recognizes termination and early retirement benefit obligations when it is demonstrably committed to either: terminating the employment of current employees according to a detailed formal plan without the possibility of withdrawal; or providing termination benefits as a result of an offer made to encourage voluntary redundancy and/or early retirement. The specific terms vary among the terminated and early retired employees depending on various factors, including the position, length of service and district of the employees concerned. Benefits falling due for more than 12 months after the end of the reporting period are discounted to their present values.
ALUMINUM CORPORATION OF CHINA LIMITED AND ITS SUBSIDIARIES
NOTES TO THE CONSOLIDATED FINANCIAL STATEMENTS(Continued)
For the years ended December 31, 2016, 2017 and 2018
(Amounts expressed in thousands of RMB unless otherwise stated)
2.252. | BASIS OF PREPARATION AND SIGNIFICANT ACCOUNTING POLICIES (CONTINUED) |
| 2.25 | Current and deferred income tax |
Income tax comprises current and deferred tax. Income tax relating to items recognized outside profit or loss is recognized outside profit or loss, either in other comprehensive income or directly in equity.
Current tax assets and liabilities are measured at the amount expected to be recovered from or paid to the taxation authorities, based on tax rates (and tax laws) that have been enacted or substantively enacted by the end of the reporting period, taking into consideration interpretations and practices prevailing in the countries in which the Group operates.
Deferred tax is provided, using the liability method, on all temporary differences at the end of the reporting period between the tax bases of assets and liabilities and their carrying amounts for financial reporting purposes.
Deferred tax liabilities are recognized for all taxable temporary differences, except:
| | |
| | Income tax comprises current and deferred tax. Income tax relating to items recognized outside profit or loss is recognized outside profit or loss, either in other comprehensive income or directly in equity. |
| | |
| | Current tax assets and liabilities are measured at the amount expected to be recovered from or paid to the taxation authorities, based on tax rates (and tax laws) that have been enacted or substantively enacted by the end of the reporting period, taking into consideration interpretations and practices prevailing in the countries in which the Group operates. |
| | |
| | Deferred tax is provided, using the liability method, on all temporary differences at the end of the reporting period between the tax bases of assets and liabilities and their carrying amounts for financial reporting purposes. |
| | | |
| | Deferred tax liabilities are recognized for all taxable temporary differences, except: |
| | |
| | •● | when the deferred tax liability arises from the initial recognition of goodwill or an asset or liability in a transaction that is not a business combination and, at the time of the transaction, affects neither the accounting profit nor taxable profit or loss; and |
| | | |
| | •● | in respect of taxable temporary differences associated with investments in subsidiaries, associates and joint ventures, when the timing of the reversal of the temporary differences can be controlled and it is probable that the temporary differences will not reverse in the foreseeable future. |
Deferred tax assets are recognized for all deductible temporary differences, the carryforward of unused tax credits and any unused tax losses. Deferred tax assets are recognized to the extent that it is probable that taxable profit will be available against which the deductible temporary differences, the carryforward of unused tax credits and unused tax losses can be utilized, except:
| | | |
| | Deferred tax assets are recognized for all deductible temporary differences, the carryforward of unused tax credits and any unused tax losses. Deferred tax assets are recognized to the extent that it is probable that taxable profit will be available against which the deductible temporary differences, the carryforward of unused tax credits and unused tax losses can be utilized, except: |
| | |
| | •● | when the deferred tax asset relating to the deductible temporary differences arises from the initial recognition of an asset or liability in a transaction that is not a business combination and, at the time of the transaction, affects neither the accounting profit nor taxable profit or loss; and |
| | | |
| | •● | in respect of deductible temporary differences associated with investments in subsidiaries, associates and joint ventures, deferred tax assets are only recognized to the extent that it is probable that the temporary differences will reverse in the foreseeable future and taxable profit will be available against which the temporary differences can be utilized. |
ALUMINUM CORPORATION OF CHINA LIMITED AND ITS SUBSIDIARIES
NOTES TO THE CONSOLIDATED FINANCIAL STATEMENTS(Continued)
For the years ended December 31, 2015, 2016, 2017 and 2017
2018
(Amounts expressed in thousands of RMB unless otherwise stated)
| 2. | BASIS OF PREPARATION AND SIGNIFICANT ACCOUNTING POLICIES(Continued) (CONTINUED) |
| 2.25 | |
| 2.25 | Current and deferred income tax(Continued) |
| | |
| | The carrying amount of deferred tax assets is reviewed at the end of each reporting period and reduced to the extent that it is no longer probable that sufficient taxable profit will be available to allow all or part of the deferred tax asset to be utilized. Unrecognized deferred tax assets are reassessed at the end of each reporting period and are recognized to the extent that it has become probable that sufficient taxable profit will be available to allow all or part of the deferred tax asset to be recovered. |
| | |
| | Deferred tax assets and liabilities are measured at the tax rates that are expected to apply to the period when the asset is realized or the liability is settled, based on tax rates (and tax laws) that have been enacted or substantively enacted by the end of the reporting period. |
| | |
| | Deferred tax assets and deferred tax liabilities are offset if and only if the Group has a legally enforceable right to set off current tax assets and current tax liabilities and the deferred tax assets and deferred tax liabilities relate to income taxes levied by the same taxation authority on either the same taxable entity or different taxable entities which intend either to settle current tax liabilities and assets on a net basis, or to realize the assets and settle the liabilities simultaneously, in each future period in which significant amounts of deferred tax liabilities or assets are expected to be settled or recovered. (continued) |
The carrying amount of deferred tax assets is reviewed at the end of each reporting period and reduced to the extent that it is no longer probable that sufficient taxable profit will be available to allow all or part of the deferred tax asset to be utilized. Unrecognized deferred tax assets are reassessed at the end of each reporting period and are recognized to the extent that it has become probable that sufficient taxable profit will be available to allow all or part of the deferred tax asset to be recovered.
Deferred tax assets and liabilities are measured at the tax rates that are expected to apply to the period when the asset is realized or the liability is settled, based on tax rates (and tax laws) that have been enacted or substantively enacted by the end of the reporting period.
Deferred tax assets and deferred tax liabilities are offset if and only if the Group has a legally enforceable right to set off current tax assets and current tax liabilities and the deferred tax assets and deferred tax liabilities relate to income taxes levied by the same taxation authority on either the same taxable entity or different taxable entities which intend either to settle current tax liabilities and assets on a net basis, or to realize the assets and settle the liabilities simultaneously, in each future period in which significant amounts of deferred tax liabilities or assets are expected to be settled or recovered.
ALUMINUM CORPORATION OF CHINA LIMITED AND ITS SUBSIDIARIES
NOTES TO THE CONSOLIDATED FINANCIAL STATEMENTS(Continued)
For the years ended December 31, 2015, 2016, 2017 and 2017
2018
(Amounts expressed in thousands of RMB unless otherwise stated)
| 2. | BASIS OF PREPARATION AND SIGNIFICANT ACCOUNTING POLICIES(Continued) (CONTINUED) |
| |
| 2.26 | Perpetual securities |
| | |
| | Perpetual securities are classified as equity if they are non-redeemable, or redeemable only at the issuer’s option, and any interest and distributions are discretionary. Interest and distributions on perpetual securities classified as equity are recognized as distributions within equity. |
Perpetual securities are classified as equity if they are non-redeemable, or redeemable only at the issuer’s option, and any interest and distributions are discretionary. Interest and distributions on perpetual securities classified as equity are recognized as distributions within equity.
The perpetual securities issued by the Company are recognized as other equity instruments, and the perpetual securities issued by a subsidiary of the Company are recognized as non-controlling interests.
| 2.27 | | |
| | The perpetual securities issued by the Company are recognized as other equity instruments, and the perpetual securities issued by a subsidiary of the Company are recognized as non-controlling interests. |
| | | |
| 2.27 | Revenue recognition |
Applicable from January 1, 2018
Revenue from contracts with customers
Revenue from contracts with customers is recognized when control of goods or services is transferred to the customers at an amount that reflects the consideration to which the Group expects to be entitled in exchange for those goods or services.
| | | |
| | The Group recognizes revenue when the amount of revenue can be reliably measured, it is probable that future economic benefits will flow to the Group and when specific criteria have been met for each of the Group’s activities (see descriptions below). |
| | | |
| | (a) | Sales of goods |
| | | |
| | | Revenue from the sales (including sales of goods is recognized when the significant risks and rewards of ownership have been transferred to the buyers, provided that the Group maintains neither managerial involvement to the degree usually associated with ownership, nor effective control over the goods sold. |
| | | |
| | | If the Group is acting solely as an agent, the related revenue is reported on a net basis. |
| | | |
| | (b) | Rendering of services |
| | | |
| | | The Group provides machinery processing, transportation and packaging servicesscrap and other services to third party customers. These services are recognized in the period when the related services are provided. |
| | | |
| 2.28 | Interest income |
| | |
| | Interest income is recognized using the effective interest method. When a loan or receivable is impaired, the Group reduces the carrying amount to its recoverable amount, being the estimated future cash flows discounted at the original effective interest rate of the instrument, and continues unwinding the discount as interest income. Interest income on impaired loans and receivables is recognized using the original effective interest rate. |
| | |
| 2.29 | Dividend income |
| | |
| | Dividend income is recognized when the right to receive payment is established.materials) |
Revenue from the sale of industrial products or scrap and other materials is recognized at the point in time when control of the asset is transferred to the customer, generally on delivery of the industrial products.
Revenue from services is recognized over time, using an input method to measure progress towards complete satisfaction of the service, because the customer simultaneously receives and consumes the benefits provided by the Group. Revenue is recognized on a straight-line basis because the entity’s inputs are expended evenly throughout the performance period.
ALUMINUM CORPORATION OF CHINA LIMITED AND ITS SUBSIDIARIES
NOTES TO THE CONSOLIDATED FINANCIAL STATEMENTS(Continued)
For the years ended December 31, 2015, 2016, 2017 and 2017
2018
(Amounts expressed in thousands of RMB unless otherwise stated)
| 2. | BASIS OF PREPARATION AND SIGNIFICANT ACCOUNTING POLICIES(Continued) (CONTINUED) |
| | |
| 2.30 | Leases |
| | |
| | The determination of whether an arrangement is, or contains, a lease is based on the substance of the arrangement at the inception date. The arrangement is assessed for whether fulfilment of the arrangement is dependent on the use of a specific asset or assets or the arrangement conveys a right to use the asset or assets, even if that right is not explicitly specified in an arrangement. |
| | |
| | Leases in which a significant portion of the risks and rewards of ownership are retained by the lessor are classified as operating leases. Payments made under operating leases (net of any incentives received from the lessor) are charged to profit or loss on a straight-line basis over the period of the lease. |
| | |
| | The Group leases certain land use rights and property, plant and equipment. |
| | |
| | Prepaid land lease payments under operating leases are initially stated at cost and subsequently recognized on the straight-line basis over the lease terms. |
| | |
| | Property, plant and equipment where the Group has substantially all the risks and rewards of ownership are classified as finance leases. Finance leases are capitalised at the lease’s commencement at the lower of the fair value of the leased land use rights and the present value of the minimum lease payments. |
| | |
| | Each lease payment is allocated between the liability and finance charges. The corresponding rental obligations, net of finance charges, are included in other long-term payables. The interest element of the finance costs is charged to profit or loss over the lease period so as to produce a constant periodic rate of interest on the remaining balance of the liability for each period. The property, plant and equipment acquired under finance leases are depreciated over the shorter of the useful life of the asset and the lease term. |
| | |
| 2.31 | Borrowing costs |
| | |
| | General and specific borrowing costs directly attributable to the acquisition, construction or production of qualifying assets, which are assets that necessarily take a substantial period of time to get ready for their intended use or sale, are added to the cost of those assets, until such time as the assets are substantially ready for their intended use or sale. |
| | |
| | Investment income earned on the temporary investment of specific borrowings pending their expenditure on qualifying assets is deducted from the borrowing costs eligible for capitalisation. |
| | |
| | All other borrowing costs are recognized in profit or loss in the period in which they are incurred. Borrowing costs consist of interest and other costs that an entity incurs in connection with the borrowing of funds. |
Applicable from January 1, 2018
A contract liability is the obligation to transfer goods or services to a customer for which the Group has received a consideration (or an amount of consideration that is due) from the customer. If a customer pays the consideration before the Group transfers goods or services to the customer, a contract liability is recognized when the payment is made or the payment is due (whichever is earlier). Contract liabilities are recognized as revenue when the Group performs under the contract.
Applicable from January 1, 2018
Interest income is recognized on an accrual basis using the effective interest method by applying the rate that exactly discounts the estimated future cash receipts over the expected life of the financial instrument or a shorter period, when appropriate, to the net carrying amount of the financial asset.
Applicable from January 1, 2018
Dividend income is recognized when the shareholders’ right to receive payment has been established, it is probable that the economic benefits associated with the dividend will flow to the Group and the amount of the dividend can be measured reliably.
ALUMINUM CORPORATION OF CHINA LIMITED AND ITS SUBSIDIARIES
NOTES TO THE CONSOLIDATED FINANCIAL STATEMENTS(Continued)
For the years ended December 31, 2015, 2016, 2017 and 2017
2018
(Amounts expressed in thousands of RMB unless otherwise stated)
| 2. | BASIS OF PREPARATION AND SIGNIFICANT ACCOUNTING POLICIES(Continued) (CONTINUED) |
| | |
| 2.32 | Dividend distribution |
| | |
| | Dividend distribution to the Company’s shareholders is recognized as a liability in the Group’s and Company’s financial statements in the period in which the dividends are approved by the Company’s shareholders. |
| | |
| 2.33 | Provisions |
| | |
| | A provision is recognized when a present obligation (legal or constructive) has arisen as a result of a past event and it is probable that a future outflow of resources will be required to settle the obligation, provided that a reliable estimate can be made of the amount of the obligation. |
| | |
| | Provisions are measured at the present value of the expenditures expected to be required to settle the obligation using a pre-tax rate that reflects current market assessments of the time value of money and the risks specific to the obligation. The increase in the provision due to the passage of time is recognized as interest expenses. |
Applicable before January 1, 2018
The Group recognizes revenue when the amount of revenue can be reliably measured, it is probable that future economic benefits will flow to the Group and when specific criteria have been met for each of the Group’s activities (see descriptions below).
Revenue from the sales of goods is recognized when the significant risks and rewards of ownership have been transferred to the buyer, provided that the Group maintains neither managerial involvement to the degree usually associated with ownership, nor effective control over the goods sold.
The Group provides machinery processing, transportation and packaging services and other services to third party customers. These services are recognized in the period when the related services are provided.
Applicable before January 1, 2018
Interest income is recognized using the effective interest method. When a loan or receivable is impaired, the Group reduces the carrying amount to its recoverable amount, being the estimated future cash flows discounted at the original effective interest rate of the instrument, and continues unwinding the discount as interest income. Interest income on impaired loans and receivables is recognized using the original effective interest rate.
Applicable before January 1, 2018
Dividend income is recognized when the right to receive payment is established.
ALUMINUM CORPORATION OF CHINA LIMITED AND ITS SUBSIDIARIES
NOTES TO THE CONSOLIDATED FINANCIAL STATEMENTS(Continued)
For the years ended December 31, 2015, 2016, 2017 and 2017
2018
(Amounts expressed in thousands of RMB unless otherwise stated)
| 2. | BASIS OF PREPARATION AND SIGNIFICANT ACCOUNTING POLICIES (CONTINUED) |
Leases that transfer substantially all the rewards and risks of ownership of assets to the Group, other than legal title, are accounted for as finance leases. At the inception of a finance lease, the cost of the leased asset is capitalized at the present value of the minimum lease payments and recorded together with the obligation, excluding the interest element, to reflect the purchase and financing. Assets held under capitalized finance leases, including prepaid land lease payments under finance leases, are included in property, plant and equipment, and depreciated over the shorter of the lease terms and the estimated useful lives of the assets. The finance costs of such leases are charged to the statement of profit or loss and other comprehensive income so as to provide a constant periodic rate of charge over the lease terms.
Assets acquired through hire purchase contracts of a financing nature are accounted for as finance leases, but are depreciated over their estimated useful lives.
Leases where substantially all the rewards and risks of ownership of assets remain with the lessor are accounted for as operating leases. Where the Group is the lessor, assets leased by the Group under operating leases are included in non-current assets, and rentals receivable under the operating leases are credited to the statement of profit or loss and other comprehensive income on the straight-line basis over the lease terms. Where the Group is the lessee, rentals payable under operating leases net of any incentives received from the lessor are charged to the statement of profit or loss and other comprehensive income on the straight-line basis over the lease terms.
Prepaid land lease payments under operating leases are initially stated at cost and subsequently recognized on the straight-line basis over the lease terms.
When the lease payments cannot be allocated reliably between the land and buildings elements, the entire lease payments are included in the cost of the land and buildings as a finance lease in property, plant and equipment.
General and specific borrowing costs directly attributable to the acquisition, construction or production of qualifying assets, which are assets that necessarily take a substantial period of time to get ready for their intended use or sale, are added to the cost of those assets, until such time as the assets are substantially ready for their intended use or sale.
Investment income earned on the temporary investment of specific borrowings pending their expenditure on qualifying assets is deducted from the borrowing costs eligible for capitalisation.
All other borrowing costs are recognized in profit or loss in the period in which they are incurred. Borrowing costs consist of interest and other costs that an entity incurs in connection with the borrowing of funds.
ALUMINUM CORPORATION OF CHINA LIMITED AND ITS SUBSIDIARIES
NOTES TO THE CONSOLIDATED FINANCIAL STATEMENTS(Continued)
For the years ended December 31, 2016, 2017 and 2018
(Amounts expressed in thousands of RMB unless otherwise stated)
| 2. | BASIS OF PREPARATION AND SIGNIFICANT ACCOUNTING POLICIES (CONTINUED) |
| 2.36 | Dividend distribution |
Dividend distribution to the Company’s shareholders is recognized as a liability in the Group’s and Company’s financial statements in the period in which the dividends are approved by the Company’s shareholders.
A provision is recognized when a present obligation (legal or constructive) has arisen as a result of a past event and it is probable that a future outflow of resources will be required to settle the obligation, provided that a reliable estimate can be made of the amount of the obligation.
Provisions are measured at the present value of the expenditures expected to be required to settle the obligation using a pre-tax rate that reflects current market assessments of the time value of money and the risks specific to the obligation. The increase in the provision due to the passage of time is recognized as finance costs.
ALUMINUM CORPORATION OF CHINA LIMITED AND ITS SUBSIDIARIES
NOTES TO THE CONSOLIDATED FINANCIAL STATEMENTS(Continued)
For the years ended December 31, 2016, 2017 and 2018
(Amounts expressed in thousands of RMB unless otherwise stated)
| 3. | SIGNIFICANT ACCOUNTING ESTIMATES AND JUDGEMENTS |
The preparation of the Group’s consolidated financial statements requires management to make judgements, estimates and assumptions that affect the reported amounts of revenues, expenses, assets and liabilities, and the accompanying disclosures, and the disclosure of contingent liabilities. Uncertainty about these judgements, assumptions and estimates could result in outcomes that require a material adjustment to the carrying amounts of assets or liabilities affected in future periods.
Judgements
In the process of applying the Group’s accounting policies and preparing the Group’s consolidated financial statements, management has made the following judgements, apart from those involving estimates, which have a significant effect on the amounts recognized in the consolidated financial statements.
| |
| (a) | The preparation of the Group’s consolidated financial statements requires management to make judgements, estimates and assumptions that affect the reported amounts of revenues, expenses, assets and liabilities, and the accompanying disclosures, and the disclosure of contingent liabilities. Uncertainty about these judgements, assumptions and estimates could result in outcomes that require a material adjustment to the carrying amounts of assets or liabilities affected in future periods. |
| | |
| Judgements |
| |
| In the process of applying the Group’s accounting policies and preparing the Group’s consolidated financial statements, management has made the following judgements, apart from those involving estimates, which have significant effect on the amounts recognized in the consolidated financial statements. |
| |
| (a) | Significant influence over an entity in which the Group holds less than 20% of voting rights |
| | |
| | At December 31, 2016 and 2017, the Group owned a 15% and 6.68% equity interest of Chalco Mineral Resources Co. Ltd. (“Chalco Resources”) (中鋁礦產資源有限公司), respectively. The Group considers that it has significant influence over Chalco Resources even though it owns less than 20% of the voting rights, on the grounds that the Group can appoint one out of the five directors of the board of directors of Chalco Resources. |
| | |
| | At December 31, 2016 and 2017, the Group owned a 14.62% equity interest of China Rare Earth Co., Ltd. (“China Rare Earth”) (中國稀有稀土有限公司). The Group considers that it has significant influence over China Rare Earth even though it owns less than 20% of the voting rights, on the grounds that the Group can appoint one out of the seven directors of the board of directors of China Rare Earth. |
| | |
| | At December 31, 2016 and 2017, the Group owned 17.7% of the voting right of Chinalco Capital Holdings Co., Ltd.* (“Chinalco Capital”) (中鋁資本控股有限公司). The Group considers that it has significant influence over Chinalco Capital since it can appoint one out of three directors of the board of directors of Chinalco Capital. |
| | |
| | At December 31, 2016 and 2017, the Group owned a 16% equity interest of Baise New Aluminum Power Co., Ltd. * (“New Aluminum Power”) (百色新鋁電力有限公司). The Group considers that the Group has significant influence over New Aluminum Power even though it owns less than 20% of the voting rights, on the grounds that the Group can appoint one out of the nine directors of the board of directors of New Aluminum Power. |
At December 31, 2018, the Group owned a 6.68% equity interest in Chalco Mineral Resources Co.,Ltd.* (“Chalco Resources”) (中鋁礦產資源有限公司). The Group considers that it has significant influence over Chalco Resources even though it owns less than 20% of the voting rights, on the grounds that the Group can appoint one out of the five directors of the board of directors of Chalco Resources.
At December 31, 2018, the Group owned a 14.62% equity interest in China Rare Earth Co., Ltd. * (“China Rare Earth”) (中國稀有稀土有限公司). The Group considers that it has significant influence over China Rare Earth even though it owns less than 20% of the voting rights, on the grounds that the Group can appoint one out of the seven directors of the board of directors of China Rare Earth.
At December 31, 2018, the Group owned 17.7% of the voting right of Chinalco Capital Holdings Co., Ltd.* (“Chinalco Capital”) (中鋁資本控股有限公司). The Group considers that it has significant influence over Chinalco Capital since it can appoint one out of three directors of the board of directors of Chinalco Capital.
ALUMINUM CORPORATION OF CHINA LIMITED AND ITS SUBSIDIARIES
NOTES TO THE CONSOLIDATED FINANCIAL STATEMENTS(Continued)
For the years ended December 31, 2015, 2016, 2017 and 2017
2018
(Amounts expressed in thousands of RMB unless otherwise stated)
| 3. | SIGNIFICANT ACCOUNTING ESTIMATES AND JUDGEMENTS(Continued) (CONTINUED) |
Judgements (continued)
| (a) | Significant influence over an entity in which the Group holds less than 20% of voting rights (continued) |
At December 31, 2018, the Group owned a 16% equity interest in Baise New Aluminum Power Co., Ltd. * (“New Aluminum Power”) (百色新鋁電力有限公司). The Group considers that the Group has significant influence over New Aluminum Power even though it owns less than 20% of the voting rights, on the grounds that the Group can appoint one out of the nine directors of the board of directors of New Aluminum Power.
At December 31, 2018, the Group owned a 14.29% equity interest in Inner Mongolia Geliugou Co., Ltd.* (“Inner Mongolia Qiliugou”) (內蒙古圪柳溝能源有限公司). The Group considers that it has significant influence over Inner Mongolia Qiliugou even though it owns less than 20% of the voting rights, on the grounds that the Group can appoint one out of the seven directors of the board of directors of Inner Mongolia Qiliugou.
| Judgements(Continued) |
| (b) | |
| (b) | Consolidation of entities in which the Group holds less than a majority of voting rights |
At December 31, 2018, the Group owned a 40.23% equity interest in Ningxia Yinxing Energy Co., Ltd. * (“Yinxing Energy”) (寧夏銀星能源股份有限公司). Since the remaining 59.77% of the equity shares in Yinxing Energy are held by a large number of individual shareholders, in opinion of the directors of the Company, the Group has control over Yinxing Energy, and Yinxing Energy continues to be included in the consolidation scope.
As disclosed in note 38, the Company holds a 40% equity interest in Guizhou Huaren New Materials Co., Ltd.* (“Guizhou Huaren”) (貴州華仁新材料有限公司). In accordance with the acting-in-concert agreement signed between the Company and Hangzhou Jinjiang Group Co., Ltd. (“Hangzhou Jinjiang”), Hangzhou Jinjiang would exercise the shareholders’ and board of directors’ votes in concert with the Group. Therefore, the directors of the Company believe that the Company has control over Guizhou Huaren and consolidated Guizhou Huaren’s financial statements from the date the Group obtained control.
As disclosed in note 38, the Company holds 40% of the shares of Shanxi China Aluminum China Resources Co., Ltd.* (“Shanxi Zhongrun”) (山西中鋁華潤有限公司). In accordance with the acting-in-concert agreement signed between the Company and China Resources Coal Industry Group Co., Ltd. (“China Resources Coal Industry”), China Resources Coal Industry would exercise the shareholders’ and board of directors’ votes in concert with the Group. Therefore, the directors of the Company believe that the Company has control over Shanxi Zhongrun and consolidated Shanxi Zhongrun’s financial statements from the date the Group obtained control.
ALUMINUM CORPORATION OF CHINA LIMITED AND ITS SUBSIDIARIES
NOTES TO THE CONSOLIDATED FINANCIAL STATEMENTS(Continued)
For the years ended December 31, 2016, 2017 and 2018
(Amounts expressed in thousands of RMB unless otherwise stated)
| | | |
| | At December 31, 2017, the Group owned a 40.23% equity interest of Yinxing Energy (December 31, 2016: 40.44%). Since the remaining 59.77% (December 31, 2016: 59.56%) of the equity shares in Yinxing Energy are held by large number of individual shareholders, in opinion of the directors of the Company, the Group has control over Yinxing Energy, and Yinxing Energy continues to be included in the consolidation scope. |
| | | |
| | As disclosed in note 37, as at December 31, 2017, the Group had 18.86% equity interest in Chalco Mining. According to the “Investment Agreements” and “Debt to Equity Swap Agreements”, other shareholders of Chalco Mining will exercise their voting rights in shareholders’ and board meetings in concert with the Group. Accordingly, the directors of the Company consider that the Group had control over Chalco Mining and included Chalco Mining in the consolidation scope. |
| | | |
| (c)3. | SIGNIFICANT ACCOUNTING ESTIMATES AND JUDGEMENTS (CONTINUED) |
Judgements (continued)
| (c) | Determination of control over structured entities |
As disclosed in note 10, in 2017, the Company initiated the establishment of Beijing Chalco Bocom Size Industry Investment Fund Management Partnership (Limited Partnership) * (“Size Industry Investment Fund”) (北京中鋁交銀四則產業投資基金管理合夥企業(有限合夥)). Pursuant to the Investment Agreements, the directors of the Company are of the opinion that as a limited partner, the Company neither had control over or joint control over nor significant influence over Size Industry Investment Fund. Therefore, the Company’s investment in Size Industry Investment Fund was accounted for as equity investment designated at fair value through other comprehensive income.
| (d) | | |
| | As disclosed in note 10, in 2017, the Company initiated the establishment of Beijing Chalco Bocom Size Industry Investment Fund Management Partnership (Limited Partnership) (“Size Industry Investment Fund”*) (北京中鋁交銀四則產業投資基金管理合夥企業(有限合夥)). Pursuant to the Investment Agreements, the directors of the Company are of the opinion that as a limited partner, the Company neither had control over or joint control over nor significant influence over Size Industry Investment Fund. Therefore, the Company’s investment in the Size Industry Investment Fund was accounted for as an available-for-sale financial instrument. |
| | | |
| (d) | Lease classification |
As disclosed in note 20, the Group has entered into several sales and lease back agreements with third party leasing companies and related party leasing companies. The Group assessed the terms in the agreements and considered that the Group had substantially all the risks and rewards of ownership and treated them as finance leases.
| | | |
| | As disclosed in note 20, the Group has entered into several sales and lease back agreements with third party leasing companies and related party leasing companies. The Group assessed the terms in the agreements and considered that the Group had substantially all the risks and rewards of ownership and treated them as finance leases. |
| | | |
| * | The English name represents the best effort made by management of the Group in translating its Chinese name as it does not have any official English names. |
ALUMINUM CORPORATION OF CHINA LIMITED AND ITS SUBSIDIARIES
NOTES TO THE CONSOLIDATED FINANCIAL STATEMENTS(Continued)
For the years ended December 31, 2015, 2016, 2017 and 2017
2018
(Amounts expressed in thousands of RMB unless otherwise stated)
| 3. | SIGNIFICANT ACCOUNTING ESTIMATES AND JUDGEMENTS(Continued) (CONTINUED) |
Estimates and assumptions
The key assumptions concerning the future and other key sources of estimation uncertainty at the reporting date, that have a significant risk of causing a material adjustment to the carrying amounts of assets and liabilities within the next financial year, are described below. The Group’s assumptions and estimates are based on parameters available when the consolidated financial statements were prepared. Existing circumstances and assumptions about future developments, however, may change due to market changes or circumstances arising beyond the control of the Group. Such changes are reflected in the assumptions when they occur.
| |
| (a) | Estimates and assumptions |
| |
| The key assumptions concerning the future and other key sources of estimation uncertainty at the reporting date, that have a significant risk of causing a material adjustment to the carrying amounts of assets and liabilities within the next financial year, are described below. The Group’s assumptions and estimates are based on parameters available when the consolidated financial statements were prepared. Existing circumstances and assumptions about future developments, however, may change due to market changes or circumstances arising beyond the control of the Group. Such changes are reflected in the assumptions when they occur. |
| |
| (a) | Property, plant and equipment and intangible assets-assets – recoverable amount |
| | |
| | In accordance with the Group’s accounting policy, each asset or cash-generating unit is evaluated in every reporting period to determine whether there are any indications of impairment. If any such indication exists, an estimate of the net recoverable amount is performed and an impairment loss is recognized to the extent that the carrying amount exceeds the net recoverable amount. The net recoverable amount of an asset or cash-generating unit of assets is measured at the higher of fair value less costs of disposal and value in use. |
| | |
| | A fair value measurement of a non-financial asset takes into account a market participant’s ability to generate economic benefits by using the asset in its highest and best use or by selling it to another market participant that would use the asset in its highest and best use. |
| | |
| | Value in use is generally determined as the present value of the estimated future cash flows of those expected to arise from the continued use of the asset in its present form and its eventual disposal. Present values are determined using a risk-adjusted pre-tax discount rate appropriate to the risks inherent in the asset. Future cash flow estimates are based on expected production and sales volumes, selling prices (considering current and historical prices, price trends and related factors) and operating costs. This policy requires management to make these estimates and assumptions which are subject to risk and uncertainty; hence there is a possibility that changes in circumstances will alter these projections, which may impact on the net recoverable amounts of the assets. In such circumstances, some or all of the carrying value of the assets may be impaired and the impairment would be charged against profit or loss. |
In accordance with the Group’s accounting policy, each asset or cash-generating unit is evaluated in every reporting period to determine whether there are any indications of impairment. If any such indication exists, an estimate of the net recoverable amount is performed and an impairment loss is recognized to the extent that the carrying amount exceeds the recoverable amount. The recoverable amount of an asset or cash-generating unit of assets is measured at the higher of fair value less costs of disposal and value in use.
A fair value measurement of a non-financial asset takes into account a market participant’s ability to generate economic benefits by using the asset in its highest and best use or by selling it to another market participant that would use the asset in its highest and best use.
Value in use is generally determined as the present value of the estimated future cash flows of those expected to arise from the continued use of the asset in its present form and its eventual disposal. Present values are determined using a risk-adjusted pre-tax discount rate appropriate to the risks inherent in the asset. Future cash flow estimates are based on expected production and sales volumes, selling prices (considering current and historical prices, price trends and related factors) and operating costs. This policy requires management to make these estimates and assumptions which are subject to risk and uncertainty; hence, there is a possibility that changes in circumstances will alter these projections, which may impact on the net recoverable amounts of the assets. In such circumstances, some or all of the carrying value of the assets may be impaired and the impairment would be charged against profit or loss.
ALUMINUM CORPORATION OF CHINA LIMITED AND ITS SUBSIDIARIES
NOTES TO THE CONSOLIDATED FINANCIAL STATEMENTS(Continued)
For the years ended December 31, 2015, 2016, 2017 and 2017
2018
(Amounts expressed in thousands of RMB unless otherwise stated)
| 3. | SIGNIFICANT ACCOUNTING ESTIMATES AND JUDGEMENTS(Continued) (CONTINUED) |
Estimates and assumptions (continued)
| |
| (b) | Estimates and assumptions(Continued) |
| |
| (b) | Property, plant and equipment and intangible assets-assets - estimated useful lives and residual values |
| | |
| | The Group’s management determines the estimated useful lives and residual values (if applicable) and consequently the related depreciation/amortization charges for its property, plant and equipment and intangible assets (excluding goodwill). These estimates are based on the historical experience of the actual useful lives of property, plant and equipment of similar nature and functions, or based on value-in-use calculations or market valuations according to the estimated periods that the Group intends to derive future economic benefits from the use of intangible assets. Management will increase the depreciation/ amortization charge where useful lives are less than previously estimated, and it will write off or write down technically obsolete or non-strategic assets that have been abandoned or sold. |
| | |
| | Actual economic lives may differ from estimated useful lives and actual residual values may differ from estimated residual values. Periodic review could result in change in depreciable lives and residual values and therefore change in depreciation/amortization expense in future periods. |
| | |
| (c) | Estimated impairment of trade and other receivables and inventories |
| | |
| | A provision for impairment of trade and other receivables is established when there is objective evidence that the Group will not be able to collect all amounts due according to the original repayment terms of the receivables. Significant financial difficulties of the debtor, probability that the debtor will enter bankruptcy or financial reorganisation, and default or delinquency in payments are considered as indicators that a trade receivable is impaired. The amount of provision is the difference between the asset’s carrying amount and the present value of estimated future cash flows, discounted at the original effective interest rate. Cash flows relating to trade and other receivables are discounted if the effect of discounting is material. The carrying amount of the asset is reduced through the use of an allowance account and the amount of the loss is recognized in profit or loss. When a trade and other receivable is uncollectible, it is written off against the allowance account for trade and other receivables. Subsequent recoveries of amounts previously written off are recognized as income in profit or loss. The impairment is subject to management’s assessment at the end of the reporting period, and hence, the provision amount is subject to uncertainty. |
The Group’s management determines the estimated useful lives and residual values (if applicable) and consequently the related depreciation/amortization charges for its property, plant and equipment and intangible assets (excluding goodwill). These estimates are based on the historical experience of the actual useful lives of property, plant and equipment of similar nature and functions, or based on value-in-use calculations or market valuations according to the estimated periods that the Group intends to derive future economic benefits from the use of intangible assets. Management will increase the depreciation/ amortization charge where useful lives are less than previously estimated, and it will write off or write down technically obsolete or non-strategic assets that have been abandoned or sold.
Actual economic lives may differ from estimated useful lives and actual residual values may differ from estimated residual values. Periodic review could result in change in depreciable lives and residual values and therefore change in depreciation/amortization expense in future periods.
| (c) | Provision for expected credit losses on trade receivables |
The Group uses a provision matrix to calculate ECLs for trade receivables. The provision rates are based on days past due for groupings of various customer segments that have similar loss patterns (i.e., by product type, customer type, and coverage by letters of credit and other forms of credit insurance).
The provision matrix is initially based on the Group’s historical observed default rates. The Group will calibrate the matrix to adjust the historical credit loss experience with forward-looking information. For instance, if forecast economic conditions (i.e., gross domestic products) are expected to deteriorate over the next year which can lead to an increased number of defaults in the manufacturing sector, the historical default rates are adjusted. At each reporting date, the historical observed default rates are updated and changes in the forward-looking estimates are analysed.
The assessment of the correlation among historical observed default rates, forecast economic conditions and ECLs is a significant estimate. The amount of ECLs is sensitive to changes in circumstances and forecast economic conditions. The Group’s historical credit loss experience and forecast of economic conditions may also not be representative of the customer’s actual default in the future. The information about the ECLs on the Group’s trade receivables is disclosed in note 14 to the financial statements.
ALUMINUM CORPORATION OF CHINA LIMITED AND ITS SUBSIDIARIES
NOTES TO THE CONSOLIDATED FINANCIAL STATEMENTS(Continued)
For the years ended December 31, 2015, 2016, 2017 and 2017
2018
(Amounts expressed in thousands of RMB unless otherwise stated)
| 3. | SIGNIFICANT ACCOUNTING ESTIMATES AND JUDGEMENTS(Continued) (CONTINUED) |
Estimates and assumptions (continued)
| |
| (d) | Estimates and assumptions(Continued) |
| |
| (c) | Estimated impairment of trade and other receivables and inventories(Continued) |
In accordance with the Group’s accounting policy, the Group’s management tests whether inventories suffered any impairment based on the estimates of the net realisable amount of the inventories. For different types of inventories, it requires the estimation on selling prices, costs of conversion, selling expenses and the related tax expense to calculate the net realisable amount of inventories. For inventories held for executed sales contracts, management estimates the net realisable amount based on the contracted price; for other inventories, management estimates the realisable future price based on the actual prices during the period from the end of the reporting period to the date that these financial statements were approved for issue by the board of directors of the Company and takes into account the nature and balance of inventories and future estimated price trends. For raw materials and work-in-progress, management has established a model in estimating the net realisable amount at which the inventories can be realized in the normal course of business after considering the Group’s manufacturing cycles, production capacity and forecasts, estimated future conversion costs and selling prices. Management also takes into account the price or cost fluctuations and other related matters occurring after the end of the reporting period which reflect conditions that existed at the end of the reporting period.
It is reasonably possible that if there is a significant change in circumstances, including the Group’s business and the external environment, outcomes within the next financial year would be significantly affected.
| (e) | |
| | In accordance with the Group’s accounting policy, the Group’s management tests whether inventories suffered any impairment based on estimates of the net realisable amount of the inventories. For different types of inventories, it requires the estimation on selling prices, costs of conversion, selling expenses and the related tax expense to calculate the net recoverable amount of inventories. For inventories held for executed sales contracts, management estimates the net recoverable amount based on the contracted price; for other inventories, management estimates the realisable future price based on the actual prices during the period from the end of the reporting period to the date that these financial statements were approved for issue by the board of directors of the Company and takes into account the nature and balance of inventories and future estimated price trends. For raw materials and work-in-progress, management has established a model in estimating the net recoverable amount at which the inventories can be realized in the normal course of business after considering the Group’s manufacturing cycles, production capacity and forecasts, estimated future conversion costs and selling prices. Management also takes into account the price or cost fluctuations and other related matters occurring after the end of the reporting period which reflect conditions that existed at the end of the reporting period. |
| | |
| | It is reasonably possible that if there is a significant change in circumstances including the Group’s business and the external environment, outcomes within the next financial year would be significantly affected. |
| | |
| (d) | Coal reserve estimates and units-of-production depreciationamortization for coal mining rights |
| | |
| | External qualified valuation professionals evaluate “economically recoverable reserves” based on the reserves estimated by external qualified exploration engineers in accordance with the PRC standards. The estimates of coal reserves are inherently imprecise and represent only the approximate amounts of the coal reserves because of the subjective judgements involved in developing such information. Economically recoverable reserve estimates are evaluated on a regular basis and have taken into account recent production and technical information about each mine. |
External qualified valuation professionals evaluate “economically recoverable reserves” based on the reserves estimated by external qualified exploration engineers in accordance with the PRC standards. The estimates of coal reserves are inherently imprecise and represent only the approximate amounts of the coal reserves because of the subjective judgements involved in developing such information. Economically recoverable reserve estimates are evaluated on a regular basis and have taken into account recent production and technical information about each mine.
ALUMINUM CORPORATION OF CHINA LIMITED AND ITS SUBSIDIARIES
NOTES TO THE CONSOLIDATED FINANCIAL STATEMENTS(Continued)
For the years ended December 31, 2015, 2016, 2017 and 2017
2018
(Amounts expressed in thousands of RMB unless otherwise stated)
| 3. | SIGNIFICANT ACCOUNTING ESTIMATES AND JUDGEMENTS(Continued) (CONTINUED) |
| |
| Estimates and assumptions(Continued) |
| |
| (e) | Income tax |
| | |
| | The Group estimates its income tax provision and deferred taxation in accordance with the prevailing tax rules and regulations, taking into account any special approvals obtained from the relevant tax authorities and any preferential tax treatment to which it is entitled in each location or jurisdiction in which the Group operates. There are many transactions and calculations for which the ultimate tax determination is uncertain during the ordinary course of business. The Group recognizes liabilities for anticipated tax audit issues based on estimates of whether additional taxes will be due. Where the final tax outcome of these matters is different from the amounts that were initially recorded, the differences will impact on the income tax and deferred tax provisions in the period in which the determination is made. |
| | |
| | Deferred tax assets are recognized for unused tax losses and deductible temporary differences, such as the provision for impairment of receivables, inventories and property, plant and equipment and accruals of expenses not yet deductible for tax purposes, to the extent that it is probable that taxable profits will be available against which the losses deductible temporary difference can be utilized. Significant management judgement is required to determine the amount of deferred tax assets that can be recognized, based upon the likely timing and level of future taxable profits together with future tax planning strategies. |
| | |
| | An entity shall recognize a deferred tax liability for all taxable temporary differences associated with investments in subsidiaries, associates and joint ventures, except to the extent that both of the following conditions are satisfied: |
Estimates and assumptions (continued)
The Group estimates its income tax provision and deferred taxation in accordance with the prevailing tax rules and regulations, taking into account any special approvals obtained from the relevant tax authorities and any preferential tax treatment to which it is entitled in each location or jurisdiction in which the Group operates. There are many transactions and calculations for which the ultimate tax determination is uncertain during the ordinary course of business. The Group recognizes liabilities for anticipated tax audit issues based on the estimates of whether additional taxes will be due. Where the final tax outcome of these matters is different from the amounts that were initially recorded, the differences will impact on the income tax and deferred tax provisions in the period in which the determination is made.
Deferred tax assets are recognized for unused tax losses and deductible temporary differences, such as the provision for impairment of receivables, inventories and property, plant and equipment and accruals of expenses not yet deductible for tax purposes, to the extent that it is probable that taxable profits will be available against which the losses and deductible temporary difference can be utilized. Significant management judgement is required to determine the amount of deferred tax assets that can be recognized, based upon the likely timing and level of future taxable profits together with future tax planning strategies.
An entity shall recognize a deferred tax liability for all taxable temporary differences associated with investments in subsidiaries, associates and joint ventures, except to the extent that both of the following conditions are satisfied:
| ● | the parent, investor or joint venturer is able to control the timing of the reversal of the temporary difference; and |
| | | |
| | •● | it is probable that the temporary difference will not reverse in the foreseeable future. |
| | The Group considers that it has recorded adequate current tax provision and deferred taxes based on the prevailing tax rules and regulations and its current best estimates and assumptions. In the event that future tax rules and regulations or related circumstances change, adjustments to current and deferred taxation may be necessary which would impact on the Group’s results or financial position. |
ALUMINUM CORPORATION OF CHINA LIMITED AND ITS SUBSIDIARIES
NOTES TO THE CONSOLIDATED FINANCIAL STATEMENTS(Continued)
For the years ended December 31, 2015, 2016, 2017 and 2017
2018
(Amounts expressed in thousands of RMB unless otherwise stated)
| 3. | SIGNIFICANT ACCOUNTING ESTIMATES AND JUDGEMENTS(Continued) (CONTINUED) |
Estimates and assumptions (continued)
| (g) | |
| Estimates and assumptions(Continued) |
| | |
| (f) | Goodwill - recoverable amount |
In accordance with the Group’s accounting policy, goodwill is allocated to the Group’s cash generating units as it represents the lowest level within the Group at which the goodwill is monitored for internal management purposes and is tested for impairment annually by preparing a formal estimate of the recoverable amount. The recoverable amount is the higher of value in use and the fair value less costs of disposal. Similar considerations to those described above in respect of assessing the recoverable amount of property, plant and equipment also apply to goodwill.
| | |
| | In accordance with the Group’s accounting policy, goodwill is allocated to the Group’s operating segments as it represents the lowest level within the Group at which the goodwill is monitored for internal management purposes and is tested for impairment annually by preparing a formal estimate of the recoverable amount. The recoverable amount is the higher of value in use and the fair value less costs of disposal. Similar considerations to those described above in respect of assessing the recoverable amount of property, plant and equipment also apply to goodwill. |
| | |
| (g)h) | InvestmentInvestments in joint ventures and associates - recoverable amount |
| | |
| | In accordance with the Group’s accounting policy, each investment in joint ventures and associates is evaluated in every reporting period to determine whether there are any indications of impairment. If any such indication exists, an estimate of the recoverable amount is performed and an impairment loss is recognized to the extent that the carrying amount exceeds the recoverable amount. The recoverable amount of the investment in a joint venture and an associate is measured at the higher of fair value less costs of disposal and value in use. |
| | |
| | A fair value measurement of a non-financial asset takes into account a market participant’s ability to generate economic benefits by using the asset in its highest and best use or by selling it to another market participant that would use the asset in its highest and best use. |
| | |
| | Value in use is also generally determined as the present value of the estimated future cash flows of those expected to arise from the continued use of the asset in its present form and its eventual disposal. Present values are determined using a risk-adjusted pre-tax discount rate appropriate to the risks inherent in the asset. Future cash flow estimates are based on expected production and sales volumes, commodity prices (considering current and historical prices, price trends and related factors) and operating costs. This policy requires management to make these estimates and assumptions which are subject to risk and uncertainty; hence there is a possibility that changes in circumstances will alter these projections, which may impact on the recoverable amounts of the investments. In such circumstances, some or all of the carrying value of the investments may be impaired and the impairment would be charged against profit or loss. |
In accordance with the Group’s accounting policy, each investment in a joint venture and an associate is evaluated in every reporting period to determine whether there are any indicators of impairment. If any such indicators exists, an estimate of the recoverable amount is performed and an impairment loss is recognized to the extent that the carrying amount exceeds the recoverable amount. The recoverable amount of the investment in a joint venture and an associate is measured at the higher of fair value less costs of disposal and value in use.
A fair value measurement of a non-financial asset takes into account a market participant’s ability to generate economic benefits by using the asset in its highest and best use or by selling it to another market participant that would use the asset in its highest and best use.
Value in use is also generally determined as the present value of the estimated future cash flows of those expected to arise from the continued use of the asset in its present form and its eventual disposal. Present values are determined using a risk-adjusted pre-tax discount rate appropriate to the risks inherent in the asset. Future cash flow estimates are based on expected production and sales volumes, commodity prices (considering current and historical prices, price trends and related factors) and operating costs. This policy requires management to make these estimates and assumptions which are subject to risk and uncertainty; hence there is a possibility that changes in circumstances will alter these projections, which may impact on the recoverable amounts of the investments. In such circumstances, some or all of the carrying value of the investments may be impaired and the impairment would be charged against profit or loss.
ALUMINUM CORPORATION OF CHINA LIMITED AND ITS SUBSIDIARIES
NOTES TO THE CONSOLIDATED FINANCIAL STATEMENTS(Continued)
For the years ended December 31, 2015, 2016, 2017 and 2017
2018
(Amounts expressed in thousands of RMB unless otherwise stated)
| 4. | REVENUE AND SEGMENT INFORMATION |
| |
| (a) | Revenue |
| | |
| | Revenue recognized during the years are as follows: |
| | 2015 | | 2016 | | 2017 |
| | | | | | |
| Sales of goods (net of value-added tax) | 121,255,842 | | 141,534,738 | | 177,872,845 |
| Other revenue | 2,411,825 | | 2,694,178 | | 2,207,905 |
| | | | | | |
| | 123,667,667 | | 144,228,916 | | 180,080,750 |
Revenue recognized during the years is as follows:
| | | 2016 | | | 2017 | | | 2018 | |
| | | | | | | | | | |
| Sales of goods (net of value-added tax) | | | 144,564,755 | | | | 180,704,153 | | | | 179,784,444 | |
| Rendering of services | | | 123,966 | | | | 163,732 | | | | 215,557 | |
| Rental income | | | 165,861 | | | | 152,543 | | | | 240,153 | |
| | | | | | | | | | | | | |
| | | | 144,854,582 | | | | 181,020,428 | | | | 180,240,154 | |
Other revenue primarily includes revenue from the sale of scrap and other materials, the supply of heat and water and the provision of machinery processing, transportation and packaging and other services.
| Other(i) | Disaggregated revenue primarily includes revenue from the sale of scrap and other materials, the supply of heat and water and the provision of machinery processing, transportation and packaging and other services.information |
For the year ended December 31, 2018
| | | Alumina segment | | | Primary aluminum segment | | | Energy segment | | | Trading | | | Corporate and other operating segments | | | Inter-segment elimination | | | Total | |
| Type of goods or services | | | | | | | | | | | | | | | | | | | | | | | | | | | | |
| Sales of goods | | | 43,979,059 | | | | 53,771,379 | | | | 7,019,716 | | | | 141,979,219 | | | | 667,095 | | | | (67,632,024 | ) | | | 179,784,444 | |
| Rendering of services | | | — | | | | — | | | | 215,557 | | | | — | | | | — | | | | — | | | | 215,557 | |
| Total revenue | | | 43,979,059 | | | | 53,771,379 | | | | 7,235,273 | | | | 141,979,219 | | | | 667,095 | | | | (67,632,024 | ) | | | 180,000,001 | |
| | | | | | | | | | | | | | | | | | | | | | | | | | | | | |
| Geographical markets | | | | | | | | | | | | | | | | | | | | | | | | | | | | |
| Mainland China | | | 43,979,059 | | | | 53,771,379 | | | | 7,235,273 | | | | 132,762,660 | | | | 667,095 | | | | (67,632,024 | ) | | | 170,783,442 | |
| Outside of mainland China | | | — | | | | — | | | | — | | | | 9,216,559 | | | | — | | | | — | | | | 9,216,559 | |
| Total revenue | | | 43,979,059 | | | | 53,771,379 | | | | 7,235,273 | | | | 141,979,219 | | | | 667,095 | | | | (67,632,024 | ) | | | 180,000,001 | |
| | | | | | | | | | | | | | | | | | | | | | | | | | | | | |
| Timing of revenue recognition | | | | | | | | | | | | | | | | | | | | | | | | | | | | |
| Goods transferred at a point in time | | | 43,979,059 | | | | 53,771,379 | | | | 7,019,716 | | | | 141,979,219 | | | | 667,095 | | | | (67,632,024 | ) | | | 179,784,444 | |
| Services transferred over time | | | — | | | | — | | | | 215,557 | | | | — | | | | — | | | | — | | | | 215,557 | |
| Total revenue | | | 43,979,059 | | | | 53,771,379 | | | | 7,235,273 | | | | 141,979,219 | | | | 667,095 | | | | (67,632,024 | ) | | | 180,000,001 | |
| | | | | | | | | | | | | | | | | | | | | | | | | | | | | |
| Revenue from contracts with customers | | | | | | | | | | | | | | | | | | | | | | | | | | | | |
| External customers | | | 14,586,564 | | | | 41,313,516 | | | | 7,036,936 | | | | 116,608,916 | | | | 454,069 | | | | — | | | | 180,000,001 | |
| Intersegment sales | | | 29,392,495 | | | | 12,457,863 | | | | 198,337 | | | | 25,370,303 | | | | 213,026 | | | | — | | | | 67,632,024 | |
| | | | 43,979,059 | | | | 53,771,379 | | | | 7,235,273 | | | | 141,979,219 | | | | 667,095 | | | | — | | | | 247,632,025 | |
| Intersegment adjustments and eliminations | | | (29,392,495 | ) | | | (12,457,863 | ) | | | (198,337 | ) | | | (25,370,303 | ) | | | (213,026 | ) | | | — | | | | (67,632,024 | ) |
| Total revenue | | | 14,586,564 | | | | 41,313,516 | | | | 7,036,936 | | | | 116,608,916 | | | | 454,069 | | | | — | | | | 180,000,001 | |
ALUMINUM CORPORATION OF CHINA LIMITED AND ITS SUBSIDIARIES
NOTES TO THE CONSOLIDATED FINANCIAL STATEMENTS(Continued)
For the years ended December 31, 2015, 2016, 2017 and 2017
2018
(Amounts expressed in thousands of RMB unless otherwise stated)
| 4. | REVENUE AND SEGMENT INFORMATION(Continued) |
| (i) | Disaggregated revenue information (continued) |
The following table shows the amounts of revenue recognized in the current reporting period that were included in the contract liabilities at the beginning of the reporting period and recognized from performance obligations satisfied in previous periods:
| | | 2018 | |
| | (b) | Segment information | |
| Revenue recognized that was included in contract liabilities at the beginning of the reporting period: | | | | |
| — Sale of goods | | | 1,277,125 | |
| — Others | | | 32,947 | |
| | | | |
| | | The presidents of the Company have been identified as the chief operating decision-makers. They are responsible for the review of internal reports in order to allocate resources to operating segments and assess their performance of these operating segments. | 1,310,072 | |
| (ii) | Performance obligations |
Information about the Group’s performance obligations is summarised below:
Revenue from sales of products (including sales of and other materials)
The performance obligation is satisfied upon delivery of the industrial products and payment is generally due within 30 to 90 days from delivery, except for new customers, where payment in advance is normally required.
Sale of goods were made in a short period of time and the performance obligation was mostly satisficed in one year or less at the end of each year.
Rendering of services
The performance obligation is satisfied over time as services are rendered and payment is generally due upon completion of the relevant services.
The transaction prices allocated to the remaining performance obligations (unsatisfied or partially unsatisfied) as at December 31, 2018 are as follows:
| | | |
| Within one year | | | 1,579,322 | |
| More than one year | | | 132,844 | |
| | | | |
| | | The presidents monitor the business from a product perspective comprising alumina, primary aluminum and energy products which are identified as separate reportable operating segments. In addition, the Group’s trading business is identified as a separate reportable operating segment. The Group’s operating segments also include corporate and other operating activities. |
| 1,712,166 | | |
| | The presidents assess the performance of operating segments based on profit or loss before income tax in related periods. Unless otherwise stated below, the manner of assessment used by the presidents is consistent with that applied in these financial statements. Management has determined the operating segments based on the reports reviewed by the presidents that are used to make strategic decisions. |
The remaining performance obligations expected to be recognized in more than one year relate to rendering of services that are to be satisfied within 1–10 years. All the other remaining performance obligations are satisfied in one year or less at the end of each year.
ALUMINUM CORPORATION OF CHINA LIMITED AND ITS SUBSIDIARIES
NOTES TO THE CONSOLIDATED FINANCIAL STATEMENTS(Continued)
For the years ended December 31, 2015, 2016, 2017 and 2017
2018
(Amounts expressed in thousands of RMB unless otherwise stated)
| 4. | REVENUE AND SEGMENT INFORMATION(Continued) |
The presidents of the Company have been identified as the chief operating decision-makers. They are responsible for the review of internal reports in order to allocate resources to operating segments and assess their performance of these operating segments.
The presidents monitor the business from a product perspective comprising alumina, primary aluminum and energy products which are identified as separate reportable operating segments. In addition, the Group’s trading business is identified as a separate reportable operating segment. The Group’s operating segments also include corporate and other operating activities.
The presidents assess the performance of operating segments based on profit or loss before income tax in related periods. Unless otherwise stated below, the manner of assessment used by the presidents is consistent with that applied in these financial statements. Management has determined the operating segments based on the reports reviewed by the presidents that are used to make strategic decisions.
ALUMINUM CORPORATION OF CHINA LIMITED AND ITS SUBSIDIARIES
NOTES TO THE CONSOLIDATED FINANCIAL STATEMENTS(Continued)
For the years ended December 31, 2016, 2017 and 2018
(Amounts expressed in thousands of RMB unless otherwise stated)
| (b)4. | Segment informationREVENUE AND SEGMENT INFORMATION(Continued) |
| (b) | Segment information(Continued) |
The Group’s five reportable operating segments are summarised as follows:
| |
| | The Group’s five reportable operating segments are summarized as follows: |
| | |
| | •● | The alumina segment, which consists of the mining and purchase of bauxite and other raw materials, the refining of bauxite into alumina, and the sale of alumina both internally to the Group’s aluminum enterprises and trading enterprises and externally to customers outside the Group. This segment also includes the production and sale of chemical alumina and metal gallium. |
| | | |
| | •● | The primary aluminum segment, which consists of the procurement of alumina and other raw materials, supplemental materials and electricity power, and the smelting of alumina to produce primary aluminum which is sold to internal trading enterprises and external customers, including Chinalco and its subsidiaries. This segment also includes the production and sale of carbon products and aluminum alloy and other aluminum products. |
| | | |
| | •● | The energy segment, which consists of the research and development, production and operation of energy products, mainly includes coal mining, electricity generation by thermal power, wind power and solar power, and the new energy relatedenergy-related equipment manufacturing business. Sales of coals are mainly made to the Group’s internal and external coalscoal consuming customers; electricity is sold to regional power grid corporations. |
| | | |
| | •● | The trading segment, which consists of the trading of alumina, primary aluminum, aluminum fabrication products, other non-ferrous metal products, coal products, raw materials and supplemental materials and logistics and transport services to internal manufacturing plants and external customers in the PRC. The products are sourced from fellow subsidiaries of the Group, international and domestic suppliers of the Group. Sales of products manufactured by the Group’s manufacturing business are included in the total revenue of the trading segment and are eliminated with the segment revenue of the respective segments which supply the products to the trading segment. |
| | | |
| | •● | Corporate and other operating segments, which mainly include corporate management, research and development activities and others. |
| | | |
| | Prepaid current income tax and deferred tax assets are excluded from segment assets, and income tax payable and deferred tax liabilities are excluded from segment liabilities. All sales among the operating segments were conducted on terms mutually agreed among group companies, and have been eliminated on consolidation. |
Prepaid current income tax and deferred tax assets are excluded from segment assets, and income tax payable and deferred tax liabilities are excluded from segment liabilities. All sales among the operating segments were conducted on terms mutually agreed among group companies, and have been eliminated on consolidation.
ALUMINUM CORPORATION OF CHINA LIMITED AND ITS SUBSIDIARIES
NOTES TO THE CONSOLIDATED FINANCIAL STATEMENTS(Continued)
For the years ended December 31, 2015, 2016, 2017 and 20172018
(Amounts expressed in thousands of RMB unless otherwise stated)
| 4. | REVENUE AND SEGMENT INFORMATION(Continued) |
| | |
| (b) | Segment information(Continued) (CONTINUED) |
| (b) | Segment information (continued) |
| | | Year ended December 31, 2015 | | | Year ended December 31, 2016 | |
| | | Alumina | | | | Primary aluminum | | | | Energy | | | | Trading | | | | Corporate and other operating segments | | | | Inter- segment eliminations | | | | Total | | | Alumina | | | Primary aluminum | | | Energy | | | Trading | | | Corporate and other operating segments | | | Inter- segment eliminations | | | Total | |
| | | | | | | | | | | | | | | | | | | | | | | | | | | | | | | | | | | | | | | | | | | | |
| Total revenue | | | 33,497,260 | | | | 36,973,230 | | | | 4,290,915 | | | | 94,131,114 | | | | 302,377 | | | | (45,527,229 | ) | | | 123,667,667 | | | | 30,027,317 | | | | 35,089,860 | | | | 4,519,806 | | | | 114,345,851 | | | | 504,355 | | | | (39,632,607 | ) | | | 144,854,582 | |
| Inter-segment revenue | | | (26,643,874 | ) | | | (8,861,390 | ) | | | (98,124 | ) | | | (9,908,906 | ) | | | (14,935 | ) | | | 45,527,229 | | | | — | | | | (20,508,466 | ) | | | (4,981,936 | ) | | | (137,460 | ) | | | (13,906,423 | ) | | | (98,322 | ) | | | 39,632,607 | | | | — | |
| | | | | | | | | | | | | | | | | | | | | | | | | | | | | | | | | | | | | | | | | | | | | | | | | | | | | | | | | |
| Sales of self-produced products(Note (i)) | | | | | | | | | | | | | | | 23,294,776 | | | | | | | | | | | | | | | | | | | | | | | | | | | | 18,292,949 | | | | | | | | | | | | | |
| | | | | | | | | | | | | | | | | | | | | | | | | | | | | | | | | | | | | | | | | | | | | | | | | | | | | | | | | |
| Sales of products sourced from external suppliers | | | | | | | | | | | | | | | 60,927,432 | | | | | | | | | | | | | | | | | | | | | | | | | | | | 82,146,479 | | | | | | | | | | | | | |
| | | | | | | | | | | | | | | | | | | | | | | | | | | | | | | | | | | | | | | | | | | | | | | | | | | | | | | | | |
| Revenue from external customers | | | 6,853,386 | | | | 28,111,840 | | | | 4,192,791 | | | | 84,222,208 | | | | 287,442 | | | | — | | | | 123,667,667 | | | | 9,518,851 | | | | 30,107,924 | | | | 4,382,346 | | | | 100,439,428 | | | | 406,033 | | | | — | | | | 144,854,582 | |
| | | | | | | | | | | | | | | | | | | | | | | | | | | | | | | | | | | | | | | | | | | | | | | | | | | | | | | | | |
| Segment profit/(loss) before income tax | | | 1,895,706 | | | | (1,386,922 | ) | | | (74,153 | ) | | | (1,234,554 | ) | | | 733,760 | | | | 188,104 | | | | 121,941 | | | | 910,426 | | | | 2,183,826 | | | | 33,408 | | | | 804,207 | | | | (1,993,161 | ) | | | (318,017 | ) | | | 1,620,689 | |
| | | | | | | | | | | | | | | | | | | | | | | | | | | | | | | | | | | | | | | | | | | | | | | | | | | | | | | | | |
| Income tax benefit | | | | | | | | | | | | | | | | | | | | | | | | | | | 225,961 | | |
| Income tax expense | | | | | | | | | | | | | | | | | | | | | | | | | | | | (403,899 | ) |
| | | | | | | | | | | | | | | | | | | | | | | | | | | | | | | | | | | | | | | | | | | | | | | | | | | | | | | | | |
| Profit for the year | | | | | | | | | | | | | | | | | | | | | | | | | | | 347,902 | | | | | | | | | | | | | | | | | | | | | | | | | | | | 1,216,790 | |
| | | | | | | | | | | | | | | | | | | | | | | | | | | | | | | | | | | | | | | | | | | | | | | | | | | | | | | | | |
| Other items | | | | | | | | | | | | | | | | | | | | | | | | | | | | | | | | | | | | | | | | | | | | | | | | | | | | | | | | |
| Finance income | | | 204,580 | | | | 20,820 | | | | 39,231 | | | | 265,372 | | | | 282,456 | | | | — | | | | 812,459 | | | | 302,230 | | | | 36,139 | | | | 51,897 | | | | 226,941 | | | | 198,522 | | | | — | | | | 815,729 | |
| Finance costs | | | (1,081,381 | ) | | | (1,347,593 | ) | | | (1,016,869 | ) | | | (562,645 | ) | | | (1,971,001 | ) | | | — | | | | (5,979,489 | ) | | | (1,016,455 | ) | | | (1,226,821 | ) | | | (987,422 | ) | | | (329,454 | ) | | | (1,459,756 | ) | | | — | | | | (5,019,908 | ) |
| Share of profits and losses of joint ventures | | | — | | | | — | | | | 6,979 | | | | — | | | | 16,259 | | | | — | | | | 23,238 | | | | (41,367 | ) | | | — | | | | (28,312 | ) | | | — | | | | (25,829 | ) | | | — | | | | (95,508 | ) |
| Share of profits and losses of associates | | | — | | | | (2,027 | ) | | | 270,963 | | | | — | | | | 15,595 | | | | — | | | | 284,531 | | | | — | | | | 958 | | | | 87,359 | | | | (810 | ) | | | 27,584 | | | | — | | | | 115,091 | |
| Amortization of land use rights | | | (44,591 | ) | | | (28,989 | ) | | | (12,557 | ) | | | (15 | ) | | | (18,307 | ) | | | — | | | | (104,459 | ) | | | (43,523 | ) | | | (27,464 | ) | | | (11,172 | ) | | | (15 | ) | | | (17,550 | ) | | | — | | | | (99,724 | ) |
| Depreciation and amortization (excluding the amortization of land use rights) | | | (3,066,608 | ) | | | (2,871,447 | ) | | | (1,203,659 | ) | | | (27,526 | ) | | | (114,840 | ) | | | — | | | | (7,284,080 | ) | | | (2,847,343 | ) | | | (2,612,308 | ) | | | (1,298,483 | ) | | | (54,724 | ) | | | (88,095 | ) | | | — | | | | (6,900,953 | ) |
| Gain/(loss) on disposal of property, plant and equipment and land use rights | | | 218,384 | | | | 1,747,796 | | | | (611 | ) | | | 56,120 | | | | 296,168 | | | | — | | | | 2,317,857 | | |
| Other income | | | 316,536 | | | | 1,369,644 | | | | 79,611 | | | | 12,816 | | | | 9,167 | | | | — | | | | 1,787,774 | | |
| Gain on disposal of Shanxi Huaxing | | | 1,035,254 | | | | — | | | | — | | | | — | | | | 1,552,880 | | | | — | | | | 2,588,134 | | |
| Partial disposal of Jiaozuo Wanfang | | | — | | | | — | | | | — | | | | — | | | | 832,369 | | | | — | | | | 832,369 | | |
| Gain on disposal of property, plant and equipment and land use rights | | | | 191,364 | | | | 361,155 | | | | 253,566 | | | | 2,890 | | | | 7,746 | | | | — | | | | 816,721 | |
| Impairment of property, plant and equipment | | | — | | | | — | | | | (10,011 | ) | | | — | | | | — | | | | — | | | | (10,011 | ) | | | (35,893 | ) | | | (18,239 | ) | | | (2,948 | ) | | | — | | | | — | | | | — | | | | (57,080 | ) |
| Change for impairment of inventories(Note (ii)) | | | (219,997 | ) | | | 55,288 | | | | 7,417 | | | | (459,575 | ) | | | — | | | | — | | | | (616,867 | ) | |
| Reversal of provision for impairment of receivables, net | | | 5,389 | | | | 40,603 | | | | 64,417 | | | | 121,741 | | | | — | | | | — | | | | 232,150 | | |
| Investments in associates | | | 21,000 | | | | 312,286 | | | | 2,323,968 | | | | 118,352 | | | | 2,827,095 | | | | — | | | | 5,602,701 | | |
| Investments in joint ventures | | | 1,886,083 | | | | — | | | | 1,412,223 | | | | — | | | | 1,852,581 | | | | — | | | | 5,150,887 | | |
| Capital expenditure in: | | | | | | | | | | | | | | | | | | | | | | | | | | | | | |
| Changes in fair value gains and losses | | | | — | | | | 16,778 | | | | — | | | | 109,906 | | | | 27,901 | | | | — | | | | 154,585 | |
| Realized loss on futures, forward and option contracts, net | | | | (1,297 | ) | | | (271,000 | ) | | | — | | | | (457,702 | ) | | | (560,268 | ) | | | — | | | | (1,290,267 | ) |
| Changes for impairment of inventories | | | | 684,271 | | | | 505,595 | | | | 159 | | | | 471,218 | | | | 1,145 | | | | — | | | | 1,662,388 | |
| Provision for impairment of receivables, net of bad debts recovered | | | | 53,144 | | | | (2,465 | ) | | | (836 | ) | | | (5,838 | ) | | | — | | | | — | | | | 44,005 | |
| Gain on disposal of associates | | | | — | | | | — | | | | — | | | | — | | | | 128,833 | | | | — | | | | 128,833 | |
| Dividends from available for sale financial assets | | | | — | | | | — | | | | 1,000 | | | | — | | | | 139,929 | | | | — | | | | 140,929 | |
| | | | | | | | | | | | | | | | | | | | | | | | | | | | | | |
| Additions during the period: | | | | | | | | | | | | | | | | | | | | | | | | | | | | | |
| Investment in joint ventures | | | | 2,631,546 | | | | — | | | | 1,559,966 | | | | — | | | | 2,048,688 | | | | — | | | | 6,240,200 | |
| Investment in associates | | | | 69,000 | | | | 313,244 | | | | 2,351,845 | | | | 146,926 | | | | 3,045,518 | | | | — | | | | 5,926,533 | |
| Intangible assets | | | 5,167 | | | | 872 | | | | 27,991 | | | | 580 | | | | — | | | | — | | | | 34,610 | | | | 336,603 | | | | 3 | | | | 6,857 | | | | 509 | | | | 127 | | | | — | | | | 344,099 | |
| Land use rights | | | — | | | | 133,686 | | | | 5,938 | | | | — | | | | — | | | | — | | | | 139,624 | | | | — | | | | 26 | | | | 20,937 | | | | — | | | | — | | | | — | | | | 20,963 | |
| Property, plant and equipment(Note (iii)) | | | 5,523,144 | | | | 1,862,662 | | | | 2,377,708 | | | | 16,930 | | | | 412,632 | | | | — | | | | 10,193,076 | | |
| Investment properties | | | | 50,285 | | | | 3,354 | | | | — | | | | 38,628 | | | | — | | | | — | | | | 92,267 | |
| Property, plant and equipment(Note (ii)) | | | | 2,455,066 | | | | 4,203,385 | | | | 1,582,039 | | | | 42,476 | | | | 143,736 | | | | — | | | | 8,426,702 | |
Note:
| (i) | The sales of self-produced products include sales of self-produced alumina amounting to RMB12,699 million, sales of self-produced primary aluminum amounting RMB8,099 million, and sales of self-produced other products amounting to RMB2,497 million. |
| |
(ii) | Change for impairment of inventories do not include change for impairment due to disposal of subsidiaries and transferred to non-current assets held for sale. |
| |
(iii) | The additions in property, plant and equipment under sale and leaseback contracts are not included in capital expenditure in property, plant and equipment. |
ALUMINUM CORPORATION OF CHINA LIMITED AND ITS SUBSIDIARIES
NOTES TO THE CONSOLIDATED FINANCIAL STATEMENTS(Continued)
For the years ended December 31, 2015, 2016 and 2017
(Amounts expressed in thousands of RMB unless otherwise stated)
4. | REVENUE AND SEGMENT INFORMATION(Continued) |
| | |
| (b) | Segment information(Continued) |
| | | Year ended December 31, 2016 | |
| | | Alumina | | | | Primary aluminum | | | | Energy | | | | Trading | | | | Corporate and other operating segments | | | | Inter- segment eliminations | | | | Total | |
| | | | | | | | | | | | | | | | | | | | | | | | | | | | | |
| Total revenue | | | 30,027,317 | | | | 34,464,194 | | | | 4,519,806 | | | | 114,345,851 | | | | 504,355 | | | | (39,632,607 | ) | | | 144,228,916 | |
| Inter-segment revenue | | | (20,508,466 | ) | | | (4,981,936 | ) | | | (137,460 | ) | | | (13,906,423 | ) | | | (98,322 | ) | | | 39,632,607 | | | | — | |
| | | | | | | | | | | | | | | | | | | | | | | | | | | | | |
| Sales of self-produced products(Note (i)) | | | | | | | | | | | | | | | 18,292,949 | | | | | | | | | | | | | |
| | | | | | | | | | | | | | | | | | | | | | | | | | | | | |
| Sales of products sourced from external suppliers | | | | | | | | | | | | | | | 82,146,479 | | | | | | | | | | | | | |
| | | | | | | | | | | | | | | | | | | | | | | | | | | | | |
| Revenue from external customers | | | 9,518,851 | | | | 29,482,258 | | | | 4,382,346 | | | | 100,439,428 | | | | 406,033 | | | | — | | | | 144,228,916 | |
| | | | | | | | | | | | | | | | | | | | | | | | | | | | | |
| Segment profit/(loss) before income tax | | | 910,426 | | | | 2,183,826 | | | | 33,408 | | | | 809,063 | | | | (1,993,161 | ) | | | (318,017 | ) | | | 1,625,545 | |
| | | | | | | | | | | | | | | | | | | | | | | | | | | | | |
| Income tax expense | | | | | | | | | | | | | | | | | | | | | | | | | | | (404,172 | ) |
| | | | | | | | | | | | | | | | | | | | | | | | | | | | | |
| Profit for the year | | | | | | | | | | | | | | | | | | | | | | | | | | | 1,221,373 | |
| | | | | | | | | | | | | | | | | | | | | | | | | | | | | |
| Other items | | | | | | | | | | | | | | | | | | | | | | | | | | | | |
| Finance income | | | 302,230 | | | | 36,139 | | | | 51,897 | | | | 226,941 | | | | 198,522 | | | | — | | | | 815,729 | |
| Finance costs | | | (1,016,455 | ) | | | (1,226,821 | ) | | | (987,422 | ) | | | (329,454 | ) | | | (1,459,756 | ) | | | — | | | | (5,019,908 | ) |
| Share of profits and losses of joint ventures | | | (41,367 | ) | | | — | | | | (28,312 | ) | | | — | | | | (25,829 | ) | | | — | | | | (95,508 | ) |
| Share of profits and losses of associates | | | — | | | | 958 | | | | 87,359 | | | | (810 | ) | | | 27,584 | | | | — | | | | 115,091 | |
| Amortization of land use rights | | | (43,523 | ) | | | (27,464 | ) | | | (11,172 | ) | | | (15 | ) | | | (17,550 | ) | | | — | | | | (99,724 | ) |
| Depreciation and amortization (excluding the amortization of land use rights) | | | (2,847,343 | ) | | | (2,598,984 | ) | | | (1,298,483 | ) | | | (54,724 | ) | | | (88,095 | ) | | | — | | | | (6,887,629 | ) |
| Gain on disposal of property, plant and equipment and land use rights | | | 191,364 | | | | 361,155 | | | | 253,566 | | | | 2,890 | | | | 7,746 | | | | — | | | | 816,721 | |
| Unrealized gains on futures, forward and option contracts, net | | | — | | | | 16,778 | | | | — | | | | 109,906 | | | | 27,901 | | | | — | | | | 154,585 | |
| Realized loss on futures, forward and option contracts, net | | | (1,297 | ) | | | (271,000 | ) | | | — | | | | (457,702 | ) | | | (560,268 | ) | | | — | | | | (1,290,267 | ) |
| Other income | | | 440,592 | | | | 195,380 | | | | 57,600 | | | | 40,085 | | | | 11,612 | | | | — | | | | 745,269 | |
| Impairment of property, plant and equipment | | | (35,893 | ) | | | (18,239 | ) | | | (2,948 | ) | | | — | | | | — | | | | — | | | | (57,080 | ) |
| Changes for impairment of inventories | | | 684,271 | | | | 505,595 | | | | 159 | | | | 471,218 | | | | 1,145 | | | | — | | | | 1,662,388 | |
| Reversal of provision/(provision) for impairment of receivables, net | | | 53,144 | | | | 198 | | | | (836 | ) | | | (5,838 | ) | | | — | | | | — | | | | 46,668 | |
| Gain on disposal of associates | | | — | | | | — | | | | — | | | | — | | | | 128,833 | | | | — | | | | 128,833 | |
| Gain on disposal and dividends of available for sale | | | — | | | | — | | | | 1,000 | | | | — | | | | 139,929 | | | | — | | | | 140,929 | |
| | | | | | | | | | | | | | | | | | | | | | | | | | | | | |
| Investments in associates | | | 69,000 | | | | 313,244 | | | | 2,351,845 | | | | 146,926 | | | | 3,045,518 | | | | — | | | | 5,926,533 | |
| Investments in joint ventures | | | 2,631,546 | | | | — | | | | 1,559,966 | | | | — | | | | 2,048,688 | | | | — | | | | 6,240,200 | |
| | | | | | | | | | | | | | | | | | | | | | | | | | | | | |
| Additions during the period: | | | | | | | | | | | | | | | | | | | | | | | | | | | | |
| Intangible assets | | | 336,603 | | | | 3 | | | | 6,857 | | | | 509 | | | | 127 | | | | — | | | | 344,099 | |
| Land use rights | | | — | | | | 26 | | | | 20,937 | | | | — | | | | — | | | | — | | | | 20,963 | |
| Investment properties | | | 50,285 | | | | 3,354 | | | | — | | | | 38,628 | | | | — | | | | — | | | | 92,267 | |
| Property, plant and equipment(Note (ii)) | | | 2,455,064 | | | | 4,118,544 | | | | 1,582,039 | | | | 42,476 | | | | 143,736 | | | | — | | | | 8,341,859 | |
Note: |
| |
(i) | The sales of self-produced products include sales of self-produced alumina amounting to RMB12,795 million, sales of self-produced primary aluminum amounting RMB3,684 million, and sales of self-produced other products amounting to RMB1,814 million. |
| |
| (ii) | The additions to property, plant and equipment under sale and leaseback contracts (note 20) are not included. |
ALUMINUM CORPORATION OF CHINA LIMITED AND ITS SUBSIDIARIES
NOTES TO THE CONSOLIDATED FINANCIAL STATEMENTS(Continued)
For the years ended December 31, 2015, 2016, 2017 and 20172018
(Amounts expressed in thousands of RMB unless otherwise stated)
| 4. | REVENUE AND SEGMENT INFORMATION(Continued) |
| | |
| (b) | Segment information(Continued) (CONTINUED) |
| (b) | Segment information (continued) |
| | | Year ended December 31, 2017 | |
| | | Alumina | | | Primary aluminum | | | Energy | | | Trading | | | Corporate and other operating segments | | | Inter- segment eliminations | | | Total | |
| | | | | | | | | | | | | | | | | | | | | | |
| Total revenue | | | 38,997,261 | | | | 47,245,646 | | | | 6,250,966 | | | | 146,854,723 | | | | 645,314 | | | | (58,973,482 | ) | | | 181,020,428 | |
| Inter-segment revenue | | | (24,431,939 | ) | | | (10,693,678 | ) | | | (517,269 | ) | | | (23,159,115 | ) | | | (171,481 | ) | | | 58,973,482 | | | | — | |
| | | | | | | | | | | | | | | | | | | | | | | | | | | | | |
| Sales of self-produced products(Note (i)) | | | | | | | | | | | | | | | 23,158,952 | | | | | | | | | | | | | |
| | | | | | | | | | | | | | | | | | | | | | | | | | | | | |
| Sales of products sourced from external suppliers | | | | | | | | | | | | | | | 100,536,656 | | | | | | | | | | | | | |
| | | | | | | | | | | | | | | | | | | | | | | | | | | | | |
| Revenue from external customers | | | 14,565,322 | | | | 36,551,968 | | | | 5,733,697 | | | | 123,695,608 | | | | 473,833 | | | | — | | | | 181,020,428 | |
| | | | | | | | | | | | | | | | | | | | | | | | | | | | | |
| Segment profit/(loss) before income tax | | | 3,290,945 | | | | 826,632 | | | | (171,310 | ) | | | 733,731 | | | | (1,728,563 | ) | | | 97,575 | | | | 3,049,010 | |
| | | | | | | | | | | | | | | | | | | | | | | | | | | | | |
| Income tax expense | | | | | | | | | | | | | | | | | | | | | | | | | | | (643,734 | ) |
| | | | | | | | | | | | | | | | | | | | | | | | | | | | | |
| Profit for the year | | | | | | | | | | | | | | | | | | | | | | | | | | | 2,405,276 | |
| | | | | | | | | | | | | | | | | | | | | | | | | | | | | |
| Other items | | | | | | | | | | | | | | | | | | | | | | | | | | | | |
| Finance income | | | 233,016 | | | | 83,996 | | | | 44,015 | | | | 192,327 | | | | 153,336 | | | | — | | | | 706,690 | |
| Finance costs | | | (708,655 | ) | | | (1,212,249 | ) | | | (1,000,767 | ) | | | (467,090 | ) | | | (1,814,663 | ) | | | — | | | | (5,203,424 | ) |
| Share of profits and losses of joint ventures | | | 82,619 | | | | — | | | | (383,263 | ) | | | 1,885 | | | | 306,910 | | | | — | | | | 8,151 | |
| Share of profits and losses of associates | | | — | | | | (16,887 | ) | | | (181,667 | ) | | | 9,463 | | | | 23,842 | | | | — | | | | (165,249 | ) |
| Amortization of land use rights | | | (42,768 | ) | | | (25,120 | ) | | | (15 | ) | | | (6,376 | ) | | | (17,300 | ) | | | — | | | | (91,579 | ) |
| Depreciation and amortization (excluding the amortization of land use rights) | | | (2,781,350 | ) | | | (2,516,058 | ) | | | (1,510,218 | ) | | | (78,724 | ) | | | (86,200 | ) | | | — | | | | (6,972,550 | ) |
| Gain on disposal of property, plant and equipment and land use rights | | | 47,243 | | | | 40,106 | | | | (12,826 | ) | | | 1,673 | | | | 543 | | | | — | | | | 76,739 | |
| Realized gain/(loss) on futures, forward and option contracts, net | | | 3,398 | | | | (47,730 | ) | | | 1,585 | | | | (24,953 | ) | | | 43,749 | | | | — | | | | (23,951 | ) |
| Impairment of property, plant and equipment | | | (568 | ) | | | — | | | | (15,632 | ) | | | — | | | | — | | | | — | | | | (16,200 | ) |
| Unrealized gain/(loss) on futures, forward and option contracts, net | | | — | | | | (17,033 | ) | | | — | | | | (92,719 | ) | | | (21,321 | ) | | | — | | | | (131,073 | ) |
| Gain on deemed disposal and disposal of subsidiaries | | | — | | | | — | | | | 38,397 | | | | 54,599 | | | | 232,026 | | | | — | | | | 325,022 | |
| Changes for impairment of inventories | | | 79,063 | | | | 64,734 | | | | 4,488 | | | | 722 | | | | 5,287 | | | | — | | | | 154,294 | |
| Reversal of/(provision for) impairment of receivables, net of bad debts recovered | | | (17,453 | ) | | | 269 | | | | (25,119 | ) | | | (18,396 | ) | | | — | | | | — | | | | (60,699 | ) |
| Gain on disposal and dividends of available for sale | | | — | | | | 2,792 | | | | — | | | | — | | | | 76,616 | | | | — | | | | 79,408 | |
| Gain on previously held equity interest remeasured at acquisition-date fair value | | | — | | | | — | | | | 117,640 | | | | — | | | | — | | | | — | | | | 117,640 | |
| Investments in associates | | | 90,875 | | | | 296,357 | | | | 2,170,178 | | | | 184,149 | | | | 4,193,471 | | | | — | | | | 6,935,030 | |
| Investments in joint ventures | | | 2,809,758 | | | | — | | | | 878,196 | | | | 28,865 | | | | 2,290,805 | | | | — | | | | 6,007,624 | |
| | | | | | | | | | | | | | | | | | | | | | | | | | | | | |
| Additions during the period: | | | | | | | | | | | | | | | | | | | | | | | | | | | | |
| Intangible assets | | | — | | | | 197 | | | | 284,509 | | | | 372 | | | | 89 | | | | — | | | | 285,167 | |
| Land use rights | | | — | | | | — | | | | 27,956 | | | | 25,199 | | | | 6,060 | | | | — | | | | 59,215 | |
| Property, plant and equipment(Note (ii)) | | | 2,642,350 | | | | 5,533,168 | | | | 1,268,051 | | | | 64,005 | | | | 256,093 | | | | — | | | | 9,763,667 | |
| | | Year ended December 31, 2017 | |
| | | Alumina | | | | Primary aluminum | | | | Energy | | | | Trading | | | | Corporate and other operating segments | | | | Inter- segment eliminations | | | | Total | |
| | | | | | | | | | | | | | | | | | | | | | | | | | | | | |
| Total revenue | | | 38,079,105 | | | | 47,245,646 | | | | 6,250,966 | | | | 146,814,520 | | | | 645,314 | | | | (58,954,801 | ) | | | 180,080,750 | |
| Inter-segment revenue | | | (24,413,258 | ) | | | (10,693,678 | ) | | | (517,269 | ) | | | (23,159,115 | ) | | | (171,481 | ) | | | 58,954,801 | | | | — | |
| | | | | | | | | | | | | | | | | | | | | | | | | | | | | |
| Sales of self-produced products(Note (i)) | | | | | | | | | | | | | | | 23,158,952 | | | | | | | | | | | | | |
| | | | | | | | | | | | | | | | | | | | | | | | | | | | | |
| Sales of products sourced from external suppliers | | | | | | | | | | | | | | | 100,496,453 | | | | | | | | | | | | | |
| | | | | | | | | | | | | | | | | | | | | | | | | | | | | |
| Revenue from external customers | | | 13,665,847 | | | | 36,551,968 | | | | 5,733,697 | | | | 123,655,405 | | | | 473,833 | | | | — | | | | 180,080,750 | |
| | | | | | | | | | | | | | | | | | | | | | | | | | | | | |
| Segment profit/(loss) before income tax | | | 3,251,751 | | | | 826,632 | | | | (171,310 | ) | | | 730,131 | | | | (1,728,563 | ) | | | 97,575 | | | | 3,006,216 | |
| | | | | | | | | | | | | | | | | | | | | | | | | | | | | |
| Income tax expense | | | | | | | | | | | | | | | | | | | | | | | | | | | (642,267 | ) |
| | | | | | | | | | | | | | | | | | | | | | | | | | | | | |
| Profit for the year | | | | | | | | | | | | | | | | | | | | | | | | | | | 2,363,949 | |
| | | | | | | | | | | | | | | | | | | | | | | | | | | | | |
| Other items | | | | | | | | | | | | | | | | | | | | | | | | | | | | |
| Finance income | | | 232,625 | | | | 83,996 | | | | 44,015 | | | | 192,327 | | | | 153,336 | | | | — | | | | 706,299 | |
| Finance costs | | | (695,162 | ) | | | (1,212,249 | ) | | | (1,000,767 | ) | | | (467,090 | ) | | | (1,814,661 | ) | | | — | | | | (5,189,929 | ) |
| Share of profits and losses of joint ventures | | | 82,619 | | | | — | | | | (383,263 | ) | | | 1,885 | | | | 306,910 | | | | — | | | | 8,151 | |
| Share of profits and losses of associates | | | — | | | | (16,887 | ) | | | (181,667 | ) | | | 9,463 | | | | 23,842 | | | | — | | | | (165,249 | ) |
| Amortization of land use rights | | | (47,263 | ) | | | (25,120 | ) | | | (6,376 | ) | | | (15 | ) | | | (17,300 | ) | | | — | | | | (96,074 | ) |
| Depreciation and amortization (excluding the amortization of land use rights) | | | (2,085,476 | ) | | | (3,253,801 | ) | | | (1,514,495 | ) | | | (85,085 | ) | | | (86,201 | ) | | | — | | | | (7,025,058 | ) |
| Gain on disposal of property, plant and equipment and land use rights | | | 47,595 | | | | 40,106 | | | | (12,826 | ) | | | 1,673 | | | | 543 | | | | — | | | | 77,091 | |
| Realized gain/(loss) on futures, forward and option contracts, net | | | 3,398 | | | | (47,730 | ) | | | 1,585 | | | | (24,953 | ) | | | 43,749 | | | | — | | | | (23,951 | ) |
| Other income | | | 179,736 | | | | 79,038 | | | | 37,940 | | | | 31,060 | | | | 14,397 | | | | — | | | | 342,171 | |
| Impairment of property, plant and equipment | | | — | | | | — | | | | (15,632 | ) | | | — | | | | — | | | | — | | | | (15,632 | ) |
| Fair value loss | | | — | | | | (17,033 | ) | | | — | | | | (92,719 | ) | | | (21,321 | ) | | | — | | | | (131,073 | ) |
| Changes for impairment of inventories(Note (ii)) | | | 71,973 | | | | 64,734 | | | | 4,488 | | | | 722 | | | | 5,287 | | | | — | | | | 147,204 | |
| Reversal of/(provision for) impairment of receivables, net of bad debts recovered | | | 26 | | | | 269 | | | | (25,119 | ) | | | (18,396 | ) | | | — | | | | — | | | | (43,220 | ) |
| Gain on disposal and dividends of available for sale | | | — | | | | 2,792 | | | | — | | | | — | | | | 76,616 | | | | — | | | | 79,408 | |
| | | | | | | | | | | | | | | | | | | | | | | | | | | | | |
| Investments in associates | | | 90,875 | | | | 296,357 | | | | 2,170,178 | | | | 184,149 | | | | 4,193,471 | | | | — | | | | 6,935,030 | |
| Investments in joint ventures | | | 2,809,758 | | | | — | | | | 878,196 | | | | 28,865 | | | | 2,290,805 | | | | — | | | | 6,007,624 | |
| | | | | | | | | | | | | | | | | | | | | | | | | | | | | |
| Additions during the period: | | | | | | | | | | | | | | | | | | | | | | | | | | | | |
| Intangible assets | | | — | | | | 197 | | | | 284,509 | | | | 372 | | | | 89 | | | | — | | | | 285,167 | |
| Land use rights | | | — | | | | — | | | | 27,956 | | | | 25,199 | | | | 6,060 | | | | — | | | | 59,215 | |
| Property, plant and equipment(Note (iii)) | | | 2,558,737 | | | | 5,533,168 | | | | 1,268,051 | | | | 60,805 | | | | 256,093 | | | | — | | | | 9,676,854 | |
Note:
Note: |
| |
| (i) | The sales of self-produced products include sales of self-produced alumina amounting to RMB13,187 million, sales of self-produced primary aluminum amounting RMB6,680, and sales of self-produced other products amounting to RMB3,292 million. |
| |
| (ii) | Change for impairment of inventories do not include change for impairment due to disposal of subsidiaries. |
| |
| (iii) | The additions to property, plant and equipment under sale and leaseback contracts (note 20) are not included. |
ALUMINUM CORPORATION OF CHINA LIMITED AND ITS SUBSIDIARIES
NOTES TO THE CONSOLIDATED FINANCIAL STATEMENTS(Continued)
For the years ended December 31, 2016, 2017 and 2018
(Amounts expressed in thousands of RMB unless otherwise stated)
| 4. | REVENUE AND SEGMENT INFORMATION(Continued) |
| (b) | Segment information(Continued) |
| | | Year ended December 31, 2018 | |
| | | Alumina | | | Primary aluminum | | | Energy | | | Trading | | | Corporate and other operating segments | | | Inter- segment eliminations | | | Total | |
| | | | | | | | | | | | | | | | | | | | | | |
| Total revenue | | | 44,150,937 | | | | 53,802,172 | | | | 7,235,273 | | | | 142,016,561 | | | | 667,235 | | | | (67,632,024 | ) | | | 180,240,154 | |
| Inter-segment revenue | | | (29,392,495 | ) | | | (12,457,863 | ) | | | (198,337 | ) | | | (25,370,303 | ) | | | (213,026 | ) | | | 67,632,024 | | | | — | |
| | | | | | | | | | | | | | | | | | | | | | | | | | | | | |
| Sales of self-produced products(Note (i)) | | | | | | | | | | | | | | | 34,453,683 | | | | | | | | | | | | | |
| | | | | | | | | | | | | | | | | | | | | | | | | | | | | |
| Sales of products sourced from external suppliers | | | | | | | | | | | | | | | 82,192,575 | | | | | | | | | | | | | |
| | | | | | | | | | | | | | | | | | | | | | | | | | | | | |
| Revenue from external customers | | | 14,758,442 | | | | 41,344,309 | | | | 7,036,936 | | | | 116,646,258 | | | | 454,209 | | | | — | | | | 180,240,154 | |
| Segment profit/(loss) before income tax | | | 3,496,381 | | | | (929,298 | ) | | | 26,020 | | | | 779,451 | | | | (1,267,146 | ) | | | 198,103 | | | | 2,303,511 | |
| | | | | | | | | | | | | | | | | | | | | | | | | | | | | |
| Income tax expense | | | | | | | | | | | | | | | | | | | | | | | | | | | (822,499 | ) |
| | | | | | | | | | | | | | | | | | | | | | | | | | | | | |
| Profit for the year | | | | | | | | | | | | | | | | | | | | | | | | | | | 1,481,012 | |
| | | | | | | | | | | | | | | | | | | | | | | | | | | | | |
| Other items | | | | | | | | | | | | | | | | | | | | | | | | | | | | |
| Finance income | | | 100,125 | | | | 54,458 | | | | 15,744 | | | | 136,513 | | | | 185,392 | | | | — | | | | 492,232 | |
| Finance costs | | | (399,344 | ) | | | (1,131,622 | ) | | | (1,047,285 | ) | | | (366,807 | ) | | | (1,937,438 | ) | | | — | | | | (4,882,496 | ) |
| Share of profits and losses of joint ventures | | | 37,377 | | | | 8 | | | | (225,377 | ) | | | 9,010 | | | | (20,470 | ) | | | — | | | | (199,452 | ) |
| Share of profits and losses of associates | | | (1,141 | ) | | | 17,102 | | | | (52,368 | ) | | | 19,375 | | | | 56,367 | | | | — | | | | 39,335 | |
| Amortization of land use rights | | | (39,027 | ) | | | (41,175 | ) | | | (9,335 | ) | | | (18,000 | ) | | | — | | | | — | | | | (107,537 | ) |
| Depreciation and amortization (excluding the amortization of land use rights) | | | (2,846,051 | ) | | | (2,954,801 | ) | | | (1,962,081 | ) | | | (101,705 | ) | | | (82,962 | ) | | | — | | | | (7,947,600 | ) |
| Gain on disposal of property, plant and equipment and land use rights | | | 53,116 | | | | 15,211 | | | | 24,780 | | | | 20,036 | | | | (12,045 | ) | | | — | | | | 101,098 | |
| Realized (loss)/gain on futures, forward and option contracts, net | | | (716 | ) | | | — | | | | 2,855 | | | | 47,601 | | | | (9,248 | ) | | | — | | | | 40,492 | |
| Impairment of property, plant and equipment | | | — | | | | — | | | | (7,450 | ) | | | — | | | | — | | | | — | | | | (7,450 | ) |
| Unrealized gain on futures, forward and option contracts, net | | | — | | | | — | | | | — | | | | 100,967 | | | | — | | | | — | | | | 100,967 | |
| Gain / (loss) on disposal of subsidiaries | | | 7,671 | | | | — | | | | — | | | | — | | | | (4,154 | ) | | | — | | | | 3,517 | |
| Changes for impairment of inventories | | | (54,463 | ) | | | (273,796 | ) | | | (7,884 | ) | | | (17,802 | ) | | | — | | | �� | — | | | | (353,945 | ) |
| Reversal of/(provision for) impairment of receivables, net of bad debts recovered | | | 19,320 | | | | (9,406 | ) | | | (23,327 | ) | | | (84,807 | ) | | | (9,621 | ) | | | — | | | | (107,841 | ) |
| Dividends of equity investments at fair value through other comprehensive income | | | — | | | | — | | | | 1,000 | | | | — | | | | 108,914 | | | | — | | | | 109,914 | |
| Loss on disposal of associates | | | — | | | | — | | | | (1,904 | ) | | | — | | | | — | | | | — | | | | (1,904 | ) |
| Gain on previously held equity interest remeasured at acquisition-date fair value | | | — | | | | — | | | | (3,177 | ) | | | — | | | | 751,263 | | | | — | | | | 748,086 | |
| Investments in associates | | | 89,734 | | | | 558,759 | | | | 2,064,425 | | | | 131,691 | | | | 3,518,853 | | | | — | | | | 6,363,462 | |
| Investments in joint ventures | | | 989,840 | | | | — | | | | 435,867 | | | | 77,211 | | | | 1,890,431 | | | | — | | | | 3,393,349 | |
| | | | | | | | | | | | | | | | | | | | | | | | | | | | | |
| Additions during the period: | | | | | | | | | | | | | | | | | | | | | | | | | | | | |
| Intangible assets | | | 99,089 | | | | 753 | | | | 2,754 | | | | 514 | | | | 194 | | | | — | | | | 103,304 | |
| Land use rights | | | 2,786 | | | | — | | | | — | | | | 52 | | | | — | | | | — | | | | 2,838 | |
| Property, plant and equipment(Note (ii)) | | | 2,564,003 | | | | 4,602,580 | | | | 1,610,442 | | | | 101,360 | | | | 143,839 | | | | — | | | | 9,022,224 | |
Note:
| (i) | The sales of self-produced products include sales of self-produced alumina amounting to RMB16,561 million, sales of self-produced primary aluminum amounting RMB13,517 million, and sales of self-produced other products amounting to RMB4,376 million. |
| (ii) | The additions to property, plant and equipment under sale and leaseback contracts (note 20) are not included. |
ALUMINUM CORPORATION OF CHINA LIMITED AND ITS SUBSIDIARIES
NOTES TO THE CONSOLIDATED FINANCIAL STATEMENTS(Continued)
For the years ended December 31, 2016, 2017 and 2018
(Amounts expressed in thousands of RMB unless otherwise stated)
| 4. | REVENUE AND SEGMENT INFORMATION (CONTINUED) |
| (b) | Segment information (continued) |
| | | Alumina | | | Primary aluminum | | | Energy | | | Trading | | | Corporate and other operating segments | | | Total | |
| As at December 31, 2017 | | | | | | | | | | | | | | | | | | | | | | | | |
| | | | | | | | | | | | | | | | | | | | | | | | | |
| Segment assets | | | 69,810,387 | | | | 51,736,716 | | | | 40,113,747 | | | | 18,586,406 | | | | 48,264,166 | | | | 228,511,422 | |
| Reconciliation: | | | | | | | | | | | | | | | | | | | | | | | | |
| Elimination of inter-segment receivables | | | | | | | | | | | | | | | | | | | | | | | (30,170,567 | ) |
| Other eliminations | | | | | | | | | | | | | | | | | | | | | | | (194,763 | ) |
| Corporate and other unallocated assets: | | | | | | | | | | | | | | | | | | | | | | | | |
| Deferred tax assets | | | | | | | | | | | | | | | | | | | | | | | 1,606,150 | |
| Prepaid income tax | | | | | | | | | | | | | | | | | | | | | | | 64,557 | |
| | | | | | | | | | | | | | | | | | | | | | | | | |
| Total assets | | | | | | | | | | | | | | | | | | | | | | | 199,816,799 | |
| | | | | | | | | | | | | | | | | | | | | | | | | |
| Segment liabilities | | | 33,037,329 | | | | 29,552,176 | | | | 27,368,026 | | | | 13,067,384 | | | | 60,012,851 | | | | 163,037,766 | |
| Reconciliation: | | | | | | | | | | | | | | | | | | | | | | | | |
| Elimination of inter-segment payables | | | | | | | | | | | | | | | | | | | | | | | (30,170,567 | ) |
| Corporate and other unallocated liabilities: | | | | | | | | | | | | | | | | | | | | | | | | |
| Deferred tax liabilities | | | | | | | | | | | | | | | | | | | | | | | 993,742 | |
| Income tax payable | | | | | | | | | | | | | | | | | | | | | | | 213,262 | |
| | | | | | | | | | | | | | | | | | | | | | | | | |
| Total liabilities | | | | | | | | | | | | | | | | | | | | | | | 134,074,203 | |
| | | Alumina | | | Primary aluminum | | | Energy | | | Trading | | | Corporate and other operating segments | | | Total | |
| As at December 31, 2018 | | | | | | | | | | | | | | | | | | | | | | | | |
| | | | | | | | | | | | | | | | | | | | | | | | | |
| Segment assets | | | 82,677,250 | | | | 57,712,842 | | | | 39,458,086 | | | | 20,129,355 | | | | 33,577,526 | | | | 233,555,059 | |
| Reconciliation: | | | | | | | | | | | | | | | | | | | | | | | | |
| Elimination of inter-segment receivables | | | | | | | | | | | | | | | | | | | | | | | (34,228,334 | ) |
| Other eliminations | | | | | | | | | | | | | | | | | | | | | | | (155,283 | ) |
| Corporate and other unallocated assets: | | | | | | | | | | | | | | | | | | | | | | | | |
| Deferred tax assets | | | | | | | | | | | | | | | | | | | | | | | 1,542,569 | |
| Prepaid income tax | | | | | | | | | | | | | | | | | | | | | | | 162,103 | |
| | | | | | | | | | | | | | | | | | | | | | | | | |
| Total assets | | | | | | | | | | | | | | | | | | | | | | | 200,876,114 | |
| | | | | | | | | | | | | | | | | | | | | | | | | |
| Segment liabilities | | | 38,817,030 | | | | 34,492,538 | | | | 27,265,031 | | | | 14,442,010 | | | | 50,492,049 | | | | 165,508,658 | |
| Reconciliation: | | | | | | | | | | | | | | | | | | | | | | | | |
| Elimination of inter-segment payables | | | | | | | | | | | | | | | | | | | | | | | (34,228,334 | ) |
| Corporate and other unallocated liabilities: | | | | | | | | | | | | | | | | | | | | | | | | |
| Deferred tax liabilities | | | | | | | | | | | | | | | | | | | | | | | 1,812,805 | |
| Income tax payable | | | | | | | | | | | | | | | | | | | | | | | 113,783 | |
| | | | | | | | | | | | | | | | | | | | | | | | | |
| Total liabilities | | | | | | | | | | | | | | | | | | | | | | | 133,206,912 | |
ALUMINUM CORPORATION OF CHINA LIMITED AND ITS SUBSIDIARIES
NOTES TO THE CONSOLIDATED FINANCIAL STATEMENTS(Continued)
For the years ended December 31, 2016, 2017 and 2018
(Amounts expressed in thousands of RMB unless otherwise stated)
| 4. | REVENUE AND SEGMENT INFORMATION (CONTINUED) |
| (b) | Segment information (continued) |
The Group mainly operates in Mainland China. Operating segment information by geographical location as follows:
| | | 2016 | | | 2017 | | | 2018 | |
| | | | | | | | | | |
| | | | | | | | | | |
| Segment revenue from external customers | | | | | | | | | | | | |
| — Mainland China | | | 142,018,789 | | | | 171,954,097 | | | | 171,023,595 | |
| — Outside Mainland China | | | 2,835,793 | | | | 9,066,331 | | | | 9,216,559 | |
| | | | | | | | | | | | | |
| | | | 144,854,582 | | | | 181,020,428 | | | | 180,240,154 | |
| | | 2017 | | | 2018 | |
| | | | | | | |
| | | | | | | |
| Non-current assets (excluding financial assets and deferred tax assets) | | | | | | | | |
| — Mainland China | | | 126,992,893 | | | | 137,857,441 | |
| — Outside Mainland China | | | 384,089 | | | | 646,327 | |
| | | | | | | | | |
| | | | 127,376,982 | | | | 138,503,768 | |
For the year ended December 31, 2018, revenues of approximately RMB32,852 million (2016: RMB30,940 million, 2017: RMB39,759 million) were derived from entities directly or indirectly owned or controlled by the PRC government including Chinalco. These revenues are mainly attributable to the alumina, primary aluminum, energy and trading segments. There were no other individual customers from which the Group has derived revenue of 10% or more of the Group’s revenue during the years ended December 31, 2016, 2017 and 2018.
ALUMINUM CORPORATION OF CHINA LIMITED AND ITS SUBSIDIARIES
NOTES TO THE CONSOLIDATED FINANCIAL STATEMENTS(Continued)
For the years ended December 31, 2016, 2017 and 2018
(Amounts expressed in thousands of RMB unless otherwise stated)
| | | Goodwill | | | Mining rights and others | | | Mineral exploration rights | | | Computer software, production quota and others | | | Total | |
| | | | | | | | | | | | | | | | |
| Year ended December 31, 2017 | | | | | | | | | | | | | | | | | | | | |
| Opening net carrying amount | | | 2,346,853 | | | | 6,981,217 | | | | 1,123,639 | | | | 140,540 | | | | 10,592,249 | |
| Additions | | | — | | | | 280,340 | | | | — | | | | 4,827 | | | | 285,167 | |
| Acquisition of a subsidiary | | | — | | | | — | | | | — | | | | 188 | | | | 188 | |
| Disposals | | | — | | | | — | | | | — | | | | (11,168 | ) | | | (11,168 | ) |
| Disposal of subsidiaries | | | — | | | | — | | | | — | | | | (562 | ) | | | (562 | ) |
| Amortization | | | — | | | | (241,261 | ) | | | — | | | | (34,616 | ) | | | (275,877 | ) |
| Transfer from property, plant and equipment (note 6) | | | — | | | | 53,565 | | | | — | | | | 22,614 | | | | 76,179 | |
| Impairment losses | | | — | | | | — | | | | — | | | | (8,134 | ) | | | (8,134 | ) |
| Currency translation differences | | | (923 | ) | | | (7,433 | ) | | | (12,053 | ) | | | — | | | | (20,409 | ) |
| | | | | | | | | | | | | | | | | | | | | |
| Closing net carrying amount | | | 2,345,930 | | | | 7,066,428 | | | | 1,111,586 | | | | 113,689 | | | | 10,637,633 | |
| | | | | | | | | | | | | | | | | | | | | |
| As at December 31, 2017 | | | | | | | | | | | | | | | | | | | | |
| Cost | | | 2,345,930 | | | | 8,546,343 | | | | 1,111,586 | | | | 399,532 | | | | 12,403,391 | |
| Accumulated amortization and impairment | | | — | | | | (1,479,915 | ) | | | — | | | | (285,843 | ) | | | (1,765,758 | ) |
| | | | | | | | | | | | | | | | | | | | | |
| Net carrying amount | | | 2,345,930 | | | | 7,066,428 | | | | 1,111,586 | | | | 113,689 | | | | 10,637,633 | |
| | | Goodwill | | | Mining rights and others | | | Mineral exploration rights | | | Computer software, production quota and others | | | Total | |
| | | | | | | | | | | | | | | | |
| Year ended December 31, 2018 | | | | | | | | | | | | | | | | | | | | |
| Opening net carrying amount | | | 2,345,930 | | | | 7,066,428 | | | | 1,111,586 | | | | 113,689 | | | | 10,637,633 | |
| Additions | | | — | | | | 98,995 | | | | — | | | | 4,309 | | | | 103,304 | |
| Acquisition of subsidiaries | | | 1,163,949 | | | | 728,066 | | | | — | | | | 1,285 | | | | 1,893,300 | |
| Reclassification | | | — | | | | 7,072 | | | | (7,072 | ) | | | — | | | | — | |
| Disposals | | | — | | | | — | | | | — | | | | (168 | ) | | | (168 | ) |
| Amortization | | | — | | | | (265,108 | ) | | | — | | | | (30,793 | ) | | | (295,901 | ) |
| Transfer from property, plant and equipment (note 6) | | | — | | | | 41,148 | | | | — | | | | 484,068 | | | | 525,216 | |
| Currency translation differences | | | 754 | | | | 5,782 | | | | 9,445 | | | | — | | | | 15,981 | |
| | | | | | | | | | | | | | | | | | | | | |
| Closing net carrying amount | | | 3,510,633 | | | | 7,682,383 | | | | 1,113,959 | | | | 572,390 | | | | 12,879,365 | |
| | | | | | | | | | | | | | | | | | | | | |
| As at December 31, 2018 | | | | | | | | | | | | | | | | | | | | |
| Cost | | | 3,510,633 | | | | 9,430,183 | | | | 1,113,959 | | | | 888,975 | | | | 14,943,750 | |
| Accumulated amortization and impairment | | | — | | | | (1,747,800 | ) | | | — | | | | (316,585 | ) | | | (2,064,385 | ) |
| | | | | | | | | | | | | | | | | | | | | |
| Net carrying amount | | | 3,510,633 | | | | 7,682,383 | | | | 1,113,959 | | | | 572,390 | | | | 12,879,365 | |
ALUMINUM CORPORATION OF CHINA LIMITED AND ITS SUBSIDIARIES
NOTES TO THE CONSOLIDATED FINANCIAL STATEMENTS(Continued)
For the years ended December 31, 2016, 2017 and 2018
(Amounts expressed in thousands of RMB unless otherwise stated)
| 5. | INTANGIBLE ASSETS(Continued) |
For the year ended December 31, 2018, the amortization expenses of intangible assets recognized in profit or loss were analysed as follows:
| | | 2016 | | | 2017 | | | 2018 | |
| | | | | | | | | | |
| Cost of sales | | | 211,915 | | | | 241,261 | | | | 265,108 | |
| General and administrative expenses | | | 32,446 | | | | 34,616 | | | | 30,793 | |
| | | | | | | | | | | | | |
| | | | 244,361 | | | | 275,877 | | | | 295,901 | |
As at December 31, 2018, the Group has pledged intangible assets with a net carrying value amounting to RMB773 million (December 31, 2017: RMB1,112 million) for bank and other borrowings as set out in note 24 to the financial statements.
As at December 31, 2018, the Group was in the process of applying for the certificates of mining rights with a carrying value amounting to RMB626 million (December 31, 2017: RMB1,680 million). There have been no litigations, claims or assessments against the Group for compensation with respect to the use of these rights to date. As at December 31, 2018, the carrying value of these rights only represented approximately 0.31% of the total asset value of the Group (December 31, 2017: approximately 0.84%). Management considers that it is probable that the Group can obtain the relevant ownership certificates from the appropriate authorities. The directors of the Company are of the opinion that the Group legally owns and has the rights to use the above mining rights, and that there is no material adverse impact on the overall financial position of the Group.
ALUMINUM CORPORATION OF CHINA LIMITED AND ITS SUBSIDIARIES
NOTES TO THE CONSOLIDATED FINANCIAL STATEMENTS(Continued)
For the years ended December 31, 2016, 2017 and 2018
(Amounts expressed in thousands of RMB unless otherwise stated)
| 5. | INTANGIBLE ASSETS(Continued) |
Impairment testing of goodwill
The lowest level within the Group at which goodwill is monitored for internal management purposes is the operating segment level. Therefore, goodwill is allocated to the Group’s cash-generating units (“CGUs”) and groups of CGUs according to operating segments. A summary of goodwill allocated to each segment is presented below:
| | | December 31, 2017 | | | December 31, 2018 | |
| | | Alumina | | | Primary aluminum | | | Alumina | | | Primary aluminum | |
| | | | | | | | | | | | | |
| Qinghai Branch | | | — | | | | 217,267 | | | | — | | | | 217,267 | |
| Guangxi Branch | | | 189,419 | | | | — | | | | 189,419 | | | | — | |
| Lanzhou Branch | | | — | | | | 1,924,259 | | | | — | | | | 1,924,259 | |
| PT. Nusapati Prima (“PTNP”) | | | 14,985 | | | | — | | | | 15,739 | | | | — | |
| Shanxi Huaxing | | | — | | | | — | | | | 1,163,949 | | | | — | |
| | | | | | | | | | | | | | | | | |
| | | | 204,404 | | | | 2,141,526 | | | | 1,369,107 | | | | 2,141,526 | |
The recoverable amount of a CGU is determined based on value-in-use calculations. These calculations use pre-tax cash flow projections based on financial budgets approved by management covering a five-year period. Cash flows beyond the 5-year period are extrapolated using the estimated growth rate of 2% (2017: 2%) not exceeding the long-term average growth rate for the businesses in which the CGU operates. Other key assumptions applied in the impairment testing include the expected product price, demand for the products, product costs and related expenses. Management determined these key assumptions based on past performance and their expectations on market development. Furthermore, the Group adopts a pre-tax rate of 12.62% (2017: 12.62%) that reflects specific risks related to CGUs and groups of CGUs as the discount rate. The assumptions above are used in analysing the recoverable amounts of CGUs and groups of CGUs within operating segments.
The directors of the Company are of the view that, based on their assessment, there was no impairment of goodwill as at December 31, 2018 (December 31, 2017: no impairment).
ALUMINUM CORPORATION OF CHINA LIMITED AND ITS SUBSIDIARIES
NOTES TO THE CONSOLIDATED FINANCIAL STATEMENTS(Continued)
For the years ended December 31, 2016, 2017 and 2018
(Amounts expressed in thousands of RMB unless otherwise stated)
| 6. | PROPERTY, PLANT AND EQUIPMENT |
| | | Buildings | | | Machinery | | | Transportation facilities | | | Office and other equipment | | | Construction in progress | | | Total | |
| | | | | | | | | | | | | | | | | | | |
| Year ended December 31, 2017 | | | | | | | | | | | | | | | | | | | | | | | | |
| Opening net carrying amount | | | 27,918,175 | | | | 45,522,495 | | | | 656,467 | | | | 100,202 | | | | 16,174,232 | | | | 90,371,571 | |
| Reclassifications and internal transfers | | | 5,334,951 | | | | 9,722,364 | | | | 9,064 | | | | 11,439 | | | | (15,077,818 | ) | | | — | |
| Transfer to intangible assets (note 5) | | | — | | | | — | | | | — | | | | — | | | | (76,179 | ) | | | (76,179 | ) |
| Transfer to land use rights (note 8) | | | — | | | | — | | | | — | | | | — | | | | (396,398 | ) | | | (396,398 | ) |
| Transfer to investment properties (note 7) | | | (157,150 | ) | | | — | | | | — | | | | — | | | | — | | | | (157,150 | ) |
| Additions | | | 8,941 | | | | 1,068,129 | | | | 36,667 | | | | 47,804 | | | | 9,602,162 | | | | 10,763,703 | |
| Acquisition of subsidiaries | | | 889,597 | | | | 2,600,315 | | | | 3,410 | | | | 1,714 | | | | 99,934 | | | | 3,594,970 | |
| Disposal of subsidiaries | | | (86,945 | ) | | | (62,814 | ) | | | (5,269 | ) | | | (2,114 | ) | | | (108,479 | ) | | | (265,621 | ) |
| Disposals | | | (37,678 | ) | | | (1,140,096 | ) | | | (13,084 | ) | | | (1,123 | ) | | | (334,329 | ) | | | (1,526,310 | ) |
| Government grants | | | (3,585 | ) | | | (105,979 | ) | | | — | | | | — | | | | — | | | | (109,564 | ) |
| Depreciation | | | (1,577,363 | ) | | | (4,803,886 | ) | | | (145,287 | ) | | | (28,239 | ) | | | — | | | | (6,554,775 | ) |
| Impairment losses | | | (564 | ) | | | (15,636 | ) | | | — | | | | — | | | | — | | | | (16,200 | ) |
| Currency translation differences | | | (156 | ) | | | (196 | ) | | | (60 | ) | | | (58 | ) | | | — | | | | (470 | ) |
| | | | | | | | | | | | | | | | | | | | | | | | | |
| Closing net carrying amount | | | 32,288,223 | | | | 52,784,696 | | | | 541,908 | | | | 129,625 | | | | 9,883,125 | | | | 95,627,577 | |
| | | | | | | | | | | | | | | | | | | | | | | | | |
| As at December 31, 2017 | | | | | | | | | | | | | | | | | | | | | | | | |
| Cost | | | 48,990,555 | | | | 101,005,277 | | | | 2,873,825 | | | | 561,597 | | | | 9,995,123 | | | | 163,426,377 | |
| Accumulated depreciation and impairment | | | (16,702,332 | ) | | | (48,220,581 | ) | | | (2,331,917 | ) | | | (431,972 | ) | | | (111,998 | ) | | | (67,798,800 | ) |
| | | | | | | | | | | | | | | | | | | | | | | | | |
| Net carrying amount | | | 32,288,223 | | | | 52,784,696 | | | | 541,908 | | | | 129,625 | | | | 9,883,125 | | | | 95,627,577 | |
ALUMINUM CORPORATION OF CHINA LIMITED AND ITS SUBSIDIARIES
NOTES TO THE CONSOLIDATED FINANCIAL STATEMENTS(Continued)
For the years ended December 31, 2016, 2017 and 2018
(Amounts expressed in thousands of RMB unless otherwise stated)
| 6. | PROPERTY, PLANT AND EQUIPMENT (Continued) |
| | | Buildings | | | Machinery | | | Transportation facilities | | | Office and other equipment | | | Construction in progress | | | Total | |
| | | | | | | | | | | | | | | | | | | |
| Year ended December 31, 2018 | | | | | | | | | | | | | | | | | | | | | | | | |
| Opening net carrying amount | | | 32,288,223 | | | | 52,784,696 | | | | 541,908 | | | | 129,625 | | | | 9,883,125 | | | | 95,627,577 | |
| Reclassifications and internal transfers | | | 3,204,611 | | | | 3,600,371 | | | | 75,277 | | | | 5,149 | | | | (6,885,408 | ) | | | — | |
| Government grants | | | (468 | ) | | | (113,481 | ) | | | — | | | | — | | | | — | | | | (113,949 | ) |
| Transfer to intangible assets (note 5) | | | — | | | | — | | | | — | | | | — | | | | (525,216 | ) | | | (525,216 | ) |
| Transfer to land use rights (note 8) | | | — | | | | — | | | | — | | | | — | | | | (382,242 | ) | | | (382,242 | ) |
| Transfer to investment properties (note 7) | | | (11,039 | ) | | | — | | | | — | | | | — | | | | — | | | | (11,039 | ) |
| Transfer from investment properties (note 7) | | | 21,773 | | | | — | | | | — | | | | — | | | | — | | | | 21,773 | |
| Additions | | | 230,243 | | | | 1,998,717 | | | | 31,668 | | | | 48,912 | | | | 8,025,615 | | | | 10,335,155 | |
| Acquisition of subsidiaries | | | 4,633,728 | | | | 4,026,062 | | | | 17,443 | | | | 5,937 | | | | 3,149,060 | | | | 11,832,230 | |
| Disposal of subsidiaries | | | — | | | | (472 | ) | | | (101 | ) | | | (53 | ) | | | (8,893 | ) | | | (9,519 | ) |
| Disposals | | | (251,212 | ) | | | (2,505,158 | ) | | | (39,827 | ) | | | (3,347 | ) | | | (275,391 | ) | | | (3,074,935 | ) |
| Depreciation | | | (1,266,607 | ) | | | (6,087,890 | ) | | | (116,807 | ) | | | (28,018 | ) | | | — | | | | (7,499,322 | ) |
| Impairment losses | | | — | | | | (7,061 | ) | | | — | | | | — | | | | (389 | ) | | | (7,450 | ) |
| Currency translation differences | | | 99 | | | | 146 | | | | 34 | | | | 27 | | | | — | | | | 306 | |
| | | | | | | | | | | | | | | | | | | | | | | | | |
| Closing net carrying amount | | | 38,849,351 | | | | 53,695,930 | | | | 509,595 | | | | 158,232 | | | | 12,980,261 | | | | 106,193,369 | |
| | | | | | | | | | | | | | | | | | | | | | | | | |
| As at December 31, 2018 | | | | | | | | | | | | | | | | | | | | | | | | |
| Cost | | | 56,620,994 | | | | 103,608,492 | | | | 2,538,835 | | | | 603,593 | | | | 13,092,648 | | | | 176,464,562 | |
| Accumulated depreciation and impairment | | | (17,771,643 | ) | | | (49,912,562 | ) | | | (2,029,240 | ) | | | (445,361 | ) | | | (112,387 | ) | | | (70,271,193 | ) |
| | | | | | | | | | | | | | | | | | | | | | | | | |
| Net carrying amount | | | 38,849,351 | | | | 53,695,930 | | | | 509,595 | | | | 158,232 | | | | 12,980,261 | | | | 106,193,369 | |
For the years ended December 31, 2016, 2017 and 2018, depreciation expenses recognized in profit or loss are analyzed as follows:
| | | 2016 | | | 2017 | | | 2018 | |
| | | | | | | | | | |
| Cost of sales | | | 6,399,010 | | | | 6,387,773 | | | | 7,291,380 | |
| General and administrative expenses | | | 181,708 | | | | 160,076 | | | | 201,337 | |
| Selling and distribution expenses | | | 9,530 | | | | 6,926 | | | | 6,605 | |
| | | | | | | | | | | | | |
| | | | 6,590,248 | | | | 6,554,775 | | | | 7,499,322 | |
As at December 31, 2018, the Group was in the process of applying for the ownership certificates of buildings with a net carrying value of RMB5,639 million (December 31, 2017: RMB6,942 million). There have been no litigations, claims or assessments against the Group for compensation with respect to the use of these buildings as at the date of approval of these financial statements.
ALUMINUM CORPORATION OF CHINA LIMITED AND ITS SUBSIDIARIES
NOTES TO THE CONSOLIDATED FINANCIAL STATEMENTS(Continued)
For the years ended December 31, 2016, 2017 and 2018
(Amounts expressed in thousands of RMB unless otherwise stated)
| 6. | PROPERTY, PLANT AND EQUIPMENT (CONTINUED) |
As at December 31, 2018, the carrying value of these buildings only represented approximately 2.81% of the Group’s total asset value (December 31, 2017: 3.47%). Management considers that it is probable that the Group can obtain the relevant ownership certificates from the appropriate authorities. The directors of the Company are of the opinion that the Group legally owns and has the rights to use the above buildings, and that there is no material adverse impact on the overall financial position of the Group.
For the year ended December 31, 2018, interest expenses of RMB518 million (2016: RMB414 million, 2017: RMB344 million) (note 28) arising from borrowings attributable to the construction of property, plant and equipment during the year were capitalized at an annual rate ranging from 4.54% to 7.00% (2016: 3.85% to 6.00%, 2017: 4.41% to 8.00%) (note 28), and were included in additions to property, plant and equipment.
As at December 31, 2018, the Group has pledged property, plant and equipment at a net carrying value amounting to RMB4,168 million (December 31, 2017: RMB5,799 million) for bank and other borrowings as set out in note 24 to the financial statements.
As at December 31, 2018, the carrying value of temporarily idle property, plant and equipment of the Group was RMB675 million (December 31, 2017: RMB2,530 million).
The cost of the Group’s fixed assets held under finance leases included in the total amounts of the machinery and construction in progress at December 31, 2018 were RMB10,678 million (2017: RMB9,955 million) and RMB112 million (2017: RMB100 million), respectively. The accumulated depreciation of the Group’s fixed assets held under finance leases amounted to RMB2,011 million (2017: RMB1,908 million).
Impairment testing for property, plant and equipment
When any indicators of impairment are identified, property, plant and equipment are reviewed for impairment based on each CGU. The CGU is an individual plant or entity. The carrying values of these individual plants or entities were compared to the recoverable amounts of the CGUs, which were based predominantly on value in use. Value-in-use calculations use pre-tax cash flow projections based on financial budgets approved by management covering a five-year period. Cash flows beyond the five-year period are extrapolated using the same cash flow projections of the fifth year. Other key assumptions applied in the impairment testing include the expected product price, demand for the products, product cost and related expenses. Management determined these key assumptions based on past performance and their expectations on market development. Further, the Group adopts a pre-tax and non-inflation rate of 10.16% (2017: 10.16%) that reflects specific risks related to the CGUs as discount rates. The assumptions above are used in analysing the recoverable amounts of the CGUs within operating segments.
For the CGUs with indicators of impairment identified, the assets were not further impaired during the current year based on the impairment testing (2017: Nil).
In addition to the CGUs for which impairment was tested based on value in use, the Group also assessed the recoverable amounts for property, plant and equipment about to be disposed or abandoned, and impairment losses of RMB7 million were provided during the year ended December 31, 2018 (2016: RMB57 million, 2017: RMB16 million).
ALUMINUM CORPORATION OF CHINA LIMITED AND ITS SUBSIDIARIES
NOTES TO THE CONSOLIDATED FINANCIAL STATEMENTS(Continued)
For the years ended December 31, 2015, 2016, 2017 and 20172018
(Amounts expressed in thousands of RMB unless otherwise stated)
4. | REVENUE AND SEGMENT INFORMATION(Continued) |
| 7. | | |
| (b) | Segment information(Continued)INVESTMENT PROPERTIES |
| | | | Alumina | | | | Primary
aluminum | | | | Energy | | | | Trading | | | | Corporate
and other
operating
segments | | | | Total | |
| As at December 31, 2016 | | | | | | | | | | | | | | | | | | | | | | | | |
| | | | | | | | | | | | | | | | | | | | | | | | | |
| Segment assets | | | 75,022,795 | | | | 46,680,908 | | | | 38,078,969 | | | | 14,927,762 | | | | 37,040,630 | | | | 211,751,064 | |
| Reconciliation: | | | | | | | | | | | | | | | | | | | | | | | | |
| Elimination of inter-segment receivables | | | | | | | | | | | | | | | | | | | | | | | (22,023,956 | ) |
| Other eliminations | | | | | | | | | | | | | | | | | | | | | | | (746,586 | ) |
| Corporate and other unallocated assets: | | | | | | | | | | | | | | | | | | | | | | | | |
| Deferred tax assets | | | | | | | | | | | | | | | | | | | | | | | 1,426,707 | |
| Prepaid income tax | | | | | | | | | | | | | | | | | | | | | | | 104,213 | |
| | | | | | | | | | | | | | | | | | | | | | | | | |
| Total assets | | | | | | | | | | | | | | | | | | | | | | | 190,511,442 | |
| | | | | | | | | | | | | | | | | | | | | | | | | |
| Segment liabilities | | | 42,562,213 | | | | 30,023,322 | | | | 24,927,277 | | | | 11,298,129 | | | | 46,596,662 | | | | 155,407,603 | |
| Reconciliation: | | | | | | | | | | | | | | | | | | | | | | | | |
| Elimination of inter-segment payables | | | | | | | | | | | | | | | | | | | | | | | (22,023,956 | ) |
| Corporate and other unallocated liabilities: | | | | | | | | | | | | | | | | | | | | | | | | |
| Deferred tax liabilities | | | | | | | | | | | | | | | | | | | | | | | 984,304 | |
| Income tax payable | | | | | | | | | | | | | | | | | | | | | | | 356,683 | |
| | | | | | | | | | | | | | | | | | | | | | | | | |
| Total liabilities | | | | | | | | | | | | | | | | | | | | | | | 134,724,634 | |
| | | Buildings | | | Land use right | | | Total | |
| | | | | | | | | | |
| Year ended December 31, 2017 | | | | | | | | | | | | |
| Opening net carrying amount | | | 99,655 | | | | 1,156,120 | | | | 1,255,775 | |
| Transfer from property, plant and equipment and land use rights (note 6) (note 8) | | | 157,150 | | | | 6,896 | | | | 164,046 | |
| Disposal | | | — | | | | (73,346 | ) | | | (73,346 | ) |
| Depreciation | | | (2,744 | ) | | | (11,361 | ) | | | (14,105 | ) |
| Closing net carrying amount | | | 254,061 | | | | 1,078,309 | | | | 1,332,370 | |
| | | | | | | | | | | | | |
| As at December 31, 2017 | | | | | | | | | | | | |
| Cost | | | 263,066 | | | | 1,107,411 | | | | 1,370,477 | |
| Accumulated depreciation | | | (9,005 | ) | | | (29,102 | ) | | | (38,107 | ) |
| | | | | | | | | | | | | |
| Net carrying amount | | | 254,061 | | | | 1,078,309 | | | | 1,332,370 | |
| | | | Alumina | | | | Primary
aluminum
| | | | Energy | | | | Trading | | | | Corporate
and other
operating
segments | | | | Total | |
| As at December 31, 2017 | | | | | | | | | | | | | | | | | | | | | | | | |
| | | | | | | | | | | | | | | | | | | | | | | | | |
| Segment assets | | | 69,657,926 | | | | 51,996,432 | | | | 40,249,776 | | | | 18,576,192 | | | | 48,271,025 | | | | 228,751,351 | |
| Reconciliation: | | | | | | | | | | | | | | | | | | | | | | | | |
| Elimination of inter-segment receivables | | | | | | | | | | | | | | | | | | | | | | | (30,077,354 | ) |
| Other eliminations | | | | | | | | | | | | | | | | | | | | | | | (194,763 | ) |
| Corporate and other unallocated assets: | | | | | | | | | | | | | | | | | | | | | | | | |
| Deferred tax assets | | | | | | | | | | | | | | | | | | | | | | | 1,602,825 | |
| Prepaid income tax | | | | | | | | | | | | | | | | | | | | | | | 64,557 | |
| | | | | | | | | | | | | | | | | | | | | | | | | |
| Total assets | | | | | | | | | | | | | | | | | | | | | | | 200,146,616 | |
| | | | | | | | | | | | | | | | | | | | | | | | | |
| Segment liabilities | | | 33,106,617 | | | | 29,811,892 | | | | 27,504,055 | | | | 13,063,870 | | | | 60,019,710 | | | | 163,506,144 | |
| Reconciliation: | | | | | | | | | | | | | | | | | | | | | | | | |
| Elimination of inter-segment payables | | | | | | | | | | | | | | | | | | | | | | | (30,077,354 | ) |
| Corporate and other unallocated liabilities: | | | | | | | | | | | | | | | | | | | | | | | | |
| Deferred tax liabilities | | | | | | | | | | | | | | | | | | | | | | | 993,742 | |
| Income tax payable | | | | | | | | | | | | | | | | | | | | | | | 210,205 | |
| | | | | | | | | | | | | | | | | | | | | | | | | |
| Total liabilities | | | | | | | | | | | | | | | | | | | | | | | 134,632,737 | |
| | | Buildings | | | Land use rights | | | Total | |
| | | | | | | | | | |
| Year ended December 31, 2018 | | | | | | | | | | | | |
| Opening net carrying amount | | | 254,061 | | | | 1,078,309 | | | | 1,332,370 | |
| Transfer from property, plant and equipment (note 6) | | | 11,039 | | | | — | | | | 11,039 | |
| Transfer to property, plant and equipment (note 6) | | | (21,773 | ) | | | — | | | | (21,773 | ) |
| Disposal | | | — | | | | (143,401 | ) | | | (143,401 | ) |
| Depreciation | | | (7,353 | ) | | | (14,876 | ) | | | (22,229 | ) |
| Closing net carrying amount | | | 235,974 | | | | 920,032 | | | | 1,156,006 | |
| | | | | | | | | | | | | |
| As at December 31, 2018 | | | | | | | | | | | | |
| Cost | | | 251,626 | | | | 939,015 | | | | 1,190,641 | |
| Accumulated depreciation | | | (15,652 | ) | | | (18,983 | ) | | | (34,635 | ) |
| | | | | | | | | | | | | |
| Net carrying amount | | | 235,974 | | | | 920,032 | | | | 1,156,006 | |
The Group’s investment properties consist of land use rights held for capital appreciation and buildings leased to third parties under operating leases.
As at December 31, 2018, the Group was in the process of applying for the ownership certificates of investment properties with a net carrying value of RMB68 million (December 31, 2017: RMB147 million). There have been no litigations, claims or assessments against the Group for compensation with respect to the use of these rights to date. As at December 31, 2018, the carrying value of these investment properties only represented approximately 0.03% of the total asset value of the Group (December 31, 2017: 0.07%). Management considers that it is probable that the Group can obtain the relevant ownership certificates from the appropriate authorities. The directors of the Company are of the opinion that the Group legally owns and has the rights to use the above investment properties, and that there is no material adverse impact on the overall financial position of the Group.
As at December 31, 2018, the fair value of the buildings was approximately RMB781 million (December 31, 2017: RMB1,208 million), which was estimated based on the market price of comparable buildings in the nearby area. The directors of the Company estimated that the fair value of the land use right is likely to be RMB1,287 million (December 31, 2017: RMB1,182 million), which was determined based on the transaction prices for similar lands nearby.
ALUMINUM CORPORATION OF CHINA LIMITED AND ITS SUBSIDIARIES
NOTES TO THE CONSOLIDATED FINANCIAL STATEMENTS(Continued)
For the years ended December 31, 2015, 2016, 2017 and 20172018
(Amounts expressed in thousands of RMB unless otherwise stated)
4. | REVENUE8. | LAND USE RIGHTS AND SEGMENT INFORMATION(Continued) |
| | |
| (b) | Segment information(Continued) |
| | |
| | The Group mainly operates in the mainland of China. Geographical information of the operating segments is as follows: |
| | 2015 | | 2016 | | 2017 |
| | | | | | |
| Segment revenue from external customers | | | | | |
| — Mainland China | 121,421,378 | | 141,393,123 | | 171,014,419 |
| — Outside of Mainland China | 2,246,289 | | 2,835,793 | | 9,066,331 |
| | | | | | |
| | 123,667,667 | | 144,228,916 | | 180,080,750 |
| | December 31, 2016 | December 31,2017 |
| | | | | |
| Non-current assets (excluding financial assets and deferred tax assets) | | | | |
| — Mainland China | | 120,696,743 | | 127,621,039 |
| — Outside of Mainland China | | 370,561 | | 384,089 |
| | | | | |
| | | 121,067,304 | | 128,005,128 |
| For the year ended December 31, 2017, revenues of approximately RMB39,759 million (2015: RMB31,818 million, 2016: RMB30,940 million) were derived from entities directly or indirectly owned or controlled by the PRC government including Chinalco. These revenues are mainly attributable to the alumina, primary aluminum, energy and trading segments. There were no other individual customer from which the Group has derived revenue of more than 10% of the Group’s revenue during the years ended December 31, 2015, 2016 and 2017. |
ALUMINUM CORPORATION OF CHINA LIMITED AND ITS SUBSIDIARIES
NOTES TO THE CONSOLIDATED FINANCIAL STATEMENTS(Continued)
For the years ended December 31, 2015, 2016 and 2017
(Amounts expressed in thousands of RMB unless otherwise stated)
5. | INTANGIBLE ASSETSLEASEHOLD LAND |
Details of land use rights and leasehold land are as follows:
| | | | Goodwill | | | | Mining
rights and
others | | | | Mineral
exploration
rights | | | | Computer
software and others | | | | Total | |
| | | | | | | | | | | | | | | | | | | | | |
| Year ended December 31, 2016 | | | | | | | | | | | | | | | | | | | | |
| Opening net carrying amount | | | 2,345,837 | | | | 6,771,023 | | | | 1,143,482 | | | | 178,673 | | | | 10,439,015 | |
| Additions | | | — | | | | 341,687 | | | | 1,190 | | | | 1,222 | | | | 344,099 | |
| Disposal | | | — | | | | — | | | | — | | | | (6,827 | ) | | | (6,827 | ) |
| Amortization | | | — | | | | (211,325 | ) | | | — | | | | (32,446 | ) | | | (243,771 | ) |
| Transfer from property, plant and equipment | | | — | | | | 42,165 | | | | 10,408 | | | | 143 | | | | 52,716 | |
| Reclassification | | | — | | | | 36,686 | | | | (36,686 | ) | | | — | | | | — | |
| Currency translation differences | | | 1,016 | | | | 9,351 | | | | 13,192 | | | | — | | | | 23,559 | |
| | | | | | | | | | | | | | | | | | | | | |
| Closing net carrying amount | | | 2,346,853 | | | | 6,989,587 | | | | 1,131,586 | | | | 140,765 | | | | 10,608,791 | |
| | | | | | | | | | | | | | | | | | | | | |
| As at December 31, 2016 | | | | | | | | | | | | | | | | | | | | |
| Cost | | | 2,346,853 | | | | 8,231,287 | | | | 1,131,586 | | | | 399,631 | | | | 12,109,357 | |
| Accumulated amortization and impairment | | | — | | | | (1,241,700 | ) | | | — | | | | (258,866 | ) | | | (1,500,566 | ) |
| | | | | | | | | | | | | | | | | | | | | |
| Net carrying amount | | | 2,346,853 | | | | 6,989,587 | | | | 1,131,586 | | | | 140,765 | | | | 10,608,791 | |
| | | December 31, 2017 | | | December 31, 2018 | |
| | | | | | | |
| Operating leases : | | | | | | | | |
| In the mainland of the PRC, held on: | | | | | | | | |
| Leases less than 10 years | | | 127,516 | | | | 768,153 | |
| Leases between 10 to 50 years | | | 3,331,557 | | | | 3,393,547 | |
| Leases over 50 years | | | 117,939 | | | | 118,591 | |
| | | | | | | | | |
| | | | 3,577,012 | | | | 4,280,291 | |
Operating leases prepayments
| | | | Goodwill | | | | Mining
rights and
others | | | | Mineral
exploration
rights | | | | Computer
software and
others | | | | Total | |
| | | | | | | | | | | | | | | | | | | | | |
| Year ended December 31, 2017 | | | | | | | | | | | | | | | | | | | | |
| Opening net carrying amount | | | 2,346,853 | | | | 6,989,587 | | | | 1,131,586 | | | | 140,765 | | | | 10,608,791 | |
| Additions | | | — | | | | 280,340 | | | | — | | | | 4,827 | | | | 285,167 | |
| Acquisition of a subsidiary | | | — | | | | — | | | | — | | | | 188 | | | | 188 | |
| Disposals | | | — | | | | — | | | | — | | | | (11,168 | ) | | | (11,168 | ) |
| Disposal of subsidiaries | | | — | | | | — | | | | — | | | | (562 | ) | | | (562 | ) |
| Amortization | | | — | | | | (242,261 | ) | | | — | | | | (34,616 | ) | | | (276,877 | ) |
| Transfer from property, plant and equipment (note 6) | | | — | | | | 53,565 | | | | — | | | | 22,614 | | | | 76,179 | |
| Impairment losses | | | — | | | | — | | | | — | | | | (8,134 | ) | | | (8,134 | ) |
| Currency translation differences | | | (923 | ) | | | (7,433 | ) | | | (12,053 | ) | | | — | | | | (20,409 | ) |
| | | | | | | | | | | | | | | | | | | | | |
| Closing net carrying amount | | | 2,345,930 | | | | 7,073,798 | | | | 1,119,533 | | | | 113,914 | | | | 10,653,175 | |
| | | | | | | | | | | | | | | | | | | | | |
| As at December 31, 2017 | | | | | | | | | | | | | | | | | | | | |
| Cost | | | 2,345,930 | | | | 8,554,713 | | | | 1,119,533 | | | | 399,707 | | | | 12,419,883 | |
| Accumulated amortization and impairment | | | — | | | | (1,480,915 | ) | | | — | | | | (285,793 | ) | | | (1,766,708 | ) |
| | | | | | | | | | | | | | | | | | | | | |
| Net carrying amount | | | 2,345,930 | | | | 7,073,798 | | | | 1,119,533 | | | | 113,914 | | | | 10,653,175 | |
| | | 2017 | | | 2018 | |
| | | | | | | |
| As at January 1 | | | 3,198,047 | | | | 3,577,012 | |
| Additions | | | 59,215 | | | | 2,838 | |
| Acquisition of a subsidiary | | | 31,833 | | | | 460,638 | |
| Transfer from property, plant and equipment (note 6) | | | 396,398 | | | | 382,242 | |
| Disposals | | | (6,712 | ) | | | — | |
| Government grants | | | — | | | | (34,174 | ) |
| Disposal of subsidiaries | | | (3,294 | ) | | | (728 | ) |
| Transfer to investment properties | | | (6,896 | ) | | | — | |
| Amortization | | | (91,579 | ) | | | (107,537 | ) |
| | | | | | | | | |
| As at December 31 | | | 3,577,012 | | | | 4,280,291 | |
As at December 31, 2018, the Group was in the process of applying for the certificates of land use rights with a carrying amount of RMB687 million (December 31, 2017: RMB516 million). There have been no litigations, claims or assessments against the Group for compensation with respect to the use of land parcels to date. As at December 31, 2018, the carrying value of these land parcels only represented approximately 0.34% of the total asset value of the Group (December 31, 2017: 0.26%). Management considers that it is probable that the Group can obtain the relevant ownership certificates from the appropriate authorities. The directors of the Company are of the opinion that the Group legally owns and has the right to use the above land, and that there is no material adverse impact on the overall financial position of the Group.
For the year ended December 31, 2018, the amortization expenses of land use rights were recognized in “general and administrative expenses” in profit or loss amounting to RMB108 million (December 31, 2017: RMB92 million ).
As at December 31, 2018, the Group has pledged land use rights at a net carrying value amounting to RMB328 million (December 31, 2017: RMB177 million) for bank and other borrowings as set out in note 24 to the financial statements.
ALUMINUM CORPORATION OF CHINA LIMITED AND ITS SUBSIDIARIES
NOTES TO THE CONSOLIDATED FINANCIAL STATEMENTS(Continued)
For the years ended December 31, 2015, 2016, 2017 and 20172018
(Amounts expressed in thousands of RMB unless otherwise stated)
5. | INTANGIBLE ASSETS(Continued)9. | INVESTMENTS IN JOINT VENTURES AND ASSOCIATES |
| |
| (a) | For the years ended December 31, 2015, 2016 and 2017, the amortization expenses of intangible assets recognizedInvestments in profit or loss are analyzed as follows:joint ventures |
Movements in investments in joint ventures are as follows:
| | 2015 | 2016 | 2017 |
| | | | | | |
| Cost of sales | 223,068 | | 211,325 | | 242,261 |
| General and administrative expenses | 32,030 | | 32,446 | | 34,616 |
| | | | | | |
| | 255,098 | | 243,771 | | 276,877 |
| | | 2017 | | | 2018 | |
| | | | | | | |
| As at January 1 | | | 6,240,200 | | | | 6,007,624 | |
| Capital injections | | | 201,864 | | | | 90,000 | |
| A joint venture changed into a subsidiary (note 38 (k)) | | | (315,706 | ) | | | (2,048,780 | ) |
| A subsidiary changed into a joint venture | | | 11,980 | | | | — | |
| Share of profits and losses for the year | | | 8,151 | | | | (199,452 | ) |
| Share of changes in reserves | | | (6,105 | ) | | | (2,837 | ) |
| Cash dividends declared | | | (132,760 | ) | | | (236,253 | ) |
| Impairment | | | — | | | | (216,953 | ) |
| | | | | | | | | |
| As at December 31 | | | 6,007,624 | | | | 3,393,349 | |
As at December 31, 2018, all joint ventures of the Group were unlisted.
| As at December 31, 2017, the Group has pledged intangible assets with a net carrying value amounting to RMB1,112 million (December 31, 2016: RMB1,114 million) for bank and other borrowings as set out in note 24 to the financial statements. |
| |
| As at December 31, 2017, the Group was in the process of applying for the certificates of mining rights with a carrying value amounting to RMB1,680 million (December 31, 2016: RMB1,577 million). There have been no litigations, claims or assessments against the Group for compensation with respect to the use of these rights to date. As at December 31, 2017, the carrying value of these rights only represented approximately 0.84% of the total asset value of the Group (December 31, 2016: approximately 0.83%). Management considers that it is probable that the Group can obtain the relevant ownership certificates from the appropriate authorities. The directors of the Company are of the opinion that the Group legally owns and has the rights to use the above mining rights, and that there is no material adverse impact on the overall financial position of the Group. |
No joint venture was individually material to the Group.
The following table illustrates the aggregate financial information of the Group’s joint ventures that are not individually material:
| | | 2017 | | | 2018 | |
| | | | | | | |
| Share of the joint ventures’ profits and losses for the year | | | 8,151 | | | | (199,452 | ) |
| Share of the joint ventures’ total comprehensive income | | | 8,151 | | | | (199,452 | ) |
| | | | | | | | | |
| Aggregate carrying amount of the Group’s investments in joint ventures | | | 6,007,624 | | | | 3,393,349 | |
As at December 31, 2018, there were no proportionate interests of the Group in the joint ventures’ capital commitments (December 31, 2017: Nil).
There were no material contingent liabilities relating to the Group’s interests in the joint ventures and the joint ventures themselves.
ALUMINUM CORPORATION OF CHINA LIMITED AND ITS SUBSIDIARIES
NOTES TO THE CONSOLIDATED FINANCIAL STATEMENTS(Continued)
For the years ended December 31, 2015, 2016, 2017 and 20172018
(Amounts expressed in thousands of RMB unless otherwise stated)
5. | INTANGIBLE ASSETS(Continued) |
| (b) | |
| Impairment tests for goodwill |
| |
| The lowest level within the Group at which goodwill is monitored for internal management purposes is the operating segment level. Therefore, goodwill is allocated to the Group’s cash-generating units (“CGUs“) and groups of CGUs according to operating segments. A summary of goodwill allocated to each segment is presented below: |
| | December 31, 2016 | December 31, 2017 |
| | Alumina | Primary aluminium | Alumina | Primary aluminium |
| | | | | | | | |
| Qinghai Branch | - | | 217,267 | | - | | 217,267 |
| Guangxi Branch | 189,419 | | - | | 189,419 | | - |
| Lanzhou Branch | - | | 1,924,259 | | - | | 1,924,259 |
| PT. Nusapati Prima (“PTNP”) | 15,908 | | - | | 14,985 | | - |
| | | | | | | | |
| | 205,327 | | 2,141,526 | | 204,404 | | 2,141,526 |
| | | | | | | | | | |
| The recoverable amount of a CGU is determined based on value-in-use calculations. These calculations use pre-tax cash flow projections based on financial budgets approved by management covering a five-year period. Cash flows beyond the 5-year period are extrapolated using the estimated growth rate of 2% (2016: 2%) not exceeding the long-term average growth rate for the businessesInvestments in which the CGU operates. Other key assumptions applied in the impairment tests include the expected product price, demand for the products, product costs and related expenses. Management determined these key assumptions based on past performance and their expectations on market development. Furthermore, the Group adopts a pre-tax rate of 12.62% (2016: 12.62%) that reflects specific risks related to CGUs and groups of CGUs as the discount rate. The assumptions above are used in analysing the recoverable amounts of CGUs and groups of CGUs within operating segments. |
| |
| The directors of the Company are of the view that, based on their assessment, there was no impairment of goodwill as at December 31, 2017 (December 31, 2016: no impairment). |
ALUMINUM CORPORATION OF CHINA LIMITED AND ITS SUBSIDIARIES
NOTES TO THE CONSOLIDATED FINANCIAL STATEMENTS(Continued)
For the years ended December 31, 2015, 2016 and 2017
(Amounts expressed in thousands of RMB unless otherwise stated)
6. | PROPERTY, PLANT AND EQUIPMENTassociates |
Movements in investments in associates are as follows:
| | | | Buildings | | | | Machinery | | | | Transportation
facilities | | | | Office
and other
equipment | | | | Construction
in progress | | | | Total | |
| | | | | | | | | | | | | | | | | | | | | | | | | |
| Year ended December 31, 2016 | | | | | | | | | | | | | | | | | | | | | | | | |
| Opening net carrying amount | | | 27,097,190 | | | | 51,266,390 | | | | 818,625 | | | | 124,497 | | | | 12,682,514 | | | | 91,989,216 | |
| Currency translation differences | | | 239 | | | | 258 | | | | 159 | | | | 39 | | | | — | | | | 695 | |
| Reclassifications and internal transfers | | | 3,041,286 | | | | 1,412,368 | | | | 18,750 | | | | 4,485 | | | | (4,476,889 | ) | | | — | |
| Transfer to intangible assets | | | — | | | | — | | | | — | | | | — | | | | (52,716 | ) | | | (52,716 | ) |
| Transfer to land use rights | | | — | | | | — | | | | — | | | | — | | | | (156,752 | ) | | | (156,752 | ) |
| Additions | | | 4,755 | | | | 1,403,380 | | | | 17,335 | | | | 7,261 | | | | 8,408,684 | | | | 9,841,415 | |
| Disposals | | | (761,184 | ) | | | (3,098,579 | ) | | | (25,420 | ) | | | (3,238 | ) | | | (230,608 | ) | | | (4,119,029 | ) |
| Depreciation | | | (1,491,627 | ) | | | (4,875,314 | ) | | | (176,383 | ) | | | (34,190 | ) | | | — | | | | (6,577,514 | ) |
| Impairment losses | | | (28,670 | ) | | | (28,326 | ) | | | (59 | ) | | | (25 | ) | | | — | | | | (57,080 | ) |
| | | | | | | | | | | | | | | | | | | | | | | | | |
| Closing net carrying amount | | | 27,861,989 | | | | 46,080,177 | | | | 653,007 | | | | 98,829 | | | | 16,174,233 | | | | 90,868,235 | |
| | | | | | | | | | | | | | | | | | | | | | | | | |
| As at December 31, 2016 | | | | | | | | | | | | | | | | | | | | | | | | |
| Cost | | | 43,221,788 | | | | 90,645,929 | | | | 2,938,562 | | | | 524,045 | | | | 16,770,699 | | | | 154,101,023 | |
| Accumulated depreciation and impairment | | | (15,359,799 | ) | | | (44,565,752 | ) | | | (2,285,555 | ) | | | (425,216 | ) | | | (596,466 | ) | | | (63,232,788 | ) |
| | | | | | | | | | | | | | | | | | | | | | | | | |
| Net carrying amount | | | 27,861,989 | | | | 46,080,177 | | | | 653,007 | | | | 98,829 | | | | 16,174,233 | | | | 90,868,235 | |
| | | | | | | | | | | | | | | | | | | | | | | | | |
| | | 2017 | | | 2018 | |
| | | | | | | |
| As at January 1 | | | 5,926,533 | | | | 6,935,030 | |
| Capital injections | | | 857,317 | | | | 315,300 | |
| Deemed disposal of a subsidiary | | | 100,092 | | | | — | |
| A subsidiary changed into an associate | | | 240,258 | | | | — | |
| Associates changed into subsidiaries | | | — | | | | (862,214 | ) |
| Disposal | | | — | | | | (32,720 | ) |
| Share of profits and losses for the year | | | (165,249 | ) | | | 39,335 | |
| Cash dividends declared | | | (26,330 | ) | | | (36,157 | ) |
| Share of changes in reserves | | | 2,409 | | | | 4,888 | |
| | | | | | | | | |
| As at December 31 | | | 6,935,030 | | | | 6,363,462 | |
As at December 31, 2018, all associates of the Group were unlisted.
No associate was individually material to the Group.
As at December 31, 2018, the Group has pledged investment in an associate amounting to RMB536 million (31 December 2017: nil) for bank and other borrowings as set out in note 24 to the financial statements.
The following table illustrates the aggregate financial information of the Group’s associates that are not individually material:
| | | 2017 | | | 2018 | |
| | | | | | | |
| Share of the associates’ profits and losses | | | (165,249 | ) | | | 39,335 | |
| Share of the associates’ total comprehensive income | | | (165,249 | ) | | | 39,335 | |
| | | | | | | | | |
| Aggregate carrying amount of the Group’s investments in the associates | | | 6,935,030 | | | | 6,363,462 | |
There were no material contingent liabilities relating to the Group’s interests in the associates and the associates themselves.
ALUMINUM CORPORATION OF CHINA LIMITED AND ITS SUBSIDIARIES
NOTES TO THE CONSOLIDATED FINANCIAL STATEMENTS(Continued)
For the years ended December 31, 2015, 2016, 2017 and 20172018
(Amounts expressed in thousands of RMB unless otherwise stated)
| 6.10. | PROPERTY, PLANT AND EQUIPMENT(Continued)EQUITY INVESTMENTS DESIGNATED AT FAIR VALUE THROUGH OTHER COMPREHENSIVE INCOME/AVAILABLE-FOR-SALE FINANCIAL INVESTMENTS |
| | | December 31, 2017 | | | December 31, 2018 | |
| | | | | | | |
| Equity investments designated at fair value through other comprehensive income | | | | | | | | |
| Stated at fair value | | | | | | | | |
| Listed equity investments | | | — | | | | 6,441 | |
| Unlisted investments(Note) | | | — | | | | 1,723,384 | |
| | | | — | | | | 1,729,825 | |
| | | | | | | | | |
| Available-for-sale investments | | | | | | | | |
| Non current portion | | | | | | | | |
| Stated at fair value | | | | | | | | |
| Listed equity investments | | | 9,701 | | | | — | |
| Unlisted investments(Note) | | | 1,848,000 | | | | — | |
| | | | 1,857,701 | | | | — | |
| Stated at cost | | | | | | | | |
| Unlisted equity investments | | | 73,211 | | | | — | |
| Less: provision for impairment | | | (2,711 | ) | | | — | |
| | | | 70,500 | | | | — | |
| | | | | | | | | |
| | | | 1,928,201 | | | | 1,729,825 | |
| | | | Buildings | | | | Machinery | | | | Transportation
facilities | | | | Office
and other
equipment | | | | Construction
in progress | | | | Total | |
| | | | | | | | | | | | | | | | | | | | | | | | | |
| Year ended December 31, 2017 | | | | | | | | | | | | | | | | | | | | | | | | |
| Opening net carrying amount | | | 27,861,989 | | | | 46,080,177 | | | | 653,007 | | | | 98,829 | | | | 16,174,233 | | | | 90,868,235 | |
| Reclassifications and internal transfers | | | 5,334,951 | | | | 9,722,364 | | | | 9,064 | | | | 11,439 | | | | (15,077,818 | ) | | | — | |
| Transfer to intangible assets (note 5) | | | — | | | | — | | | | — | | | | — | | | | (76,179 | ) | | | (76,179 | ) |
| Transfer to land use rights (note 8) | | | — | | | | — | | | | — | | | | — | | | | (396,398 | ) | | | (396,398 | ) |
| Transfer to investment properties (note 7) | | | (157,150 | ) | | | — | | | | — | | | | — | | | | — | | | | (157,150 | ) |
| Additions | | | 8,224 | | | | 1,027,337 | | | | 32,257 | | | | 7,052 | | | | 9,602,020 | | | | 10,676,890 | |
| Acquisition of a subsidiary | | | 889,597 | | | | 2,600,315 | | | | 3,410 | | | | 1,714 | | | | 99,934 | | | | 3,594,970 | |
| Disposal of subsidiaries | | | (86,945 | ) | | | (62,814 | ) | | | (5,269 | ) | | | (2,114 | ) | | | (108,479 | ) | | | (265,621 | ) |
| Disposals | | | (37,678 | ) | | | (1,140,081 | ) | | | (12,437 | ) | | | (1,123 | ) | | | (334,329 | ) | | | (1,525,648 | ) |
| Depreciation | | | (1,575,776 | ) | | | (4,857,954 | ) | | | (144,508 | ) | | | (28,045 | ) | | | — | | | | (6,606,283 | ) |
| Impairment losses | | | — | | | | (15,632 | ) | | | — | | | | — | | | | — | | | | (15,632 | ) |
| Currency translation differences | | | (155 | ) | | | (196 | ) | | | (60 | ) | | | (58 | ) | | | — | | | | (469 | ) |
| | | | | | | | | | | | | | | | | | | | | | | | | |
| Closing net carrying amount | | | 32,237,057 | | | | 53,353,516 | | | | 535,464 | | | | 87,694 | | | | 9,882,984 | | | | 96,096,715 | |
| | | | | | | | | | | | | | | | | | | | | | | | | |
| As at December 31, 2017 | | | | | | | | | | | | | | | | | | | | | | | | |
| Cost | | | 48,882,784 | | | | 101,507,889 | | | | 2,860,597 | | | | 502,779 | | | | 9,994,982 | | | | 163,749,031 | |
| Accumulated depreciation and impairment | | | (16,645,727 | ) | | | (48,154,373 | ) | | | (2,325,133 | ) | | | (415,085 | ) | | | (111,998 | ) | | | (67,652,316 | ) |
| | | | | | | | | | | | | | | | | | | | | | | | | |
| Net carrying amount | | | 32,237,057 | | | | 53,353,516 | | | | 535,464 | | | | 87,694 | | | | 9,882,984 | | | | 96,096,715 | |
| | | | | | | | | | | | | | | | | | | | | | | | | |
The above equity investments were irrevocably designated at fair value through other comprehensive income as the Group considers these investments to be strategic in nature.
| For the years ended December 31, 2015, 2016 and 2017, depreciation expenses recognized in profit or loss are analyzed as follows: |
Note:
| | 2015 | | 2016 | 2017 |
| | | | | | |
| Cost of sales | 6,749,735 | | 6,386,276 | | 6,440,128 |
| General and administrative expenses | 172,524 | | 181,708 | | 159,230 |
| Selling and distribution expenses | 22,731 | | 9,530 | | 6,925 |
| | | | | | |
| | 6,944,990 | | 6,577,514 | | 6,606,283 |
In 2017, the Company entered into a series of agreements with Bank of Communications International Trust Co., Ltd. (“BOCOMMTRUST”) (交銀國際信託有限公司), Bocommtrust Asset Management Co., Ltd.* (“Bocommtrust Asset”) ( 交銀國信資產管理有限公司), a subsidiary of BOCOMMTRUST, and Chinalco Jianxin Investment Fund Management (Beijing) Company Limited* (“Chinalco Jianxin”) (中鋁建信投資基金管理(北京)有限公司) to establish Size Industry Investment Fund. According to these agreements, BOCOMMTRUST acted as the prioritised limited partner and the Company as the secondary limited partner of Size Industry Investment Fund, with the maximum amount of capital contribution of RMB6,700 million and RMB3,300 million, respectively. Bocommtrust Asset and Chinalco Jianxin are the general partner and the manager of Size Industry Investment Fund, respectively. The purpose of Size Industry Investment Fund is to invest in the Company’s subsidiaries, associates or joint ventures in the form of debt financing. As of December 31, 2017, the Company has made investment of RMB1,848 million to the fund.
ALUMINUM CORPORATION OF CHINA LIMITED AND ITS SUBSIDIARIES
NOTES TO THE CONSOLIDATED FINANCIAL STATEMENTS(Continued)
For the years ended December 31, 2015, 2016, 2017 and 2017
(Amounts expressed in thousands of RMB unless otherwise stated)
6. | PROPERTY, PLANT AND EQUIPMENT(Continued) |
| |
| As at December 31, 2017, the Group was in the process of applying for the ownership certificates of buildings with a net carrying value of RMB6,942 million (December 31, 2016: RMB6,759 million). There has been no litigations, claims or assessments against the Group for compensation with respect to the use of these buildings as at the date of approval of these financial statements. As at December 31, 2017, the carrying value of these buildings only represented approximately 3.47% of the Group’s total asset value (December 31, 2016: 3.55%). Management considers that it is probable that the Group can obtain the relevant ownership certificates from the appropriate authorities. The directors of the Company are of the opinion that the Group legally owns and has the rights to use the above property, plant and equipment, and that there is no material adverse impact on the overall financial position of the Group. |
| |
| For the year ended December 31, 2017, interest expenses of RMB344 million (2015: RMB522 million, 2016: RMB414 million) arising from borrowings attributable to the construction of property, plant and equipment during the year were capitalised at an annual rate ranging from 4.41% to 8.00% (2015: 4.90% to 6.55%, 2016: 3.85% to 6.00%) (note 28), and were included in additions to property, plant and equipment. |
| |
| As at December 31, 2017, the Group has pledged property, plant and equipment at a net carrying value amounting to RMB5,799 million (December 31, 2016: RMB6,541 million) for bank and other borrowings as set out in note 24 to the financial statements. |
| |
| As at December 31, 2017, the carrying value of temporarily idle property, plant and equipment of the Group was RMB2,530 million (December 31, 2016: RMB2,828 million). |
| |
| The net carrying amounts of the Group’s fixed assets held under finance leases included in the total amounts of the machinery and construction in progress at December 31, 2017 were RMB9,955 million (2016: RMB7,200 million) and RMB100 million (2016: RMB194 million), respectively. The accumulated depreciation of the Group’s fixed assets held under finance lease amounted to RMB1,908 million (2016: RMB1,703 million). |
| |
| Impairment tests for property, plant and equipment |
| |
| When any indicators of impairment are identified, property, plant and equipment are reviewed for impairment based on each CGU. The CGU is an individual plant or entity. The carrying values of these individual plants or entities were compared to the recoverable amounts of the CGUs, which were based predominantly on value-in-use. Value-in-use calculations use pre-tax cash flow projections based on financial budgets approved by management covering a five-year period. Cash flows beyond the five-year period are extrapolated using the same cash flow projections of the fifth year. Other key assumptions applied in the impairment testing include the expected product price, demand for the products, product cost and related expenses. Management determined these key assumptions based on past performance and their expectations on market development. Further, the Group adopts a pre-tax and non-inflation rate of 10.16% (2016: 10.16%) that reflects specific risks related to the CGUs as discount rates. The assumptions above are used in analysing the recoverable amounts of the CGUs within operating segments. |
| |
| For the CGUs with indicators of impairment identified, the assets were not further impaired during the current year based on the impairment testing (2016: nil). |
| |
| In addition to the CGUs for which impairment was tested based on value-in-use, the Group also assessed the recoverable amounts for property, plant and equipment about to be disposed or abandoned, and impairment losses of RMB16 million were provided during the year ended December 31, 2017 (2015: RMB10 million, 2016: RMB57 million). |
ALUMINUM CORPORATION OF CHINA LIMITED AND ITS SUBSIDIARIES
NOTES TO THE CONSOLIDATED FINANCIAL STATEMENTS(Continued)
For the years ended December 31, 2015, 2016 and 20172018
(Amounts expressed in thousands of RMB unless otherwise stated)
| 7.10. | INVESTMENT PROPERTIESEQUITY INVESTMENTS DESIGNATED AT FAIR VALUE THROUGH OTHER COMPREHENSIVE INCOME/AVAILABLE-FOR-SALE FINANCIAL INVESTMENTS (CONTINUED) |
Note: (continued)
| | | | Buildings | | | | Land use right | | | | Total | |
| | | | | | | | | | | | | |
| Year ended December 31, 2016 | | | | | | | | | | | | |
| Opening net carrying amount | | | 10,902 | | | | — | | | | 10,902 | |
| Additions | | | 88,913 | | | | 966,625 | | | | 1,055,538 | |
| Transfer from land use right | | | — | | | | 190,761 | | | | 190,761 | |
| Depreciation | | | (160 | ) | | | (1,266 | ) | | | (1,426 | ) |
| Closing net carrying amount | | | 99,655 | | | | 1,156,120 | | | | 1,255,775 | |
| | | | | | | | | | | | | |
| As at December 31, 2016 | | | | | | | | | | | | |
| Cost | | | 102,242 | | | | 1,181,942 | | | | 1,284,184 | |
| Accumulated depreciation and impairment | | | (2,587 | ) | | | (25,822 | ) | | | (28,409 | ) |
| | | | | | | | | | | | | |
| Net carrying amount | | | 99,655 | | | | 1,156,120 | | | | 1,255,775 | |
As at December 31, 2018, Size Industry Investment Fund made four investments in two of the Company’s associates and two of the Company’s joint ventures amounting to RMB5,600 million in the form of debt. The Company and BOCOMMTRUST contributed capital of RMB1,650 million and RMB3,350 million to Size Industry Investment Fund, respectively.
| | | | Buildings | | | | Land use rights | | | | Total | |
| | | | | | | | | | | | | |
| Year ended December 31, 2017 | | | | | | | | | | | | |
| Opening net carrying amount | | | 99,655 | | | | 1,156,120 | | | | 1,255,775 | |
| Transfer from property, plant and equipment and land use rights (note 6) (note 8) | | | 157,150 | | | | 6,896 | | | | 164,046 | |
| Disposal | | | — | | | | (73,346 | ) | | | (73,346 | ) |
| Depreciation | | | (2,744 | ) | | | (11,361 | ) | | | (14,105 | ) |
| Closing net carrying amount | | | 254,061 | | | | 1,078,309 | | | | 1,332,370 | |
| | | | | | | | | | | | | |
| As at December 31, 2017 | | | | | | | | | | | | |
| Cost | | | 263,066 | | | | 1,107,411 | | | | 1,370,477 | |
| Accumulated depreciation and impairment | | | (9,005 | ) | | | (29,102 | ) | | | (38,107 | ) |
| | | | | | | | | | | | | |
| Net carrying amount | | | 254,061 | | | | 1,078,309 | | | | 1,332,370 | |
Because the variable return of Size Industry Investment Fund depends on the selection of investment targets, the timing and size of the investment fund and the rate of return, which are all determined by BOCOMMTRUST under its full authority, the directors of the Company are of the opinion that the Company did not have control or joint control over, or significant influence over Size Industry Investment Fund. Therefore, the Company’s investment in Size Industry Investment Fund was accounted for as an equity investment designated at fair value through other comprehensive income.
| The Group’s investment properties consist of land use rights held for capital appreciation and buildings leased to third parties under operating leases. |
| |
| As at December 31, 2017, the Group was in the process of applying for the ownership certificates of investment properties with a net carrying value of RMB147 million (December 31, 2016: Nil). There have been no litigations, claims or assessments against the Group for compensation with respect to the use of these rights to date. As at December 31, 2017, the carrying value of these investment properties only represented approximately 0.07% of the total asset value of the Group (December 31, 2016: Nil). Management considers that it is probable that the Group can obtain the relevant ownership certificates from the appropriate authorities. The directors of the Company are of the opinion that the Group legally owns and has the rights to use the above investment properties, and that there is no material adverse impact on the overall financial position of the Group |
| |
| As at December 31, 2017, the fair value of the buildings was approximately RMB1,208 million (December 31, 2016: RMB125 million) which was estimated based on the market price of comparable buildings in the nearby area. The directors of the Company estimated that the fair value of the land use right is highly likely to be RMB1,182 million (December 31, 2016: RMB1,221 million), which was determined based on the transaction prices for similar lands nearby. |
ALUMINUM CORPORATION OF CHINA LIMITED AND ITS SUBSIDIARIES
NOTES TO THE CONSOLIDATED FINANCIAL STATEMENTS(Continued)
For the years ended December 31, 2015, 2016 and 2017
(Amounts expressed in thousands of RMB unless otherwise stated)
8. | LAND USE RIGHTS |
| |
| Details of land use rights are as follows: |
| | | | December 31,
2016 | | | | December 31,
2017 | |
| | | | | | | | | |
| Operating leases : | | | | | | | | |
| In the mainland of the PRC, held on: | | | | | | | | |
| Leases less than 10 years | | | 121,047 | | | | 127,516 | |
| Leases between 10 to 50 years | | | 3,089,734 | | | | 3,475,023 | |
| Leases over 50 years | | | 135,227 | | | | 117,939 | |
| | | | | | | | | |
| | | | 3,346,008 | | | | 3,720,478 | |
| Operating leases prepayments |
| | | | 2016 | | | | 2017 | |
| | | | | | | | | |
| As at January 1, | | | 3,471,604 | | | | 3,346,008 | |
| Additions | | | 20,963 | | | | 59,215 | |
| Acquisition of a subsidiary | | | — | | | | 31,833 | |
| Transfer from property, plant and equipment (note 6) | | | 156,752 | | | | 396,398 | |
| Disposals | | | (12,826 | ) | | | (6,712 | ) |
| Disposal of subsidiaries | | | — | | | | (3,294 | ) |
| Transfer to investment properties (note 7) | | | (190,761 | ) | | | (6,896 | ) |
| Amortization | | | (99,724 | ) | | | (96,074 | ) |
| | | | | | | | | |
| As at December 31, | | | 3,346,008 | | | | 3,720,478 | |
| As at December 31, 2017, the Group was in the process of applying for the certificates of land use rights with a carrying amount of RMB516 million (December 31, 2016: RMB447 million). There has been no litigations, claims or assessments against the Group for compensation with respect to the use of land parcels to date. As at December 31, 2017, the carrying value of these land parcels only represented approximately 0.26% of the total asset value of the Group (December 31, 2016: 0.23%). Management considers that it is probable that the Group can obtain the relevant ownership certificates from the appropriate authorities. The directors of the Company are of the opinion that the Group legally owns and has the right to use the above land, and that there is no material adverse impact on the overall financial position of the Group. |
| |
| For the year ended December 31, 2017, the amortization expenses of land use rights were recognized in “general and administrative expenses” in profit or loss amounting to RMB96 million (December 31, 2015: RMB104 million, December 31, 2016: RMB100 million). |
| |
| As at December 31, 2017, the Group has pledged land use rights at a net carrying value amounting to RMB177 million (December 31, 2016: RMB275 million) for bank and other borrowings as set out in note 24 to the financial statements. |
ALUMINUM CORPORATION OF CHINA LIMITED AND ITS SUBSIDIARIES
NOTES TO THE CONSOLIDATED FINANCIAL STATEMENTS(Continued)
For the years ended December 31, 2015, 2016 and 2017
(Amounts expressed in thousands of RMB unless otherwise stated)
9. | INVESTMENTS IN JOINT VENTURES AND ASSOCIATES |
| | |
| (a) | Investments in joint ventures |
| | |
| | Movements in investments in joint ventures are as follows: |
| | | | 2016 | | | | 2017 | |
| | | | | | | | | |
| As at January 1, | | | 5,150,887 | | | | 6,240,200 | |
| Capital injections | | | 1,224,912 | | | | 201,864 | |
| A joint venture changed into a subsidiary (note 38 (i)) | | | — | | | | (315,706 | ) |
| A subsidiary changed into a joint venture (note 39 (f)) | | | — | | | | 11,980 | |
| Share of profits and losses for the year | | | (95,508 | ) | | | 8,151 | |
| Share of changes in reserves | | | 8,373 | | | | (6,105 | ) |
| Cash dividends declared | | | (48,464 | ) | | | (132,760 | ) |
| | | | | | | | | |
| As at December 31, | | | 6,240,200 | | | | 6,007,624 | |
| As at December 31, 2016 and 2017, all joint ventures of the Group were unlisted. |
| |
| As at December 31, 2017, particulars of the Group’s material joint venture is as follows: |
| Name | Place of establishment and operation | | Registered and paid-in capital | | Principal activities | Effective equity interest held |
| | | | | | | Ownership
interest | Voting
power | Profit sharing |
| | | | | | | | | |
| Guangxi Huayin Aluminum Co.,Ltd.*(“Guangxi Huayin”) (廣西華銀鋁業有限公司) | PRC/Mainland of China | | 2,441,987 | | Manufacturing | 33% | 33% | 33% |
| Guangxi Huayin, which is considered a material joint venture of the Group, is accounted for using the equity method. |
| |
| * The English names represent the best effort by management of the Group in translating the Chinese names of the Companies as they do not have any official English names. |
ALUMINUM CORPORATION OF CHINA LIMITED AND ITS SUBSIDIARIES
NOTES TO THE CONSOLIDATED FINANCIAL STATEMENTS(Continued)
For the years ended December 31, 2015, 2016 and 2017
(Amounts expressed in thousands of RMB unless otherwise stated)
9. | INVESTMENTS IN JOINT VENTURES AND ASSOCIATES(Continued) |
| | |
| (a) | Investments in joint ventures(Continued) |
| | |
| | The following table illustrates the summarized financial information in respect of Guangxi Huayin : |
| | | | 2016 | | 2017 |
| | | | | | |
| Cash and cash equivalents | | | 444,104 | | 259,280 |
| Other current assets | | | 1,519,522 | | 1,056,431 |
| Current assets | | | 1,963,626 | | 1,315,711 |
| | | | | | |
| Non-current assets | | | 6,253,828 | | 5,921,936 |
| | | | | | |
| Financial liabilities | | | 2,642,830 | | 942,641 |
| Other current liabilities | | | 199,885 | | 258,858 |
| Current liabilities | | | 2,842,715 | | 1,201,499 |
| | | | | | |
| Non-current liabilities | | | 1,866,613 | | 1,383,866 |
| | | | | | |
| Net assets | | | 3,508,126 | | 4,652,282 |
| Non-controlling interests | | | - | | - |
| | | | | | |
| Reconciliation to the Group’s interest in the joint venture: | | | | | |
| Proportion of the Group’s ownership | | | 33% | | 33% |
| Group's share of net assets of the joint venture | | | 1,157,682 | | 1,535,253 |
| Carrying amount of the investment | | | 1,157,682 | | 1,535,253 |
| | | | | | |
| | 2015 | | 2016 | | 2017 |
| | | | | | |
| Revenue | 4,234,157 | | 4,008,925 | | 5,547,895 |
| Gross profit | 706,818 | | 531,785 | | 1,844,116 |
| Interest income | 5,004 | | 2,944 | | 31,754 |
| Depreciation and amortization | 524,436 | | 509,510 | | 524,090 |
| Interest expenses | 227,592 | | 169,745 | | 132,273 |
| Profit before income tax | 189,720 | | 173,690 | | 1,507,883 |
| Income tax | 47,914 | | 35,312 | | 214,264 |
| Profit and total comprehensive income for the year | 141,806 | | 138,378 | | 1,293,619 |
| Other comprehensive income | - | | - | | - |
| Dividend received | - | | - | | 40,260 |
ALUMINUM CORPORATION OF CHINA LIMITED AND ITS SUBSIDIARIES
NOTES TO THE CONSOLIDATED FINANCIAL STATEMENTS(Continued)
For the years ended December 31, 2015, 2016 and 2017
(Amounts expressed in thousands of RMB unless otherwise stated)
9. | INVESTMENTS IN JOINT VENTURES AND ASSOCIATES(Continued) |
| | |
| (a) | Investments in joint ventures(Continued) |
| | |
| | The following table illustrates the aggregate financial information of the Group’s joint ventures that are not individually material: |
| | 2016 | | 2017 |
| | | | |
| Share of the joint ventures’ profits and losses for the year | (141,173) | | (418,743) |
| Share of the joint ventures’ total comprehensive income | (141,173) | | (418,743) |
| | | | |
| Aggregate carrying amount of the Group’s investments in joint ventures | 5,082,518 | | 4,472,371 |
| As at December 31, 2017, there were no proportionate interests of the Group in the joint ventures’ capital commitments (December 31, 2016: RMB3 million). |
| |
| There were no material contingent liabilities relating to the Group’s interests in the joint ventures and the joint ventures themselves. |
ALUMINUM CORPORATION OF CHINA LIMITED AND ITS SUBSIDIARIES
NOTES TO THE CONSOLIDATED FINANCIAL STATEMENTS(Continued)
For the years ended December 31, 2015, 2016 and 2017
(Amounts expressed in thousands of RMB unless otherwise stated)
| (b) | Investments in associates |
| | |
| | Movements in investments in associates are as follows: |
| | | | 2016 | | | | 2017 | |
| | | | | | | | | |
| As at January 1, | | | 5,602,701 | | | | 5,926,533 | |
| Capital injections | | | 511,151 | | | | 857,317 | |
| Deemed disposal of a subsidiary (note 39 (e)) | | | — | | | | 100,092 | |
| A subsidiary changed into an associate (note 39 (d)) | | | — | | | | 240,258 | |
| An investment in an associate changed into an available-for-sale financial investment | | | (176,774 | ) | | | — | |
| Share of profits and losses for the year | | | 115,091 | | | | (165,249 | ) |
| Cash dividends declared | | | (65,603 | ) | | | (26,330 | ) |
| Share of changes in reserves | | | 596 | | | | 2,409 | |
| Other decrease of investment in an associate | | | (60,629 | ) | | | — | |
| | | | | | | | | |
| As at December 31, | | | 5,926,533 | | | | 6,935,030 | |
| As at December 31, 2017, all associates of the Group were unlisted. |
| |
| As at December 31, 2016, particulars of the Group's material associate are as follows: |
| | | | | | | Effective equity interest held |
| Name | Place of establishment and operation | | Registered and paid-in capital | | Principal activities | Ownership interest | Voting power | Profit sharing |
| | | | | | | | | |
| Ling Wu Power | PRC/Mainland of China | | Registered capital 1,300,000 Paid-in capital 2,050,239 | | Thermal power generation | 35% | 35% | 35% |
| Ling Wu Power, which is considered a material associate of the Group in 2016, is accounted for using the equity method. |
ALUMINUM CORPORATION OF CHINA LIMITED AND ITS SUBSIDIARIES
NOTES TO THE CONSOLIDATED FINANCIAL STATEMENTS(Continued)
For the years ended December 31, 2015, 2016 and 2017
(Amounts expressed in thousands of RMB unless otherwise stated)
9. | INVESTMENTS IN JOINT VENTURES AND ASSOCIATES(Continued) |
| | |
| (b) | Investments in associates(Continued) |
| | |
| | The following table illustrates the summarized financial information in respect of Ling Wu Power: |
| | | | 2016 | | | | 2017 | |
| | | | | | | | | |
| Cash and cash equivalents | | | 26,191 | | | | 10,629 | |
| Other current assets | | | 705,994 | | | | 948,443 | |
| Current assets | | | 732,185 | | | | 959,072 | |
| | | | | | | | | |
| Non-current assets | | | 8,781,399 | | | | 8,151,428 | |
| | | | | | | | | |
| Financial liabilities | | | 1,521,912 | | | | 1,885,097 | |
| Other current liabilities | | | 6,011 | | | | 18,129 | |
| Current liabilities | | | 1,527,923 | | | | 1,903,226 | |
| | | | | | | | | |
| Non-current liabilities | | | 4,126,278 | | | | 3,469,266 | |
| | | | | | | | | |
| Net assets | | | 3,859,383 | | | | 3,738,008 | |
| Non-controlling interests | | | — | | | | — | |
| | | | | | | | | |
| Reconciliation to the Group’s interest in the associate: | | | | | | | | |
| Proportion of the Group’s ownership | | | 35% | | | | 35% | |
| Group’s share of net assets of the associate | | | 1,350,784 | | | | 1,308,303 | |
| Carrying amount of the investment | | | 1,350,784 | | | | 1,308,303 | |
| | | | 2015 | | | | 2016 | | | | 2017 | |
| | | | | | | | | | | | | |
| Revenue | | | 4,319,345 | | | | 3,297,397 | | | | 3,723,669 | |
| Gross profit | | | 1,190,966 | | | | 524,930 | | | | 79,200 | |
| Interest income | | | 2,140 | | | | 1,320 | | | | 1,513 | |
| Depreciation and amortization | | | 610,910 | | | | 608,345 | | | | 609,240 | |
| Interest expenses | | | 312,128 | | | | 251,838 | | | | 213,983 | |
| Profit/(loss) | | | 629,564 | | | | 327,481 | | | | (154,054 | ) |
| Income tax expense/(benefits) | | | 75,404 | | | | 74,911 | | | | (32,679 | ) |
| Profit and total comprehensive income / (loss) for the year | | | 554,160 | | | | 252,570 | | | | (121,375 | ) |
| Other comprehensive (income) | | | — | | | | — | | | | — | |
| Dividend received | | | 289,605 | | | | — | | | | — | |
ALUMINUM CORPORATION OF CHINA LIMITED AND ITS SUBSIDIARIES
NOTES TO THE CONSOLIDATED FINANCIAL STATEMENTS(Continued)
For the years ended December 31, 2015, 2016 and 2017
(Amounts expressed in thousands of RMB unless otherwise stated)
9. | INVESTMENTS IN JOINT VENTURES AND ASSOCIATES(Continued) |
| | |
| (b) | Investments in associates(Continued) |
| | |
| | The following table illustrates the aggregate financial information of the Group’s associates that are not individually material: |
| | | | 2016 | | | | 2017 | |
| | | | | | | | | |
| Share of the associates’ profits and losses | | | 26,692 | | | | (122,768 | ) |
| Share of the associates’ total comprehensive income | | | 26,692 | | | | (122,768 | ) |
| | | | | | | | | |
| Aggregate carrying amount of the Group’s investments in the associates | | | 4,575,749 | | | | 5,626,727 | |
| As at December 31, 2017, the proportionate interests of the Group in the associates’ capital commitments amounted to RMB760 million (December 31, 2016: Nil) |
| |
| There were no material contingent liabilities relating to the Group’s interests in the associates and the associates themselves. |
ALUMINUM CORPORATION OF CHINA LIMITED AND ITS SUBSIDIARIES
NOTES TO THE CONSOLIDATED FINANCIAL STATEMENTS(Continued)
For the years ended December 31, 2015, 2016 and 2017
(Amounts expressed in thousands of RMB unless otherwise stated)
10. | AVAILABLE-FOR-SALE FINANCIAL INVESTMENTS |
| | | | December 31,
2016 | | | | December 31,
2017 | |
| | | | | | | | | |
| Non current portion | | | | | | | | |
| Stated at fair value | | | | | | | | |
| Listed equity investments | | | 93,893 | | | | 9,701 | |
| Other unlisted investments(Note) | | | — | | | | 1,848,000 | |
| | | | 93,893 | | | | 1,857,701 | |
| Stated at cost | | | | | | | | |
| Unlisted equity investments | | | 73,211 | | | | 73,211 | |
| Less: provision for impairment | | | (2,711 | ) | | | (2,711 | ) |
| | | | 70,500 | | | | 70,500 | |
| | | | 164,393 | | | | 1,928,201 | |
| The gross loss in respect of the Group's available-for-sale investments recognized in other comprehensive income amounted to RMB5 million (2015: the gross gain amounted RMB58 million, 2016: the gross gain amounted to RMB104 million). |
| |
| During the year ended December 31, 2017, due to the disposal of available-for-sale investments, gains in fair value changes amounting to RMB45 million (2015: nil, 2016: RMB103 million) recognized in other comprehensive income were transferred to profit or loss. |
| |
| Note: |
| |
| In 2017, the Company entered into a series of agreements with Bank of Communications International Trust Co., Ltd. (“BOCOMMTRUST”) (交銀國際信託有限公司), Bocommtrust Asset Management Co., Ltd.* (“Bocommtrust Asset”) (交銀國信資產管理有限公司), a subsidiary of BOCOMMTRUST, and Chinalco Jianxin Investment Fund Management (Beijing) Company Limited* (“Chinalco Jianxin”) (中鋁建信投資基金管理(北京)有限公司) to establish Beijing Chalco Bocom Size Industry Investment Fund Management Partnership (Limited Partnership)* (“Size Industry Investment Fund”) (北京中鋁交銀四則產業投資基金管理合夥企業(有限合夥)). According to these agreements, BOCOMMTRUST acted as the prioritised limited partner and the Company as the secondary limited partner of Size Industry Investment Fund, with the maximum amount of capital contribution of RMB6,700 million and RMB3,300 million, respectively. Bocommtrust Asset and Chinalco Jianxin are the general partner and the manager of Size Industry Investment Fund, respectively. The purpose of Size Industry Investment Fund is to invest in the Company’s subsidiaries, associates or joint ventures in the form of debt financing. |
| |
| As at December 31, 2017, Size Industry Investment Fund made four investments in two of the Company’s associates and two of the Company’s joint ventures amounting to RMB5,600 million in the form of debt. The Company and BOCOMMTRUST contributed capital of RMB1,848 million and RMB3,752 million to Size Industry Investment Fund, respectively. |
ALUMINUM CORPORATION OF CHINA LIMITED AND ITS SUBSIDIARIES
NOTES TO THE CONSOLIDATED FINANCIAL STATEMENTS(Continued)
For the years ended December 31, 2015, 2016 and 2017
(Amounts expressed in thousands of RMB unless otherwise stated)
10. | AVAILABLE-FOR-SALE FINANCIAL INVESTMENTS(Continued) |
| | |
| Note: (Continued) |
| | |
| Because the variable return of Size Industry Investment Fund depends on the selection of investment targets, the timing and size of the investment fund and the rate of return, which are all determined by BOCOMMTRUST under its full authority, the directors of the Company are of the opinion that the Company did not have control or joint control over, or significant influence over Size Industry Investment Fund. Therefore, the Company’s investment in Size Industry Investment Fund was accounted for as an available-for-sale financial instrument. |
| | |
| * | The English names represent the best effort made by management of the Group in translating the Chinese names of the Companies as the companies do not have any official English names. |
ALUMINUM CORPORATION OF CHINA LIMITED AND ITS SUBSIDIARIES
NOTES TO THE CONSOLIDATED FINANCIAL STATEMENTS(Continued)
For the years ended December 31, 2015, 2016, 2017 and 20172018
(Amounts expressed in thousands of RMB unless otherwise stated)
11. | 11. | DEFERRED TAX |
| |
| Deferred tax assets and liabilities are offset when there is a legally enforceable right to offset current income tax assets against current income tax liabilities and when the deferred taxes relate to the same tax authority. |
| |
| The movements in deferred tax assets and liabilities during the year ended December 31, 2016 and 2017 without taking into consideration the offsetting of balances within the same tax jurisdiction, are as follows: |
| |
| Movements in deferred tax assets: |
Deferred tax assets and liabilities are offset when there is a legally enforceable right to offset current income tax assets against current income tax liabilities and when the deferred taxes relate to the same tax authority.
| | | | Provision for
impairment | | | | Accrued
expenses | | | | Tax losses | | | | Unrealized
profit at
consolidation | | | | Others | | | | Total | |
| As at January 1, 2016 | | | 989,523 | | | | 215,497 | | | | 803,140 | | | | 101,459 | | | | 168,928 | | | | 2,278,547 | |
| (Charged)/credited to profit or loss | | | (436,751 | ) | | | (7,846 | ) | | | (166,943 | ) | | | 67,654 | | | | (48,119 | ) | | | (592,005 | ) |
| | | | | | | | | | | | | | | | | | | | | | | | | |
| As at December 31, 2016 | | | 552,772 | | | | 207,651 | | | | 636,197 | | | | 169,113 | | | | 120,809 | | | | 1,686,542 | |
| | | | | | | | | | | | | | | | | | | | | | | | | |
| As at January 1, 2017 | | | 552,772 | | | | 207,651 | | | | 636,197 | | | | 169,113 | | | | 120,809 | | | | 1,686,542 | |
| (Charged)/credited to profit or loss | | | (30,715 | ) | | | 59,664 | | | | (94,978 | ) | | | (3,070 | ) | | | 47,838 | | | | (21,261 | ) |
| Disposal of subsidiaries | | | — | | | | (3,106 | ) | | | (1,320 | ) | | | — | | | | — | | | | (4,426 | ) |
| | | | | | | | | | | | | | | | | | | | | | | | | |
| As at December 31, 2017 | | | 522,057 | | | | 264,209 | | | | 539,899 | | | | 166,043 | | | | 168,647 | | | | 1,660,855 | |
The movements in deferred tax assets and liabilities during the year ended December 31, 2018 without taking into consideration the offsetting of balances within the same tax jurisdiction are as follows:
Movements in deferred tax assets:
| | | Provision for impairment | | | Accrued expenses | | | Tax losses | | | Unrealized profit at consolidation | | | Others | | | Total | |
| As at January 1, 2017 | | | 553,716 | | | | 207,651 | | | | 636,197 | | | | 169,113 | | | | 120,830 | | | | 1,687,507 | |
| (Charged)/credited to profit or loss | | | (28,334 | ) | | | 59,664 | | | | (94,978 | ) | | | (3,070 | ) | | | 47,817 | | | | (18,901 | ) |
| Disposal of subsidiaries | | | — | | | | (3,106 | ) | | | (1,320 | ) | | | — | | | | — | | | | (4,426 | ) |
| | | | | | | | | | | | | | | | | | | | | | | | | |
| As at December 31, 2017 | | | 525,382 | | | | 264,209 | | | | 539,899 | | | | 166,043 | | | | 168,647 | | | | 1,664,180 | |
| | | | | | | | | | | | | | | | | | | | | | | | | |
| As at January 1, 2018 | | | 525,382 | | | | 264,209 | | | | 539,899 | | | | 166,043 | | | | 168,647 | | | | 1,664,180 | |
| Acquisition of subsidiaries | | | 360 | | | | — | | | | — | | | | — | | | | 7,734 | | | | 8,094 | |
| (Charged)/credited to profit or loss | | | (139,985 | ) | | | (21,839 | ) | | | 76,338 | | | | 3,833 | | | | 5,989 | | | | (75,664 | ) |
| | | | | | | | | | | | | | | | | | | | | | | | | |
| As at December 31, 2018 | | | 385,757 | | | | 242,370 | | | | 616,237 | | | | 169,876 | | | | 182,370 | | | | 1,596,610 | |
ALUMINUM CORPORATION OF CHINA LIMITED AND ITS SUBSIDIARIES
NOTES TO THE CONSOLIDATED FINANCIAL STATEMENTS(Continued)
For the years ended December 31, 2015, 2016, 2017 and 20172018
(Amounts expressed in thousands of RMB unless otherwise stated)
| 11. | DEFERRED TAX(Continued) |
| |
| Movements in deferred tax liabilities: |
| | | Interest
capitalisation | | | Fair value
changes of
financial
assets | | | Depreciation
and amortization | | | Unrealized
losses of
consolidation | | | Fair value
adjustments
arising from
acquisition of
subsidiaries | | | Investment
in a
subsidiary | | | Investment
in an associate | | | Total | |
| As at January 1, 2016 | | | 71,009 | | | | 911 | | | | 7,654 | | | | 4,889 | | | | 1,000,667 | | | | 800,640 | | | | 35,937 | | | | 1,921,707 | |
| Exchange realignment | | | — | | | | — | | | | — | | | | — | | | | 210 | | | | — | | | | — | | | | 210 | |
| Charged to other comprehensive income | | | — | | | | 13,288 | | | | — | | | | — | | | | — | | | | — | | | | — | | | | 13,288 | |
| (Credited)/ charged to profit or loss | | | (9,843 | ) | | | 726 | | | | (180 | ) | | | (4,889 | ) | | | (23,535 | ) | | | (617,408 | ) | | | (35,937 | ) | | | (691,066 | ) |
| | | | | | | | | | | | | | | | | | | | | | | | | | | | | | | | | |
| | | | 61,166 | | | | 14,925 | | | | 7,474 | | | | — | | | | 977,342 | | | | 183,232 | | | | — | | | | 1,244,139 | |
| | | | | | | | | | | | | | | | | | | | | | | | | | | | | | | | | |
| As at January 1, 2017 | | | 61,166 | | | | 14,925 | | | | 7,474 | | | | — | | | | 977,342 | | | | 183,232 | | | | — | | | | 1,244,139 | |
| Exchange realignment | | | — | | | | — | | | | — | | | | — | | | | (1,830 | ) | | | — | | | | — | | | | (1,830 | ) |
| Credited to other comprehensive income | | | — | | | | (11,180 | ) | | | — | | | | — | | | | — | | | | — | | | | — | | | | (11,180 | ) |
| Acquisition of a subsidiary | | | — | | | | — | | | | — | | | | — | | | | 40,706 | | | | — | | | | — | | | | 40,706 | |
| (Credited)/ charged to profit or loss | | | (8,232 | ) | | | (1,414 | ) | | | 185 | | | | — | | | | (27,370 | ) | | | (183,232 | ) | | | — | | | | (220,063 | ) |
| | | | | | | | | | | | | | | | | | | | | | | | | | | | | | | | | |
| As at December 31, 2017 | | | 52,934 | | | | 2,331 | | | | 7,659 | | | | — | | | | 988,848 | | | | — | | | | — | | | | 1,051,772 | |
Movements in deferred tax liabilities:
| | | Interest capitalisation | | | Fair value changes of financial assets | | | Depreciation and amortization | | | Fair value adjustments arising from acquisition of subsidiaries | | | Investment in a subsidiary | | | Investment in an associate | | | Total | |
| As at January 1, 2017 | | | 61,166 | | | | 14,925 | | | | 7,474 | | | | 977,342 | | | | 183,232 | | | | — | | | | 1,244,139 | |
| Exchange realignment | | | — | | | | — | | | | — | | | | (1,830 | ) | | | — | | | | — | | | | (1,830 | ) |
| Credited to other comprehensive income | | | — | | | | (11,180 | ) | | | — | | | | — | | | | — | | | | — | | | | (11,180 | ) |
| Acquisition of subsidiaries | | | — | | | | — | | | | — | | | | 40,706 | | | | — | | | | — | | | | 40,706 | |
(Credited)/ charged to profit or loss | | | (8,232 | ) | | | (1,414 | ) | | | 185 | | | | (27,370 | ) | | | (183,232 | ) | | | — | | | | (220,063 | ) |
| | | | | | | | | | | | | | | | | | | | | | | | | | | | | |
| As at December 31, 2017 | | | 52,934 | | | | 2,331 | | | | 7,659 | | | | 988,848 | | | | — | | | | — | | | | 1,051,772 | |
| | | | | | | | | | | | | | | | | | | | | | | | | | | | | |
| Changes in accounting policies | | | — | | | | 3,641 | | | | — | | | | — | | | | — | | | | — | | | | 3,641 | |
| As at January 1, 2018 | | | 52,934 | | | | 5,972 | | | | 7,659 | | | | 988,848 | | | | — | | | | — | | | | 1,055,413 | |
| Exchange realignment | | | | | | | | | | | | | | | 1,353 | | | | | | | | | | | | 1,353 | |
| Credited to other comprehensive income | | | | | | | (3,769 | ) | | | — | | | | — | | | | — | | | | — | | | | (3,769 | ) |
| Acquisition of subsidiaries | | | — | | | | — | | | | — | | | | 822,229 | | | | — | | | | — | | | | 822,229 | |
(Credited)/ charged to profit or loss | | | (9,102 | ) | | | 3,403 | | | | 24,830 | | | | (27,511 | ) | | | — | | | | — | | | | (8,380 | ) |
| | | | | | | | | | | | | | | | | | | | | | | | | | | | | |
| As at December 31, 2018 | | | 43,832 | | | | 5,606 | | | | 32,489 | | | | 1,784,919 | | | | — | | | | — | | | | 1,866,846 | |
ALUMINUM CORPORATION OF CHINA LIMITED AND ITS SUBSIDIARIES
NOTES TO THE CONSOLIDATED FINANCIAL STATEMENTS(Continued)
For the years ended December 31, 2015, 2016, 2017 and 20172018
(Amounts expressed in thousands of RMB unless otherwise stated)
| 11. | DEFERRED TAX(Continued) |
| |
| For presentation purposes, certain deferred tax assets and liabilities have been offset in the consolidated statement of financial position. The following is an analysis of the deferred tax balances of the Group for financial reporting purposes: |
For presentation purposes, certain deferred tax assets and liabilities have been offset in the consolidated statement of financial position. The following is an analysis of the deferred tax balances of the Group for financial reporting purposes:
| | December 31, 2016 | December 31, 2017 |
| | | | |
| Net deferred tax assets | 1,426,707 | | 1,602,825 |
| | | | |
| Net deferred tax liabilities | 984,304 | | 993,742 |
| | | | |
| As at December 31, 2017, the Group has not recognized deferred tax assets of RMB4,337 million (December 31, 2016: RMB5,220 million) in respect of accumulated tax losses amounting to RMB18,214 million (December 31, 2016: RMB21,991 million) arising in Mainland China that can be carried forward for offsetting against future taxable income, and deferred tax assets of RMB1,434 million (December 31, 2016: RMB1,860 million) in respect of deductible temporary differences amounting to RMB6,235 million (December 31, 2016: RMB7,660 million) as it was considered not probable that those assets would be realized. The above tax losses will expire in one to five years if not utilized. |
| |
| As at December 31, 2016 and 2017, the expiry profile of these unprovided tax losses was analyzed as follows: |
| | | December 31, 2017 | | | December 31, 2018 | |
| | | | | | | |
| Net deferred tax assets | | | 1,606,150 | | | | 1,542,569 | |
| | | | | | | | | |
| Net deferred tax liabilities | | | 993,742 | | | | 1,812,805 | |
| | December 31, 2016 | December 31, 2017 |
| | | | |
| Expiring in | | | |
| 2017 | 4,473,661 | | - |
| 2018 | 7,880,303 | | 7,689,663 |
| 2019 | 7,686,919 | | 7,650,084 |
| 2020 | 880,805 | | 711,878 |
| 2021 | 1,069,152 | | 975,081 |
| 2022 | - | | 1,186,914 |
| | | | |
| | 21,990,840 | | 18,213,620 |
As at December 31, 2018, the Group has not recognized deferred tax assets of RMB2,634 million (December 31, 2017: RMB4,337 million) in respect of accumulated tax losses amounting to RMB11,387 million (December 31, 2017: RMB18,214 million) arising in Mainland China and deferred tax assets of RMB1,660 million (December 31, 2017: RMB1,434 million) in respect of deductible temporary differences amounting to RMB7,992 million (December 31, 2017: RMB6,235 million) as it was considered not probable that those assets would be realized. The above tax losses will expire in one to five years if not utilized.
As at December 31, 2018, the expiry profile of these unprovided tax losses was analysed as follows:
| | | | December 31, 2017 | | | December 31, 2018 | |
| | | | | | | | |
| Expiring in | | | | | | | | | |
| 2018 | | | | 7,689,663 | | | | — | |
| 2019 | | | | 7,650,084 | | | | 6,753,096 | |
| 2020 | | | | 711,878 | | | | 711,878 | |
| 2021 | | | | 975,081 | | | | 975,081 | |
| 2022 | | | | 1,186,914 | | | | 1,211,002 | |
| 2023 | | | | — | | | | 1,736,412 | |
| | | | | | | | | | |
| | | | | 18,213,620 | | | | 11,387,469 | |
ALUMINUM CORPORATION OF CHINA LIMITED AND ITS SUBSIDIARIES
NOTES TO THE CONSOLIDATED FINANCIAL STATEMENTS(Continued)
For the years ended December 31, 2015, 2016, 2017 and 20172018
(Amounts expressed in thousands of RMB unless otherwise stated)
| 12. | OTHER NON-CURRENT ASSETS |
| | | | December 31, 2017 | | December 31, 2018 | |
| | December 31, 2016 | December 31, 2017 | | | | | |
| | | | | | | | | |
| Financial assets | | | | | | |
| - Receivables from disposal of Guizhou Branch’s aluminum properties | 1,060,682 | | - | |
| - Other long-term receivables | 305,677 | | 261,156 | | | 261,156 | | | 204,718 | |
| | 1,366,359 | | 261,156 | |
| | | | | | | |
| Prepayment for mining rights | 769,108 | | 801,657 | | 801,657 | | 808,736 | |
| Long-term prepaid expenses | 389,076 | | 484,536 | | 484,536 | | 667,772 | |
| Deferred losses for sale and leaseback transactions(Note) | 1,172,671 | | 1,234,376 | | 1,234,376 | | 1,164,782 | |
| Others | 490,907 | | 739,167 | | | 739,167 | | | 1,596,636 | |
| | 2,821,762 | | 3,259,736 | | 3,259,736 | | 4,237,926 | |
| | | | | | | | |
| | 4,188,121 | | 3,520,892 | | | 3,520,892 | | | 4,442,644 | |
| Note: | As disclosed in note 20, the Group entered into several sale and leaseback agreements which constitute finance leases during the year. The deferred losses resulted from the sale are classified as other non-current assets and were amortized over the useful lives of the assets leased back. |
| | |
| As at December 31, 2017, all amounts were denominated in RMB (December 31, 2016, all amounts were denominated in RMB). |
| | |
| As at December 31, 2017, except for other long-term receivables from Shanxi Huaxing Alumina Co., Ltd. (“Shanxi Huaxing”) amounting to RMB97 million (December 31, 2016: RMB112 million) which was an interest-bearing asset, all amounts in other non-current assets were non-interest-bearing.(December 31, 2016: non-interest-bearing) |
As at December 31, 2018 and December 31, 2017, all amounts were denominated in RMB.
As at December 31, 2018 and December 31, 2017, all amounts in other non-current assets were non-interest-bearing.
ALUMINUM CORPORATION OF CHINA LIMITED AND ITS SUBSIDIARIES
NOTES TO THE CONSOLIDATED FINANCIAL STATEMENTS(Continued)
For the years ended December 31, 2015, 2016, 2017 and 20172018
(Amounts expressed in thousands of RMB unless otherwise stated)
| | | | December 31,
2016 | | | | December 31,
2017 | |
| | | | | | | | | |
| Raw materials | | | 8,853,776 | | | | 7,547,870 | |
| Work-in-progress | | | 5,830,213 | | | | 8,122,072 | |
| Finished goods | | | 3,095,633 | | | | 4,354,676 | |
| Spare parts | | | 818,769 | | | | 731,621 | |
| Packaging materials and others | | | 42,853 | | | | 43,064 | |
| | | | 18,641,244 | | | | 20,799,303 | |
| | | | | | | | | |
| Less: provision for impairment of inventories | | | (707,812 | ) | | | (452,594 | ) |
| | | | | | | | | |
| | | | 17,933,432 | | | | 20,346,709 | |
| Movements in the provision for impairment of inventories are as follows: |
| | | | 2016 | | | | 2017 | |
| | | | | | | | | |
| As at January 1, | | | 2,370,200 | | | | 707,812 | |
| Provision for impairment of inventories | | | 122,047 | | | | 193,138 | |
| Reversal arising from increase in net realisable value | | | (69,395 | ) | | | (80,778 | ) |
| Reversal upon sales of inventories | | | (1,715,040 | ) | | | (259,564 | ) |
| Disposal of Subsidiaries | | | — | | | | (108,014 | ) |
| | | | | | | | | |
| As at December 31, | | | 707,812 | | | | 452,594 | |
| As at December 31, 2016 and 2017, the Group had no pledged inventories for bank and other borrowings. |
| | | December 31, 2017 | | | December 31, 2018 | |
| | | | | | | |
| Raw materials | | | 7,619,265 | | | | 8,362,697 | |
| Work-in-progress | | | 8,193,656 | | | | 8,684,506 | |
| Finished goods | | | 4,417,202 | | | | 3,280,641 | |
| Spare parts | | | 731,621 | | | | 879,794 | |
| Packaging materials and others | | | 43,064 | | | | 63,227 | |
| | | | 21,004,808 | | | | 21,270,865 | |
| | | | | | | | | |
| Less: provision for impairment of inventories | | | (457,252 | ) | | | (811,197 | ) |
| | | | | | | | | |
| | | | 20,547,556 | | | | 20,459,668 | |
.Movements in the provision for impairment of inventories are as follows:
| | | 2017 | | | 2018 | |
| | | | | | | |
| As at January 1 | | | 719,560 | | | | 457,252 | |
| Provision for impairment of inventories | | | 194,588 | | | | 2,413,098 | |
| Reversal arising from increase in net realisable value | | | (89,318 | ) | | | (165,510 | ) |
| Written off upon sales of inventories | | | (259,564 | ) | | | (1,893,643 | ) |
| Disposal of subsidiaries | | | (108,014 | ) | | | — | |
| | | | | | | | | |
| As at December 31 | | | 457,252 | | | | 811,197 | |
As at December 31, 2018 and December 31, 2017, the Group had not pledged inventories for bank and other borrowings.
ALUMINUM CORPORATION OF CHINA LIMITED AND ITS SUBSIDIARIES
NOTES TO THE CONSOLIDATED FINANCIAL STATEMENTS(Continued)
For the years ended December 31, 2015, 2016, 2017 and 20172018
(Amounts expressed in thousands of RMB unless otherwise stated)
14. | 14. | TRADE AND NOTES RECEIVABLES |
| | | | December 31,
2016 | | | | December 31,
2017 | | | December 31, 2017 | | December 31, 2018 | |
| | | | | | | | | | | | | | |
| Trade receivables | | | 4,649,107 | | | | 4,794,017 | | | 4,832,177 | | 5,865,311 | |
| Less: provision for impairment | | | (462,571 | ) | | | (482,020 | ) | | | (546,102 | ) | | | (659,261 | ) |
| | | | 4,186,536 | | | | 4,311,997 | | | 4,286,075 | | 5,206,050 | |
| | | | | | | | | | | | | | |
| Notes receivable | | | 3,163,027 | | | | 3,714,212 | | | | 3,722,862 | | | 2,894,482 | |
| | | | | | | | | | | | | | |
| | | | 7,349,563 | | | | 8,026,209 | | | | 8,008,937 | | | 8,100,532 | |
As at December 31, 2018, except for trade and notes receivables of the Group amounting to RMB1,403 million (December 31, 2017: RMB1,094 million) which were denominated in USD, all trade and notes receivables were denominated in RMB.
| As at December 31, 2017, except for trade and notes receivables of the Group amounting to RMB1,094 million which were denominated in USD (December 31, 2016: RMB458 million denominated in USD and RMB5 million in EUR), all trade and notes receivables were denominated in RMB (December 31, 2016: all in RMB). |
| |
| Trade receivables are non-interest-bearing and are generally on terms of 3 to 12 months. Certain of the Group’s sales were on advance payments or documents against payment. In some cases, these terms are extended for qualifying long term customers that have met specific credit requirements. As at December 31, 2016 and 2017, the ageing analysis of trade and notes receivables was as follows: |
Included in the Group’s trade and notes receivables are amounts due from the Group’s joint ventures and associates of RM820 million (December 31, 2017: RMB591 million) and RMB7 million (December 31, 2017: RMB97 million), respectively, which are repayable on credit terms similar to those offered to the major customers of the Group.
| | | | December 31,
2016 | | | | December 31,
2017 | |
| | | | | | | | | |
| Within 1 year | | | 5,787,705 | | | | 6,320,428 | |
| Between 1 and 2 years | | | 557,602 | | | | 505,493 | |
| Between 2 and 3 years | | | 533,227 | | | | 336,019 | |
| Over 3 years | | | 933,600 | | | | 1,346,289 | |
| | | | 7,812,134 | | | | 8,508,229 | |
| | | | | | | | | |
| Less: provision for impairment | | | (462,571 | ) | | | (482,020 | ) |
| | | | | | | | | |
| | | | 7,349,563 | | | | 8,026,209 | |
As at December 31, 2018, the Group had pledged notes receivable amounting to RMB934 million to exchange notes receivable (December 31, 2017: trade receivables amounting to RMB22 million and notes receivable amounting to RMB82 million for bank and other borrowings and to exchange notes receivable) as set out in note 24 to the financial statements.
Trade receivables are non-interest-bearing and are generally on terms of 3 to 12 months. Certain of the Group’s sales were on advance payments or documents against payment. In some cases, these terms are extended for qualifying long term customers that have met specific credit requirements. As at December 31, 2018, the ageing analysis of trade and notes receivables was as follows:
| | | December 31, 2017 | | | December 31,
2018 | |
| | | | | | | |
| Within 1 year | | | 6,289,931 | | | | 6,212,537 | |
| Between 1 and 2 years | | | 516,359 | | | | 906,302 | |
| Between 2 and 3 years | | | 338,334 | | | | 158,162 | |
| Over 3 years | | | 1,410,415 | | | | 1,482,792 | |
| | | | 8,555,039 | | | | 8,759,793 | |
| | | | | | | | | |
| Less: provision for impairment | | | (546,102 | ) | | | (659,261 | ) |
| | | | | | | | | |
| | | | 8,008,937 | | | | 8,100,532 | |
ALUMINUM CORPORATION OF CHINA LIMITED AND ITS SUBSIDIARIES
NOTES TO THE CONSOLIDATED FINANCIAL STATEMENTS(Continued)
For the years ended December 31, 2015, 2016, 2017 and 20172018
(Amounts expressed in thousands of RMB unless otherwise stated)
| 14. | TRADE AND NOTES RECEIVABLES(Continued) |
| |
| As at December 31, 2016 and 2017, the ageing analysis of past due but not impaired trade and notes receivables was as follows: |
Impairment under IFRS 9 for the year ended December 31, 2018
| | December 31, 2016 | December 31, 2017 |
| | | | |
| Past due for 1 year | 523,333 | | 459,188 |
| Past due for 1 to 2 years | 505,774 | | 295,928 |
| Past due for over 2 years | 412,028 | | 781,832 |
| | 1,441,135 | | 1,536,948 |
| | | | |
| Not past due | 5,710,535 | | 6,137,627 |
| | | | |
| | 7,151,670 | | 7,674,575 |
An impairment analysis is performed at each reporting date using a provision matrix to measure expected credit losses. The provision rates are based on days past due for groupings of various customer segments with similar loss patterns (i.e., by geographical region, product type, customer type and rating, and coverage by letters of credit or other forms of credit insurance). The calculation reflects the probability-weighted outcome, the time value of money and reasonable and supportable information that is available at the reporting date about past events, current conditions and forecasts of future economic conditions.
| The credit quality of trade and notes receivables that are neither past due nor impaired is assessed by reference to the counterparties’ default history. As at December 31, 2016 and 2017, there was no history of default of these customers. |
| |
| The balances of trade and notes receivables that were past due but not impaired relate to a number of individual customers for who have good credit record or by whom there were securities have been provided. Based on past experience, the directors of the Company are of the opinion that no provision for impairment is necessary in respect of these balances as there has not been a significant change in credit quality and the balances are still considered recoverable within 12 months as at December 31, 2016 and 2017. |
| |
| Included in the Group’s trade and notes receivables are amounts due from the Group’s joint ventures and associates of RMB591 million (December 31, 2016: RMB38 million) and RMB97 million (December 31, 2016: nil), respectively, which are repayable on credit terms similar to those offered to the major customers of the Group. |
| |
| As at December 31, 2017, the Group had pledged trade receivables amounting to RMB22 million and notes receivable amounting to RMB82 million for bank and other borrowings and to exchange notes receivable (December 31, 2016: trade receivables amounting to RMB36 million and notes receivable amounting to RMB34 million for bank and other borrowings) as set out in note 24 to the financial statements. |
Set out below is the information about the credit risk exposure on the Group’s trade receivables using a provision matrix:
As at December 31, 2018
| | | Gross carrying
amount | | | Expected credit
losses | | | Expected credit
loss rate ( % ) | |
| Alumina and primary aluminum | | | | | | | | | |
| Within 1 year | | | 401,691 | | | | 3,696 | | | | 0.92 | |
| Between 1 and 2 years | | | 55,766 | | | | 6,179 | | | | 11.08 | |
| Between 2 and 3 years | | | 16,546 | | | | 14,893 | | | | 90.01 | |
| Over 3 years | | | 379,213 | | | | 359,759 | | | | 94.87 | |
| | | | 853,216 | | | | 384,527 | | | | / | |
| Trading | | | | | | | | | | | | |
| Within 1 year | | | 473,153 | | | | 662 | | | | 0.14 | |
| Between 1 and 2 years | | | 4,146 | | | | 70 | | | | 1.69 | |
| Between 2 and 3 years | | | 74 | | | | 3 | | | | 4.05 | |
| Over 3 years | | | 19,422 | | | | 3,787 | | | | 19.50 | |
| | | | 496,795 | | | | 4,522 | | | | / | |
| Energy | | | | | | | | | | | | |
| Within 1 year | | | 88,462 | | | | 3,388 | | | | 3.83 | |
| Between 1 and 2 years | | | 3,217 | | | | 685 | | | | 21.29 | |
| Between 2 and 3 years | | | 15,417 | | | | 3,688 | | | | 23.92 | |
| Over 3 years | | | 12,710 | | | | 6,216 | | | | 48.91 | |
| | | | 119,806 | | | | 13,977 | | | | / | |
| Corporate and other operating segments |
| Within 1 year | | | 108,627 | | | | 6,539 | | | | 6.02 | |
| Between 1 and 2 years | | | 10,974 | | | | 7,767 | | | | 70.78 | |
| Between 2 and 3 years | | | 4,026 | | | | 3,823 | | | | 94.96 | |
| Over 3 years | | | 25,800 | | | | 25,142 | | | | 97.45 | |
| | | | 149,427 | | | | 43,271 | | | | / | |
| | | | | | | | | | | | | |
| Individually assessed trade receivables | | | 4,246,067 | | | | 212,964 | | | | | |
| | | | | | | | | | | | | |
| | | | 5,865,311 | | | | 659,261 | | | | | |
ALUMINUM CORPORATION OF CHINA LIMITED AND ITS SUBSIDIARIES
NOTES TO THE CONSOLIDATED FINANCIAL STATEMENTS(Continued)
For the years ended December 31, 2015, 2016, 2017 and 20172018
(Amounts expressed in thousands of RMB unless otherwise stated)
| 14. | TRADE AND NOTES RECEIVABLES(Continued) |
Impairment under IAS 39 for the year ended December 31, 2017
The ageing analysis of the trade receivables as at December 31, 2017 that were not individually nor collectively considered to be impaired under IAS 39 is as follows:
| | December 31, 2017 | |
| | | |
| Past due for 1 year | | | 470,008 | |
| Past due for 1 to 2 years | | | 298,008 | |
| Past due for over 2 years | | | 781,832 | |
| | | 1,549,848 | |
| | | | |
| Not past due | | | 2,384,268 | |
| | | | |
| | As at December 31, 2017, trade and notes receivables of RMB834 million (December 31, 2016: RMB660 million) of the Group were impaired and provisions of RMB482 million (December 31, 2016: RMB463 million) were made. The individually impaired receivables mainly relate to customers which are in unexpected difficult economic situations and it was expected that only a portion of these receivables would be recovered. The ageing analysis of these trade receivables is as follows: | | 3,934,116 | |
The credit quality of trade and notes receivables that are neither past due nor impaired was assessed by reference to the counterparties’ default history.
| | | | December 31,
2016 | | | | December 31,
2017 | |
| | | | | | | | | |
| Within 1 year | | | 77,170 | | | | 182,801 | |
| Between 1 and 2 years | | | 34,269 | | | | 46,305 | |
| Between 2 and 3 years | | | 27,453 | | | | 40,091 | |
| Over 3 years | | | 521,572 | | | | 564,457 | |
| | | | 660,464 | | | | 833,654 | |
| | | | | | | | | |
| Provision for impairment | | | (462,571 | ) | | | (482,020 | ) |
| | | | | | | | | |
| | | | 197,893 | | | | 351,634 | |
As at December 31, 2017, trade and notes receivables of RMB898 million of the Group were impaired and provisions of RMB546 million were made. The individually impaired receivables mainly relate to customers which are in unexpected difficult economic situations and it was expected that only a portion of these receivables would be recovered. The ageing analysis of these trade receivables is as follows:
| | Movements in the provision for impairment of trade and notes receivables are as follows: | December 31, 2017 | |
| | | | 2016 | | | | 2017 | |
| | | | | | | | | |
| As at January 1, | | | 510,336 | | | | 462,571 | |
| Provision for impairment | | | 5,862 | | | | 29,663 | |
| Written off | | | (192 | ) | | | (15,341 | ) |
| Reversal | | | (53,435 | ) | | | (6,395 | ) |
| Others | | | — | | | | 11,522 | |
| | | | | | | | | |
| As at December 31, | | | 462,571 | | | | 482,020 | |
| | As at December 31, 2017, the Group derecognized notes receivable not yet due with a carrying amount in aggregate of RMB24,474 million (December 31, 2016: RMB11,456 million). In addition, as at December 31, 2017, the Group has not derecognized notes receivable not yet due with a carrying amount of RMB227 million (December 31, 2016: RMB479 million). | | |
| Within 1 year | | | 182,801 | |
| Between 1 and 2 years | | | 46,351 | |
| Between 2 and 3 years | | | 40,325 | |
| Over 3 years | | | 628,584 | |
| | | 898,061 | |
| | | | |
| Loss allowance for impairment | | | (546,102 | ) |
| | | | |
| | | 351,959 | |
ALUMINUM CORPORATION OF CHINA LIMITED AND ITS SUBSIDIARIES
NOTES TO THE CONSOLIDATED FINANCIAL STATEMENTS(Continued)
For the years ended December 31, 2015, 2016, 2017 and 20172018
(Amounts expressed in thousands of RMB unless otherwise stated)
| 14. | TRADE AND NOTES RECEIVABLES(Continued) |
| |
| The derecognized notes receivable had a maturity of one to six months at the end of the reporting period. In accordance with the Law of Negotiable Instruments in the PRC, the holders of the derecognized notes receivable have a right of recourse against the Group if the PRC banks default (the “Continuing Involvement”). In the opinion of the directors, the Group has transferred substantially all risks and rewards relating to the derecognized notes receivable. Accordingly, it has derecognized the full carrying amounts of the derecognized notes receivable and the associated trade payables. The maximum exposure to loss from the Group's Continuing Involvement in the derecognized notes receivable and the undiscounted cash flows to repurchase these derecognized notes receivable is equal to their carrying amounts. In the opinion of the directors, the fair values of the Group’s Continuing Involvement in the derecognized notes receivable are not significant. |
| |
| During the year ended December 31, 2017, the Group has not recognized any gain or loss on the date of transfer of the derecognized notes receivable. (2015: nil, 2016: nil). No gains or losses were recognized from the Continuing Involvement, both during the year or cumulatively. The endorsement has been made evenly throughout the year. |
Movements in the loss allowance for impairment of trade and notes receivables are as follows:
| | | 2017 | | | 2018 | |
| | | | | | | |
| As at January 1 | | | 507,593 | | | | 546,102 | |
| Effect of adoption of IFRS 9 | | | — | | | | 112,407 | |
| At beginning of year | | | 507,593 | | | | 658,509 | |
| | | | | | | | | |
| Impairment loss | | | 47,953 | | | | 64,544 | |
| Written off | | | (15,341 | ) | | | (33,469 | ) |
| Reversal | | | (7,206 | ) | | | (20,466 | ) |
| Others | | | 13,103 | | | | (9,857 | ) |
| | | | | | | | | |
| As at December 31 | | | 546,102 | | | | 659,261 | |
As at December 31, 2018, the Group has derecognized notes receivable that have been discounted or endorsed but not yet due carrying amount in aggregate of RMB29,273 million (December 31, 2017: RMB24,474 million). In addition, as at December 31, 2018, the Group has not derecognized notes receivable that have been discounted or endorsed but not yet due with a carrying amount of RMB444 million (December 31, 2017: RMB227 million).
The derecognized notes receivable had a maturity of one to six months at the end of the reporting period. In accordance with the Law of Negotiable Instruments in the PRC, the holders of the derecognized notes receivable have a right of recourse against the Group if the PRC banks default (the “Continuing Involvement”). In the opinion of the directors, the Group has transferred substantially all risks and rewards relating to the derecognized notes receivable. Accordingly, it has derecognized the full carrying amounts of the derecognized notes receivable and the associated trade payables. The maximum exposure to loss from the Group’s Continuing Involvement in the derecognized notes receivable and the undiscounted cash flows to repurchase these derecognized notes receivable is equal to their carrying amounts. In the opinion of the directors, the fair values of the Group’s Continuing Involvement in the derecognized notes receivable are not significant.
During the year ended December 31, 2018, the Group has not recognized any gain or loss on the date of transfer of the derecognized notes receivable. No gains or losses were recognized from the Continuing Involvement, both during the year or cumulatively. The endorsement has been made evenly throughout the year.
ALUMINUM CORPORATION OF CHINA LIMITED AND ITS SUBSIDIARIES
NOTES TO THE CONSOLIDATED FINANCIAL STATEMENTS(Continued)
For the years ended December 31, 2015, 2016, 2017 and 20172018
(Amounts expressed in thousands of RMB unless otherwise stated)
15. | 15. | OTHER CURRENT ASSETS |
| | | | December 31,
2016 | | | | December 31,
2017 | |
| | | | | | | | | |
| Financial assets | | | | | | | | |
| - Deposits paid to suppliers | | | 714,263 | | | | 756,748 | |
| - Dividends receivable | | | 148,546 | | | | 267,331 | |
| - Receivables from disposal of businesses and assets | | | 5,080,791 | | | | 575,650 | |
| - Entrusted loans and loans receivable from third parties | | | 1,631,624 | | | | 1,615,429 | |
| - Entrusted loans and loans receivable from related parties | | | 1,859,769 | | | | 2,459,883 | |
| - Receivable from disposal of Shanxi Huaxing | | | 1,646,035 | | | | — | |
| - Receivables from disposal of Guizhou Branch’s aluminum properties | | | 200,000 | | | | 1,320,488 | |
| - Interest receivable | | | 111,625 | | | | 144,473 | |
| - Recoverable reimbursement for freight charges | | | 37,069 | | | | 13,944 | |
| - Other financial assets | | | 899,946 | | | | 1,006,189 | |
| | | | 12,329,668 | | | | 8,160,135 | |
| | | | | | | | | |
| Less: provision for impairment | | | (1,666,182 | ) | | | (1,673,046 | ) |
| | | | 10,663,486 | | | | 6,487,089 | |
| | | | | | | | | |
| Receivable of value-added tax refund | | | 3,492 | | | | 1,063 | |
| Advances to employees | | | 31,869 | | | | 46,890 | |
| Deductible input value added tax receivables | | | 1,537,245 | | | | 2,408,504 | |
| Prepaid income tax | | | 104,213 | | | | 64,557 | |
| Prepayments to related parties for purchases | | | 118,777 | | | | 61,150 | |
| Prepayments to suppliers for purchases and others | | | 2,626,002 | | | | 885,433 | |
| Others | | | 168,714 | | | | 113,145 | |
| | | | 4,590,312 | | | | 3,580,742 | |
| | | | | | | | | |
| Less: provision for impairment | | | (6,053 | ) | | | (4,155 | ) |
| | | | 4,584,259 | | | | 3,576,587 | |
| | | | | | | | | |
| Total other current assets | | | 15,247,745 | | | | 10,063,676 | |
| | | December 31, 2017 | | | December 31,
2018 | |
| | | | | | | |
| Financial assets | | | | | | | | |
| - Deposits paid to suppliers | | | 756,748 | | | | 317,946 | |
| - Dividends receivable | | | 267,331 | | | | 47,167 | |
| - Receivables from other revenue | | | 575,650 | | | | 693,039 | |
| - Entrusted loans and loans receivable from third parties | | | 1,615,429 | | | | 1,645,205 | |
| - Entrusted loans and loans receivable from related parties | | | 2,459,883 | | | | 1,297,892 | |
| - Receivables from disposal of Guizhou Branch’s aluminum properties | | | 1,320,488 | | | | 1,881,513 | |
| - Interest receivables | | | 144,473 | | | | 40,936 | |
| - Recoverable reimbursement for freight charges | | | 13,944 | | | | 185,866 | |
| - Other financial assets | | | 1,006,723 | | | | 530,029 | |
| | | | 8,160,669 | | | | 6,639,593 | |
| | | | | | | | | |
| Less: provision for impairment | | | (1,673,122 | ) | | | (1,764,068 | ) |
| | | | 6,487,547 | | | | 4,875,525 | |
| | | | | | | | | |
| Receivable of governments grants | | | — | | | | 58,455 | |
| Receivable of value-added tax refund | | | 1,063 | | | | — | |
| Advances to employees | | | 46,890 | | | | 23,744 | |
| Deductible input value added tax receivables | | | 2,411,495 | | | | 2,187,202 | |
| Prepaid income tax | | | 64,557 | | | | 162,103 | |
| Prepayments to related parties for purchases | | | 62,724 | | | | 586,312 | |
| Prepayments to suppliers for purchases and others | | | 890,958 | | | | 963,870 | |
| Others | | | 113,146 | | | | 169,881 | |
| | | | 3,590,833 | | | | 4,151,567 | |
| | | | | | | | | |
| Less: provision for impairment | | | (4,155 | ) | | | (4,139 | ) |
| | | | 3,586,678 | | | | 4,147,428 | |
| | | | | | | | | |
| Total other current assets | | | 10,074,225 | | | | 9,022,953 | |
ALUMINUM CORPORATION OF CHINA LIMITED AND ITS SUBSIDIARIES
NOTES TO THE CONSOLIDATED FINANCIAL STATEMENTS(Continued)
For the years ended December 31, 2015, 2016, 2017 and 2018
(Amounts expressed in thousands of RMB unless otherwise stated)
| 15. | OTHER CURRENT ASSETS(Continued) |
As at December 31, 2018, except for an amount included in other receivables amounting to RMB48 million and RMB0.10 million, which were denominated in USD and HKD, respectively (December 31, 2017: other receivables amounting to RMB161 million denominated in USD), amounts in other current assets were denominated in RMB.
As at December 31, 2018, except for entrusted loans and loans receivable (December 31, 2017: except for entrusted loans and loans receivable) which were interest-bearing assets, all amounts in other current assets were non-interest-bearing (December 31, 2017: all non-interest-bearing).
As at December 31, 2018, the ageing analysis of financial assets included in other current assets was as follows:
| | | December 31, 2017 | | | December 31, 2018 | |
| | | | | | | |
| Within 1 year | | | 2,582,172 | | | | 1,114,811 | |
| Between 1 and 2 years | | | 1,016,290 | | | | 1,653,822 | |
| Between 2 and 3 years | | | 1,689,050 | | | | 449,003 | |
| Over 3 years | | | 2,873,157 | | | | 3,421,957 | |
| | | | 8,160,669 | | | | 6,639,593 | |
| Less: provision for impairment | | | (1,673,122 | ) | | | (1,764,068 | ) |
| | | | | | | | | |
| | | | 6,487,547 | | | | 4,875,525 | |
Movements in the provision for impairment of other current assets are as follows:
| | | 2017 | | | 2018 | |
| | | | | | | |
| As at January 1 | | | 1,672,316 | | | | 1,677,277 | |
| Effect of adoption of IFRS 9 | | | — | | | | 38,502 | |
| At beginning of year | | | 1,672,316 | | | | 1,715,779 | |
| | | | | | | | | |
| Impairment loss | | | 29,483 | | | | 65,494 | |
| Write off | | | (10,926 | ) | | | (6,117 | ) |
| Reversal | | | (9,531 | ) | | | (1,731 | ) |
| Others | | | (4,065 | ) | | | (5,218 | ) |
| | | | | | | | | |
| As at December 31 | | | 1,677,277 | | | | 1,768,207 | |
ALUMINUM CORPORATION OF CHINA LIMITED AND ITS SUBSIDIARIES
NOTES TO THE CONSOLIDATED FINANCIAL STATEMENTS(Continued)
For the years ended December 31, 2016, 2017
and 2018
(Amounts expressed in thousands of RMB unless otherwise stated)
| 15. | OTHER CURRENT ASSETS(Continued) (CONTINUED) |
Impairment under IFRS 9 for the year ended December 31, 2018
Financial assets included in other current assets at amortized cost are subject to impairment under the general approach and they are classified within the following stages for measurement of ECLs.
| | | | | | |
| As at December 31, 2018 | | | Gross carrying amount | | | | Expected credit losses | |
| Stage 1 – 12 months expected credit loss | | | 1,098,455 | | | | — | |
| Stage 2 – life time expected credit loss | | | 3,744,612 | | | | 88,974 | |
| Stage 3 – life time expected credit loss with credit-impaired | | | 1,796,526 | | | | 1,675,094 | |
| | | | 6,639,593 | | | | 1,764,068 | |
Impairment under IAS 39 for the year ended December 31, 2017
As at December 31, 2017, the ageing analysis of financial assets that are not impaired and included in other current assets was as follows:
| | December 31, 2017 | |
| | | |
| Past due for 1 year | | | 1,214,515 | |
| Past due for 1 to 2 years | | | 364,953 | |
| Past due for over 2 years | | | 1,073,261 | |
| | | 2,652,729 | |
| | | | |
| Not past due | | | 3,695,813 | |
| | | | |
| | As at December 31, 2017, except for an amount included in other receivables amounting to RMB161 million, which were denominated in USD (December 31, 2016: receivables from disposal of business amounting to RMB2,867 million, other items amounting to RMB161 million, in advances and deposits paid to suppliers amounting to RMB1,686 million), remaining amounts in other current assets were denominated in RMB (December 31, 2016: remaining denominated in RMB). |
| | |
| As at December 31, 2017, except for entrusted loans and loans receivable (December 31, 2016: except for entrusted loans and loans receivable, receivables from disposals of businesses and an amount included in advances and deposits paid to suppliers) which were interest-bearing assets, all amounts in other current assets were non-interest-bearing (December 31, 2016: all non-interest-bearing). |
| 6,348,542 | |
| As at December 31, 2016 and 2017, the ageing analysis of financial assets included in other current assets was as follows: |
| | | | December 31, | | | December 31, | |
| | | | 2016 | | | 2017 | |
| | | | | | | | |
| Within 1 year | | | 1,911,115 | | | 2,581,750 | |
| Between 1 and 2 years | | | 2,496,848 | | | 1,016,284 | |
| Between 2 and 3 years | | | 1,365,830 | | | 1,689,050 | |
| Over 3 years | | | 6,555,875 | | | 2,873,051 | |
| | | | 12,329,668 | | | 8,160,135 | |
| Less: provision for impairment | | | (1,666,182 | ) | | (1,673,046 | ) |
| | | | | | | | |
| | | | 10,663,486 | | | 6,487,089 | |
The credit quality of other current assets that are neither past due nor impaired is assessed by reference to the counterparties’ default history. As at December 31, 2017, there was no history of default of these customers.
| As at December 31, 2016 and 2017, the ageing analysis of past due but not impaired financial assets included in other current assets was as follows: |
The credit quality of other current assets that were not impaired is assessed by reference to the counterparties’ default history. Based on past experience, the directors of the Company are of the opinion that no provision for impairment is necessary in respect of these balances as there has not been a significant change in credit quality and the balances are still considered recoverable.
| | | | December 31, | | | December 31, | |
| | | | 2016 | | | 2017 | |
| | | | | | | | |
| Past due for 1 year | | | 613,140 | | | 1,214,509 | |
| Past due for 1 to 2 years | | | 741,276 | | | 364,953 | |
| Past due for over 2 years | | | 442,437 | | | 1,073,231 | |
| | | | 1,796,853 | | | 2,652,693 | |
| | | | | | | | |
| Not past due | | | 8,609,164 | | | 3,695,391 | |
| | | | | | | | |
| | | | 10,406,017 | | | 6,348,084 | |
Included in the Group’s financial assets that are past due but not impaired are amounts due from the Group’s related parties of RMB1,545 million on December 31, 2017.
| The credit quality of other current assets that are neither past due nor impaired is assessed by reference to the counterparties’ default history. As at December 31, 2016 and 2017, there was no history of default of these customers. |
ALUMINUM CORPORATION OF CHINA LIMITED AND ITS SUBSIDIARIES
NOTES TO THE CONSOLIDATED FINANCIAL STATEMENTS(Continued)
For the years ended December 31, 2015, 2016, 2017 and 2017
2018
(Amounts expressed in thousands of RMB unless otherwise stated)
15. | OTHER CURRENT ASSETS(Continued) |
| |
| The credit quality of other current assets that were not impaired is assessed by reference to the counterparties’ default history. Based on past experience, the directors of the Company are of the opinion that no provision for impairment is necessary in respect of these balances as there has not been a significant change in credit quality and the balances are still considered recoverable. |
| |
| Included in the Group’s past due but not impaired financial assets are amounts due from the Group’s related parties of RMB1,545 million (December 31, 2016: RMB1,279 million). |
| |
| As at December 31, 2017, other current assets of RMB1,817 million (December 31, 2016: RMB1,906 million) of the Group were impaired and provisions of RMB1,677 million (December 31, 2016: RMB1,672 million) were made. The ageing analysis of these current assets is as follows: |
| | | | December 31, | | | December 31, | |
| | | | 2016 | | | 2017 | |
| | | | | | | | |
| Within 1 year | | | 28,375 | | | 7,305 | |
| Between 1 and 2 years | | | 38,234 | | | 1,775 | |
| Between 2 and 3 years | | | 215,169 | | | 28,313 | |
| Over 3 years | | | 1,624,207 | | | 1,779,306 | |
| | | | 1,905,985 | | | 1,816,699 | |
| | | | | | | | |
| Less: provision for impairment | | | (1,672,235 | ) | | (1,677,201 | ) |
| | | | | | | | |
| | | | 233,750 | | | 139,498 | |
| Movements in the provision for impairment of other current assets are as follows: |
| | | | 2016 | | | 2017 | |
| | | | | | | | |
| As at January 1, | | | 1,679,137 | | | 1,672,235 | |
| Provision for impairment | | | 3,864 | | | 29,483 | |
| Write off | | | (7,807 | ) | | (10,921 | ) |
| Reversal | | | (2,959 | ) | | (9,531 | ) |
| Others | | | — | | | (4,065 | ) |
| | | | | | | | |
| As at December 31, | | | 1,672,235 | | | 1,677,201 | |
ALUMINUM CORPORATION OF CHINA LIMITED AND ITS SUBSIDIARIES
NOTES TO THE CONSOLIDATED FINANCIAL STATEMENTS(Continued)
For the years ended December 31, 2015, 2016 and 2017
(Amounts expressed in thousands of RMB unless otherwise stated)
| 16. | CASH AND CASH EQUIVALENTS AND RESTRICTED CASH AND TIME DEPOSITS |
| | | | December 31, | | | December 31, | |
| | | | 2016 | | | 2017 | |
| | | | | | | | |
| Restricted cash | | | 2,014,747 | | | 2,152,492 | |
| Time deposits | | | 72,700 | | | — | |
| | | | | | | | |
| Restricted cash and time deposits | | | 2,087,447 | | | 2,152,492 | |
| Cash and cash equivalents | | | 23,813,736 | | | 27,750,686 | |
| | | | | | | | |
| | | | 25,901,183 | | | 29,903,178 | |
| | | December 31, 2017 | | | December 31, 2018 | |
| | | | | | | |
| Restricted cash | | | 2,168,192 | | | | 2,165,288 | |
| | | | | | | | | |
| Cash and cash equivalents | | | 27,835,866 | | | | 19,130,652 | |
| | | | | | | | | |
| | | | 30,004,058 | | | | 21,295,940 | |
| Restricted cash mainly represented deposits held for use in issued notes payable and letters of credit. |
| |
| As at December 31, 2016 and 2017, bank balances and cash on hand of the Group were denominated in the following currencies: |
Restricted cash mainly represented deposits held for use in issued notes payable and letters of credit.
| | | | December 31, | | | December 31, | |
| | | | 2016 | | | 2017 | |
| | | | | | | | |
| RMB | | | 20,548,620 | | | 26,848,177 | |
| USD | | | 5,343,559 | | | 3,045,228 | |
| HKD | | | 6,252 | | | 7,029 | |
| EUR | | | 24 | | | 56 | |
| AUD | | | 2,625 | | | 2,688 | |
| IDR | | | 103 | | | — | |
| | | | | | | | |
| | | | 25,901,183 | | | 29,903,178 | |
As at December 31, 2018, bank balances and cash on hand of the Group were denominated in the following currencies:
| Cash at banks earns interest at floating rates based on daily bank deposit rates. The bank balances, time deposits and restricted cash are deposited with creditworthy banks with no recent history of default. |
| | | December 31, 2017 | | | December 31,
2018 | |
| | | | | | | |
| RMB | | | 26,949,057 | | | | 18,026,082 | |
| USD | | | 3,045,228 | | | | 3,256,625 | |
| HKD | | | 7,029 | | | | 8,321 | |
| EUR | | | 56 | | | | 371 | |
| AUD | | | 2,688 | | | | 2,552 | |
| IDR | | | — | | | | 1,989 | |
| | | | | | | | | |
| | | | 30,004,058 | | | | 21,295,940 | |
Cash at banks earns interest at floating rates based on daily bank deposit rates. The bank balances and restricted cash are deposited with creditworthy banks with no recent history of default.
ALUMINUM CORPORATION OF CHINA LIMITED AND ITS SUBSIDIARIES
NOTES TO THE CONSOLIDATED FINANCIAL STATEMENTS(Continued)
For the years ended December 31, 2015, 2016, 2017 and 2017
2018
(Amounts expressed in thousands of RMB unless otherwise stated)
As at December 31, 2017 and 2018, all issued shares were registered and fully paid. Both A shares and H shares rank pari passu with each other.
| | | | Number of shares in issue | | | Share | | | Share | |
| | | | (Note (a)) | | | capital | | | premium | |
| | | | A shares | | | H shares | | | | | | | |
| At January 1, 2016 | | | 10,959,832 | | | 3,943,966 | | | 14,903,798 | | | 20,747,839 | |
| Business combination under common control | | | — | | | — | | | — | | | (3,010,627 | ) |
| Capital injection from non-controlling shareholders | | | — | | | — | | | — | | | 176,615 | |
| At December 31, 2016 and January 1, 2017 | | | 10,959,832 | | | 3,943,966 | | | 14,903,798 | | | 17,913,827 | |
| | | | | | | | | | | | | | |
| Business combinations under common control(Note (b)) | | | — | | | — | | | — | | | (242,564 | ) |
| Capital injection from non-controlling shareholders(Note (c)) | | | — | | | — | | | — | | | 1,887,824 | |
| Acquisition of non-controlling interests (note 35 (a) (xxvi))(Note (d)) | | | — | | | — | | | — | | | (980,725 | ) |
| Disposal of equity interest in subsidiaries without loss of control(Note (e)) | | | — | | | — | | | — | | | 38,189 | |
| | | | | | | | | | | | | | |
| At December 31, 2017 | | | 10,959,832 | | | 3,943,966 | | | 14,903,798 | | | 18,616,551 | |
The number of the Company’s authorised ordinary shares was 14,903,798,236 at par value of RMB1.00 per share as at December 31, 2017 and 2018. There were 14,903,798,236 ordinary shares issued and outstanding as at December 31, 2017 and 2018, respectively.
The amounts of the Group’s reserves and the movements therein for the current and prior years are presented in the consolidated statement of changes in equity of the financial statements.
| (a) | |
| (a) | As at December 31, 2016 and 2017, all issued shares were registered and fully paid. Both A shares and H shares rank pari passu with each other. |
| | |
| | The number of the Company’s authorised ordinary shares was 14,903,798,236 at par value of RMB1.00 per share as at December 31, 2016 and 2017. There were 14,903,798,236 ordinary shares issued and outstanding as at December 31, 2016 and 2017, respectively. |
| | |
| (b) | As disclosed in note 38(g)38(l) , note 38(m), note 38(n) and note 38(h)38(o), the acquisitions of 100%the carbon business of Shandong Aluminum Co., Ltd. (“Shandong Aluminum”) (山東鋁業有限公司), the carbon business of Pingguo Aluminum Co., Ltd. (“Pingguo Aluminum”) (平果鋁業有限公司), a 77.65% equity interest of Chinalco Qingdao Light MetalRed Cliff Carbon Co., Ltd. (“Qingdao Light Metal”Red Cliff Carbon”) (中鋁青島輕金屬(赤壁長城碳素有限公司) and Sewage Treatment Planta 51% equity interest of Chalco Shanxi AluminumHarbin Bingdong Light Logistics Co., Ltd. (“Shanxi Aluminum Sewage Treatment Plant”East Light Logistics”) (山西鋁廠汙水處理站(哈爾滨東輕龍華物流有限公司) were considered to be business combinations under common control, which resulted toin the decrease of share premium amountedamounting to RMB162RMB444 million and RMB50 million, respectively. |
| | |
| | In November 2017, the Group and Chinalco adjusted the consideration of acquisition of Xinghua Technology, which was considered to be a business combination under common control in 2016. The adjustment of consideration was agreed by both parties within the measurement period. Accordingly, share premium was reduced by RMB31 million.total. |
ALUMINUM CORPORATION OF CHINA LIMITED AND ITS SUBSIDIARIES
NOTES TO THE CONSOLIDATED FINANCIAL STATEMENTS(Continued)
For the years ended December 31, 2015, 2016 and 2017
(Amounts expressed in thousands of RMB unless otherwise stated)
17. | SHARE CAPITAL(Continued) |
| (b) | |
| Note: (Continued) |
| | |
| (c) | In December 2017,On January 31, 2018, the Company entered into “Investment Agreements” and “Debt to Equity Swap Agreements” with eight investors, (the “Investors”), including Huarong Ruitong Equity Investment Management Co., Ltd. (華融瑞通股權投資管理有限公司), China Life Insurance Co., Ltd. (中國人壽保險股份有限公司), Shenzhen Zhao Ping Aluminum Investment Center (limited partnership) (深圳市招平中鋁投資有限(有(有限合夥))), China Pacific Life Insurance Co., Ltd. (中國太平洋人壽保險股份有限公司), China Cinda Asset Management Co., Ltd. (中國信達資產管理股份有限公司), BOC Financial Asset Investment Co, Ltd. (中銀金融資產投資有限公司), ICBC Financial Asset Investment Co., Ltd. (工銀金融資產投資有限公司) and ABC Financial Asset Investment Co., Ltd. (農銀金融資產投資有限公司). The “Investment Agreements” (collectively called “Transferors”) entered into the equity acquisition agreements, pursuant to which, the Company agreed to acquire and the “Debt to Equity Swap Agreements” were approved by the second extraordinary general meeting of shareholders of the Company on December 20, 2017. Pursuant to the “Investment Agreements” and the “Debt to Equity Swap Agreements”, the Investors respectivelyTransferors agreed to investsell their non-controlling equity interests in the following subsidiaries of the Company, Chalco Shandong, Zhongzhou Aluminum, Baotou Aluminum and Chalco Mining (“Target(collectively called the “Target Companies”) by cash or debt-to-equity swap amounting to RMB12,600 million in aggregate. The investment did not result in, at a lossconsideration of approximately 2.1 billion shares, which was determined at the fair value of the Company’s control overnon-controlling interests in the subsidiaries. OnTarget Companies of approximately RMB12.7 billion. Upon signing the equity acquisition agreements, together with the investment agreements and debt to equity swap agreements signed in 2017, the Transferors effectively surrendered their non-controlling interests in the Target Companies, which included the rights to profit or loss, voting rights and other shareholder rights of the Target Companies to the Group. Consequently the carrying values of the Transferors’ non-controlling interests in the Target Companies of RMB10.7 billion were derecognized, and were transferred to the capital injection date, the carrying amountreserve of the net assets of Target Companies attributed to the Investors was RMB10,736 million, therefore, the difference amounting to RMB1,864 million was recorded in share premium. |
| | |
| | In July 2017, Jiaozuo Wanfang Aluminum Co., Ltd.* (“Jiaozuo Wanfang” ) (焦作萬方鋁業股份有限公司) made a capital contribution to Chinalco Xinjiang Aluminum Power Co., Ltd.* (“Xinjiang Aluminum”) (中鋁新疆鋁電有限公司) of RMB27 million. After the capital contribution, the carrying amount of the net assets of Xinjiang Aluminum attributed to Jiaozuo Wanfang was RMB4 million and the difference amounting to RMB23 million was recorded in share premium. |
| | |
| (d) | In August 2017, the Company entered into a reorganisation agreement with Shanxi Zhangze Electric Power Co., Ltd.* (“Zhangze Electric Power”) (山西漳澤電力股份有限公司), pursuant to which the Company made a capital contribution into Shanxi Huaze Aluminum and Power Co., Ltd. (“Shanxi Huaze”) by injecting the net assets of Shanxi branch of the Company with the appraisal value amounting to RMB3,426 million and Shanxi Huaze was renamed as Chalco Shanxi New Material Co., Ltd.* (“Shanxi New Material”) (中鋁山西新材料有限公司). After the capital contribution, the Company’s equity interest in Shanxi New Material increased from 60.00% to 85.98%. Zhangze Electric Power’s non- controlling equity interests in Shanxi New Material was reduced to 14.02%, resulting in a decrease in non-controlling interests and an increase in share premium amounting to RMB45 million, respectively.Group. |
On February 25, 2019, the Company has completed the issuance of ordinary shares to these Transferors, and the total number of shares issued was 2,118,874,715.
ALUMINUM CORPORATION OF CHINA LIMITED AND ITS SUBSIDIARIES
NOTES TO THE CONSOLIDATED FINANCIAL STATEMENTS(Continued)
For the years ended December 31, 2015, 2016, 2017 and 2017
2018
(Amounts expressed in thousands of RMB unless otherwise stated)
| 17.19. | SHARE CAPITAL(Continued)INTEREST-BEARING LOANS AND BORROWINGS |
| |
| Note: (Continued) |
| | |
| (e) | In September 2017, Beijing Shijingshan People's Court accepted the liquidation petition filed by the Group’s subsidiary, Beijing Yike Energy Technology Co., Ltd. (“Beijing Yike”) (北京意科能源技术有限公司). Upon the liquidation administrators took control over Beijing Yike, and therefore, the directors of the Company considered the Group lost control over Beijing Yike and deconsolidated Beijing Yike since then. |
| | |
| | Beijing Yike held 29.06% equity interest of Ningxia Yike Solar Energy Power Co., Ltd. (寧夏意科太陽能發電有限公司), and the Group directly held other 70.94% equity interests. After the liquidation, the 29.06% equity interest was accounted for as a non-controlling interest due to the Group’s loss of control over Beijing Yike. |
| | |
| * | The English names represent the best effort by the management of the Group in translating their Chinese names as they do not have any official English names. |
| | |
18. | RESERVES |
| |
| The amounts of the Group's reserves and the movements therein for the current and prior years are presented in the consolidated statement of shareholders’ equity on pages F10 to F12 of the financial statements. |
| | | December 31,
2017 | | | December 31,
2018 | |
| | | | | | | |
| Long-term loans and borrowings | | | | | | | | |
| | | | | | | | | |
| Finance lease payables (note 20) | | | 5,607,570 | | | | 4,081,270 | |
| | | | | | | | | |
| Bank and other loans(Note (a)) | | | | | | | | |
| — Secured(Note (f)) | | | 14,716,175 | | | | 12,608,727 | |
| — Guaranteed(Note (e)) | | | 3,191,277 | | | | 3,040,400 | |
| — Unsecured | | | 22,597,382 | | | | 30,491,613 | |
| | | | | | | | | |
| | | | 40,504,834 | | | | 46,140,740 | |
| | | | | | | | | |
| Medium-term notes and bonds and long-term bonds and private placement notes(Note (b)) | | | | | | | | |
| — Unsecured | | | 15,696,961 | | | | 10,094,861 | |
| | | | | | | | | |
| Total long-term loans and borrowings | | | 61,809,365 | | | | 60,316,871 | |
| | | | | | | | | |
| Current portion of finance lease payables (note 20) | | | (2,115,644 | ) | | | (2,328,358 | ) |
| | | | | | | | | |
| Current portion of medium-term bonds and long-term bonds | | | (12,492,378 | ) | | | (396,727 | ) |
| | | | | | | | | |
| Current portion of long-term bank and other loans | | | (6,911,640 | ) | | | (3,384,400 | ) |
| | | | | | | | | |
| Non-current portion of long-term loans and borrowings | | | 40,289,703 | | | | 54,207,386 | |
ALUMINUM CORPORATION OF CHINA LIMITED AND ITS SUBSIDIARIES
NOTES TO THE CONSOLIDATED FINANCIAL STATEMENTS(Continued)
For the years ended December 31, 2015, 2016, 2017 and 2018
(Amounts expressed in thousands of RMB unless otherwise stated)
| 19. | INTEREST-BEARING LOANS AND BORROWINGS (CONTINUED) |
| | | December 31,
2017 | | | December 31,
2018 | |
| | | | | | | |
| Short-term loans and borrowings | | | | | | | | |
| Bank and other loans(Note (c)) | | | | | | | | |
| — Secured(Note (f)) | | | 1,362,000 | | | | 1,220,680 | |
| — Guaranteed(Note (e)) | | | 150,000 | | | | 240,000 | |
| — Unsecured | | | 29,529,442 | | | | 37,835,512 | |
| | | | | | | | | |
| | | | 31,041,442 | | | | 39,296,192 | |
| | | | | | | | | |
| Short-term bonds, unsecured(Note (d)) | | | 3,601,573 | | | | 500,000 | |
| Gold leasing arrangements(Note (g)) | | | 6,818,393 | | | | 1,607,905 | |
| Current portion of finance lease payables (note 20) | | | 2,115,644 | | | | 2,328,358 | |
| Current portion of medium-term notes | | | 12,492,378 | | | | 396,727 | |
| Current portion of long-term bank and other loans | | | 6,911,640 | | | | 3,384,400 | |
| | | | | | | | | |
Total short-term borrowings and current portion of long-term loans and borrowings | | | 62,981,070 | | | | 47,513,582 | |
As at December 31, 2018, except for loans and borrowings of the Group amounting to RMB19 million (December 31, 2017: RMB21 million) and RMB3,984 million (December 31, 2017: RMB1,860 million), which were denominated in JPY and USD, respectively, all loans and borrowings were denominated in RMB.
As at December 31, 2018, included in the Group’s interest-bearing loans and borrowings are amounts due to subsidiaries of Chinalco of RMB4,373 million (December 31, 2017: RMB3,330 million are due to subsidiaries of Chinalco and RMB190 million are due to a joint venture), as set out in note 35(b).
ALUMINUM CORPORATION OF CHINA LIMITED AND ITS SUBSIDIARIES
NOTES TO THE CONSOLIDATED FINANCIAL STATEMENTS(Continued)
For the years ended December 31, 2016, 2017
and 2018
(Amounts expressed in thousands of RMB unless otherwise stated)
| 19. | INTEREST-BEARING LOANS AND BORROWINGS (CONTINUED) |
| | | | December 31, | | | December 31, | |
| | | | 2016 | | | 2017 | |
| | | | | | | | |
| Long-term loans and borrowings | | | | | | | |
| | | | | | | | |
| Finance lease payables (note 20) | | | 6,692,302 | | | 5,607,570 | |
| | | | | | | | |
| Bank and other loans(Note (a)) | | | | | | | |
| — Secured(Note (f)) | | | 13,415,140 | | | 14,716,175 | |
| — Guaranteed(Note (e)) | | | 2,088,327 | | | 3,191,277 | |
| — Unsecured | | | 16,196,805 | | | 22,575,882 | |
| | | | | | | | |
| | | �� | 31,700,272 | | | 40,483,334 | |
| | | | | | | | |
| Medium-term notes and bonds and long-term bonds and private placement notes(Note (b)) | | | | | | | |
| — Guaranteed(Note (e)) | | | 1,998,833 | | | — | |
| — Unsecured | | | 22,058,281 | | | 15,696,961 | |
| | | | | | | | |
| | | | 24,057,114 | | | 15,696,961 | |
| | | | | | | | |
| Total long-term loans and borrowings | | | 62,449,688 | | | 61,787,865 | |
| | | | | | | | |
| Current portion of finance lease payables (note 20) | | | (2,008,716 | ) | | (2,115,644 | ) |
| | | | | | | | |
| Current portion of medium-term bonds and long-term bonds | | | (8,393,073 | ) | | (12,492,378 | ) |
| | | | | | | | |
| Current portion of long-term bank and other loans | | | (4,725,151 | ) | | (6,890,140 | ) |
| | | | | | | | |
| Non-current portion of long-term loans and borrowings | | | 47,322,748 | | | 40,289,703 | |
ALUMINUM CORPORATION OF CHINA LIMITED AND ITS SUBSIDIARIES
NOTES TO THE CONSOLIDATED FINANCIAL STATEMENTS(Continued)Note:
For the years ended December 31, 2015, 2016 and 2017
(Amounts expressed in thousands of RMB unless otherwise stated)
19. | INTEREST-BEARING LOANS AND BORROWINGS(Continued) |
| | | | December 31, | | | December 31, | |
| | | | 2016 | | | 2017 | |
| | | | | | | | |
| Short-term loans and borrowings | | | | | | | |
| Bank and other loans(Note (c)) | | | | | | | |
| — Secured(Note (f)) | | | 1,846,500 | | | 1,292,000 | |
| — Guaranteed(Note (e)) | | | 305,000 | | | 150,000 | |
| — Unsecured | | | 30,170,325 | | | 29,392,442 | |
| | | | | | | | |
| | | | 32,321,825 | | | 30,834,442 | |
| | | | | | | | |
| Short-term bonds, unsecured(Note (d)) | | | 8,020,015 | | | 3,601,573 | |
| Gold leasing arrangements(Note (g)) | | | 2,990,614 | | | 6,818,393 | |
| Current portion of finance lease payables (note 20) | | | 2,008,716 | | | 2,115,644 | |
| Current portion of medium-term notes | | | 8,393,073 | | | 12,492,378 | |
| Current portion of long-term bank and other loans | | | 4,725,151 | | | 6,890,140 | |
| | | | | | | | |
| Total short-term borrowings and current portion of long-term loans and borrowings | | | 58,459,394 | | | 62,752,570 | |
| As at December 31, 2017, except for loans and borrowings of the Group amounting to RMB21 million (December 31, 2016: RMB23 million) and RMB1,860 million (December 31, 2016: RMB1,572 million) which were denominated in JPY and USD, respectively, all loans and borrowings were denominated in RMB. |
| |
| Included in the Group’s interest-bearing loans and borrowings are amounts due from the Group’s joint ventures and subsidiaries of Chinalco of RMB190 million (December 31, 2016: RMB190 million) and RMB3,330 million (December 31, 2016: RMB6,051 million), respectively, as set out in note 35(b). |
ALUMINUM CORPORATION OF CHINA LIMITED AND ITS SUBSIDIARIES
NOTES TO THE CONSOLIDATED FINANCIAL STATEMENTS(Continued)
For the years ended December 31, 2015, 2016 and 2017
(Amounts expressed in thousands of RMB unless otherwise stated)
19. | INTEREST-BEARING LOANS AND BORROWINGS(Continued) |
| | | |
| Note: |
| | | |
| (a) | Long-term bank and other loans |
| | | |
| | (i) | The maturity of long-term bank and other loans is set out below: |
| | | | Loans from banks and other
financial institutions | | | Other loans | | | Total of long-term bank and other
loans | |
| | | | December 31, 2016 | | | December 31, 2017 | | | December 31, 2016 | | | December 31, 2017 | | | December 31, 2016 | | | December 31, 2017 | |
| Within 1 year | | | 4,718,809 | | | 6,883,500 | | | 6,342 | | | 6,640 | | | 4,725,151 | | | 6,890,140 | |
| Between 1 and 2 years | | | 7,994,380 | | | 5,171,738 | | | 6,342 | | | 2,277 | | | 8,000,722 | | | 5,174,015 | |
| Between 2 and 5 years | | | 10,268,857 | | | 8,666,967 | | | 7,026 | | | 6,827 | | | 10,275,883 | | | 8,673,794 | |
| Over 5 years | | | 8,687,124 | | | 19,736,283 | | | 11,392 | | | 9,102 | | | 8,698,516 | | | 19,745,385 | |
| | | | | | | | | | | | | | | | | | | | |
| | | | 31,669,170 | | | 40,458,488 | | | 31,102 | | | 24,846 | | | 31,700,272 | | | 40,483,334 | |
| | | Loans from banks and other
financial institutions | | | Other loans | | | Total of long-term bank and other
loans | |
| | | December 31,
2017 | | | December 31,
2018 | | | December 31,
2017 | | | December 31, 2018 | | | December 31,
2017 | | | December 31,
2018 | |
| | | | | | | | | | | | | | | | | | | |
| Within 1 year | | | 6,905,000 | | | | 3,382,325 | | | | 6,640 | | | | 2,075 | | | | 6,911,640 | | | | 3,384,400 | |
| Between 1 and 2 years | | | 5,171,738 | | | | 7,375,557 | | | | 2,277 | | | | 2,399 | | | | 5,174,015 | | | | 7,377,956 | |
| Between 2 and 5 years | | | 8,666,967 | | | | 16,586,390 | | | | 6,827 | | | | 7,197 | | | | 8,673,794 | | | | 16,593,587 | |
| Over 5 years | | | 19,736,283 | | | | 18,777,275 | | | | 9,102 | | | | 7,522 | | | | 19,745,385 | | | | 18,784,797 | |
| | | | | | | | | | | | | | | | | | | | | | | | | |
| | | | 40,479,988 | | | | 46,121,547 | | | | 24,846 | | | | 19,193 | | | | 40,504,834 | | | | 46,140,740 | |
| | (ii) | Other loans were provided by local bureaus of the Ministry of Finance to the Group. The weighted average annual interest rate of long-term bank and other loans for the year ended December 31, 20172018 was 5.67% (2016: 5.08%4.78% (2017: 4.97%). |
| | | |
| (b) | Medium-term notes and bonds and long-term bonds and private placement notes |
| | |
| | Outstanding long-term bonds and medium-term notes of the Group as at December 31, 2016 and 2017 are summarized as follows: |
| | | | Face value
/maturity | | | Effective
interest
rate | | | December 31, 2016 | | | December 31, 2017 | |
| 2007 long-term bonds | | | 2,000,000/2017 | | | 4.64% | | | 1,998,833 | | | — | |
| 2015 medium-term notes | | | 3,000,000/2018 | | | 5.53% | | | 2,989,992 | | | 2,999,030 | |
| 2015 medium-term notes | | | 1,500,000/2018 | | | 5.01% | | | 1,492,351 | | | 1,496,503 | |
| 2012 medium-term bonds | | | 3,000,000/2017 | | | 5.77% | | | 2,996,618 | | | — | |
| 2013 medium-term bonds | | | 3,000,000/2018 | | | 5.99% | | | 2,993,272 | | | 2,999,211 | |
| 2014 medium-term bonds | | | 3,000,000/2017 | | | 7.35% | | | 2,997,622 | | | — | |
| 2015 medium-term bonds | | | 3,000,000/2018 | | | 6.11% | | | 2,996,615 | | | 2,999,359 | |
| 2015 medium-term bonds | | | 2,000,000/2018 | | | 6.08% | | | 1,993,474 | | | 1,998,275 | |
| 2016 private placement notes | | | 3,215,000/2019 | | | 5.12% | | | 3,198,337 | | | 3,204,583 | |
| 2012 NingXia medium-term notes | | | 400,000/2017 | | | 6.06% | | | 400,000 | | | — | |
| | | | | | | | | | 24,057,114 | | | 15,696,961 | |
Outstanding medium-term bonds & private placement notes of the Group as at December 31, 2018 are summarised as follows:
| | Long-term bonds and medium-term notes and bonds were issued for capital expenditure purposes, operating cash flows and bank loan re-financing. |
| | | Face value /maturity | | | Effective
interest rate | | | December 31, 2017 | | | December 31,
2018 | |
| | | | | | | | | | | | | |
| 2015 medium-term notes | | | 3,000,000/2018 | | | | 5.53 | % | | | 2,999,030 | | | | — | |
| 2015 medium-term notes | | | 1,500,000/2018 | | | | 5.01 | % | | | 1,496,503 | | | | — | |
| 2013 medium-term bonds | | | 3,000,000/2018 | | | | 5.99 | % | | | 2,999,211 | | | | — | |
| 2015 medium-term bonds | | | 3,000,000/2018 | | | | 6.11 | % | | | 2,999,359 | | | | — | |
| 2015 medium-term bonds | | | 2,000,000/2018 | | | | 6.08 | % | | | 1,998,275 | | | | — | |
| 2016 private placement notes | | | 3,215,000/2019 | | | | 5.12 | % | | | 3,204,583 | | | | 396,727 | |
| 2018 medium-term notes | | | 2,000,000/2021 | | | | 5.84 | % | | | — | | | | 1,986,418 | |
| 2018 medium-term bonds | | | 1,100,000/2021 | | | | 4.66 | % | | | — | | | | 1,097,003 | |
| 2018 medium-term bonds | | | 900,000/2023 | | | | 5.06 | % | | | — | | | | 897,820 | |
| 2018 medium-term bonds | | | 1,400,000/2021 | | | | 4.30 | % | | | — | | | | 1,395,970 | |
| 2018 medium-term bonds | | | 1,600,000/2023 | | | | 4.57 | % | | | — | | | | 1,595,311 | |
| 2018 US dollar medium-term bonds | | | 2,785,840/2021 | | | | 5.25 | % | | | — | | | | 2,725,612 | |
| | | | | | | | | | | | 15,696,961 | | | | 10,094,861 | |
ALUMINUM CORPORATION OF CHINA LIMITED AND ITS SUBSIDIARIES
NOTES TO THE CONSOLIDATED FINANCIAL STATEMENTS(Continued)
For the years ended December 31, 2015, 2016 and 2017
(Amounts expressed in thousands of RMB unless otherwise stated)
19. | INTEREST-BEARING LOANS AND BORROWINGS (Continued) |
| | | |
| Note: (continued) |
| | |
| (c) | Short-term bank and other loans |
| | |
| | Other loans were entrusted loans provided by state-owned companies to the Group. |
| | |
| | The weighted average annual interest rate of short-term bank and other loans for the year ended December 31, 2017 was 4.43% (2016: 4.44%). |
| | |
| (d) | Short-term bonds |
| | |
| | Outstanding short-term bonds as at December 31, 2016 and 2017 are summarized as follows: |
| | | | Face value
/maturity | | | Effective
interest
rate | | | December 31, 2016 | | | December 31, 2017 | |
| 2016 short-term bonds | | | 1,500,000/2017 | | | 4.30% | | | 1,535,140 | | | — | |
| 2016 short-term bonds | | | 3,000,000/2017 | | | 4.13% | | | 3,047,026 | | | — | |
| 2016 short-term bonds | | | 3,000,000/2017 | | | 3.95% | | | 3,037,849 | | | — | |
| 2016 short-term bonds | | | 400,000/2017 | | | 4.13% | | | 400,000 | | | — | |
| 2017 short-term bonds | | | 3,000,000/2018 | | | 4.30% | | | — | | | 3,101,573 | |
| 2017 short-term bonds | | | 500,000/2018 | | | 4.90% | | | — | | | 500,000 | |
| | | | | | | | | | 8,020,015 | | | 3,601,573 | |
| | All the above short-term bonds were issued for working capital needs. |
ALUMINUM CORPORATION OF CHINA LIMITED AND ITS SUBSIDIARIES
NOTES TO THE CONSOLIDATED FINANCIAL STATEMENTS(Continued)
For the years ended December 31, 2015, 2016, 2017 and 20172018
(Amounts expressed in thousands of RMB unless otherwise stated)
| 19. | INTEREST-BEARING LOANS AND BORROWINGS(Continued) (CONTINUED) |
Note: (continued)
| (c) | Short-term bank and other loans |
Other loans were entrusted loans provided by state-owned companies to the Group.
The weighted average annual interest rate of short-term bank and other loans for the year ended December 31, 2018 was 4.52% (2017: 4.43%).
Outstanding short-term bonds as at December 31, 2018 are summarized as follows:
| | | Face value /maturity | | | Effective interest rate | | | December 31, 2017 | | | December 31,
2018 | |
| 2017 short-term bonds | | | 3,000,000/2018 | | | | 4.30 | % | | | 3,101,573 | | | | — | |
| 2017 short-term bonds | | | 500,000/2018 | | | | 4.90 | % | | | 500,000 | | | | — | |
| 2018 Ningxia short-term bonds | | | 500,000/2019 | | | | 5.30 | % | | | — | | | | 500,000 | |
| | | | | | | | | | | | | | | | | |
| | | | | | | | | | | | 3,601,573 | | | | 500,000 | |
All the above short-term bonds were issued for working capital needs.
ALUMINUM CORPORATION OF CHINA LIMITED AND ITS SUBSIDIARIES
NOTES TO THE CONSOLIDATED FINANCIAL STATEMENTS(Continued)
For the years ended December 31, 2016, 2017 and 2018
(Amounts expressed in thousands of RMB unless otherwise stated)
| Note: (continued)19. | INTEREST-BEARING LOANS AND BORROWINGS (CONTINUED) |
Note: (continued)
| | | |
| (e) | Guaranteed interest-bearing loans and borrowings |
| | |
| | Details of the interest-bearing loans and borrowings in which the Group received guarantees are set out as follows: |
| Guarantors | December 31, 2016 | | December 31, 2017 |
| | | | |
| Long-term bonds | | | |
| Bank of Communications (交通銀行股份有限公司) (“BOCOM”) | 1,998,833 | | - |
| | | | |
| Long-term loans | | | |
| Lanzhou Aluminum Factory*(蘭州鋁廠)(Note (i)) | 8,000 | | 4,000 |
| The Company | 866,877 | | - |
| Ningxia Energy(Note (ii)) | 1,099,400 | | 1,020,400 |
| Yinxing Energy (Note (ii)) | 109,000 | | 91,000 |
| Zhongwei Renewable Energy Co., Ltd.* (中衛寧電新能源有限公司)(Note (ii)) | 5,050 | | - |
| Baotou Aluminum Co., Ltd. (包頭鋁業) and Baotou Communications Investment Group Co., Ltd. (包交投資)(Note (iii)) | - | | 1,600,000 |
| The Company and Hangzhou Jinjiang Group Co., Ltd. (杭州錦江)(Note (iv)) | - | | 475,877 |
| | | | |
| | 2,088,327 | | 3,191,277 |
| | | | |
| Short-term loans | | | |
| Ningxia Energy(Note (ii)) | 120,000 | | 70,000 |
| Shandong Aluminum(Note (i)) | 15,000 | | - |
| Chalco Shandong(Note (ii)) | 170,000 | | 80,000 |
| | | | |
| | 305,000 | | 150,000 |
Details of the interest-bearing loans and borrowings in which the Group received guarantees are set out as follows:
| Guarantors | | December 31, 2017 | | | December 31, 2018 | |
| | | | | | | |
| Long-term loans | | | | | | | | |
| Lanzhou Aluminum Factory*(蘭州鋁廠)(Note (i)) | | | 4,000 | | | | — | |
| Ningxia Energy(Note (ii)) | | | 1,020,400 | | | | 892,400 | |
| Yinxing Energy(Note (ii)) | | | 91,000 | | | | 70,000 | |
| Baotou Aluminum Limited Company*(包头铝业有限公司) and Baotou Communications Investment Group Limited Company*(包头交通投资集团有限公司)(Note (iii)) | | | 1,600,000 | | | | 1,600,000 | |
| The Company and Hangzhou Jinjiang(Note (iv)) | | | 475,877 | | | | 246,000 | |
| Qingzhen Industrial Investment Co., Ltd.*(“Qingzhen Investment”) (清鎮市工業投資有限公司)(Note (v)) | | | — | | | | 116,000 | |
| Guizhou Industrial Investment Group Co., Ltd.*(“Guizhou Investment”) (貴州產業投資(集團)有限責任公司)(Note (v)) | | | — | | | | 116,000 | |
| | | | | | | | | |
| | | | 3,191,277 | | | | 3,040,400 | |
| | | | | | | | | |
| Short-term loans | | | | | | | | |
| Ningxia Energy(Note (ii)) | | | 70,000 | | | | — | |
| Chalco Shandong(Note (ii)) | | | 80,000 | | | | — | |
| China Great Wall Aluminum Co., Ltd.*(“China Great Wall Aluminum”)(中國長城鋁業有限公司) (Note(i)) | | | — | | | | 40,000 | |
| Hangzhou Jinjiang, Qingzhen Investment and Guizhou Investment | | | — | | | | 200,000 | |
| | | | | | | | | |
| | | | 150,000 | | | | 240,000 | |
| | | | | | | | | |
Note:
| | Note: |
| | | |
| | (i) | The guarantor is a subsidiary of Chinalco. |
| | | |
| | (ii) | The guarantor is a subsidiary of the Group. |
| | | |
| | (iii) | The guarantors are a subsidiary of the Company and a third party respectively. |
| | | |
| | (iv) | The guarantors are the Company and a third party respectively. |
| (v) | | The guarantor is a third party |
| | * | The English names represent the best effort by management of the Group in translating the Chinese names of the Companies as they do not have any official English names. |
| | | |
| (f) | Secured interest-bearing loans and borrowings |
The assets pledged for bank and other borrowings were set out in note 24 to the financial statements.
ALUMINUM CORPORATION OF CHINA LIMITED AND ITS SUBSIDIARIES
NOTES TO THE CONSOLIDATED FINANCIAL STATEMENTS(Continued)
For the years ended December 31, 2016, 2017 and 2018
(Amounts expressed in thousands of RMB unless otherwise stated)
| 19. | INTEREST-BEARING LOANS AND BORROWINGS (CONTINUED) |
Note: (continued)
| (g) | Gold leasing arrangements |
In 2017 and 2018, the Company entered into several gold leasing master framework agreements, individual gold leasing agreements and general hedging agreements with Bank of Communications and Agriculture Bank of China, (collectively, “the Banks”). According to the gold leasing master framework agreements and gold leasing agreements, the Company leased standard gold with fineness of Au 99.99 for 6 to 12 months from the Banks, with annual interest rates ranging from 4.10% to 4.50%. In 2018, the Company entrusted the Banks to sell all leased gold and received cash of RMB2,323 million from the sale (2017: RMB7,804 million). Upon the expiry of the gold leasing agreements, the Company shall purchase the standard gold (with same quality and value according to the general hedging agreements entered into simultaneously with the leasing agreements) to return to the Banks.
The directors of the Company are of the view that the Company is free from the assumption of risk of gold price fluctuations due to the fixed repurchase price under the general hedging agreements, and therefore, this arrangement should be accounted for as short-term loans with fixed interest rates (ranging from 4.10% to 4.50%), net of the Banks’ charges.
ALUMINUM CORPORATION OF CHINA LIMITED AND ITS SUBSIDIARIES
NOTES TO THE CONSOLIDATED FINANCIAL STATEMENTS(Continued)
For the years ended December 31, 2016, 2017 and 2018
(Amounts expressed in thousands of RMB unless otherwise stated)
| 20. | FINANCE LEASE PAYABLES |
As disclosed in note 6, the Group leased certain machineries and construction in progress under finance leases with lease terms ranging from one to six years. At December 31, 2018, the total future minimum lease payments under finance leases and their present values are as follows:
| | | Minimum lease payments | | | Present value of minimum lease payments | |
| | | December 31, 2017 | | | December 31, 2018 | | | December 31, 2017 | | | December 31, 2018 | |
| | | | | | | | | | | | | |
| Amounts payable: | | | | | | | | | | | | | | | | |
| Within one year | | | 2,371,917 | | | | 2,518,653 | | | | 2,115,644 | | | | 2,328,358 | |
| In the second year | | | 1,762,618 | | | | 1,161,490 | | | | 1,606,571 | | | | 1,075,050 | |
| In the third to fifth years, inclusive | | | 1,890,329 | | | | 707,716 | | | | 1,817,506 | | | | 664,889 | |
| After five years | | | 73,603 | | | | 13,238 | | | | 67,849 | | | | 12,973 | |
| | | | | | | | | | | | | | | | | |
| Total minimum finance lease payments | | | 6,098,467 | | | | 4,401,097 | | | | 5,607,570 | | | | 4,081,270 | |
| | | | | | | | | | | | | | | | | |
| Future finance charges | | | (490,897 | ) | | | (319,827 | ) | | | | | | | | |
| | | | | | | | | | | | | | | | | |
| Total net finance lease payables (note 19) | | | 5,607,570 | | | | 4,081,270 | | | | | | | | | |
| | | | | | | | | | | | | | | | | |
| Portion classified as current liabilities (note 19) | | | (2,115,644 | ) | | | (2,328,358 | ) | | | | | | | | |
| | | | | | | | | | | | | | | | | |
| Non-current portion | | | 3,491,926 | | | | 1,752,912 | | | | | | | | | |
During the year ended December 31, 2018 and 2017, the Group entered into various sale and leaseback agreements with Pingan International Financial Leasing Co., Ltd. (平安國際融資租賃有限公司), Tianjin Far East Hongxin Finance Leasing Co., Ltd. (“遠東宏信(天津)融資租賃有限公司”),China Aviation International Leasing Co., Ltd. (“中航國際租賃有限公司”), Zhaoyin Leasing Co., Ltd.(“招銀租賃有限公司”) and Chalco Financial Leasing Co., Ltd.*(“中鋁融資租賃有限公司”), which is a related party of the Group, respectively, under which the Group sold machineries and construction in progress and leased them back. The lease terms range from one to six years and the lease rentals are payable by installments which bear interest at prevailing lending rates.
During the year ended December 31, 2018, the Group entered into under the sales and leaseback arrangements and incurred losses of RMB254 million (2017: RMB102 million), which were amortized over their respective useful lives of the assets. The Group entered into sales and leaseback arrangements and incurred a gain of RMB115 million (2017: Nil). The internal rate of return (IRR) of the sales and finance leaseback arrangements range from 4.35% to 9.74% (2017: from 4.35% to 6.20%).
| * | The English names represent the best effort made by the management of the Group in translating the Chinese name of the companies as they do not have any official English names. |
ALUMINUM CORPORATION OF CHINA LIMITED AND ITS SUBSIDIARIES
NOTES TO THE CONSOLIDATED FINANCIAL STATEMENTS(Continued)
For the years ended December 31, 2016, 2017 and 2018
(Amounts expressed in thousands of RMB unless otherwise stated)
| 21. | OTHER NON-CURRENT LIABILITIES |
| | | December 31, 2017 | | | December 31, 2018 | |
| | | | | | | |
| Financial liabilities | | | | | | | | |
| - Long-term payables for mining rights | | | 749,761 | | | | 788,133 | |
| - Other financial liabilities | | | 19,300 | | | | 52,926 | |
| | | | 769,061 | | | | 841,059 | |
| | | | | | | | | |
| Obligations in relation to early retirement schemes(Note (i)) | | | 900,924 | | | | 777,305 | |
| Deferred government grants (Note (ii)) | | | 373,447 | | | | 314,045 | |
| Deferred gain relating to sales and leaseback agreements | | | 176,774 | | | | 240,661 | |
| Contract liabilities | | | — | | | | 132,844 | |
| Provision for rehabilitation | | | 113,672 | | | | 121,033 | |
| Others | | | 119,782 | | | | 11,217 | |
| | | | 1,684,599 | | | | 1,597,105 | |
| | | | | | | | | |
| | | | 2,453,660 | | | | 2,438,164 | |
ALUMINUM CORPORATION OF CHINA LIMITED AND ITS SUBSIDIARIES
NOTES TO THE CONSOLIDATED FINANCIAL STATEMENTS(Continued)
For the years ended December 31, 2016, 2017 and 2018
(Amounts expressed in thousands of RMB unless otherwise stated)
| 21. | OTHER NON-CURRENT LIABILITIES (CONTINUED) |
Note:
| (i) | Obligations in relation to early retirement schemes |
From 2014, certain subsidiaries and branches implemented certain early retirement benefit schemes which allow qualified employees to early retire on a voluntary basis. The Group undertakes the obligations to pay the early retired employees’ living expenses for no more than five years in the future on a monthly basis according to the early retirement benefit schemes, together with social insurance and housing fund pursuant to the regulation of the local Social Security Office. Living expenses, social insurance and the housing fund are together referred to as “the Payments”. The Payments are discounted by the treasury bond rate of December 31, 2018. As at December 31, 2018, the current portion of the Payments within one year was reclassified to “Other payables and accrued liabilities”.
As at December 31, 2018, obligations in relation to retirement benefits under the Group’s early retirement schemes are as follows:
| | | 2017 | | | 2018 | |
| | | | | | | |
| As at January 1, | | | 996,598 | | | | 1,438,440 | |
| Provision made during the year (note 29) | | | 767,632 | | | | 447,660 | |
| Interest costs | | | 17,618 | | | | 62,801 | |
| Payment during the year | | | (343,408 | ) | | | (655,060 | ) |
| | | | | | | | | |
| As at December 31, | | | 1,438,440 | | | | 1,293,841 | |
| | | | | | | | | |
| Non-current | | | 900,924 | | | | 777,305 | |
| Current (note 22) | | | 537,516 | | | | 516,536 | |
| | | | | | | | | |
| | | | 1,438,440 | | | | 1,293,841 | |
| (ii) | As described on note 2.2 (d), in order to provide more reliable and more relevant information about the government grants, from January 1, 2018, the Group voluntarily changed the accounting policy in relation to government grants. For an asset-related government grant, had the asset already existed upon receiving the government grant, the Group directly deducted the grant amount from the book value of the asset related to the government grant instead of recording the government grant as deferred income. For a government grants related to income and expenses already incurred by the Group, which are specific to compensate certain cost and expenses, the Group would directly offset the grant amount against the related cost or expense. Other types of government grants are still included in deferred government grants and other income. |
ALUMINUM CORPORATION OF CHINA LIMITED AND ITS SUBSIDIARIES
NOTES TO THE CONSOLIDATED FINANCIAL STATEMENTS(Continued)
For the years ended December 31, 2016, 2017 and 2018
(Amounts expressed in thousands of RMB unless otherwise stated)
| 22. | OTHER PAYABLES AND ACCRUED LIABILITIES |
| | | December 31, 2017 | | | December 31, 2018 | |
| | | | | | | |
| Financial liabilities | | | | | | | | |
| - Payable for capital expenditures | | | 6,283,484 | | | | 5,694,632 | |
| - Accrued interest | | | 827,367 | | | | 396,286 | |
| - Payables withheld as guarantees and deposits | | | 1,494,367 | | | | 1,101,456 | |
| | | | | | | | | |
| - Dividends payable by subsidiaries to non-controlling shareholders | | | 223,942 | | | | 543,207 | |
| - Consideration payable for investment projects | | | 170,494 | | | | 280,856 | |
| - Current portion of payables for mining rights | | | 300,970 | | | | 210,325 | |
| - Others | | | 2,062,612 | | | | 1,025,163 | |
| | | | 11,363,236 | | | | 9,251,925 | |
| | | | | | | | | |
| Sales and other deposits from customers(note 2.2(c)) | | | 1,605,374 | | | | — | |
| Taxes other than income taxes payable(Note) | | | 818,979 | | | | 831,040 | |
| Accrued payroll and bonus | | | 76,683 | | | | 220,851 | |
| Staff welfare payables | | | 262,077 | | | | 391,824 | |
| Current portion of obligations in relation to early retirement schemes(note 21) | | | 537,516 | | | | 516,536 | |
| Contribution payable for pension insurance | | | 27,248 | | | | 30,145 | |
| Output value-added tax on pending | | | — | | | | 252,691 | |
| Others | | | 1,786 | | | | 37,492 | |
| | | | 3,329,663 | | | | 2,280,579 | |
| | | | | | | | | |
| | | | 14,692,899 | | | | 11,532,504 | |
| Note: | Taxes other than income taxes payable mainly comprise accruals for value-added tax, resource tax, city construction tax and education surcharge. |
As at December 31, 2018, except for other payables and accrued liabilities of the Group amounting to RMB240 million and RMB0.27 million, which were denominated in USD and HKD, respectively (December 31, 2017: RMB331 million and RMB0.32 million which were denominated in USD and HKD respectively), all payables and accrued liabilities were denominated in RMB.
ALUMINUM CORPORATION OF CHINA LIMITED AND ITS SUBSIDIARIES
NOTES TO THE CONSOLIDATED FINANCIAL STATEMENTS(Continued)
For the years ended December 31, 2016, 2017 and 2018
(Amounts expressed in thousands of RMB unless otherwise stated)
| 23. | TRADE AND NOTES PAYABLES |
| | | December 31, 2017 | | | December 31, 2018 | |
| | | | | | | |
| Trade payables | | | 7,767,482 | | | | 8,568,438 | |
| Notes payable | | | 4,592,959 | | | | 5,439,162 | |
| | | | | | | | | |
| | | | 12,360,441 | | | | 14,007,600 | |
As at December 31, 2018, except for trade and notes payables of the Group amounting to RMB213 million (December 31, 2017: RMB56 million) which were denominated in USD, all trade and notes payables were denominated in RMB.
The ageing analysis of trade and notes payables is as follows:
| | | December 31, 2017 | | | December 31, 2018 | |
| | | | | | | |
| Within 1 year | | | 11,748,228 | | | | 13,598,040 | |
| Between 1 and 2 years | | | 199,889 | | | | 140,517 | |
| Between 2 and 3 years | | | 200,191 | | | | 47,111 | |
| Over 3 years | | | 212,133 | | | | 221,932 | |
| | | | | | | | | |
| | | | 12,360,441 | | | | 14,007,600 | |
The trade and notes payables are non-interest-bearing and are normally settled within one year.
ALUMINUM CORPORATION OF CHINA LIMITED AND ITS SUBSIDIARIES
NOTES TO THE CONSOLIDATED FINANCIAL STATEMENTS(Continued)
For the years ended December 31, 2016, 2017 and 2018
(Amounts expressed in thousands of RMB unless otherwise stated)
The Group has pledged various assets as collateral against certain secured borrowings as set out in note 19. As at December 31, 2018, a summary of these pledged assets was as follows:
| | | December 31, 2017 | | | December 31, 2018 | |
| | | | | | | |
| Property, plant and equipment (note 6) | | | 5,799,013 | | | | 4,168,239 | |
| Land use rights (note 8) | | | 176,914 | | | | 328,116 | |
| Intangible assets (note 5) | | | 1,111,705 | | | | 772,597 | |
| Notes receivable (note 14) | | | 82,125 | | | | 933,551 | |
| Trade receivables (note 14) | | | 22,000 | | | | — | |
| Investments in associates | | | — | | | | 535,610 | |
| | | | | | | | | |
| | | | 7,191,757 | | | | 6,738,113 | |
As at December 31, 2018, in addition to the loans and borrowings which were secured by the above assets, the current portion of long-term loans and borrowings amounting to RMB1,354 million and the non-current portion of long-term loans and borrowings amounting to RMB10,155 million were secured by the contractual right to charge users for electricity generated in the future (December 31, 2017: the current portion of long-term loans and borrowings amounting to RMB1,007 million and the non-current portion of long-term loans and borrowings amounting to RMB12,582 million were secured by the contractual right to charge users for electricity generated in the future and 70.82% equity interests in a subsidiary of the Company, Ningxia Energy).
ALUMINUM CORPORATION OF CHINA LIMITED AND ITS SUBSIDIARIES
NOTES TO THE CONSOLIDATED FINANCIAL STATEMENTS(Continued)
For the years ended December 31, 2016, 2017 and 2018
(Amounts expressed in thousands of RMB unless otherwise stated)
| 25. | PROFIT BEFORE INCOME TAX |
An analysis of profit before income tax is as follows:
| | | 2016 | | | 2017 | | | 2018 | |
| | | | | | | | | | |
| Purchase of inventories in relation to trading activities | | | 79,682,085 | | | | 98,282,714 | | | | 85,443,397 | |
| Raw materials and consumables used, and changes in work-in-progress and finished goods | | | 27,209,597 | | | | 34,550,042 | | | | 43,197,855 | |
| Power and utilities | | | 12,980,854 | | | | 17,274,948 | | | | 17,650,214 | |
| Depreciation and amortization | | | 7,000,677 | | | | 7,064,129 | | | | 8,055,137 | |
| Employee benefit expenses (note 29) | | | 5,899,257 | | | | 6,975,281 | | | | 7,433,027 | |
| Repairs and maintenance | | | 1,354,394 | | | | 1,716,940 | | | | 1,750,194 | |
| Transportation expenses | | | 1,532,920 | | | | 1,768,604 | | | | 1,893,659 | |
| Logistic cost | | | 796,231 | | | | 1,894,061 | | | | 2,794,733 | |
| Taxes other than income tax expense(Note (i)) | | | 690,718 | | | | 858,344 | | | | 936,546 | |
| Rental expenses for land use rights and buildings | | | 511,189 | | | | 497,356 | | | | 649,640 | |
| Packaging expenses | | | 236,465 | | | | 267,547 | | | | 261,626 | |
| Research and development expenses | | | 168,862 | | | | 498,234 | | | | 626,873 | |
| Auditors’ remuneration expense(Note (ii)) | | | 26,006 | | | | 31,815 | | | | 30,847 | |
| | | |
| Note: | The assets pledged for bank and other borrowings were set out in note 24 to the financial statements. |
| (i) | Taxes other than income tax expense mainly comprise surcharges, land use tax, property tax and stamp duties. |
| (ii) | During the year ended December 31, 2018, auditors’ remuneration included audit and non-audit services provided by Ernst & Young, including Ernst & Young, Hong Kong and Ernst & Young Hua Ming LLP, amounting to RMB26.7 million (2016:RMB23.7 million, 2017: RMB23.1 million), and services provided by other auditors. |
ALUMINUM CORPORATION OF CHINA LIMITED AND ITS SUBSIDIARIES
NOTES TO THE CONSOLIDATED FINANCIAL STATEMENTS(Continued)
For the years ended December 31, 2016, 2017 and 2018
(Amounts expressed in thousands of RMB unless otherwise stated)
For the year ended December 31, 2018, government grants amounting to RMB135 million (2016: RMB156 million, 2017: RMB90 million) were recognized as income for the year to facilitate the Group’s development. There are no unfulfilled conditions or contingencies attached to the grants.
| | | 2016 | | | 2017 | | | 2018 | |
| | | | | | | | | | |
| Gain on deemed disposal and disposal of subsidiaries | | | — | | | | 325,022 | | | | 3,517 | |
| Gain on disposal and dividends of available for sales investments/equity investments designated at fair value through other comprehensive income | | | 140,929 | | | | 79,408 | | | | 109,914 | |
| Realized gains/(losses) on futures, forward and option contracts, net(Note) | | | (1,290,267 | ) | | | (23,951 | ) | | | 40,492 | |
| Unrealized gains/(losses) on futures, forward and option contracts, net(Note) | | | 154,585 | | | | (131,073 | ) | | | 100,967 | |
| Gain on disposal of property, plant and equipment and land use rights, net | | | 816,721 | | | | 76,739 | | | | 101,098 | |
| Gain on previously held equity interests remeasured at acquisition-date fair value (note 38(h), 38 (i), 38 (j) and 38 (k)) | | | — | | | | 117,640 | | | | 748,086 | |
| Loss on disposal of investments in an associate | | | 128,833 | | | | — | | | | (1,904 | ) |
| Others | | | 218,342 | | | | (124,403 | ) | | | (180,266 | ) |
| | | | | | | | | | | | | |
| | | | 169,143 | | | | 319,382 | | | | 921,904 | |
Note:None of these futures, forward and option contracts was designated for hedge accounting.
ALUMINUM CORPORATION OF CHINA LIMITED AND ITS SUBSIDIARIES
NOTES TO THE CONSOLIDATED FINANCIAL STATEMENTS(Continued)
For the years ended December 31, 2015, 2016, 2017 and 20172018
(Amounts expressed in thousands of RMB unless otherwise stated)
| 19.28. | INTEREST-BEARING LOANS AND BORROWINGS(Continued)FINANCE INCOME/FINANCE COSTS |
| | | |
| Note: (continued) |
| | | |
| (g) | Gold leasing arrangements |
| | |
| | In 2016 and 2017, the Company entered into several gold leasing master framework agreements, individual gold leasing agreements and general hedging agreements with Bank of Communications, China Everbright Bank and Agriculture Bank of China, collectively, “the Banks”. |
| | |
| | According to the gold leasing master framework agreements and gold leasing agreements, the Company leased standard gold with fineness of Au 99.99 for 6 to 12 months from the Banks, with annual interest rates ranging from 3.65% to 4.15%. Concurrently, the Company entrusted the Banks to sell all the leased gold and received cash of RMB7,804 million from the sale. Upon the expiry of the gold leasing agreements, the Company shall purchase the standard gold (with same quality and value according to the general hedging agreements entered into simultaneously with the leasing agreements) to return to the Banks. |
| | |
| | The directors of the Company are of the view that the Company is free from the assumption of risk of gold price fluctuations due to the fixed repurchase price under the general hedging agreements, and therefore, this arrangement should be accounted for as short-term loans with fixed interest rates (ranging from 3.65% to 4.15%), net of the Banks’ charges. |
An analysis of finance income/finance costs is as follows:
| | | 2016 | | | 2017 | | | 2018 | |
| | | | | | | | | | |
| Finance income - interest income | | | (815,729 | ) | | | (706,690 | ) | | | (492,232 | ) |
| | | | | | | | | | | | | |
| Interest expense | | | 5,169,568 | | | | 5,175,156 | | | | 5,202,639 | |
| Less: interest expense capitalized in property, plant and equipment (note 6) | | | (414,133 | ) | | | (344,452 | ) | | | (517,589 | ) |
| Interest expense, net of capitalized interest | | | 4,755,435 | | | | 4,830,704 | | | | 4,685,050 | |
| Amortization of unrecognized finance expenses | | | 324,701 | | | | 241,099 | | | | 205,335 | |
| Exchange (gain)/loss, net | | | (60,228 | ) | | | 131,621 | | | | (7,889 | ) |
| Finance costs | | | 5,019,908 | | | | 5,203,424 | | | | 4,882,496 | |
| | | | | | | | | | | | | |
| Capitalization rate during the year (note 6) | | | 3.85% to 6.00% | | | | 4.41% to 8.00% | | | | 4.54% to 7.00% | |
| 29. | EMPLOYEE BENEFIT EXPENSES |
An analysis of employee benefit expenses is as follows:
| | | 2016 | | | 2017 | | | 2018 | |
| | | | | | | | | | |
| Salaries and bonus | | | 3,854,571 | | | | 4,205,361 | | | | 4,636,972 | |
| Housing fund | | | 388,017 | | | | 395,489 | | | | 414,440 | |
| Staff welfare and other expenses(Note) | | | 1,495,618 | | | | 1,576,552 | | | | 1,896,365 | |
| Employment expense in relation to early retirement schemes (note 21) | | | 132,044 | | | | 767,632 | | | | 447,660 | |
| Employment expenses in relation to termination benefit | | | 29,007 | | | | 30,247 | | | | 37,590 | |
| | | | | | | | | | | | | |
| | | | 5,899,257 | | | | 6,975,281 | | | | 7,433,027 | |
| Note: | Staff welfare and other expenses include staff welfare, staff union expenses, staff education expenses, unemployment insurance expenses, pension insurance expenses, etc. |
Employee benefit expenses include remuneration payables to directors, supervisors and senior management as set out in note 30.
ALUMINUM CORPORATION OF CHINA LIMITED AND ITS SUBSIDIARIES
NOTES TO THE CONSOLIDATED FINANCIAL STATEMENTS(Continued)
For the years ended December 31, 2015, 2016, 2017 and 2018
(Amounts expressed in thousands of RMB unless otherwise stated)
| 30. | DIRECTORS’ AND SUPERVISORS’ REMUNERATION |
| (a) | Directors’ and supervisors’ remuneration |
Directors' and supervisors’ remuneration for the year, disclosed pursuant to the Listing Rules, section 383(1)(a), (b), (c) and (f) of the Hong Kong Companies Ordinance and Part 2 of the Companies Regulation (Disclosure of Information about Benefits of Directors), is as follows:
| | | 2016 | | | 2017 | | | 2018 | �� |
| | | | | | | | | | |
| Fees | | | 762 | | | | 768 | | | | 756 | |
| Basic salaries, housing fund, other allowances and benefits in kind | | | 975 | | | | 1,370 | | | | 1,849 | |
| Pension cost | | | 114 | | | | 166 | | | | 234 | |
| | | | | | | | | | | | | |
| | | | 1,851 | | | | 2,304 | | | | 2,839 | |
ALUMINUM CORPORATION OF CHINA LIMITED AND ITS SUBSIDIARIES
NOTES TO THE CONSOLIDATED FINANCIAL STATEMENTS(Continued)
For the years ended December 31, 2016, 2017 and 2018
(Amounts expressed in thousands of RMB unless otherwise stated)
| 20.30.
| DIRECTORS’ AND SUPERVISORS’ REMUNERATION (CONTINUED) |
| (a) | FINANCE LEASE PAYABLESDirectors’ and supervisors’ remuneration (continued) |
The remuneration of each director and supervisor of the Company for the year ended December 31, 2016 is set out below:
| Names of directors and supervisors | | Fees | | | Salaries | | | Discretionary
bonuses | | | Pension costs | | | total | |
| | | | | | | | | | | | | | | | |
| Executive Directors: | | | | | | | | | | | | | | | | | | | | |
| Ge Honglin | | | — | | | | — | | | | — | | | | — | | | | — | |
| Ao Hong | | | — | | | | — | | | | — | | | | — | | | | — | |
| Lu Dongliang | | | — | | | | — | | | | — | | | | — | | | | — | |
| Jiang Yinggang | | | — | | | | 725 | | | | — | | | | 76 | | | | 801 | |
| | | | — | | | | 725 | | | | — | | | | 76 | | | | 801 | |
| Non-executive Directors: | | | | | | | | | | | | | | | | | | | | |
| Yu Dehui | | | — | | | | — | | | | — | | | | — | | | | — | |
| Liu Caiming | | | — | | | | — | | | | — | | | | — | | | | — | |
| Wang Jun | | | 150 | | | | — | | | | — | | | | — | | | | 150 | |
| Lie-A-Cheong Tai-Chong, David | | | 204 | | | | — | | | | — | | | | — | | | | 204 | |
| Chen Lijie | | | 204 | | | | — | | | | — | | | | — | | | | 204 | |
| Hu Shihai | | | 204 | | | | — | | | | | | | | | | | | 204 | |
| | | | 762 | | | | — | | | | — | | | | — | | | | 762 | |
| Supervisors: | | | | | | | | | | | | | | | | | | | | |
| Liu Xiangmin | | | — | | | | — | | | | — | | | | — | | | | — | |
| Yuan Li | | | — | | | | — | | | | — | | | | — | | | | — | |
| Wang Jun | | | — | | | | — | | | | — | | | | — | | | | — | |
| Wu Zuoming | | | | | | | 250 | | | | — | | | | 38 | | | | 288 | |
| Zhao Zhao | | | | | | | — | | | | — | | | | — | | | | — | |
| | | | — | | | | 250 | | | | — | | | | 38 | | | | 288 | |
| | | | | | | | | | | | | | | | | | | | | |
| Total | | | 762 | | | | 975 | | | | — | | | | 114 | | | | 1,851 | |
ALUMINUM CORPORATION OF CHINA LIMITED AND ITS SUBSIDIARIES
NOTES TO THE CONSOLIDATED FINANCIAL STATEMENTS(Continued)
For the years ended December 31, 2016, 2017 and 2018
(Amounts expressed in thousands of RMB unless otherwise stated)
| 30. | DIRECTORS’ AND SUPERVISORS’ REMUNERATION (CONTINUED) |
| (a) | Directors’ and supervisors’ remuneration (continued) |
The remuneration of each director and supervisor of the Company for the year ended December 31, 2017 is set out below:
| Names of directors and supervisors | | Fees | | | Salaries | | | Discretionary
bonuses | | | Pension costs | | | total | |
| | | | | | | | | | | | | | | | |
| Executive Directors: | | | | | | | | | | | | | | | | | | | | |
| Yu Dehui | | | — | | | | — | | | | — | | | | — | | | | — | |
| Lu Dongliang | | | — | | | | — | | | | — | | | | — | | | | — | |
| Jiang Yinggang | | | — | | | | 822 | | | | — | | | | 83 | | | | 905 | |
| | | | — | | | | 822 | | | | — | | | | 83 | | | | 905 | |
| | | | | | | | | | | | | | | | | | | | | |
| Non-executive Directors: | | | | | | | | | | | | | | | | | | | | |
| Ao Hong | | | — | | | | — | | | | — | | | | — | | | | — | |
| Liu Caiming | | | — | | | | — | | | | — | | | | — | | | | — | |
| Wang Jun | | | 150 | | | | — | | | | — | | | | — | | | | 150 | |
| Chen Lijie | | | 206 | | | | — | | | | — | | | | — | | | | 206 | |
| Lie-A-Cheong Tai-Chong, David | | | 206 | | | | — | | | | — | | | | — | | | | 206 | |
| Hu Shihai | | | 206 | | | | — | | | | — | | | | — | | | | 206 | |
| | | | 768 | | | | — | | | | — | | | | — | | | | 768 | |
| | | | | | | | | | | | | | | | | | | | | |
| Supervisors: | | | | | | | | | | | | | | | | | | | | |
| Liu Xiangmin | | | — | | | | — | | | | — | | | | — | | | | — | |
| Wang Jun | | | — | | | | — | | | | — | | | | — | | | | — | |
| Wu Zuoming | | | — | | | | 548 | | | | — | | | | 83 | | | | 631 | |
| | | | — | | | | 548 | | | | — | | | | 83 | | | | 631 | |
| | | | | | | | | | | | | | | | | | | | | |
| Total | | | 768 | | | | 1,370 | | | | — | | | | 166 | | | | 2,304 | |
ALUMINUM CORPORATION OF CHINA LIMITED AND ITS SUBSIDIARIES
NOTES TO THE CONSOLIDATED FINANCIAL STATEMENTS(Continued)
For the years ended December 31, 2016, 2017 and 2018
(Amounts expressed in thousands of RMB unless otherwise stated)
| 30. | DIRECTORS’ AND SUPERVISORS’ REMUNERATION (CONTINUED) |
| (a) | Directors’ and supervisors’ remuneration (continued) |
The remuneration of each director and supervisor of the Company for the year ended December 31, 2018 is set out below:
| Names of directors and supervisors | | Fees | | | Salaries | | | Discretionary
bonuses | | | Pension costs | | | total | |
| | | | | | | | | | | | | | | | |
| Executive Directors: | | | | | | | | | | | | | | | | | | | | |
| Yu Dehui(Note (i)) | | | — | | | | — | | | | — | | | | — | | | | — | |
| Lu Dongliang(Note (iii)) | | | — | | | | — | | | | — | | | | — | | | | — | |
| Jiang Yinggang | | | — | | | | 762 | | | | — | | | | 90 | | | | 852 | |
| Zhu Runzhou | | | — | | | | 438 | | | | — | | | | 54 | | | | 492 | |
| | | | — | | | | 1,200 | | | | — | | | | 144 | | | | 1,344 | |
| Non-executive Directors: | | | | | | | | | | | | | | | | | | | | |
| Ao Hong(Note ii)) | | | — | | | | — | | | | — | | | | — | | | | — | |
| Wang Jun (Note (ii)) | | | 150 | | | | — | | | | — | | | | — | | | | 150 | |
| Chen Lijie | | | 202 | | | | — | | | | — | | | | — | | | | 202 | |
| Lie-A-Cheong Tai-Chong, David | | | 202 | | | | — | | | | — | | | | — | | | | 202 | |
| Hu Shihai | | | 202 | | | | — | | | | — | | | | — | | | | 202 | |
| | | | 756 | | | | — | | | | — | | | | — | | | | 756 | |
| Supervisors: | | | | | | | | | | | | | | | | | | | | |
| Ye Guohua | | | — | | | | — | | | | — | | | | — | | | | — | |
| Wang Jun | | | — | | | | — | | | | — | | | | — | | | | — | |
| Wu Zuoming | | | — | | | | 649 | | | | — | | | | 90 | | | | 739 | |
| | | | — | | | | 649 | | | | — | | | | 90 | | | | 739 | |
| | | | | | | | | | | | | | | | | | | | | |
| Total | | | 756 | | | | 1849 | | | | — | | | | 234 | | | | 2,839 | |
Note:
| (i) | On February 21, 2019, Mr. Yu Dehui resigned as the chairman and an executive Director of the Company, and Mr. Lu Dongliang was elected as the chairman of the sixth session of the Board of the Company at the 39th meeting of the sixth session of the Board. |
| (ii) | On February 20, 2019, the appointment of Mr. Wang Jun as the chief financial officer and the Secretary to the Board (Company Secretary) of the Company was approved at the 38th meeting of the sixth session of the Board of the Company. |
ALUMINUM CORPORATION OF CHINA LIMITED AND ITS SUBSIDIARIES
NOTES TO THE CONSOLIDATED FINANCIAL STATEMENTS(Continued)
For the years ended December 31, 2016, 2017 and 2018
(Amounts expressed in thousands of RMB unless otherwise stated)
| 30. | DIRECTORS’ AND SUPERVISORS’ REMUNERATION (CONTINUED) |
| (a) | Directors’ and supervisors’ remuneration (continued) |
The remuneration of the directors and supervisors of the Company fell within the following band:
| | | Number of individuals | |
| | | 2016 | | | 2017 | | | 2018 | |
| | | | | | | | | | |
| Nil to RMB1,000,000 | | | 15 | | | | 15 | | | | 12 | |
During the year, no options were granted to the directors or the supervisors of the Company (2016: Nil, 2017: Nil).
During the year, no emoluments were paid to the directors or the supervisors of the Company (among which included the five highest paid employees) as an inducement to join or upon joining the Company or as compensation for loss of office (2016: Nil, 2017: Nil).
No directors or supervisors of the Company waived any remuneration during the years 2018 and 2017.
| (b) | Five highest paid individuals |
During the year ended December 31, 2018, the five highest paid employees of the Group include two directors and one supervisor (2016: two directors and one supervisor, 2017: one director and one supervisor) whose remuneration is reflected in the analysis presented above. The remuneration payable to the remaining three individuals during 2018 (2016: two, 2017: three) is as follows:
| | | 2016 | | | 2017 | | | 2018 | |
| | | | | | | | | | |
| Basic salaries, housing fund, other allowances and benefits in kind | | | 1,450 | | | | 2,460 | | | | 1,305 | |
| Discretionary bonuses | | | — | | | | — | | | | — | |
| Pension costs | | | 152 | | | | 249 | | | | 165 | |
| | | | | | | | | | | | | |
| | | | 1,602 | | | | 2,709 | | | | 1,470 | |
The number of the remaining three highest paid individuals during 2018 (2016: two, 2017: three) whose remuneration fell within the following band is as follows:
| | | Number of employees | |
| | | 2016 | | | 2017 | | | 2018 | |
| | | | | | | | | | |
| Nil to RMB1,000,000 | | | 2 | | | | 3 | | | | 2 | |
ALUMINUM CORPORATION OF CHINA LIMITED AND ITS SUBSIDIARIES
NOTES TO THE CONSOLIDATED FINANCIAL STATEMENTS(Continued)
For the years ended December 31, 2016, 2017 and 2018
(Amounts expressed in thousands of RMB unless otherwise stated)
As disclosed in note 6, the Group leased certain machineries and construction in progress under finance leases with lease terms ranging from one to six years. | 31. | INCOME TAX BENEFIT/ (EXPENSE) |
| | | 2016 | | | 2017 | | | 2018 | |
| | | | | | | | | | |
| Current income tax expense: | | | | | | | | | | | | |
| — PRC corporate income tax | | | 503,233 | | | | 844,896 | | | | 755,215 | |
| Deferred tax (benefit)/expense | | | (99,334 | ) | | | (201,162 | ) | | | 67,284 | |
| | | | | | | | | | | | | |
| | | | 403,899 | | | | 643,734 | | | | 822,499 | |
In general, the Group’s PRC entities are subject to PRC corporate income tax at the standard rate of 25% (2016: 25%, 2017: 25%) on their respective estimated assessable profits for the year. Certain branches and subsidiaries of the Company located in the western regions of the PRC are granted tax concessions including a preferential tax rate of 15% (2016: 15%, 2017: 15%).
ALUMINUM CORPORATION OF CHINA LIMITED AND ITS SUBSIDIARIES
NOTES TO THE CONSOLIDATED FINANCIAL STATEMENTS(Continued)
For the years ended December 31, 2016, 2017 and 2018
(Amounts expressed in thousands of RMB unless otherwise stated)
At December 31, 2017, the total future minimum lease payments under finance leases and their present values are as follows: | 31. | INCOME TAX EXPENSE (CONTINUED) |
| | | | Minimum lease payments | | | Present value of minimum lease payments | |
| | | | December 31, 2017 | | | December 31, 2016 | | | December 31, 2017 | | | December 31, 2016 | |
| Amounts payable: | | | | | | | | | | | | | |
| Within one year | | | 2,371,917 | | | 2,253,720 | | | 2,115,644 | | | 2,008,716 | |
| In the second year | | | 1,762,618 | | | 2,068,315 | | | 1,606,571 | | | 1,891,406 | |
| In the third to fifth | | | | | | | | | | | | | |
| years, inclusive | | | 1,890,329 | | | 2,895,251 | | | 1,817,506 | | | 2,792,180 | |
| After five years | | | 73,603 | | | — | | | 67,849 | | | — | |
| | | | | | | | | | | | | | |
| Total minimum finance | | | | | | | | | | | | | |
| lease payments | | | 6,098,467 | | | 7,217,286 | | | 5,607,570 | | | 6,692,302 | |
| | | | | | | | | | | | | | |
| Future finance charges | | | (490,897 | ) | | (524,984 | ) | | | | | | |
| | | | | | | | | | | | | | |
| Total net finance lease | | | | | | | | | | | | | |
| payables (note 19) | | | 5,607,570 | | | 6,692,302 | | | | | | | |
| | | | | | | | | | | | | | |
| Portion classified as | | | | | | | | | | | | | |
| current liabilities | | | | | | | | | | | | | |
| (note 19) | | | (2,115,644 | ) | | (2,008,716 | ) | | | | | | |
| | | | | | | | | | | | | | |
| Non-current portion | | | 3,491,926 | | | 4,683,586 | | | | | | | |
A reconciliation of the tax expense applicable to profit before tax at the statutory rates for the countries in which the Company and the majority of its subsidiaries are domiciled to the tax expense at the effective tax rates, and a reconciliation of the applicable rates to the effective tax rates are as follows:
| During the year ended December 31, 2017, the Group entered into various sale and leaseback agreements with Anhui Xincheng Financial Leasing Co., Ltd. (安徽信成融资租賃有限公司), Pingan International Financial Leasing Co., Ltd. (平安國際融資租賃有限公司), Chongqing Transportation Equipment Financing Leasing Co., Ltd. (重慶市交通設備融資租賃有限公司), Taiping Sinopec Financial Leasing Co., Ltd. (太平石化金融租賃有限公司) and CFL, which is a related party of the Group, respectively, under which the Group sold machineries and construction in progress and leased them back. The lease terms range from one to six years and the lease rentals are payable by instalments with bearing interest at prevailing lending rates. |
| |
| During the year ended December 31, 2017, the Group disposed of the assets under the sales and leaseback arrangements and incurred losses of RMB102 million (2016: RMB234 million), which were amortized over their respective useful lives of the assets. The internal rate of return (IRR) of the sales and finance lease back arrangements range from 4.35% to 6.20% (2016: from 4.76% to 6.28%). |
| |
| * | The English name represents the best effort made by management of the Group in translating the Chinese name of the Companies as it does not have any official English names. |
| | | 2016 | | | 2017 | | | 2018 | |
| | | | | | | | | | |
| Profit before income tax | | | 1,620,689 | | | | 3,049,010 | | | | 2,303,511 | |
| | | | | | | | | | | | | |
| Tax expense calculated at the statutory tax rate of 25% (2016 and 2017: 25%) | | | 405,172 | | | | 762,253 | | | | 575,878 | |
| Tax effects of: | | | | | | | | | | | | |
| Preferential income tax rates applicable to certain branches and subsidiaries | | | (3,322 | ) | | | (287,081 | ) | | | (268,665 | ) |
| Impact of change in income tax rate | | | 5,945 | | | | 98,150 | | | | 23,425 | |
| Tax losses with no deferred tax assets recognized | | | 269,173 | | | | 296,728 | | | | 434,103 | |
| Deductible temporary differences with no deferred tax assets recognized | | | 78,644 | | | | 308,657 | | | | 382,503 | |
| Utilisation of previously unrecognized tax losses and deductible temporary differences | | | (203,423 | ) | | | (212,240 | ) | | | (52,962 | ) |
| Tax incentive in relation to deduction of certain expenses | | | (3,769 | ) | | | (43,846 | ) | | | (62,172 | ) |
| Non-taxable income | | | (89,602 | ) | | | (126,101 | ) | | | (254,337 | ) |
| Expenses not deductible for tax purposes | | | 83,966 | | | | 10,290 | | | | 46,758 | |
| Write-off of unrecoverable deferred tax assets previously recognized | | | 3,315 | | | | 49,808 | | | | 183,195 | |
| Return on equity investment measured by the equity method | | | (4,896 | ) | | | 39,274 | | | | 40,029 | |
| Recognition of deferred tax assets related to deductible temporary differences and tax losses previously not recognized | | | (117,513 | ) | | | (274,726 | ) | | | (233,940 | ) |
| True-up adjustments in respect of prior year’s annual income tax filings and others | | | (19,791 | ) | | | 22,568 | | | | 8,684 | |
| | | | | | | | | | | | | |
| Income tax expense | | | 403,899 | | | | 643,734 | | | | 822,499 | |
| | | | | | | | | | | | | |
| Effective tax rate | | | 25 | % | | | 21 | % | | | 36 | % |
Share of income tax expense of associates and joint ventures of RMB106 million (2016: RMB64 million, 2017: RMB86 million) and RMB48 million (2016: RMB22 million, 2017: RMB 11 million) is included in “Share of profits and losses of associates“ and “Share of profits and losses of joint ventures“, respectively.
ALUMINUM CORPORATION OF CHINA LIMITED AND ITS SUBSIDIARIES
NOTES TO THE CONSOLIDATED FINANCIAL STATEMENTS(Continued)
For the years ended December 31, 2015, 2016, 2017 and 2017
(Amounts expressed in thousands of RMB unless otherwise stated)
21. | OTHER NON-CURRENT LIABILITIES |
| | December 31, 2016 | December 31, 2017 |
| | | | |
| Financial liabilities | | | |
| - Long-term payables for mining rights | 789,420 | | 749,761 |
| - Other financial liabilities | 300 | | 19,300 |
| | 789,720 | | 769,061 |
| | | | |
| Obligations in relation to early retirement schemes(Note (i)) | 674,835 | | 900,924 |
| Deferred government grants | 1,466,656 | | 1,406,122 |
| Deferred gain relating to sales and leaseback agreements(Note (ii)) | 193,724 | | 176,774 |
| Provision for rehabilitation | 106,769 | | 113,672 |
| Others | 6,037 | | 5,837 |
| | 2,448,021 | | 2,603,329 |
| | | | |
| | 3,237,741 | | 3,372,390 |
ALUMINUM CORPORATION OF CHINA LIMITED AND ITS SUBSIDIARIES
NOTES TO THE CONSOLIDATED FINANCIAL STATEMENTS(Continued)
For the years ended December 31, 2015, 2016 and 2017
(Amounts expressed in thousands of RMB unless otherwise stated)
21. | OTHER NON-CURRENT LIABILITIES(Continued) |
| | | |
| Note: |
| | | |
| (i) | Obligations in relation to early retirement schemes |
| | |
| | From 2014, certain subsidiaries and branches implemented certain early retirement benefit schemes which allow qualified employees to early retire on a voluntary basis. The Group undertakes the obligations to pay the early retirement employees' living expenses for no more than five years in the future on a monthly basis according to the early retirement benefit schemes, together with social insurance and housing fund pursuant to the regulation of the local Social Security Office. Living expenses, social insurance and the housing fund are together referred to as “the Payments“. The Payments are forecasted to increase by 3% per annum with reference to the inflation rate and adjusted based on the average death rate in China. The Payments are discounted by the treasury bond rate of December 31, 2017. As at December 31, 2016 and 2017, the current portion of the Payments within one year was reclassified to "other payables and accrued liabilities". |
| | |
| | As at December 31, 2016 and 2017, obligations in relation to retirement benefits under the Group’s early retirement schemes are as follows: |
| | | | 2016 | | | | 2017 | |
| | | | | | | | | |
| As at January 1, | | | 1,147,320 | | | | 996,598 | |
| Provision made during the year (note 29) | | | 132,044 | | | | 767,632 | |
| Interest costs | | | 84,616 | | | | 17,618 | |
| Payment during the year | | | (367,382 | ) | | | (343,408 | ) |
| | | | | | | | | |
| As at December 31, | | | 996,598 | | | | 1,438,440 | |
| | | | | | | | | |
| Non-current | | | 674,835 | | | | 900,924 | |
| Current (note 22) | | | 321,763 | | | | 537,516 | |
| | | | | | | | | |
| | | | 996,598 | | | | 1,438,440 | |
| (ii) | As disclosed in note 20, the Group entered into several sales and leaseback agreements which were finance leases during the year. The deferred gains resulting from the sales were classified under other non-current liabilities and were amortized over the useful lives of the assets leased back. |
ALUMINUM CORPORATION OF CHINA LIMITED AND ITS SUBSIDIARIES
NOTES TO THE CONSOLIDATED FINANCIAL STATEMENTS(Continued)
For the years ended December 31, 2015, 2016 and 20172018
(Amounts expressed in thousands of RMB unless otherwise stated)
22. | OTHER PAYABLES AND ACCRUED LIABILITIES |
| | | | | | | | | |
| | | | December 31,
2016 | | | | December 31,
2017 | |
| | | | | | | | | |
| Financial liabilities | | | | | | | | |
| - Payable for capital expenditures | | | 5,660,677 | | | | 6,283,484 | |
| - Accrued interest | | | 1,070,620 | | | | 827,016 | |
| - Payables withheld as guarantees and deposits | | | 1,075,760 | | | | 1,490,811 | |
| - Dividends payable by subsidiaries to non-controlling shareholders | | | 221,496 | | | | 223,942 | |
| - Consideration payable for investment projects | | | 305,506 | | | | 170,494 | |
| - Current portion of payables for mining rights | | | 337,659 | | | | 300,970 | |
| - Others | | | 900,771 | | | | 1,987,739 | |
| | | | 9,572,489 | | | | 11,284,456 | |
| | | | | | | | | |
| Sales and other deposits from customers | | | 1,799,345 | | | | 1,597,539 | |
| Taxes other than income taxes payable(Note) | | | 715,089 | | | | 818,730 | |
| Accrued payroll and bonus | | | 218,741 | | | | 74,400 | |
| Staff welfare payables | | | 277,802 | | | | 261,056 | |
| Current portion of obligations in relation to early retirement schemes (note 21) | | | 321,763 | | | | 537,516 | |
| Contribution payable for pension insurance | | | 109,077 | | | | 27,248 | |
| Others | | | 3,013 | | | | 1,786 | |
| | | | 3,444,830 | | | | 3,318,275 | |
| | | | | | | | | |
| | | | 13,017,319 | | | | 14,602,731 | |
| Note: | Taxes other than income taxes payable mainly comprise accruals for value- added tax, resource tax, city construction tax and education surcharge. |
| | |
| As at December 31, 2017, except for other payables and accrued liabilities of the Group amounting to RMB390 million, RMB0.32 million and RMB0.06 million which were denominated in USD, HKD and EUR, respectively (December 31, 2016: RMB251 million denominated in USD and RMB0.022 million denominated in EUR). All payables and accrued liabilities were denominated in RMB (December 31, 2016: all denominated in RMB). |
ALUMINUM CORPORATION OF CHINA LIMITED AND ITS SUBSIDIARIES
NOTES TO THE CONSOLIDATED FINANCIAL STATEMENTS(Continued)
For the years ended December 31, 2015, 2016 and 2017
(Amounts expressed in thousands of RMB unless otherwise stated)
23. | TRADE AND NOTES PAYABLES |
| | | December 31,
2016 | | | | December 31,
2017 | |
| | | | | | | | | |
| Trade payables | | | 6,739,761 | | | | 7,751,911 | |
| Notes payable | | | 4,603,109 | | | | 4,570,059 | |
| | | | | | | | | |
| | | | 11,342,870 | | | | 12,321,970 | |
| As at December 31, 2017, except for trade and notes payables of the Group amounting to RMB56 million which were denominated in USD (December 31, 2016: RMB22 million in USD), all trade and notes payables were denominated in RMB (December 31, 2016: all denominated in RMB). |
| |
| The ageing analysis of trade and notes payables is as follows: |
| | | | December 31, | | | | December 31, | |
| | | | 2016 | | | | 2017 | |
| | | | | | | | | |
| Within 1 year | | | 10,777,171 | | | | 11,710,641 | |
| Between 1 and 2 years | | | 276,351 | | | | 199,121 | |
| Between 2 and 3 years | | | 107,137 | | | | 201,919 | |
| Over 3 years | | | 182,211 | | | | 210,289 | |
| | | | | | | | | |
| | | | 11,342,870 | | | | 12,321,970 | |
| The trade and notes payables are non-interest-bearing and are normally settled within one year. |
ALUMINUM CORPORATION OF CHINA LIMITED AND ITS SUBSIDIARIES
NOTES TO THE CONSOLIDATED FINANCIAL STATEMENTS(Continued)
For the years ended December 31, 2015, 2016 and 2017
(Amounts expressed in thousands of RMB unless otherwise stated)
24. | PLEDGE OF ASSETS |
| |
| The Group has pledged various assets as collateral against certain secured borrowings as set out in note 19. As at December 31, 2016 and 2017, a summary of these pledged assets was as follows: |
| | December 31, 2016 | | December 31, 2017 | |
| | | | | |
| Property, plant and equipment (note 6) | 6,540,545 | | 5,799,013 | |
| Land use rights (note 8) | 275,061 | | 176,914 | |
| Intangible assets (note 5) | 1,114,454 | | 1,111,705 | |
| Investment in an associate (note 9(b)) | 376,270 | | - | |
| Notes receivable (note 14) | 33,500 | | 82,125 | |
| Trade receivables (note 14) | 35,836 | | 22,000 | |
| | | | | |
| | 8,375,666 | | 7,191,757 | |
| As at December 31, 2017, in addition to the loans and borrowings which were secured by the above assets, the current portion of long-term loans and borrowings amounting to RMB997 million (December 31, 2016: RMB933 million) and the non-current portion of long-term loans and borrowings amounting to RMB10,935 million (December 31, 2016: RMB8,956 million) were secured by the contractual right to charge users for electricity generated in the future. As at December 31, 2017, the current portion of long-term loans and borrowings amounting to RMB10 million (December 31, 2016: RMB10 million) and the non-current portion of long-term loans and borrowings amounting to RMB1,647 million (December 31, 2016: RMB1,657 million) were secured by 70.82% equity interests in a subsidiary of the Company, Ningxia Energy. |
ALUMINUM CORPORATION OF CHINA LIMITED AND ITS SUBSIDIARIES
NOTES TO THE CONSOLIDATED FINANCIAL STATEMENTS(Continued)
For the years ended December 31, 2015, 2016 and 2017
(Amounts expressed in thousands of RMB unless otherwise stated)
25. | PROFIT BEFORE INCOME TAX |
| |
| An analysis of profit before income tax is as follows: |
| | 2015 | 2016 | 2017 | |
| | | | | |
| Purchase of inventories in relation to trading activities | 60,318,158 | 79,682,085 | 98,282,714 | |
| Raw materials and consumables used, and changes in work-in-progress and finished goods | 29,647,657 | 27,243,423 | 34,374,412 | |
| Power and utilities | 15,835,191 | 12,980,854 | 17,187,133 | |
| Depreciation and amortization | 7,388,539 | 6,987,353 | 7,121,132 | |
| Employee benefit expenses (note 29) | 6,110,608 | 5,894,726 | 6,897,530 | |
| Repairs and maintenance | 1,797,254 | 1,354,394 | 1,716,693 | |
| Transportation expenses | 1,152,027 | 1,495,018 | 1,742,699 | |
| Logistic cost | - | 796,231 | 1,894,061 | |
| Taxes other than income tax expense(Note (i)) | 567,157 | 695,984 | 890,467 | |
| Rental expenses for land use rights and buildings | 664,917 | 511,189 | 497,356 | |
| Packaging expenses | 272,558 | 235,929 | 266,745 | |
| Research and development expenses | 168,870 | 168,862 | 494,590 | |
| Auditors’ remuneration expense(Note (ii)) | 23,666 | 26,006 | 31,460 | |
| Note: | |
| | |
| (i) | Taxes other than income tax expense mainly comprise surcharges, land use tax, property tax and stamp duty. |
| | |
| (ii) | During the year ended December 31, 2017, auditors’ remuneration included audit and non-audit services provided by Ernst & Young, including Ernst & Young Hong Kong and Ernst & Young Hua Ming LLP, amounting to RMB23.1 million (2015: RMB23.3 million, 2016: RMB23.7 million), and services provided by other auditors. |
ALUMINUM CORPORATION OF CHINA LIMITED AND ITS SUBSIDIARIES
NOTES TO THE CONSOLIDATED FINANCIAL STATEMENTS(Continued)
For the years ended December 31, 2015, 2016 and 2017
(Amounts expressed in thousands of RMB unless otherwise stated)
26. | OTHER INCOME |
| |
| For the year ended December 31, 2017, government grants amounting to RMB342 million (2015: RMB 1,788 million, 2016: RMB745 million) were recognized as income for the year necessary to compensate the costs and facilitate the Group’s development. There are no unfulfilled conditions or contingencies attached to the grants. |
| | |
27. | OTHER GAINS, NET |
| | | | 2015 | | | | 2016 | | | | 2017 | |
| | | | | | | | | | | | | |
| Gain on disposal of investments in associates | | | 832,369 | | | | 128,833 | | | | — | |
| Gain on deemed disposal and disposal of subsidiaries | | | 2,588,134 | | | | — | | | | 325,022 | |
| Gain on disposal and dividends of available for sale investments | | | 38,469 | | | | 140,929 | | | | 79,408 | |
| Realized loss on futures, forward and option contracts, net(Note) | | | (477,733 | ) | | | (1,290,267 | ) | | | (23,951 | ) |
| Unrealized (losses) /gains on futures, forward and option contracts, net(Note) | | | (213,085 | ) | | | 154,585 | | | | (131,073 | ) |
| Gain on disposal of other property, plant and equipment and land use rights, net | | | 2,317,857 | | | | 816,721 | | | | 77,091 | |
| Gain on previously held equity interest remeasured at acquisition-date fair value (note 38 (i)) | | | — | | | | — | | | | 117,640 | |
| Others | | | (62,458 | ) | | | 215,582 | | | | (124,141 | ) |
| | | | | | | | | | | | | |
| | | | 5,023,553 | | | | 166,383 | | | | 319,996 | |
| Note: None of these futures, forward and option contracts was designated for hedge accounting. |
ALUMINUM CORPORATION OF CHINA LIMITED AND ITS SUBSIDIARIES
NOTES TO THE CONSOLIDATED FINANCIAL STATEMENTS(Continued)
For the years ended December 31, 2015, 2016 and 2017
(Amounts expressed in thousands of RMB unless otherwise stated)
28. | FINANCE INCOME/FINANCE COSTS |
| | |
| An analysis of finance income/finance costs is as follows: |
| | | | 2015 | | | | 2016 | | | | 2017 | |
| | | | | | | | | | | | | |
| Finance income - interest income | | | (812,459 | ) | | | (815,729 | ) | | | (706,299 | ) |
| | | | | | | | | | | | | |
| Interest expense | | | 6,119,964 | | | | 5,169,568 | | | | 5,161,663 | |
| Less: interest expense capitalized in property, plant and equipment (note 6) | | | (522,053 | ) | | | (414,133 | ) | | | (344,452 | ) |
| Interest expense, net of capitalized interest | | | 5,597,911 | | | | 4,755,435 | | | | 4,817,211 | |
| Amortization of unrecognized finance expenses | | | 285,727 | | | | 324,701 | | | | 241,097 | |
| Exchange loss/(gain), net | | | 95,851 | | | | (60,228 | ) | | | 131,621 | |
| Finance costs | | | 5,979,489 | | | | 5,019,908 | | | | 5,189,929 | |
| | | | | | | | | | | | | |
| Finance costs, net | | | 5,167,030 | | | | 4,204,179 | | | | 4,483,630 | |
| | | | | | | | | | | | | |
| Capitalization rate during the year (note 6) | | | 4.90% to 6.55% | | | | 3.85% to 6.00% | | | | 4.41% to 8.00% | |
29. | EMPLOYEE BENEFIT EXPENSES |
| | |
| An analysis of employee benefit expenses is as follows: |
| | | | 2015 | | | | 2016 | | | | 2017 | |
| | | | | | | | | | | | | |
| Salaries and bonus | | | 3,980,430 | | | | 3,850,040 | | | | 4,150,233 | |
| Housing fund | | | 395,699 | | | | 388,017 | | | | 391,757 | |
| Staff welfare and other expenses(Note) | | | 1,672,833 | | | | 1,495,618 | | | | 1,557,661 | |
| Employment expense in relation to early retirement schemes (note 21) | | | 34,893 | | | | 132,044 | | | | 767,632 | |
| Employment expenses in relation to termination benefit | | | 26,753 | | | | 29,007 | | | | 30,247 | |
| | | | | | | | | | | | | |
| | | | 6,110,608 | | | | 5,894,726 | | | | 6,897,530 | |
| Note: | Staff welfare and other expenses include staff welfare, staff union expenses, staff education expenses, unemployment insurance expenses and pension insurance expenses, etc. |
| | |
| | Employee benefit expenses include remuneration payables to directors, supervisors and senior management as set out in note 30. |
ALUMINUM CORPORATION OF CHINA LIMITED AND ITS SUBSIDIARIES
NOTES TO THE CONSOLIDATED FINANCIAL STATEMENTS(Continued)
For the years ended December 31, 2015, 2016 and 2017
(Amounts expressed in thousands of RMB unless otherwise stated)
30. | DIRECTORS’, SUPERVISORS’ AND SENIOR MANAGEMENT’S REMUNERATION |
| | |
| (a) | Directors’ and supervisors’ remuneration |
| | |
| | The aggregate amounts of remuneration payables to directors and supervisors of the Company during the year are as follows:
|
| | 2015 | | 2016 | | 2017 | |
| | | | | | | |
| Fees | 653 | | 762 | | 768 | |
| Basic salaries, housing fund, other allowances and benefits in kind | 1,143 | | 975 | | 1,370 | |
| Pension cost | 140 | | 114 | | 166 | |
| | | | | | | |
| | 1,936 | | 1,851 | | 2,304 | |
ALUMINUM CORPORATION OF CHINA LIMITED AND ITS SUBSIDIARIES
NOTES TO THE CONSOLIDATED FINANCIAL STATEMENTS(Continued)
For the years ended December 31, 2015, 2016 and 2017
(Amounts expressed in thousands of RMB unless otherwise stated)
30. | DIRECTORS’ AND SUPERVISORS’ REMUNERATION(Continued) |
| | |
| (a) | Directors’ and supervisors’ remuneration(Continued) |
| | |
| | The remuneration of each director and supervisor of the Company for the year ended December 31, 2015 is set out below: |
| Names of directors and supervisors | | Fees | | Salaries | | Discretionary bonus | | Pension costs | | total |
| | | | | | | | | | | |
| Directors: | | | | | | | | | | | | | | | | | | | | |
| Ge Honglin(Note (i)) | | | — | | | | — | | | | — | | | | — | | | | — | |
| Ao Hong(Note (ii)) | | | — | | | | — | | | | — | | | | — | | | | — | |
| Luo Jianchuan(Note (ii)) | | | — | | | | — | | | | — | | | | — | | | | — | |
| Liu Xiangmin | | | — | | | | — | | | | — | | | | — | | | | — | |
| Jiang Yinggang | | | — | | | | 643 | | | | — | | | | 70 | | | | 713 | |
| Liu Caiming(Note (iii)) | | | — | | | | — | | | | — | | | | — | | | | — | |
| Wang Jun | | | 150 | | | | — | | | | — | | | | — | | | | 150 | |
| Ma Si-hang, Frederick(Note (iv)) | | | 192 | | | | — | | | | — | | | | — | | | | 192 | |
| Lie-A-Cheong Tai-Chong, David (Note (iv)) | | | — | | | | — | | | | — | | | | — | | | | — | |
| Chen Lijie(Note (v)) | | | 162 | | | | — | | | | — | | | | — | | | | 162 | |
| Hu Shihai(Note (vi)) | | | 102 | | | | — | | | | — | | | | — | | | | 102 | |
| Wu Zhenfang(Note (ix)) | | | 47 | | | | — | | | | — | | | | — | | | | 47 | |
| Wu Jianchang(Note (x)) | | | — | | | | — | | | | — | | | | — | | | | — | |
| | | | 653 | | | | 643 | | | | — | | | | 70 | | | | 1,366 | |
| Supervisors: | | | | | | | | | | | | | | | | | | | | |
| Zhao Zhao | | | — | | | | — | | | | — | | | | — | | | | — | |
| Yuan Li | | | — | | | | 500 | | | | — | | | | 70 | | | | 570 | |
| Zhang Zhankui (Note (vii)) | | | — | | | | — | | | | — | | | | — | | | | — | |
| Wang Jun(Note (viii)) | | | — | | | | — | | | | — | | | | — | | | | — | |
| | | | — | | | | 500 | | | | — | | | | 70 | | | | 570 | |
| | | | | | | | | | | | | | | | | | | | | |
| Total | | | 653 | | | | 1,143 | | | | — | | | | 140 | | | | 1,936 | |
| | Note: | |
| | | |
| | (i) | Mr. Ge Honglin was elected as an executive director of the Company at the 2015 first extraordinary general meeting of the Company and he was elected as the chairman of the Board of the Company at the sixteenth meeting of the fifth session of the Board of the Company. On February 16, 2016, Mr. Ge proposed to resign as an executive Director, the chairman of the Board and from each of his positions in relevant special committees under the Board of the Company due to his work commitment. |
| | | |
| | (ii) | On November 20, 2015, due to work arrangement, Mr. Luo Jianchuan resigned from the Executive Director and President of the Company, along with all the duties of various special committees. Mr. Ao Hong was elected to be the Executive Director in the second extraordinary shareholders’ meeting in 2015 of the fifth session of the board of directors. |
| | | |
| | (iii) | Mr. Liu Caiming was elected as a non-executive director of the fifth session of the Board of the Company at the 2015 first extraordinary general meeting of the Company. |
ALUMINUM CORPORATION OF CHINA LIMITED AND ITS SUBSIDIARIES
NOTES TO THE CONSOLIDATED FINANCIAL STATEMENTS(Continued)
For the years ended December 31, 2015, 2016 and 2017
(Amounts expressed in thousands of RMB unless otherwise stated)
30. | DIRECTORS’ AND SUPERVISORS’ REMUNERATION(Continued) |
| | |
| (a) | Directors’ and supervisors’ remuneration(Continued) |
| | Note: (Continued) |
| | | |
| | (iv) | On November 12, 2015, due to other work arrangement, Mr. Ma Si-hang resigned as an independent non-executive director and relevant duties of various special committees of the board of directors. Through the review of the election nomination committee of the fifth session of the board of directors and discussion of board of directors’ 23th meeting, Mr. Lie-A-Cheong Tai-Chong, David was nominated to be the candidate of Non-executive Director. In the second extraordinary shareholders meeting in 2015, he was elected to be independent non-executive director of the fifth session of the board of directors. |
| | | |
| | (v) | Ms. Chen Lijie was elected as an independent non-executive director of the fifth session of the Board of the Company at the 2015 first extraordinary general meeting of the Company. |
| | | |
| | (vi) | Mr. Hu Shihai was elected as an independent non-executive director of the fifth session of the Board of the Company at the 2015 annual general meeting of the Company. |
| | | |
| | (vii) | On November 13, 2015, due to other work arrangement, Mr. Zhang Zhankui resigned as a supervisor of the Group. On November 13, 2015, Mr. Zhang Zhankui was appointed as chief financial officer. |
| | | |
| | (viii) | The controlling shareholder, Chinalco nominated Mr. Wang Jun as the candidate for the supervisor of the fifth session of the board of supervisors. Mr. Wang Jun was elected to be supervisor of the fifth session of the board of supervisors. |
| | | |
| | (ix) | On April 2, 2015, due to being under an investigation by the competent authority, Mr. Wu Zhenfang resigned as an independent non-executive Director and from relevant positions in the special committees under the Board of the Company by submitting a resignation to the Board. |
| | | |
| | (x) | Due to his age, Mr. Wu Jianchang resigned from the position of independent Non-executive Director of the Company, with effect from February 26, 2015. |
ALUMINUM CORPORATION OF CHINA LIMITED AND ITS SUBSIDIARIES
NOTES TO THE CONSOLIDATED FINANCIAL STATEMENTS(Continued)
For the years ended December 31, 2015, 2016 and 2017
(Amounts expressed in thousands of RMB unless otherwise stated)
30. | DIRECTORS’ AND SUPERVISORS’ REMUNERATION(Continued) |
| | |
| (a) | Directors’ and supervisors’ remuneration(Continued) |
| | |
| | The remuneration of each director and supervisor of the Company for the year ended December 31, 2016 is set out below: |
| Names of directors and supervisors | Fees | | Salaries | | Discretionary bonuses | | Pension costs | | total | |
| | | | | | | | | | | |
| Executive Directors: | | | | | | | | | | |
| Ge Honglin | - | | - | | - | | - | | - | |
| Ao Hong | - | | - | | - | | - | | - | |
| Lu Dongliang | - | | - | | - | | - | | - | |
| Jiang Yinggang | - | | 725 | | - | | 76 | | 801 | |
| | - | | 725 | | - | | 76 | | 801 | |
| | | | | | | | | | | |
| Non-executive Directors: | | | | | | | | | | |
| Yu Dehui | - | | - | | - | | - | | - | |
| Liu Caiming | - | | - | | - | | - | | - | |
| Wang Jun | 150 | | - | | - | | - | | 150 | |
Lie-A-Cheong Tai- Chong, David | 204 | | - | | - | | - | | 204 | |
| Chen Lijie | 204 | | - | | - | | - | | 204 | |
| Hu Shihai | 204 | | - | | - | | - | | 204 | |
| | 762 | | - | | - | | - | | 762 | |
| | | | | | | | | | | |
| Supervisors: | | | | | | | | | | |
| Liu Xiangmin | - | | - | | - | | - | | - | |
| Yuan Li | - | | - | | - | | - | | - | |
| Wang Jun | - | | - | | - | | - | | - | |
| Wu Zuoming | - | | 250 | | - | | 38 | | 288 | |
| Zhao Zhao | - | | - | | - | | - | | - | |
| | - | | 250 | | - | | 38 | | 288 | |
| | | | | | | | | | | |
| Total | 762 | | 975 | | - | | 114 | | 1,851 | |
ALUMINUM CORPORATION OF CHINA LIMITED AND ITS SUBSIDIARIES
NOTES TO THE CONSOLIDATED FINANCIAL STATEMENTS(Continued)
For the years ended December 31, 2015, 2016 and 2017
(Amounts expressed in thousands of RMB unless otherwise stated)
30. | DIRECTORS’ AND SUPERVISORS’ REMUNERATION(Continued) |
| | |
| (a) | Directors’ and supervisors’ remuneration(Continued) |
| | |
| | The remuneration of each director and supervisor of the Company for the year ended December 31, 2017 is set out below: |
| Names of directors and supervisors | Fees | | Salaries | | Discretionary bonuses | | Pension costs | | total | |
| | | | | | | | | | | |
| Executive Directors: | | | | | | | | | | |
| Yu Dehui(Note (i)) | - | | - | | - | | - | | - | |
| Lu Dongliang(Note (iii)) | - | | - | | - | | - | | - | |
| Jiang Yinggang | - | | 822 | | - | | 83 | | 905 | |
| | - | | 822 | | - | | 83 | | 905 | |
| | | | | | | | | | | |
| Non-executive Directors: | | | | | | | | | | |
| Ao Hong(Note ii)) | - | | - | | - | | - | | - | |
| Liu Caiming | - | | - | | - | | - | | - | |
| Wang Jun | 150 | | - | | - | | - | | 150 | |
| Chen Lijie | 206 | | - | | - | | - | | 206 | |
| Lie-A-Cheong Tai-Chong, David | 206 | | - | | - | | - | | 206 | |
| Hu Shihai | 206 | | - | | - | | - | | 206 | |
| | 768 | | - | | - | | - | | 768 | |
| | | | | | | | | | | |
| Supervisors: | | | | | | | | | | |
| Liu Xiangmin | - | | - | | - | | - | | - | |
| Wang Jun | - | | - | | - | | - | | - | |
| Wu Zuoming | - | | 548 | | - | | 83 | | 631 | |
| | - | | 548 | | - | | 83 | | 631 | |
| | | | | | | | | | | |
| Total | 768 | | 1,370 | | - | | 166 | | 2,304 | |
| | Note: | |
| | | |
| | (i) | Considering that Mr. Yu Dehui’s decision making authority and major duties in the Company fall within the definition of the responsibility of an executive director during his tenure of service as the Chairman of the Company, Mr. Yu was re-designated from a non-executive Director to an executive Director with effect from August 17, 2017. |
| | | |
| | (ii) | Due to re-arrangement of work, and as considered and approved at the twentieth meeting of the sixth session of the Board, Mr. Ao Hong resigned as the president of the Company on February 13, 2018. Since Mr. Ao Hong would not hold any executive position in the Company, he was re-designated from an executive Director to a non-executive Director on the same date. |
| | | |
| | (iii) | On February 13, 2018, as considered and approved at the twentieth meeting of the sixth session of the Board, the Company appointed Mr. Lu Dongliang as the president of the Company and dismissed him from the position of senior vice president of the Company. |
ALUMINUM CORPORATION OF CHINA LIMITED AND ITS SUBSIDIARIES
NOTES TO THE CONSOLIDATED FINANCIAL STATEMENTS(Continued)
For the years ended December 31, 2015, 2016 and 2017
(Amounts expressed in thousands of RMB unless otherwise stated)
30. | DIRECTORS’ AND SUPERVISORS’ REMUNERATION(Continued) |
| | |
| (a) | Directors’ and supervisors’ remuneration(Continued) |
| | |
| | The remuneration of the directors and supervisors of the Company fell within the following band: |
| | | Number of individuals | |
| | 2015 | 2016 | 2017 | |
| | | | | | |
| Nil to RMB1,000,000 | 16 | 15 | | 15 | |
| | During the year, no options were granted to the directors or the supervisors of the Company (2015: Nil, 2016: Nil). |
| | |
| | During the year, no emoluments were paid to the directors or the supervisors of the Company (among which included the five highest paid employees) as an inducement to join or upon joining the Company or as compensation for loss of office (2015: Nil, 2016: Nil). |
| | |
| | No directors or supervisors of the Company waived any remuneration during the years 2015, 2016 and 2017. |
| | |
| (b) | Five highest paid individuals |
| | |
| | During the year ended December 31, 2017, the five highest paid employees of the Group include one director and one supervisor (2015: one director and one supervisor, 2016: two directors and one supervisor) whose remuneration is reflected in the analysis presented above. The remuneration payable to the remaining three individuals during 2017 (2015: three, 2016: two) is as follows: |
| | 2015 | 2016 | 2017 | |
| | | | | | |
| Basic salaries, housing fund, other allowances and benefits in kind | 1,875 | 1,450 | | 2,460 | |
| Pension costs | 204 | 152 | | 249 | |
| | | | | | |
| 2,079 | 1,602 | | 2,709 | |
| | The number of the remaining three highest paid individuals during 2017 (2015: three, 2016: two) whose remuneration fell within the following band is as follows: |
| | | | Number of employees | |
| | 2015 | | 2016 | 2017 | |
| | | | | | | |
| Nil to RMB1,000,000 | 3 | | 2 | | 3 | |
ALUMINUM CORPORATION OF CHINA LIMITED AND ITS SUBSIDIARIES
NOTES TO THE CONSOLIDATED FINANCIAL STATEMENTS(Continued)
For the years ended December 31, 2015, 2016 and 2017
(Amounts expressed in thousands of RMB unless otherwise stated)
31. | INCOME TAX BENEFIT/ (EXPENSE) |
| | | | 2015 | | | | 2016 | | | | 2017 | |
| | | | | | | | | | | | | |
| Current income tax expense: | | | | | | | | | | | | |
| — PRC corporate income tax | | | (259,758 | ) | | | (503,233 | ) | | | (841,069 | ) |
| Deferred income tax benefit | | | 485,719 | | | | 99,061 | | | | 198,802 | |
| | | | | | | | | | | | | |
| | | | 225,961 | | | | (404,172 | ) | | | (642,267 | ) |
| |
| In general, the Group’s PRC entities are subject to PRC corporate income tax at the standard rate of 25% (2015: 25%, 2016: 25%) on their respective estimated assessable profits for the year. Certain branches and subsidiaries of the Company located in the western regions of the PRC are granted tax concessions including a preferential tax rate of 15% (2015: 15%, 2016: 15%). |
ALUMINUM CORPORATION OF CHINA LIMITED AND ITS SUBSIDIARIES
NOTES TO THE CONSOLIDATED FINANCIAL STATEMENTS(Continued)
For the years ended December 31, 2015, 2016 and 2017
(Amounts expressed in thousands of RMB unless otherwise stated)
31. | INCOME TAX BENEFIT/(EXPENSE)(Continued) |
| | |
| A reconciliation of the tax expense applicable to profit before tax at the statutory rates for the countries in which the Company and the majority of its subsidiaries are domiciled to the tax expense at the effective tax rates, and a reconciliation of the applicable rates to the effective tax rates, are as follows: |
| | | | 2015 | | | | 2016 | | | | 2017 | |
| | | | | | | | | | | | | |
| Profit before income tax | | | 121,941 | | | | 1,625,545 | | | | 3,006,216 | |
| | | | | | | | | | | | | |
| Tax expense calculated at the statutory tax rate of 25% (2015 and 2016: 25%) | | | 30,485 | | | | 406,386 | | | | 751,554 | |
| Tax effects of: | | | | | | | | | | | | |
| Preferential income tax rates applicable to certain branches and subsidiaries | | | 21,442 | | | | (3,322 | ) | | | (287,081 | ) |
| Impact of change in income tax rate | | | 4,538 | | | | 5,945 | | | | 98,150 | |
| Tax losses with no deferred tax assets recognized | | | 445,056 | | | | 267,288 | | | | 296,728 | |
| Deductible temporary differences with no deferred tax assets recognized | | | 241,812 | | | | 78,644 | | | | 363,809 | |
| Utilisation of previously unrecognized tax losses and deductible temporary differences | | | (358,106 | ) | | | (203,423 | ) | | | (258,232 | ) |
| Tax incentive in relation to deduction of certain expenses | | | (2,502 | ) | | | (3,769 | ) | | | (43,846 | ) |
| Non-taxable income | | | (149,613 | ) | | | (89,602 | ) | | | (126,101 | ) |
| Expenses not deductible for tax purposes | | | 30,280 | | | | 80,014 | | | | 49,636 | |
| Write-off of unrecoverable deferred tax assets previously recognized | | | 76,775 | | | | 3,315 | | | | 49,808 | |
| Unrecognized taxable temporary differences relating to equity investments | | | (351,846 | ) | | | — | | | | — | |
| Recognition of deferred tax assets related to deductible temporary differences and tax losses previously not recognized | | | (238,728 | ) | | | (117,513 | ) | | | (274,726 | ) |
| True-up adjustments in respect of prior year’s annual income tax filings and others | | | 24,446 | | | | (19,791 | ) | | | 22,568 | |
| | | | | | | | | | | | | |
| Income tax expense | | | (225,961 | ) | | | 404,172 | | | | 642,267 | |
| | | | | | | | | | | | | |
| Effective tax rate | | | (185 | %) | | | 25 | % | | | 21 | % |
| Share of income tax expense of associates and joint ventures of RMB86 million (2015: RMB41 million, 2016: RMB64 million) and RMB11 million (2015: RMB21 million, 2016: RMB22 million) is included in “share of profits and losses of associates” and “share of profits and losses of joint ventures”, respectively. |
ALUMINUM CORPORATION OF CHINA LIMITED AND ITS SUBSIDIARIES
NOTES TO THE CONSOLIDATED FINANCIAL STATEMENTS(Continued)
For the years ended December 31, 2015, 2016 and 2017
(Amounts expressed in thousands of RMB unless otherwise stated)
| 32. | EARNINGS PER SHARE ATTRIBUTABLE TO ORDINARY EQUITY |
| HOLDERS OF THE PARENT |
| | |
| (a) | Basic |
| | |
| | The basic earnings per share amount is calculated by dividing the earnings attributable to ordinary equity holders of the parent by the weighted average number of shares in issue during the year. |
| | | | 2015 | | | | 2016 | | | | 2017 | |
| | | | | | | | | | | | | |
| Profit attributable to owners of the parent(RMB) | | | 129,510,705 | | | | 368,411,780 | | | | 1,378,435,350 | |
| Other equity instruments’ distribution(RMB) | | | (19,287,671 | ) | | | (110,000,000 | ) | | | (110,000,000 | ) |
| | | | 110,223,034 | | | | 258,411,780 | | | | 1,268,435,350 | |
| | | | | | | | | | | | | |
| Weighted average number of ordinary shares in issue | | | 14,272,716,517 | | | | 14,903,798,236 | | | | 14,903,798,236 | |
| | | | | | | | | | | | | |
| Basic earnings per share(RMB) | | | 0.01 | | | | 0.02 | | | | 0.09 | |
The basic earnings per share amount is calculated by dividing the earnings attributable to ordinary equity holders of the parent by the weighted average number of shares in issue during the year.
For the purpose of calculating basic earnings per share, the Group adjusted (i) the profit attributable to owners of the parent for the after-tax amounts of cumulative distribution reserved for the period of other equity instruments, which were issued by the Group and classified as equity instruments, and (ii) the weighted average effect of the shares to be issued as a consideration to acquire the non-controlling interests as disclosed in note 18(b).
| | | 2016 | | | 2017 | | | 2018 | |
| | | | | | | | | | |
| Profit attributable to ordinary equity holders of the parent(RMB) | | | 365,697,352 | | | | 1,413,028,383 | | | | 746,477,441 | |
| Other equity instruments’ distribution reserved(RMB) | | | (110,000,000 | ) | | | (110,000,000 | ) | | | (129,282,192 | ) |
| | | | 255,697,352 | | | | 1,303,028,383 | | | | 617,195,249 | |
| | | | | | | | | | | | | |
Weighted average number of ordinary shares in issue
| | | 14,903,798,236 | | | | 14,903,798,236 | | | | 14,903,798,236 | |
| Effect of equity exchange arrangement (Note 18(b)) | | | — | | | | — | | | | 1,938,915,502 | |
| | | | 14,903,798,236 | | | | 14,903,798,236 | | | | 16,842,713,738 | |
| | | | | | | | | | | | | |
| Basic earnings per share(RMB) | | | 0.017 | | | | 0.087 | | | | 0.037 | |
The diluted earnings per share amounts for the years ended December 31, 2016, 2017 and 2018 are the same as the basic earnings per share amounts as there were no dilutive potential shares during those years.
| | |
| | The diluted earnings per share amounts for the years ended December 31, 2015, 2016 and 2017 are the same as the basic earnings per share amounts as there were no dilutive potential shares during those years. |
| | |
| 33. | DIVIDENDS |
According to the articles of association of the Company, the Company considers that the maximum limit of profit appropriation to its shareholders is the lowest of:
| |
| According to the articles of association of the Company, the Company considers the maximum limit of profit appropriation to its shareholders is the lowest of: |
| | |
| (i) | the sum of the net profit and the opening retained earnings for the current period in accordance with IFRSs; |
| | |
| (ii) | the sum of the net profit and the opening retained earnings for the current period in accordance with the PRC Accounting Standards for Business Enterprises; and |
| | |
| (iii) | the amount limited by the Company Law of the PRC. |
According to the resolution of the board of directors dated 28 March 2019, the directors did not propose any final dividend for the year ended December 31, 2018, which is to be approved by the shareholders.
| | | |
| According to the resolution of the Board of Directors dated March 22, 2018, the directors did not propose any final dividend for the year ended December 31, 2017, which is to be approved by the shareholders. |
ALUMINUM CORPORATION OF CHINA LIMITED AND ITS SUBSIDIARIES
NOTES TO THE CONSOLIDATED FINANCIAL STATEMENTS(Continued)
For the years ended December 31, 2015, 2016 and 2017
(Amounts expressed in thousands of RMB unless otherwise stated)
34. | NOTES TO THE CONSOLIDATED STATEMENT OF CASH FLOWS |
| (a) | Reconciliation of profit before taxation to cash generated from operations |
| | | | Notes | | | | 2015 | | | | 2016 | | | | 2017 | |
| | | | | | | | | | | | | | | | | |
| Cash flows generated from operating activities | | | | | | | | | | | | | | | | |
| | | | | | | | | | | | | | | | | |
| Profit before income tax | | | | | | | 121,941 | | | | 1,625,545 | | | | 3,006,216 | |
| | | | | | | | | | | | | | | | | |
| Adjustments for: | | | | | | | | | | | | | | | | |
| Share of profits and losses of joint ventures | | | 9 (a) | | | | (23,238 | ) | | | 95,508 | | | | (8,151 | ) |
| Share of profits and losses of associates | | | 9 (b) | | | | (284,531 | ) | | | (115,091 | ) | | | 165,249 | |
| Depreciation of property, plant and equipment | | | 6 | | | | 6,944,990 | | | | 6,577,514 | | | | 6,606,283 | |
| Depreciation of investment properties | | | 7 | | | | — | | | | 1,426 | | | | 14,105 | |
| Gain on disposal of other property, plant and equipment and land use rights, net | | | 27 | | | | (2,317,857 | ) | | | (816,721 | ) | | | (77,091 | ) |
| Impairment losses on property, plant and equipment | | | 6 | | | | 10,011 | | | | 57,080 | | | | 15,632 | |
| Impairment losses of intangible assets | | | 5 | | | | — | | | | — | | | | 8,134 | |
| Amortization of intangible assets | | | 5 | | | | 255,098 | | | | 243,771 | | | | 276,877 | |
| Amortization of land use rights | | | 8 | | | | 104,459 | | | | 99,724 | | | | 96,074 | |
| Amortization of prepaid expenses included in other non-current assets | | | | | | | 83,992 | | | | 64,918 | | | | 127,793 | |
| Realized and unrealized losses on futures, option and forward contracts | | | 27 | | | | 690,818 | | | | 1,135,682 | | | | 155,024 | |
| Gain on previously held equity interest remeasured at acquisition-date fair value | | | 27 | | | | — | | | | — | | | | (117,640 | ) |
| Gain on disposals and deemed disposals of subsidiaries | | | 27 | | | | (2,588,134 | ) | | | — | | | | (325,022 | ) |
| Gain on disposal of investments in associates | | | 27 | | | | (832,369 | ) | | | (128,833 | ) | | | — | |
| Gain on disposal of and dividends from available-for-sale investments | | | 27 | | | | (38,469 | ) | | | (140,929 | ) | | | (79,408 | ) |
| Receipt of government subsidies | | | | | | | (282,635 | ) | | | (207,146 | ) | | | (202,359 | ) |
| Interest income | | | | | | | (340,278 | ) | | | (353,535 | ) | | | (183,017 | ) |
| Finance cost | | | 28 | | | | 5,979,489 | | | | 5,019,908 | | | | 5,189,929 | |
| Change in special reserve | | | | | | | (102,426 | ) | | | 9,148 | | | | 56,729 | |
| Others | | | | | | | 14,852 | | | | (7,531 | ) | | | (16,950 | ) |
| | | | | | | | | | | | | | | | | |
| | | | | | | | 7,395,713 | | | | 13,160,438 | | | | 14,708,407 | |
ALUMINUM CORPORATION OF CHINA LIMITED AND ITS SUBSIDIARIES
NOTES TO THE CONSOLIDATED FINANCIAL STATEMENTS(Continued)
For the years ended December 31, 2015, 2016, 2017 and 20172018
(Amounts expressed in thousands of RMB unless otherwise stated)
| 34. | NOTES TO THE CONSOLIDATED STATEMENT OF CASH FLOWS(Continued) |
| (a) | Reconciliation of profit before taxation to cash generated from operations(Continued) |
| | | | | | | 2015 | | | 2016 | | | 2017 | |
| Cash flows generated from operating activities(Continued) | | | | | | | | | | | | | |
| | | | | | | | | | | | | | |
| Changes in working capital: | | | | | | | | | | | | | |
| Decrease/(Increase) in inventories | | | | | | 1,805,110 | | | 2,412,815 | | | (2,605,918 | ) |
| Increase in trade and notes receivables | | | | | | (68,353 | ) | | (3,679,766 | ) | | (2,123,242 | ) |
| Decrease in other current assets | | | | | | (804,811 | ) | | 3,466,467 | | | 1,275,535 | |
| Increase in restricted cash | | | | | | (109,542 | ) | | (264,508 | ) | | (137,745 | ) |
| Increase in other non-current assets | | | | | | (566,664 | ) | | (133,249 | ) | | (420,486 | ) |
| (Decrease)/Increase in trade and notes payables | | | | | | (618,583 | ) | | (3,401,529 | ) | | 1,511,908 | |
| Increase in other payables and accrued liabilities | | | | | | 1,024,249 | | | 40,469 | | | 1,875,014 | |
| Decrease in other non-current liabilities | | | | | | (461,995 | ) | | (15,804 | ) | | (7,805 | ) |
| | | | | | | | | | | | | | |
| Cash generated from operations | | | | | | 7,595,124 | | | 11,585,333 | | | 14,075,668 | |
| | | | | | | | | | | | | | |
| PRC corporate income taxes paid | | | | | | (277,378 | ) | | (54,933 | ) | | (947,891 | ) |
| | | | | | | | | | | | | | |
| Net cash generated from operating activities | | | | | | 7,317,746 | | | 11,530,400 | | | 13,127,777 | |
| | | | | | | | | | | | | | |
| Non-cash transactions of investing activities and financing activities | | | | | | | | | | | | | |
| Capital injection in an associate and joint ventures by non-cash assets | | | | | | 793,364 | | | 371,051 | | | 186,450 | |
| Endorsement of notes receivables accepted from sale of goods or services for purchase of property, plant and equipment | | | | | | 1,342,759 | | | 1,568,488 | | | 372,816 | |
| Acquisition of business | | | 38 (h) | | | — | | | — | | | 50,058 | |
| Finance lease | | | | | | — | | | — | | | 44,342 | |
| | | Notes | | | 2016 | | | 2017 | | | 2018 | |
| | | | | | | | | | | | | |
| Cash flows generated from operating activities | | | | | | | | | | | | | | | | |
| | | | | | | | | | | | | | | | | |
| Profit before income tax | | | | | | | 1,620,689 | | | | 3,049,010 | | | | 2,303,511 | |
| | | | | | | | | | | | | | | | | |
| Adjustments for: | | | | | | | | | | | | | | | | |
| Share of profits and losses of joint ventures | | | 9 | (a) | | | 95,508 | | | | (8,151 | ) | | | 199,452 | |
| Share of profits and losses of associates | | | 9 | (b) | | | (115,091 | ) | | | 165,249 | | | | (39,335 | ) |
| Depreciation of property, plant and equipment | | | 6 | | | | 6,590,248 | | | | 6,554,775 | | | | 7,499,322 | |
| Depreciation of investment properties | | | 7 | | | | 1,426 | | | | 14,105 | | | | 22,229 | |
| Gain on disposal of other property, plant and equipment and land use rights, net | | | 27 | | | | (245,451 | ) | | | (76,739 | ) | | | (101,098 | ) |
| Gain on disposal of Environmental Protection Assets | | | | | | | (571,270 | ) | | | — | | | | — | |
| Impairment losses on property, plant and equipment | | | 6 | | | | 57,080 | | | | 16,200 | | | | 7,450 | |
| Impairment losses of intangible assets | | | 5 | | | | — | | | | 8,134 | | | | — | |
| Amortization of intangible assets | | | 5 | | | | 244,361 | | | | 275,877 | | | | 295,629 | |
| Amortization of land use rights | | | 8 | | | | 99,724 | | | | 91,579 | | | | 107,809 | |
| Amortization of prepaid expenses included in other non-current assets | | | | | | | 64,918 | | | | 127,793 | | | | 130,148 | |
| Realized and unrealized losses/(gains) on futures, option and forward contracts | | | 27 | | | | 1,135,682 | | | | 155,024 | | | | (141,459 | ) |
| Gain on previously held equity interest remeasured at acquisition-date fair value | | | 27 | | | | — | | | | (117,640 | ) | | | (748,086 | ) |
| Gain on disposals and deemed disposals of subsidiaries | | | 27 | | | | — | | | | (325,022 | ) | | | (3,517 | ) |
| Loss on disposal of investments in associates | | | 27 | | | | (128,833 | ) | | | — | | | | 1,904 | |
| Gain on disposal of and dividends from equity investments | | | 27 | | | | (140,929 | ) | | | (79,408 | ) | | | (109,914 | ) |
| Receipt of government subsidies | | | | | | | (207,146 | ) | | | (202,359 | ) | | | (158,109 | ) |
| Interest income | | | | | | | (353,619 | ) | | | (183,015 | ) | | | — | |
| Finance costs | | | 28 | | | | 5,019,908 | | | | 5,203,422 | | | | 4,882,496 | |
| Change in special reserve | | | | | | | 9,839 | | | | 58,743 | | | | 6,605 | |
| Others | | | | | | | 55 | | | | (16,950 | ) | | | 75,380 | |
| | | | | | | | | | | | | | | | | |
| | | | | | | | 13,177,099 | | | | 14,710,627 | | | | 14,230,417 | |
ALUMINUM CORPORATION OF CHINA LIMITED AND ITS SUBSIDIARIES
NOTES TO THE CONSOLIDATED FINANCIAL STATEMENTS(Continued)
For the years ended December 31, 2015, 2016, 2017 and 20172018
(Amounts expressed in thousands of RMB unless otherwise stated)
| 34. | NOTES TO THE CONSOLIDATED STATEMENT OF CASH FLOWS(Continued)(continued) |
| | |
| (b) | Reconciliation of liabilities arising from financing activities |
| | |
| The table below details changes in the Group’s liabilities from financing activities, including both cash and non-cash changes. Liabilities arising from financing activities are liabilities for which cash flows was, or future cash flows will be, classified in the Group’s consolidated statement of cash flows as cash flows from financing activities. |
| (a) | Reconciliation of profit before taxation to cash generated from operations(continued) |
| | | | Financial liabilities at fair value through profit or loss | | | Trade and notes payables | | | Financial liabilities included in other current payables and accrued expenses | | | Financial Liabilities included in other non-current Liabilities | | | Interest bearing loans and borrowings | | | Total | |
| | | | | | | | | | | | | | | | | | | | |
| As at January 1, 2017 | | | 3,575 | | | 11,342,870 | | | 9,572,490 | | | 789,720 | | | 105,782,141 | | | 127,490,796 | |
| | | | | | | | | | | | | | | | | | | | |
| Net cash generated from operating activities | | | — | | | 1,511,909 | | | 1,379,505 | | | — | | | — | | | 2,891,414 | |
| | | | | | | | | | | | | | | | | | | | |
| Net cash flows from/(used in) investing activities | | | 85,851 | | | (530,457 | ) | | 640,157 | | | (73,701 | ) | | 2,400,464 | | | 2,522,314 | |
| | | | | | | | | | | | | | | | | | | | |
| Proceeds from gold leasing arrangement | | | — | | | — | | | — | | | — | | | 7,804,083 | | | 7,804,083 | |
| Proceeds from issuance of short-term bonds and medium-term notes, net of issuance costs | | | — | | | — | | | — | | | — | | | 3,478,550 | | | 3,478,550 | |
| Repayments of medium-term notes and short-term bonds | | | — | | | — | | | — | | | — | | | (16,300,000 | ) | | (16,300,000 | ) |
| Repayments of gold leasing arrangement | | | — | | | — | | | — | | | — | | | (4,000,000 | ) | | (4,000,000 | ) |
| Drawdown of short-term and long-term bank and other loans | | | — | | | — | | | — | | | — | | | 83,523,749 | | | 83,523,749 | |
| Repayments of short-term and long-term bank and other loans | | | — | | | — | | | — | | | — | | | (78,673,459 | ) | | (78,673,459 | ) |
| Proceeds from finance lease, net of deposit and transaction costs | | | — | | | — | | | — | | | — | | | 1,000,036 | | | 1,000,036 | |
| Capital elements of finance lease rental payment | | | — | | | — | | | — | | | — | | | (2,462,250 | ) | | (2,462,250 | ) |
| Dividends paid by subsidiaries to non-controlling shareholders | | | — | | | — | | | 2,446 | | | — | | | — | | | 2,446 | |
| Amortization of unrecognized finance expenses and interest expense | | | | | | | | | | | | 16,352 | | | 398,371 | | | 414,723 | |
| Interest paid | | | — | | | — | | | (262,105 | ) | | — | | | — | | | (262,105 | ) |
| Reclassification | | | — | | | — | | | (36,690 | ) | | 36,690 | | | — | | | — | |
| Net cash (used in)/ generated from financing activities | | | — | | | — | | | (296,349 | ) | | 53,042 | | | (5,230,920 | ) | | (5,474,227 | ) |
| | | | | | | | | | | | | | | | | | | | |
| Net foreign exchange differences | | | — | | | (2,352 | ) | | (11,347 | ) | | — | | | 90,588 | | | 76,889 | |
| | | | | | | | | | | | | | | | | | | | |
| As at December 31, 2017 | | | 89,426 | | | 12,321,970 | | | 11,284,456 | | | 769,061 | | | 103,042,273 | | | 127,507,186 | |
| | | 2016 | | | 2017 | | | 2018 | |
| | | | | | | | | | |
| Cash flows generated from operating activities (continued) | | | | | | | | | | | | |
| | | | | | | | | | | | | |
| Changes in working capital: | | | | | | | | | | | | |
| Decrease/(increase) in inventories | | | 2,398,030 | | | | (2,662,507 | ) | | | 1,194,454 | |
| Increase in trade and notes receivables | | | (3,655,735 | ) | | | (1,961,968 | ) | | | (2,486,201 | ) |
| Decrease in other current assets | | | 3,463,799 | | | | 1,275,535 | | | | 916,681 | |
| (Increase)/decrease in restricted cash | | | (264,508 | ) | | | (137,745 | ) | | | 530,284 | |
| (Increase)/decrease in other non-current assets | | | (132,203 | ) | | | (422,845 | ) | | | 425,768 | |
| (Decrease)/increase in trade and notes payables | | | (3,405,737 | ) | | | 1,599,294 | | | | (5,660 | ) |
| Increase/(decrease) in other payables and accrued liabilities | | | 73,357 | | | | 1,672,658 | | | | (945,270 | ) |
| Increase in other non-current liabilities | | | 11,105 | | | | 81,878 | | | | 105,386 | |
| | | | | | | | | | | | | |
| Cash generated from operations | | | 11,665,207 | | | | 14,154,927 | | | | 13,965,859 | |
| | | | | | | | | | | | | |
| PRC corporate income taxes paid | | | (55,898 | ) | | | (949,355 | ) | | | (947,683 | ) |
| | | | | | | | | | | | | |
| Net cash generated from operating activities | | | 11,609,309 | | | | 13,205,572 | | | | 13,018,176 | |
| | | | | | | | | | | | | |
| Non-cash transactions of investing activities and financing activities | | | | | | | | | | | | |
| Capital injection to an associate and joint ventures by non-cash assets | | | 371,051 | | | | 186,450 | | | | — | |
| Equity exchange arrangement (note 18(b)) | | | — | | | | — | | | | 10,735,214 | |
| Endorsement of notes receivables accepted from the sale of goods or services for purchase of property, plant and equipment | | | 1,568,488 | | | | 372,816 | | | | 2,384,046 | |
| Acquisition of businesses at non-cash consideration | | | — | | | | 50,058 | | | | 70,087 | |
| Finance lease | | | — | | | | 44,342 | | | | 113,305 | |
ALUMINUM CORPORATION OF CHINA LIMITED AND ITS SUBSIDIARIES
NOTES TO THE CONSOLIDATED FINANCIAL STATEMENTS(Continued)
For the years ended December 31, 2015, 2016, 2017 and 20172018
(Amounts expressed in thousands of RMB unless otherwise stated)
| 35.34. | SIGNIFICANT RELATED PARTY BALANCES AND TRANSACTIONS |
| |
| The Company is controlled by Chinalco, the parent company and a state-owned enterprise established in Mainland China. Chinalco itself is controlled by the PRC government, which also owns a significant portion of the productive assets in Mainland China. In accordance with IAS 24NOTES TO THE CONSOLIDATED STATEMENT OF CASH FLOWSRelated Party Disclosures,(continued)government-related entities and their subsidiaries, directly or indirectly controlled, jointly controlled or significantly influenced by the PRC government are defined as related parties of the Group. On that basis, related parties include Chinalco and its subsidiaries (other than the Group), other government-related entities and their subsidiaries (“other state-owned enterprises“), other entities and corporations over which the Company is able to control or exercise significant influence and key management personnel of the Company and Chinalco as well as their close family members. |
| |
| For the purposes of the related party transaction disclosures, the directors of the Company consider that meaningful information in respect of related party transactions has been adequately disclosed. |
| |
| In addition to the related party information and transactions disclosed elsewhere in the consolidated financial statements, the following is a summary of significant related party transactions in the ordinary course of business between the Group and its related parties during the year. |
| | |
| (a) | Significant related party transactions |
| | | | | | 2015 | | | 2016 | | | 2017 | |
| | | | Note | | | | | | | | | | |
| | | | | | | | | | | | | | |
| Sales of goods and services rendered: | | | | | | | | | | | | | |
| Sales of materials and finished goods to: | | | (i) | | | | | | | | | | |
| Chinalco and its subsidiaries | | | (ix) | | | 10,998,505 | | | 10,311,722 | | | 10,612,330 | |
| Associates of Chinalco | | | | | | 703,628 | | | 688,308 | | | 682,992 | |
| Joint ventures | | | | | | 79,034 | | | 648,145 | | | 2,031,159 | |
| Associates | | | | | | 2,165,445 | | | 605,449 | | | 705,052 | |
| | | | | | | | | | | | | | |
| | | | | | | 13,946,612 | | | 12,253,624 | | | 14,031,533 | |
| | | | | | | | | | | | | | |
| Provision of engineering, construction and supervisory services to: | | | (iii) | | | | | | | | | | |
| Chinalco and its subsidiaries | | | (ix) | | | 46,328 | | | 101,323 | | | 77,095 | |
| Joint ventures | | | | | | — | | | 41,423 | | | 2,046 | |
| | | | | | | | | | | | | | |
| | | | | | | 46,328 | | | 142,746 | | | 79,141 | |
| | | | | | | | | | | | | | |
| Provision of utility services to: | | | (ii) | | | | | | | | | | |
| Chinalco and its subsidiaries | | | (ix) | | | 314,544 | | | 567,628 | | | 581,566 | |
| Associates of Chinalco | | | | | | 14,803 | | | 4,444 | | | 8,776 | |
| Joint ventures | | | | | | — | | | 3,031 | | | 118,280 | |
| Associates | | | | | | 553 | | | 584 | | | 1,122 | |
| | | | | | | | | | | | | | |
| | | | | | | 329,900 | | | 575,687 | | | 709,744 | |
(b) Reconciliation of liabilities arising from financing activities
The table below details changes in the Group’s liabilities from financing activities, including both cash and non-cash changes. Liabilities arising from financing activities are liabilities for which cash flows were, or future cash flows will be, classified in the Group’s consolidated statement of cash flows as cash flows from financing activities.
| | | Financial
liabilities at fair
value through
profit or loss | | | Trade and
notes payables | | | Financial
liabilities
included in other
current payables
and accrued
expenses | | | Financial
liabilities
included in
other non-
current
liabilities | | | Interest bearing
loans and
borrowings | | | Total | |
| | | | | | | | | | | | | | | | | | | |
| As at January 1, 2017 | | | 3,575 | | | | 11,532,163 | | | | 9,793,534 | | | | 789,720 | | | | 105,968,641 | | | | 128,087,633 | |
| | | | | | | | | | | | | | | | | | | | | | | | | |
| Net cash generated from operating activities | | | — | | | | 1,361,087 | | | | 1,253,220 | | | | — | | | | — | | | | 2,614,307 | |
| | | | | | | | | | | | | | | | | | | | | | | | | |
| Net cash flows from/(used in) investing activities | | | 85,851 | | | | (530,457 | ) | | | 640,157 | | | | (73,701 | ) | | | 2,400,464 | | | | 2,522,314 | |
| Payment of upfront interest of gold leasing arrangement | | | — | | | | — | | | | — | | | | — | | | | 7,804,083 | | | | 7,804,083 | |
| Proceeds from issuance of short-term bonds and medium-term notes, net of issuance costs | | | — | | | | — | | | | — | | | | — | | | | 3,478,550 | | | | 3,478,550 | |
| Repayments of medium-term notes and short-term bonds | | | — | | | | — | | | | — | | | | — | | | | (16,300,000 | ) | | | (16,300,000 | ) |
| Repayments of gold leasing arrangement | | | — | | | | — | | | | — | | | | — | | | | (4,000,000 | ) | | | (4,000,000 | ) |
| Drawdown of short-term and long-term bank and other loans | | | — | | | | — | | | | — | | | | — | | | | 83,758,749 | | | | 83,758,749 | |
| Repayments of short-term and long-term bank and other loans | | | — | | | | — | | | | — | | | | — | | | | (78,866,459 | ) | | | (78,866,459 | ) |
| Proceeds from finance lease, net of deposit and transaction costs | | | — | | | | — | | | | — | | | | — | | | | 1,000,036 | | | | 1,000,036 | |
| Capital elements of finance lease rental payment | | | — | | | | — | | | | — | | | | — | | | | (2,462,250 | ) | | | (2,462,250 | ) |
| Dividends paid by subsidiaries to non-controlling shareholders | | | — | | | | — | | | | 2,446 | | | | — | | | | — | | | | 2,446 | |
| Amortization of unrecognized finance expenses and interest expense | | | — | | | | — | | | | — | | | | 16,352 | | | | 398,371 | | | | 414,723 | |
| Interest paid | | | — | | | | — | | | | (278,084 | ) | | | — | | | | — | | | | (278,084 | ) |
| Reclassification | | | — | | | | — | | | | (36,690 | ) | | | 36,690 | | | | — | | | | — | |
| Net cash (used in)/ generated from financing activities | | | — | | | | — | | | | (312,328 | ) | | | 53,042 | | | | (5,188,920 | ) | | | (5,448,206 | ) |
| Net foreign exchange differences | | | — | | | | (2,352 | ) | | | (11,347 | ) | | | — | | | | 90,588 | | | | 76,889 | |
| As at December 31, 2017 | | | 89,426 | | | | 12,360,441 | | | | 11,363,236 | | | | 769,061 | | | | 103,270,773 | | | | 127,852,937 | |
ALUMINUM CORPORATION OF CHINA LIMITED AND ITS SUBSIDIARIES
NOTES TO THE CONSOLIDATED FINANCIAL STATEMENTS(Continued)
For the years ended December 31, 2015, 2016, 2017 and 20172018
(Amounts expressed in thousands of RMB unless otherwise stated)
| 35.34. | SIGNIFICANT RELATED PARTY BALANCES AND TRANSACTIONSNOTES TO THE CONSOLIDATED STATEMENT OF CASH FLOWS(Continued) |
| | |
| (a) | Significant related party transactions(Continued)(continued) |
| | | | Notes | | | 2015 | | | 2016 | | | 2017 | |
| Sales of goods and services rendered:(Continued) | | | | | | | | | | | | | |
| | | | | | | | | | | | | | |
| Rental revenue of land use rights and buildings from: | | | (vi) | | | | | | | | | | |
| Chinalco and its subsidiaries | | | (ix) | | | 34,476 | | | 33,231 | | | 40,875 | |
| Associates of Chinalco | | | | | | 249 | | | — | | | — | |
| Joint ventures | | | | | | — | | | — | | | 426 | |
| | | | | | | | | | | | | | |
| | | | | | | 34,725 | | | 33,231 | | | 41,301 | |
| Purchases of goods and services: | | | | | | | | | | | | | |
| | | | | | | | | | | | | | |
| Purchases of engineering, construction and supervisory services from: | | | (iii) | | | | | | | | | | |
| Chinalco and its subsidiaries | | | (ix) | | | 1,737,344 | | | 1,525,349 | | | 1,205,355 | |
| | | | | | | | | | | | | | |
| Purchases of key and auxiliary materials, equipment and finished goods from: | | | (iv) | | | | | | | | | | |
| Chinalco and its subsidiaries | | | (ix) | | | 1,640,051 | | | 1,626,782 | | | 3,849,889 | |
| Joint ventures | | | | | | 1,276,078 | | | 3,799,116 | | | 6,516,087 | |
| Associates | | | | | | 414,539 | | | 31,413 | | | 1,175 | |
| | | | | | | | | | | | | | |
| | | | | | | 3,330,668 | | | 5,457,311 | | | 10,367,151 | |
| | | | | | | | | | | | | | |
| Provision of social services and logistics services by: | | | (v) | | | | | | | | | | |
| Chinalco and its subsidiaries | | | (ix) | | | 324,872 | | | 307,354 | | | 326,830 | |
| | | | | | | | | | | | | | |
| | | | | | | | | | | | | | |
| Provision of utility services by: | | | (ii) | | | | | | | | | | |
| Chinalco and its subsidiaries | | | (ix) | | | 643,597 | | | 686,474 | | | 1,397,346 | |
| Joint ventures | | | | | | — | | | 3,386 | | | 19,537 | |
| | | | | | | | | | | | | | |
| | | | | | | 643,597 | | | 689,860 | | | 1,416,883 | |
(b) Reconciliation of liabilities arising from financing activities(continued)
| | | Financial
liabilities at fair
value through
profit or loss | | | Trade and notes payables | | | Financial
liabilities
included in other current payables
and accrued
expenses | | | Financial
liabilities
included in
other non-
current
liabilities | | | Interest bearing
loans and
borrowings | | | Total | |
| | | | | | | | | | | | | | | | | | | |
| As at January 1, 2018 | | | 89,426 | | | | 12,360,441 | | | | 11,363,236 | | | | 769,061 | | | | 103,270,773 | | | | 127,852,937 | |
| | | | | | | | | | | | | | | | | | | | | | | | | |
| Net cash generated from operating activities | | | — | | | | (5,660 | ) | | | (669,353 | ) | | | — | | | | — | | | | (675,013 | ) |
| | | | | | | | | | | | | | | | | | | | | | | | | |
| Net cash flows from/(used in) investing activities | | | (87,660 | ) | | | 1,646,299 | | | | (193,345 | ) | | | — | | | | 7,197,213 | | | | 8,562,507 | |
| Payment of upfront interest of gold leasing arrangement | | | — | | | | — | | | | — | | | | — | | | | 2,323,105 | | | | 2,323,105 | |
| Proceeds from issuance of short-term bonds and medium-term notes, net of issuance costs | | | — | | | | — | | | | — | | | | — | | | | 13,185,034 | | | | 13,185,034 | |
| Repayments of medium-term notes and short-term bonds | | | — | | | | — | | | | — | | | | — | | | | (21,815,000 | ) | | | (21,815,000 | ) |
| Repayments of gold leasing arrangement | | | — | | | | — | | | | — | | | | — | | | | (7,519,283 | ) | | | (7,519,283 | ) |
| Drawdown of short-term and long-term bank and other loans | | | — | | | | — | | | | — | | | | — | | | | 76,899,591 | | | | 76,899,591 | |
| Repayments of short-term and long-term bank and other loans | | | — | | | | — | | | | (1,000,000 | ) | | | — | | | | (69,546,537 | ) | | | (70,546,537 | ) |
| Proceeds from finance lease, net of deposit and transaction costs | | | — | | | | — | | | | — | | | | — | | | | 1,204,843 | | | | 1,204,843 | |
| Capital elements of finance lease rental payment | | | — | | | | — | | | | — | | | | — | | | | (3,915,404 | ) | | | (3,915,404 | ) |
| Dividends paid by subsidiaries to non-controlling shareholders | | | — | | | | — | | | | 277,771 | | | | — | | | | — | | | | 277,771 | |
| Amortization of unrecognized finance expenses and interest expense | | | — | | | | — | | | | — | | | | 6,090 | | | | 521,295 | | | | 527,385 | |
| Interest paid | | | — | | | | — | | | | (449,835 | ) | | | (24,736 | ) | | | (85,579 | ) | | | (560,150 | ) |
| Reclassification | | | — | | | | — | | | | (90,644 | ) | | | 90,644 | | | | — | | | | — | |
| Net cash (used in)/ generated from financing activities | | | — | | | | — | | | | (1,262,708 | ) | | | 71,998 | | | | (8,747,935 | ) | | | (9,938,645 | ) |
| Net foreign exchange differences | | | — | | | | 6,520 | | | | 14,095 | | | | — | | | | 917 | | | | 21,532 | |
| As at December 31, 2018 | | | 1,766 | | | | 14,007,600 | | | | 9,251,925 | | | | 841,059 | | | | 101,720,968 | | | | 125,823,318 | |
ALUMINUM CORPORATION OF CHINA LIMITED AND ITS SUBSIDIARIES
NOTES TO THE CONSOLIDATED FINANCIAL STATEMENTS(Continued)
For the years ended December 31, 2015, 2016, 2017 and 20172018
(Amounts expressed in thousands of RMB unless otherwise stated)
| 35. | SIGNIFICANT RELATED PARTY BALANCES AND TRANSACTIONS |
The Company is controlled by Chinalco, the parent company and a state-owned enterprise established in Mainland China. Chinalco itself is controlled by the PRC government, which also owns a significant portion of the productive assets in Mainland China. In accordance with IAS 24Related Party Disclosures, government-related entities and their subsidiaries, directly or indirectly controlled, jointly controlled or significantly influenced by the PRC government, are defined as related parties of the Group. On that basis, related parties include Chinalco and its subsidiaries (other than the Group), other government-related entities and their subsidiaries (“other state-owned enterprises“), other entities and corporations over which the Company is able to control or exercise significant influence and key management personnel of the Company and Chinalco as well as their close family members.
For the purposes of the related party transaction disclosures, the directors of the Company consider that meaningful information in respect of related party transactions has been adequately disclosed.
In addition to the related party information and transactions disclosed elsewhere in the consolidated financial statements, the following is a summary of significant related party transactions in the ordinary course of business between the Group and its related parties during the year.
| (a) | Significant related party transactions |
| | | Note | | | 2016 | | | 2017 | | | 2018 | |
| | | | | | | | | | | | | |
| Sales of goods and services rendered: |
| Sales of materials and finished goods to: | | (i) | | | | | | | | | | |
| Chinalco and its subsidiaries | | | (ix) | | | | 10,319,958 | | | | 10,658,507 | | | | 11,248,625 | |
| Associates of Chinalco | | | | | | | 688,308 | | | | 682,992 | | | | 897,642 | |
| Joint ventures | | | | | | | 648,145 | | | | 2,031,159 | | | | 4,462,670 | |
| Associates | | | | | | | 605,449 | | | | 724,658 | | | | 2,626,780 | |
| | | | | | | | | | | | | | | | | |
| | | | | | | | 12,261,860 | | | | 14,097,316 | | | | 19,235,717 | |
| | | | | | | | | | | | | | | | | |
| Provision of engineering, construction and supervisory services to: | | | (iii) | | | | | | | | | | | | | |
| Chinalco and its subsidiaries | | | (ix) | | | | 101,323 | | | | 77,095 | | | | 5,981 | |
| Joint ventures | | | | | | | 41,423 | | | | 2,046 | | | | — | |
| Associates | | | | | | | — | | | | — | | | | 1,725 | |
| | | | | | | | 142,746 | | | | 79,141 | | | | 7,706 | |
| | | | | | | | | | | | | | | | | |
| Provision of utility services to: | | | (ii) | | | | | | | | | | | | | |
| Chinalco and its subsidiaries | | | (ix) | | | | 567,628 | | | | 581,566 | | | | 620,552 | |
| Associates of Chinalco | | | | | | | 4,444 | | | | 8,776 | | | | 15,719 | |
| Joint ventures | | | | | | | 3,031 | | | | 118,280 | | | | 186,672 | |
| Associates | | | | | | | 584 | | | | 1,122 | | | | 24,309 | |
| | | | | | | | | | | | | | | | | |
| | | | | | | | 575,687 | | | | 709,744 | | | | 847,252 | |
| | | | | | | | | | | | | | | | | |
ALUMINUM CORPORATION OF CHINA LIMITED AND ITS SUBSIDIARIES
NOTES TO THE CONSOLIDATED FINANCIAL STATEMENTS(Continued)
For the years ended December 31, 2016, 2017 and 2018
(Amounts expressed in thousands of RMB unless otherwise stated)
| 35. | SIGNIFICANT RELATED PARTY BALANCES AND TRANSACTIONS(Continued) |
| (a) | Significant related party transactions(Continued) |
| | | Notes | | | 2016 | | | 2017 | | | 2018 | |
| | | | | | | | | | | | | |
| Sales of goods and services rendered: (continued) | | | | | | | | | | | | |
| | | | | | | | | | | | | |
| Rental revenue of land use rights and buildings from: | | | (vi) | | | | | | | | | | | | | |
| Chinalco and its subsidiaries | | | (ix) | | | | 33,231 | | | | 40,875 | | | | 31,551 | |
| Joint ventures | | | | | | | — | | | | 426 | | | | 1,545 | |
| Associates | | | | | | | | | | | — | | | | 1,511 | |
| | | | | | | | | | | | | | | | | |
| | | | | | | | 33,231 | | | | 41,301 | | | | 34,607 | |
| Purchases of goods and services: | | | | | | | | | | | | | | | | |
| | | | | | | | | | | | | | | | | |
| Purchases of engineering, construction and supervisory services from: | | | (iii) | | | | | | | | | | | | | |
| Chinalco and its subsidiaries | | | (ix) | | | | 1,529,453 | | | | 1,071,283 | | | | 2,088,338 | |
| Joint ventures | | | | | | | — | | | | — | | | | 2,100 | |
| Associates | | | | | | | — | | | | 134,072 | | | | 405,993 | |
| | | | | | | | | | | | | | | | | |
| | | | | | | | 1,529,453 | | | | 1,205,355 | | | | 2,496,431 | |
| | | | | | | | | | | | | | | | | |
| Purchases of key and auxiliary materials, equipment and finished goods from: | | | (iv) | | | | | | | | | | | | | |
| Chinalco and its subsidiaries | | | (ix) | | | | 1,660,529 | | | | 3,850,073 | | | | 3,513,420 | |
| Associates of Chinalco | | | | | | | | | | | — | | | | 18,917 | |
| Joint ventures | | | | | | | 3,799,116 | | | | 6,516,087 | | | | 8,182,251 | |
| Associates | | | | | | | 31,413 | | | | 1,175 | | | | 2,108,072 | |
| | | | | | | | | | | | | | | | | |
| | | | | | | | 5,491,058 | | | | 10,367,335 | | | | 13,822,660 | |
| | | | | | | | | | | | | | | | | |
| Provision of social services and logistics services by: | | | (v) | | | | | | | | | | | | | |
| Chinalco and its subsidiaries | | | (ix) | | | | 307,354 | | | | 326,830 | | | | 312,062 | |
| | | | | | | | | | | | | | | | | |
| | | | | | | | | | | | | | | | | |
| Provision of utility services by: | | | (ii) | | | | | | | | | | | | | |
| Chinalco and its subsidiaries | | | (ix) | | | | 686,474 | | | | 1,412,722 | | | | 992,827 | |
| Associates of Chinalco | | | | | | | — | | | | — | | | | 96,510 | |
| Joint ventures | | | | | | | 3,386 | | | | 19,537 | | | | 26,269 | |
| Associates | | | | | | | — | | | | — | | | | 77,432 | |
| | | | | | | | | | | | | | | | | |
| | | | | | | | 689,860 | | | | 1,432,259 | | | | 1,193,038 | |
ALUMINUM CORPORATION OF CHINA LIMITED AND ITS SUBSIDIARIES
NOTES TO THE CONSOLIDATED FINANCIAL STATEMENTS(Continued)
For the years ended December 31, 2016, 2017 and 2018
(Amounts expressed in thousands of RMB unless otherwise stated)
| 35. | SIGNIFICANT RELATED PARTY BALANCES AND TRANSACTIONS(Continued) |
| (a) | Significant related party transactions(Continued) |
| | | Notes | | 2015 | | 2016 | | 2017 | | | Notes | | 2016 | | | 2017 | | | 2018 | |
| Purchases of goods and services:(Continued) | | | | | | | | | | |
| | | | | | | | | | | | | | | | | | | |
| Provision of product processing services by: | | (vii) | | | | | | | | | |
| Chinalco and its subsidiaries | | (ix) | | | 62,623 | | | — | | | — | | |
| | | | | | | | | | | |
| Purchases of goods and services: (continued) | | Purchases of goods and services: (continued) | | | | | | | |
| Provision of other services by: | | | | | | | | | | | | | | | | | | |
| A joint venture | | | | — | | | 151,552 | | | 269,204 | | | | | | 151,552 | | | | 269,204 | | | | 226,280 | |
| | | | | | | | | | | | | | | | | | | | | | | | |
| Rental expenses for buildings and land use rights charged by: | | (vi) | | | | | | | | | | (vi) | | | | | | | | | | | | |
| Chinalco and its subsidiaries | | (ix) | | | 590,657 | | 509,558 | | 474,567 | | | (ix) | | | 511,001 | | | | 509,848 | | | | 501,866 | |
| Joint ventures | | | | — | | | 126 | | | — | | | | | | 126 | | | | — | | | | — | |
| | | | | | | | | | | | | | | | | | | | | | | | |
| | | | | 590,657 | | | 509,684 | | | 474,567 | | | | | | 511,127 | | | | 509,848 | | | | 501,866 | |
| | | | | | | | | | | | | | | | | | | | | | | | |
| Other significant related party transactions: | | | | | | | | | | | | | | | | | | | | | | | |
| | | | | | | | | | | | | | | | | | | | | | | | |
| Borrowing from a subsidiary of Chinalco | | (viii), (ix) | | | 5,929,000 | | | 5,145,959 | | | 3,901,000 | | | (viii), (ix) | | | 5,145,959 | | | | 4,010,000 | | | | 6,525,000 | |
| | | | | | | | | | | | | | | | | | | | | | | | |
| Interest expense on borrowings, discounted notes and factoring arrangement from subsidiaries of Chinalco | | | | | 149,213 | | | 226,118 | | | 225,934 | | | | | | 226,118 | | | | 225,934 | | | | 143,415 | |
| | | | | | | | | | | | | | | | | | | | | | | | |
| Entrusted loans and other borrowings to: | | | | | | | | | | | | | | | | | | | | | | | |
| Joint ventures | | | | 140,000 | | 212,400 | | 500,000 | | | | | | 212,400 | | | | 500,000 | | | | — | |
| Associates | | | | | — | | | — | | | 1,100,000 | | | | | | — | | | | 1,100,000 | | | | — | |
| | | | | | | | | | | | | | | | | | | | | | | | |
| | | | | | 140,000 | | | 212,400 | | | 1,600,000 | | | | | | 212,400 | | | | 1,600,000 | | | | — | |
| | | | | | | | | | | | | | | | | | | | | | | | |
| Interest income on entrusted loans and other borrowings: | | | | | | | | | | | | | | | | | | | | | | | |
| Joint ventures | | | | 14,061 | | 31,373 | | 41,005 | | | | | | 31,373 | | | | 41,005 | | | | — | |
| An associate | | | | | — | | | — | | | 24,425 | | | | | | — | | | | 24,425 | | | | — | |
| | | | | | | | | | | | | | | | | | | | | | | | |
| | | | | 14,061 | | | 31,373 | | | 65,430 | | | | | | 31,373 | | | | 65,430 | | | | — | |
| | | | | | | | | | | | | | | | | | | | | | | | |
| Interest income from the unpaid disposal proceeds from: | | | | | | | | | | | | | | | | | | | | | | | |
| Chinalco and its subsidiaries | | | | | 326,217 | | | 246,149 | | | 117,587 | | | | | | 246,149 | | | | 117,587 | | | | — | |
ALUMINUM CORPORATION OF CHINA LIMITED AND ITS SUBSIDIARIES
NOTES TO THE CONSOLIDATED FINANCIAL STATEMENTS(Continued)
For the years ended December 31, 2015, 2016, 2017 and 20172018
(Amounts expressed in thousands of RMB unless otherwise stated)
| 35. | SIGNIFICANT RELATED PARTY BALANCES AND TRANSACTIONS(Continued) (CONTINUED) |
| | |
| (a) | Significant related party transactions(Continued) (continued) |
| | | | Notes | | 2016 | | | 2017 | | | 2018 | |
| | | Notes | | 2015 | | 2016 | | 2017 | | | | | | | | | | |
| Disposal of assets under a sale and leaseback contract to a subsidiary of Chinalco | | (xxvi) | | | 1,150,000 | | | 1,040,000 | | | 600,000 | | | (xi) | | | 1,040,000 | | | | 600,000 | | | | 224,000 | |
| | | | | | | | | | | | | | | | | | | | | | | | |
| Finance lease under a sale and leaseback contract from subsidiaries of Chinalco | | (xxvi), (ix) | | | 1,150,064 | | | 1,040,036 | | | 600,036 | | |
| Finance lease under a sale and leaseback contract from a subsidiary of Chinalco | | | (xi), (ix) | | | 1,040,036 | | | | 600,036 | | | | 224,000 | |
| | | | | | | | | | | | | | | | | | | | | | | | |
| Trade receivable factoring arrangement from a subsidiary of Chinalco | | (ix) | | | — | | | — | | | 1,570,000 | | | (ix) | | | — | | | | 1,570,000 | | | | 470,101 | |
| | | | | | | | | | | | | | | | | | | | | | | | |
| Discounted notes receivable to a subsidiary of Chinalco | | (viii) | | | 122,000 | | | 40,200 | | | 523,253 | | | (viii) | | | 40,200 | | | | 523,253 | | | | 756,000 | |
| | | | | | | | | | | | | | | | | | | | | | | | |
| Provision of financial guarantees to: | | | | | | | | | | | | | | | | | | | | | | | |
| Joint ventures | | (xv), (xxv) | | 340,900 | | 24,245 | | 18,350 | | |
| An associate | | (xvi) | | | 17,470 | | | — | | | — | | |
| | | | | | | | | | | |
| | | | | | 358,370 | | | 24,245 | | | 18,350 | | |
| A joint venture | | | (x) | | | 24,245 | | | | 18,350 | | | | 12,450 | |
| | | | | | | | | | | | | | | | | | | | | | | | |
| Financial guarantees provided by: | | | | | | | | | | | | | | | | | | | | | | | |
| Subsidiaries of Chinalco | | 19(e) | | | 27,000 | | | 23,000 | | | 4,000 | | | | | | 23,000 | | | | 4,000 | | | | — | |
| | | | | | | | | | | | | | | | |
All transactions with related parties were conducted at prices and on terms mutually agreed by the parties involved, which are determined as follows:
| | | All transactions with related parties were conducted at prices and on terms mutually agreed by the parties involved, which are determined as follows: |
| | | | | |
| | | (i) | Sales of materials and finished goods comprised sales of alumina, primary aluminum, copper and scrap materials. Transactions entered into are covered by general agreements on a mutual provision of production supplies and ancillary services. The pricing policy is summarizedsummarised below: |
| | | | | |
| | | | 1. | The price prescribed by the PRC government (“the state-prescribed price”) is adopted; |
| | | | | |
| | | | 2. | If there is no state-prescribed price, the state-guidance price is adopted; |
| | | | | |
| | | | 3. | If there is neither a state-prescribed price nor state-guidance price, then the market price (being price charged to and from independent third parties) is adopted; and |
| | | | | |
| | | | 4. | If none of the above is available, then the adoption of a contractual price (being reasonable costs incurred in providing the relevant services plus not more than 5% of such costscosts) is adopted).adopted. |
ALUMINUM CORPORATION OF CHINA LIMITED AND ITS SUBSIDIARIES
NOTES TO THE CONSOLIDATED FINANCIAL STATEMENTS(Continued)
For the years ended December 31, 2015, 2016, 2017 and 20172018
(Amounts expressed in thousands of RMB unless otherwise stated)
| 35. | SIGNIFICANT RELATED PARTY BALANCES AND TRANSACTIONS(Continued) |
| |
| (a) | Significant related party transactions(Continued) |
All transactions with related parties are conducted at prices and terms mutually agreed by the parties involved, which are determined as follows: (continued)
| | |
| | All transactions with related parties are conducted at prices and terms mutually agreed by the parties involved, which are determined as follows: (continued) |
| | | |
| | (ii) | Utility services, including electricity, gas, heat and water, are provided at the state-prescribed price. |
| | | |
| | (iii) | Engineering, project construction and supervisory services were provided for construction projects of the Group.projects. The state-guidance price or prevailing market price (including the tender price where by way of tender) is adopted for pricing purposes. |
| | | |
| | (iv) | The pricing policy for purchases of key and auxiliary materials (including bauxite, limestone, carbon, cement and coal) is the same as that set out in (i) above. |
| | | |
| | (v) | Social services and logistics services provided by Chinalco Group cover public security, fire services, education and training, school and hospital services, cultural and physical education, newspaper and magazines, broadcasting and printing as well as property management, environmental and hygiene, greenery, nurseries and kindergartens, sanatoriums, canteens and offices, public transport and retirement management and other services. Provisions of these services are covered by the Comprehensive Social and Logistics Services Agreement. The pricing policy is the same as that set out in (i) above. |
| | | |
| | (vi) | Pursuant to the Land Use Rights Lease Agreements entered into between the Group and Chinalco Group, operating leases for industrial or commercial land are charged at the market rent rate. The Group also entered into a building rental agreement with Chinalco Group and paid rent based on the market rate for its lease of buildings owned by Chinalco. |
| | | |
| | (vii) | The pricing policy for product processing services is the same as that set out in (i) above. |
ALUMINUM CORPORATION OF CHINA LIMITED AND ITS SUBSIDIARIES
NOTES TO THE CONSOLIDATED FINANCIAL STATEMENTS(Continued)
For the years ended December 31, 2016, 2017 and 2018
(Amounts expressed in thousands of RMB unless otherwise stated)
| 35. | SIGNIFICANT RELATED PARTY BALANCES AND TRANSACTIONS (CONTINUED) |
| (a) | Significant related party transactions (continued) |
All transactions with related parties are conducted at prices and terms mutually agreed by the parties involved, which are determined as follows: (continued)
| (viii) | Chinalco Finance Company Limited (“Chinalco Finance”)* (中鋁���財務有限責任公司), a wholly-owned subsidiary of Chinalco and a non-bank financial institution established in the PRC, provides deposit services, credit services and miscellaneous financial services to the Group. The terms for the provision of financial services to the Group are no less favourable than those of the same type of financial services provided by Chinalco Finance to Chinalco and other members of its group or those of the same type of financial services that may be provided to the Group by other financial institutions. |
| | | |
| | (ix) | These related party transactions also constitute connected transactions or continuing connected transactions as defined in Chapter 14A of the Listing Rules. |
ALUMINUM CORPORATION OF CHINA LIMITED AND ITS SUBSIDIARIES
NOTES TO THE CONSOLIDATED FINANCIAL STATEMENTS(Continued)
For the years ended December 31, 2015, 2016 and 2017
(Amounts expressed in thousands of RMB unless otherwise stated)
35. | SIGNIFICANT RELATED PARTY BALANCES AND TRANSACTIONS(Continued) |
| | | |
| (a) | Significant related party transactions(Continued) |
| | | |
| | (x) | In November 2015, the Company together with its two subsidiaries, Chalco International Trading and Chalco Shanghai Kelin Co., Ltd. (上海中鋁凱林鋁業有限公司) (“Shanghai Kelin”) signed a capital injection agreement with Chinalco Asset Management Co., Ltd.*(中鋁資產經營管理公司) (“Chinalco Asset Management”) to inject capital to Chinalco Property Development Co., Ltd.* (中鋁置業發展有限公司) (“Chinalco Property Development”) by way of injecting certain urban property assets and land use rights with appraised value amounting to RMB676.95 million and cash amounting to RMB696 million. Subsequent to the capital injection, the Group held a 24.12% equity interest in Chinalco Investment Development. The investment in Chinalco Property Development has been adjusted the impact of downstream transaction amounting to RMB111.3 million. The transaction generated disposal gain amounting to RMB350.22 million. In November 2015, Chinalco Property Development changed its name to Chinalco Investment Development.
|
| | | |
| | (xi) | Transfer of the Property Assets of Chalco Hong Kong to Chinalco assets holdings
|
| | | |
| | | In November 2015, Chalco Hong Kong and Chinalco Assets Holdings entered into an asset transfer agreement, pursuant to which, Chalco Hong Kong agreed to dispose of the property assets (“HK Property”) of Chalco Hong Kong to Chinalco Assets Holdings. The appraised value of the properties was HKD372 million (equivalent to RMB311 million) as at the Benchmark Date of September 30, 2015. According to the asset transfer agreement, 30% of the total consideration, i.e. HKD112 million (equivalent to RMB93 million), shall be paid to Chalco Hong Kong by Chinalco Assets Holdings in December 2015, and the remaining 70% of the total consideration shall be paid before June 30, 2016. The transaction between the Group and Chinalco Assets Holdings constituted a connected transaction. The Group disposed of the Hong Kong property with carrying value of RMB102 million and recognized a gain of RMB210 million. In December 2015, the Group received the first batch of the asset transfer consideration of RMB93 million. |
| | | |
| | (xii) | As disclosed in note 38, the Group acquired relevant assets and liabilities of High-Purity Aluminum Plant and Light Metal Material Plant (“High-Purity Aluminum and Light Metal”) from Baotou Group which also constituted a connected transaction.
|
| | | |
| | (xiii) | In August 2015, the Company entered into an agreement with Chalco Resource, a subsidiary of Chinalco, pursuant to which the Company shall make a capital injection to Chalco Resource of RMB616.58 million in proportion to its 15% equity interest in Chalco Resource. As at December 31, 2015, the Company has made a capital injection of RMB246.63 million in cash, and still has the capital injection commitment amounting to RMB369.95 million.
|
ALUMINUM CORPORATION OF CHINA LIMITED AND ITS SUBSIDIARIES
NOTES TO THE CONSOLIDATED FINANCIAL STATEMENTS(Continued)
For the years ended December 31, 2015, 2016 and 2017
(Amounts expressed in thousands of RMB unless otherwise stated)
35. | SIGNIFICANT RELATED PARTY BALANCES AND TRANSACTIONS(Continued) |
| | | |
| (a) | Significant related party transactions(Continued) |
| | | |
| | (xiv) | In August 2015, the Company signed a capital injection agreement with China Rare Earth pursuant to which the Company has made a capital injection of RMB400 million in cash in return for 14.62% equity interest in China Rare Earth.
|
| | | |
| | (xv) | In March 2013, the Company entered into a guarantee agreement with China Development Bank, together with other shareholders of Xinyugou Coal Co., Ltd. *(“山西介休鑫峪沟煤业有限公司”) (“Xinyugou Coal”), a joint venture of the Company, and pursuant to the guarantee agreement, the Company provided financial guarantee to loans up to RMB1,020 million of Xinyugou Coal, in proportion to its 34% shareholding. In August 2016, Xinyugou Coal was default in repayment of bank loans and interests of RMB914 million and RMB101 million, respectively. Based on the agreement entered among the Company, Xinyugou Coal, one of its other shareholders and China Development Bank on 31 August 2016, the Company fulfilled its guarantee obligation by paying RMB336 million to China Development Bank, and the related financial guarantee was released.
|
| | | |
| | (xvi) | In February 2014, Shanxi Huasheng, a subsidiary of the Company, entered into a financial guarantee contract with Shanghai Pudong Development Bank providing a financial guarantee to Xingshengyuan Coal Co., Ltd*(“霍州煤电集团兴盛园煤业有限责任公司”) (“Xingshengyuan Coal”) an associate of the Company, for its bank loan up to RMB200 million, in proportion of the 43.03% shareholding in Xingshengyuan Coal. In 2016, Xingshengyuan Coal repaid the bank loan in full, and the guarantee has been released.
|
| | | |
| | (xvii) | As disclosed in note 38, on January 1, 2016, Chalco Shandong swapped certain assets and liabilities to acquire a business from Shandong Aluminum, which constituted a related party transaction.
|
| | | |
| | (xviii) | As disclosed in note 38, the Group acquired relevant assets and employees of pseudoboehmite and activated silicon powder production lines of Science and Technology Chemical Company from Shanxi Aluminum Plant, which also constituted a related party transaction.
|
| | | |
| | (xix) | As disclosed in note 38, the Group acquired the 33% and 33% equity interests in Xinghua Technology from Shandong Aluminum and Shanxi Aluminum Plant, respectively, which constituted a related party transaction.
|
| | | |
| | (xx) | As disclosed in note 38, the Group acquired the 60% equity interest of Chinalco Shanghai from Chinalco, which also constituted a related party transaction. |
ALUMINUM CORPORATION OF CHINA LIMITED AND ITS SUBSIDIARIES
NOTES TO THE CONSOLIDATED FINANCIAL STATEMENTS(Continued)
For the years ended December 31, 2015, 2016 and 2017
(Amounts expressed in thousands of RMB unless otherwise stated)
35. | SIGNIFICANT RELATED PARTY BALANCES AND TRANSACTIONS(Continued) |
| | | |
| (a) | Significant related party transactions(Continued) |
| | | |
| | (xxi) | In November 2015, the Company and Chinalco Capital, a subsidiary of Chinalco, entered into a capital contribution agreement (the “Capital Contribution Agreement“), pursuant to which the Company made a capital injection to Chinalco Capital by the 15% equity interest held by the Company in ABC-CA Fund Management Co., Ltd. (“農銀匯理基金管理有限公司“) (“ABC-CA“) with appraised value of RMB283.15 million and cash of RMB150 million totalling RMB433.15 million. The Company completed the capital injection of 15% equity interest of ABC-CA in June 2016 which constituted a related party transaction.
|
| | | |
| | (xxii) | As Disposal of non-core assets
|
| | | |
| | | On March 30, 2016, Chalco Shandong, Chalco Shanxi Branch and Chalco Henan Branch entered into asset transfer agreements to transfer certain non-core assets to Shandong Aluminum, Shanxi Aluminum Plant and China Great Wall Aluminum Corporation, respectively, which are all subsidiaries of Chinalco. The total consideration was RMB474.62 million which was determined based on the valuation reports of the assets disposed of on the valuation base date as at February 29, 2016. The carrying value of the assets disposed of amounted to RMB279.19 million and the Group recognized a disposal gain of RMB195.43 million. The transactions were completed on March 31, 2016. Pursuant to the asset transfer agreements, the considerations will be paid in two instalments. In 2016, Shanxi Aluminum Plant and China Great Wall Aluminum Corporation paid the first instalment amounting to RMB120.04 million by notes receivable, and Shandong Aluminum settled its payment by offsetting receivables amounting to RMB76.62 million.
|
ALUMINUM CORPORATION OF CHINA LIMITED AND ITS SUBSIDIARIES
NOTES TO THE CONSOLIDATED FINANCIAL STATEMENTS(Continued)
For the years ended December 31, 2015, 2016 and 2017
(Amounts expressed in thousands of RMB unless otherwise stated)
35. | SIGNIFICANT RELATED PARTY BALANCES AND TRANSACTIONS(Continued) |
| | | |
| (a) | Significant related party transactions(Continued) |
| | | |
| | (xxiii) | Disposal of businesses
|
| | | |
| | | As disclosed in note 39, on June 30, 2016, the Group transferred the Environmental Protection Business to Aluminum SPC, which constituted a related party transaction. |
| | | |
| | (xxiv) | Cooperative exploration of Maochang Mine
|
| | | |
| | | On June 28, 2016, the Company and Chinalco entered into a cooperative exploration agreement, pursuant to which the Company and Chinalco contributed construction investment and mining rights of RMB660 million and RMB475 million, respectively, representing 58.15% and 41.85%, respectively. The Group and Chinalco are entitled to the share of profits derived from Maochang Mine based on their respective percentage of assets contributed and mine rights, respectively, for the period from July 1, 2016 to December 30, 2038.
|
| | | |
| | | On June 28, 2016, the Company also entered into a profit sharing rights transfer agreement with Chinalco, pursuant to which the Group acquired 80% of Chinalco’s profit sharing rights in Maochang Mine at the consideration of RMB349.95 million which is determined by both parties with reference to the appraised value provided by an independent qualified valuer. The consideration will be paid in cash by the Group by instalments of RMB120 million, RMB135 million and RMB94.95 million in 2016, 2017 and 2018, respectively. The Group recorded the profit sharing rights purchased from Chinalco as an intangible asset at the present value of the cash consideration instalments and the related transactions totalling RMB335.41 million.
|
| | | |
| | | As at December 31, 2017, Maochang Mine had been put into operation.
|
| | | |
| | (xxv) | In December 2006, Ningxia Energy, a subsidiary of the Company, entered into a financial guarantee contract with China Construction Bank providing a financial guarantee to Tian Jing Shen Zhou Wind Power Co., Ltd, a joint venture of the Company, for its 14-year bank loan amounting to RMB35 million. As at December 31, 2017,2018, the outstanding amount of the guarantee was RMB18RMB12 million. (December 31, 2015: RMB30 million, December 31, 2016:RMB24 million) |
| (xi) | | |
| | (xxvi) | As disclosed in note 20, the Group has entered into several sales and leaseback contracts with CFL. |
ALUMINUM CORPORATION OF CHINA LIMITED AND ITS SUBSIDIARIES
NOTES TO THE CONSOLIDATED FINANCIAL STATEMENTS(Continued)
For the years ended December 31, 2015, 2016 and 2017
(Amounts expressed in thousands of RMB unless otherwise stated)
35. | SIGNIFICANT RELATED PARTY BALANCES AND TRANSACTIONS(Continued) |
| (xii) | | | |
| (a) | Significant related party transactions(Continued) |
| | | |
| | (xxvii) | On 12 May 2017, the Company entered into an equity transfer agreement with Chinalco, pursuant to which, the Company acquired the 40% non-controlling equity interest in Chinalco Shanghai at a total cash consideration of RMB1,413 million. The consideration was determined based on the appraisal value of the equity of Chinalco Shanghai and was fully paid before December 31, 2017. On the acquisition date, the carrying amount of 40% equity interest in Chinalco Shanghai was RMB387 million, therefore the difference amounting to RMB1,026 million was recorded in share premium. After the acquisition, Chinalco Shanghai became a wholly-owned subsidiary of the Company. The acquisition of 40% equity interest in Chinalco Shanghai constituted a related party transaction.
|
| | | |
| | (xxviii) | As disclosed in note 38(g)38 (n) and 38 (o), the Group acquired 100%57.69% and 19.96% equity interest in QingdaoChibi Great Wall Carbon from China Great Wall Aluminum and Henan Great Wall Zhongxin Industrial Co., Ltd. (“Henan Great Wall Zhongxin”) (河南長城眾鑫實業股份有限公司) respectively; and acquired 51% equity interest in East Light MetalLogistics from Chinalco,Northeast Light Alloy Co., Ltd. (“Northeast Light Alloy”) (東北輕合金有限公司); which constituted a related party transaction. transactions. |
| (xiii) | | |
| | (xxix) | As disclosed in note 38(h)38 (l) and 38 (m), the Group acquired ShanxiShandong Aluminum Sewage Treatment Plant from Shanxi(山東鋁廠碳素廠) and Pingguo Aluminum Plant (平果鋁業碳素廠) from Pingguo Aluminum and Shandong Aluminum, which also constituted a related party transaction. transactions. |
| * | (xxx) | As disclosed in note 39(d), on October 31, 2017, the Group transferred 60% equity interest of China Aluminum Shandong Engineering Technology Co., Ltd.(“Shandong Engineering”) (中鋁山東工程技術有限公司) to China Aluminum International Engineering Co., Ltd. (“CHALIECO”) (中鋁國際工程股份有限公司), which constituted a related party transaction.
|
| | | |
| | During the years ended December 31, 2015, 2016 and 2017, the Group’s significant transactions with entities directly or indirectly owned or controlled by the government through its agencies, affiliates or other organisations (collectively “State-owned Enterprises“ (“SOEs“)) (excluding Chinalco and its subsidiaries) constituted a large portion of its sales of goods and purchases of raw materials, electricity, property, plant and equipment and services. In addition, substantially all restricted cash, time deposits, cash and cash equivalents and borrowings as at December 31, 2016 and 2017 and the relevant interest earned or paid during the year were transacted with banks and other financial institutions which are controlled by the PRC government. In the opinion of the directors of the Company, the transactions with SOEs are activities conducted in the ordinary course of business, and the dealings of the Group have not been significantly or unduly affected by the fact that the Group and those SOEs are ultimately controlled or owned by the PRC government. The Group has also established pricing policies for rendered services and such pricing policies do not depend on whether or not the customers are SOEs.
|
| | | |
| | As of December 31, 2017, pursuant to the "Investment Agreements" and the "Debt to Equity Swap Agreements" (note 17), the Target Companies have already received additional capital contributions of RMB12,600 million by the Investors, who belong to SOEs.
|
| | | |
| | * The English namesname represent the best effort made by management of the Group in translating the Chinese namesname of the Companiescompany as they doit does not have any official English names.
name. |
ALUMINUM CORPORATION OF CHINA LIMITED AND ITS SUBSIDIARIES
NOTES TO THE CONSOLIDATED FINANCIAL STATEMENTS(Continued)
For the years ended December 31, 2015, 2016, 2017 and 20172018
(Amounts expressed in thousands of RMB unless otherwise stated)
| 35. | SIGNIFICANT RELATED PARTY BALANCES AND TRANSACTIONS(Continued) (CONTINUED) |
| | |
| (b) | Balances with related parties |
| | |
| | Other than those disclosed elsewhere in the consolidated financial statements, the outstanding balances with related entities at the year end are as follows: |
Other than those disclosed elsewhere in the consolidated financial statements, the outstanding balances with related entities at the year end are as follows:
| | | | December 31, 2016 | | | December 31, 2017 | |
| | | | | | | | |
| Cash and cash equivalents deposited with | | | | | | | |
| A subsidiary of Chinalco(Note) | | | 7,073,289 | | | 7,679,806 | |
| | | | | | | | |
| Trade and notes receivables | | | | | | | |
| Chinalco and its subsidiaries | | | 1,086,014 | | | 1,475,477 | |
| Associates of Chinalco | | | 10,200 | | | 2,000 | |
| Joint ventures | | | 38,055 | | | 591,488 | |
| Associates | | | — | | | 96,574 | |
| | | | 1,134,269 | | | 2,165,539 | |
| | | | | | | | |
| Provision for impairment of receivables | | | (78,262 | ) | | (78,388 | ) |
| | | | | | | | |
| | | | 1,056,007 | | | 2,087,151 | |
| | | December 31, 2017 | | | December 31, 2018 | |
| | | | | | | |
| Cash and cash equivalents deposited with | | | | | | | | |
| A subsidiary of Chinalco(Note) | | | 7,679,806 | | | | 9,101,541 | |
| | | | | | | | | |
| Trade and notes receivables | | | | | | | | |
| Chinalco and its subsidiaries | | | 1,483,984 | | | | 1,278,715 | |
| Associates of Chinalco | | | 2,000 | | | | 18,655 | |
| Joint ventures | | | 591,488 | | | | 819,878 | |
| Associates | | | 96,574 | | | | 6,615 | |
| | | | 2,174,046 | | | | 2,123,863 | |
| | | | | | | | | |
| Provision for impairment of receivables | | | (78,388 | ) | | | (77,657 | ) |
| | | | | | | | | |
| | | | 2,095,658 | | | | 2,046,206 | |
| Note: | Note:On August 26, 2011, the Company entered into an agreement with Chinalco Finance, pursuant to which, Chinalco Finance agreed to provide deposit services, credit services and other financial services to the Group. On August 24, 2012, April 28, 2015 and October 26, 2017, the Company renewed the financial service agreement with Chinalco Finance with a validation term of three years ending on August 25, 2018.October 26, 2020. |
ALUMINUM CORPORATION OF CHINA LIMITED AND ITS SUBSIDIARIES
NOTES TO THE CONSOLIDATED FINANCIAL STATEMENTS(Continued)
For the years ended December 31, 2016, 2017 and 2018
(Amounts expressed in thousands of RMB unless otherwise stated)
| 35. | SIGNIFICANT RELATED PARTY BALANCES AND TRANSACTIONS (CONTINUED) |
| (b) | Balances with related parties (continued) |
| | | December 31, 2017 | | | December 31, 2018 | |
| | | | | | | |
| Other current assets | | | | | | | | |
| Chinalco and its subsidiaries | | | 623,254 | | | | 830,615 | |
| Joint ventures | | | 1,737,644 | | | | 1,424,678 | |
| Associates | | | 1,132,138 | | | | 29,701 | |
| | | | 3,493,036 | | | | 2,284,994 | |
| | | | | | | | | |
| Provision for impairment of other current assets | | | (48,166 | ) | | | (40,830 | ) |
| | | | | | | | | |
| | | | 3,444,870 | | | | 2,244,164 | |
| | | | | | | | | |
| Other non-current assets | | | | | | | | |
| A joint venture | | | 97,103 | | | | — | |
| Associates | | | 111,845 | | | | 111,845 | |
| | | | | | | | | |
| | | | 208,948 | | | | 111,845 | |
| | | | | | | | | |
| Borrowings and finance lease payables | | | | | | | | |
| Subsidiaries of Chinalco | | | 3,329,807 | | | | 4,373,033 | |
| A joint venture | | | 190,000 | | | | — | |
| | | | | | | | | |
| | | | 3,519,807 | | | | 4,373,033 | |
| | | | | | | | | |
| Trade and notes payables | | | | | | | | |
| Chinalco and its subsidiaries | | | 332,701 | | | | 404,278 | |
| Joint ventures | | | 413,533 | | | | 631,570 | |
| Associates | | | 7,222 | | | | 13,033 | |
| Associates of Chinalco | | | — | | | | 4,012 | |
| | | | | | | | | |
| | | | 753,456 | | | | 1,052,893 | |
ALUMINUM CORPORATION OF CHINA LIMITED AND ITS SUBSIDIARIES
NOTES TO THE CONSOLIDATED FINANCIAL STATEMENTS(Continued)
For the years ended December 31, 2016, 2017 and 2018
(Amounts expressed in thousands of RMB unless otherwise stated)
| 35. | SIGNIFICANT RELATED PARTY BALANCES AND TRANSACTIONS (CONTINUED) |
| (b) | Balances with related parties(Continued) |
| | | December 31, 2017 | | | December 31, 2018 | |
| Other payables and accrued liabilities | | | | | | | | |
| Chinalco and its subsidiaries | | | 2,652,249 | | | | 1,887,010 | |
| Associates of Chinalco | | | 5,030 | | | | 17,128 | |
| Associates | | | 218,560 | | | | 148,978 | |
| Joint ventures | | | 101,828 | | | | 8,860 | |
| | | | | | | | | |
| | | | 2,977,667 | | | | 2,061,976 | |
| | December 31, 2017 | | | December 31, 2018 | |
| Contract Liabilities | | | | | | | | |
| Chinalco and its subsidiaries | | | — | | | | 22,307 | |
| Associates of Chinalco | | | — | | | | 20 | |
| Associates | | | — | | | | 12,451 | |
| Joint ventures | | | — | | | | 94,367 | |
| | | | | | | | |
| | | — | | | | 129,145 | |
As at December 31, 2018, included in long-term loans and borrowings and short-term loans and borrowings were from other state-owned enterprises amounting to RMB42,553 million (December 31, 2017: RMB33,575 million) and RMB41,189 million (December 31, 2017: RMB42,648 million).
The terms of all balances with the exception of the entrusted loans were unsecured and were in accordance with terms as set out in the respective agreements or as mutually agreed between the parties concerned.
| (c) | Compensation of key management personnel |
| | | 2016 | | | 2017 | | | 2018 | |
| | | | | | | | | | |
| Fees | | | 762 | | | | 768 | | | | 756 | |
| Basic salaries, housing fund, other allowances and benefits in kind | | | 2,542 | | | | 3,830 | | | | 3,953 | |
| Pension costs | | | 277 | | | | 415 | | | | 482 | |
| | | | | | | | | | | | | |
| | | | 3,581 | | | | 5,013 | | | | 5,191 | |
Details of directors’ remuneration are included in note 30 to the financial statements.
| (d) | Commitments with related parties |
As at December 31, 2018 and 2017, except for the other capital commitments disclosed in note 42(c) to these financial statements, the Group had no significant commitments with related parties.
| 36. | FINANCIAL AND CAPITAL RISK MANAGEMENT |
ALUMINUM CORPORATION OF CHINA LIMITED AND ITS SUBSIDIARIES
NOTES TO THE CONSOLIDATED FINANCIAL STATEMENTS(Continued)
For the years ended December 31, 2016, 2017 and 2018
(Amounts expressed in thousands of RMB unless otherwise stated)
| 36.1 | Financial risk management |
The Group’s activities expose it to a variety of financial risks, including market risk (including foreign currency risk, interest rate risk and commodity price risk), credit risk and liquidity risk. The Group’s overall risk management program focuses on the unpredictability of financial markets and seeks to minimise the potential adverse effects on the Group’s financial performance.
Risk management is carried out by the treasury management department (the “Group Treasury“) under policies approved by the board of directors of the Company. The Group Treasury identifies, evaluates and hedges financial risks through close co-operation with the Group’s operating units.
Foreign currency risk primarily arises from certain significant foreign currency deposits, trade and notes receivables, trade and notes payables, advances paid to suppliers, and short-term and long-term loans denominated in United States dollars (“USD”), Australian dollars (“AUD”), Euro (“EUR”), Japanese yen (“JPY”), and Hong Kong dollars (“HKD”). Related exposures are disclosed in notes 14, 15, 16, 19, 22, 23 and 40 to the financial statements, respectively. The Group Treasury closely monitors the international foreign currency market on the change of exchange rates and takes these into consideration when investing in foreign currency deposits and borrowing loans. As at December 31, 2018, the Group only had significant exposure to USD.
As at December 31, 2018, if RMB had weakened /strengthened by 5% against USD with all other variables held constant, the total comprehensive income for the year would have been approximately RMB10 million higher/lower (2017: RMB21 million lower/higher), mainly as a result of foreign exchange gains and losses arising from the translation of USD-denominated borrowings, cash and receivables. Profit was more sensitive to the fluctuation in the RMB/USD exchange rates in 2018 than in 2017, mainly due to the increase in the USD denominated cash and receivables.
As the assets and liabilities denominated in other foreign currencies other than USD were relatively minimal to the total assets and liabilities of the Group, the directors of the Company are of the opinion that the Group was not exposed to any significant foreign currency risk arising from these foreign currency denominated assets and liabilities as at December 31, 2018 and 2017.
ALUMINUM CORPORATION OF CHINA LIMITED AND ITS SUBSIDIARIES
NOTES TO THE CONSOLIDATED FINANCIAL STATEMENTS(Continued)
For the years ended December 31, 2016, 2017 and 2018
(Amounts expressed in thousands of RMB unless otherwise stated)
| 36. | FINANCIAL AND CAPITAL RISK MANAGEMENT(Continued) |
| 36.1 | Financial risk management(Continued) |
| (a) | Market risk(Continued) |
As at December 31, 2018, as the Group had no significant interest-bearing assets except for bank deposits (note 16) and entrusted loans (note 15), the Group’s income and operating cash flows are substantially independent of changes in market interest rates.
Most of the bank deposits are maintained in savings and time deposit accounts in the PRC. The interest rates are regulated by the People’s Bank of China and the Group Treasury closely monitors the fluctuation on such rates periodically. The interest rates of entrusted loans are fixed. As the interest rates applied to the entrusted loans were fixed, the directors of the Company are of the opinion that the Group was not exposed to any significant interest rate risk for its financial assets held as at December 31, 2018 and 2017.
The interest rate risk for the Group’s financial liabilities primarily arises from interest-bearing loans. Loans borrowed at floating interest rates expose the Group to cash flow interest rate risk. The Group enters into debt obligations to support general corporate purposes including capital expenditures and working capital needs. The Group Treasury closely monitors market interest rates and maintains a balance between variable rate and fixed rate borrowings in order to reduce the exposures to the interest rate risk described above.
As at December 31, 2018, if interest rates had been 100 basis points (December 31, 2017: 100 basis points) higher/lower for bank and other loans borrowed at floating interest rates with all other variables held constant, the total comprehensive income for the year would have been RMB641 million lower/higher (2017: RMB537 million), respectively, mainly as a result of the higher/lower interest expense on floating rate borrowings.
ALUMINUM CORPORATION OF CHINA LIMITED AND ITS SUBSIDIARIES
NOTES TO THE CONSOLIDATED FINANCIAL STATEMENTS(Continued)
For the years ended December 31, 2016, 2017 and 2018
(Amounts expressed in thousands of RMB unless otherwise stated)
| 36. | FINANCIAL AND CAPITAL RISK MANAGEMENT(Continued) |
| 36.1 | Financial risk management(Continued) |
| (a) | Market risk(Continued) |
| (ii) | Interest rate risk (continued) |
The interest rate risk of the Group mainly arises from medium-term notes and short-term bonds issued at fixed rates. As the fluctuation of comparable interest rates of corporate bonds with similar terms was relatively low, the directors of the Company are of the opinion that the Group is not exposed to any significant fair value interest rate risk for its fixed interest rate borrowings held as at December 31, 2018 and 2017.
| (iii) | Commodity price risk |
The Group uses futures and option contracts to reduce its exposure to fluctuations in the price of primary aluminum and other products. The Group uses the futures contract for hedging other than speculation. With reference to the hedging of primary aluminum, production company hedges the output of primary aluminum and trading company hedges the quantities of buyout and self-supporting.
The Group uses mainly futures contracts and option contracts traded on the Shanghai Futures Exchange and London Metal Exchange (“LME“) to hedge against fluctuations in primary aluminum prices. As at December 31, 2018, the fair values of the outstanding futures contracts amounting to RMB16 million (December 31, 2017: RMB10 million) and RMB2 million (December 31, 2017: RMB89 million) were recognized in financial assets and financial liabilities at fair value through profit or loss, respectively. As at December 31, 2018, the Company did not hold any option contracts (December 31, 2017: the Company did not hold any option contracts).
ALUMINUM CORPORATION OF CHINA LIMITED AND ITS SUBSIDIARIES
NOTES TO THE CONSOLIDATED FINANCIAL STATEMENTS(Continued)
For the years ended December 31, 2015, 2016, 2017 and 20172018
(Amounts expressed in thousands of RMB unless otherwise stated)
| 35.36. | SIGNIFICANT RELATED PARTY BALANCESFINANCIAL AND TRANSACTIONS(Continued) |
| | |
| (b) | Balances with related partiesCAPITAL RISK MANAGEMENT(Continued) |
| 36.1 | Financial risk management(Continued) |
| | | | December 31, | | | December 31, | |
| | | | 2016 | | | 2017 | |
| Other current assets | | | | | | | |
| Chinalco and its subsidiaries | | | 5,065,890 | | | 623,254 | |
| Joint ventures | | | 2,092,369 | | | 1,737,644 | |
| Associates | | | 73,546 | | | 1,132,138 | |
| | | | 7,231,805 | | | 3,493,036 | |
| | | | | | | | |
| Provision for impairment of other current assets | | | (48,510 | ) | | (48,166 | ) |
| | | | | | | | |
| | | | 7,183,295 | | | 3,444,870 | |
| | | | | | | | |
| Other non-current assets | | | | | | | |
| Chinalco and its subsidiaries | | | 27,946 | | | — | |
| A joint venture | | | 112,403 | | | 97,103 | |
| Associates | | | 111,846 | | | 111,845 | |
| | | | | | | | |
| | | | 252,195 | | | 208,948 | |
| | | | | | | | |
| Borrowings and finance lease payables | | | | | | | |
| Subsidiaries of Chinalco | | | 6,051,288 | | | 3,329,807 | |
| A joint venture | | | 190,000 | | | 190,000 | |
| | | | | | | | |
| | | | 6,241,288 | | | 3,519,807 | |
| | | | | | | | |
| Trade and notes payables | | | | | | | |
| Chinalco and its subsidiaries | | | 374,325 | | | 426,190 | |
| Joint ventures | | | 300 | | | 413,533 | |
| Associates | | | — | | | 7,222 | |
| | | | | | | | |
| | | | 374,625 | | | 846,945 | |
| (a) | Market risk(Continued) |
| (iii) | Commodity price risk(Continued) |
As at December 31, 2018, if the commodity futures prices had increased/decreased by 3% (December 31, 2017: 3%) and all other variables were held constant, the profit for the year would have changed by the amounts shown below:
| | 2017 | | 2018 |
| | | | |
| Primary aluminum | Decrease/increase RMB46 million | | Decrease/increase RMB14 million |
| | | | |
| Copper | Increase/decrease RMB0.3 million | | Increase/decrease RMB0.9 million |
| | | | |
| Zinc | Decrease/increase RMB7 million | | Decrease/increase RMB1.0 million |
| | | | |
| Coal | Decrease/increase RMB0.2 million | | Decrease/increase RMB2.7 million |
ALUMINUM CORPORATION OF CHINA LIMITED AND ITS SUBSIDIARIES
NOTES TO THE CONSOLIDATED FINANCIAL STATEMENTS(Continued)
For the years ended December 31, 2015, 2016, 2017 and 20172018
(Amounts expressed in thousands of RMB unless otherwise stated)
35. | SIGNIFICANT RELATED PARTY BALANCES AND TRANSACTIONS(Continued) |
| | |
| (b)36. | Balances with related partiesFINANCIAL AND CAPITAL RISK MANAGEMENT(Continued) |
| | | | December 31, | | | December 31, | |
| | | | 2016 | | | 2017 | |
| Other payables and accrued liabilities | | | | | | | |
| Chinalco and its subsidiaries | | | 1,540,119 | | | 2,652,249 | |
| Associates of Chinalco | | | 1,149 | | | 5,030 | |
| Associates | | | 53,000 | | | 218,560 | |
| Joint ventures | | | 159,669 | | | 101,828 | |
| | | | | | | | |
| | | | 1,753,937 | | | 2,977,667 | |
| | As at December 31, 2017, included in long-term loans and borrowings and short-term loans and borrowings were from other state-owned enterprises amounting to RMB33,575 million (December 31, 2016: RMB27,788 million) and RMB42,648 million (December 31, 2016: RMB39,698 million). |
| | |
| | The terms of all balances with the exception of the entrusted loans were unsecured and were in accordance with terms as set out in the respective agreements or as mutually agreed between the parties concerned. |
| | |
| 36.1 | (c) | Compensation of keyFinancial risk management personnel(Continued) |
| | | | 2015 | | | 2016 | | | 2017 | |
| Fees | | | 653 | | | 762 | | | 768 | |
| Basic salaries, housing fund, other allowances and benefits in kind | | | 3,202 | | | 2,542 | | | 3,830 | |
| Pension costs | | | 221 | | | 277 | | | 415 | |
| | | | | | | | | | | |
| | | | 4,076 | | | 3,581 | | | 5,013 | |
| (b) | Details of directors’ remuneration are included in note 30 to the financial statements. |
| | |
| (d) | Commitments with related parties |
| | |
| | As at December 31, 2016 and 2017, except for the other capital commitments disclosed in note 42(c) to these financial statements, the Group had no significant commitments with related parties.Credit risk (continued) |
Credit risk arises from balances with banks and financial institutions, trade and notes receivables, other current and non-current receivables as well as credit exposures of customers, including outstanding receivables and committed transactions.
The Group maintains substantially all of its bank balances and cash and short-term investments in several major state-owned banks in the PRC. With strong support from the PRC government to these state-owned banks, the directors of the Company are of the opinion that there is no significant credit risk on such assets being exposed to losses.
The Group applies the simplified approach to most of its trade receivables to provide for expected credit losses prescribed by IFRS 9, which permits the use of the lifetime expected loss provision for trade receivables. The Group has made individual assessment for trade receivables from clients with top rating and those receivables with pledged assets separately and impairment provisions are made.
To measure the expected credit losses of trade receivables excluding individually assessed and impaired receivables, trade receivables have been grouped based on shared credit risk characteristics and the days past due. The expected credit loss model also incorporates forward-looking information.
ALUMINUM CORPORATION OF CHINA LIMITED AND ITS SUBSIDIARIES
NOTES TO THE CONSOLIDATED FINANCIAL STATEMENTS(Continued)
For the years ended December 31, 2015, 2016, 2017 and 20172018
(Amounts expressed in thousands of RMB unless otherwise stated)
| 36. | FINANCIAL AND CAPITAL RISK MANAGEMENT(Continued) |
| | |
| 36.1 | Financial risk management |
| | |
| | The Group’s activities expose it to a variety of financial risks, including market risk (including foreign currency risk, interest rate risk and commodity price risk), credit risk and liquidity risk. The Group’s overall risk management program focuses on the unpredictability of financial markets and seeks to minimise the potential adverse effects on the Group’s financial performance. |
| | |
| | Risk management is carried out by the treasury management department (the “Group Treasury“) under policies approved by the board of directors of the Company. The Group Treasury identifies, evaluates and hedges financial risks through close co-operation with the Group’s operating units. |
| 36.1 | (a) | Market risk |
| | | | |
| | | (i) | Foreign currency risk |
| | | | |
| | | | Foreign currencyFinancial risk primarily arises from certain significant foreign currency deposits, trade and notes receivables, trade and notes payables, advances paid to suppliers, and short-term and long-term loans denominated in United States dollars (“USD”), Australian dollars (“AUD”), Euro (“EUR”), Japanese yen (“JPY”), and Hong Kong dollars (“HKD”). Related exposures are disclosed in notes 14, 15, 16, 19, 22, 23 and 40 to the financial statements, respectively. The Group Treasury closely monitors the international foreign currency market on the change of exchange rates and takes these into consideration when investing in foreign currency deposits and borrowing loans. As at December 31, 2016 and 2017, the Group only had significant exposure to USD. |
| | | | |
| | | | As at December 31, 2017, if RMB had strengthened/weakened by 5% against USD with all other variables held constant, the profit for the year would have been approximately RMB21 million lower/higher (2016: RMB269 million lower/higher), mainly as a result of foreign exchange gains and losses arising from translation of USD-denominated borrowings, cash and receivables. Profit was less sensitive to the fluctuation in the RMB/USD exchange rates in 2017 than in 2016, mainly due to the decrease in the USD denominated cash and receivables. |
| | | | |
| | | | As the assets and liabilities denominated in other foreign currencies other than USD were relatively minimal to the total assets and liabilities of the Group, the directors of the Company are of the opinion that the Group was not exposed to any significant foreign currency risk arising from these foreign currency denominated assets and liabilities as at December 31, 2016 and 2017.management(Continued) |
| (b) | Credit risk (continued) |
The Group has performed historical analysis and identified the key economic variables impacting credit risk and expected credit losses. It considers available reasonable and supportive forwarding-looking information. Especially the following indicators are incorporated:
| ● | actual or expected significant adverse changes in business, financial or economic conditions that are expected to cause a significant change to the borrower’s ability to meet its obligations |
| ● | actual or expected significant changes in the operating results of individual clients |
| ● | significant changes in the expected performance and behaviour of the clients |
The Group measures expected credit loss rates on the basis of a loss rate approach by segmenting its portfolio into appropriate groupings based on shared credit risk characteristics. At the end of each year, the Group updates its historical loss information with forward-looking information. As the historical credit loss rates were comparatively stable and no significant changes were expected to the forward-looking information after the consideration of reasonable and supportable forecasts of comparatively stable customer relationship and customers’ credit ratings, the expected credit loss rates remained consistent during 2018.
ALUMINUM CORPORATION OF CHINA LIMITED AND ITS SUBSIDIARIES
NOTES TO THE CONSOLIDATED FINANCIAL STATEMENTS(Continued)
For the years ended December 31, 2015, 2016, 2017 and 20172018
(Amounts expressed in thousands of RMB unless otherwise stated)
| 3636.. | FINANCIAL AND CAPITAL RISK MANAGEMENT(Continued) |
| | | | |
| 36.1 | 36.1 | Financial risk management(Continued) |
| | | | |
| | (a) | Market risk(Continued) |
| | | | |
| | | (ii) | Interest rate risk |
| | | | |
| | | | The interest rate risk of the Group mainly arises from medium-term notes and short-term bonds issued at fixed rates. As at December 31, 2016 and 2017, as the Group had no significant interest-bearing assets except for bank deposits (note 16), entrusted loans (note 15), and a loan to Shanxi Huaxing (note 12), the Group’s income and operating cash flows are substantially independent of changes in market interest rates. |
| | | | |
| | | | Most of the bank deposits are maintained in savings and time deposit accounts in the PRC. The interest rates are regulated by the People’s Bank of China and the Group Treasury closely monitors the fluctuation on such rates periodically. The interest rates of entrusted loans are fixed. As the interest rates applied to the entrusted loans were fixed, the directors of the Company are of the opinion that the Group was not exposed to any significant interest rate risk for its financial assets held as at December 31, 2016 and 2017. |
| | | | |
| | | | The interest rate risk for the Group’s financial liabilities primarily arises from interest-bearing loans. Loans borrowed at floating interest rates expose the Group to cash flow interest rate risk. The exposures to these risks are disclosed separately in note 19. The Group enters into debt obligations to support general corporate purposes including capital expenditures and working capital needs. The Group Treasury closely monitors market interest rates and maintains a balance between variable rate and fixed rate borrowings in order to reduce the exposures to the interest rate risk described above. |
| | | | |
| | | | As at December 31, 2017, if interest rates had been 100 basis points (December 31, 2016: 100 basis points) higher/lower for bank and other loans borrowed at floating interest rates with all other variables held constant, net profit for the year would have been RMB535 million lower/higher (2016: RMB480 million), respectively, mainly as a result of the higher/lower interest expense on floating rate borrowings. |
| (b) | Credit risk (continued) |
Maximum exposure and year-end staging as at December 31, 2018
The table below shows the credit quality and the maximum exposure to credit risk based on the Group's credit policy, which is mainly based on past due information unless other information is available without undue cost or effort, and year-end staging classification as at December 31, 2018. The amounts presented are gross carrying amounts for financial assets and the exposure to credit risk for the financial guarantee contracts.
| | | 12-month
ECLs | | | Lifetime ECLs | | | | |
| | | Stage 1 | | | Stage 2 | | | Stage 3 | | | Simplified | | | Total | |
| Trade receivables* | | | — | | | | — | | | | — | | | | 5,206,050 | | | | 5,206,050 | |
| Financial assets in other current assets* | | | 1,098,455 | | | | 3,655,638 | | | | 121,432 | | | | — | | | | 4,875,525 | |
| Notes receivable | | | 2,894,482 | | | | — | | | | — | | | | — | | | | 2,894,482 | |
| Restricted cash | | | 2,165,288 | | | | — | | | | — | | | | — | | | | 2,165,288 | |
| Cash and cash equivalents | | | 19,130,652 | | | | — | | | | — | | | | — | | | | 19,130,652 | |
| Financial assets in other non-current assets | | | 204,718 | | | | — | | | | — | | | | — | | | | 204,718 | |
| Financial guarantees - not yet past due | | | 12,450 | | | | — | | | | — | | | | — | | | | 12,450 | |
| | | | 25,506,045 | | | | 3,655,638 | | | | 121,432 | | | | 5,206,050 | | | | 34,489,165 | |
| * | For trade receivables to which the Group applies the simplified approach for impairment, information based on the provision matrix is disclosed in notes 14 to the consolidated financial statements. |
ALUMINUM CORPORATION OF CHINA LIMITED AND ITS SUBSIDIARIES
NOTES TO THE CONSOLIDATED FINANCIAL STATEMENTS(Continued)
For the years ended December 31, 2015, 2016, 2017 and 20172018
(Amounts expressed in thousands of RMB unless otherwise stated)
| 3636.. | FINANCIAL AND CAPITAL RISK MANAGEMENT(Continued) |
| | | | |
| 36.1 | 36.1 | Financial risk management(Continued) |
| | | | |
| | (a) | Market risk(Continued) |
| | | | |
| | | (ii) | Interest rate risk(Continued) |
| | | | |
| | | | The interest rate risk of the Group mainly arises from medium-term notes and short-term bonds issued at fixed rates. As the fluctuation of comparable interest rates of corporate bonds with similar terms was relatively low, the directors of the Company are of the opinion that the Group is not exposed to any significant fair value interest rate risk for its fixed interest rate borrowings held as at December 31, 2016 and 2017. |
| | | | |
| | | (iii) | Commodity price risk |
| | | | |
| | | | The Group uses futures and option contracts to reduce its exposure to fluctuations in the price of primary aluminum and other products. The Group uses the futures contract for hedging other than speculation. With reference to the hedging of primary aluminum, production company hedges the output of primary aluminum and trading company hedges the quantities of buyout and self-supporting. |
| | | | |
| | | | The Group uses mainly futures contracts and option contracts traded on the Shanghai Futures Exchange and London Metal Exchange (“LME“) to hedge against fluctuations in primary aluminum prices. As at December 31, 2017, the fair values of the outstanding futures contracts amounting to RMB10 million (December 31, 2016: RMB55 million) and RMB89 million (December 31, 2016: RMB3 million) were recognized in financial assets and financial liabilities at fair value through profit or loss, respectively. As at December 31, 2017, the Company did not hold any option contracts (December 31, 2016: the fair value of the outstanding options contracts amounting to RMB0.1 million was recognized in financial liabilities at fair value through profit or loss). |
| (b) | Credit risk (continued) |
Maximum exposure as at December 31, 2017
The carrying amounts of short-term investments and these receivables included in notes 10, 12, 14, and 15 represent the Group’s maximum exposure to credit risk in relation to its financial assets. The Group also provided financial guarantees to certain subsidiaries and a joint venture. The guarantees to the joint venture mentioned in note 35 represented the Group’s maximum exposure to credit risk in relation to its guarantees to the joint venture.
For the year ended December 31, 2018, revenues of approximately RMB32,852 million (2016: RMB30,940 million, 2017: RMB39,759 million) were derived from entities directly or indirectly owned or controlled by the PRC government including Chinalco. There were no other individual customers from whom the Group has derived revenue of more than 10% of the Group’s revenue during the years ended December 31, 2016, 2017 and 2018. Thus, the directors of the Company are of the opinion that the Group was not exposed to any significant concentration of credit risk as at December 31, 2016, 2017 and 2018.
ALUMINUM CORPORATION OF CHINA LIMITED AND ITS SUBSIDIARIES
NOTES TO THE CONSOLIDATED FINANCIAL STATEMENTS(Continued)
For the years ended December 31, 2015, 2016, 2017 and 20172018
(Amounts expressed in thousands of RMB unless otherwise stated)
36. | 36. | FINANCIAL AND CAPITAL RISK MANAGEMENT(Continued)MANAGEMENT(CONTINUED) |
| | | | |
| 36.1 | 36.1 | Financial risk management(Continued) |
| | | | |
| | (a) | Market risk(Continued) |
| | | | |
| | | (iii) | Commodity price risk(Continued) |
| | | | |
| | | | As at December 31, 2017, if the commodity futures prices had increased/decreased by 3% (December 31, 2016: 3%) and all other variables held constant, profit for the year would have changed by the amounts shown below: |
| | 2016 | 2017 |
| | | |
| Primary aluminum | Decrease/increase RMB7 million | Decrease/increase RMB46 million |
| Copper | Decrease/increase RMB4 million | Increase/decrease RMB0.3 million |
| Zinc | Decrease/increase RMB1 million | Decrease/increase RMB7 million |
| Lead | Increase/decrease RMB0.1 million | - |
| Coal | Decrease/increase RMB1 million | Decrease/increase RMB0.2 million |
Cash flow forecast is performed in the operating entities of the Group and aggregated by the Group Treasury. The Group Treasury monitors rolling forecasts of the Group’s liquidity requirements to ensure that it has sufficient cash to meet operational needs while maintaining sufficient headroom on its undrawn committed borrowing facilities at all times so that the Group does not breach borrowing limits or covenants (where applicable) on any of its borrowing facilities. This forecast takes into consideration the Group’s debt financing plans, covenant compliance, compliance with internal balance sheet ratio targets and, if applicable, external regulatory or legal requirements, for example, currency restrictions.
As at December 31, 2018, the Group had total banking facilities of approximately RMB183,129 million of which the amounts totalling RMB61,611 million have been utilized as at December 31, 2018. Banking facilities of approximately RMB92,582 million will be subject to renewal during the next 12 months. The directors of the Company are confident that such banking facilities can be renewed upon expiration based on their past experience and good credit standing.
In addition, as at December 31, 2018, the Group had credit facilities through its futures agent at the LME amounting to USD12 million (equivalent to RMB82 million) (December 31, 2017: USD20 million (equivalent to RMB131 million)), of which USD1 million (equivalent to RMB7 million) (December 31, 2017: USD2 million (equivalent to RMB13 million)) has been utilized. The futures agent has the right to adjust the related credit facilities.
Management also monitors rolling forecasts of the Group’s liquidity reserve on the basis of the expected cash flows.
ALUMINUM CORPORATION OF CHINA LIMITED AND ITS SUBSIDIARIES
NOTES TO THE CONSOLIDATED FINANCIAL STATEMENTS(Continued)
For the years ended December 31, 2015, 2016, 2017 and 20172018
(Amounts expressed in thousands of RMB unless otherwise stated)
| 3636.. | FINANCIAL AND CAPITAL RISK MANAGEMENT(Continued) |
| | | | |
| 36.1 | 36.1 | Financial risk management(Continued) |
| | | | |
| | (b) | Credit risk |
| | | |
| | | Credit risk arises from balances with banks and financial institutions, short-term investments, trade and notes receivables, other current and non-current receivables as well as credit exposures of customers, including outstanding receivables and committed transactions. The carrying amounts of short-term investments and these receivables included in notes 10, 12, 14, and 15 represent the Group’s maximum exposure to credit risk in relation to its financial assets. The Group also provided financial guarantees to certain subsidiaries and a joint venture. The guarantees to joint ventures and an associate mentioned in note 35 represented the Group’s maximum exposure to credit risk in relation to its guarantees to a joint venture. |
| | | |
| | | The Group maintains substantially all of its bank balances and cash and short-term investments in several major state-owned banks in the PRC. With strong support from the PRC government to these state-owned banks, the directors of the Company are of the opinion that there is no significant credit risk on such assets being exposed to losses. |
| | | |
| | | With regard to receivables, the marketing department assesses the credit quality of the customers and their related parties, taking into account their financial positions, past experience and other factors. The Group performs periodic credit evaluations of its customers and considers that adequate provision for impairment of receivables has been made in the financial statements. Management does not expect any further losses from non-performance by these counterparties. The Group holds collateral for some entrusted loans. |
| | | |
| | | For the year ended December 31, 2017, revenues of approximately RMB39,759 million (2015: RMB31,818 million, 2016: RMB30,940 million) were derived from entities directly or indirectly owned or controlled by the PRC government including Chinalco. There were no other individual customers from whom the Group has derived revenue of more than 10% of the Group’s revenue during the years ended December 31, 2015, 2016 and 2017. Thus, the directors of the Company are of the opinion that the Group was not exposed to any significant concentration of credit risk as at December 31, 2015, 2016 and 2017. |
| (c) | Liquidity risk(Continued) |
The table below analyses the maturity profile of the Group’s financial liabilities as at the end of the reporting period. The amounts disclosed in the table are the contractual undiscounted cash flows.
| | | Within 1 year | | | 1 to 2 years | | | 2 to 5 years | | | Over 5 years | | | Total | |
| | | | | | | | | | | | | | | | |
As at December 31, 2017 | | | | | | | | | | | | | | | | | | | | |
| Finance lease payables, including current portion | | | 2,371,917 | | | | 1,762,618 | | | | 1,890,329 | | | | 73,603 | | | | 6,098,467 | |
| Long-term bank and other loans, including current portion | | | 6,911,640 | | | | 5,174,015 | | | | 8,673,794 | | | | 19,745,385 | | | | 40,504,834 | |
| Medium-term notes and bonds, including current portion | | | 12,500,000 | | | | 3,215,000 | | | | — | | | | — | | | | 15,715,000 | |
| Short-term bonds | | | 3,500,000 | | | | — | | | | — | | | | — | | | | 3,500,000 | |
| Gold leasing arrangement | | | 6,818,393 | | | | — | | | | — | | | | — | | | | 6,818,393 | |
| Short-term bank and other loans | | | 31,041,442 | | | | — | | | | — | | | | — | | | | 31,041,442 | |
| Interest payables for borrowings | | | 5,502,360 | | | | 2,123,149 | | | | 4,106,037 | | | | 1,048,728 | | | | 12,780,274 | |
| Financial liabilities at fair value through profit or loss | | | 89,426 | | | | — | | | | — | | | | — | | | | 89,426 | |
| Financial liabilities included in other payables and accrued liabilities, excluding accrued interest | | | 10,535,869 | | | | — | | | | — | | | | — | | | | 10,535,869 | |
| Financial liabilities included in other non-current liabilities(Note) | | | — | | | | 107,785 | | | | 108,896 | | | | 587,668 | | | | 804,349 | |
| Trade and notes payables | | | 12,360,441 | | | | — | | | | — | | | | — | | | | 12,360,441 | |
| | | | | | | | | | | | | | | | | | | | | |
| | | | 91,631,488 | | | | 12,382,567 | | | | 14,779,056 | | | | 21,455,384 | | | | 140,248,495 | |
ALUMINUM CORPORATION OF CHINA LIMITED AND ITS SUBSIDIARIES
NOTES TO THE CONSOLIDATED FINANCIAL STATEMENTS(Continued)
For the years ended December 31, 2015, 2016, 2017 and 20172018
(Amounts expressed in thousands of RMB unless otherwise stated)
| 3636.. | FINANCIAL AND CAPITAL RISK MANAGEMENT(Continued) |
| | | | |
| 36.1 | 36.1 | Financial risk management(Continued) |
| | |
| | (c) | Liquidity risk(Continued) |
| | | Within 1 year | | | 1 to 2 years | | | 2 to 5 years | | | Over 5 years | | | Total | |
| | | | | | | | | | | | | | | | |
| As at December 31, 2018 | | | | | | | | | | | | | | | | | | | | |
| Finance lease payables, including current portion | | | 2,518,653 | | | | 1,161,490 | | | | 707,716 | | | | 13,238 | | | | 4,401,097 | |
| Long-term bank and other loans, including current portion | | | 3,384,400 | | | | 7,377,956 | | | | 16,593,587 | | | | 18,784,797 | | | | 46,140,740 | |
| Medium-term notes and bonds, including current portion | | | 400,000 | | | | — | | | | 9,785,840 | | | | — | | | | 10,185,840 | |
| Short-term bonds | | | 500,000 | | | | — | | | | — | | | | — | | | | 500,000 | |
| Gold leasing arrangement | | | 1,607,905 | | | | — | | | | — | | | | — | | | | 1,607,905 | |
| Short-term bank and other loans | | | 39,296,192 | | | | — | | | | — | | | | — | | | | 39,296,192 | |
| Interest payables for borrowings | | | 4,848,968 | | | | 2,602,751 | | | | 4,197,364 | | | | 898,786 | | | | 12,547,869 | |
| Financial liabilities at fair value through profit or loss | | | 1,766 | | | | — | | | | — | | | | — | | | | 1,766 | |
| Financial liabilities included in other payables and accrued liabilities, excluding accrued interest | | | 8,855,639 | | | | — | | | | — | | | | — | | | | 8,855,639 | |
| Financial liabilities included in other non-current liabilities (note) | | | — | | | | 108,896 | | | | 333,354 | | | | 420,258 | | | | 862,508 | |
| Trade and notes payables | | | 14,007,600 | | | | — | | | | — | | | | — | | | | 14,007,600 | |
| | | | | | | | | | | | | | | | | | | | | |
| | | | 75,421,123 | | | | 11,251,093 | | | | 31,617,861 | | | | 20,117,079 | | | | 138,407,156 | |
| | | |
| | | Cash flow forecast is performed in the operating entities of the Group and aggregated by the Group Treasury. The Group Treasury monitors rolling forecasts of the Group’s liquidity requirements to ensure it has sufficient cash to meet operational needs while maintaining sufficient headroom on its undrawn committed borrowing facilities at all times so that the Group does not breach borrowing limits or covenants (where applicable) on any of its borrowing facilities. This forecast takes into consideration of the Group’s debt financing plans, covenant compliance, compliance with internal balance sheet ratio targets and, if applicable, external regulatory or legal requirements, for example, currency restrictions. |
| | | |
| | Note: | As at December 31, 2017, the Group had total banking facilities of approximately RMB152,080 million (2016: RMB134,235 million) of which amounts totalling RMB69,414 million (2016: RMB61,980 million) have been utilizeddisclosed in note 21, as at December 31, 2017. Banking facilities2018, the carrying value of approximately RMB56,104financial liabilities included in other non-current liabilities was RMB841 million (2016: RMB67,510 million) will be subject to renewal during the next 12 months. The directors of the Company are confident that such banking facilities can be renewed upon expiration based on their past experience and good credit standing. |
| | | |
| | | In addition, as at December 31, 2017, the Group had credit facilities through its futures agent at the LME amounting to USD20 million (equivalent to RMB131 million) (December 31, 2016: USD120 million (equivalent to RMB8322017: RMB769 million)), of which USD2 million (equivalent to RMB13 million) (December 31, 2016: USD50 million (equivalent to RMB344 million)) has been utilized. The futures agent has the right to adjust the related credit facilities. |
| | | |
| | | Management also monitors rolling forecasts of the Group’s liquidity reserve on the basis of expected cash flows.. |
ALUMINUM CORPORATION OF CHINA LIMITED AND ITS SUBSIDIARIES
NOTES TO THE CONSOLIDATED FINANCIAL STATEMENTS(Continued)
For the years ended December 31, 2015, 2016, 2017 and 20172018
(Amounts expressed in thousands of RMB unless otherwise stated)
| 3636.. | FINANCIAL AND CAPITAL RISK MANAGEMENT(Continued) |
| | | | |
| 36.2 | 36.1 | Financial risk managementinstruments(Continued) |
| | | | |
| | (c) | Liquidity risk(Continued) |
| | | |
| | | The table below analyzes the maturity profile of the Group’s financial liabilities as at the end of the reporting period. The amounts disclosed in the table are the contractual undiscounted cash flows. |
| | | | Within 1 year | | | 1 to 2 years | | | 2 to 5 years | | | Over 5 years | | | Total | |
| | | | | | | | | | | | | | | | | |
| As at December 31, 2016 | | | | | | | | | | | | | | | | |
| Finance lease payables, including current portion | | | 2,253,720 | | | 2,068,315 | | | 2,895,251 | | | — | | | 7,217,286 | |
| Long-term bank and other loans, including current portion | | | 4,725,151 | | | 8,000,722 | | | 10,275,883 | | | 8,698,516 | | | 31,700,272 | |
| Long-term bonds | | | 2,000,000 | | | — | | | — | | | — | | | 2,000,000 | |
| Medium-term notes and bonds, including current portion | | | 6,400,000 | | | 12,500,000 | | | 3,215,000 | | | — | | | 22,115,000 | |
| Short-term bonds | | | 7,900,000 | | | — | | | — | | | — | | | 7,900,000 | |
| Gold leasing arrangement | | | 3,000,000 | | | — | | | — | | | — | | | 3,000,000 | |
| Short-term bank and other loans | | | 32,321,825 | | | — | | | — | | | — | | | 32,321,825 | |
| Interest payables for borrowings | | | 6,062,365 | | | 1,701,480 | | | 2,436,061 | | | 470,469 | | | 10,670,375 | |
| Financial liabilities at fair value through profit or loss | | | 3,575 | | | — | | | — | | | — | | | 3,575 | |
| Financial liabilities included in other payables and accrued liabilities, excluding accrued interest | | | 8,501,869 | | | — | | | — | | | — | | | 8,501,869 | |
| Financial liabilities included in other non-current liabilities(Note) | | | — | | | 218,201 | | | 330,021 | | | 405,261 | | | 953,483 | |
| Trade and notes payables | | | 11,342,870 | | | — | | | — | | | — | | | 11,342,870 | |
| | | | | | | | | | | | | | | | | |
| | | | 84,511,375 | | | 24,488,718 | | | 19,152,216 | | | 9,574,246 | | | 137,726,555 | |
| (a) | Financial instruments by category |
The carrying amounts of each of the categories of financial instruments of the Group as at the end of the reporting period are as follows:
| Financial assets | | | |
| | | December 31, 2017 | |
| | | Financial assets at fair value through profit or loss | | | Loans and
receivables | | | Available-
for-sale
financial investments | | | Total | |
| Current | | | | | | | | | | | | |
| | | | | | | | | | | | | |
| Trade and notes receivables | | | — | | | | 8,008,937 | | | | — | | | | 8,008,937 | |
| Financial assets at fair value through profit or loss | | | 9,534 | | | | — | | | | — | | | | 9,534 | |
| Restricted cash | | | — | | | | 2,168,192 | | | | — | | | | 2,168,192 | |
| Cash and cash equivalents | | | — | | | | 27,835,866 | | | | — | | | | 27,835,866 | |
| Financial assets included in other current assets | | | — | | | | 6,487,547 | | | | — | | | | 6,487,547 | |
| | | | | | | | | | | | | | | | | |
| Subtotal | | | 9,534 | | | | 44,500,542 | | | | — | | | | 44,510,076 | |
| | | | | | | | | | | | | | | | | |
| Non-current | | | | | | | | | | | | | | | | |
| | | | | | | | | | | | | | | | | |
| Available-for-sale financial investments | | | — | | | | — | | | | 1,928,201 | | | | 1,928,201 | |
| Financial assets included in other non-current assets | | | — | | | | 261,156 | | | | — | | | | 261,156 | |
| | | | | | | | | | | | | | | | | |
| Subtotal | | | — | | | | 261,156 | | | | 1,928,201 | | | | 2,189,357 | |
| | | | | | | | | | | | | | | | | |
| Total | | | 9,534 | | | | 44,761,698 | | | | 1,928,201 | | | | 46,699,433 | |
ALUMINUM CORPORATION OF CHINA LIMITED AND ITS SUBSIDIARIES
NOTES TO THE CONSOLIDATED FINANCIAL STATEMENTS(Continued)
For the years ended December 31, 2015, 2016, 2017 and 20172018
(Amounts expressed in thousands of RMB unless otherwise stated)
| 3636.. | FINANCIAL AND CAPITAL RISK MANAGEMENT(Continued) |
| | | |
| 36.2 | 36.1Financial instruments(Continued) |
| (a) | Financial risk managementinstruments by category(Continued) |
| | | |
| | (c) | Liquidity risk(Continued) |
| | | |
| | | The table below analyzes the maturity profile of the Group’s financial liabilities as at the end of the reporting period. The amounts disclosed in the table are the contractual undiscounted cash flows. |
| | | | Within 1 year | | | 1 to 2 years | | | 2 to 5 years | | | Over 5 years | | | Total | |
| | | | | | | | | | | | | | | | | |
| As at December 31, 2017 | | | | | | | | | | | | | | | | |
| Finance lease payables, including current portion | | | 2,371,917 | | | 1,762,618 | | | 1,890,329 | | | 73,603 | | | 6,098,467 | |
| Long-term bank and other loans, including current portion | | | 6,890,140 | | | 5,174,015 | | | 8,673,794 | | | 19,745,385 | | | 40,483,334 | |
| Medium-term notes and bonds, including current portion | | | 12,500,000 | | | 3,215,000 | | | — | | | — | | | 15,715,000 | |
| Short-term bonds | | | 3,500,000 | | | — | | | — | | | — | | | 3,500,000 | |
| Gold leasing arrangement | | | 6,818,393 | | | — | | | — | | | — | | | 6,818,393 | |
| Short-term bank and other loans | | | 30,834,442 | | | — | | | — | | | — | | | 30,834,442 | |
| Interest payables for borrowings | | | 5,282,030 | | | 2,123,149 | | | 4,106,037 | | | 1,048,728 | | | 12,559,944 | |
| Financial liabilities at fair value through profit or loss | | | 89,426 | | | — | | | — | | | — | | | 89,426 | |
| Financial liabilities included in other payables and accrued liabilities, excluding accrued interest | | | 10,307,315 | | | — | | | — | | | — | | | 10,307,315 | |
| Financial liabilities included in other non-current liabilities(Note) | | | — | | | 107,785 | | | 108,896 | | | 587,668 | | | 804,349 | |
| Trade and notes payables | | | 12,321,970 | | | — | | | — | | | — | | | 12,321,970 | |
| | | | | | | | | | | | | | | | | |
| | | | 90,915,633 | | | 12,382,567 | | | 14,779,056 | | | 21,455,384 | | | 139,532,640 | |
| | | Note: As disclosed in note 21, as at December 31, 2017, the carrying value of financial liabilities included in other non-current liabilities was RMB769 million (December 31, 2016: RMB790 million). |
| Financial liabilities | | | |
| | | December 31, 2017 | |
| | | Financial liabilities at fair value through profit or loss | | | Financial liabilities at amortized cost | | | Total | |
| Current | | | | | | | | | |
| | | | | | | | | | |
| Financial liabilities at fair value through profit or loss | | | 89,426 | | | | — | | | | 89,426 | |
| Interest-bearing loans and borrowings | | | — | | | | 62,981,070 | | | | 62,981,070 | |
| Financial liabilities included in other payables and accrued liabilities | | | — | | | | 11,363,236 | | | | 11,363,236 | |
| Trade and notes payables | | | — | | | | 12,360,441 | | | | 12,360,441 | |
| | | | | | | | | | | | | |
| Subtotal | | | 89,426 | | | | 86,704,747 | | | | 86,794,173 | |
| | | | | | | | | | | | | |
| Non-current | | | | | | | | | | | | |
| | | | | | | | | | | | | |
| Financial liabilities included in other non-current liabilities | | | — | | | | 769,061 | | | | 769,061 | |
| Interest-bearing loans and borrowings | | | — | | | | 40,289,703 | | | | 40,289,703 | |
| | | | | | | | | | | | | |
| Subtotal | | | — | | | | 41,058,764 | | | | 41,058,764 | |
| | | | | | | | | | | | | |
| Total | | | 89,426 | | | | 127,763,511 | | | | 127,852,937 | |
ALUMINUM CORPORATION OF CHINA LIMITED AND ITS SUBSIDIARIES
NOTES TO THE CONSOLIDATED FINANCIAL STATEMENTS(Continued)
For the years ended December 31, 2015, 2016, 2017 and 20172018
(Amounts expressed in thousands of RMB unless otherwise stated)
| 36. | FINANCIAL AND CAPITAL RISK MANAGEMENT(Continued) |
| | | |
| 36.2 | 36.2 | Financial instruments(Continued) |
| | | |
| | (a) | Financial instruments by category |
| | | |
| | | The carrying amounts of each of the categories of financial instruments of the Group as at the end of the reporting period are as follows: |
| Financial assets | | | | |
| | | | December 31, 2016 | |
| | | | Financial assets at fair value through profit or loss | | | Loans and receivables | | | Available- for-sale financial investments | | | Total | |
| Current | | | | | | | | | | | | | |
| | | | | | | | | | | | | | |
| Trade and notes receivables | | | — | | | 7,349,563 | | | — | | | 7,349,563 | |
| Financial assets at fair value through profit or loss | | | 54,756 | | | — | | | — | | | 54,756 | |
| Restricted cash and time deposits | | | — | | | 2,087,447 | | | — | | | 2,087,447 | |
| Cash and cash equivalents | | | — | | | 23,813,736 | | | — | | | 23,813,736 | |
| Financial assets included in other current assets | | | — | | | 10,663,486 | | | — | | | 10,663,486 | |
| | | | | | | | | | | | | | |
| Subtotal | | | 54,756 | | | 43,914,232 | | | — | | | 43,968,988 | |
| | | | | | | | | | | | | | |
| Non-current | | | | | | | | | | | | | |
| | | | | | | | | | | | | | |
| Available-for-sale financial investments | | | — | | | — | | | 164,393 | | | 164,393 | |
| Financial assets included in other non-current assets | | | — | | | 1,366,359 | | | — | | | 1,366,359 | |
| | | | | | | | | | | | | | |
| Subtotal | | | — | | | 1,366,359 | | | 164,393 | | | 1,530,752 | |
| | | | | | | | | | | | | | |
| Total | | | 54,756 | | | 45,280,591 | | | 164,393 | | | 45,499,740 | |
ALUMINUM CORPORATION OF CHINA LIMITED AND ITS SUBSIDIARIES
NOTES TO THE CONSOLIDATED FINANCIAL STATEMENTS(Continued)
For the years ended December 31, 2015, 2016 and 2017
(Amounts expressed in thousands of RMB unless otherwise stated)
36. | FINANCIAL AND CAPITAL RISK MANAGEMENT(Continued) |
| |
| 36.2 | Financial instruments(Continued) |
| | |
| (a) | Financial instruments by category(Continued) |
| | |
| | Financial liabilities |
| | | December 31, 2016 |
| | | | Financial
liabilities at fair
value through
profit or loss | | | | Financial
liabilities at
amortized cost | | | | Total | |
| Current | | | | | | | | | | | | |
| | | | | | | | | | | | | |
| Financial liabilities at fair value through profit or loss | | | 3,575 | | | | — | | | | 3,575 | |
| Interest-bearing loans and borrowings | | | — | | | | 58,459,394 | | | | 58,459,394 | |
| Financial liabilities included in other payables and accrued liabilities | | | — | | | | 9,572,489 | | | | 9,572,489 | |
| Trade and notes payables | | | — | | | | 11,342,870 | | | | 11,342,870 | |
| | | | | | | | | | | | | |
| Subtotal | | | 3,575 | | | | 79,374,753 | | | | 79,378,328 | |
| | | | | | | | | | | | | |
| Non-current | | | | | | | | | | | | |
| | | | | | | | | | | | | |
| Financial liabilities included in other non-current liabilities | | | — | | | | 789,720 | | | | 789,720 | |
| Interest-bearing loans and borrowings | | | — | | | | 47,322,748 | | | | 47,322,748 | |
| | | | | | | | | | | | | |
| Subtotal | | | — | | | | 48,112,468 | | | | 48,112,468 | |
| | | | | | | | | | | | | |
| Total | | | 3,575 | | | | 127,487,221 | | | | 127,490,796 | |
ALUMINUM CORPORATION OF CHINA LIMITED AND ITS SUBSIDIARIES
NOTES TO THE CONSOLIDATED FINANCIAL STATEMENTS(Continued)
For the years ended December 31, 2015, 2016 and 2017
(Amounts expressed in thousands of RMB unless otherwise stated)
36. | FINANCIAL AND CAPITAL RISK MANAGEMENT(Continued) |
| |
| 36.2 | Financial instruments(Continued) |
| | |
| (a) | Financial instruments by category(Continued) |
| Financial assets | | |
| | | |
| | | December 31, 2017 |
| | | | Financial assets
at fair value
through profit or
loss | | | | Loans and
receivables | | | | Available-
for-sale
financial
investments | | | | Total | |
| Current | | | | | | | | | | | | | | | | |
| | | | | | | | | | | | | | | | | |
| Trade and notes receivables | | | — | | | | 8,026,209 | | | | — | | | | 8,026,209 | |
| Financial assets at fair value through profit or loss | | | 9,534 | | | | — | | | | — | | | | 9,534 | |
| Restricted cash and time deposits | | | — | | | | 2,152,492 | | | | — | | | | 2,152,492 | |
| Cash and cash equivalents | | | — | | | | 27,750,686 | | | | — | | | | 27,750,686 | |
| Financial assets included in other current assets | | | — | | | | 6,487,089 | | | | — | | | | 6,487,089 | |
| | | | | | | | | | | | | | | | | |
| Subtotal | | | 9,534 | | | | 44,416,476 | | | | — | | | | 44,426,010 | |
| | | | | | | | | | | | | | | | | |
| Non-current | | | | | | | | | | | | |
| | | | | | | | | | | | | |
| Available-for-sale financial investments | | | — | | | | — | | | | 1,928,201 | | | | 1,928,201 | |
| Financial assets included in other non-current assets | | | — | | | | 261,156 | | | | — | | | | 261,156 | |
| | | | | | | | | | | | | | | | | |
| Subtotal | | | — | | | | 261,156 | | | | 1,928,201 | | | | 2,189,357 | |
| | | | | | | | | | | | | | | | | |
| Total | | | 9,534 | | | | 44,677,632 | | | | 1,928,201 | | | | 46,615,367 | |
| Financial assets | | | |
| | | December 31, 2018 | |
| | | Financial assets at fair value through profit or loss | | | Financial assets at amortized cost | | | Equity investments designated at fair value through other comprehensive income | | | Total | |
| | | Designated as such upon initial recognition | | | Held for trading | | | | | | | | | | |
| Current | | | | | | | | | | | | | | | |
| | | | | | | | | | | | | | | | |
| Trade and notes receivables | | | — | | | | — | | | | 8,100,532 | | | | — | | | | 8,100,532 | |
| Financial assets at fair value through profit or loss | | | — | | | | 16,141 | | | | — | | | | — | | | | 16,141 | |
| Restricted cash | | | — | | | | — | | | | 2,165,288 | | | | | | | | 2,165,288 | |
| Cash and cash equivalents | | | — | | | | — | | | | 19,130,652 | | | | — | | | | 19,130,652 | |
| Financial assets included in other current assets | | | — | | | | — | | | | 4,875,525 | | | | — | | | | 4,875,525 | |
| | | | | | | | | | | | | | | | | | | | | |
| Subtotal | | | — | | | | 16,141 | | | | 34,271,997 | | | | — | | | | 34,288,138 | |
| | | | | | | | | | | | | | | | | | | | | |
| Non-current | | | | | | | | | | | | | | | | | | | | |
| | | | | | | | | | | | | | | | | | | | | |
| Equity investments designated at fair value through other comprehensive income | | | — | | | | — | | | | — | | | | 1,729,825 | | | | 1,729,825 | |
| Other non-current assets | | | — | | | | — | | | | 204,718 | | | | — | | | | 204,718 | |
| | | | | | | | | | | | | | | | | | | | | |
| Subtotal | | | — | | | | — | | | | 204,718 | | | | 1,729,825 | | | | 1,934,543 | |
| | | | | | | | | | | | | | | | | | | | | |
| Total | | | — | | | | 16,141 | | | | 34,476,715 | | | | 1,729,825 | | | | 36,222,681 | |
ALUMINUM CORPORATION OF CHINA LIMITED AND ITS SUBSIDIARIES
NOTES TO THE CONSOLIDATED FINANCIAL STATEMENTS(Continued)
For the years ended December 31, 2015, 2016, 2017 and 2017
2018
(Amounts expressed in thousands of RMB unless otherwise stated)
| 36. | FINANCIAL AND CAPITAL RISK MANAGEMENT(Continued) |
| |
| 36.2 | 36.2 | Financial instruments(Continued) |
| | |
| (a) | Financial instruments by category(Continued) |
| Financial liabilities | | |
| | | |
| | | December 31, 2017 |
| | | | Financial
liabilities at fair
value through
profit or loss | | | | Financial
liabilities at
amortized cost | | | | Total | |
| Current | | | | | | | | | | | | |
| | | | | | | | | | | | | |
| Financial liabilities at fair value through profit or loss | | | 89,426 | | | | — | | | | 89,426 | |
| Interest-bearing loans and borrowings | | | — | | | | 62,752,570 | | | | 62,752,570 | |
| Financial liabilities included in other payables and accrued liabilities (note 22) | | | — | | | | 11,284,456 | | | | 11,284,456 | |
| Trade and notes payables | | | — | | | | 12,321,970 | | | | 12,321,970 | |
| | | | | | | | | | | | | |
| Subtotal | | | 89,426 | | | | 86,358,996 | | | | 86,448,422 | |
| | | | | | | | | | | | | |
| Non-current | | | | | | | | | | | | |
| | | | | | | | | | | | | |
| Financial liabilities included in other non-current liabilities (note 21) | | | — | | | | 769,061 | | | | 769,061 | |
| Interest-bearing loans and borrowings | | | — | | | | 40,289,703 | | | | 40,289,703 | |
| | | | | | | | | | | | | |
| Subtotal | | | — | | | | 41,058,764 | | | | 41,058,764 | |
| | | | | | | | | | | | | |
| Total | | | 89,426 | | | | 127,417,760 | | | | 127,507,186 | |
| Financial liabilities | | | |
| | | December 31, 2018 | |
| | | Financial liabilities at fair value through profit or loss | | | Financial liabilities at amortized cost | | | Total | |
| | | Designated as such upon initial recognition | | | Held for trading | | | | | | | |
| Current | | | | | | | | | | | | |
| | | | | | | | | | | | | |
| Financial liabilities at fair value through profit or loss | | | — | | | | 1,766 | | | | — | | | | 1,766 | |
| Interest-bearing loans and borrowings | | | — | | | | — | | | | 47,513,582 | | | | 47,513,582 | |
| Financial liabilities included in other payables and accrued liabilities (note 22) | | | — | | | | — | | | | 9,251,925 | | | | 9,251,925 | |
| Trade and notes payables | | | — | | | | — | | | | 14,007,600 | | | | 14,007,600 | |
| | | | | | | | | | | | | | | | | |
| Subtotal | | | — | | | | 1,766 | | | | 70,773,107 | | | | 70,774,873 | |
| | | | | | | | | | | | | | | | | |
| Non-current | | | | | | | | | | | | | | | | |
| | | | | | | | | | | | | | | | | |
| Financial liabilities included in other non-current liabilities (note 21) | | | — | | | | — | | | | 841,059 | | | | 841,059 | |
| Interest-bearing loans and borrowings | | | — | | | | — | | | | 54,207,386 | | | | 54,207,386 | |
| | | | | | | | | | | | | | | | | |
| Subtotal | | | — | | | | — | | | | 55,048,445 | | | | 55,048,445 | |
| | | | | | | | | | | | | | | | | |
| Total | | | — | | | | 1,766 | | | | 125,821,552 | | | | 125,823,318 | |
ALUMINUM CORPORATION OF CHINA LIMITED AND ITS SUBSIDIARIES
NOTES TO THE CONSOLIDATED FINANCIAL STATEMENTS(Continued)
For the years ended December 31, 2015, 2016, 2017 and 2017
2018
(Amounts expressed in thousands of RMB unless otherwise stated)
| 3636.. | FINANCIAL AND CAPITAL RISK MANAGEMENT(Continued) |
| |
| 36.2 | 36.2 | Financial instruments(Continued) |
| | |
| (b) | Fair value and fair value hierarchy |
| | |
| | Fair value |
| | |
| | The carrying amounts and fair values of the Group’s financial instruments, other than those with carrying amounts that reasonably approximate to fair values and those carried at fair value, are as follows: |
Fair value
| | Carrying amounts | Fair values |
| | December 31,
2016 | December 31, 2017 | December 31, 2016 | December 31, 2017 |
| | | | | |
| Financial assets | | | | |
| Available-for-sale financial instruments | - | 1,848,000 | - | 1,848,000 |
| Financial assets included in other non-current assets (note 12) | 1,366,359 | 261,156 | 1,375,140 | 242,567 |
| | | | | |
| | 1,366,359 | 2,109,156 | 1,375,140 | 2,090,567 |
| | Carrying amounts | Fair values |
| | December 31, 2016 | December 31, 2017 | December 31, 2016 | December 31, 2017 |
| | | | | |
| Financial liabilities | | | | |
| Financial liabilities included in other non-current liabilities (note 21) | 789,720 | 769,061 | 789,720 | 660,688 |
| Long-term interest-bearing loans and borrowings (note 19) | 47,322,748 | 40,289,703 | 46,766,169 | 39,475,392 |
| | | | | |
| | 48,112,468 | 41,058,764 | 47,555,889 | 40,136,080 |
The carrying amounts and fair values of the Group’s financial instruments, other than those with carrying amounts that reasonably approximate to fair values and those carried at fair value, are as follows:
| | | | Carrying amounts | | | | Fair values | |
| | | | December 31, 2017 | | | | December 31, 2018 | | | | December 31, 2017 | | | | December 31, 2018 | |
| | | | | | | | | | | | | | | | | |
| Financial assets | | | | | | | | | | | | | | | | |
| Other non-current assets (note 12) | | | 261,156 | | | | 204,718 | | | | 242,567 | | | | 182,132 | |
| | | | | | | | | | | | | | | | | |
| | | | 261,156 | | | | 204,718 | | | | 242,567 | | | | 182,132 | |
| | | | Carrying amounts | | | | Fair values | |
| | | | December 31, 2017 | | | | December 31, 2018 | | | | December 31, 2017 | | | | December 31, 2018 | |
| | | | | | | | | | | | | | | | | |
| Financial liabilities | | | | | | | | | | | | | | | | |
| Financial liabilities included in other non-current liabilities (note 21) | | | 769,061 | | | | 841,059 | | | | 660,688 | | | | 816,529 | |
| Long-term interest-bearing loans and borrowings (note 19) | | | 40,289,703 | | | | 54,207,386 | | | | 39,475,392 | | | | 53,207,052 | |
| | | | | | | | | | | | | | | | | |
| | | | 41,058,764 | | | | 55,048,445 | | | | 40,136,080 | | | | 54,023,581 | |
ALUMINUM CORPORATION OF CHINA LIMITED AND ITS SUBSIDIARIES
NOTES TO THE CONSOLIDATED FINANCIAL STATEMENTS(Continued)
For the years ended December 31, 2015, 2016, 2017 and 2017
2018
(Amounts expressed in thousands of RMB unless otherwise stated)
| 3636.. | FINANCIAL AND CAPITAL RISK MANAGEMENT(Continued) |
| |
| 36.2 | 36.2 | Financial instruments(Continued) |
| | | |
| | (b) | Fair value and fair value hierarchy(Continued) |
| | | |
| | | Fair value(Continued) |
| | | |
| | | Management has assessed that the fair values of cash and cash equivalents, restricted cash and time deposits, trade and notes receivables, financial assets included in other current assets, entrusted loans, trade and notes payables, financial liabilities included in other payables and accrued liabilities, short-term and the current portion of interest-bearing loans and borrowings, interest payable and the current portion of long-term payables approximate to their carrying amounts largely due to the short term maturities of these instruments. |
| | | |
| | | The fair values of the financial assets and liabilities are included at the amount at which the instrument could be exchanged in a current transaction between willing parties, other than in a forced or liquidation sale. The following methods and assumptions were used to estimate the fair values: |
Fair value (continued)
Management has assessed that the fair values of cash and cash equivalents, restricted cash, trade and notes receivables, financial assets included in other current assets, entrusted loans, trade and notes payables, financial liabilities included in other payables and accrued liabilities, short-term and the current portion of interest-bearing loans and borrowings, interest payable and the current portion of long-term payables approximate to their carrying amounts largely due to the short term maturities of these instruments.
The fair values of the financial assets and liabilities are included at the amount at which the instrument could be exchanged in a current transaction between willing parties, other than in a forced or liquidation sale. The following methods and assumptions were used to estimate the fair values:
| | | •● | The fair values of the financial assets included in other non-current assets and financial liabilities included in other non-current liabilities and long-term interest-bearing loans and borrowings have been calculated by discounting the expected future cash flows using rates currently available for instruments on with similar terms, credit risk and remaining maturities. |
| | | The Group’s own non-performance risk for financial liabilities included in other non-current liabilities and long-term interest-bearing loans and borrowings as at December 31, 2016 and 2017 was assessed to be insignificant. |
ALUMINUM CORPORATION OF CHINA LIMITED AND ITS SUBSIDIARIES
NOTES TO THE CONSOLIDATED FINANCIAL STATEMENTS(Continued)
For the years ended December 31, 2015, 2016 and 2017
(Amounts expressed in thousands of RMB unless otherwise stated)
36. | FINANCIAL AND CAPITAL RISK MANAGEMENT(Continued) |
| |
| 36.2 | Financial instruments(Continued) |
| | |
| (b) | Fair value and fair value hierarchy(Continued) |
| | |
| | Fair value hierarchy |
| | |
| | The following tables illustrate the fair value measurement hierarchy of the Group’s financial instruments: |
| | |
| | Assets measured at fair value |
| As at December 31, 2016 | Fair value measurement using |
| | Quoted prices in
active markets (Level 1) | Significant
observable
inputs (Level 2) | Significant
unobservable
inputs (Level 3) | Total |
| | | | | |
| Financial assets at fair value through profit or loss: | | | | |
| Futures contracts | 54,756 | - | - | 54,756 |
| Available for sale financial investments | 93,893 | - | - | 93,893 |
| | | | | |
| | 148,649 | - | - | 148,649 |
| As at December 31, 2017 | Fair value measurement using |
| | Quoted prices in
active markets (Level 1) | Significant
observable
inputs (Level 2) | Significant
unobservable
inputs (Level 3) | Total |
| | | | | |
| Financial assets at fair value through profit or loss: | | | | |
| Futures contracts | 9,534 | - | - | 9,534 |
| Available-for-sale financial investments | | | | |
| Listed equity investments | 9,701 | - | - | 9,701 |
| Other unlisted investment | - | 1,848,000 | - | 1,848,000 |
| | | | | |
| | 19,235 | 1,848,000 | - | 1,867,235 |
2018 was assessed to be insignificant.
ALUMINUM CORPORATION OF CHINA LIMITED AND ITS SUBSIDIARIES
NOTES TO THE CONSOLIDATED FINANCIAL STATEMENTS(Continued)
For the years ended December 31, 2015, 2016 and 2017
(Amounts expressed in thousands of RMB unless otherwise stated)
36. | FINANCIAL AND CAPITAL RISK MANAGEMENT(Continued) |
| |
| 36.2 | Financial instruments(Continued) |
| | |
| (b) | Fair value and fair value hierarchy(Continued) |
| | |
| | Fair value hierarchy(Continued) |
| | |
| | Liabilities measured at fair value |
| As at December 31, 2016 | Fair value measurement using |
| | Quoted prices
in active
markets (Level 1) | Significant
observable
inputs (Level 2) | Significant
unobservable
inputs (Level 3) | Total |
| | | | | |
| Financial liabilities at fair value through profit or loss: | | | | |
| Futures contracts | 3,468 | - | - | 3,468 |
| European option contracts | - | 107 | - | 107 |
| | | | | |
| | 3,468 | 107 | - | 3,575 |
| | | | | | |
| As at December 31, 2017 | Fair value measurement using |
| | Quoted prices
in active
markets (Level 1) | Significant
observable
inputs (Level 2) | Significant
unobservable
inputs (Level 3) | Total |
| | | | | |
| Financial liabilities at fair value through profit or loss: | | | | |
| Futures contracts | 89,426 | - | - | 89,426 |
| | | | | |
| | 89,426 | - | - | 89,426 |
ALUMINUM CORPORATION OF CHINA LIMITED AND ITS SUBSIDIARIES
NOTES TO THE CONSOLIDATED FINANCIAL STATEMENTS(Continued)
For the years ended December 31, 2015, 2016 and 2017
(Amounts expressed in thousands of RMB unless otherwise stated)
36. | FINANCIAL AND CAPITAL RISK MANAGEMENT(Continued) |
| |
| 36.2 | Financial instruments(Continued) |
| | |
| (b) | Fair value and fair value hierarchy(Continued) |
| | |
| | Fair value hierarchy(Continued) |
| | |
| | Assets for which fair values are disclosed |
| As at December 31, 2016 | Fair value measurement using |
| | Quoted prices
in active
markets (Level 1) | Significant
observable
inputs (Level 2) | Significant
unobservable
inputs (Level 3) | Total |
| Loans and receivables: | | | | |
| Financial assets included in other non-current assets | - | 1,375,140 | - | 1,375,140 |
| As at December 31, 2017 | Fair value measurement using |
| | Quoted prices
in active
markets (Level 1) | Significant
observable
inputs (Level 2) | Significant
unobservable
inputs (Level 3) | Total |
| Loans and receivables: | | | | |
| Financial assets included in other non-current assets | - | 242,567 | - | 242,567 |
ALUMINUM CORPORATION OF CHINA LIMITED AND ITS SUBSIDIARIES
NOTES TO THE CONSOLIDATED FINANCIAL STATEMENTS(Continued)
For the years ended December 31, 2015, 2016 and 2017
(Amounts expressed in thousands of RMB unless otherwise stated)
36. | FINANCIAL AND CAPITAL RISK MANAGEMENT(Continued) |
| | |
| 36.2 | Financial instruments(Continued) |
| | |
| (b) | Fair value and fair value hierarchy(Continued) |
| | |
| | Fair value hierarchy(Continued) |
| | |
| | Liabilities for which fair values are disclosed |
As at December 31, 2016 | Fair value measurement using |
| | Quoted
prices in
active
markets (Level 1) | Significant
observable
inputs (Level 2) | Significant
unobservable
inputs (Level 3) | Total |
| | | | | |
| Financial liabilities at amortized cost: | | | | |
| Financial liabilities included in other non-current liabilities | - | 789,720 | - | 789,720 |
| Long-term interest-bearing loans and borrowings | - | 46,766,169 | - | 46,766,169 |
| | | | | |
| | - | 47,555,889 | - | 47,555,889 |
| As at December 31, 2017 | Fair value measurement using |
| | Quoted
prices in
active
markets (Level 1) | Significant
observable
inputs (Level 2) | Significant
unobservable
inputs (Level 3) | Total |
| | | | | |
| Financial liabilities at amortized cost: | | | | |
| Financial liabilities included in other non-current liabilities | - | 660,688 | - | 660,688 |
| Long-term interest-bearing loans and borrowings | - | 39,475,392 | - | 39,475,392 |
| | | | | |
| | - | 40,136,080 | - | 40,136,080 |
| | During the year ended December 31, 2017, the Group had no transfers of fair value measurements between Level 1 and Level 2 and no transfers into or out of Level 3 for both financial assets and financial liabilities (2016: Nil). |
ALUMINUM CORPORATION OF CHINA LIMITED AND ITS SUBSIDIARIES
NOTES TO THE CONSOLIDATED FINANCIAL STATEMENTS(Continued)
For the years ended December 31, 2015, 2016, 2017 and 20172018
(Amounts expressed in thousands of RMB unless otherwise stated)
| 3636.. | FINANCIAL AND CAPITAL RISK MANAGEMENT(Continued) |
| | |
| 36.2 | 36.3Financial instruments(Continued) |
| (b) | Capital risk management |
| | |
| | The Group’s capital management objectives are to safeguard the Group’s ability to continue as a going concern in order to provide returns for shareholdersFair value and benefits for other stakeholders, and to maintain an optimal capital structure to reduce the cost of capital. |
| | |
| | In order to maintain or adjust the capital structure, the Group may adjust the amount of dividends paid to shareholders, issue new shares or sell assets to reduce debts. |
| | |
| | Consistent with other entities in the industry, the Group monitors capital on the basis of its gearing ratio. This ratio is calculated as net debt divided by total capital. Net debt is calculated as total liabilities (excluding deferred tax liabilities, income tax payable and deferred government grants) and deferred government grants less restricted cash, time deposits and cash and cash equivalents. Total capital is calculated as equity, as shown in the consolidated statement of financial position, plus net debt less non-controlling interests. |
| | |
| | The gearing ratio as at December 31, 2016 and 2017 is as follows:fair value hierarchy(Continued) |
Fair value hierarchy
| | | | December 31,
2016 | | | | December 31,
2017 | |
| | | | | | | | | |
| Total liabilities (excluding deferred tax liabilities, income tax payable and deferred government grants) | | | 131,916,992 | | | | 132,022,668 | |
| Less: restricted cash, time deposits and cash and cash equivalents | | | (25,901,183 | ) | | | (29,903,178 | ) |
| | | | | | | | | |
| Net debt | | | 106,015,809 | | | | 102,119,490 | |
| | | | | | | | | |
| Total equity | | | 55,786 ,808 | | | | 65,513,879 | |
| Add: net debt | | | 106,015,809 | | | | 102,119,490 | |
| Less: non-controlling interests | | | (17,618,510 | ) | | | (26,035,429 | ) |
| | | | | | | | | |
| Total capital attributable to owners of the parent | | | 144,184,107 | | | | 141,597,940 | |
| | | | | | | | | |
| Gearing ratio | | | 74% | | | | 72% | |
The following tables illustrate the fair value measurement hierarchy of the Group’s financial instruments:
Assets measured at fair value
| As at December 31, 2017 | | Fair value measurement using | |
| | | Quoted prices in active markets (Level 1) | | | Significant observable inputs (Level 2) | | | Significant unobservable inputs (Level 3) | | | Total | |
| | | | | | | | | | | | | |
| Financial assets at fair value through profit or loss: | | | | | | | | | | | | | | | | |
| Futures contracts | | | 9,534 | | | | — | | | | — | | | | 9,534 | |
| Available-for-sale financial investments: | | | | | | | | | | | | | | | | |
| Listed equity investments | | | 9,701 | | | | — | | | | — | | | | 9,701 | |
| Other unlisted investment | | | — | | | | — | | | | 1,848,000 | | | | 1,848,000 | |
| | | | | | | | | | | | | | | | | |
| | | | 19,235 | | | | — | | | | 1,848,000 | | | | 1,867,235 | |
| As at December 31, 2018 | | Fair value measurement using | |
| | | Quoted prices in active markets (Level 1) | | | Significant observable inputs (Level 2) | | | Significant unobservable inputs (Level 3) | | | Total | |
| | | | | | | | | | | | | |
| Financial assets at fair value through profit or loss: | | | | | | | | | | | | | | | | |
| Futures contracts | | | 16,141 | | | | — | | | | — | | | | 16,141 | |
| Equity investments designated at fair value through other comprehensive income: | | | | | | | | | | | | | | | | |
| Listed equity investments | | | 6,441 | | | | — | | | | — | | | | 6,441 | |
| Other unlisted investment | | | — | | | | — | | | | 1,723,384 | | | | 1,723,384 | |
| | | | | | | | | | | | | | | | | |
| | | | 22,582 | | | | — | | | | 1,723,384 | | | | 1,745,966 | |
ALUMINUM CORPORATION OF CHINA LIMITED AND ITS SUBSIDIARIES
NOTES TO THE CONSOLIDATED FINANCIAL STATEMENTS(Continued)
For the years ended December 31, 2015, 2016, 2017 and 2017
2018
(Amounts expressed in thousands of RMB unless otherwise stated)
| 37.36. | PARTLY-OWNED SUBSIDIARIES WITH MATERIAL NON-CONTROLLING INTERESTSFINANCIAL AND CAPITAL RISK MANAGEMENT(Continued) |
| |
| Other than the senior perpetual securities issued by a subsidiary of the Group, which is disclosed in note 40, details of the Group’s subsidiaries that have material non-controlling interests are set out below: |
| | 2016 | 2017 |
| | | | |
| Percentage of equity interest held by non-controlling interests |
| | | | |
| Ningxia Energy | 29.18% | | 29.18% |
| Shandong Huayu | 45.00% | | 45.00% |
| Chalco Shandong | - | | 30.80% |
| Zhongzhou Aluminum | - | | 36.90% |
| Baotou Aluminum | - | | 25.67% |
| Chalco Mining | - | | 81.14% |
| | | | |
| Profit for the year allocated to non-controlling interests |
| | | | |
| Ningxia Energy | 53,667 | | (5,670) |
| Shandong Huayu | 79,621 | | 13,070 |
| Chalco Shandong | - | | - |
| Zhongzhou Aluminum | - | | - |
| Baotou Aluminum | - | | 72,902 |
| Chalco Mining | - | | - |
| | | | |
| Dividends distributed to non-controlling interests |
| | | | |
| Ningxia Energy | 7,430 | | 3,264 |
| Shandong Huayu | - | | - |
| Chalco Shandong | - | | - |
| Zhongzhou Aluminum | - | | - |
| Baotou Aluminum | - | | - |
| Chalco Mining | - | | - |
| | | | |
| Accumulated balances of non-controlling interests at the reporting dates |
| | | | |
| Ningxia Energy | 4,516,727 | | 4,914,902 |
| Shandong Huayu | 822,327 | | 860,235 |
| Chalco Shandong | - | | 1,426,620 |
| Zhongzhou Aluminum | - | | 2,151,713 |
| Baotou Aluminum | 700,000 | | 2,588,831 |
| Chalco Mining | 1,101 | | 5,345,570 |
| 36.2 | Financial instruments(Continued) |
| (b) | Fair value and fair value hierarchy(Continued) |
Fair value hierarchy(Continued)
Liabilities measured at fair value
| As at December 31, 2017 | | Fair value measurement using | |
| | | Quoted prices in active markets
(Level 1) | | | Significant observable inputs
(Level 2) | | | Significant unobservable inputs
(Level 3) | | | Total | |
| | | | | | | | | | | | | |
| Financial liabilities at fair value through profit or loss: | | | | | | | | | | | | | | | | |
| Futures contracts | | | 89,426 | | | | — | | | | — | | | | 89,426 | |
| | | | | | | | | | | | | | | | | |
| | | | 89,426 | | | | — | | | | — | | | | 89,426 | |
| | | | | | | | | | | | | | | | | |
| As at December 31, 2018 | | Fair value measurement using | |
| | | Quoted prices in active markets (Level 1) | | | Significant observable inputs (Level 2) | | | Significant unobservable inputs (Level 3) | | | Total | |
| | | | | | | | | | | | | |
| Financial liabilities at fair value through profit or loss: | | | | | | | | | | | | | | | | |
| Futures contracts | | | 1,766 | | | | — | | | | — | | | | 1,766 | |
| | | | | | | | | | | | | | | | | |
| | | | 1,766 | | | | — | | | | — | | | | 1,766 | |
ALUMINUM CORPORATION OF CHINA LIMITED AND ITS SUBSIDIARIES
NOTES TO THE CONSOLIDATED FINANCIAL STATEMENTS(Continued)
For the years ended December 31, 2015, 2016, 2017 and 2017
2018
(Amounts expressed in thousands of RMB unless otherwise stated)
| 37.36. | PARTLY-OWNED SUBSIDIARIES WITH MATERIAL NON-CONTROLLING INTERESTSFINANCIAL AND CAPITAL RISK MANAGEMENT(Continued) |
| |
| 36.2 | As of December 31, 2017, pursuant to the "Investment Agreements" and the "Debt to Equity Swap Agreements" (note 17), the Investors have already made additional capital contributions of RMB12,600 million to the Target Companies. Subsequent to the completion of the capital increase, the Company's interest in Chalco Shandong, Zhongzhou Aluminum, Baotou Aluminum and Chalco Mining decreased from 100% to 69.20%, 63.10%, 74.33% and 18.86%, respectively. Pursuant to the "Investment Agreements" and the "Debt-to-Equity Swap Agreements", the Investors voluntarily became parties acting in concert with the Company. When voting at the shareholders’ and board meetings of the Target Companies, the Investors and the directors appointed by them undertake to act in accordance with the instructions from the Company and in concert with the Company. Therefore, in the opinion of the directors of the Company, the Group exercises control over the Target Companies; and the equity interest of the Target Companies held by the Investors are accounted for as non-controlling interests.Financial instruments(Continued) |
| (b) | Fair value and fair value hierarchy(Continued) |
Fair value hierarchy(Continued)
Assets for which fair values are disclosed
| As at December 31, 2017 | | Fair value measurement using | |
| | | Quoted
prices in
active
markets
(Level 1) | | Significant
observable
inputs
(Level 2) | | | Significant
unobservable
inputs
(Level 3) | | | Total | |
| Loans and receivables: | | | | | | | | | | | | | | |
| Financial assets included in other non-current assets | | — | | | 242,567 | | | | — | | | | 242,567 | |
| As at December 31, 2018 | | Fair value measurement using | |
| | | Quoted prices in active markets
(Level 1) | | Significant observable inputs
(Level 2) | | | Significant unobservable inputs
(Level 3) | | | Total | |
| Financial assets at amortized cost: | | | | | | | | | | | | | | |
| Financial assets included in other non-current assets | | — | | | 182,132 | | | | — | | | | 182,132 | |
ALUMINUM CORPORATION OF CHINA LIMITED AND ITS SUBSIDIARIES
NOTES TO THE CONSOLIDATED FINANCIAL STATEMENTS(Continued)
For the years ended December 31, 2015, 2016, 2017 and 2017
2018
(Amounts expressed in thousands of RMB unless otherwise stated)
| 36. | FINANCIAL AND CAPITAL RISK MANAGEMENT(Continued) |
| 36.2 | Financial instruments(Continued) |
| (b) | Fair value and fair value hierarchy(Continued) |
Fair value hierarchy(Continued)
Liabilities for which fair values are disclosed
As at December 31, 2017 | | Fair value measurement using | |
| | | Quoted prices in active markets
(Level 1) | | | Significant observable inputs
(Level 2) | | | Significant unobservable inputs
(Level 3) | | | Total | |
| | | | | | | | | | | | | |
| Financial liabilities at amortized cost: | | | | | | | | | | | | | | | | |
| Financial liabilities included in other non-current liabilities | | | — | | | | 660,688 | | | | — | | | | 660,688 | |
| Long-term interest-bearing loans and borrowings | | | — | | | | 39,475,392 | | | | — | | | | 39,475,392 | |
| | | | | | | | | | | | | | | | | |
| | | | — | | | | 40,136,080 | | | | — | | | | 40,136,080 | |
| As at December 31, 2018 | | Fair value measurement using | |
| | | Quoted prices in active markets
(Level 1) | | | Significant observable inputs
(Level 2) | | | Significant unobservable inputs
(Level 3) | | | Total | |
| | | | | | | | | | | | | |
| Financial liabilities at amortized cost: | | | | | | | | | | | | | | | | |
| Financial liabilities included in other non-current liabilities | | | — | | | | 816,529 | | | | — | | | | 816,529 | |
| Long-term interest-bearing loans and borrowings | | | — | | | | 53,207,052 | | | | — | | | | 53,207,052 | |
| | | | | | | | | | | | | | | | | |
| | | | — | | | | 54,023,581 | | | | — | | | | 54,023,581 | |
During the year ended December 31, 2018, the Group had no transfers of fair value measurements between Level 1 and Level 2 and no transfers into or out of Level 3 for both financial assets and financial liabilities (2017: Nil).
ALUMINUM CORPORATION OF CHINA LIMITED AND ITS SUBSIDIARIES
NOTES TO THE CONSOLIDATED FINANCIAL STATEMENTS(Continued)
For the years ended December 31, 2016, 2017 and 2018
(Amounts expressed in thousands of RMB unless otherwise stated)
| 36. | FINANCIAL AND CAPITAL RISK MANAGEMENT(Continued) |
| 36.2 | Financial instruments(Continued) |
| (b) | Fair value and fair value hierarchy(Continued) |
Fair value hierarchy(Continued)
Liabilities for which fair values are disclosed (continued)
Below is a summary of significant unobservable inputs to the valuation of financial instruments as at 31 December 2018 and 2017:
| | Valuation Technique | | Significant unobservable input | | Range | |
Equity investments in Size Industry Investment Fund | | | | | | | | |
| 31 December 2018 | | Net Assets Method | | Net Assets | | | 5,000,000 | |
| 31 December 2017 | | Net Assets Method | | Net Assets | | | 5,600,000 | |
ALUMINUM CORPORATION OF CHINA LIMITED AND ITS SUBSIDIARIES
NOTES TO THE CONSOLIDATED FINANCIAL STATEMENTS(Continued)
For the years ended December 31, 2016, 2017 and 2018
(Amounts expressed in thousands of RMB unless otherwise stated)
| 36. | FINANCIAL AND CAPITAL RISK MANAGEMENT(Continued) |
| 36.3 | Capital risk management |
The Group’s capital management objectives are to safeguard the Group’s ability to continue as a going concern in order to provide returns for shareholders and benefits for other stakeholders, and to maintain an optimal capital structure to reduce the cost of capital.
In order to maintain or adjust the capital structure, the Group may adjust the amount of dividends paid to shareholders, issue new shares or sell assets to reduce debts.
Consistent with other entities in the industry, the Group monitors capital on the basis of its gearing ratio. This ratio is calculated as net debt divided by total capital. Net debt is calculated as total liabilities (excluding deferred tax liabilities, income tax payable and deferred government grants) less restricted cash, and cash and cash equivalents. Total capital is calculated as equity, as shown in the consolidated statement of financial position, plus net debt less non-controlling interests.
The gearing ratio as at December 31, 2018 is as follows:
| | | December 31, 2017 | | | December 31, 2018 | |
| | | | | | | |
| Total liabilities (excluding deferred tax liabilities, income tax payable and deferred government grants) | | | 132,493,752 | | | | 130,966,279 | |
| Less: restricted cash, time deposits and cash and cash equivalents | | | (30,004,058 | ) | | | (21,295,940 | ) |
| | | | | | | | | |
| Net debt | | | 102,489,694 | | | | 109,670,339 | |
| | | | | | | | | |
| Total equity | | | 65,742,596 | | | | 67,669,202 | |
| Add: net debt | | | 102,489,694 | | | | 109,670,339 | |
| Less: non-controlling interests | | | (26,054,567 | ) | | | (15,254,312 | ) |
| | | | | | | | | |
| Total capital attributable to owners of the parent | | | 142,177,723 | | | | 162,085,229 | |
| | | | | | | | | |
| Gearing ratio | | | 72 | % | | | 68 | % |
ALUMINUM CORPORATION OF CHINA LIMITED AND ITS SUBSIDIARIES
NOTES TO THE CONSOLIDATED FINANCIAL STATEMENTS(Continued)
For the years ended December 31, 2016, 2017 and 2018
(Amounts expressed in thousands of RMB unless otherwise stated)
| 37. | PARTLY-OWNED SUBSIDIARIES WITH MATERIAL NON-CONTROLLING INTERESTS |
Other than the senior perpetual securities issued by a subsidiary of the Group, which is disclosed in note 40, details of the Group’s subsidiaries that have material non-controlling interests are set out below:
| | | 2017 | | | 2018 | |
| | | | | | | |
| Percentage of equity interest held by non-controlling interests |
| | | | | | | |
| Ningxia Energy | | | 29.18 | % | | | 29.18 | % |
| Guizhou Huajin | | | 40.00 | % | | | 40.00 | % |
| Guizhou Huaren | | | N/A | | | | 60.00 | % |
| Inner Mongolia Huayun new material Co.,Ltd (“Huayun”) (Note) | | | 50.00 | % | | | 50.00 | % |
| | | | | | | | | |
| Profit/(loss) for the year allocated to non-controlling interests | | | | | | | | |
| | | | | | | | | |
| Ningxia Energy | | | (5,670 | ) | | | 214,479 | |
| Guizhou Huajin | | | 410,023 | | | | 291,009 | |
| Guizhou Huaren | | | N/A | | | | 20,783 | |
| Huayun | | | 72,903 | | | | 186,945 | |
| | | | | | | | | |
| Dividends distributed to non-controlling interests | | | | | | | | |
| | | | | | | | | |
| Ningxia Energy | | | 3,264 | | | | 351,979 | |
| Guizhou Huajin | | | — | | | | 200,000 | |
| Guizhou Huaren | | | — | | | | — | |
| Huayun | | | — | | | | — | |
| | | | | | | | | |
| Accumulated balances of non-controlling interests at the reporting dates | | | | | | | | |
| | | | | | | | | |
| Ningxia Energy | | | 4,914,902 | | | | 4,757,014 | |
| Guizhou Huajin | | | 695,251 | | | | 782,176 | |
| Guizhou Huaren | | | N/A | | | | 820,675 | |
| Huayun | | | 776,418 | | | | 959,847 | |
Note: the Group owned 51% of the voting right of Huayun.
ALUMINUM CORPORATION OF CHINA LIMITED AND ITS SUBSIDIARIES
NOTES TO THE CONSOLIDATED FINANCIAL STATEMENTS(Continued)
For the years ended December 31, 2016, 2017 and 2018
(Amounts expressed in thousands of RMB unless otherwise stated)
| 37. | PARTLY-OWNED SUBSIDIARIES WITH MATERIAL NON-CONTROLLING INTERESTS(Continued) |
The following tables illustrate the summarizedsummarised financial information of the above subsidiaries. The amounts disclosed are before any inter-company eliminations:
| 2016 | | Ningxia Energy | | | Shandong Huayu | | | Chalco Shandong | | | Zhongzhou Aluminum | | | Baotou Aluminum | | | Chalco Mining | |
| Revenue | | | 4,170,859 | | | | 2,500,353 | | | | 5,990,183 | | | | 4,716,235 | | | | 6,467,152 | | | | 2,390,441 | |
| Total expenses | | | 4,064,127 | | | | 2,323,417 | | | | 5,636,485 | | | | 4,700,680 | | | | 5,671,676 | | | | 2,930,569 | |
| Profit/(loss) for the year | | | 106,732 | | | | 176,936 | | | | 353,698 | | | | 15,555 | | | | 795,476 | | | | (540,128 | ) |
| Total comprehensive income/(loss) for the year | | | 106,732 | | | | 176,936 | | | | 353,698,698 | | | | 15,555 | | | | 795,476 | | | | (540,128 | ) |
| | | | | | | | | | | | | | | | | | | | | | | | | |
| Current assets | | | 4,481,921 | | | | 918,043 | | | | 2,307,274 | | | | 2,658,649 | | | | 2,308,282 | | | | 2,790,087 | |
| Non-current assets | | | 30,633,509 | | | | 2,231,424 | | | | 4,795,278 | | | | 4,722,540 | | | | 8,068,407 | | | | 6,060,379 | |
| Current liabilities | | | 6,959,388 | | | | 1,331,872 | | | | 3,974,857 | | | | 3,793,320 | | | | 4,851,993 | | | | 2,627,715 | |
| Non-current liabilities | | | 17,720,701 | | | | 1,100 | | | | 300,547 | | | | 340,809 | | | | 1,060,164 | | | | 5,421,182 | |
| | | | | | | | | | | | | | | | | | | | | | | | | |
| Net cash flows from/(used in) operating activities | | | 1,874,909 | | | | (332,713 | ) | | | 136,934 | | | | 368,083 | | | | 1,271,670 | | | | 212,147 | |
| Net cash flows (used in)/from investing activities | | | (1,384,059 | ) | | | 32,753 | | | | (200,859 | ) | | | (373,882 | ) | | | (2,035,306 | ) | | | (461,248 | ) |
| Net cash flows from/(used in) financing activities | | | 291,301 | | | | (68,627 | ) | | | (62,754 | ) | | | (40,286 | ) | | | 1,084,462 | | | | 157,940 | |
| Effect of foreign exchange rate changes, net | | | — | | | | — | | | | — | | | | — | | | | 12 | | | | — | |
| | | | | | | | | | | | | | | | | | | | | | | | | |
| Net increase/(decrease) in cash and cash equivalents | | | 782,151 | | | | (368,587 | ) | | | (126,679 | ) | | | (46,085 | ) | | | 320,838 | | | | (91,161 | ) |
| 2017 | | Ningxia Energy | |
| | | |
| Revenue | | | 5,624,059 | |
| Total expenses | | | 5,691,240 | |
| Loss for the year | | | (67,181 | ) |
| Total comprehensive income for the year | | | (67,181 | ) |
| | | | |
| Current assets | | | 4,538,735 | |
| Non-current assets | | | 33,716,269 | |
| Current liabilities | | | 7,944,491 | |
| Non-current liabilities | | | 19,488,716 | |
| | | | |
| Net cash flows from operating activities | | | 2,110,801 | |
| Net cash flows used in investing activities | | | (3,933,743 | ) |
| Net cash flows from financing activities | | | 1,350,275 | |
| Effect of foreign exchange rate changes, net | | | — | |
| | | | |
| Net decrease in cash and cash equivalents | | | (472,667 | ) |
| 2018 | | Ningxia Energy | |
| | | |
| Revenue | | | 6,714,040 | |
| Total expenses | | | 6,555,933 | |
| Profit for the year | | | 158,107 | |
| Total comprehensive income for the year | | | 158,107 | |
| | | | |
| Current assets | | | 5,036,413 | |
| Non-current assets | | | 32,677,977 | |
| Current liabilities | | | 8,723,922 | |
| Non-current liabilities | | | 18,367,979 | |
| | | | |
| Net cash flows from operating activities | | | 2,755,612 | |
| Net cash flows used in investing activities | | | (1,616,513 | ) |
| Net cash flows from financing activities | | | (991,998 | ) |
| Effect of foreign exchange rate changes, net | | | — | |
| | | | |
| Net increase in cash and cash equivalents | | | 147,101 | |
ALUMINUM CORPORATION OF CHINA LIMITED AND ITS SUBSIDIARIES
NOTES TO THE CONSOLIDATED FINANCIAL STATEMENTS(Continued)
For the years ended December 31, 2015, 2016, 2017 and 2017
2018
(Amounts expressed in thousands of RMB unless otherwise stated)
| 2017 | | Ningxia Energy | | | Shandong Huayu | | | Chalco Shandong | | | Zhongzhou Aluminum | | | Baotou Aluminum | | | Chalco Mining | |
| | | | | | | | | | | | | | | | | | | | | | | | |
| Revenue | | | 5,624,059 | | | | 2,900,693 | | | | 8,402,308 | | | | 5,831,439 | | | | 10,419,392 | | | | 4,430,817 | |
| Total expenses | | | 5,691,240 | | | | 2,873,755 | | | | 8,080,124 | | | | 5,653,178 | | | | 9,696,225 | | | | 4,389,171 | |
| (Loss)/profit for the year | | | (67,181 | ) | | | 26,938 | | | | 322,184 | | | | 178,261 | | | | 723,167 | | | | 41,646 | |
| Total comprehensive (loss)/income for the year | | | (67,181 | ) | | | 26,938 | | | | 322,184 | | | | 178,261 | | | | 723,167 | | | | 41,646 | |
| | | | | | | | | | | | | | | | | | | | | | | | | |
| Current assets | | | 4,538,735 | | | | 1,086,854 | | | | 2,279,318 | | | | 3,058,917 | | | | 3,785,165 | | | | 2,997,388 | |
| Non-current assets | | | 33,716,269 | | | | 2,475,925 | | | | 4,741,067 | | | | 4,681,807 | | | | 12,535,637 | | | | 6,108,012 | |
| Current liabilities | | | 7,944,491 | | | | 1,612,994 | | | | 2,239,052 | | | | 1,881,642 | | | | 4,591,208 | | | | 2,499,653 | |
| Non-current liabilities | | | 19,488,716 | | | | 80,489 | | | | 148,757 | | | | 27,725 | | | | 3,894,064 | | | | 17,604 | |
| | | | | | | | | | | | | | | | | | | | | | | | | |
| Net cash flows from operating activities | | | 2,110,801 | | | | 195,673 | | | | 840,018 | | | | 778,375 | | | | 1,015,534 | | | | 1,205,318 | |
| Net cash flows used in investing activities | | | (3,933,743 | ) | | | (186,230 | ) | | | (496,837 | ) | | | (630,895 | ) | | | (4,622,781 | ) | | | (552,588 | ) |
| Net cash flows from/(used in) financing activities | | | 1,350,275 | | | | 117 | | | | (268,386 | ) | | | (190,781 | ) | | | 3,447,792 | | | | (603,051 | ) |
| Effect of foreign exchange rate changes, net | | | — | | | | — | | | | — | | | | — | | | | (16 | ) | | | — | |
| | | | | | | | | | | | | | | | | | | | | | | | | |
| Net (decrease)/increase in cash and cash equivalents | | | (472,667 | ) | | | 9,560 | | | | 74,795 | | | | (43,301 | ) | | | (159,471 | ) | | | 49,679 | |
| 37. | PARTLY-OWNED SUBSIDIARIES WITH MATERIAL NON-CONTROLLING INTERESTS(Continued) |
The following tables illustrate the summarised financial information of the above subsidiaries. The amounts disclosed are before any inter-company eliminations: (Continued)
| 2017 | | Guizhou Huajin | |
| | | |
| Revenue | | | 4,123,352 | |
| Total expenses | | | 3,098,295 | |
| Profit for the year | | | 1,025,057 | |
| Total comprehensive income for the year | | | 1,025,057 | |
| | | | |
| Current assets | | | 1,820,262 | |
| Non-current assets | | | 2,841,975 | |
| Current liabilities | | | 1,958,230 | |
| Non-current liabilities | | | 965,880 | |
| | | | |
| Net cash flows from operating activities | | | 1,162,069 | |
| Net cash flows used in investing activities | | | (7,437,104 | ) |
| Net cash flows used in financing activities | | | (1,835,878 | ) |
| Effect of foreign exchange rate changes, net | | | (221,567 | ) |
| | | | |
| Net increase in cash and cash equivalents | | | (8,332,480 | ) |
| 2018 | | Guizhou Huajin | |
| | | |
| Revenue | | | 4,018,682 | |
| Total expenses | | | 3,291,160 | |
| Profit for the year | | | 727,522 | |
| Total comprehensive income for the year | | | 727,522 | |
| | | | |
| Current assets | | | 1,495,922 | |
| Non-current assets | | | 2,752,815 | |
| Current liabilities | | | 1,875,227 | |
| Non-current liabilities | | | 418,070 | |
| | | | |
| Net cash flows from operating activities | | | 1,104,759 | |
| Net cash flows used in investing activities | | | (75,066 | ) |
| Net cash flows used in financing activities | | | (1,075,311 | ) |
| Effect of foreign exchange rate changes, net | | | — | |
| | | | |
| Net decrease in cash and cash equivalents | | | (45,618 | ) |
ALUMINUM CORPORATION OF CHINA LIMITED AND ITS SUBSIDIARIES
NOTES TO THE CONSOLIDATED FINANCIAL STATEMENTS(Continued)
For the years ended December 31, 2015, 2016, 2017 and 2017
2018
(Amounts expressed in thousands of RMB unless otherwise stated)
| 38.37. | BUSINESS COMBINATIONPARTLY-OWNED SUBSIDIARIES WITH MATERIAL NON-CONTROLLING INTERESTS(Continued) |
The following tables illustrate the summarised financial information of the above subsidiaries. The amounts disclosed are before any inter-company eliminations: (Continued)
| 2018 | | |
| (a) | Acquisition of High-Purity Aluminum and Light Metal |
| Guizhou Huaren | |
| | | In November 2015, Baotou Aluminum, the subsidiary of the Company, acquired relevant assets and liabilities of High-Purity Aluminum and Light Metal of Baotou Aluminum Group at a total cash consideration of RMB37.662 million. Baotou Aluminum Group is a subsidiary of Chinalco, the parent company of the Group. Before and after the acquisition, both sides are controlled by Chinalco, and the control is not temporary. Thus, the acquisition is considered to be business combination under common control. The combination date is November 30, 2015, which is determined by the date of transfer of the assets and liabilities. | |
| Revenue | | | 4,282,882 | |
| Total expenses | | | 4,248,243 | |
| Profit for the year | | | 34,639 | |
| Total comprehensive income for the year | | | 34,639 | |
| | | The book values of the | | |
Current assets and | | | 1,169,453 | |
| Non-current assets | | | 3,038,875 | |
Current liabilities of High-Purity Aluminum and Light Metal as at the acquisition date and the comparative financial figures were as follows: | | | 1,381,541 | |
| | | | December 31, 2014 | | | | December 31, 2015 | |
| Assets | | | | | | | | |
| Trade and notes receivables | | | 19,959 | | | | 47,729 | |
| Other current assets | | | 11,808 | | | | 13 | |
| Inventories | | | 101,898 | | | | 146,224 | |
| Property, plant and equipment | | | 87,609 | | | | 76,611 | |
| Intangible assets | | | 2,139 | | | | 1,347 | |
| | | | | | | | | |
| Liabilities | | | | | | | | |
| Trade and notes payables | | | 2,911 | | | | 43,597 | |
| Other payables and accrued expenses | | | 3,791 | | | | 137,539 | |
| Interest bearing loans and borrowings | | | 191,707 | | | | 65,000 | |
| | | | | | | | | |
| Net assets | | | 25,004 | | | | 25,788 | |
| Difference recognized in equity | | | | | | | 11,874 | |
| | | | | | | | 37,662 | |
| | | | | | | | | |
| Cash | | | | | | | 37,662 | |
| Total purchase consideration | | | | | | | 37,662 | |
| Non-current liabilities | | | 1,458,995 | |
| | During the year ended December 31, 2015, the Group has paid the | | | |
Net cash consideration amounting to RMB30 million,flows from operating activities | | | 134,781 | |
| Net cash flows used in investing activities | | | (510,243 | ) |
| Net cash flows used in financing activities | | | (115,222 | ) |
| Effect of foreign exchange rate changes, net | | | — | |
| | | | |
Net decrease in cash and the remaining cash consideration amounting to RMB7.6 million has been paid in year ended December 31, 2016.equivalents | | | (490,684 | ) |
ALUMINUM CORPORATION OF CHINA LIMITED AND ITS SUBSIDIARIES
NOTES TO THE CONSOLIDATED FINANCIAL STATEMENTS(Continued)
For the years ended December 31, 2015, 2016, 2017 and 2017
2018
(Amounts expressed in thousands of RMB unless otherwise stated)
| 38.37. | BUSINESS COMBINATIONPARTLY-OWNED SUBSIDIARIES WITH MATERIAL NON-CONTROLLING INTERESTS(Continued)
|
The following tables illustrate the summarised financial information of the above subsidiaries. The amounts disclosed are before any inter-company eliminations: (Continued)
| 2017 | | |
| (b) | Acquisition of Bayer aluminum production line |
| Huayun | |
| | | On January 1, 2016, Chalco Shandong, a subsidiary of the Company, completed the swap of its certain assets and liabilities with Shandong Aluminum, a subsidiary of Chinalco. The assets disposed of by Chalco Shandong include the relevant assets and liabilities of the electrolysis aluminum plant except
| |
| Revenue | | | 3,085,361 | |
| Total expenses | | | 2,939,556 | |
Profit for the electrolysis production line (mainly carbon assets), the aluminum processing plant and the hospital ward building of Chalco Shandong (the “Assets Disposed of“). The assets acquired by Chalco Shandong comprised the relevant assets and liabilities of the Bayer alumina production line of Shandong Aluminum which, in the opinion of directors of the Company, constitute businesses (the “Business Acquired“). According to the final consideration, Chalco Shandong shall pay a net consideration amounting to RMB162 million. As at the combination date, the carrying amounts of the Business Acquired and Assets Disposed of were RMB327 million and RMB176 million, respectively. Before and after the transaction, both entities were controlled by Chinalco, and the control was not temporary. Thus, the acquisition is considered to be a business combination under common control. The transaction date was January 1, 2016, which was determined by the date that the transfer of the rights and risks of the assets and liabilities was completed.year |
| | | 145,805 | |
| Total comprehensive income for the year | | | 145,805 | |
| | | The carrying amounts
| | |
| Current assets | | | 2,151,021 | |
| Non-current assets | | | 7,549,859 | |
| Current liabilities | | | 3,525,808 | |
| Non-current liabilities | | | 4,122,238 | |
| | | | |
| Net cash flows from operating activities | | | 263,559 | |
| Net cash flows used in investing activities | | | (4,408,396 | ) |
| Net cash flows used in financing activities | | | 4,308,874 | |
Effect of the assetsforeign exchange rate changes, net | | | — | |
| | | | |
Net increase in cash and liabilities of Business Acquired as at the transaction date and the comparative financial figures were as follows:cash equivalents | | | 164,037 | |
| | | | December 31,
2015 | | | | January 1,
2016 | |
| | | | | | | | | |
| Assets | | | | | | | | |
| Property, plant and equipment | | | 328,354 | | | | 328,354 | |
| | | | | | | | | |
| Liabilities | | | | | | | | |
| Other payables and accrued expenses | | | 1,488 | | | | 1,488 | |
| | | | | | | | | |
| Net assets | | | 326,866 | | | | 326,866 | |
| Difference recognized in equity | | | — | | | | 11,418 | |
| | | | | | | | 338,284 | |
| | | | | | | | | |
| Cash | | | | | | | 161,962 | |
| Carrying values of assets disposed of | | | | | | | 176,322 | |
| Total purchase consideration | | | | | | | 338,284 | |
| 2018 | | Huayun | |
| | | |
| Revenue | | | 8,099,579 | |
| Total expenses | | | 7,725,689 | |
| Profit for the year | | | 373,890 | |
| Total comprehensive income for the year | | | 373,890 | |
| | | | |
| Current assets | | | 2,372,120 | |
| Non-current assets | | | 8,338,220 | |
| Current liabilities | | | 4,342,807 | |
| Non-current liabilities | | | 3,947,839 | |
| | | | |
| Net cash flows from operating activities | | | 1,448,853 | |
| Net cash flows used in investing activities | | | (2,097,536 | ) |
| Net cash flows used in financing activities | | | 614,418 | |
| Effect of foreign exchange rate changes, net | | | — | |
| | | | |
| Net decrease in cash and cash equivalents | | | (34,265 | ) |
ALUMINUM CORPORATION OF CHINA LIMITED AND ITS SUBSIDIARIES
NOTES TO THE CONSOLIDATED FINANCIAL STATEMENTS(Continued)
For the years ended December 31, 2015, 2016, 2017 and 2017
2018
(Amounts expressed in thousands of RMB unless otherwise stated)
| 38. | BUSINESS COMBINATION(Continued) |
| (a) | | |
| (c) | Acquisition of pseudoboehmite and activated silicon powderBayer aluminum production lines |
| | |
| | On June 28, 2016, the Shanxi Branch of the Company (“Shanxi Branch“) entered into an Asset Transfer Agreement with Shanxi Aluminum Plant, pursuant to which, the Shanxi Branch acquired pseudoboehmite and activated silicon powder production lines of Science and Technology Chemical Company, a branch of Shanxi Aluminum Plant, at a total cash consideration of RMB43.06 million. In the opinion of directors of the Company, the production lines constitute a business. The total cash consideration was determined based on the asset appraisal report performed by an independent qualified valuer.
|
| | |
| | Shanxi Aluminum Plant is a subsidiary of Chinalco, the parent company of the Group. Before and after the acquisition, both Shanxi Aluminum Plant and the Company are controlled by Chinalco, and the control is not temporary. Thus, the acquisition is considered to be business combination under common control. The transaction date is July 5, 2016, which is determined by the date of transfer of the assets.
|
| | |
| | The carrying amount of the assets and liabilities of pseudoboehmite and activated silicon powder production lines as at the transaction date and the comparative financial figures were as follows:
line |
| | | | December 31,
2015 | | | | July 5,
2016 | |
| | | | | | | | | |
| Assets | | | | | | | | |
| Property, plant and equipment | | | 29,966 | | | | 28,860 | |
| | | | | | | | | |
| Liabilities | | | | | | | | |
| Other payables and accrued expenses | | | 2,503 | | | | — | |
| | | | | | | | | |
| Net assets | | | 27,463 | | | | 28,860 | |
| Difference recognized in equity | | | | | | | 14,201 | |
| | | | | | | | 43,061 | |
| | | | | | | | | |
| Cash | | | | | | | 43,061 | |
| Total purchase consideration | | | | | | | 43,061 | |
On January 1, 2016, Chalco Shandong, a subsidiary of the Company, completed the swap of its certain assets and liabilities with Shandong Aluminum, a subsidiary of Chinalco. The assets disposed of by Chalco Shandong include the relevant assets and liabilities of the electrolysis aluminum plant except for the electrolysis production line (mainly carbon assets), the aluminum processing plant and the hospital ward building of Chalco Shandong (the “Assets Disposed of“). The assets acquired by Chalco Shandong comprised the relevant assets and liabilities of the Bayer alumina production line of Shandong Aluminum which, in the opinion of directors of the Company, constitute businesses (the “Business Acquired“). According to the final consideration, Chalco Shandong shall pay a net consideration amounting to RMB162 million. As at the combination date, the carrying amounts of the Business Acquired and Assets Disposed of were RMB327 million and RMB176 million, respectively. Before and after the transaction, both entities were controlled by Chinalco, and the control was not temporary. Thus, the acquisition is considered to be a business combination under common control. The transaction date was January 1, 2016, which was determined by the date that the transfer of the rights and risks of the assets and liabilities was completed.
The carrying amounts of the assets and liabilities of Business Acquired as at the transaction date and the comparative financial figures were as follows:
| | The acquisition of Shanxi Aluminum Plant has no impact on the Group’s cash and cash equivalents.
|
| | | December 31, 2015 | | | January 1, 2016 | |
| Assets | | | | | | | | |
| Property, plant and equipment | | | 328,354 | | | | 328,354 | |
| | | | | | | | | |
| Liabilities | | | | | | | | |
| Other payables and accrued expenses | | | 1,488 | | | | 1,488 | |
| | | | | | | | | |
| Net assets | | | 326,866 | | | | 326,866 | |
| Difference recognized in equity | | | — | | | | 11,418 | |
| | | | | | | | 338,284 | |
| | | | | | | | | |
| Cash | | | | | | | 161,962 | |
| Carrying values of assets disposed of | | | | | | | 176,322 | |
| Total purchase consideration | | | | | | | 338,284 | |
ALUMINUM CORPORATION OF CHINA LIMITED AND ITS SUBSIDIARIES
NOTES TO THE CONSOLIDATED FINANCIAL STATEMENTS(Continued)
For the years ended December 31, 2015, 2016, 2017 and 2017
2018
(Amounts expressed in thousands of RMB unless otherwise stated)
| 38. | BUSINESS COMBINATION(Continued) |
38.(b) | BUSINESS COMBINATION(Continued)
|
| | |
| (d) | Acquisition of equity interest in Chinalco Shanghai |
| | |
| | On August 8, 2016, through the Shanghai United Assetspseudoboehmite and Equity Exchange, the Company was affirmed as the acquirer of the 60% equity interest in Chinalco Shanghai and the Company entered into an equity transfer agreement with Chinalco, pursuant to which, the Company acquired the 60% equity interest of Chinalco Shanghai with a total cash consideration of RMB2,113.76 million. The consideration was determined based on the appraisal value of the equity of Chinalco Shanghai. Subsequent to the acquisition, the Group exercised control over Chinalco Shanghai.
|
| | |
| | Before and after the acquisition, both Chinalco Shanghai and the Company are controlled by Chinalco, and the control is not temporary. Thus, the acquisition of 60% equity interest in Chinalco Shanghai is considered to be business combination under common control. The transaction date was September 9, 2016, which was determined by the date that the Group obtained control over Chinalco Shanghai.
|
| | |
| | The book values of the assets and liabilities of Chinalco Shanghai Company Limited as at the transaction date and the comparative financial figures were as follows:
activated silicon powder production lines |
| | | | December 31,
2015 | | | | September 9,
2016 | |
| | | | | | | | | |
| Assets | | | | | | | | |
| Property, plant and equipment | | | 414,766 | | | | 494,725 | |
| Land use rights | | | 742,771 | | | | 731,967 | |
| Inventories | | | 22 | | | | 15 | |
| Other current assets | | | 916 | | | | 1,425 | |
| Restricted cash and time deposits | | | 51,500 | | | | 70,500 | |
| Cash and cash equivalents | | | 1,156 | | | | 2,164 | |
| | | | | | | | | |
| Liabilities | | | | | | | | |
| Interest bearing loans and borrowings | | | 241,118 | | | | 330,549 | |
| Trade and notes payables | | | 147 | | | | 29 | |
| Other payables and accrued expenses | | | 1,598 | | | | 1,951 | |
| | | | | | | | | |
| Net assets | | | 968,268 | | | | 968,267 | |
| Non-controlling interests | | | | | | | 387,307 | |
| Net assets acquired | | | | | | | 580,960 | |
| Difference recognized in equity | | | | | | | 1,532,801 | |
| | | | | | | | 2,113,761 | |
| | | | | | | | | |
| Satisfied by cash | | | | | | | 2,113,761 | |
| Total purchase consideration | | | | | | | 2,113,761 | |
On June 28, 2016, the Shanxi Branch of the Company (“Shanxi Branch“) entered into an Asset Transfer Agreement with Shanxi Aluminum Plant, pursuant to which, the Shanxi Branch acquired pseudoboehmite and activated silicon powder production lines of Science and Technology Chemical Company, a branch of Shanxi Aluminum Plant, at a total cash consideration of RMB43.06 million. In the opinion of directors of the Company, the production lines constitute a business. The total cash consideration was determined based on the asset appraisal report performed by an independent qualified valuer.
Shanxi Aluminum Plant is a subsidiary of Chinalco, the parent company of the Group. Before and after the acquisition, both Shanxi Aluminum Plant and the Company are controlled by Chinalco, and the control is not temporary. Thus, the acquisition is considered to be business combination under common control. The transaction date is July 5, 2016, which is determined by the date of transfer of the assets.
| | As at December 31, 2016, the Group has paid up the purchase consideration amounting to RMB2,114 million.
|
The carrying amount of the assets and liabilities of pseudoboehmite and activated silicon powder production lines as at the transaction date and the comparative financial figures were as follows:
| | | December 31, 2015 | | | July 5, 2016 | |
| Assets | | | | | | | | |
| Property, plant and equipment | | | 29,966 | | | | 28,860 | |
| | | | | | | | | |
| Liabilities | | | | | | | | |
| Other payables and accrued expenses | | | 2,503 | | | | — | |
| | | | | | | | | |
| Net assets | | | 27,463 | | | | 28,860 | |
| Difference recognized in equity | | | | | | | 14,201 | |
| | | | | | | | 43,061 | |
| | | | | | | | | |
| Cash | | | | | | | 43,061 | |
| Total purchase consideration | | | | | | | 43,061 | |
The acquisition of Shanxi Aluminum Plant has no impact on the Group’s cash and cash equivalents.
ALUMINUM CORPORATION OF CHINA LIMITED AND ITS SUBSIDIARIES
NOTES TO THE CONSOLIDATED FINANCIAL STATEMENTS(Continued)
For the years ended December 31, 2015, 2016, 2017 and 2017
2018
(Amounts expressed in thousands of RMB unless otherwise stated)
| 38. | BUSINESS COMBINATION(Continued) |
38.(c) | BUSINESS COMBINATION(Continued)
|
| | |
| (e) | Acquisition of equity interest in Xinghua Technology |
| | |
| | On December 5, 2016, through China Beijing Equity Exchange, the Company, and Chalco Shandong entered into equity transfer agreements with Shanxi Aluminum Plant and Shandong Aluminum respectively, pursuant to which the Company and Chalco Shandong acquired 33% and 33% equity interests of Xinghua Technology, from Shanxi Aluminum Plant and Shandong Aluminum respectively. The considerations for the acquisition of 33% and 33% equity interests of Xinghua Technology were RMB257.76 million and RMB257.76 million, respectively, which were determined based on the appraisal value of Xinghua Technology. Up to December 31, 2016, the Group has paid RMB335.09 million based on the equity transfer agreements. The remaining considerations will be paid before December 31, 2017 with interest at the prevailing one year lending rate quoted by the People's Bank of China.
|
| | |
| | Xinghua Technology was a subsidiary of Chinalco the parent company of the Group. Subsequent to the acquisition, the Group had control over Xinghua Technology. Before and after the acquisition, both Xinghua Technology and the Company are controlled by Chinalco, and the control is not temporary. Thus, the acquisition of 66% equity interests in Xinghua Technology is considered to be a business combination under common control. The transaction date was December 23, 2016, which was date that the Group obtained control over Xinghua Technology.
|
| | |
| | The book values of the assets and liabilities of Xinghua Technology Ltd. as at the transaction date and the comparative financial figures were as follows:Shanghai |
| | | | December 31,
2015 | | | | December 23,
2016 | |
| Assets | | | | | | | | |
| Property, plant and equipment | | | 978,596 | | | | 1,134,185 | |
| Land use rights | | | — | | | | 8,339 | |
| Other non-current assets | | | 1,474 | | | | 8,334 | |
| Trade and notes receivables | | | 2,423 | | | | 5,471 | |
| Inventories | | | 164,262 | | | | 170,986 | |
| Other current assets | | | 89,626 | | | | 86,283 | |
| Restricted cash and time deposits | | | 15,000 | | | | 184,060 | |
| Cash and cash equivalents | | | 1,910 | | | | 19,828 | |
| | | | | | | | | |
| Liabilities | | | | | | | | |
| Interest bearing loans and borrowings (non-current) | | | 34,086 | | | | 14,909 | |
| Other non-current liabilities | | | 47,900 | | | | 43,921 | |
| Interest bearing loans and borrowings (current) | | | 338,393 | | | | 354,181 | |
| Trade and notes payables | | | 230,235 | | | | 484,755 | |
| Other payables and accrued expenses | | | 329,184 | | | | 398,239 | |
| Income tax payable | | | — | | | | 9,919 | |
| | | | | | | | | |
| Net assets | | | 273,493 | | | | 311,562 | |
| Non-controlling interests | | | | | | | 105,931 | |
| Net assets acquired | | | | | | | 205,631 | |
| Difference recognized in equity | | | | | | | 309,890 | |
| | | | | | | | 515,521 | |
| | | | | | | | | |
| Satisfied by cash | | | | | | | 515,521 | |
| Total purchase consideration | | | | | | | 515,521 | |
On August 8, 2016, through the Shanghai United Assets and Equity Exchange, the Company was affirmed as the acquirer of the 60% equity interest in Chinalco Shanghai and the Company entered into an equity transfer agreement with Chinalco, pursuant to which, the Company acquired the 60% equity interest of Chinalco Shanghai with a total cash consideration of RMB2,113.76 million. The consideration was determined based on the appraisal value of the equity of Chinalco Shanghai. Subsequent to the acquisition, the Group exercised control over Chinalco Shanghai.
Before and after the acquisition, both Chinalco Shanghai and the Company are controlled by Chinalco, and the control is not temporary. Thus, the acquisition of 60% equity interest in Chinalco Shanghai is considered to be business combination under common control. The transaction date was September 9, 2016, which was determined by the date that the Group obtained control over Chinalco Shanghai.
The book values of the assets and liabilities of Chinalco Shanghai Company Limited as at the transaction date and the comparative financial figures were as follows:
| | | December 31, 2015 | | | September 9,
2016 | |
| Assets | | | | | | | | |
| Property, plant and equipment | | | 414,766 | | | | 494,725 | |
| Land use rights | | | 742,771 | | | | 731,967 | |
| Inventories | | | 22 | | | | 15 | |
| Other current assets | | | 916 | | | | 1,425 | |
| Restricted cash and time deposits | | | 51,500 | | | | 70,500 | |
| Cash and cash equivalents | | | 1,156 | | | | 2,164 | |
| | | | | | | | | |
| Liabilities | | | | | | | | |
| Interest bearing loans and borrowings | | | 241,118 | | | | 330,549 | |
| Trade and notes payables | | | 147 | | | | 29 | |
| Other payables and accrued expenses | | | 1,598 | | | | 1,951 | |
| | | | | | | | | |
| Net assets | | | 968,268 | | | | 968,267 | |
| Non-controlling interests | | | | | | | 387,307 | |
| Net assets acquired | | | | | | | 580,960 | |
| Difference recognized in equity | | | | | | | 1,532,801 | |
| | | | | | | | 2,113,761 | |
| | | | | | | | | |
| Satisfied by cash | | | | | | | 2,113,761 | |
| Total purchase consideration | | | | | | | 2,113,761 | |
As at December 31, 2016, the Group has paid up the purchase consideration amounting to RMB2,114 million.
ALUMINUM CORPORATION OF CHINA LIMITED AND ITS SUBSIDIARIES
NOTES TO THE CONSOLIDATED FINANCIAL STATEMENTS(Continued)
For the years ended December 31, 2015, 2016, 2017 and 2017
2018
(Amounts expressed in thousands of RMB unless otherwise stated)
| 38. | BUSINESS COMBINATION(Continued) |
| (d) | | |
| (f) | Acquisition of equity interest in Xinghua Technology |
| | |
| | As at December 31, 2016, the Group has paid the purchase consideration of RMB335 million. As at December 31, 2017, the Group has paid the purchase consideration of RMB61 million with notes receivables and the Group has not paid the remaining consideration of approximately RMB121 million.
|
| | |
| (g) | Acquisition of 100% equity interest in Qingdao Light Metal |
| | |
| | On December 28, 2017, Chalco Shandong, a subsidiary of the Company, entered into an equity transfer agreement with Chinalco, pursuant to which Chalco Shandong acquired 100% equity interest of Qingdao Light Metal from Chinalco. The consideration for the acquisition was RMB162 million which was determined based on the appraisal value of the 100% equity interest in Qingdao Light Metal. The Company has paid all consideration as of December 31, 2017. The transaction date was December 29, 2017 which was the date that the Group obtained control of Qingdao Light Metal. Before and after the acquisition, both Qingdao Light Metal and the Company were controlled by Chinalco, and the control was not temporary. Thus, the acquisition of 100% equity interest in Qingdao Light Metal is considered to be a business combination under common control. |
| | |
| | The carrying amounts of the assets and liabilities of Qingdao Light Metal as at the transaction date and the comparative financial figures were as follows: |
On December 5, 2016, through China Beijing Equity Exchange, the Company, and Chalco Shandong entered into equity transfer agreements with Shanxi Aluminum Plant and Shandong Aluminum respectively, pursuant to which the Company and Chalco Shandong acquired 33% and 33% equity interests of Xinghua Technology, from Shanxi Aluminum Plant and Shandong Aluminum respectively. The considerations for the acquisition of 33% and 33% equity interests of Xinghua Technology were RMB257.76 million and RMB257.76 million, respectively, which were determined based on the appraisal value of Xinghua Technology. Up to December 31, 2016, the Group has paid RMB335.09 million based on the equity transfer agreements. The remaining considerations will be paid before December 31, 2017 with interest at the prevailing one year lending rate quoted by the People's Bank of China.
| | | | December 31,
2016 | | | | December 29,
2017 | |
| Assets | | | | | | | | |
| | | | | | | | | |
| Investment properties | | | 10,742 | | | | 10,425 | |
| Property, plant and equipment | | | 290,579 | | | | 278,309 | |
| Land use rights | | | 20,722 | | | | 20,195 | |
| Inventories | | | 29,446 | | | | 49,489 | |
| Other current assets | | | 2,934 | | | | 3,978 | |
| Trade and notes receivables | | | 29,748 | | | | 98,957 | |
| Cash and cash equivalents | | | 5,688 | | | | 10,924 | |
| | | | | | | | | |
| Liabilities | | | | | | | | |
| Trade and notes payables | | | 64,900 | | | | 97,681 | |
| Other payables and accrued expenses | | | 10,641 | | | | 66,042 | |
| Interest-bearing loans and borrowings | | | 167,000 | | | | 167,000 | |
| | | | | | | | | |
| Net assets | | | 147,318 | | | | 141,554 | |
| Other equity instruments | | | 138,670 | | | | 138,670 | |
| | | | 8,648 | | | | 2,884 | |
| | | | | | | | | |
| Difference recognized in equity | | | | | | | 158,848 | |
| | | | | | | | | |
| Total purchase consideration | | | | | | | 161,732 | |
Xinghua Technology was a subsidiary of Chinalco, the parent company of the Group. Subsequent to the acquisition, the Group had control over Xinghua Technology. Before and after the acquisition, both Xinghua Technology and the Company are controlled by Chinalco, and the control is not temporary. Thus, the acquisition of 66% equity interests in Xinghua Technology is considered to be a business combination under common control. The transaction date was December 23, 2016, which was date that the Group obtained control over Xinghua Technology.
The book values of the assets and liabilities of Xinghua Technology Ltd. as at the transaction date and the comparative financial figures were as follows:
| | | December 31, 2015 | | | December 23, 2016 | |
| Assets | | | | | | | | |
| Property, plant and equipment | | | 978,596 | | | | 1,134,185 | |
| Land use rights | | | — | | | | 8,339 | |
| Other non-current assets | | | 1,474 | | | | 8,334 | |
| Trade and notes receivables | | | 2,423 | | | | 5,471 | |
| Inventories | | | 164,262 | | | | 170,986 | |
| Other current assets | | | 89,626 | | | | 86,283 | |
| Restricted cash and time deposits | | | 15,000 | | | | 184,060 | |
| Cash and cash equivalents | | | 1,910 | | | | 19,828 | |
| | | | | | | | | |
| Liabilities | | | | | | | | |
| Interest bearing loans and borrowings (non-current) | | | 34,086 | | | | 14,909 | |
| Other non-current liabilities | | | 47,900 | | | | 43,921 | |
| Interest bearing loans and borrowings (current) | | | 338,393 | | | | 354,181 | |
| Trade and notes payables | | | 230,235 | | | | 484,755 | |
| Other payables and accrued expenses | | | 329,184 | | | | 398,239 | |
| Income tax payable | | | — | | | | 9,919 | |
| | | | | | | | | |
| Net assets | | | 273,493 | | | | 311,562 | |
| Non-controlling interests | | | | | | | 105,931 | |
| Net assets acquired | | | | | | | 205,631 | |
| Difference recognized in equity | | | | | | | 309,890 | |
| | | | | | | | 515,521 | |
| | | | | | | | | |
| Satisfied by cash | | | | | | | 515,521 | |
| Total purchase consideration | | | | | | | 515,521 | |
ALUMINUM CORPORATION OF CHINA LIMITED AND ITS SUBSIDIARIES
NOTES TO THE CONSOLIDATED FINANCIAL STATEMENTS(Continued)
For the years ended December 31, 2015, 2016, 2017 and 2017
2018
(Amounts expressed in thousands of RMB unless otherwise stated)
| 38. | BUSINESS COMBINATION(Continued) |
| (e) | Acquisition of equity interest in Xinghua Technology |
As at December 31, 2016, the Group has paid the purchase consideration of RMB335 million. As at December 31, 2017, the Group has paid the purchase consideration of RMB61 million with notes receivables and the Group has not paid the remaining consideration of approximately RMB121 million.
| (f) | Acquisition of 100% equity interest in Qingdao Light Metal |
On December 28, 2017, Chalco Shandong, a subsidiary of the Company, entered into an equity transfer agreement with Chinalco, pursuant to which Chalco Shandong acquired 100% equity interest of Qingdao Light Metal from Chinalco. The consideration for the acquisition was RMB162 million which was determined based on the appraisal value of the 100% equity interest in Qingdao Light Metal. The Company has paid all consideration as of December 31, 2017. The transaction date was December 29, 2017 which was the date that the Group obtained control of Qingdao Light Metal. Before and after the acquisition, both Qingdao Light Metal and the Company were controlled by Chinalco, and the control was not temporary. Thus, the acquisition of 100% equity interest in Qingdao Light Metal is considered to be a business combination under common control.
The carrying amounts of the assets and liabilities of Qingdao Light Metal as at the transaction date and the comparative financial figures were as follows:
| | | December 31, 2016 | | | December 29, 2017 | |
| Assets | | | | | | | | |
| | | | | | | | | |
| Investment properties | | | 10,742 | | | | 10,425 | |
| Property, plant and equipment | | | 290,579 | | | | 278,309 | |
| Land use rights | | | 20,722 | | | | 20,195 | |
| Inventories | | | 29,446 | | | | 49,489 | |
| Other current assets | | | 2,934 | | | | 3,978 | |
| Trade and notes receivables | | | 29,748 | | | | 98,957 | |
| Cash and cash equivalents | | | 5,688 | | | | 10,924 | |
| | | | | | | | | |
| Liabilities | | | | | | | | |
| Trade and notes payables | | | 64,900 | | | | 97,681 | |
| Other payables and accrued expenses | | | 10,641 | | | | 66,042 | |
| Interest-bearing loans and borrowings | | | 167,000 | | | | 167,000 | |
| | | | | | | | | |
| Net assets | | | 147,318 | | | | 141,554 | |
| Other equity instruments | | | 138,670 | | | | 138,670 | |
| | | | 8,648 | | | | 2,884 | |
| | | | | | | | | |
| Difference recognized in equity | | | | | | | 158,848 | |
| | | | | | | | | |
| Total purchase consideration | | | | | | | 161,732 | |
ALUMINUM CORPORATION OF CHINA LIMITED AND ITS SUBSIDIARIES
NOTES TO THE CONSOLIDATED FINANCIAL STATEMENTS(Continued)
For the years ended December 31, 2016, 2017 and 2018
(Amounts expressed in thousands of RMB unless otherwise stated)
| 38. | (h)BUSINESS COMBINATION(Continued) |
| (g) | Acquisition of Shanxi Aluminum Sewage Treatment Plant |
| | |
| | On December 28, 2017, Shanxi New Material, a subsidiary of the Company, entered into an assets transfer agreement with Chalco Shanxi Aluminum, a subsidiary of Chinalco, pursuant to which, Shanxi New Material acquired Shanxi Aluminum Sewage Treatment Plant at a total consideration of RMB50 million. The consideration was determined based on the appraisal report issued by an independent qualified valuer. In the opinion of directors of the Company, the sewage treatment plant constitutes a business. Before and after the acquisition, both entities were controlled by Chinalco, and the control was not temporary. Thus, the acquisition is considered to be a business combination under common control. The acquisition date was December 28, 2017, which is determined by the date of transfer of the assets. |
| | |
| | The carrying amount of the assets and liabilities of Shanxi Aluminum Sewage Treatment Plant as at the transaction date and the comparative financial figures were as follows: |
On December 28, 2017, Shanxi New Material, a subsidiary of the Company, entered into an assets transfer agreement with Chalco Shanxi Aluminum, a subsidiary of Chinalco, pursuant to which, Shanxi New Material acquired Shanxi Aluminum Sewage Treatment Plant at a total consideration of RMB50 million. The consideration was determined based on the appraisal report issued by an independent qualified valuer. In the opinion of directors of the Company, the sewage treatment plant constitutes a business. Before and after the acquisition, both entities were controlled by Chinalco, and the control was not temporary. Thus, the acquisition is considered to be a business combination under common control. The acquisition date was December 28, 2017, which is determined by the date of transfer of the assets.
| | | | December 31,
2016 | | | | 28 December,
2017 | |
| Assets | | | | | | | | |
| Property, plant and equipment | | | 52,001 | | | | 48,995 | |
| | | | | | | | | |
| Liabilities | | | | | | | | |
| Other payables and accrued expenses | | | — | | | | — | |
| | | | | | | | | |
| Net assets | | | 52,001 | | | | 48,995 | |
| Difference recognized in equity | | | — | | | | 1,063 | |
| | | | | | | | | |
| Total purchase consideration | | | — | | | | 50,058 | |
The carrying amount of the assets and liabilities of Shanxi Aluminum Sewage Treatment Plant as at the transaction date and the comparative financial figures were as follows:
| | | December 31,
2016 | | | December 28,
2017 | |
| Assets | | | | | | | | |
| Property, plant and equipment | | | 52,001 | | | | 48,995 | |
| | | | | | | | | |
| Liabilities | | | | | | | | |
| Other payables and accrued expenses | | | — | | | | — | |
| | | | | | | | | |
| Net assets | | | 52,001 | | | | 48,995 | |
| Difference recognized in equity | | | — | | | | 1,063 | |
| | | | | | | | | |
| Total purchase consideration | | | | | | | 50,058 | |
The acquisition of Shanxi Aluminum Sewage Treatment Plant has no impact on the Group’s cash and cash equivalents.
ALUMINUM CORPORATION OF CHINA LIMITED AND ITS SUBSIDIARIES
NOTES TO THE CONSOLIDATED FINANCIAL STATEMENTS(Continued)
For the years ended December 31, 2015, 2016, 2017 and 2017
2018
(Amounts expressed in thousands of RMB unless otherwise stated)
| 38. | BUSINESS COMBINATIONS(Continued) |
| (h) | Acquisition of Yinxing Power |
In April 2015, Ningxia Energy and Zhejiang Power Group Co., Ltd.* (“Zhejiang Power”) (浙江省能源集團有限公司) jointly established Ningxia Yinxing Power Co., Ltd.* (“Yinxing Power”) (寧夏銀星發電有限責任公司). The registered capital of Yinxing Power is RMB800 million, of which Ningxia Energy and Zhejiang Power contributed 51% and 49%, respectively. Ningxia Energy can appoint four out of the seven directors of the board of directors. According to the articles of association of Yinxing Power, the resolutions pertaining to significant relevant activities at both the shareholders’ and board of directors meetings require more than two-thirds of the votes for passing. Accordingly, the directors of the Company considered that Ningxia Energy and Zhejiang Power have joint control over Yinxing Power, which was accounted for as a joint venture.
In August 2017, to minimize coal procurement costs and to secure long-term coal supply to Yinxing Power, Ningxia Energy and Zhejiang Power entered into an acting-in-concert agreement which was effective on 31 August 2017. According to the acting-in-concert agreement, Zhejiang Power will exercise the shareholders vote in concert with the Group. Accordingly, the directors of the Company consider that Ningxia Energy have control over Yinxing Power and consolidated Yinxing Power as a subsidiary since 31 August 2017.
ALUMINUM CORPORATION OF CHINA LIMITED AND ITS SUBSIDIARIES
NOTES TO THE CONSOLIDATED FINANCIAL STATEMENTS(Continued)
For the years ended December 31, 2016, 2017 and 2018
(Amounts expressed in thousands of RMB unless otherwise stated)
| 38. | (i)BUSINESS COMBINATIONS(Continued) |
| (h) | Acquisition of Yinxing Power(Continued) |
| | |
| | In April 2015, Ningxia Energy and Zhejiang Power Group Co., Ltd.* (“Zhejiang Power”) (浙江省能源集團有限公司) jointly established Ningxia Yinxing Power Co., Ltd.* (“Yinxing Power”) (寧夏銀星發電有限責任公司). The registered capital of Yinxing Power is RMB800 million, of which Ningxia Energy and Zhejiang Power contributed 51% and 49%, respectively. Ningxia Energy can appoint four out of the seven directors of the board of directors. According to the articles of association of Yinxing Power, the resolutions pertaining to significant relevant activities at both the shareholders’ and board of directors meetings require more than two-thirds of the votes for passing. Accordingly, the directors of the Company considered that Ningxia Energy and Zhejiang Power have joint control over Yinxing Power, which was accounted for as a joint venture. |
| | |
| | In August 2017, to minimize coal procurement costs and to secure long-term coal supply to Yinxing Power, Ningxia Energy and Zhejiang Power entered into an acting-in-concert agreement which was effective on August 31, 2017. According to the acting-in-concert agreement, Zhejiang Power will exercise the shareholders vote in concert with the Group. Accordingly, the directors of the Company consider that Ningxia Energy have control over Yinxing Power and consolidated Yinxing Power as a subsidiary since August 31, 2017. |
| | |
| | The fair value of identifiable assets and liabilities of Yinxing Power at the acquisition date are as follows: |
The fair value of identifiable assets and liabilities of Yinxing Power at the acquisition date are as follows:
| | | August 31, 2017 | |
| | | | Fair value | |
| | | | |
| Assets | | | | |
| Property, plant and equipment | | | 3,594,970 | |
Land use rightrights | | | 31,833 | |
| Intangible assets | | | 188 | |
| Other current assets | | | 312,840 | |
| Inventories | | | 35,349 | |
| Trade and notes receivables | | | 162,093 | |
| Cash and cash equivalents | | | 255,152 | |
| | | | | |
| Liabilities | | | | |
| Deferred tax liabilities | | | (40,706 | ) |
| Interest-bearing loans and borrowings | | | (2,514,800 | ) |
| Other payables and accrued expenses | | | (186,782 | ) |
| Trade and notes payables | | | (800,438 | ) |
| | | | | |
| Net assets | | | 849,699 | |
| | | | | |
| Non-controlling interests | | | 416,353 | |
| | | | | |
| Net assets acquired | | | 433,346 | |
| | | | | |
| Goodwill | | | — | |
| | | | | |
| Satisfied by cash | | | — | |
ALUMINUM CORPORATION OF CHINA LIMITED AND ITS SUBSIDIARIES
NOTES TO THE CONSOLIDATED FINANCIAL STATEMENTS(Continued)
For the years ended December 31, 2015, 2016, 2017 and 2017
2018
(Amounts expressed in thousands of RMB unless otherwise stated)
| 38. | BUSINESS COMBINATIONCOMBINATIONS(Continued) |
| (h) | (i) | Acquisition of Yinxing Power(Continued) |
| | |
| | Details of the 51% equity interest held by the Group before the acquisition of Yinxing Power and the profit from the investment are as follows: |
Details of the 51% equity interest held by the Group before the acquisition of Yinxing Power and the profit from the investment are as follows:
| | | August 31, 2017 | |
| | | | |
| Initial investment cost | | | 316,200 | |
| | | | | |
| Investment income recognized under the equity method | | | (494 | ) |
| | | | | |
| The book value of the investment in 51% equity of Yinxing Power on the merger date | | | 315,706 | |
| | | | | |
| The fair value of the investment in 51% equity of Yinxing Power on the merger date(Note) | | | 433,346 | |
| | | | | |
| Gain on previously held equity interest remeasured at acquisition-date fair value | | | 117,640 | |
Note: The fair value was determined by the valuation report issued by an independent qualified valuer.
An analysis of the cash flows in respect of the acquisition of Yinxing Power is as follows:
| Note: | The fair value was determined by the valuation report of Zhong Tong Hua Ping Bao Zi (2017) No. 776 issued by Beijing Zhong Tong Hua Asset Valuation Co., Ltd. |
| | |
| An analysis of the cash flows in respect of the acquisition of Yinxing Power is as follows: |
| | | RMB’000 | |
| | | | | |
| Cash consideration | | | -— | |
| Cash and bank balances acquired | | | 255,152 | |
| | | | | |
| Net inflow of cash and cash equivalents included in cash flows from investing activities | | | 255,152 | |
| | The operating results and cash flows of Yinxing Power since the merger date to the end of the year are as follows: |
| | | | RMB’000 | |
| | | | |
| Revenue | | | 578,117 | |
| | | | |
Profit for the yearperiod | | | 96,756 | |
| | | | |
| Net cash flows | | | 36,024 | |
* | * | The English names represent the best effort by management of the Group in translating the Chinese names of the Companies as they do not have any official English names. |
ALUMINUM CORPORATION OF CHINA LIMITED AND ITS SUBSIDIARIES
NOTES TO THE CONSOLIDATED FINANCIAL STATEMENTS(Continued)
For the years ended December 31, 2015, 2016, 2017 and 2017
2018
(Amounts expressed in thousands of RMB unless otherwise stated)
39. | 38. | DISPOSAL OF BUSINESSESBUSINESS COMBINATIONS(Continued) |
| (i) | (a) | DisposalAcquisition of Shanxi Huaxing |
| | |
| | In December 2015, the Group entered into Equity Transfer Agreement with Shenzhen CR Yuanda, a state-owned entity, to transfer 50% equity interests in Shanxi Huaxing, a wholly owned subsidiary, through the Shanghai United Assets and Equity Exchange at a price of RMB2,351 million. The price was determined based on the appraisal value provided by an independent qualified appraisal company. According to the Equity Transfer Agreement, 30% of the consideration amounting to RMB705 million has been received by the Group in December 2015 whereas the remaining amount of RMB1,646 million would be paid within one year from the effective date of the Equity Transfer Agreement and the balance is interest bearing charged at prevailing lending interest rate. |
| | |
| | The directors of the Company are of the opinion that the Group lost control over Shanxi Huaxing and accounted for it as a joint venture accordingly. As of the date of disposal, the carrying amounts of Shanxi Huaxing was RMB2,115 million, and the Group recognized gain of disposal of subsidiary of RMB1,294 million for 50% equity interest disposed of. The Group re-measured the remaining 50% net assets of Shanxi Huaxing to fair value of RMB2,351 million and recognized fair value gain of RMB1,294 million accordingly. |
| | |
| | The details of the net assets disposed of are as follows:Guizhou Huaren |
In May 2017, the Company, together with Hangzhou Jinjiang, Guizhou Investment and Qingzhen Investment jointly established Guizhou Huaren. The registered capital of Guizhou Huaren is RMB1,200 million, of which the Company holds 40% of equity interest in Guizhou Huaren, Hangzhou Jinjiang holds 30%, while each of the other two shareholders holds 15% equity interest, respectively. According to the article of association of Guizhou Huaren, the directors of the Company considered that the Company had significant influence over Guizhou Huaren, which was accounted for as an associate.
In December 2017, the Company and Hangzhou Jinjiang entered into an acting-in-concert agreement which became effective on January 1, 2018. According to the acting-in-concert agreement, Hangzhou Jinjiang agreed to exercise the board members’ and shareholder’s vote in concert with the Company. Accordingly, the directors of the Company considered that the Company obtains control over Guizhou Huaren and has consolidated Guizhou Huaren’s financial position and performance into the Group’s consolidated financial statements since January 1, 2018.
ALUMINUM CORPORATION OF CHINA LIMITED AND ITS SUBSIDIARIES
NOTES TO THE CONSOLIDATED FINANCIAL STATEMENTS(Continued)
For the years ended December 31, 2015, 2016, 2017 and 2017
2018
(Amounts expressed in thousands of RMB unless otherwise stated)
39. | 38. | DISPOSAL OF BUSINESSESBUSINESS COMBINATIONS(Continued) |
| (i) | (a) | DisposalAcquisition of Shanxi HuaxingGuizhou Huaren(Continued) |
The fair value of identifiable assets and liabilities of Guizhou Huaren at the acquisition date are as follows:
| | | | Date of disposalJanuary 1, 2018 | |
Net assets disposed of: | | Fair value | |
| Assets | | | |
CashProperty, plant and cash equivalents
equipment | | | 114,7942,194,095 | |
Restricted cash and time depositsIntangible assets | | | 46,716137 | |
| Land use rights | | | 109,320 | |
| Other current assets | | | 353,655 | |
| Inventories | | | 220,718 | |
| Trade and notes receivables | | | 34,479250 | |
Other current assetsRestricted cash | | | 30,849324,030 | |
InventoriesCash and cash equivalents | | | 340,218673,587 | |
Property, plant and equipment | | | 4,495,019 | |
Land use rightLiabilities | | | 251,295 | |
Intangible assets | | | 365,427 | |
Deferred tax assets | | | 3,057 | |
Other non-current assets | | | 487,076 | |
Trade and notes payablesliabilities | | | (426,28858,299 | ) |
| Interest-bearing loans and borrowings | | | (1,680,000 | ) |
| Contract liabilities | | | (2,562 | ) |
| Other payables and accrued expenses | | | (898,781345,562 | ) |
Interest bearing loansTrade and borrowingsnotes payables | | | (2,312,574 | ) |
Income tax payable | | | (4,271 | ) |
Other non-current liabilities | | | (412,192 | ) |
Net assets | | | 2,114,824 | |
50% of net assets transferred into joint venture(Note) | | | (1,057,412464,454 | ) |
| | | | | |
Net assets disposed of | | | 1,057,412 | |
Gain on disposal of Shanxi Huaxing | | | 1,294,0671,324,915 | |
| | | | | |
| Non-controlling interests | | | 2,351,479794,949 | |
| | | | |
| Share of net assets acquired | | | 529,966 | |
| | | | |
| Goodwill | | | — | |
| | | | |
| Satisfied by: | | | | |
Cash | | | — | |
| Fair value of previously held equity interest | | | 529,966 | |
| | | 529,966 | |
ALUMINUM CORPORATION OF CHINA LIMITED AND ITS SUBSIDIARIES
NOTES TO THE CONSOLIDATED FINANCIAL STATEMENTS(Continued)
For the years ended December 31, 2016, 2017 and 2018
(Amounts expressed in thousands of RMB unless otherwise stated)
| 38. | BUSINESS COMBINATIONS(Continued) |
| (i) | Acquisition of Guizhou Huaren(Continued) |
Details of the 40% equity interest held by the Company before the acquisition of Guizhou Huaren and the profit from the investment are as follows:
| | January 1, 2018 | |
| | | |
| Initial investment cost | | | 480,000 | |
| | | | |
| Share of loss accumulated under the equity method | | | (18,347 | ) |
| | | | |
| Book value of the investment in 40% equity of Guizhou Huaren on the acquisition date | | | 461,653 | |
| | | | |
| Fair value of the investment in 40% equity of Guizhou Huaren on the acquisition date (Note) | | | 529,966 | |
| | | | |
| Gain on previously held equity interest remeasured at acquisition-date fair value | | | 68,313 | |
Note: The fair value was determined by the valuation report issued by an independent qualified valuer.
ALUMINUM CORPORATION OF CHINA LIMITED AND ITS SUBSIDIARIES
NOTES TO THE CONSOLIDATED FINANCIAL STATEMENTS(Continued)
For the years ended December 31, 2016, 2017 and 2018
(Amounts expressed in thousands of RMB unless otherwise stated)
| 38. | BUSINESS COMBINATIONS(Continued) |
| (i) | Acquisition of Guizhou Huaren(Continued) |
An analysis of the cash flows in respect of the acquisition of Guizhou Huaren is as follows:
| | RMB’000 | |
| | | |
| Cash consideration | | | — | |
Cash and bank balances acquired
| | | 673,587 | |
| | | | |
| Net inflow of cash and cash equivalents included in cash flows from investing activities | | | 673,587 | |
The operating results and cash flows of Guizhou Huaren since the acquisition date to December 31, 2018 are as follows:
| | RMB’000 | |
| | | |
| Revenue | | | 4,282,882 | |
| Profit for the period | | | 34,639 | |
| Net cash out flows | | | (490,684 | ) |
ALUMINUM CORPORATION OF CHINA LIMITED AND ITS SUBSIDIARIES
NOTES TO THE CONSOLIDATED FINANCIAL STATEMENTS(Continued)
For the years ended December 31, 2016, 2017 and 2018
(Amounts expressed in thousands of RMB unless otherwise stated)
| 38. | BUSINESS COMBINATION(Continued) |
| (j) | Acquisition of Shanxi Zhongrun |
In February 2017, the Company entered into a capital injection and enlargement agreement on Shanxi Zhongrun with Huarun (Coal) Group Co., Ltd.* (“Huarun (Coal) Group”) (華潤(煤業)集團有限公司), Shanxi Xishan Coal and Electricity Power Co., Ltd.* (“Xishan Coal Electricity”) (山西西山煤電股份有限公司) and Jin Energy Power Group Co., Ltd.* (“Jin Energy Power”) (晉能電力集團有限公司). After the capital contribution, the registered capital of Shanxi Zhongrun is RMB500 million, of which the Company holds 40% of equity interest in Shanxi Zhongrun while each of the other three shareholders holds a 20% equity interest, respectively. The Company can appoint two out of the five directors of the board of directors. According to the article of association of Shanxi Zhongrun and the agreement, the directors of the Company considered that the Company had significant influence over Shanxi Zhongrun, which was accounted for as an associate.
In December 2017, the Company and Huarun (Coal) Group entered into an acting-in-concert agreement which was effective on January 1, 2018. According to the acting-in-concert agreement, Huarun (Coal) Group agreed to exercise the board members’ and shareholder’s vote in concert with the Company. Accordingly, the directors of the Company considered that the Company obtains control over Shanxi Zhongrun and has consolidated Shanxi Zhongrun’s financial position and performance into the Group’s consolidated financial statements since January 1, 2018.
ALUMINUM CORPORATION OF CHINA LIMITED AND ITS SUBSIDIARIES
NOTES TO THE CONSOLIDATED FINANCIAL STATEMENTS(Continued)
For the years ended December 31, 2016, 2017 and 2018
(Amounts expressed in thousands of RMB unless otherwise stated)
| 38. | BUSINESS COMBINATION(Continued) |
| (j) | Acquisition of Shanxi Zhongrun(Continued) |
The fair value of identifiable assets and liabilities of Shanxi Zhongrun at the acquisition date are as follows:
| | January 1, 2018 | |
| | Fair value | |
| Assets | | | |
| Property, plant and equipment | | | 2,292,483 | |
| Intangible assets | | | 749 | |
| Other current assets | | | 215,575 | |
| Inventories | | | 15,473 | |
| Trade and notes receivables | | | 4,135 | |
| Cash and cash equivalents | | | 2,173,062 | |
| | | | |
| Liabilities | | | | |
| Deferred tax liabilities | | | (41,581 | ) |
| Interest-bearing loans and borrowings | | | (3,485,852 | ) |
| Other payables and accrued expenses | | | (37,789 | ) |
| Trade and notes payables | | | (13,778 | ) |
| | | | |
| Net assets | | | 1,122,477 | |
| | | | |
| Non-controlling interests | | | 673,486 | |
| | | | |
| Share of net assets acquired | | | 448,991 | |
| | | | |
| Goodwill | | | — | |
| | | | | |
| Satisfied by: | | | | |
| Cash | | | 705,444— | |
Receivables as at December 31, 2015Fair value of previously held equity interest | | | 1,646,035448,991 | |
| | | 448,991 | |
ALUMINUM CORPORATION OF CHINA LIMITED AND ITS SUBSIDIARIES
NOTES TO THE CONSOLIDATED FINANCIAL STATEMENTS(Continued)
For the years ended December 31, 2016, 2017 and 2018
(Amounts expressed in thousands of RMB unless otherwise stated)
| 38. | BUSINESS COMBINATION(Continued) |
| (j) | Acquisition of Shanxi Zhongrun(Continued) |
Details of the 40% equity interest held by the Company before the acquisition of Shanxi Zhongrun and the profit from the investment are as follows:
| | January 1, 2018 | |
| | | |
| Initial investment cost | | | 400,184 | |
| | | | |
| Share of loss accumulated under the equity method | | | (6,553 | ) |
| | | | |
| Book value of the investment in 40% equity of Shanxi Zhongrun on the acquisition date | | | 393,631 | |
| | | | |
| Fair value of the investment in 40% equity of Shanxi Zhongrun on the acquisition date(Note) | | | 448,991 | |
| | | | |
| Gain on previously held equity interest remeasured at acquisition-date fair value | | | 55,360 | |
Note: The fair value was determined by the valuation report issued by an independent qualified valuer.
ALUMINUM CORPORATION OF CHINA LIMITED AND ITS SUBSIDIARIES
NOTES TO THE CONSOLIDATED FINANCIAL STATEMENTS(Continued)
For the years ended December 31, 2016, 2017 and 2018
(Amounts expressed in thousands of RMB unless otherwise stated)
| 38. | BUSINESS COMBINATION(Continued) |
| (j) | Acquisition of Shanxi Zhongrun(Continued) |
An analysis of the cash flows in respect of the acquisition of Shanxi Zhongrun is as follows:
| | RMB’000 | |
| | | |
| Cash consideration | | | — | |
| Cash and bank balances acquired | | | 2,173,062 | |
| | | | |
| Net inflow of cash and cash equivalents included in cash flows from investing activities | | | 2,173,062 | |
The operating results and cash flows of Shanxi Zhongrun since the acquisition date to December 31, 2018 are as follows:
| | RMB’000 | |
| | | |
| Revenue | | | 645,214 | |
| Profit for the period | | | 817 | |
| Net cash out flows | | | (2,137,166 | ) |
| * | The English names represent the best effort made by management of the Group in translating their Chinese names as the companies do not have any official English names. |
ALUMINUM CORPORATION OF CHINA LIMITED AND ITS SUBSIDIARIES
NOTES TO THE CONSOLIDATED FINANCIAL STATEMENTS(Continued)
For the years ended December 31, 2016, 2017 and 2018
(Amounts expressed in thousands of RMB unless otherwise stated)
| 38. | BUSINESS COMBINATIONS(Continued) |
| (k) | Acquisition of Shanxi Huaxing |
On December 31, 2017, the Company, Chalco Hong Kong and Baotou Communication Investment held 10%, 40% and 50% of the shares of Shanxi Huaxing, respectively. According to the articles of association of Shanxi Huaxing, the Group can exercise joint control over Shanxi Huaxing and therefore, which was accounted for as a joint venture accordingly.
In December 2018, the Company entered into an equity transfer agreement with Baotou Communication Investment. According to the agreement, the Company acquired 50% of Shanxi Huaxing’s equity with a consideration at RMB2,665 million in cash. Upon completion of the transaction, the Group held a total of 100% of Shanxi Huaxing’s shares. The directors of the Company considered that the Company obtains control over Shanxi Huaxing and has consolidated Shanxi Huaxing’s financial position and performance into the Group’s consolidated financial statements since the acquisition date of December 6, 2018.
ALUMINUM CORPORATION OF CHINA LIMITED AND ITS SUBSIDIARIES
NOTES TO THE CONSOLIDATED FINANCIAL STATEMENTS(Continued)
For the years ended December 31, 2016, 2017 and 2018
(Amounts expressed in thousands of RMB unless otherwise stated)
| 38. | BUSINESS COMBINATIONS(Continued) |
| (k) | Acquisition of Shanxi Huaxing(Continued) |
The fair value of identifiable assets and liabilities of Shanxi Huaxing at the acquisition date are as follows:
| | December 6, 2018 | |
| | Fair value | |
| Assets | | | |
| Property, plant and equipment | | | 7,327,807 | |
| Intangible assets | | | 728,067 | |
| Land use right | | | 348,901 | |
| Deferred tax assets | | | 8,094 | |
| Other non-current assets | | | 60,336 | |
| Other current assets | | | 102,396 | |
| Inventories | | | 865,418 | |
| Trade and notes receivables | | | 44,706 | |
| Restricted cash | | | 203,350 | |
| Cash and cash equivalents | | | 81,344 | |
| | | | | |
| | | | 2,351,479 | |
| Liabilities | | | | |
Note: | | | | |
50% of net assets transferred into joint venture | | | 1,057,412 | |
Gain on remeasurement of the remaining equity interest at fair value | | | 1,294,067 | |
| | | | |
Initial cost of investment in joint venture | | | 2,351,479 | |
| | |
| An analysis of the cash flows of cash and cash equivalents in respect of the Disposal of Shanxi Huaxing is as follows: |
| |
| | | 2015 | |
Cash consideration received | | | 705,444 | |
Less: cash and cash equivalents of Shanxi Huaxing disposed ofDeferred tax liabilities | | | (114,794722,349 | ) |
| Interest-bearing loans and borrowings | | | (1,743,036 | ) |
| Other non-current liabilities | | | (239,998 | ) |
| Contract liabilities | | | (617,827 | ) |
| Other payables and accrued expenses | | | (686,024 | ) |
| Trade and notes payables | | | (1,594,724 | ) |
| | | | | |
Net inflows of cash and cash equivalents in respect of the disposal of Shanxi Huaxing | | | 590,650 | |
ALUMINUM CORPORATION OF CHINA LIMITED AND ITS SUBSIDIARIES
NOTES TO THE CONSOLIDATED FINANCIAL STATEMENTS(Continued)
For the years ended December 31, 2015, 2016 and 2017
(Amounts expressed in thousands of RMB unless otherwise stated)
39. | DISPOSAL OF BUSINESSES(Continued) |
| (b) | Loss control of Ningxia photovoltaic subsidiaries |
| | |
| | In September and October 2015, LingWu People's Court , Yinchuan Intermediate People's Court and Wuzhong People's Court accepted the liquidation petition filed by the Group’s subsidiaries, Ningxia Ning Electric Silicon Co., Ltd.* (寧夏寧電矽業有限公司), Ningxia Ning Electric PV Material Co., Ltd.* (寧夏寧電光伏材料有限公司), Ningxia Ning Electric Silicon Materials Co., Ltd.* (寧夏寧電矽材料有限公司) and Ningxia Yinxing Polycrystalline Silicon Co., Ltd.* (寧夏銀星多晶矽有限公司) (hereinafter referred to as “Ningxia photovoltaic subsidiaries”), respectively. Upon the liquidation administrators took control over those companies, the directors of the Company considered the Group lost control over Ningxia photovoltaic subsidiaries and therefore ceased to consolidate these companies since then (“date of lost control”). |
| | |
| | The book value of assets and liabilities of Ningxia photovoltaic subsidiaries is result from the fair value adjustments of Ningxia photovoltaic subsidiaries’ assets and liabilities arising from acquisition of Ningxia Energy in 2013. |
ALUMINUM CORPORATION OF CHINA LIMITED AND ITS SUBSIDIARIES
NOTES TO THE CONSOLIDATED FINANCIAL STATEMENTS(Continued)
For the years ended December 31, 2015, 2016 and 2017
(Amounts expressed in thousands of RMB unless otherwise stated)
39. | DISPOSAL OF BUSINESSES(Continued)
|
| (b) | Loss control of Ningxia photovoltaic subsidiaries(Continued) |
| | |
| | The details of the net assets of Ningxia photovoltaic subsidiaries are as follows: |
| | | Date of lost control | |
Net assets: | | | | |
Cash and cash equivalents | | | 189 | |
Trade and notes receivables | | | 47,619 | |
Other current assets | | | 166,377 | |
Inventories | | | 18,718 | |
Property, plant and equipment | | | 387,324 | |
Land use right | | | 114,330 | |
Intangible assets | | | 3,954 | |
Other non-current assets | | | 8,432 | |
Available-for-sale financial investments | | | 5,686 | |
Trade and notes payables | | | (290,441 | ) |
Other payables and accrued expenses | | | (215,198 | ) |
Deferred tax liabilities | | | (36,389 | ) |
Other non-current liabilities | | | (61,123 | ) |
Net assets | | | 149,4784,166,461 | |
| | | | | |
Trade and notes receivable due from Ningxia photovoltaic subsidiariesNon-controlling interests | | | 15,644— | |
Other current amount due from Ningxia photovoltaic subsidiaries | | | 1,435,802 | |
Provision for trade and notes receivable due from Ningxia photovoltaic subsidiariesShare of net assets acquired | | | 4,166,461 | |
| | | | |
| Goodwill | | | 1,163,949 | |
| | | | |
| Satisfied by: | | | | |
Cash
| | | 2,665,205 | |
| Fair value of previously held equity interest | | | 2,665,205 | |
| | | 5,330,410 | |
ALUMINUM CORPORATION OF CHINA LIMITED AND ITS SUBSIDIARIES
NOTES TO THE CONSOLIDATED FINANCIAL STATEMENTS(Continued)
For the years ended December 31, 2016, 2017 and 2018
(Amounts expressed in thousands of RMB unless otherwise stated)
| 38. | BUSINESS COMBINATION(Continued) |
| (k) | Acquisition of Shanxi Huaxing(Continued) |
Details of the 50% equity interest held by the Group before the acquisition of Shanxi Huaxing and the profit from the investment are as follows:
| | December 6, 2018 | |
| | | |
| Initial investment cost | | | 2,351,479 | |
| | | | |
| Share of loss accumulated under the equity method | | | (15,644 | ) |
Provision for other current assets due from Ningxia photovoltaic subsidiaries | | | (1,321,71277,309 | ) |
| | | | | |
ConsiderationShare of changes in reserves under the equity method | | | 114,09011,166 | |
| | | | | |
Release of unrealized gains or losses between Ningxia photovoltaic subsidiaries and the Group upon deconsolidationCash dividends declared | | | 16,515(236,556 | ) |
| | | | |
| Book value of the investment in 50% equity of Shanxi Huaxing on the acquisition date | | | 2,048,780 | |
| | | | |
| Fair value of the investment in 50% equity of Shanxi Huaxing on the acquisition date(Note) | | | 2,665,205 | |
| | | | |
| Gain on previously held equity interest remeasured at acquisition-date fair value | | | 616,425 | |
| Note: | The fair value was determined by the valuation report issued by an independent qualified valuer. |
ALUMINUM CORPORATION OF CHINA LIMITED AND ITS SUBSIDIARIES
NOTES TO THE CONSOLIDATED FINANCIAL STATEMENTS(Continued)
For the years ended December 31, 2016, 2017 and 2018
(Amounts expressed in thousands of RMB unless otherwise stated)
| 38. | BUSINESS COMBINATION(Continued) |
| (k) | Acquisition of Shanxi Huaxing(Continued) |
An analysis of the cash flows in respect of the acquisition of Shanxi Huaxing is as follows:
| | RMB’000 | |
| | | |
| Cash consideration | | | (2,665,205 | ) |
| Cash and bank balances acquired | | | 81,344 | |
| | | | | |
Net loss on lost controloutflow of Ningxia photovoltaic subsidiariescash and cash equivalents included in cash flows from investing activities | | | (18,8732,583,861 | ) |
The operating results and cash flows of Shanxi Huaxing since the acquisition date to December 31, 2018 are as follows:
| | | An analysis of the cash flows of cash and cash equivalents in respect of lost control of Ningxia photovoltaic subsidiaries is as follows: |
| 2015RMB’000 | |
Cash consideration paid | - | | |
Less: cash and cash equivalents of Ningxia photovoltaic subsidiariesRevenue | 189 | | 415,509 | |
| Profit for the period | | | 110,917 | |
Net outflows of cash and cash equivalents in respect of lost control of Ningxia photovoltaic subsidiaries | (189)out flows | | | (434 | ) |
| * | The English names represent the best effort made by management of the Group in translating their Chinese names as the companies do not have any official English names. |
ALUMINUM CORPORATION OF CHINA LIMITED AND ITS SUBSIDIARIES
NOTES TO THE CONSOLIDATED FINANCIAL STATEMENTS(Continued)
For the years ended December 31, 2015, 2016, 2017 and 2017
2018
(Amounts expressed in thousands of RMB unless otherwise stated)
39. | 38. | DISPOSAL OF BUSINESSESBUSINESS COMBINATION(Continued) |
| (l) | Acquisition of Shandong Aluminum Carbon Plant |
On August 31, 2018, Chalco Shandong, a subsidiary of the Company, entered into an asset transfer agreement with Shandong Aluminum Plant, pursuant to which, Chalco Shandong acquired Shandong Aluminum Carbon Plant from Shandong Aluminum at a total consideration of RMB146 million. The consideration was determined based on the appraisal report issued by an independent qualified valuer. Chalco Shandong has paid all consideration as of December 31, 2018. In the opinion of the directors of the Company, Shandong Aluminum Carbon Plant constitutes a business. Before and after the acquisition, Chalco Shandong and Shandong Aluminum were controlled by Chinalco, and the control was not temporary. As such, the acquisition is considered to be a business combination under common control. The acquisition date was August 31, 2018, which is determined by the date of transfer of the assets.
The carrying amounts of the assets and liabilities of Shandong Aluminum Carbon Plant as at the transaction date and the comparative financial figures were as follows:
| | | December 31, 2017 | | | August 31, 2018 | |
| Assets | | | | | | | | |
| | | | | | | | | |
| Property, plant and equipment | | | 24,393 | | | | 23,845 | |
| Inventories | | | 51,104 | | | | 46,150 | |
| Other current assets | | | 418 | | | | 411 | |
| Trade and notes receivables | | | 23,052 | | | | 44,522 | |
| Cash and cash equivalents | | | 34,354 | | | | — | |
| | | | | | | | | |
| Liabilities | | | | | | | | |
| Trade and notes payables | | | (12,235 | ) | | | (24,011 | ) |
| Contract liabilities | | | — | | | | (1,432 | ) |
| Other payables and accrued expenses | | | (38,415 | ) | | | (1,542 | ) |
| | | | | | | | | |
| Net assets | | | 82,671 | | | | 87,943 | |
| | | | | | | | | |
| Difference recognized in equity | | | | | | | 58,319 | |
| | | | | | | | | |
| Total purchase consideration | | | | | | | 146,262 | |
ALUMINUM CORPORATION OF CHINA LIMITED AND ITS SUBSIDIARIES
NOTES TO THE CONSOLIDATED FINANCIAL STATEMENTS(Continued)
For the years ended December 31, 2016, 2017 and 2018
(Amounts expressed in thousands of RMB unless otherwise stated)
| 38. | (c)BUSINESS COMBINATION(Continued) |
| (m) | Acquisition of Pingguo Aluminum Carbon Plant |
On August 30, 2018, Guangxi Branch of the Company entered into an asset transfer agreement with Pingguo Aluminum, pursuant to which, Guangxi Branch of the Company acquired Pingguo Aluminum Carbon Plant from Pingguo Aluminum at a total consideration of RMB92 million. The consideration was determined based on the appraisal report issued by an independent qualified valuer. Guangxi Branch of the Company has paid all consideration as of December 31, 2018. In the opinion of the directors of the Company, the Pingguo Aluminum Carbon Plant constitutes a business. Before and after the acquisition, Guangxi Branch and Pingguo Aluminum were controlled by Chinalco, and the control was not temporary. As such, the acquisition is considered to be a business combination under common control. The acquisition date was August 30, 2018, which is determined by the date of transfer of the assets.
The carrying amounts of the assets and liabilities of Pingguo Aluminum Carbon Plant as at the transaction date and the comparative financial figures were as follows:
| | | December 31, 2017 | | | August 30, 2018 | |
| Assets | | | | | | | | |
| Property, plant and equipment | | | 35,201 | | | | 127,315 | |
| Trade and notes receivables | | | 12,143 | | | | — | |
| Inventories | | | 90,581 | | | | 71,264 | |
| | | | | | | | | |
| Liabilities | | | | | | | | |
| Trade and notes payables | | | (69,521 | ) | | | (117,749 | ) |
| | | | | | | | | |
| Net assets | | | 68,404 | | | | 80,830 | |
| Difference recognized in equity | | | | | | | 11,218 | |
| | | | | | | | | |
| Total purchase consideration | | | | | | | 92,048 | |
ALUMINUM CORPORATION OF CHINA LIMITED AND ITS SUBSIDIARIES
NOTES TO THE CONSOLIDATED FINANCIAL STATEMENTS(Continued)
For the years ended December 31, 2016, 2017 and 2018
(Amounts expressed in thousands of RMB unless otherwise stated)
| 38. | BUSINESS COMBINATION(Continued) |
| (n) | Acquisition of Chibi Great Wall Carbon |
On August 30, 2018, Chalco Mining, a subsidiary of the Company, entered into an equity transfer agreement with China Great Wall Aluminum and Henan Great Wall Zhongxin, pursuant to which, Chalco Mining acquired 57.69% and 19.96% equity interest in Red Chibi Great Wall from China Great Wall Aluminum and Henan Great Wall Zhongxin, respectively. The consideration for the acquisition was RMB202 million, which was determined based on the appraisal value of the 77.65% equity interest in Chibi Great Wall Carbon. As at December 31, 2018, Chalco Mining has paid the consideration in receivables amounting to RMB70 million and cash amounting to RMB132 million, respectively. The transaction date was August 30, 2018, which was the date that the Group obtained control of Chibi Great Wall Carbon. Before and after the acquisition, both Chibi Great Wall Carbon and Chalco Mining were controlled by Chinalco, and the control was not temporary. Thus, the acquisition of the 77.65% equity interest in Chibi Great Wall Carbon is considered to be a business combination under common control.
The carrying amounts of the assets and liabilities of Red Cliff Carbon as at the transaction date and the comparative financial figures were as follows:
| | | December 31, 2017 | | | August 30, 2018 | |
| Assets | | | | | | | | |
| Property, plant and equipment | | | 271,604 | | | | 379,618 | |
| Land use rights | | | 26,124 | | | | 25,731 | |
| Deferred tax assets | | | 3,325 | | | | 3,325 | |
| Inventories | | | 59,035 | | | | 65,440 | |
| Other current assets | | | 11,095 | | | | 18,608 | |
| Trade and notes receivables | | | 32,880 | | | | 53,392 | |
| Restricted Cash | | | 15,700 | | | | — | |
| Cash and cash equivalents | | | 50,545 | | | | 16,258 | |
| | | | | | | | | |
| Liabilities | | | | | | | | |
| Interest-bearing loans and borrowings | | | (228,500 | ) | | | (233,000 | ) |
| Contract liabilities | | | — | | | | (1,816 | ) |
| Trade and notes payables | | | (46,702 | ) | | | (56,970 | ) |
| Other payables and accrued expenses | | | (51,595 | ) | | | (52,114 | ) |
| Income tax payable | | | (2,927 | ) | | | — | |
| Other non-current liabilities | | | (69,640 | ) | | | (65,901 | ) |
| | | | | | | | | |
| Net assets | | | 70,944 | | | | 152,571 | |
| Non-controlling interests | | | (15,856 | ) | | | (34,100 | ) |
| Difference recognized in equity | | | | | | | 83,497 | |
| | | | | | | | | |
| Total purchase consideration | | | | | | | 201,968 | |
ALUMINUM CORPORATION OF CHINA LIMITED AND ITS SUBSIDIARIES
NOTES TO THE CONSOLIDATED FINANCIAL STATEMENTS(Continued)
For the years ended December 31, 2016, 2017 and 2018
(Amounts expressed in thousands of RMB unless otherwise stated)
| 38. | BUSINESS COMBINATION(Continued) |
| (o) | Acquisition of Longhua Logistics |
On August 30, 2018, China Aluminum Logistics Group Corporation Co., Ltd. (“China Aluminum Logistics Group”) (“中鋁物流集團有限公司”), a subsidiary of the Company, entered into an equity transfer agreement with Northeast Light Alloy Co., Ltd., pursuant to which, Chalco Aluminum Logistics acquired a 51% equity interest in East Light Logistics from Northeast Light Alloy Co., Ltd. The consideration for the acquisition was RMB3 million, which was determined based on the appraisal value of the 51% equity interest in East Light Logistics and China Aluminum Logistics Group has paid all consideration as of December 31, 2018. The transaction date was August 30, 2018, which was the date that the Group obtained control of East Light Logistics. Before and after the acquisition, both East Light Logistics and China Aluminum Logistics Group were controlled by Chinalco, and the control was not temporary. As such, the acquisition of the 51% equity interest in East Light Logistics is considered to be a business combination under common control.
The carrying amount of the assets and liabilities of East Light Logistics as at the transaction date and the comparative financial figures were as follows:
| | | December 31, 2017 | | | September 17, 2018 | |
| Assets | | | | | | | | |
| | | | | | | | | |
| Property, plant and equipment | | | 2,901 | | | | 3,839 | |
| Inventories | | | 127 | | | | 2,207 | |
| Other current assets | | | 200 | | | | 608 | |
| Trade and notes receivables | | | 6,704 | | | | 6,828 | |
| Cash and cash equivalents | | | 281 | | | | 403 | |
| | | | | | | | | |
| Liabilities | | | | | | | | |
| Trade and notes payables | | | (2,062 | ) | | | (4,647 | ) |
| Contract liabilities | | | — | | | | (1,504 | ) |
| Income tax payable | | | (130 | ) | | | — | |
| Other payables and accrued expenses | | | (1,323 | ) | | | (2,065 | ) |
| | | | | | | | | |
| Net assets | | | 6,698 | | | | 5,669 | |
| | | | | | | | | |
| Non-controlling interests | | | (3,281 | ) | | | (2,778 | ) |
| | | | | | | | | |
| Net assets acquired | | | | | | | 2,891 | |
| | | | | | | | | |
| Difference recognized in equity | | | | | | | 413 | |
| | | | | | | | | |
| Total purchase consideration | | | | | | | 3,304 | |
ALUMINUM CORPORATION OF CHINA LIMITED AND ITS SUBSIDIARIES
NOTES TO THE CONSOLIDATED FINANCIAL STATEMENTS(Continued)
For the years ended December 31, 2016, 2017 and 2018
(Amounts expressed in thousands of RMB unless otherwise stated)
| 39. | DISPOSAL OF BUSINESSES |
| (a) | Disposed of the Environmental Protection Business |
| | |
| | On June 29, 2016, each of the Lanzhou Branch and three subsidiaries, Baotou Aluminum Shandong Huayu and Ningxia Energy of the Company (collectively the “Sellers“ and each a “Seller“), entered into a business transfer agreement with Aluminum SPC, pursuant to which the Sellers agreed to sell and Aluminum SPC agreed to acquire the environmental protection business. Aluminum SPC is a joint venture of the Company and SPC. The environmental protection business includes the environmental protection assets and relevant liabilities in relation to the desulfurization, denitration and dedusting of the coal fired generating units of the Sellers (collectively as “Environmental Protection Business“). The aggregate consideration of the business transfer agreements was RMB1,754 million, which was determined based on the valuation reports of the Environmental Protection Business on the valuation base date of March 31, 2016. As at December 31, 2016, all the cash consideration of disposal of environmental assets was received. |
| | |
| | The Group disposed of the Environmental Protection Business with a carrying value of RMB1,183 million and recognized a disposal gain of RMB571 million in the period. The transaction was completed on June 30, 2016. |
| | |
| | The details of the net assets disposed of are as follows: |
On June 29, 2016, each of the Lanzhou Branch and three subsidiaries, Baotou Aluminum Shandong Huayu and Ningxia Energy of the Company (collectively the “Sellers“ and each a “Seller“), entered into a business transfer agreement with Aluminum SPC, pursuant to which the Sellers agreed to sell and Aluminum SPC agreed to acquire the environmental protection business. Aluminum SPC is a joint venture of the Company and SPC. The environmental protection business includes the environmental protection assets and relevant liabilities in relation to the desulfurization, denitration and dedusting of the coal fired generating units of the Sellers (collectively as “Environmental Protection Business“). The aggregate consideration of the business transfer agreements was RMB1,754 million, which was determined based on the valuation reports of the Environmental Protection Business on the valuation base date of March 31, 2016. As at December 31, 2016, all the cash consideration of disposal of environmental assets was received.
The Group disposed of the Environmental Protection Business with a carrying value of RMB1,183 million and recognized a disposal gain of RMB571 million in the period. The transaction was completed on June 30, 2016.
The details of the net assets disposed of are as follows:
| | | | June 30, 2016 | |
Net assets disposed of:of : | | | | |
| Property, plant and equipment | | | 1,187,802 | |
| Trade and notes payables | | | (2,042 | ) |
| Accruals and other payables | | | (2,665 | ) |
| | | | | |
| | | | 1,183,095 | |
| Gain on disposal of the Environmental Protection Business | | | 571,270 | |
| | | | | |
| Cash consideration | | | 1,754,365 | |
ALUMINUM CORPORATION OF CHINA LIMITED AND ITS SUBSIDIARIES
NOTES TO THE CONSOLIDATED FINANCIAL STATEMENTS(Continued)
For the years ended December 31, 2015, 2016, 2017 and 20172018
(Amounts expressed in thousands of RMB unless otherwise stated)
| 39. | DISPOSAL OF BUSINESSES(Continued) (CONTINUED) |
| (d)(b) | Disposal of Shandong Engineering |
| | |
| | On October 31, 2017, the Company and CHALIECO entered into an equity transfer agreement, pursuant to which the Company agreed to sell and CHALIECO agreed to acquire 60% equity interest in Shandong Engineering at a consideration of RMB360 million. The consideration was determined based on the appraised value of the 60% equity interest in Shandong Engineering. Full consideration has been received by the Group in November 2017. |
| | |
| | The directors of the Company are of the opinion that the Group lost control over Shandong Engineering and accounted for it as an associate accordingly. As of the date of disposal, the carrying amount of Shandong Engineering was RMB350 million, and the Group recognized gain of disposal of subsidiary of RMB153 million for 60% equity interests disposed of. The Group re-measured the remaining 40% equity interest of Shandong Engineering to a fair value of RMB240 million and recognized the fair value gain of RMB102 million accordingly. In addition, unrealized profit arisen from construction services provided by Shandong Engineering previously eliminated upon consolidation amounting to RMB59 million was reversed and recognized in other gains. |
On October 31, 2017, the Company and CHALIECO entered into an equity transfer agreement, pursuant to which the Company agreed to sell and CHALIECO agreed to acquire 60% equity interest in Shandong Engineering at a consideration of RMB360 million. The consideration was determined based on the appraised value of the 60% equity interest in Shandong Engineering. Full consideration has been received by the Group in November 2017.
The directors of the Company are of the opinion that the Group lost control over Shandong Engineering and accounted for it as an associate accordingly. As of the date of disposal, the carrying amount of Shandong Engineering was RMB350 million, and the Group recognized gain of disposal of subsidiary of RMB153 million for 60% equity interests disposed of. The Group re-measured the remaining 40% equity interest of Shandong Engineering to a fair value of RMB240 million and recognized the fair value gain of RMB102 million accordingly. In addition, unrealized profit arisen from construction services provided by Shandong Engineering previously eliminated upon consolidation amounting to RMB59 million was reversed and recognized in other gains.
ALUMINUM CORPORATION OF CHINA LIMITED AND ITS SUBSIDIARIES
NOTES TO THE CONSOLIDATED FINANCIAL STATEMENTS(Continued)
For the years ended December 31, 2015, 2016, 2017 and 20172018
(Amounts expressed in thousands of RMB unless otherwise stated)
| 39. | DISPOSAL OF BUSINESSES(Continued) (CONTINUED) |
| (d)(b) | Disposal of Shandong Engineering(Continued) |
| | |
| | |
The details of the net assets disposed of are as follows:
| | | Date of disposal | |
| Net assets disposed of: | | | | |
| Property, plant and equipment | | | 109,103 | |
| Intangible assets | | | 428 | |
| Deferred tax assets | | | 3,106 | |
| Inventories | | | 167,499 | |
| Trade receivables and notes receivable | | | 1,067,636 | |
| Other current assets | | | 23,136 | |
| Cash and cash equivalents | | | 123,530 | |
| Other non-current liabilities | | | (4,637 | ) |
| Other payables and accrued liabilities | | | (282,232 | ) |
| Trade and notes payables | | | (727,622 | ) |
| Interest-bearing loans and borrowings | | | (130,000 | ) |
| | | | |
| Net assets | | | 349,947 | |
| Non-controlling interests | | | 3,961 | |
| Total net assets | | | 345,986 | |
| | | | |
| Gain on disposal of Shandong Engineering | | | 254,659 | |
| | | | |
| The fair value of the remaining equity interest in Shandong Engineering | | | 240,258 | |
| | | | |
| Consideration | | | 360,387 | |
| | | | |
| Satisfied by: | | | | |
| Cash | | | 387 | |
| Notes receivable | | | 360,000 | |
| | | | |
| An analysis of the cash flow of cash and cash equivalents in respect of the Disposal of Shandong Engineering is as follows: |
| | | Date of disposal | |
| | | | | |
| Cash consideration received | | | 387 | |
| Cash and bank balances disposed of | | | (123,530 | ) |
| | | | | |
Net outflows of cash and cash equivalents in respect of disposal of Shandong Engineering | | | (123,143 | ) |
ALUMINUM CORPORATION OF CHINA LIMITED AND ITS SUBSIDIARIES
NOTES TO THE CONSOLIDATED FINANCIAL STATEMENTS(Continued)
For the years ended December 31, 2015, 2016, 2017 and 20172018
(Amounts expressed in thousands of RMB unless otherwise stated)
| 39. | DISPOSAL OF BUSINESSES(Continued) (CONTINUED) |
| (e)(c) | Deemed disposal of Shanxi Zhongrun |
| | |
| | The Company previously had a 50% equity interest in Shanxi China Huarun Co., Ltd.* (“Shanxi Zhongrun”) (山西中鋁華潤有限公司). According to the then acting-in-concert agreement entered into by the Company and the other shareholders of Shanxi Zhongrun, Huarun (Coal) Group Co., Ltd. * (“Huarun (Coal) Group”) (華潤(煤業)集團有限公司), Huarun (Coal) Group agreed to confer its voting rights in the shareholders’ meeting of Shanxi Zhongrun to the Company. Accordingly, the directors of the Company considered that the Company had control over Shanxi Zhongrun and included Shanxi Zhongrun in the consolidation scope. |
| | |
| | On 15 February 2017, the Company entered into a capital injection and enlargement agreement on Shanxi Zhongrun with Huarun (Coal) Group, Shanxi Xishan Coal and Electricity Power Co., Ltd.* (“Xishan Coal Electricity”) (西山煤電), and Jin Energy Power Group Co., Ltd.* (“Jin Energy Power”) (晉能電力). Pursuant to the agreement, the Company, Xishan Coal Electricity and Jin Energy Power had each subscribed RMB100 million, respectively. After the capital contribution, the Company’s equity interest in Shanxi Zhongrun decreased to 40% while each of the other three shareholders hold a 20% equity interest, respectively, and the acting-in-concert agreement between the Company and Huarun (Coal) Group also ceased to be effective since then. The directors of the Company are of the opinion that the Group lost control over Shanxi Zhongrun and accounted for it as an associate accordingly. As of the date of deemed disposal, the Company re-measured the 40% equity of Shanxi Zhongrun to a fair value of RMB100 million and recognized the fair value gain of RMB4 million accordingly. |
The Company previously had a 50% equity interest in Shanxi China Huarun Co., Ltd.* (“Shanxi Zhongrun”) (山西中鋁華潤有限公司). According to the then acting-in-concert agreement entered into by the Company and the other shareholders of Shanxi Zhongrun, Huarun (Coal) Group Co., Ltd. * (“Huarun (Coal) Group”) (華潤(煤業)集團有限公司), Huarun (Coal) Group agreed to confer its voting rights in the shareholders’ meeting of Shanxi Zhongrun to the Company. Accordingly, the directors of the Company considered that the Company had control over Shanxi Zhongrun and included Shanxi Zhongrun in the consolidation scope.
On February 15, 2017, the Company entered into a capital injection and enlargement agreement on Shanxi Zhongrun with Huarun (Coal) Group, Shanxi Xishan Coal and Electricity Power Co., Ltd.* (“Xishan Coal Electricity”) (西山煤電), and Jin Energy Power Group Co., Ltd.* (“Jin Energy Power”) (晉能電力). Pursuant to the agreement, the Company, Xishan Coal Electricity and Jin Energy Power had each subscribed RMB100 million, respectively. After the capital contribution, the Company’s equity interest in Shanxi Zhongrun decreased to 40% while each of the other three shareholders hold a 20% equity interest, respectively, and the acting-in-concert agreement between the Company and Huarun (Coal) Group also ceased to be effective since then. The directors of the Company are of the opinion that the Group lost control over Shanxi Zhongrun and accounted for it as an associate accordingly. As of the date of deemed disposal, the Company re-measured the 40% equity of Shanxi Zhongrun to a fair value of RMB100 million and recognized the fair value gain of RMB4 million accordingly.
ALUMINUM CORPORATION OF CHINA LIMITED AND ITS SUBSIDIARIES
NOTES TO THE CONSOLIDATED FINANCIAL STATEMENTS(Continued)
For the years ended December 31, 2015, 2016, 2017 and 20172018
(Amounts expressed in thousands of RMB unless otherwise stated)
| 39. | DISPOSAL OF BUSINESSES(Continued) (CONTINUED) |
| (f)(d) | Disposal of Zibo Trading |
In November 2017, Chalco Trading, a subsidiary of the Company, agreed to transfer 50% equity interest in Zibo International Trading Co. Ltd. * (”Zibo Trading”) (“淄博國貿”) to a third party. The directors of the Company are of the opinion that the Group lost control over Zibo Trading and accounted for it as a joint venture accordingly. As of the date of disposal, the Group recognized loss of disposal of subsidiary of RMB2 million for 50% equity interest disposed of. The Group re-measured the 50% equity of Zibo Trading to a fair value of RMB12 million and recognized the fair value loss of RMB2 million accordingly.
| | |
| | In November 2017, Chalco Trading, a subsidiary of the Company, agreed to transfer 50% equity interest in Zibo International Trading Co. Ltd. * (”Zibo Trading”) (“淄博國貿”) to a third party. The directors of the Company are of the opinion that the Group lost control over Zibo Trading and accounted for it as a joint venture accordingly. As of the date of disposal, the Group recognized loss of disposal of subsidiary of RMB2 million for 50% equity interest disposed of. The Group re-measured the 50% equity of Zibo Trading to a fair value of RMB12 million and recognized the fair value loss of RMB2 million accordingly. |
| | |
| (g)(e) | Bankruptcy liquidation of Longmen Aluminum |
In September 2017, Shanxi Hejin People's Court accepted the liquidation petition filed by the Group’s subsidiary, Shanxi Longmen Aluminum Co., Ltd. ("Longmen Aluminum”) (山西龍門鋁業有限公司). Upon the liquidation, administrators took control over Longmen Aluminum, the directors of the Company considered the Company lost control over Longmen Aluminum and therefore, ceased to consolidate Longmen Aluminum since then. The Group recognized a loss of RMB26 million for lost control over Longmen Aluminum.
| | |
| | In September 2017, Shanxi Hejin People's Court accepted the liquidation petition filed by the Group’s subsidiary, Shanxi Longmen Aluminium Co., Ltd. ("Longmen Aluminum”) (山西龍門鋁業有限公司). Upon the liquidation, administrators took control over Longmen Aluminum, the directors of the Company considered the Company lost control over Longmen Aluminum and therefore, ceased to consolidate Longmen Aluminum since then. The Group recognized a loss of RMB26 million for lost control over Longmen Aluminum. |
| | |
| (h)(f) | Bankruptcy liquidation of Beijing Yike |
In September 2017, Beijing Shijingshan People's Court accepted the liquidation petition filed by the Group’s subsidiary, Beijing Yike. Upon the liquidation, administrators took control over Beijing Yike, and therefore, the directors of the Company considered the Group lost control over Beijing Yike and deconsolidated Beijing Yike since then. The Group recognized a gain of RMB38 million upon the deconsolidation of Beijing Yike.
| (g) | Disposal of Zhengzhou Chalco Longyu Mining Co., Ltd. |
In August 2018, Chalco Trading, a subsidiary of the Company, agreed to transfer a 51% equity interest in Zhengzhou Chalco Longyu Mining Co., Ltd.* (“Longyu Mining”) (“鄭州中鋁龍宇礦業有限公司”) to a third party. As of the date of disposal, the Group recognized a gain of disposal of subsidiary of RMB8 million.
| (h) | In September 2017, Beijing Shijingshan People's Court accepted theBankruptcy liquidation petition filed by the Group’s subsidiary, Beijing Yike.of Shanxi Huatai Carbon Co., Ltd. |
In March 2018, Shanxi Jiexiu People’s Court accepted the liquidation petition filed by the Group’s subsidiary, Shanxi Huatai Carbon Co., Ltd.* (“山西華泰碳素有限責任公司”). Upon the liquidation, administrators took control over Shanxi Huatai Carbon Co., Ltd., and the directors of the Company considered that the Company lost control over Shanxi Huatai Carbon Co., Ltd. and therefore, ceased to consolidate Shanxi Huatai Carbon Co., Ltd. since then. The Group recognized a loss of RMB2 million for lost control over Shanxi Huatai Carbon Co., Ltd.
| (i) | Bankruptcy liquidation administrators took control over Beijing Yike, and therefore, the directors of the Company considered the Group lost control over Beijing Yike and deconsolidated Beijing Yike since then. The Group recognized a gain of RMB38 million upon the deconsolidation of Beijing Yike.Hedong Carbon Co., Ltd. |
In June 2018, Shanxi Hejin People’s Court accepted the liquidation petition filed by the Group’s subsidiary, Hedong Carbon Co., Ltd.* (“河東碳素”). Upon the liquidation, administrators took control over Hedong Carbon Co., Ltd., and the directors of the Company considered that the Company lost control over Hedong Carbon Co., Ltd. and therefore, ceased to consolidate Hedong Carbon Co., Ltd. since then. The Group recognized a loss of RMB2 million for lost control over Hedong Carbon Co., Ltd.
| | |
| | * | The English names representname represents the best effort made by management of the Group in translating theits Chinese names of the Companiesname as they doit does not have any official English names. |
ALUMINUM CORPORATION OF CHINA LIMITED AND ITS SUBSIDIARIES
NOTES TO THE CONSOLIDATED FINANCIAL STATEMENTS(Continued)
For the years ended December 31, 2015, 2016, 2017 and 20172018
(Amounts expressed in thousands of RMB unless otherwise stated)
| 40. | OTHER EQUITY INSTRUMENTS |
| |
| On October 22, 2013, a subsidiary of the Company, Chalco Hong Kong Investment Company Limited (“Chalco Hong Kong Investment”, or the “Issuer“) issued USD350 million senior perpetual securities with an initial distribution rate of 6.625% (the “2013 Senior Perpetual Securities“). The proceeds from the issuance of the 2013 Senior Perpetual Securities after the issuance costs amounted to USD347 million (equivalent to RMB2,123 million). The proceeds were on-lent to the Company and any of its subsidiaries for general corporate use. Coupon payments of 6.625% per annum on the 2013 Senior Perpetual Securities have been made semi-annually in arrears from October 29, 2013 and may be deferred at the discretion of the Group. The 2013 Senior Perpetual Securities have no fixed maturity dates and are callable only at the Group’s option on or after October 29, 2018 at their principal amounts together with any accrued, unpaid or deferred coupon distribution payments. After October 29, 2018, the coupon distribution rate will be reset to a percentage per annum equal to the sum of (a) the initial spread of 5.312 percent, (b) the U. S. Treasury Rate, and (c) a margin of 5.00 percent per annum. While any coupon distribution payments are unpaid or deferred, the Group, the wholly-owned subsidiaries of Chalco Hong Kong as guarantors, and the Issuer cannot declare or pay dividends or make distributions or similar discretionary payments in respect of, or repurchase, redeem or otherwise acquire any securities of lower or equal rank. |
On October 22, 2013, a subsidiary of the Company, Chalco Hong Kong Investment Company Limited (“Chalco Hong Kong Investment”, or the “Issuer“) issued USD350 million senior perpetual securities at an initial distribution rate of 6.625% (the “2013 Senior Perpetual Securities“). The proceeds from the issuance of the 2013 Senior Perpetual Securities after the issuance costs amounted to USD347 million (equivalent to RMB2,123 million). The proceeds were on-lent to the Company and any of its subsidiaries for general corporate use. Coupon payments at 6.625% per annum on the 2013 Senior Perpetual Securities have been made semi-annually in arrears from October 29, 2013 and may be deferred at the discretion of the Group. The 2013 Senior Perpetual Securities have no fixed maturity dates and are callable only at the Group’s option on or after October 29, 2018 at their principal amounts together with any accrued, unpaid or deferred coupon distribution payments. After October 29, 2018, the coupon distribution rate will be reset to a percentage per annum equal to the sum of (a) the initial spread of 5.312 percent, (b) the U.S. Treasury Rate, and (c) a margin of 5.00 percent per annum. While any coupon distribution payments are unpaid or deferred, the Company and Chalco Hong Kong as guarantors, and the Issuer cannot declare or pay dividends or make distributions or similar discretionary payments in respect of, or repurchase, redeem or otherwise acquire any securities of lower or equal rank.
On October 31, 2018, the Group redeemed the senior perpetual security, and paid $373 million in principal and interest, approximately RMB2,592 million.
On October 27, 2015, the Company issued RMB2,000 million perpetual medium-term notes with an initial distribution rate at 5.50% (the “2015 Perpetual Medium-term Notes“). The proceeds from the issuance of the 2015 Perpetual Medium-term Notes were RMB2,000 million. The proceeds were used for the repayment of interest-bearing loans and borrowings. Coupon payments at 5.50% per annum on the 2015 Perpetual Medium-term Notes have been made annually in arrears from October 29, 2015 and may be deferred at the discretion of the Company. The 2015 Perpetual Medium-term Notes have no fixed maturity date and are callable only at the Group’s option on October 29, 2020 or any coupon distribution date after October 29, 2020 at their principal amounts together with any accrued, unpaid or deferred coupon distribution payments. The coupon distribution rate will be reset to a percentage per annum equal to the sum of (a) the initial spread of 2.61 percent, (b) the China Treasury Rate, and (c) a margin of maximum 300 Bps every five years after October 29, 2020. While any coupon distribution payments are unpaid or deferred, the Company cannot declare or pay dividends to shareholders or decrease the share capital, or make material fixed asset investments.
ALUMINUM CORPORATION OF CHINA LIMITED AND ITS SUBSIDIARIES
NOTES TO THE CONSOLIDATED FINANCIAL STATEMENTS(Continued)
For the years ended December 31, 2015, 2016, 2017 and 2017
2018
(Amounts expressed in thousands of RMB unless otherwise stated)
| 40. | OTHER EQUITY INSTRUMENTS (CONTINUED) |
On October 31, 2016, Chalco Hong Kong Investment issued USD500 million senior perpetual securities with an initial distribution rate at 4.25% (the “2016 Senior Perpetual Securities“). The proceeds from the issuance of the 2016 Senior Perpetual Securities after the issuance costs were USD498 million (equivalent to RMB3,374 million). The proceeds were on-lent to the Company and any of its subsidiaries for general corporate use. Coupon payments at 4.25% per annum on the 2016 Senior Perpetual Securities have been made semi-annually on April 29 and October 29, in arrears from November 7, 2016 and may be deferred at the discretion of the Group. The first coupon payment date was April 29, 2017. The 2016 Senior Perpetual Securities have no fixed maturity date and are callable only at the Group’s option on or after November 7, 2021 at their principal amounts together with any accrued, unpaid or deferred coupon distribution payments. After November 7, 2021, the coupon distribution rate will be reset to a percentage per annum equal to the sum of (a) the initial spread of 2.931 percent, (b) the U.S. Treasury Rate, and (c) a margin of 5.00 percent per annum. While any coupon distribution payments are unpaid or deferred, the Company and Chalco Hong Kong as guarantors, and the Issuer cannot declare or pay dividends or make distributions or similar discretionary payments in respect of, or repurchase, redeem or otherwise acquire any securities of lower or equal rank.
On October 19, 2018, the Company issued RMB2,000 million perpetual medium-term notes with an initial distribution rate at 5.10% (the “2018 Perpetual Medium-term Notes“). The proceeds from the issuance of the 2018 Perpetual Medium-term Notes were RMB2,000 million. The proceeds were used for the repayment of interest-bearing loans and borrowings. Coupon payments of 5.10% per annum on the 2018 Perpetual Medium-term Notes have been made annually in arrears from October 19, 2018 and may be deferred at the discretion of the Company. The 2018 Perpetual Medium-term Notes have no fixed maturity date and are callable only at the Group’s option on October 23, 2021 or any coupon distribution date after October 23, 2021 at their principal amounts together with any accrued, unpaid or deferred coupon distribution payments. The coupon distribution rate will be reset to a percentage per annum equal to the sum of (a) the initial spread of 2.61 percent, (b) the China Treasury Rate, and (c) a margin of 500 Bps every three years after October 23, 2021. While any coupon distribution payments are unpaid or deferred, the Company cannot declare or pay dividends to shareholders or decrease the share capital, or make material fixed asset investments.
Pursuant to the terms and conditions of the 2013 Senior Perpetual Securities, the 2015 Perpetual Medium-term Notes and the 2016 Senior Perpetual Securities, the Group has no contractual obligations to repay their principal or to pay any coupon distributions. Thus, in the opinion of the directors of the Company, they do not meet the definition of financial liabilities according to IAS 32Financial Instruments: Presentation, and are classified as equity and subsequent distributions declared will be treated as distributions to equity owners.
| 40.41. | OTHER EQUITY INSTRUMENTS(Continued)CONTINGENT LIABILITIES |
| |
| On April 10, 2014, Chalco Hong Kong Investment issued USD400 million senior perpetual securities with an initial distribution rate at 6.25% (the “2014 Senior Perpetual Securities“). The proceeds from the issuance of the 2014 Senior Perpetual Securities after the issuance costs were USD398 million (equivalent to RMB2,462 million). The proceeds were on-lent to the Company and any of its subsidiaries for general corporate use. Coupon payments of 6.25% per annum on the 2014 Senior Perpetual Securities have been made semi-annually on April 29, and October 29, in arrears from April 17, 2014 and may be deferred at the discretion of the Group. The first coupon payment date was April 29, 2014. The 2014 Senior Perpetual Securities have no fixed maturity date and are callable only at the Group’s option on or after April 17, 2017 at their principal amounts together with any accrued, unpaid or deferred coupon distribution payments. While any coupon distribution payments are unpaid or deferred, the Group, the wholly-owned subsidiaries of Chalco Hong Kong as guarantors, and the issuer cannot declare or pay dividends or make distributions or similar discretionary payments in respect of, or repurchase, redeem or otherwise acquire any securities of lower or equal rank. On April 29, 2017, the Group redeemed the 2014 Senior Perpetual Securities. |
| |
| On October 27, 2015, the Company issued RMB2,000 million perpetual medium-term notes with an initial distribution rate at 5.50% (the “2015 Perpetual Medium-term Notes“). The proceeds from the issuance of the 2015 Perpetual Medium-term Notes were RMB2,000 million. The proceeds were used for the repayment of interest-bearing loans and borrowings. Coupon payments of 5.50% per annum on the 2015 Perpetual Medium-term Notes have been made annually in arrears from October 29, 2015 and may be deferred at the discretion of the Company. The 2015 Perpetual Medium-term Notes have no fixed maturity date and are callable only at the Group’s option on October 29, 2020 or any coupon distribution date after October 29, 2020 at their principal amounts together with any accrued, unpaid or deferred coupon distribution payments. The coupon distribution rate will be reset to a percentage per annum equal to the sum of (a) the initial spread of 2.61 percent, (b) the China Treasury Rate, and (c) a margin of maximum 300 Bps every five years after October 29, 2020. While any coupon distribution payments are unpaid or deferred, the Company cannot declare or pay dividends to shareholders or decrease the share capital, or make material fixed asset investments. |
As at December 31, 2018 and 2017, the Group had no significant contingent liabilities.
ALUMINUM CORPORATION OF CHINA LIMITED AND ITS SUBSIDIARIES
NOTES TO THE CONSOLIDATED FINANCIAL STATEMENTS(Continued)
For the years ended December 31, 2015, 2016, 2017 and 2017
(Amounts expressed in thousands of RMB unless otherwise stated)2018
40. | OTHER EQUITY INSTRUMENTS(Continued) |
| |
| On October 31, 2016, Chalco Hong Kong Investment issued USD500 million senior perpetual securities with an initial distribution rate at 4.25% (the “2016 Senior Perpetual Securities“). The proceeds from the issuance of the 2016 Senior Perpetual Securities after the issuance costs were USD498 million (equivalent to RMB3,374 million). The proceeds were on-lent to the Company and any of its subsidiaries for general corporate use. Coupon payments of 4.25% per annum on the 2016 Senior Perpetual Securities have been made semi-annually on April 29 and October 29 in arrears from November 7, 2016 and may be deferred at the discretion of the Group. The first coupon payment date was April 29, 2017. The 2016 Senior Perpetual Securities have no fixed maturity date and are callable only at the Group’s option on or after November 7, 2021 at their principal amounts together with any accrued, unpaid or deferred coupon distribution payments. After November 7, 2021, the coupon distribution rate will be reset to a percentage per annum equal to the sum of (a) the initial spread of 2.931 percent, (b) the U. S. Treasury Rate, and (c) a margin of 5.00 percent per annum. While any coupon distribution payments are unpaid or deferred, the Group, the wholly-owned subsidiaries of Chalco Hong Kong as guarantors, and the Issuer cannot declare or pay dividends or make distributions or similar discretionary payments in respect of, or repurchase, redeem or otherwise acquire any securities of lower or equal rank. |
| |
| Pursuant to the terms and conditions of the 2013 Senior Perpetual Securities, the 2015 Perpetual Medium-term Notes and the 2016 Senior Perpetual Securities, the Group has no contractual obligations to repay their principal or to pay any coupon distributions. Thus in the opinion of the directors of the Company, they do not meet the definition of financial liabilities according to IAS 32 Financial Instruments: Presentation, and are classified as equity and subsequent distributions declared will be treated as distributions to equity owners. |
| |
41. | CONTINGENT LIABILITIES |
| |
| As at December 31, 2016 and 2017, the Group had no significant contingent liabilities. |
ALUMINUM CORPORATION OF CHINA LIMITED AND ITS SUBSIDIARIES
NOTES TO THE CONSOLIDATED FINANCIAL STATEMENTS(Continued)
For the years ended December 31, 2015, 2016 and 2017
(Amounts expressed in thousands of RMB unless otherwise stated)
| (a) | Capital commitments ofon property, plant and equipment |
| | December 31, 2016 | December 31, 2017 |
| | | | |
| Contracted, but not provided for | 7,594,756 | | 2,967,541 |
| | December 31, 2017 | | December 31, 2018 | |
| | | | | | | |
| Contracted, but not provided for | | 2,967,541 | | | 3,942,933 | |
| (b) | Commitments under operating leases |
| | |
| | The future aggregate minimum lease payments as at December 31, 2016 and 2017 pursuant to non-cancellable lease agreements entered into by the Group are summarized as follows: |
The future aggregate minimum lease payments as at December 31, 2018 pursuant to non-cancellable lease agreements entered into by the Group are summarised as follows:
| | December 31, 2016 | December 31, 2017 |
| | | | |
| Within one year | 515,276 | | 658,574 |
| In the second to fifth years, inclusive | 1,925,606 | | 2,112,800 |
| After five years | 13,096,017 | | 12,544,108 |
| | | | |
| | 15,536,899 | | 15,315,482 |
| | December 31,
2017 | | December 31, 2018 | |
| | | | | |
| Within one year | | 658,574 | | | 541,541 | |
| In the second to fifth years, inclusive | | 2,112,800 | | | 1,880,058 | |
| After five years | | 12,544,108 | | | 10,567,925 | |
| | | | | | | |
| | | 15,315,482 | | | 12,989,524 | |
| (c) | Other capital commitments |
| | |
| | As at December 31, 2016 and 2017, the commitments to make capital contributions to the Group’s joint ventures and associates were as follows: |
| | December 31, 2016 | December 31, 2017 |
| | | | |
| Associates | 739,975 | | 374,800 |
| Joint ventures | 278,664 | | - |
| | | | |
| | 1,018,639 | | 374,800 |
As at December 31, 2018, the commitments to make capital contributions to the Group’s joint ventures and associates were as follows:
| | December 31, 2017 | | December 31, 2018 | |
| | | | | |
| Associates | | 374,800 | | | 82,800 | |
| Joint ventures | | — | | | 460,000 | |
| | | | | | | |
| | | 374,800 | | | 542,800 | |
ALUMINUM CORPORATION OF CHINA LIMITED AND ITS SUBSIDIARIES
NOTES TO THE CONSOLIDATED FINANCIAL STATEMENTS(Continued)
For the years ended December 31, 2015, 2016, 2017 and 2017
2018
(Amounts expressed in thousands of RMB unless otherwise stated)
| 43. | EVENTS AFTER THE REPORTING PERIOD |
| (a) | On January 18, 2018,16, 2019, the Group completed an issuance of short-term bonds with a total face value of RMB2 billion at par value of RMB100.00 per unit which will mature in March 2019 for working capital needs. The fixed annual coupon interest rate of these bonds is 2.99%. |
| (b) | On January 22, 2019, the Group completed an issuance of corporate bonds with a total face value of RMB2 billion at par value of RMB100.00 per unit which will mature in January 2022 for working capital needs and repayment of bank borrowings. The fixed annual coupon interest rate of these bonds is 3.80%. |
| (c) | On March 14, 2019, the Group completed an issuance of short-term bonds with a total face value of RMB1 billion at par value of RMB100.00 per unit which will mature in September 2019 for working capital needs. The fixed annual coupon interest rate of these bonds is 2.64%. |
| (d) | On March 15, 2019, the Group completed an issuance of short-term bonds with a total face value of RMB2 billion at par value of RMB100.00 per unit which will mature in May 2019 for working capital needs. The fixed annual coupon interest rate of these bonds is 2.90%. |
| (e) | On March 20, 2019, the Group completed an issuance of short-term bonds with a total face value of RMB3 billion at par value of RMB100.00 per unit which will mature in July 2018September 2019 for working capital needs. The fixed annual coupon interest rate of these bonds is 4.70%2.98%. |
| | | |
| (b)(f) | On March 20, 2018,April 24, 2019, the Group completed an issuance of medium-term notesshort-term bonds with a total face value of RMB2RMB1 billion at par value of RMB100.00 per unit which will mature in March 2021June 2019 for working capital needs and repayment of bank borrowings.needs. The fixed annual coupon interest rate of these notesbonds is 5.55%2.89%. |
| | Certain comparative amounts have been retrospectively adjustedCertain comparative amounts have been restated as a result of the business combinations under common control and voluntary change in the accounting policy as disclosed in note 38 and note 2.2(d). | | The comparative consolidated statements of cash flows for the years ended December 31, 2016 and 2017 have been revised to reclassify the cash outflows for the purchase of non-controlling interests and business combination under common control as disclosedfrom investing activities to financing activities in note 38.accordance with IAS 7Statement of Cash Flows. This change did not impact the consolidated statement of financial position or consolidated statement of profit or loss and other comprehensive income for the prior periods. |
| 45. | APPROVAL OF THE FINANCIAL STATEMENTS | | | | The financial statements were approved and authorized for issue by the board of directors on April 19, 2018. |
The financial statements were approved and authorized for issue by the board of directors on April 24, 2019. |
