UNITED STATES
SECURITIES AND EXCHANGE COMMISSION
(Mark One)
| |
o | |
| o | REGISTRATION STATEMENT PURSUANT TO SECTION 12(b) OR (g) OF THE SECURITIES EXCHANGE ACT OF 1934 |
| | | OR |
OR |
| x | | |
x | ANNUAL REPORT PURSUANT TO SECTION 13 OR 15(d) OF THE SECURITIES EXCHANGE ACT OF 1934 |
| | | |
| For the fiscal year endedDecember 31, 20132016 |
| OR |
| | | |
OR |
| o | | |
o | TRANSITION REPORT PURSUANT TO SECTION 13 OR 15(d) OF THE SECURITIES EXCHANGE ACT OF 1934 |
| | |
| | For the transition period from _________________ to _________________ |
| | | OR |
OR |
| o | | |
o | SHELL COMPANY REPORT PURSUANT TO SECTION 13 OR 15(d) OF THE SECURITIES EXCHANGE ACT OF 1934 |
| |
| | Date of event requiring this shell company report _________________ |
Commission file number: 001-36231
|
|
| SCORPIO BULKERS INC. |
| (Exact name of Registrant as specified in its charter) |
| |
| (Translation of Registrant’s name into English) |
| |
| Republic of the Marshall Islands |
| (Jurisdiction of incorporation or organization) |
| |
| 9, Boulevard Charles III Monaco 98000 |
| (Address of principal executive offices) |
| |
Mr. Emanuele Lauro |
+377-9898-5716
377-9798-5715 9, Boulevard Charles III Monaco 98000
|
| (Name, Telephone, E-mail and/or Facsimile, and address of Company Contact Person) |
Securities registered or to be registered pursuant to section 12(b) of the Act.
|
| | |
| Title of each class | | Name of each exchange on which registered |
| Common stock, par value $0.01 per share | | New York Stock Exchange |
| 7.50% Senior Notes due 2019 | | New York Stock Exchange |
Securities registered or to be registered pursuant to section 12(g) of the Act.
Securities for which there is a reporting obligation pursuant to Section 15(d) of the Act.
Indicate the number of outstanding shares of each of the issuer’s classes of capital or common stock as of the close of the period covered by the annual report.
As of December 31,
2013,2016, there were
133,403,93175,298,676 outstanding shares of common stock, par value $0.01 per share.
Indicate by check mark if the registrant is a well-known seasoned issuer, as defined in Rule 405 of the Securities Act.
If this report is an annual or transition report, indicate by check mark if the registrant is not required to file reports pursuant to Section 13 or 15(d) of the Securities Exchange Act of 1934.
Note – Checking the box above will not relieve any registrant required to file reports pursuant to Section 13 or 15(d) of the Securities Exchange Act of 1934 from their obligations under those Sections.
Indicate by check mark whether the registrant (1) has filed all reports required to be filed by Section 13 or 15(d) of the Securities Exchange Act of 1934 during the preceding 12 months (or for such shorter period that the registrant was required to file such reports), and (2) has been subject to such filing requirements for the past 90 days.
Indicate by check mark whether the registrant has submitted electronically and posted on its corporate Web site, if any, every Interactive Data File required to be submitted and posted pursuant to Rule 405 of Regulation S-T (§232.405 of this chapter) during the preceding 12 months (or for such shorter period that the registrant was required to submit and post such files).
Indicate by check mark whether the registrant is a large accelerated filer, an accelerated filer or a non-accelerated filer. See the definitions of “large accelerated filer” and “accelerated filer” in Rule 12b-2 of the Exchange Act. (Check one):
|
| | | | | |
| | Large accelerated filer o | | Accelerated filer ox | | Non-accelerated filer xo |
Indicate by check mark which basis of accounting the registrant has used to prepare the financial statements included in this filing:
|
| | |
| x | | U.S. GAAP |
| | | |
| | | International Financial Reporting Standards as issued by the international Accounting Standards Board |
| | | |
| | | Other |
If “Other” has been checked in response to the previous question, indicate by check mark which financial statement item the registrant has elected to follow:
If this is an annual report, indicate by check mark whether the registrant is a shell company (as defined in Rule 12b-2 of the Exchange Act).
|
| | | |
| | | | |
| | | | | |
| | | | | |
| | | | | |
| | | | | 19 |
| | | | | 47 |
| | | | | 47 |
| | | | | 51 |
| | | | | 55 |
| | | | | 56 |
| | | | | 57 |
| | | | | 58 |
| | | | | 69 |
| | | | | 69 |
| | | | | |
| | | | 69 |
| | | | | 69 |
| | | | | 69 |
| | | | | 70 |
| | | | | 70 |
| | | | | 71 |
| | | | | 71 |
| | | | | 71 |
| | | | | 71 |
| | | | | 71 |
| | | | | 71 |
| | | | | 72 |
| | | | | |
| | | | 72 |
| | | | | 72 |
| | | | | 72 |
| | | | | 72 |
CAUTIONARY STATEMENT REGARDING FORWARD-LOOKING STATEMENTS
Scorpio Bulkers Inc. desires to take advantage of the safe harbor provisions of the Private Securities Litigation Reform Act of 1995 and is including this cautionary statement in connection therewith. This document and any other written or oral statements made by the Company or on its behalf may include forward-looking statements, which reflect its current views with respect to future events and financial performance.
The Private Securities Litigation Reform Act of 1995 provides safe harbor protections for forward-looking statements in order to encourage companies to provide prospective information about their business. Forward-looking statements include statements concerning plans, objectives, goals, strategies, future events or performance, and underlying assumptions and other statements, which are other than statements of historical facts. This document includes assumptions, expectations, projections, intentions and beliefs about future events. These statements are intended as “forward-looking statements.” We caution that assumptions, expectations, projections, intentions and beliefs about future events may and often do vary from actual results and the differences can be material. When used in this document, the words “believe,” “expect,” “anticipate,” “estimate,” “intend,” “plan,” “targets,” “projects,” “likely,” “will,” “would,” “could” and similar expressions or phrases may identify forward-looking statements.
All statements in this document that are not statements of historical fact are forward-looking statements. Forward-looking statements include, but are not limited to, such matters as:
| ● | our future operating or financial results; |
| ● | statements about planned, pending or recent acquisitions, business strategy and expected capital spending or operating expenses, including drydocking, surveys, upgrades and insurance costs; |
| ● | the strength of world economies; |
| ● | fluctuations in interest rates; |
| ● | general drybulk market conditions, including fluctuations in charter hire rates and vessel values; |
| ● | changes in demand in the drybulk shipping industry, including the market for our vessels; |
| ● | changes in our operating expenses, including bunker prices, dry docking and insurance costs; |
| ● | changes in governmental rules and regulations or actions taken by regulatory authorities; |
| ● | potential liability from pending or future litigation; |
| ● | general domestic and international political conditions; |
| ● | potential disruption of shipping routes due to accidents or political events; |
| ● | our ability to procure or have access to financing, our liquidity and the adequacy of cash flow for our operations; |
| ● | our continued borrowing availability under our debt agreements and compliance with the covenants contained therein; |
| ● | our ability to successfully employ our existing and newbuilding drybulk vessels; |
| ● | our future capital expenditures and investments in the construction, acquisition and refurbishment of our vessels (including the amount and nature thereof and the timing of completion thereof, the delivery and commencement of operations dates, expected downtime and lost revenue); |
| ● | our expectations regarding the availability of vessel acquisitions; |
| ● | vessel breakdowns and instances of off-hire; and |
| ● | statements about drybulk shipping market trends, charter rates and factors affecting supply and demand. |
our future operating or financial results; statements about planned, pending or recent acquisitions, business strategy and expected capital spending or operating expenses, including drydocking, surveys, upgrades and insurance costs;
the strength of world economies;
stability of Europe and the Euro;
fluctuations in interest rates and foreign exchange rates;
changes in the supply of drybulk vessels, including when caused by new newbuilding vessel orders or changes to or terminations of existing orders, and vessel scrapping levels;
general drybulk shipping market conditions, including fluctuations in charter hire rates and vessel values;
changes in demand in the drybulk shipping industry, including the market for our vessels;
changes in the value of our existing vessels and proposed newbuildings;
changes in our operating expenses, including bunker prices, dry docking and insurance costs;
changes in governmental rules and regulations or actions taken by regulatory authorities;
potential liability from pending or future litigation;
general domestic and international political conditions;
potential disruption of shipping routes due to accidents or political events;
our ability to procure or have access to financing, our liquidity and the adequacy of cash flows for our operations;
our continued borrowing availability under our debt agreements and compliance with the covenants contained therein;
our ability to successfully employ our existing and newbuilding drybulk vessels;
our ability to fund future capital expenditures and investments in the construction, acquisition and refurbishment of our vessels (including the amount and nature thereof and the timing of completion thereof, the delivery and commencement of operations dates, expected downtime and lost revenue);
risks associated with vessel construction;
potential exposure or loss from investment in derivative instruments;
potential conflicts of interest involving members of our board and senior management and our significant shareholders;
our expectations regarding the availability of vessel acquisitions and our ability to complete acquisition transactions planned;
vessel breakdowns and instances of off-hire; and
drybulk shipping market trends, charter rates and factors affecting supply and demand.
We have based these statements on assumptions and analyses formed by applying our experience and perception of historical trends, current conditions, expected future developments and other factors we believe are appropriate in the circumstances. All future written and verbal forward-looking statements attributable to us or any person acting on our behalf are expressly qualified in their entirety by the cautionary statements contained
in or referred to in this section. We undertake no obligation, and specifically decline any obligation, except as required by law, to publicly update or revise any forward-looking statements, whether as a result of new information, future events or otherwise. In light of these risks, uncertainties and assumptions, the forward-looking events discussed in this annual report might not occur.
See “Item 3. Key Information—D. Risk Factors” for a more complete discussion of these risks and uncertainties and for other risks and uncertainties. These factors and the other risk factors described in this annual report are not necessarily all of the important factors that could cause actual results or developments to differ materially from those expressed in any of our forward-looking statements. Other unknown or unpredictable factors also could harm our results. Consequently, there can be no assurance that actual results or developments anticipated by us will be realized or, even if substantially realized, that they will have the expected consequences to, or effects on, us. Given these uncertainties, prospective investors are cautioned not to place undue reliance on such forward-looking statements.
PART I
PART I
| |
| ITEM 1. | IDENTITY OF DIRECTORS, SENIOR MANAGEMENT AND ADVISERS |
Not applicable.
|
| |
| ITEM 2. | OFFER STATISTICS AND EXPECTED TIMETABLE |
Not applicable.
Unless otherwise indicated, references to “Scorpio Bulkers,” the “Company,” “we,” “our,” “us” or similar terms refer to the registrant, Scorpio Bulkers Inc., and its subsidiaries, except where the context otherwise requires. We use the term deadweight tons, or dwt, expressed in metric tons, each of which is equivalent to 1,000 kilograms, in describing the size of our vessels. Unless otherwise indicated, all references to “U.S. dollars,” “dollars,” “U.S. $”
On December 31, 2015, we effected a one-for-twelve reverse stock split. All share and “$” inper share information throughout this annual report arehas been retroactively adjusted to reflect the lawful currencyreverse stock split. The par value was not adjusted as a result of the United States of America and references to “Norwegian Kroner” and “NOK” are to the lawful currency of Norway.reverse stock split.
| |
| A. | Selected Financial Data |
The
following table summarizes our selected
consolidated financialConsolidated Statements of Operations data and
other operatingthe Consolidated Balance Sheet data
at the dates andpresented for the
periods indicated. The selected consolidated financial data in the table as ofyears ended December 31,
20132016, 2015, 2014, and for the period from March 20, 2013 (date of inception) to December 31, 2013, are derived from our audited consolidated financial
statements and notes thereto for the period from March 20, 2013 (date of inception) to December 31, 2013 included elsewhere in this annual report, which have been prepared in accordance with U.S. GAAP.Our audited consolidated statements of operations, shareholders’ equity and cash flows for the period from March 20, 2013 (date of inception) to December 31, 2013, and the consolidated balance sheet at December 31, 2013, together with the notes thereto, are included elsewhere in this annual report. The followingstatements. Such selected financial data should be read in conjunctionconnection with “Item 5. Operating and Financial Review and Prospects,” the consolidated financial statements and related notes thereto, and other financial information included elsewherecontained in this annual report.
| | Period from March
20, 2013 (date of
inception) to
December 31, 2013 | |
In thousands of US dollars except per share and share data | | | | |
Consolidated Statement of Operations Data | | | | |
Revenue: | | | | |
Vessel revenue | | $ | — | |
| | | | |
Operating expenses: | | | | |
Voyage expenses | | | — | |
Vessel operating expenses | | | — | |
Depreciation and amortization | | | — | |
General and administrative expenses | | | 5,505 | |
Total operating expenses | | | 5,505 | |
| | | | |
Operating loss | | | (5,505 | ) |
| | | | |
Other income (expense): | | | | |
Interest income | | | 341 | |
Foreign exchange loss | | | (1,135 | ) |
Other expense, net | | | (8 | ) |
Total other loss | | | (802 | ) |
| | | | |
Net loss | | $ | (6,307 | ) |
| | | | |
Loss per common share- basic and diluted(1) | | $ | (0.16 | ) |
| | | | |
Weighted-average shares outstanding- basic and diluted(1) | | | 39,925,160 | |
| | | December 31, 2013 | |
| In thousands of US dollars | | | | |
| Balance Sheet Data | | | | |
| Cash and cash equivalents | | $ | 733,896 | |
| Vessels under construction | | | 371,692 | |
| Total assets | | | 1,105,684 | |
| Total shareholders’ equity | | | 1,104,212 | |
| | | Period from
March 20,
2013 (date of
inception) to
December 31,
2013 | |
| In thousands of US dollars | | | | |
| Cash Flow Data | | | | |
| Net cash used in operating activities | | $ | (2,237 | ) |
| Net cash used in investing activities | | | (371,692 | ) |
| Net cash provided by financing activities | | | 1,107,825 | |
|
| | | | | | | | | | | | | | | |
| | Year Ended December 31, | | Period from March 20, 2013 (date of inception) to December 31, |
| | 2016 | | 2015 | | 2014 | | 2013 |
| Dollars in thousands, except per share data | | | |
| | | | |
| Consolidated Statement of Operations Data: | | | |
| | | | |
| Total vessel revenue | $ | 78,402 |
| | $ | 62,521 |
| | $ | 48,987 |
| | $ | — |
|
| Total operating expenses | 179,133 |
| | 554,130 |
| | 166,475 |
| | 5,505 |
|
| Operating loss | (100,731 | ) | | (491,609 | ) | | (117,488 | ) | | (5,505 | ) |
| Total other loss | (24,104 | ) | | (19,180 | ) | | 923 |
| | (802 | ) |
| Net loss | $ | (124,835 | ) | | $ | (510,789 | ) | | $ | (116,565 | ) | | $ | (6,307 | ) |
| | | | | | | | |
| Basic weighted average shares outstanding | 56,174 |
| | 21,410 |
| | 11,466 |
| | 3,327 |
|
| Diluted weighted average shares outstanding | 56,174 |
| | 21,410 |
| | 11,466 |
| | 3,327 |
|
| | | | |
| | | | |
| Basic loss per share | $ | (2.22 | ) | | $ | (23.86 | ) | | $ | (10.17 | ) | | $ | (1.90 | ) |
| Diluted loss per share | $ | (2.22 | ) | | $ | (23.86 | ) | | $ | (10.17 | ) | | $ | (1.90 | ) |
|
| | | | | | | | | | | | | | | |
| | As of December 31, | | Period from March 20, 2013 (date of inception) to December 31, |
| Dollars in thousands | 2016 | | 2015 | | 2014 | | 2013 |
| Consolidated Balance Sheet Data: | | | |
| | | | |
| Cash and cash equivalents | $ | 101,734 |
| | $ | 200,300 |
| | $ | 272,673 |
| | $ | 733,896 |
|
| Assets held for sale | — |
| | 172,888 |
| | 43,781 |
| | — |
|
| Vessels, net | 1,234,081 |
| | 764,454 |
| | 66,633 |
| | — |
|
| Vessels under construction | 180,000 |
| | 288,282 |
| | 866,844 |
| | 371,692 |
|
| Total assets | 1,547,157 |
| | 1,473,093 |
| | 1,321,024 |
| | 1,105,684 |
|
| Current liabilities (including current portion of bank loans) | 24,550 |
| | 124,577 |
| | 20,265 |
| | 1,472 |
|
| Bank loans | 493,793 |
| | 342,314 |
| | 29,549 |
| | — |
|
| Senior Notes | 72,199 |
| | 71,671 |
| | 71,222 |
| | — |
|
| Total liabilities | 590,542 |
| | 538,562 |
| | 121,036 |
| | 1,472 |
|
| Shareholders’ equity | 956,615 |
| | 934,531 |
| | 1,199,988 |
| | 1,104,212 |
|
Pursuant to ASU 2015-03, “Simplifying the Presentation of Debt Issuance Costs”, we reclassified unamortized debt issuance costs of $12.3 million and $3.2 million as of December 31, 2015 and 2014, respectively, from Deferred financing costs, net to a reduction in both current and non-current Bank loans, net in the Consolidated Balance Sheet.
| (1) | Diluted weighted-average shares outstanding, which would include the impact of restricted shares, for the period from March 20, 2013 (date of inception) to December 31, 2013 would be anti-dilutive since the Company is in a net loss position. As such, there is no difference between basic and diluted earnings per share for this period. |
| B. | Capitalization and Indebtedness |
Not applicable.
| |
| C. | Reasons for the Offer and Use of Proceeds |
Not applicable.
The following risks relate principally to the industry in which we operate and our business in general. Other risks relate principally to the securities market and ownership of our
securities, including our common
shares.shares and our 7.50% Senior Notes due 2019, which we refer to as our Senior Notes. The occurrence of any of the events described in this section could significantly and negatively affect our business, financial condition, operating results or cash available for
the payment of dividends
on our common shares and interest on our Senior Notes, or the trading price of our
common shares.securities.
INDUSTRY SPECIFIC RISK FACTORS
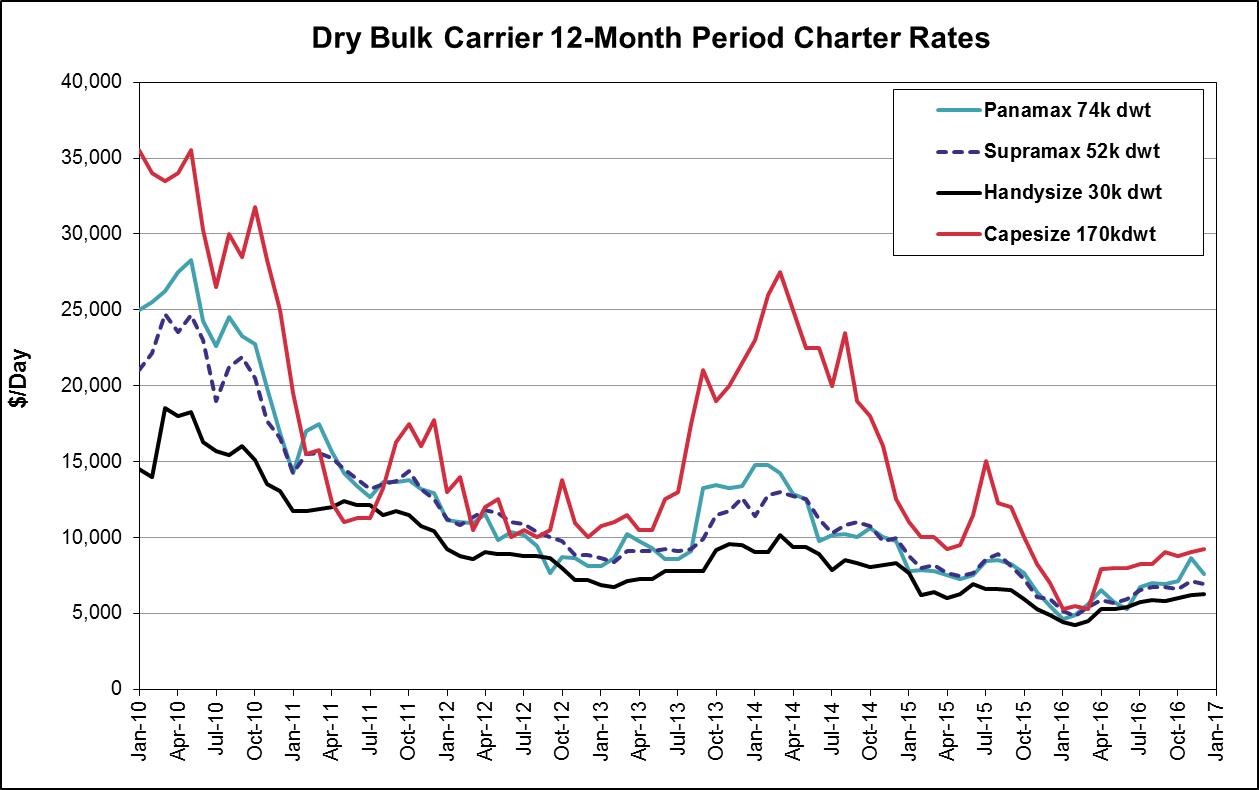
Charter hire rates for drybulk vessels are volatile and have declined significantly since their historic highs and may remain at low levels or decrease in the future, which may adversely affect our earnings, revenue and profitability and our ability to comply with our loan covenants.
The drybulk shipping industry is cyclical with high volatility in charter hire rates and profitability. The degree of charter hire rate volatility among different types of drybulk vessels has varied widely; however, the continued downturn in the drybulk charter market has severely affected the entire drybulk shipping industry and charter hire rates for drybulk vessels have declined significantly from historically high levels.
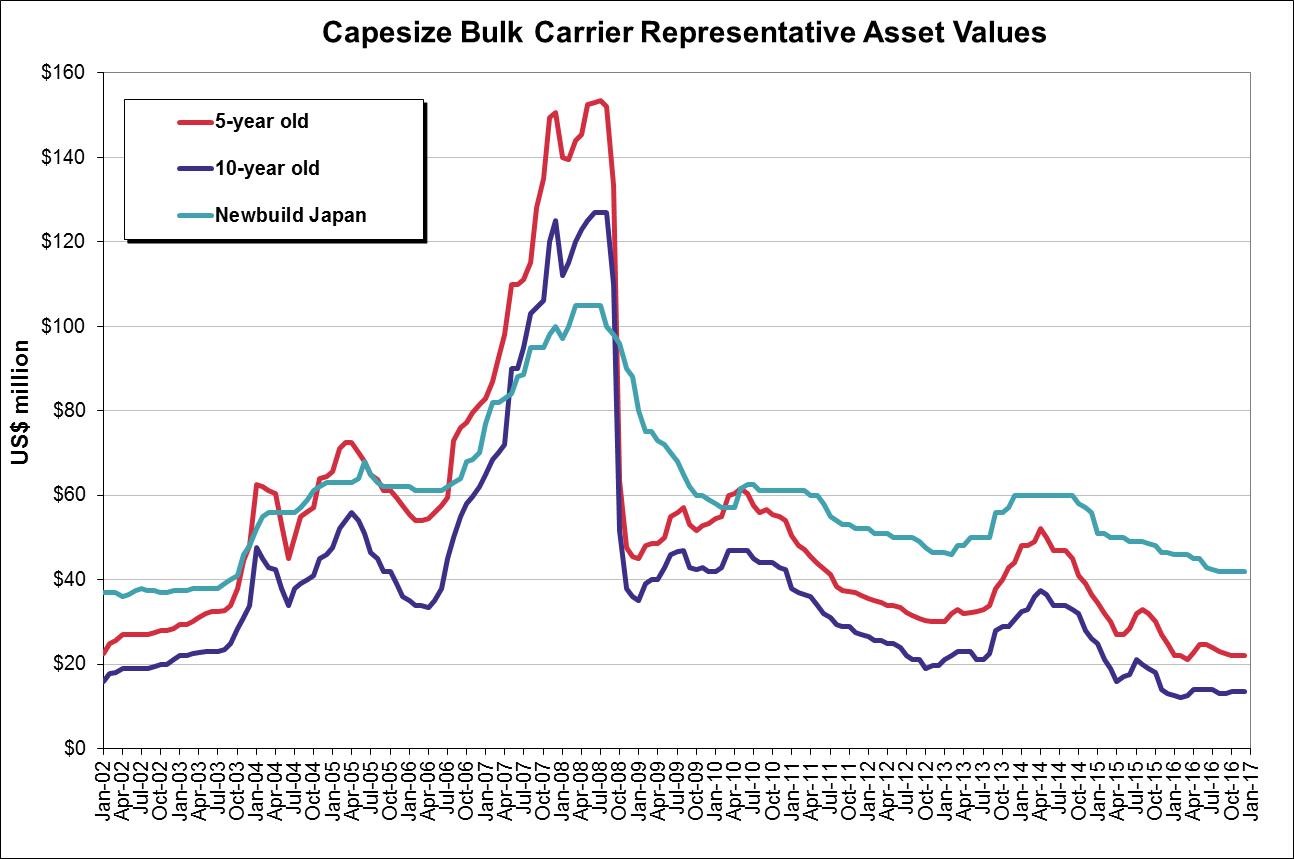
In the past, time charter and spot market charter rates for drybulk carriers have declined below operating costs of vessels. The Baltic Dry Index, or the BDI, a daily average of charter rates for key drybulk routes published by the Baltic Exchange Limited, which has long been viewed as the main benchmark to monitor the movements of the drybulk vessel charter market and the performance of the entire drybulk shipping market, declined 94%
in 2008 from
a peakits high of
11,793almost 12,000 in May
2008 to a low of 663 in December 2008 and has remained volatile since then.
The BDI recorded a record low of 647 in February 2012. During
2013,the year ended December 31, 2016, the BDI
remained volatile, ranging fromfluctuated in a
lowrange between 290, the lowest level it has ever reached, and 1,257. As of
698 in January to a high of 2,337 in December, before endingFebruary 3, 2017, the
year at 2,277. The BDI
has since decreased to 1,481 as of March 17, 2014.was 752.
Fluctuations in charter rates result from changes in the supply of and demand for vessel capacity and changes in the supply of and demand for the major commodities carried by water internationally. Because the factors affecting the supply of and demand for vessels are outside of our control and are unpredictable, the nature, timing, direction and degree of changes in industry
conditions are also unpredictable. Since we
intend toprimarily charter all our vessels
principally in the spot market we
will beare exposed to the cyclicality and volatility of the spot market.
WeSpot market charterhire rates may fluctuate significantly based upon available charters and the supply of and demand for seaborne shipping capacity, and we may be unable to keep our vessels fully employed in these short-term
markets ormarkets. Alternatively, charter rates available in the spot market may be insufficient to enable our vessels to
be operatedoperate profitably. A significant decrease in charter rates would affect asset values and adversely affect our profitability, cash flows and ability to pay dividends, if
any.any, in the future, on our common shares, and interest on our Senior Notes. Furthermore, a significant decrease in charter rates would cause asset values to decline, or decline further, and we may have to record an impairment charge in our consolidated financial statements which could adversely affect our financial results.
Factors that influence demand for drybulk vessel capacity include:
| ● | supply of and demand for energy resources, commodities and industrial products; |
| ● | changes in the exploration or production of energy resources, commodities, consumer and industrial products; |
| ● | the location of regional and global exploration, production and manufacturing facilities; |
| ● | the location of consuming regions for energy resources, commodities, consumer and industrial products; |
| ● | the globalization of production and manufacturing; |
| ● | global and regional economic and political conditions, including armed conflicts and terrorist activities; embargoes and strikes; |
| ● | developments in international trade; |
| ● | changes in seaborne and other transportation patterns, including the distance cargo is transported by sea; |
| ● | environmental and other regulatory developments; |
| ● | currency exchange rates; and |
supply of and demand for energy resources, commodities and industrial products; changes in the exploration or production of energy resources, commodities, consumer and industrial products;
the location of regional and global production and manufacturing facilities;
the location of consuming regions for energy resources, commodities, consumer and industrial products;
the globalization of production and manufacturing;
global and regional economic and political conditions, including armed conflicts and terrorist activities, embargoes and strikes;
natural disasters;
disruptions and developments in international trade;
changes in seaborne and other transportation patterns, including the distance cargo is transported by sea;
environmental and other regulatory developments;
currency exchange rates; and
weather.
Factors that influence the supply of
drybulk vessel capacity include:
| ● | the number of newbuilding deliveries; |
| ● | port and canal congestion; |
| ● | the scrapping of older vessels; |
| ● | the number of vessels that are out of service, namely those that are laid-up, drydocked, awaiting repairs or otherwise not available for hire. |
the number of newbuilding orders and deliveries, including slippage in deliveries;
the number of shipyards and ability of shipyards to deliver vessels;
port and canal congestion;
the scrapping rate of older vessels;
speed of vessel operation;
vessel casualties; and
the number of vessels that are out of service, namely those that are laid-up, drydocked, awaiting repairs or otherwise not available for hire.
In addition to the prevailing and anticipated freight rates, factors that affect the rate of newbuilding, scrapping and laying-up include newbuilding prices, secondhand vessel values in relation to scrap prices, costs of bunkers and other operating costs, costs associated with classification society surveys, normal maintenance and insurance coverage
costs, the efficiency and age profile of the existing drybulk fleet in the market and government and industry regulation of maritime transportation practices, particularly environmental protection laws and regulations. These factors influencing the supply of and demand for shipping capacity are outside of our control, and we may not be able to correctly assess the nature, timing and degree of changes in industry conditions.
We anticipate that the future demand for our drybulk vessels will be dependent upon economic growth in the world’s economies, including China and India, seasonal and regional changes in demand, changes in the capacity of the global drybulk fleet and the sources and supply of drybulk cargo to be transported by sea.
Given the number of new drybulk carriers currently on order with the shipyards, the capacity of the global drybulk carrier fleet seems likely to increase and there can be no assurance as to the timing or extent of future economic growth. Adverse economic, political, social or other developments could have a material adverse effect on our business and operating results.
Global economic conditions may continue to negatively impact the drybulk shipping industry.
In the
current global economy, operating businesses have recently faced tightening credit, weakening demand for goods and services, weak international liquidity conditions, and declining markets.
LowerIn particular, lower demand for drybulk cargoes as well as diminished trade credit available for the delivery of such cargoes have led to decreased demand for drybulk carriers, creating downward pressure on charter rates and vessel values. The relatively weak global economic conditions have and may continue to have a number of adverse consequences for drybulk and other shipping sectors, including, among other things:
| ● | low charter rates, particularly for vessels employed on short-term time charters or in the spot market; |
| ● | decreases in the market value of drybulk vessels and limited second-hand market for the sale of vessels; |
| ● | limited financing for vessels; |
| ● | widespread loan covenant defaults; and |
| ● | declaration of bankruptcy by certain vessel operators, vessel owners, shipyards and charterers. |
low charter rates, particularly for vessels employed on short-term time charters or in the spot market;
decreases in the market value of drybulk vessels and limited second-hand market for the sale of vessels;
limited financing for vessels;
widespread loan covenant defaults; and
declaration of bankruptcy by certain vessel operators, vessel owners, shipyards and charterers.
The occurrence of one or more of these events could have a material adverse effect on our business, results of operations, cash flows and financial condition.
The current state of global financial markets and current
Weak economic conditions may adversely impactthroughout the world, in particular in China and the rest of the Asia-Pacific region, could negatively affect our results of operations, financial condition, cash flows and ability to obtain financing, and may adversely affect the market price of our common shares.
Negative trends in the global economy that emerged in 2008 continue to adversely affect global economic conditions. In addition, the world economy is currently facing a number of new challenges, recent turmoil and hostilities in various regions, including Russia, Syria, Iraq, North Africa, and North Korea. The weakness in the global economy has caused, and may continue to cause, a decrease in worldwide demand for certain goods, and, thus, shipping. Continuing economic instability could have a material adverse effect on our ability to implement our business strategy.
The United States, the European Union and other parts of the world exhibited weak economic trends. The credit markets in the United States and Europe have experienced significant contraction, deleveraging and reduced liquidity, and the U.S. federal and state governments and European authorities have implemented and are considering a broad variety of governmental action and/or
refinance our futurenew regulation of the financial markets and may implement additional regulations in the future. Securities and futures markets and the credit
facilities on acceptable terms, whichmarkets are subject to comprehensive statutes, regulations and other requirements. The Securities and Exchange Commission, or the SEC, other regulators, self-regulatory organizations and exchanges are authorized to take extraordinary actions in the event of market emergencies, and may
hindereffect changes in law or
prevent us from operating or expanding our business.interpretations of existing laws.
Global financial markets and economic conditions have been, and continue to be volatile.
Credit markets and the debt and equity capital markets have been distressed and the uncertainty surrounding the future of the global credit markets has resulted in reduced access to credit worldwide. These issues, along with significant write-offs in the financial services sector, the re-pricing of credit risk and the current weak economic conditions, have made, and will likely continue to make, it difficult to obtain additional financing.
TheIn addition, the current state of global financial markets and current economic conditions might adversely impact our ability to issue additional equity at prices which will not be dilutive to our existing shareholders or preclude us from issuing equity at all.
Also, as a result of concerns about the stability of financial markets generally and the solvency of counterparties specifically, the cost of obtaining money from the credit markets has increased as many lenders have increased interest rates, enacted tighter lending standards, refused to refinance existing debt at all or on terms similar to current debt and reduced, and in some cases ceased, to provide funding to borrowers. Due to these factors, we cannot be certain that financing will be available to the extent required, or that we will be able to refinance our future credit facilities, on acceptable terms or at all. If financing or refinancing is not available when needed, or is available only on unfavorable terms, we may be unable to meet our obligations as they come due or we may be unable to enhance our existing business, complete the acquisition of our newbuildings and additional vessel acquisitions or otherwise take advantage of business opportunities as they arise.
If economic conditions throughout the world do not improve, it may impede our results of operations, financial condition and cash flows, and may adversely affect the market price of our common shares.
Negative trends in the global economy that emerged in 2008 continue to adversely affect global economic conditions. In addition, the world economy is currently facing a number of new challenges, recent turmoil and hostilities in Crimea, the Middle East, including Syria, North Korea, North Africa and other geographic areas and countries. The weakness in the global economy has caused, and may continue to cause, a decrease in worldwide demand for certain goods and, thus, shipping. Continuing economic instability could have a material adverse effect on our ability to implement our business strategy.
We face risks attendant to changes in economic environments, changes in interest rates, and instability in the banking and securities markets around the world, among other factors. Major market disruptions and the current adverse changes in market conditions and regulatory climate in the United States and worldwide may adversely affect our business or impair our ability to borrow amounts under credit facilities or any future financial arrangements. The recent and developing economic and governmental factors, together with
the possible further declines in charter rates and vessel values, may have a material adverse effect on our results of operations, financial condition or cash flows, or the trading price of our common shares.
Continued economic slowdown in the Asia Pacific region, particularly in China, may exacerbate the effect on us, as we anticipate a significant number of the port calls made by our vessels will continue to involve the loading or discharging of drybulk commodities in ports in the Asia Pacific region. Before the global economic financial crisis that began in 2008, China had one of the world’s fastest growing economies in terms of
gross domestic product, GDP, which had a significant impact on shipping demand. The growth rate of China’s GDP is estimated to have decreased
for the fourth year in a row to approximately
7.7%6.7% for the year ended December 31,
2013, as compared to 7.8%2016, which is China’s lowest growth rate for the
year ended December 31, 2012,past five years, and continues to remain below pre-2008 levels.
China has recently imposed measures to restrain lending, which may further contribute to a slowdown in its economic growth. It is possible that China and other countries in the Asia Pacific region will continue to experience slowed or even negative economic growth in the
near future. Moreover, the current economic slowdown in the economies of the United States, the European Union and other Asian countries may further adversely affect economic growth in China and elsewhere. Our business, financial condition and results of operations, ability to pay dividends, if any, as well as our future prospects, will likely be materially and adversely affected by a further economic downturn in any of these
countries.countries or geographic regions.
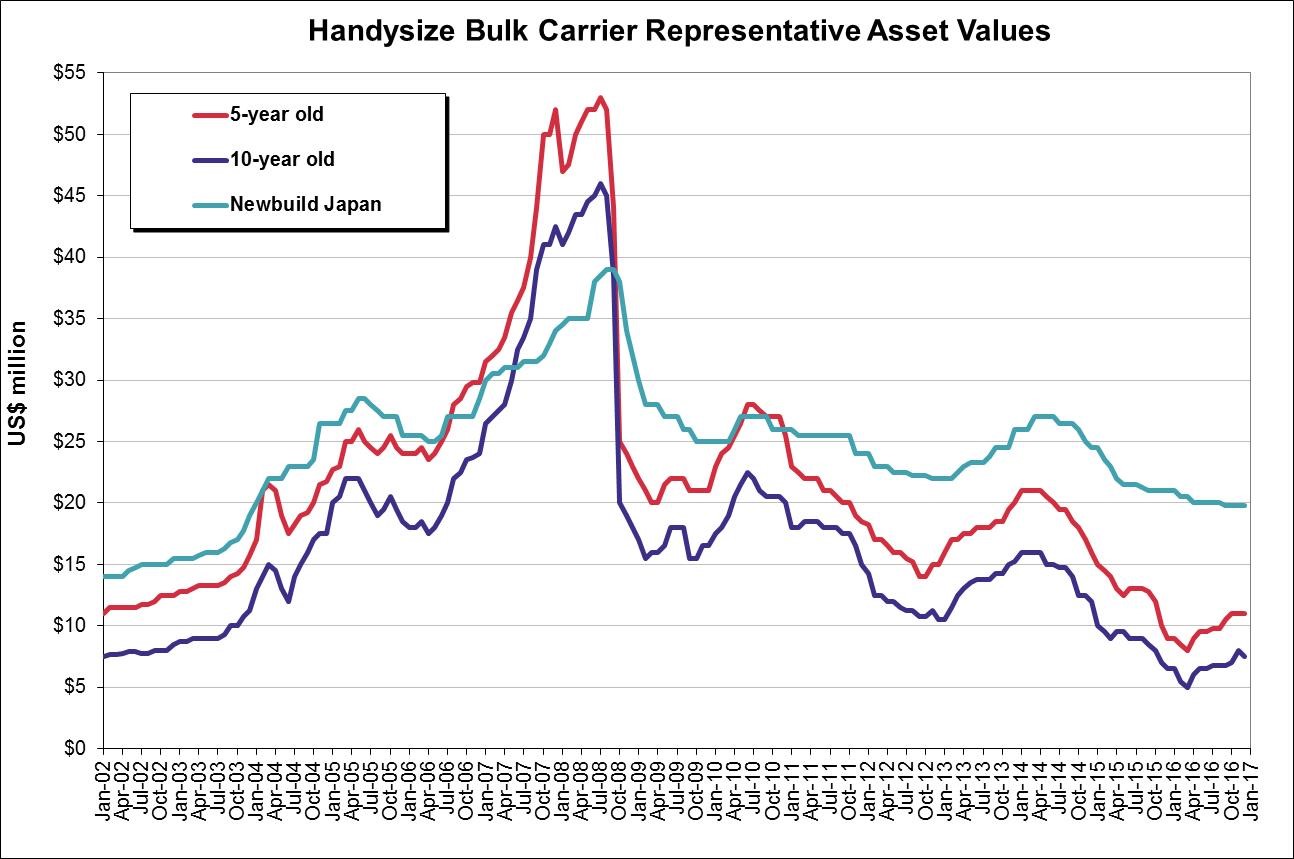
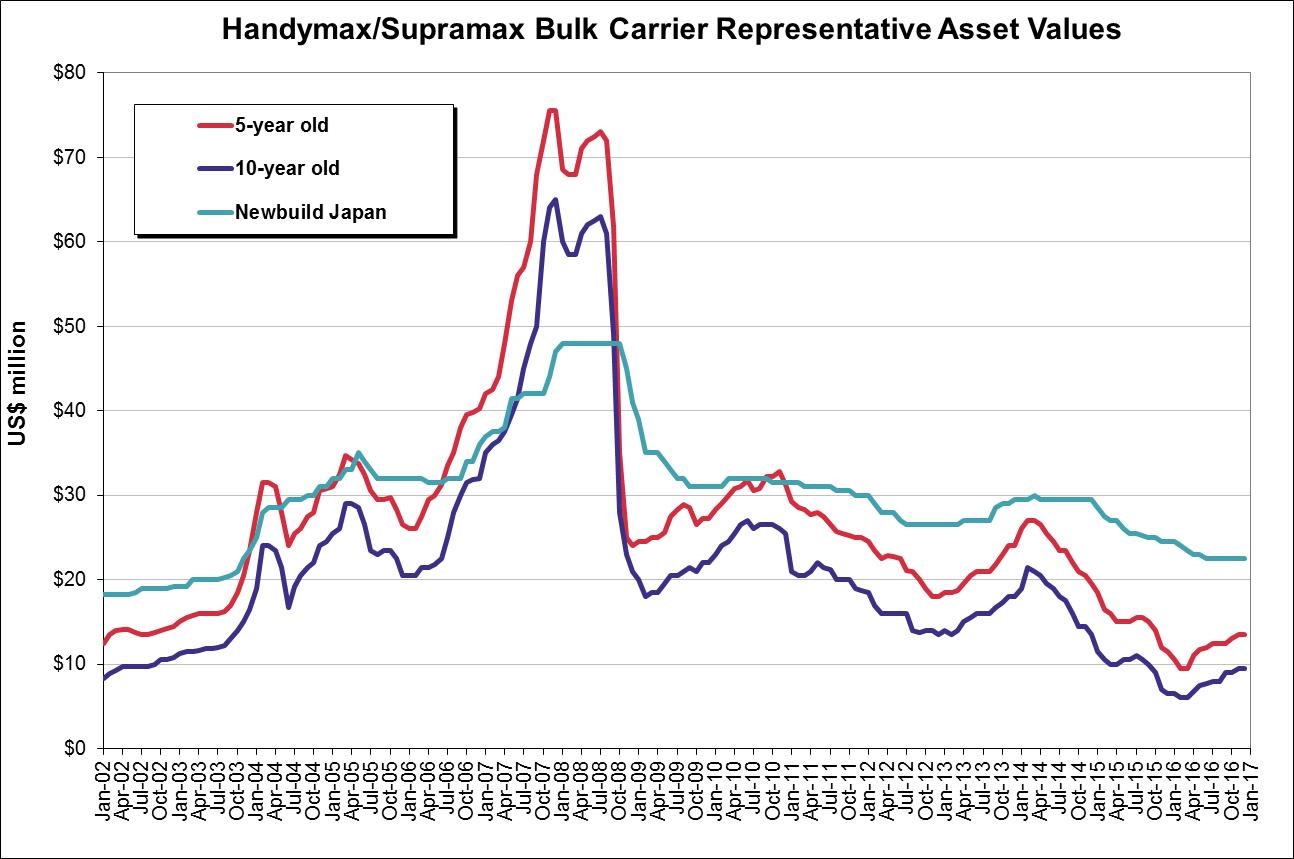
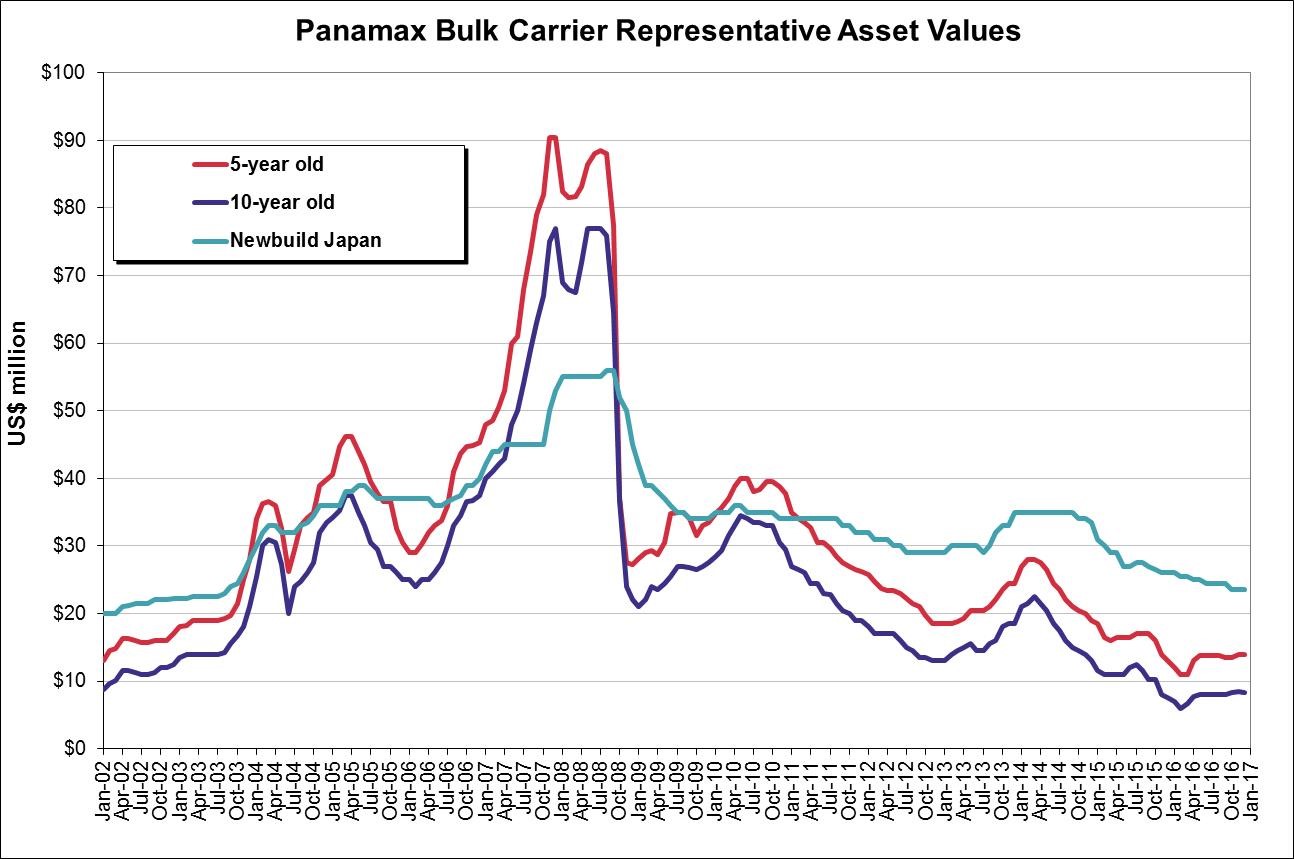
The
fair market values of our vessels
have declined and may decline
further, which could limit the amount of funds that we can borrow, cause us to breach certain financial covenants in our
future credit facilities, or result in an impairment charge, and we may incur a loss if we sell vessels following a decline in their market value.
The fair market values of drybulk
vessels, including our vessels, have generally experienced high volatility and have recently declined significantly.
Although we believe that we have contracted to purchase our initial 79 vessels, which we refer to as our Newbuilding Program, at attractive times in the cycle, theThe fair market value of our vessels may continue to fluctuate depending on a number of factors, including:
| ● | prevailing level of charter rates; |
| ● | general economic and market conditions affecting the shipping industry; |
| ● | types, sizes and ages of vessels; |
| ● | supply of and demand for vessels; |
| ● | other modes of transportation; |
| ● | governmental or other regulations; |
| ● | the need to upgrade vessels as a result of charterer requirements, technological advances in vessel design or equipment or otherwise; and |
prevailing level of charter rates; general economic and market conditions affecting the shipping industry;
types, sizes and ages of vessels;
supply of and demand for vessels;
other modes of transportation;
cost of newbuildings;
governmental or other regulations;
the need to upgrade vessels as a result of charterer requirements, technological advances in vessel design or equipment or otherwise;
technological advances; and
competition from other shipping companies and other modes of transportation.
If the fair market values of our vessels decline,
or decline further, the amount of funds we may
draw downdrawdown under
theour secured credit facilities
we expect to enter into may be limited and we may not be in compliance with certain covenants contained in
thoseour secured credit facilities, which may result in an event of default. In such circumstances, we may not be able to refinance our debt or obtain additional financing. If we are not able to comply with the covenants in our secured credit facilities, and are unable to remedy the relevant breach, our lenders could accelerate our debt and foreclose on our fleet. In addition, if we sell one or more of our vessels at a time when vessel prices have fallen,
and before we have recorded an impairment adjustment to our consolidated financial statements, the sale may be less than the vessel’s carrying value on our consolidated financial statements, resulting in a loss and a reduction in earnings.
Furthermore, if vessel values decline, we may have to record an impairment charge in our consolidated financial statements which could adversely affect our financial results.Conversely, if vessel values are elevated at a time when we wish to acquire additional vessels, the cost of such acquisitions may increase and this could adversely affect our business, results of operations, cash flow and financial condition.
Compliance with safety
A further reduction in charter rates and other
vessel requirements imposed by classification societiesmarket deterioration may require us to record impairment charges related to our long-lived assets (our vessels) and such charges may be
very costlylarge and
may adversely affecthave a material impact on our
business.The hullconsolidated financial statements.
At December 31, 2016, we had vessels and machineryvessels under construction of every commercial vessel must$1.4 billion in total on our consolidated balance sheet, representing 148% of our shareholders’ equity. Additionally, as of December 31, 2016, we had $18.6 million of installment payments due on our existing newbuilding contracts, of which $17.2 million remains to be classed bypaid.
Our vessels are assessed annually for impairment in the fourth quarter and between annual tests if an event occurs or circumstances change that would more likely than not reduce the fair value of our vessels and vessels under construction below its carrying value. As of December 31, 2016, we have determined that the estimated undiscounted future cash flows (as determined under U.S. GAAP) of our vessels exceeded the carrying value. However, if there is a
classification society authorized by its country of registry. The classification society certifies that a vessel is safe and seaworthyfurther reduction in
accordance with the applicable rules and regulations of the country of registry of the vessel and the Safety of Life at Sea Convention.A vessel must undergo annual surveys, intermediate surveys and special surveys. In lieu of a special survey, a vessel’s machineryour charter rates, we may be on a continuous survey cycle under which the machinery would be surveyed periodically over a five-year period. Every vessel is also required to be drydocked every tworecord impairment charges on our vessels and vessels under construction, which would require us to write down the carrying value of these assets to their fair value. Since vessels and vessels under construction comprise a half to five years for inspectionsubstantial portion of its underwater parts.
Compliance with the above requirements following the delivery of vessels may result in significant expense. If any vessel does not maintain its class or fails any annual, intermediate or special survey, the vessel will be unable to trade between ports and will be unemployable and uninsurable, whichour balance sheet, such charges could negativelyhave a material impact on our results of operations andconsolidated financial condition.
statements.
We are subject to complex laws and regulations, including environmental regulations that can adversely affect the cost, manner or feasibility of doing business.
Our operations are subject to numerous international, national, state and local laws, regulations, treaties and conventions in force in international waters and the jurisdictions in which our vessels operate or are registered, which can significantly affect the ownership and operation of our vessels. These laws and regulations include, but are not limited to, the U.S. Oil Pollution Act of 1990, or OPA, the Comprehensive Environmental Response, Compensation and Liability Act, or CERCLA, the U.S. Clean Air Act, the U.S. Clean Water Act, or the CWA, and the U.S. Maritime Transportation Security Act of 2002, or the MTSA, and regulations of the International Maritime Organization, or IMO, including the International Convention for the Prevention of Pollution from Ships of 1975,1973 (as from time to time amended and generally referred to as MARPOL) including the International Convention fordesignation of Emission Control Areas, or ECAs, thereunder, the Prevention of Marine Pollution of 1973, the IMO International Convention for the Safety of Life at Sea of 1974 (as from time to time amended and generally referred to as SOLAS), the International Convention on Civil Liability for Bunker Oil Pollution Damage, and the International Convention on Load Lines of 1966. 1966 (as from time to time amended), or the LL Convention.
Compliance with such laws, regulations and standards, where applicable, may require installation of costly equipment or implementation of operational changes and may affect the resale value or useful lives of our vessels. These costs could have a material adverse effect on our business, results of operations, cash flows and financial condition. A failure to comply with applicable laws and regulations may result in administrative and civil penalties, criminal sanctions or the suspension or termination of our operations. Because such conventions, laws, and regulations are often revised, we cannot predict the ultimate cost of complying with them or the impact thereof on the resale prices or useful lives of our vessels. Additional conventions, laws and regulations may be adopted which could limit our ability to do business or increase the cost of our doing business and which may materially adversely affect our operations.
For example, the International Convention for the Control and Management of Ships’ Ballast Water and Sediments, or the BWM Convention, adopted by the UN International Maritime Organization in February 2004, calls for the phased introduction of mandatory reducing living organism limits in ballast water over time (as discussed further below). In order to comply with these living organism limits, vessel owners may have to install expensive ballast water treatment systems or make port facility disposal arrangements and modify existing vessels to accommodate those systems. The BWM Convention enters in force on September 8, 2017 and while we believe that our vessels have been fitted with systems that will comply with the standards, we cannot be assured that these systems will be approved by the regulatory bodies of every jurisdiction in which we may wish to conduct our business. If they are not approved it could have an adverse material impact on our business, financial condition, and results of operations depending on the available ballast water treatment systems and the extent to which existing vessels must be modified to accommodate such systems.
Environmental laws often impose strict liability for remediation of spills and releases of oil and hazardous substances, which could subject us to liability without regard to whether we were negligent or at fault. Under OPA, for example, owners, operators and bareboat charterers are jointly and severally strictly liable for the discharge of oil within the 200-mile exclusive economic zone around the United States.
Furthermore, the 2010 explosion of theDeepwater Horizon well and the subsequent release of oil into the Gulf of Mexico, or other similar events, may result in further regulation of the shipping industry, and modifications to statutory liability schemes, which could have a material adverse effect on our business, financial condition, results of operations and cash flows. An oil spill could result in significant liability, including fines, penalties and criminal liability and remediation costs for natural resource damages under other federal, state and local laws, as well as third-party damages.We are required by various governmental and quasi-governmental agencies to obtain certain permits, licenses, and certificates with respect to our operations, and satisfy insurance and financial responsibility requirements for potential oil (including marine fuel) spills and other pollution incidents. Although we
will, when available, arrangehave insurance to cover certain environmental risks, there can be no assurance that such insurance will be sufficient to cover all such risks or that any claims will not have a material adverse effect on our business, results of operations, cash flows and financial condition and our ability to pay dividends, if any, in the
future.future, on our common shares, and interest on our Senior Notes. An over-supply of drybulk carrier capacity may prolong or further depress the current low charter rates, which may limit our ability to operate our drybulk carriers profitably.
The supply of drybulk vessels has increased significantly since the beginning of 2006.
AsAccording to SSY, as of
September 2013,December 2016, newbuilding orders have been placed for approximately
15.7%9.8% of the existing fleet capacity. Vessel supply growth has been outpacing vessel demand growth over the past few years causing downward pressure on charter rates. Until the new supply is fully absorbed by the market, charter rates may continue to be under pressure due to vessel supply in the near to medium term.
Since our fleet will be employed primarily in spot market-oriented pools, voyage charters and short-term charters, we remain exposed to the spot market.World events could affect our results of operations and financial condition.
Past terrorist attacks, as well as the threat of future terrorist attacks around the world, continue to cause uncertainty in the world’s financial markets and may affect our business, operating results and financial condition. Continuing conflicts and recent developments in Russia,
Ukraine and Crimea, the Korean Peninsula,North Korea, the Middle East, including
Iran, Iraq, Syria, Egypt and North Africa, and the presence of U.S. or other armed forces in the Middle East, may lead to additional acts of terrorism and armed conflict around the world, which may contribute to further economic instability in the global financial markets. These uncertainties could also adversely affect our ability to obtain additional financing on terms acceptable to us or at all. In the past, political conflicts have also resulted in attacks on vessels, mining of waterways and other efforts to disrupt international shipping, particularly in the Arabian Gulf region. Acts of terrorism and piracy have also affected vessels trading in regions such as the South China Sea,
and the Gulf of Aden off the coast of
Somalia.Somalia and West Africa. Any of these occurrences could have a material adverse impact on our operating results, revenues and costs.
Acts of piracy on ocean-going vessels have had and may continue to have an adverse effect on our business.
Acts of piracy have historically affected ocean-going vessels trading in regions of the world such as the South China Sea, the Indian Ocean and in the Gulf of Aden off the coast of Somalia. Although the frequency of sea piracy worldwide decreased during 2012 and 2013 to its lowest level since 2009, seaSea piracy incidents continue to occur, particularly in the Gulf of Aden off the coast of Somalia, and increasingly in the Gulf of Guinea and the West Coast of Africa, with drybulk vessels particularly vulnerable to such attacks. If these piracy attacks result in regions in which our vessels are deployed being characterized as “war risk” zones by insurers as the Gulf of Aden temporarily was in May 2008, or Joint War Committee “war and strikes” listed areas, premiums payable for such coverage could increase significantly and such insurance coverage may be more difficult to obtain. In addition, crew costs, including due to employing onboard security guards, could increase in such circumstances. Furthermore, while we believe the charterer remains liable for charter payments
when a vessel is seized by pirates, the charterer may dispute this and withhold charter hire until the vessel is released. A charterer may also claim that a vessel seized by pirates was not “on-hire” for a certain number of days and is therefore entitled to cancel the charter party, a claim that we would dispute. We may not be adequately insured to cover losses from these incidents, which could have a material adverse effect on us. In addition, any detention hijacking as a result of an act of piracy against our vessels, or an increase in cost, or unavailability, of insurance for our vessels, could have a material adverse impact on our business, financial condition and results of operations.
Our vessels may call on ports located in countries that are subject to restrictions imposed by the U.S. or other governments,
thatwhich could adversely affect our reputation and the market for our common shares.
Although we do not expect
that our vessels will call on ports located in countries subject to sanctions and embargoes imposed by the U.S. government and other authorities or countries identified by the U.S. government or other authorities as state sponsors of terrorism, such as
Cuba, Iran, Sudan and Syria, from time to time on charterers’ instructions, our vessels may call on ports located in such countries in the future. The U.S. sanctions and embargo laws and regulations vary in their application, as they do not all apply to the same covered persons or proscribe the same activities, and such sanctions and embargo laws and regulations may be amended or strengthened over time. In 2010, the U.S. enacted the Comprehensive Iran Sanctions Accountability and Divestment Act, or CISADA, which amended the Iran Sanctions Act. Among other things, CISADA introduced limits on the ability of companies and persons to do business or trade with Iran when such activities relate to the investment, supply or export of refined petroleum or petroleum products. In 2012, President Obama signed Executive Order 13608 which prohibits foreign persons from violating or attempting to violate, or causing a violation of any sanctions in effect against Iran or facilitating any deceptive transactions for or on behalf of any person subject to U.S. sanctions. Any persons found to be in violation of Executive Order 13608 will be deemed a foreign sanctions evader and will be banned from all contacts with the United States, including conducting business in U.S. dollars. Also in 2012, President Obama signed into law the Iran Threat Reduction and Syria Human Rights Act of 2012, or the Iran Threat Reduction Act, which created new sanctions and strengthened existing sanctions. Among other things, the Iran Threat Reduction Act intensifies existing sanctions regarding the provision of goods, services, infrastructure or technology to Iran’s petroleum or petrochemical sector. The Iran Threat Reduction Act also includes a provision requiring the President of the United States to impose five or more sanctions from Section 6(a) of the Iran Sanctions Act, as amended, on a person the President determines is a controlling beneficial owner of, or otherwise owns, operates, or controls or insures a vessel that was used to transport crude oil from Iran to another country and (1) if the person is a controlling beneficial owner of the vessel, the person had actual knowledge the vessel was so used or (2) if the person otherwise owns, operates, or controls, or insures the vessel, the person knew or should have known the vessel was so used. Such a person could be subject to a variety of sanctions, including exclusion from U.S. capital markets, exclusion from financial transactions subject to U.S. jurisdiction, and exclusion of that person’s vessels from U.S. ports for up to two years.
On November 24, 2013, the P5+1 (the United States, United Kingdom, Germany, France, Russia and China) entered into an interim agreement with Iran entitled the “Joint Plan of Action” (“JPOA”)., or the JPOA. Under the JPOA it was agreed that, in exchange for Iran taking certain voluntary measures to ensure that its nuclear program is used only for peaceful purposes, the U.S. and EU would voluntarily suspend certain sanctions for a period of six months. On January 20, 2014, the U.S. and E.U. indicated that they would begin implementing the temporary relief measures provided for under the JPOA. These measures include,included, among other things, the suspension of certain sanctions on the Iranian petrochemicals, precious metals, and automotive industries from January 20, 2014 until July 20, 2014. Although it is our intention to comply withThe JPOA was subsequently extended twice.
On July 14, 2015, the
provisions of the JPOA, there can be no assurance that we will be in compliance in the future as such regulations and U.S. sanctions may be amended over time,P5+1 and the
EU announced that they reached a landmark agreement with Iran titled the Joint Comprehensive Plan of Action Regarding the Islamic Republic of Iran’s Nuclear Program, or the JCPOA, which is intended to significantly restrict Iran’s ability to develop and produce nuclear weapons for 10 years while simultaneously easing sanctions directed toward non-U.S. persons for conduct involving Iran, but taking place outside of U.S.
retainsjurisdiction and does not involve U.S. persons. On January 16, 2016, which we refer to as Implementation Day, the
authority to revokeUnited States joined the
aforementioned relief ifEU and the UN in lifting a significant number of their nuclear-related sanctions on Iran
fails to meetfollowing an announcement by the International Atomic Energy Agency, or the IAEA, that Iran had satisfied its
commitmentsrespective obligations under the
JPOA.JCPOA.
Although we believe that we are in compliance with all applicable sanctions and embargo laws and regulations, and intend to maintain such compliance, there can be no assurance that we will be in compliance in the future, particularly as the scope of certain laws may be unclear and may be subject to changing interpretations. Any such violation could result in fines or other penalties and could severely impact our ability to access U.S. capital markets and conduct our business, and could result in some investors deciding, or being required, to divest their interest, or not to invest, in us. In addition, certain institutional investors may have investment policies or restrictions that prevent them from holding securities of companies that have contracts with countries identified by the U.S. government as state sponsors of terrorism. The determination by these investors not to invest in, or to divest from, our common sharessecurities may adversely affect the price at which our common sharessecurities trade. Moreover, our charterers may violate applicable sanctions and embargo laws and regulations as a result of actions that do not involve us or our vessels, and those violations could
in turn negatively affect our reputation. In addition, our reputation and the market for our securities may be adversely affected if we engage in certain other activities, such as entering into charters with individuals or entities in countries subject to U.S. sanctions and embargo laws that are not controlled by the governments of those countries, or engaging in operations associated with those countries pursuant to contracts with third parties that are unrelated to those countries or entities controlled by their governments. Investor perception of the value of our
common sharessecurities may be adversely affected by the consequences of war, the effects of terrorism, civil unrest and governmental actions in these and surrounding countries.
Our operating results will be subject to seasonal fluctuations, which could affect our operating results.
We operate our vessels in markets that have historically exhibited seasonal variations in demand and, as a result, in charter hire rates. This seasonality may result in volatility in our operating results to the extent that we enter into new charter agreements or renew existing agreements during a time when charter rates are weaker or we operate our vessels on the spot market or index based time charters, which may result in quarter-to-quarter volatility in our operating results. The drybulk sector is typically stronger in the fall and winter months in anticipation of increased consumption of coal and other raw materials in the northern hemisphere.
The celebration of Chinese New Year in the first quarter of each year, also results in lower volumes of seaborne trade into China during this period. In addition, unpredictable weather patterns in these months tend to disrupt vessel scheduling and supplies of certain commodities. As a result, our revenues from our drybulk carriers may be weaker during the fiscal quarters ended June 30 and September 30, and, conversely, our revenues from our drybulk carriers may be stronger in fiscal quarters ended December 31 and March 31.
We are subject to international safety regulations and
requirements imposed by our classification societies and the failure to comply with these regulations
and requirements may subject us to increased liability, may adversely affect our insurance coverage and may result in a denial of access to, or detention in, certain ports.
The operation of our vessels is affected by the requirements set forth in
the International Management Code for the Safe Operation of Ships and for Pollution Prevention, or the ISM Code. The ISM Code requires ship owners, ship managers and bareboat charterers to develop and maintain an extensive “Safety Management System” that includes the adoption of a safety and environmental protection policy setting forth instructions and procedures for safe operation of vessels and describing procedures for dealing with emergencies. In addition, vessel classification societies impose significant safety and other requirements on our vessels.
The failure of a shipowner or bareboat charterer to comply with the ISM Code may subject it to increased liability, may invalidate existing insurance or decrease available insurance coverage for the affected vessels and may result in a denial of access to, or detention in, certain ports. Each of
theour vessels
that we have agreed to acquireare or will be ISM Code-certified when delivered to us. However, if we are subject to increased liability for non-compliance or if our insurance coverage is adversely impacted as a result of non-compliance, it may negatively affect our ability to pay dividends, if any, in the
future.future, on our common shares and interest on our Senior Notes. If any of our vessels are denied access to, or are detained in, certain ports as a result of non-compliance with the ISM Code, our revenues may be adversely impacted.
In addition, the hull and machinery of every commercial vessel must be classed by a classification society authorized by its country of registry. The classification society certifies that a vessel is safe and seaworthy in accordance with the applicable rules and regulations of the country of registry of the vessel and the Safety of Life at Sea Convention. The cost of maintaining our vessels’ classifications may be substantial.If any vessel does not maintain its class or fails any annual, intermediate or special survey, the vessel will be unable to trade between ports and will be unemployable and uninsurable, which could negatively impact our results of operations and financial condition. Increased inspection procedures and tighter import and export controls could increase costs and disrupt our business.
International shipping is subject to various security and customs inspection and related procedures in countries of origin and destination and trans-shipment points. Inspection procedures may result in the seizure of contents of our vessels, delays in the loading, offloading, trans-shipment or delivery and the levying of customs duties, fines or other penalties against us.
It is possible that changes to inspection procedures could impose additional financial and legal obligations on us. Changes to inspection procedures could also impose additional costs and obligations on our customers and may, in certain cases, render the shipment of certain types of cargo uneconomical or impractical. Any such changes or developments may have a material adverse effect on our business, financial condition and results of operations.
Rising fuel, or bunker, prices may adversely affect our profits.
Since we primarily employ our vessels in the spot market or in spot market-oriented pools, we expect that fuel, or bunkers, will be typically the largest expense in our shipping operations for our vessels. While we believe that we will experience a competitive advantage as a result of increased bunker prices due to the greater fuel efficiency of our vessels compared to the average global fleet, changes in the price of fuel may adversely affect our profitability. The operationprice and supply of fuel is unpredictable and fluctuates based on events outside our control, including geopolitical developments, supply and demand for oil and gas, actions by the Organization of the Petroleum Exporting Countries, or OPEC, and other oil and gas producers, war and unrest in oil producing countries and regions, regional production patterns and environmental concerns. Further, fuel may become much more expensive in the future, which may reduce our profitability and the competitiveness of our business compared to other forms of transportation.
We operate drybulk carriersvessels worldwide and as a result, our business has certain uniqueinherent operational risks, which may reduce our revenue or increase our expenses, and we may not be adequately covered by insurance.
The international shipping industry is an inherently risky business involving global operations. Our vessels and their cargoes are at risk of being damaged or lost because of events such as marine disasters, bad weather, mechanical failures, human error, environmental accidents, war, terrorism, piracy and other circumstances or events. In addition, transporting cargoes across a wide variety of international jurisdictions creates a risk of business interruptions due to political circumstances in foreign countries, hostilities, labor strikes and boycotts, the potential for changes in tax rates or policies, and the potential for government expropriation of our vessels. Any of these events may result in loss of revenues, increased costs and decreased cash flows to our customers, which could affectimpair their ability to make payments to us under our earnings and cash flow.charters.
Furthermore, Thethe operation of certain vessel types, such as drybulk carriers, has certain unique risks. With a drybulk carrier, the cargo itself and its interaction with the vessel can be an operational risk. By their nature, drybulk cargoes are often heavy, dense, easily shifted, and react badly to water exposure. In addition, drybulk carriers are often subjected to battering treatment during unloading operations with grabs, jackhammers (to pry encrusted cargoes out of the hold) and small bulldozers. This treatment may cause damage to the vessel. Vessels damaged due to treatment during unloading procedures may be more susceptible to breach at sea. Hull breaches in drybulk carriers may lead to the flooding of the vessels’ holds. If a drybulk carrier suffers flooding in its forward holds, the bulk cargo may become so dense and waterlogged that its pressure may buckle the vessel’s bulkheads, leading to the loss of a vessel. If we are unable to adequately maintain our vessels, we may be unable to prevent these events. Any of these circumstances or events may have a material adverse effect on our business, results of operations, cash flows, financial condition and ability to pay dividends.dividends, if any, in the future, on our common shares, and interest on our Senior Notes. In addition, the loss of any of our vessels could harm our reputation as a safe and reliable vessel owner and operator.
Rising fuel, or bunker, prices may adversely affect our profits.
Since we primarily employ our vessels in the spot market or in spot market-oriented pools, we expect that fuel, or bunkers, will be typically the largest expense in our shipping operations for our vessels. While we believe that we will experience a competitive advantage as a result of increased bunker prices due to the greater fuel efficiency of our vessels compared to the average global fleet, changes in the price of fuel may adversely affect our profitability. The price and supply of fuel is unpredictable and fluctuates based on events outside our control, including geopolitical developments, supply and demand for oil and gas, actions by the Organization of the Petroleum Exporting Countries, or OPEC, and other oil and gas producers, war and unrest in oil producing countries and regions, regional production patterns and environmental concerns. Further, fuel may become much more expensive in the future, which may reduce our profitability.
Our business has inherent operational risks, which may not be adequately covered by insurance.
Our vessels and their cargoes are at risk of being damaged or lost because of events such as marine disasters, bad weather, mechanical failures, human error, environmental accidents, war, terrorism, piracy and other circumstances or events. In addition, transporting cargoes across a wide variety of international jurisdictions creates a risk of business interruptions due to political circumstances in foreign countries, hostilities, labor strikes and boycotts, the potential for changes in tax rates or policies, and the potential for government expropriation of our vessels. Any of these events may result in loss of revenues, increased costs and decreased cash flows to our customers, which could impair their ability to make payments to us under our charters.
In the event of a casualty to a vessel or other catastrophic event, we will rely on our insurance to pay the insured value of the vessel or the damages incurred. We procure insurance for the vessels in our fleet against those risks that we believe the shipping industry commonly insures against. These insurances include marine hull and machinery insurance, protection and indemnity insurance, which include pollution risks and crew insurances, and war risk insurance. Currently, the amount of coverage for liability for pollution, spillage and leakage available to us on commercially reasonable terms through protection and indemnity associations and providers of excess coverage is
$1$1.0 billion per vessel per occurrence.
We
will procurehave procured hull and machinery insurance, protection and indemnity insurance, which includes environmental damage and pollution insurance coverage, and war risk insurance for our fleet. We do not maintain for our vessels insurance against loss of hire, which covers business interruptions that result from the loss of use of a vessel. We may not be adequately insured against all risks. We may not be able to obtain adequate insurance coverage for our fleet in the future, and we may not be able to obtain certain insurance
coverages.coverage. The insurers may not pay particular claims. Our insurance policies may contain deductibles for which we will be responsible and limitations and exclusions which may increase our costs or lower our revenue. Moreover, insurers may default on claims they are required to pay.
We cannot assure you that we will be adequately insured against all risks or that we will be able to obtain adequate insurance coverage at reasonable rates for our vessels in the future. For example, in the past more stringent environmental regulations have led to increased costs for, and in the future may result in the lack of availability of, insurance against risks of environmental damage or pollution. Additionally, our insurers may refuse to pay particular claims. Any significant loss or liability for which we are not insured could have a material adverse effect on our financial condition.
Maritime claimants could arrest or attach one or more of our vessels, which could interrupt our cash flow.
flows.
Crew members, suppliers of goods and services to a vessel, shippers of cargo, lenders, and other parties may be entitled to a maritime lien against a vessel for unsatisfied debts, claims or damages. In many jurisdictions, a claimantmaritime lien holder may seek to obtain security for
enforce its
claimlien by arresting
or attaching a vessel through foreclosure proceedings. The arrest or attachment of one or more of our vessels could interrupt our cash
flowflows and require us to pay large sums of money to have the arrest or attachment lifted. In addition, in some jurisdictions, such as South Africa, under the “sister ship” theory of liability, a claimant may arrest both the vessel
whichthat is subject to the claimant’s maritime lien and any “associated” vessel, which is any vessel owned or controlled by the same owner. Claimants could attempt to assert “sister ship” liability against one vessel in our fleet for claims relating to another of our vessels.
Governments could requisition our vessels during a period of war or emergency,
resulting in a losswhich could negatively impact our business, financial condition, results of
earnings.operations, and available cash.
A government could requisition one or more of our vessels for title or for hire. Requisition for title occurs when a government takes control of a vessel and becomes
herits owner, while requisition for hire occurs when a government takes control of a vessel and effectively becomes
herits charterer at dictated charter rates. Generally, requisitions occur during periods of war or emergency, although governments may elect to requisition vessels in other circumstances. Although we would be entitled to compensation in the event of a requisition of one or more of our vessels, the amount and timing of payment would be uncertain. Government requisition of one or more of our vessels may negatively impact our revenues.
Failure to comply with the U.S. Foreign Corrupt Practices Act could result in fines, criminal penalties,
chartercontract terminations and an adverse effect on our business.
We
may operate in a number of countries throughout the world, including countries known to have a reputation for corruption. We are committed to doing business in accordance with applicable anti-corruption laws and have adopted a code of business conduct and ethics which is consistent and in full compliance with the U.S. Foreign Corrupt Practices Act of 1977, or the FCPA. We are subject, however, to the risk that we, our affiliated entities or our or their respective officers, directors, employees and agents may take actions determined to be in violation of such anti-corruption laws, including the FCPA. Any such violation could result in substantial fines, sanctions, civil and/or criminal penalties and curtailment of operations in certain jurisdictions, and might adversely affect our business, results of operations or financial condition. In addition, actual or alleged violations could damage our reputation and ability to do business. Furthermore, detecting, investigating, and resolving actual or alleged violations is expensive and can consume significant time and attention of our senior management.
COMPANY SPECIFIC RISK FACTORS
We are a recently formed company with a limited history of operations.
We
are a recentlywere formed
companyin March 2013 and have a limited performance record, operating history and historical financial statements upon which you can evaluate our operations or our ability to implement and achieve our business strategy. We cannot assure you that we will be successful in implementing our business strategy. In addition, while our Chief Executive Officer and the management teams of our commercial and technical managers have experience operating drybulk carriers, other members of our senior management, who have experience operating tanker and other classes of vessels,
do not have
limited experience operating drybulk carriers. We believe that the experience of our senior management in the ownership and operation of tanker vessels, which require significant technical expertise to operate and are subject to heightened regulatory oversight and more rigorous vetting procedures from charterers than drybulk carriers, provides our management team with the expertise and qualifications to manage drybulk carriers, however we cannot assure you that they will be able to successfully operate our fleet.
We
will not generate significant revenue until we take delivery of the vessels we have agreed to acquire or identify and acquire other vessels.We have entered into construction contracts for 79 newbuilding vessels, with scheduled deliveries to us between the second quarter of 2014 and the third quarter of 2016 and have chartered in 17 vessels which are currently operated in a Scorpio Group Pool (defined later). We will not generate significant revenue until the second quarter of 2014. However,cannot assure you that we will continue to incur expenses related to the supervision of these newbuildings, costs related to any efforts to identify other vessels for acquisition, interest expense for the outstanding debt we expect to incur and general administrative expenses, including those related to being a public company. As a result, we will incur losses and are unlikely to be able to pay dividends during the period priorraise funds sufficient to meet our future capital and operating needs.
We cannot assure you that our available liquidity will be sufficient to meet our ongoing capital and operating needs.
We are exposed to the
deliverycyclicality and volatility of
onespot market charterhire rates, which have fluctuated, and may continue to fluctuate, significantly based upon available charters and the supply of and demand for seaborne shipping capacity. If charter rates available in the spot market are insufficient to enable our vessels to operate profitably it could adversely affect our available liquidity, profitability, cash flows, and financial results. Furthermore, a prolonged period of depressed charter rates or
more ofa significant decrease in charter rates may negatively impact our liquidity position and may cause our vessel values to decline, which could, among other things, affect our ability to comply with the
vessels we have agreed to acquire.The vesselsfinancial covenants in our fleet willloan agreements. Please see “The fair market values of our vessels have declined and may decline further, which could limit the amount of funds that we can borrow, cause us to breach certain financial covenants in our credit facilities, or result in an impairment charge, and we may incur a loss if we sell vessels following a decline in their market value” and “We are leveraged, which could significantly limit our ability to execute our business strategy, and we may be unable to comply with our covenants in our credit facilities that impose operating and financial restrictions on us, which could result in a default under the terms of these agreements.”
The Scorpio Group Pools in which our vessels operate
inare newly
created pools withformed and have limited
or no prior operating history. We cannot assure you that these pools will be successful in finding employment for all of our vessels.
The
poolsScorpio Group Pools, which consist of the Scorpio Kamsarmax Pool and the Scorpio Ultramax Pool in which our vessels operate,
or are
expected to operate in, are or will be newly formed and
will have limited
or no history of operations.prior operating history. We
will own a large number of vessels that
have entered, or will enter, these pools in a relatively short period of time without having previously secured employment. We cannot assure you that these pools will be successful in finding employment for all such vessels in the volatile spot market
immediately upon their deliveries to us or whether any such employment will be at profitable rates. We cannot assure you that our vessels will be profitably operated by such pools. In addition, vessels
ownedoperated by our affiliates, including members of the Scorpio Group,
which includes Scorpio Ship Management S.A.M., or SSM, which provides us with vessel technical management services, Scorpio Commercial Management S.A.M., or SCM, which provides us with vessel commercial management services, and Scorpio Services Holding Limited, or SSH, which provides us and other related entities with administrative services and services related to the acquisition of vessels,as well as
vessels operated by unaffiliated third-parties, may participate in such pools. Such vessels may not be of the comparable design or quality to our vessels, negatively impacting the profitability of such pools, while diluting our interest in such profits.
Newbuilding projects are subject to risks that could cause delays, cost overruns or cancellation of our newbuilding contracts.
We have entered into
As of the date of this annual report, we are party to a shipbuilding
contractscontract with
an established
shipyardsshipyard in
Japan, China
South Korea and Romania for the construction of
79one newbuilding
vesselsvessel for an aggregate purchase price of
$3,071.5 million. These vessels are$25.7 million, of which $17.2 million remains to be paid. This vessel is expected to be delivered to us
betweenin the
second quarterfirst half of
2014 and the third quarter of 2016. These construction2017. Construction projects are subject to risks of delay or cost overruns inherent in any large construction project from numerous factors, including shortages of equipment, materials or skilled labor, unscheduled delays in the delivery of ordered materials and equipment or shipyard construction, failure of equipment to meet quality and/or performance standards, financial or operating difficulties experienced by equipment vendors or the shipyard, unanticipated actual or purported change orders, inability to obtain required permits or approvals, unanticipated cost increases between order and delivery, design or engineering changes and work stoppages and other labor disputes, adverse weather conditions or any other events of force majeure. Significant cost overruns or delays could adversely affect our financial position, results of operations and cash flows. Additionally, failure to complete a project on time may result in the delay of revenue from that vessel.
As of December 31, 2013, we had made total yard payments in the amount of $371.6 million and we have remaining yard installments in the amount of $2,699.9 million before we take possession of the vessels. We had, as of December 31, 2013, a cash balance of $733.9 million to fund future newbuilding commitments, however, a significant portion of our remaining commitments are currently unfunded. If we are not able to borrow additional funds, raise other capital or utilize available cash on hand, we may not be able to acquire these newbuilding vessels, which could have a material adverse effect on our business, financial condition, results of operations and cash flows. We have entered into a commitment letter for our Proposed $330.0 Million Senior Secured Credit Facility that will be secured by 22 of the vessels in our Newbuilding Program and a commitment letter for our Proposed $67.5 Million Senior Secured Credit Facility that will be secured by four of the vessels in our Newbuilding Program, however, such credit facilities are subject to important conditions, including the negotiation and execution of definitive documentation. We cannot assure you that we will be able to enter into either such proposed senior secured credit facility. If for any reason we fail to make a payment when due, which may result in a default under our newbuilding contracts, or otherwise fail to take delivery of our newbuild vessels, we would be prevented from realizing potential revenues from these vessels, we could also lose all or a portion of our yard payments that were paid by us and we could be liable for penalties and damages under such contracts.
In addition, in the event the
shipyards doshipyard does not perform under
their contractsits contract and we are unable to enforce
certainthe refund
guaranteesguarantee with
a third party
banksbank for any reason, we may lose all or part of our investment, which would have
a materialan adverse effect on our results of operations, financial condition and cash flows.
We are subject to certain risks with respect to our counterparties on contracts, and failure of such counterparties to meet their obligations could cause us to suffer losses or negatively impact our results of operations and cash flows.
We have entered into, and may enter,
into the future, various contracts, including pooling arrangements,
charter agreements,time charters, spot voyage charters, shipbuilding contracts,
credit facilities and
credit facilities.other agreements. Such agreements subject us to counterparty risks. The ability
and willingness of each of our counterparties to perform its obligations under a contract with us will depend on a number of factors that are beyond our control and may include, among other things, general economic conditions, the condition of the maritime and offshore industries, the overall financial condition of the counterparty,
charter rates received for specific types of vessels, and various expenses.
For example, the combination of a reduction of cash flow resulting from declines in world trade, a reduction in borrowing bases under reserve-based credit facilities and the lack of availability of debt or equity financing may result in a significant reduction in the ability of our charterers to make charter payments to us. In addition, in depressed market conditions, our charterers and customers may no longer need a vessel that is then under charter or contract or may be able to obtain a comparable vessel at lower rates. As a result, charterers and customers may seek to renegotiate the terms of their existing charter agreements or avoid their obligations under those contracts. Should a counterparty fail to honor its obligations under agreements with us, we could sustain significant losses which could have a material adverse effect on our business, financial condition, results of operations and cash flows.
In addition, in depressed market conditions, our charterers may no longer need a vessel that is then under charter or may be able to obtain a comparable vessel at lower rates. As a result, charterers may seek to renegotiate the terms of their existing charter agreements or avoid their obligations under those contracts. If our charterers fail to meet their obligations to us or attempt to renegotiate our charter agreements, it may be difficult to secure substitute employment for such vessel, and any new charter arrangements we secure in the spot market or on time charters may be at lower rates given currently decreased drybulk carrier charter rate levels. As a result, we could sustain significant losses which could have a material adverse effect on our business, financial condition, results of operations and cash flows, as well as our ability to pay dividends, if any, in the future, on our common shares and interest on our Senior Notes, and comply with covenants in our credit facilities.
We
are, and expect
to continue to be, dependent on spot market-oriented pools and spot charters and
currently low spot charter rates, or any
further decrease in spot charter rates in the future
may adversely affect our earnings.We expect that allwill result in significant operating losses.
All of our vessels
will beare employed in
eitherScorpio Group Pools. During the
spot marketyear ended December 31, 2016, we earned 40% and 60% of our revenue (including commissions from Scorpio Commercial Management S.A.M., or
in spot market-oriented drybulk pools, such asSCM) from the
Scorpio Kamsarmax Pool and the Scorpio Ultramax Pool, respectively. The Scorpio Group Pools
exposing usin which our vessels operate are spot market-oriented commercial pools managed by our commercial manager, which are exposed to fluctuations in spot market charter rates. The spot charter market may fluctuate significantly based upon drybulk carrier supply and demand. The successful operation of our vessels in the competitive spot charter market, including within the Scorpio Group Pools, depends on, among other things, obtaining profitable spot charters and minimizing, to the extent possible, time spent waiting for charters and time spent traveling unladen to pick up cargo. The spot market is very volatile, and,
in the recent past, there have been periods whencurrently spot charter rates have declined below the operating cost of
vessels and for some vessel classes are currently only slightly above operating costs.vessels. If future spot charter rates
do not improve, or decline
further, then we may be unable to operate our vessels trading in the spot market profitably, meet our obligations, including payments on indebtedness, or pay dividends in the future.
As a result, we have, and may in the future, agree with shipyards to delay taking delivery of certain newbuilding vessels. Furthermore, as charter rates for spot charters are fixed for a single voyage which may last up to several weeks, during periods in which spot charter rates are rising, we will generally experience delays in realizing the benefits from such increases.
Our ability to renew expiring charters or obtain new charters will depend on the prevailing market conditions at the time. If we are not able to obtain new charters in direct continuation with previous charters or
for our newbuilding vessels upon their delivery to us, or if new charters are entered into at charter rates substantially below the existing charter rates or on terms otherwise less favorable compared to previous charter terms, our revenues and profitability could be adversely affected.
The failure of our charterers to meet their obligations under our charter agreements, on which we depend for our revenues, could cause us to suffer losses or otherwise adversely affect our business.
We do not expect to employ any of our vessels under a long-term time charter agreement but we may enter into such agreements in the future. The ability and willingness of each of our counterparties to perform their obligations under a time charter, spot voyage or other agreement with us, directly or through our pooling arrangements, will depend on a number of factors that are beyond our control and may include, among other things, general economic conditions, the condition of the drybulk shipping industry and the overall financial condition of the counterparties. In addition, in depressed market conditions, there have been reports of charterers renegotiating their charters or defaulting on their obligations under charters. Our customers may fail to pay charterhire or attempt to renegotiate charter rates. Should a counterparty fail to honor its obligations under agreements with us, it may be difficult to secure substitute employment for such vessel, and any new charter arrangements we secure in the spot market or on time charters may be at lower rates given currently decreased drybulk carrier charter rate levels. When we employ a vessel in the spot charter market, we intend to place such vessel in a drybulk carrier pool managed by our commercial manager that pertains to that vessel’s size class. If our charterers fail to meet their obligations to us or attempt to renegotiate our charter agreements, we could sustain significant losses which could have a material adverse effect on our business, financial condition, results of operations and cash flows, as well as our ability to pay dividends, if any, in the future, and comply with covenants in our credit facilities.
We cannot assure you that our board of directors will declare dividends.
We currently do not intend to pay dividends to the holders of our common shares. Our board of directors will continue to assess our dividend policy and may in the future determine to pay dividends. The declaration and payment of dividends, if any, will always be subject to the discretion of our board of directors, restrictions contained in our credit
facilityfacilities and the requirements of Marshall Islands law. The timing and amount of any dividends declared will depend on, among other things, our earnings, financial condition and cash requirements and availability, our ability to obtain debt and equity financing on acceptable terms as contemplated by our growth strategy, the terms of our outstanding indebtedness and the ability of our subsidiaries to distribute funds to us. The international drybulk shipping industry is highly volatile, and we cannot predict with certainty the amount of cash, if any, that will be available for distribution as dividends in any period. Also, there may be a high degree of variability from period to period in the amount of cash that is available for the payment of dividends.
Until we take delivery of the vessels we have agreed to acquire or identify and acquire additional vessels and deploy them on charters, we will not generate cash from operations for dividends. Accordingly, it may take substantial time before it would be possible for us to pay any dividends.We may incur expenses or liabilities or be subject to other circumstances in the future that reduce or eliminate the amount of cash that we have available for distribution as dividends, including as a result of the risks described herein. Our growth strategy contemplates that we will finance our acquisitions of additional vessels through debt financings or the net proceeds of future equity issuances on terms acceptable to us. If financing is not available to us on acceptable terms, our board of directors may determine to finance or refinance acquisitions with cash from operations, which would reduce the amount of any cash available for the payment of dividends.
In general, under the terms of
theour credit facilities,
that we
expect to enter into, we willare not
be permitted to pay dividends if there is a default or a breach of a loan covenant. Please see “Item 5. Operating and Financial Review and
Prospects—B.Prospects-B. Liquidity and Capital Resources” for more information relating to restrictions on our ability to pay dividends under the terms of our proposed credit facilities.
The Republic of Marshall Islands laws generally prohibit the payment of dividends other than from surplus (retained earnings and the excess of consideration received for the sale of shares above the par value of the shares) or while a company is insolvent or would be rendered insolvent by the payment of such a dividend. We may not have sufficient surplus in the future to pay dividends and our subsidiaries may not have sufficient funds or surplus to make distributions to us. We can give no assurance that dividends will be paid at all.
We may have difficulty managing our planned growth properly.
Our operating fleet of 48 vessels consists of 47 wholly-owned newbuilding drybulk vessels (which were delivered to us beginning in 2015) and one chartered-in vessel. We
also have
entered into shipbuilding contracts with established shipyards in Japan, China, South Korea and Romaniaa contract for the construction of
79 latest generationan additional drybulk
vessels and we have chartered in 17 vessels,vessel, which
we employ inis expected to be delivered to us during the
Scorpio Group Pools.second quarter of 2017. One of our principal strategies is to continue to grow by expanding our operations, and
adding towe may, in the future, increase the size of our
fleet.fleet through timely and selective acquisitions. Our future growth will primarily depend upon a number of factors, some of which may not be within our control. These factors include our ability to:
| ● | identify suitable drybulk carriers, including newbuilding slots at shipyards and/or shipping companies for acquisitions at attractive prices; |
| ● | obtain required financing for our existing and new operations; |
| ● | identify businesses engaged in managing, operating or owning drybulk carriers for acquisitions or joint ventures; |
| ● | integrate any acquired drybulk carriers or businesses successfully with our existing operations, including obtaining any approvals and qualifications necessary to operate vessels that we acquire; |
| ● | hire, train and retain qualified personnel and crew to manage and operate our growing business and fleet; |
| ● | identify additional new markets; |
| ● | enhance our customer base; and |
| ● | improve our operating, financial and accounting systems and controls. |
identify suitable drybulk carriers, including newbuilding slots at shipyards and/or shipping companies for acquisitions at attractive prices;
obtain required financing for our existing and new operations;
identify businesses engaged in managing, operating or owning drybulk carriers for acquisitions or joint ventures;
integrate any acquired drybulk carriers or businesses successfully with our existing operations, including obtaining any approvals and qualifications necessary to operate vessels that we acquire;
hire, train and retain qualified personnel and crew to manage and operate our growing business and fleet;
identify additional new markets;
enhance our customer base; and
improve our operating, financial and accounting systems and controls.
Our failure to effectively identify, acquire, develop and integrate any drybulk carriers or businesses, or our inability to effectively manage the size of our fleet, could adversely affect our business, financial condition and results of operations. TheAs a result of the prolonged downturn in the drybulk shipping market, we have reduced the size of our fleet over the past two years through the sale of certain of our vessels and construction contracts and the termination of certain time charter-in contracts, and we may continue to reduce the size of our fleet in the future.
Furthermore, the number of employees that perform services for us and our current operating and financial systems may not be adequate as we
implement our plan to expand the size of our fleet in the drybulk sector, and we may not be able to effectively hire more employees or adequately improve those systems.
Finally, acquisitions may require additional equity issuances, which may dilute our common shareholders if issued at lower prices than the price they acquired their shares, or debt issuances (with amortization payments), both of which could lower our available cash. If any such events occur, our financial condition may be adversely affected.Growing any business by acquisition presents numerous risks such as undisclosed liabilities and obligations, difficulty in obtaining additional qualified personnel and managing relationships with customers and suppliers and integrating newly acquired operations into existing infrastructures. The expansion of our fleet may impose significant additional responsibilities on our management and staff, and the management and staff of our commercial and technical managers, and may necessitate that we, and they, increase the number of personnel. We cannot give any assurance that we will be successful in executing our growth plans or that we will not incur significant expenses and losses in connection with our future growth.
As we expand our business, we may need to improve our operating and financial systems and will need to recruit suitable employees and crew for our vessels.
Our current operating and financial systems may not be adequate as we implement our plan to take delivery of 79 newbuilding vessels between the second quarter of 2014 and the third quarter of 2016 and to expand the size of our fleet through acquiring and chartering in additional vessels, and our attempts to improve those systems may be ineffective. In addition, if we further expand our fleet, we will need to recruit suitable additional seafarers and shore side administrative and management personnel. We cannot guarantee that we will be able to hire suitable employees as we expand our fleet. If we or our crewing agent encounters business or financial difficulties, we may not be able to adequately staff our vessels. If we are unable to grow our financial and operating systems or to recruit suitable employees as we expand our fleet, our financial performance may be adversely affected and, among other things, the amount of cash available for distribution as dividends to our shareholders may be reduced.
Finally, acquisitions may require additional equity issuances, which may dilute our common shareholders if issued at lower prices than the price at which they acquired their shares, or debt issuances (with amortization payments), both of which could lower our available cash. If any such events occur, our financial condition may be adversely affected.
Growing any business by acquisition presents numerous risks such as undisclosed liabilities and obligations, difficulty in obtaining additional qualified personnel and managing relationships with customers and suppliers and integrating newly acquired operations into existing infrastructures. The expansion of our fleet may impose significant additional responsibilities on our management and staff, and the management and staff of our commercial and technical managers, and may necessitate that we, and they, increase the number of personnel. We cannot give any assurance that we will be successful in executing our growth plans or that we will not incur significant expenses and losses in connection with our future growth.
If we acquire and operate secondhand vessels, we will be exposed to increased operating costs which could adversely affect our earnings and, as our fleet ages, the risks associated with older vessels could adversely affect our ability to obtain profitable charters.
Our current business strategy includes additional growth which
We may
in addition to the acquisition of newbuilding vessels, include the acquisition of modernacquire and operate secondhand vessels. While we expect that we would typically inspect secondhand vessels prior to acquisition, this does not provide us with the same knowledge about their condition that we would have had if these vessels had been built for and operated exclusively by us. Generally, purchasers of secondhand vessels do not receive the benefit of warranties from the builders for the secondhand vessels that they acquire.
Governmental regulations, safety or other equipment standards related to the age of vessels may require expenditures for alterations, or the addition of new equipment to our vessels and may restrict the type of activities in which the vessels may engage. As our vessels age, market conditions may not justify those expenditures or enable us to operate our vessels profitably during the remainder of their useful lives.
The aging of our fleet may result in increased operating costs in the future, which could adversely affect our earnings.
In general, the cost of maintaining a vessel in good operating condition increases with the age of the vessel. While all of the vessels in our owned fleet
will beare newbuildings, as our vessels age typically they will become less fuel-efficient and more costly to maintain than more recently constructed vessels due to improvements in engine technology. Cargo insurance rates increase with the age of a vessel, making older vessels less desirable to charterers. Governmental regulations and safety or other equipment standards related to the age of vessels may also require expenditures for alterations or the addition of new equipment to our vessels and may restrict the type of activities in which our vessels may engage. We cannot assure you that, as our vessels age, market conditions will justify those expenditures or enable us to operate our vessels profitably during the remainder of their useful lives.
Technological innovation could reduce our charter hire income and the value of our vessels.
The charter hire rates and the value and operational life of a vessel are determined by a number of factors including the vessel’s efficiency, operational flexibility and physical life. Efficiency includes speed, fuel economy and the ability to load and discharge cargo quickly. Flexibility includes the ability to enter harbors, utilize related docking facilities and pass through canals and straits. The length of a vessel’s physical life is related to its original design and construction, its maintenance and the impact of the stress of operations. If new drybulk carriers are built that are more efficient or more flexible or have longer physical lives than our vessels, competition from these more technologically advanced vessels could adversely affect the amount of charterhire payments we receive for our vessels once their initial charters expire and the resale value of our vessels could significantly decrease. As a result, our business, results of operations, cash flows and financial condition could be adversely affected.
In the highly competitive international shipping industry, we may not be able to compete for charters with new entrants or established companies with greater resources, and as a result, we may be unable to employ our vessels profitably.
Our vessels
will beare employed in a highly competitive market that is capital intensive and highly fragmented. Competition arises primarily from other vessel owners, some of whom have substantially greater resources than we do. Competition for the transportation of drybulk cargo by sea is intense and depends on price, location, size, age, condition and the acceptability of the vessel and its operators to the charterers. Due in part to the highly fragmented market, competitors with greater resources could enter the drybulk shipping industry and operate larger fleets through consolidations or acquisitions and may be able to offer lower charter rates and higher quality vessels than we are able to offer. If we are unable to successfully compete with other drybulk shipping companies, our results of operations would be adversely impacted.
We may be subject to litigation that, if not resolved in our favor and not sufficiently insured against, could have a material adverse effect on us.
We may be, from time to time, involved in various litigation matters. These matters may include, among other things, contract disputes, personal injury claims, environmental claims or proceedings, asbestos and other toxic tort claims, employment matters, governmental claims for taxes or duties, and other litigation that arises in the ordinary course of our business. Although we intend to defend these matters vigorously, we cannot predict with certainty the outcome or effect of any claim or other litigation matter, and the ultimate outcome of any litigation or the potential costs to resolve them may have a material adverse effect on us. Insurance may not be applicable or sufficient in all cases and/or insurers may not remain solvent which may have a material adverse effect on our financial condition.
We are a holding company, and we depend on the ability of our subsidiaries to distribute funds to us in order to satisfy our financial obligations and to make dividend payments.
We are a holding company and our subsidiaries conduct all of our operations and own all of our operating assets. We have no significant assets other than the equity interests in our subsidiaries. As a result, our ability to satisfy our financial obligations and to make dividend payments in the futurepay dividends to our shareholders depends on our subsidiaries and their ability to distribute funds to us. If we are unable to obtain funds from our subsidiaries, our board of directors may exercise its discretion not to declare or pay dividends.
We docannot assure you that our internal controls and procedures over financial reporting will be sufficient.
We are subject to the reporting requirements of the Securities Exchange Act of 1934, as amended, or the Exchange Act, and the other rules and regulations of the SEC, including the Sarbanes-Oxley Act of 2002, or Sarbanes-Oxley. Section 404 of Sarbanes-Oxley requires that we evaluate and determine the effectiveness of our internal controls over financial reporting. If we have a material weakness in our internal controls over financial reporting, we may not
intenddetect errors on a timely basis and our financial statements may be materially misstated. We dedicate a significant amount of time and resources to
obtain funds fromensure compliance with these regulatory requirements. We will continue to evaluate areas such as corporate governance, corporate control, internal audit, disclosure controls and procedures and financial reporting and accounting systems. We will make changes in any of these and other
sourcesareas, including our internal control over financial reporting, which we believe are necessary. However, these and other measures we may take may not be sufficient to
pay dividends.allow us to satisfy our obligations as a public company on a timely and reliable basis. Because we are organized under the laws of the Marshall Islands, it may be difficult to serve us with legal process or enforce judgments against us, our directors or our management.
We are organized under the laws of the Marshall Islands, and substantially all of our assets are located outside of the United States. In addition, the majority of our directors and officers are or will be non-residents of the United States, and all or a substantial portion of the assets of these non-residents are located outside the United States. As a result, it may be difficult or impossible for you
someone to bring an action against us or against these individuals in the United States if
youthey believe that
yourtheir rights have been infringed under securities laws or otherwise. Even if you are successful in bringing an action of this kind, the laws of the Marshall Islands and of other jurisdictions may prevent or restrict
youthem from enforcing a judgment against our assets or the assets of our directors or officers.
The international nature of our operations may make the outcome of any bankruptcy proceedings difficult to predict.
We are incorporated under the laws of the Republic of the Marshall Islands and we conduct operations in countries around the world. Consequently, in the event of any bankruptcy, insolvency, liquidation, dissolution, reorganization or similar proceeding involving us or any of our subsidiaries, bankruptcy laws other than those of the United States could apply. If we become a debtor under U.S. bankruptcy law, bankruptcy courts in the United States may seek to assert jurisdiction over all of our assets, wherever located, including property situated in other countries. There can be no assurance, however, that we would become a debtor in the United States, or that a U.S. bankruptcy court would be entitled to, or accept, jurisdiction over such a bankruptcy case, or that courts in other countries that have jurisdiction over us and our operations would recognize a U.S. bankruptcy court’s jurisdiction if any other bankruptcy court would determine it had jurisdiction.
We may have to pay tax on
United StatesU.S. source income, which would reduce our
earnings.earnings and cash flow.
Under the
United StatesU.S. Internal Revenue Code of 1986, as amended, or the Code, 50% of the gross shipping income of a vessel owning or chartering corporation, such as ourselves and our subsidiaries, that is attributable to transportation that begins or ends, but that does not both begin and end, in the United States is characterized as
United StatesU.S. source shipping income and such income is subject to a 4%
United StatesU.S. federal income tax without allowance for any deductions, unless that corporation qualifies for exemption from tax under Section 883 of the Code and the Treasury regulations promulgated thereunder.
We
intend to take the positionbelieve that we
qualifiedqualify for this statutory exemption for
U.S. federal income tax return reporting purposes for our
20132016 taxable year and we
intendexpect to so qualify for
futureour subsequent taxable years. However, there are factual circumstances beyond our control that could cause us to lose the benefit of this tax exemption and thereby cause us to become subject to
United StatesU.S. federal income tax on our
United StatesU.S. source shipping income. For example, there is a risk that we could no longer qualify for exemption under Section 883 of the Code for a particular taxable year if “non-qualified” shareholders with a five percent or greater interest in our stock were, in combination with each other, to own 50% or more of the outstanding shares of our stock on more than half the days during the taxable year. Due to the factual nature of the issues involved, we can give no assurances on our tax-exempt status or that of any of our subsidiaries.
If we are not entitled to this exemption under Section 883 of the Code for any taxable year, we would be subject for such taxable year to a 4%
United StatesU.S. federal income tax on our
United StatesU.S. source shipping income on a gross basis. The imposition of this taxation could have a negative effect on our business and would result in decreased earnings
and cash available for distribution to our
shareholders.United Statesshareholders and to pay amounts due on our Senior Notes.
U.S. tax authorities could treat us as a “passive foreign investment company,” which could have adverse
United StatesU.S. federal income tax consequences to
United Statesour U.S. shareholders.
A foreign corporation will be treated as a “passive foreign investment company,” or PFIC, for
United StatesU.S. federal income tax purposes if either (1) at least 75% of its gross income for any taxable year consists of certain types of “passive income” or (2) at least 50% of the average value of the corporation’s assets produce or are held for the production of those types of “passive income,” including cash. For purposes of these tests, “passive income” includes dividends, interest, and gains from the sale or exchange of investment property and rents and royalties other than rents and royalties which are received from unrelated parties in connection with the active conduct of a trade or business. For purposes of these tests, income derived from the performance of services
to third parties does not constitute “passive income.”
United StatesU.S. shareholders of a PFIC are subject to a disadvantageous
United StatesU.S. federal income tax regime with respect to the income derived by the PFIC, the distributions they receive from the PFIC and the gain, if any, they derive from the sale or other disposition of their shares in the PFIC.
There
It is
a significant riskpossible that we
willmay be
treated asconsidered a PFIC for our
2013, 2014 and 20152016 taxable
years.year. Whether we are treated as a PFIC will depend, in part, upon whether the deposits that we make on newbuilding contracts are treated as being held for the production of “passive income” and on the amount of “passive income” that we derive for such years.
Thereafter,
For our 2017 taxable year and subsequent taxable years, whether we will be treated as a PFIC will depend upon the nature and extent of our operations. In this regard, we intend to treat the gross income we derive or are deemed to derive from our time chartering activities as services income, rather than rental income. Accordingly, we believe that our income from our time chartering activities does not constitute “passive income,” and the assets that we own and operate in connection with the production of that income do not constitute passive assets. There is, however, no direct legal authority under the PFIC rules addressing our method
of operation. Accordingly, no assurance can be given that the United States Internal Revenue Service, or IRS, or a court of law will accept our position, and there is a risk that the IRS or a court of law could determine that we are a PFIC. Moreover, no assurance can be given that we would not constitute a PFIC for any taxable year if there were to be changes in the nature and extent of our operations.
If we were treated as a PFIC for any taxable year, our
United StatesU.S. shareholders may face adverse
United StatesU.S. federal income tax consequences and information reporting obligations. Under the PFIC rules, unless those shareholders made an election available under the Code (which election could itself have adverse consequences for such shareholders), such shareholders would be liable to pay
United StatesU.S. federal income tax upon excess distributions and upon any gain from the disposition of our common shares at the then prevailing income tax rates applicable to ordinary income plus interest as if the excess distribution or gain had been recognized ratably over the shareholder’s holding period of our common shares. See “Item 10. Additional Information
–- E. Taxation
–- U.S. Federal Income Tax Considerations
–- U.S. Federal Income Taxation of U.S. Holders
–- Passive Foreign Investment Company Status and Significant Tax Consequences” for a more comprehensive discussion of the U.S. federal income tax consequences to U.S. holders of our common shares if we are or were to be treated as a PFIC.
Risks Related to Our Relationship with Scorpio Group and its Affiliates
We are dependent on our managers and their ability to hire and retain key personnel, and there may be conflicts of interest between us and our managers that may not be resolved in our favor.
Our success depends to a significant extent upon the abilities and efforts of our technical manager,
Scorpio Ship Management S.A.M., or SSM, our commercial manager, SCM, and our management
team. Our success will dependteam and upon our and our managers’ ability to hire and retain key members of our management team. The loss of any of these individuals could adversely affect our business prospects and financial condition.
Difficulty in hiring and retaining personnel could adversely affect our results of operations. We do not maintain “key man” life insurance on any of our officers.
Our technical and commercial managers are affiliates of the Scorpio Group, which is owned and controlled by the Lolli-Ghetti family, of which our founder, Chairman and Chief Executive Officer, Mr. Emanuele Lauro,
is a member.and our Vice President, Mr. Filippo Lauro, are members. Conflicts of interest may arise
between us, on the one hand, and our commercial and technical managers, on the other hand. As a result of these conflicts, our commercial and technical managers, who have limited contractual duties, may favor their own or their owner’s interests over our interests. These conflicts may have unfavorable results for us.Our Co-Founder, Chairman and Chief Executive Officer, has affiliations with our commercial and technical managers which may create conflicts of interest.
Emanuele Lauro, our Co-Founder, Chairman and Chief Executive Officer, is a member of the Lolli-Ghetti family which owns and controls our commercial and technical managers. These relationships could create conflicts of interest between us, on the one hand, and our commercial and technical managers, on the other hand. These conflicts may arise in connection with the chartering, purchase, sale and operation of the vessels in our fleet versus vessels managed by other companies affiliated with our commercial or technical managers. In particular, as of the date of this annual report, our commercial and technical managers, which are operated by entities affiliated with Messrs. Lauro, provide commercial and technical management services to approximately 108200 and 28150 vessels, respectively, other than thein addition to vessels in our fleet, that are operated by entities affiliated with Mr. Lauro, and such entitiesour commercial and technical managers may operate additional vessels that will compete with our vessels in the future. Such conflicts may have an adverse effect on our results of operations.
Our Chief Executive Officer, President, Chief Operating Officer,
Chief Financial Officer, Vice President,
Vessel Operations, General Counsel and Secretary
willdo not devote all of their time to our business, which may hinder our ability to operate successfully.
Our Chief Executive Officer, President, Chief Operating Officer,
Chief Financial Officer, Vice President,
Vessel Operations, General Counsel and Secretary participate in business activities not associated with us, including serving as members of the management team of Scorpio Tankers,
Inc. (“Scorpio Tankers”), and are not required to work full-time on our affairs.
Initially, weWe expect that each of our executive officers will
continue to devote a substantial portion of
histheir business time to the
completion of our Newbuilding Program and management of the Company. Additionally, our Chief Executive Officer, President, Chief Operating Officer, Vice President,
Vessel Operations, General Counsel and Secretary serve in similar positions in
other entities within the Scorpio Group. As a result, such
executive officers may devote less time to us than if they were not engaged in other business activities and may owe fiduciary duties to the shareholders of both us as well as shareholders of other companies which they may be affiliated with, including Scorpio Tankers and Scorpio Group companies. This may create conflicts of interest in matters involving or affecting us and our customers and it is not certain that any of these conflicts of interest will be resolved in our favor. This could have a material adverse effect on our business, financial condition, results of operations and cash flows.
Our commercial and technical managers are each privately held companies and there is little or no publicly available information about them.
Upon delivery our
Our vessels
will beare commercially managed by SCM and technically managed by SSM. SCM’s and SSM’s ability to render management services will depend in part on their own financial strength. Circumstances beyond our control could impair our commercial manager’s or technical manager’s financial strength, and because each is a privately held company, information about the financial strength of our commercial manager and technical manager is not available. As a result, we and our shareholders might have little advance warning of financial or other problems affecting our commercial manager or technical manager even though their financial or other problems could have a material adverse effect on us.
RISKS RELATED TO OUR INDEBTEDNESS
Servicing our current or future indebtedness limits funds available for other purposes and if we cannot service our debt, we may lose our vessels.
Borrowing under
our credit facilities requires us to dedicate a part of our cash flow from operations to paying interest on our
indebtedness.indebtedness under such facilities. These payments limit funds available for working capital, capital expenditures and other purposes, including further equity or debt financing in the future. Amounts borrowed under our credit facilities
will bear interest at variable rates. Increases in prevailing rates could increase the amounts that we would have to pay to our lenders, even though the outstanding principal amount remains the same, and our net income and cash flows would decrease. We expect our earnings and cash flow to vary from year to year due to the cyclical nature of the drybulk carrier industry. If we do not generate or reserve enough cash flow from operations to satisfy our debt obligations, we may have to undertake alternative financing plans, such as:
| ● | seeking to raise additional capital; |
| ● | refinancing or restructuring our debt; |
| ● | selling drybulk carriers; or |
| ● | reducing or delaying capital investments. |
seeking to raise additional capital;
refinancing or restructuring our debt;
selling drybulk carriers; or
reducing or delaying capital investments.
However, these alternative financing plans, if necessary, may not be sufficient to allow us to meet our debt obligations. If we are unable to meet our debt obligations or if some other default occurs under
theour credit facilities,
that we intend to enter, our lenders could elect to declare that debt, together with accrued interest and fees, to be immediately due and payable and proceed against the collateral vessels securing that debt.
We
expect to beare exposed to volatility in the London Interbank Offered Rate, or LIBOR, and
intend tomay selectively enter into derivative contracts, which can result in higher than market interest rates and charges against our income.
We expect the
The loans under our secured credit facilities
to beare generally advanced at a floating rate based on LIBOR, which has been stable, but was volatile in prior years, which can affect the amount of interest payable on our debt, and which, in turn, could have an adverse effect on our earnings and cash flow. In addition,
although in recent years LIBOR has been at relatively low levels,
LIBOR increased during 2016 and may
continue to rise in the future as the current low interest rate environment comes to an end. Our financial condition could be materially adversely affected
at any time thatas we have not entered into interest rate hedging arrangements to hedge our exposure to the interest rates applicable to our credit facilities and
may not enter into interest rate hedging arrangements any other financing arrangements we may enter into in the future, including those we enter into to finance a portion of the amounts payable with respect to newbuildings. Moreover, even if we have entered into interest rate swaps or other derivative instruments for purposes of managing our interest rate exposure, our hedging strategies may not be effective and we may incur substantial losses.
We intend to selectivelymay enter into derivative contracts to hedge our overall exposure to interest rate risk exposure. Entering into swaps and derivatives transactions is inherently risky and presents various possibilities for incurring significant expenses. The derivatives strategies that we may employ in the future may not be successful or effective, and we could, as a result, incur substantial additional interest costs. See “Item 11. Quantitative
We may be adversely affected by the introduction of new accounting rules for leasing.
In early 2016, the U.S. accounting standard-setting board (the Financial Accounting Standards Board, or the FASB) issued new accounting guidance that would require lessees to record most leases on their balance sheets as lease assets and Qualitative Disclosures About Market Risk” forliabilities. Entities would still classify leases, but classification would be based on different criteria and would serve a descriptiondifferent purpose than it does today. Lease classification would determine how entities recognize lease-related revenue and expense, as well as what lessors record on the balance sheet. Classification would be based on the portion of the economic benefits of the underlying asset expected to be consumed by the lessee over the lease term. Once adopted, the proposals would be expected generally to have the effect of bringing most off-balance sheet leases onto a lessee’s balance sheet as liabilities, which would also change the income and expense recognition patterns of those items. Financial statement metrics, including non-GAAP financial measures, such as leverage and capital ratios, as well as EBITDA and Adjusted EBITDA, may also be affected, even when cash flow and business activity have not changed. This may in turn affect covenant calculations under various contracts (such as loan agreements) unless the affected contracts are modified.
We are leveraged, which could significantly limit our
expected interest rate swap arrangements.Theability to execute our business strategy and we may be unable to comply with our covenants in our credit facilities that we expect to enter may contain restrictive covenants which limit the amount of cash that we may use for other corporate activities, which could negatively affect our growth and cause our financial performance to suffer.
The credit facilities that we expect to enter may impose operating and financial restrictions on us. Theseus, which could result in a default under the terms of these agreements.
As of December 31, 2016, we had $596.1 million of outstanding indebtedness under our credit facilities and debt securities.
Our credit facilities impose operating and financial restrictions
on us, that limit our ability, or the ability of our subsidiaries party thereto, to:
| ● | pay dividends and make capital expenditures if we do not repay amounts drawn under our credit facilities or if there is another default under our credit facilities; |
| ● | incur additional indebtedness, including the issuance of guarantees; |
| ● | create liens on our assets; |
| ● | change the flag, class or management of our vessels or terminate or materially amend the management agreement relating to each vessel; |
| ● | merge or consolidate with, or transfer all or substantially all our assets to, another person; or |
| ● | enter into a new line of business. |
pay dividends and make capital expenditures if we do not repay amounts drawn under our credit facilities or if there is another default under our credit facilities; incur additional indebtedness, including the issuance of guarantees;
create liens on our assets;
change the flag, class or management of our vessels or terminate or materially amend the management agreement relating to each vessel;
sell our vessels;
merge or consolidate with, or transfer all or substantially all our assets to, another person; and/or
enter into a new line of business.
Therefore, we may need to seek permission from our lenders in order to engage in some corporate actions. Our lenders’ interests may be different from ours and we may not be able to obtain our lenders’ permission when needed. This may limit our ability to pay dividends
to youon our common shares if we determine to do so in the future,
and interest on our Senior Notes, finance our future operations or capital requirements, make acquisitions or pursue business opportunities.
In addition, our future secured credit facilities including the Proposed $330.0 Million Senior Secured Credit Facility and the Proposed $67.5 Million Senior Secured Credit Facility, will likely require us to maintain specified financial ratios and satisfy financial covenants, including ratios and covenants based on the market value of the vessels in our fleet. Should our charter rates or vessel values materially decline in the future, we may seek to obtain waivers or amendments from our lenders with respect to such financial ratios and covenants, or we may be required to take action to reduce our debt or to act in a manner contrary to our business objectives to meet any such financial ratios and satisfy any such financial covenants. In 2016, we amended our credit facilities to reduce the minimum liquidity, interest coverage ratio and loan-to-value ratio covenants, as well as to amend the definition of net worth used in the leverage and net worth covenants. There can be no assurances that our lenders will grant any waivers or additional amendments in the future.
Events beyond our control, including changes in the economic and business conditions in the shipping markets in which we operate, may affect our ability to comply with these covenants. We cannot assure you that we will meet these ratios or satisfy these covenants or that our lenders will waive any failure to do so.so or amend these requirements. A breach of any of the covenants in, or our inability to maintain the required financial ratios under, our credit facilities would prevent us from borrowing additional money under our credit facilities and could result in a default under our credit facilities. If a default occurs under our credit facilities, the lenders could elect to declare the outstanding debt, together with accrued interest and other fees, to be immediately due and payable and foreclose on the collateral securing that debt, which could constitute all or substantially all of our assets. Moreover, in connection with any waivers or amendments to our credit facilities that we may obtain, our lenders may impose additional operating and financial restrictions on us or modify the terms of our existing credit facilities. These restrictions may further restrict our ability to, among other things, pay dividends, repurchase our common shares, make capital expenditures, or incur additional indebtedness.
Furthermore, our debt agreements contain cross-default provisions that may be triggered if we default under the terms of any one of our financing agreements. In the event of default by us under one of our debt agreements, the lenders under our other debt agreements could determine that we are in default under such other financing agreements. Such cross defaults could result in the acceleration of the maturity of such debt under these agreements and the lenders thereunder may foreclose upon any collateral securing that debt, including our vessels, even if we were to subsequently cure such default. In the event of such acceleration or foreclosure, we might not have sufficient funds or other assets to satisfy all of our obligations, which would have a material adverse effect on our business, results of operations and financial condition.
Please see “Item 5. Operating Financial Review and
Prospects—B.Prospects-B. Liquidity and Capital
Resources—Proposed Credit Facilities.Resources-Credit Facilities and Unsecured Notes.”
RISKS RELATING TO OUR COMMON SHARES
We are incorporated in the Marshall Islands, which does not have a well-developed body of corporate law.
Our corporate affairs are governed by our amended and restated articles of incorporation and bylaws and by the Marshall Islands Business Corporations Act, or the BCA. The provisions of the BCA resemble provisions of the corporation laws of a
number of states in the United States. However, there have been few judicial cases in the Marshall Islands interpreting the BCA. The rights and fiduciary responsibilities of directors under the laws of the Marshall Islands are not as clearly established as the rights and fiduciary responsibilities of directors under statutes or judicial precedent in existence in the United States. The rights of shareholders of companies incorporated in the Marshall Islands may differ from the rights of shareholders of companies incorporated in the United States. While the BCA provides that it is to be interpreted according to the laws of the State of Delaware and other states with substantially similar legislative provisions, there have been few, if any, court cases interpreting the BCA in the Marshall Islands and we
can’tcannot predict whether Marshall Islands courts would reach the same conclusions as
United StatesU.S. courts. Thus, you may have more difficulty in protecting your interests in the face of actions by the management, directors or controlling shareholders than would shareholders of a corporation incorporated in a
United StatesU.S. jurisdiction which has developed a relatively more substantial body of case law.
The market price of our common shares has fluctuated widely and may fluctuate widely in the future, or there may be no continuing public market for you to resell our common shares.
The market price of our common shares has fluctuated widely since our common shares began trading on the NYSE in December 2013, and may continue to do so as a result of many factors such as actual or anticipated fluctuations in our quarterly and annual results and those of other public companies in our industry, mergers and strategic alliances in the shipping industry, market conditions in the shipping industry, particularly the drybulk sector, changes in government regulation, shortfalls in our operating results from levels forecast by securities analysts, announcements concerning us or our competitors and the general state of the securities market. Further, there may be no continuing active or liquid public market for our common shares.
If the market price of our common shares falls below $5.00 per share, under NYSE rules, our shareholders will not be able to use such shares as collateral for borrowing in margin accounts. This inability to continue to use our common shares as collateral may lead to sales of such shares creating downward pressure on and increased volatility in the market price of our common shares.
On December 31, 2015, our board of directors effected a one-for-twelve reverse stock split of our common shares, par value $0.01 per share, and a reduction in the total number of authorized common shares to 56,250,000 shares. Our shareholders approved the reverse stock split and change in authorized common shares at a special meeting of shareholders held on December 23, 2015. The reverse stock split reduced the number of outstanding common shares from 344,239,098 shares to 28,686,561 shares. In June 2016, upon receiving shareholder approval, we further amended our Amended and Restated Articles of Incorporation to increase our total number of authorized common shares to 112,500,000.
The shipping industry has been highly unpredictable and volatile. The market for common shares in this industry may be equally volatile. Therefore, we cannot assure you that you will be able to sell any of our common shares you may have purchased at a price greater than or equal to its original purchase price, or that you will be able to sell them at all.
Future sales of our common shares could cause the market price of our common shares to decline.
Our amended and restated articles of incorporation authorize us to issue
450,000,000112,500,000 common shares, of which we have issued
138,098,93175,298,676 common shares as of
the date of this annual report.December 31, 2016. Sales of a substantial number of common shares in the public market, or the perception that these sales could occur, may depress the market price for our common shares. These sales could also impair our ability to raise additional capital through the sale of our equity securities in the future. We intend to issue additional common shares in the future. Our shareholders may incur dilution from any future equity offering and upon the issuance of additional common shares upon the exercise of options we grant to certain of our executive officers,
or upon the issuance of additional common shares pursuant to our equity incentive
plan or upon the issuance of common shares to SSH as payment of fees for arranging vessel acquisitions pursuant to the Administrative Services Agreement.plan.
Anti-takeover provisions in our organizational documents could have the effect of discouraging, delaying or preventing a merger or acquisition, or could make it difficult for our shareholders to replace or remove our current board of directors, which could adversely affect the market price of our common shares.
Several provisions of our amended and restated articles of incorporation and bylaws could make it difficult for our shareholders to change the composition of our board of directors in any one year, preventing them from changing the composition of management. In addition, the same provisions may discourage, delay or prevent a merger or acquisition that shareholders may consider favorable. These provisions include:
| ● | authorizing our board of directors to issue “blank check” preferred stock without stockholder approval; |
| ● | providing for a classified board of directors with staggered, three year terms; |
| ● | establishing certain advance notice requirements for nominations for election to our board of directors or for proposing matters that can be acted on by shareholders at stockholder meetings; |
| ● | prohibiting cumulative voting in the election of directors; |
authorizing our board of directors to issue “blank check” preferred stock without shareholder approval; | ● | limiting the persons who may call special meetings of shareholders; |
| ● | authorizing the removal of directors only for cause and only upon the affirmative vote of the holders of a majority of the outstanding common shares entitled to vote for the directors; and |
| ● | establishing supermajority voting provisions with respect to amendments to certain provisions of our amended and restated articles of incorporation and bylaws. |
providing for a classified board of directors with staggered, three-year terms;
establishing certain advance notice requirements for nominations for election to our board of directors or for proposing matters that can be acted on by shareholders at shareholder meetings;
prohibiting cumulative voting in the election of directors;
limiting the persons who may call special meetings of shareholders;
authorizing the removal of directors only for cause and only upon the affirmative vote of the holders of a majority of the outstanding common shares entitled to vote for the directors; and
establishing super majority voting provisions with respect to amendments to certain provisions of our amended and restated articles of incorporation and bylaws.
These anti-takeover provisions could substantially impede the ability of public shareholders to benefit from a change in control and, as a result, may adversely affect the market price of our common shares and your ability to realize any potential change of control premium.
We are an “emerging growth company” and we cannot be certain if the reduced disclosure requirements applicable to emerging growth companies will make our common shares less attractive to investors.
We are an “emerging growth company,” as defined in the JOBS Act, and we may take advantage of certain exemptions from various reporting requirements that are applicable to other public companies that are not “emerging growth companies” as described under “Item 4. Information on the Company—A. History and Development of the Company—Implications of Being an Emerging Growth Company.” We cannot predict if investors will find our common shares less attractive because we may rely on these exemptions. If some investors find our common shares less attractive as a result, there may be a less active trading market for our common shares and our share price may be more volatile.
In addition, under the JOBS Act, our independent registered public accounting firm will not be required to attest to the effectiveness of our internal control over financial reporting pursuant to Section 404 of the Sarbanes-Oxley Act of 2002 for so long as we are an emerging growth company. For as long as we take advantage of the reduced reporting obligations, the information that we provide shareholders may be different from information provided by other public companies.
Our costs of operating as a public company
will beis significant, and our management
will beis required to devote substantial time to complying with public company regulations.
We
recently becameare subject to the reporting requirements of the Securities Exchange Act of 1934, as amended, or the Exchange Act, and the other rules and regulations of the SEC, including the Sarbanes-Oxley Act of 2002, or the Sarbanes-Oxley Act, and as such, we will have significant legal, accounting and other
expenses that we did not incur as a private company.expenses. These reporting obligations impose various requirements on public companies, including changes in corporate governance practices, and these requirements may continue to evolve. We and our management personnel, and other personnel, if any,
will need to devote a substantial amount of time to comply with these requirements. Moreover, these rules and regulations increase our legal and financial compliance costs and make some activities more time-consuming and costly.
The Sarbanes-Oxley Act requires, among other things, that we maintain and periodically evaluate our internal control over financial reporting and disclosure controls and procedures. In particular, we need to perform system and process evaluation and testing of our internal control over financial reporting to allow management and our independent registered public accounting firm to report on the effectiveness of our internal control over financial reporting, as required by Section 404 of the Sarbanes-Oxley subject to the reduced disclosure requirements for emerging growth companies set forth above.Act. Our compliance with Section 404 may requirerequires that we incur substantial accounting expenses and expend significant management efforts.
|
| |
| ITEM 4. | INFORMATION ON THE COMPANY |
| |
| A. | Historyand Development of the Company |
Scorpio Bulkers Inc. is an international shipping company that was incorporated in the Republic of the Marshall Islands pursuant to the
Marshall Islands Business Corporations ActBCA on March 20, 2013. In December 2013, we completed our underwritten initial public offering of
31,300,0002,608,333 common shares at
$9.75$117.00 per share, and in January 2014, the underwriters in the initial public offering exercised their option to purchase an additional
4,695,000391,250 common shares. In February 2014, we completed our offer to exchange unregistered common shares that were previously issued in Norwegian equity private placements (other than the common shares owned by affiliates of us) for common shares that were registered under the Securities Act of 1933, as amended,
or the Securities Act, which we refer to as the Exchange Offer. Upon completion of the Exchange Offer, holders of
95,766,7797,980,565 unregistered common shares validly tendered their shares in exchange for such registered common shares, representing a participation rate of 99.7%.
On July 31, 2014, we delisted from the Norwegian Over-the-Counter List, or Norwegian OTC List. Our common shares
currently tradeare listed for trading on the New York Stock Exchange,
and Norwegian OTC Listor NYSE, under the symbol “SALT.”
Our principal executive offices are located at 9, Boulevard Charles III, Monaco 98000 and our telephone number at that location is
+377-9798-5716.Implications of Being an Emerging Growth Company
We were incorporated in the Republic of the Marshall Islands on March 20, 2013 for the purpose of acquiring newbuilding drybulk carriers.
We had less than $1.0 billion in revenue during our last fiscal year, which means that we qualify as an “emerging growth company” as defined in the Jumpstart Our Business Startups Act, or JOBS Act. An emerging growth company may take advantage of specified reduced reporting and other burdens that are otherwise applicable generally to public companies. These provisions include:
| ● |
| B. | the ability to present only two years of audited financial statements and only two years of related Management’s Discussion and Analysis of Financial Condition and Results of Operations in the registration statement for our initial public offering;Business Overview |
| ● | exemption from the auditor attestation requirement in the assessment of the emerging growth company’s internal controls over financial reporting; |
| ● | exemption from new or revised financial accounting standards applicable to public companies until such standards are also applicable to private companies; and |
| ● | exemption from compliance with any new requirements adopted by the Public Company Accounting Oversight Board, or the PCAOB, requiring mandatory audit firm rotation or a supplement to our auditor’s report in which the auditor would be required to provide additional information about the audit and our financial statement. |
We may take advantage of these provisions until the end of the fiscal year following the fifth anniversary of our initial public offering or such earlier time that we are no longer an emerging growth company. We will cease to be an emerging growth company if we have more than $1.0 billion in “total annual gross revenues” during our most recently completed fiscal year, if we become a “large accelerated filer” with market capitalization of more than $700 million, or as of any date on which we have issued more than $1.0 billion in non-convertible debt over the three year period to such date. As of the date of this annual report, we expect to become a “large accelerated filer” as of December 31, 2014, and, as a result we will cease to be an emerging growth company. For as long as we qualify as an emerging growth company and take advantage of the reduced reporting obligations, the information that we provide shareholders may be different from information provided by other public companies.
We are
choosing to “opt out” of the extended transition period relating to the exemption from new or revised financial accounting standardsan international shipping company that owns and
as a result, we will comply with new or revised accounting standards on the relevant dates on which adoption of such standards is required for non-emerging growth companies. Section 107 of the JOBS Act provides that our decision to opt out of the extended transition period for complying with new or revised accounting standards is irrevocable.We were formed for the purpose of acquiring and operatingoperates the latest generation of newbuilding drybulk carriers with fuel-efficient specifications and carrying capacities of greater than 30,000 dwt. All of our owned vessels have carrying capacities of greater than 60,000 dwt. Our vessels transport a broad range of major and minor bulk commodities, including ores, coal, grains, and fertilizers, along worldwide shipping routes, and are employed primarily in the spot market or in spot market-oriented pools of similarly sized vessels. As of the date of this annual report, we charter-in 17our operating fleet of 48 vessels consisted of 47 wholly-owned drybulk vessels and one chartered-in drybulk vessel, which we refer to collectively as our “Operating Fleet” (see below table for details). We also have contractsa contract for the construction of 79one newbuilding drybulk vessels at established shipyardsvessel, which is expected to be delivered to us in Japan, China, South Korea and Romania with an aggregatethe second quarter of 2017 (see below table for details). Upon delivery of this vessel, our owned fleet is expected to have a total carrying capacity of approximately 8.73.4 million dwt, which we have agreed to acquire for an aggregate purchase price of $3,071.5 million, which we refer to as our Newbuilding Program. We expect to take delivery of the vessels in our Newbuilding Program as follows: two in 2014, 41 in 2015 and 36 in 2016.
dwt.
The following
table setstables set forth certain summary information regarding our
fleetOperating Fleet and vessel under construction as of the date of this annual report:
Vessels Under Construction
| | | | | |
| | | Expected | | |
| | Vessel Name | Delivery (1) | DWT | Shipyard |
| | Capesize Vessels | | | |
| 1 | SBI Puro | Q1-15 | 180,000 | Shanghai Waigaoqiao Shipbuilding Co., Ltd. |
| 2 | SBI Valrico | Q2-15 | 180,000 | Shanghai Waigaoqiao Shipbuilding Co., Ltd. |
| 3 | SBI Maduro | Q3-15 | 180,000 | Shanghai Waigaoqiao Shipbuilding Co., Ltd. |
| 4 | SBI Belicoso | Q4-15 | 180,000 | Shanghai Waigaoqiao Shipbuilding Co., Ltd. |
| 5 | SBI Corona | Q1-16 | 180,000 | Shanghai Waigaoqiao Shipbuilding Co., Ltd. |
| 6 | SBI Diadema | Q2-16 | 180,000 | Shanghai Waigaoqiao Shipbuilding Co., Ltd. |
| 7 | SBI Estupendo | Q3-16 | 180,000 | Shanghai Waigaoqiao Shipbuilding Co., Ltd. |
| 8 | SBI Montesino | Q2-15 | 180,000 | Sungdong Shipbuilding & Marine Engineering Co., Ltd. |
| 9 | SBI Magnum | Q3-15 | 180,000 | Sungdong Shipbuilding & Marine Engineering Co., Ltd. |
| 10 | SBI Montecristo | Q3-15 | 180,000 | Sungdong Shipbuilding & Marine Engineering Co., Ltd. |
| 11 | SBI Aroma | Q3-15 | 180,000 | Sungdong Shipbuilding & Marine Engineering Co., Ltd. |
| 12 | SBI Cohiba | Q4-15 | 180,000 | Sungdong Shipbuilding & Marine Engineering Co., Ltd. |
| 13 | SBI Habano | Q4-15 | 180,000 | Sungdong Shipbuilding & Marine Engineering Co., Ltd. |
| 14 | SBI Lonsdale | Q1-16 | 180,000 | Sungdong Shipbuilding & Marine Engineering Co., Ltd. |
| 15 | SBI Partagas | Q1-16 | 180,000 | Sungdong Shipbuilding & Marine Engineering Co., Ltd. |
| 16 | SBI Parejo | Q2-16 | 180,000 | Sungdong Shipbuilding & Marine Engineering Co., Ltd. |
| 17 | SBI Toro | Q2-16 | 180,000 | Sungdong Shipbuilding & Marine Engineering Co., Ltd. |
| 18 | SBI Tuscamina | Q2-16 | 180,000 | Sungdong Shipbuilding & Marine Engineering Co., Ltd. |
| 19 | SBI Camacho | Q2-15 | 180,000 | Sungdong Shipbuilding & Marine Engineering Co., Ltd. |
| 20 | SBI Churchill | Q4-15 | 180,000 | Daewoo Mangalia Heavy Industries S.A. |
| 21 | SBI Perfecto | Q1-16 | 180,000 | Daewoo Mangalia Heavy Industries S.A. |
| 22 | SBI Presidente | Q4-15 | 180,000 | Daewoo Mangalia Heavy Industries S.A. |
| 23 | SBI Panatela | Q1-16 | 180,000 | Daewoo Mangalia Heavy Industries S.A. |
| 24 | SBI Robusto | Q2-16 | 180,000 | Daewoo Mangalia Heavy Industries S.A. |
| 25 | SBI Behike | Q3-15 | 180,000 | Daehan Shipbuilding Co., Ltd. |
| 26 | SBI Monterray | Q4-15 | 180,000 | Daehan Shipbuilding Co., Ltd. |
| 27 | SBI Macanudo | Q4-15 | 180,000 | Daehan Shipbuilding Co., Ltd. |
| 28 | SBI Cuaba | Q1-16 | 180,000 | Daehan Shipbuilding Co., Ltd. |
| | Capesize NB DWT | | 5,040,000 | |
| | | | | |
| | Kamsarmax Vessels | | | |
| | | | | |
| 1 | SBI Cakewalk | Q2-14 | 82,000 | Shanghai Waigaoqiao Shipbuilding Co., Ltd. |
| 2 | SBI Charleston | Q3-14 | 82,000 | Shanghai Waigaoqiao Shipbuilding Co., Ltd. |
| 3 | SBI Samba | Q1-15 | 84,000 | Imabari Shipbuilding Co., Ltd. |
| 4 | SBI Rumba | Q3-15 | 84,000 | Imabari Shipbuilding Co., Ltd. |
| 5 | SBI Electra | Q3-15 | 82,000 | Jiangsu Yangzijiang Shipbuilding Co., Ltd. |
| 6 | SBI Flamenco | Q3-15 | 82,000 | Jiangsu Yangzijiang Shipbuilding Co., Ltd. |
| 7 | SBI Rock | Q4-15 | 82,000 | Jiangsu Yangzijiang Shipbuilding Co., Ltd. |
| 8 | SBI Twist | Q1-16 | 82,000 | Jiangsu Yangzijiang Shipbuilding Co., Ltd. |
| 9 | SBI Salsa | Q3-15 | 81,600 | Tsuneishi Group (Zhoushan) Shipbuilding Inc. |
| 10 | SBI Merengue | Q1-16 | 81,600 | Tsuneishi Group (Zhoushan) Shipbuilding Inc. |
| 11 | SBI Capoeira | Q3-15 | 82,000 | Hudong-Zhonghua (Group) Co., Ltd. |
| 12 | SBI Conga | Q3-15 | 82,000 | Hudong-Zhonghua (Group) Co., Ltd. |
| 13 | SBI Bolero | Q3-15 | 82,000 | Hudong-Zhonghua (Group) Co., Ltd. |
| 14 | SBI Carioca | Q4-15 | 82,000 | Hudong-Zhonghua (Group) Co., Ltd. |
| 15 | SBI Sousta | Q4-15 | 82,000 | Hudong-Zhonghua (Group) Co., Ltd. |
| 16 | SBI Reggae | Q1-16 | 82,000 | Hudong-Zhonghua (Group) Co., Ltd. |
| 17 | SBI Lambada | Q1-16 | 82,000 | Hudong-Zhonghua (Group) Co., Ltd. |
| 18 | SBI Zumba | Q1-16 | 82,000 | Hudong-Zhonghua (Group) Co., Ltd. |
| 19 | SBI Macerena | Q2-16 | 82,000 | Hudong-Zhonghua (Group) Co., Ltd. |
| 20 | SBI Swing | Q3-16 | 82,000 | Hudong-Zhonghua (Group) Co., Ltd. |
| 21 | SBI Jive | Q3-16 | 82,000 | Hudong-Zhonghua (Group) Co., Ltd. |
| 22 | SBI Parapara | Q2-16 | 82,000 | Hudong-Zhonghua (Group) Co., Ltd. |
| 23 | SBI Mazurka | Q2-16 | 82,000 | Hudong-Zhonghua (Group) Co., Ltd. |
| | Kamsarmax NB DWT | 1,889,200 | |
| | | | | |
| | Ultramax Vessels | | | |
| | | | | |
| 1 | SBI Echo | Q3-15 | 61,000 | Imabari Shipbuilding Co., Ltd. |
| 2 | SBI Cronos | Q1-16 | 61,000 | Imabari Shipbuilding Co., Ltd. |
| 3 | SBI Tango | Q4-15 | 61,000 | Imabari Shipbuilding Co., Ltd. |
| 4 | SBI Hermes | Q1-16 | 61,000 | Imabari Shipbuilding Co., Ltd. |
| 5 | SBI Hera | Q2-16 | 60,200 | Mitsui Engineering & Shipbuilding Co., Ltd. |
| 6 | SBI Zeus | Q2-16 | 60,200 | Mitsui Engineering & Shipbuilding Co., Ltd. |
| 7 | SBI Poseidon | Q3-16 | 60,200 | Mitsui Engineering & Shipbuilding Co., Ltd. |
| 8 | SBI Apollo | Q3-16 | 60,200 | Mitsui Engineering & Shipbuilding Co., Ltd. |
| 9 | SBI Bravo | Q1-15 | 61,000 | Nantong COSCO KHI Ship Engineering Co. Ltd. |
| 10 | SBI Antares | Q1-15 | 61,000 | Nantong COSCO KHI Ship Engineering Co. Ltd. |
| 11 | SBI Maia | Q3-15 | 61,000 | Nantong COSCO KHI Ship Engineering Co. Ltd. |
| 12 | SBI Hydra | Q3-15 | 61,000 | Nantong COSCO KHI Ship Engineering Co. Ltd. |
| 13 | SBI Hyperion | Q2-16 | 61,000 | Nantong COSCO KHI Ship Engineering Co. Ltd. |
| 14 | SBI Tethys | Q2-16 | 61,000 | Nantong COSCO KHI Ship Engineering Co. Ltd. |
| 15 | SBI Leo | Q2-15 | 61,000 | Dalian COSCO KHI Ship Engineering Co. Ltd. |
| 16 | SBI Lyra | Q3-15 | 61,000 | Dalian COSCO KHI Ship Engineering Co. Ltd. |
| 17 | SBI Subaru | Q3-15 | 61,000 | Dalian COSCO KHI Ship Engineering Co. Ltd. |
| 18 | SBI Ursa | Q4-15 | 61,000 | Dalian COSCO KHI Ship Engineering Co. Ltd. |
| 19 | SBI Athena | Q1-15 | 64,000 | Chengxi Shipyard Co. Ltd. |
| 20 | SBI Pegasus | Q3-15 | 64,000 | Chengxi Shipyard Co. Ltd. |
| 21 | SBI Orion | Q4-15 | 64,000 | Chengxi Shipyard Co. Ltd. |
| 22 | SBI Thalia | Q4-15 | 64,000 | Chengxi Shipyard Co. Ltd. |
| 23 | SBI Hercules | Q1-16 | 64,000 | Chengxi Shipyard Co. Ltd. |
| 24 | SBI Kratos | Q2-16 | 64,000 | Chengxi Shipyard Co. Ltd. |
| 25 | SBI Perseus | Q2-16 | 64,000 | Chengxi Shipyard Co. Ltd. |
| 26 | SBI Samson | Q2-16 | 64,000 | Chengxi Shipyard Co. Ltd. |
| 27 | SBI Phoebe | Q2-16 | 64,000 | Chengxi Shipyard Co. Ltd. |
| 28 | SBI Phoenix | Q3-16 | 64,000 | Chengxi Shipyard Co. Ltd. |
| | Ultramax NB DWT | | 1,734,800 | |
| | | | | |
| | Total Newbuild DWT | 8,664,000 | |
| Owned fleet |
| | | | | | | |
| Vessel Name | | Year Built | | DWT | | Vessel Type |
| SBI Cakewalk | | 2014 | | 82,000 |
| | Kamsarmax |
| SBI Charleston | | 2014 | | 82,000 |
| | Kamsarmax |
| SBI Samba | | 2015 | | 84,000 |
| | Kamsarmax |
| SBI Rumba | | 2015 | | 84,000 |
| | Kamsarmax |
| SBI Capoeira | | 2015 | | 82,000 |
| | Kamsarmax |
| SBI Electra | | 2015 | | 82,000 |
| | Kamsarmax |
| SBI Carioca | | 2015 | | 82,000 |
| | Kamsarmax |
| SBI Conga | | 2015 | | 82,000 |
| | Kamsarmax |
| SBI Flamenco | | 2015 | | 82,000 |
| | Kamsarmax |
| SBI Bolero | | 2015 | | 82,000 |
| | Kamsarmax |
| SBI Sousta | | 2016 | | 82,000 |
| | Kamsarmax |
| SBI Rock | | 2016 | | 82,000 |
| | Kamsarmax |
| SBI Lambada | | 2016 | | 82,000 |
| | Kamsarmax |
| SBI Reggae | | 2016 | | 82,000 |
| | Kamsarmax |
| SBI Zumba | | 2016 | | 82,000 |
| | Kamsarmax |
| SBI Macarena | | 2016 | | 82,000 |
| | Kamsarmax |
| SBI Parapara | | 2017 | | 82,000 |
| | Kamsarmax |
| SBI Mazurka | | 2017 | | 82,000 |
| | Kamsarmax |
| SBI Swing | | 2017 | | 82,000 |
| | Kamsarmax |
| Total Kamsarmax | | | | 1,562,000 |
| | |
| | | | | | | |
| SBI Antares | | 2015 | | 61,000 |
| | Ultramax |
| SBI Athena | | 2015 | | 64,000 |
| | Ultramax |
| SBI Bravo | | 2015 | | 61,000 |
| | Ultramax |
| SBI Leo | | 2015 | | 61,000 |
| | Ultramax |
| SBI Echo | | 2015 | | 61,000 |
| | Ultramax |
| SBI Lyra | | 2015 | | 61,000 |
| | Ultramax |
| SBI Tango | | 2015 | | 61,000 |
| | Ultramax |
| SBI Maia | | 2015 | | 61,000 |
| | Ultramax |
| SBI Hydra | | 2015 | | 61,000 |
| | Ultramax |
| SBI Subaru | | 2015 | | 61,000 |
| | Ultramax |
| SBI Pegasus | | 2015 | | 64,000 |
| | Ultramax |
| SBI Ursa | | 2015 | | 61,000 |
| | Ultramax |
| SBI Thalia | | 2015 | | 64,000 |
| | Ultramax |
| SBI Cronos | | 2015 | | 61,000 |
| | Ultramax |
| SBI Orion | | 2015 | | 64,000 |
| | Ultramax |
| SBI Achilles | | 2016 | | 61,000 |
| | Ultramax |
| SBI Hercules | | 2016 | | 64,000 |
| | Ultramax |
| SBI Perseus | | 2016 | | 64,000 |
| | Ultramax |
| SBI Hermes | | 2016 | | 61,000 |
| | Ultramax |
| SBI Zeus | | 2016 | | 60,200 |
| | Ultramax |
| SBI Hera | | 2016 | | 60,200 |
| | Ultramax |
| SBI Hyperion | | 2016 | | 61,000 |
| | Ultramax |
| SBI Tethys | | 2016 | | 61,000 |
| | Ultramax |
| SBI Phoebe | | 2016 | | 64,000 |
| | Ultramax |
|
| | | | | | | |
| Vessel Name | | Year Built | | DWT | | Vessel Type |
| SBI Poseidon | | 2016 | | 60,200 |
| | Ultramax |
| SBI Apollo | | 2016 | | 60,200 |
| | Ultramax |
| SBI Samson | | 2017 | | 64,000 |
| | Ultramax |
| SBI Phoenix | | 2017 | | 64,000 |
| | Ultramax |
| Total Ultramax | | | | 1,731,800 |
| | |
| Aggregate Owned DWT | | | | 3,293,800 |
| | |
Time chartered-in vessel
|
| | | | | | | | | | | | | | | |
| Vessel Type | | Year Built | | DWT | | Where Built | | Daily Base Rate | | Earliest Expiry |
| Kamsarmax | | 2012 | | 82,000 |
| | South Korea | | $ | 15,500 |
| | 30-Jul-17 | | (1) |
| Aggregate Time Chartered-in DWT | 82,000 |
| | | | |
| | | | |
| (1) | Expected delivery date relates to quarter during which each vessel is currently expected to be delivered from the shipyard. |
Chartered in Vessels
| Vessel Type | | Year Built | | | DWT | | | Where Built | | Daily Base Rate | | | Earliest Expiry |
| Post-Panamax | | | 2010 | | | | 93,000 | | | China | | | $13,250 | | | 28-Oct-14 (1) |
| Post-Panamax | | | 2011 | | | | 93,000 | | | China | | | $13,500 | | | 31-Oct-14 (2) |
| Kamsarmax | | | 2009 | | | | 82,500 | | | Japan | | | $14,500 | | | 28-Feb-15 (3) |
| Kamsarmax | | | 2012 | | | | 82,000 | | | South Korea | | | $15,500 | | | 31-Jul-17 (4) |
| Kamsarmax | | | 2012 | | | | 81,500 | | | South Korea | | | $14,500 | | | 31-Dec-14 (5) |
| Kamsarmax | | | 2011 | | | | 81,500 | | | South Korea | | | $15,000 | | | 31-Jan-16 (6) |
| Kamsarmax | | | 2012 | | | | 81,000 | | | South Korea | | | $15,000 | | | 28-Feb-15 (7) |
| Kamsarmax | | | 2012 | | | | 79,500 | | | China | | | $14,000 | | | 1-Jan-15 (8) |
| Panamax | | | 2004 | | | | 77,500 | | | China | | | $14,000 | | | 31-Jan-17 (9) |
| Panamax | | | 2014 | | | | 77,000 | | | Japan | | | $16,000 | | | 31-Mar-15 (10) |
| Panamax | | | 2009 | | | | 76,500 | | | Japan | | | $15,900 | | | 23-Jun-14 (11) |
| Panamax | | | 2007 | | | | 75,500 | | | South Korea | | | $13,750 | | | 28-Feb-14 (12) |
| Ultramax | | | 2010 | | | | 61,000 | | | Japan | | | $14,200 | | | 1-Apr-17 (13) |
| Supramax | | | 2010 | | | | 58,000 | | | China | | | $14,250 | | | 31-Dec-16 (14) |
| Supramax | | | 2011 | | | | 58,000 | | | China | | | $13,750 | | | 31-Jan-15 (15) |
| Supramax | | | 2015 | | | | 55,000 | | | Japan | | | $14,000 | | | 30-Jun-18 (16) |
| Handymax | | | 2002 | | | | 48,500 | | | Japan | | | $12,000 | | | 31-Jan-17 (17) |
| Total TC DWT | | | | | | | 1,261,000 | | | | | | | | | |
| (1) | This vessel has been time chartered-in for eight to 10 months at Company’s option at $13,250 per day. The vessel was delivered on February 23, 2014. |
| (2) | This vessel has been time chartered-in for seven to nine months at the Company’s option at $13,500 per day. This vessel was delivered on March 24, 2014. |
| (3) | This vessel has been time chartered-in for 11 to 13 months at the Company’s option at $14,500 per day. The Company has the option to extend this time charter for one year at $15,500 per day. The vessel was delivered on March 8, 2014. |
| (4) | This vessel has been time chartered-in for 39 to 44 months at the Company’s option at $15,500 per day. The Company has the option to extend this time charter for one year at $16,300 per day. The vessel is expected to bewas delivered inon April 23, 2014. |
In addition, we have a profit and loss sharing agreement in place as of December 31, 2016 for a Panamax vessel that we previously chartered in, pursuant to which we have agreed to split all the vessel’s profits and losses for a two year period. Vessel Under Construction | (5) | This vessel has been time chartered-in for 10 to 12 months at Company’s option at $14,500 per day. The vessel was delivered on February 7, 2014. |
| (6) | This vessel has been time-chartered in for 23 to 28 months at the Company’s option at $15,000 per day. The Company has the option to extend the charter for an additional 11 to 13 months at $16,000 per day. This vessel was delivered on February 15, 2014. |
| (7) | This vessel has been time chartered-in for 12 to 14 months at Company’s option at $15,000 per day. The vessel was delivered on February 10, 2014. |
| (8) | This vessel has been time chartered-in for 11 to 14 month at the Company’s option at $14,000 per day. The Company has the option to extend the charter for an additional 11 to 14 months at $14,750 per day. This vessel was delivered on February 23, 2014. |
| (9) | This vessel has been time-chartered in for 32 to 38 months at the Company’s option at $14,000 per day. The vessel is expected to be delivered by June 2014. |
| (10) | This vessel has been time chartered-in for 12 to 13 months at Company’s option at $16,000 per day. The vessel was delivered on March 4, 2014. |
| (11) | This vessel has been time chartered-in for five to seven months at Company’s option at $15,900 per day. The vessel was delivered on January 23, 2014. |
| (12) | This vessel has been time chartered-in for 11 to 13 months at the Company’s option at $13,750 per day. The Company has the option to extend the charter for an additional year at $14,750 per day. The vessel was delivered on March 14, 2014. |
| (13) | This vessel has been time-chartered in for three years at $14,200 per day. The Company has options to extend the charter for up to three consecutive one year periods at $15,200 per day, $16,200 per day and $17,200 per day, respectively. This vessel is expected to be delivered during April 2014. |
| (14) | This vessel has been time-chartered in for 20 to 24 month at the Company’s option at $14,250 per day. The Company has the option to extend the charter for an additional 10 to 12 months at $14,850 per day. This vessel is expected to be delivered during the second quarter of 2014. |
| (15) | This vessel has been time-chartered in for 10 to 13 month at the Company’s option at $13,750 per day. This vessel was delivered on March 18, 2014. |
| (16) | This vessel has been time-chartered in for three years at $14,000 per day. The Company has options to extend the charter for up to two consecutive one year periods at $15,000 per day and $16,000 per day, respectively. This vessel is expected to be delivered during the first half of 2015. |
| (17) | This vessel has been time chartered-in for 34 to 37 months at the Company’s option at $12,000 per day. The Company has options to extend the charter for up to three consecutive one year periods at $12,750 per day, $13,600 per day and $14,800 per day, respectively. This vessel is expected to be delivered during April 2014. |
|
| | | | | |
| Kamsarmax Vessel | | | |
| | Vessel Name | Expected
Delivery | DWT | Shipyard |
| 1 | Hull S1233 - TBN SBI Jive | Q2-17 | 82,000 |
| Hudong-Zhonghua Shipbuilding (Group) Co., Inc. |
| | Aggregate Kamsarmax Newbuilding DWT
| 82,000 |
| |
Employment of Our Fleet
Generally, we intend to
We typically operate our vessels in spot market-oriented commercial pools, in the spot market or, under certain circumstances, on time charters.
Spot Market-Oriented Commercial Pools
To increase vessel utilization and thereby revenues, we
intend to participate in commercial pools with other shipowners with similar modern, well-maintained vessels. By operating a large number of vessels as an integrated transportation system, commercial pools offer customers greater flexibility and a higher level of service while achieving scheduling efficiencies. Pools employ experienced commercial managers and operators who have close working relationships with customers and brokers, while technical management is performed by each shipowner. The managers of the pools negotiate charters with customers primarily in the spot
market.market but may also arrange time charter agreements. The size and scope of these pools enable them to enhance vessel utilization rates for pool vessels by securing backhaul voyages, which is when cargo is transported on the return leg of a journey, and contracts of
contracts of affreightment, or COAs, thus generating higher effective
time charter equivalent, or TCE, revenues than otherwise might be obtainable in the spot market, while providing a higher level of service offerings to customers.
AllAs of the date of this annual report, all of the vessels in our chartered-in vesselsOperating Fleet are employed in a spot market-oriented commercial pool managed by our commercial manager, or a Scorpio Group Pool, which exposes us to fluctuations in spot market charter rates. In addition, we expect that each of the vessels in our Newbuilding Program, following their delivery to us,drybulk vessel that is currently under construction will initially be employed in a Scorpio Group Pool. The Scorpio Group Pools have been newly formed or will be formed priorPool following its delivery to the delivery of the vessels in our Newbuilding Program.us. Our vessels are expected to participate in the Scorpio Group Pools under the same contractual terms and conditions as the third party vessels in the pool. Each pool will aggregateaggregates the revenues and expenses of all of the pool participants and distributedistributes the net earnings calculated on (i) the number of pool points for the vessel, which are based on vessel attributes such as cargo carrying capacity, fuel consumption, and construction characteristics, and (ii) the number of days the vessel operatesoperated in the period. SCM, a Monaco corporation controlled by the Lolli-Ghetti family of which our co-founder, Chairman and Chief Executive Officer is a member, as is our Vice President, is responsible for the administration of the pool and the commercial
management of the participating vessels, including marketing the pool, negotiating charters, including voyage charters, short duration time charters and COAs, conducting pool operations, including the distribution of pool cash earnings, and managing bunker (fuel oil) purchases, port charges and administrative services for the vessels. SCM, as operator of the Scorpio Group Pools, charges $300 a day for each vessel, whether owned by us or chartered-in, plus a 1.75% commission on the gross revenues per charter fixture.
SCM is expected to negotiate voyage charters, short duration time charters, and contractsSee “-Management of
affreightment; manages procurement of bunkers, port charges and administrative services; and distributes the cash earnings.SCM, a Monaco corporation controlled by the Lolli-Ghetti family of which our co-founder, Chairman and Chief Executive Officer is a member, is or will be responsible for the administration of the pool and the commercial management of the participating vessels, including the marketing, chartering, operating and bunker (fuel oil) purchases for the vessels. Business” below.
The pool participants
will remain responsible for all other costs including the financing, insurance, manning and technical management of their vessels. The earnings of all of the vessels
will beare aggregated and divided according to the relative performance capabilities of the vessel and the actual earning days each vessel is available.
A spot market voyage charter is generally a contract to carry a specific cargo from a load port to a discharge port for an agreed freight per ton of cargo or a specified total amount. Under spot market voyage charters, we pay specific voyage expenses such as port, canal and bunker costs. Spot charter rates are volatile and fluctuate on a seasonal and year-to-year basis.
Fluctuations derive from imbalances in the availability of cargoes for shipment and the number of vessels available at any given time to transport these cargoes. Vessels operating in the spot market generate revenue that is less predictable
than those under time charters, but may enable us to capture increased profit margins during periods of improvements in drybulk vessel charter rates.
Downturns in the drybulk industry would result in a reduction in profit margins.
Time charters give us a fixed and stable cash flow for a known period of time. Time charters also mitigate in part the
volatility and seasonality of the spot market business, which is generally weaker in the second and third quarters of the year.
In the future, we mayWe opportunistically
look to enter ouremploy vessels
intounder time charter
contracts should rates become more attractive.contracts. We may also enter into time charter contracts with profit sharing agreements, which enable us to benefit
ifwhen the spot market
increases.rates increase.
Management of Our Business
On September 29, 2016, we agreed to amend our master agreement, or the Master Agreement, with SCM and SSM, and our administrative services agreement, or the Administrative Services Agreement, with Scorpio Services Holding Limited, or SSH, under a deed of amendment, or the Deed of Amendment. Pursuant to the terms of the Deed of Amendment, on December 9, 2016, we entered into definitive documentation to memorialize the agreed amendments to the Master Agreement, or the Amended and Restated Master Agreement. The Amended and Restated Master Agreement and the Administrative Services Agreement as amended by the Deed of Amendment, or the Amended Administrative Services Agreement, are effective as from September 29, 2016.
Pursuant to the Amended and Restated Master Agreement, effective beginning on the fifth day within any 20 trading day period that the closing price of our common shares on the NYSE is equal to or greater than $5.00, the commission payable for commercial management would be reinstated to 1.75% of all monies earned by a vessel from 1%. As of close of trading on the NYSE on November 18, 2016, the condition was met and the commission payable for commercial management was reinstated to 1.75% of all monies earned by a vessel, effective November 19, 2016.
Set forth below is a description of the other material terms of the Amended and Restated Master Agreement and the Amended Administrative Services Agreement. Please also see Note 13, Related Party Transactions, to the Consolidated Financial Statements included herein for additional information.
Commercial and Technical Management
- Amended and Restated Master Agreement
Our vessels are commercially managed by SCM and technically managed by SSM pursuant to
athe Amended and Restated Master Agreement, which may be terminated by either party upon 24
months’ notice, unless terminated earlier in accordance with the provisions of the Amended and Restated Master Agreement. In the event of the sale of one or more vessels, a notice period of three months’ and a payment equal to three months
notice.of management fees will apply, provided that the termination does not amount to a change of control, including a sale of substantially all vessels, in which case a payment equal to 24 months of management fees will apply. SCM and SSM are companies affiliated with us. The
vesselsvessel we charter-in
areis also commercially managed by SCM. We expect that additional vessels that we may
charter-in or acquire in the future,
includingand the
vessels in our Newbuilding Program,drybulk vessel that is expected to be delivered to us during the second quarter of 2017, will also be managed under the
Amended and Restated Master Agreement or on substantially similar terms.
SCM’s services include securing employment for our vessels in the spot market andor on time charters. SCM also manages the Scorpio Group Pools in which our vessels are or are expected to be, employed. For commercial management of any of our vessels that does not
operate in one of these pools, we pay SCM a daily fee of $300 per vessel, plus a 1.75% commission on the gross revenues per charter fixture. The Scorpio Group Pool participants, including us and third-party owners,
of similar vessels, are each expected to pay SCM a pool management fee of $300 per vessel per day, plus a 1.75% commission on the gross revenues per charter fixture.
SSM’s services include providing technical support, such as arranging the hiring of qualified officers and crew, supervising the maintenance and performance of vessels, purchasing supplies, spare parts and new equipment, arranging and supervising drydocking and repairs, and monitoring regulatory and classification society compliance and customer standards. We
will pay SSM an annual fee of $200,000 per vessel to provide technical management services for each of our
vessels in the Newbuilding Program upon delivery.owned vessels. In addition, representatives of SSM, including certain subcontractors, provide us with construction supervisory services while our vessels are being constructed in shipyards. For these services, we compensate SSM for its direct expenses, which can vary between $200,000 and $500,000 per vessel. Please see “Item 7. Major Shareholders and Related Party Transactions—B. Related Party Transactions—Commercial and Technical Management Agreements” for additional information.
Amended Administrative Services Agreement
We have entered into an Amended Administrative Services Agreement with SSH for the provision of administrative staff, office space and accounting, legal compliance, financial and information technology services. SSH is a company affiliated with us. SSH also arranges acquisitions for us. The services provided to us by SSH may be sub-contracted to other entities within the Scorpio Group. Pursuant to the Amended Administrative Services Agreement, we will reimburse SSH for the reasonable direct or indirect expenses it incurs in providing us with the administrative services described above and a pro-rata portion of the salary incurred by SSH for an internal auditor. above.
We will also paypaid SSH a fee, payable in our common shares, for arranging vessel acquisitions, including newbuildings, equal to $250,000 per vessel, due upon delivery of the vessel, which is payable in our common shares. We have agreed to issue upon delivery of each vessel in our Newbuilding Program (i) 31,250 common shares to SSH as payment related to each of the first 17 vessels in our Newbuilding Program; (ii) 25,811 common shares to SSH as payment related to each of the next nine vessels in our Newbuilding Program; (iii) 25,633 common shares to SSH as payment related to each of the next ten vessels in our Newbuilding Program; (iv) 26,419 common shares to SSH as payment related to each of the next four Kamsarmax vessels in our Newbuilding Program; (v) 26,185 common shares to SSH as payment related to each of the next three Capesize vessels in our Newbuilding Program; (vi) 26,197 common shares to SSH as payment related to each of the next two vessels in our Newbuilding Program; (vii) 26,396 common shares to SSH as payment related to each of the next seven vessels in our Newbuilding Program; (viii) 26,248 common shares to SSH as payment related to each of the next four vessels in our Newbuilding Program; (ix) 26,111 common shares to SSH as payment related to each of the next four vessels in our Newbuilding Program; (x) 26,050 common shares to SSH as payment related to each of the next three vessels in our Newbuilding Program; (xi) 25,888 common shares to SSH as payment related to each of the next 11 vessels in our Newbuilding Program and (xii) 25,438 common shares to SSH as payment related to each of the next five vessels in our Newbuilding Program. For all vessels added to our Newbuilding Program after the first 17 vessels, the numbernewbuildings. The amount of common shares issuable to SSH as payment is based onpayable was determined by dividing $250,000 by the market value of our common shares based on the volume weighted average price of our common shares over the 30 trading day period immediately preceding the contract date of a definitive agreement to acquire any vessel. As of the date of this annual report, we issued an aggregate of 178,580common shares to SSH in connection with the deliveries of our newbuilding vessels, and expect to issue an additional 2,136 common shares to SSH upon the delivery of the remaining drybulk vessel under construction. In addition, November 2014, SSH agreed to waive its fee on vessel acquisitions contracted after November 20, 2014, for so long as the closing price of our common shares remained below a specified threshold. Effective September 29, 2016, this fee was eliminated on all future acquisitions.
SSH has agreed
with us not to own any drybulk carriers greater than 30,000 dwt for so long as the
Amended Administrative Services Agreement is in full force and effect. This agreement may be terminated by SSH
three years followingafter the third anniversary of our initial public offering upon 12
monthsmonths’ prior written notice or by us with 24 months’ notice.
Recent and Other Developments
Newbuilding Vessels
In
Fleet Updates
During the period from January 2014,1, 2017 through February 28, 2017, we announcedtook delivery of the following newbuilding vessels:
SBI Samson, an Ultramax vessel, was delivered from Chengxi Shipyard Co. Ltd.
SBI Parapara, a Kamsarmax vessel, was delivered from Hudong-Zhonghua (Group) Co., Ltd.
SBI Swing, a Kamsarmax vessel, was delivered from Hudong-Zhonghua (Group) Co., Ltd.
SBI Phoenix, an Ultramax vessel, was delivered from Chengxi Shipyard Co. Ltd.
SBI Mazurka, a Kamsarmax vessel, was delivered from Hudong-Zhonghua (Group) Co., Ltd.
As of December 31, 2016, we had a profit and loss sharing agreement in place for a Panamax vessel that we had entered into agreementspreviously chartered in, pursuant to which we have agreed to split all of the vessel’s profits and losses for a two-year period.
Credit Facility Amendments
During the constructionfourth quarter of 22 drybulk vessels, consisting2016, we agreed with our lenders to amend the interest coverage ratio requirement in each of 20 Capesize vessels and two Kamsarmax vessels, for an aggregate purchase price of approximately $1,173 million, with expected deliveries betweenthe applicable credit facilities, as such term is defined in each such credit facility, such that the interest coverage ratio will be waived until the first quarter of 2015 through2019, at which point we will be required to maintain an interest coverage ratio of at least 1.00 to 1.00 (calculated on a year to date basis) for the quarters ending March 31, 2019 and June 30, 2019, 2.50 to 1.00 for the quarter ending September 30, 2019 (calculated on a year-to-date basis) and 2.50 to 1.00 for each quarter thereafter (calculated on a trailing four quarter basis).
During the fourth quarter of 2016, we also agreed with the lenders under certain of our credit facilities to amend the covenants thereunder related to the "leverage ratio" and "consolidated net worth" to exclude from such calculations $100.0 million of historical non-operating losses (which is in addition to other exclusions that our lenders previously agreed to, for certain non-
operating items, including impairments). Certain of our lenders have agreed to amend the above-mentioned definitions in the second quarter of 2016. We plan2016 to financeexclude all historical incurred losses/write downs on assets sold, all historical incurred losses on termination of shipbuilding contracts and certain future non-operating items including impairments.
Furthermore, during the
purchase pricefourth quarter of
these vessels with cash on hand and anticipated borrowings under future credit facilities.Chartered-in Vessels
In February and March 2014,2016, we agreed with certain of our lenders to time charter-in 17 drybulk vessels, consisting of six Kamsarmax vessels,add four, Panamax vessels, and two Post-Panamaxseven or eight quarterly installment payments, depending on the vessel, one Ultramax vessel, three Supramax vessels and one Handymax vessel. Please see “—Our Fleet” for information on these vessels.
Exchange Offer
On February 12, 2014, we completed our offer to exchange unregistered common shares that were previously issued in Norwegian equity private placements (other than the common shares owned by affiliates of us) for common shares that were registered under the Securities Act of 1933, as amended, which we refer to as the Exchange Offer. Upon completion of the Exchange Offer, holders of 95,766,779 unregistered common shares validly tendered their sharesrespective balloon payments in exchange for such registered common shares, representingadvance principal repayments. As a participation rateresult of 99.7%.
Proposed $67.5these agreements, we will not have to make the next eight, fourteen or sixteen scheduled quarterly installment payments, depending on the vessel.
Lastly, we agreed with the lender under our $39.6 Million
Senior Secured Credit Facility
In February 2014, we signed a commitment letter for a $67.5 million credit facility with a leading European financial institution. The proceeds of this facility are expected to be usedextend the maturity date from June 2019 to partially finance the purchase price of four of the vessels in our Newbuilding Program upon their delivery to us, which will be pledged as collateral under this facility. This facility is expected to have a seven year term from the date of delivery of each such vessel securing the loan, with customary financial and restrictive covenants. The closing of this loan facility isSeptember 2020, subject to usualour satisfaction of certain conditions on or before June 2019, during the fourth quarter of 2016.
For additional information regarding our credit facilities and
customary conditions precedent, including the negotiationother debt arrangements, please see “Item 5. Operating and
execution of final documentation.Financial Review and Prospects—B. Liquidity and Capital Resources—Credit Facilities and Unsecured Notes.” Our Customers
We believe that developing strong relationships with the end users of our services allow us to better satisfy their needs with appropriate and capable vessels.
All of our vessels are employed in Scorpio Group Pools, which are spot market-oriented commercial pools managed by our commercial manager, SCM. A prospective charterer’s financial condition, creditworthiness, and reliability track record are important factors in negotiating our vessels’
employment.Seasonality
employment, which SCM evaluates on our behalf. We willearned 40% and 60% of our revenue (including commissions from SCM) from the Scorpio Kamsarmax Pool and the Scorpio Ultramax Pool, respectively, during the year ended December 31, 2016, 41%, 43%, and 8% of our revenue (including commissions from SCM) from the Scorpio Kamsarmax Pool, the Scorpio Ultramax Pool and the Scorpio Capesize Pool, respectively, during the year ended December 31, 2015, and 71% and 21% of our revenue (including commissions from SCM) from the Scorpio Kamsarmax Pool and the Scorpio Ultramax Pool, respectively, during the year ended December 31, 2014.
Seasonality
We operate our vessels in markets that have historically exhibited seasonal variations in demand and, as a result, in charter hire rates. This seasonality may result in quarter to quarter volatility in our operating
results, which could affect the amount of dividends that we pay to our shareholders from quarter to quarter.results. The drybulk carrier market is typically stronger in the fall and winter months in anticipation of increased consumption of coal and other raw materials in the northern hemisphere during the winter months. In addition, unpredictable weather patterns in these months
tend tomay disrupt vessel scheduling and supplies of certain commodities. As a result, revenues of drybulk carrier operators in general have historically been weaker during the fiscal quarters ended June 30 and September 30, and, conversely, been stronger in fiscal quarters ended December 31 and March 31. This seasonality may materially affect our operating results and cash available for dividends.
Competition
Our business fluctuates in line with the main patterns of trade of the major dry bulk cargoes and varies according to changes in the supply and demand for these items.
We operate in markets that are highly competitive and based primarily on supply and demand. We compete for charters on the basis of price, vessel location, size, age and condition of the vessel, as well as on our reputation
as an owner and
operator.that of our commercial manager. We compete
primarily with other
owners of dry bulk carriers in the Panamax, Post-Panamaxindependent and
smaller class sectorsstate-owned drybulk vessel-owners. Our competitors may have more resources than us and
with owners of Capesizemay operate vessels that are newer, and
Newcastlemax dry bulk carriers.therefore more attractive to charterers, than our vessels. Ownership of
dry bulk carriersdrybulk vessels is highly
fragmented.Permitsfragmented and Authorizations
We are required by various governmentalis divided among publicly listed companies, state-controlled owners and quasi-governmental agencies to obtain certain permits, licenses and certificates with respect to our vessels. The kinds of permits, licenses and certificates required depend upon several factors, including the commodity transported, the waters in which the vessel operates the nationality of the vessel’s crew and the age of a vessel. We have been able to obtain all permits, licenses and certificates currently required to permit our vessels to operate. Additional laws and regulations, environmental or otherwise, may be adopted which could limit our ability to do business or increase the cost of us doing business.
private shipowners.
Industry and Market Conditions
The Drybulk Shipping Industry
Except as otherwise indicated, the statistical information and industry and market data contained in this section
(the DATA) is based on or derived from statistical information and industry and market data collated and prepared by SSY Consultancy & Research Ltd,
(“SSY”).or SSY. The data is based on
SSY’sSSY's review of such statistical information and market data available at the time (including internal surveys and sources, independent financial information, independent external industry publications, reports or other publicly available information). Due to the incomplete nature of the statistical information and market data available, SSY has had to make some estimates where necessary when preparing the data. The data is subject to change and may differ from similar assessments obtained from other analysts of shipping markets. Whilst reasonable care has been taken in the preparation of the data, SSY has not undertaken any independent verification of the information and market data obtained from published sources.
Industry Overview
Dry bulk
Drybulk shipping mainly comprises the shipment of minerals,
(suchsuch as iron ore and
coal),coal, other industrial raw materials and various agricultural products. Of these, the major cargoes are iron ore, coal and grain. The remaining minor bulk cargoes include steel products, bauxite/alumina, nickel ore, cement, petroleum coke, forest products,
fertilisersfertilizers and non-grain agricultural products,
(e.g. sugar).such as sugar.
Charterers in the
dry bulkdrybulk shipping industry range from cargo owners (such as mining companies and grain houses) to end-users (such as steel producers and power utilities) and also include a number of different trading companies and ship operators.
In 2013 total
Total international seaborne
dry bulkdrybulk trade
is provisionally estimated to have reached
an estimateda new annual record of
3.97approximately 4.3 billion
tonnes.tonnes in 2016. This
was up byrepresents an increase of an estimated
7.1% on 20122.6% from the 2015 level and
by an estimated
33.0% on21.4% from the
20082011 level. With the exception of 2009 when the global economy was in recession, seaborne
dry bulkdrybulk trade has recorded positive annual growth in every year since 1998. While the
20132016 trade estimates will be subject to revision, as final trade statistics become available, estimates outlined in the table below indicate that last year’s increase in
total seaborne trade was
aboveunevenly distributed between the various cargo types and below the compound annual average growth rate,
(CAGR)or CAGR, for the
five yearsperiod from 2011 to
2013.2016.
World Seaborne
Dry BulkDrybulk Trade
(million tonnes)
| Cargo/Year | 2008 | 2009 | 2010 | 2011 | 2012 | 2013 | 2008-13%
Growth | CAGR |
| Major Bulks | 1998 | 2109 | 2326 | 2464 | 2607 | 2805 | 40% | 7% |
| Iron Ore | 847 | 939 | 1036 | 1107 | 1138 | 1238 | 46% | 8% |
| Coal | 829 | 849 | 958 | 1020 | 1117 | 1200 | 45% | 8% |
| Grains | 321 | 321 | 332 | 338 | 352 | 367 | 14% | 3% |
| Minor Bulks | 985 | 868 | 977 | 1058 | 1096 | 1161 | 18% | 3% |
| Total | 2983 | 2977 | 3303 | 3523 | 3703 | 3966 | 33% | 6% |
|
| | | | | | | | |
| Cargo/Year | 2011 | 2012 | 2013 | 2014 | 2015 | 2016 | 2011-16% Growth | CAGR |
| Major Bulks | 2,468 | 2,610 | 2,824 | 2,996 | 2,990 | 3,076 | 25% | 5% |
| Iron Ore | 1,107 | 1,138 | 1,256 | 1,391 | 1,414 | 1,484 | 34% | 6% |
| Coal | 1,023 | 1,119 | 1,199 | 1,182 | 1,126 | 1,118 | 9% | 2% |
| Grains | 338 | 353 | 369 | 423 | 450 | 475 | 41% | 7% |
| Minor Bulks | 1,078 | 1,119 | 1,179 | 1,192 | 1,204 | 1,228 | 14% | 2% |
| Total | 3,546 | 3,729 | 4,001 | 4,188 | 4,194 | 4,304 | 21% | 4% |
Totals may not add due to rounding Iron ore:The key raw material for steelmaking, iron ore trade has surged in recent years on the back of unprecedented Chinese import demand to be the single largest seaborne dry bulkdrybulk cargo, totallingwith annual volumes expanding more than three-fold since 2000 to an estimated 1,2381,484 million tonnes, (Mt)or Mt, in 2013.2016. Last year saw the sequence of annual increases extended to 15 years with volumes up by an estimated 4.9% from 2015 and 34.0% from 2011. This was up by 8.7% on the 2012 total, 46% highermuch faster than in 2008 and 131% above the corresponding totalgrowth in 2003.world steel production, which rose by less than 1% in 2016 and by approximately 5.9% between 2011 and 2016. In addition to China which, as described elsewhere in this section, has become the dominant importer accounting for approximatelyover two-thirds of seaborne imports in 2013,2016, the main import markets for iron ore are Japan, Western Europe and South Korea. Exports are dominated by Australia and Brazil, which together account for over 75%80% of the seaborne market. Other exporters include Canada, India, South and West Africa. Amarket with a large majority of iron oretheir cargoes are carried by Capesize vessels given the favourablefavorable unit economics. However, such iseconomies. This market share has increased from 71% in 2011, mainly due to the diversityintroduction of additional Australian export capacity, with both countries recording new annual export records in 2016. Other iron ore supply sources to China – with 17 different countries supplying 5 Mt or more of iron ore to China in 2013, according to PRC customs statistics – that there are also employment opportunities in the smaller vessel sizes.exporters include Canada, India, South Africa and West Africa.
Coal:At an estimated 1,2001,118 million tonnes in 2013,2016, global seaborne coal trade has expanded atdeclined by an estimated 0.8% from its 2015 level and represented a third consecutive year of decline. This contrasted with a CAGR of 8% between 2008 and 2013. It2% for the entire five-year period from 2011 to 2016. Coal trade is comprised of two main categories: (1) steam coal (which is chiefly used for electricity generation, but also by industrial users, such as the cement industry) and (2) coking coal (a key input for blast furnace steelmaking). TraditionallyBoth categories have experienced lower trade volumes since 2013, but in 2016 coking coal trade is estimated to have increased marginally.
Although the import market for coal was historically dominated by import demand from Japan and Western Europe, the
past five years havelast decade has seen China and India emerge as key
driversimporters of
incremental world import growth.both categories of coal. The leading exporter of coking coal is Australia, followed by the
USUnited States and Canada.
Indonesia is the largest exporter of steam coal, ahead of Australia, the former Soviet Union, Colombia, South Africa and the US. Within the past ten yearsUnited States.
Between 2005 and 2013, China has been transformed from one of the world’sa major steam coal exporting nationsnation to the single largest importer, such has beenrepresenting the strength of the country’s domestic demand for power generation. IndianIn 2014, however, China recorded its first annual decline in steam coal imports have also grown rapidly duringsince 2008, against the past 5-10 yearsbackground of an oversupplied domestic coal market and government intervention to surpass thoserestrict imports. The rate of Taiwan,decline quickened in 2015, reducing the country’s steam coal imports to a six-year low, but the downward trend was reversed in 2016 with both coking and steam coal imports increasing, mainly as a result of
government-driven cuts in domestic coal production. India remained the single largest importer in 2016, even though its annual volumes experienced a second consecutive year of net decline which, in direct contrast to China, was mainly due to rising domestic coal production. Japan, South Korea and
Japan.Taiwan, together with Western Europe,
remains aremain major import
market,markets, while
South East Asia and Latin America
hashave grown in importance as
a coal import
generator.generators. Although investments in new port facilities
have enabled the participation of Capesize vessels in the Asia-led coal trade growth
in recent years,during the period from 2010 to 2013, it has chiefly benefitted demand for Panamax and Handymax
type vessels.
Grains:Seaborne grain trade is comprised of wheat, coarse grains (corn, barley, oats, rye and sorghum) and soyabeans/meal. Compared with the mineral cargoes, grains have generated slower, but still positive rates of annual trade growth over the past five years withsoybeans/meal, which together totaled an estimated new record of 475 Mt in 2016, according to preliminary trade data. This was up by an estimated 5.4% from 2015 and compares with a CAGR of 3%. The7.1% for the period from 2011 to 2016. In addition, the grain trades do, however, remain an important source of freight market volatility due to both the seasonality of export flows and year-on-year variations in crop surpluses and deficits.Soya
Soy is the largest of the three main categories of grain trade with
Brazil, the
US, BrazilUnited States and Argentina
as the leading export countries. The principal markets are in Europe and Far East Asia with China
being the world’s single largest
soyabeansoybean importer. Shipments are dominated by Panamax and Handymax vessels. Wheat and coarse grains are also primarily carried by mid-size vessels with the
US,United States, Canada, Russia, Ukraine, Argentina,
Brazil, Australia and the
EUEuropean Union as the main exporting regions. In addition to Far East Asia and Europe, the Middle East, Africa and Latin America are all significant import markets.
Minor Bulks:A diversity of cargo types are covered under this heading with different sets of demand drivers. Nevertheless, together at more than 1approximately 1.2 billion tonnes per annum these trades represent a major source of employment for the smaller Handysize and Handymax vessels. Several minor bulk cargoes, including steel products and cement suffered an especially severe decline
In recent years growth in trade volumes during the global financial crisis. The subsequent recovery in overallaggregate minor bulk trade volumes to an estimated all-time high in 2013 has been shapedhampered by some different drivers than during(1) government restrictions on the pre-2008 period with a greater emphasisexport of key industrial ores in South East Asia and (2) moves by key importing regions to protect domestic steel markets against imports. The former was led by an Indonesian ban on Chinese importsthe export of industrial raw materials, such asunprocessed mineral ores beginning in January 2014, which reduced the country’s combined exports of bauxite and nickel ore.ore from 121 Mt in 2013 to zero in 2015 and 2016. Bauxite trade did benefit from a sharp increase in exports from Malaysia in 2015, but in early 2016 the Malaysian government announced a temporary suspension of domestic bauxite mining, which has since been extended. This turned the focus of importers in China (the world’s biggest bauxite market) to longer haul supplies, particularly from West Africa. Further interventions by South East Asian governments have followed in the early weeks of 2017; first, in January 2017, the Indonesian government announced reduced restrictions on bauxite and nickel ore exports, second it was subsequently announced in the Philippines that a number of the country’s nickel ore mines are to be closed or suspended.
Despite these constraints, total minor bulk trade is estimated to have achieved a new annual record in 2016. The estimated CAGR for minor bulk
trade volumes for the period from
20082011 to
20132016 was
3%2%.
Demand for Dry BulkDrybulk Shipping
Dry bulkDrybulk trade is a function of levels of a)(a) economic activity, b)(b) the industrialisation/urbanisationindustrialization/urbanization of developing countries, c)(c) population growth (plus changes in dietary habits) and d)(d) regional shifts in cargo supply/demand balances, (e.g.which can occur, for example, due to the development of new export/import capacity or depletion/development of mineral reserves).reserves. The distances shipped chiefly reflect regional commodity surpluses and deficits. Generally, the more concentrated the sources of cargo supply, the greater the average distance shipped.
Ship demand is determined by the overall volumes of cargo moved and the distance that these are shipped,
(i.e.or tonne-mile
demand),demand, as well as changes in vessel efficiency. These changes may be caused by such factors as (1) vessel speed
(in the high(which will change in response to movements in fuel
cost/lowcosts and freight
rate environment of recent years, there has been an incentive for shipowners to reduce speed and so lower fuel consumption)market earnings); (2) port delays (which have been a common occurrence in the last
1015 years as inland and port logistics in several key export areas
have struggled to meet surging global demand) and (3) laden to ballast ratios,
- i.e.or how much time vessels spend sailing empty on re-positioning
voyages (ballastingvoyages. Ballasting has also been on the increase over the last 10
to 15 years due to the widening imbalance in cargo flows between the Atlantic and Pacific
Basins).Basins.
World seaborne
dry bulkdrybulk trade followed a steady underlying upward trend during the 1980s and 1990s.
Compound annual average growthCAGR in the major
dry bulkdrybulk cargoes over this period was an estimated 2.5%, before accelerating sharply to 6.3%
induring the
decadeperiod from
2000-092000 to 2009 and
tobeing sustained at an estimated
7.4% in 2010-13.Both the5.5% between 2010 and 2016.
The growth in dry bulkdrybulk trade volumes since the global financial crisis of 2008/09, and the preceding acceleration in the underlying rate of expansion in cargo movements, were2000 has been primarily due to the rapid industrialisationindustrialization and urbanization of China. From approximately 130 Mt in 2000, Chinese dry bulkdrybulk imports hadhave increased more than ten-fold, by 2013, as illustrated in the accompanying chart.
chart below. Such an expansion
has beenwas facilitated by investments in new mining and port
facultiesfacilities in key exporting areas around the world in response to Chinese-driven rises in commodity
prices.Chinese customs data show that the country’s dry bulk imports increased by 169 Mt in 2013prices from 2004 to a new annual record of 1,473 Mt. Preliminary customs statistics for Jan/Feb 2014 put the combined total for China’s imports of iron ore, coal and soyabeans at 217.5 Mt or some 18.5% higher than in the same two months in 2013.
2011.
The table below provides a more detailed comparison of China’s dry bulkdrybulk imports between 2008from 2011 to 2016 and 2013. It confirmsshows that, following its first annual decline in 17 years in 2015, positive growth resumed in 2016 with annual data indicating an increase in aggregate volumes of approximately 111.0 Mt last year. Chinese imports of iron ore’s role asore rose to a new annual record in 2016 and, after successive years of decline in 2014 and 2015, coal imports rose by more than 50 Mt in 2016. Total grain imports are estimated to have fallen by 9.0 Mt last year despite a new high for soybeans.
Iron ore has been the leading source of growth during thisin Chinese drybulk imports over the last five year period. Thisyears. The 338 Mt increase in iron ore imports between 2011 and 2016 reflects not only increases in domestic steel production (and, therefore, iron ore consumption) to meet the needs of an industrializing and urbanizing economy, as well as historically high exports of steel products, but also the substitution of higher-quality imported iron ore for lower-quality domestic supplies. This growthConsequently, iron ore imports have grown more rapidly than Chinese steel production over the last five years and now account for a large majority of Chinese iron ore consumption.
Growth in China’s iron ore trades has mainly been to the benefit of Capesize vessels, hauling cargoes from West Australia and Brazil.
The table also highlights high rates of growth across a range of other cargoes, such as coal, grains Australia and some of the key minor bulks. Indonesia and Australia are the primary sources of Chinese coal imports, while in the grain trades increased Chinese demand for soyabeanssoybeans from Latin America and the USUnited States has boosted tonne-mile demand for Panamax and Supramax vessels.
Indonesia
has beenwas the dominant supplier of bauxite and nickel ore to China
but this situation has changeduntil January 2014’s export restrictions. With Chinese buyers struggling to find alternative supplies from
January 2014 following the implementation of export restrictions on unprocessed mineral ores by the Indonesian government, which effectively banelsewhere, the country’s
exportsannual nickel ore imports fell to an annual total of
31.9 Mt in 2016 from a peak of 71.2 Mt in 2013. By contrast, after declining from 71.6 Mt in 2013 to 36.5 Mt in 2014, China’s bauxite
imports partially rebounded to 56.1 Mt in 2015 and
nickel ore.52.1 Mt in 2016. The 2016 level includes included record imports from the Atlantic, where Guinea and Brazil were the prominent sources of supply.
Chinese
Dry BulkDrybulk Imports (Million Tonnes)
| | 2008 | 2013 | CAGR |
| Iron Ore | 444.0 | 820.3 | +13% |
| Steel Products | 15.7 | 14.6 | -1% |
| Coal* | 45.8 | 327.1 | +48% |
| Bauxite/alumina | 30.6 | 75.4 | +20% |
| Grains | 39.4 | 78.0 | +15% |
| Fertiliser | 6.3 | 7.9 | +5% |
| Other** | 47.1 | 149.5 | +26% |
| Total of above | 628.9 | 1472.8 | +19% |
|
| | | | |
| | 2011 | 2015 | 2016 | CAGR |
| Iron Ore | 686.8 | 953.3 | 1,024.7 | +8% |
| Coal* | 222.2 | 204.2 | 255.7 | +3% |
| Bauxite/Alumina | 47.1 | 60.8 | 55.1 | +3% |
| Grains | 58.0 | 114.4 | 105.1 | +13% |
| Other** | 164.3 | 168.5 | 172.2 | +1% |
| Total of above | 1,178.4 | 1,501.2 | 1,612.8 | +7% |
* Includes lignite, **which is excluded from SSY’s estimates for seaborne coal trade and categorized as a minor bulk.
** Includes mineral ores (e.g.(such as nickel), pulp/woodchipwood chip/logs and petroleum coke. coke.
Outside of China, most of the additional growth in
dry bulkdrybulk cargo import demand during the past
5-6five years has been generated by other Asian economies. For example,
and despite setbacks in 2015 and 2016, Indian coal imports
arein 2016 were estimated to
have risen from 62be more than 70 Mt
higher than their corresponding level in
2008 to 186 Mt in 2013,2011, reflecting the strength of demand from electricity generators
and the cement and steel industries. Although India has added several Capesize coal import terminals in recent years, a majority of the coal cargoes arriving in the country are shipped by Supramax, Panamax and Kamsarmax vessels. More established Asian import markets, such as
Japan and South Korea, have also contributed to the region’s import growth with
the increase in Koreantheir combined imports of coal and iron ore
increasing by an estimated 30 Mt between
20082011 and
2013 (of 41 Mt) more than offsetting the corresponding decrease in Japanese imports (of approximately 5 Mt).In contrast, European mineral imports have staged only a partial recovery from their cyclical lows in 2009 and have remained below their 2007 totals, partly due to
the ongoing financial crisispersistently slow economic growth in the
eurozone.Eurozone, but also policy driven changes in the region’s energy mix away from coal. Consequently, Far East Asia’s share of world seaborne major bulk imports is estimated to have climbed above 75%
by 2013 from approximately 60% in the middle of the last decade and
50-55%50% to 55% in 2000.
As a result,
the fastest
dry bulkdrybulk trade growth has been seen within the Pacific Basin, which has been supplemented by increases in
fronthaulfront-haul trade from the Atlantic to the Pacific (chiefly iron ore on Capesize vessels and grains on Panamaxes and Supramaxes).

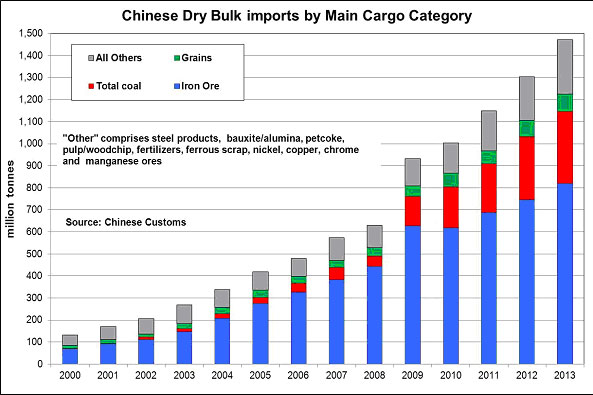
The cargoes outlined above are predominantly carried by
dry bulkdrybulk carriers of more than 10,000 dwt.
Dry bulkDrybulk carriers are single-decked ships that transport dry cargoes in “bulk” form,
(i.e.that is loose within cargo holds, rather than in bags, crates or on
pallets).pallets. As
at mid-March 2014,of the end of December 2016, the total fleet of 10,000+ dwt
dry bulkdrybulk carriers numbered approximately
9,73510,440 vessels of
722.3783.2 million deadweight
(Mdwt).tonnes, or Mdwt.
This fleet is divided into four principal size segments: Handysize
(10-39,999(10,000-39,999 dwt), Handymax
(40-64,999(40,000-64,999 dwt), Panamax
(65-99,999(65,000-99,999 dwt) and Capesize (100,000+dwt). Aside from size, the main distinction between
dry bulkdrybulk vessel types is whether they are geared
(i.e.(that is, equipped with cranes for loading/discharge) or gearless. The main characteristics of these four vessel types are
summarisedsummarized below, while the
accompanying table
summarisesbelow summarizes the current structure of the fleet by age and size. It shows that in terms of deadweight capacity, the Capesize sector is the largest with
41.1%40.3% of the
mid-March 2014end-of-December 2016 total, followed by Panamaxes at
25.7%25.0%, Handymaxes at
21.9%23.5% and
HandysHandysizes at
11.3%11.2%.
Handysize (10,000-39,999 dwt)(10,000-39,999dwt): These ships carry the widest range of cargoes of any dry bulkdrybulk size segment and are the most dependent on the minor bulks for employment. They are usually equipped with cargo-handling gear (cranes or derricks) and are widely used on routes to and from draft-restricted ports that a)(a) cannot receive larger ships and b)(b) often lack their own land-based cargo-handling equipment. Many such loading or discharge facilities are located in the developing nations. Due to the limited economies of scale economies that these vessels offer, compared to larger tonnage vessels, many of these ships are extensively employed on intra-regional, shorter-haul trades. Special designs of ship are associated with the carriage of such cargoes as steel products and logs, (i.e “open-hatch”or open-hatch and “log-fitted” vessels);log-fitted vessels; while some variants also exist in terms of cargo-handling equipment, e.g. “grab-fitted”such as grab-fitted tonnage possessing scoops that facilitate easier unloading of certain cargo types.
Handymax (40,000-64,999dwt): This segment of the dry bulkdrybulk carrier fleet contains three distinct sub-categories –- the traditional Handymax size (40-49,999 dwt)(40,000-49,999dwt), the Supramax size (50-59,999 dwt)(50,000-59,999dwt) and the Ultramax size (60-64,999(60,000-64,999 dwt) (there. There are some Ultramax newbuilding designs of above 65,000 dwt, but as these are much fewer in number than existing gearless vessels of 65-69.9 kdwt, they currently fall in SSY’s Panamax size range).range. Despite their increased size, these vessels retain a high degree of trading flexibility as their cargo gear enables them to load and/or discharge at ports with limited facilities. They are more widely deployed on longer-haul routes than are Handysizes (due to the greater scale economies that they offer). Whereas the traditional Handymax types have gained market share from the sub-40,000 dwt fleet of Handysizes over the past 20 years, the new generation of Supramax and Ultramax vessels are also competing for business on Panamax routes (e.g.(such as grains from Latin America).
Panamax (65-99,999(65,000-99,999 dwt): The strict definition of a Panamax bulk carrier is a ship able to transit the Panama Canal fully laden. However, in recent years this definition has become blurred as (1) only a minority of the vessels in this size range pass through the Panama Canal in any 12-month period and (2) shipyards have developedthe opening of an additional trade lane with a new designsset of locks in anticipation ofmid-2016 expanded the Panama Canal’s expanded dimensions from late 2015 onwards (currently,to enable the Panama Canal can accommodatetransit of ships of maximum beam, (i.e.or extreme vessel breadth)breadth, of 32.349 metres, maximum length overall, (LOA)or LOA, of 294.1m366m and maximum draft of 12m15.2m tropical fresh water, (TFW). Post-enlargement, these limits will increaseor TFW. This compares with the pre-existing, and still operational, locks which can accommodate ships to 49ma maximum of 32.3m beam, 366m294.1m LOA and 15.2m12m TFW draft).Fordraft. For these reasons our fleet definition stretches from 65,000 to 99,999 dwt, encompassing three main sub-types: traditional Panamaxes (70-79,999(70,000-79,999 dwt), Kamsarmaxes (82/83,000(82,000-83,000 dwt, which are currentlyprior to the enlargement were the largest bulk carrier to transit the Panama Canal fully laden) and post-Panamaxes (85-99,999(85,000-99,999 dwt). The baseloadbase load demand for these vessel types is provided by coal and grain cargoes, although they also participate in a number of other trades (including iron ore, bauxite and fertilisers)fertilizers). Only a small minority of vessels in this size range are equipped with cargo gear as most of the ports served have well developed cargo loading or discharge terminals.
Capesize (100,000+dwt): These ships are almost exclusively deployed onin the iron ore and coal trades, which benefit most from their scale economies. There are three main sub-types: small Capes (100-119,999(100,000-119,999 dwt), standard Capes (160-209,999(160,000-209,999 dwt, which are mainly concentrated between 170,000 dwt and 180,000 dwt, but also include Newcastlemaxes of 200-209,999200,000-209,999 dwt) and Very Large Ore Carriers (220,000 dwt and above).Dry BulkDrybulk Carrier Fleet by Size/Age (Million Dwt):
As
at mid-March 2014| Built/Dwt | 10-39,999 | 40-64,999 | 65-99,999 | 100,000+ | Total |
| Pre-1990 | 13.7 | 9.2 | 5.4 | 4.0 | 32.3 |
| 1990-94 | 3.4 | 6.0 | 9.9 | 26.3 | 45.5 |
| 1995-99 | 9.8 | 15.9 | 22.2 | 27.5 | 75.5 |
| 2000-04 | 7.8 | 19.3 | 25.7 | 26.4 | 79.2 |
| 2005-4-09- | 13.2 | 33.4 | 34.7 | 59.5 | 140.7 |
| 2010-14 | 33.6 | 74.5 | 87.9 | 153.1 | 349.1 |
| Total Fleet | 81.4 | 158.3 | 185.8 | 296.8 | 722.3 |
| Avg Age | 12 Yrs | 9 Yrs | 8 Yrs | 8 Yrs | 9 Yrs |
of December 31, 2016
|
| | | | | |
| Built/Dwt | 10-39,999 | 40-64,999 | 65-99,999 | 100,000+ | Total |
| Pre-1992 | 5.2 | 4.1 | 2.8 | 3.1 | 15.2 |
| 1992-96 | 5.1 | 7.7 | 7.0 | 18.7 | 38.5 |
| 1997-01 | 7.9 | 14.1 | 22.8 | 14.5 | 59.3 |
| 2002-06 | 8.3 | 22.5 | 27.7 | 35.1 | 93.7 |
| 2007-11 | 29.5 | 61.9 | 55.8 | 124.4 | 271.6 |
| 2012-16 | 32.1 | 73.4 | 79.8 | 119.6 | 304.9 |
| Total Fleet | 88.1 | 183.8 | 196.1 | 315.3 | 783.2 |
| Average Age | 10 Yrs | 8 Yrs | 8 Yrs | 7 Yrs | 8 Yrs |
Totals may not add due to rounding
Unlike other specialist areas of the world shipping fleet, ownership in the
dry bulkdrybulk segment is highly fragmented, with SSY’s database showing approximately 2,000 different owners. The largest
1050 owners account for approximately
20%34% of the fleet in terms of deadweight carrying capacity, but this
will includeincludes a large number of Chinese-flagged vessels that will trade on domestic as well as international routes.
While such analysis will tend to understate levels of market concentration, due to the operation of vessel pools and chartered in fleets, the
dry bulkdrybulk segment is sufficiently competitive to ensure that vessel spot market earnings are extremely responsive to fluctuations in the supply/demand balance
– both globally and regionally.
Supply of
Dry BulkDrybulk Shipping
The supply of
dry bulkdrybulk carriers is fundamentally determined by the delivery of new vessels from the world’s shipbuilding industry and the removal of older vessels, mainly through demolition.
Newbuilding deliveries not only reflect the demand from
shipownersship owners for new tonnage, but also available shipyard capacity. Following a sharp upswing in demand for new vessels in all of the main sectors of the commercial shipping industry during the last decade, and an accompanying rise in shipbuilding prices to record levels in
2007/8,2007 to 2008, there was a massive China-led expansion in world shipbuilding capacity. In the case of the
dry bulkdrybulk sector, annual newbuilding deliveries surged from
24.324.4 Mdwt in 2008 (and an average of 19.1 Mdwt p.a.
in 2000-07between 2000 and 2007, inclusive) to
43.844.3 Mdwt in 2009,
79.079.7 Mdwt in 2010 and a peak of
99.1100.0 Mdwt in 2012.
The resulting impact on freight market balances and vessel earnings, as described elsewhere in this section, led to
sharply reducedsharply-reduced levels of
dry bulkdrybulk carrier ordering in 2011 and 2012, which
startedled to
be reflected in a slower pace of newbuilding deliveries in
2013. At2013 at an estimated
61.161.6 Mdwt
last year’s annual total for newbuilding deliveries was the lowest since 2009.followed by a further slowdown to 47.7 Mdwt in 2014.
There was, however, a revival in
dry bulkdrybulk carrier newbuilding investments during 2013,
in spite ofwhich continued into 2014 and reversed the
generally weak freight market earningsdownward trend in the
first six to eight months of the year, and further newbuilding
orders have been confirmed in the first quarter of 2014.orderbook. These orders
have been focussedwere focused on new, more
fuel efficientfuel-efficient ship designs,
wherefor which shipyard descriptions offer significantly lower fuel consumption compared with existing vessels through a combination of new technology main engines and refinements of hull forms.
The rising costs of bunker fuels
over the past 5-10 yearsbetween 2004 and 2012 are illustrated in the
accompanying chart
below, which is based on the
52,454 dwt Supramax vessel specifications used by the Baltic Exchange
(30(that is, 30 tonnes
(380cst)of 380cst fuel oil per day at 14.0 knots laden/14.5 knots ballast) and estimated bunker prices in Singapore. This shows an increase at sea, at full speed, from approximately
$4,500/$5,400 per day in
20022004 to approximately
$20,000/$20,000 per day in 2012.
We would, however, stressReflecting the general decline in world oil prices, there was a sharp reduction in bunker fuel costs between September 2014 and the first quarter of 2016. In the case of our Supramax example, the annual average fell from approximately $16,800/day in 2014 to approximately $7,000 per day in 2016. However, the subsequent rebound in global oil prices during 2016, and into the early weeks of 2017, lifted estimated Supramax bunkering costs to a monthly average of approximately $10,000/day in January 2017. SSY stresses that (1) there is a wide variance in individual vessel fuel consumptions, even within the same size segments, and (2)
that, as described earlier in this section, vessels have been operating at slower speeds in order to lower their daily fuel consumption and costs.
Reflecting the increased ordering of more fuel-efficient vessels, there was a small net rise in drybulk carrier newbuilding deliveries in 2015 to 48.7 Mdwt, but the downward trend resumed in 2016 with the estimated annual newbuilding delivery total of 47.0 Mdwt the lowest since 2009.
Since 2014, there has been a general reduction in new drybulk carrier ordering, in response to the deterioration in freight market conditions, which is reflected in a sharply declining newbuilding orderbook.
The
accompanying table
summarisesbelow summarizes the confirmed
dry bulkdrybulk carrier orderbook
at mid-March 2014,as of the end of December 2016, by vessel size and scheduled year of delivery. These delivery dates can be subject to delay with actual deliveries in recent years significantly lagging scheduled totals. For example,
20132016 deliveries were an estimated
35%47% below the scheduled total as
atof January 1,
st January 2013. 2016, which compared with a corresponding average rate of slippage from scheduled delivery dates in the previous five years of approximately 31.7%. At an estimated
141.077.1 Mdwt, the total tonnage on order
representsas of the end of December 2016 represented approximately
19.5%9.8% of the existing fleet. This
is the lowest end-year share since 2002 and compares with
end-yearan estimated 15.7% as of the end of 2015 and year-end highs of 56.5% in 2007, 57.2% in 2009 and 67.3% in 2008, as illustrated in the
accompanying chart.Dry BulkDrybulk Carrier Newbuilding Orderbook by Size Range (Million Dwt):
As
at mid-March 2014| Delivery | 10-39,999 | 40-64,999 | 65-99,999 | 100,000+ | Total |
| 2014 | 6.0 | 11.8 | 12.6 | 17.3 | 47.7 |
| 2015 | 6.8 | 14.7 | 11.8 | 21.3 | 54.5 |
| 2016 | 1.8 | 8.6 | 6.9 | 17.3 | 34.6 |
| 2017+ | 0.2 | 1.6 | 0.6 | 1.8 | 4.2 |
| Total | 14.7 | 36.7 | 31.9 | 57.7 | 141.0 |
| % of Fleet | 18.1% | 23.2% | 17.2% | 19.4% | 19.5% |
of December 2016
|
| | | | | |
| Delivery | 10-39,999 | 40-64,999 | 65-99,999 | 100,000+ | Total |
| 2017 | 5.3 | 14.6 | 12.9 | 20.6 | 53.4 |
| 2018 | 1.6 | 2.7 | 2.5 | 8.1 | 14.9 |
| 2019 | 0.5 | 0.6 | 0.3 | 7.1 | 8.4 |
| 2020+ | 0.1 | 0.1 | 0.1 | 0.1 | 0.4 |
| Total | 7.4 | 18.0 | 15.7 | 36.0 | 77.1 |
| % of Fleet | 8.4% | 9.8% | 8.0% | 11.4% | 9.8% |
Totals may not add due to rounding
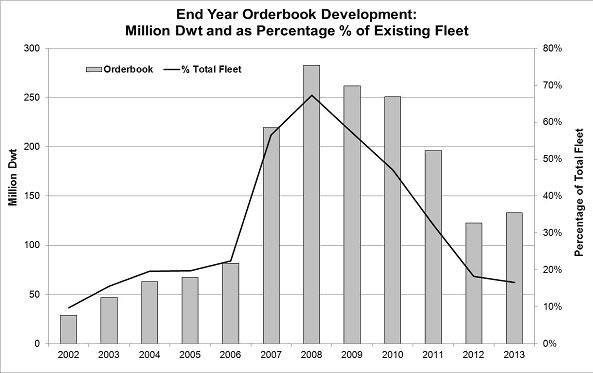
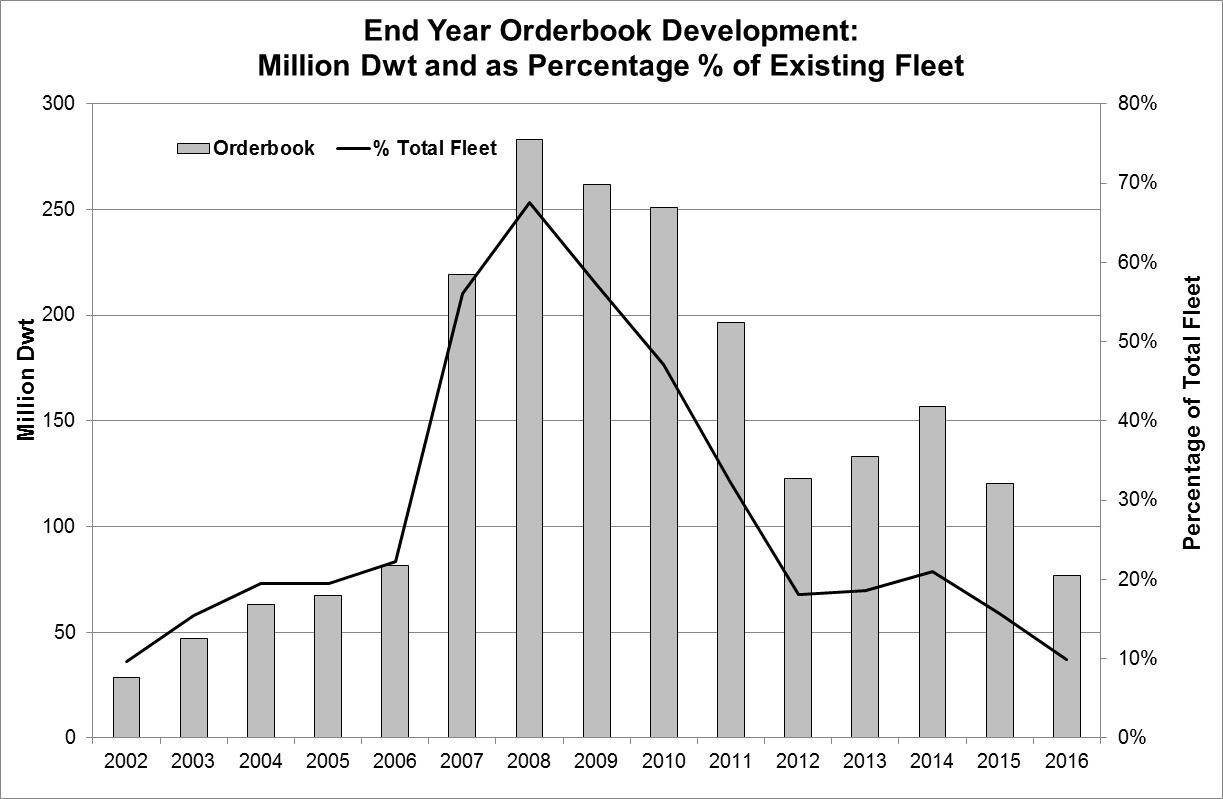
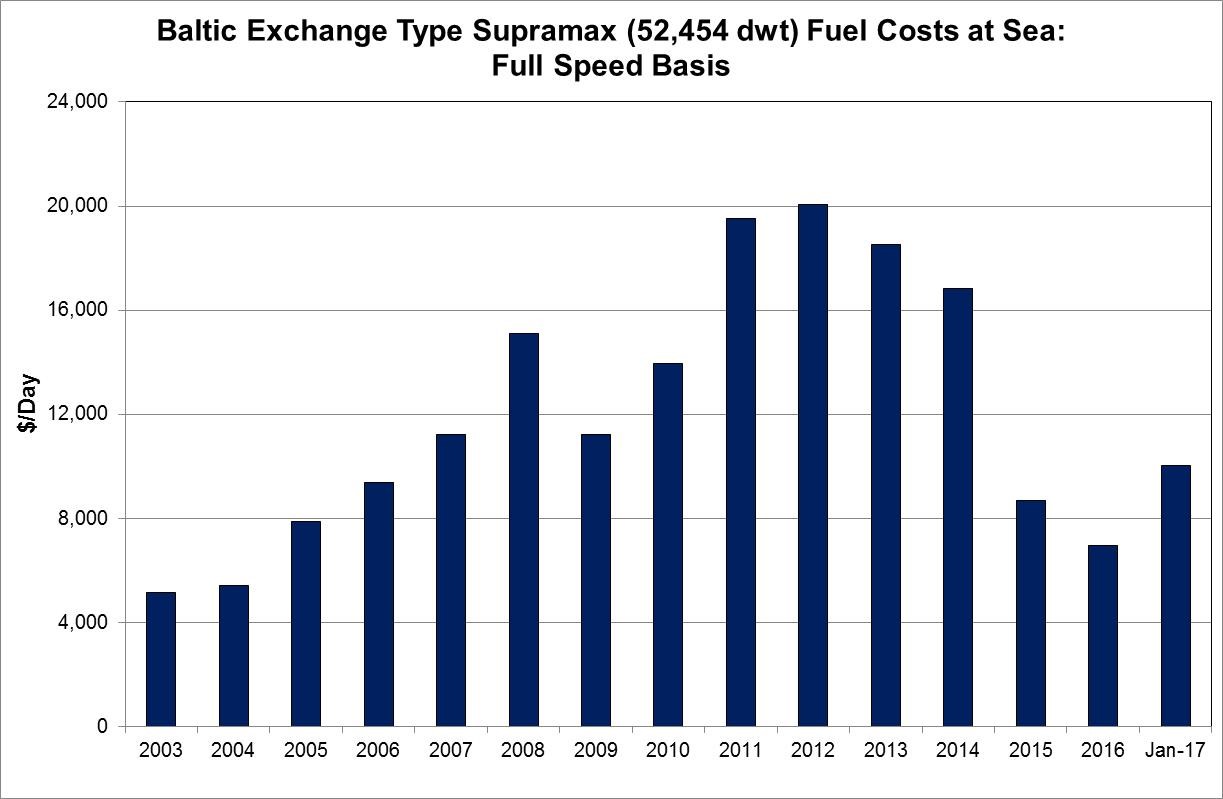
Typically
dry bulkdrybulk carriers are scrapped between the ages of 25 and 30 years,
( but the removal of vessels of 20-24 years are common during periods of freight market weakness, and there have also been examples of scrapping of 15-19 year-old vessels (especially in
2012 and the
first 10 months of 2013,larger-sized vessels). In 2016, the average age of Handysize vessels scrapped was
3029 years, for Handymax it was
2823 years, for Panamax it was
2721 years and for
CapesCapesize vessels it was
22-23 years).20 years. However, demolition is not simply a function of the fleet’s age profile. Several factors will influence an
owners’owner’s decision on whether to scrap older vessels, notably (1) actual and anticipated returns from the charter market, (2) the relative running costs of the vessel,
and (3) prospective expenditure at classification society
surveys.Forsurveys (which, as well as general costs of repair and maintenance can be impacted by new regulations, such as the International Maritime Organization’s convention on Ballast Water Management, which is currently due to enter force for existing vessels in September 2017) and (4) the second-hand re-sale value (that is, whether it provides a premium to scrap). For much of the
decade 2000-09,period from 2000 to 2009, returns from the
dry bulkdrybulk charter markets supported continued investment in vessel life extension, and scrapping volumes fell to minimal levels. This, however, ensured an accumulation of older tonnage in the fleet and, as a result, demolition proved extremely responsive to a deterioration in freight market conditions. For instance, deletions from the
dry bulkdrybulk fleet rose from
3.53.6 Mdwt in 2008 to 14.7 Mdwt in 2009 and
reached a new annual record of
35.135.4 Mdwt in 2012. Deletions
in 2013subsequently dropped to
an estimated annual total of 21.7 Mdwt (which was still the third highest year on record) and were running at an annualised rate of 14.815.8 Mdwt in
Jan/Feb 2014.2014, before 2015 brought a sharp rebound in drybulk carrier demolition activity with total annual deletions of 29.8 Mdwt. A similar 29.7 Mdwt was removed in 2016, according to our current estimates.
As the
accompanying chart
below illustrates,
record volumeshistorically high levels of ship demolition
did not preventcontributed to a marked
accelerationslowdown in the rate of
dry bulkdrybulk carrier
fleet supply growth. From 6-7% p.a. in 2005-08, net fleet growth
leaptover the past two years with the estimated 2.3% rise in 2016, representing the lowest annual percentage increase since the 1990s. This compares with 2.5% in 2015, 4.5% in 2014 and an average of 11.3% p.a. over the five year period from 2009 to
9% in 2009 and 16.6% in 2010 with further years of double-digit percentage growth following in 2011 and 2012, before slowing to approximately 5.9% in 2013.
Demolition
did, however, contributehas also contributed to the uneven development of
dry bulkdrybulk carrier fleet supply over the past
5-6five years. In particular, the removal of elderly Handysize vessels, combined with the relatively modest newbuilding
programmeprogram in this sector compared with the other sizes, ensured that the
10-39,99910,000-39,999 dwt
Handysize fleet grew at an estimated CAGR of
just 1.5%1.2% between
20082011 and
2013,2016, compared with
10.3%6.1% for
40-64,99940,000-64,999 dwt Handymaxes,
11.9%6.6% for
65-99,99965,000-99,999 dwt Panamaxes and
15.1%4.9% for 100,000+ dwt Capes. As a result, the Handysize sector’s share of total dwt capacity fell from an estimated
17.9% at13.6% as of the end of
20082011 to
11.3% at11.2% as of the end of
2013.2016. By contrast, the
same five-year period saw an increased share
of the fleet accounted for by
65,000-99,999 dwt Panamaxes, rising from 23.3% to 25.0%, and 40,000-64,999 dwt Handymaxes, from 22.4% to 23.5%. The 100,000+ dwt
Capes rose from 34.6% to 41.2% over the same period. The 65-99,999 dwt PanamaxCapesize sector recorded a modest
increase in its share, from 24.7% to 25.5%, and the 40-64,999 dwt Handymax sector a modestnet decline, from
22.8%40.7% to
22.0%40.3%.
Despite the
increased levels of demolition
ofin recent years, there
remains over 32remained approximately 15.3 Mdwt of ships aged 25 years or older in the
current dry bulkdrybulk carrier fleet
as of the end of December 2016, with
a further 45.5an additional 38.5 Mdwt aged
20-2420 to 24 years and 59.3 Mdwt aged 15 to 20 years.
Existing pre-1990 built ships are heavily concentratedThe highest concentration of vessels 20+ years old was in the Handysize
and Handymax fleets, yet both the Capesize and Panamax sectors contain substantial concentrationssector, accounting for 11.7% of
tonnage in the 20-25 year age range. As a result 20+ year old vessels account for 21.0% of total Handysize dwt capacity
in this size range as of the end of December 2016, compared with
9.6%6.5% of Handymaxes,
8.2%5.0% of Panamaxes and
10.2%6.9% of
Capes.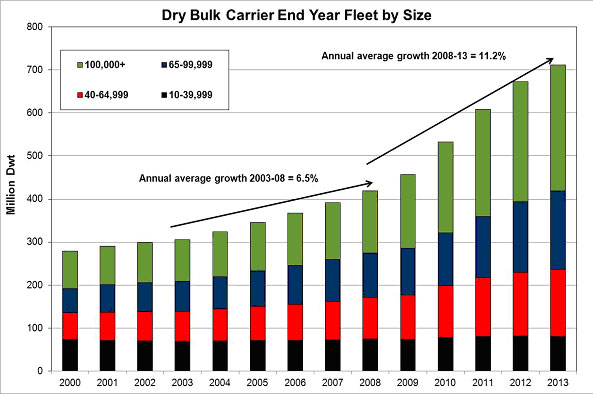
Charter Market & Freight Rates
The chartering of
dry bulkdrybulk vessels can take several different forms, the most typical of which are
summarisedsummarized below.
Single voyage (“spot”) charter
| |
| (a) | Single voyage (“spot”) charter |
This involves the hire of a vessel for just one stipulated voyage, carrying a designated quantity of a named commodity. For most such charters, an individual ship is specified that will carry out the voyage to be undertaken. The terms of the agreement between the charterer and vessel owner usually
definesdefine the port (or ports) of cargo loading and discharge, the dates between which the cargo is to be loaded,
plusand the cargo-handling terms. The vessel owner will receive from the charterer a mutually
agreedagreed-upon payment (normally quoted as a US$ per ton freight rate). In return, the
shipownership owner pays all voyage expenses
(e.g.(such as the costs of fuel consumed on the voyage, plus port expenses), all operating costs
(e.g.(such as insurance and crewing of the vessel), and capital expenses
(i.e.(such as the servicing of any mortgage debt on the ship).
Contract of affreightment (“COA”)
| |
| (b) | Contract of affreightment, or COA |
Under a COA, the vessel owner and charterer agree
to terms for the carriage of a designated volume of a given commodity on a specified route (or routes), with such shipments being carried out on a regular basis. The agreement does not normally identify an individual ship that will be used to
fulfilfulfill its terms, but
includes more general specifications on the vessels to be used
(e.g.(such as maximum age). Under the terms of a COA, freight is normally paid on
an agreeda mutually agreed-upon US$ per ton basis, with the vessel owner then meeting all voyage, operating and capital costs incurred in the execution of such a charter.
Time charter
Under a time charter, the charterer takes the ship on hire for either (1) a trip between designated delivery and re-delivery positions or (2) for a designated period
(e.g.(for example, 12 months). The freight rate agreed
upon between the
shipownership owner and charterer is in terms of a daily hire rate (in US dollars), rather than as a US$ per ton figure. For longer term period charters, this may escalate at a rate mutually agreed
upon between vessel owner and charterer. Under the terms of such charters, the vessel owner meets the ship’s operating and capital costs, with the charterer paying all variable voyage expenses (mainly fuel costs, plus port and canal dues). In addition, and unless otherwise stipulated in the charter agreement, the period charterer is able to trade the vessel to and from whichever loading and discharge ports that
theyit may choose, carrying whichever cargoes they prefer.
Bareboat charter
Under a bareboat charter, the vessel owner effectively relinquishes control of theirits ship to the charterer (usually for a period of several years). The shipownership owner receives an agreedagreed-upon level of remuneration (which may again escalate at a mutually agreedagreed-upon rate) for the duration of the charter, and remains responsible for the vessel’s capital costs. In return, the charterer assumes
total control of the vessel, thereby becoming responsible for operating the ship and meeting all costs of such operation
(e.g.(such as crewing, repairs and maintenance), as well as the direct voyage expenses incurred
(i.e.(such as fuel costs
and port
expenses, etc)expenses) when it is trading.
Freight rates are determined by the balance of tonnage demand and tonnage supply. Primarily as the result of record newbuilding deliveries, fleet
utilisationutilization rates have dropped sharply from the peak levels of 2007, as illustrated by movements in key freight market indicators.
Given the diversity of routes and cargoes traded by the
dry bulkdrybulk fleet, freight market measures tend to focus on average worldwide spot earnings (expressed in US$
/ per day). The most
recognisedrecognized of these measures are published on a daily basis by the Baltic Exchange in London. In addition to global averages for standard designs of Handysize (28,000 dwt), Supramax
(52,450(52,454 dwt), Panamax (74,000 dwt) and Capesize
(172,000(180,000 dwt)
. vessels, together with a number of component routes, the Baltic Exchange also publishes a daily composite Index for the entire
dry bulkdrybulk market (the BDI or Baltic Exchange Dry Index).
From its all-time high of almost 12,000 points in May 2008, just prior to the global financial crisis, the BDI fell to below 700 points in December of the same year. After partial recovery in 2009, negative pressure on freight markets returned under the weight of sustained fleet supply growth. At 920 points in 2012, the BDI’s annual average was
the lowest since the 1980s.a 26-year low. The corresponding 2013 level was 1,206 points
but this annual average obscured sharp differences betweenand included the
first and second halves of 2013. From its lowest quarterly average since 1986 in the 1q13 (796 points), the BDI rose to its highest quarterly average for two years in the
4q13fourth quarter of 2013 (1,854 points) against the background of
sharply reducedsharply-reduced fleet supply growth and new peaks for
dry bulkdrybulk trade.
Volatility
remainsremained a feature of
dry bulkdrybulk spot markets
due, in
part, to seasonal fluctuations in cargo availability. From 2,277 points at the end of 2013,2014 with the BDI
fellranging between 2,113 and 723 points, but its annual average of 1,105 points was below the corresponding 2013 level. Spot market weakness intensified in 2015, chiefly due to the sharp slowdown in drybulk trade growth, with the BDI’s annual average falling to 718 points. This was followed by
more than 50%new daily (290 points) and monthly (307 points) lows in February 2016, when weak global steel production, disruptions to
1,084cargo availability and lower bunker prices, together with negative seasonal factors, all contributed to the further weakening in the freight market. From these record lows, the BDI did rebound to 1,257 points during November and averaged 994 points in
early February 2014 before rebounding to 1,621 points on 20 March. At 1,356 pointsthe fourth quarter of 2016, which was the highest quarterly average since the fourth quarter of 2014. However, this could not prevent 2016 from recording the BDI’s
year to datelowest annual average
(on 20 March 2014) was 73% higher than for the same periodsince its inception in
2013.The first of the
accompanying charts
below traces developments in representative
12 month time12-month charter rates for the four main
vessel sizes from January 2002 to the end of
February 2014,December 2016, encompassing the all-time highs in vessel earnings and the subsequent slump in rates. The second chart looks in more detail at developments since the beginning of
2009.2010. It shows
that duringthe Capesize-led rebound from mid-2013 to the first quarter of 2014
Capesize period rates have strengthenedand subsequent slide to
their highestthe depressed levels
since 2010, whereas Panamax and Supramax period rates have been at their firmest since 2011.in the first quarter of 2016 before a partial revival during the second half of 2016. These
assessments are based on existing modern
(i.e.(that is, under 10 years of age) vessels. Within these individual size ranges, period rates will vary according to such factors as vessel age, size, fuel consumption and yard of build.
Although both charts show the extent to which vessel earnings in the different size ranges move broadly in tandem, they also highlight that the sharpness of market rises and falls vary in degree. Those size groups that carry the narrowest range of cargoes,
- or
which arethose employed on the least number of routes,
- tend to experience the greatest variations in charter rates. Hence, in the
dry bulkdrybulk shipping sector, earnings of Capesizes have been prone to fluctuate to a far greater degree than those of smaller
vessels. It appears that as the average size of Capesize has increased, so has its relative volatility compared with the other sizes.A feature of the recent downswing in the freight market cycle was the relative resilience of earnings in the Handymax and Handysize sectors compared with the larger vessel sizes. This can be partly attributed to thevessels (with their greater trading versatility, offeredassisted by the cargo gear on Handymax types, but also relative rates of fleet supply growth.
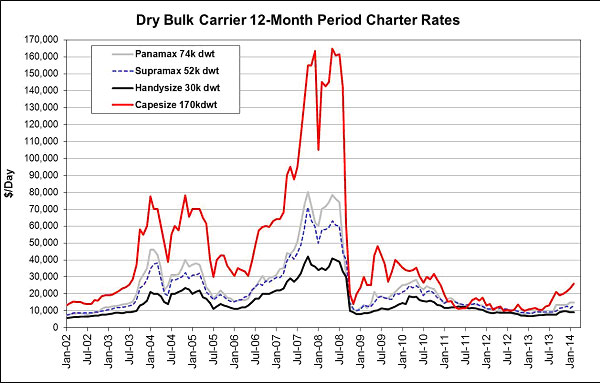
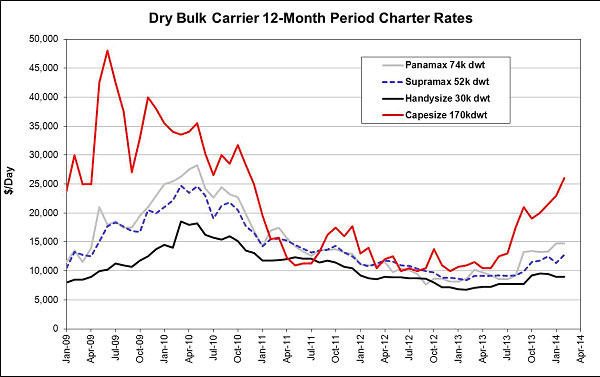
In addition to the global balance between the demand for new vessels and available shipbuilding capacity, newbuilding prices are also influenced by changes in vessel construction costs, due to such factors as movements in steel plate prices or exchange rates against the
USU.S. dollar in key shipbuilding nations (principally China, Japan and South Korea).
A higher US dollar cost base helps to explain why oversupplied shipbuilding markets have not returned newbuilding prices to their previous historic lows. For example,
Panamax bulk carrier newbuilding prices in Japan
fell frompeaked at $56 million in the third quarter of 2008
and subsequently fell to $29 million in the final quarter of
2012, which compares with an estimated $20 million in the first quarter of 2002.2012. By the end of 2013 Japanese prices had climbed to a 38-month high of $35 million, chiefly as the result of recovering newbuilding demand, and remained at similar levels
in the first two monthsthrough much of 2014.
Secondhand However, prices
entered a downward trend in 2015 which continued into 2016 and, by the final quarter of last year, Japanese Panamax newbuilding prices reached their lowest level since 2003 at an estimated $23.5 million.
Second-hand values are primarily shaped by actual and anticipated earnings, newbuilding replacement costs (which are relevant for modern vessels) and residual scrap value (more relevant for older units). To an extent, prices are also influenced by the availability and cost of ship
finance,financing, as this will help to determine whether investors are able to
realiserealize their demand for new or
secondhandsecond-hand vessels.
The
accompanying charts
below compare the development of representative newbuilding,
fivefive-year old and
ten yearten-year old
secondhandsecond-hand prices for Handysize, Handymax, Panamax and Capesize vessels since 2002. Individual vessel prices
will vary according to such factors as specific size, age, cargo gear, yard of build and fuel consumption. Following the pattern of the charter markets, prices peaked between mid-2007 and mid-2008. Such was the shortage of shipbuilding capacity during that period,
- with a lengthening lead time between contracting and delivery,
- that demand for existing vessels with prompt delivery briefly created the
abnormalunusual situation where
secondhandsecond-hand vessels were priced at a premium to newbuildings.
Consequently, the percentage decline in
secondhandsecond-hand prices
from their peaksbetween 2008 and 2012 was more severe than for newbuildings.
Nevertheless, prices did not fall back to their 2002 lows and have shownPrices showed a firmer trend
sincefrom the beginning of 2013
with five yearto March 2014, when five-year old values
risingrose by an average of approximately 50%
between December 2012 and February 2014,, led by a
60%60-70% increase in Capesize prices.
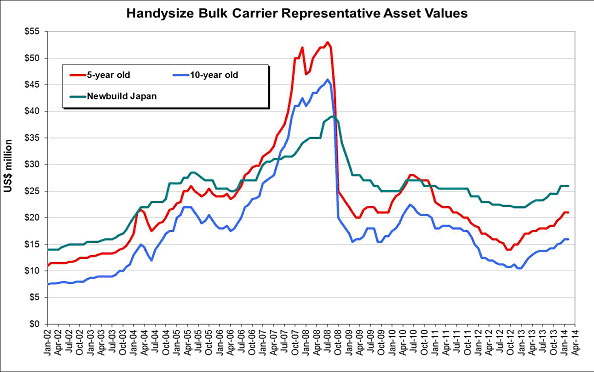
The onset of generally weaker spot and period charter rates began to erode second-hand values during the latter months of 2014, and downward pressure intensified during 2015 and into 2016, sharply reducing prices. By the end of February 2016, Panamax five-year old prices of approximately $11.0 million were at their lowest since the 1980s. However, from these lows, second-hand prices have shown some improvement, with Panamax five-year old values reaching approximately $14.0 million at the end of 2016. There were larger percentage rises in Supramax and Handysize five-year old prices over the same 10-month period, while Capesize values are estimated to have shown a smaller percentage increase. 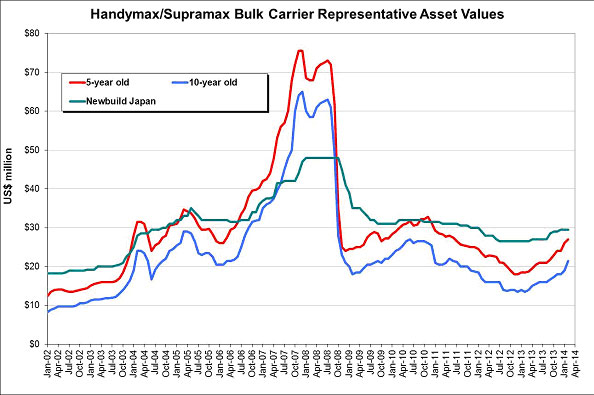

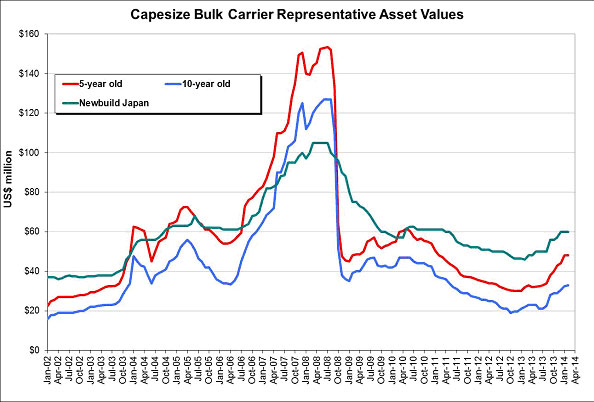
Environmental and Other Regulations
Government regulation significantly affects the ownership and operation of our fleet. We are subject to international conventions and treaties and national, state and local laws and regulations relating to safety and health and environmental protection in force in the countries in which our vessels may operate or are registered. These regulations include requirements relating to the storage, handling, emission, transportation and discharge of hazardous and non-hazardous materials, and the remediation of contamination and liability for damage to natural resources. Compliance with such laws, regulations and other requirements may entail significant expense, including vessel modifications and implementation of certain operating procedures.
A variety of government,
quasi-governmental and private
entitiesorganizations subject our vessels to both scheduled and unscheduled inspections. These entities include the local port authorities (applicable national authorities such as the United States Coast Guard,
or USCG, harbor master or equivalent), classification societies; flag state administrations (countries of registry) and charterers, particularly terminal operators. Certain of these entities require us to obtain permits, licenses, certificates and other authorizations for the operation of our vessels. Failure to maintain necessary permits or approvals could require us to incur substantial costs or result in the operation of one or more of our vessels being temporarily suspended.
We believe that the heightened level of environmental and quality concerns among insurance underwriters, regulators and charterers is leading to greater inspection and safety requirements on all vessels and may accelerate the scrapping of older vessels throughout the industry. Increasing environmental concerns have created a demand for vessels that conform to the stricter environmental standards. We are required to maintain operating standards for all of our vessels that emphasize operational safety, quality maintenance, continuous training of our officers and crews and compliance with United States and international regulations. We believe that the operation of our vessels will be in substantial compliance with applicable environmental laws and regulations and that our vessels will have all material permits licenses, certificates or other authorizations necessary for the conduct of our operations. However, because such laws and regulations are frequently changed and may impose increasingly stricter requirements, we cannot predict the ultimate cost of complying with these requirements, or the impact of these requirements on the resale value or useful lives of our vessels. In addition, a future serious marine incident that causes significant adverse environmental impact, such as the 2010 BP plc Deepwater Horizon oil spill in the Gulf of Mexico, could result in additional legislation or regulations that could negatively affect our profitability. International Maritime Organization
The International Maritime Organization, the United Nations agency for maritime safety and the prevention of pollution by ships, or the IMO, has adopted the International Convention for the Prevention of Marine Pollution from Ships, 1973, as modified by
the related Protocol of 1978 and updated through various amendments (collectively, “MARPOL”). MARPOL entered into force on October 2, 1983. It has been adopted by over 150 nations, including many of the jurisdictions in which our vessels will operate.
MARPOL is broken into six Annexes, each of which regulates a different source of pollution. Annex I relates to oil leakage or spilling; Annexes II and III relate to harmful substances carried, in bulk, in liquid or packaged form, respectively; Annexes IV and V relate to sewage and garbage management, respectively; and Annex VI relates to air emissions.
In 2012, the IMO’s Marine Environment Protection Committee, or MEPC, adopted by resolution amendments to the international code for the construction and equipment of ships carrying dangerous chemicals in bulk, or the IBC Code. The provisions of the IBC Code are mandatory under MARPOL and SOLAS. These amendments, which entered into force in June 2014, pertain to revised international certificates of fitness for the carriage of dangerous chemicals in bulk and identifying new products that fall under the IBC Code. We may need to make certain financial expenditures to comply with these amendments.
In 2013 the MEPC adopted by resolution amendments to the MARPOL Annex I Condition Assessment Scheme,
(CAS).CAS. These amendments
which are expected to becomebecame effective on October 1, 2014
and pertain to revising references to the inspections of bulk carriers and tankers after the 2011 ESP Code, which enhances the programs of inspections, becomes mandatory. We may need to make certain financial expenditures to comply with these amendments.
In September of 1997, the IMO adopted Annex VI to MARPOL to address air pollution. Effective May 2005, Annex VI set limits on nitrogen oxide emissions from ships whose diesel engines were constructed (or underwent major conversions) on or after January 1, 2000. It also prohibits “deliberate emissions” of “ozone depleting substances,” defined to include certain halons and chlorofluorocarbons. “Deliberate emissions” are not limited to times when the ship is at sea; they can for example include discharges occurring in the course of the ship’s repair and maintenance. Emissions of “volatile organic compounds” from certain vessels, and the shipboard incineration (from incinerators installed after January 1, 2000) of certain substances (such as polychlorinated biphenyls,
(PCBs))PCBs) are also prohibited. Annex VI also includes a global cap on the sulfur content of fuel oil
and allows for special areas to be established with more stringent controls of sulfur emissions known as “Emission Control Areas,” or ECAs (see below).
The IMO’s Maritime Environment Protection Committee, or
MEPC, adopted amendments to Annex VI on October 10, 2008, which entered into force on July 1, 2010. The amended Annex VI seeks to further reduce air pollution by, among other things, implementing a progressive reduction of the amount of sulfur contained in any fuel oil used on board ships. As of January 1, 2012, the amended Annex VI required that fuel oil contain no more than 3.50% sulfur (from the previous cap of 4.50%). On October 27, 2016, at its 70th session, MEPC 70, MEPC announced its decision concerning the implementation of regulations mandating a reduction in sulfur emissions from the current 3.5% to 0.5% as of the beginning of 2020 rather than pushing the deadline back to 2025. By January 1, 2020 ships will now have to either reduce sulfur content must not exceed 0.50%, subjectfrom emissions through the installation and use of emission scrubbers or buy fuel with lower sulfur content. Consequently, complying with MEPC 70 could result in a significant capital expenditure or a significant increase in the cost of bunkers. The Company is currently reviewing alternatives to a feasibility review to be completed no later than 2018.comply with MEPC 70 when it enters into force.
Sulfur content standards are even stricter within certain
“Emission Control Areas” (“ECAs”).ECAs. As of
JulyJanuary 1,
2010,2015, ships operating within an ECA
weremay not
permitted to use fuel with sulfur content in excess of
1.0% (reduced from 1.50%), which will be further reduced to 0.10%
on January 1, 2015.. Amended Annex VI established procedures for designating new ECAs. The Baltic and North Seas, certain coastal areas of North America and the United States Caribbean Sea are all within designated ECAs.
Ocean-going vessels in these areas are subject to stringent emission controls, which may cause us to incur additional costs. If other ECAs are approved by the IMO or other new or more stringent requirements relating to emissions from marine diesel engines or port operations by vessels are adopted by the
U.S. Environmental Protection Agency, or the EPA, or the states where we operate, compliance with these regulations could entail significant capital expenditures, operational changes, or otherwise increase the costs of our operations.
Amended For example, the amended Annex VI also establishes new tiers of stringent nitrogen oxide emissions standards for new marine engines, depending on their date of installation. The U.S. EPA promulgated equivalent (and in some senses stricter) emissions standards in late 2009.
At MEPC 70, MEPC approved the North Sea and Baltic Sea as ECAs for nitrogen oxides, effective January 1, 2021. It is expected that these areas will be formally designated after the draft amendments are presented at MEPC’s next session.
As of January 1, 2013, MARPOL made mandatory certain measures relating to energy efficiency for ships.
ThisUnder these measures, by 2025, all new ships built will be 30% more energy efficient than those built in 2014.This included the requirement that all new ships utilize the Energy Efficiency Design Index, or
“EEDI”,EEDI, and all ships develop and implement Ship Energy Management Plans,
(SEEMPs).or SEEMPs.
We believe that all our vessels will be compliant in all material respects with these regulations. Additional or new conventions, laws and regulations may be adopted that could require the installation of expensive emission control systems and could adversely affect our business, results of operations, cash flows and financial condition.
The IMO adopted
the International Convention for the Control and Management of Ships’ Ballast Water and Sediments, or the BWM Convention, in February 2004. The BWM Convention’s implementing regulations call for a phased introduction of mandatory ballast water exchange requirements, to be replaced in time with mandatory concentration limits.
All ships will also have to carry a ballast water record book and an International Ballast Water Management Certificate. The BWM Convention
will not become effective untilenters into force 12 months after it has been adopted by 30 states, the combined merchant fleets of which represent not less than 35% of the gross tonnage of the world’s merchant shipping.
To date, there has not been sufficient adoption ofOn September 8, 2016, this
standard for it to take force.threshold was met (with 52 contracting parties making up 35.14%). Thus, the BWM Convention will enter into force on September 8, 2017. Many of the implementation dates
originally written in the BWM Convention have already passed, so
that once the BWM Convention enters into force, the period of installation of mandatory ballast water exchange requirements would be extremely short, with several thousand ships a year needing to install ballast water management systems, or BWMS. For this reason, on December 4, 2013, the IMO Assembly passed a resolution revising the
application dates
of applicability of the requirements of the BWM Convention so that they are triggered by the entry into force date and not the dates originally in the BWM Convention. This, in effect,
mademakes all vessels constructed before the entry into force date
‘existing’ vessels“existing vessels” and
delayedallows for the
date for installation of
ballast water management systemsa BWMS on such vessels
untilat the first renewal survey following entry into
force.force of the convention. At MEPC 70, MEPC adopted updated “guidelines for approval of ballast water managements systems (G8).” G8 updates previous guidelines concerning procedures to approve BWMS. Once mid-ocean ballast exchange or ballast water treatment requirements become mandatory, the cost of compliance could increase for ocean
carriers.carriers and the costs of ballast water treatments may be material. However, many countries already regulate the discharge of ballast water carried by vessels from country to country to prevent the introduction of invasive and harmful species via such discharges. The United States for example, requires vessels entering its waters from another country to conduct mid-ocean ballast exchange, or undertake some alternate measure, and to comply with certain reporting requirements. Although we do not believe that the costs of such compliance would be material, it is difficult to predict the overall impact of such a requirement on our operations.
Safety Management System Requirements
The IMO has also adopted
the International Convention for the Safety of Life at Sea, or SOLAS and
the International Convention on Load Lines, or the LL Convention, which impose a variety of standards that regulate the design and operational features of ships. The IMO periodically revises the SOLAS and LL Convention standards. Amendments to SOLAS relating to safe manning of vessels that were adopted in May 2012 entered in force on January 1, 2014. The Convention on Limitation of Liability for Maritime Claims,
(LLMC)LLMC, was recently amended and the amendments
are expected to gowent into effect on June 8, 2015. The amendments alter the limits of liability for loss of life or personal injury claims and property claims against ship owners. We believe that all our vessels will be in substantial compliance with SOLAS and LL Convention standards.
Our operations are also subject to environmental standards and requirements under Chapter IX of SOLAS
set forth in the
International Safety Management Code for the Safe Operation of Ships and for Pollution Prevention, or ISM Code. The ISM Code requires the owner of a vessel, or any person who has taken responsibility for operation of a vessel, to develop an extensive safety management system that includes, among other things, the adoption of a safety and environmental protection policy setting forth instructions and procedures for operating its vessels safely and describing procedures for responding to emergencies. We rely upon the safety management system that we and our technical manager have developed for compliance with the ISM Code. The failure of a ship owner or bareboat charterer to comply with the ISM Code may subject such party to increased liability, may decrease available insurance coverage for the affected vessels and may result in a denial of access to, or detention in, certain ports.
The ISM Code requires that vessel operators obtain a safety management certificate for each vessel they operate. This certificate evidences compliance by a vessel’s management with the ISM Code requirements for a safety management system. No vessel can obtain a safety management certificate under the ISM Code unless its manager has been awarded a document of compliance, issued by classification societies under the authority of each flag state. SSM has or will obtain documents of compliance for their offices and will obtain safety management certificates for all of our vessels for which the certificates are required by the IMO. The document of compliance
or the DOC, and safety management certificate
or the SMC, are renewed every five years, but the
DOCdocument of compliance is subject to audit verification annually and the
SMCsafety management certificate at least every 2.5 years.
The flag state, as defined by the United Nations Convention on Law of the Sea, has overall responsibility for implementing and enforcing a broad range of international maritime regulations with respect to all ships granted the right to fly its flag. The “Shipping Industry Guidelines on Flag State Performance”Performance Table” published annually by the International Chamber of Shipping evaluates and reports on flag states based on factors such as sufficiency of infrastructure, ratification, implementation, and enforcement of principal international maritime treaties and regulations, supervision of statutory ship surveys, casualty investigations and participation at IMO and ILO meetings. All of our vessels will be flagged in the Marshall Islands. Marshall Islands flagged vessels have historically received a good assessment in the shipping industry. We recognize the importance of a credible flag state and do not intend to use flags of convenience or flag states with
poor performance indicators. Noncompliance with the ISM Code or other IMO regulations may subject the ship owner or bareboat charterer to increased liability, may lead to decreases in available insurance coverage for affected vessels and may result in the denial of access to, or detention in, some ports. The
U.S. Coast GuardUSCG and European Union authorities have indicated that vessels not in compliance with the ISM Code by the applicable deadlines will be prohibited from trading in U.S. and European Union ports, respectively. Each of our vessels will be ISM Code certified. However, there can be no assurance that such certificate will be maintained.
Noncompliance with the ISM Code and other IMO regulations may subject the shipowner or bareboat charterer to increased liability, may lead to decreases in, or invalidation of, available insurance coverage for affected vessels and may result in the denial of access to, or detention in, some ports.
Pollution Control and Liability Requirements
The IMO has negotiated international conventions that impose liability for oil pollution in international waters and the territorial waters of the signatory to such conventions. Many countries have ratified and follow the liability plan adopted by the IMO and set out in the International Convention on Civil Liability for Oil Pollution Damage of 1969, as amended by different Protocol in 1976, 1984, and 1992, and amended in 2000, or the CLC. Under this convention, and depending on whether the country in which the damage results is a party to the 1992 Protocol to the CLC, a vessel’s registered owner is strictly liable for pollution damage caused in the territorial waters of a contracting state by discharge of persistent oil, subject to certain exceptions. The 1992 Protocol changed certain limits on liability, expressed using the International Monetary Fund currency unit of Special Drawing Rights. The limits on liability have since been amended so that the compensation limits on liability were raised. The right to limit liability is forfeited under the CLC where the spill is caused by the ship owner’s actual fault and under the 1992 Protocol where the spill is caused by the ship owner’s intentional or reckless act or omission where the ship owner knew pollution damage would probably result. The CLC requires ships covered by it to maintain insurance covering the liability of the owner in a sum equivalent to an owner’s liability for a single incident. We believe that our protection and indemnity insurance will cover the liability under the plan adopted by the IMO.
The IMO adopted the International Convention on Civil Liability for Bunker Oil Pollution Damage, or the Bunker Convention, to impose strict liability on ship owners for pollution damage in jurisdictional waters of ratifying states caused by discharges of bunker fuel. The Bunker Convention requires registered owners of ships over 1,000 gross tons to maintain insurance for pollution damage in an amount equal to the limits of liability under the applicable national or international limitation regime (but not exceeding the amount calculated in accordance with the Convention on Limitation of Liability for Maritime Claims of 1976, as amended). With respect to non-ratifying states, liability for spills or releases of oil carried as fuel in ship’s bunkers typically is determined by the national or other domestic laws in the jurisdiction where the events or damages occur.
IMO regulations also require owners and operators of vessels to adopt shipboard oil pollution emergency plans and/or shipboard marine pollution emergency plans for noxious liquid substances in accordance with the guidelines developed by the IMO.
The IMO continues to review and introduce new regulations. It is impossible to predict what additional regulations, if any, may be passed by the IMO and what effect, if any, such regulations may have on our operations.
The U.S. Oil Pollution Act of 1990 and Comprehensive Environmental Response, Compensation and Liability Act
The U.S. Oil Pollution Act of 1990, or OPA, established an extensive regulatory and liability regime for the protection and cleanup of the environment from oil spills. OPA affects all “owners and operators” whose vessels trade in the United States, its territories and possessions or whose vessels operate in United States waters, which includes the United States’ territorial sea and its 200 nautical mile exclusive economic zone. The United States has also enacted the Comprehensive Environmental Response, Compensation and Liability Act, or CERCLA, which applies to the discharge of hazardous substances other than oil
except in limited circumstances, whether on land or at sea. OPA and CERCLA both define “owner and operator” in the case of a vessel as any person owning, operating or chartering by demise, the vessel. OPA applies to oil tankers (which are not operated by us), as well as non-tanker ships that carry fuel oil, or bunkers, to power such ships. CERCLA also applies to our operations.
Under OPA, vessel owners and operators are “responsible parties” and are jointly, severally and strictly liable (unless the spill results solely from the act or omission of a third party, an act of God or an act of war) for all containment and clean-up costs and other damages arising from discharges or threatened discharges of oil from their vessels. OPA defines these other damages broadly to include:
| ● | injury to, destruction or loss of, or loss of use of, natural resources and the costs of assessment thereof; |
| ● | injury to, or economic losses resulting from, the destruction of real and personal property; |
| ● | net loss of taxes, royalties, rents, fees or net profit revenues resulting from injury, destruction or loss of real or personal property, or natural resources; |
| ● | loss of subsistence use of natural resources that are injured, destroyed or lost; |
| ● | lost profits or impairment of earning capacity due to injury, destruction or loss of real or personal property or natural resources; |
| ● | net cost of increased or additional public services necessitated by removal activities following a discharge of oil, such as protection from fire, safety or health hazards. |
•injury to, destruction or loss of, or loss of use of, natural resources and the costs of assessment thereof;
•injury to, or economic losses resulting from, the destruction of real and personal property;
•net loss of taxes, royalties, rents, fees or net profit revenues resulting from injury, destruction or loss of real or personal property, or natural resources;
•loss of subsistence use of natural resources that are injured, destroyed or lost;
•lost profits or impairment of earning capacity due to injury, destruction or loss of real or personal property or natural resources;
•net cost of increased or additional public services necessitated by removal activities following a discharge of oil, such as protection from fire, safety or health hazards.
OPA contains statutory caps on liability and damages; such caps do not apply to direct cleanup costs. Effective
July 31, 2009,December 21, 2015, the
U.S. Coast GuardUSCG adjusted the limits of OPA liability for non-tank vessels,
edible oil tank vessels, and any oil spill response vessels, to the greater of
$1,000$1,100 per gross ton or
$854,400$939,800 (subject to periodic adjustment for inflation). These limits of liability do not apply if an incident was proximately caused by the violation of an applicable U.S. federal safety, construction or operating regulation by a responsible party (or its agent, employee or a person acting pursuant to a contractual relationship), or a responsible party’s gross negligence or willful misconduct. The limitation on liability similarly does not apply if the responsible party fails or refuses to (i) report the incident where the
responsibilityresponsible party knows or has reason to know of the incident; (ii) reasonably cooperate and assist as requested in connection with oil removal activities; or (iii) without sufficient cause, comply with an order issued under the Federal Water Pollution Act (Section 311 (c), (e)) or the Intervention on the High Seas Act.
CERCLA contains a similar liability regime whereby owners and operators of vessels are liable for cleanup, removal and remedial costs, as well as damage for injury to, or destruction or loss of, natural resources, including the reasonable costs associated with assessing same, and health assessments or health effects studies. There is no liability if the discharge of a hazardous substance results solely from the act or omission of a third party, an act of God or an act of war. Liability under CERCLA is limited to the greater of $300 per gross ton or $5 million for vessels carrying a hazardous substance as cargo and the greater of $300 per gross ton or $500,000 for any other vessel. These limits do not apply (rendering the responsible person liable for the total cost of response and damages) if the release or threat of release of a hazardous substance resulted from willful misconduct or negligence, or the primary cause of the release was a violation of applicable safety, construction or operating standards or regulations. The limitation on liability also does not apply if the responsible person fails or refused to provide all reasonable cooperation and assistance as requested in connection with response activities where the vessel is subject to OPA.
OPA and CERCLA both require owners and operators of vessels to establish and maintain with the
U.S. Coast GuardUSCG evidence of financial responsibility sufficient to meet the maximum amount of liability to which the particular responsible person may be subject. Vessel owners and operators may satisfy their financial responsibility obligations by providing a proof of insurance, a surety bond, qualification as a self-insurer or a guarantee. We plan to comply with the
U.S. Coast Guard’sUSCG’s financial responsibility regulations by providing a certificate of responsibility evidencing sufficient self-insurance.
We currently maintain pollution liability coverage insurance in the amount of $1.0 billion per incident for each of our vessels. If the damages from a catastrophic spill were to exceed our insurance coverage it could have an adverse effect on our business and results of operation.
operations.
OPA specifically permits individual states to impose their own liability regimes with regard to oil pollution incidents occurring within their boundaries, provided they accept, at a minimum, the levels of liability established under OPA. Some states have enacted legislation providing for unlimited liability for oil spills. In some cases, states, which have enacted such legislation have not yet issued implementing regulations defining vessels owners’ responsibilities under these laws. We intend to comply with all existing and future applicable state regulations in the ports where our vessels call.
The 2010Deepwater Horizon oil spill in the Gulf of Mexico may also result in additional legislative or regulatory initiatives, including the raising of liability caps under OPA or more stringent operational requirements. We cannot predict what additional requirements, if any, may be enacted and what effect, if any, such requirements may have on our operations. Other Environmental Initiatives
The U.S. Clean Water Act, or CWA prohibits the discharge of oil or other substances in U.S. navigable waters unless authorized by a duly-issued permit or exemption, and imposes strict liability in the form of penalties for any unauthorized discharges. The CWA also imposes substantial liability for the costs of removal, remediation and damages and complements the remedies available under OPA and CERCLA. In addition, many U.S. states that border a navigable waterway have enacted environmental pollution laws that impose
strict liability on a person for removal costs and damages resulting from a discharge of oil or a release of a hazardous substance. These laws may be more stringent than U.S. federal law.
The EPA regulates the discharge of ballast water and other substances in U.S. waters under the CWA. EPA regulations require vessels 79 feet in length or longer (other than commercial fishing and recreational vessels) to comply with a Vessel General Permit, or VGP, that authorizes ballast water discharges and other discharges incidental to the operation of vessels. For a new vessel delivered to an owner or operator after September 19, 2009 to be covered by the VGP, the owner must submit a Notice of Intent, or NOI, at least 30 days before the vessel operates in U.S. waters. The VGP imposes technology and water-quality based effluent limits for certain types of discharges and establishes specific inspection, monitoring, record keeping and reporting requirements to ensure the effluent limits are met. The EPA renewed and revised the VGP, effective December 19, 2013. The VGP now contains numeric ballast water discharge limits for most vessels to reduce the risk of invasive species in U.S. waters and more stringent requirements for exhaust gas scrubbers and requires the use of environmentally acceptable lubricants. U.S. Coast Guard
The USCG, regulations adopted under the U.S. National Invasive Species Act, or NISA, also impose mandatory ballast water management practices for all vessels equipped with ballast water tanks entering or operating in U.S. waters. The Coast Guard, asAs of June 21, 2012, the U.S. Coast GuardUSCG adopted revised ballast water management regulations that established standards for allowable concentrations of living organisms in ballast water discharged from ships in U.S. waters. The Coast Guard’s revisedUSCG must approve any technology before it is placed on a vessel, but has not yet approved the technology necessary for vessels to meet the foregoing standards.
Notwithstanding the foregoing, as of January 1, 2014, vessels are technically subject to the phasing-in of these standards. As a result, the USCG has provided waivers to vessels which cannot install the as-yet unapproved technology. The EPA, on the other hand, has taken a different approach to enforcing ballast waterdischarge standards are consistent with requirements under the 2004 BWM Convention. VGP. On December 27, 2013, the EPA issued an enforcement response policy in connection with the new VGP in which the EPA indicated that it would take into account the reasons why vessels do not have the requisite technology installed, but will not grant any waivers.
It should also be noted that in October 2015, the Second Circuit Court of Appeals issued a ruling that directed the EPA to redraft the sections of the 2013 VGP that address ballast water. However, the Second Circuit stated that 2013 VGP will remains in effect until the EPA issues a new VGP.
Compliance with the EPA and the
U.S. Coast GuardUSCG regulations could require the installation of equipment on our vessels to treat ballast water before it is discharged or the implementation of other port facility disposal arrangements or procedures at potentially substantial cost, or may otherwise restrict our vessels from entering U.S. waters.
While we believe that our vessels have been fitted with systems that will comply with the standards, those systems may not be approved. If they are not approved it could have an adverse material impact on our business, financial condition, and results of operations depending on the available ballast water treatment systems and the extent to which existing vessels must be modified to accommodate such systems. In addition, certain states have enacted more stringent discharge standards as conditions to their required certification of the VGP. It presently remains unclear how the ballast water requirements set forth by the EPA, the USCG, and IMO BWM Convention, some of which are in effect and some which are pending, will co-exist.
The U.S. Clean Air Act of 1970, as amended by the Clean Air Act Amendments of 1977 and 1990, or the CAA, requires the EPA to promulgate standards applicable to emissions of volatile organic compounds and other air contaminants. Our vessels will be subject to vapor control and recovery requirements for certain cargoes when loading, unloading, ballasting, cleaning and conducting other operations in regulated port areas. Our vessels that operate in such port areas with restricted cargoes will be equipped with vapor recovery systems that satisfy these requirements. The CAA also requires states to adopt State Implementation Plans, or SIPs, designed to attain national health-based air quality standards in primarily major metropolitan and/or industrial areas. Several SIPs regulate emissions resulting from vessel loading and unloading operations by requiring the installation of vapor control equipment. As indicated above, our vessels operating in covered port areas will be equipped with vapor recovery systems that satisfy these existing requirements.
Compliance with future EPA and U.S. Coast Guard regulations could require the installation of certain engineering equipment and treatment systems or the implementation of other port facility disposal arrangements or procedures at potentially substantial cost, or may otherwise restrict our vessels from entering U.S. waters.
European Union Regulations
In October 2009, the European Union amended a directive to impose criminal sanctions for illicit ship-source discharges of polluting substances, including minor discharges, if committed with intent, recklessly or with serious negligence and the discharges individually or in the aggregate result in deterioration of the quality of water. Aiding and abetting the discharge of a polluting substance may also lead to criminal penalties. Member States were required to enact laws or regulations to comply with the directive by the end of 2010. Criminal liability for pollution may result in substantial penalties or fines and increased civil liability claims. The directive applies to all types of vessels, irrespective of their flag, but certain exceptions apply to warships or where human safety or that of the ship is in danger.
The European Union has adopted several regulations and directives requiring, among other things, more frequent inspections of high-risk ships, as determined by type, age, flag, and the number of times the ship has been detained. The European Union also adopted and then extended a ban on substandard ships and enacted a minimum ban period and a definitive ban for repeated offenses. The regulation also provided the European Union with greater authority and control over classification societies, by imposing more requirements on classification societies and providing for fines or penalty payments for organizations that failed to comply.
Greenhouse Gas Regulation
Currently, the emissions of greenhouse gases from international shipping are not subject to the Kyoto Protocol to the United Nations Framework Convention on Climate Change, which entered into force in 2005 and pursuant to which adopting countries have been required to implement national programs to reduce greenhouse gas emissions. The 2015 United Nations Convention on Climate Change Conference in Paris resulted in the Paris Agreement, which entered into force on November 4, 2016. The Paris Agreement does not directly limit greenhouse gas emissions from ships. As of January 1, 2013, ships were required to comply with new MEPC mandatory requirements to address greenhouse gas emissions from ships. Currently operating ships are required to develop SEEMPs, and minimum energy efficiency levels per capacity mile will apply to new ships. These requirements could cause us to incur additional compliance costs. The IMO is considering market-based mechanisms(as discussed above). For 2020, the EU made a unilateral commitment to reduce overall greenhouse gas emissions from ships.its member states from 20% of 1990 levels. The European Union has proposed legislationEU also committed to reduce its emissions by 20% under the Kyoto Protocol’s second period, from 2013 to 2020. In April 2015, a regulation was adopted requiring that would require the monitoringlarge ships (over 5,000 gross tons) calling at EU ports from January 2018 collect and reporting of greenhouse gaspublish data on carbon dioxide emissions from marine vessels. and other information.
In the United States, the EPA has issued a finding that greenhouse gases endanger the public health and safety, has adopted regulations to limit greenhouse gas emissions from certain mobile sources and has proposed regulations to limit greenhouse gas emissions from large stationary sources. Although the mobile source emissions regulations do not apply to greenhouse gas emissions from vessels, the EPA is considering a petitionhas received petitions from the California Attorney General and environmental groups to regulate greenhouse gas emissions from ocean-going vessels. Furthermore, in the United States individual states can also enact environmental regulations. For example, California has introduced caps for greenhouse gas emission and, in the end of 2016, signaled it might take additional actions regarding climate change.
Any passage of climate control legislation or other regulatory initiatives by the IMO, European Union, the U.S. or other countries where we operate, or any treaty adopted at the international level to succeed the Kyoto Protocol
or Paris Agreement, that restrict emissions of greenhouse gases could require us to make significant financial expenditures which we cannot predict with certainty at this time. Even in the absence of climate control legislation, our business may be indirectly affected to the extent that climate change may result in sea level changes or more intense weather events.
International Labour Organization
The International Labour Organization (ILO) is a specialized agency of the UN with headquarters in Geneva, Switzerland. The ILO has adopted the Maritime Labor Convention 2006,
(MLC 2006).or MLC 2006. A Maritime Labor Certificate and a Declaration of Maritime Labor Compliance will be required to ensure compliance with the MLC 2006 for all ships above 500 gross tons in international trade. The MLC 2006 came into force on August 20,
20132013. Amendments to MLC were adopted in 2014 and
we2016. We are in compliance with
these results.MLC 2006.
Vessel Security Regulations
Since the terrorist attacks of September 11, 2001, there have been a variety of initiatives intended to enhance vessel security. On November 25, 2002, the
U.S. Maritime Transportation Security Act of 2002, or the MTSA came into effect. To implement certain portions of the MTSA, in July 2003, the
U.S. Coast GuardUSCG issued regulations requiring the implementation of certain security requirements aboard vessels operating in waters subject to the jurisdiction of the United States. The regulations also impose requirements on certain ports and facilities, some of which are regulated by the EPA.
Similarly, in December 2002, amendments to SOLAS created a new chapter of the convention dealing specifically with maritime security. The new Chapter
VXI-2 became effective in July 2004 and imposes various detailed security obligations on vessels and port authorities, and mandates compliance with the International Ship and Port Facility Security Code, or the ISPS Code. The ISPS Code is designed to enhance the security of ports and ships against terrorism. After July 1, 2004, to trade internationally, a vessel must attain an International Ship Security Certificate, or ISSC, from a recognized security organization approved by the vessel’s flag state.
AmongThe following are among the various requirements,
are: | ● | on-board installation of automatic identification systems to provide a means for the automatic transmission of safety-related information from among similarly equipped ships and shore stations, including information on a ship’s identity, position, course, speed and navigational status; |
| ● | on-board installation of ship security alert systems, which do not sound on the vessel but only alert the authorities on shore; |
| ● | the development of a ship security plan; |
| ● | ship identification number to be permanently marked on a vessel’s hull; |
| ● | a continuous synopsis record kept onboard showing a vessel’s history including the name of the ship, the state whose flag the ship is entitled to fly, the date on which the ship was registered with that state, the ship’s identification number, the port at which the ship is registered and the name of the registered owner(s) and their registered address; and |
| ● | compliance with flag state security certification requirements. |
some of which are found in SOLAS:
on-board installation of automatic identification systems to provide a means for the automatic transmission of safety-related information from among similarly equipped ships and shore stations, including information on a ship’s identity, position, course, speed and navigational status;
on-board installation of ship security alert systems, which do not sound on the vessel but only alert the authorities on shore;
the development of a ship security plan;
ship identification number to be permanently marked on a vessel’s hull;
a continuous synopsis record kept onboard showing a vessel’s history including the name of the ship, the state whose flag the ship is entitled to fly, the date on which the ship was registered with that state, the ship’s identification number, the port at which the ship is registered and the name of the registered owner(s) and their registered address; and
compliance with flag state security certification requirements.
Any vessel operating without a valid certificate may be detained at port until it obtains an ISSC, or it may be expelled from port, or refused entry at port.
The
U.S. Coast GuardUSCG regulations, intended to align with international maritime security standards, exempt from MTSA vessel security measures non-U.S. vessels provided such vessels have on board a valid ISSC that attests to the vessel’s compliance with SOLAS security requirements and the ISPS Code. Our managers intend to implement the various security measures addressed by MTSA, SOLAS and the ISPS Code, and we intend that our fleet will comply with applicable security requirements.
Inspection by Classification Societies
Every oceangoing vessel must be “classed” by a classification society. The classification society certifies that the vessel is “in class”, signifying that the vessel has been built and maintained in accordance with the rules of the classification society and complies with applicable rules and regulations of the vessel’s country of registry and the international conventions of which that country is a member. In addition, where surveys are required by international conventions and corresponding laws and ordinances of a flag state, the classification society will undertake them on application or by official order, acting on behalf of the authorities concerned.
The classification society also undertakes on request other surveys and checks that are required by regulations and requirements of the flag state. These surveys are subject to agreements made in each individual case and/or to the regulations of the country concerned.
For maintenance of the class certification, regular and extraordinary surveys of hull, machinery, including the electrical plant, and any special equipment classed are required to be performed as follows:
Annual Surveys. For seagoing ships, annual surveys are conducted for the hull and the machinery, including the electrical plant and where applicable for special equipment classed, at intervals of 12 months from the date of commencement of the class period indicated in the certificate. Intermediate Surveys. Extended annual surveys are referred to as intermediate surveys and typically are conducted two and one-half years after commissioning and each class renewal. Intermediate surveys may be carried out on the occasion of the second or third annual survey. Class Renewal Surveys. Class renewal surveys, also known as special surveys, are carried out for the ship’s hull, machinery, including the electrical plant, and for any special equipment classed, at the intervals indicated by the character of classification for the hull. At the special survey the vessel is thoroughly examined, including audio-gauging to determine the thickness of the steel structures. Should the thickness be found to be less than class requirements, the classification society would prescribe steel renewals. The classification society may grant a one-year grace period for completion of the special survey. Substantial amounts of money may have to be spent for steel renewals to pass a special survey if the vessel experiences excessive wear and tear. In lieu of the special survey every four or five years, depending on whether a grace period was granted, a ship owner has the option of arranging with the classification society for the vessel’s hull or machinery to be on a continuous survey cycle, in which every part of the vessel would be surveyed within a five-year cycle. Upon a ship owner’s request, the surveys required for class renewal may be split according to an agreed schedule to extend over the entire period of class. This process is referred to as continuous class renewal. All areas subject to survey as defined by the classification society are required to be surveyed at least once per class period, unless shorter intervals between surveys are prescribed elsewhere. The period between two subsequent surveys of each
area must not exceed five years. Vessels under five years of age can waive drydocking in order to increase available days and decrease capital expenditures, provided the vessel is inspected underwater.
Most vessels are also drydocked every 30 to 36 months for inspection of the underwater parts and for repairs related to inspections. If any defects are found, the classification surveyor will issue a “recommendation” which must be rectified by the ship owner within prescribed time limits.
Most insurance underwriters make it a condition for insurance coverage that a vessel be certified as “in class” by a classification society which is a member of the International Association of Classification Societies,
(the IACS).or the IACS. In 2012, the IACS issued draft harmonized Common
StructureStructural Rules, that align with the IMO goals standards, and were adopted in winter 2013. All our vessels will be certified as being “in class” by the American Bureau of Shipping, or ABS, and Det Norske Veritas, or DNV, major classification societies. All new and secondhand vessels that we acquire must be certified prior to their delivery under our standard purchase contracts and memorandum of agreement. If the vessel is not certified on the date of closing, we have no obligation to take delivery of the vessel.
Risk of Loss and Liability Insurance
The operation of any drybulk vessel includes risks such as mechanical and structural failure, hull damage, collision, property loss, cargo loss or damage and business interruption due to political circumstances in foreign countries, piracy, hostilities and labor strikes. In addition, there is always an inherent possibility of marine disaster, including oil spills and other environmental incidents, and the liabilities arising from owning and operating vessels in international trade. OPA, which imposes virtually unlimited liability upon owners, operators and demise charterers of vessels trading in the United States exclusive economic zone for certain oil pollution accidents in the United States, has made liability insurance more expensive for ship owners and operators trading in the United States market.
We plan to maintain hull and machinery insurance, war risks insurance, protection and indemnity cover, and freight, demurrage and defense cover for our fleet in amounts that we believe to be prudent to cover normal risks in our operations. However, we may not be able to achieve or maintain this level of coverage throughout a vessel’s useful life. In addition, while we believe that the insurance coverage that we plan to obtain will behave obtained is adequate, not all risks can be insured, and there can be no guarantee that any specific claim will be paid, or that we will always be able to obtain adequate insurance coverage at reasonable rates.
Hull & Machinery and War Risks Insurance
We
plan to maintain marine hull and machinery and war risks insurance, which will include the risk of actual or constructive total loss, for all of our vessels.
We expect that eachEach of our vessels
will beis covered up to at least fair market value with deductibles of
$100,000—$100,000-$150,000 per vessel per incident. We also
plan to maintain increased value coverage for most of our vessels. Under this increased value coverage, in the event of total loss of a vessel, we will be able to recover the sum insured under the increased value policy in addition to the sum insured under the hull and machinery policy. Increased value insurance also covers excess liabilities which are not recoverable under our hull and machinery policy by reason of under insurance.
Protection and Indemnity Insurance
Protection and indemnity insurance is provided by mutual protection and indemnity associations, or P&I Associations, which insure liabilities to third parties in connection with our shipping activities. This includes third-party liability and other related expenses resulting from the injury or death of crew, passengers and other third parties, the loss or damage to cargo, claims arising from collisions with other vessels, damage to other third-party property, pollution arising from oil or other substances and salvage, towing and other related costs, including wreck removal. Our P&I coverage will be subject to and in accordance with the rules of the P&I Association in which the vessel is entered. Protection and indemnity insurance is a form of mutual indemnity insurance, extended by protection and indemnity mutual associations, or “clubs.” Our coverage is
expected to be limited to approximately $6.5 billion, except for pollution which is limited to $1
billion and passenger and crew which is limited to $3 billion.
We expect that our
Our protection and indemnity insurance coverage for pollution will be $1 billion per vessel per incident. The thirteen P&I Associations that comprise the International Group insure approximately 90% of the world’s commercial tonnage and have entered into a pooling agreement to reinsure each association’s liabilities. Each P&I Association has capped its exposure to this pooling agreement at $6.5 billion. As a member of a P&I Association which is a member of the International Group, we are subject to calls payable to the associations based on the group’s claim records as well as the claim records of all other members of the individual associations and members of the pool of P&I Associations comprising the International Group.
Permits and Authorizations
We are required by various governmental and quasi-governmental agencies to obtain certain permits, licenses and certificates with respect to our vessels. The kinds of permits, licenses and certificates required depend upon several factors, including the commodity transported, the waters in which the vessel operates, the nationality of the vessel’s crew and the age of a vessel. We expect to be able to obtainbelieve that we have obtained all permits, licenses and certificates currently required to permit our vessels to operate. Additional laws and regulations, environmental or otherwise, may be adopted which could limit our ability to do business or increase the cost of us doing business.
| |
| C. | Organizational Structure |
Scorpio Bulkers Inc. is a company incorporated under the laws of the Marshall Islands. We own our vessels through separate wholly-owned subsidiaries that are incorporated in the Marshall Islands or Cayman Islands. Please see Exhibit 8.1 to this annual report for a list of our current subsidiaries.
| |
| D. | Property, Plants and Equipment |
We do not own any material real property. We lease office space in Monaco and in New York, New York. Our only material assets consist of our vessels (including our
contractscontract for the construction of
oura new
vessels)vessel) which are owned through our separate wholly owned subsidiaries.
For a description of our fleet, see “Item 4. Information on the Company—A. History and Development of the Company” and “Item 4. Information on the Company—B. Business Overview—Our Fleet.”
|
| |
| ITEM 4A. | UNRESOLVED STAFF COMMENTS |
None.
|
| |
| ITEM 5. | OPERATING AND FINANCIAL REVIEW AND PROSPECTS |
The following presentation of management’s discussion and analysis of results of operations and financial condition should be read in conjunction with our consolidated financial statements, accompanying notes thereto and other financial information appearing in
Item“Item 18.
“FinancialFinancial Statements.” You should also carefully read the following discussion with the sections of this annual report entitled
“Risk“Item 3. Key Information- D. Risk Factors” and “Cautionary Statement Regarding Forward-Looking Statements.” Our consolidated financial statements as of December 31,
20132016, 2015 and
for the period from March 20, 2013 (date of inception) to December 31, 20132014 have been prepared in accordance with
accounting principles generally accepted in the United States of America, or U.S. GAAP.
As of December 31, 2013, we are a development stage company because we have not begun our planned principal operations. TheOur consolidated financial statements are presented in U.S. dollars ($) unless otherwise indicated. Any amounts converted from another non-U.S. currency to U.S. dollars in this annual report are at the rate applicable at the relevant date, or the average rate during the applicable period.
Results
We generate revenues by charging customers for the Periodtransportation of their drybulk cargoes using our vessels. Historically, these services generally have been provided under the following basic types of contractual relationships:
Commercial Pools, whereby we participate with other shipowners to operate a large number of vessels as an integrated transportation system, which offers customers greater flexibility and a higher level of service while achieving scheduling efficiencies. Pools negotiate charters primarily in the spot market but may also arrange time charter agreements. The size and scope of these pools enable them to enhance utilization rates for pool vessels by securing backhaul voyages and COAs (described below), thus generating higher effective TCE revenues than otherwise might be obtainable in the spot market.
Voyage charters, which are charters for short intervals that are priced on current, or “spot,” market rates.
Time charters, which are chartered to customers for a fixed period of time at rates that are generally fixed, but may contain a variable component based on inflation, interest rates, or current market rates.
For all types of vessels in contractual relationships, we are responsible for crewing and other vessel operating costs for our owned vessels and the charterhire expense for vessels that we time charter-in.
The table below illustrates the primary distinctions among these different employment arrangements: |
| | | | | |
| Voyage Charter | | Time Charter | | Commercial Pool |
| Typical contract length | Single voyage | | One year or more | | Varies |
Hire rate basis (1) | Varies | | Daily | | Varies |
Voyage expenses (2) | We pay | | Customer pays | | Pool pays |
Vessel operating costs for owned vessels (2) | We pay | | We pay | | We pay |
Charterhire expense for vessels chartered-in (2) | We pay | | We pay | | We pay |
Off-hire (3) | Customer does not pay | | Customer does not pay | | Pool does not pay |
| |
| (1) | “Hire rate” refers to the basic payment from the charterer for the use of the vessel. |
| |
| (2) | See “Important Financial and Operational Terms and Concepts” below. |
| |
| (3) | “Off-hire” refers to the time a vessel is not available for service due primarily to scheduled and unscheduled repairs or drydockings. For time chartered-in vessels, we do not pay the charterhire expense when the vessel is off-hire. |
As of the date of this annual report, all of our owned and time chartered-in vessels were operating in the Scorpio Group Pools.
Important Financial and Operational Terms and Concepts
We use a variety of financial and operational terms and concepts. These include the following:
Vessel revenues. Vessel revenues primarily include revenues from March 20, 2013 (datetime charters, pool revenues and voyage charters. Vessel revenues are affected by hire rates and the number of inception)days a vessel operates. Vessel revenues are also affected by the mix of business between vessels on time charter, vessels in pools and vessels operating on voyage charter. Revenues from vessels in pools and on voyage charter are more volatile, as they are typically tied to prevailing market rates.
Voyage charters. Voyage charters or spot voyages are charters under which the customer pays a transportation charge for the movement of a specific cargo between two or more specified ports. We pay all of the voyage expenses.
Voyage expenses. Voyage expenses primarily include bunkers, port charges, canal tolls, cargo handling operations and brokerage commissions paid by us under voyage charters, as well as brokerage commissions and miscellaneous voyage expenses that we are unable to collect under time charter and pool arrangements. These expenses are subtracted from voyage charter revenues to calculate TCE revenues.
Vessel operating costs. For our owned vessels, we are responsible for vessel operating costs, which include crewing, repairs and maintenance, insurance, stores, lube oils, communication expenses, and technical management fees.
Technical management fees are paid to SSM, which is controlled by the Lolli-Ghetti family. Pursuant to our Amended and Restated Master Agreement, SSM provides us with technical services, and we provide them with the ability to subcontract technical management of our vessels with our approval.
Charterhire. Charterhire is the amount we pay the owner for time chartered-in vessels. The amount is usually for a fixed period of time at rates that are generally fixed, but may contain a variable component based on inflation, interest rates, or current market rates. The vessel’s owner is responsible for crewing and other vessel operating costs.
Drydocking. We periodically drydock each of our owned vessels for inspection, repairs and maintenance and any modifications to comply with industry certification or governmental requirements. Generally, each vessel is drydocked every 30 months to 60 months. We capitalize a substantial portion of the costs incurred during drydocking and amortize those costs on a straight-line basis from the completion of a drydocking to the estimated completion of the next drydocking. We immediately expense costs for routine repairs and maintenance performed during drydocking that do not improve or extend the useful lives of the assets. The number of drydockings undertaken in a given period and the nature of the work performed determine the level of drydocking expenditures.
Depreciation. Depreciation expense typically consists of:
charges related to the depreciation of the historical cost of our owned vessels (less an estimated residual value) over the estimated useful lives of the vessels; and
charges related to the amortization of drydocking expenditures over the estimated number of years to the next scheduled drydocking.
Time charter equivalent (TCE) revenue or rates. We report TCE revenues, a non-GAAP financial measure, because (i) we believe it provides additional meaningful information in conjunction with voyage revenues and voyage expenses, the most directly comparable U.S.-GAAP measure, (ii) it assists our management in making decisions regarding the deployment and use of our vessels and in evaluating their financial performance, (iii) it is a standard shipping industry performance measure used primarily to compare period-to-period changes in a shipping company’s performance irrespective of changes in the mix of charter types (i.e., spot charters, time charters and bareboat charters) under which the vessels may be employed between the periods, and (iv) we believe that it presents useful information to investors. TCE revenue is vessel revenue less voyage expenses, including bunkers and port charges. The TCE rate achieved on a given voyage is expressed in U.S. dollars/day and is generally calculated by taking TCE revenue and dividing that figure by the number of revenue days in the period. For a reconciliation of TCE revenue, deduct voyage expenses from revenue on our Statement of Operations.
Revenue days. Revenue days are the total number of calendar days our vessels were in our possession during a period, less the total number of off-hire days during the period associated with repairs or drydockings. Consequently, revenue days represent the total number of days available for the vessel to earn revenue. Idle days, which are days when a vessel is available to earn revenue, yet is not employed, are included in revenue days. We use revenue days to show changes in net vessel revenues between periods.
Contract of affreightment. A contract of affreightment, or COA, relates to the carriage of specific quantities of cargo with multiple voyages over the same route and over a specific period of time which usually spans a number of years. A COA does not designate the specific vessels or voyage schedules that will transport the cargo, thereby providing both the charterer and shipowner greater operating flexibility than with voyage charters alone. The charterer has the flexibility to determine the individual voyage scheduling at a future date while the shipowner may use different vessels to perform these individual voyages. As a result, COAs are mostly entered into by large fleet operators, such as pools or shipowners with large fleets of the same vessel type. We pay the voyage expenses while the freight rate normally is agreed on a per cargo ton basis.
Commercial pools. To increase vessel utilization and revenues, we participate in commercial pools with other shipowners and operators of similar modern, well-maintained vessels. By operating a large number of vessels as an integrated transportation system, commercial pools offer customers greater flexibility and a higher level of service while achieving scheduling efficiencies. Pools employ experienced commercial charterers and operators who have close working relationships with customers and brokers, while technical management is performed by each shipowner. Pools negotiate charters with customers primarily in the spot market. The size and scope of these pools enable them to enhance utilization rates for pool vessels by securing backhaul voyages and COAs, thus generating higher effective TCE revenues than otherwise might be obtainable in the spot market while providing a higher level of service offerings to customers.
Operating days. Operating days are the total number of available days in a period with respect to the owned vessels, before deducting available days due to off-hire days and days in drydock. Operating days is a measurement that is only applicable to our owned vessels, not our chartered-in vessels.
Non-GAAP Financial Measures
To supplement our financial information presented in accordance with U.S. GAAP, management uses certain "non-GAAP financial measures" as such term is defined in SEC Regulation G, to clarify and enhance understanding of past performance and prospects for the future. Generally, a non-GAAP financial measure is a numerical measure of a company's operating performance, financial position or cash flows that excludes or includes amounts that are included in, or excluded from, the most directly comparable measure calculated and presented in accordance with U.S. GAAP. For example, non-GAAP financial measures may exclude the impact of certain unique and/or non-operating items such as acquisitions, divestitures, restructuring charges, large write-offs or items outside of management's control. Management believes that the following non-GAAP financial measures described below provide investors and analysts useful insight into our financial position and operating performance.
Adjusted net loss with related per share amounts are non-GAAP financial measures that we believe are useful to assist investors in gaining an understanding of the trends and operating results for our core business. These measures should be viewed in addition to, and not in lieu of, results reported under U.S. GAAP.
Reconciliations of adjusted net loss and related per share amounts as determined in accordance with U.S. GAAP for the years ended December 31,
20132016, 2015 and 2014 are provided below (dollars in thousands, except per share data).
|
| | | | | | | | | | | | | | | | | | | | | | | |
| | For the years ended December 31, |
| | 2016 | | 2015 | | 2014 |
| | Amount | | Per share | | Amount | | Per share | | Amount | | Per share |
| Net loss | $ | (124,835 | ) | | $ | (2.22 | ) | | $ | (510,789 | ) | | $ | (23.86 | ) | | $ | (116,565 | ) | | $ | (10.17 | ) |
| Adjustments: | | | | | | | | | | | |
| Loss / write down on assets held for sale | 12,433 |
| | 0.22 |
| | 422,937 |
| | 19.75 |
| | 55,487 |
| | 4.84 |
|
| Write down of deferred financing cost | 2,456 |
| | 0.04 |
| | 16,085 |
| | 0.75 |
| | — |
| | — |
|
| Charterhire contract termination | 10,000 |
| | 0.18 |
| | — |
| | — |
| | — |
| | — |
|
| Total adjustments | 24,889 |
| | 0.44 |
| | 439,022 |
| | 20.50 |
| | 55,487 |
| | 4.84 |
|
| Adjusted net loss | $ | (99,946 | ) | | $ | (1.78 | ) | | $ | (71,767 | ) | | $ | (3.36 | ) | | $ | (61,078 | ) | | $ | (5.33 | ) |
Time Charter Equivalent (TCE) revenue is defined as voyage revenues less voyage expenses. Such TCE revenue, divided by the number of our available days during the period, or revenue days, is TCE per revenue day, which is consistent with industry standards. TCE per revenue day is a common shipping industry performance measure used primarily to compare daily earnings generated by vessels on time charters with daily earnings generated by vessels on voyage charters, because charter hire rates for vessels on voyage charters are generally not expressed in per-day amounts while charter hire rates for vessels on time charters generally are expressed in such amounts.
Overview
Our results for the year ended December 31, 2016 reflect the weakness in the drybulk market experienced since the start of 2014 and the actions we have taken to enhance our liquidity position and balance sheet. The BDI continued to exhibit volatility in 2016, ranging 290 (the lowest level it has ever reached) to 1,257. Because our vessels were primarily chartered at rates tied to the spot market our revenues were adversely impacted.
For the period from March 20, 2013 (date of inception) toyear ended December 31, 2013,2016, we had a net loss $124.8 million, or $2.22 loss per diluted share. Our adjusted net loss for the same period was $99.9 million, or $1.78 loss per diluted share. The adjusted net loss excluded a loss/write off of vessels and assets held for sale of $12.4 million, the related write off of deferred financing costs on credit facilities that will no longer be used of $2.5 million as a result of the classifying these assets as held for sale and a charterhire contract termination fee of $10.0 million. These adjustments total a $0.44 loss per diluted share (see Non-GAAP Financial Measures).
For comparison, for the year ended December 31, 2015, we had a net loss of $6.3$510.8 million, or $0.16 basic and diluted$23.86 loss per diluted share. Our adjusted net loss for the same period was $71.8 million, or $3.36 adjusted loss per diluted share. The adjusted net loss excluded a write down on assets held for sale of $422.9 million and the related write off of deferred financing costs on credit facilities that will no longer be used of $16.1 million, or $20.50 loss per share (see Non-GAAP Financial Measures).
During this period,the year ended December 31, 2016, we took delivery of 17 newbuilding vessels. As of December 31, 2016, we had no42 owned vessels in operation.operation and six vessels under construction that were scheduled to be delivered to us in 2017 (of which five vessels have since been delivered to us).
Results for the Year Ended December 31, 2016 Compared to the Year Ended December 31, 2015 |
| | | | | | | | | | | | | | | | | | | | | | | | | | | | | | | | | | | | | |
| | Year Ended December 31, 2016 | | Year Ended December 31, 2015 |
| | Capesize | | Kamsarmax | | Ultramax | | Corporate | Total | | Capesize | | Kamsarmax | | Ultramax | | Corporate | Total |
| TCE Revenue: | | | | | | | | | | | | | | | | | |
| Vessel revenue | $ | — |
| | $ | 31,685 |
| | $ | 46,717 |
| | $ | — |
| $ | 78,402 |
| | $ | 9,038 |
| | $ | 26,712 |
| | $ | 26,771 |
| | $ | — |
| $ | 62,521 |
|
| Voyage expenses | — |
| | (81 | ) | | 36 |
| | — |
| (45 | ) | | 280 |
| | 331 |
| | 176 |
| | — |
| 787 |
|
| TCE Revenue | $ | — |
| | $ | 31,766 |
| | $ | 46,681 |
| | $ | — |
| $ | 78,447 |
| | $ | 8,758 |
| | $ | 26,381 |
| | $ | 26,595 |
| | $ | — |
| $ | 61,734 |
|
| Operating expenses: | | | | | | | |
| | | | | | | | |
|
| Vessel operating costs | — |
| | 27,083 |
| | 41,749 |
| | — |
| 68,832 |
| | 5,089 |
| | 9,986 |
| | 14,297 |
| | — |
| 29,372 |
|
| Charterhire expense | — |
| | 12,323 |
| | 5,033 |
| | | 17,356 |
| | — |
| | 29,509 |
| | 21,880 |
| | — |
| 51,389 |
|
| Charterhire termination | — |
| | 2,500 |
| | 7,500 |
| | — |
| 10,000 |
| | | | | | | | | — |
|
| Vessel depreciation | — |
| | 14,522 |
| | 22,040 |
| | — |
| 36,562 |
| | 3,623 |
| | 4,536 |
| | 6,104 |
| | — |
| 14,263 |
|
| General and administrative expense | 380 |
| | 1,718 |
| | 2,725 |
| | 29,172 |
| 33,995 |
| | 275 |
| | 498 |
| | 713 |
| | 33,896 |
| 35,382 |
|
| Loss / write down on assets held for sale | 1,006 |
| | 11,557 |
| | (130 | ) | | — |
| 12,433 |
| | 408,318 |
| | 8,997 |
| | 5,622 |
| | — |
| 422,937 |
|
| Total operating expenses | $ | 1,386 |
| | $ | 69,703 |
| | $ | 78,917 |
| | $ | 29,172 |
| $ | 179,178 |
| | $ | 417,305 |
| | $ | 53,526 |
| | $ | 48,616 |
| | $ | 33,896 |
| $ | 553,343 |
|
| Operating loss | $ | (1,386 | ) | | $ | (37,937 | ) | | $ | (32,236 | ) | | $ | (29,172 | ) | $ | (100,731 | ) | | $ | (408,547 | ) | | $ | (27,145 | ) | | $ | (22,021 | ) | | $ | (33,896 | ) | $ | (491,609 | ) |
| Other expense (income): | | | | | | | | | | | | | | | | | |
| Interest income | — |
| | — |
| | — |
| | (933 | ) | (933 | ) | | — |
| | — |
| | (4 | ) | | (352 | ) | (356 | ) |
| Foreign exchange gain (loss) | — |
| | — |
| | — |
| | 116 |
| 116 |
| | 4 |
| | 10 |
| | 27 |
| | (29 | ) | 12 |
|
| Financial expense, net | — |
| | — |
| | — |
| | 24,921 |
| 24,921 |
| | — |
| | — |
| | — |
| | 19,524 |
| 19,524 |
|
| Total other expense | — |
| | — |
| | — |
| | 24,104 |
| 24,104 |
| | 4 |
| | 10 |
| | 23 |
| | 19,143 |
| 19,180 |
|
| Net loss | $ | (1,386 | ) | | $ | (37,937 | ) | | $ | (32,236 | ) | | $ | (53,276 | ) | $ | (124,835 | ) | | $ | (408,551 | ) |
| $ | (27,155 | ) |
| $ | (22,044 | ) |
| $ | (53,039 | ) | $ | (510,789 | ) |
Vessel revenue increased significantly to $78.4 million in 2016 from $62.5 million in 2015 due to the increase in revenue days associated with the growth of our fleet.
TCE revenue (see Non-GAAP Financial Measures) was $78.4 million for 2016 and was associated with a day-weighted average of 36 vessels owned and three vessels time chartered-in, compared to $61.7 million for the prior year, which was associated with a day-weighted average of 16 vessels owned and 12 vessels time chartered-in. TCE revenue per day was $5,789 and $7,173 for 2016 and 2015, respectively. The decrease in TCE revenue per day was due to the depressed market in which we operated for most of the year. Overall TCE revenues increased versus the prior year despite the lower rates due to the increase in revenue days associated with the growth of our fleet.
Vessel operating costs were $68.8 million, including approximately $2.8 million of takeover costs associated with new deliveries and $2.2 million of other non-operating expenses and related to 36 vessels owned, on average during the period. Takeover costs will no longer be incurred after the delivery of the final vessel under construction, which is expected to occur in the second quarter of 2017. Vessel operating costs for the prior year were $29.4 million and related to 16 vessels owned, on average during the period. Daily operating costs excluding takeover and other non-operating expenses for 2016 were $5,129.
Charterhire expense decreased to $17.4 million in 2016 from $51.4 million in the prior year reflecting the reduction in the number of vessels time chartered-in. During 2016, we recorded a $10.0 million charge to terminate four time charter-in contracts. Terminating these contracts reduced our cash outflow and had a positive impact on our future operating results as the contracts were at above current market rates. As such,of December 31, 2016, we had no revenues, voyage expenses or vessel related expenses. two remaining time chartered-in vessels. Of these two time chartered-in vessels, one was redelivered in the first quarter of 2017, and the other is expected to be redelivered during the third quarter of 2017.
Depreciation increased to $36.6 million in 2016 from $14.3 million in the prior year reflecting the increase in our weighted average vessels owned to 36 from 16.
General and administrative expense was $5.5$34.0 million for 2016 and $35.4 for 2015 and included $18.6 million and $24.6 million of restricted stock amortization, respectively. Such amounts were generally not attributable to our operating segments and were therefore considered corporate. The decrease in restricted stock amortization was due to prior year grants, with higher fair values than current grants, vesting and being fully expensed as well as the period from March 20, 2013 (datereversal of inception)expense related to canceled awards. This decrease was offset by an increase in commercial management fees, reflecting the growth of our fleet.
During 2016, we recorded a loss/write off of vessels and assets held for sale of $12.4 million, of which $11.6 million related to the cancellation of a shipbuilding contract for a Kamsarmax bulk carrier and $0.8 million in additional expenses related to vessels held for sale at December 31,
2013,2015, including accrual adjustments and other cost true ups. The loss recorded in the
majorityprior year was associated with writing down 24 vessels and construction contracts that were sold or classified as held for sale during 2015, as well as incremental write-downs of
which relates to amortization of stock-based compensation and salaries of New York and Monaco based personnel, including our officers. Amortization of stock-based compensation was $3.4 millioncertain construction contracts that were classified as held for
the period from March 20, 2013 (date of inception) tosale at December 31,
2013.Also contributing to our net loss2014.
During 2016 and 2015, we wrote off $2.5 million and $16.1 million, respectively, of deferred financing costs accumulated on credit facilities for which the period from March 20, 2013 (date of inception) to December 31, 2013 was a $1.1 million foreign exchange loss. Such loss relatescommitments were reduced pursuant to the issuance andremoval from the facilities of certain vessels that have been sold or classified as held for sale on September 24, 2013or for which the construction contract was cancelled. In addition, during 2016, the Company agreed to reduce the aggregate available loan amounts by $45.2 million resulting in the write off of 33,400,000 common shares for net proceeds that were denominated in Norwegian kroner (NOK)approximately $1.3 million of deferred financing costs.
Please see Note 14, Segments, in Norwegian private placement transactions exempt from registration underto the Securities Act which was not settled in U.S. dollars until October 2013.Critical Accounting Policies
This discussion and analysis of our financial condition and results of operations is based upon our condensed consolidated financial statements included herein for more information on our segment results.
Results for the Year Ended December 31, 2015 Compared to the Year Ended 12/31/2014
|
| | | | | | | | | | | | | | | | | | | | | | | | | | | | | | | | | | | | | |
| | Year Ended December 31, 2015 | | Year ended December 31, 2014 |
| | Capesize | | Kamsarmax | | Ultramax | | Corporate | Total | | Capesize | | Kamsarmax | | Ultramax | | Corporate | Total |
| TCE Revenue: | | | | | | | | | | | | | | | | | |
| Vessel revenue | $ | 9,038 |
| | $ | 26,712 |
| | $ | 26,771 |
| | $ | — |
| $ | 62,521 |
| | $ | — |
| | $ | 38,770 |
| | $ | 10,217 |
| | $ | — |
| $ | 48,987 |
|
| Voyage expenses | 280 |
| | 331 |
| | 176 |
| | — |
| 787 |
| | — |
| | 3,653 |
| | 74 |
| | — |
| 3,727 |
|
| TCE Revenue | $ | 8,758 |
| | $ | 26,381 |
| | $ | 26,595 |
| | $ | — |
| $ | 61,734 |
| | $ | — |
| | $ | 35,117 |
| | $ | 10,143 |
| | $ | — |
| $ | 45,260 |
|
| Operating expenses: | | | | | | | | | | | | | | | | | |
| Vessel operating costs | 5,089 |
| | 9,986 |
| | 14,297 |
| | — |
| 29,372 |
| | — |
| | 1,600 |
| | — |
| | — |
| 1,600 |
|
| Charterhire expense | — |
| | 29,509 |
| | 21,880 |
| | — |
| 51,389 |
| | — |
| | 57,909 |
| | 15,305 |
| | — |
| 73,214 |
|
| Vessel depreciation | 3,623 |
| | 4,536 |
| | 6,104 |
| | — |
| 14,263 |
| | — |
| | 686 |
| | — |
| | — |
| 686 |
|
| General and administrative expense | 275 |
| | 498 |
| | 713 |
| | 33,896 |
| 35,382 |
| | 39 |
| | 103 |
| | 26 |
| | 31,593 |
| 31,761 |
|
| Loss / write down on assets held for sale | 408,318 |
| | 8,997 |
| | 5,622 |
| | — |
| 422,937 |
| | 52,553 |
| | 2,934 |
| | — |
| | — |
| 55,487 |
|
| Total operating expenses | $ | 417,305 |
| | $ | 53,526 |
| | $ | 48,616 |
| | $ | 33,896 |
| $ | 553,343 |
| | $ | 52,592 |
| | $ | 63,232 |
| | $ | 15,331 |
| | $ | 31,593 |
| $ | 162,748 |
|
| Operating loss | $ | (408,547 | ) | | $ | (27,145 | ) | | $ | (22,021 | ) | | $ | (33,896 | ) | $ | (491,609 | ) | | $ | (52,592 | ) | | $ | (28,115 | ) | | $ | (5,188 | ) | | $ | (31,593 | ) | $ | (117,488 | ) |
| Other expense (income): | | | | | | | | | | | | | | | | | |
| Interest income | — |
| | — |
| | (4 | ) | | (352 | ) | (356 | ) | | — |
| | — |
| | — |
| | (1,052 | ) | (1,052 | ) |
| Foreign exchange loss (gain) | 4 |
| | 10 |
| | 27 |
| | (29 | ) | 12 |
| | — |
| | — |
| | — |
| | (43 | ) | (43 | ) |
| Financial expense, net | — |
| | — |
| | — |
| | 19,524 |
| 19,524 |
| | — |
| | — |
| | — |
| | 172 |
| 172 |
|
| Total other expense (income) | 4 |
| | 10 |
| | 23 |
| | 19,143 |
| 19,180 |
| | — |
| | — |
| | — |
| | (923 | ) | (923 | ) |
| Net loss | $ | (408,551 | ) | | $ | (27,155 | ) | | $ | (22,044 | ) | | $ | (53,039 | ) | $ | (510,789 | ) | | $ | (52,592 | ) | | $ | (28,115 | ) | | $ | (5,188 | ) |
| $ | (30,670 | ) | $ | (116,565 | ) |
Vessel revenue increased significantly to $62.5 million in 2015 from $49.0 million in 2014 despite a decrease in rates due to the increase in revenue days associated with the growth of our fleet.
TCE revenue (see Non-GAAP Financial Measures)was $61.7 million for 2015, associated with 20 time chartered-in vessels and 30 owned vessels, compared to TCE revenue of $45.3 million during 2014, associated with 24 time chartered-in vessels and two owned vessels. TCE revenue per day was $7,173 and $7,931 for the years ended December 31, 2015 and 2014, respectively. While our newly built fuel-efficient fleet consistently outperformed the market as compared to the BDI, the decrease in TCE revenue per day was due to the weakness in the drybulk market across all vessel classes, as reflected by the BDI which hit then record lows in 2015. The increase in TCE revenue during 2015 compared to the prior year was attributable to the increase in the number of revenue days associated with the increase in vessels.
Voyage expenses for 2015 were $0.8 million, compared to $3.7 million for 2014. The costs incurred in 2015 are primarily comprised of brokerage commissions on vessels we time charter-out and miscellaneous costs that we are unable to recoup under time charter and pool arrangements. Voyage expenses in 2014 relate primarily to voyage charters for certain vessels we time chartered-in prior to their joining the Scorpio Group Pools.
Vessel operating costs for 2015 were $29.4 million related to 30 owned vessels. Vessel operating costs for the year ended 2014 were $1.6 million related to two owned vessels. Vessel operating costs include expenses incurred upon the delivery of a vessel (takeover costs), which include the crew’s travel costs to the shipyard and training.
Charterhire expense was $51.4 million and $73.2 million for 2015 and 2014, respectively. This decrease was due to fewer vessels chartered-in during 2015 compared to the prior year.
Depreciation for 2015 was $14.3 million related to 30 owned vessels. Depreciation for 2014 was $0.7 million related to two owned vessels.
General and administrative expense was $35.4 million and $31.8 million for 2015 and 2014, respectively. Such amounts were primarily not attributable to our operating segments and were therefore considered corporate. These included $24.6 million and $23.9 million of noncash restricted stock amortization in 2015 and 2014, respectively, with the balance primarily related to payroll, directors’ fees, professional fees and insurance in both periods.
During 2015, we recorded a loss of $422.9 million associated with writing down 24 vessels and construction contracts that we sold or classified as held for sale during 2015, as well as incremental write downs of certain construction contracts for vessels that were classified as held for sale at December 31, 2014. During 2014 we recorded a loss of $55.5 million associated with writing down seven construction contracts for vessels that were classified as held for sale at December 31, 2014.
In addition, during 2015, we recorded financial expense, net of $19.5 million, which consisted primarily of a $16.1 million loss associated with writing off a portion of deferred financing costs accumulated on five credit facilities for which the commitments were reduced pursuant to the removal from the facility of certain vessels that have been classified as held for sale. In addition, during 2015, we recorded interest expense of $1.0 million. During 2014, we incurred no write offs and all of our interest expense was capitalized.
Please see Note 14, Segments, to the consolidated financial statements included herein for more information on our segment results.
Critical Accounting Estimates
Our consolidated financial statements and accompanying notes are prepared in accordance with U.S. GAAP. The preparationIn many instances, the application of those financial statementssuch principles requires usmanagement to make estimates or to apply subjective principles to particular facts and judgments that affectcircumstances. A change in the reported amountestimates or a variance in the application, or interpretation of assets and liabilities, revenues and expenses and related disclosure of contingent assets and liabilities at the dateU.S. GAAP could yield a materially different accounting result. A summary of our critical accounting estimates where we believe that the estimations, judgments or interpretations that we made, if different, would have yielded the most significant differences in our consolidated financial statements, can be found in the notes to the consolidated financial statements. Actual results may differ from these estimates under different assumptions or conditions.CriticalIn addition, for a summary of all of our significant accounting policies are those that reflectsee Note 1,
General information and significant judgments or uncertainties, and potentially result in materially different results under different assumptions and conditions. We have described below what we believe are our most critical accounting policies.Additional information—Development stage company
The preparation of financial statements in conformity with U.S. GAAP requires the disclosure of certain information applicable to development stage companies:
| ● | The balance sheet includes cumulative net losses under the caption “Deficit accumulated during the development stage” in shareholders’ equity; |
| ● | The income statement shows amounts of revenue and expenses for each period and, in addition, cumulative amounts from our inception; |
| ● | The statement of changes in shareholders’ equity shows the changes in components of shareholders’ equity for each period and, in addition, cumulative amounts from our inception; and |
| ● | The statement of cash flows shows the sources and uses of financial resources for each period for which an income statement is presented and, in addition, cumulative amounts from our inception. |
We were incorporated in March 2013 and, as such, there was only one period reported in our financial statements, included elsewhere herein.
The following are accounting policies we will adopt going forward.
Revenue recognition
Vessel revenue is measured at the fair value of the consideration received or receivable and represents amounts receivable for services provided, in the normal course of business, net of discounts, and other sales-related or value added taxes.
Vessel revenue is comprised of time charter revenue, voyage revenue and pool revenue.
| ● | Time charter revenue is recognized as services are performed based on the daily rates specified in the time charter contract. |
| ● | Voyage charter agreements are charter hires, where a contract is made in the spot market for the use of a vessel for a specific voyage for a specified charter rate. Revenue from voyage charter agreements is recognized on a pro rata basis based on the relative transit time in each period. The period over which voyage revenues are recognized commences at the time the vessel departs from its last discharge port and ends at the time the discharge of cargo at the next discharge port is completed. We do not begin recognizing revenue until a charter has been agreed to by the customer and us, even if the vessel has discharged its cargo and is sailing to the anticipated load port on its next voyage. We do not recognize revenue when a vessel is off hire. Estimated losses on voyages are provided for in full at the time such losses become evident. In the application of this policy, we do not begin recognizing revenue until (i) the amount of revenue can be measured reliably, (ii) it is probable that the economic benefits associated with the transaction will flow to the entity, (iii) the transactions’ stage of completion at the balance sheet date can be measured reliably and (iv) the costs incurred and the costs to complete the transaction can be measured reliably. |
| ● | Pool revenue for each vessel is determined in accordance with the profit sharing terms specified within each pool agreement. In particular, the pool manager aggregates the revenues and expenses of all of the pool participants and distributes the net earnings to participants based on: |
| o | the pool points (vessel attributes such as cargo carrying capacity, fuel consumption, and construction characteristics are taken into consideration); and |
| o | the number of days the vessel participated in the pool in the period. |
We recognize pool revenue on a monthly basis, when the vessel has participated in a pool during the period and the amount of pool revenue for the month can be estimated reliably. We receive estimated vessel earnings based on the known number of days the vessel has participated in the pool, the contract terms, and the estimated monthly pool revenue. On a quarterly basis, we receive a report from the pool which identifies the number of days the vessel participated in the pool, the total pool points for the period, the total pool revenue for the period, and the calculated share of pool revenue for the vessel. We review the quarterly report for consistency with each vessel’s pool agreement and vessel management records. The estimated pool revenue is reconciled quarterly, coinciding with our external reporting periods,notes to the actual pool revenue earned, per the pool report. Consequently, in ourconsolidated financial statements, reported revenues represent actual pooled revenues. While differences do arise in the performance of these quarterly reconciliations, such differences are not material to total reported revenues.
statements.
We record the value of our vessels at their cost (which includes acquisition costs directly attributable to the vessel including capitalized interest and expenditures made to prepare the vessel for its initial voyage) less accumulated depreciation. We depreciate our vessels on a straight-line basis to their residual value over their estimated useful lives estimated to beof 25 years from date the vessel is ready for its first voyage. The estimated useful life of initial delivery from the shipyard. Depreciation25 years is based on cost less the estimatedmanagement’s best estimate and is also consistent with industry practice for similar vessels. The residual value which is estimated as the lightweight tonnage of each vessel multiplied by an estimated scrap value per ton. The scrap value per ton is estimated taking into consideration the historical four yearyears average scrap market rates at the balance sheet date with changes accounted for in the period of change and in future periods. We believe that a 25-year depreciable life for our vessels is consistent with that of other ship owners and with its economic useful life. date.
An increase in the useful life of the vessel or in its residual value would have the effect of decreasing the annual depreciation charge and extending it into later periods. A decrease in the useful life of the vessel or in its residual value would have the effect of increasing the annual depreciation charge. However, when
When regulations place limitations over the ability of a vessel to trade on a worldwide basis, or when the cost of complying with such regulations is not expected to be recovered, we will adjust the vessel’s useful life to end at the date such regulations preclude such vessel’s further commercial use.
The carrying value of ourthe Company’s vessels does not represent the fair market value of such vessels or the amount weit could obtain if weit were to sell any of ourits vessels, which could be more or less. Under U.S. GAAP, the Company would not record
a loss if the fair market value of a vessel (excluding its charter) is below our carrying value unless and until it determines to sell that vessel or the vessel is impaired as discussed below under “Impairment of long-lived assets held for use.”
Pursuant to our bank credit facilities, prior to drawdown of loans under the credit facilities we submit to the lenders valuations of the vessels collateralizing the relevant facility. Thereafter, we will regularly submit to the lenders valuations of our vessels on an individual charter free basis in order to evidence our compliance with the collateral maintenance covenants under our bank credit facilities. Such a valuation is not necessarily the same as the amount any vessel may bring upon sale, which may be more or less, and should not be relied upon as such. We have received valuations on each vessel in our fleet as of December 31, 2016. If we were to apply those valuations to the carrying value of our vessels as of December 31, 2016, that carrying value would exceed their fair values by an aggregate of $410.4 million, ranging from $5.3 million per vessel to $11.8 million per vessel. The fair values of our vessels can fluctuate depending on the shipyards and the dates of delivery. These assumptions have not been taken into account in the amounts disclosed above.
Impairment of long-lived assets held for use
We follow Accounting Standards Codification or ASC Subtopic 360-10, Property, Plant and Equipment or ASC 360-10, which requires impairment losses to be recorded on long-lived assets used in operations when indicators of impairment are present and the undiscounted cash flows estimated to be generated by those assets are less than their carrying amounts. If indicators of impairment are present, we perform an analysis of the anticipated undiscounted future net cash flows of the related long-lived assets.
The current economic and market conditions, including the significant disruptions in the global credit markets, are having broad effects on participants in a wide variety of industries. Since mid-August 2008, the charter rates in the drybulk charter market have declined to historical lows, and drybulk vessel values have also declined as a result of both a slowdown in the availability of global credit and the significant deterioration in charter rates.
When indicators of impairment are present and our estimate of undiscounted future cash flows for any vessel is lower than the vessel’s carrying value, the carrying value is written down, by recording a charge to operations, to the vessel’s fair market value if the fair market value is lower than the vessel’s carrying value.
Our vessels are assessed annually for impairment in the fourth quarter and whenever events or changes in circumstances indicate the carrying amount of our vessels and vessels under construction may not be recoverable. In developing its estimates of undiscounted cash flows, we make assumptions and estimates about vessels’ future performance, with the most significant assumptions relating to (i) charter rates on expiry of existing charters, which are based on the current fixing applicable to five-year time charter rates and thereafter, a reversion to the ten-year historical average for each category of vessel, (ii) off-hire days, which are based on actual off-hire statistics for our fleet, (iii) operating costs, based on current levels escalated over time based on long term trends, (iv) dry docking frequency, duration and cost, (v) estimated useful life which is assessed as a total of 25 years and (vi) estimated scrap values. Specifically, we utilize the rates currently in effect for the duration of their current time charters, without assuming any profit sharing. For periods of time where our vessels are not fixed on time charters, we utilize an estimated daily TCE for our vessels’ unfixed days using the five year time charter average in effect as of December 31, 2016 for the next five years and the ten year historical average for the remainder of the vessels��� useful lives, which is common practice for the industry. Actual equivalent drybulk shipping rates are currently significantly lower than the estimated rate. We further assume a utilization rate of 95% for our vessels and do not apply any inflation to the estimated rates used. We apply a 1% inflation rate to vessel operating costs.
During our fourth quarter 2016 assessment, we determined that the future income streams expected to be generated by our vessels, including vessels under construction which are carried at balances that approximate their fair values, over their remaining operating lives on an undiscounted basis would be sufficient to recover their carrying values and, accordingly, it confirmed that our vessels were not impaired under U.S. GAAP. Our estimated future undiscounted cash flows exceeded each of our vessels’ carrying values, as well as the expected carrying values of vessels under construction upon their delivery to us by the shipyards, by a considerable margin (approximately 150% - 192% of carrying value). As of December 31, 2016, we owned 42 vessels with an average remaining useful life of 23.9 years.
Our vessels remain fully utilized and have a long average remaining useful life in which to generate sufficient cash flows on an undiscounted basis to recover their carrying values as of December 31, 2016.
During our fourth quarter 2015 assessment, we determined that the future income streams expected to be generated by our vessels, including vessels under construction and excluding assets held for sale which are carried at balances that approximate their fair values, over their remaining operating lives on an undiscounted basis would be sufficient to recover their carrying values and, accordingly, it confirmed that our vessels were not impaired under U.S. GAAP. Our estimated future undiscounted cash
flows exceeded each of our vessels’ carrying values, as well as the expected carrying values of vessels under construction upon their delivery to us by the shipyards, by a considerable margin (approximately 68% - 118% of carrying value). As of December 31, 2015, we owned 25 vessels, excluding those classified as held for sale, which had an average remaining useful life of 24.6 years.
During our fourth quarter 2014 assessment, we determined that the future income streams expected to be generated by our vessels, including vessels under construction and excluding assets held for sale which are carried at balances that approximate their fair values, over their remaining operating lives on an undiscounted basis would be sufficient to recover their carrying values and, accordingly, it confirmed that our vessels were not impaired under U.S. GAAP. Our estimated future undiscounted cash flows exceeded each of our vessels’ carrying values, as well as the expected carrying values of vessels under construction upon their delivery to us by the shipyards, by a considerable margin (approximately 116% - 289% of carrying value). Our vessels remained fully utilized and had a relatively long average remaining useful life in which to recover sufficient cash flows on an undiscounted basis to recover their carrying values as of December 31, 2014. As of December 31, 2014, all but two of our vessels under construction had remaining lives of 25 years, and the two Kamsarmax vessels we owned as of December 31, 2014 had an average remaining useful life of 24.7 years.
In our impairment testing, we also examined the sensitivity of the future income streams expected to be earned by our vessels by reviewing other scenarios relative to the initial assumptions we used to see if the resulting impact would have resulted in a different conclusion. Accordingly, we performed sensitivity analyses based on more conservative charter rates and expected useful lives for our vessels. In the first sensitivity analysis, we lowered charter rate assumptions to 70% of the long-term averages of Kamsarmax and Ultramax vessels, respectively (holding all other critical assumptions constant), while in our second sensitivity analysis; we decreased our vessels’ estimated useful lives by approximately 50% for each vessel class (holding all other critical assumptions constant). We then evaluated the outcomes of the sensitivity analysis performed to assess their impact on our conclusions. In both analyses, we found that there would be no impairment of any of our vessels.
Although we believe that the assumptions used to evaluate potential impairment are reasonable and appropriate, such assumptions are highly subjective. There can be no assurance as to how long charter rates and vessel values will remain at their currently low levels or whether they will improve by any significant degree. Charter rates may remain at depressed levels for some time, which could adversely affect our revenue and profitability, and future assessments of vessel impairment.
Management will continue to monitor developments in charter rates in the markets in which it participates with respect to the expectation of future rates over an extended period of time that are utilized in the analyses.
| |
| B. | Liquidity and Capital Resources |
We were formed forare an international shipping company that owns and operates the purpose acquiring and operating latest generation of newbuilding drybulk carriers with fuel-efficient specifications and carrying capacities of greater than 30,000 dwt.
During the period following our inception, we contracted for the construction of up to 80 drybulk vessels with established shipyards in Japan, China, South Korea and Romania, which we agreed to acquire for an aggregate purchase price of $3,102.8 million, including 29 Ultramax vessels, 23 Kamsarmax vessels and 28 Capesize vessels, which we refer to generally as our “Newbuilding Program.” Due to the decline in the drybulk market, we have since reduced the expected fleet size through a series of sales or cancellation of newbuilding construction contracts. At December 31, 2016, we owned 42 drybulk vessels (16 Kamsarmax vessels and 26 Ultramax vessels) and had contracts for the construction of another six vessels (four Kamsarmax vessels and two Ultramax vessels), for an aggregate purchase price of $161.9 million of which $18.6 million remained to be paid. An installment payment of $1.4 million was made in the first quarter of 2017 and an installment payment of $17.2 million is scheduled for the second quarter of 2017, the latter of which will occur upon the delivery of the vessel. Of the six vessels under construction as of December 31, 2016, five vessels have since been delivered to us and the remaining vessel is expected to be delivered to us during the second quarter of 2017.
We believe that the reduction in the size of our expected fleet through the sale or cancellation of 32 vessels and contracts for the construction of vessels preserved liquidity in that such sales generated cash proceeds and effectively relieved us of the requirement to make the remaining unpaid installments under the contracts. A tabular summary of our newbuilding vessel construction contracts through December 31, 2016 is as follows:
|
| | | | | | | | | | | | | | | | | |
| | Capesize | | Kamsarmax | | Ultramax | | LR2 | | LR1 | | Total |
| Total vessels contracted for | 28 |
| | 23 |
| | 29 |
| | — |
| | — |
| | 80 |
|
| Delivered from shipyards in 2014 | — |
| | (2 | ) | | — |
| | — |
| | — |
| | (2 | ) |
| Committed to convert into tankers in 2014 | (6 | ) | | — |
| | — |
| | 6 |
| | — |
| | — |
|
| Classified as assets held for sale in 2014 | — |
| | (1 | ) | | — |
| | (6 | ) | | — |
| | (7 | ) |
| Vessels under construction as of December 31, 2014 | 22 |
| | 20 |
| | 29 |
| | — |
| | — |
| | 71 |
|
| Delivered from shipyards in 2015 | (5 | ) | | (8 | ) | | (15 | ) | | — |
| | — |
| | (28 | ) |
| Committed to convert into tankers in 2015 | (3 | ) | | — |
| | — |
| | — |
| | 3 |
| | — |
|
| Classified as assets held for sale in 2015 | (14 | ) | | (1 | ) | | (1 | ) | | — |
| | (3 | ) | | (19 | ) |
| Vessels under construction as of December 31, 2015 | — |
| | 11 |
| | 13 |
| | — |
| | — |
| | 24 |
|
| Delivered from shipyards in 2016 | — |
| | (6 | ) | | (11 | ) | | — |
| | — |
| | (17 | ) |
| Contracts canceled | — |
| | (1 | ) | | — |
| | — |
| | — |
| | (1 | ) |
| Vessels under construction as of December 31, 2016 | — |
| | 4 |
| | 2 |
| | — |
| | — |
| | 6 |
|
As of December 31, 2016 there were six drybulk vessels in our Newbuilding Program (four Kamsarmax vessels and two Ultramax vessels), which have an aggregate purchase price of $161.9 million. Of this, $17.2 million remains to be paid on one of the vessels under construction as of the date of this annual report, we charter-in 17 drybulk vessels, and have contracts for the construction of 79 newbuilding drybulk vessels. In addition, as part of our growth strategy we may also acquire modern secondhand vessels, or charter in additional vessels. Our business is capital intensive and we intend to pay for these vessels with a combination of proceeds from the issuance of bonds, cash generated from operations, equity capital, and borrowings from commercial banks under one or more secured credit facilities. We anticipate that such credit agreements will bear interest based on LIBOR. We expect to rely on operating cash flows as well as equity offerings and long-term borrowings under secured credit facilities to implement our growth plan and dividend policy. filing.
We believe that our current cash balance as well as operating cash flows,
and available borrowings under
the securedour credit facilities,
that we expect to enter into, including
the Proposed $67.5 Million Senior Secured Credit Facilityour credit facilities described below, and
the Proposed $330.0 Million Senior Secured Credit Facility,potential issuances of debt and equity securities will be sufficient to meet our
short-term and long-term liquidity needs for the next 12
months.months from the date of this annual report. We have entered into shipbuilding contracts with shipyards in Japan, China, South KoreaDuring 2016, we made total yard payments and Romania for thepaid other construction of 79 newbuilding vessels for an aggregate purchase price of $3,071.5 million. These vessels are expected to be delivered to us between the second quarter of 2014 and the third quarter of 2016. These construction projects are subject to risks of delay or cost overruns inherent in any large construction project from numerous factors, including shortages of equipment, materials or skilled labor, unscheduled delayscosts in the deliveryamount of ordered materials and equipment or shipyard construction, failure of equipment to meet quality and/or performance standards, financial or operating difficulties experienced by equipment vendors or the shipyard, unanticipated actual or purported change orders, inability to obtain required permits or approvals, unanticipated cost increases between order and delivery, design or engineering changes and work stoppages and other labor disputes, adverse weather conditions or any other events of force majeure. Significant cost overruns or delays could adversely affect our financial position, results of operations and cash flows. Additionally, failure to complete a project on time may result in the delay of revenue from that vessel.
$408.3 million. As of December 31, 2013,2016, we have made total yard payments in the amount of $371.6 million and we havehad remaining yard installments in the amount of $2,699.9$18.6 million before we take delivery of the vessels. We had, asfinal vessel in our Newbuilding Program, of December 31, 2013, a cash balance of $733.9which $17.2 million to fund future newbuilding commitments, however, a significant portion of our remaining commitments are currently unfunded. If we are not able to borrow additional funds, raise other capital or utilize available cash on hand, we may not be able to acquire these newbuilding vessels, which could have a material adverse effect on our business, financial condition, results of operations and cash flows. If for any reason we fail to make a payment when due, which may result in a default under our newbuilding contracts, or otherwise fail to take delivery of our newbuild vessels, we would be prevented from realizing potential revenues from these vessels, we could also lose all or a portion of our yard payments that were paid by us and we could be liable for penalties and damages under such contracts.
In addition, in the event the shipyards do not perform under their contracts and we are unable to enforce certain refund guarantees with third party banks for any reason, we may lose all or part of our investment, which would have a material adverse effect on our results of operations, financial condition and cash flows.
remains unpaid.
Equity
Private PlacementsUpon our formation in March 2013,Issuances
On June 20, 2016, we issued
1,500 common shares to SSH. Between July 1, 2013 and July 16, 2013, we issued and sold 31,250,00023.0 million common shares, par value $0.01 per share,
for net proceedsat $3.05 per share in an underwritten public offering. SSH purchased an aggregate of
$242.8 million; on September 24, 2013, we issued and sold an additional 33,400,000 common shares for net proceeds of $290.5 million; and on October 31, 2013, we issued and sold an additional 32,590,411 common shares for net proceeds of $291.05.3 million
in Norwegian private placement transactions exempt from registration under the Securities Act.Initial Public Offering
In December 2013, we completed our underwritten initial public offering of 31,300,000 common shares at $9.75the public offering price. We received approximately $67.5 million of net proceeds from the issuance.
On June 1, 2016, our shareholders approved an amendment to our Amended and Restated Articles of Incorporation to increase our total number of authorized common shares to 112.5 million shares at the annual general meeting of shareholders.
On March 22, 2016, we issued 21.0 million common shares, par value $0.01 per share, at $3.00 per share in an underwritten public offering. SSH and certain of our directors purchased an aggregate of approximately 5.0 million common shares at the public offering price. We received approximately $60.6 million of net proceeds from the issuance.
On December 31, 2015, our board of directors effected a one-for-twelve reverse stock split of our common shares, par value $0.01 per share, and in January 2014, the underwritersa reduction in the initial public offeringtotal number of authorized common shares to approximately 56.3 million shares. Our shareholders approved the reverse stock split and change in authorized common shares at a special meeting of shareholders held on December 23, 2015. The reverse stock split reduced the number of outstanding common shares from approximately 344.2 million shares to approximately 28.7 million shares.
On June 23, 2015, underwriters exercised their option to purchase an additional 4,695,000approximately 1.7 million additional common shares.shares in connection with the offering. The sale of these common shares resulted in net proceeds to us of approximately $28.4 million, after deducting underwriters’ discounts and commissions.
On June 16, 2015, we issued approximately 11.1 million common shares, par value $0.01 per share at $18.00 per share in an underwritten public offering. SSH and certain of our executive officers purchased an aggregate of 0.8 million common shares at the public offering price. We received net$190.2 million of proceeds from the issuance.
On November 20, 2014, we issued and sold an aggregate of 3.3 million common shares, par value $0.01 per share, to certain institutional investors, certain of our executive officers and SSH, in a private offering exempt from registration under the Securities Act, pursuant to a Securities Purchase Agreement, for gross proceeds of $326$150.0 million. In connection with this transaction, we have also entered into a Registration Rights Agreement with the purchasers in the offering, pursuant to which we have filed a registration statement under the Securities Act covering the resale of common shares held by the investors.
Cash Flow
Operating Activities
The table below summarizes the effect of the major components of operating cash flow.
|
| | | | | | | | | | | | |
| | | Year Ended December 31, |
| (in thousands) | | 2016 | | 2015 | | 2014 |
| Net loss | | $ | (124,835 | ) | | $ | (510,789 | ) | | (116,565 | ) |
| Non-cash items included in net loss | | 73,644 |
| | 479,872 |
| | 80,192 |
|
| Related party balances | | 5,656 |
| | (4,878 | ) | | (15,170 | ) |
| Effect of changes in other working capital and operating assets and liabilities | | (6,661 | ) | | 653 |
| | 1,203 |
|
| Net cash used in operating activities | | $ | (52,196 | ) | | $ | (35,142 | ) | | $ | (50,340 | ) |
The cash flow used in operating activities for the year ended December 31, 2016 was driven by our recorded net loss. Operating cash flow decreased from 2015 to 2016 due to an increase in the amount of working capital injected into the pools as vessels were delivered to such pools.
Investing Activities
Net cash used in investing activities reflects the investment we made in our fleet, offset by any proceeds received from the sale of vessels.
Financing Activities
Net cash provided by financing activities of $189.0 million reflects our issuance of stock and proceeds from long-term debt borrowings, offset by repayments of long-term debt.
During 2016, we issued 44.0 million common shares in aggregate in two public offerings for combined proceeds of $128.1 million.
In December of 2016, our Board of Directors authorized the repurchase of up to $20.0 million of the Company's outstanding 7.5% Senior Notes due in 2019, or Senior Notes in open market or privately negotiated transactions. The specific timing and amounts of the repurchases, which
was used to fund newbuilding vessel capital expenditures.Proposed will be funded by available cash, will be in the sole discretion of management and vary based on market conditions and other factors. This authorization has no expiration date. As of the date of this annual report, the entire $20.0 million remains available.
Credit Facilities
Proposed $67.5 and Unsecured Notes
$39.6 Million Senior Secured Credit Facility
In February
On June 27, 2014, we
signedentered into a
commitment letter for a $67.5$39.6 million
senior secured credit facility with
a leading European financial instition. The proceeds of this facility are expectedNIBC Bank N.V. to
fundfinance a portion of the
purchase pricemarket value of two of the
four of the vessels
then in our Newbuilding Program
that willwhich secure this facility. This facility
is expectedbears interest at LIBOR plus a margin of 2.925%. The term of this facility was originally five years, expiring in June 2019, which was subsequently extended to
have a seven year term from the date of delivery of each such vessel securing the loan, with customary financial and restrictive covenants.September 2020 should we meet certain conditions. This facility is
expected to bear interest at 2.95% over LIBOR,secured by, among other things, a first priority mortgage on two of the Kamsarmax vessels then in our Newbuilding Program and
quarterly principal repaymentsguaranteed by each of the collateral vessel owning subsidiaries. As of December 31, 2016, the outstanding balance on
each tranche are expected to bethis facility was approximately
$0.3$20.1 million.
The closing of this loan facility is subject to usual and customary conditions precedent, including the negotiation and execution of final documentation.Proposed $330.0
$330.0 Million Senior Secured Credit Facility
On
December 5, 2013,July 29, 2014, we entered into a
commitment letter$330.0 million senior secured credit facility with Credit Agricole Corporate and Investment Bank and Deutsche Bank AG London
for up to
$330.0 million. The proceeds of the Proposed $330.0 Million Senior Secured Credit Facility are expected to fundfinance a portion of the purchase price of
22 of the vessels then in our Newbuilding Program, which was subsequently reduced by $15.0 million due to our sale of one of the vessels that
will securewas to collateralize this facility.
The Proposed $330.0 Million Senior Secured Credit Facility This facility bears interest at LIBOR plus a margin of 2.925% and has a term of seven years. This facility is expected to be secured by, among other things, a first preferred cross-collateralized mortgage on each of 2221 of our newbuilding vessels consisting(consisting of 1615 Ultramax drybulk carriers and six KarsarmaxKamsarmax drybulk carriers,carriers) and guaranteed by each of the collateral vessel owning subsidiaries. As of December 31, 2016, we drew down $255.8 million relating to 14 Ultramax vessels (including one vessel under construction) and four Kamsarmax vessels. As of December 31, 2016, the outstanding balance on this facility was approximately $225.8 million.
Of the remaining four vessels (including one vessel under construction), three were delivered in January 2017 and we drew down amounts not exceeding the lesser of 60% of the fair market value of such vessel or a stated drawdown amount. The facilitylast vessel is expectedscheduled to bear interestbe delivered in the second quarter of 2017 at LIBOR plus a margin. Wewhich time we expect that we will be able to draw under this facility upon the delivery of each collateral vessel in an amount not to exceed the lesser of 60% of the fair market value of such vessel or a stated draw downdrawdown amount.
During 2016, we also reduced the available loan amount untilby approximately $16.8 million, for which $0.6 million of deferred financing costs were written off.
$67.5 Million Senior Secured Credit Facility
On July 30, 2014, we entered into a $67.5 million credit facility with a leading European financial institution. The proceeds of this facility have been used to fund a portion of the purchase price of four of the vessels in our Newbuilding Program that secure this facility. This facility has a seven year term from the date of delivery of each such vessel securing the loan, with customary financial and restrictive covenants. This facility bears interest at LIBOR plus a margin of 2.95%. The $67.5 Million Senior Secured Credit Facility is secured by, among other things, a first priority mortgage on four of the vessels then in our Newbuilding Program (two Ultramax and two Kamsarmax vessels), and a parent company guarantee. As of December 31,
2016.The2016, we borrowed $53.8 million associated with drawdowns on two Kamsarmax vessels and two Ultramax vessels that were delivered. We also reduced the available loan amount by approximately $4.4 million. As of December 31, 2016, the outstanding balance on this facility was approximately $40.5 million.
$409.0 Million Senior Secured Credit Facility
On December 30, 2014, we entered into a $409.0 million senior secured credit facility with Nordea Bank Finland PLC, New York Branch, and Skandinaviska Enskilda Banken AB (publ) to partially finance a portion of our acquisition of 20 of the vessels in our Newbuilding Program (six Ultramax, nine Kamsarmax, and five Capesize vessels). This credit facility was subsequently reduced by $136.0 million due to the sale of five Capesize vessels and the addition of one Ultramax vessel to the security package under the facility, and reduced by an additional $14.6 million due to the cancellation of a shipbuilding contract for a Kamsarmax bulk carrier that was serving as partial security under the facility. As amended, this credit facility is expectedused to be repaid in full at maturity on the seventh anniversaryfinance a portion of the closingpurchase price of 15 vessels (seven Ultramax and eight Kamsarmax vessels). As of December 31, 2016, we drew down $207.6 million on 14 vessels (including one vessel under construction). We also reduced the available loan amount by approximately $22.5 million during 2016. As of December 31, 2016, the outstanding balance on this facility was approximately $167.8 million. The remaining drawdown took place upon delivery of the final Kamsarmax vessel in January 2017. This facility bears interest at LIBOR plus a margin of 3.00% and has a term of six years. This facility is secured by, among other things, a first preferred mortgage on each of the 15 vessels.
$42.0 Million Senior Secured Credit Facility
On January 30, 2015, we entered into a senior secured credit facility for up to $42.0 million with a leading European financial institution to finance a portion of the purchase price of two Kamsarmax which were delivered to us, and subsequently upsized by $10.8 million to finance a portion of the purchase price of one Ultramax vessel. Each tranche for the Kamsarmax vessels has a final maturity of six years from the drawdown date of the facility. The available amount to be drawn underrespective vessel, and the tranche for the Ultramax vessel matures on September 21, 2021. This facility bears interest at LIBOR plus a margin of 2.97%. This facility is expected to be reducedsecured by, among other things, a first preferred mortgage on a consecutive quarter basisthe three vessels and guaranteed by an amount equal to 1/48 of the loan amount applicable to each of the collateral vessels withvessel owning subsidiaries. As of December 31, 2016, the outstanding balance on this facility was approximately $38.5 million.
$12.5 Million Senior Secured Credit Facility
On December 22, 2015, we entered into a senior secured credit facility for up to $12.5 million, which was used to finance a portion of the purchase price of one Ultramax vessel which was delivered to us. The facility has a maturity date of December 22, 2020. This facility bears interest at LIBOR plus a margin of 3.00%. This facility is secured by, among other things, a first scheduled reduction to occurpreferred mortgage on the last dayUltramax newbuilding vessel and guaranteed by the collateral vessel owning subsidiary. As of December 31, 2016, the outstanding balance on this facility was approximately $10.4 million.
$27.3 Million Senior Secured Credit Facility
On December 22, 2015, we entered into a senior secured credit facility for up to $27.3 million, which was used to finance a portion of the quarter followingpurchase price of two Ultramax vessels in our Newbuilding Program. Each tranche has a maturity of five years from the first draw down. The closingdrawdown date. This facility bears interest at LIBOR plus a margin of this loan2.95%. This facility is subject to usualsecured by, among other things, a first preferred mortgage on the two Ultramax newbuilding vessels and customary conditions precedent, includingguaranteed by each of the negotiationcollateral vessel owning subsidiaries. As of December 31, 2016, the outstanding balance on this facility was approximately $19.4 million.
As of December 31, 2016, we had $522.4 million of outstanding borrowings under the credit agreements described above as shown in the following table (dollars in thousands):
|
| | | | | | | | | | | | |
| | | December 31, 2016 | | February 28, 2017 |
| | | Amount outstanding | | Amount outstanding | | Maximum amount available |
| $39.6 Million Senior Secured Credit Facility | | $ | 20,144 |
| | $ | 20,144 |
| | $ | — |
|
| $409 Million Senior Secured Credit Facility | | 167,816 |
| | 179,473 |
| | — |
|
| $330 Million Senior Secured Credit Facility | | 225,759 |
| | 250,959 |
| | 13,200 |
|
| $42 Million Senior Secured Credit Facility | | 38,512 |
| | 38,512 |
| | — |
|
| $67.5 Million Senior Secured Credit Facility | | 40,461 |
| | 40,461 |
| | — |
|
| $12.5 Million Senior Secured Credit Facility | | 10,379 |
| | 10,379 |
| | — |
|
| $27.3 Million Senior Secured Credit Facility | | 19,375 |
| | 19,375 |
| | — |
|
| Total | | $ | 522,446 |
| | $ | 559,303 |
| | $ | 13,200 |
|
Our secured credit facilities are secured by, among other things: a first priority mortgage over the relevant collateralized vessels; a first priority assignment of earnings, and
executioninsurances from the mortgaged vessels for the specific facility; a pledge of
final documentation.Expected the earnings account of the mortgaged vessels for the specific facility; and a pledge of the equity interests of each vessel owning subsidiary under the specific facility.
Loan Covenants
Our proposed
Certain of our credit facilities discussed above, are expected to have, among other things, the following financial covenants, as amended or waived, the most stringent of which require us to maintain:
The ratio of net debt to total capitalization no greater than 0.60 to 1.00.
Consolidated tangible net worth (adjusted for a minimum amount of $100.0 million in historical non-operating costs and to exclude certain future non-operating items) including impairments, no less than $500.0 million plus (i) 25% of cumulative positive net income (on a consolidated basis) for each fiscal quarter commencing on or after December 31, 2013 and (ii) 50% of the value of any new equity issues occurring on or after December 31, 2013.
The ratio of EBITDA to net interest expense calculated on a year-to-date basis of greater than 1.00 to 1.00 for the quarters ending March 31, 2019 and June 30, 2019, 2.50 to 1.00 for the quarter ending September 30, 2019, calculated on a year-to-date basis and 2.50 to 1.00 for each quarter thereafter, calculated on a trailing four quarter basis.
Minimum liquidity of not less than the greater of $25.0 million or $0.7 million per owned vessel.
Maintain a minimum fair value of the collateral for each credit facility, such that the aggregate fair value of the vessels collateralizing the credit facility is 140%, except in the case of our $67.5 Million Credit Facility, for which it is 115% of
the aggregate principal amount outstanding under such credit facility, or, if we do not meet these thresholds to prepay a portion of the loan or provide additional security to eliminate the shortfall.
Our credit facilities discussed above have, among other things, the following restrictive covenants which would restrict our ability to:
incur additional indebtedness;
sell the collateral vessel, if applicable;
make additional investments or acquisitions;
pay dividends; and
effect a change of control of us.
A violation of any of the financial covenants contained in our credit facilities described above may constitute an event of default under all of our credit facilities, which, unless cured within the grace period set forth under the credit facility, if applicable, or waived or modified by our lenders, provides our lenders with the right to, among other things, require us to:to post additional collateral, enhance our equity and liquidity, increase our interest payments, pay down our indebtedness to a level where we are in compliance with our loan covenants, sell vessels in our fleet, reclassify our indebtedness as current liabilities and accelerate our indebtedness and foreclose their liens on our vessels and the other assets securing the credit facilities, which would impair our ability to continue to conduct our business.
Furthermore, our credit facilities contain a cross-default provision that may be triggered by a default under one of our other credit facilities. A cross-default provision means that a default on one loan would result in a default on certain of our other loans. Because of the presence of cross-default provisions in certain of our credit facilities, the refusal of any one lender under our credit facilities to grant or extend a waiver could result in certain of our indebtedness being accelerated, even if our other lenders under our credit facilities have waived covenant defaults under the respective credit facilities. If our secured indebtedness is accelerated in full or in part, it would be very difficult in the current financing environment for us to refinance our debt or obtain additional financing and we could lose our vessels and other assets securing our credit facilities if our lenders foreclose their liens, which would adversely affect our ability to conduct our business.
Moreover, in connection with any waivers of or amendments to our credit facilities that we have obtained, or may obtain in the future, our lenders may impose additional operating and financial restrictions on us or modify the terms of our existing credit facilities. These restrictions may further restrict our ability to, among other things, pay dividends, make capital expenditures or incur additional indebtedness, including through the issuance of guarantees. In addition, our lenders may require the payment of additional fees, require prepayment of a portion of our indebtedness to them, accelerate the amortization schedule for our indebtedness and increase the interest rates they charge us on our outstanding indebtedness.
As of December 31, 2016, we were in compliance with all of the financial covenants contained in the credit facilities that we had entered into as of that date.
Please see Note 11, Debt, to our consolidated financial statements for additional information about these credit facilities.
Senior Notes due 2019
On September 22, 2014, we issued $65.0 million aggregate principal amount of our 7.50% senior unsecured notes due 2019, or our Senior Notes, in a registered public offering. The Senior Notes will mature on September 15, 2019, and may be redeemed in whole or in part at any time, or from time to time, after September 15, 2016. Interest on the Senior Notes is payable quarterly on each of March 15, June 15, September 15 and December 15, commencing on December 15, 2014. We used the net proceeds we received to fund installment payments due under our Newbuilding Program. On October 16, 2014, we issued an additional $8.625 million aggregate principal amount of our Senior Notes, pursuant to the underwriters’ option to purchase additional Senior Notes. Our 7.50% senior unsecured notes due 2019 commenced trading on the NYSE on September 29, 2014 under the symbol “SLTB.”
The indenture governing our Senior Notes contains certain restrictive covenants, including:
| ● |
| (a) | Maintain minimum liquidity levels;Limitation on Borrowings. We are prohibited from letting net borrowings equal or exceed 70% of our total assets, which are calculated as all of our assets of the types presented on our consolidated balance sheet. |
| ● |
| (b) | Maintain a minimum levelLimitation on Minimum Tangible Net Worth. The Company shall ensure that net worth always exceeds $500 million. |
| |
| (c) | Reports. Following any cross default, the Company shall promptly notify the holders of consolidated tangible net worth;our Senior Notes of the occurrence of such cross default. |
| ● |
| (d) | MaintainLimitation on Asset Sales. We shall not, and shall not permit any subsidiary to, in the ordinary course of business or otherwise, sell, lease, convey, transfer or otherwise dispose of any of our of any such subsidiary’s assets (including capital stock and warrants, options or other rights to acquire capital stock) other than pursuant to a maximum ratioPermitted Asset Sale or a Limited Permitted Asset Sale (as such terms are defined in the indenture governing our Senior Notes and described below), unless (A) the Company receives, or the relevant subsidiary receives, consideration at the time of net debt (which means our total indebtedness less cash)such asset sale at least equal to consolidated total capitalization (which means consolidated tangible net worth plus, among other things, our consolidated indebtedness); |
| ● | Maintain a minimum ratio of consolidated EBITDA to consolidated net interest expense; and |
| ● | Maintain at all times a minimum aggregatethe fair market value (including as to the value of all non-cash consideration), as determined in good faith by the board of directors of the Company, of the assets subject to such asset sale, and (B) within 365 days after the receipt of any net proceeds from an asset sale, the Company or the relevant subsidiary, as the case may be, shall apply all such net proceeds to certain permitted purposes, including the repayment of secured indebtedness, capital expenditures, repayment of unsecured indebtedness, acquire all or substantially all of the collateral vessels versus total outstanding borrowings under this facility.assets or, or the capital stock of, a person primarily engaged in a permitted business; provided, that in the case of the acquisition of capital stock of any person, such person is or becomes a subsidiary of the Company. |
For purposes of this covenant: a Permitted Asset Sale includes certain specified asset sales, certain vessel losses not to exceed 10% of the consolidated aggregate market value of the Company’s assets and any transaction or series of transactions involving assets disposed of for fair market value and having an aggregate market value in any one fiscal year of up to 25% of the consolidated aggregate market value of the Company’s assets; and a Limited Permitted Asset Sale includes any transaction or series of transactions during a single fiscal year, the net proceeds of which are not otherwise applied pursuant to the requirements set forth in this clause (d), that results in net proceeds in excess of 25% of the consolidated aggregate market value of the Company’s assets.
As of December 31, 2016, we were in compliance with the financial covenants of our Senior Notes.
If a Limited Permitted Asset Sale occurs, the Company must make an offer to purchase our Notes having a principal amount equal to the excess proceeds of such Limited Permitted Asset Sale at a purchase price of 101% of the principal amount of our Senior Notes to be purchased, plus accrued and unpaid interest.
In addition, we expect thatif a Change of Control (as defined in the indenture for the Senior Notes) occurs, holders of our proposed credit facilities will contain customary eventsSenior Notes have the right, at their option, to require us to purchase any or all of such holders’ our Senior Notes at a purchase price of 101% of the principal amount of our Senior Notes to be purchased, plus accrued and unpaid interest.
In addition, if an event of default or an event or circumstance which, with the giving of any notice or the lapse of time, would constitute an event of default under our Senior Notes has occurred and is continuing, or we are not in compliance with the covenant described under Limitation on Borrowings or Limitation on Minimum Net Worth described above, then none of the Company or any subsidiary will be permitted to declare or pay any dividends or return any capital to its equity holders (other than the Company or a wholly-owned subsidiary of the Company) or authorize or make any other distribution, payment or delivery of property or cash to its equity holders (other than the Company or a wholly-owned subsidiary of the Company), or redeem, retire, purchase or otherwise acquire, directly or indirectly, for value, any interest of any class or series of its equity interests (or acquire any rights, options or warrants relating thereto but not including cross-default provisions.convertible debt) now or hereafter outstanding and held by persons other than the Company or any wholly-owned subsidiary, or repay any subordinated loans to equity holders (other than the Company or a wholly-owned subsidiary of the Company) or set aside any funds for any of the foregoing purposes.
In December 2016, our Board of Directors authorized the repurchase of up to $20.0 million of the outstanding Senior Notes in open market or privately negotiated transactions. The specific timing and amounts of the repurchases, which will be funded by available cash, will be in the sole discretion of management and vary based on market conditions and other factors. This authorization has no expiration date. As of December 31, 2016, the full $20.0 million remains available for repurchases under this authorization.
| |
| C. | Research and Development, Patents and Licenses, Etc. |
Not applicable.
See “Item 4. Information on the Company—B. Business Overview—Industry and Market Conditions.”
| |
| E. | Off-Balance Sheet Arrangements |
As of December 31, 2013,2016, we did not have any off-balance sheet arrangements. Currently, we are committed to make charter-hire payments to a third partiesparty for certaina chartered-in vessels. These arrangements arevessel. This arrangement is accounted for as an operating leases.lease. Please see “Tabular Disclosure of Contractual Obligations” for our other contractual obligations and commitments.
| |
| F. | Tabular Disclosure of Contractual Obligations |
The following table sets forth our
estimated currenttotal contractual obligations
for our newbuilding commitments through the expected delivery dates of the vessels and vessels that we have time chartered-in.| (in millions of U.S. dollars) | | Less than
1 year | | | 1 to 3
years | | | 3 to 5
years | | | More
than 5
years | |
| Vessels Under Construction (1) | | $ | 572.4 | | | $ | 2,127.5 | | | $ | — | | | $ | — | |
| Time Charter-in Commitments (2) | | | 61.2 | | | | 64.9 | | | | 13.4 | | | | — | |
|
| | | | | | | | | | | | | | | | | | | | |
| (in millions of U.S. dollars) | | Less than 1 year | | 1 to 3 years | | 3 to 5 years | | More than 5 years | | Total |
Vessels under construction (1) | | $ | 18.6 |
| | $ | — |
| | $ | — |
| | $ | — |
| | $ | 18.6 |
|
Time charter-in commitments (2) | | 3.3 |
| | — |
| | — |
| | — |
| | 3.3 |
|
Senior Notes (3) | | — |
| | 73.6 |
| | — |
| | — |
| | 73.6 |
|
Bank loans (4) | | 13.9 |
| | 43.6 |
| | 428.5 |
| | 36.4 |
| | 522.4 |
|
Interest payments (5) | | 26.1 |
| | 48.3 |
| | 23.8 |
| | 1.9 |
| | 100.1 |
|
Commercial management fee (6) | | 2.6 |
| | — |
| | — |
| | — |
| | 2.6 |
|
Technical management fee (7) | | 4.8 |
| | — |
| | — |
| | — |
| | 4.8 |
|
| Total | | $ | 69.3 |
| | $ | 165.5 |
| | $ | 452.3 |
| | $ | 38.3 |
| | $ | 725.4 |
|
| |
| (1) | Represents the unpaid installments as of December 31, 20132016 relating to the remaining undelivered newbuilding vessel. Of this amount $17.2 million remains unpaid as of the 79 vessels we currently have under construction.date of this filing. |
| |
| (2) | Represents the amounts expected to be paid by us on the 17two vessels that we currently have time chartered-in as of December 31, 2016, assuming we redeliver the vessels to their owners on the earliest redelivery date or actual redelivery date and excluding any option periods which may be exercised by us. |
50 | |
| (3) | Represents the repayment of our Senior Notes which mature in September 2019. |
| |
| (4) | Represents the repayment of installments under the bank loans outstanding as of December 31, 2016. |
| |
| (5) | Represents the interest payments on outstanding balances of our Senior Notes at 7.50% per annum and bank loans, for which the interest rate used for each facility is based on interest rates in effect as of December 31, 2016, which approximate 4% inclusive of margins. |
| |
| (6) | Represents the fixed component of the termination fees we would have to pay our commercial manager, SCM, of $300 per day for a notice period of three months’ and a payment equal to three months of management fees for each vessel that we own and each vessel under construction as of December 31, 2016. Due to the variable nature of the commissions, they have been excluded from the above table. |
| |
| (7) | Represents the termination fees we would have to pay our technical manager, SSM, of $0.2 million per vessel per year for a notice period of three months’ and a payment equal to three months of management fees for each vessel that we own and each vessel under construction as of December 31, 2016. |
This table does not include (i) vessel management fees and expenses, which will be incurred starting with the delivery of the first vessel we time chartered-in and (ii) payments that we expect to make under our credit facilities we expect to enter into.
|
| |
| ITEM 6. | DIRECTORS, SENIOR MANAGEMENT AND EMPLOYEES |
| |
| A. | Directors and Senior managementManagement |
Set forth below are the names, ages and positions of our directors and executive officers. Our board of directors is elected annually on a staggered basis, and each director elected holds office for a three year term or until his successor shall have been duly elected and qualified, except in the event of his death, resignation, removal or the earlier termination of his term of office. The initial term of office of each director is follows: ourOur Class A directors will serve for a term expiring at the 20142017 annual meeting of shareholders, our Class B directors will serve for a term expiring at the 20152018 annual meeting, and our Class C directors will serve for a term expiring at the 20162019 annual meeting. Officers are elected from time to time by vote of our board of directors and hold office until a successor is elected. The business address of each of our directors and executive officers listed below is Scorpio Bulkers Inc., 9, Boulevard Charles III, MC 98000 Monaco.
|
| | | | | |
| Name | | Age | | | Position |
| Emanuele A. Lauro | | 38 | 34 |
| | Chairman, Class A Director and Chief Executive Officer |
| | | | | | |
| Robert Bugbee | | 56 | 53 |
| | Class B Director and President |
| | | | | | |
| Cameron Mackey | | 48 | 45 |
| | Chief Operating Officer |
| Filippo Lauro | | 40 |
| | | | Vice President |
| Hugh Baker | | 49 | 45 |
| | Chief Financial Officer |
| | | | | | |
| Roberto Giorgi | | 66 | 63 |
| | Class A Director |
| | | | | | |
| Einar Michael Steimler | | 68 | 65 |
| | Class B Director |
| | | | | | |
| Christian M. Gut | | 37 | 34 |
| | Class C Director |
| Thomas Ostrander | | 66 |
| | Class A Director |
| James B. Nish | | 58 |
Sergio Gianfranchi
| | | 69 | | | Vice President, Vessel Operations |
| | | | | | Class C Director |
| Luca Forgione | | 40 | 37 |
| | General Counsel |
| | | | | | |
| Anoushka Kachelo | | 36 | 34 |
| | Secretary |
Biographical information concerning the directors and executive officers listed above is set forth below.
Emanuele A. Lauro, Chairman &and Chief Executive Officer Emanuele A. Lauro,
our Co-Founder,the Company’s co-founder, serves and has served as our Chairman and Class A
directorDirector since April 9, 2013 and as our Chief Executive Officer since July 1, 2013. Mr. Lauro also serves and has served as Chairman and Chief Executive Officer of Scorpio Tankers (NYSE: STNG) since its initial public offering in April
2010.2010, as as Director of the Standard Club since May 2013. He joined Scorpio Group in 2003 and has continued to serve there in a senior management position since 2004. Under Mr. Lauro’s leadership, Scorpio Group has grown from an owner of three vessels in 2003 to become a leading operator and manager of
over 100approximately 210 vessels in
2013.2016. Over the course of the last several years, Mr. Lauro has founded and developed all of the Scorpio Group
Tanker Pools in addition to several other ventures such as Scorpio Logistics,
in 2007, which owns and operates specialized assets engaged in the transshipment of
coaldry cargo commodities and invests in coastal transportation and port infrastructure developments
in Asia and
Scorship Navigation in 2005, which engages in the identification, placement, and management of certain international shipping investments on behalf of retail investors in Europe.Africa since 2007. Mr. Lauro has a degree in international business from the European Business School, London.
Mr. Lauro is the brother of our Vice President, Mr. Filippo Lauro.
Robert Bugbee, President and Director Robert Bugbee,
our Co-Founder,the Company’s co-founder, serves and has served as our Class B
directorDirector since April 9, 2013 and as our President since July 1, 2013. Mr. Bugbee has more than
2530 years of experience in the shipping industry. Mr. Bugbee also serves and has served as President and Director of Scorpio Tankers
(NYSE: STNG) since its initial public offering in April 2010. He joined Scorpio Group in February 2009 and has continued to serve there in
a senior
management.management position. Prior to joining Scorpio Group, Mr. Bugbee was a partner at Ospraie Management LLP between 2007 and 2008, a company which advises and invests in commodities and basic industry. From 1995 to 2007, Mr. Bugbee was employed at OMI Corporation, or OMI, a NYSE-listed tanker company sold in 2007. While at OMI, Mr. Bugbee
most recently served as President from January 2002 until the sale of the company, and
he previouslybefore that served as Executive Vice President since January 2001, Chief Operating Officer since March 2000 and Senior Vice President
of OMI from August 1995 to June 1998. Mr. Bugbee joined OMI in February
1993.1995. Prior to this, he was employed by Gotaas-Larsen Shipping Corporation since 1984. During this time he took a two year sabbatical from 1987 for the M.I.B.
ProgrammeProgram at the Norwegian School for Economics and Business administration in Bergen. He has a
Fellowship from the International Shipbrokers Association and a B.A. (Honors) from London University.
Cameron Mackey, Chief Operating Officer
Cameron Mackey
serves and has served as our Chief Operating Officer since July 1, 2013. Mr. Mackey also serves and has served as Chief Operating Officer of Scorpio Tankers
(NYSE: STNG) since its initial public offering in April
2010.2010 and as a Director since May 2013. He joined Scorpio Group in March 2009, where he continues to serve in a senior management position. Prior to joining Scorpio Group, he was an equity and commodity analyst at Ospraie Management LLC from
2007-2008.2007 to 2008. Prior to that, he was Senior Vice President of OMI Marine Services LLC from
2004-2007 and2004 to 2007, where he was also in Business Development
at OMI Corporation from
2002-2004.2002 to 2004. He has been employed in the shipping industry since 1994 and, earlier in his career, was employed in unlicensed and licensed positions in the merchant navy, primarily on tankers in the international fleet of Mobil Oil Corporation, where he held the qualification of Master Mariner. He has an M.B.A. from the Sloan School of Management at the Massachusetts Institute of Technology, a B.S. from the Massachusetts Maritime Academy and a B.A. from Princeton University.
Filippo Lauro, Vice President
Filippo Lauro serves and has served as an executive officer of the Company with the title of Vice President since June 8, 2016. Mr. Filippo Lauro also serves and has served as Vice President of Scorpio Tankers since May 2015. He joined Scorpio Group in 2010 and has continued to serve there in a senior management position. Prior to joining Scorpio Group, Mr. Filippo Lauro was the founder of and held senior executive roles in several private companies, primarily active in real estate, golf courses and resorts development. Mr. Filippo Lauro is the brother of our Chairman and Chief Executive Officer, Mr. Emanuele Lauro.
Hugh Baker, Chief Financial Officer Hugh Baker
serves and has served as our Chief Financial Officer since July 1, 2013.
Since 2012, Mr. Baker
has also
serves and has served as a Managing Director ofbeen employed by Scorpio
USA LLC since July 2012,Tankers focusing on business development and
finance for Scorpio Tankers (NYSE: STNG) and the Scorpio Group.finance. For three years prior to joining Scorpio, Mr. Baker was a Managing Director in the investment banking team at Evercore Partners in New York, concentrating on the shipping industry. Prior to Evercore, he was the Head of Shipping at HSH Nordbank in New York and was previously a Managing Director in the ship finance team at ING Bank in London. Prior to banking, Mr. Baker worked in commercial roles for Greek-owned shipping companies in London. Mr. Baker has a BA from the London School of Economics and a MSc in Shipping, Trade & Finance from Cass Business School. Mr. Baker is a Fellow of the Institute of Chartered Shipbrokers.
Roberto Giorgi
serves and has served as our Class A
directorDirector since the closing of our initial public offering in December 2013. Mr. Giorgi also serves and has served
as Executive Chairman of Fraser Yachts since
2005September 2014 and as
a committee member of Skuld P&I Club since June 2013. From 2014 to 2015, he served as Honorary President and member of the
PresidentGroup Executive of V.Ships,
Ship Management, the world’s largest ship management company. From 1988 to
2008,2014, Mr. Giorgi has held various roles within V.Ships, including
President of V.Ships Ship Management, Managing Director of V.Ships New York, head of V.Ships Leisure in the cruise sector, and head of V.Ship’s ship management operation from its Monaco office. From 2008 to 2010, Mr. Giorgi also served as President of InterManager, the international trade association for third-party and in-house ship managers, whose members between them are responsible for approximately 3,700 ships and more than 200,000 crew members. Prior to joining the V.Ships Group, he attended the San Giorgio Nautical College in Genoa (1964 – 1969) and sailed from Deck Cadet to First Officer with Navigazione Alta Italia, Italian line and Sitmar Cruises. Before joining the merchant marine, he spent one year (1970/71) in the Naval Academy of Leghorn and sailed with the Italian Navy as Lieutenant.
In addition, since June 2013 Mr. Giorgi has been a director of Skuld P&I Club.Einar Michael Steimler, Director Einar Michael Steimler
serves and has served as our Class B
directorDirector since the closing of our initial public offering in December 2013. Mr. Steimler also serves
and has served as a director of DHT Holdings Inc. (NYSE:DHT)
., where he is also a member of the Audit and Nominating and Corporate Governance Committees, and the Chairman of the Compensation Committee. Mr. Steimler has over
3040 years
of experience in the shipping industry.
FromIn 2000,
to 2011, Mr. Steimler served as chairmanhe was instrumental in the formation of Tanker (UK) Agencies, the commercial agent to Tankers International. He
was instrumental in the formation of Tanker (UK) Agencies in 2000 and served as its Chief Executive Officer until the end of
2007.2007, and subsequently as its Chairman until 2011. From 1998 to 2010, Mr. Steimler served as a Director of Euronav NV (EURN:EN Brussels). He has been involved in both sale and purchase and chartering brokerage in the tanker, gas and chemical sectors and was a founder of Stemoco, a Norwegian ship brokerage firm. He graduated from the Norwegian School of Business Management in 1973 with a degree in Economics.
Christian M. Gut, Director Christian M. Gut
serves and has served as our Class C
directorDirector since the closing of our initial public offering in December 2013. Mr. Gut has
10over twelve years of experience in the consulting industry in the Asia Pacific region. Mr. Gut started his professional career at ThyssenKrupp Technologies AG (as it then was) in Essen, Germany in 2002. He later joined Singapore based EABC Pte Ltd., or EABC, in 2003 where he was appointed as Director on May 18, 2006. EABC’s services comprise market intelligence and strategy, sales promotion and support to project management in selected Asia Pacific countries, principally Australia. Furthermore, Mr. Gut is a co-founder and past manager of the Stellar Energy Fund, launched in Singapore in 2006, which invested in energy focused private companies to finance projects and expansion plans in Asia, Middle East and Europe in the following industries: oil trading and bunkering, gas E&P, solar, geothermal and power generating heat plants. Mr. Gut has a Bachelor’s degree in international business from the European Business School in London.
Thomas Ostrander, Director Sergio Gianfranchi, Vice President, Vessel Operations
Sergio Gianfranchi has served as our Vice President of Vessel Operations since September 19, 2013. Mr. Gianfranchi also
Thomas Ostrander serves and has served as Vice President, Vessel Operations of Scorpio Tankers (NYSE: STNG)our Class A director since its initial public offering in April 2010. HeJanuary 2016. From 2013 to 2015, Mr. Ostrander served as Operations ManagerChief Financial Officer of our technical manager, SSM,U.S. Alliance Paper Inc., a privately held business involved in consumer tissue converting
and marketing in the eastern half of the United States. From 2011 to 2013, he served as a Managing Director at its headquartersGCA Savvian, a global investment bank. From 2006 to 2008, Mr. Ostrander served as a Managing Director and Sector Head in Monaco from 2002the Industrial Group at Banc of America Securities. From 1989 to 2004. He has been instrumental2006, he held various roles within Citigroup (legacy Salomon Brothers), where he was most recently Chairman of the Global Industrial Group for North America. Prior to that, he was Head of the Global Industrial Group for North America and Co-Head of the Global group. From 1976 to 1989, he served in launchingvarious roles, including as a Managing Director, and operatinghe was a member of the Scorpio Group Pools duringBoard of Directors of New York based Kidder Peabody & Co., where he also was Co-Founder and Co-Head of Equity Capital Markets. Furthermore, Mr. Ostrander was a Director of Westmoreland Coal Company for over 12 years, where he served as Chairman of the last five years,Corporate Governance Committee and was employeda member of the Audit, Compensation and Benefits, Finance and Nominating Committees. Mr. Ostrander has an MBA from Harvard Business School and an AB from the University of Michigan in Economics and Accounting.
James B. Nish, Director
James B. Nish serves and has served as
our Class C director since January 2016. Mr. Nish has 28 years of experience in investment banking, serving clients across a variety of international industrial markets. He also serves as a Board member and Chairman of the
Fleet ManagerAudit Committee of
SCM,Gibraltar Industries, Inc. (NASDAQ: ROCK), a manufacturer and distributor of products for building markets, a position he has held since 2015, and has served as a Board member of the
ScorpioCSG Group
affiliatesince 2014, a private company that
manages the commercial operations of approximately 50 vessels groupedprovides security alarm monitoring and related home automation services to subscribers in the
three ScorpioUnited States. From 2008 to 2012, Mr. Nish was Group
Pools, from 2007Head of Middle Corporate Investment Banking at J.P.Morgan. From 1986 to
2009. Mr. Gianfranchi is currently employed as the Pool Fleet Manager of SCM. From 1999 to 2001, Mr. Gianfranchi2008, he served as
the on-site owner’s representativeCo-Chairman of the
ScorpioInvestment Banking Commitment Committee and Group
affiliates named Doria Shipping, Tristan Shipping, Milan ShippingHead of the General Industries Group of Bear Stearns & Co. Inc., where he organized and
Roma Shipping, to surveymanaged investment banking coverage of a diversified group of industrial companies. Mr. Nish is a Certified Public Accountant and Adjunct Professor in both the
constructionUndergraduate Business School and MBA Programs at Baruch College, Zicklin School of
their PanamaxBusiness in New York and
Post-Panamax newbuilding tankers being builtat Pace University, Lubin School of Business in New York, where he teaches a number of courses in both the Accounting and Finance departments. Mr. Nish has an MBA from the Wharton School at the
3Maj ShipyardUniversity of Pennsylvania and a BS from the State University of New York at Buffalo in
Rijeka, Croatia. When Mr. Gianfranchi joined SSM in 1989, he began as vessel master of its OBOs (multipurpose vessels that carry ore, heavy drybulkAccounting and
oil). Upon obtaining his Master Mariner License in 1972, he served until 1989 as a vessel master with prominent Italian shipping companies, including NAI, which is the largest private Italian shipping company and owned by the Lolli-Ghetti family, and Almare, initially a subsidiary of NAI but later controlled by Finmare, the Italian state shipping financial holding company. In this position he served mostly on OBOs, tankers and drybulk carriers. He graduated from La Spezia Nautical Institute in Italy in 1963.Business.
Luca Forgione, General Counsel Luca Forgione
serves and has served as our General Counsel since July 1, 2013 and
served as our Secretary from July 1, 2013 to December 18, 2013. Mr. Forgione also serves and has served as
Secretary and General Counsel of Scorpio Tankers
(NYSE: STNG) since its initial public offering in April
2010.2010 and served as Secretary until December 2013. He joined Scorpio Group in August 2009 where he continues to serve as General Counsel. He is licensed as a lawyer in his native Italy and as a Solicitor of the Supreme Court of England & Wales. Mr. Forgione has
more than ten years of shipping industry experience and has worked in the fields of shipping, offshore logistics, commodity trading and energy since the beginning of his in-house career, most recently with Constellation Energy Commodities Group Ltd. in London,
part of Constellation Energy Group Inc. then listed on the NYSE under “CEG” and now part of Exelon (NYSE: EXC) from 2007 to 2009, and previously with Coeclerici S.p.a. in Milan from 2004 to 2007. He has experience with all aspects of the supply chain of drybulk and energy commodities (upstream and downstream), and has developed considerable understanding of the regulatory and compliance regimes surrounding the trading of physical and financial commodities as well as the owning, managing and chartering of vessels. Mr. Forgione was a Tutor in International Trade Law and Admiralty Law at University College London (U.K.) and more recently a Visiting Lecturer in International Trade Law at King’s College (U.K.). He has a
MastersMaster’s Degree in Maritime Law from the University of Southampton (U.K.) and a Law Degree from the University of Genoa (Italy).
Anoushka Kachelo, Secretary Anoushka Kachelo serves and has served as our Secretary since December 18, 2013. Mrs. Kachelo also serves as Secretary of Scorpio Tankers. She joined Scorpio Group in September 2010 as Senior Legal Counsel. SheMrs. Kachelo is a Solicitor of the Supreme Court of England & Wales and has worked in the fields of commodity trading, energy and asset finance. Prior to joining the Scorpio Group, Mrs. Kachelo was Legal Counsel for the Commodities Team at JPMorgan (London) and prior to that in private practice for the London office of McDermott Will & Emery and Linklaters. She has a BA in Jurisprudence from the University of Oxford (U.K.).
For the period from March 20, 2013 (our inception) to December 31, 2013, we paid compensation to our directors and senior management of approximately $1.8 million. These amounts have been accruing since July 2013.
Beginning January 2014, each
Each of our non-employee directors receive cash compensation in the aggregate amount of $60,000 annually, plus either (i) an additional fee of $10,000 per year for each committee on which a director serves or (ii) an additional fee of $20,000 per year for each committee for which a director serves as Chairman. In addition, our lead independent director receives an additional fee of $20,000 per year. All actual expenses incurred while acting in their capacity as a director are reimbursed. For each board or committee meeting the non-employee director attends, the director receives $2,000. We do not have a retirement plan for our officers or directors.
For the year ended December 31, 2016, we paid an aggregate compensation to our directors and senior management of approximately $4.4 million.
Executive Officers
We have
agreed employment agreements with
eachthe majority of our
executives.executive officers. These employment agreements remain in effect until terminated in accordance with their terms upon no less than 24 months prior written notice. Pursuant to the terms of their respective employment agreements, our
executivesexecutive officers are prohibited from disclosing or unlawfully using any of our material confidential information.
Upon a change in control of us, the annual bonus provided under the employment agreement becomes a fixed bonus of between 150% and 250% of the executive’s base salary, depending on the terms of the employment agreement applicable to each executive.
Any such executive may be entitled to receive upon termination an assurance bonus equal to such fixed bonus and an immediate lump-sum payment in an amount equal to up to three times the sum of the executive’s then current base salary and the assurance bonus. If an executive’s employment is terminated for cause or voluntarily by the employee, he shall not be entitled to any salary, benefits or reimbursements beyond those accrued through the date of his termination, unless he voluntarily terminated his employment in connection with certain conditions. Those conditions include a change in control combined with a significant geographic relocation of his office, a material diminution of his duties and responsibilities, and other conditions identified in the employment agreement.
We believe that it is important to align the interests of our directors and management with that of our shareholders. In this regard, we have determined that it will generally be beneficial to us and to our shareholders for our directors and management to have a stake in our long-term performance. We expect to have a meaningful component of our compensation package for our directors and management consist of equity interests in us in order to provide them on an on-going basis with a meaningful percentage of ownership in us.
Equity Incentive Plan
Our board of directors has adopted an equity incentive plan, which we refer to as the Equity Incentive Plan, under which directors, officers and employees of us and our subsidiaries,
and affiliatesas well as employees of affiliated companies are eligible to receive incentive stock options and non-qualified stock options, stock appreciation rights, restricted stock, restricted stock units and unrestricted common shares.
We haveAs of December 31, 2016, we had reserved a total of
7,012,3913,970,580 common shares,
which includes an additional 2,150,370 common shares that our board of directors reserved for issuance under the plan on February 21, 2014, for issuance under the Equity Incentive Plan, subject to adjustment for changes in capitalization as provided in the Equity Incentive Plan.
TheOur Equity Incentive Plan is administered by our Compensation Committee.
Under the terms of the
plan,Equity Incentive Plan, stock options and stock appreciation rights granted under the
planEquity Incentive Plan will have an exercise price equal to the fair market value of a common share on the date of grant, unless otherwise determined by the plan administrator, but in no event will the exercise price be less than the fair market value of a common share on the date of grant. Options and stock appreciation rights will be exercisable at times and under conditions as determined by the plan administrator, but in no event will they be exercisable later than ten years from the date of grant.
The plan administrator may grant shares of restricted stock and awards of restricted stock units subject to vesting, forfeiture and other terms and conditions as determined by the plan administrator.
Following the vesting of a restricted stock unit, the award recipient will be paid an amount equal to the number of vested restricted stock units multiplied by the fair market value of a common share on the date of vesting, which payment may be paid in the form of cash or common shares or a combination of both, as determined by the plan administrator. The plan administrator may grant dividend equivalents with respect to grants of restricted stock units.Adjustments may be made to outstanding awards in the event of a corporate transaction or change in capitalization or other extraordinary event. In the event of a “change in control” (as defined in the plan), unless otherwise provided by the plan administrator in an award agreement, awards then outstanding will become fully vested and exercisable in full.
Our board of directors may amend or terminate the
planEquity Incentive Plan and may amend outstanding awards, provided that no such amendment or termination may be made that would materially impair any rights, or materially increase any obligations, of a grantee under an outstanding award. Shareholder approval of
planEquity Incentive Plan amendments will be required under certain circumstances. Unless terminated earlier by our board of directors, the
planEquity Incentive Plan will expire ten years from the date the
planEquity Incentive Plan is adopted.
On
September 30, 2013,June 24, 2015, we granted
an aggregate of 2,775,000 restricted shares to officers and employees. Of this total, 1,395,000 restricted shares vest in three equal installments on July 27, 2015, July 27, 2016 and July 27, 2017. The remaining 1,380,000 restricted shares vest in three equal installments on September 30, 2015, September 30, 2016 and September 30, 2017. The aggregate fair value of these awards is $26.9 million, which will be amortized as stock-based compensation expense, a component of general and administrative expense, over the vesting periods of each grant.On November 6, 2013, we granted 1,380,000 restricted shares to our officers. These restricted shares vest in three equal installments on November 6, 2015, November 6, 2016 and November 6, 2017. The fair value of these awards was $13.3 million, which will be amortized as stock-based compensation expense, a component of general and administrative expense, over the vesting periods of each grant.
On December 17, 2013, we granted 707,020135,829 restricted shares to our officers, members of the board of directors and employees. Of these restricted shares, 617,0207,374 restricted shares vest in three equal installments beginning on December 17, 2015, December 17, 2016the first anniversary of the date of grant and December 17, 2017 and 90,000128,455 restricted shares vest in three equal installments beginning on December 17, 2014, December 17, 2015 and December 17, 2016.the second anniversary of the date of grant. The aggregate fair value of these awards was $6.8 million, which will be amortized as stock-based compensation expense, a component of general and administrative expense, over the vesting periods of each grant.
is $2.8 million.
On February 21, 2014,July 10, 2015, we granted 2,080,37041,818 restricted shares to certain employees of the Scorpio Group, which vest in three equal installments beginning on June 24, 2017. The aggregate fair value of these awards is $0.8 million.
On September 18, 2015, we granted 626,388 restricted shares to our officers and members of the board of directors and employees of the Company.directors. Of these restricted shares, 1,990,37035,373 restricted shares vest in three equal installments beginning on February 21, 2016, February 21, 2017the first anniversary of the date of grant and February 21, 2018 and 90,000591,015 restricted shares vest in three equal installments beginning on February 21, 2015, February 21, 2016 and February 21, 2017.the second anniversary of the date of grant. The aggregate fair value of these awards was $19.4 million, which will be amortized as stock-based compensation expense,is $12.5 million.
On July 28, 2016, we granted 2,265,000 restricted shares to our officers and members of the board of directors. Of these restricted shares, 150,000 restricted shares vest in three equal installments beginning on the first anniversary of the date of grant and 2,115,000 restricted shares vest in three equal installments beginning on the second anniversary of the date of grant. The aggregate fair value of these awards is $7.4 million.
Compensation cost is recognized on a component of general and administrative expense,straight-line basis over the requisite service period for each separately vesting periodsportion of each grant. the award as if the award was, in-substance, multiple awards. Please see Note 10, Equity Incentive Plan, to our Consolidated Financial Statements included herein for additional information.
Our board of directors currently consists of
fiveseven directors,
threefive of whom have been determined by our board of directors to be independent under the rules of the
New York Stock ExchangeNYSE and the rules and regulations of the SEC. Our board has an Audit Committee, a Nominating
and Corporate Governance Committee and a Compensation
Committee. Our Audit Committee
each of which is comprised of our
threefive independent directors, who are Messrs.
Ostrander, Giorgi, Steimler,
Gut and Nish. Our Nominating and Corporate Governance Committee and our Compensation Committee are comprised of Messrs. Steimler, Giorgi and Gut. The Audit Committee, which operates under a charter, among other things, reviews our external financial reporting, engages our external auditors and
overseeoversees our internal audit activities, procedures and the adequacy of our internal controls. In addition, provided that no member of the Audit Committee has a material interest in such transaction, the Audit Committee is responsible for reviewing transactions that we may enter into in the future with other members of the Scorpio Group that our board believes may present potential conflicts of interests between us and the Scorpio Group. The Nominating and Corporate Governance Committee is responsible for recommending to the board of directors nominees for director and directors for appointment to board committees and advising the board with regard to corporate governance practices. The Compensation Committee oversees our equity incentive plan and recommends director and senior employee compensation. Our shareholders may also nominate directors in accordance with procedures set forth in our bylaws.
During
For the
period from March 20, 2013 (date of inception) toyears ended December 31,
2013,2016, 2015, and 2014 we had
onethree, four and three employee (excluding our executive officers)
., respectively. These employees hold administrative positions in New York, New York.
Our executive officers are employed by us and our support staff is provided by SSH pursuant to anthe Amended Administrative Services Agreement. Our technical manager will beis responsible for identifying, screening and recruiting, directly or through a crewing agent, the officers and all other crew members for our vessels that are employed by our vessel-owning subsidiaries. Our subsidiaries that will own the vessels in our fleet, indirectly through our technical manager pursuant to the respective technical management agreements, will employ officers and crew members manning such vessels.
The common shares beneficially owned by our directors and our executive officers are disclosed in “Item 7. Major Shareholders and Related Party Transactions—A. Major Shareholders.”
|
| |
| ITEM 7. | MAJOR SHAREHOLDERS AND RELATED PARTY TRANSACTIONS. |
The following table sets forth information regarding beneficial ownership of our common shares for (i) owners of more than five percent of our common shares and (ii) our directors and
executive officers, of which we are aware as of
the date of this annual report.| | | | | | | |
| Name | | No. of Shares | | | % Owned(1)(2) | |
| Scorpio Services Holding Limited(2)(6) | | | 1,251,500 | | | | 0.9 | % |
| | | | | | | | | |
| Galahad Securities Limited(3) | | | 17,679,481 | | | | 12.9 | % |
| | | | | | | | | |
| Avenue Europe International Management, L.P.(5) | | | 2,270,565 | | | | 1.7 | % |
| | | | | | | | | |
| Avenue Capital Management II, L.P.(5) | | | 7,607,435 | | | | 5.7 | % |
| | | | | | | | | |
| BlueMountain Capital Management LLC(5) | | | 8,538,000 | | | | 6.4 | % |
| | | | | | | | | |
| York Capital Management Global Advisors, LLC(4)(5) | | | 10,659,000 | | | | 8.0 | % |
| | | | | | | | | |
| Monarch Alternative Capital LP(4)(5) | | | 8,341,000 | | | | 6.3 | % |
| | | | | | | | | |
| Directors and executive officers as a group(6) | | | 4,756,675 | | | | 3.6 | % |
February 16, 2017.
|
| | | | | | | | |
| Name | | No. of Shares | | | % Owned (1) |
| Scorpio Services Holding Limited | | 13,160,377 |
| (2 | ) | | 17.5 | % |
| GRM Investments Ltd. | | 12,839,328 |
| (3 | ) | | 17.0 | % |
| Raging Capital Management, LLC * | | 9,205,700 |
| (4 | ) | | 12.2 | % |
| Evermore Global Advisors, LLC * | | 4,351,926 |
| (5 | ) | | 5.8 | % |
| Directors and executive officers as a group | | 4,001,591 |
| | | 5.3 | % |
____________________
| |
| (1) | Calculated based on 133,403,93175,309,486 common shares outstanding as of December 31, 2013.February 16, 2017. |
| (2) | Excludes 2,140,820 common shares payable under the Administrative Services Agreement. |
| (3)(2) | This information is derived from Schedule 13G/13D/A filed with the SEC on March 12, 2014. |
| (4) | This information is derived from Schedule 13G filed with the SEC on February 14, 2014. |
| (5) | IncludesJune 23, 2016, adjusted for additional common shares heldissued to SSH as payment for fees pursuant to the Administrative Service Agreement. Ms. Annalisa Lolli-Ghetti may be deemed to be the beneficial owner of these shares by funds managed thereby. |
| (6) | virtue of being the majority shareholder of SSH. Emanuele Lauro, our Director and Chief Executive Officer, Robert Bugbee, our Director and President, and Cameron Mackey, our Chief Operating Officer, own 10%, 10% and 7% of Scorpio Services Holdings Limited,SSH, respectively. |
| B. |
| (3) | This information is derived from Schedule 13G/A filed with the SEC on June 20, 2016. |
| |
| (4) | This information is derived from Schedule 13G/A filed with the SEC on February 14, 2017. |
| |
| (5) | This information is derived from Schedule 13G filed with the SEC on January 23, 2017. |
* Includes common shares held by funds managed thereby.
As of February 1, 2017, we had 34 shareholders of record, eight of which were located in the United States and held an aggregate of 73,744,282 shares of our common stock, representing 98% of our outstanding common shares. However, one of the U.S. shareholders of record is Cede & Co., a nominee of The Depository Trust Company, which held 70,106,172 shares of our common stock, as of that date.
| |
| B. | Related Party Transactions |
On September 29, 2016, we agreed to amend our master agreement, or the Master Agreement, with SCM and SSM, and our administrative services agreement, or the Administrative Services Agreement, with SSH under a deed of amendment, or Deed of Amendment. Pursuant to the terms of the Deed of Amendment, on December 9, 2016, we entered into definitive documentation to memorialize the agreed amendments to the Master Agreement, or the Amended and Restated Master Agreement. The Amended and Restated Master Agreement and the Administrative Services Agreement as amended by the Deed of Amendment, or the Amended Administrative Services Agreement, are effective as from September 29, 2016.
Pursuant to the Amended and Restated Master Agreement, effective beginning on the fifth day within any 20 trading day period that the closing price of our common shares on the NYSE is equal to or greater than $5.00, the commission payable for commercial management would be reinstated to 1.75% of all monies earned by a vessel from 1%. As of close of trading on the NYSE on November 18, 2016, the condition was met and the commission payable for commercial management was reinstated to 1.75% of all monies earned by a vessel, effective November 19, 2016.
Set forth below is a description of the other material terms of the Amended and Restated Master Agreement and the Amended Administrative Services Agreement. Please also see Note 13, Related Party Transactions, to the Consolidated Financial Statements included herein for additional information.
Commercial and Technical Management Agreements
- Amended and Restated Master Agreement
Our vessels are commercially managed by SCM and technically managed by SSM pursuant to
athe Amended and Restated Master Agreement, which may be terminated by either party upon 24
months’ notice, unless terminated earlier in accordance with the provisions of the Amended and Restated Master Agreement. In the event of the sale of one or more vessels, a notice period of three months’ and a payment equal to three months
notice.of management fees will apply, provided that the termination does not amount to a change of control, including a sale of substantially all vessels, in which case a payment equal to 24 months of management fees will apply. SCM and SSM are companies affiliated with us. The
vesselsvessel we charter-in
areis also commercially managed by SCM. We expect that additional vessels that we may
charter-in or acquire in the future,
includingand the
vessels in our Newbuilding Program,newbuilding drybulk vessel that is expected to be delivered to us during the second quarter of 2017, will also be managed under the
Amended and Restated Master Agreement or on substantially similar terms.
SCM’s services include securing employment for our vessels in the spot market and on time charters. SCM also manages the Scorpio Group Pools in which our vessels are or are expected to be employed. For commercial management of any of our vessels that does not operate in one of these pools, we pay SCM a daily fee of $300 per vessel, plus a 1.75% commission on the gross revenues per charter fixture. The Scorpio Group Pool participants, including us and third-party owners of similar vessels, are each expected to pay SCM a pool management fee of $300 per vessel per day, plus a 1.75% commission on the gross revenues per charter fixture.
SSM’s services include providing technical support, such as arranging the hiring of qualified officers and crew, supervising the maintenance and performance of vessels, purchasing supplies, spare parts and new equipment, arranging and supervising drydocking and repairs, and monitoring regulatory and classification society compliance and customer standards. We
will pay SSM an annual fee of $200,000 per vessel to provide technical management services for each of our
vessels in the Newbuilding Program upon delivery.owned vessels. In addition, representatives of SSM, including certain subcontractors, provide us with construction supervisory services while our vessels are being constructed in shipyards. For these services, we compensate SSM for its direct expenses, which can vary between $200,000 and $500,000 per vessel.
Amended Administrative Services Agreement
We have entered into an Amended Administrative Services Agreement with SSH for the provision of administrative staff, office space and accounting, legal compliance, financial and information technology services. SSH is a company affiliated with us. SSH also arranges acquisitions for us. The services provided to us by SSH may be sub-contracted to other entities within the Scorpio Group. Pursuant to the Amended Administrative Services Agreement, we will reimburse SSH for the reasonable direct or indirect expenses it incurs in providing us with the administrative services described above and a pro-rata portion of the salary incurred by SSH for an internal auditor. above.
We will also paypaid SSH a fee, payable in our common shares, for arranging vessel acquisitions, including newbuildings, equal to $250,000 per vessel, due upon delivery of the vessel, which is payable in our common shares. We have agreed to issue upon delivery of each vessel in our Newbuilding Program (i) 31,250 common shares to SSH as payment related to each of the first 17 vessels in our Newbuilding Program; (ii) 25,811 common shares to SSH as payment related to each of the next nine vessels in our Newbuilding Program; (iii) 25,633 common shares to SSH as payment related to each of the next ten vessels in our Newbuilding Program; (iv) 26,419 common shares to SSH as payment related to each of the next four Kamsarmax vessels in our Newbuilding Program; (v) 26,185 common shares to SSH as payment related to each of the next three Capesize vessels in our Newbuilding Program; (vi) 26,197 common shares to SSH as payment related to each of the next two vessels in our Newbuilding Program; (vii) 26,396 common shares to SSH as payment related to each of the next seven vessels in our Newbuilding Program; (viii) 26,248 common shares to SSH as payment related to each of the next four vessels in our Newbuilding Program; (ix) 26,111 common shares to SSH as payment related to each of the next four vessels in our Newbuilding Program; (x) 26,050 common shares to SSH as payment related to each of the next three vessels in our Newbuilding Program; (xi) 25,888 common shares to SSH as payment related to each of the next 11 vessels in our Newbuilding Program and (xii) 25,438 common shares to SSH as payment related to each of the next five vessels in our Newbuilding Program. For all vessels added to our Newbuilding Program after the first 17 vessels, the numbernewbuildings. The amount of common shares issuable to SSH as payment is based onpayable was determined by dividing $250,000 by the market value of our common shares based on the volume weighted average price of our common shares over the 30 trading day period immediately preceding the contract date of a definitive agreement to acquire any vessel. As of the date of this annual report, we issued an aggregate of 178,580common shares to SSH in connection with the deliveries of our newbuilding vessels, and expect to issue an additional 2,136 common shares to SSH upon the delivery of the remaining drybulk vessel under construction. In addition, November 2014, SSH agreed to waive its fee on vessel acquisitions contracted after November 20, 2014, for so long as the closing price of our common shares remained below a specified threshold. Effective September 29, 2016, this fee was eliminated on all future acquisitions.
SSH has agreed with us not to own any drybulk carriers greater than 30,000 dwt for so long as the
Amended Administrative Services Agreement is in full force and effect. This agreement may be terminated by SSH
three years after
thisthe third anniversary of our initial public offering upon 12
monthsmonths’ prior written notice or by us with 24 months’ notice.
Transactions with entities controlled by the Lolli-Ghetti family and with Scorpio Tankers (herein referred to as related party affiliates) in the consolidated statement of operations and balance sheet are as follows:
For the year ended December 31, 2016, 2015 and 2014, we had the following balances with related parties, which have been included in the consolidated statement of operations (tabular amounts in thousands of U.S. dollars).
|
| | | | | | | | | | | |
| | For the year ended December 31, |
| | 2016 | | 2015 | | 2014 |
| Vessel revenue | | | | | |
| Scorpio Kamsarmax Pool | $ | 31,319 |
| | $ | 25,151 |
| | $ | 34,986 |
|
| Scorpio Ultramax Pool | 46,227 |
| | 26,338 |
| | 10,196 |
|
| Scorpio Capesize Pool | — |
| | 4,857 |
| | — |
|
| SCM | 856 |
| | 718 |
| | 31 |
|
| Total vessel revenue | $ | 78,402 |
| | $ | 57,064 |
| | $ | 45,213 |
|
| Voyage expense | | | | | |
| SCM | $ | 319 |
| | $ | 664 |
| | $ | 148 |
|
| Vessel operating cost: | | | | | |
| SSM | $ | 7,191 |
| | $ | 2,765 |
| | $ | 122 |
|
| General and administrative expense: | | | | | |
| SCM | $ | 43 |
| | $ | 258 |
| | $ | — |
|
| SSM | — |
| | — |
| | 51 |
|
| SSH | 3,949 |
| | 1,265 |
| | 56 |
|
| SUK | 862 |
| | 486 |
| | 717 |
|
| Total general and administrative expense | $ | 4,854 |
| | $ | 2,009 |
| | $ | 824 |
|
| Write down on assets held for sale | | | | | |
SCM | $ | 500 |
| | $ | 12,465 |
| | $ | — |
|
| SSM | 500 |
| | 13,000 |
| | — |
|
| Total write down on assets held for sale | $ | 1,000 |
| | $ | 25,465 |
| | $ | — |
|
At December 31, 2016 and 2015, we had the following balances with related parties, which have been included in the consolidated balance sheets (tabular amounts and the notes thereto in thousands of U.S. dollars except per share and per vessel data):
|
| | | | | | | |
| | As of December 31, |
| | 2016 | | 2015 |
| Assets | | | |
| Due from related parties-current: | | | |
| Scorpio Kamsarmax Pool | $ | 2,579 |
| | $ | 3,376 |
|
| Scorpio Ultramax Pool | 1,661 |
| | 2,129 |
|
| Scorpio Capesize Pool | — |
| | 2,268 |
|
| SCM | — |
| | 424 |
|
| Total due from related parties-current | $ | 4,240 |
| | $ | 8,197 |
|
| Due from related parties non-current: | | | |
| Scorpio Kamsarmax Pool | $ | 4,606 |
| | $ | 4,868 |
|
| Scorpio Ultramax Pool | 6,633 |
| | 7,657 |
|
| Total due from related parties non-current | $ | 11,239 |
| | $ | 12,525 |
|
| Liabilities | | | |
| Due to related parties-current: | | | |
| SCM | $ | 507 |
| | $ | 3,415 |
|
| SSM | 209 |
| | 4,274 |
|
| SSH | 321 |
| | — |
|
| Less balances due to SCM and SSM included in assets held for sale | — |
| | (7,065 | ) |
| Total due from related parties-current | $ | 1,037 |
| | $ | 624 |
|
Share Issuances
Upon our formation in March 2013,
On June 20, 2016, we issued 1,50023.0 million common shares, to SSH. During July 2013,par value $0.01 per share, at $3.05 per share in an underwritten public offering. SSH purchased an aggregate of 5,250,000 common shares at the public offering price.
On March 22, 2016, we issued 21.0 million common shares, par value $0.01 per share, at $3.00 per share in an underwritten public offering. SSH and soldcertain of our directors purchased an aggregate of 5,030,000 common shares at the public offering price.
On June 16, 2015, we issued 11,083,333 common shares, par value of $0.01 per share at $18.00 per share in an underwritten public offering. SSH and certain of our executive officers purchased an aggregate of 833,333 common shares at the public offering price. On June 23, 2015, underwriters exercised their option to purchase an additional 1,250,0001,662,500 additional common shares toin connection with the public offering.
In November 2014, certain of our executive officers and SSH for $10.0 million as partpurchased an aggregate of a series of Norwegian private transactions exempt from registration under the Securities Act, which are subject to a contractual lock-up until July 2014.345,500 common shares in our November 2014 Private Placement.
| |
| C. | INTERESTS OF EXPERTS AND COUNSEL |
Not applicable.
|
| |
| ITEM 8. | FINANCIAL INFORMATION |
| ITEM 8. |
| A. | FINANCIAL INFORMATION |
| A. | Consolidated Statements and Other Financial Information |
See “Item 18. Financial Statements.”
To our knowledge, we are not currently a party to any lawsuit that, if adversely determined, would have a material adverse effect on our financial position, results of operations or liquidity. As such, we do not believe that pending legal proceedings, taken as a whole, should have any significant impact on our financial statements. From time to time in the future we may be subject to legal proceedings and claims in the ordinary course of business, principally personal injury and property casualty claims. While we expect that these claims would be covered by our existing insurance policies, those claims, even if lacking merit, could result in the expenditure of significant financial and managerial resources. We have not been involved in any legal proceedings which may have, or have had, a significant effect on our financial position, results of operations or liquidity, nor are we aware of any proceedings that are pending or threatened which may have a significant effect on our financial position, results of operations or liquidity.
Dividend Policy
We
While we currently do not intend to pay dividends to the holders of our common shares, but ratherwe continue to invest our available cash in the growth of our fleet and development of our business. We will continue to assess our dividend policy and our board of directors may determine it is in the best interest of the Company to pay dividends in the future. UponAny dividends paid by us will be income to a U.S. shareholder. Please see “Item 10. Additional Information - E. Taxation” for additional information relating to the deliveryU.S. federal income tax treatment of one or more vesselsour dividend payments, if any are declared in the future.
We are a holding company with no material assets other than the equity interests in our
Newbuilding Programwholly-owned subsidiaries. As a result, our ability to pay dividends, if any, depends on our subsidiaries and
dependingtheir ability to distribute funds to us. Our secured credit facilities have restrictions on
prevailing charter market conditions, our
operating resultsability, and
capital requirementsthe ability of certain of our subsidiaries, to pay dividends in the event of a default or breach of covenants under the credit facility agreement. Under such circumstances, we or our subsidiaries may not be able to pay dividends so long as we are in default or have breached certain covenants of the credit facility without our lender’s consent or waiver of the default or breach. In addition, Marshall Islands law generally prohibits the payment of dividends (i) other than from surplus (retained earnings and
other relevant factors, our boardthe excess of
directors will re-evaluate ourconsideration received for the sale of shares above the par value of the shares) or (ii) when a company is insolvent or (iii) if the payment of the dividend
policy.would render the company insolvent.
In addition, we may incur expenses or liabilities, including extraordinary expenses, decreases in revenues, including as a result of unanticipated off-hire days or loss of a vessel, or increased cash needs that could reduce or eliminate the amount of cash that we have available for distribution as dividends.
The declaration and payment of dividends is subject at all times to the discretion of our board of directors. The timing and amount of dividends, if any, depends on our earnings, financial condition, cash requirements and availability, fleet renewal and expansion, restrictions in the loan agreements, the provisions of Marshall Islands law affecting the payment of dividends and other factors.
In addition, since we are a holding company with no material assets other than the shares of our subsidiaries through which we conduct our operations, our ability to pay dividends will depend on our subsidiaries’ distributing to us their earnings and cash flow.
There have been no significant changes since the date of the consolidated financial statements included in this annual report.
|
| |
| ITEM 9. | OFFER AND THE LISTING |
| |
| A. | Offer and Listing Details. |
Our common shares have traded on the
Norwegian OTC List since July 3, 2013 and on the New York Stock Exchange, or NYSE since December 12, 2013 under the symbol “SALT.”
In addition, during the period from July 3, 2013 through July 31, 2014, our common shares minimally traded on the Norwegian OTC under the symbol “SALT.” The following tables settable sets forth the high and low closing prices for our common shares as reported on the Norwegian OTC List for the periods listed below. Shareindicated, as reported by the NYSE.
All share prices
are presented in U.S. dollars per common share basedhave been adjusted to account for the one-for-twelve reverse stock split effected on
the Bloomberg Composite Rate on each day of measurement. On March 26, 2014, the exchange rate between the Norwegian Kroner and the U.S. dollar was NOK6.0525 to one U.S. dollar based on the Bloomberg Composite Rate in effect on that date.| | | NYSE | | | Norwegian OTC List | |
| | | High
(US$) | | | Low
(US$) | | | High
(US$) | | | Low
(US$) | |
| For the Fiscal Year Ended | | | | | | | | | | | | | | | | |
| December 31, 2013 (beginning July 3, 2013) | | $ | 10.18 | | | $ | 9.04 | | | $ | 10.05 | | | $ | 7.95 | |
| | | NYSE | | | Norwegian OTC List | |
| | | High
(US$) | | | Low
(US$) | | | High
(US$) | | | Low
(US$) | |
| For the Quarter Ended | | | | | | | | | | | | | | | | |
| September 30, 2013* | | | — | | | | — | | | | 9.83 | | | | 7.95 | |
| December 31, 2013** | | | 10.18 | | | | 9.04 | | | | 10.05 | | | | 9.40 | |
| March 31, 2014 (through and including March 26, 2014) | | | 10.73 | | | | 9.09 | | | | 10.21 | | | | 9.50 | |
| | | | | | | | | | | | | | | | | |
| * | Period for the Norwegian OTC List begins on July 3, 2013. |
| ** | Period for the NYSE begins on December 12, 2013. |
| | | NYSE | | | Norwegian OTC List | |
| | | High
(US$) | | | Low
(US$) | | | High
(US$) | | | Low
($US$) | |
| For the Month | | | | | | | | | | | | | | | | |
| September 2013 | | | — | | | | — | | | | 9.80 | | | | 9.70 | |
| October 2013 | | | — | | | | — | | | | 10.01 | | | | 9.55 | |
| November 2013 | | | — | | | | — | | | | 9.68 | | | | 9.40 | |
| December 2013*** | | | 10.18 | | | | 9.04 | | | | 10.05 | | | | 9.50 | |
| January 2014 | | | 10.73 | | | | 9.54 | | | | 10.21 | | | | 9.51 | |
| February 2014 | | | 9.99 | | | | 9.09 | | | | 9.71 | | | | 9.71 | |
| March 2014 (through and including March 26, 2014) | | | 10.20 | | | | 9.24 | | | | — | | | | — | |
| *** | Period for the NYSE begins on December 12, 2013 |
|
| | | | | | | | |
| | | NYSE |
| For the Fiscal Year Ended | | High (U.S.$) | | Low
(U.S.$) |
| December 31, 2016 | | $ | 8.34 |
| | $ | 1.84 |
|
| December 31, 2015 | | 33.12 |
| | 7.20 |
|
| December 31, 2014 | | 126.96 |
| | 22.92 |
|
| December 31, 2013 (beginning December 12, 2013) | | 120.60 |
| | 112.56 |
|
|
| | | | | | | | |
| | | NYSE |
| For the Quarter Ended | | High
(U.S.$) | | Low
(U.S.$) |
| | | |
| | |
|
| December 31, 2016 | | $ | 5.80 |
| | $ | 3.39 |
|
| September 30, 2016 | | 3.99 |
| | 2.91 |
|
| June 30, 2016 | | 4.20 |
| | 2.65 |
|
| March 31, 2016 | | 8.34 |
| | 1.84 |
|
| December 31, 2015 | | 19.56 |
| | 7.20 |
|
| September 30, 2015 | | 22.80 |
| | 17.04 |
|
| June 30, 2015 | | 32.16 |
| | 19.08 |
|
| March 31, 2015 | | 33.12 |
| | 15.72 |
|
|
| | | | | | | | |
| | | NYSE |
| For the Month | | High
(U.S.$) | | Low
(U.S.$) |
| | | |
| | |
|
| February 2017 (through and including February 24, 2017) | | $ | 7.90 |
| | $ | 6.80 |
|
| January 2017 | | 7.55 |
| | 5.65 |
|
| December 2016 | | 5.60 |
| | 4.65 |
|
| November 2016 | | 5.80 |
| | 3.50 |
|
| October 2016 | | 3.95 |
| | 3.39 |
|
| September 2016 | | 3.99 |
| | 3.33 |
|
| August 2016 | | 3.49 |
| | 3.04 |
|
Not applicable
Our common shares have traded on the Norwegian OTC List since July 3, 2013 and on the New York Stock Exchange, or NYSE, since December 12, 2013, under the symbol “SALT,” and our 7.50% Senior Notes due 2019 have traded on the NYSE since September 29, 2014 under the symbol “SLTB.” During the period from July 3, 2013 through July 31, 2014, our common shares minimally traded on the Norwegian OTC under the symbol “SALT.”
Not applicable.
Not applicable.
Not applicable.
|
| |
| ITEM 10. | ADDITIONAL INFORMATION |
| ITEM 10. |
| A. | ADDITIONAL INFORMATIONShare capital. |
Not applicable.
Not applicable.
| B. | Memorandum and Articles of Association. |
The following is a description
Our Amended and Restated Articles of
material terms of our amendedIncorporation and
restated articles of incorporation and amended and restated bylaws. Because the following is a summary, it does not contain all information that you may find useful. For more complete information, you should read our amended and restated articles of incorporation and bylaws
copies of which have been filed as Exhibit 3.1 and Exhibit 3.2, respectively, to
theour Registration Statement on Form F-1 (Registration No. 333-192246), declared effective by the SEC on December 11, 2013, and are hereby incorporated by reference into this annual report.
Purpose
Our purpose, as stated in In December 2015, upon receiving shareholder approval, we amended our amendedAmended and restated articlesRestated Articles of incorporation, isIncorporation to engage in any lawful act or activity for which corporations may now or hereafter be organized under the BCA. Our amended and restated articleseffect a one-for-twelve reverse stock split of incorporation and bylaws do not impose any limitations on the ownership rights of our shareholders.
Authorized capitalization
Under our amended and restated articles of incorporation our authorized capital stock consists of 450,000,000 common shares, par value $0.01 per share, and to reduce the total number of which 140,179,301 shares were issued and outstanding as of March 31, 2014, and 50,000,000 preferred shares, par value $0.01 per share, of which no shares are issued and outstanding.
Share history
On March 20, 2013, we issued 1,500authorized common shares to SSH in connection with56,250,000 shares. In June 2016, upon receiving shareholder approval, we amended our initial capitalization.
Between July 1, 2013Amended and July 16, 2013,Restated Articles of Incorporation to increase the aggregate number of shares of capital stock that we issuedare authorized to issue to One Hundred and sold 31,250,000Sixty-Two Million Five Hundred Thousand (162,500,000), consisting of One Hundred and Twelve Million Five Hundred Thousand (112,500,000) common shares, par value $0.01 per share, for net proceeds of $242.8 million; on September 24, 2013, we issued and sold an additional 33,400,000 common shares for net proceeds of $290.5 million; and on October 31, 2013, we issued and sold an additional 32,590,411 common shares for net proceeds of $291.0 million. These common shares were initially sold in offshore transactions to non-U.S. persons pursuant to Regulation S under the Securities Act and in the United States to “qualified institutional buyers” as defined in, and in reliance on Rule 144A of the Securities Act.
In December 2013, we completed our underwritten initial public offering of 31,300,000 common shares at $9.75 per share,resulting in net proceeds to us of approximately $282.9 million, after deducting underwriting discounts and commissions and estimated expenses payable by us. In January 2014, the underwriters’ exercised their option to purchase an additional 4,695,000 common shares, resulting in additional net proceeds to us of approximately $42.6 million, after deducting underwriting discounts and commissions and estimated expenses payable by us.
We have reserved 7,012,391 of our common shares for issuance under the terms and pursuant to the conditions of our Equity Incentive Plan. As of March 31, 2014, we have granted an aggregate of 6,942,390 restricted shares, subject to applicable vesting schedules, under the Equity Incentive Plan.
Common Shares
Each outstanding common share entitles the holder to one vote on all matters submitted to a vote of shareholders. Subject to preferences that may be applicable to any outstandingFifty Million (50,000,000) preferred shares, holders of common shares are entitledpar value $0.01 per share. These amendments to receive ratably all dividends, if any, declared by our board of directors out of funds legally available for dividends. Upon our dissolution or liquidation or the sale of all or substantially all of our assets, after payment in full of all amounts required to be paid to creditors and to the holders of preferred stock having liquidation preferences, if any, the holders of our common shares are entitled to receive pro rata our remaining assets available for distribution. Holders of common shares do not have conversion, redemption or pre-emptive rights to subscribe to any of our securities. The rights, preferences and privileges of holders of our common shares are subject to the rights of the holders of any preferred shares, which we may issue in the future.
Preferred shares
Our amended and restated articles of incorporation authorize our board of directors to establish one or more series of preferred shares and to determine, with respect to any series of preferred shares, the terms and rights of that series, including:
| ● | the designation of the series; |
| ● | the number of shares of the series; |
| ● | the preferences and relative, participating, option or other special rights, if any, and any qualifications, limitations or restrictions of such series; and |
| ● | the voting rights, if any, of the holders of the series. |
Directors
Our directors are elected by a plurality of the votes cast by shareholders entitled to vote. There is no provision for cumulative voting.
Our amended and restated Articles of Incorporation require our board of directors to consist of at least one member. Our board of directors consists of five members. Our amended and restated bylaws may be amended by the vote of a majority of our entire board of directors.
Directors are elected annually on a staggered basis, and each shall serve for a three year term and until his successor shall have been duly elected and qualified, except in the event of his death, resignation, removal, or the earlier termination of his term of office. Our board of directors has the authority to fix the amounts which shall be payable to the members of the board of directors for attendance at any meeting or for services rendered to us.
Shareholder meetings
Under our amended and restated bylaws, annual meetings of shareholders will be held at a time and place selected by our board of directors. The meetings may be held in or outside of the Marshall Islands. Special meetings may be called at any time by a majority of our board of directors, the chairman of our board of directors, an officer of the Company who is also a director. Our board of directors may set a record date between 15 and 60 days before the date of any meeting to determine the shareholders that will be eligible to receive notice and vote at the meeting. One or more shareholders representing at least one-third of the total voting rights of our total issued and outstanding shares present in person or by proxy at a shareholder meeting shall constitute a quorum for the purposes of the meeting.
Dissenters’ rights of appraisal and payment
Under the BCA, our shareholders have the right to dissent from various corporate actions, including any merger or consolidation and the sale of all or substantially all of our assets not made in the usual course of our business, and receive payment of the fair value of their shares. In the event of any further amendment of our amended and restated articles of incorporation, a shareholder also has the right to dissent and receive payment for his or her shares if the amendment alters certain rights in respect of those shares. The dissenting shareholder must follow the procedures set forth in the BCA to receive payment. In the event that we and any dissenting shareholder fail to agree on a price for the common shares, the BCA procedures involve, among other things, the institution of proceedings in the high court of the Republic of The Marshall Islands or in any appropriate court in any jurisdiction in which our shares are primarily traded on a local or national securities exchange.
Shareholders’ derivative actions
Under the BCA, any of our shareholders may bring an action in our name to procure a judgment in our favor, also known as a derivative action, provided that the shareholder bringing the action is a holder of common shares both at the time the derivative action is commenced and at the time of the transaction to which the action relates.
Limitations on liability and indemnification of officers and directors
The BCA authorizes corporations to limit or eliminate the personal liability of directors and officers to corporations and their shareholders for monetary damages for breaches of directors’ fiduciary duties. Our amended and restated articles of incorporation and bylaws include a provision that eliminates the personal liability of directors for monetary damages for actions taken as a director to the fullest extent permitted by law.
Our amended and restated bylaws provide that we must indemnify our directors and officers to the fullest extent authorized by law, provided they acted in good faith and in a manner reasonably believed to be in or not opposed to our best interest (or, in the case of a criminal action, not unlawful). We are also expressly authorized to advance certain expenses (including attorney’s fees and disbursements and court costs) to our directors and officers and carry directors’ and officers’ insurance providing indemnification for our directors, officers and certain employees for some liabilities. We believe that these indemnification provisions and this insurance are useful to attract and retain qualified directors and officers.
The limitation of liability and indemnification provisions in our amended and restated articles of incorporation and bylaws may discourage shareholders from bringing a lawsuit against directors for breach of their fiduciary duty. These provisions may also have the effect of reducing the likelihood of derivative litigation against directors and officers, even though such an action, if successful, might otherwise benefit us and our shareholders. In addition, your investment may be adversely affected to the extent we pay the costs of settlement and damage awards against directors and officers pursuant to these indemnification provisions.
There is currently no pending material litigation or proceeding involving any of our directors, officers or employees for which indemnification is sought.
Anti-takeover effect of certain provisions of our Amended and Restated Articles of Incorporation are filed as exhibits to this annual report.
Information regarding the rights, preferences and
BylawsSeveral provisionsrestrictions attaching to each class of our shares is described in the section entitled “Description of Capital Stock” in the accompanying prospectus to our Registration Statement on Form F-3 (File No. 333-201354) declared effective by the SEC on January 15, 2015, provided that since the date of such Registration Statement, our total issued and outstanding common shares has increased to 75,298,676 as of December 31, 2016.
Stockholders Rights Agreement
On January 14, 2016, we entered into the First Amended and Restated Stockholders Rights Agreement, or the Stockholders Rights Agreement, with Computershare Trust Company, N.A., as Rights Agent, which amended and restated
articlesin its entirety the Stockholders Rights Agreement dated June 18, 2015. Under the Stockholders Rights Agreement, we declared a dividend payable of
incorporationone preferred stock purchase right, or Right, for each outstanding share of our common stock, to our stockholders of record at the close of business on June 29, 2015. Each Right entitled the registered holder to purchase from us a unit consisting of one one-thousandth of a share of our Series A Participating Preferred Stock, par value $0.01 per share. The Rights separate from the common stock and
bylaws, which are summarized below, may have anti-takeover effects. These provisions are intended to avoid costly takeover battles, lessen our vulnerability to a hostile changebecome exercisable after the earlier of
control and enhance(1) the
ability of10th calendar day (or such later date as determined by our board of
directors to maximize shareholder value in connection with any unsolicited offer to acquire us. However, these anti-takeover provisions, which are summarized below, could also discourage, delay or prevent (1)directors) after the
merger or acquisition of us by means of a tender offer, a proxy contest or otherwisepublic announcement that a
shareholder may consider in its best interest andperson or group of affiliated or associated persons has acquired beneficial ownership of 20% or more of shares of our common stock or (2) the
removal of incumbent officers and directors.Blank check preferred stock
Under the terms of our amended and restated articles of incorporation,10th business day (or such later date as determined by our board of directors has authority, without any further votedirectors) after a person or actiongroup announces a tender or exchange offer, that would result in ownership by our shareholders, to issue up to 50,000,000that person or group of 20% or more of shares of blank check preferred stock. Our board of directors may issue preferred shares on terms calculated to discourage, delay or prevent a change of control of us or the removal of our management and might harm the market price of our common shares. Westock. On the distribution date, each holder of a Right would have no current plansbeen entitled to issue any preferred shares.
Electionpurchase for $50.00, or the Exercise Price, a fraction (1/1000th) of one share of our Series A Participating Preferred Stock, which has similar economic terms as one share of our common stock.
If an acquiring person, or an Acquiring Person, acquires more than 20% of the shares of our common stock, then each holder of a Right (except that Acquiring Person) would have been entitled to buy at the Exercise Price, a number of shares of our common stock which had a market value of twice the Exercise Price. Any time after the date an Acquiring Person obtained more than 20% of shares of our common stock and
removalbefore that Acquiring Person acquired more than 50% of
directorsOur amended and restated articles of incorporation prohibit cumulative voting in the election of directors. Our amended and restated bylaws require parties other than the board of directors to give advance written notice of nominations for the election of directors. Our amended and restated articles of incorporation also provide that our directors may be removed for cause upon the affirmative vote of not less than two-thirds of the outstanding shares of our capitalcommon stock, entitled to votewe may have exchanged the Rights, in whole or in part, for those directors. These provisions may discourage, delay or prevent the removal of incumbent officers and directors.
Limited actions by shareholders
Our amended and restated articles of incorporation and our amended and restated bylaws provide that any action required or permitted to be taken by our shareholders must be effectedcommon shares at an annualexchange ratio of one common share per Right, and in certain circumstances, we may have elected to exchange the Rights for cash or special meetingother securities having a value approximately equal to one common share. The Rights expired on the earliest of shareholders(i) June 18, 2016 or by(ii) the unanimous written consent of our shareholders. Our amended and restated articles of incorporation and our amended and restated bylaws provide that, unless otherwise prescribed by law, only a majority of our board of directors, the chairman of our board of directorsredemption or an officerexchange of the Company who is also a director may call special meetings of our shareholdersRights by us as described above. The rights were not redeemed or exchanged and therefore expired on June 18, 2016. We could have redeemed the business transacted at the special meeting is limited to the purposes stated in the notice. Accordingly, a shareholder will be prevented from calling a special meeting for shareholder consideration of a proposal unless scheduled by our board of directors and shareholder consideration of a proposal may be delayed until the next annual meeting.
Advance notice requirements for shareholder proposals and director nominations
Our amended and restated bylaws provide that shareholders seeking to nominate candidates for election as directors or to bring business before an annual meeting of shareholders must provide timely notice of their proposal in writing to the corporate secretary. Generally, to be timely, a shareholder’s notice must be received at our principal executive offices not less than 150 days nor more than 180 days prior to the one year anniversary of the immediately preceding annual meeting of shareholders. Our amended and restated bylaws also specify requirements as to the form and content of a shareholder’s notice. These provisions may impede shareholders’ ability to bring matters before an annual meeting of shareholders or make nominations for directors at an annual meeting of shareholders.
Classified board of directors
As described above, our amended and restated articles of incorporation provide for the division of our board of directors into three classes of directors, with each class as nearly equal in number as possible, serving staggered three year terms beginning on the expiration of the initial term for each class. Accordingly, approximately one-third of our board of directors will be elected each year. This classified board provision could discourage a third party from making a tender offer for our shares or attempting to obtain control of us. It could also delay shareholders who do not agree with the policies of our board of directors from removing a majority of our board of directors for two years.
Business combinations
Although the BCA does not contain specific provisions regarding “business combinations” between companies organized under the laws of the Marshall Islands and “interested shareholders,” we have included these provisions in our amended and restated articles of incorporation. Specifically, our amended and restated articles of incorporation prohibit us from engaging in a “business combination” with certain persons for three years following the date the person becomes an interested shareholder. Interested shareholders generally include:
| ● | any person who is the beneficial owner of 15% or more of our outstanding voting shares; or |
| ● | any person who is our affiliate or associate and who held 15% or more of our outstanding voting shares at any time within three years before the date on which the person’s status as an interested shareholder is determined, and the affiliates and associates of such person. |
Subject to certain exceptions, a business combination includes, among other things:
| ● | certain mergers or consolidations of us or any direct or indirect majority-owned subsidiary of ours; |
| ● | any sale, lease, exchange, mortgage, pledge, transfer or other disposition of our assets or of any subsidiary of ours having an aggregate market value equal to 10% or more of either the aggregate market value of all of our assets, determined on a combined basis, or the aggregate value of all of our outstanding shares; |
| ● | certain transactions that result in the issuance or transfer by us of any shares of ours to the interested shareholder; |
| ● | any transaction involving us or any of our subsidiaries that has the effect of increasing the proportionate share of any class or series of stock, or securities convertible into any class or series of stock, of ours or any such subsidiary that is owned directly or indirectly by the interested shareholder or any affiliate or associate of the interested shareholder; and |
| ● | any receipt by the interested shareholder of the benefit directly or indirectly (except proportionately as a shareholder) of any loans, advances, guarantees, pledges or other financial benefits provided by or through us. |
These provisions of our amended and restated articles of incorporation do not apply to a business combination if:
| ● | before a person became an interested shareholder, our board of directors approved either the business combination or the transaction in which the shareholder became an interested shareholder; |
| ● | upon consummation of the transaction which resulted in the shareholder becoming an interested shareholder, the interested shareholder owned at least 85% of our voting shares outstanding at the time the transaction commenced, other than certain excluded shares; |
| ● | at or following the transaction in which the person became an interested shareholder, the business combination is approved by our board of directors and authorized at an annual or special meeting of shareholders, and not by written consent, by the affirmative vote of the holders of at least two-thirds of our outstanding voting shares that is not owned by the interest shareholder; |
| ● | the shareholder was or became an interested shareholder prior to the closing of our initial public offering; |
| ● | a shareholder became an interested shareholder inadvertently and (i) as soon as practicable divested itself of ownership of sufficient shares so that the shareholder ceased to be an interested shareholder; and (ii) would not, at any time within the three-year period immediately prior to a business combination between us and such shareholder, have been an interested shareholder but for the inadvertent acquisition of ownership; or |
| ● | the business combination is proposed prior to the consummation or abandonment of and subsequent to the earlier of the public announcement or the notice required under our amended and restated articles of incorporation which (i) constitutes one of the transactions described in the following sentence; (ii) is with or by a person who either was not an interested shareholder during the previous three years or who became an interested shareholder with the approval of the board; and (iii) is approved or not opposed by a majority of the members of the board of directors then in office (but not less than one) who were directors prior to any person becoming an interested shareholder during the previous three years or were recommended for election or elected to succeed such directors by a majority of such directors. The proposed transactions referred to in the preceding sentence are limited to: |
| o | a merger or consolidation of us (except for a merger in respect of which, pursuant to the BCA, no vote of our shareholders is required); |
| o | a sale, lease, exchange, mortgage, pledge, transfer or other disposition (in one transaction or a series of transactions), whether as part of a dissolution or otherwise, of assets of us or of any direct or indirect majority-owned subsidiary of ours (other than to any direct or indirect wholly-owned subsidiary or to us) having an aggregate market value equal to 50% or more of either the aggregate market value of all of our assets determined on a consolidated basis or the aggregate market value of all the outstanding shares; or |
| o | a proposed tender or exchange offer for 50% or more of our outstanding voting shares. |
Registration Rights
We have agreed to register for resale up to 10,863,500 of our common shares purchased in one of the Equity Private Placements within 30 days of the request of the holder made at any time afteron or prior to the earlier of the closing10th business day following the public announcement that a person has acquired ownership of 20% or more of shares of our initial public offering orcommon stock. The terms of the commencementRights and the Stockholders Rights Agreement may have been amended to make changes that did not adversely affect the rights of our Exchange Offer.
Transfer agent
the Rights holders (other than the Acquiring Person). The registrar and transfer agent for our common shares is Computershare Inc.
Rights did not have any voting rights. The Rights had the benefit of certain customary anti-dilution protections.
Attached as exhibits to this annual report are the contracts we consider to be both material and outside the ordinary course of business during the two-year period immediately preceding the date of this annual report. We refer you to “Item 4. Information on the
Company—B. Business Overview”Company”, “Item 6. Directors, Senior Management and Employees—B. Compensation” and “Item 7. Major Shareholders and Related Party Transactions—B. Related Party Transactions” for a discussion of these agreements.
Other than as set forth above, there were no material contracts, other than contracts entered into in the ordinary course of business, to which we were a party during the two year period immediately preceding the date of this annual report.
Under Marshall Islands law, there are currently no restrictions on the export or import of capital, including foreign exchange controls or restrictions that affect the remittance of dividends, interest or other payments to non-resident holders of our common shares.
The following is a discussion of the material Marshall Islands and U.S. federal income tax considerations of the ownership and disposition by a U.S. Holder and a Non-U.S. Holder, each as defined below, with respect to the common
share.shares. This discussion does not purport to deal with the tax consequences of owning common shares to all categories of investors, some of which, such as dealers in securities or commodities, financial institutions, insurance companies, tax-exempt organizations, U.S. expatriates, persons liable for the alternative minimum tax, persons who hold common shares as part of a straddle, hedge, conversion transaction or integrated investment, U.S. Holders whose functional currency is not the United States dollar and investors that own, actually or under applicable constructive ownership rules, 10% or more of the Company’s common shares, may be subject to special rules. This discussion deals only with holders who hold the common shares as a capital asset. You are encouraged to consult your own tax advisors concerning the overall tax consequences arising in your own particular situation under U.S. federal, state, local or foreign law of the ownership of common shares.
Marshall Islands Tax Considerations
In the opinion of Seward & Kissel LLP, the following are the material Marshall Islands tax consequences of our activities to us and of our common shares to our shareholders. We are incorporated in the Marshall Islands. Under current Marshall Islands law, we are not subject to tax on income or capital gains, and no Marshall Islands withholding tax will be imposed upon payments of dividends by us to our shareholders.
U.S. Federal Income Tax Considerations
In the opinion of Seward & Kissel LLP, our U.S. counsel, the following are the material U.S. federal income tax consequences of our activities to us, and of the ownership of common shares to U.S. Holders and Non-U.S. Holders, each as defined below. The following discussion of U.S. federal income tax matters is based on the,
U.S. Internal Revenue Code of 1986, as amended, or the Code, judicial decisions, administrative pronouncements, and existing and proposed regulations issued by the U.S. Department of the Treasury, or the Treasury Regulations, all of which are subject to change, possibly with retroactive effect.
U.S. Federal Income Taxation of Operating Income: In General
We anticipate that we will earn substantially all our income from the hiring or leasing of vessels for use on a spot or time charter basis, from participation in a pool or from the performance of services directly related to those uses, all of which we refer to as “shipping income.”
Unless we qualify from an exemption from U.S. federal income taxation under Section 883 of the Code, or Section 883, as discussed below, a foreign corporation will be subject to U.S. federal income taxation on its “shipping income” that is treated as derived from sources within the United States, to which we refer as “U.S. source shipping income.” For U.S. federal income tax purposes, “U.S. source shipping income” includes 50% of shipping income that is attributable to transportation that begins or ends, but that does not both begin and end, in the United States.
Shipping income attributable to transportation exclusively between non-U.S. ports will be considered to be 100% derived from sources entirely outside the United States. Shipping income derived from sources outside the United States will not be subject to any U.S. federal income tax.
Shipping income attributable to transportation exclusively between U.S. ports is considered to be 100% derived from U.S. sources. However, we are not permitted by U.S. law to engage in the transportation that produces 100% U.S. source shipping income.
In the absence of exemption from tax under Section 883, we anticipate that our gross U.S. source shipping income would be subject to a 4% U.S. federal income tax imposed without allowance for deductions, as described below.
Exemption of Operating Income from U.S. Federal Income Taxation
Under Section 883 and the Treasury Regulations thereunder, a foreign corporation will be exempt from U.S. federal income taxation of its U.S. source shipping income if:
(1) it is organized in a “qualified foreign
country”country,” which is one that grants an “equivalent exemption” from tax to corporations organized in the U.S. in respect of each category of shipping income for which exemption is being claimed under Section 883; and
(2) one of the following tests is met: (A) more than 50% of the value of its shares is beneficially owned, directly or indirectly, by “qualified shareholders,” which as defined includes individuals who are “residents” of a qualified foreign country, to which we refer as the “50% Ownership Test”; or (B) its shares are “primarily and regularly traded on an established securities market” in a qualified foreign country or in the United States, to which we refer as the “Publicly-Traded Test.”
The Republic of
Thethe Marshall Islands, the jurisdiction where we are incorporated, has been officially recognized by
the U.S. Internal Revenue Service, or the IRS as a qualified foreign country that grants the requisite “equivalent exemption” from tax in respect of each category of shipping income we earn and currently expect to earn in the future. Therefore, we will be exempt from U.S. federal income taxation with respect to our U.S. source shipping income if we satisfy either the 50% Ownership Test or the Publicly-Traded Test.
Given the widely held nature of our common shares, we do not currently anticipate circumstances under which we would be able to satisfy the 50% Ownership Test.
The Treasury Regulations
promulgated under Section 883 provide, in pertinent part, that shares of a foreign corporation will be considered to be “primarily traded” on an established securities market in a country if the number of shares of each class of stock that are traded during any taxable year on all established securities markets in that country exceeds the number of shares in each such class that are traded during that year on established securities markets in any other single country. Our common shares, which constitute our sole class of issued and outstanding stock, are “primarily traded” on the
New York Stock Exchange, or the NYSE, which is an established market for these purposes.
Under the Treasury Regulations, our common shares will be considered to be “regularly traded” on an established securities market if one or more classes of our shares representing more than 50% of our outstanding stock, by both total combined voting power of all classes of stock entitled to vote and total value, are listed on such market, to which we refer as the “listing threshold.” Our common shares, which constitutes our sole class of issued and outstanding stock, is listed on the NYSE. Accordingly, we will satisfy the listing threshold.
The Treasury Regulations also require that with respect to each class of stock relied upon to meet the listing threshold, (1) such class of stock is traded on the market, other than in minimal quantities, on at least 60 days during the taxable year or one-sixth of the days in a short taxable year, which we refer to as the “trading frequency test”; and (2) the aggregate number of shares of such class of stock traded on such market during the taxable year must be at least 10% of the average number of shares of such class of stock outstanding during such year or as appropriately adjusted in the case of a short taxable year, which we refer to as the “trading volume” test. Even if this were not the case, the Treasury Regulations provide that the trading frequency and trading volume tests will be deemed satisfied if, as is expected to be the case with our common shares, such class of stock is traded on an established securities market in the United States and such shares are regularly quoted by dealers making a market in such shares.
Notwithstanding the foregoing, the Treasury Regulations provide, in pertinent part, that a class of shares will not be considered to be “regularly traded” on an established securities market for any taxable year in which 50% or more of the vote and value of the outstanding shares of such class are owned, actually or constructively under specified share attribution rules, on more than half the days during the taxable year by persons who each own 5% or more of the vote and value of such class of outstanding stock, to which we refer as the “5% Override Rule.”
For purposes of being able to determine the persons who actually or constructively own 5% or more of the vote and value of our common shares, or “5% Shareholders,” the Treasury Regulations permit us to rely on those persons that are identified on
Schedule 13G and Schedule 13D filings with the
U.S. Securities and Exchange Commission,SEC, as owning 5% or more of our common shares. The Treasury Regulations further provide that an investment company
whichthat is registered under the Investment Company Act of 1940, as amended, will not be treated as a 5% Shareholder for such purposes.
In the event the 5% Override Rule is triggered, the Treasury Regulations provide that the 5% Override Rule will nevertheless not apply if we can establish that within the group of 5% Shareholders, qualified shareholders (as defined for purposes of Section 883) own sufficient number of shares to preclude non-qualified shareholders in such group from owning 50% or more of our common shares for more than half the number of days during the taxable year.
We believe that we
satisfysatisfied the Publicly-Traded Test for the
20132016 taxable year and were not subject to the
Five Percent5% Override Rule, and we intend to take that position on our
20132016 U.S. federal income tax returns.
Taxation in Absence of Section 883 Exemption
If the benefits of Section 883 are unavailable, our U.S. source shipping income would be subject to a 4% tax imposed by Section 887 of the Code on a gross basis, without the benefit of deductions, or the “4% gross basis tax regime,” to the extent that such income is not considered to be “effectively connected” with the conduct of a U.S. trade or business, as described below. Since under the sourcing rules described above, no more than 50% of our shipping income would be treated as being U.S. source shipping income, the maximum effective rate of U.S. federal income tax on our shipping income would never exceed 2%
under the(i.e., 50% of 4% gross basis tax
regime.regime).
To the extent our U.S. source shipping income is considered to be “effectively connected” with the conduct of a U.S. trade or business, as described below, any such “effectively connected” U.S. source shipping income, net of applicable deductions, would be subject to U.S. federal income tax, currently imposed at rates of up to 35%. In addition, we would generally be subject to the 30% “branch profits” tax on earnings effectively connected with the conduct of such trade or business, as determined after allowance for certain adjustments, and on certain interest paid or deemed paid attributable to the conduct of our U.S. trade or business.
Our U.S. source shipping income would be considered “effectively connected” with the conduct of a U.S. trade or business only if:
| |
| (1) | we have, or are considered to have, a fixed place of business in the U.S. involved in the earning of U.S. source shipping income; and |
| |
| (2) | substantially all of our U.S. source shipping income is attributable to regularly scheduled transportation, such as the operation of a vessel that follows a published schedule with repeated sailings at regular intervals between the same points for voyages that begin or end in the United States. |
We do not intend to have, or permit circumstances that would result in having, any vessel sailing to or from the United States on a regularly scheduled basis. Based on the foregoing and on the expected mode of our shipping operations and other activities, it is anticipated that none of our U.S. source shipping income will be treated as “effectively connected” with the conduct of a U.S. trade or business.
business, which we refer to as ECI.
U.S. Taxation of Gain on Sale of Vessels
Regardless of whether we qualify for exemption under Section 883, we will not be subject to U.S. federal income tax with respect to gain realized on a sale of a vessel, provided the sale is considered to occur outside of the United States under U.S. federal income tax principles. In general, a sale of a vessel will be considered to occur outside of the U.S. for this purpose if title to the vessel, and risk of loss with respect to the vessel, pass to the buyer outside of the United States. It is expected that any sale of a vessel by us will be considered to occur outside of the United States.
U.S. Federal Income Taxation of U.S. Holders
As used herein, the term “U.S. Holder” means a holder that for U.S. federal income tax purposes is a beneficial owner of common shares and is an individual U.S. citizen or resident, a U.S. corporation or other U.S. entity taxable as a corporation, an estate the income of which is subject to U.S. federal income taxation regardless of its source, or a trust if a court within the U.S. is able to exercise primary jurisdiction over the administration of the trust and one or more U.S. persons have the authority to control all substantial decisions of the trust.
If a partnership holds the common shares, the tax treatment of a partner will generally depend upon the status of the partner and upon the activities of the partnership. If you are a partner in a partnership holding the common shares, you are encouraged to consult your tax advisor.
Subject to the discussion of passive foreign investment companies below, any distributions made by us with respect to our common shares to a U.S. Holder will generally constitute dividends to the extent of our current or accumulated earnings and profits, as determined under U.S. federal income tax principles. Distributions in excess of such earnings and profits will be treated first as a nontaxable return of capital to the extent of the U.S. Holder’s tax basis in
itsour common shares and thereafter as capital gain. Because we are not a U.S. corporation, U.S. Holders that are corporations will not be entitled to claim a dividends received deduction with respect to any distributions they receive from us. Dividends paid with respect to our common shares will generally be treated as foreign source dividend income and will generally constitute “passive category income” for purposes of computing allowable foreign tax credits for U.S. foreign tax credit purposes.
Dividends paid on our common shares to certain non-corporate U.S. Holders will generally be treated as “qualified dividend income” that is taxable to such U.S. Holders at preferential tax rates provided that (1) the common shares are readily tradable on an established securities market in the U.S. (such as the NYSE); (2) we are not a passive foreign investment company for the taxable year during which the dividend is paid or the immediately preceding taxable year (as discussed in detail below); (3) the non-corporate U.S. Holder has owned the common shares for more than 60 days in the 121-day period beginning 60 days before the date on which the common shares become ex-dividend; and (4) certain other conditions are met.
There is no assurance that any dividends paid on our common shares will be eligible for these preferential rates in the hands of such non-corporate U.S. Holders. Any dividends paid by us which are not eligible for these preferential rates will be taxed as ordinary income to a non-corporate U.S. Holder.
Special rules may apply to any “extraordinary dividend”
—generally,-generally, a dividend in an amount which is equal to or in excess of 10% of a shareholder’s adjusted tax basis in a common
share—paidshare-paid by us. If we pay an “extraordinary dividend” on our common shares that is treated as “qualified dividend income,” then any loss derived by certain non-corporate U.S. Holders from the sale or exchange of such common shares will be treated as long term capital loss to the extent of such dividend.
3.8% Tax on Net Investment Income
For taxable years beginning after December 31, 2012, a U.S. Holder that is an individual, estate, or, in certain cases, a trust, will generally be subject to a 3.8% tax on the lesser of (1) the U.S. Holder’s net investment income for the taxable year and (2) the excess of the U.S. Holder’s modified adjusted gross income for the taxable year over a certain threshold (which in the case of individuals will be between $125,000 and $250,000). A U.S. Holder’s net investment income will generally include distributions we make on the common shares which are treated as dividends for U.S. federal income tax purposes and capital gains from the sale, exchange or other disposition of the common shares. This tax is in addition to any income taxes due on such investment income.
If you are a U.S. Holder that is an individual, estate or trust, you are encouraged to consult your tax advisors regarding the applicability of the 3.8% tax on net investment income to your common shares.
Sale, Exchange or Other Disposition of Common Shares
Assuming we do not constitute a passive foreign investment company for any taxable year, a U.S. Holder generally will recognize taxable gain or loss upon a sale, exchange or other disposition of our common shares in an amount equal to the difference between the amount realized by the U.S. Holder from such sale, exchange or other disposition and the U.S. Holder’s tax basis in such shares. Such gain or loss will be treated as long-term capital gain or loss if the U.S. Holder’s holding period is greater than one year at the time of the sale, exchange or other disposition. Such capital gain or loss will generally be treated as U.S. source income or loss, as applicable, for U.S. foreign tax credit purposes. Long-term capital gains of certain non-corporate U.S. Holders are currently eligible for reduced rates of taxation. A U.S. Holder’s ability to deduct capital losses is subject to certain limitations.
Passive Foreign Investment Company Status and Significant Tax Consequences
Special U.S. federal income tax rules apply to a U.S. Holder that holds shares in a foreign corporation classified as a “passive foreign investment company,” or a PFIC, for U.S. federal income tax purposes. In general, we will be treated as a PFIC with respect to a U.S. Holder if, for any taxable year in which such holder holds our common shares, either
| |
| (1) | at least 75% of our gross income for such taxable year consists of passive income (e.g., dividends, interest, capital gains and rents derived other than in the active conduct of a rental business), which we refer to as the income test; or |
| |
| (2) | at least 50% of the average value of our assets during such taxable year produce, or are held for the production of, passive income, which we refer to as the asset test. |
For purposes of determining whether we are a PFIC, cash will be treated as an asset which is held for the production of passive income. In addition, we will be treated as earning and owning our proportionate share of the income and assets, respectively, of any of our subsidiary corporations in which we own at least 25% of the value of the subsidiary’s stock. Income earned, or deemed earned, by us in connection with the performance of services would not constitute passive income. By contrast, rental income would generally constitute “passive income” unless we were treated under specific rules as deriving our rental income in the active conduct of a trade or business.
The PFIC rules contain an exception pursuant to which a foreign corporation will not be treated as a PFIC during its “start-up year.” Under this exception, a foreign corporation will not be treated as a PFIC for the first taxable year the corporation has gross income if (1) no predecessor of the corporation was a PFIC; (2) the corporation satisfies the IRS
It is possible that
it will not be a PFIC for either of the first two taxable years following the start-up year; and (3) the corporation is not in fact a PFIC for either of those taxable years. Wewe may be
able to rely upon the start-up exception to avoid being treated asconsidered a PFIC for our
20132016 taxable year.
However, as discussed below, we may be treated as a PFIC during either our 2014 taxable year or our 2015 taxable year. In addition, there is limited guidance regarding the application of the start-up exception. Therefore, there can be no assurance that we will be able to satisfy the exception.Whether we are treated as a PFIC for our 20132016 taxable year will depend, in part, upon whether the deposits that we make on newbuilding contracts are treated as being held for the production of “passive income” and on the amount of “passive income” that we derive in our 2014 and 20252016 taxable years.year. In making the determination as to whether we are a PFIC, we intend to treat the deposits that we make on our newbuilding contracts as assets which are not held for the production of passive income for purposes of determining whether we are a PFIC. We note that there is no direct authority on this point and it is possible that the IRS may disagree with our position.
After
For our
acquisition of vessels, our status2015 taxable year and subsequent taxable years, whether we will be treated as a PFIC will depend upon the
operationsnature and extent of
those vessels.our operations. In making the determination as to whether we are a PFIC, we intend to treat the gross income
that we derive or
that we are deemed to derive from the spot chartering and time chartering activities of us or any of our subsidiaries as services income, rather than rental income. Correspondingly, such income should not constitute passive income, and the assets that we or our wholly owned subsidiaries own and operate in connection with the production of such income should not constitute passive assets for purposes of determining whether we are a PFIC. We believe that there is substantial legal authority supporting our position consisting of case law and IRS pronouncements concerning the characterization of income derived from time charters and voyage charters as services income for other tax purposes. However, there is also authority which characterizes time charter income as rental income rather than services income for other tax purposes. In the absence of any legal authority specifically relating to the statutory provisions governing PFICs, the IRS or a court could disagree with our position. In addition, although we intend to conduct our affairs in a manner to avoid being classified as a PFIC with respect to any taxable year, we cannot assure you that the nature of our operations will not change in the future.
As discussed more fully below, if we were to be treated as a PFIC for any taxable year, a U.S. Holder would be subject to different taxation rules depending on whether the U.S. Holder makes an election to treat us as a “Qualified Electing Fund,” which election we refer to as a “QEF election.” As an alternative to making a QEF election, a U.S. Holder should be able to make a “mark-to-market” election with respect to our common shares, as discussed below. If we were treated as a PFIC,
for any taxable year ending on or after December 31, 2013, a U.S. Holder will
generally be required to file IRS Form 8621 with respect to
each such taxable year containingits ownership of our common shares, and may be subject to additional U.S. tax or information
regardingreporting obligations in connection with the
Company. We intend to promptly notifyacquisition, holding or disposition of our
shareholders if we determine that we are a PFIC for any taxable year.Taxation of U.S. Holders Making a Timely QEF Election
If a U.S. Holder makes a timely QEF election, which U.S. Holder we refer to as an “Electing Holder,” the Electing Holder must report for U.S. federal income tax purposes its pro rata share of our ordinary earnings and net capital gain, if any, for each of our taxable years during which we are a PFIC that ends with or within the taxable year of the Electing Holder, regardless of whether distributions were received from us by the Electing Holder. No portion of any such inclusions of ordinary earnings will be treated as “qualified dividend income.” Net capital gain inclusions of certain non-corporate U.S. Holders may be eligible for preferential capital gains tax rates. The Electing Holder’s adjusted tax basis in the common shares will be increased to reflect any income included under the QEF election. Distributions of previously taxed income will not be subject to tax upon distribution but will decrease the Electing Holder’s tax basis in the common shares. An Electing Holder would not, however, be entitled to a deduction for its pro rata share of any losses that we incur with respect to any taxable year. An Electing Holder would generally recognize capital gain or loss on the sale, exchange or other disposition of our common shares. A U.S. Holder would make a timely QEF election for our common shares by filing IRS Form 8621 with his U.S. federal income tax return for the first year in which he held such shares when we were a PFIC. If we determine that we are a PFIC for any taxable year, we
wouldintend to provide each U.S. Holder with
allinformation necessary
information in orderfor the U.S. Holder to make the QEF election described above. If we
take the position that we are not a PFIC for any taxable year and it is later determined that we were
a PFIC for such taxable year, it may be possible for a U.S. Holder to make a retroactive QEF election effective in such year. If we were to be treated as a PFIC for our
2013 Taxable Year, our 2014 taxable year and our 20152016 taxable year, we anticipate that, based on our current projections, we would not have a significant amount of taxable income or gain that would be required to be taken into account by U.S. Holders making a QEF election effective for such taxable
years.year.
Taxation of U.S. Holders Making a “Mark-to-Market” Election
Alternatively, if
If we were to be treated as a PFIC for any taxable year and, as we anticipate will be the case, our shares are treated as “marketable stock,” a U.S. Holder would be allowed to make a “mark-to-market” election with respect to our common shares, provided the U.S. Holder completes and files IRS Form 8621 in accordance with the relevant instructions and related Treasury Regulations. If that election is made, the U.S. Holder generally would include as ordinary income in each taxable year the excess, if any, of the fair market value of the common shares at the end of the taxable year over such Holder’s adjusted tax basis in the common shares. The U.S. Holder would also be permitted an ordinary loss in respect of the excess, if any, of the U.S. Holder’s adjusted tax basis in the common shares over its fair market value at the end of the taxable year, but only to the extent of the net amount previously included in income as a result of the mark-to-market election. A U.S. Holder’s tax basis in hisour common shares would be adjusted to reflect any such income or loss amount recognized. Any gain realized on the sale, exchange or other disposition of our common shares would be treated as ordinary income, and any loss realized on the sale, exchange or other disposition of
the common shares would be treated as ordinary loss to the extent that such loss does not exceed the net mark-to-market gains previously included by the U.S. Holder.
Taxation of U.S. Holders Not Making a Timely QEF or Mark-to-Market Election
If we were to be treated as a PFIC for any taxable year, a U.S. Holder who does not make either a QEF election or a “mark-to-market” election for that year,
whomwhich we refer to as a “Non-Electing Holder,” would be subject to special rules with respect to (1) any excess distribution (i.e., the portion of any distributions received by the Non-Electing Holder on the common shares in a taxable year in excess of 125% of the average annual distributions received by the Non-Electing Holder in the three preceding taxable years, or, if shorter, the Non-Electing Holder’s holding period for the common shares), and (2) any gain realized on the sale, exchange or other disposition of our common shares. Under these special rules:
| |
| (1) | the excess distribution or gain would be allocated ratably over the Non-Electing Holder’s aggregate holding period for the common shares; |
| |
| (2) | the amount allocated to the current taxable year, and any taxable year prior to the first taxable year in which we were a PFIC, would be taxed as ordinary income and would not be “qualified dividend income”; and |
| |
| (3) | the amount allocated to each of the other taxable years would be subject to tax at the highest rate of tax in effect for the applicable class of taxpayer for that year, and an interest charge for the deemed tax deferral benefit would be imposed with respect to the resulting tax attributable to each such other taxable year. |
U.S. Federal Income Taxation of “Non-U.S. Holders”
As used herein, the term “Non-U.S. Holder” means a holder that, for U.S. federal income tax purposes, is a beneficial owner of common shares (other than a partnership)
thatand who is not a U.S. Holder.
If a partnership holds our common shares, the tax treatment of a partner will generally depend upon the status of the partner and upon the activities of the partnership. If you are a partner in a partnership holding our common shares, you are encouraged to consult your tax
advisor.adviser.
Dividends on Common Shares
A Non-U.S. Holder generally will not be subject to U.S. federal income or withholding tax on dividends received from us with respect to our common shares, unless that income is effectively connected with the Non-U.S. Holder’s conduct of a trade or business in the United States. In general, if the Non-U.S. Holder is entitled to the benefits of an applicable U.S. income tax treaty with respect to those dividends, that income is taxable only if it is attributable to a permanent establishment maintained by the Non-U.S. Holder in the United States.
Sale, Exchange or Other Disposition of Common Shares
A Non-U.S. Holder generally will not be subject to U.S. federal income or withholding tax on any gain realized upon the sale, exchange or other disposition of our common shares, unless:
| |
| (1) | the gain is effectively connected with the Non-U.S. Holder’s conduct of a trade or business in the United States; in general, in the case of a Non-U.S. Holder entitled to the benefits of an applicable U.S. income tax treaty with respect to that gain, that gain is taxable only if it is attributable to a permanent establishment maintained by the Non-U.S. Holder in the United States; or |
| |
| (2) | the Non-U.S. Holder is an individual who is present in the United States for 183 days or more during the taxable year of disposition and who also meets other conditions are met.conditions. |
Income or Gains Effectively Connected with a U.S. Trade or Business
If the Non-U.S. Holder is engaged in a U.S. trade or business for U.S. federal income tax purposes, dividends on the common shares and
gaingains from the sale, exchange or other disposition of the shares, that
isare effectively connected with the conduct of that trade or business (and, if required by an applicable U.S. income tax treaty, is attributable to a U.S. permanent establishment), will generally be subject to regular U.S. federal income tax in the same manner as discussed in the previous section relating to the taxation of U.S. Holders. In addition, in the case of a corporate Non-U.S. Holder, its earnings and profits that are attributable to the effectively connected income, which are subject to certain adjustments, may be subject to an additional U.S. federal branch profits tax at a rate of 30%, or at a lower rate as may be specified by an applicable U.S. income tax treaty.
Backup Withholding and Information Reporting
In general, dividend payments, or other taxable distributions, and the payment of gross proceeds on a sale or other disposition of our common shares, made within the United States to a non-corporate U.S. Holder will be subject to information reporting. Such payments or distributions may also be subject to backup withholding if the non-corporate U.S. Holder:
| |
| (1) | fails to provide an accurate taxpayer identification number; |
| |
| (2) | is notified by the IRS that it has have failed to report all interest or dividends required to be shown on its U.S. federal income tax returns; or |
| |
| (3) | in certain circumstances, fails to comply with applicable certification requirements. |
Non-U.S. Holders may be required to establish their exemption from information reporting and backup withholding with respect to dividends payments or other taxable distribution on our common shares by certifying their status on an applicable IRS Form W-8. If a Non-U.S. Holder sells our common shares to or through a U.S. office of a broker, the payment of the proceeds is subject to both U.S. backup withholding and information reporting unless the Non-U.S. Holder certifies that it is a non-U.S. person, under penalties of perjury, or it otherwise establish an exemption. If a Non-U.S. Holder sells our common shares through a non-U.S. office of a non-U.S. broker and the sales proceeds are paid outside the U.S., then information reporting and backup withholding generally will not apply to that payment. However, U.S. information reporting requirements, but not backup withholding, will apply to a payment of sales proceeds, even if that payment is made outside the United States, if a Non-U.S. Holder sells our common shares through a non-U.S. office of a broker that is a U.S. person or has some other contacts with the United States. Such information reporting requirements will not apply, however, if the broker has documentary evidence in its records that the Non-U.S. Holder is not a U.S. person and certain other conditions are met, or the Non-U.S. Holder otherwise establishes an exemption.
Backup withholding is not an additional tax. Rather, a refund may generally be obtained of any amounts withheld under backup withholding rules that exceed the taxpayer’s U.S. federal income tax liability by filing a timely refund claim with the IRS.
Individuals who are U.S. Holders (and to the extent specified in applicable Treasury Regulations, Non-U.S. Holders and certain U.S. entities) who hold “specified foreign financial assets” (as defined in Section 6038D of the Code) are required to file IRS Form 8938 with information relating to the asset for each taxable year in which the aggregate value of all such assets exceeds $75,000 at any time during the taxable year or $50,000 on the last day of the taxable year (or such higher dollar amount as prescribed by applicable Treasury Regulations). Specified foreign financial assets would include, among other assets, our common shares, unless the common shares are held in an account maintained with a U.S. financial institution. Substantial penalties apply to any failure to timely file IRS Form 8938, unless the failure is shown to be due to reasonable cause and not due to willful neglect. Additionally, in the event an individual U.S. Holder (and to the extent specified in applicable Treasury Regulations, a Non-U.S. Holder or a U.S. entity) that is required to file IRS Form 8938 does not file such form, the statute of limitations on the assessment and collection of U.S. federal income taxes of such holder for the related tax year may not close until three years after the date that the required information is filed. U.S. Holders (including U.S. entities) and Non-U.S. Holders are encouraged consult their own tax advisors regarding their reporting obligations in respect of our common shares.
| |
| F. | Dividends and paying agents. |
Not applicable.
Not applicable.
We file reports and other information with the SEC. These materials, including this annual report and the accompanying exhibits, may be inspected and copied at the public reference facilities maintained by the CommissionSEC at 100 F Street, N.E. Washington, D.C. 20549, or from the SEC’sits websitehttp://www.sec.gov. You may obtain information on the operation of the public reference room by calling 1 (800) SEC-0330, and you may obtain copies at prescribed rates. Shareholders may also request a copy of our filings at no cost, by writing
or telephoningto us at the following address: 9, Boulevard Charles III, Monaco,
98000.98000 or telephoning us at + 377 9798 5716.
Not applicable.
|
| |
| ITEM 11. | QUANTITATIVE AND QUALITATIVE DISCLOSURES ABOUT MARKET RISK |
Interest Rate Risk
We are exposed to the impact of interest rate changes primarily through our unhedged variable-rate borrowings. Significant increases in interest rates could adversely affect our operating margins, results of operations and our ability to service our debt. As of December 31, 2016, we have variable-rate borrowings totaling $522.4 million. A one percent increase in LIBOR rates would increase our interest payments by $5.2 million per year from January 1, 2017.
Spot Market Rate Risk
The cyclical nature of the tanker industry causes significant increases or decreases in the revenue that we earn from our vessels, particularly those vessels that operate in the spot market or participate in pools that are concentrated in the spot market such as the Scorpio Group Pools. Our owned and chartered-in vessels operated for 13,550 days in the spot market or in the Scorpio Group Pools during 2016. Additionally, we have the ability to remove our vessels from the pools on relatively short notice if attractive time charter opportunities arise. A $1,000 per day increase or decrease in spot rates for all of our vessel classes would have increased or decreased our operating loss by $13.6 million for the year ended December 31, 2016.
Foreign Exchange Rate Risk
Our primary economic environment is the international shipping market. This market utilizes the U.S. dollar as its functional currency. Consequently, virtually all of our revenues and the majority of our operating expenses will be in U.S. dollars. However, we will incur some of our combined expenses in other currencies, particularly the Euro. The amount and frequency of some of these expenses (such as vessel repairs, supplies and stores) may fluctuate from period to period. Depreciation in the value of the U.S. dollar relative to other currencies will increase the U.S. dollar cost of us paying such expenses. The portion of our business conducted in other currencies could increase in the future, which could expand our exposure to losses arising from currency fluctuations.
There is a risk that currency fluctuations will have a negative effect on our cash flows. We have not entered into any hedging contracts to protect against currency fluctuations. However, we have some ability to shift the purchase of goods and services from one country to another and, thus, from one currency to another, on relatively short notice. We may seek to hedge this currency fluctuation risk in the future.
Inflation
We do not expect inflation to be a significant risk to direct expenses in the current and foreseeable economic environment.
|
| |
| ITEM 12. | DESCRIPTION OF SECURITIES OTHER THAN EQUITY SECURITIES |
PART II
|
| |
| ITEM 13. | DEFAULTS, DIVIDEND ARREARAGES AND DELINQUENCIES |
None.
|
| |
| ITEM 14. | MATERIAL MODIFICATIONS TO THE RIGHTS OF SECURITY HOLDERS AND USE OF PROCEEDS |
Use of Proceeds
Our Registration Statement on Form F-1 (Registration No. 333-192246) relating to our underwritten initial public offering of common shares, was declared effective by the SEC on December 11, 2013.The maximum aggregate offering amount registered, following our filing of a Registration Statement on Form F-1MEF (Registration No. 333-192784) to increase the aggregate offering price,was $350,951,250.The offering date of the initial public offering was December 11, 2013 and the initial public offering was completed on December 17, 2013.Deutsche Bank Securities, Credit Suisse and RS Platou Markets AS acted as joint book-running managers for the offering and Evercore, Global Hunter Securities, Stifel and Credit Agricole CIB acted as co-managers for the offering. RS Platou Markets AS is not a U.S. registered broker-dealer and, therefore, only participated in the offering outside of the United States and, to the extent that the offering by RS Platou Markets AS was within the United States, RS Platou Markets AS offered to place common shares with investors through RS Platou Markets, Inc., an affiliated U.S. broker-dealer. The activities of RS Platou Markets AS in the United States were effected only to the extent permitted by Rule 15a-6 under the Exchange Act.
We issued and sold 31,300,000 registered common shares in the initial public offering at a public offering price of $9.75 per share, resulting in net proceeds to us of approximately $282.9 million, after deducting underwriting discounts and commissions and estimated expenses payable by us. In January 2014, the underwriters’ exercised their option to purchase an additional 4,695,000 common shares, resulting in additional net proceeds to us of approximately $42.6 million, after deducting underwriting discounts and commissions and estimated expenses payable by us.
As of the date of this annual report, we have committed substantially all the net proceeds of the initial public offering for general corporate purposes and working capital.
|
| |
| ITEM 15. | CONTROLS AND PROCEDURES |
| ITEM 15. |
| A. | CONTROLS AND PROCEDURES |
| A. | Disclosure Controls and Procedures.Procedures |
We maintain disclosure controls and procedures that are designed to ensure that information required to be disclosed in our reports under the Exchange Act is recorded, processed, summarized and reported within time periods specified in the SEC’s
rules and forms, and that such information is accumulated and communicated to management, including the Chief Executive Officer and Chief Financial Officer, as appropriate, to allow timely decisions regarding required disclosures. Our controls and procedures are designed to provide reasonable assurance of achieving their objectives.
We carried out an evaluation under the supervision, and with the participation of our management, including our Chief Executive Officer and Chief Financial Officer, of the effectiveness of the design and operation of our disclosure controls and procedures (as defined in
Exchange Act RuleRules 13a-15(e) and 15d-15e under the Securities
Act of 1934)Act) as of December 31,
2013.2016. Based upon that evaluation, our Chief Executive Officer and Chief Financial Officer concluded that our disclosure controls and procedures were effective as of December 31,
20132016 to provide reasonable assurance that (1) information required to be disclosed by us in the reports that we file under the Exchange Act is recorded, processed, summarized and reported within the time periods specified in the SEC’s rules and forms, and (2)
that such information is accumulated and communicated to our management, including our Chief Executive Officer and our Chief Financial Officer, as appropriate, to allow timely decisions regarding required disclosures.
There are inherent limitations to the effectiveness of any system of disclosure controls and procedures, including the possibility of human error and the circumvention or overriding of the controls and procedures. Accordingly, even effective disclosure controls and procedures can only provide reasonable assurance of achieving their control objectives.
| |
| B. | Management’s Annual Report on Internal Control Over Financial Reporting. |
This annual report does not include
In accordance with Rule 13a-15(f) of the Exchange Act, the management of the Company is responsible for the establishment and maintenance of adequate internal controls over financial reporting for the Company. Internal control over financial reporting is a
reportprocess designed to provide reasonable assurance regarding the reliability of
management’s assessment regardingfinancial reporting and the preparation of financial statements for external purposes in accordance with generally accepted accounting principles. The Company’s system of internal control over financial reporting
dueincludes those policies and procedures that (i) pertain to
a transition period established by rulesthe maintenance of records that, in reasonable detail, accurately and fairly reflect the transactions and dispositions of the
Securities and Exchange Commission for newly public companies. | C. | Attestation Report of the Registered Public Accounting Firm. |
This annual report does not include an attestation reportassets of the Company; (ii) provide reasonable assurance that transactions are recorded as necessary to permit preparation of financial statements in accordance with generally accepted accounting principles, and that receipts and expenditures of the Company are being made only in accordance with authorizations of management and directors of the Company; and (iii) provide reasonable assurance regarding prevention or timely detection of unauthorized acquisition, use, or disposition of the Company’s assets that could have a material effect on the financial statements. Management has performed an assessment of the effectiveness of the Company’s internal controls over financial reporting as of December 31, 2016 based on the provisions of Internal Control—Integrated Framework issued by the Committee of Sponsoring Organizations of the Treadway Commission or COSO in 2013. Based on our assessment, management determined that the Company’s internal controls over financial reporting were effective as of December 31, 2016 based on the criteria in Internal Control—Integrated Framework issued by COSO (2013).
The Company’s internal control over financial reporting, at December 31, 2016, has been audited by PricewaterhouseCoopers Audit, an independent registered public accounting firm,
due towho also audited the Company’s consolidated financial statements for that year, which are filed as a
transition period established by rulespart of this annual report. PricewaterhouseCoopers Audit has issued an attestation report on management’s assessment of the
Securities and Exchange Commission for newly public companies and emerging growth companies.Company’s internal control over financial reporting. C.Attestation Report of the Registered Public Accounting Firm.
The attestation report of PricewaterhouseCoopers Audit is presented on page F-2 of the Financial Statements filed as part of this annual report.
| |
| D. | Changes in Internal Control Over Financial Reporting. |
None
|
| |
| ITEM 16A. | AUDIT COMMITTEE FINANCIAL EXPERT |
Our Board of Directors has determined that Mr. Einar Michael Steimler,James B. Nish, who serves on the Audit Committee, qualifies as an “audit committee financial expert” and that he is “independent” according to Securities and Exchange CommissionSEC rules.
70 |
| |
| ITEM 16B. | CODE OF ETHICS |
We have adopted a codeCode of ethicsEthics that applies to all entities controlled by the Company and its employees, directors, officers and agents. A copy of our codeCode of ethicsEthics, as in effect on the date hereof, has been filed as an exhibit to our Registration Statement on Form F-1 (Registration No. 333-192246)this annual report and is incorporated by reference herein.
also available on our website at www.scorpiobulkers.com.
Shareholders may also request a copy of our codeCode of ethicsEthics at no cost, by writing to us at 9, Boulevard Charles III, Monaco, 98000 or telephoning us at+ 377 9798 5716.5715.
|
| |
| ITEM 16C. | PRINCIPAL ACCOUNTING FEES AND SERVICES |
Our principal accountant for the fiscal yearyears ended December 31, 20132016 and December 31, 2015 was PricewaterhouseCoopers Audit, and the audit fees for this periodthose periods were $215,000.$283,500 and $268,000, respectively.
None.
During 2016 and 2015, our principal accountant, PricewaterhouseCoopers Audit, provided services related to our public offerings. The fee for these services was approximately $120,100 in 2016 and $45,000 in 2015.
None.
None.
| |
| E. | Audit Committee’s Pre-Approval Policies and Procedures |
Our Audit Committee pre-approves all audit, audit-related and non-audit services not prohibited by law to be performed by our independent auditors and associated fees prior to the engagement of the independent auditor with respect to such services.
| |
| F. | Audit Work Performed by Other Than Principal Accountant if Greater Than 50% |
Not applicable.
|
| |
| ITEM 16D. | EXEMPTIONS FROM LISTING STANDARDS FOR AUDIT COMMITTEES |
Not applicable.
|
| |
| ITEM 16E. | PURCHASES OF EQUITY SECURITIES BY THE ISSUER AND AFFILIATED PURCHASESPURCHASERS |
None.
|
| | | | | | | | | | | | | |
| Name | | Period | | (a) No. of Common Shares Purchased (1) | | (b) Average Price Paid per Common Share | | (c) Total No. of Shares Purchased as Part of Publicly Announced Plans or Programs | | (d) Maximum Number of Common Shares that May Yet Be Purchased Under the Plans or Programs |
| Scorpio Services Holding Ltd. | | January 2016 | | 338,436 |
| | $ | 4.64 |
| | N/A | | N/A |
| Scorpio Services Holding Ltd. | | March 2016 | | 620,465 |
| | $ | 3.75 |
| | N/A | | N/A |
| Robert Bugbee | | March 2016 | | 145,000 |
| | $ | 2.98 |
| | N/A | | N/A |
| Robert Bugbee | | October 2016 | | 195,000 |
| | $ | 3.70 |
| | N/A | | N/A |
(1) These common shares were purchased in the open market.
|
| |
| ITEM 16F. | CHANGE IN REGISTRANT’S CERTIFYING ACCOUNTANT |
None.
|
| |
| ITEM 16G. | CORPORATE GOVERNANCE |
Pursuant to an exception for foreign private issuers, we, as a Marshall Islands company, are not required to comply with the corporate governance practices followed by U.S. companies under the NYSE listing standards. We believe that our established practices in the area of corporate governance are in line with the spirit of the NYSE standards and provide adequate protection to our shareholders. In this respect, we have voluntarily adopted NYSE required practices, such as (i) having a majority of independent directors, (ii) establishing audit, compensation and nominating committees and (iii) adopting a Code of Ethics.
There are two significant differences between our corporate governance practices and the practices required by the NYSE. The NYSE requires that non-management directors meet regularly in executive sessions without management. The NYSE also requires that all independent directors meet in an executive session at least once a year. The Marshall Islands lawLaw and our bylaws do not require our non-management directors to regularly hold executive sessions without management. During 20132016 and through the date of this annual report, our non-management directors met in executive session once.five times. The NYSE requires companies to adopt and disclose corporate governance guidelines. The guidelines must address, among other things: director qualification standards, director responsibilities, director access to management and independent advisers, director compensation, director orientation and continuing education, management succession and an annual performance evaluation. We are not required to adopt such guidelines under Marshall Islands lawLaw and we have not adopted such guidelines.
71 |
| |
| ITEM 16H. | MINE SAFETY DISCLOSURE |
| ITEM 16H. | MINE SAFETY DISCLOSURE |
Not applicable.
PART III
|
| |
| ITEM 17. | FINANCIAL STATEMENTS |
See “Item 18. Financial Statements.”
|
| |
| ITEM 18. | FINANCIAL STATEMENTS |
The financial statements, together with the report of PricewaterhouseCoopers Audit thereon, beginning on page F-1, are filed as a part of this annual report.
Number
| | | Description
|
| | |
| Number | Description |
| |
| 1.1 |
| | Amended and Restated Articles of Incorporation of the Company (1) |
| 1.2 |
| | Amendment to the Amended and Restated Articles of Incorporation of the Company, effective December 30, 2015 (8) |
| 1.3 |
| | 1.2Certificate of Correction to the Amended and Restated Articles of Incorporation of the Company (10) |
| 1.4 |
| | Amendment to the Amended and Restated Articles of Incorporation of the Company, effective June 1, 2016 |
| 1.5 |
| | Amended and Restated Bylaws of the Company (1) |
| |
| 2.1 |
| | Form of Common Share Certificate (1)(10) |
| 2.2 |
| | Base Indenture, dated September 22, 2014, by and between the Company and Deutsche Bank Trust Company Americas, relating to the 7.50% Senior Notes due 2019 (5) |
| 2.3 |
| | First Supplemental Indenture, dated September 22, 2014, by and between the Company and Deutsche Bank Trust Company Americas (5) |
| 4.1 |
| | Master Agreement (1) |
| |
| 4.2 |
| | Administrative Services Agreement (1) |
| |
| 4.3 |
| | Equity Incentive Plan (1) |
| |
| 4.4 |
| | Form of Shipbuilding Contract of Chengxi ShiyardShipyard Co. Ltd (1) |
| |
| 4.5 |
| | Form of Shipbuilding Contract of Dalian COSCO KHI Ship EngingeeringEngineering Co. Ltd. (1) |
| |
| 4.6 |
| | Form of Shipbuilding Contract of Hudong-Zhongdua Shipbuilding (Group) Co., Inc. (1) |
| |
| 4.7 |
| | Form of Shipbuilding Contract of Imabari Shipbuilding Co. Ltd. (1) |
| |
| 4.8 |
| | Form of Shipbuilding Contract of Daewoo Mangalia Heavy Industries S.A. (1) |
| |
| 4.9 |
| | Form of Shipbuilding Contract of Tsuneishi Group (Zhoushan) Shipbuilding Inc. (1) |
| |
| 4.10 |
| | Form of Shipbuilding Contract of Mitsui Engineering & Shipbuilding Co. Ltd. (1) |
| |
| 4.11 |
| | Form of Shipbuilding Contract of Nantong COSCO KHI Ship Engineering Co., Ltd. (1) |
| |
| 4.12 |
| | Form of Shipbuilding Contract of Jiangsu Yangzijian Shipbuilding Co. Ltd. (1) |
| | | | |
| 4.13 |
| | Form of Shipbuilding Contract of Shanghai Jiangnan-Changxing Shipbuilding Co., Ltd. (1) |
| 4.14 |
| | Form of Shipbuilding Contract of Sungdong Shipbuilding & Marine Engineering Co., Ltd. (2) |
| 4.15 |
| | 4.14Form of Shipbuilding Contract of Daehan Shipbuilding Co., Ltd. (2) |
| 4.16 |
| | Registration Rights Agreement, dated November 18, 2014 (4) |
| 4.17 |
| | Share Purchase Agreement, dated December 5, 2013, by and among SBI Zumba Shipping Company Limited, Berkeley Shipping Inc., TCV Management and Trust Services Limited and Belgrave Shipping Limited (1)November 18, 2014 (4) |
| 4.18 | |
| 4.15
| | $67.5 Million Senior Secured Credit Facility (2) |
| 4.19 | Share Purchase
| | $330.0 Million Senior Secured Credit Facility (2) |
| 4.20 |
| | $39.6 Million Senior Secured Credit Facility (2) |
| 4.21 |
| | $409.0 Million Senior Secured Credit Facility (6) |
| 4.22 |
| | $411.3 Million Senior Secured Credit Facility (6) |
| 4.23 |
| | $42.0 Million Senior Secured Credit Facility (6) |
| 4.24 |
| | $26.0 Million Senior Secured Credit Facility (6) |
| 4.25 |
| | $19.8 Million Senior Secured Credit Facility (6) |
| 4.26 |
| | $76.5 Million Senior Secured Credit Facility (10) |
| 4.27 |
| | $12.5 Million Senior Secured Credit Facility (10) |
| 4.28 |
| | $27.3 Million Senior Secured Credit Facility (10) |
| 4.29 |
| | First Amended and Restated Stockholders Rights Agreement(9) |
| 4.30 |
| | Agreement with Institutional Investor(7) |
| 4.31 |
| | Deed of Amendment |
| 4.32 |
| | Amended and Restated Master Agreement |
| 4.33 |
| | First Supplemental Agreement to the $67.5 Million Senior Secured Credit Facility, dated September 14, 2015 |
| 4.34 |
| | Second Supplemental Agreement to the $67.5 Million Senior Secured Credit Facility, dated October 23, 2015 |
| 4.35 |
| | Third Supplemental Agreement to the $67.5 Million Senior Secured Credit Facility, dated April 5, 2016 |
| 4.36 |
| | Fourth Supplemental Agreement to the $67.5 Million Senior Secured Credit Facility, dated June 15, 2016 |
|
| | | |
| Number | Description |
| 4.37 |
| | Fifth Supplemental Agreement to the $67.5 Million Senior Secured Credit Facility, dated December 27, 2016 |
| 4.38 |
| | Letter Agreement, dated September 30, 2015, relating to the $67.5 Million Senior Secured Credit Facility |
| 4.39 |
| | Letter Agreement, dated July 10, 2015, relating to the $330.0 Million Senior Secured Credit Facility |
| 4.40 |
| | Letter Agreement, dated October 27, 2015, relating to the $330.0 Million Senior Secured Credit Facility |
| 4.41 |
| | Letter Agreement, dated April 26, 2016, relating to the $330.0 Million Senior Secured Credit Facility |
| 4.42 |
| | Letter Agreement, dated June 15, 2016, relating to the $330.0 Million Senior Secured Credit Facility |
| 4.43 |
| | Letter Agreement, dated December 5, 2013, by and among SBI Conga Shipping Company Limited, Berkeley Shipping Inc., TCV Management and Trust Services Limited and Cavendish Shipping Limited (1)15, 2016, relating to the $330.0 Million Senior Secured Credit Facility |
|
| 4.44 | 4.16
| | Supplemental Agreement to the $39.6 Million Senior Secured Credit Facility, dated January 14, 2016 |
| 4.45 | Share Purchase
| | Fourth Supplemental Agreement to the $39.6 Million Senior Secured Credit Facility, dated March 29, 2016 |
| 4.46 |
| | Fifth Supplemental Agreement to the $39.6 Million Senior Secured Credit Facility, dated June 15, 2016 |
| 4.47 |
| | Sixth Supplemental Agreement to the $39.6 Million Senior Secured Credit Facility, dated December 22, 2016 |
| 4.48 |
| | First Amendment to the $409.0 Million Senior Secured Credit Facility, dated March 6, 2015 |
| 4.49 |
| | Second Amendment to the $409.0 Million Senior Secured Credit Facility, dated October 21, 2015 |
| 4.50 |
| | Third Amendment to the $409.0 Million Senior Secured Credit Facility, dated December 14, 2015 |
| 4.51 |
| | Fourth Amendment to the $409.0 Million Senior Secured Credit Facility, dated April 7, 2016 |
| 4.52 |
| | Fifth Amendment to the $409.0 Million Senior Secured Credit Facility, dated June 1, 2016 |
| 4.53 |
| | Sixth Amendment to the $409.0 Million Senior Secured Credit Facility, dated August 9, 2016 |
| 4.54 |
| | Seventh Amendment to the $409.0 Million Senior Secured Credit Facility, dated December 14, 2016 |
| 4.55 |
| | Letter Agreement, dated May 8, 2015, relating to the $409.0 Million Senior Secured Credit Facility |
| 4.56 |
| | Letter Agreement, dated January 8, 2016, relating to the $409.0 Million Senior Secured Credit Facility |
| 4.57 |
| | Letter Agreement, dated May 04, 2016, relating to the $42.0 Million Senior Secured Credit Facility |
| 4.58 |
| | Letter Agreement, dated June 28, 2016, relating to the $42.0 Million Senior Secured Credit Facility |
| 4.59 |
| | Letter Agreement, dated January 4, 2017, relating to the $42.0 Million Senior Secured Credit Facility |
| 4.60 |
| | Letter Agreement, dated February 25,2016 relating to the $12.5 Million Senior Secured Credit Facility |
| 4.61 |
| | Letter Agreement, dated June 14, 2016, relating to the $12.5 Million Senior Secured Credit Facility |
| 4.62 |
| | Letter Agreement, dated December 5, 2013, by and among SBI Bolero Shipping Company Limited, Berkeley Shipping Inc., TCV Management and Trust Services Limited and Fitzroy Shipping Limited (1)16, 2016, relating to the $12.5 Million Senior Secured Credit Facility |
| 4.63 | |
| 4.17
| | First Supplemental Agreement to the $27.3 Million Senior Secured Credit Facility, dated April 6, 2016 |
| 4.64 | Share Purchase
| | Second Supplemental Agreement to the $27.3 Million Senior Secured Credit Facility, dated June 2, 2016 |
| 4.65 |
| | Third Supplemental Agreement to the $27.3 Million Senior Secured Credit Facility, dated December 5, 2013, by and among SBI Reggae Shipping Company Limited, Berkeley Shipping Inc., TCV Management and Trust Services Limited and Sloane Shipping Limited (1)30, 2016 |
| |
| 4.18 | | | Share Purchase Agreement, dated December 5, 2013, by and among SBI Sousta Shipping Company Limited, Berkeley Shipping Inc., TCV Management and Trust Services Limited and Bedford Shipping Limited (1) |
| |
| 4.19 | | | Registration Rights Agreement |
| |
| 8.1 |
| | List of Subsidiaries |
| |
| 11.1 |
| | Code of Ethics (1) |
| |
| 12.1 |
| | Rule 13a-14(a)/15d-14(a) Certification of Principal Executive Officer |
| | | | |
| 12.2 |
| | Rule 13a-14(a)/15d-14(a) Certification of Principal Financial Officer |
| | | | |
| 13.1 |
| | Certification of Principal Executive Officer pursuant to 18 U.S.C. Section 1350, as adopted pursuant to Section 906 of the Sarbanes-Oxley Act of 2002 |
| | | | |
| 13.2 |
| | Certification of Principal Financial Officer pursuant to 18 U.S.C. Section 1350, as adopted pursuant to Section 906 of the Sarbanes-Oxley Act of 2002 |
| 15.1 |
| | Consent of Independent Registered Public Accounting Firm |
| 15.2 |
| | Consent of SSY Consultancy & Research Ltd |
| 101. INS |
| | XBRL Instance Document |
| | | | |
| 101. SCH |
| | XBRL Taxonomy Extension Schema |
| | | | |
| 101. CAL |
| | XBRL Taxonomy Extension Schema Calculation Linkbase |
| | | | |
| 101. DEF |
| | XBRL Taxonomy Extension Schema Definition Linkbase |
| | | | |
| 101. LAB |
| | XBRL Taxonomy Extension Schema Label Linkbase |
| | | | |
| 101. PRE |
| | XBRL Taxonomy Extension Schema Presentation Linkbase |
| |
| (1) | Incorporated by reference to the Company’s Registration Statement on Form F-1, which was declared effective by the Securities and Exchange CommissionSEC on December 11, 2013 (File No.333-192246) 333-192246). |
| |
| (2) | Incorporated by reference to the Company’s Registration Statement on Form F-1, which was declared effective by the SEC on September 15, 2015 (File No. 333-197949). |
| |
| (3) | Incorporated by reference to the Company’s Annual Report on Form 20-F, filed with the SEC on April 2, 2014. |
| |
| (4) | Incorporated by reference to the Company’s Report on Form 6-K, filed with the SEC on November 18, 2014. |
| |
| (5) | Incorporated by reference to the Company’s Report on Form 6-K, filed with the SEC on September 25, 2014. |
| |
| (6) | Incorporated by reference to the Company’s Annual Report on Form 20-F, filed with the SEC on April 2, 2015. |
| |
| (7) | Incorporated by reference to the Company’s Report on Form 6-K, filed with the SEC on December 23, 2015. |
| |
| (8) | Incorporated by reference to the Company’s Report on Form 6-K, filed with the SEC on January 4, 2016. |
| |
| (9) | Incorporated by reference to the Company’s Report on Form 6-K, filed with the SEC on January 15, 2016. |
| |
| (10) | Incorporated by reference to the Company’s Annual Report on Form 20-F, filed with the SEC on March 1, 2016. |
The registrant hereby certifies that it meets all of the requirements for filing on Form 20-F and has duly caused and authorized the undersigned to sign this annual report on its behalf.
|
| |
Dated April 2, 2014 | | |
| February 28, 2017 | |
| | Scorpio Bulkers Inc. | |
| | (Registrant) | |
| | |
| | /s/ Emanuele Lauro | |
| | |
| | Emanuele Lauro |
| | Chief Executive Officer |
INDEX TO CONSOLIDATED FINANCIAL STATEMENTS
REPORT OF INDEPENDENT REGISTERED PUBLIC ACCOUNTING FIRM
To the Board of Directors and Shareholders of Scorpio Bulkers Inc.:
In our opinion, the accompanying consolidated balance sheet and the related consolidated statements of operations, changes in shareholders’ equity, and statement of cash flows present fairly, in all material respects, the financial position of Scorpio Bulkers, Inc. and its subsidiaries (a development stage company) at December 31, 2013, and the results of its operations and its cash flows for the period March 20, 2013 (date of inception) to December 31, 2013 in conformity with accounting principles generally accepted in the United States of America. These financial statements are the responsibility of the Company’s management. Our responsibility is to express an opinion on these financial statements based on our audit. We conducted our audit of these statements in accordance with the standards of the Public Company Accounting Oversight Board (United States), which require that we plan and perform the audit to obtain reasonable assurance about whether the financial statements are free of material misstatement. An audit includes examining, on a test basis, evidence supporting the amounts and disclosures in the financial statements, assessing the accounting principles used and significant estimates made by management, and evaluating the overall financial statement presentation. We believe that our audit provides a reasonable basis for our opinion.
/s/ PricewaterhouseCoopers Audit
PricewaterhouseCoopers Audit
April 2, 2014
Monaco, Principality of Monaco
Scorpio Bulkers Inc. and Subsidiaries
(a development stage company)Consolidated Balance Sheet
Sheets
(Dollars in
Thousands, Except Per Share Data)| Assets | | December 31, 2013 | |
| Current assets | | | | |
| Cash and cash equivalents | | $ | 733,896 | |
| Prepaid expenses and other current assets | | | 61 | |
| Total current assets | | | 733,957 | |
| | | | | |
| Non-current assets | | | | |
| Vessels under construction | | | 371,692 | |
| Other assets | | | 35 | |
| Total non-current assets | | | 371,727 | |
| Total assets | | $ | 1,105,684 | |
| | | | | |
| Liabilities and shareholders’ equity | | | | |
| Current liabilities | | | | |
| Accounts payable and accrued expenses | | $ | 1,472 | |
| Total current liabilities | | | 1,472 | |
| | | | | |
| Non-current liabilities | | | — | |
| Total liabilities | | | 1,472 | |
| Shareholders’ equity | | | | |
| Common stock, $0.01 par value per share; authorized 450,000,000 shares; 133,403,931 shares issued and outstanding shares as of December 31, 2013 | | | 1,334 | |
| Paid-in capital | | | 1,109,185 | |
| Deficit accumulated during the development stage | | | (6,307 | ) |
| Total shareholders’ equity | | | 1,104,212 | |
| | | | | |
| Total liabilities and shareholders’ equity | | $ | 1,105,684 | |
| | | | | |
| See notes to consolidated financial statements. | | | | |
thousands, expect per share data)
|
| | | | | | | |
| | As of December 31, |
| | 2016 | | 2015 |
| Assets | | | |
| Current assets | | | |
|
| Cash and cash equivalents | $ | 101,734 |
| | $ | 200,300 |
|
| Due from related parties | 4,240 |
| | 8,197 |
|
| Prepaid expenses and other current assets | 9,506 |
| | 11,247 |
|
| Assets held for sale | — |
| | 172,888 |
|
| Total current assets | 115,480 |
| | 392,632 |
|
| Non-current assets | | | |
|
| Vessels, net | 1,234,081 |
| | 764,454 |
|
| Vessels under construction | 180,000 |
| | 288,282 |
|
| Deferred financing cost, net | 3,307 |
| | 464 |
|
| Other assets | 3,050 |
| | 14,736 |
|
| Due from related parties | 11,239 |
| | 12,525 |
|
| Total non-current assets | 1,431,677 |
| | 1,080,461 |
|
| Total assets | $ | 1,547,157 |
| | $ | 1,473,093 |
|
| | | | |
|
| Liabilities and shareholders’ equity | | | |
|
| Current liabilities | | | |
|
| Bank loans, net | $ | 13,480 |
| | $ | 107,739 |
|
| Accounts payable and accrued expenses | 10,033 |
| | 16,214 |
|
| Due to related parties | 1,037 |
| | 624 |
|
| Total current liabilities | 24,550 |
| | 124,577 |
|
| Non-current liabilities | | | |
|
| Bank loans, net | 493,793 |
| | 342,314 |
|
| Senior Notes, net | 72,199 |
| | 71,671 |
|
| Total non-current liabilities | 565,992 |
| | 413,985 |
|
| Total liabilities | 590,542 |
| | 538,562 |
|
| Commitment and contingencies (Note 7) |
|
| |
|
|
| Shareholders’ equity | | | |
|
| Preferred stock, $0.01 par value; 50,000,000 shares authorized; no shares issued or outstanding | — |
| | — |
|
| Common stock, $0.01 par value per share; authorized 112,500,000 shares; issued and outstanding 75,298,676 and 28,686,561 shares as of December 31, 2016 and December 31, 2015, respectively | 753 |
| | 287 |
|
| Paid-in capital | 1,714,358 |
| | 1,567,905 |
|
| Accumulated deficit | (758,496 | ) | | (633,661 | ) |
| Total shareholders’ equity | 956,615 |
| | 934,531 |
|
| Total liabilities and shareholders’ equity | $ | 1,547,157 |
| | $ | 1,473,093 |
|
See notes to the consolidated financial statements.
Scorpio Bulkers Inc. and Subsidiaries
(a development stage company)Consolidated Statement of Operations
(
DollarsAmounts in
Thousands, Except Per Share Data) | | Period from March | |
| | 20, 2013 (date of | |
| | inception) to | |
| | December 31, 2013 | |
Revenue: | | | | |
Vessel revenue | | $ | — | |
| | | | |
Operating expenses: | | | | |
Voyage expenses | | | — | |
Vessel operating expenses | | | — | |
Depreciation and amortization | | | — | |
General and administrative expenses | | | 5,505 | |
Total operating expenses | | | 5,505 | |
Operating loss | | | (5,505 | ) |
Other income (expense): | | | | |
Interest income | | | 341 | |
Foreign exchange loss | | | (1,135 | ) |
Other expense, net | | | (8 | ) |
Total other loss | | | (802 | ) |
Net loss | | $ | (6,307 | ) |
| | | | |
Weighted-average shares outstanding: | | | | |
Basic | | | 39,925,160 | |
Diluted | | | 39,925,160 | |
| | | | |
Loss per common share: | | | | |
Basic | | $ | (0.16 | ) |
Diluted | | $ | (0.16 | ) |
thousands, except per share data)
|
| | | | | | | | | | | | |
| | | Year Ended December 31, |
| | | 2016 | | 2015 | | 2014 |
| Revenue: | | | | |
| | |
| Vessel revenue | | $ | — |
| | $ | 5,457 |
| | $ | 3,774 |
|
| Vessel revenue-related party pools | | 78,402 |
| | 57,064 |
| | 45,213 |
|
| Total vessel revenue | | 78,402 |
| | 62,521 |
| | 48,987 |
|
| Operating expenses: | | | | |
| | |
|
| Voyage expenses | | (364 | ) | | 123 |
| | 3,579 |
|
| Voyage expenses-related party | | 319 |
| | 664 |
| | 148 |
|
| Vessel operating costs | | 61,641 |
| | 26,607 |
| | 1,478 |
|
| Vessel operating costs-related party | | 7,191 |
| | 2,765 |
| | 122 |
|
| Charterhire expense | | 17,356 |
| | 51,389 |
| | 73,214 |
|
| Charterhire termination | | 10,000 |
| | — |
| | — |
|
| Vessel depreciation | | 36,562 |
| | 14,263 |
| | 686 |
|
| General and administrative expenses | | 29,141 |
| | 33,373 |
| | 30,937 |
|
| General and administrative expenses-related party | | 4,854 |
| | 2,009 |
| | 824 |
|
| Loss / write down on assets held for sale | | 11,433 |
| | 397,472 |
| | 55,487 |
|
| Loss / write down on assets held for sale-related party | | 1,000 |
| | 25,465 |
| | — |
|
| Total operating expenses | | 179,133 |
| | 554,130 |
| | 166,475 |
|
| Operating loss | | (100,731 | ) | | (491,609 | ) | | (117,488 | ) |
| Other income (expense): | | | | |
| | |
|
| Interest income | | 933 |
| | 356 |
| | 1,052 |
|
| Foreign exchange gain (loss) | | (116 | ) | | (12 | ) | | 43 |
|
| Financial expense, net | | (24,921 | ) | | (19,524 | ) | | (172 | ) |
| Total other (loss) income | | (24,104 | ) | | (19,180 | ) | | 923 |
|
| Net loss | | $ | (124,835 | ) | | $ | (510,789 | ) | | $ | (116,565 | ) |
| Weighted-average shares outstanding: | | | | |
| | |
|
| Basic | | 56,174 |
| | 21,410 |
| | 11,466 |
|
| Diluted | | 56,174 |
| | 21,410 |
| | 11,466 |
|
| Loss per common share: | | | | |
| | |
|
| Basic | | $ | (2.22 | ) | | $ | (23.86 | ) | | $ | (10.17 | ) |
| Diluted | | $ | (2.22 | ) | | $ | (23.86 | ) | | $ | (10.17 | ) |
See notes to
the consolidated financial statements.
Scorpio Bulkers Inc. and Subsidiaries
(a development stage company)Consolidated Statement of Changes in Shareholders’ Equity
(Dollars in
Thousands)| | | | | | | | | | | | Deficit | | | | |
| | | | | | | | | | | | accumulated | | | | |
| | | Number of | | | | | | | | | during the | | | | |
| | | shares | | | Common | | | Paid-in | | | development | | | | |
| | | outstanding | | | stock | | | capital | | | stage | | | Total | |
| | | | | | | | | | | | | | | | |
| Balance at March 20, 2013 (date of inception) | | | — | | | $ | — | | | $ | — | | | $ | — | | | $ | — | |
| Net loss | | | | | | | | | | | | | | | (6,307 | ) | | | (6,307 | ) |
| Shares issued upon formation | | | 1,500 | | | | — | | | | — | | | | | | | | — | |
| Net proceeds from common stock offerings: | | | | | | | | | | | | | | | | | | | | |
| Norwegian private placements | | | 97,240,411 | | | | 972 | | | | 823,307 | | | | | | | | 824,279 | |
| Initial public offering | | | 31,300,000 | | | | 313 | | | | 282,568 | | | | | | | | 282,881 | |
| Issuance of shares of restricted stock | | | 4,862,020 | | | | 49 | | | | (49 | ) | | | | | | | — | |
| Restricted stock amortization | | | | | | | | | | | 3,359 | | | | | | | | 3,359 | |
| Balance as of December 31, 2013 | | | 133,403,931 | | | $ | 1,334 | | | $ | 1,109,185 | | | $ | (6,307 | ) | | $ | 1,104,212 | |
thousands)
|
| | | | | | | | | | | | | | | | | | |
| | Number of shares outstanding | | Common stock | | Paid-in capital | | Accumulated deficit | | Total |
| Balance as of December 31, 2013 | 11,116,994 |
| | $ | 1,334 |
| | $ | 1,109,185 |
| | $ | (6,307 | ) | | $ | 1,104,212 |
|
| Net loss | | | | | | | (116,565 | ) | | (116,565 | ) |
| Net proceeds from common stock offering: | | | | | | | | | |
| Overallotment of initial public offering | 391,250 |
| | 47 |
| | 42,298 |
| | — |
| | 42,345 |
|
| Private placement | 3,333,333 |
| | 400 |
| | 145,227 |
| | — |
| | 145,627 |
|
| Common Stock issued to SSH | 4,366 |
| | 1 |
| | 499 |
| | — |
| | 500 |
|
| Issuance of shares of restricted stock | 179,031 |
| | 21 |
| | (21 | ) | | — |
| | — |
|
| Restricted stock amortization | — |
| | — |
| | 23,869 |
| | — |
| | 23,869 |
|
| Balance as of December 31, 2014 | 15,024,974 |
| | $ | 1,803 |
| | $ | 1,321,057 |
| | $ | (122,872 | ) | | $ | 1,199,988 |
|
| Net loss | | | | | | | (510,789 | ) | | $ | (510,789 | ) |
| Net proceeds from common stock offering: | | | | | | | | | |
| Private placement | — |
| | — |
| | 250 |
| | — |
| | 250 |
|
| Public offering | 11,083,333 |
| | 1,330 |
| | 188,343 |
| | — |
| | 189,673 |
|
| Overallotment of public offering | 1,662,500 |
| | 200 |
| | 28,230 |
| | — |
| | 28,430 |
|
| Reverse stock split | (29 | ) | | (3,155 | ) | | 3,155 |
| | — |
| | — |
|
| Common Stock issued to SSH | 111,725 |
| | 13 |
| | 2,367 |
| | — |
| | 2,380 |
|
| Issuance of shares of restricted stock | 804,058 |
| | 96 |
| | (96 | ) | | — |
| | — |
|
| Restricted stock amortization | — |
| | — |
| | 24,599 |
| | — |
| | 24,599 |
|
| Balance as of December 31, 2015 | 28,686,561 |
| | $ | 287 |
| | $ | 1,567,905 |
| | $ | (633,661 | ) | | $ | 934,531 |
|
| Net loss | | | | | | | (124,835 | ) | | (124,835 | ) |
| Net proceeds from common stock offering: | | | | | | | | |
|
| Public offering | 44,000,000 |
| | 440 |
| | 127,672 |
| | — |
| | 128,112 |
|
| Common stock issued to SSH | 51,679 |
| | — |
| | 198 |
| | — |
| | 198 |
|
| Issuance of shares of restricted stock, net of forfitures | 2,560,436 |
| | 26 |
| | (26 | ) | | — |
| | — |
|
| Restricted stock amortization | — |
| | — |
| | 18,609 |
| | — |
| | 18,609 |
|
| Balance as of December 31, 2016 | 75,298,676 |
| | $ | 753 |
| | $ | 1,714,358 |
| | $ | (758,496 | ) | | $ | 956,615 |
|
See notes to
the consolidated financial statements.
Scorpio Bulkers Inc. and Subsidiaries
(a development stage company)Consolidated StatementStatements of Cash Flows
(Dollars in
Thousands)| | | Period from | |
| | | March 20, | |
| | | 2013 (date of | |
| | | inception) to | |
| | | December 31, | |
| | | 2013 | |
| Operating activities | | | | |
| Net loss | | $ | (6,307 | ) |
| Restricted stock amortization | | | 3,359 | |
| Increase in prepaid expenses and other current assets | | | (61 | ) |
| Increase in other assets | | | (35 | ) |
| Increase in accounts payable and accrued expenses | | | 807 | |
| Net cash used in operating activities | | | (2,237 | ) |
| | | | | |
| Investing activities | | | | |
| Payments for vessels under construction | | | (371,692 | ) |
| Net cash used in investing activities | | | (371,692 | ) |
| | | | | |
| Financing activities | | | | |
| Proceeds from issuance of common stock | | | 1,107,825 | |
| Net cash provided by financing activities | | | 1,107,825 | |
| | | | | |
| Increase in cash and cash equivalents | | | 733,896 | |
| Cash at cash equivalents, beginning of period | | | — | |
| Cash and cash equivalents, end of period | | $ | 733,896 | |
thousands)
|
| | | | | | | | | | | |
| | December 31, |
| | 2016 | | 2015 | | 2014 |
| Operating activities | | | |
| | |
| Net loss | $ | (124,835 | ) | | $ | (510,789 | ) | | $ | (116,565 | ) |
| Adjustment to reconcile net loss to net cash used by operating activities: | | | | | |
| Restricted stock amortization | 18,609 |
| | 24,599 |
| | 23,869 |
|
| Vessel depreciation | 36,562 |
| | 14,263 |
| | 686 |
|
| Amortization of deferred financing costs | 4,137 |
| | 1,988 |
| | 150 |
|
| Write off of deferred financing costs | 3,781 |
| | 16,085 |
| | — |
|
| Loss / write down on assets held for sale | 10,555 |
| | 397,472 |
| | 55,487 |
|
| Loss / write down on assets held for sale-related party | — |
| | 25,465 |
| | — |
|
| Changes in operating assets and liabilities: | | | | | |
| Decrease in prepaid expenses and other current assets | (483 | ) | | (4,669 | ) | | (3,811 | ) |
| (Decrease) increase in accounts payable accrued expenses | (6,178 | ) | | 5,372 |
| | 5,014 |
|
| Increase (decrease) in related party balances | 5,656 |
| | (4,928 | ) | | (15,170 | ) |
| Net cash used in operating activities | (52,196 | ) | | (35,142 | ) | | (50,340 | ) |
| Investing activities | | | |
| | |
| Security deposit refunded (paid) on assets held for sale | — |
| | 31,277 |
| | (31,277 | ) |
| Proceeds from sale of assets held for sale | 271,376 |
| | 281,050 |
| | — |
|
| Payments on assets classified as held for sale | (98,445 | ) | | (92,433 | ) | | — |
|
| Payments for vessels and vessels under construction | (408,307 | ) | | (875,970 | ) | | (651,505 | ) |
| Net cash used by investing activities | (235,376 | ) | | (656,076 | ) | | (682,782 | ) |
| Financing activities | | | | | |
| Proceeds from issuance of common stock | 128,112 |
| | 217,997 |
| | 187,615 |
|
| Proceeds from issuance of debt | 247,243 |
| | 489,561 |
| | 33,550 |
|
| Repayments of long term debt | (185,239 | ) | | (62,669 | ) | | — |
|
| Proceeds from Senior Notes offering | — |
| | — |
| | 73,625 |
|
| Debt issue cost paid | (1,110 | ) | | (26,044 | ) | | (22,891 | ) |
| Net cash provided by financing activities | 189,006 |
| | 618,845 |
| | 271,899 |
|
| Decrease in cash and cash equivalents | (98,566 | ) | | (72,373 | ) | | (461,223 | ) |
| Cash at cash equivalents, beginning of period | 200,300 |
| | 272,673 |
| | 733,896 |
|
| Cash and cash equivalents, end of period | $ | 101,734 |
| | $ | 200,300 |
| | $ | 272,673 |
|
| Supplemental cash flow information: | | | | | |
| Interest paid | $ | 22,647 |
| | $ | 12,874 |
| | $ | 1,273 |
|
| Non-cash investing and financing activities | | | | | |
| Amounts payable vessels and vessels under construction | $ | 207 |
| | $ | 2,800 |
| | $ | 7,568 |
|
| Deferred financing cost payable | — |
| | 85 |
| | 532 |
|
| Issuance of common stock | 147 |
| | — |
| | 357 |
|
| Interest capitalized | 6,951 |
| | 11,886 |
| | 1,600 |
|
See notes to the consolidated financial statements.
SCORPIO BULKERS INC. AND SUBSIDIARIES
Notes to the Consolidated Financial Statements
(
a development stage company)Dollars in thousands, except per share, per day and per vessel data)
NOTES TO THE CONSOLIDATED FINANCIAL STATEMENTSAS OF DECEMBER 31, 2013
(DOLLARS IN THOUSANDS, EXCEPT PER SHARE, PER DAY AND PER VESSEL DATA)
1. General information and significant accounting policies
| |
| 1. | Organization and Basis of Presentation |
Scorpio Bulkers Inc. and its subsidiaries (together “we”, “us”
, “our” or the “Company”) is
aan international shipping company
formed for the purpose of acquiringthat owns and
operatingoperates the latest generation newbuilding drybulk carriers with fuel-efficient specifications and carrying capacities of greater than 30,000 dwt in the international shipping markets. Scorpio Bulkers Inc. was incorporated in the Republic of the Marshall Islands on March 20, 2013.
As at the report date, which wasof December 31, 2013,2016, the Company owned 42 vessels (consisting of 16 Kamsarmax vessels and 26 Ultramax vessels) and has ordered 79six newbuilding drybulk carriers, which it intends to operate. The planned principal operationsoperate, under construction. Five of the Companynewbuilding drybulk carriers are to be delivered in the first quarter of 2017 and the final newbuilding drybulk carrier is expected to be delivered in the second quarter of 2017.
Our vessels are commercially managed by Scorpio Commercial Management S.A.M., or SCM, which is majority owned by the Lolli-Ghetti family of which, Emanuele Lauro, our Chairman and Chief Executive Officer, and Filippo Lauro, our Vice President, are members. SCM’s services include securing employment, in pools, in the spot market and on time charters.
Our vessels are technically managed by Scorpio Ship Management S.A.M., or SSM, which is majority owned by the Lolli-Ghetti family. SSM facilitates vessel support such as crew, provisions, deck and engine stores, insurance, maintenance and repairs, and other services as necessary to operate the vessels such as drydocks and vetting/inspection under a technical management agreement.
We also have not yet commencedan administrative services agreement with Scorpio Services Holding Limited, or SSH, which is majority owned by the Lolli-Ghetti family. The administrative services provided under this agreement primarily include accounting, legal compliance, financial, information technology services, the provision of administrative staff and no revenue hasoffice space. Under the administrative services agreement, we also reimburse SSH for any direct or indirect expenses that they incur in providing these services.
Basis of accounting
The consolidated financial statements and accompanying notes have been produced. The Company is considered a development stage company underprepared in accordance with accounting principles generally accepted in the United States of America, (“or U.S. GAAP”).BasisGAAP. All intercompany accounts and transactions have been eliminated in consolidation. The consolidated financial statements reflect all adjustments which, in the opinion of management, are necessary for the fair presentation of results. Pursuant to ASU 2015-03, “Simplifying the Presentation of Debt Issuance Costs”, certain reclassifications have been made to prior years’ Deferred financing costs, net, Bank loans, net and Senior Notes, net to conform to current year presentation. See “Recently adopted accounting standards”
below for additional information on these reclassifications.
Other comprehensive income is net income and thus not presented separately.
Reverse stock split
On December 31, 2015, the Company effected a one-for-twelve reverse stock split. All share and per share information has been retroactively adjusted to reflect the reverse stock split. The accompanyingpar value was not adjusted as a result of the reverse stock split.
Going concern
The Company’s revenue is primarily derived from pool revenue. The bulker shipping industry is volatile and has been experiencing a sustained cyclical downturn. If the downturn continues, this could have a material adverse effect on the Company’s business, financial condition, results of operations and cash flows.
The fair market values of the Company’s vessels also experience high volatility. The fair market value of the vessels may increase or decrease depending on a number of factors including, but not limited to, the prevailing level of charter rates and day rates, general economic and market conditions affecting the international shipping industry, types, sizes and ages of vessels, supply and demand for vessels, availability of or developments in other modes of transportation, competition from other shipping companies, cost of newbuildings, governmental or other regulations and technological advances. In addition, as vessels grow older, they generally decline in value. If the fair market value of vessels declines, the Company may not be in compliance with certain
SCORPIO BULKERS INC. AND SUBSIDIARIES
Notes to the Consolidated Financial Statements
(Dollars in thousands, except per share, per day and per vessel data)
provisions of its credit facilities and it may not be able to refinance its debt. The prepayment of certain credit facilities may be necessary for the Company to maintain compliance with certain covenants in the event that the value of its vessels falls below a certain level. Additionally, if the Company sells one or more of its vessels at a time when vessel prices have fallen, the sale price may be less than the vessel’s carrying value on its consolidated financial statements, resulting in a loss on sale or an impairment loss being recognized, ultimately leading to a reduction in earnings. Furthermore, if vessel values fall significantly, this could indicate a decrease in the recoverable amount for the vessel which may result in an impairment adjustment in the carrying value of the vessel.
As described in Note 7, the Company has commitments to pay for its vessels currently under construction that may exceed the amount of financing presently secured for these which could have an adverse effect on the Company’s business, financial condition, results of operations and cash flows.
These consolidated financial statements have been prepared on a going concern basis, which contemplates the realization of assets and the satisfaction of liabilities in accordancethe normal course of business. The consolidated financial statements do not include any adjustments relating to the recoverability and classification of recorded assets, nor to the amounts and classification of liabilities that may be necessary should the Company be unable to continue as a going concern.
Significant Accounting Policies
Principles of Consolidation
The consolidated financial statements represent the consolidation of the accounts of Scorpio Bulkers Inc. and its subsidiaries in conformity with U.S. GAAP. All intercompany accounts and transactions have been eliminated in consolidation.
Significant Investments in unconsolidated companies (generally 20 to 50 percent ownership), in which the Company has the ability to exercise significant influence but neither has a controlling interest nor is the primary beneficiary, are accounted for under the equity method. Investments in entities in which the Company does not have the ability to exercise significant influence are accounted for under the cost method. Under certain criteria indicated in Accounting Policies
Additional information—Development stage company
The preparation of financial statements in conformity with U.S. GAAP requiresStandards Codification ("ASC") 810, Consolidation, a partially-owned affiliate would be consolidated as a variable interest entity when it has less than a 50% ownership if the disclosure of certain information applicable to development stage companies:
| ● | | The balance sheet includes cumulative net losses under the caption “Deficit accumulated during the development stage” in shareholders’ equity; |
| ● | | The statement of changes in shareholders’ equity shows the changes in components of shareholders’ equity for each period and, in addition, cumulative amounts from the Company’s inception; and |
| ● | | The statement of cash flows shows the sources and uses of financial resources for each period for which an income statement is presented and, in addition, cumulative amounts from the company’s inception. |
The Company was incorporated on March 20, 2013 hencethe primary beneficiary of that entity. At the present time, there is only one period reportedare no interests in these financial statements.
variable interest entities.
The preparation of financial statements in conformity with U.S. GAAP requires management to make estimates and assumptions that affect the reported amounts of assets,
liabilities, revenues and
liabilitiesexpenses and disclosures of contingent assets,
liabilities, revenues and
liabilities at the date of the financial statements and the reported amounts of expenses during the reporting period.expenses. Actual results could differ from those results. In addition to the estimates noted above, significant estimates will include vessel valuations, the valuation of amounts due from charterers, residual value of vessels, useful life of vessels, and residual value of vessels.
Revenue recognition
Vessel revenue is measured at the fair value of
derivative instruments.Cashthe consideration received or receivable and cash equivalents
Cash and cash equivalents comprise cash on hand and demand deposits,represents amounts receivable for services provided in the normal course of business, net of discounts, and other short-term highly-liquid investmentssales-related or value added taxes.
Vessel revenue is comprised of either pool revenue, time charter revenue and voyage revenue.
Pool revenue for each vessel is determined in accordance with original maturitiesthe profit sharing terms specified within each pool agreement. In particular, the pool manager aggregates the revenues and expenses of three months or less,all of the pool participants and distributes the net earnings to participants based on:
the pool points (vessel attributes such as cargo carrying capacity, fuel consumption, and construction characteristics are taken into consideration); and
the number of days the vessel participated in the pool in the period.
Time charter revenue is recognized ratably as services are performed based on the daily rates specified in the time charter contract. We do not recognize revenue when a vessel is off hire.
SCORPIO BULKERS INC. AND SUBSIDIARIES
Notes to the Consolidated Financial Statements
(Dollars in thousands, except per share, per day and per vessel data)
Voyage charter agreements are charter hires, where a contract is made in the spot market for the use of a vessel for a specific voyage for a specified charter rate. Revenue from voyage charter agreements is recognized on a pro rata basis based on the relative transit time in each period. The period over which voyage revenues are recognized commences at the time the vessel departs from its last discharge port and ends at the time the discharge of cargo at the next discharge port is completed. We do not begin recognizing revenue until a charter has been agreed to by the customer and us, even if the vessel has discharged its cargo and is sailing to the anticipated load port on its next voyage. Estimated losses on voyages are provided for in full at the time such losses become evident. In the application of this policy, we do not begin recognizing revenue until (i) the amount of revenue can be measured reliably, (ii) it is probable that the economic benefits associated with the transaction will flow to the entity, (iii) the transactions’ stage of completion at the balance sheet date can be measured reliably and (iv) the costs incurred and the costs to complete the transaction can be measured reliably.
We recognize pool revenue when the vessel has participated in a pool during the period and the amount of pool revenue can be estimated reliably. We receive estimated vessel earnings based on the known number of days the vessel has participated in the pool, the contract terms, and the estimated pool revenue.
Voyage expenses
Voyage expenses, which primarily include bunkers, port charges, canal tolls, cargo handling operations and brokerage commissions paid by us under voyage charters, brokerage commissions and miscellaneous voyage expenses that the Company is unable to recoup under time charter and pool arrangements, as well as credits for intermediary hold cleaning are expensed as incurred.
Charterhire expense
Charterhire expense is the amount we pay the owner for time chartered-in vessels. The amount is usually for a fixed period of time at charter rates that are readily convertiblegenerally fixed, but may contain a variable component based on drybulk indices, inflation, interest rates, profit sharing, or current market rates. The vessel’s owner is responsible for crewing and other vessel operating costs. Charterhire expense is recognized ratably over the charterhire period.
Operating leases
Costs in respect of operating leases are charged to the Consolidated Statement of Operations on a known amount of cashstraight line basis over the lease term.
Vessel operating costs
Vessel operating costs, which include crewing, repairs and maintenance, insurance, stores, lube oils, communication expenses, and technical management fees, are subjectexpensed as incurred.
Technical management fees are paid to SSM (See Note 13). Pursuant to an
insignificant riskagreement, or the Master Agreement, SSM provides us with technical services, and we provide them with the ability to subcontract technical management of
changes in value. The carrying value of cash and cash equivalents approximates fair value due to the short-term nature of these instruments.our vessels with our approval.
The individual financial statements of Scorpio Bulkers Inc. and each of its subsidiaries are presented in the currency of the primary economic environment in which we operate (its functional currency), which in all cases is U.S. dollars. For the purpose of the consolidated financial statements, our results and financial position are also expressed in U.S. dollars.
In preparing the financial statements of Scorpio Bulkers Inc. and each of its subsidiaries, transactions in currencies other than the U.S. dollar are recorded at the rate of exchange prevailing on the dates of the transactions. Any change in exchange rate between the date of recognition and the date of settlement may result in a gain or loss which is recognizedincluded in the consolidated statementConsolidated Statement of operations.Operations. At the end of each reporting period, monetary assets and liabilities denominated in other currencies are retranslated into the functional currency at rates ruling at that date. All resultant exchange differences are included in the Consolidated Statement of Operations.
SCORPIO BULKERS INC. AND SUBSIDIARIES
Notes to the Consolidated Financial Statements
(Dollars in thousands, except per share, per day and per vessel data)
Cash and cash equivalents
Cash and cash equivalents are comprised of cash on hand and demand deposits, and other short-term highly-liquid investments with original maturities of three months or less, and that are readily convertible to a known amount of cash and are subject to an insignificant risk of changes in value.
Inventories
Inventories, which are included in prepaid expenses and other current assets in the Consolidated Balance Sheet, consists mainly of lubricating oils, and are stated at the lower of cost or net realizable value. Cost is determined using the first in first out method.
Assets held for sale
Assets held for sale include vessels and contracts for the construction of vessels and are classified in accordance with ASC 360, Property, Plant, and Equipment. The Company considers such assets to be held for sale when all of the following criteria are met:
management commits to a plan to sell the property;
it is unlikely that the disposal plan will be significantly modified or discontinued;
the property is available for immediate sale in its present condition;
actions required to complete the sale of the property have been recognizedinitiated;
sale of the property is probable and we expect the completed sale will occur within one year; and
the property is actively being marketed for sale at a price that is reasonable given its current market value.
Upon designation as an asset held for sale, the Company records the asset at the lower of its carrying value or its estimated fair value, less estimated costs to sell, and, if the asset is a vessel, the Company ceases depreciation.
Vessels, net
Vessels, net is stated at historical cost less accumulated depreciation. Included in
vessel costs are acquisition costs directly attributable to the
consolidated statementacquisition of
operations.a vessel including capitalized interest and expenditures made to prepare the vessel for its initial voyage. Vessels are depreciated to their residual value on a straight-line basis over their estimated useful lives of 25 years from the date the vessel is ready for its first voyage. The estimated useful life of 25 years is management’s best estimate and is also consistent with industry practice for similar vessels. The residual value is estimated as the lightweight tonnage of each vessel multiplied by a estimated scrap value per ton. The scrap value per ton is estimated taking into consideration the historical four years average scrap market rates at the balance sheet date.
When regulations place limitations over the ability of a vessel to trade on a worldwide basis, or when the cost of complying with such regulations is not expected to be recovered, we will adjust the vessel’s useful life to end at the date such regulations preclude such vessel’s further commercial use.
The carrying value of the Company’s vessels does not represent the fair market value of such vessels or the amount it could obtain if it were to sell any of its vessels, which could be more or less. Under U.S. GAAP, the Company would not record a loss if the fair market value of a vessel (excluding its charter) is below our carrying value unless and until it determines to sell that vessel or the vessel is impaired as discussed below under “Impairment of long-lived assets held for use.”
Vessels under construction
Vessels under construction are measured at cost and include costs incurred that are directly attributable to bringing the asset to the location and condition necessary for it to be capable of operating in the manner intended by management. These costs include installment payments made to the shipyards,
directly attributable financing costs,capitalized interest, professional fees and other costs deemed directly attributable to the construction of the asset.
Earnings per share
Basic earnings per share is calculated by dividing the net income attributable to equity holders of the common shares by the weighted average number of common shares outstanding. Diluted earnings per share are calculated by adjusting the net income attributable to equity holders of the parent and the weighted average number of common shares used for calculating basic per share for the effects of all potentially dilutive shares. Such dilutive common shares are excluded when the effect would be to increase earnings per share or reduce a loss per share.
Restricted stock
We follow ASC Subtopic 718-10, “Compensation—Stock Compensation” (“ASC 718-10”), for restricted stock issued under our equity incentive plans. Stock-based compensation costs from restricted stock are classified as a component of additional paid-in capital. The restricted stock awards granted to our employees and directors contain only service conditions and are classified as equity settled. Accordingly, the fair value of our restricted stock awards is calculated by multiplying the share price on the grant date and the number of restricted stock shares granted that are expected to vest. We believe that the share price at the grant date serves as a proxy for the fair value of services to be provided by the employees and directors under the plan.
Compensation expense related to the awards is recognized ratably over the vesting period, based on our estimate of the number of awards that will eventually vest. The vesting period is the period during which an employee or director is required to provide service in exchange for an award and is updated at each balance sheet date to reflect any revisions in estimates of the number of awards expected to vest as a result of the effect of non-market-based vesting conditions.
The following are accounting policies that the Company will adopt going forward.
Once the planned operations of the Company commence, the following accounting policies will be relevant.
Revenue recognition
Vessel revenue is measured at the fair value of the consideration received or receivable and represents amounts receivable for services provided in the normal course of business, net of discounts, and other sales-related or value added taxes.
Vessel revenue is comprised of either time charter revenue, voyage revenue and/or pool revenue.
| (1) | Time charter revenue is recognized ratably as services are performed based on the daily rates specified in the time charter contract. We do not recognize revenue when a vessel is off hire. |
| (2) | Voyage charter agreements are charter hires, where a contract is made in the spot market for the use of a vessel for a specific voyage for a specified charter rate. Revenue from voyage charter agreements is recognized on a pro rata basis based on the relative transit time in each period. The period over which voyage revenues are recognized commences at the time the vessel departs from its last discharge port and ends at the time the discharge of cargo at the next discharge port is completed. We do not begin recognizing revenue until a charter has been agreed to by the customer and us, even if the vessel has discharged its cargo and is sailing to the anticipated load port on its next voyage. Estimated losses on voyages are provided for in full at the time such losses become evident. In the application of this policy, we do not begin recognizing revenue until (i) the amount of revenue can be measured reliably, (ii) it is probable that the economic benefits associated with the transaction will flow to the entity, (iii) the transactions’ stage of completion at the balance sheet date can be measured reliably and (iv) the costs incurred and the costs to complete the transaction can be measured reliably. |
| (3) | Pool revenue for each vessel is determined in accordance with the profit sharing terms specified within each pool agreement. In particular, the pool manager aggregates the revenues and expenses of all of the pool participants and distributes the net earnings to participants based on: |
| ● | the pool points (vessel attributes such as cargo carrying capacity, fuel consumption, and construction characteristics are taken into consideration); and |
| ● | the number of days the vessel participated in the pool in the period. |
We recognize pool revenue on a monthly basis, when the vessel has participated in a pool during the period and the amount of pool revenue for the month can be estimated reliably. We receive estimated vessel earnings based on the known number of days the vessel has participated in the pool, the contract terms, and the estimated monthly pool revenue. On a quarterly basis, we receive a report from the pool which identifies the number of days the vessel participated in the pool, the total pool points for the period, the total pool revenue for the period, and the calculated share of pool revenue for the vessel. We review the quarterly report for consistency with each vessel’s pool agreement and vessel management records. The estimated pool revenue is reconciled quarterly, coinciding with our external reporting periods, to the actual pool revenue earned, per the pool report. Consequently, in our financial statements, reported revenues represent actual pooled revenues. While differences do arise in the performance of these quarterly reconciliations, such differences are not material to total reported revenues.
Voyage expenses
Voyage expenses, which primarily include bunkers, port charges, canal tolls, cargo handling operations and brokerage commissions paid by us under voyage charters are expensed as incurred.
Vessel operating costs
Vessel operating costs, which include crewing, repairs and maintenance, insurance, stores, lube oils, communication expenses, and technical management fees, are expensed as incurred. Expenses for repairs and maintenance tend to fluctuate from period to period because most repairs and maintenance typically occur during periodic drydocking. We expect these expenses to increase as our fleet matures and to the extent that it expands.
Additionally, these costs include technical management fees that we pay to Scorpio Ship Management S.A.M. (“SSM”). (See Note 10.) Pursuant to an agreement, or the Master Agreement, SSM provides us with technical services, and we provide them with the ability to subcontract technical management of our vessels with our approval.
Charterhire expense
Charterhire expense is the amount we pay the owner for time chartered-in vessels. The amount is usually for a fixed period of time at charter rates that are generally fixed, but may contain a variable component based on inflation, interest rates, profit sharing, or current market rates. The vessel’s owner is responsible for crewing and other vessel operating costs. Charterhire expense is recognized ratably over the charterhire period.
Operating leases
Costs in respect of operating leases are charged to the consolidated statement of operations on a straight line basis over the lease term.
Income tax
Scorpio Bulkers Inc. and its subsidiaries are incorporated in the Republic of the Marshall Islands, and in accordance with the income tax laws of the Marshall Islands, are not subject to Marshall Islands’ income tax. We are also exempt from income tax in other jurisdictions including the United States of America due to tax treaties; therefore, we will not have any tax charges, benefits, or balances.
Vessels, net
Vessels, net is stated at historical cost less accumulated depreciation. Included in vessel costs are acquisition costs directly attributable to the acquisition of a vessel and expenditures made to prepare the vessel for its initial voyage. The Company also capitalizes interest costs for a vessel under construction as a cost which is directly attributable to the acquisition cost of a vessel. Vessels are depreciated on a straight-line basis over their estimated useful lives, determined to be 25 years from the date of initial delivery from the shipyard. Vessels under construction are not depreciated until such time as they are ready for use. Depreciation is based on cost lessdepreciated.
SCORPIO BULKERS INC. AND SUBSIDIARIES
Notes to the estimated residual value which is the lightweight tonnage of eachConsolidated Financial Statements
(Dollars in thousands, except per share, per day and per vessel
multiplied by scrap value per ton. The scrap value per ton is estimated taking into consideration the historical four year average scrap market rates at the balance sheet date with changes accounted for in the period of change and in future periods. Deferred drydocking costs
The vessels are required to undergo planned drydocks for replacement of certain components, major repairs and maintenance of other components, which cannot be carried out while the vessels are operating, approximately every 30 months or 60 months depending on the nature of work and external requirements. These drydock costs are capitalized and depreciated on a straight-line basis over the estimated period until the next drydock. When the drydock expenditure is incurred prior to the expiry of the period, the remaining balance is expensed.
The Company had no drydocking activity during the three years ended December 31, 2016.
We only include in deferred drydocking those direct costs that are incurred as part of the drydocking to meet regulatory requirements, or are expenditures that add economic life to the vessel, increase the vessel’s earnings capacity or improve the vessel’s efficiency. Direct costs include shipyard costs as well as the costs of placing the vessel in the shipyard; cost of travel, lodging and subsistence of personnel sent to the drydocking site to supervise; and the cost of hiring a third party to oversee the drydocking. Expenditures for normal maintenance and repairs, whether incurred as part of the drydocking or not, are expensed as incurred.
Other assets
Other assets consist primarily of deferred financing costs relating to lines of credit and loan facilities that have not yet been drawn down. As the loan facilities are drawn down, the related portion of costs incurred relating to such facilities will be reflected as a reduction to the related debt. Deferred financing costs relating to both the lines of credit and loan facilities are amortized to expense over the life of the related debt using the effective interest rate method.
Impairment of long-lived assets
We follow Accounting Standards Codification (“ASC”) Subtopic held for use
In accordance with ASC subtopic 360-10, “Property,Property, Plant and Equipment” (“ASC 360-10”)Equipment, which requires impairment losseslong-lived assets to be recordedheld and used are reviewed for impairment whenever events or changes in circumstances indicate that the carrying amount of such assets may not be recoverable. Determination of recoverability is based on an estimate of undiscounted future cash flows resulting from the use of the asset and its eventual disposition. Measurement of an impairment loss for long-lived assets usedthat management expects to hold and use is based on the fair value of the asset as estimated using a cash flow model. Long-lived assets to be disposed of are reporting at the lower of carrying amount or fair value less costs to sell.
During the fourth quarter of 2016, the Company performed impairment tests of the Company’s vessels due to the prevailing conditions in operations when indicators of impairment are present and the shipping industry. The Company compared undiscounted cash flows estimated to be generated by those assets are less than theirthe carrying amounts. If indicators of impairment are present, the Company performs an analysisvalues for each of the anticipated undiscounted future net cash flowsCompany’s vessels to determine if the assets were impaired. In developing its estimates of the related long-lived assets. If the carrying value of the related asset exceeds the undiscounted cash flows, the Company makes assumptions and estimates about vessels’ future performance, with the most significant assumptions relating to (i) charter rates on expiry of existing charters, which are based on the current fixing applicable to five-year time charter rates and thereafter, the ten-year historical average for each category of vessel (ii) off-hire days, which are based on actual off-hire statistics for the Company’s fleet (iii) operating costs, based on current levels escalated over time based on long term trends (iv) dry docking frequency, duration and cost, (v) estimated useful life which is assessed as a total of 25 years and (vi) estimated scrap values. In the case of an indication of impairment, the results of a recoverability test would also be sensitive to the discount rate applied.
The assumptions used involve a considerable degree of estimation. Actual conditions may differ significantly from the assumptions and thus actual cash flows may be significantly different to those expected with a material effect on the recoverability of each vessel’s carrying amount.
No impairment charges were recorded on the Company’s long-lived assets held for use as at December 31, 2016 and 2015 based on the assumptions made, the expected undiscounted future cash flows exceeding the vessels’ carrying amounts.
Fair value is reduced to itsof financial instruments
Substantially all of the Company’s financial instruments are carried at fair value or amounts approximating fair value. Various factors including anticipated future charter rates,Cash and cash equivalents, amounts due to / from charterers, accounts payable and long-term debt, are carried at market value or estimated scrap values, future drydocking costsfair value.
SCORPIO BULKERS INC. AND SUBSIDIARIES
Notes to the Consolidated Financial Statements
(Dollars in thousands, except per share, per day and
estimatedper vessel
operating costs are included in this analysis.Inventories
Inventories consist of lubricating oils and other items including stock provisions, and are stated at the lower of cost and net realizable value. Cost is determined using the first in first out method. Stores and spares are charged to vessel operating costs when purchased.
data)
Deferred financing costs,
net
Deferred financing costs, included in other assets
or as a reduction to debt balances (as described above), consist of fees, commissions and legal expenses associated with obtaining
loan facilities and amending existingor modifying loan facilities. These costs are amortized over the life of the related debt
using the effective interest rate method and are included in
interest expense.Fair valueFinancial expense, net in the Consolidated Statement of financial instruments
Operations. Amortization was $4.1 million, $2.0 million, and $0.2 million respectively for years ended December 31, 2016, 2015 and 2014. Deferred financing costs of $26.1 million and $14.9 million, and accumulated amortization was $6.2 million and $2.1 million as of December 31, 2016 and 2015, respectively. Amortization for the next five years based on balances as of December 31, 2016 are as follows (in millions):
|
| | | | | |
| 2017 | | $ | 5.1 |
| |
| 2018 | | 4.9 |
| |
| 2019 | | 4.6 |
| |
| 2020 | | 4.0 |
| |
| 2021 | | 1.1 |
| |
| Total | | 19.7 |
| |
The estimated fair valuesCompany wrote off $3.8 million and $16.1 million during the years ended December 31, 2016 and 2015, respectively, associated with the portion of our financial instruments such as amountsdeferred financing costs accumulated on credit facilities for which the commitments were reduced due to / due from charterers, accounts payable and long-term debt, approximate their individual carrying amounts due to their short-term maturity or the variable-rate naturesale of vessels, cancellation of the respective borrowingsconstruction contract or because the amount of the facility exceeded the amounts that we would be able to draw downdue to decreases in vessel values.
Earnings per share
Basic earnings per share is determined by dividing the net income (loss) by the weighted average number of common shares outstanding, while diluted earnings per share is determined by dividing net income (loss) by the average number of common stock adjusted for the dilutive effect of common stock equivalents by application of the treasury stock method. Common stock equivalents are excluded from the diluted calculation if their effect is anti-dilutive.
Share-based Compensation
We follow ASC Subtopic 718-10, Compensation-Stock Compensation, for restricted stock issued under our equity incentive plans. Share-based compensation expense requires measurement of compensation cost for shared based awards at fair value and recognition of compensation cost over the credit facilities.vesting period, net of estimated forfeitures. The restricted stock awards granted to our employees and directors have graded vesting schedules and contain only service conditions. The Company recognizes compensation cost on a straight-line basis over the requisite service period for each separately vesting portion of the award as if the award was, in-substance, multiple awards.
The fair value of restricted stock awards is based on the fair value of the Company’s common stock on the grant date.
Income tax
Scorpio Bulkers Inc. is incorporated in the Republic of the Marshall Islands, and its subsidiaries are incorporated in the Republic of the Marshall Islands and the Cayman Islands. In accordance with the income tax laws of the Marshall Islands and the Cayman Islands, we are not subject to Marshall Islands or Cayman Islands income tax. We are also exempt from income tax in other jurisdictions including the United States of America due to tax treaties or domestic tax laws; therefore, we will not have any tax charges, benefits, or balances.
Concentration of credit risk
Financial instruments that potentially subject the Company to concentrations of credit risk are amounts due from charterers and from related parties. With respect to balances due from the Scorpio Ultramax Pool, and the Scorpio Kamsarmax Pool (see Note 13), the Company, through SCM, limits its credit risk by performing ongoing credit evaluations and, when deemed necessary, requires letters of credit, guarantees or collateral. The Company earned 40%, and 60% of its revenues (including commissions from SCM) from two customers during the year ended December 31, 2016. The Company earned 41% and 43% and 8% of its revenues (including commissions from SCM), from three customers during the year ended December 31, 2015. During the year
SCORPIO BULKERS INC. AND SUBSIDIARIES
Notes to the Consolidated Financial Statements
(Dollars in thousands, except per share, per day and per vessel data)
ended 12/31/2014, the Company earned 71% and 21% of its revenues (including commissions from SCM), respectively from two customers. Management does not believe significant risk exists in connection with the Company’s concentrations of credit at December 31, 2016 due to the number of charterers with which the pools conduct business.
At December 31, 2016, the Company maintains all of its cash and cash equivalents with seven financial institutions. None of the Company’s cash and cash equivalent balances are covered by insurance in the event of default by these financial institutions.
Interest rate risk
The Company is exposed to the impact of interest rate swapschanges primarily through its variable-rate borrowings which consist of borrowings under its secured credit facilities. Significant increases in interest rates could adversely affect our operating margins, results of operations and our ability to service our debt.
Liquidity risk
Liquidity risk is the estimated amount we would receive or haverisk that an entity will encounter difficulty in raising funds to pay in order to terminate these agreements atmeet commitments associated with financial instruments.
We manage liquidity risk by maintaining adequate reserves and borrowing facilities and by continuously monitoring forecast and actual cash flows.
Current economic conditions make forecasting difficult, and there is the reporting date, takingpossibility that our actual trading performance during the coming year may be materially different from expectations. Based on internal forecasts and projections that take into account current interest ratesreasonably possible changes in our trading performance, we believe that we have adequate financial resources to continue in operation and meet our financial commitments (including but not limited to newbuilding installments, debt service obligations and charterhire commitments) for a period of at least 12 months from the date of this annual report. Accordingly, we continue to adopt the going concern basis in preparing our financial statements.
Currency and exchange rate risk
The international shipping industry’s functional currency is the U.S. Dollar. Virtually all of our revenues and most of our operating costs are in U.S. Dollars. We incur certain operating expenses in currencies other than the U.S. Dollar, and the creditworthinessforeign exchange risk associated with these operating expenses is immaterial.
Recent accounting pronouncements
In November 2016, the Financial Accounting Standards Board (FASB) issued Accounting Standards Update (ASU) 2016-18, “Restricted Cash”. When cash, cash equivalents, restricted cash and restricted cash equivalents are presented in more than one line item on the balance sheet, the new guidance requires a reconciliation of the counterpartytotals in the statement of cash flows to the related captions in the balance sheet. This reconciliation can be presented either on the face of the statement of cash flows or in the notes to the financial statements. The guidance is effective for assetsfiscal years beginning after 15 December 2017, and our creditworthinessinterim periods within those years. Early adoption in an interim period is permitted, but any adjustments must be reflected as of the beginning of the fiscal year that includes that interim period. The Company does not expect ASU 2016-018 to have a significant impact on its Consolidated Statement of Cash Flows.
In August 2016, the FASB issued ASU 2016-15, “Classification of Certain Cash Receipts and Cash Payments”, which addresses classification issues related to the statement of cash flows. Classification issues relate to (i) debt repayment of debt extinguishment costs, (ii) settlement of zero-coupon bonds, (iii) contingent consideration payments made after a business combination, (iv) proceeds from the settlement of insurance claims, (v) proceeds from the settlement of corporate-owned life insurance policies, including bank-owned life insurance policies, (vi) distributions received from equity method investees, (vii) beneficial interests in securitization transactions, and (viii) separately identifiable cash flows and application of the predominance principle. The guidance is effective for
liabilities.annual and interim periods in fiscal years beginning after December 15, 2017. Early adoption is permitted, including adoption in an interim period. If an entity early adopts the ASU in an interim period, adjustments should be reflected as of the beginning of the fiscal year that includes that interim period. An entity that elects early adoption must adopt all of the amendments in the same period. Entities should apply this ASU using a retrospective transition method to each period presented. If it is impracticable for an entity to apply the ASU retrospectively for some of the issues, it may apply the amendments for those issues prospectively as of the earliest date practicable. The Company does not expect ASU 2016-15 to have a significant impact on its Consolidated Statement of Cash Flows.
Derivative financial instruments
Derivatives
SCORPIO BULKERS INC. AND SUBSIDIARIES
Notes to the Consolidated Financial Statements
(Dollars in thousands, except per share, per day and per vessel data)
In March 2016, the FASB issued ASU 2016-09, “Improvements to Employee Share-Based Payment Accounting”. The new guidance requires excess tax benefits and tax deficiencies to be recorded on the income statement when the awards vest or are
initially recognized at fair value at the date a derivative contract is entered into and are subsequently remeasuredsettled. In addition, cash flows related to
their fair value at each balance sheet date. A derivative with a positive fair value is recognizedexcess tax benefits will no longer be separately classified as a
financial asset whereas a derivative with a negative fair value is recognized as a financial liability. The resulting gain or loss is recognized in profit or loss immediately unless the derivative is designated and effective as a hedging instrument, in which event the timing of the recognition in profit or loss dependsfinancing activity on the
naturestatement of
cash flows. The standard also allows withholding up to the
hedging relationship. We designate certain derivatives as hedges of highly probable forecast transactions (cash flow hedges) as described further below.A derivative ismaximum statutory amount for taxes on employee share-based compensation, clarifies that all cash payments made on an employee’s behalf for withheld shares should be presented as a non-current assetfinancing activity on the statement of cash flows and provides an accounting policy election to account for forfeitures as they occur. The new standard is effective for annual reporting periods beginning after December 15, 2016 with early adoption permitted. The Company does not expect ASU 2016-09 to have a significant impact on its consolidated financial statements.
In February 2016 the FASB issued ASU 2016-02, “Leases”, which is intended to improve financial reporting about leasing transactions. The ASU affects all companies that lease assets. The ASU will require organizations that lease assets, or lessees, to recognize on the balance sheet the assets and liabilities for the rights and obligations created by those leases with terms of more than twelve months. The accounting by organizations that own the assets leased by the lessee, the lessor, will remain largely unchanged from current U.S. GAAP. The ASU will also require additional quantitative and qualitative disclosures to help financial statement users better understand the amount, timing, and uncertainty of cash flows arising from leases. The ASU is effective for fiscal years and interim periods beginning after December 15, 2018 although early adoption is permitted. The ASU requires reporting organizations to take a non-current liability ifmodified retrospective transition approach. The Company is currently in the remaining maturityprocess of evaluating the impact of adoption of the instrumentASU on its consolidated financial statements but could experience a gross up of assets and liabilities should the Company time charter-in a significant number of vessels.
In May 2014, the FASB issued ASU No. 2014-09, “Revenue from Contracts with Customers”, which supersedes nearly all existing revenue recognition guidance under U.S. GAAP. The core principle is
that a company should recognize revenue when promised goods or services are transferred to customers in an amount that reflects the consideration to which an entity expects to be entitled for those goods or services. This update defines a five-step process to achieve this core principle and, in doing so, more
judgment and estimates may be required within the revenue recognition process than
12 months, and itare required under existing U.S. GAAP. ASU 2014-09 was originally going to be effective January 1, 2017; however, the FASB recently issued ASU 2015-14, which deferred the effective date of ASU 2014-09 by one year to January 1, 2018. The adoption of this standard is not expected to
be realizedhave a material impact on the revenue recognized for our vessels that operate in pools or
settled within 12 months.Hedge accounting for cash flow hedges
Our policyon time charter. These arrangements qualify as single performance obligations that meet the criteria to recognize revenue ‘over time’ as the customer (i.e. the pool or the charterer) is to designate certain hedging instruments, which can include derivatives, embedded derivativessimultaneously receiving and non-derivatives in respect of foreign currency risk, as either fair value hedges, cash flow hedges, or hedges of net investments in foreign operations. Atconsuming the inceptionbenefits of the hedge relationship,vessel. This method of revenue recognition is identical to our current accounting policy for these types of employment arrangements. For vessels operating in the spot market, we documentalso expect to recognize revenue over time however, the relationship betweentime period over which revenue is recognized is still being determined.
Recently adopted accounting standards
In April 2015, the hedging instrument andFinancial Accounting Standards Board (“FASB”) issued Accounting Standards Update (“ASU”) 2015-03,“Simplifying the hedged item, along with its risk management objectives and its strategy for undertaking various hedge transactions. Furthermore, atPresentation of Debt Issuance Costs”, which changes the inceptionpresentation of the hedge and ondebt issuance costs in financial statements. ASU 2015-03 requires an ongoing basis, we document whether the hedging instrument is highly effective in offsetting changes in fair values or cash flows of the hedged item.Derivative financial instruments are initially recognizedentity to present such costs in the balance sheet at fair value atas a direct deduction from the daterelated debt liability rather than as an asset. Amortization of the derivative contract is entered into and are subsequently measured at their fair value as other assets or other liabilities, respectively. Changes in fair value of derivative financial instruments, which are designated as cash flow hedges and deemedcosts will continue to be reported as interest expense. The new standard is effective are recognized directly in other comprehensive income. Changes in fair value of a portion of a hedge deemed to be ineffective are recognized in net profit or loss. Hedge effectiveness is measured quarterly.
Amounts previously recognized in other comprehensive income and accumulated in the hedging reserve are reclassified to profit or loss in thefor annual reporting periods when the hedged item is recognized in profit or loss, in the same line of the statement of profit or loss as the recognized hedged item. However, when the forecast transaction that is hedged results in the recognition of a non-financial asset or a non-financial liability, the gains and losses previously accumulated in equity are transferred from equity and included in the initial measurement of the cost of the non-financial asset or non-financial liability.
Hedge accounting is discontinued when we revoke the hedging relationship, the hedging instrument expires or is sold, terminated, or exercised, or no longer qualifies for hedge accounting. Any gain or loss recognized in other comprehensive income at that time is accumulated in the hedge reserve and is recognized when the forecast transaction is ultimately recognized in profit or loss. When a forecast transaction is no longer expected to occur, the gain or loss accumulated in the hedge reserve is recognized immediately in profit or loss.
Provisions
Provisions are recognized when we have a present obligation asbeginning after December 15, 2015. We adopted ASU 2015-03 effective January 1, 2016. As a result of the retrospective adoption, we reclassified unamortized debt issuance costs of $12.3 million and $3.2 million as of December 31, 2015 and 2014, respectively, from Deferred financing costs, net to a past event,reduction in both current and itnon-current Bank loans, net as well as Senior Notes, net in the Consolidated Balance Sheet. Adoption of this standard did not impact results of operations, retained earnings or cash flows in the current or previous interim and annual reporting periods.
In August 2014, the FASB issued ASU No. 2014-15, “Presentation of Financial Statements - Going Concern”. ASU 2014-15 provides U.S. GAAP guidance on management’s responsibility in evaluating whether there is
probable that wesubstantial doubt about a company’s ability to continue as a going concern and on related required footnote disclosures. For each reporting period, management will be required to
settleevaluate whether there are conditions or events that
obligation. Provisionsraise substantial doubt about a company’s ability to continue as a going concern within one year from the date the financial statements are
measured at our best estimateissued. ASU 2014-15 is applicable to all entities and is effective for annual reporting periods ending after December 15, 2016 and for annual and interim reporting periods thereafter. Early application is permitted. Adoption of
the expenditure required to settle the obligation at the balance sheet date, and are discounted to present value where the effect is material.2. Cash Flow Information
For the period from March 20, 2013 (datethis standard did not impact results of inception) to December 31, 2013, the Company had non-cash financing activities not includedoperations, retained earnings or cash flows in the consolidated statement of cash flows of $665 relating to costs associated with issuance of common shares that had not been paid as of December 31, 2013.
3. Cashcurrent or previous interim and cash equivalents
annual reporting periods.
| |
| 2. | Cash and cash equivalents |
Included in cash and cash equivalents as of December 31,
20132016 and 2015 is
a $150,000$25.4 million and $20.1 million, respectively, of short-term
depositdeposits with
an original
maturitymaturities of less than three months.
4. Vessels under construction
Vessels under construction
SCORPIO BULKERS INC. AND SUBSIDIARIES
Notes to the Consolidated Financial Statements
(Dollars in thousands, except per share, per day and per vessel data)
| |
| 3. | Earnings Per Common Share |
The following is $371,692a reconciliation of the basic and diluted earnings per share computations (amounts in thousands, except per share data):
|
| | | | | | | | | | | | |
| | | For the years ended December 31, |
| | | 2016 | | 2015 | | 2014 |
| Net loss for basic and diluted earnings per share | | $ | (124,835 | ) | | $ | (510,789 | ) | | $ | (116,565 | ) |
| | | | | | | |
| Shares of common stock and common stock equivalents: | | | | | | |
| Weighted average shares basic | | 56,174 |
| | 21,410 |
| | 11,466 |
|
| Effect of dilutive securities | | — |
| | — |
| | — |
|
Weighted average common shares - diluted
| | 56,174 |
| | 21,410 |
| | 11,466 |
|
| | | | | | | |
| Loss per share: | | | | | | |
| Basic | | $ | (2.22 | ) | | $ | (23.86 | ) | | $ | (10.17 | ) |
| Diluted | | $ | (2.22 | ) | | $ | (23.86 | ) | | $ | (10.17 | ) |
The following is a summary of share equivalents not included in the computation of diluted earnings per share because their effectives would have been anti-dilutive for the years ended December 31, 2016, 2015 and 2014 (in thousands).
|
| | | | | | | | | |
| | | For the years ended December 31, |
| | | 2016 | | 2015 | | 2014 |
| Share equivalents | | 3,600 |
| | 1,248 |
| | 582 |
|
At December 31, 2016 the Company owned 16 Kamsarmax vessels and 26 Ultramax vessels. A rollforward of activity within vessels is as follows (in thousands):
|
| | | |
| Balance December 31, 2014 | $ | 66,633 |
|
| Transfer from vessels under construction and other additions | 1,002,912 |
|
| Depreciation | (14,263 | ) |
| Transferred to assets held for sale | (290,828 | ) |
| Balance December 31, 2015 | $ | 764,454 |
|
| Transfer from vessels under construction and other additions | 506,189 |
|
| Depreciation | (36,562 | ) |
| Balance December 31, 2016 | $ | 1,234,081 |
|
During 2015, vessels and accumulated depreciation were reduced by approximately $294.5 million and $3.6 million, respectively, for vessels that were sold. There were no such reductions during 2016. All of our vessels serve as collateral against existing loan facilities.
SCORPIO BULKERS INC. AND SUBSIDIARIES
Notes to the Consolidated Financial Statements
(Dollars in thousands, except per share, per day and per vessel data)
Owned vessels
|
| | | | | | | |
| Vessel Name | | Year Built | | DWT | | Vessel Type |
| SBI Antares | | 2015 | | 61,000 |
| | Ultramax |
| SBI Athena | | 2015 | | 64,000 |
| | Ultramax |
| SBI Bravo | | 2015 | | 61,000 |
| | Ultramax |
| SBI Leo | | 2015 | | 61,000 |
| | Ultramax |
| SBI Echo | | 2015 | | 61,000 |
| | Ultramax |
| SBI Lyra | | 2015 | | 61,000 |
| | Ultramax |
| SBI Tango | | 2015 | | 61,000 |
| | Ultramax |
| SBI Maia | | 2015 | | 61,000 |
| | Ultramax |
| SBI Hydra | | 2015 | | 61,000 |
| | Ultramax |
| SBI Subaru | | 2015 | | 61,000 |
| | Ultramax |
| SBI Pegasus | | 2015 | | 64,000 |
| | Ultramax |
| SBI Ursa | | 2015 | | 61,000 |
| | Ultramax |
| SBI Thalia | | 2015 | | 64,000 |
| | Ultramax |
| SBI Cronos | | 2015 | | 61,000 |
| | Ultramax |
| SBI Orion | | 2015 | | 64,000 |
| | Ultramax |
| SBI Achilles | | 2016 | | 61,000 |
| | Ultramax |
| SBI Hercules | | 2016 | | 64,000 |
| | Ultramax |
| SBI Perseus | | 2016 | | 64,000 |
| | Ultramax |
| SBI Hermes | | 2016 | | 61,000 |
| | Ultramax |
| SBI Zeus | | 2016 | | 60,200 |
| | Ultramax |
| SBI Hera | | 2016 | | 60,200 |
| | Ultramax |
| SBI Hyperion | | 2016 | | 61,000 |
| | Ultramax |
| SBI Tethys | | 2016 | | 61,000 |
| | Ultramax |
| SBI Phoebe | | 2016 | | 64,000 |
| | Ultramax |
| SBI Poseidon | | 2016 | | 60,200 |
| | Ultramax |
| SBI Apollo | | 2016 | | 60,200 |
| | Ultramax |
| Total Ultramax | | | | 1,603,800 |
| | |
| SBI Cakewalk | | 2014 | | 82,000 |
| | Kamsarmax |
| SBI Charleston | | 2014 | | 82,000 |
| | Kamsarmax |
| SBI Samba | | 2015 | | 84,000 |
| | Kamsarmax |
| SBI Rumba | | 2015 | | 84,000 |
| | Kamsarmax |
| SBI Capoeira | | 2015 | | 82,000 |
| | Kamsarmax |
| SBI Electra | | 2015 | | 82,000 |
| | Kamsarmax |
| SBI Carioca | | 2015 | | 82,000 |
| | Kamsarmax |
| SBI Conga | | 2015 | | 82,000 |
| | Kamsarmax |
| SBI Flamenco | | 2015 | | 82,000 |
| | Kamsarmax |
| SBI Bolero | | 2015 | | 82,000 |
| | Kamsarmax |
| SBI Sousta | | 2016 | | 82,000 |
| | Kamsarmax |
| SBI Rock | | 2016 | | 82,000 |
| | Kamsarmax |
| SBI Lambada | | 2016 | | 82,000 |
| | Kamsarmax |
| SBI Reggae | | 2016 | | 82,000 |
| | Kamsarmax |
| SBI Zumba | | 2016 | | 82,000 |
| | Kamsarmax |
| SBI Macarena | | 2016 | | 82,000 |
| | Kamsarmax |
| Total Kamsarmax | | | | 1,316,000 |
| | |
| Total Owned Vessels DWT | | 2,919,800 |
| | |
SCORPIO BULKERS INC. AND SUBSIDIARIES
Notes to the Consolidated Financial Statements
(Dollars in thousands, except per share, per day and per vessel data)
SBI Macarena had not reached its port of first load as of December 31, 2013. Substantially all2016, and therefore the vessel cost remains in vessels under construction.
| |
| 5. | Vessels under construction |
Vessels under construction was $180.0 million and $288.3 million as of
this amount relates to initialDecember 31, 2016 and 2015, respectively. These balances consist primarily of installments paid
to shipyards on
54 of our newbuilding contracts.
As
A rollforward of March 27, 2014, we had contracts to acquire 79 newbuilding drybulk carriers, including 28 Ultramaxactivity within vessels with carrying capacities between 60,200 and 64,000 dwt, 23 Kamsarmaxunder construction is as follows (in thousands): |
| | | |
| Balance December 31, 2014 | $ | 866,844 |
|
| Installment payments and other | 875,970 |
|
| Capitalized interest | 11,886 |
|
| Transferred to vessels | (1,001,808 | ) |
| Transferred to assets held for sale | (464,610 | ) |
| Balance December 31, 2015 | $ | 288,282 |
|
| Installment payments and other | 401,556 |
|
| Capitalized interest | 6,951 |
|
| Transferred to vessels | (506,362 | ) |
| Write off due to contract cancellation | (10,427 | ) |
| Balance December 31, 2016 | 180,000 |
|
All vessels with carrying capacities between 81,600 and 84,000 dwt and 28 Capesize vessels with carrying capacities of 180,000 dwt.under construction serve as collateral for related loan facilities. The aggregate purchase priceestimated cost of these 79six newbuildings is approximately $3,071,470$161.9 million of which we have paid $371,582$143.2 million through December 31, 2013. 2016.
A summary of our vessels under construction
as of December 31, 2016 is as follows:
Vessels Under Construction
| | | Expected | | |
| | Vessel Name | Delivery (1) | DWT | Shipyard |
| | Capesize Vessels | | | |
| 1 | SBI Puro | Q1-15 | 180,000 | Shanghai Waigaoqiao Shipbuilding Co., Ltd. |
| 2 | SBI Valrico | Q2-15 | 180,000 | Shanghai Waigaoqiao Shipbuilding Co., Ltd. |
| 3 | SBI Maduro | Q3-15 | 180,000 | Shanghai Waigaoqiao Shipbuilding Co., Ltd. |
| 4 | SBI Belicoso | Q4-15 | 180,000 | Shanghai Waigaoqiao Shipbuilding Co., Ltd. |
| 5 | SBI Corona | Q1-16 | 180,000 | Shanghai Waigaoqiao Shipbuilding Co., Ltd. |
| 6 | SBI Diadema | Q2-16 | 180,000 | Shanghai Waigaoqiao Shipbuilding Co., Ltd. |
| 7 | SBI Estupendo | Q3-16 | 180,000 | Shanghai Waigaoqiao Shipbuilding Co., Ltd. |
| 8 | SBI Montesino | Q2-15 | 180,000 | Sungdong Shipbuilding & Marine Engineering Co., Ltd. |
| 9 | SBI Magnum | Q3-15 | 180,000 | Sungdong Shipbuilding & Marine Engineering Co., Ltd. |
| 10 | SBI Montecristo | Q3-15 | 180,000 | Sungdong Shipbuilding & Marine Engineering Co., Ltd. |
| 11 | SBI Aroma | Q3-15 | 180,000 | Sungdong Shipbuilding & Marine Engineering Co., Ltd. |
| 12 | SBI Cohiba | Q4-15 | 180,000 | Sungdong Shipbuilding & Marine Engineering Co., Ltd. |
| 13 | SBI Habano | Q4-15 | 180,000 | Sungdong Shipbuilding & Marine Engineering Co., Ltd. |
| 14 | SBI Lonsdale | Q1-16 | 180,000 | Sungdong Shipbuilding & Marine Engineering Co., Ltd. |
| 15 | SBI Partagas | Q1-16 | 180,000 | Sungdong Shipbuilding & Marine Engineering Co., Ltd. |
| 16 | SBI Parejo | Q2-16 | 180,000 | Sungdong Shipbuilding & Marine Engineering Co., Ltd. |
| 17 | SBI Toro | Q2-16 | 180,000 | Sungdong Shipbuilding & Marine Engineering Co., Ltd. |
| 18 | SBI Tuscamina | Q2-16 | 180,000 | Sungdong Shipbuilding & Marine Engineering Co., Ltd. |
| 19 | SBI Camacho | Q2-15 | 180,000 | Sungdong Shipbuilding & Marine Engineering Co., Ltd. |
| 20 | SBI Churchill | Q4-15 | 180,000 | Daewoo Mangalia Heavy Industries S.A. |
| 21 | SBI Perfecto | Q1-16 | 180,000 | Daewoo Mangalia Heavy Industries S.A. |
| 22 | SBI Presidente | Q4-15 | 180,000 | Daewoo Mangalia Heavy Industries S.A. |
| 23 | SBI Panatela | Q1-16 | 180,000 | Daewoo Mangalia Heavy Industries S.A. |
| 24 | SBI Robusto | Q2-16 | 180,000 | Daewoo Mangalia Heavy Industries S.A. |
| 25 | SBI Behike | Q3-15 | 180,000 | Daehan Shipbuilding Co., Ltd. |
| 26 | SBI Monterray | Q4-15 | 180,000 | Daehan Shipbuilding Co., Ltd. |
| 27 | SBI Macanudo | Q4-15 | 180,000 | Daehan Shipbuilding Co., Ltd. |
| 28 | SBI Cuaba | Q1-16 | 180,000 | Daehan Shipbuilding Co., Ltd. |
| | Capesize NB DWT | | 5,040,000 | |
|
| | Kamsarmax Vessels | | | |
| | | | | |
| 1 | SBI Cakewalk | Q2-14 | 82,000 | Shanghai Waigaoqiao Shipbuilding Co., Ltd. |
| 2 | SBI Charleston | Q3-14 | 82,000 | Shanghai Waigaoqiao Shipbuilding Co., Ltd. |
| 3 | SBI Samba | Q1-15 | 84,000 | Imabari Shipbuilding Co., Ltd. |
| 4 | SBI Rumba | Q3-15 | 84,000 | Imabari Shipbuilding Co., Ltd. |
| 5 | SBI Electra | Q3-15 | 82,000 | Jiangsu Yangzijiang Shipbuilding Co., Ltd. |
| 6 | SBI Flamenco | Q3-15 | 82,000 | Jiangsu Yangzijiang Shipbuilding Co., Ltd. |
| 7 | SBI Rock | Q4-15 | 82,000 | Jiangsu Yangzijiang Shipbuilding Co., Ltd. |
| 8 | SBI Twist | Q1-16 | 82,000 | Jiangsu Yangzijiang Shipbuilding Co., Ltd. |
| 9 | SBI Salsa | Q3-15 | 81,600 | Tsuneishi Group (Zhoushan) Shipbuilding Inc. |
| 10 | SBI Merengue | Q1-16 | 81,600 | Tsuneishi Group (Zhoushan) Shipbuilding Inc. |
| 11 | SBI Capoeira | Q3-15 | 82,000 | Hudong-Zhonghua (Group) Co., Ltd. |
| 12 | SBI Conga | Q3-15 | 82,000 | Hudong-Zhonghua (Group) Co., Ltd. |
| 13 | SBI Bolero | Q3-15 | 82,000 | Hudong-Zhonghua (Group) Co., Ltd. |
| 14 | SBI Carioca | Q4-15 | 82,000 | Hudong-Zhonghua (Group) Co., Ltd. |
| 15 | SBI Sousta | Q4-15 | 82,000 | Hudong-Zhonghua (Group) Co., Ltd. |
| 16 | SBI Reggae | Q1-16 | 82,000 | Hudong-Zhonghua (Group) Co., Ltd. |
| 17 | SBI Lambada | Q1-16 | 82,000 | Hudong-Zhonghua (Group) Co., Ltd. |
| 18 | SBI Zumba | Q1-16 | 82,000 | Hudong-Zhonghua (Group) Co., Ltd. |
| 19 | SBI Macerena | Q2-16 | 82,000 | Hudong-Zhonghua (Group) Co., Ltd. |
| 20 | SBI Swing | Q3-16 | 82,000 | Hudong-Zhonghua (Group) Co., Ltd. |
| 21 | SBI Jive | Q3-16 | 82,000 | Hudong-Zhonghua (Group) Co., Ltd. |
| 22 | SBI Parapara | Q2-16 | 82,000 | Hudong-Zhonghua (Group) Co., Ltd. |
| 23 | SBI Mazurka | Q2-16 | 82,000 | Hudong-Zhonghua (Group) Co., Ltd. |
| | Kamsarmax NB DWT | 1,889,200 | |
| | | | | |
| | Ultramax Vessels | | | |
| | | | | |
| 1 | SBI Echo | Q3-15 | 61,000 | Imabari Shipbuilding Co., Ltd. |
| 2 | SBI Cronos | Q1-16 | 61,000 | Imabari Shipbuilding Co., Ltd. |
| 3 | SBI Tango | Q4-15 | 61,000 | Imabari Shipbuilding Co., Ltd. |
| 4 | SBI Hermes | Q1-16 | 61,000 | Imabari Shipbuilding Co., Ltd. |
| 5 | SBI Hera | Q2-16 | 60,200 | Mitsui Engineering & Shipbuilding Co., Ltd. |
| 6 | SBI Zeus | Q2-16 | 60,200 | Mitsui Engineering & Shipbuilding Co., Ltd. |
| 7 | SBI Poseidon | Q3-16 | 60,200 | Mitsui Engineering & Shipbuilding Co., Ltd. |
| 8 | SBI Apollo | Q3-16 | 60,200 | Mitsui Engineering & Shipbuilding Co., Ltd. |
| 9 | SBI Bravo | Q1-15 | 61,000 | Nantong COSCO KHI Ship Engineering Co. Ltd. |
| 10 | SBI Antares | Q1-15 | 61,000 | Nantong COSCO KHI Ship Engineering Co. Ltd. |
| 11 | SBI Maia | Q3-15 | 61,000 | Nantong COSCO KHI Ship Engineering Co. Ltd. |
| 12 | SBI Hydra | Q3-15 | 61,000 | Nantong COSCO KHI Ship Engineering Co. Ltd. |
| 13 | SBI Hyperion | Q2-16 | 61,000 | Nantong COSCO KHI Ship Engineering Co. Ltd. |
| 14 | SBI Tethys | Q2-16 | 61,000 | Nantong COSCO KHI Ship Engineering Co. Ltd. |
| 15 | SBI Leo | Q2-15 | 61,000 | Dalian COSCO KHI Ship Engineering Co. Ltd. |
| 16 | SBI Lyra | Q3-15 | 61,000 | Dalian COSCO KHI Ship Engineering Co. Ltd. |
| 17 | SBI Subaru | Q3-15 | 61,000 | Dalian COSCO KHI Ship Engineering Co. Ltd. |
| 18 | SBI Ursa | Q4-15 | 61,000 | Dalian COSCO KHI Ship Engineering Co. Ltd. |
| 19 | SBI Athena | Q1-15 | 64,000 | Chengxi Shipyard Co. Ltd. |
| 20 | SBI Pegasus | Q3-15 | 64,000 | Chengxi Shipyard Co. Ltd. |
| 21 | SBI Orion | Q4-15 | 64,000 | Chengxi Shipyard Co. Ltd. |
| 22 | SBI Thalia | Q4-15 | 64,000 | Chengxi Shipyard Co. Ltd. |
| 23 | SBI Hercules | Q1-16 | 64,000 | Chengxi Shipyard Co. Ltd. |
| 24 | SBI Kratos | Q2-16 | 64,000 | Chengxi Shipyard Co. Ltd. |
| 25 | SBI Perseus | Q2-16 | 64,000 | Chengxi Shipyard Co. Ltd. |
| 26 | SBI Samson | Q2-16 | 64,000 | Chengxi Shipyard Co. Ltd. |
| 27 | SBI Phoebe | Q2-16 | 64,000 | Chengxi Shipyard Co. Ltd. |
| 28 | SBI Phoenix | Q3-16 | 64,000 | Chengxi Shipyard Co. Ltd. |
| | Ultramax NB DWT | | 1,734,800 | |
| | | | | |
| | Total Newbuild DWT | 8,664,000 | |
|
| | | | | |
| Ultramax Vessels | | |
| |
| | Vessel Name | Expected
Delivery | DWT | Shipyard |
| 1 | Hull CX0655 - TBN SBI Samson | Q1-17 | 64,000 |
| Chengxi Shipyard Co. Ltd. |
| 2 | Hull CX0656 - TBN SBI Phoenix | Q1-17 | 64,000 |
| Chengxi Shipyard Co. Ltd. |
| | Ultramax NB DWT | | 128,000 |
| |
|
| | | | | |
| Kamsarmax Vessels | | | |
| | Vessel Name | Expected
Delivery | DWT | Shipyard |
| 1 | Hull S1735A - TBN SBI Parapara | Q1-17 | 82,000 |
| Hudong-Zhonghua (Group) Co., Ltd. |
| 2 | Hull S1736A - TBN SBI Mazurka | Q1-17 | 82,000 |
| Hudong-Zhonghua (Group) Co., Ltd. |
| 3 | Hull S1232 - TBN SBI Swing | Q1-17 | 82,000 |
| Hudong-Zhonghua (Group) Co., Ltd. |
| 4 | Hull S1233 - TBN SBI Jive | Q2-17 | 82,000 |
| Hudong-Zhonghua (Group) Co., Ltd. |
| | Kamsarmax NB DWT | 328,000 |
| |
| | Total Newbuild DWT | | 456,000 |
| |
| (1) |
| 6. | Expected delivery date relates to quarter during which each vessel is currently expected to be delivered from the shipyard.Assets Held for Sale |
5. Earnings Per Common Share
The computation of basic earnings per share is based on the weighted-average number of common shares issued and outstanding during the year, excluding unvested shares of restricted stock (see Note 8). The computation of diluted earnings per share assumes the lapsing of restrictions on unvested restricted stock awards, for which the assumed proceeds upon lapsing of restrictions are deemed to be the amount of compensation cost attributable to future services and not yet recognized using the treasury stock method, to the extent dilutive.
The components of the denominator for the calculation of basic earnings per share and diluted earnings per share are as follows for the period from March 20, 2013 (date of inception) to December 31, 2013:
Common shares outstanding, basic: | | | | |
Weighted average common shares outstanding, basic | | | 39,925,160 | |
| | | | |
Common shares outstanding, diluted: | | | | |
Weighted average common shares outstanding, basic | | | 39,925,160 | |
Restricted stock awards | | | — | |
Weighted average common shares outstanding, diluted | | | 39,925,160 | |
Due to the net loss realized for the period from March 20, 2013 (date of inception) to December 31, 2013, potentially dilutive restricted stock awards totaling 373,046 shares were determined to be anti-dilutive.
6. Contractual Obligations
As of December 31, 2013,2016, the Company’s estimated commitments throughCompany did not have any vessels classified as held for sale.
During 2016, the expected delivery datesCompany sold the eight vessels that were classified as held for sale as of December 31, 2015, for net proceeds of $271.4 million and recorded $0.8 million in additional expenses upon the completion of the 79sales of those vessels.
SCORPIO BULKERS INC. AND SUBSIDIARIES
Notes to the Consolidated Financial Statements
(Dollars in thousands, except per share, per day and per vessel data)
During 2015, the Company sold 23 vessels for net proceeds of $281.1 million during the year ended December 31, 2015, including seven vessels that were classified as held for sale at December 31, 2014.
During 2014, the Company recorded a write down on assets held for sale aggregating $55.5 million which includes (i) the amount by which balances in vessels under construction
aggregate approximately $2,699,888,for these contracts exceeded the selling prices of the contracts net of remaining installments yet to be made under the contracts, including modifications to contract prices of the three LR1 product tanker contracts, and (ii) costs expected to be incurred to suppliers relating to the cancellation of orders for the purchase of components that would have been used in the construction of the Capesize vessels prior to their modification. An additional $4.4 million loss was recorded in 2015 related to these contracts for additional costs and adjustments to estimates, the majority of which
will be payable as follows:| 2014 | | $ | 572,355 | |
| 2015 | | | 1,319,147 | |
| 2016 | | | 808,386 | |
| | | $ | 2,699,888 | |
F-15 | |
| 7. | Commitment and Contingencies |
Legal Matters
The Company is periodically involved in litigation and various legal matters that arise in the normal course of business. Such matters are subject to many uncertainties and outcomes that are not predictable. At the current time, the Company does not believe that any of these matters will have a material adverse effect on its financial position or future results of operations and therefore has not recorded any reserves as of December 31, 2016. Capital Commitments
As of December 31, 2013,2016, the Company had $18.6 million of total contractual obligations scheduled to be paid in 2017 for one of the six undelivered vessels. As of December 31, 2016, we had a cash balance of $733,896$101.7 million and a maximum of $51.6 million available to fund these future newbuilding commitments; however, a significant portiondraw upon under signed credit facility agreements. The amount of debt we can draw upon is dependent upon the fair value of our remaining commitments are currently unfunded. If we are not able to borrow additional funds, raise other capital or utilize available cash on hand,vessels and if the fair market values of our vessels decline, the amount we may notdrawdown under our secured credit facilities may be able to acquire these newbuildingreduced.
Time chartered-in vessels
The Company time charters in vessels, which couldwere entered into and operated out of spot market-oriented commercial pools managed by our commercial manager. The Company has agreements to charter-in two drybulk vessels. The terms of the time charter-in contracts are summarized as follows:
|
| | | | | | |
| Vessel Type | Year Built | DWT | Where Built | Daily Base Rate | Earliest Expiry |
| Kamsarmax | 2012 | 82,000 |
| South Korea | $15,500 | 30-Jul-17 |
| Panamax | 2004 | 77,500 |
| China | $14,000 | 03-Jan-17 |
| Aggregate TC DWT | | 159,500 |
| | | |
Future minimum obligations under non-cancelable time charter-in agreements as of December 31, 2016 was, $3.3 million.
Debt
See Note 11, Debt, to the consolidated financial statements for a schedule of debt payments at December 31, 2016.
Other
The Company also has certain commitments related to the commercial and technical management of its vessels. As of December 31, 2016, we would be obligated to pay termination fees of $7.4 million to SCM and SSM if we were to cancel our service agreements with them as of December 31, 2016. We are also required to pay SCM for each vessel that we own an amount equal to six months of commissions that SCM would have a material adverse effectexpected to earn had the contracts not been terminated. Due to the variable nature of the commissions, they have been excluded from these figures.
SCORPIO BULKERS INC. AND SUBSIDIARIES
Notes to the Consolidated Financial Statements
(Dollars in thousands, except per share, per day and per vessel data)
| |
| 8. | Accounts Payable and Accrued Expenses |
Accounts payable and accrued expenses consist of the following:
|
| | | | | | | |
| | As of |
| (in thousands) | December 31, 2016 | | December 31, 2015 |
| Accounts payable | $ | 4,612 |
| | $ | 11,934 |
|
| Accrued operating | 2,250 |
| | 2,371 |
|
| Accrued administrative | 3,171 |
| | 1,909 |
|
| Accounts payable and accrued expenses | $ | 10,033 |
| | $ | 16,214 |
|
Accounts payable is primarily consists of obligations to suppliers arising in the normal course of business. Accrued operating relates to obligations arising from operation of the Company’s owned and chartered-in vessels and construction of the Company’s fleet, such as operating costs and installments on our business, financial condition, resultsvessels under construction. Accrued administrative relates to obligations that are corporate or financing in nature, such as payroll, professional fees, interest and commitment fees.
As of
operations and cash flows.7. Common Shares
On March 20, 2013,December 31, 2016 we issued 1,500had:
75,298,676 common shares
in connection with our formation.Between July 1, 2013 and July 16, 2013, we issued and sold 31,250,000outstanding, the $0.01 par value of which is recorded as common stock of $0.8 million.
Paid-in capital of $1.7 billion which substantially represents the excess net proceeds from common stock issuances over the par value as well as the amount of cumulative restricted stock amortization.
Effective December 31, 2015, the Company’s Board of Directors, or the Board, determined to effect a one-for-twelve reverse stock split of the Company's common shares, par value $0.01 per share, and a reduction in the total number of authorized common shares to 56,250,000 shares. The Company's shareholders approved the reverse stock split and change in authorized common shares at the Company's special meeting of shareholders held on December 23, 2015. This reduced the number of outstanding common shares from 344,239,098 shares to 28,686,561 shares. On December 17, 2015, the Company received notice from the NYSE that the Company was no longer in compliance with the NYSE's continued listing standards because the average closing share price of its common shares over a consecutive 30 trading-day period ending December 15, 2015 fell below the requirement to be at least $1.00 per share. The purpose of the reverse stock split was to increase the market price of the Company's common shares. The increased market price for our common shares as a result of implementing the reverse stock split cured this deficiency.
In June 2016, upon receiving shareholder approval, we further amended our Amended and Restated Articles of Incorporation to increase our total number of authorized common shares to 112,500,000.
On June 16, 2015, the Board approved a Shareholders’ Rights Plan, as subsequently amended and restated on January 14, 2016, or the Rights Plan, and authorized and declared a dividend distribution of one right for each outstanding share of common stock of the Company to stockholders. Each right entitled the holder to purchase from the Company one one-thousandth of a share of preferred stock at an exercise price of $50.00 per one one-thousandth of a preferred share.
The Rights Plan was intended to protect stockholders’ rights in the event of an unsolicited takeover attempt. It was not intended to prevent a takeover of the Company on terms that were favorable and fair to all shareholders and would not have interfered with a merger approved by the Board.
The rights would have generally become exercisable only if a person or group acquired beneficial ownership of 20% or more of the Company’s common stock in a transaction not approved by the Board and the Board did not redeem the rights within ten business days of such an event. If triggered, the right could have entitled the holder to one of the following:
To purchase, for the exercise price, a number of common shares having a then current market value of twice the exercise price,
To purchase, for the exercise price, one-thousandth of a share of preferred stock, or
SCORPIO BULKERS INC. AND SUBSIDIARIES
Notes to the Consolidated Financial Statements
(Dollars in thousands, except per share, per day and per vessel data)
The Board may have exchanged the rights, in whole or in part, for common shares at an exchange ratio of one to one or for cash or other securities having a value approximately equal to one share.
The rights expired on June 18, 2016.
During 2016, the Company issued a total of 51,679 shares, with a fair value of $0.2 million, to SSH pursuant to the Administrative Services Agreement in connection with the deliveries of our newbuilding vessels.
During 2016, the Company issued an aggregate of 44.0 million shares of common stock, par value $0.01 per share, at $3.00 per share in two separate underwritten public offerings. SSH and certain of the Company's directors purchased an aggregate of $10.3 million common shares at the public offering prices. The Company received approximately $128.1 million of net proceeds from the issuance.
On June 16, 2015, the Company issued 12,745,833 shares of
$242,800.On September 24, 2013 we issuedcommon stock, par value $0.01 per share at $18.00 per share in an underwritten public offering. SSH and soldcertain of our executive officers purchased an additional 33,400,000aggregate of 833,333 common shares for net proceeds of $290,490, as denominated in Norwegian kroner (NOK) as of that date, in Norwegian private placement transactions exempt from registration underat the Securities Act. As of September 24, 2013, we recorded a receivable from shareholders of $289,956, denominated in NOK, which was not paid until October 2013 when wepublic offering price. The company received $288,822 in full settlement of that receivable. The $1,134 difference between the amount initially recorded as a shareholder receivable and the amount subsequently collected was attributable to a change in exchange rate and recorded as foreign exchange loss on our consolidated statement of operations.
In November 2013 we received $291,000$218.6 million of proceeds from the issuance.
During 2015, the Company issued a total of 111,725 shares to SSH pursuant to the Administrative Services Agreement relating to the delivery of 28 vessels and the sale of 32,590,411 common20 vessels. The aggregate value of these shares that had been consummatedwas $2.4 million.
In 2014, the underwriters in
October 2013 in a Norwegian private transaction exempt from registration under the
Securities Act.OnCompany’s initial public offering, which closed on December 17, 2013, we received $284,018exercised in full their option to purchase an additional 391,250 common shares at the public offering price of proceeds from the$117.00 per share. The sale of 31,300,000these common shares resulted in our initial public offering.
net proceeds to the Company of approximately $42.4 million, after deducting underwriters’ discounts and commissions.
During 2014, the Company issued a total of 4,366 shares to SSH pursuant to the Administrative Services Agreement relating to two newbuilding Kamsarmax vessels delivered to us. The aggregate value of these shares was $0.5 million.
During 2014 the Company issued 3,333,333 Common shares through a Securities Purchase Agreement with certain institutional investors for the private placement of shares of its common stock, par value $0.01 per share for $150.0 million. Of this share issuance, SSH acquired 333,333 shares for $15.0 million.
The Scorpio Bulkers Inc. 2013 Equity Incentive Plan, or the Plan was approved by the Company’s Board and became effective on September 30, 2013 and was last amended effective June 29, 2016. Adjustments may be made to outstanding awards in the event of a corporate transaction or change in capitalization or other extraordinary event. In the event of a “change in control” (as defined in the plan), unless otherwise provided by the plan administrator in an award agreement, awards then outstanding will become fully vested and exercisable in full. The Board may amend or terminate the Plan and may amend outstanding awards, provided that no such amendment or termination may be made that would materially impair any rights, or materially increase any obligations, of a grantee under an outstanding award. Shareholder approval of plan amendments will be required under certain circumstances. As of December 31,
2013,2016 we
have: | ● | | 133,403,931 common shares outstanding,reserved a total of 3,970,580 common shares for issuance under the $0.01 par value of which is recorded as common stock of $1,334. |
| ● | | Paid-in capital of $1,109,185 which substantially represents the excess of net proceeds from common stock issuances over the par value. |
8. Equity Incentive Plan,
Our board subject to adjustment for changes in capitalization as provided in the Plan. The Plan is administered by the Compensation Committee. The Plan will remain in effect until the tenth anniversary of directors hasthe date on which the Plan was adopted an equity incentive plan, which we referby the Board, unless terminated, or extended by the Board. After this date, no further awards shall be granted pursuant to as the Equity Incentive Plan, under which directors, officersbut previously granted awards will remain outstanding in accordance with their applicable terms and employees of us and our subsidiaries are eligibleconditions.
Under the Plan, the Company is permitted to
receivegrant incentive stock options,
and non-qualified stock options, stock appreciation rights, restricted stock, restricted stock units and unrestricted common shares.
We reserved a total of 7,012,391 common shares, which includes an additional 2,150,370 common shares that our board of directors reserved for issuance under the plan on February 21, 2014,common shares for issuance under the Equity Incentive Plan, subject to adjustment for changes in capitalization as provided in the Equity Incentive Plan. Our Equity Incentive Plan is administered by our Compensation Committee. Under the terms of the
plan,Plan, stock options and stock appreciation rights granted under the
planPlan will have an exercise price equal to the fair market value of a common share on the date of grant, unless otherwise determined by the plan administrator, but in no event will the exercise price be less than the fair market value of a common share on the date of grant. Options and stock appreciation rights will be exercisable at times and under conditions as determined by the plan administrator, but in no event will they be exercisable later than ten years from the date of grant.
The Company did not grant any option awards or stock appreciation rights under the Plan during the three years ended December 31, 2016.
SCORPIO BULKERS INC. AND SUBSIDIARIES
Notes to the Consolidated Financial Statements
(Dollars in thousands, except per share, per day and per vessel data)
The plan administrator may grant shares of restricted stock and awards of restricted stock units subject to vesting, forfeiture and other terms and conditions as determined by the plan administrator.Adjustments may be made to outstanding awards Generally, restricted stock granted under the Plan vests in one of the event of a corporate transaction or change in capitalization or other extraordinary event. In the event of a “change in control” (as defined in the plan), unless otherwise provided by the plan administrator in an award agreement, awards then outstanding will become fully vested and exercisable in full.
Our board of directors may amend or terminate the plan and may amend outstanding awards, provided that no such amendment or termination may be made that would materially impair any rights, or materially increase any obligations, of a grantee under an outstanding award. Shareholder approval of plan amendments will be required under certain circumstances. Unless terminated earlier by our board of directors, the plan will expire ten years from the date the plan is adopted.
On September 30, 2013, we granted an aggregate of 2,775,000 restricted shares to officers and employees. Of this total, 1,395,000 restricted shares vestfollowing manners: (a) annually in three equal installments, on July 27, 2015, July 27, 2016 and July 27, 2017. The remaining 1,380,000 restricted shares vest in three equal installments on September 30, 2015, September 30, 2016 and September 30, 2017. The aggregate fair value of these awards is $26,918, which will be amortized as stock-based compensation expense, a component of general and administrative expense, overif the vesting periods of each grant.
On November 6, 2013, we granted 1,380,000 restricted sharesindependent director has continued to officers and employees of the Company. These restricted shares vest in three equal installmentsserve on November 6, 2015, November 6, 2016 and November 6, 2017. The fair value of these awards was $13,289, which will be amortized as stock-based compensation expense, a component of general and administrative expense, over the vesting periods of each grant.
On December 17, 2013, we granted 707,020 restricted shares to officers, members of the board of directors and employeesfrom the grant date to the applicable vesting date or (b) serial vest on each of the Company. Of these restricted shares, 617,020 restricted shares vest in three equal installmentssecond, third and fourth anniversaries of the date of grant so long as the award recipient is employed on such date. The Company recognizes share-based compensation expense (see Note 1,
Summary of Significant Accounting Polices) over this three-year period or four-year period, as applicable. The company recorded share-based compensation expense of $18.6 million $24.6 million and $23.9 million for the years ended December
17, 2015, December 17,31, 2016,
and December 17, 2017 and 90,000 restricted shares vest in three equal installments on December 17, 2014, December 17, 2015 and
December 17, 2016. The fair value of these2014, respectively, related to restricted stock awards,
was $6,780, which
will be amortized as stock-based compensation expense, a component of generalis included in General and administrative
expense, overexpenses in the
vesting periodsConsolidated Statement of
each grant.Operations.
A summary of activity for restricted stock awards during the three years December 31, 2016 is as follows:
|
| | | | | |
| | Number of Shares | | Weighted Average Grant Date Fair Value $ |
| Outstanding at December 31, 2013 | 405,156 |
| | 115.97 |
|
| Granted | 179,014 |
| | 111.71 |
|
| Vested | (2,499 | ) | | 116.40 |
|
| Outstanding at December 31, 2014 | 581,671 |
| | 114.66 |
|
| Granted | 804,035 |
| | 20.03 |
|
| Vested | (137,543 | ) | | 115.90 |
|
| Outstanding at December 31, 2015 | 1,248,163 |
| | 53.56 |
|
| Granted | 2,582,000 |
| | 3.26 |
|
| Vested | (208,266 | ) | | 107.82 |
|
| Forfeited | (21,564 | ) | | 51.50 |
|
| Outstanding at December 31, 2016 | 3,600,333 |
| | 14.36 |
|
As of December 31, 2016, there was $20.0 million of total unrecognized compensation cost related to restricted stock awards. These costs are expected to be recognized over the weighted average period of approximately 1 year. During 2016, restricted stock with a fair value of approximately $0.6 million vested.
SCORPIO BULKERS INC. AND SUBSIDIARIES
Notes to the Consolidated Financial Statements
(Dollars in thousands, except per share, per day and per vessel data)
During 2016, the Company and its lenders agreed to loan amendments that strengthened the Company’s balance sheet, liquidity position and financial flexibility. The Company’s long-term debt consists of Senior Notes and bank loans, summarized as follows:
|
| | | | | | | |
| | December 31, |
| (amounts in thousands) | 2016 | | 2015 |
| | | | |
| Senior Notes | $ | 73,625 |
| | $ | 73,625 |
|
| | | | |
| Bank Loans: | | | |
| $39.6 Million Credit Facility | $ | 20,144 |
| | $ | 30,754 |
|
| $409 Million Credit Facility | 167,816 |
| | 94,473 |
|
| $330 Million Credit Facility | 225,759 |
| | 173,950 |
|
| $42 Million Credit Facility | 38,512 |
| | 36,588 |
|
| $67.5 Million Credit Facility | 40,461 |
| | 29,666 |
|
| $411.3 Million Credit Facility | — |
| | 83,261 |
|
| $12.5 Million Credit Facility | 10,379 |
| | 11,750 |
|
| $27.3 Million Credit Facility | 19,375 |
| | — |
|
| | 522,446 |
| | 460,442 |
|
| Less: Current portion | (13,882 | ) | | (110,226 | ) |
| | $ | 508,564 |
| | $ | 350,216 |
|
|
| | | | | | | | | | | | | | | | | |
| | December 31, 2016 | | December 31, 2015 |
| (amounts in thousands) | Current | | Non-current | | Total | | Current | | Non-current | | Total |
| Total bank loans and senior notes, gross | 13,882 |
| | 582,188 |
| | 596,070 |
| | 110,226 |
| | 423,841 |
| | 534,067 |
|
| Unamortized deferred financing costs | (402 | ) | | (16,196 | ) | | (16,598 | ) | | (2,487 | ) | | (9,856 | ) | | (12,343 | ) |
| Total bank loans and senior notes, net | 13,480 |
| | 565,992 |
| | 579,472 |
| | 107,739 |
| | 413,985 |
| | 521,724 |
|
The future principal and estimated interest payments (based on the interest rates in effect as of December 31, 2016) under the Company’s long-term debt over the next five years on our Senior Notes and credit facilities as of December 31, 2016 is as follows:
|
| | | | | | |
| (amounts in thousands) | Principal | Interest | Total |
| 2017 | 13,883 |
| 26,116 |
| 39,999 |
|
| 2018 | 21,515 |
| 25,280 |
| 46,795 |
|
| 2019 | 95,727 |
| 23,032 |
| 118,759 |
|
| 2020 | 221,543 |
| 17,880 |
| 239,423 |
|
| 2021 | 206,952 |
| 5,915 |
| 212,867 |
|
| Thereafter | 36,450 |
| 1,903 |
| 38,353 |
|
| Total | 596,070 |
| 100,126 |
| 696,196 |
|
Unsecured Senior Notes
On September 22, 2014, the Company issued $65.0 million in aggregate principal amount of 7.5% Senior Notes due September 2019, or the Senior Notes, and on October 16, 2014 the Company issued an additional $8.6 million aggregate principal amount
SCORPIO BULKERS INC. AND SUBSIDIARIES
Notes to the Consolidated Financial Statements
(Dollars in thousands, except per share, per day and per vessel data)
of Senior Notes when the underwriters partially exercised their option to purchase additional Senior Notes on the same terms and conditions.
All terms mentioned are defined in the indenture.
The Senior Notes will mature on September 15, 2019 and bear interest at a rate of 7.5% per year, payable quarterly on each March 15, June 15, September 15 and December 15. The Senior Notes are redeemable at the Company’s option in whole or in part, at any time on or after September 15, 2016 at a redemption price equal to 100% of the principal amount to be redeemed plus accrued and unpaid interest to, but excluding, the redemption date.
The Senior Notes are our senior unsecured obligations and rank equally with all of our existing and future senior unsecured and unsubordinated debt and are effectively subordinated to our existing and future secured debt, to the extent of the value of the assets securing such debt, and will be structurally subordinated to all existing and future debt and other liabilities of our subsidiaries. No sinking fund is provided for the Senior Notes. The Senior Notes were issued in minimum denominations of $25.00 and integral multiples of $25.00 in excess thereof and are listed on the New York Stock Exchange under the symbol “SLTB”. The Senior Notes require us to comply with certain covenants, including financial covenants; restrictions on consolidations, mergers or sales of assets and prohibitions on paying dividends or returning capital to equity holders if a covenant breach or an event of default has occurred or would occur as a result of such payment. If the Company undergoes a change of control, holders may require us to repurchase for cash all or any portion of their notes at a change of control repurchase price equal to 101% of the principal amount of the notes to be repurchased, plus accrued and unpaid interest to, but excluding, the change of control purchase date.
The financial covenants include:
Net borrowings shall not equal or exceed 70% of total assets.
Tangible net worth shall always exceed $500.0 million.
As of December 31, 2016, we were in compliance with the financial covenants relating to the Senior Notes.
In December 2016, our Board of Directors authorized the repurchase of up to $20.0 million of our outstanding Senior Notes in open market or privately negotiated transactions. The specific timing and amounts of the repurchases, which will be funded by available cash, will be in the sole discretion of management and vary based on market conditions and other factors. This authorization has no expiration date. As of December 31, 2016, the full $20.0 million remains available for repurchases under this authorization.
SCORPIO BULKERS INC. AND SUBSIDIARIES
Notes to the Consolidated Financial Statements
(Dollars in thousands, except per share, per day and per vessel data)
Secured Credit Facilities
The Company had seven credit agreements in place, which are all collateralized by certain of the Company’s vessels. The following is a summary of those credit agreements as of December 31, 2016.
|
| | | | | | | | | | | | | | | | | | | | | |
| ($000’s) | | $39.6 Million Credit Facility | | $409 Million Credit Facility | | $330 Million Credit Facility | | $42 Million Credit Facility | | $67.5 Million Credit Facility | | $12.5 Million Credit Facility | | $27.3 Million Credit Facility |
| Date of Agreement | | June 27, 2014 | | December 30, 2014 | | July 29, 2014 | | January 30, 2015 | | July 30, 2014 | | December 22, 2015 | | December 22, 2015 |
| | | | | | | | | | | | | | | |
| Total Vessels to be Financed | | | | | | | | | | | | | | |
| Kamsarmax | | 2 |
| | 8 |
| | 6 |
| | 2 |
| | 2 |
| | — |
| | — |
|
| Ultramax | | — |
| | 7 |
| | 15 |
| | 1 |
| | 2 |
| | 1 |
| | 2 |
|
| | | | | | | | | | | | | | | |
| Interest Rate-LIBOR+ | | 2.925 | % | | 3.000 | % | | 2.925 | % | | 2.970 | % | | 2.950 | % | | 3.000 | % | | 2.950 | % |
| | | | | | | | | | | | | | | |
| Commitment Fee | | 1.170 | % | | 1.200 | % | | 1.170 | % | | 1.120 | % | | 1.250 | % | | — | % | | 1.180 | % |
| | | | | | | | | | | | | | | |
| Maturity Date | | September 28, 2020 | | December 30, 2020 | | July 29, 2021 | | 6 years from each Kamsarmax drawdown and September 21, 2021 on the Ultramax tranche
| | 7 years from each drawdown | | December 22, 2020 | | 5 years from each drawdown |
| | | | | | | | | | | | | | | |
| Amount drawn down (in thousands) | | 33,550 |
| | 207,569 |
| | 255,825 |
| | 48,870 |
| | 53,816 |
| | 11,750 |
| | 23,250 |
|
| | | | | | | | | | | | | | | |
| Amount outstanding (in thousands) | | 20,144 |
| | 167,816 |
| | 225,759 |
| | 38,512 |
| | 40,461 |
| | 10,379 |
| | 19,375 |
|
| | | | | | | | | | | | | | | |
| Carrying Value of Vessels Collateralized (in thousands) | | 62,040 |
| | 404,650 |
| | 487,195 |
| | 97,297 |
| | 116,538 |
| | 30,988 |
| | 63,172 |
|
| | | | | | | | | | | | | | | |
| Amount Available (in thousands) | | — |
| | 13,200 |
| | 38,400 |
| | — |
| | — |
| | — |
| | — |
|
| | | | | | | | | | | | | | | |
| Remaining Vessels to be Financed | | — |
| | 1 |
| | 3 |
| | — |
| | — |
| | — |
| | — |
|
| | | | | | | | | | | | | | | |
The loan amendments discussed below were accounted for as debt modifications in accordance with ASC 470, Debt.
$39.6 Million Credit Facility
During 2016, the Company reached agreements with the lender to add eight quarterly installment payments to the balloon payment in exchange for an advance principal repayment of approximately $4.7 million and to not make the installment payments falling due in the first quarter of 2018 in exchange for an advance principal repayment of approximately $0.5 million. As a result of these agreements, the Company will not have to make quarterly installment payments until the second quarter of 2020.
The Company also reached an agreement with the lender to extend the maturity date of this facility from March 20, 2013 (dateJune 2019 to September 2020 subject to the Company meeting certain conditions on or before June 2019.
SCORPIO BULKERS INC. AND SUBSIDIARIES
Notes to the Consolidated Financial Statements
(Dollars in thousands, except per share, per day and per vessel data)
$330.0 Million Credit Facility
During 2016, the Company reached agreements whereby quarterly installment payments on certain of inception)the existing debt were waived until the second quarter of 2017 in exchange for prepayments totaling $23.8 million. Installment payments on certain of the other existing debt and new debt will be paid as per the original loan agreement. The lenders also agreed to extend the availability period of the credit facility to June 30, 2017 (from December 31, 2016) in order to accommodate delivery delays of certain vessels. The Company also agreed to reduce the available loan amount by approximately $16.8 million, for which $0.6 million of deferred financing costs were written off. This write-off is reflected in financing costs in the Consolidated Statement of Operations.
$67.5 Million Credit Facility
During 2015, the Company reached an agreement to reduce the amount drawn down by any quarterly installments that would have been paid through December 31, 2016 and the quarterly payments would not begin until 2017. During 2016, the Company and lender further agreed to add eight quarterly installment payments to the balloon payment in exchange for an advance principal repayment of approximately $8.0 million. The Company also reached an agreement with the lender to reduce the available loan amount by approximately $4.4 million, while making an additional advance principal repayment of approximately $2.5 million. The Company wrote off approximately $0.2 million of deferred financing costs, which is included in financing costs in the Consolidated Statement of Operations related to this reduction. As a result of these agreements, the Company will not have to make quarterly installment payments until the first quarter of 2021.
$409.0 Million Credit Facility
During 2016, the Company reached agreements with the lenders to defer between seven and eight quarterly installment payments to between the first and fourth quarter of 2020, depending on the vessel, in exchange for an advance principal repayments of approximately $26.8 million (calculated on the basis of loan amounts available for undelivered ships), which was made during 2016 or, where applicable, will be made upon drawdown.
During 2016, the Company also agreed to reduce the available loan amount by approximately $38.6 million for which the Company wrote off $3.0 million of deferred financing costs. This is included in financing costs in the Consolidated Statements of Operations.
In addition, the lenders also agreed to extend the availability period of the credit facility to February 28, 2017 in order to accommodate delivery delays of certain vessels.
$42.0 Million Credit Facility
During 2016, the Company signed an amendment with the lender for a $10.9 million upsize to its original $42 million senior secured credit facility. The proceeds of the upsized commitment financed a portion of the purchase price of one Ultramax vessel that was delivered to the Company in the third quarter of 2015.
During 2016, the Company also reached agreements with the lender to add eight quarterly installment payments to the balloon payment in exchange for an advance principal repayment of approximately $6.5 million. In addition, the Company agreed with the lender to not make installment payments due in the first quarter of 2018 in exchange for approximately $0.8 million. As a result of these agreements, the Company will not have to make quarterly installment payments until the second quarter of 2020.
$12.5 Million Credit Facility
During 2016, the Company reached an agreement with the lender to add four quarterly installment payments to the balloon payment in exchange for an advance principal repayment of approximately $0.8 million. As a result of this agreement, the Company will not have to make quarterly installment payments until the fourth quarter of 2018.
$27.3 Million Credit Facility
During 2016, the Company reached agreements with the lender to add eight quarterly installment payments to the balloon payment in exchange for an advance principal repayment of $3.1 million. In addition the Company agreed with the lender to not make installment payments falling due between and the second and third quarters of 2018 in exchange for approximately $0.8 million. As a result of these agreements, the Company will not have to make quarterly installment payments until the fourth quarter of 2020.
SCORPIO BULKERS INC. AND SUBSIDIARIES
Notes to the Consolidated Financial Statements
(Dollars in thousands, except per share, per day and per vessel data)
Each of these seven credit agreements, as amended through December 31, 2016, has financial covenants with which we must comply (based on terms defined in the credit agreements), the most stringent by facility are as follows:
The ratio of net debt to total capitalization no greater than 0.60 to 1.00.
Consolidated tangible net worth (adjusted for a minimum amount of $100.0 million in historical non-operating costs and to exclude certain future non-operating items, including impairments) no less than $500.0 million plus (i) 25% of cumulative positive net income (on a consolidated basis) for each fiscal quarter commencing on or after December 31, 2013 and (ii) 50% of the value of any new equity issues occurring on or after December 31, 2013.
The ratio of EBITDA to net interest expense calculated on a year to date basis of greater than 1.00 to 1.00 for the quarters ending March 31, 2019 and June 30, 2019, 2.50 to 1.00 for the quarter ending September 30, 2019, calculated on a year-to-date basis and 2.50 to 1.00 for each quarter thereafter, calculated on a trailing four quarter basis.
Minimum liquidity of not less than the greater of $25.0 million or $0.7 million per owned vessel.
Maintain a minimum fair value of the collateral for each credit facility, such that the aggregate fair value of the vessels collateralizing the credit facility is
140%, except in the case of our $67.5 Million Credit Facility, for which it is 115% of the aggregate principal amount outstanding under such credit facility, or, if we do not meet these thresholds to prepay a
follows:| | | | | | Weighted | |
| | | | | | Average | |
| | | | | | Grant | |
| | | Number of | | | Date Fair | |
| | | Shares | | | Value | |
| Outstanding and nonvested, March 20, 2013 | | | — | | | | | |
| | | | | | | | | |
| Granted | | | 4,862,020 | | | $ | 9.66 | |
| Vested | | | — | | | | — | |
| Forfeited | | | — | | | | — | |
| Outstanding and nonvested, December 31, 2013 | | | 4,862,020 | | | $ | 9.66 | |
portion of the loan or provide additional security to eliminate the shortfall. TheIn addition to the credit agreements described above, which are in effect as of December 31, 2016, the Company entered into the following table summarizescredit agreement which was repaid in full during the amortization,year ended December 31, 2016:
On January 15, 2015, the Company signed a loan agreement for up to $411.3 million, or the $411.3 Million Credit Facility, which willwas originally planned to be includedused to finance a portion of 12 Capesize vessels. However, all Capesize vessels and Capesize vessels under construction were sold and $83.3 million, which was outstanding under this facility at December 31, 2015 was fully repaid in generalJanuary 2016 and administrative expenses,the credit facility was closed.
Our credit facilities discussed above have, among other things, the following restrictive covenants which would restrict our ability to:
incur additional indebtedness;
sell the collateral vessel, if applicable;
make additional investments or acquisitions;
pay dividends; and
effect a change of control of us.
In addition, our credit facilities contain customary events of default, including cross-default provisions. As of December 31, 2016, we are in compliance with the financial covenants of each of our seven credit facilities. We expect to remain in compliance with the financial covenants of each of our seven credit facilities for the next twelve months.
Interest rates on all of the Company’s restricted stock grantssecured credit facilities during the year ended December 31, 2016 ranged from 2.23% to 6.25%. The Company records its interest expense, all of which was capitalized until the fourth quarter of 2015, as a component of Financial expense, net on its Consolidated Statement of Operations. For the years ended December 31, 2016, 2015 and 2014, Financial expense, net consists of:
|
| | | | | | | | | | | |
| | Year ended December 31, |
| (in thousands) | 2016 | | 2015 | | 2014 |
| Interest expense | $ | 16,002 |
| | $ | 998 |
| | $ | — |
|
| Amortization of deferred financing costs | 4,137 |
| | 1,988 |
| | 150 |
|
| Write off | 3,781 |
| | 16,085 |
| | — |
|
| other, net | 1,001 |
| | 453 |
| | 22 |
|
| | $ | 24,921 |
| | $ | 19,524 |
| | $ | 172 |
|
SCORPIO BULKERS INC. AND SUBSIDIARIES
Notes to the Consolidated Financial Statements
(Dollars in thousands, except per share, per day and per vessel data)
| |
| 12. | Fair value of financial instruments |
The carrying amount and fair value of financial instruments at December 31, 2016 and 2015 were as follows (in thousands): |
| | | | | | | | | | | | | | | |
| | 2016 | | 2015 |
| | Carrying value | | Fair Value | | Carrying value | | Fair Value |
| Financial assets: | | | | | | | |
| Cash and cash equivalents | $ | 101,734 |
| | $ | 101,734 |
| | $ | 200,300 |
| | $ | 200,300 |
|
| | | | | | | | |
| Financial liabilities: | | | | | | | |
| Bank loans | 507,273 |
| | 507,273 |
| | 450,053 |
| | 450,053 |
|
| Senior Notes | 72,199 |
| | 65,850 |
| | 71,671 |
| | 36,813 |
|
Fair value is the price that would be received to sell an asset or paid to transfer a liability in an orderly transaction between market participants at the measurement date. In determining fair value, various methods are used including market, income and cost approaches. Based on these approaches, certain assumptions that market participants would use in pricing the asset or liability are used, including assumptions about risk and/or the risks inherent in the inputs to the valuation technique. These inputs can be readily observable, market-corroborated, or generally unobservable firm inputs. Valuation techniques that are used maximize the use of observable inputs and minimize the use of unobservable inputs. Based on the observability of the inputs used in the valuation techniques, fair value measured financial instruments are categorized according to the fair value hierarchy prescribed by ASC 820, Fair Value Measurements and Disclosures. The fair value hierarchy ranks the quality and reliability of the information used to determine fair values. Financial assets and liabilities carried at fair value are classified and disclosed in one of the following three categories:
Level 1: Fair value measurements using unadjusted quoted market prices in active markets for identical, unrestricted assets or liabilities.
Level 2: Fair value measurements using correlation with (directly or indirectly) observable market-based inputs, unobservable inputs that are corroborated by market data, or quoted prices in markets that are not active.
Level 3: Fair value measurements using inputs that are significant and not readily observable in the market.
Cash and cash equivalents comprise cash on hand and demand deposits, and other short-term highly-liquid investments with original maturities of three months or less, and that are readily convertible to a known amount of cash and are subject to an insignificant risk of changes in value. The carrying value of cash and cash equivalents approximates fair value due to the short-term nature of these instruments.
The carrying value of our secured bank loans are measured at amortized cost using the effective interest method. The Company believes the carrying amounts of its bank loans at December 31, 2016 and December 31, 2015 approximate fair value because the interest rates on these instruments change with, or approximate, market interest rates. These amounts are shown net of $15.2 million and $10.4 million of unamortized deferred financing fees, on our consolidated balance sheet as of December 31,
2013:| Restricted Stock Grant Date: | | | | | | | | | | | | | | | |
| | | 2014 | | | 2015 | | | 2016 | | | 2017 | | | Total | |
| September 30, 2013 | | $ | 10,084 | | | $ | 8,456 | | | $ | 4,330 | | | $ | 1,506 | | | $ | 24,376 | |
| November 6, 2013 | | | 4,797 | | | | 4,463 | | | | 2,367 | | | | 940 | | | | 12,567 | |
| December 17, 2013 | | | 2,655 | | | | 2,335 | | | | 1,221 | | | | 474 | | | | 6,685 | |
| Total by year | | $ | 17,536 | | | $ | 15,254 | | | $ | 7,918 | | | $ | 2,920 | | | $ | 43,628 | |
For the period from March 20, 2013 (date of inception) to2016 and December 31, 2013, we incurred $3,3592015, respectively.
The Senior Notes are publicly traded on the New York Stock Exchange and are considered a level 1 item. The carrying values shown in the table are the face value of compensation cost relatingthe notes net of $1.4 million and $2.0 million of unamortized deferred financing fees as of December 31, 2016 and December 31, 2015, respectively.
Certain of the Company’s assets and liabilities are carried at contracted amounts that approximate fair value. Assets and liabilities that are recorded at contracted amounts approximating fair value consist primarily of balances with related parties, prepaid expenses and other current assets, accounts payable and accrued expenses.
The Company believes the carrying amounts of its bank loans at December 31, 2016 and December 31, 2015 approximate fair value because the interest rates on these instruments change with, or approximate, market interest rates.
SCORPIO BULKERS INC. AND SUBSIDIARIES
Notes to the amortizationConsolidated Financial Statements
(Dollars in thousands, except per share, per day and per vessel data)
Certain items are measured at fair value on a non-recurring basis. The table below details the portion of restricted stock awards.those items that we re-measured at fair value during 2015 and the resultant loss recorded.
|
| | | | | | | | | | | | | | | | | | | |
| | Fair Value Using |
| December 31, 2015 | Total | | Level 1 | | Level 2 | | Level 3 | | Total Losses |
| Assets held for sale | $ | 338,048 |
| | $ | — |
| | $ | — |
| | $ | 338,048 |
| | $ | 418,521 |
|
| Total | $ | 338,048 |
| | $ | — |
| | $ | — |
| | $ | 338,048 |
| | $ | 418,521 |
|
Assets Held for Sale
The fair value of assets held for sale (see Note 6) was determined based on the selling price, net of estimated costs to sell, of such assets based on negotiated contracts, and are considered to be Level 3 items. During 2015, assets held for sale was with a carrying value of $756.6 million was written down to its implied fair value of $338.0 million, resulting in a charge of $418.5 million.
F-18 | |
| 13. | Related Party Transactions |
Our Co-Founder, Chairman and Chief Executive Officer, Mr. Emanuele Lauro, is a member of the Lolli-Ghetti family, which in 2009 founded Scorpio Tankers Inc. (NYSE: “STNG”), or Scorpio Tankers, a large international shipping company engaged in seaborne transportation of refined petroleum products, of which Mr. Lauro is currently the Chairman and Chief Executive Officer. The Lolli-Ghetti family also owns and controls the Scorpio Group, including Scorpio Ship Management S.A.M., or SSM, which provides us with vessel technical management services, Scorpio Commercial Management S.A.M., or SCM, which provides us with vessel commercial management services, Scorpio Services Holding Limited, or SSH, which provides us and other related entities with administrative services and services related to the acquisition of vessels and Scorpio UK Limited, or SUK which provides us with chartering services. In addition, our Vice President, Mr. Filippo Lauro is the brother of Mr. Emanuele Lauro and a member of the Lolli-Ghetti family. Our Co-Founder, President and Director, Mr. Robert Bugbee is also the President and a Director of Scorpio Tankers and has a senior management position at the Scorpio Group.
9. General and Administrative Expenses
Most of our $5,505 of general and administrative expenses for the period from March 20, 2013 (date of inception) to December 31, 2013, relates to our senior management’s compensation including salaries which were accrued since July 1, 2013, and $3,359 of amortization of restricted stock amortization.
10. Related Party Transactions
We entered into an Administrative Services Agreement, as amended from time to time, with Scorpio Services Holding Limited, or SSH, a party related to us, for the provision of administrative staff, office space and accounting, legal compliance, financial and information technology services. Under the terms of this agreement,services for which we reimburse SSH for the reasonable direct orand indirect expenses it incurs in providing us with such services. Such costs are classified as general and administrative in the administrative services described above. Consolidated Statement of Operations.
SSH also arranges vessel sales and purchases for us.
The services provided to us by SSH may be sub-contracted to other entities within the Scorpio Group. For the period from March 20, 2013 (date of inception) to December 31, 2013, SSH charged us $21 for administrative costs.Pursuant to the Administrative Services Agreement, we will reimburse SSH for the reasonable direct or indirect expenses it incurs in providing us with the administrative services described above and a pro-rata portion of the salary incurred by SSH for an internal auditor. We will also pay SSH a fee, payable in the Company’s common shares, for arranging vessel acquisitions, including newbuildings, equal to $250,000 per vessel, due upon delivery of the vessel, which is payable in our common shares. We have agreed to issue upon delivery of each vessel (i) 31,250 common shares to SSH as payment related to each of the first 17 vessels in our Newbuilding Program; (ii) 25,811 common shares to SSH as payment related to each of the next nine vessels in our Newbuilding Program; (iii) 25,633 common shares to SSH as payment related to each of the next ten vessels in our Newbuilding Program; (iv) 26,419 common shares to SSH as payment related to each for the next four Kamsarmax vessels in our Newbuilding Program; and (v) 26,185 common shares to SSH as payment related to each of the next three Capesize vessels in our Newbuilding Program; (vi) 26,197 common shares to SSH as payment related to each of the next two vessels in our Newbuilding Program; (vii) 26,396 common shares to SSH as payment related to each of the next seven vessels in our Newbuilding Program; (viii) 26,248 common shares to SSH as payment related to each of the next four vessels in our Newbuilding Program; (ix) 26,111 common shares to SSH as payment related to each of the next four vessels in our Newbuilding Program; (x) 26,050 common shares to SSH as payment related to each of the next three vessels in our Newbuilding Program; (xi) 25,888 common shares to SSH as payment related to each of the next 11 vessels in our Newbuilding Program and (xii) 25,438 common shares to SSH as payment related to each of the next five vessels in our Newbuilding Program. For all vessels added to our Newbuilding Program after the first 17 vessels, the numbernewbuildings. The amount of common shares issuable to SSH as payment is based onpayable was determined by dividing $250,000 by the market value of our common shares based on the volume weighted average price of our common shares over the 30 trading day period immediately preceding the contract date of a definitive agreement to acquire any vessel. During 2016 we issued 51,679 shares, of our common shares to SSH. During the years ended December 31, 2015 and 2014 we issued 111,725 and 4,366 shares, respectively, of our common shares to SSH. We will deliver an additional 12,946 shares upon delivery of six vessels currently under construction. In addition, SSH has agreed with us not to own any drybulk carriers greater than 30,000 dwt for so long as the Administrative Services Agreement is in full force and effect. This agreement may be terminated by SSH three years after thisthe third anniversary of our initial public offering upon 12 monthsmonths’ notice or by us with 24 months’ notice.
In November 2014, SSH agreed to waive its fee on vessel acquisitions contracted after November 20, 2014, for so long as the closing price of our common shares remained below a specified threshold. Effective September 29, 2016, the Company amended the terms of its Administrative Services Agreement with SSH and this fee was eliminated on all future acquisitions.
The services provided to us by SSH may be sub-contracted to other entities within the Scorpio Group.
During July 2013,November 2014, we issued and sold 1,250,000 common333,333 shares to SSH for $10,000$15.0 million as part of a seriesprivate placement transaction.
During June 2015, we issued and sold 833,333 shares to SSH for $15.0 million as part of Norwegian private transactions exempt from registration undera public offering.
During March 2016, we issued 5,000,000 shares to SSH for $15.0 million as part of a public offering.
SCORPIO BULKERS INC. AND SUBSIDIARIES
Notes to the Securities Act. These commonConsolidated Financial Statements
(Dollars in thousands, except per share, per day and per vessel data)
During June 2016, we issued 5,250,000 shares
are subject to
SSH for $16.0 million as part of a
contractual lock-up until July 2014.Our vessels are commercially managed by Scorpio Commercial Management S.A.M. (“SCM”)SCM and technically managed by SSM pursuant to a Master Agreement, as amended and restated from time to time, or the Amended and Restated Master Agreement, which may be terminated by either party upon 24 months notice. SCM and SSM are companies affiliatedmonths’ notice, unless terminated earlier in accordance with us. In addition, our Co-founder, Chairman and Chief Executive Officer, Emanuele Lauro, is a memberthe provisions of the Lolli-Ghetti family,Amended and Restated Master Agreement. In the event of a sale of one or more vessels, a notice period of three months’ and a payment equal to three months of management fees will apply, provided that the termination does not amount to a change of control, including a sale of substantially all vessels, in which owns and controls SCM, our commercial manager, and SSM, our technical manager. We expect that additionalcase a payment equal to 24 months of management fees will apply. Additional vessels that wethe Company may acquire in the future will also be managed under the Amended and Restated Master Agreement or on substantially similar terms.
SCM’s
commercial management services include securing employment for our vessels in the spot market and on time charters. SCM also manages the Scorpio Group Pools (spot market-oriented vessel
pools, which includepools) including the Scorpio
LR2Ultramax Pool, the Scorpio
Panamax Tanker Pool, the Scorpio MRKamsarmax Pool and the
currently inactive Scorpio
Handymax Tanker Pool)Capesize Pool in which our owned and
will manage thetime chartered-in vessels are employed and from which we generate a significant portion of our revenue. The Scorpio Ultramax Pool, the Scorpio Kamsarmax Pool and the Scorpio Capesize Pool
in which we expect our Newbuilding Program will be employed and in which our time chartered-in vessels are employed. For commercial management of any of our vessels that does not operate in one of these pools, we will pay SCM a daily fee of $300 per vessel, plus a 1.75% commission on the gross revenues per charter fixture. The Scorpio Ultramax Pool and the Scorpio Kamsarmax Pool participants, including us and third-party owners of similar vessels,
are each expected to pay SCM a pool management fee of $300 per vessel per day, plus a 1.75% commission on the gross revenues per charter fixture.
We typically have balances due from these pools, consisting primarily of working capital, undistributed earnings and reimbursable costs. These receivables are either classified as current or non-current assets within the Consolidated Balance Sheet depending upon whether the associated vessel is expected to exit the pool within the next 12 months. We are also allocated general and administrative expenses from SCM.
For the commercial management of any of our vessels that do not operate in one of these pools, we pay SCM a daily fee of $300 per vessel, plus a 1.75% commission on the gross revenues per charter fixture, which are classified as voyage expenses in the Consolidated Statement of Operations.
Effective November 20, 2014, SCM agreed to reduce, with respect to our vessels, the 1.75% commission to 1.00% until the first day when the closing price of the Company’s common shares was not less than $117 per share, adjusted to include all equity restructuring and authorized dividends paid on the Company’s share capital, at which time the commission would revert to 1.75%. The reduction in commission expense is classified as vessel revenues in the Consolidated Statement of Operations.
Effective September 29, 2016, pursuant to the terms of the Amended and Restated Master Agreement, effective beginning on the fifth day within any 20 trading day period that the closing price of the Company's common shares on the New York Stock Exchange is equal to or greater than $5.00, the commission payable for commercial management to SCM will be reinstated to 1.75% of all monies earned by a vessel from 1.00%. As of close of trading on the NYSE on November 18, 2016, the condition was met and the commission payable for commercial management was reinstated to 1.75% of all monies earned by a vessel, effective November 19, 2016.
The Scorpio Kamsarmax Pool and the Scorpio Ultramax Pool were significant customers for the year ended December 31, 2016, accounting for 40% and 60% of our total vessel revenue (including commissions from SCM), respectively. During year ended December 31, 2015, the Scorpio Kamsarmax Pool, the Scorpio Ultramax Pool and the Scorpio Capesize Pool accounted for 41% and 43% and 8% of our total vessel revenue (including commissions from SCM), respectively. During year ended 12/31/2014, the Scorpio Kamsarmax Pool and the Scorpio Ultramax Pool accounted for 71% and 21% of our total vessel revenue (including commissions from SCM), respectively.
Prior to the amendment to the Amended and Restated Master Agreement on September 29, 2016, contracts for the construction of vessels that were sold or cancelled prior to the Company taking delivery of the vessels resulted in a termination fee of $0.5 million per vessel and the termination fee for a vessel which was under SCM management was two years of daily fees of $300, or $0.2 million per vessel plus 1.00% of the estimated revenue SCM would have generated for the vessel over the next two years. This fee is classified as a loss/write off of vessels and assets held for sale in the Consolidated Statement of Operations.
Following the amendment to the Amended and Restated Master Agreement on September 29, 2016, the fees due for a termination of the commercial management arrangements in the event of the sale of one or more vessels, provided it does not amount to a change of control of the Company, including a sale of substantially all vessels, have been reduced to a three month notice period and payment equal to three months of management fees.
SSM’s technical management services include providing technical support, such as arranging the hiring of qualified officers and crew, supervising the maintenance and performance of vessels, purchasing supplies, spare parts and new equipment, arranging and supervising drydocking and repairs, and monitoring regulatory and classification society compliance and customer standards.
SCORPIO BULKERS INC. AND SUBSIDIARIES
Notes to the Consolidated Financial Statements
(Dollars in thousands, except per share, per day and per vessel data)
We will pay SSM an annual fee of $200,000$0.2 million per vessel to provide technical management services for each of our vessels upon delivery. delivery, which is a component of vessel operating cost in the Consolidated Statement of Operations.
In addition, representatives of SSM
including certain subcontractors, provide us with construction supervisory services while our vessels are being constructed in shipyards.
For these services,In addition to the supervisory fee, we
will compensate SSM for its direct expenses
in assisting with the supervision, which can vary between
$200,000$0.2 million and
$500,000$0.5 million per vessel.
11. Subsequent Events
Underwriters Exercise Option
Prior to
Purchase Additional SharesIn January 2014, the underwriters inamendment to the Company’s initial public offering, which closedAmended and Restated Master Agreement on December 17, 2013, exercised in full their option to purchase an additional 4,695,000 common shares atSeptember 29, 2016, contracts for the public offering priceconstruction of $9.75 per share. The sale of these common shares resulted in net proceedsvessels that were sold or canceled prior to the Company of approximately $42,572, after deducting underwriters’ discounts and commissions.
Newbuilding vessel orders
In January 2014, the Company announced that it had entered into agreements for the purchase of 20 Capesize dry bulk vessels and two Kamsarmax dry bulk vessels. The total purchase price for these 22 vessels is approximately $1,172,700 and the deliveriestaking delivery of the vessels resulted in a termination fee of $0.5 million per vessel and the termination fee for a vessel which was under SSM management was two years of annual fees of $0.2 million per vessel, or $0.4 million per vessel. This fee is classified as a loss/write off of vessels and assets held for sale in the Consolidated Statement of Operations.
Following the amendment to the Amended and Restated Master Agreement on September 29, 2016, the fees due for a termination of the technical management arrangements in the event of the sale of one or more vessels, provided it does not amount to a change of control of the Company, including a sale of substantially all vessels, have been reduced to a notice period of three months and a payment equal to three months of management fees.
SUK will allocate salaries of certain SUK employees to the Company for services performed for the Company.
Transactions with entities controlled by the Lolli-Ghetti family and with Scorpio Tankers (herein referred to as related party affiliates) in the Consolidated Statement of Operations and Consolidated Balance Sheet are expectedsummarized in the following tables (in thousands).
|
| | | | | | | | | | | | |
| | | Year Ended December 31, |
| | | 2016 | | 2015 | | 2014 |
| Vessel revenue | | | | | | |
| Scorpio Kamsarmax Pool | | $ | 31,319 |
| | $ | 25,151 |
| | $ | 34,986 |
|
| Scorpio Ultramax Pool | | 46,227 |
| | 26,338 |
| | 10,196 |
|
| Scorpio Capesize Pool | | — |
| | 4,857 |
| | — |
|
| SCM | | 856 |
| | 718 |
| | 31 |
|
| Total vessel revenue | | $ | 78,402 |
| | $ | 57,064 |
| | $ | 45,213 |
|
| Voyage expense: | | | | | | |
| SCM | | $ | 319 |
| | $ | 664 |
| | $ | 148 |
|
| Vessel operating cost: | | | | | | |
| SSM | | $ | 7,191 |
| | $ | 2,765 |
| | 122 |
|
| General and administrative expense: | | | | | | |
| SCM | | $ | 43 |
| | $ | 258 |
| | $ | — |
|
| SSM | | — |
| | — |
| | 51 |
|
| SSH | | 3,949 |
| | 1,265 |
| | 56 |
|
| SUK | | 862 |
| | 486 |
| | 717 |
|
| Total general and administrative expense | | $ | 4,854 |
| | $ | 2,009 |
| | $ | 824 |
|
| Write down on assets held for sale | | | | | | |
| SCM | | $ | 500 |
| | $ | 12,465 |
| | $ | — |
|
| SSM | | 500 |
| | 13,000 |
| | — |
|
| Total write down on assets held for sale | | $ | 1,000 |
| | $ | 25,465 |
| | $ | — |
|
SCORPIO BULKERS INC. AND SUBSIDIARIES
Notes to occurthe Consolidated Financial Statements
(Dollars in thousands, except per share, per day and per vessel data)
At December 31, 2016 and December 31, 2015, we had the following balances with related parties, which have been included in the Consolidated Balance Sheet: |
| | | | | | | |
| | December 31, |
| | 2016 | | 2015 |
| Assets | | | |
| Due from related parties-current: | | | |
| Scorpio Kamsarmax Pool | $ | 2,579 |
| | $ | 3,376 |
|
| Scorpio Ultramax Pool | 1,661 |
| | 2,129 |
|
| Scorpio Capesize Pool | — |
| | 2,268 |
|
| SCM | — |
| | 424 |
|
| Total due from related parties-current | $ | 4,240 |
| | $ | 8,197 |
|
| Due from related parties non-current: | | | |
| Scorpio Kamsarmax Pool | $ | 4,606 |
| | $ | 4,868 |
|
| Scorpio Ultramax Pool | 6,633 |
| | 7,657 |
|
| Total due from related parties non-current | $ | 11,239 |
| | $ | 12,525 |
|
| Liabilities | | | |
| Due to related parties-current : | | | |
| SCM | $ | 507 |
| | $ | 3,415 |
|
| SSM | 209 |
| | 4,274 |
|
| SSH | 321 |
| | — |
|
| Less balances due to SCM and SSM included in assets held for sale | — |
| | (7,065 | ) |
| Total due to related parties-current | $ | 1,037 |
| | $ | 624 |
|
SCORPIO BULKERS INC. AND SUBSIDIARIES
Notes to the Consolidated Financial Statements
(Dollars in thousands, except per share, per day and per vessel data)
As of December 31, 2016, the Company is organized by vessel type into two operating segments through which the Company’s chief operating decision maker manages the Company’s business. The Kamsarmax and Ultramax Operations segments include the following:
Kamsarmax - includes vessels ranging from approximately 77,500 DWT to 98,700 DWT
Ultramax - includes vessels ranging from approximately 60,200 DWT to 64,000 DWT
Prior to 2016, the Company was organized into three operating segments: Kamsarmax, Ultramax and Capesize, which included vessels of approximately 180,000 DWT. However, the Company sold (or agreed to sell) all of its Capesize vessels and Capesize newbuilding vessels by the end of 2015.
Although each vessel within its respective class qualifies as an operating segment under U.S. GAAP, each vessel also exhibits similar long-term financial performance and similar economic characteristics to the other vessels within the respective vessel class, thereby meeting the aggregation criteria in U.S. GAAP. We have therefore chosen to present our segment information by vessel class using the aggregated information from the individual vessels.
The Company’s vessels regularly move between countries in international waters, over dozens of trade routes and, as a result, the first quarterdisclosure of financial information about geographic areas is impracticable.
Certain of the corporate general and administrative expenses incurred by the Company are not attributable to any specific segment. Accordingly, these costs are not allocated to any of the Company’s segments and are included in the results below as “Corporate”.
The following schedule presents segment information about the Company’s operations for the years ended December 31, 2016, 2015 and 2014 (in thousands).
|
| | | | | | | | | | | | | | | | | | | |
| December 31, 2016 | Capesize | | Kamsarmax | | Ultramax | | Corporate | | Total |
| Vessel revenue | $ | — |
| | $ | 31,685 |
| | $ | 46,717 |
| | $ | — |
| | $ | 78,402 |
|
| Voyage expenses | — |
| | (81 | ) | | 36 |
| | — |
| | (45 | ) |
| Vessel operating cost | — |
| | 27,083 |
| | 41,749 |
| | — |
| | 68,832 |
|
| Charterhire expense | — |
| | 12,323 |
| | 5,033 |
| | — |
| | 17,356 |
|
| Charterhire termination | — |
| | 2,500 |
| | 7,500 |
| | — |
| | 10,000 |
|
| Vessel depreciation | — |
| | 14,522 |
| | 22,040 |
| | — |
| | 36,562 |
|
| General and administrative expenses | 380 |
| | 1,718 |
| | 2,725 |
| | 29,172 |
| | 33,995 |
|
| Loss / write down on assets held for sale | 1,006 |
| | 11,557 |
| | (130 | ) | | — |
| | 12,433 |
|
| Interest income | — |
| | — |
| | — |
| | (933 | ) | | (933 | ) |
| Foreign exchange gain | — |
| | — |
| | — |
| | 116 |
| | 116 |
|
| Financial expense, net | — |
| | — |
| | — |
| | 24,921 |
| | 24,921 |
|
| Segment loss | $ | (1,386 | ) | | $ | (37,937 | ) | | $ | (32,236 | ) | | $ | (53,276 | ) | | $ | (124,835 | ) |
During 2016, we recorded a $10.0 million charge to terminate four time charter-in contracts. Terminating these contracts reduced our cash outflow and had a positive impact on our future operating results as the
third quarter of 2016.In March 2014,contracts were at above current market rates.
SCORPIO BULKERS INC. AND SUBSIDIARIES
Notes to the Consolidated Financial Statements
(Dollars in thousands, except per share, per day and per vessel data)
|
| | | | | | | | | | | | | | | | | | | |
| December 31, 2015 | Capesize | | Kamsarmax | | Ultramax | | Corporate | | Total |
| Vessel revenue | $ | 9,038 |
| | $ | 26,712 |
| | $ | 26,771 |
| | $ | — |
| | $ | 62,521 |
|
| Voyage expenses | 280 |
| | 331 |
| | 176 |
| | — |
| | 787 |
|
| Vessel operating cost | 5,089 |
| | 9,986 |
| | 14,297 |
| | — |
| | 29,372 |
|
| Charterhire expense | — |
| | 29,509 |
| | 21,880 |
| | — |
| | 51,389 |
|
| Vessel depreciation | 3,623 |
| | 4,536 |
| | 6,104 |
| | — |
| | 14,263 |
|
| General and administrative expenses | 275 |
| | 498 |
| | 713 |
| | 33,896 |
| | 35,382 |
|
| Loss / write down on assets held for sale | 408,318 |
| | 8,997 |
| | 5,622 |
| | — |
| | 422,937 |
|
| Interest income | — |
| | — |
| | (4 | ) | | (352 | ) | | (356 | ) |
| Foreign exchange gain | 4 |
| | 10 |
| | 27 |
| | (29 | ) | | 12 |
|
| Financial expense, net | — |
| | — |
| | — |
| | 19,524 |
| | 19,524 |
|
| Segment loss | $ | (408,551 | ) | | $ | (27,155 | ) | | $ | (22,044 | ) | | $ | (53,039 | ) | | $ | (510,789 | ) |
|
| | | | | | | | | | | | | | | | | | | |
| December 31, 2014 | Capesize | | Kamsarmax | | Ultramax | | Corporate | | Total |
| Vessel revenue | $ | — |
| | $ | 38,770 |
| | $ | 10,217 |
| | $ | — |
| | $ | 48,987 |
|
| Voyage expenses | — |
| | 3,653 |
| | 74 |
| | — |
| | 3,727 |
|
| Vessel operating cost | — |
| | 1,600 |
| | — |
| | — |
| | 1,600 |
|
| Charterhire expense | — |
| | 57,909 |
| | 15,305 |
| | — |
| | 73,214 |
|
| Vessel depreciation | — |
| | 686 |
| | — |
| | — |
| | 686 |
|
| General and administrative expenses | 39 |
| | 103 |
| | 26 |
| | 31,593 |
| | 31,761 |
|
| Loss / write down on assets held for sale | 52,553 |
| | 2,934 |
| | — |
| | — |
| | 55,487 |
|
| Interest income | — |
| | — |
| | — |
| | (1,052 | ) | | (1,052 | ) |
| Foreign exchange loss | — |
| | — |
| | — |
| | (43 | ) | | (43 | ) |
| Financial expense, net | — |
| | — |
| | — |
| | 172 |
| | 172 |
|
| Segment loss | $ | (52,592 | ) | | $ | (28,115 | ) | | $ | (5,188 | ) | | $ | (30,670 | ) | | $ | (116,565 | ) |
Identifiable assets, classified by the segment by which the Company agreedoperates, are as follows:
|
| | | | | | | | |
| Identifiable assets | | | | |
| | | December 31, 2016 | | December 31, 2015 |
| Held by vessel owning subsidiaries or allocated to segments: | | | | |
| Capesize | | $ | 643 |
| | $ | 180,850 |
|
| Kamsarmax | | 600,578 |
| | 468,875 |
|
| Ultramax | | 847,016 |
| | 626,304 |
|
| Held by parent and other subsidiaries, not allocated to segments: | | | | |
| Cash and cash equivalents | | 88,311 |
| | 178,103 |
|
| Other | | 10,609 |
| | 18,961 |
|
| Total identifiable assets | | $ | 1,547,157 |
| | $ | 1,473,093 |
|
SCORPIO BULKERS INC. AND SUBSIDIARIES
Notes to acquirethe Consolidated Financial Statements
(Dollars in thousands, except per share, per day and per vessel data)
| |
| 15. | Unaudited Quarterly Results of Operations |
The following tables set forth certain unaudited financial data for the Company's quarterly operations in 2016 and 2015. The following information has been prepared on the same basis as the annual information presented elsewhere in this report and, in the opinion of management, includes all adjustments, consisting only of normal recurring adjustments, necessary for a fair presentation of the information for the quarterly periods presented. The operating results for any quarter are not necessarily indicative of results for any future period.
|
| | | | | | | | | | | | | | | | | | | | | | | | | | | | | | | |
| (amounts in thousands) | (Unaudited) 2016 Quarter Ended | | (Unaudited) 2015 Quarter Ended |
| | First Quarter(1) | | Second Quarter | | Third Quarter | | Fourth Quarter | | First Quarter(2) | | Second Quarter(2) | | Third Quarter(2) | | Fourth Quarter(2) |
| Revenues | $ | 10,244 |
| | $ | 17,374 |
| | $ | 23,938 |
| | $ | 26,846 |
| | $ | 12,270 |
| | $ | 12,781 |
| | $ | 15,182 |
| | $ | 22,017 |
|
Operating loss (1)(2) | (51,192 | ) | | (19,204 | ) | | (16,244 | ) | | (14,091 | ) | | (48,399 | ) | | (135,856 | ) | | (16,255 | ) | | (291,137 | ) |
| | | | | | | | | | | | | | | | |
| Net loss | (58,260 | ) | | (24,748 | ) | | (21,273 | ) | | (20,557 | ) | | (52,065 | ) | | (138,645 | ) | | (18,052 | ) | | (302,036 | ) |
| | | | | | | | | | | | | | | | |
| Basic loss per share | $ | (1.96 | ) | | $ | (0.48 | ) | | $ | (0.30 | ) | | $ | (0.29 | ) | | $ | (3.60 | ) | | $ | (8.50 | ) | | $ | (0.66 | ) | | $ | (11.02 | ) |
| | | | | | | | | | | | | | | | |
| Diluted loss per share | $ | (1.96 | ) | | $ | (0.48 | ) | | $ | (0.30 | ) | | $ | (0.29 | ) | | $ | (3.60 | ) | | $ | (8.50 | ) | | $ | (0.66 | ) | | $ | (11.02 | ) |
| | | | | | | | | | | | | | | | |
| Basic weighted average common shares outstanding | 29,794 |
| | 51,305 |
| | 71,575 |
| | 71,672 |
| | 14,455 |
| | 16,303 |
| | 27,277 |
| | 27,399 |
|
| Diluted weighted average common shares outstanding | 29,794 |
| | 51,305 |
| | 71,575 |
| | 71,672 |
| | 14,455 |
| | 16,303 |
| | 27,277 |
| | 27,399 |
|
Earnings per share for quarterly periods are based on the weighted average common shares outstanding in individual quarters; thus, the sum of earnings per share of the quarters may not equal the amounts reported for the full year.
| |
(1) | First quarter 2016 results include a loss / write down on assets held for sale of $12.4 million. |
| |
(2) | First, second, third and fourth quarters of 2015 include losses / write downs on assets held for sale of $31.8 million, $119.6 million, $0.3 million and $261.8 million, respectively. |
Delivery of vessels from shipyards
During the period from January 1, 2017 to February 28, 2017, we took delivery of the following five Capesize dry bulk vessels that were under construction at two South Korean shipyards. The aggregate purchase price for these five vessels is approximately $306,000as of December 31, 2016 (see Note 5):
SBI Samson, a Ultramax vessel
SBI Parapara, a Kamsarmax vessel
SBI Phoenix, a Ultramax vessel
SBI Swing, a Kamsarmax vessel
SBI Mazurka, a Kamsarmax vessel
Borrowings and repayments under secured credit facilities
During the
deliveries are expected to occur between the second quarter of 2015 and the first quarter of 2016.Betweenperiod from January 1, 2014 and March2017 to February 28, 2014,2017, we paidborrowed an aggregate amount of $236,299 relating$38.4 million under our secured credit facilities.
SCORPIO BULKERS INC. AND SUBSIDIARIES
Notes to installment paymentsthe Consolidated Financial Statements
(Dollars in thousands, except per share, per day and per vessel data)
During the period from January 1, 2017 to February 28, 2017, we made a prepayment of $1.5 million on
newbuilding contracts for 25 dry bulk carriers with fuel-efficient specifications and carrying capacities ranging from 61,000 and 180,000 dwt, leaving us with a cash balanceour secured credit facilities, which was made simultaneously to loan drawdowns. A summary of
$527,979our outstanding borrowing under our credit facilities as of
MarchFebruary 28,
2014.2017 is as follows (dollars in thousands): |
| | | | | | | | |
| | | February 28, 2017 |
| | | Amount outstanding | | Amount available |
| $39.6 Million Credit Facility | | $ | 20,144 |
| | $ | — |
|
| $409 Million Credit Facility | | 179,473 |
| | — |
|
| $330 Million Credit Facility | | 250,959 |
| | 13,200 |
|
| $42 Million Credit Facility | | 38,512 |
| | — |
|
| $67.5 Million Credit Facility | | 40,461 |
| | — |
|
| $12.5 Million Credit Facility | | 10,379 |
| | — |
|
| $27.3 Million Credit Facility | | 19,375 |
| | — |
|
| Total | | $ | 559,303 |
| | $ | 13,200 |
|
Credit facility amendments
$42.0 Million Credit Facility
Time chartered-in vesselsIn February and March 2014,January 2017, the Company announcedreached an agreement with the lender that that it has agreed(i) allows us to time charter-in 17 dry bulk vessels. The termsdefer 4 quarters of the time charter-in contracts are summarized as follows:
| Vessel Type | Year Built | DWT | Where Built | Daily Base Rate | Earliest Expiry |
| Post-Panamax | 2010 | 93,000 | China | $13,250 | 28-Oct-14 (1) |
| Post-Panamax | 2011 | 93,000 | China | $13,500 | 31-Oct-14 (2) |
| Kamsarmax | 2009 | 82,500 | Japan | $14,500 | 28-Feb-15 (3) |
| Kamsarmax | 2012 | 82,000 | South Korea | $15,500 | 31-Jul-17 (4) |
| Kamsarmax | 2012 | 81,500 | South Korea | $14,500 | 31-Dec-14 (5) |
| Kamsarmax | 2011 | 81,500 | South Korea | $15,000 | 31-Jan-16 (6) |
| Kamsarmax | 2012 | 81,000 | South Korea | $15,000 | 28-Feb-15 (7) |
| Kamsarmax | 2012 | 79,500 | China | $14,000 | 1-Jan-15 (8) |
| Panamax | 2004 | 77,500 | China | $14,000 | 31-Jan-17 (9) |
| Panamax | 2014 | 77,000 | Japan | $16,000 | 31-Mar-15 (10) |
| Panamax | 2009 | 76,500 | Japan | $15,900 | 23-Jun-14 (11) |
| Panamax | 2007 | 75,500 | South Korea | $13,750 | 28-Feb-14 (12) |
| Ultramax | 2010 | 61,000 | Japan | $14,200 | 1-Apr-17 (13) |
| Supramax | 2010 | 58,000 | China | $14,250 | 31-Dec-16 (14) |
| Supramax | 2011 | 58,000 | China | $13,750 | 31-Jan-15 (15) |
| Supramax | 2015 | 55,000 | Japan | $14,000 | 30-Jun-18 (16) |
| Handymax | 2002 | 48,500 | Japan | $12,000 | 31-Jan-17 (17) |
| Total TC DWT | | 1,261,000 | | | |
(1) | This vessel has been time chartered-in for eight to 10 months at Company’s option at $13,250 per day. The vessel was delivered on February 23, 2014. |
(2) | This vessel has been time chartered-in for seven to nine months at the Company’s option at $13,500 per day. The vessel was delivered on March 24, 2014. |
(3) | This vessel has been time chartered-in for 11 to 13 months at the Company’s option at $14,500 per day. The Company has the option to extend this time charter for one year at $15,500 per day. The vessel was delivered on March 8, 2014. |
(4) | This vessel has been time chartered-in for 39 to 44 months at the Company’s option at $15,500 per day. The Company has the option to extend this time charter for one year at $16,300 per day. The vessel is expected to be delivered in April 2014. |
(5) | This vessel has been time chartered-in for 10 to 12 months at Company’s option at $14,500 per day. The vessel was delivered on February 7, 2014. |
(6) | This vessel has been time-chartered in for 23 to 28 months at the Company’s option at $15,000 per day. The Company has the option to extend the charter for an additional 11 to 13 months at $16,000 per day. This vessel was delivered on February 15, 2014. |
(7) | This vessel has been time chartered-in for 12 to 14 months at Company’s option at $15,000 per day. The vessel was delivered on February 10, 2014. |
(8) | This vessel has been time chartered-in for 11 to 14 month at the Company’s option at $14,000 per day. The Company has the option to extend the charter for an additional 11 to 14 months at $14,750 per day. This vessel was delivered on February 23, 2014. |
(9) | This vessel has been time-chartered in for 32 to 38 months at the Company’s option at $14,000 per day. The vessel is expected to be delivered by June 2014. |
(10) | This vessel has been time chartered-in for 12 to 13 months at Company’s option at $16,000 per day. The vessel was delivered on March 4, 2014. |
(11) | This vessel has been time chartered-in for five to seven months at Company’s option at $15,900 per day. The vessel was delivered on January 23, 2014. |
(12) | This vessel has been time chartered-in for 11 to 13 months at the Company’s option at $13,750 per day. The Company has the option to extend the charter for an additional year at $14,750 per day. The vessel was delivered on March 14, 2014. |
(13) | This vessel has been time-chartered in for three years at $14,200 per day. The Company has options to extend the charter for up to three consecutive one year periods at $15,200 per day, $16,200 per day and $17,200 per day, respectively. This vessel is expected to be delivered during April 2014. |
(14) | This vessel has been time-chartered in for 20 to 24 month at the Company’s option at $14,250 per day. The Company has the option to extend the charter for an additional 10 to 12 months at $14,850 per day. This vessel is expected to be delivered during the second quarter of 2014. |
(15) | This vessel has been time-chartered in for ten to 13 month at the Company’s option at $13,750 per day. This vessel was delivered on March 18, 2014. |
(16) | This vessel has been time-chartered in for three years at $14,000 per day. The Company has options to extend the charter for up to two consecutive one year periods at $15,000 per day and $16,000 per day, respectively. This vessel is expected to be delivered during the first half of 2015. |
(17) | This vessel has been time chartered-in for 34 to 37 months at the Company’s option at $12,000 per day. The Company has options to extend the charter for up to three consecutive one year periods at $12,750 per day, $13,600 per day and $14,800 per day, respectively. This vessel is expected to be delivered during April 2014. |
Completion of Exchange Offer
On February 12, 2014, the Company completed its offer to exchange an aggregate of 96,065,411 unregistered common shares issued in equity private placements between July and October 2013 for an equivalent number of registered common shares. Pursuantdebt repayment to the exchange offer, holders of 95,766,779 unregistered common shares tendered such sharesballoon amount in exchange for registered common shares representing participationa prepayment equal to 4 quarters of 99.7%.
Equity Incentive Plan
On February 21, 2014, our board of directors reserved an additional 2,150,370 common sharesscheduled repayments, which was made in Q4 2016 and (ii) waives the interest coverage covenant for issuance under the Equity Incentive Plan. On that date, we also granted 2,080,370 restricted shares to officers, members of the board of directors and employees of the Company. Of these restricted shares, 1,990,370 restricted shares vest in three equal installments on February 21, 2016, February 21, 2017 and February 21, 2018, and 90,000 restricted shares vest in three equal installmentsamends the level to 1.0 to 1.0 for 1Q 2019 and 2Q 2019 (both calculated on February 21, 2015, February 21, 2016a year to date basis), 2.5 to 1.0 for 3Q 2019 (calculated on a year to date basis) and February 21, 2017. The fair value of these awards was $19,410, which will be amortized as stock-based compensation expense,2.5 to 1.0 for 4Q 2019 and thereafter (calculated on a component of general and administrative expense, over the vesting periods of each grant.
trailing four quarters basis).
Loan Facility
On February 25, 2014, the Company received a commitment from a leading European financial institution for a Loan Facility (the Facility) of up to $67,500. The Facility will be used to finance up to 60% of the purchase price upon delivery of two Ultramax and two Kamsarmax vessels currently under construction. The Facility has a final maturity of seven years from the date of delivery of each vessel. The terms and conditions of this commitment are consistent with those of the Company’s existing credit commitments. The closing of the Facility remains subject to customary conditions precedent, including negotiation and execution of final documentation.