| REGISTRATION STATEMENT PURSUANT TO SECTION 12(b) OR (g) OF THE SECURITIES EXCHANGE ACT OF 1934 |
| OR |
| OR |
Title of Each Class | Name of Each Exchange on which Registered | |
| Ordinary Shares, par value NIS 1.00 each | The NASDAQ Stock Market LLC |
U.S. GAAP ☐ | International Financing Reporting Standards as issued by the International Accounting Standards Board | Other |
| PART I | |
| 147 | |
| PART II | |
| Item 16A. Audit committee financial expert | |
| 151 | |
| PART III | |
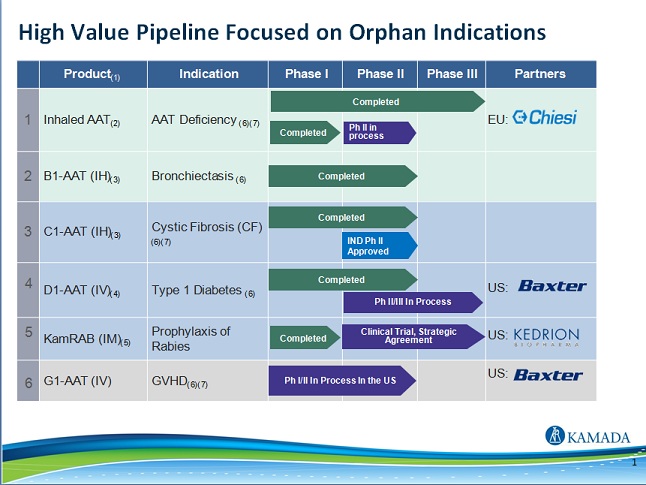
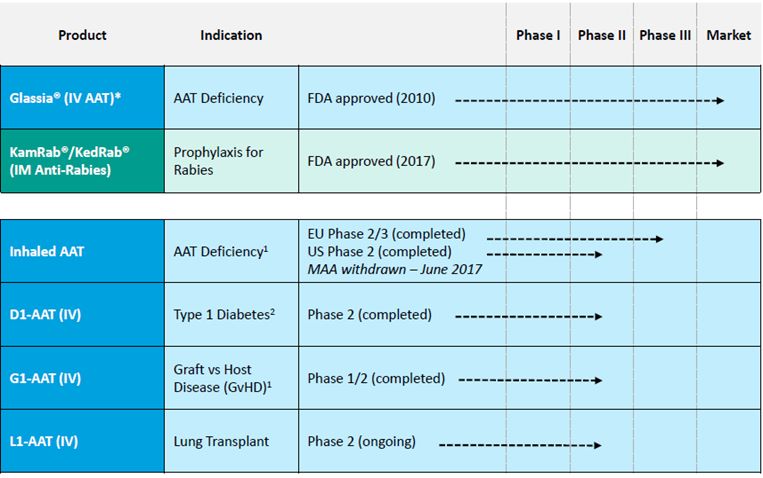
| · | Our focus in the Alpha-1 Antitrypsin (“AAT”) deficiency ("AATD") field, and becoming the innovator in this field by developing different therapeutic approaches to AATD independently and through collaborations with strategic partners; |
| · | our expectation that |
| · | our belief that our relationships with our strategic partners will lead to increased revenues and other benefits in the future and that such relationships, including with Shire plc. (“Shire”), and Kedrion S.p.A ("Kedrion") will continue without disruption; |
| · | our expectation that the minimum aggregate revenue for Glassia for the years 2018 to 2020 under our agreement with Shire will reach approximately $177 million and may be expanded to $228 million during that period; |
| · | our expectation that our product offerings in our Proprietary Products segment will increase until 2020 (thereafter, Shire has no obligation to purchase a minimum amount of Glassia), that Shire will begin selling Glassia produced in its own manufacturing facility as early as 2021 and pay us royalties and that Shire will have an FDA approved production facility by 2021; |
| · | our expectation that as Shire transitions to producing Glassia in its own facilities, we will incur a substantial reduction in revenues (as well as costs of goods sold), driven by the reduction in Glassia manufacturing, and our intent to partially offset such decrease in revenues by income from royalty payments from Shire on sales of Glassia and continued increased sales of Glassia in rest of the world countries through local distributors and the KEDRAB product in the United States; |
| · | our ability to launch our anti-rabies immunoglobulin product for prophylaxis treatment of rabies disease in the United States in 2018 in collaboration with Kedrion (under the trademark "KEDRAB" in the U.S.) and our expectations regarding future sales of the product in the U.S. and in other territories (under the trademark "KamRAB"), including that a recently signed supply agreement from November 2017 for marketing of KamRAB will generate total revenues through 2020 for our Company in the total amount of approximately $13 million; |
| · | our belief that receiving FDA approval for marketing of our anti-rabies immunoglobulin (under the trademark "KEDRAB" in the U.S.) will assist us in our efforts to register the product in additional countries where it is not currently registered, and our belief that this would lead to additional sales worldwide; |
| · | our belief that we will be able to continue to meet our customers' demand for AAT and anti-rabies immunoglobulin; |
| · | our belief that U.S-based and other healthcare providers would seek to diversify their source of anti-rabies immunoglobulin, using our product; |
| · | our ability to procure adequate quantities of plasma and fraction IV from our suppliers, which are acceptable for use in our manufacturing |
| · | our ability to maintain compliance with government regulations and licenses; |
| · | our ability to identify growth opportunities for existing products and our ability to identify and develop new product candidates; |
| · | our belief that the market opportunity for |
| · | the beneficial characteristics of Inhaled AAT for AATD, which we believe may result in our increased profitability; |
| · | our expectations are that our discussions with the U.S. Food and Drug Administration (the “FDA”) regarding the clinical and regulatory pathway for registration in the United States of Inhaled AAT for AATD, will materialize by mid-2018 and will lead to receiving the FDA approval for our Investigational New Drug (“IND”) application, which will enable us to initiate a pivotal study for registration thereafter. We intend to use the data from this study, if successful, to resubmit a Marketing Authorization Application ("MAA") in the European Union with the European Medicines Agency (the “EMA”); |
| · | our belief that Inhaled AAT for AATD will increase patient convenience and reduce the |
| · | our belief that |
| · | the various uses of AAT products to potentially be effective against various diseases, including Graft versus Host Disease ("GvHD"), type-1 diabetes ("T1D") and prevention of lung transplantation rejection, and our ability to generate the needed data to potentially attract strategic partner(s) to collaborate in the further development of these indications; |
| · | our expectation that we will report interim results from the Phase II clinical study of our intravenous AAT product to prevent lung transplantation rejection in the second half of 2018 and top-line results in the second half of 2019; |
| · | the timing of, and our ability to, obtain and/or maintain regulatory approvals for our products and new product candidates, the rate and degree of market acceptance, and the clinical utility of our products; |
| · | the |
| · | our plan to |
| · | our |
| potential actions or inactions of existing and potential competitors of our |
| · | legislation or regulation in countries where we sell our products that affect product pricing, reimbursement, access or distribution channels; |
| · | the impact of geographic and product mix on our total revenues and gross profit; |
| · | our ability to obtain and maintain protection for the intellectual property relating to or incorporated into our technology and products; |
| · | the impact of our research and development expenses on our financial results as we continue developing product |
| · | our expectations regarding our ability to utilize Israeli tax incentives against future income; and |
| · | our expectations regarding taxation, including that we will not be classified as a passive foreign investment company for the taxable year ending December 31, 2017. |
Year Ended December 31, | Year Ended December 31, | |||||||||||||||||||||||||||||||||||
2014 | 2013 | 2012 | 2011 | 2017 | 2016 | 2015 | 2014 | 2013 | ||||||||||||||||||||||||||||
(in thousands, except per share data) | (in thousands, except per share data) | |||||||||||||||||||||||||||||||||||
| Consolidated Statements of Operations Data: | ||||||||||||||||||||||||||||||||||||
Revenues from Proprietary Products | $ | 44,389 | $ | 50,658 | $ | 46,445 | $ | 35,308 | $ | 79,559 | $ | 55,958 | $ | 42,952 | $ | 44,389 | $ | 50,658 | ||||||||||||||||||
Revenues from Distribution | 26,676 | 19,965 | 26,230 | 24,175 | 23,266 | 21,536 | 26,954 | 26,676 | 19,965 | |||||||||||||||||||||||||||
Total revenues | 71,065 | 70,623 | 72,675 | 59,483 | 102,825 | 77,494 | 69,906 | 71,065 | 70,623 | |||||||||||||||||||||||||||
| Cost of revenues from Proprietary Products | 32,617 | 27,104 | 26,911 | 22,188 | 51,335 | 37,723 | 30,901 | 32,617 | 27,104 | |||||||||||||||||||||||||||
Cost of revenues from Distribution | 23,406 | 17,112 | 23,071 | 20,574 | 19,402 | 18,411 | 23,640 | 23,406 | 17,112 | |||||||||||||||||||||||||||
Total cost of revenues | 56,023 | 44,216 | 49,982 | 42,762 | 70,737 | 56,134 | 54,541 | 56,023 | 44,216 | |||||||||||||||||||||||||||
Gross profit | 15,042 | 26,407 | 22,693 | 16,721 | 32,088 | 21,360 | 15,365 | 15,042 | 26,407 | |||||||||||||||||||||||||||
Research and development expenses | 16,030 | 12,745 | 11,821 | 11,729 | 11,973 | 16,245 | 16,530 | 16,030 | 12,745 | |||||||||||||||||||||||||||
Selling and marketing expenses | 2,898 | 2,100 | 1,853 | 2,331 | 4,398 | 3,243 | 3,652 | 2,898 | 2,100 | |||||||||||||||||||||||||||
General and administrative expenses | 7,593 | 7,862 | 4,781 | 5,126 | 8,273 | 7,353 | 6,607 | 7,593 | 7,862 | |||||||||||||||||||||||||||
Operating income (loss) | (11,479 | ) | 3,700 | 4,238 | (2,465 | ) | 7,444 | (5,481 | ) | (11,424 | ) | (11,479 | ) | 3,700 | ||||||||||||||||||||||
Financial income | 1,611 | 289 | 578 | 870 | 500 | 469 | 463 | 404 | 278 | |||||||||||||||||||||||||||
| Income (expense) in respect of currency exchange and translation differences and derivatives instruments, net | — | (369 | ) | (100 | ) | 937 | (612 | ) | 127 | 625 | - | (369 | ) | |||||||||||||||||||||||
| Income (expense) in respect of revaluation of warrants to fair value | — | — | (576 | ) | 540 | - | - | - | - | - | ||||||||||||||||||||||||||
Financial expense | (3,293 | ) | (3,153 | ) | (3,357 | ) | (3,597 | ) | (162 | ) | (126 | ) | (934 | ) | (2,086 | ) | (3,142 | ) | ||||||||||||||||||
Income (loss) before taxes on income | (13,161 | ) | 467 | 783 | (3,715 | ) | 7,170 | (5,011 | ) | (11,270 | ) | (13,161 | ) | 467 | ||||||||||||||||||||||
Taxes on income | 52 | 24 | 523 | — | 269 | 1,722 | - | 52 | 24 | |||||||||||||||||||||||||||
Net income (loss) | $ | (13,213 | ) | $ | 443 | $ | 260 | $ | (3,715 | ) | 6,901 | (6,733 | ) | $ | (11,270 | ) | $ | (13,213 | ) | $ | 443 | |||||||||||||||
| Income (loss) attributable to equity holders | $ | (13,213 | ) | $ | 443 | $ | 260 | $ | (3,715 | ) | 6,901 | (6,733 | ) | $ | (11,270 | ) | $ | (13,213 | ) | $ | 443 | |||||||||||||||
| Income (loss) per share attributable to equity holders: | ||||||||||||||||||||||||||||||||||||
Basic | $ | (0.37 | ) | $ | 0.01 | $ | 0.01 | $ | (0.13 | ) | $ | 0.18 | $ | (0.18 | ) | $ | (0.31 | ) | $ | (0.37 | ) | $ | 0.01 | |||||||||||||
Diluted | $ | (0.37 | ) | $ | 0.01 | $ | 0.01 | $ | (0.15 | ) | $ | 0.18 | $ | (0.18 | ) | $ | (0.31 | ) | $ | (0.37 | ) | $ | 0.01 | |||||||||||||
| Weighted-average number of ordinary shares used to compute income (loss) per share attributable to equity holders: | ||||||||||||||||||||||||||||||||||||
Basic | 35,971,335 | 32,714,631 | 28,078,996 | 27,550,643 | 37,970,697 | 36,418,833 | 36,245,813 | 35,971,335 | 32,714,631 | |||||||||||||||||||||||||||
Diluted | 35,971,335 | 33,385,651 | 28,686,636 | 27,703,331 | 38,045,097 | 36,418,833 | 36,245,813 | 35,971,335 | 33,385,651 | |||||||||||||||||||||||||||
| Consolidated Statements of Cash Flows: | ||||||||||||||||||||||||||||||||||||
Cash flows from operating activities | $ | (9,918 | ) | $ | (3,854 | ) | $ | (8,262 | ) | $ | 994 | $ | 3,608 | $ | 1,897 | $ | (13,979 | ) | $ | (9,918 | ) | $ | (3,854 | ) | ||||||||||||
Cash flows from investing activities | (26,819 | ) | (3,903 | ) | (2,432 | ) | (1,136 | ) | (15,608 | ) | 1,637 | 11,253 | (26,819 | ) | (3,903 | ) | ||||||||||||||||||||
Cash flows from financing activities | (7,640 | ) | 49,208 | 2,966 | (403 | ) | 15,320 | 1,490 | (6,355 | ) | (7,640 | ) | 49,208 | |||||||||||||||||||||||
| Consolidated Balance Sheet Data: | ||||||||||||||||||||||||||||||||||||
| Cash, cash equivalents, restricted cash and short-term investments | $ | 51,896 | $ | 74,177 | $ | 33,795 | $ | 42,686 | $ | 43,019 | $ | 28,632 | $ | 28,306 | $ | 51,896 | $ | 74,177 | ||||||||||||||||||
Trade receivables | 17,514 | 17,882 | 13,861 | 7,131 | 30,662 | 19,788 | 23,071 | 17,514 | 17,882 | |||||||||||||||||||||||||||
Working capital (1) | 66,206 | 85,108 | 40,651 | 44,185 | 67,486 | 49,871 | 57,655 | 66,206 | 85,108 | |||||||||||||||||||||||||||
Total assets | 119,140 | 139,379 | 89,114 | 85,114 | 122,110 | 99,696 | 101,992 | 119,140 | 139,379 | |||||||||||||||||||||||||||
Total liabilities | 38,723 | 49,409 | 60,721 | 62,716 | 32,618 | 32,953 | 29,485 | 38,723 | 49,409 | |||||||||||||||||||||||||||
Total shareholders’ equity | 80,417 | 89,970 | 28,393 | 22,398 | 89,492 | 66,743 | 72,507 | 80,417 | 89,970 | |||||||||||||||||||||||||||
| Other Data: | ||||||||||||||||||||||||||||||||||||
Adjusted net income (loss)(2) (3) | $ | (4,940 | ) | $ | 9,414 | $ | 2,103 | $ | (3,377 | ) | $ | 7,384 | $ | (5,663 | ) | $ | (9,363 | ) | $ | (9,462 | ) | $ | 9,414 | |||||||||||||
Adjusted EBITDA(2) | $ | (9,462 | ) | $ | 3,156 | $ | 8,549 | $ | 1,453 | $ | 11,450 | $ | (909 | ) | $ | (6,290 | ) | $ | (4,940 | ) | $ | 3,156 | ||||||||||||||
| (1) | Working capital is defined as total current assets minus total current liabilities. |
| (2) | We present adjusted net income (loss) and adjusted EBITDA because we use these non-IFRS financial measures to assess our operational performance, for financial and operational decision-making, and as a means to evaluate period-to-period comparisons on a consistent basis. Management believes these non-IFRS financial measures are useful to investors because: (1) they allow for greater transparency with respect to key metrics used by management in its financial and operational decision-making; and (2) they exclude the impact of non-cash items that are not directly attributable to our core operating performance and that may obscure trends in the core operating performance of the business. |
| (3) | Adjusted EBITDA is defined as net income (loss), plus income tax expense, plus financial expense, net, plus depreciation and amortization expense, plus non-cash share-based compensation expenses, plus or minus income or expense in respect of exchange and translation differences and derivatives instruments not designated as hedging, |
Year Ended December 31, | Year Ended December 31, | |||||||||||||||||||||||||||||||||||
2014 | 2013 | 2012 | 2011 | 2017 | 2016 | 2015 | 2014 | 2013 | ||||||||||||||||||||||||||||
| (in thousands) | (in thousands) | |||||||||||||||||||||||||||||||||||
Net income (loss) | $ | (13,213 | ) | $ | 443 | $ | 260 | $ | (3,715 | ) | $ | 6,901 | $ | (6,733 | ) | $ | (11,270 | ) | $ | (13,213 | ) | $ | 443 | |||||||||||||
| Non-cash share-based compensation expenses | 3,751 | 1,327 | 1,267 | 878 | 483 | 1,071 | 1,907 | 3,751 | 1,327 | |||||||||||||||||||||||||||
| One-time management compensation payment | - | 1,386 | — | — | - | - | - | - | 1,386 | |||||||||||||||||||||||||||
| Expense (income) in respect of revaluation of warrants to fair value | — | — | 576 | (540 | ) | |||||||||||||||||||||||||||||||
Adjusted net income (loss) | $ | (9,462 | ) | $ | 3,156 | $ | 2,103 | $ | (3,377 | ) | $ | 7,384 | $ | (5,663 | ) | $ | (9,363 | ) | $ | (9,462 | ) | $ | 3,156 | |||||||||||||
Year Ended December 31, | Year Ended December 31, | |||||||||||||||||||||||||||||||||||
2014 | 2013 | 2012 | 2011 | 2017 | 2016 | 2015 | 2014 | 2013 | ||||||||||||||||||||||||||||
(in thousands) | (in thousands) | |||||||||||||||||||||||||||||||||||
Net income (loss) | $ | (13,213 | ) | $ | 443 | $ | 260 | $ | (3,715 | ) | $ | 6,901 | $ | (6,733 | ) | $ | (11,270 | ) | $ | (13,213 | ) | $ | 443 | |||||||||||||
Income tax expense | 52 | 24 | 523 | — | 269 | 1,722 | - | 52 | 24 | |||||||||||||||||||||||||||
Financial expense, net | 1,682 | 2,864 | 2,779 | 2,727 | (338 | ) | (343 | ) | 471 | 1,682 | 2,864 | |||||||||||||||||||||||||
Depreciation and amortization expense | 2,788 | 3,001 | 3,044 | 3,040 | 3,523 | 3,501 | 3,227 | 2,788 | 3,001 | |||||||||||||||||||||||||||
| Non-cash share-based compensation expenses | 3,751 | 1,327 | 1,267 | 878 | 483 | 1,071 | 1,907 | 3,751 | 1,327 | |||||||||||||||||||||||||||
| Income (expense) in respect of translation differences and derivatives instruments, net | — | 369 | 100 | (937 | ) | 612 | (127 | ) | (625 | ) | - | 369 | ||||||||||||||||||||||||
| Expense (income) in respect of revaluation of warrants fair value | — | — | 576 | (540 | ) | |||||||||||||||||||||||||||||||
| One-time management compensation payment | — | 1,386 | — | — | - | - | - | 1,386 | ||||||||||||||||||||||||||||
Adjusted EBITDA | $ | (4,940 | ) | $ | 9,414 | $ | 8,549 | $ | 1,453 | $ | 11,450 | $ | (909 | ) | $ | (6,290 | ) | $ | (4,940 | ) | $ | 9,414 | ||||||||||||||
| · | delays may occur in obtaining our clinical materials; |
| · | our preclinical tests or clinical trials may produce negative or inconclusive results, and we may decide, or regulators may require us, to conduct additional preclinical testing or clinical trials or to abandon strategic projects; |
| · | the number of patients required for our clinical trials may be larger than we anticipate, enrollment in our clinical trials may be slower or more difficult than we anticipate, or participants may withdraw from our clinical trials at higher rates than we anticipate; |
| · | delays may occur in reaching agreement on acceptable clinical trial agreement terms with prospective sites or obtaining institutional review board approval; |
| · | our strategic partners may not achieve their clinical development goals and/or comply with their relevant regulatory requirements; |
| · | we may be forced to suspend or terminate our clinical trials if the participants are being exposed to unacceptable health risks or if any participant experiences an unexpected serious adverse event; |
| · | regulators or institutional review boards may require that we hold, suspend or terminate clinical research for various reasons, including noncompliance with regulatory requirements; |
| · | regulators may not authorize us to commence or conduct a clinical trial within a country or at a prospective trial site, or according to the clinical trial outline we propose; |
| · | undetected or concealed fraudulent activity by a clinical researcher, if discovered, could preclude the submission of clinical data prepared by that researcher, lead to the suspension or substantive scientific review of one or more of our marketing applications by regulatory agencies, and result in the recall of any approved product distributed pursuant to data determined to be fraudulent; |
| · | the cost of our clinical and preclinical trials may be greater than we anticipate; |
| · | an audit of preclinical tests or clinical studies by the FDA, the EMA, the regulatory authorities in Israel or other regulatory authorities may reveal noncompliance with applicable regulations, which could lead to disqualification of the results of such studies and the need to perform additional tests and studies; and |
| · | our product candidates may not achieve the desired clinical benefits, or may cause undesirable side effects, or the product candidates may have other unexpected characteristics. |
| · | be delayed in obtaining regulatory or marketing approval for our product candidates; |
| · | be unable to obtain regulatory and marketing approval; |
| · | decide to halt the clinical trial or other testing; |
| · | be required to conduct additional trials under a conditional approval; |
| · | be unable to obtain reimbursement for our products in all or some countries; |
| · | only obtain approval for indications that are not as broad as we initially intend; |
| · | have the product removed from the market after obtaining marketing approval from the FDA, the EMA, the regulatory authorities in Israel or other regulatory authorities; and |
| · | be delayed in, or prevented from, the receipt of clinical milestone payments from our strategic partners. |
| · | the prevalence and severity of any side effects; |
| · | the efficacy, potential advantages and timing of introduction to the market of alternative treatments; |
| · | our ability to offer our product candidates for sale at competitive prices; |
| · | relative convenience and ease of administration of our products; |
| · | the willingness of physicians to prescribe our products; |
| · | the willingness of patients to use our products; |
| · | the strength of marketing and distribution support; and |
| · | third-party coverage or reimbursement. |
| · | decreased demand for our plasma-derived protein therapeutics and any product candidates that we may develop; |
| · | injury to our reputation; |
| · | difficulties in recruitment of new participants to our future clinical trials and withdrawal of current clinical |
| · | costs to defend the related litigation; |
| · | substantial monetary awards to trial participants or patients; |
| · | difficulties in finding distributors |
| · | difficulties in entering into strategic partnerships with third parties; |
| · | diversion of management’s attention; |
| · | loss of revenue; |
| · | the inability to commercialize any products that we may develop; and |
| · | higher insurance premiums. |
| · | actual or anticipated fluctuations in our financial condition and operating results; |
| · | overall conditions in the specialty pharmaceuticals market; |
| · | loss of significant customers or changes to agreements with our strategic partners; |
| · | changes in laws or regulations applicable to our products; |
| · | actual or anticipated changes in our growth rate relative to our competitors’; |
| · | announcements of clinical trial results, technological innovations, significant acquisitions, strategic alliances, joint ventures or capital commitments by us or our competitors; |
| · | changes in key personnel; |
| · | fluctuations in the valuation of companies perceived by investors to be comparable to us; |
| · | the issuance of new or updated research reports by securities analysts; |
| · | disputes or other developments related to proprietary rights, including patents, litigation matters and our ability to obtain intellectual property protection for our technologies; |
| · | announcement of, or expectation of, additional financing efforts; |
| · | sales of our ordinary shares by us or our |
| · | share price and volume fluctuations attributable to inconsistent trading volume levels of our shares; |
| · | recalls and/or adverse events associated with our products; |
| · | the expiration of contractual lock-up agreements with our executive officers and directors; and |
| · | general political, economic and market conditions. |
| · | December 31, 2018, which is the last day of the fiscal year in which the fifth anniversary of our initial public offering in the United States has occurred; |
| · | the last day of the fiscal year in which our annual gross revenues are |
| · | the date on which we have, during the previous three-year period, issued more than $1 billion in non-convertible debt securities; or |
| · | the |
| Product | Indication | Active Ingredient | Geography | |||
| Respiratory | ||||||
| Glassia (or | Intravenous AATD | Alpha-1 Antitrypsin (human) | United States, Israel, Russia, | |||
| Immunoglobulins | ||||||
| KamRAB | Prophylaxis of rabies disease | Anti-rabies immunoglobulin (human) | Israel, India, Thailand, El | |||
| KamRho (D) IM | Prophylaxis of hemolytic disease of newborns | Rho(D) immunoglobulin (human) | Israel, Brazil, India, Argentina, | |||
| KamRho (D) IV | Treatment of immune thermobocytopunic purpura | Rho(D) immunoglobulin (human) | Israel, | |||
| Snake bite antiserum | Treatment of snake bites by the Vipera palaestinae and the Echis coloratus | |||||
| Other Products | ||||||
| Heparin Lock Flush | To maintain patency of indwelling IV catheter designed for intermittent injection therapy or blood sampling | Heparin sodium | ||||
| Kamacaine 0.5% | Local or regional anesthesia or analgesia during surgery, diagnostic and therapeutic procedures and obstetrical procedures. Spinal anesthesia for surgery | Bupivacaine HCl | Israel | |||
| Human transferrin (diagnostical grade) | Not for human use | Transferrin | United States, Israel, |
| ___________ |
| * | We have regulatory approval, but |
| Product | Indication | Active Ingredient | ||
| Respiratory | ||||
| Bramitob | Management of chronic pulmonary infection due to pseudomonas aeruginosa in patients six years and older with cystic fibrosis | Tobramycin | ||
| FOSTER | Regular treatment of asthma where use of a combination product (inhaled corticosteroid and long-acting beta2-agonist) is appropriate | Beclomethasone dipropionate, Formoterol fumarate | ||
| Immunoglobulins | ||||
| IVIG 5% | Treatment of various immunodeficiency-related conditions | Gamma globulins (IgG) (human) | ||
| Varitect | Preventive treatment after exposure to the virus | Varicella zoster immunoglobulin (human) | ||
| Zutectra | Prevention of hepatitis B virus (HBV) re-infection in HBV-DNA negative patients 6 months after liver transplantation for hepatitis B induced liver failure | Human hepatitis B immunoglobulin | ||
| Hepatect CP | Prevent contraction of Hepatitis B by adults and children older than two years | Hepatitis B immunoglobulin (human) | ||
| Megalotect | Contains antibodies | CMV immunoglobulin (human) | ||
| Critical Care | ||||
| Heparin sodium injection | Treatment of thrombo-embolic disorders such as deep vein thrombosis, acute arterial embolism or thrombosis, thrombophlebitis, pulmonary embolism, fat embolism. Prophylaxis of deep vein thrombosis and thromboembolic events | Heparin sodium | ||
| Albumin and Albumin 4% | Maintains a proper level in the patient’s blood plasma | Human serum Albumin | ||
| Coagulation Factors | ||||
| Factor VIII | Treatment of Hemophilia Type A diseases | Coagulation Factor VIII (human) | ||
| Factor IX | Treatment of Hemophilia Type B disease | Coagulation Factor IX (human) | ||
| Vaccinations | ||||
| IXIARO | Active immunization against Japanese encephalitis in adults, adolescents, children and infants aged 2 months and older | Japanese encephalitis purified inactivated vaccine |
| Orphan drug designation |
| · | FEV1 (L) rose significantly in AAT treated patients and decreased in placebo treated patients (+15ml for AAT vs. -27ml for placebo, a 42 ml difference, p=0.0268) |
| · | There was a trend towards better FEV1% predicted (0.54% for AAT vs. -0.62% for placebo, a 1.16% difference, p=0.065) |
| · | FEV1/SVC% rose significantly in AAT treated patients and decreased in placebo treated patients (0.62% for AAT vs. -0.87% for placebo, a 1.49% difference, p=0.0074) |
| · | There was a trend towards reduced FEV1 (L)decline (-12ml for AAT vs. -62ml for placebo, a 50 ml difference, p=0.0956) |
| · | There was a trend towards a reduced decline in FEV1% predicted (-0.1323% for AAT vs. -1.6205% for placebo, a 1.4882% difference, p=0.1032) |
| · | FEV1/SVC% rose significantly in AAT treated patients and decreased in placebo treated patients (0.61% for AAT vs. -1.07% for placebo, a 1.68% difference, p=0.013) |
| 1. | preclinical laboratory tests and animal tests; |
| 2. | submission to the FDA of an IND application for human clinical testing, which must become effective before human clinical trials may commence; |
| 3. | adequate and well-controlled human clinical trials to establish the safety and efficacy of the product; |
| 4. | submission to the FDA of a BLA or supplemental BLA; |
| 5. | FDA pre-approval inspection of product manufacturers; and |
| 6. | FDA review and approval of the BLA or supplemental BLA. |
| · | Phase I studies may be conducted in a limited number of patients, but are usually conducted in healthy volunteer subjects. The drug is usually tested for safety and, as appropriate, for absorption, metabolism, distribution, excretion, pharmacodynamics and pharmacokinetics. |
| · | Phase II usually involves studies in a larger, but still limited, patient population to evaluate preliminarily the efficacy of the drug candidate for specific, targeted indications; to determine dosage tolerance and optimal dosage; and to identify possible short-term adverse effects and safety risks. |
| · | Phase III trials are undertaken to further evaluate clinical efficacy of a specific endpoint and to test further for safety within an expanded patient population at geographically dispersed clinical study sites. |
| · | increases the minimum level of Medicaid rebates payable by manufacturers of brand-name drugs from 15.1% to 23.1%; |
| · | requires Medicaid rebates for covered outpatient drugs to be extended to Medicaid managed care organizations; |
| · | requires manufacturers of drugs covered under Medicare Part D to participate in a coverage gap discount program, under which they must agree to offer 50% point-of-sale discounts off negotiated prices of applicable brand drugs to eligible Medicare beneficiaries during their coverage gap |
| · | imposes a non-deductible annual fee on pharmaceutical manufacturers or importers who sell “branded prescription drugs” to specified federal government programs. |
Legal Name | Jurisdiction | |
| Kamada Biopharma Limited | England and Wales | |
| Kamada Inc. | Delaware | |
| Bio-Kam Ltd. | Israel | |
| Kamada Assets Ltd. | Israel |
| Year Ended December 31, | ||||||||||||
| 2017 | 2016 | 2015 | ||||||||||
| (in thousands, except per share data) | ||||||||||||
| Revenues from Proprietary Products segment | $ | 79,559 | $ | 55,958 | $ | 42,952 | ||||||
| Revenues from Distribution segment | 23,266 | 21,536 | 26,954 | |||||||||
| Total revenues | 102,825 | 77,494 | 69,906 | |||||||||
| Cost of revenues from Proprietary Products segment | 51,335 | 37,723 | 30,901 | |||||||||
| Cost of revenues from Distribution segment | 19,402 | 18,411 | 23,640 | |||||||||
| Total cost of revenues | 70,737 | 56,134 | 54,541 | |||||||||
| Gross profit | 32,088 | 21,360 | 15,365 | |||||||||
| Research and development expenses | 11,973 | 16,245 | 16,530 | |||||||||
| Selling and marketing expenses | 4,398 | 3,243 | 3,652 | |||||||||
| General and administrative expenses | 8,273 | 7,353 | 6,607 | |||||||||
| Operating income (loss) | 7,444 | (5,481 | ) | (11,424 | ) | |||||||
| Financial income | 500 | 469 | 463 | |||||||||
| Income (expense) in respect of currency exchange differences and derivatives instruments | (612 | ) | 127 | 625 | ||||||||
| Financial expense | (162 | ) | (126 | ) | (934 | ) | ||||||
| Income (loss) before taxes on income | 7,170 | (5,011 | ) | (11,270 | ) | |||||||
| Taxes on income | 269 | 1,722 | - | |||||||||
| Net income (loss) | 6,901 | $ | (6,733 | ) | $ | (11,270 | ) | |||||
Year Ended December 31, | ||||||||||||
2014 | 2013 | 2012 | ||||||||||
| (in thousands, except per share data) | ||||||||||||
| Revenues from Proprietary Products | $ | 44,389 | $ | 50,658 | $ | 46,445 | ||||||
| Revenues from Distribution | 26,676 | 19,965 | 26,230 | |||||||||
| Total revenues | 71,065 | 70,623 | 72,675 | |||||||||
| Cost of revenues from Proprietary Products | 32,617 | 27,104 | 26,911 | |||||||||
| Cost of revenues from Distribution | 23,406 | 17,112 | 23,071 | |||||||||
| Total cost of revenues | 56,023 | 44,216 | 49,982 | |||||||||
| Gross profit | 15,042 | 26,407 | 22,693 | |||||||||
| Research and development expenses | 16,030 | 12,745 | 11,821 | |||||||||
| Selling and marketing expenses | 2,898 | 2,100 | 1,853 | |||||||||
| General and administrative expenses | 7,593 | 7,862 | 4,781 | |||||||||
| Operating income (loss) | (11,479 | ) | 3,700 | 4,238 | ||||||||
| Financial income | 1,611 | 289 | 578 | |||||||||
| Income (expense) in respect of currency exchange and translation differences and derivatives instruments | — | (369 | ) | (100 | ) | |||||||
| Income (expense) in respect of revaluation of warrants to fair value | — | — | (576 | ) | ||||||||
| Financial expense | (3,293 | ) | (3,153 | ) | (3,357 | ) | ||||||
| Income (loss) before taxes on income | (13,161 | ) | 467 | 783 | ||||||||
| Taxes on income | 52 | 24 | 523 | |||||||||
| Net income (loss) | $ | (13,213 | ) | $ | 443 | $ | 260 | |||||
Change 2017 vs. 2016 | ||||||||||||||||
| 2017 | 2016 | Amount | Percent | |||||||||||||
| Revenues: | ||||||||||||||||
| Proprietary Products | $ | 79,559 | $ | 55,958 | $ | 23,601 | 42.2 | % | ||||||||
| Distribution | 23,266 | 21,536 | 1,730 | 8 | % | |||||||||||
| Total | $ | 102,825 | $ | 77,494 | $ | 25,331 | 32.7 | % | ||||||||
| Cost of Revenues: | ||||||||||||||||
| Proprietary Products | $ | 51,335 | $ | 37,723 | $ | 13,612 | 36 | % | ||||||||
| Distribution | 19,402 | 18,411 | 991 | 5.4 | % | |||||||||||
| Total | $ | 70,737 | $ | 56,134 | $ | 14,603 | 26 | % | ||||||||
| Gross Profit: | ||||||||||||||||
| Proprietary Products | $ | 28,224 | $ | 18,235 | $ | 9,989 | 54.8 | % | ||||||||
| Distribution | 3,864 | 3,125 | 739 | 23.7 | % | |||||||||||
| Total | $ | 32,088 | $ | 21,360 | $ | 10,728 | 50.2 | % | ||||||||
Year Ended December 31, | Change 2014 vs. 2013 | |||||||||||||||
2014 | 2013 | Amount | Percent | |||||||||||||
| (in thousands) | ||||||||||||||||
| Revenues: | ||||||||||||||||
| Proprietary Products | $ | 44,389 | $ | 50,658 | $ | (6,269 | ) | (12.4 | )% | |||||||
| Distribution | 26,676 | 19,965 | 6,711 | 33.6 | % | |||||||||||
| Total | $ | 71,065 | $ | 70,623 | $ | 442 | 0.6 | % | ||||||||
| Cost of Revenues: | ||||||||||||||||
| Proprietary Products | $ | 32,617 | $ | 27,104 | $ | 5,513 | 20.3 | % | ||||||||
| Distribution | 23,406 | 17,112 | 6,294 | 36.8 | % | |||||||||||
| Total | $ | 56,023 | $ | 44,216 | $ | 11,807 | 26.7 | % | ||||||||
| Gross Profit: | ||||||||||||||||
| Proprietary Products | $ | 11,772 | $ | 23,554 | $ | (11,782 | ) | (50.0 | )% | |||||||
| Distribution | 3,270 | 2,853 | 417 | 14.6 | % | |||||||||||
| Total | $ | 15,042 | $ | 26,407 | $ | (11,365 | ) | (43.0 | )% | |||||||
| Year ended December 31, | ||||||||
2017 | 2016 | |||||||
| (in thousands) | ||||||||
| Inhaled AAT | $ | 949 | $ | 2,695 | ||||
| AAT for newly diagnosed Type-1 Diabetes | 475 | 2,320 | ||||||
AAT IV for lung transplantation rejection and for GvHD | 734 | 194 | ||||||
| Anti Rabies | 340 | 1,772 | ||||||
| Unallocated salary | 6,413 | 5,237 | ||||||
| Unallocated facility cost allocated to research and development | 2,325 | 3,244 | ||||||
| Unallocated other expenses | 737 | 783 | ||||||
| Total research and development expenses | $ | 11,973 | $ | 16,245 | ||||
Year ended December 31, | ||||||||
2014 | 2013 | |||||||
| (in thousands) | ||||||||
| Inhaled AAT | $ | 6,326 | $ | 7,619 | ||||
| AAT for newly diagnosed Type-1 Diabetes | 1,959 | 238 | ||||||
| Unallocated salary | 4,514 | 3,847 | ||||||
| Unallocated facility cost allocated to research and development | 2,409 | 223 | ||||||
| Unallocated other expenses | 822 | 818 | ||||||
| Total research and development expenses | $ | 16,030 | $ | 12,745 | ||||
Change 2016 vs. 2015 | ||||||||||||||||
| 2016 | 2015 | Amount | Percent | |||||||||||||
| Revenues: | ||||||||||||||||
| Proprietary Products | $ | 55,958 | $ | 42,952 | $ | 13,006 | 30.2 | % | ||||||||
| Distribution | $ | 21,536 | $ | 26,954 | (5,418 | ) | (20.1 | )% | ||||||||
| Total | $ | 77,494 | $ | 69,906 | $ | 7,588 | 10.8 | % | ||||||||
| Cost of Revenues: | ||||||||||||||||
| Proprietary Products | $ | 37,723 | $ | 30,901 | $ | 6,822 | 22 | % | ||||||||
| Distribution | $ | 18,411 | $ | 23,640 | (5,229 | ) | (22.1 | )% | ||||||||
| Total | $ | 56,134 | $ | 54,541 | $ | 1,593 | 2.9 | % | ||||||||
| Gross Profit: | ||||||||||||||||
| Proprietary Products | $ | 18,235 | $ | 12,051 | $ | 6,184 | 51.3 | % | ||||||||
| Distribution | $ | 3,125 | $ | 3,314 | (189 | ) | (5.7 | )% | ||||||||
| Total | $ | 21,360 | $ | 15,365 | $ | 5,995 | 39.0 | % | ||||||||
Year Ended December 31, | Change 2013 vs. 2012 | |||||||||||||||
2013 | 2012 | Amount | Percent | |||||||||||||
| (in thousands) | ||||||||||||||||
| Revenues: | ||||||||||||||||
| Proprietary Products | $ | 50,658 | $ | 46,445 | $ | 4,213 | 9.1 | % | ||||||||
| Distribution | 19,965 | 26,230 | (6,265 | ) | (23.9 | )% | ||||||||||
| Total | $ | 70,623 | $ | 72,675 | $ | (2,052 | ) | (2.8 | )% | |||||||
| Cost of Revenues: | ||||||||||||||||
| Proprietary Products | $ | 27,104 | $ | 26,911 | $ | 193 | 0.72 | % | ||||||||
| Distribution | 17,112 | 23,071 | (5,959 | ) | (25.8 | )% | ||||||||||
| Total | $ | 44,216 | $ | 49,982 | $ | (5,766 | ) | (11.5 | )% | |||||||
| Gross Profit: | ||||||||||||||||
| Proprietary Products | $ | 23,554 | $ | 19,534 | $ | 4,020 | 20.6 | % | ||||||||
| Distribution | 2,853 | 3,159 | (306 | ) | (9.7 | )% | ||||||||||
| Total | $ | 26,407 | $ | 22,693 | $ | 3,714 | 16.4 | % | ||||||||
Year ended December 31, | Year ended December 31, | |||||||||||||||
2013 | 2012 | 2016 | 2015 | |||||||||||||
| (in thousands) | (in thousands) | |||||||||||||||
| Inhaled AAT | $ | 7,619 | $ | 6,239 | $ | 2,695 | $ | 4,939 | ||||||||
| AAT for newly diagnosed Type-1 Diabetes | 238 | 209 | 2,320 | 1,753 | ||||||||||||
| AAT IV for lung transplantation rejection and for GvHD | 194 | - | ||||||||||||||
| Anti Rabies | 1,772 | - | ||||||||||||||
| Unallocated salary | 3,847 | 3,493 | 5,237 | 4,566 | ||||||||||||
| Unallocated facility cost allocated to research and development | 223 | 1,066 | 3,244 | 4,569 | ||||||||||||
| Unallocated other expenses | 818 | 814 | 783 | 703 | ||||||||||||
| Total research and development expenses | $ | 12,745 | $ | 11,821 | $ | 16,245 | $ | 16,530 | ||||||||
Three Months Ended | ||||||||||||||||||||||||||||||||
December 31, 2014 | September 30, 2014 | June 30, 2014 | March 31, 2014 | December 31, 2013 | September 30, 2013 | June 30, 2013 | March 31, 2013 | |||||||||||||||||||||||||
| (in thousands) | ||||||||||||||||||||||||||||||||
| Revenues from Proprietary Products | $ | 19,104 | 9,143 | $ | 8,721 | $ | 7,421 | $ | 18,635 | $ | 12,066 | $ | 11,897 | $ | 8,060 | |||||||||||||||||
| Revenues from Distribution | 5,827 | 8,007 | 7,076 | 5,766 | 5,797 | 5,414 | 4,218 | 4,536 | ||||||||||||||||||||||||
Total revenues | 24,931 | 17,150 | 15,797 | 13,187 | 24,432 | 17,480 | 16,115 | 12,596 | ||||||||||||||||||||||||
Cost of revenues from Proprietary Products5 | 12,172 | 5,739 | 9,703 | 5,003 | 10,587 | 6,834 | 5,121 | 4,562 | ||||||||||||||||||||||||
Cost of revenues from Distribution | 5,288 | 7,036 | 6,160 | 4,922 | 4,979 | 4,721 | 3,573 | 3,839 | ||||||||||||||||||||||||
| Total cost of revenues | 17,460 | 12,775 | 15,863 | 9,925 | 15,566 | 11,555 | 8,694 | 8,401 | ||||||||||||||||||||||||
Gross profit | 7,471 | 4,375 | (66 | ) | 3,262 | 8,866 | 5,925 | 7,421 | 4,195 | |||||||||||||||||||||||
| Research and development expenses | 3,417 | 4,180 | 5,068 | 3,365 | 3,578 | 2,833 | 2,604 | 3,730 | ||||||||||||||||||||||||
| Selling and marketing expenses | 857 | 675 | 719 | 647 | 546 | 591 | 450 | 513 | ||||||||||||||||||||||||
| General and administrative expenses | 1,582 | 2,017 | 2,037 | 1,957 | 2,344 | 1,543 | 2,719 | 1,256 | ||||||||||||||||||||||||
| Operating income (loss) | 1,615 | (2,497 | ) | (7,890 | ) | (2,707 | ) | 2,398 | 958 | 1,648 | (1,304 | ) | ||||||||||||||||||||
Financial income | 570 | 439 | 179 | 243 | 44 | 80 | 79 | 86 | ||||||||||||||||||||||||
| Income (expense) in respect of translation differences and derivatives | (291 | ) | (44 | ) | 97 | 39 | (203 | ) | (96 | ) | (132 | ) | 62 | |||||||||||||||||||
Financial expense | (744 | ) | (759 | ) | (737 | ) | (674 | ) | (679 | ) | (926 | ) | (693 | ) | (855 | ) | ||||||||||||||||
| Income (loss) before taxes on income | 1,150 | (2,861 | ) | (8,351 | ) | (3,099 | ) | 1,560 | 16 | 902 | (2,011 | ) | ||||||||||||||||||||
Taxes on income | (18 | ) | 36 | 11 | 23 | 9 | (21 | ) | 12 | 24 | ||||||||||||||||||||||
Net income (loss) | $ | 1,168 | $ | (2,897 | ) | $ | (8,362 | ) | $ | (3,122 | ) | $ | 1,551 | $ | 37 | $ | 890 | $ | (2,035 | ) | ||||||||||||
Three Months Ended | ||||||||||||||||||||||||||||||||
| December 31, 2017 | September 30, 2017 | June 30, 2017 | March 31, 2017 | December 31, 2016 | September 30, 2016 | June 30, 2016 | March 31, 2016 | |||||||||||||||||||||||||
| (in thousands) | ||||||||||||||||||||||||||||||||
| Revenues from Proprietary Products | $ | 28,991 | $ | 17,058 | $ | 26,874 | $ | 6,636 | $ | 17,688 | $ | 15,044 | $ | 12,106 | $ | 11,120 | ||||||||||||||||
| Revenues from Distribution | 6,719 | 5,860 | 5,675 | 5,012 | 6,570 | 4,329 | 6,960 | 3,677 | ||||||||||||||||||||||||
| Total revenues | 35,710 | 22,918 | 32,549 | 11,648 | 24,258 | 19,373 | 19,066 | 14,797 | ||||||||||||||||||||||||
| Cost of revenues from Proprietary Products | 18,608 | 11,509 | 16,053 | 5,165 | 13,880 | 9,433 | 7,479 | 6,931 | ||||||||||||||||||||||||
Cost of revenues from Distribution | 5,472 | 4,961 | 4,784 | 4,185 | 5,700 | 3,644 | 5,958 | 3,089 | ||||||||||||||||||||||||
| Total cost of revenues | 24,080 | 16,470 | 20,837 | 9,350 | 19,580 | 13,097 | 13,437 | 10,020 | ||||||||||||||||||||||||
| Gross profit | 11,630 | 6,448 | 11,712 | 2,298 | 4,678 | 6,276 | 5,629 | 4,777 | ||||||||||||||||||||||||
| Research and development expenses | 1,917 | 3,418 | 3,487 | 3,151 | 4,221 | 4,415 | 3,502 | 4,107 | ||||||||||||||||||||||||
| Selling and marketing expenses | 1,265 | 1,021 | 1,084 | 1,028 | 686 | 866 | 856 | 835 | ||||||||||||||||||||||||
| General and administrative expenses | 2,003 | 2,323 | 2,117 | 1,830 | 1,665 | 2,014 | 1,861 | 1,813 | ||||||||||||||||||||||||
| Operating income (loss) | 6,445 | (314 | ) | 5,024 | (3,711 | ) | (1,894 | ) | (1,019 | ) | (590 | ) | (1,978 | ) | ||||||||||||||||||
| Financial income | 234 | 92 | 96 | 78 | 81 | 90 | 133 | 165 | ||||||||||||||||||||||||
| Income (expense) in respect of currency exchange differences and derivatives, net | (133 | ) | - | (245 | ) | (234 | ) | 259 | (73 | ) | 90 | (149 | ) | |||||||||||||||||||
| Financial expense | (112 | ) | (14 | ) | (13 | ) | (23 | ) | (20 | ) | (39 | ) | (30 | ) | (37 | ) | ||||||||||||||||
| Income (loss) before taxes on income | 6,434 | (236 | ) | 4,862 | (3,890 | ) | (1,574 | ) | (1,041 | ) | (397 | ) | (1,999 | ) | ||||||||||||||||||
| Taxes on income | 182 | - | - | 87 | 234 | - | 1,188 | 300 | ||||||||||||||||||||||||
| Net income (loss) | $ | 6,252 | $ | (236 | ) | $ | 4,862 | $ | (3,977 | ) | $ | (1,808 | ) | $ | (1,041 | ) | $ | (1,585 | ) | $ | (2,299 | ) | ||||||||||
| Total | Less than 1 Year | 1 – 3 Years | ||||||||||
| Purchase commitments | $ | 28,987 | $ | 28,987 | - | |||||||
| Short-term debt obligations (1) | 8,275 | 8,275 | - | |||||||||
| Operating lease obligations | 1,389 | 668 | 721 | |||||||||
Total | $ | 38,651 | $ | 37,930 | $ | 721 | ||||||
| Total | Less than 1 Year | 1 – 3 Years | 4-5 Years | 6 Year and thereafter | ||||||||||||||||
| Purchase commitments | $ | 37,948 | - | - | - | - | ||||||||||||||
| Long-term debt obligations (1) | 2,095 | 669 | 1,166 | 260 | - | |||||||||||||||
| Operating lease obligations | 6,432 | 1,033 | 1,504 | 1,354 | 2,541 | |||||||||||||||
| Total | $ | 46,475 | $ | 1,702 | 2,670 | 1,614 | 2,541 | |||||||||||||
| (1) | Includes interest payments on our |
| · | Expected Life. The expected life of the share options is based on historical data, and is not necessarily indicative of the exercise patterns of share options that may occur in the future. |
| · | Volatility. The expected volatility of the share prices reflects the assumption that the historical volatility of the share prices on the TASE is reasonably indicative of expected future trends. |
| · | Risk-free interest rate. The risk-free interest rate is based on the yields of non-index-linked Bank of Israel treasury bonds with maturities similar to the expected term of the options for each option group. |
| · | Expected forfeiture rate. The post-vesting forfeiture rate is based on the weighted average historical forfeiture rate. |
| · | Dividend yield and expected dividends. We have not recently declared or paid any cash dividends on our ordinary shares and do not intend to pay any cash dividends. We have therefore assumed a dividend yield and expected dividends of zero. |
| · | Share price on the TASE. The price of our ordinary shares on the TASE used in determining the grant date fair value of options is based on the price on the grant date. |
| Name | Age | Position | ||
| Executive Officers: | ||||
| Chief Executive Officer | ||||
| Chief Financial Officer | ||||
| Vice President, Research and Development and IP | ||||
| Vice President, Quality | ||||
| Shani Dotan | 45 | Vice President, Human Resources | ||
| Eran Nir | 45 | Vice President, Operations | ||
Vice President, Regulatory Affairs and PVG | ||||
| Dr. Michal Stein | 44 | Vice President, Medical Director for Immunology | ||
| Vice President, Clinical Development | ||||
| Directors: | ||||
| Leon | 69 | Chairman | ||
| David Tsur | 67 | Director, Active Deputy Chairman | ||
| Dr. Michael Berelowitz* | 73 | Director | ||
| Avraham Berger* | 66 | Director, Chairman of Audit Committee | ||
| Jonathan Hahn | Director | |||
| Dr. Abraham Havron* | ||||
| 70 | Director, Chairman of Compensation Committee | |||
| Prof. Itzhak Krinsky, Ph.D* | 66 | Director | ||
| Gwen A. Melincoff * | 65 | Director | ||
| Shmuel (Milky) Rubinstein* | 78 | Director |
| ___________ |
| * | Independent director under the Nasdaq listing requirements. |
| · |
| · | pre-approval of audit and non-audit services to be provided by the independent auditors; |
| · | reviewing and recommending to the board of directors approval of our quarterly and annual financial reports; and |
| · | overseeing the implementation and amendment of our policies for compliance with Israeli and U.S. securities laws and applicable Nasdaq corporate governance requirements. |
| · | information on the advisability of a given action brought for his or her approval or performed by virtue of his or her position; and |
| · | all other important information pertaining to such action. |
| · | refrain from any act involving a conflict of interests between the performance of his or her duties to the company and his or her other duties or personal affairs; |
| · | refrain from any activity that is competitive with the business of the company; |
| · | refrain from exploiting any business opportunity of the company to receive a personal gain for himself or herself or others; and |
| · | disclose to the company any information or documents relating to the company’s affairs which the office holder received as a result of his or her position as an office holder. |
| · | a transaction other than in the ordinary course of business; |
| · | a transaction that is not on market terms; or |
| · | a transaction that is likely to have a material impact on the company’s profitability, assets or liabilities. |
| · | at least a majority of the shares held by shareholders who have no personal interest in the transaction and who are present and voting at the meeting on the matter are voted in favor of approving the transaction, excluding abstentions; or |
| · | the shares voted against the transaction by shareholders who have no personal interest in the transaction who are present and voting at the meeting represent no more than 2% of the voting rights in the company. |
| · | an amendment to the company’s articles of association; |
| · | an increase in the company’s authorized share capital; |
| · | a merger; and |
| · | the approval of related party transactions and acts of office holders that require shareholder approval. |
| · | the securities issued amount to 20% or more of the company’s outstanding voting rights before the issuance; |
| · | some or all of the consideration is other than cash or listed securities or the transaction is not on market terms; and |
| · | the transaction will increase the relative holdings of a shareholder who holds 5% or more of the company’s outstanding share capital or voting rights or that will cause any person to become, as a result of the issuance, a holder of more than 5% of the company’s outstanding share capital or voting rights. |
| · | a majority of the shares held by shareholders who are not controlling shareholders and shareholders who do not have a personal interest in such matter and who are present and voting at the meeting, are voted in favor of approving the compensation package, excluding abstentions; or |
| · | the total number of shares voted by non-controlling shareholders and shareholders who do not have a personal interest in such matter that are voted against the compensation package does not exceed 2% of the aggregate voting rights in the company. |
| Name and Position | Salary | Bonus(1) | Value of Options Granted(2) | Other(3) | Total | |||||||||||||||
| (in thousands) | ||||||||||||||||||||
Amir London Chief Executive Officer | $ | 293 | $ | 127 | $ | 79 | $ | 26 | $ | 525 | ||||||||||
Gil Efron Former Deputy Chief Executive Officer and Chief Financial Officer | $ | 252 | $ | 146 | (4) | $ | 35 | (5) | $ | 22 | $ | 455 | ||||||||
Dr. Naveh Tov Clinical Development and Medical Director for Pulmonary Diseases | $ | 222 | $ | 39 | $ | 26 | $ | 21 | $ | 308 | ||||||||||
David Tsur Active Deputy Chairman of the Board of Directors | $ | 210 | $ | - | $ | 48 | $ | 42 | $ | 300 | ||||||||||
Eran Nir Vice President Operations | $ | 192 | $ | 35 | $ | 31 | $ | 23 | $ | 281 | ||||||||||
| Name and Position | Salary | Bonus(1) | Value of Options Granted(2) | Other(3) | Total | |||||||||||||||
| (in thousands) | ||||||||||||||||||||
David Tsur Chief Executive Officer | $ | 428 | $ | 27 | $ | 704 | $ | 38 | $ | 1,197 | ||||||||||
Gil Efron Chief Financial Officer | $ | 214 | $ | 20 | $ | 204 | $ | 26 | $ | 464 | ||||||||||
Barak Bashari Vice President, Operations and Plant Manager | $ | 222 | $ | 20 | $ | 99 | $ | 23 | $ | 364 | ||||||||||
Amir London Senior Vice President, Business Development | $ | 189 | $ | 18 | $ | 86 | $ | 21 | $ | 314 | ||||||||||
Dr. Liliana Bar Vice President, Research and Development | $ | 199 | $ | 13 | $ | 68 | $ | 19 | $ | 299 | ||||||||||
| (1) | The annual bonus is subject to the fulfillment of certain targets determined for each year by the compensation committee and board of |
| (2) | The value of options is the expense recorded in our financial statements for the period ended December 31, |
| (3) | Cost of use of company car. |
| (4) | Includes retirement grant, annual bonus and special bonus for issuance of ordinary shares in an underwritten public offering. |
| (5) | Includes Awards acceleration. |
| · | a monetary liability imposed on him or her in favor of another person pursuant to a judgment, including a settlement or arbitrator’s award approved by a court. However, if an undertaking to indemnify an office holder with respect to such liability is provided in advance, then such an undertaking must be limited to events which, in the opinion of the board of directors, can be foreseen based on the company’s activities when the undertaking to indemnify is given, and to an amount, or according to criteria, determined by the board of directors as reasonable under the circumstances. Such undertaking shall detail the foreseen events and amount or criteria mentioned above; |
| · | reasonable litigation expenses, including reasonable attorneys’ fees, incurred by the office holder (1) as a result of an investigation or proceeding instituted against him or her by an authority authorized to conduct such investigation or proceeding, provided that (i) no indictment was filed against such office holder as a result of such investigation or proceeding; and (ii) no financial liability was imposed upon him or her as a substitute for the criminal proceeding as a result of such investigation or proceeding or, if such financial liability was imposed, it was imposed with respect to an offense that does not require proof of criminal intent (mens rea); and (2) in connection with a monetary sanction; and |
| · | reasonable litigation expenses, including attorneys’ fees, incurred by the office holder or imposed by a court in proceedings instituted against him or her by the company, on its behalf, or by a third party, or in connection with criminal proceedings in which the office holder was acquitted, or as a result of a conviction for an offense that does not require proof of criminal intent (mens rea). |
| · | a breach of a duty of loyalty to the company, provided that the office holder acted in good faith and had a reasonable basis to believe that the act would not harm the company; |
| · | a breach of duty of care to the company or to a third party, to the extent such a breach arises out of the negligent conduct of the office holder; and |
| · | a monetary liability imposed on the office holder in favor of a third party. |
| · | a breach of the duty of loyalty, except for indemnification and insurance for a breach of the duty of loyalty to the company to the extent that the office holder acted in good faith and had a reasonable basis to believe that the act would not harm the company; |
| · | a breach of the duty of care committed intentionally or recklessly, excluding a breach arising out of the negligent conduct of the office holder; |
| · | an act or omission committed with intent to derive illegal personal benefit; or |
| · | a fine or penalty levied against the office holder. |
| Name | Number | Percentage | ||||||
| Amir London (1) | 137,375 | * | ||||||
| Chaime Orlev (2) | 4,166 | - | ||||||
| Dr. Liliana Bar (3) | 40,625 | * | ||||||
| Yael Brenner (4) | 26,042 | * | ||||||
| Shani Dotan (5) | 37,917 | * | ||||||
| Eran Nir (6) | 10,739 | * | ||||||
| Orit Pinchuk (7) | 30,917 | * | ||||||
| Dr. Michal Stein (8) | 4,167 | * | ||||||
| Dr. Naveh Tov (9) | 19,928 | * | ||||||
| Leon Recanati (10) | 4,021,248 | 9.1 | % | |||||
| David Tsur (11) | 1,147,537 | 2.8 | % | |||||
| Dr. Michael Berelowitz (12) | 2,188 | - | ||||||
| Avraham Berger (13) | 2,188 | - | ||||||
Asaf Frumerman (14) | - | - | ||||||
| Jonathan Hahn (15) | 3,668,089 | 8.3 | % | |||||
| Dr. Abraham Havron (16) | 23,930 | * | ||||||
| Prof. Itzhak Krinsky, Ph.D | 5,250 | * | ||||||
| Gwen A. Melincoff | - | - | ||||||
| Shmuel (Milky) Rubinstein | 4,383 | * | ||||||
| Directors and Executive Officers as a group (19 persons) | 9,186,689 | 18.6 | % | |||||
Name | Number | Percentage | ||||||
David Tsur (1) | 985,995 | 2.73 | % | |||||
Gil Efron (2) | 77,062 | * | ||||||
Dr. Liliana Bar (3) | 17,812 | * | ||||||
Barak Bashari (4) | 24,061 | * | ||||||
| Yael Brenner | — | — | ||||||
Shani Dotan (5) | 9,374 | * | ||||||
Amir London (6) | 10,311 | * | ||||||
| Orit Pinchok (7) | 6,250 | * | ||||||
| Dr. Eran Schenker | 26,203 | * | ||||||
Pnina Strauss (8) | 24,343 | * | ||||||
Dr. Ruth Wolfson (9) | 24,757 | * | ||||||
Leon Recanati (10) | 3,988,123 | 11.08 | % | |||||
Reuven Behar (11) | 1,728,466 | 4.79 | % | |||||
Dr. Estery Giloz-Ran (12) | 7,500 | * | ||||||
Jonathan Hahn (13) | 4,470,553 | 12.38 | % | |||||
Dr. Abraham Havron (14) | 9,242 | * | ||||||
Ziv Kop (15) | 32,036 | * | ||||||
Alicia Rotbard (16) | 7,500 | * | ||||||
Tuvia Shoham (17) | 57,655 | * | ||||||
Directors and Executive Officers as a group | 9,846,947 | 27.26 | % | |||||
| (1) | Includes 12,000 restricted shares and options to purchase |
| Represents 4,166 restricted shares. Does not include unvested options to purchase |
| (3) | Includes options to purchase 40,625 ordinary shares exercisable within 60 days of the date of this Annual Report, at a weighted average exercise price of NIS |
| Includes 4,667 restricted shares and options to purchase |
| Includes 4,667 restricted shares and options to purchase |
| Represents 6,833 restricted shares and options to purchase |
| Includes 2,667 restricted shares and options to purchase |
| Represents 4,167 restricted shares. Does not include unvested options to purchase |
| (9) | Includes 6,834 restricted shares and options to purchase 13,094 ordinary shares exercisable within 60 days of the date of this Annual Report, at an exercise price of NIS 31.85 (or $9.19) per share, which expire between May 14, 2020 and January 31, 2024. Does not include unvested options to purchase 23,406 ordinary shares that are not exercisable within 60 days of this Annual Report. |
| (10) | Mr. Recanati holds 677,479 ordinary shares directly and 3,295,644 ordinary shares indirectly through Gov. Gov is wholly-owned by Mr. Recanati, the Chairman of our board of directors, who exercises sole voting and investment power over the shares held by Gov. |
| (11) | Mr. |
Includes options to purchase |
| (13) | Includes options to purchase 2,188 ordinary shares exercisable within 60 days of the date of this Annual Report, at a weighted average exercise price of NIS 15.20 (or $4.38) per share, which expire at March 2, 2023 and May 30, 2024. Does not include unvested options to purchase 7,813 ordinary shares that are not exercisable within 60 days of this Annual Report. |
| (14) | We were informed by Mr. Frumerman that he is a partner at Brosh Capital Partners L.P. For information regarding the holdings of the Brosh Capital Partners group, see “Item 7. Major Shareholders and Related Party Transactions — Major Shareholders.” |
| (15) | Mr. Jonathan Hahn directly holds 313,841 ordinary shares and options to purchase 25,938 ordinary shares exercisable within 60 days of this Annual Report, at an exercise price of NIS 47.90 (or $13.82) per share, which expire between May 14, 2020 and May 5, 2024. In addition, we were informed that Mr. Hahn holds 25% of the shares of Sinara Financing S.A. (“Sinara”), which holds 100% of the shares of Damar Chemicals Inc. (“Damar”), which directly holds 2,751,661 ordinary shares. We were informed that additional 50% of the shares of Sinara are held by Mr. Hahn’s siblings, who also directly hold an aggregate 576,649 ordinary shares. Does not include unvested options to purchase 9,063 ordinary shares that are not exercisable within 60 days of this Annual Report. |
| (16) | Includes 1,742 shares owned by Operon Consultants Ltd., which is wholly-owned by Dr. Havron. Dr. Havron also holds options to purchase 22,188 ordinary shares exercisable within 60 days of the date of this Annual Report, at an exercise price of NIS |
| Name | Number | Percentage | ||||||
| Meitav Dash Group (1) | 3,691,595 | 9.2 | % | |||||
| Leon Recanati (2) | 4,021,248 | 9.1 | % | |||||
| Hahn Family (3) | 3,668,089 | 8.3 | % | |||||
| Brosh Capital Partners L.P (4). | 3,094,721 | 7.7 | % | |||||
| The Phoenix Holding Ltd. (5) | 2,785,010 | 6.9 | % | |||||
Name | Number | Percentage | ||||||
Estate of Mr. Ralf Hahn (1) | 4,411,957 | 10.54 | % | |||||
| Leon Recanati (2) | 3,988,123 | 11.08 | % | |||||
| D.S Apex Holdings group (3) | 2,830,080 | 7.84 | % | |||||
| The Phoenix Holding Ltd. (4) | 2,841,791 | 7.87 | % | |||||
| Jonathan Hahn (5) | 2,809,972 | 7.78 | % | |||||
| (1) |
| (2) | Mr. Recanati holds 677,479 ordinary shares directly and 3,295,644 ordinary shares indirectly through Gov. Gov is wholly-owned by Mr. Recanati, the Chairman of our board of directors, who exercises sole voting and investment power over the shares held by Gov. |
| (3) |
| (4) | Based solely upon, and qualified in its entirety with reference to, Amendment No. 2 to Schedule 13D filed with the SEC on November 13, 2017. According to the Schedule 13D/A, (a) Brosh Capital Partners, L.P., a |
| (5) |
| Price Per Ordinary Share | ||||||||
| High | Low | |||||||
| Annual: | ||||||||
| 2017 | $ | 8.61 | $ | 3.75 | ||||
| 2016 | $ | 6.29 | $ | 3.26 | ||||
| 2015 | $ | 5.15 | $ | 3.09 | ||||
| 2014 | $ | 17.95 | $ | 3.02 | ||||
| 2013 (from May 30, 2013) | $ | 17.07 | $ | 9.60 | ||||
| Quarterly: | ||||||||
| Fourth Quarter 2017 | $ | 5.25 | $ | 4.26 | ||||
| Third Quarter 2017 | $ | 6.05 | $ | 3.75 | ||||
| Second Quarter 2017 | $ | 8.61 | $ | 5.40 | ||||
| First Quarter 2017 | $ | 7.25 | $ | 5.50 | ||||
| Fourth Quarter 2016 | $ | 6.29 | $ | 5.05 | ||||
| Third Quarter 2016 | $ | 5.34 | $ | 3.63 | ||||
| Second Quarter 2016 | $ | 4.19 | $ | 3.60 | ||||
| First Quarter 2016 | $ | 4.44 | $ | 3.26 | ||||
| Most Recent Six Months: | ||||||||
| February 2018 (through March 5, 2018) | $ | 5.5 | $ | 4.65 | ||||
| January 2018 | $ | 5.75 | $ | 4.75 | ||||
| December 2017 | $ | 4.85 | $ | 4.26 | ||||
| November 2017 | $ | 4.85 | $ | 4.40 | ||||
| October 2017 | $ | 5.25 | $ | 4.65 | ||||
| September 2017 | $ | 4.85 | $ | 4.35 | ||||
Price Per Ordinary Share | ||||||||
High | Low | |||||||
| Annual: | ||||||||
| 2014 | 17.95 | 3.02 | ||||||
| 2013 | 17.07 | 9.6 | ||||||
| Quarterly: | ||||||||
| First Quarter 2015 | 4.83 | 3.79 | ||||||
| Fourth Quarter 2014 | 17.07 | 13.40 | ||||||
| Third Quarter 2014 | 15.48 | 11.55 | ||||||
| Second Quarter 2014 | 14.87 | 9.60 | ||||||
| Most Recent Six Months: | ||||||||
| April 2015 (through April 26, 2015) | 5.15 | 4.45 | ||||||
| March 2015 | 4.83 | 4.08 | ||||||
| February 2015 | 4.68 | 3.86 | ||||||
| January 2015 | 4.50 | 3.79 | ||||||
| December 2014 | 3.88 | 3.24 | ||||||
| November 2014 | 4.16 | 3.02 | ||||||
| NIS | $ | |||||||||||||||
| Price Per Ordinary Share | Price Per Ordinary Share | |||||||||||||||
| High | Low | High | Low | |||||||||||||
| Annual: | ||||||||||||||||
| 2017 | 29.20 | 14.81 | 8.45 | 4.29 | ||||||||||||
| 2016 | 23.25 | 13.10 | 6.32 | 3.56 | ||||||||||||
| 2015 | 19.45 | 12.09 | 4.97 | 3.09 | ||||||||||||
| 2014 | 62.00 | 11.60 | 15.85 | 2.97 | ||||||||||||
| 2013 | 60.77 | 33.80 | 15.54 | 8.64 | ||||||||||||
| Quarterly: | ||||||||||||||||
| Fourth Quarter 2017 | 18.40 | 15.25 | 5.32 | 4.41 | ||||||||||||
| Third Quarter 2017 | 21.30 | 14.81 | 6.16 | 4.29 | ||||||||||||
| Second Quarter 2017 | 29.20 | 19.05 | 8.45 | 5.51 | ||||||||||||
| First Quarter 2017 | 27.10 | 20.89 | 7.84 | 6.04 | ||||||||||||
| Fourth Quarter 2016 | 23.25 | 19.27 | 6.32 | 5.24 | ||||||||||||
| Third Quarter 2016 | 19.79 | 14.05 | 5.38 | 3.82 | ||||||||||||
| Second Quarter 2016 | 16.05 | 14.01 | 4.36 | 3.81 | ||||||||||||
| First Quarter 2016 | 17.70 | 13.10 | 4.81 | 3.56 | ||||||||||||
| Most Recent Six Months: | ||||||||||||||||
February 2018 (through March 5, 2018) | 18.97 | 16.45 | 5.49 | 4.76 | ||||||||||||
| January 2018 | 19.67 | 16.40 | 5.69 | 4.75 | ||||||||||||
| December 2017 | 16.55 | 15.25 | 4.79 | 4.41 | ||||||||||||
| November 2017 | 17.69 | 15.50 | 5.12 | 4.48 | ||||||||||||
| October 2017 | 18.40 | 16.48 | 5.32 | 4.77 | ||||||||||||
| September 2017 | 17.20 | 15.85 | 4.98 | 4.59 | ||||||||||||
NIS | $ | |||||||||||||||
Price Per Ordinary Share | Price Per Ordinary Share | |||||||||||||||
High | Low | High | Low | |||||||||||||
| Annual: | ||||||||||||||||
2014 | 62.00 | 11.60 | 15.45 | 2.89 | ||||||||||||
2013 | 60.77 | 33.80 | 15.14 | 8.42 | ||||||||||||
2012 | 35.95 | 19.02 | 8.96 | 4.74 | ||||||||||||
2011 | 33.00 | 17.65 | 8.22 | 4.40 | ||||||||||||
2010 | 28.13 | 18.18 | 7.01 | 4.53 | ||||||||||||
| Quarterly: | ||||||||||||||||
First Quarter 2015 | 19.33 | 14.70 | 4.82 | 3.66 | ||||||||||||
Fourth Quarter 2014 | 17.07 | 11.60 | 4.25 | 2.89 | ||||||||||||
Third Quarter 2014 | 25.96 | 16.22 | 6.47 | 4.04 | ||||||||||||
Second Quarter 2014 | 54.75 | 23.85 | 13.64 | 5.94 | ||||||||||||
First Quarter 2014 | 62.00 | 49.71 | 15.45 | 12.38 | ||||||||||||
Fourth Quarter 2013 | 60.77 | 46.36 | 15.14 | 11.55 | ||||||||||||
Third Quarter 2013 | 54.75 | 41.59 | 13.64 | 10.36 | ||||||||||||
Second Quarter 2013 | 44.45 | 36.05 | 11.07 | 8.98 | ||||||||||||
First Quarter 2013 | 39.70 | 33.80 | 9.89 | 8.42 | ||||||||||||
| Most Recent Six Months: | ||||||||||||||||
| April 2015 (through April 26, 2015) | 19.45 | 17.53 | 4.85 | 4.37 | ||||||||||||
March 2015 | 19.33 | 16.75 | 4.82 | 4.17 | ||||||||||||
February 2015 | 18.30 | 15.10 | 4.56 | 3.76 | ||||||||||||
January 2015 | 18.35 | 14.70 | 4.57 | 3.66 | ||||||||||||
December 2014 | 14.62 | 12.72 | 3.64 | 3.17 | ||||||||||||
November 2014 | 15.87 | 11.6 | 3.95 | 2.89 | ||||||||||||
| · | banks, certain financial institutions or insurance companies; |
| · | real estate investment trusts, regulated investment companies or grantor trusts; |
| · | dealers or traders in securities, commodities or currencies; |
| · | tax-exempt entities; |
| · | certain former citizens or long-term residents of the United States; |
| · | persons that received our shares as compensation for the performance of services; |
| · | persons that will hold our shares as part of a “hedging,” “integrated” or “conversion” transaction or as a position in a “straddle” for U.S. federal income tax purposes; |
| · | partnerships (including entities classified as partnerships for U.S. federal income tax purposes) or other pass-through entities, or holders that will hold our shares through such an entity; |
| · | S-corporations; |
| · | persons whose “functional currency” is not the U.S. Dollar; |
| · | persons that own directly, indirectly or through attribution 10% or more of the voting power or value of our shares; or |
| · | persons holding our ordinary shares in connection with a trade or business conducted outside the United States. |
| · | a citizen or resident of the United States; |
| · | a corporation (or other entity treated as a corporation for U.S. federal income tax purposes) created or organized in or under the laws of the United States or any jurisdiction thereof; or |
| · | a trust or estate the income of which is subject to United States federal income taxation regardless of its source. |
| · | at least 75% of its gross income is “passive income”, or |
| · | at least 50% of the average quarterly value of its gross assets is attributable to assets that produce passive income or are held for the production of passive income. |
| Period | Change in Average Exchange Rate of the NIS against the U.S. Dollar (%) | |||
| Year ended December 31, | ||||
| Year ended December 31, | ) | |||
| Year ended December 31, | ) | |||
| Year Ended December 31, | ||||||||
| 2017 | 2016 | |||||||
| Audit Fees(1) | $ | 190,000 | $ | 190,000 | ||||
| Audit-Related Fees(2) | 110,000 | 15,000 | ||||||
| Tax Fees and others(3) | 8,000 | 33,615 | ||||||
| Total | $ | 308,000 | $ | 238,615 | ||||
Year Ended December 31, | ||||||||
2014 | 2013 | |||||||
| Audit Fees(1) | $ | 160,000 | $ | 160,000 | ||||
| Audit-Related Fees(2) | -- | 200,000 | ||||||
| Tax Fees(3) | 12,000 | 14,000 | ||||||
| Total | $ | 172,000 | $ | 374,000 | ||||
| (1) | Audit fees are aggregate fees for audit services for each of the years shown in this table, including fees associated with the annual audit and reviews of our quarterly financial results submitted on Form 6-K, consultations on various accounting issues and audit services provided in connection with other statutory or regulatory filings. |
| (2) | Audit-related fees in 2016 are for services rendered by our auditors in connection with our shelf registration |
| (3) | Tax services in 2016 rendered by our auditors were for tax compliance and for tax consulting associated with international transfer pricing. Tax services in 2017 rendered by our auditors were for equity incentive awards and other services for methodology support in the area of business continuity. |
| · | Shareholder approval requirements for equity issuances and equity-based compensation plans. Under the Companies Law, the adoption of, and material changes to, equity-based compensation plans generally require the approval of the board of directors (for approval of equity based arrangements, see “Item 6. Directors, Senior Management and Employees — Fiduciary Duties and Approval of Specified Related Party Transactions under Israeli Law — Disclosure of Personal Interests of a Controlling Shareholder and Approval of Certain Transactions,” “Item 6. Directors, Senior Management and Employees — Compensation of Directors” and “Item 6. Directors, Senior Management and Employees — Compensation of Executive Officers”). Similarly, the approval of the board of directors is generally sufficient for a private placement unless the private placement is deemed a “significant private placement” (see “Item 6. Directors, Senior Management and Employees — Approval of Significant Private Placements”), in which case shareholder approval is also required, or an office holder or a controlling shareholder or their relative has a personal interest in the private placement, in which case, audit committee approval is required prior to the board approval and, for a private placement in which a controlling shareholder or its relative has a personal interest, shareholder approval is also required (see “Item 6. Directors, Senior Management and Employees — Fiduciary Duties and Approval of Specified Related Party Transactions under Israeli Law”). |
| · | Requirement for independent oversight on our director nominations process and to adopt a formal written charter or board resolution addressing the nominations process. In accordance with Israeli law and practice, directors are recommended by our board of directors for election by our shareholders. The Damar Group and Recananti Group have entered into a shareholders’ agreement which includes an agreement about voting in the election of nominees appointed by the other party (see “Item 7. Major Shareholders and Related Party Transactions — Related Party Transactions — Shareholders’ Agreement”). |
| · | Quorum requirement. Under our articles of association and as permitted under the Companies Law, a quorum for any meeting of shareholders shall be the presence of at least two shareholders present in person, by proxy or by a voting instrument, who hold at least 25% of the voting power of our shares instead of 33 1/3% of the issued share capital required under Nasdaq requirements. At an adjourned meeting, any number of shareholders shall constitute a quorum. |
| · | Compensation Committee Charter. As permitted under the Companies Law, we do not have a formal charter for our compensation committee. |
| · | Except as stated above, we comply with the rules generally applicable to U.S. domestic companies listed on Nasdaq subject to certain exemptions the JOBS Act provides to emerging growth companies. We may in the future decide to use other foreign private issuer exemptions with respect to some or all of the other Nasdaq listing requirements. Following our home country governance practices, as opposed to the requirements that would otherwise apply to a company listed on Nasdaq, may provide less protection than is accorded to investors under Nasdaq listing requirements applicable to domestic issuers. For more information, see “Item 3. Key Information —D. Risk Factors — We are an ‘emerging growth company’ with reduced reporting requirements that may make our ordinary shares less attractive to investors” and “Item 3. Key Information —D. Risk Factors — As we are a ‘foreign private issuer’ and intend to follow certain home country corporate governance practices, our shareholders may not have the same protections afforded to shareholders of companies that are subject to all Nasdaq corporate governance requirements.” We are also required to comply with Israeli corporate governance requirements under the Companies Law applicable to Israeli public companies, such as us, whose shares are also listed for trade on an exchange outside Israel. |
| Page | |
| F-2 | |
| Consolidated Financial Statements as of December 31, | |
| F-3 | |
| F-4 | |
| F-5 | |
| F-6 | |
| F-8 |
First Amendment to the Distribution Agreement dated as of August 19, 2014, by and between Kamada Ltd. and TUTEUR | ||
| † | Portions of this exhibit have been omitted pursuant to a request for confidential treatment and the non-public information has been filed separately with the Securities and Exchange Commission. |
KAMADA LTD. | |||
| By: | /s/ | ||
| Chief Financial Officer | |||
| Page | |


| As of December 31, | ||||||||||||
| 2017 | 2016 | |||||||||||
| Note | In thousands | |||||||||||
Current Assets | ||||||||||||
| Cash and cash equivalents | 5 | $ | 12,681 | $ | 9,968 | |||||||
| Short-term investments | 6 | 30,338 | 18,664 | |||||||||
| Trade receivables, net | 7 | 30,662 | 19,788 | |||||||||
| Other accounts receivables | 8 | 2,132 | 3,063 | |||||||||
| Inventories | 9 | 21,070 | 25,594 | |||||||||
| 96,883 | 77,077 | |||||||||||
| Property, plant and equipment, net | 10 | 25,178 | 22,579 | |||||||||
| Other long term assets | 11 | 49 | 40 | |||||||||
| 25,227 | 22,619 | |||||||||||
| 122,110 | 99,696 | |||||||||||
Current Liabilities | ||||||||||||
| Current maturities of loans and capital leases | 14 | 614 | 412 | |||||||||
| Trade payables | 12 | 18,036 | 16,277 | |||||||||
| Other accounts payables | 13 | 5,820 | 5,614 | |||||||||
| Deferred revenues | 17a,b | 4,927 | 4,903 | |||||||||
| 29,397 | 27,206 | |||||||||||
Non-Current Liabilities | ||||||||||||
| Loans and capital leases | 14 | 1,370 | 1,364 | |||||||||
| Employee benefit liabilities, net | 16 | 1,144 | 722 | |||||||||
| Deferred revenues | 17a,b | 707 | 3,661 | |||||||||
| 3,221 | 5,747 | |||||||||||
Shareholders' Equity | 19 | |||||||||||
| Ordinary shares | 10,400 | 9,320 | ||||||||||
| Additional paid in capital | 177,874 | 162,671 | ||||||||||
| Capital reserve due to translation to presentation currency | (3,490 | ) | (3,490 | ) | ||||||||
| Capital reserve from hedges | 46 | (27 | ) | |||||||||
| Capital reserve from available for sale financial assets | (4 | ) | 19 | |||||||||
| Capital reserve from share-based payments | 9,566 | 9,795 | ||||||||||
| Capital reserve from employee benefits | (337 | ) | (81 | ) | ||||||||
| Accumulated deficit | (104,563 | ) | (111,464 | ) | ||||||||
| 89,492 | 66,743 | |||||||||||
| $ | 122,110 | $ | 99,696 | |||||||||
| As of December 31, | ||||||||||
| 2014 | 2013 | |||||||||
| Note | In thousands | |||||||||
| Current Assets | ||||||||||
| Cash and cash equivalents | 5 | $ | 14,546 | $ | 59,110 | |||||
| Short-term investments | 6 | 37,350 | 15,067 | |||||||
| Trade receivables, net | 7 | 17,514 | 17,882 | |||||||
| Other accounts receivables | 8 | 2,359 | 3,694 | |||||||
| Inventories | 9 | 25,423 | 21,933 | |||||||
| 97,192 | 117,686 | |||||||||
| Property, plant and equipment, net | 10 | 21,769 | 21,443 | |||||||
| Other long term assets | 11 | 179 | 250 | |||||||
| 21,948 | 21,693 | |||||||||
| 119,140 | 139,379 | |||||||||
| Current Liabilities | ||||||||||
| Current maturities of convertible debentures | 12,15 | 7,492 | 8,718 | |||||||
| Trade payables | 13 | 16,530 | 14,093 | |||||||
| Other accounts payables | 14 | 4,045 | 4,313 | |||||||
| Deferred revenues | 18a,b | 2,919 | 5,454 | |||||||
| 30,986 | 32,578 | |||||||||
| Non-Current Liabilities | ||||||||||
| Convertible debentures | 15 | - | 7,498 | |||||||
| Employee benefit liabilities, net | 17 | 722 | 827 | |||||||
| Deferred revenues | 18a,b | 7,015 | 8,506 | |||||||
| 7,737 | 16,831 | |||||||||
| Shareholder's Equity | 20 | |||||||||
| Ordinary shares of NIS 1 par value: | ||||||||||
| Authorized - 60,000,000 ordinary shares; Issued and outstanding – 35,988,563 and 35,959,939 shares at December 31, 2014 and 2013, respectively | 9,208 | 9,201 | ||||||||
| Additional paid in capital | 158,417 | 157,100 | ||||||||
| Conversion option in convertible debentures | 1,147 | 2,218 | ||||||||
| Capital reserve due to translation to presentation currency | (3,490 | ) | (3,490 | ) | ||||||
| Capital reserve from hedges | (116 | ) | 156 | |||||||
| Capital reserve from available for sale financial assets | 10 | (27 | ) | |||||||
| Capital reserve from share-based payments | 8,783 | 5,189 | ||||||||
| Capital reserve from employee benefits | (81 | ) | (129 | ) | ||||||
| Accumulated deficit | (93,461 | ) | (80,248 | ) | ||||||
| 80,417 | 89,970 | |||||||||
| $ | 119,140 | $ | 139,379 | |||||||
For the Year Ended December 31, | |||||||||||||
| 2014 | 2013 | 2012 | |||||||||||
| Note | In thousands, except for share and per share data | ||||||||||||
| Revenues from proprietary products | $ | 44,389 | $ | 50,658 | $ | 46,445 | |||||||
| Revenues from distribution | 26,676 | 19,965 | 26,230 | ||||||||||
| Total revenues | 23a | 71,065 | 70,623 | 72,675 | |||||||||
| Cost of revenues from proprietary products | 32,617 | 27,104 | 26,911 | ||||||||||
| Cost of revenues from distribution | 23,406 | 17,112 | 23,071 | ||||||||||
| Total cost of revenues | 23b | 56,023 | 44,216 | 49,982 | |||||||||
| Gross profit | 15,042 | 26,407 | 22,693 | ||||||||||
| Research and development expenses | 23c | 16,030 | 12,745 | 11,821 | |||||||||
| Selling and marketing expenses | 23d | 2,898 | 2,100 | 1,853 | |||||||||
| General and administrative expenses | 23e | 7,593 | 7,862 | 4,781 | |||||||||
| Operating income ( loss) | (11,479 | ) | 3,700 | 4,238 | |||||||||
| Financial income | 23f | 1,611 | 289 | 578 | |||||||||
| expense in respect of currency exchange and translation differences and derivatives instruments, net | - | (369 | ) | (100 | ) | ||||||||
| expense in respect of revaluation of warrants to fair value | - | - | (576 | ) | |||||||||
| Financial expense | 23f | (3,293 | ) | (3,153 | ) | (3,357 | ) | ||||||
| Income (loss) before taxes on income | (13,161 | ) | 467 | 783 | |||||||||
| Taxes on income | 52 | 24 | 523 | ||||||||||
| Net Income ( loss) | (13,213 | ) | 443 | 260 | |||||||||
| Other Comprehensive Income (loss): | |||||||||||||
| Items that may be reclassified to profit or loss in subsequent periods: | |||||||||||||
| Gain (loss) on available for sale financial assets | 37 | (27 | ) | - | |||||||||
| Gain (loss) on cash flow hedges | (162 | ) | 303 | 366 | |||||||||
| Net amounts transferred to the statement of profit or loss for cash flow hedges | (110 | ) | (376 | ) | (137 | ) | |||||||
| Items that will not be reclassified to profit or loss in subsequent periods: | |||||||||||||
| Actuarial gain from defined benefit plans | 48 | 12 | 46 | ||||||||||
| Total comprehensive income ( loss) | $ | (13,400 | ) | $ | 355 | $ | 535 | ||||||
| Income (loss) per share attributable to equity holders of the Company: | 24 | ||||||||||||
| Basic income (loss) per share | $ | (0.37 | ) | $ | 0.01 | $ | 0.01 | ||||||
| Diluted income (loss) per share | $ | (0.37 | ) | $ | 0.01 | $ | 0.01 | ||||||
For the Year Ended December 31, | ||||||||||||||||
| 2017 | 2016 | 2015 | ||||||||||||||
| Note | In thousands, except for share and per share data | |||||||||||||||
| Revenues from proprietary products | $ | 79,559 | $ | 55,958 | $ | 42,952 | ||||||||||
| Revenues from distribution | 23,266 | 21,536 | 26,954 | |||||||||||||
| Total revenues | 22a | 102,825 | 77,494 | 69,906 | ||||||||||||
| Cost of revenues from proprietary products | 51,335 | 37,723 | 30,901 | |||||||||||||
| Cost of revenues from distribution | 19,402 | 18,411 | 23,640 | |||||||||||||
| Total cost of revenues | 22b | 70,737 | 56,134 | 54,541 | ||||||||||||
| Gross profit | 32,088 | 21,360 | 15,365 | |||||||||||||
| Research and development expenses | 22c | 11,973 | 16,245 | 16,530 | ||||||||||||
| Selling and marketing expenses | 22d | 4,398 | 3,243 | 3,652 | ||||||||||||
| General and administrative expenses | 22e | 8,273 | 7,353 | 6,607 | ||||||||||||
| Operating income (loss) | 7,444 | (5,481 | ) | (11,424 | ) | |||||||||||
| Financial income | 22f | 500 | 469 | 463 | ||||||||||||
| Income (expense) in respect of currency exchange differences and derivatives instruments, net | (612 | ) | 127 | 625 | ||||||||||||
| Financial expense | 22f | (162 | ) | (126 | ) | (934 | ) | |||||||||
| Gain (loss) before taxes on income | 7,170 | (5,011 | ) | (11,270 | ) | |||||||||||
| Taxes on income | 269 | 1,722 | - | |||||||||||||
| Net income (loss) | 6,901 | (6,733 | ) | (11,270 | ) | |||||||||||
| Other Comprehensive Income (loss): | ||||||||||||||||
| Items that may be reclassified to profit or loss in subsequent periods: | ||||||||||||||||
| Gain (loss) on available for sale financial assets | (23 | ) | (54 | ) | 63 | |||||||||||
| Gain (loss) on cash flow hedges | 329 | 47 | 71 | |||||||||||||
| Net amounts transferred to the statement of profit or loss for cash flow hedges | (256 | ) | (73 | ) | 44 | |||||||||||
| Items that will not be reclassified to profit or loss in subsequent periods: | ||||||||||||||||
| Actuarial gain (loss) from defined benefit plans | (256 | ) | (22 | ) | 22 | |||||||||||
| Total comprehensive income (loss) | $ | 6,695 | $ | (6,835 | ) | $ | (11,070 | ) | ||||||||
Income (loss) per share attributable to equity holders of the Company: | 23 | |||||||||||||||
| Basic income (loss) per share | $ | 0.18 | $ | (0.18 | ) | $ | (0.31 | ) | ||||||||
| Diluted income (loss) per share | $ | 0.18 | $ | (0.18 | ) | $ | (0.31 | ) | ||||||||
| Share capital | Share premium | Warrants | Conversion option in convertible debentures | Available for sale reserve | Capital reserve due to translation to presentation currency | Capital reserve from hedges | Capital reserve from share-based payments | Capital reserve from employee benefits | Accumulated deficit | Total equity | Share capital | Additional paid in capital | Conversion option in convertible debentures | Capital reserve from Available for sale financial assets | Capital reserve due to translation to presentation currency | Capital reserve from hedges | Capital reserve from share-based payments | Capital reserve from employee benefits | Accumulated deficit | Total equity | ||||||||||||||||||||||||||||||||||||||||||||||||||||||||||||||||
| In thousands | In thousands | |||||||||||||||||||||||||||||||||||||||||||||||||||||||||||||||||||||||||||||||||||
| Balance as of December 31, 2011 | $ | 6,928 | $ | 91,225 | $ | 325 | $ | 3,794 | $ | - | $ | (3,490 | ) | $ | -- | $ | 4,754 | $ | (187 | ) | $ | (80,951 | ) | $ | 22,398 | |||||||||||||||||||||||||||||||||||||||||||||||||||||||||||
| Net income | - | - | - | - | - | - | - | - | - | 260 | 260 | |||||||||||||||||||||||||||||||||||||||||||||||||||||||||||||||||||||||||
Balance as of December 31, 2014 | $ | 9,208 | $ | 158,417 | $ | 1,147 | $ | 10 | $ | (3,490 | ) | $ | (116 | ) | $ | 8,783 | $ | (81 | ) | $ | (93,461 | ) | $ | 80,417 | ||||||||||||||||||||||||||||||||||||||||||||||||||||||||||||
Net loss | - | - | - | - | - | - | - | - | (11,270 | ) | (11,270 | ) | ||||||||||||||||||||||||||||||||||||||||||||||||||||||||||||||||||||||||
| Other comprehensive income | - | - | - | - | - | - | 229 | - | 46 | - | 275 | - | - | - | 63 | - | 115 | - | 22 | - | 200 | |||||||||||||||||||||||||||||||||||||||||||||||||||||||||||||||
| Total comprehensive income | - | - | - | - | - | - | 229 | - | 46 | 260 | 535 | |||||||||||||||||||||||||||||||||||||||||||||||||||||||||||||||||||||||||
| Exercise of warrants and options into shares | 276 | 5,649 | (325 | ) | - | - | - | - | (1,407 | ) | - | - | 4,193 | |||||||||||||||||||||||||||||||||||||||||||||||||||||||||||||||||||||||
Total comprehensive income (loss) | - | - | - | 63 | - | 115 | - | 22 | (11,270 | ) | (11,070 | ) | ||||||||||||||||||||||||||||||||||||||||||||||||||||||||||||||||||||||||
Exercise of options into shares | 112 | 2,674 | - | - | - | - | (1,533 | ) | - | - | 1,253 | |||||||||||||||||||||||||||||||||||||||||||||||||||||||||||||||||||||||||
Expiration of conversion option on convertible debentures | - | 1,147 | (1,147 | ) | - | - | - | - | - | - | - | |||||||||||||||||||||||||||||||||||||||||||||||||||||||||||||||||||||||||
| Cost of share-based payment | - | - | - | - | - | - | - | 1,267 | - | - | 1,267 | - | - | - | - | - | - | 1,907 | - | - | 1,907 | |||||||||||||||||||||||||||||||||||||||||||||||||||||||||||||||
| Balance as of December 31, 2012 | $ | 7,204 | $ | 96,874 | $ | - | $ | 3,794 | $ | - | $ | (3,490 | ) | $ | 229 | $ | 4,614 | $ | (141 | ) | $ | (80,691 | ) | $ | 28,393 | |||||||||||||||||||||||||||||||||||||||||||||||||||||||||||
Balance as of December 31, 2015 | $ | 9,320 | $ | 162,238 | $ | - | $ | 73 | $ | (3,490 | ) | $ | (1 | ) | $ | 9,157 | $ | (59 | ) | $ | (104,731 | ) | $ | 72,507 | ||||||||||||||||||||||||||||||||||||||||||||||||||||||||||||
Net loss | - | - | - | - | - | - | - | - | (6,733 | ) | (6,733 | ) | ||||||||||||||||||||||||||||||||||||||||||||||||||||||||||||||||||||||||
Other comprehensive loss | - | - | - | (54 | ) | - | (26 | ) | - | (22 | ) | - | (102 | ) | ||||||||||||||||||||||||||||||||||||||||||||||||||||||||||||||||||||||
Total comprehensive loss | -- | -- | - | (54 | ) | - | (26 | ) | - | (22 | ) | (6,733 | ) | (6,835 | ) | |||||||||||||||||||||||||||||||||||||||||||||||||||||||||||||||||||||
Exercise of options into shares | * | 433 | - | - | - | - | (433 | ) | - | - | * | |||||||||||||||||||||||||||||||||||||||||||||||||||||||||||||||||||||||||
Cost of share-based payment | - | - | - | - | - | - | 1,071 | - | - | 1,071 | ||||||||||||||||||||||||||||||||||||||||||||||||||||||||||||||||||||||||||
Balance as of December 31, 2016 | $ | 9,320 | $ | 162,671 | $ | - | $ | 19 | $ | (3,490 | ) | $ | (27 | ) | $ | 9,795 | $ | (81 | ) | $ | (111,464 | ) | $ | 66,743 | ||||||||||||||||||||||||||||||||||||||||||||||||||||||||||||
| Net income | - | - | - | - | - | - | - | - | - | 443 | 443 | - | - | - | - | - | - | - | - | 6,901 | 6,901 | |||||||||||||||||||||||||||||||||||||||||||||||||||||||||||||||
| Other comprehensive income (loss) | - | - | - | - | (27 | ) | - | (73 | ) | - | 12 | - | (88 | ) | - | - | - | (23 | ) | - | 73 | - | (256 | ) | - | (206 | ) | |||||||||||||||||||||||||||||||||||||||||||||||||||||||||
| Total comprehensive income (loss) | - | - | - | - | (27 | ) | - | (73 | ) | - | 12 | 443 | 355 | - | - | - | (23 | ) | - | 73 | - | (256 | ) | 6,901 | 6,695 | |||||||||||||||||||||||||||||||||||||||||||||||||||||||||||
| Exercise of warrants and options into shares | 62 | 1,275 | - | - | - | - | - | (752 | ) | - | - | 585 | ||||||||||||||||||||||||||||||||||||||||||||||||||||||||||||||||||||||||
Exercise and forfeiture of share-based payment into shares | 3 | 712 | - | - | - | - | (712 | ) | - | - | 3 | |||||||||||||||||||||||||||||||||||||||||||||||||||||||||||||||||||||||||
| Issuance of ordinary shares, net of issuance costs | 1,749 | 51,053 | - | - | - | - | - | - | - | - | 52,802 | 1,077 | 14,491 | - | - | - | - | - | - | - | 15,568 | |||||||||||||||||||||||||||||||||||||||||||||||||||||||||||||||
| Conversion of convertible debentures into shares | 186 | 7,898 | - | (1,576 | ) | - | - | - | - | - | - | 6,508 | ||||||||||||||||||||||||||||||||||||||||||||||||||||||||||||||||||||||||
| Cost of share-based payment | - | - | - | - | - | - | - | 1,327 | - | - | 1,327 | - | - | - | - | - | - | 483 | - | - | 483 | |||||||||||||||||||||||||||||||||||||||||||||||||||||||||||||||
| Balance as of December 31, 2013 | $ | 9,201 | $ | 157,100 | $ | - | $ | 2,218 | $ | (27 | ) | $ | (3,490 | ) | 156 | $ | 5,189 | $ | (129 | ) | $ | (80,248 | ) | $ | 89,970 | |||||||||||||||||||||||||||||||||||||||||||||||||||||||||||
| Net loss | - | - | - | - | - | - | - | - | - | (13,213 | ) | (13,213 | ) | |||||||||||||||||||||||||||||||||||||||||||||||||||||||||||||||||||||||
| Other comprehensive income (loss) | - | - | - | - | 37 | - | (272 | ) | - | 48 | - | (187 | ) | |||||||||||||||||||||||||||||||||||||||||||||||||||||||||||||||||||||||
| Total comprehensive income (loss) | - | - | - | - | 37 | - | (272 | ) | - | 48 | (13,213 | ) | (13,400 | ) | ||||||||||||||||||||||||||||||||||||||||||||||||||||||||||||||||||||||
| Exercise of options into shares | 7 | 238 | - | - | - | - | - | (157 | ) | - | - | 88 | ||||||||||||||||||||||||||||||||||||||||||||||||||||||||||||||||||||||||
| Conversion of convertible debentures into shares | (* | 9 | - | (1 | ) | - | - | - | - | - | - | 8 | ||||||||||||||||||||||||||||||||||||||||||||||||||||||||||||||||||||||||
| Expiration of conversion option on convertible debentures | - | 1,070 | - | (1,070 | ) | - | - | - | - | - | - | - | ||||||||||||||||||||||||||||||||||||||||||||||||||||||||||||||||||||||||
| Cost of share-based payment | - | - | -- | - | - | - | - | 3,751 | - | - | 3,751 | |||||||||||||||||||||||||||||||||||||||||||||||||||||||||||||||||||||||||
| Balance as of December 31, 2014 | $ | 9,208 | $ | 158,417 | $ | - | $ | 1,147 | $ | 10 | $ | (3,490 | ) | $ | (116 | ) | $ | 8,783 | $ | (81 | ) | $ | (93,461 | ) | $ | 80,417 | ||||||||||||||||||||||||||||||||||||||||||||||||||||||||||
Balance as of December 31, 2017 | $ | 10,400 | $ | 177,874 | $ | - | $ | (4 | ) | $ | (3,490 | ) | $ | 46 | $ | 9,566 | $ | (337 | ) | $ | (104,563 | ) | $ | 89,492 | ||||||||||||||||||||||||||||||||||||||||||||||||||||||||||||
For the Year Ended December 31, | |||||||||||||
| 2014 | 2013 | 2012 | |||||||||||
| Note | In thousands | ||||||||||||
| Cash Flows from Operating Activities | |||||||||||||
| Net Income (loss) | $ | (13,213 | ) | $ | 443 | $ | 260 | ||||||
| Adjustments to reconcile net loss to net cash provided by operating activities: | |||||||||||||
| Adjustments to the profit or loss items: | |||||||||||||
| Depreciation and amortization | 10, 11 | 2,788 | 3,001 | 3,044 | |||||||||
| Financial expenses, net | 1,682 | 3,233 | 3,455 | ||||||||||
| Cost of share-based payment | 21 | 3,751 | 1,327 | 1,267 | |||||||||
| Income tax expense | 52 | 24 | 523 | ||||||||||
| Loss (gain) from sale of property and equipment | (2 | ) | 73 | - | |||||||||
| Change in employee benefit liabilities, net | (57 | ) | 121 | 38 | |||||||||
| 8,214 | 7,779 | 8,327 | |||||||||||
| Changes in asset and liability items: | |||||||||||||
| Increase in trade receivables, net | (869 | ) | (3,445 | ) | (6,662 | ) | |||||||
| Decrease (increase) in other accounts receivables | (50 | ) | (444 | ) | 451 | ||||||||
| Increase in inventories | (3,490 | ) | (1,182 | ) | (4,861 | ) | |||||||
| Decrease (increase) in deferred expenses | 1,209 | (1,231 | ) | 89 | |||||||||
| Increase (decrease) in trade payables | 3,261 | 1,579 | (157 | ) | |||||||||
| Decrease (increase) in other accounts payables | (344 | ) | 264 | 322 | |||||||||
| Decrease in deferred revenues | (4,026 | ) | (6,270 | ) | (3,438 | ) | |||||||
| Cash paid during the year for: | (4,309 | ) | (10,729 | ) | (14,256 | ) | |||||||
| Interest paid | (1,210 | ) | (1,968 | ) | (2,200 | ) | |||||||
| Interest received | 758 | 663 | 249 | ||||||||||
| Withholding taxes paid | (158 | ) | (42 | ) | (642 | ) | |||||||
| (610 | ) | (1,347 | ) | (2,593 | ) | ||||||||
| Net cash used in operating activities | $ | (9,918 | ) | $ | (3,854 | ) | $ | (8,262 | ) | ||||
For the Year Ended December 31, | |||||||||||||
| 2014 | 2013 | 2012 | |||||||||||
| Note | In thousands | ||||||||||||
| Cash Flows from Investing Activities | |||||||||||||
| Proceeds from sale of )investment in) short term investments, net | $ | (23,746 | ) | $ | 1,732 | $ | 665 | ||||||
| Purchase of property and equipment and intangible assets | 10 | (3,076 | ) | (4,609 | ) | ||||||||
| Restricted cash, net | - | - | 1,512 | ||||||||||
| Proceeds from sale of property and equipment | 3 | 8 | - | ||||||||||
| Net cash used in investing activities | (26,819 | ) | (3,903 | ) | (2,432 | ) | |||||||
| Cash Flows from Financing Activities | |||||||||||||
| Proceeds from exercise of warrants and options | 88 | 562 | 2,978 | ||||||||||
| Proceeds from issuance of ordinary shares, net | - | 52,953 | - | ||||||||||
| Short term credit from bank and others, net | - | (12 | ) | (12 | ) | ||||||||
| Repayment of convertible debentures | 15 | (7,728 | ) | (4,295 | ) | - | |||||||
| Net cash provided by (used in) financing activities | (7,640 | ) | 49,208 | 2,966 | |||||||||
| Exch Exchange differences on balances of cash and cash equivalent | (187 | ) | 793 | 220 | |||||||||
| Increase (decrease) in cash and cash equivalents | (44,564 | ) | 42,244 | (7,508 | ) | ||||||||
| Cash and cash equivalents at the beginning of the year | 59,110 | 16,866 | 24,374 | ||||||||||
| Cash and cash equivalents at the end of the year | $ | 14,546 | $ | 59,110 | $ | 16,866 | |||||||
| Significant non-cash transactions | |||||||||||||
| Issuance expenses accrued in other accounts payable | $ | - | $ | 151 | $ | - | |||||||
| Exercise of warrants presented as liability | $ | - | $ | 23 | $ | 1,215 | |||||||
| Exercise of convertible debentures into shares | $ | 7 | $ | 6,508 | $ | - | |||||||
| For the Year Ended December 31, | ||||||||||||||||
| 2017 | 2016 | 2015 | ||||||||||||||
| Note | In thousands | |||||||||||||||
Cash Flows from Operating Activities | ||||||||||||||||
| Net income (loss) | $ | 6,901 | $ | (6,733 | ) | $ | (11,270 | ) | ||||||||
| Adjustments to reconcile net income (loss) to net cash provided by (used in) operating activities: | ||||||||||||||||
| Adjustments to the profit or loss items: | ||||||||||||||||
| Depreciation and impairment | 10,11 | 3,523 | 3,501 | 3,227 | ||||||||||||
| Financial expenses (income), net | 274 | (470 | ) | (154 | ) | |||||||||||
| Cost of share-based payment | 20 | 483 | 1,071 | 1,907 | ||||||||||||
| Income tax expense | 269 | 1,722 | - | |||||||||||||
| Gain from sale of property and equipment | (52 | ) | (18 | ) | - | |||||||||||
| Change in employee benefit liabilities, net | 166 | (87 | ) | 87 | ||||||||||||
| 4,663 | 5,719 | 5,067 | ||||||||||||||
| Changes in asset and liability items: | ||||||||||||||||
| Decrease (increase) in trade receivables, net | (9,967 | ) | 3,489 | (5,604 | ) | |||||||||||
| Decrease in other accounts receivables | 328 | 211 | 118 | |||||||||||||
| Decrease (increase) in inventories | 4,524 | 742 | (913 | ) | ||||||||||||
| Decrease (increase) in deferred expenses | 594 | (433 | ) | (565 | ) | |||||||||||
| Increase (decrease) in trade payables | (838 | ) | (2,650 | ) | 887 | |||||||||||
| Increase in other accounts payables | 71 | 1,520 | 94 | |||||||||||||
| Increase (decrease) in deferred revenues | (2,930 | ) | 1,035 | (2,405 | ) | |||||||||||
| (8,218 | ) | 3,914 | (8,388 | ) | ||||||||||||
| Cash received (paid) during the year for: | ||||||||||||||||
| Interest paid | (21 | ) | (60 | ) | (484 | ) | ||||||||||
| Interest received | 399 | 842 | 1,143 | |||||||||||||
| Taxes paid | (116 | ) | (1,785 | ) | (47 | ) | ||||||||||
| 262 | (1,003 | ) | 612 | |||||||||||||
| Net cash provided by (used in) operating activities | $ | 3,608 | $ | 1,897 | $ | (13,979 | ) | |||||||||
For the Year Ended December 31, | ||||||||||||||||
| 2017 | 2016 | 2015 | ||||||||||||||
| Note | In thousands | |||||||||||||||
Cash Flows from Investing Activities | ||||||||||||||||
| Proceeds from sale of )investment in) short term investments, net | $ | (11,501 | ) | $ | 4,236 | $ | 13,971 | |||||||||
| Purchase of property and equipment and intangible assets | 10 | (4,167 | ) | (2,641 | ) | (2,718 | ) | |||||||||
| Proceeds from sale of property and equipment | 60 | 42 | - | |||||||||||||
| Net cash provided by (used in) investing activities | (15,608 | ) | 1,637 | 11,253 | ||||||||||||
Cash Flows from Financing Activities | ||||||||||||||||
| Proceeds from exercise of warrants and options | 3 | * | 1,254 | |||||||||||||
| Receipt of long-term loans | 279 | 1,701 | 197 | |||||||||||||
| Repayment of long-term loans | (530 | ) | (211 | ) | (9 | ) | ||||||||||
| Repayment of convertible debentures | - | - | (7,797 | ) | ||||||||||||
| Proceeds from issuance of ordinary shares, net | 15,568 | - | - | |||||||||||||
| Net cash provided by (used in) financing activities | 15,320 | 1,490 | (6,355 | ) | ||||||||||||
Exchange differences on balances of cash and cash equivalent | (607 | ) | (103 | ) | (418 | ) | ||||||||||
Increase (decrease) in cash and cash equivalents | 2,713 | 4,921 | (9,499 | ) | ||||||||||||
Cash and cash equivalents at the beginning of the year | 9,968 | 5,047 | 14,546 | |||||||||||||
Cash and cash equivalents at the end of the year | $ | 12,681 | $ | 9,968 | $ | 5,047 | ||||||||||
Significant non-cash transactions | ||||||||||||||||
| Purchase of property and equipment through capital lease | $ | 282 | $ | 132 | $ | - | ||||||||||
| Purchase of property and equipment | $ | 1,681 | $ | 1,968 | $ | - | ||||||||||
| Note 1: - | General |
| a. | General description of the Company and its activity |
| Proprietary Products |
| Distribution |
| b. | The Company has three |
| c. | Definitions |
| The Company | - | Kamada Ltd. |
| The Group | - | The Company and its subsidiaries. |
| Subsidiary | - | A company which the Company has a control over (as defined in IFRS 10) and whose financial statements are consolidated with the Company's Financial Statements. |
| Related parties | - | As defined in IAS 24. |
| USD/$ | - | U.S. dollar. |
| NIS | - | New Israeli Shekel |
| Note 2: - | Significant Accounting Policies |
| a. | Basis of presentation of financial statements |
| 1. | These financial statements have been prepared in accordance with International Financial Reporting Standards ("IFRS") |
| 2. | Measurement basis: |
| c. | The consolidated financial statements comprise the financial statements of companies that are controlled by the Company (subsidiaries). Control is achieved when the Company is exposed, or has rights, to variable returns from its involvement with the investee and has the ability to affect those returns through its power over the investee. The consolidation of the financial statements commences on the date on which control is obtained and ends when such control ceases. |
| The financial statements of the Company and of the subsidiaries are prepared as of the same dates and periods. The consolidated financial statements are prepared using uniform accounting policies by all companies in the Group. Significant intercompany balances and transactions and gains or losses resulting from intercompany transactions are eliminated in full in the consolidated financial statements. |
| d. | Functional currency, presentation currency and foreign currency |
| 1. | Functional currency and presentation currency |
| 2. |
| Note 2: - | Significant Accounting Policies (cont.) |
| e. | Cash equivalents |
| g. | Allowance for doubtful accounts |
| h. | Inventories |
Raw materials | - | At cost |
Work in process | - | Direct costs and indirect costs calculated at average costs for the |
Finished products | - | Direct costs and indirect costs calculated at average costs for |
Purchased products | - | At cost on a "first in – first out" basis. |
| Note 2: - | Significant Accounting Policies (cont.) |
| i. | Revenue recognition |
| - | Revenues from the sale of goods are recognized when all the significant risks and rewards of ownership of the goods have passed to the buyer and the seller no longer retains continuing managerial involvement. The delivery date is usually the date on which ownership passes. |
| - | Agreements with multiple elements provide for varying consideration terms, such as upfront payments and milestone payments. Revenues from such agreements that do not contain a general right of return and that are composed of multiple elements such as distribution exclusivity, license and services are allocated to the different elements and are recognized in respect of each element separately. An element constitutes a separate accounting unit if and only if it has a separate value to the customer. Revenue from the different element is recognized when the criteria for revenue recognition have been met and only to the extent of the consideration that is not contingent upon completion or performance of future services in the contract. |
| Note 2: - | Significant Accounting Policies (cont.) |
| Revenue from milestone and upfront events stipulated in the agreements is recognized upon the occurrence of a substantive element specified in the agreement or as a measure of substantive progress towards completion. |
| In events that the Company receives at no charge raw material, that is required for manufacturing one of the Company's products, the Company recorded the fair value of the raw material used and sold as revenue and charged the same fair value to cost of revenue. |
| j. | Taxes on income |
| 1. | Current taxes: |
| 2. | Deferred taxes: |
| Note 2: - | Significant Accounting Policies (cont.) |
| k. | Leases |
| 1. | Finance lease |
| 2. | Operating lease |
| l. | Property, plant and equipment |
| Note 2: - | ||||
| % | Mainly % | |||||||
Buildings | 2.5-4 | 4 | ||||||
Machinery and equipment | 10-20 | 15 | ||||||
Vehicles | 15 | 15 | ||||||
Computers, software, equipment and office furniture | 6-33 | 33 | ||||||
Leasehold improvements | (* | ) | 10 | |||||
| m. |
| Impairment of non-financial assets |
| Note 2: - | Significant Accounting Policies (cont.) |
Financial instruments |
| 1. | Financial assets |
| Note 2: - | Significant Accounting Policies (cont.) |
| 2. | Financial liabilities |
| 3. | Fair value |
| Note 2: - | Significant Accounting Policies (cont.) |
| - | Level 1 - quoted prices (unadjusted) in active markets for identical assets or liabilities. |
| - | Level 2 - inputs other than quoted prices included within Level 1 that are observable either directly or indirectly. |
| - | Level 3 - inputs that are not based on observable market data (valuation techniques which use inputs that are not based on observable market data). |
| 4. | Offsetting financial instruments |
De-recognition of financial instruments |
| Note 2: - |
Derivative financial instruments designated as hedges |
Accrued expenses |
| r. | Employee benefit liabilities |
| 1. | Short-term employee benefits |
| Note 2: - | Significant Accounting Policies (cont.) |
| 2. | Post-employment benefits |
Share-based payment transactions |
| Note 2: - | Significant Accounting Policies (cont.) |
| r. | Income (loss) per Share |
| s. | Reclassification of prior years' amounts |
| Note 3: - | Significant accounting judgments, estimates and assumptions used in the preparation of the financial statements |
| Determining the |
| Note 3: - |
| Note 4: - |
| a. | IFRS 15 – Revenues from contracts with customers |
| Note 4: - | Disclusure Of New Ifrs In The Period (cont.) |
| Note 4: - |
| b. | IFRS 9 - Financial Instruments |
| c. | IFRS 16 – Leases |
| d. | IFRIC Interpretation 23 - Uncertainty over Income Tax Treatment |
| December 31, | December 31, | |||||||||||||||
| 2014 | 2013 | 2017 | 2016 | |||||||||||||
| In thousands | In thousands | |||||||||||||||
| Cash and deposits for immediate withdrawal | $ | 8,382 | $ | 40,145 | $ | 8,539 | $ | 7,891 | ||||||||
| Cash equivalents in USD deposits (1) | 164 | 18,000 | 4,001 | 2,001 | ||||||||||||
| Cash equivalents in NIS deposits | 6,000 | 965 | 141 | 76 | ||||||||||||
| $ | 14,546 | $ | 59,110 | $ | 12,681 | $ | 9,968 | |||||||||
| (1) | The deposits bear interest of 1.53% and 1.12% per year, as of December 31, |
| (2) | The deposits bear interest |
| Note 6: - | Short-Term Investments |
| December 31, | December 31, | |||||||||||||||
| 2014 | 2013 | 2017 | 2016 | |||||||||||||
| In thousands | In thousands | |||||||||||||||
| Marketable securities (equity and debt) at fair value through profit or loss | $ | 8,820 | $ | 5,692 | $ | 1,663 | $ | 1,490 | ||||||||
| Bank deposits in USD (1) | 20,078 | 8,010 | ||||||||||||||
| Available for sale debt securities | 28,530 | 9,375 | 8,597 | 9,164 | ||||||||||||
| $ | 37,350 | $ | 15,067 | $ | 30,338 | $ | 18,664 | |||||||||
| (1) | The deposits bear interest of 1.70%-2.3% and 1.69%- 1.84% per year, as of December 31, 2017 and 2016, respectively. |
| Note 7: - | Trade Receivables, net |
| December 31, | ||||||||
| 2017 | 2016 | |||||||
| In thousands | ||||||||
Open accounts: | ||||||||
In NIS | $ | 8,263 | $ | 9,326 | ||||
In USD | 22,284 | 10,816 | ||||||
| 30,547 | 20,142 | |||||||
Checks receivable | 115 | 45 | ||||||
| 30,662 | 20,187 | |||||||
Less allowance for doubtful accounts (1) | - | (399 | ) | |||||
Trade receivables, net | $ | 30,662 | $ | 19,788 | ||||
| Note 7: - | Trade Receivables, net (cont.) |
| December 31, | ||||||||
| 2014 | 2013 | |||||||
| In thousands | ||||||||
| Open accounts (1): | ||||||||
| In NIS | $ | 7,988 | $ | 8,630 | ||||
| In USD | 9,744 | 9,692 | ||||||
| 17,732 | 18,322 | |||||||
| Checks receivable | 215 | 46 | ||||||
| 17,947 | 18,368 | |||||||
| Less allowance for doubtful accounts (2) | (433 | ) | (486 | ) | ||||
| Trade receivables, net | $ | 17,514 | $ | 17,882 | ||||
| (1) |
| Allowance for doubtful accounts: |
| December 31, 2013 | $ | (486 | ) | |||||
| Additions charged to costs | (83 | ) | ||||||
| Deductions | 136 | |||||||
| December 31, 2014 | $ | (433 | ) |
December 31, 2016 | $ | (399 | ) | |
Bad debt recognition | 399 | |||
December 31, 2017 | $ | - |
| Past due trade receivables with aging of | ||||||||||||||||||||||||||||
| Neither past due nor impaired | Up to 30 Days | 30-60 Days | 60-90 Days | 90-120 Days | Over 120 days | Total | ||||||||||||||||||||||
| In thousands | ||||||||||||||||||||||||||||
December 31, 2017 | $ | 29,692 | 680 | $ | 21 | $ | 152 | $ | 2 | $ | - | $ | 30,547 | |||||||||||||||
December 31, 2016 | $ | 17,769 | 1,891 | $ | 24 | $ | 43 | $ | 6 | $ | 10 | $ | 19,743 | |||||||||||||||
| Neither past due nor impaired | Past due trade receivables with aging of | |||||||||||||||||||||||||||
Up to 30 Days | 30-60 Days | 60-90 Days | 90-120 Days | Over 120 days | Total | |||||||||||||||||||||||
| In thousands | ||||||||||||||||||||||||||||
| December 31, 2014 | $ | 15,133 | $ | 1,187 | $ | 662 | $ | 146 | $ | 23 | $ | 148 | $ | 17,299 | ||||||||||||||
| December 31, 2013 | $ | 16,540 | $ | 330 | $ | 28 | $ | 94 | $ | 75 | $ | 769 | $ | 17,836 | ||||||||||||||
| Note 8: - | Other accounts Receivables |
| December 31, | ||||||||
| 2017 | 2016 | |||||||
| In thousands | ||||||||
Materials for clinical trials and inventory designated for R&D activities | $ | 635 | $ | 1,229 | ||||
Prepaid expenses | 822 | 1,057 | ||||||
Government authorities | 563 | 374 | ||||||
Accrued interest | 66 | 82 | ||||||
Other | 46 | 321 | ||||||
| $ | 2,132 | $ | 3,063 | |||||
| December 31, | ||||||||
| 2014 | 2013 | |||||||
| In thousands | ||||||||
| Materials for clinical trials | $ | 231 | $ | 1,355 | ||||
| Prepaid expenses | 1,149 | 1,168 | ||||||
| Government authorities | 674 | 407 | ||||||
| Financial derivatives, net | - | 208 | ||||||
| Receivables for unpaid interest | 249 | 80 | ||||||
| Receivables for exercise of options | - | 470 | ||||||
| Other | 56 | 6 | ||||||
| $ | 2,359 | $ | 3,694 | |||||
| December 31, | ||||||||
| 2017 | 2016 | |||||||
| In thousands | ||||||||
Finished products | $ | 5,168 | $ | 6,542 | ||||
Purchased products | 2,695 | 5,607 | ||||||
Work in progress | 6,159 | 6,227 | ||||||
Raw materials | 7,048 | 7,218 | ||||||
| $ | 21,070 | $ | 25,594 | |||||
| (1) | During the years 2017, 2016 and 2015, the Company recognized, at cost of revenues, as impairment for inventories carried at net realizable value totaled of $460 thousands, $544 thousands and $470 thousands, respectively. |
| December 31, | ||||||||
| 2014 | 2013 | |||||||
| In thousands | ||||||||
| Finished products (1) (2) | $ | 9,999 | $ | 10,982 | ||||
| Purchased products | 5,743 | 2,848 | ||||||
| Work in progress | 6,109 | 4,159 | ||||||
| Raw materials | 3,572 | 3,944 | ||||||
| $ | 25,423 | $ | 21,933 | |||||
| Note 10: – | Property, Plant and equipment |
| a. | Composition and movement: |
Land and Buildings(1) | Machinery and Equipment (1) | Vehicles | Computers, Equipment and Office Furniture | Leasehold Improvements | Total | |||||||||||||||||||
| In thousands | ||||||||||||||||||||||||
| Cost | ||||||||||||||||||||||||
| Balance at January 1, 2014 | $ | 25,057 | $ | 20,859 | $ | 86 | $ | 3,791 | $ | 1,010 | $ | 50,803 | ||||||||||||
| Additions | 1,204 | 1,417 | 8 | 372 | 46 | 3,047 | ||||||||||||||||||
| Sale of property and equipment | - | (3 | ) | - | (4 | ) | - | (7 | ) | |||||||||||||||
| Balance as of December 31, 2014 | 26,261 | 22,273 | 94 | 4,159 | 1,056 | 53,843 | ||||||||||||||||||
| Accumulated Depreciation | ||||||||||||||||||||||||
| Balance as of January 1, 2014 | 8,511 | 16,912 | 73 | 2,864 | 1,000 | 29,360 | ||||||||||||||||||
| Additions | 1,317 | 1,020 | 5 | 374 | 4 | 2,720 | ||||||||||||||||||
| Sale of property and equipment | - | (3 | ) | - | (3 | ) | - | (6 | ) | |||||||||||||||
| Balance as of December 31, 2014 | 9,828 | 17,929 | 78 | 3,235 | 1,004 | 32,074 | ||||||||||||||||||
| Depreciated cost as of December 31, 2014 | $ | 16,433 | $ | 4,344 | $ | 16 | $ | 924 | $ | 52 | $ | 21,769 | ||||||||||||
Land and Buildings(1) | Machinery and Equipment (1) (2) | Vehicles | Computers, Software, Equipment and Office Furniture | Leasehold Improvements | Total | |||||||||||||||||||
| In thousands | ||||||||||||||||||||||||
Cost | ||||||||||||||||||||||||
Balance at January 1, 2017 | $ | 27,618 | $ | 26,485 | $ | 94 | $ | 5,520 | $ | 1,052 | $ | 60,769 | ||||||||||||
Additions | 781 | 3,151 | - | 1,002 | 1,196 | 6,130 | ||||||||||||||||||
Sale and write-off | - | (34 | ) | (28 | ) | - | (975 | ) | (1,037 | ) | ||||||||||||||
Balance as of December 31, 2017 | 28,399 | 29,602 | 66 | 6,522 | 1,273 | 65,862 | ||||||||||||||||||
Accumulated Depreciation | ||||||||||||||||||||||||
Balance as of January 1, 2017 | 12,606 | 19,972 | 86 | 4,559 | 967 | 38,190 | ||||||||||||||||||
Depreciation and impairment | 1,310 | 1,492 | 1 | 635 | 85 | 3,523 | ||||||||||||||||||
Sale and write-off | - | (34 | ) | (28 | ) | - | (967 | ) | (1,029 | ) | ||||||||||||||
Balance as of December 31, 2017 | 13,916 | 21,430 | 59 | 5,194 | 85 | 40,684 | ||||||||||||||||||
Depreciated cost as of December 31, 2017 | $ | 14,483 | $ | 8,172 | $ | 7 | 1,328 | $ | 1,188 | $ | 25,178 | |||||||||||||
Land and Buildings(1) | Machinery and Equipment (1) (2) | Vehicles | Computers, Software, Equipment and Office Furniture | Leasehold Improvements | Total | |||||||||||||||||||
| In thousands | ||||||||||||||||||||||||
Cost | ||||||||||||||||||||||||
Balance at January 1, 2016 | $ | 26,701 | $ | 24,111 | $ | 94 | $ | 5,156 | $ | 1,079 | $ | 57,141 | ||||||||||||
Additions | 963 | 3,220 | - | 507 | 62 | 4,752 | ||||||||||||||||||
Sale and write-off | (46 | ) | (846 | ) | (143 | ) | (89 | ) | (1,124 | ) | ||||||||||||||
Balance as of December 31, 2016 | 27,618 | 26,485 | 94 | 5,520 | 1,052 | 60,769 | ||||||||||||||||||
Accumulated Depreciation | ||||||||||||||||||||||||
Balance as of January 1, 2016 | 11,237 | 19,310 | 83 | 4,136 | 1,012 | 35,778 | ||||||||||||||||||
Depreciation and impairment | 1,402 | 1,355 | 3 | 564 | 44 | 3,368 | ||||||||||||||||||
Sale and write-off | (33 | ) | (693 | ) | (141 | ) | (89 | ) | (956 | ) | ||||||||||||||
Balance as of December 31, 2016 | 12,606 | 19,972 | 86 | 4,559 | 967 | 38,190 | ||||||||||||||||||
Depreciated cost as of December 31, 2016 | $ | 15,012 | $ | 6,513 | $ | 8 | 961 | $ | 85 | $ | 22,579 | |||||||||||||
| Note 10: – | Property, Plant and equipment (cont.) |
Land and Buildings(1) | Machinery and Equipment (1) | Vehicles | Computers, Equipment and Office Furniture | Leasehold Improvements | Total | |||||||||||||||||||
| In thousands | ||||||||||||||||||||||||
| Cost | ||||||||||||||||||||||||
| Balance at January 1, 2013 | $ | 20,627 | $ | 20,205 | $ | 86 | $ | 3,319 | $ | 1,010 | $ | 45,247 | ||||||||||||
| Additions | 4,430 | 741 | - | 472 | - | 5,643 | ||||||||||||||||||
| Sale of property and equipment | - | (87 | ) | - | - | - | (87 | ) | ||||||||||||||||
| Balance as of December 31, 2013 | 25,057 | 20,859 | 86 | 3,791 | 1,010 | 50,803 | ||||||||||||||||||
| Accumulated Depreciation | ||||||||||||||||||||||||
| Balance as of January 1, 2013 | 7,340 | 15,519 | 67 | 2,496 | 998 | 26,420 | ||||||||||||||||||
| Additions | 1,171 | 1,399 | 6 | 368 | 2 | 2,946 | ||||||||||||||||||
| Sale of property and equipment | - | (6 | ) | - | - | - | (6 | ) | ||||||||||||||||
| Balance as of December 31, 2013 | 8,511 | 16,912 | 73 | 2,864 | 1,000 | 29,360 | ||||||||||||||||||
| Depreciated cost as of December 31, 2013 | $ | 16,546 | $ | 3,947 | $ | 13 | $ | 927 | $ | 10 | $ | 21,443 | ||||||||||||
| (1) | Including labor costs charged in |
| (2) | Including financing costs of $44 thousands and $11 thousands capitalized in 2017 and 2016 respectively, to the cost of machinery and equipment. |
| b. | As for liens, refer to Note 18. |
| c. | Capitalized leasing rights of land from the Israel land administration. |
| December 31, | ||||||||
| 2014 | 2013 | |||||||
| In thousands | ||||||||
| Under finance lease | $ | 1,051 | $ | 1,063 | ||||
| December 31, | ||||||||
| 2017 | 2016 | |||||||
| In thousands | ||||||||
Under finance lease | $ | 1,016 | $ | 1,029 | ||||
| Note 11: - | Other Long Term Assets |
| December 31, | ||||||||
| 2017 | 2016 | |||||||
| In thousands | ||||||||
Long term pre-paid expenses | $ | 49 | $ | 40 | ||||
| Note 12: - | Trade Payables |
| December 31, | ||||||||
| 2017 | 2016 | |||||||
| In thousands | ||||||||
Open debts mainly in USD | $ | 11,246 | $ | 11,187 | ||||
Open debts in NIS | 6,789 | 5,038 | ||||||
| 18,035 | 16,225 | |||||||
Notes payable | 1 | 52 | ||||||
| $ | 18,036 | $ | 16,277 | |||||
| December 31, | ||||||||
| 2014 | 2013 | |||||||
| In thousands | ||||||||
| Long term leasing deposits | $ | 76 | $ | 23 | ||||
| Intangibles assets, net | 103 | 142 | ||||||
| Materials for clinical trials | - | 85 | ||||||
| $ | 179 | $ | 250 | |||||
| Linked to NIS | ||||||||
| December 31, | ||||||||
| 2014 | 2013 | |||||||
| In thousands | ||||||||
| Current maturities of convertible debenture | $ | 7,492 | $ | 8,718 | ||||
| Note 13: |
| December 31, | ||||||||
| 2014 | 2013 | |||||||
| In thousands | ||||||||
| Open debts mainly in USD | $ | 13,075 | $ | 10,739 | ||||
| Open debts in NIS | 3,277 | 3,105 | ||||||
| 16,352 | 13,844 | |||||||
| Notes payable | 178 | 249 | ||||||
| $ | 16,530 | $ | 14,093 | |||||
| Other accounts Payables |
| December 31, | December 31, | |||||||||||||||
| 2014 | 2013 | 2017 | 2016 | |||||||||||||
| In thousands | In thousands | |||||||||||||||
| Employees and payroll accruals | $ | 3,045 | $ | 3,183 | $ | 4,735 | $ | 4,135 | ||||||||
| Derivatives instruments | 76 | - | ||||||||||||||
Derivatives financial instruments | 8 | 32 | ||||||||||||||
| Accrued Expenses and Others | 924 | 1,130 | 1,077 | 1,447 | ||||||||||||
| $ | 4,045 | $ | 4,313 | $ | 5,820 | $ | 5,614 | |||||||||
| Note 14: - | Loans and capital leases |
| December 31, | ||||||||
| 2017 | 2016 | |||||||
| In thousands | ||||||||
Total loans and capital leases (1) | 1,984 | 1,776 | ||||||
Less current maturities | 614 | 412 | ||||||
Long term loans and capital leases | $ | 1,370 | $ | 1,364 | ||||
| (1) | The capital lease balance was $274 thousands and $103 thousands, as of December 31, 2017 and 2016, respectively. |
Bank loans During 2017 and 2016, the Company received loans at an amount of NIS 1,000 thousands ($279 thousands) and NIS 6,585 thousands ($ 1,701 thousands). The loans are payable over 60 equal monthly installments. The loans bear fixed interest rate in the range of 3.15% -3.55%. As for pledges, refer to Note 18. |
| Note 15: |
| Financial Instruments |
| a. | Classification of financial assets and liabilities |
| December 31, | December 31, | |||||||||||||||
| 2014 | 2013 | 2017 | 2016 | |||||||||||||
| In thousands | In thousands | |||||||||||||||
| Financial assets | ||||||||||||||||
| Financial assets at fair value: | ||||||||||||||||
| Marketable securities (equity and debt) – through profit or loss | $ | 8,820 | $ | 5,692 | ||||||||||||
| Available for sale debt securities | 28,530 | 9,375 | ||||||||||||||
| Derivatives instruments | - | 208 | ||||||||||||||
| $ | 37,350 | $ | 15,275 | |||||||||||||
| Financial assets at fair value through profit or loss: | ||||||||||||||||
| Marketable securities (equity and debt) | $ | 1,663 | $ | 1,490 | ||||||||||||
| Financial assets at fair value through other comprehensive income (loss)- | ||||||||||||||||
Available for sale debt securities- | 8,597 | 9,164 | ||||||||||||||
| Financial assets at cost: | ||||||||||||||||
| Cash | 8,539 | 7,891 | ||||||||||||||
| Short term bank deposits | 24,220 | 10,087 | ||||||||||||||
| $ | 43,019 | $ | 28,632 | |||||||||||||
| Financial liabilities | ||||||||||||||||
| Financial liabilities at fair value through profit or loss: | ||||||||||||||||
Financial liabilities at fair value: | ||||||||||||||||
| Derivatives instruments | $ | 76 | $ | - | $ | 8 | $ | 32 | ||||||||
| Financial liabilities measured at amortized cost: | ||||||||||||||||
| Convertible debentures | $ | 7,492 | $ | 16,216 | ||||||||||||
| Bank loans and capital leases | 1,984 | 1,776 | ||||||||||||||
| $ | 1,992 | $ | 1,808 | |||||||||||||
| Note | Financial Instruments (cont.) |
| b. | Financial risk factors |
| 1. | Market risks |
| a) | Foreign exchange risk |
| b) | Price risk |
| 2. | Credit risk |
| a) | Trade receivables: |
| Note 15: - | Financial Instruments (cont.) |
| b) | Cash and cash equivalent and short term investments: |
| 3. | Liquidity risk |
| Less than one year | 1 to 2 | 2 to 3 | 3 to 5 | Total | ||||||||||||||||
| In thousands | ||||||||||||||||||||
Trade payables | $ | 18,036 | - | - | - | $ | 18,036 | |||||||||||||
Other accounts payables | 5,820 | - | - | - | 5,820 | |||||||||||||||
Long term loans and capital leases (including interest) | 669 | 634 | 532 | 260 | 2,095 | |||||||||||||||
| $ | 24,525 | $ | 634 | $ | 532 | $ | 260 | $ | 25,951 | |||||||||||
| Note 15: - | Financial Instruments (cont.) |
| Less than one year | 1 to 2 | 2 to 3 | 3 to 5 | Total | ||||||||||||||||
| In thousands | ||||||||||||||||||||
Trade payables | $ | 16,277 | - | - | - | $ | 16,277 | |||||||||||||
Other accounts payables | 5,614 | - | - | - | 5,614 | |||||||||||||||
Long term loan and capital leases (including interest) | 464 | 461 | 429 | 549 | 1,903 | |||||||||||||||
| $ | 22,355 | $ | 461 | $ | 429 | $ | 549 | $ | 23,794 | |||||||||||
| Less than one year | 1 to 2 | 2 to 3 | 3 to 4 | Total | ||||||||||||||||
| In thousands | ||||||||||||||||||||
| Trade payables | $ | 16,530 | - | - | - | $ | 16,530 | |||||||||||||
| Other accounts payables | 4,045 | - | - | - | 4,045 | |||||||||||||||
| Convertible debentures (including interest) | 8,275 | - | - | - | 8,275 | |||||||||||||||
| $ | 28,850 | $ | - | $ | - | $ | - | $ | 28,850 | |||||||||||
| Less than one year | 1 to 2 | 2 to 3 | 3 to 4 | Total | ||||||||||||||||
| In thousands | ||||||||||||||||||||
| Trade payables | $ | 14,093 | - | - | - | $ | 14,093 | |||||||||||||
| Other accounts payables | 4,313 | - | - | - | 4,313 | |||||||||||||||
| Convertible debentures (including interest) | 9,930 | 9,324 | - | - | 19,254 | |||||||||||||||
| $ | 28,336 | $ | 9,324 | $ | - | $ | - | $ | 37,660 | |||||||||||
| January 1, 2017 | Payments | Foreign exchange movement | Cash from new loans | New leases | December 31, 2017 | |||||||||||||||||||
| In thousands | ||||||||||||||||||||||||
| Bank loans | 1,673 | (419 | ) | 177 | 279 | - | 1710 | |||||||||||||||||
| Capital leases | 103 | (111 | ) | - | - | 282 | 274 | |||||||||||||||||
| Total | 1,776 | (530 | ) | 177 | 279 | 282 | 1984 | |||||||||||||||||
| c. | Fair value |
| Carrying Amount | Fair Value | |||||||||||||||
| December 31, | December 31, | |||||||||||||||
| 2017 | 2016 | 2017 | 2016 | |||||||||||||
| In thousands | ||||||||||||||||
Financial liabilities | ||||||||||||||||
Bank loans and capital Leases | $ | 1,984 | $ | 1,776 | $ | 1,984 | $ | 1,761 | ||||||||
| Carrying Amount | Fair Value | |||||||||||||||
| December 31, | December 31, | |||||||||||||||
| 2014 | 2013 | 2014 | 2013 | |||||||||||||
| In thousands | ||||||||||||||||
| Financial liabilities | ||||||||||||||||
| Convertible debentures | $ | 7,492 | $ | 16,216 | $ | 8,065 | $ | 24,637 | ||||||||
| Note | Financial Instruments (cont.) |
| d. | Classification of financial instruments by fair value hierarchy |
| Level 1 | Level 2 | Level 1 | Level 2 | |||||||||||||
| In thousands | In thousands | |||||||||||||||
| December 31, 2014 | ||||||||||||||||
December 31, 2017 | ||||||||||||||||
| Marketable securities at fair value through profit or loss: | ||||||||||||||||
| Equity shares | $ | 587 | $ | - | $ | 77 | $ | - | ||||||||
| Mutual funds | 577 | - | 456 | - | ||||||||||||
| Exchange traded notes | 46 | - | ||||||||||||||
| Debt securities (corporate and government) | 7,610 | - | 1,130 | - | ||||||||||||
Derivatives instruments | - | (8 | ) | |||||||||||||
| Available for sale debt securities (corporate and government) | - | 28,530 | - | 8,597 | ||||||||||||
| $ | 1,663 | $ | 8,589 | |||||||||||||
| $ | 8,820 | $ | 28,530 | |||||||||||||
| December 31, 2013 | ||||||||||||||||
| Derivatives instruments qualified for hedging | $ | - | $ | 208 | ||||||||||||
| Marketable securities at fair value through profit or loss: | ||||||||||||||||
| Equity securities | 1,014 | - | ||||||||||||||
| Debt securities (corporate and government) | 4,678 | - | ||||||||||||||
| 5,692 | 208 | |||||||||||||||
| Available for sale debt securities (corporate and government) | $ | - | $ | 9,375 | ||||||||||||
| $ | 5,692 | $ | 9,583 | |||||||||||||
| Level 1 | Level 2 | |||||||
| In thousands | ||||||||
| December 31, 2014 | ||||||||
| Derivatives instruments qualified for hedging | $ | - | $ | 76 | ||||
| Level 1 | Level 2 | |||||||
| In thousands | ||||||||
December 31, 2016 | ||||||||
Marketable securities at fair value through profit or loss: | ||||||||
| Equity shares | $ | 70 | $ | - | ||||
| Mutual funds | 388 | - | ||||||
| Debt securities (corporate and government) | 1,032 | - | ||||||
Derivatives instruments | - | (32 | ) | |||||
Available for sale debt securities (corporate and government) | - | 9,164 | ||||||
| $ | 1,490 | $ | 9,132 | |||||
| December 31, | ||||||||
| 2017 | 2016 | |||||||
| In thousands | ||||||||
Sensitivity test to changes in market price of listed Securities | ||||||||
Gain (loss) from change: | ||||||||
5% increase in market price | $ | 513 | $ | 535 | ||||
5% decrease in market price | $ | (513 | ) | $ | (535 | ) | ||
Sensitivity test to changes in foreign currency: | ||||||||
Gain (loss) from change: | ||||||||
5% increase in NIS | $ | (143 | ) | $ | 19 | |||
5% decrease in NIS | $ | 143 | $ | (19 | ) | |||
5% increase in Euro | $ | (135 | ) | $ | (184 | ) | ||
5% decrease in Euro | $ | 135 | $ | 184 | ||||
| Note | Financial Instruments (cont.) |
| December 31, | ||||||||
| 2014 | 2013 | |||||||
| In thousands | ||||||||
Sensitivity test to changes in market price of listed Securities | ||||||||
| Gain (loss) from change: | ||||||||
| 5% increase in market price | $ | 1,868 | $ | 753 | ||||
| 5% decrease in market price | $ | (1,868 | ) | $ | (753 | ) | ||
| Sensitivity test to changes in interest rates | ||||||||
| Gain (loss) from change: | ||||||||
| 1% interest rate increase | $ | (105 | ) | $ | (199 | ) | ||
| 1% interest rate decrease | $ | 105 | $ | 199 | ||||
| Sensitivity test to changes in foreign currency: | ||||||||
| Gain (loss) from change: | ||||||||
| 5% increase in NIS | $ | 239 | $ | (135 | ) | |||
| 5% decrease in NIS | $ | (239 | ) | $ | 135 | |||
| 5% increase in Euro | $ | (247 | ) | $ | (87 | ) | ||
| 5% decrease in Euro | $ | 247 | $ | (87 | ) | |||
| e. | Linkage terms of financial liabilities by groups of financial instruments pursuant to IAS 39: |
| December 31, | ||||||||
| In thousands | ||||||||
| 2014 | 2013 | |||||||
| Convertible debenture measured at amortized cost- In NIS: | $ | 7,492 | $ | 16,216 | ||||
| December 31, | ||||||||
| In thousands | ||||||||
| 2017 | 2016 | |||||||
| In NIS: | ||||||||
| Bank loans and capital leases measured at amortized cost | $ | 1,984 | $ | 1,776 | ||||
Derivatives and hedging: |
| Note | Employee Benefit Liabilities, NET |
| a. | Post-employment benefits: |
| 1. | Defined contribution deposit: |
| 2. | Defined benefit plans: |
| 3. | Expenses recognized in comprehensive income (loss): |
Year Ended December 31, | Year Ended December 31, | |||||||||||||||||||||||
| 2014 | 2013 | 2012 | 2017 | 2016 | 2015 | |||||||||||||||||||
| In thousands | In thousands | |||||||||||||||||||||||
| Current service cost | $ | 455 | $ | 636 | $ | 635 | $ | 356 | $ | 359 | $ | 391 | ||||||||||||
| Interest expenses, net | 23 | 24 | 22 | 23 | 20 | 18 | ||||||||||||||||||
| Current service cost due to the transfer of real yield from the compensation component to the royalties component in executive insurance policies before 2004. | (9 | ) | 1 | 9 | ||||||||||||||||||||
| Current service cost (income) due to the transfer of real yield from the compensation component to the royalties' component in executive insurance policies before 2004 | (7 | ) | 5 | (10 | ) | |||||||||||||||||||
| Total employee benefit expenses | $ | 469 | $ | 661 | $ | 666 | $ | 372 | $ | 384 | $ | 399 | ||||||||||||
| Actual return on plan assets | $ | 295 | $ | 250 | $ | 176 | ||||||||||||||||||
Actual (negative) return on plan assets | $ | 119 | $ | 22 | $ | (12 | ) | |||||||||||||||||
Year Ended December 31, | ||||||||||||
| 2014 | 2013 | 2012 | ||||||||||
| In thousands | ||||||||||||
| Cost of revenues | $ | 244 | $ | 450 | $ | 421 | ||||||
| Research and development | 101 | 118 | 88 | |||||||||
| Selling and marketing | 14 | 17 | 5 | |||||||||
| General and administrative | 110 | 76 | 152 | |||||||||
| $ | 469 | $ | 661 | $ | 666 | |||||||
| December 31, | ||||||||
| 2014 | 2013 | |||||||
| In thousands | ||||||||
| Defined benefit obligation | $ | (5,496 | ) | $ | (5,539 | ) | ||
| Fair value of plan assets | 4,774 | 4,712 | ||||||
| Total liabilities, net | $ | (722 | ) | $ | (827 | ) | ||
| Note | Employee Benefit Liabilities, NET (cont.) |
Year Ended December 31, | ||||||||||||
| 2017 | 2016 | 2015 | ||||||||||
| In thousands | ||||||||||||
Cost of revenues | $ | 211 | $ | 228 | $ | 209 | ||||||
Research and development | 57 | 62 | 90 | |||||||||
Selling and marketing | 16 | 13 | 18 | |||||||||
General and administrative | 88 | 81 | 82 | |||||||||
| $ | 372 | $ | 384 | $ | 399 | |||||||
| 4. |
| December 31, | ||||||||
| 2017 | 2016 | |||||||
| In thousands | ||||||||
Defined benefit obligation | $ | 5,907 | $ | 5,235 | ||||
Fair value of plan assets | 4,763 | 4,513 | ||||||
Total liabilities, net | $ | 1,144 | $ | 722 | ||||
| 5. | Changes in the present value of defined benefit obligation |
| 2014 | 2013 | 2017 | 2016 | |||||||||||||
| In thousands | In thousands | |||||||||||||||
| Balance at January 1,2014 | $ | 5,539 | $ | 4,634 | ||||||||||||
Balance at January 1, | $ | 5,235 | $ | 5,425 | ||||||||||||
| Interest costs | 178 | 169 | 151 | 141 | ||||||||||||
| Current service cost | 455 | 636 | 356 | 359 | ||||||||||||
| Benefits paid | (120 | ) | (365 | ) | (641 | ) | (650 | ) | ||||||||
| Demographic assumptions | (5 | ) | 18 | (28 | ) | (17 | ) | |||||||||
| Financial assumptions | 9 | 79 | 254 | * | ||||||||||||
Past Experience | 6 | (104 | ) | |||||||||||||
| Currency Exchange | (560 | ) | 368 | 574 | 81 | |||||||||||
| Balance at December 31,2014 | $ | 5,496 | $ | 5,539 | ||||||||||||
Balance at December 31, | $ | 5,907 | $ | 5,235 | ||||||||||||
| 6. | Plan assets |
| a) | Plan assets |
| 2014 | 2013 | |||||||
| In thousands | ||||||||
| Balance at January 1, 2014 | $ | 4,712 | $ | 3,916 | ||||
| Expected return | 155 | 145 | ||||||
| Contributions by employer | 338 | 568 | ||||||
| Benefits paid | (25 | ) | (335 | ) | ||||
| Demographic assumptions | - | (27 | ) | |||||
| Financial assumptions | 3 | 136 | ||||||
| Current service cost due to the transfer of real yield from the compensation component to the royalties component in executive insurance policies before 2004. | 9 | (1 | ) | |||||
| Currency exchange | (418 | ) | 310 | |||||
| Balance at December 31, 2014 | $ | 4,774 | $ | 4,712 | ||||
| Note | Employee Benefit Liabilities, NET (cont.) |
| b) | Changes in the fair value of plan assets |
| 2017 | 2016 | |||||||
| In thousands | ||||||||
Balance at January 1, | $ | 4,513 | $ | 4,638 | ||||
Expected return | 127 | 121 | ||||||
Contributions by employer | 227 | 311 | ||||||
Benefits paid | (586 | ) | (522 | ) | ||||
Demographic assumptions | 1 | 1 | ||||||
Financial assumptions | 1 | - | ||||||
Past Experience | (11 | ) | (100 | ) | ||||
| Current service cost due to the transfer of real yield from the compensation component to the royalties component in executive insurance policies before 2004 | 7 | (5 | ) | |||||
Currency exchange | 484 | 69 | ||||||
Balance at December 31, | $ | 4,763 | $ | 4,513 | ||||
| 7. | The principal assumptions underlying the defined benefit plan |
| 2014 | 2013 | 2012 | 2017 | 2016 | 2015 | |||||||||||||||||||
| % | % | |||||||||||||||||||||||
| Discount rate of the plan liability | 4 | 4.23 | 5.1 | 2.27 | 3.72 | 2.6 | ||||||||||||||||||
| Future salary increases | 4 | 4 | 4 | 4 | 4 | 4 | ||||||||||||||||||
| a. | On August 23, 2010, the Company entered into |
| Note 17: - | Contingent Liabilities and commitments (cont.) |
| b. | On August 2, 2012, the Company entered into a strategic agreement with CHIESI FARMACEUTICI S. P. A, a fully integrated European Pharmaceutical company focused on respiratory disease and special care products (" |
| The Company has engaged in operating lease agreements for office and storage spaces. These agreements will expire |
| In thousands | ||||
| 2015 | 340 | |||
| 2016 | 340 | |||
| 2017 | 85 | |||
| 765 | ||||
| In thousands | ||||
Year 1 | $ | 590 | ||
Year 2 to 5 | 2,479 | |||
Year 6 and thereafter | 2,541 | |||
| $ | 5,610 | |||
| The Company has engaged in operating lease agreements for the vehicles in its possession. These agreements will expire between |
| In thousands | ||||
| 2015 | 328 | |||
| 2016 | 225 | |||
| 2017 | 72 | |||
| 625 | ||||
| In thousands | ||||
Year 1 | $ | 443 | ||
Year 2 | 284 | |||
Year 3 | 95 | |||
| $ | 822 | |||
| In November 2006, an agreement was signed between the Company and a third party on the matter of research and development collaboration. As part of the agreement, the Company was licensed to use developments made by the third party. Furthermore, the third party will provide the Company with devices for carrying out the clinical trials, free of charge. In the event that the development is successful, the Company will pay the third party royalties based on sales of the devices. This obligation on behalf of the Company to pay royalties shall expire either when the patents expire or 15 years from the first commercial sale, whichever comes last. On the date of the expiry of the royalty period, the license will become non-exclusive and the Company shall be entitled to use the rights granted to it pursuant to the agreement without paying royalties or any other compensation. In addition, the third party would pay royalties of the total net sales exceeding a certain sum, according to a mechanism set in the agreement, until the patent expires or until 15 years pass from the first date of sale, whichever is earlier. |
| In August 2007, the Company entered into a long-term agreement with a multinational European company for the purchase of a raw material used for the development and manufacture of medicines at graded amounts and prices. In addition to the price paid by the Company for the raw material, the Company will pay the supplier an additional sum upon the sale of the product manufactured from the raw material in the territories set in the agreement, after receiving regulatory approvals. As of December 31, |
| h. |
| Note 18: - | Guarantees and charges |
| In order to guarantee the rental payments for an office in Rehovot and other obligations, the Company provided a bank guarantees in the amount of $ 246 thousands. |
| 2. | As collateral for the Company’s original loans amount of NIS 8,355 thousands, the Company has pledged the specific assets which were purchased with those loans. |
| a. | share capital |
| December 31, 2014 | December 31, 2013 | |||||||||||||||
| Authorized | Outstanding | Authorized | Outstanding | |||||||||||||
| ordinary shares of NIS 1 par value | 60,000,000 | 35,988,563 | 60,000,000 | 35,959,939 | ||||||||||||
| December 31, 2017 | December 31, 2016 | |||||||||||||||
| Authorized | Outstanding | Authorized | Outstanding | |||||||||||||
ordinary shares of NIS 1 par value | 70,000,000 | 40,262,819 | 70,000,000 | 36,419,842 | ||||||||||||
| b. | Rights attached to Shares |
| c. | Share options |
| d. | Capital management in the Company |
| Note | Share-Based Payment |
For the Year Ended December 31 | ||||||||||||
| 2014 | 2013 | 2012 | ||||||||||
| In thousands | ||||||||||||
| Cost of revenues | $ | 1,136 | $ | 406 | $ | 705 | ||||||
| Research and development | 725 | 115 | 213 | |||||||||
| Selling and marketing | 178 | 27 | 51 | |||||||||
| General and administrative | 1,712 | 779 | 298 | |||||||||
| Total share-based payment | $ | 3,751 | $ | 1,327 | $ | 1,267 | ||||||
| a. | Expense recognized in the financial statements |
For the Year Ended December 31 | ||||||||||||
| 2017 | 2016 | 2015 | ||||||||||
| In thousands | ||||||||||||
Cost of revenues | $ | 179 | $ | 332 | $ | 564 | ||||||
Research and development | 138 | 134 | 390 | |||||||||
Selling and marketing | 48 | 71 | 98 | |||||||||
General and administrative | 118 | 534 | 855 | |||||||||
Total share-based payment | $ | 483 | $ | 1,071 | $ | 1,907 | ||||||
| b. | Option granted to the Company's Chief Executive Officer ("CEO") |
| c. | Employees options |
| 1. | During 2017, 2016 and 2015 the Company's Board of Directors approved the grant, of 405,950, 320,775 and 356,075 options, respectively to employees and management. The fair value of the options was estimated at $597 thousands, $548 thousands and $749 thousands, respectively. |
| 2. |
| 1. | On November 30, 2017, the Company’s general shareholders meeting approved the grant of a total of 35,000 options to the Company’s board of directors. The options are exercisable into ordinary shares at an exercise price of NIS |
| 2. | On August 30, 2016, the Company’s general shareholders meeting approved the grant of 50,000 options to the Company’s directors. The options are exercisable ordinary shares at an exercise price of NIS 15.2 per option. According to a calculation formula based on the Binomial Model, the fair value of the options was estimated at $114 thousands. |
| 2014 | 2013 | 2012 | ||||||||||||||||||||||
| Number of Options | Weighted Average Exercise Price | Number of Options | Weighted Average Exercise Price | Number of Options | Weighted Average Exercise Price | |||||||||||||||||||
| In NIS | In NIS | In NIS | ||||||||||||||||||||||
| Outstanding at beginning of year | 2,471,507 | 37.53 | 1,674,781 | 20.55 | 1,674,092 | 26.42 | ||||||||||||||||||
| Granted | 20,000 | 54.68 | (*)1,102,850 | 56.00 | 436,313 | 27.03 | ||||||||||||||||||
| Exercised | (35,133 | ) | 15.20 | (262,773 | ) | 25.28 | (361,717 | ) | 12.05 | |||||||||||||||
| Forfeited | (59,483 | ) | 38.63 | (43,351 | ) | 25.28 | (73,907 | ) | 22.55 | |||||||||||||||
| Outstanding at end of year | 2,396,891 | 37.98 | 2,471,507 | 37.53 | 1,674,781 | 20.55 | ||||||||||||||||||
| Exercisable at end of year | 1,276,920 | 27.67 | 797,015 | 16.80 | 719,408 | 15.15 | ||||||||||||||||||
| The weighted average remaining contractual life for the share options | 3.84 | 4.88 | 4.26 |
| 2017 | 2016 | 2015 | ||||||||||||||||||||||
Number of Options | Weighted Average Exercise Price | Number of Options | Weighted Average Exercise Price | Number of Options | Weighted Average Exercise Price | |||||||||||||||||||
| In NIS | In NIS | In NIS | ||||||||||||||||||||||
Outstanding at beginning of year | 2,487,236 | 35.20 | 2,281,493 | 38.96 | 2,396,891 | 37.98 | ||||||||||||||||||
Granted | 458,950 | 21.10 | 401,275 | 15.17 | 504,075 | 18.28 | ||||||||||||||||||
Exercised | (10,659 | ) | 18.19 | (8,398 | ) | 18.47 | (430,178 | ) | 11.18 | |||||||||||||||
Forfeited | (363,155 | ) | 35.70 | (187,134 | ) | 39.22 | (189,295 | ) | 34.94 | |||||||||||||||
Outstanding at end of year | 2,572,372 | 32.47 | 2,487,236 | 35.20 | 2,281,493 | 38.96 | ||||||||||||||||||
Exercisable at end of year | 1,755,253 | 38.69 | 1,543,358 | 40.44 | 1,182,417 | 40.39 | ||||||||||||||||||
The weighted average remaining contractual life for the share options | 3.22 | 3.62 | 4.15 | |||||||||||||||||||||
| Number of RSs | ||||||||
| 2017 | 2016 | |||||||
Outstanding at beginning of year | 27,333 | - | ||||||
Granted | 58,835 | 29,333 | ||||||
End of restriction period | (7,656 | ) | - | |||||
Forfeited | (2,000 | ) | (2,000 | ) | ||||
Outstanding at end of year | 76,512 | 27,333 | ||||||
The weighted average remaining contractual life for the restricted share | 5.92 | 6.20 | ||||||
| 2014 | 2013 | 2012 | ||||||||||||||||
| 2017 | 2016 | 2015 | ||||||||||||||||
| Dividend yield (%) | - | - | - | - | - | - | ||||||||||||
| Expected volatility of the share prices (%) | 30-50 | 29-53 | 29-54 | 37-45 | 32-51 | 42-64 | ||||||||||||
| Risk-free interest rate (%) | 0.92 – 3.24 | 0.88 – 3.18 | 1.86 – 4.13 | 0.1 – 1.83 | 0.13 – 1.83 | 0.07-2.04 | ||||||||||||
| Contractual term of up to (years) | 6.5 | 6.5 | 6.5 | 6.5 | 6.5 | 6.5 | ||||||||||||
| Exercise multiple | 2 | 1.75-2 | 1.75-2 | 2 | 2 | 2 | ||||||||||||
| Weighted average share prices (NIS) | 55.08 | 49.7 | 18.75 | 16.05-16.44 | 15.17 | 17.17 | ||||||||||||
| Expected average forfeiture rate (%) | 0-5 | 0-5 | 0-5 | 1-5 | 0-5 | 0-5 | ||||||||||||
| NOTE 21: TAXES ON INCOME |
| a. | Tax laws applicable to the Company |
Tax Exemption Period | Reduced Tax Period | Rate of Reduced Tax | Percent of Foreign Ownership | |||
| 2 years | 5 years | 25% | 0-25% | |||
| 2 years | 8 years | 25% | 25-49% | |||
| 2 years | 8 years | 20% | 49-74% | |||
| 2 years | 8 years | 15% | 74-90% | |||
| 2 years | 8 years | 10% | 90-100% |
| NOTE | TAXES ON INCOME(CONT.) |
| 1. | Preferred income from a preferred enterprise will be 16% (in development area A – 7.5% instead of 9%). |
| 2. | Preferred income resulting from IP in a preferred technology enterprise will be 12% (in development area A – 7.5%). |
| 3. | Preferred income resulting from IP in a special preferred technology enterprise will be 6%. |
| 4. | Any dividends distributed from technology enterprise earnings to a foreign company that qualifies the provisions that are detailed in the law, will be subject to tax at a rate of 4%. |
| b. | Tax rates applicable to the Company (other than the applicable preferred tax) |
| c. | Tax assessments |
Finalized tax assessments |
| 2. | Settlement of tax assessments |
| d. | Carry forward losses for tax purposes and other temporary differences |
| e. | Deferred taxes: |
| NOTE | TAXES ON INCOME(CONT.) |
| Year ended December 31, | ||||||||||||
| 2017 | 2016 | 2015 | ||||||||||
| In thousands | ||||||||||||
| Current taxes | $ | 129 | $ | 362 | $ | - | ||||||
| Taxes in respect of prior years | 140 | 1,360 | - | |||||||||
| $ | 269 | $ | 1,722 | $ | - | |||||||
| Note | Supplementary Information to the Statements of |
Year Ended December 31, | |||||||||||||
| 2014 | 2013 | 2012 | |||||||||||
| In thousands | |||||||||||||
| a. | Additional information about revenues | ||||||||||||
| Revenues from major customers each of whom amount to 10% or more, of total revenues | |||||||||||||
| Customer A – Proprietary products | $ | 26,606 | $ | 28,376 | $ | 30,599 | |||||||
| Customer B – Proprietary products and Distribution Segment | 12,352 | 8,747 | 15,296 | ||||||||||
| $ | 38,958 | $ | 37,123 | $ | 45,895 | ||||||||
| Year Ended December 31, | ||||||||||||
| 2017 | 2016 | 2015 | ||||||||||
| In thousands | ||||||||||||
a. Additional information about revenues | ||||||||||||
Revenues from major customers each of whom amount to 10% or more, of total revenues | ||||||||||||
Customer A – Proprietary products Segment | $ | 60,383 | $ | 40,451 | $ | 26,032 | ||||||
Customer B – Proprietary products Segment and Distribution Segment | - | 10,225 | 10,306 | |||||||||
| $ | 60,383 | $ | 50,676 | $ | 36,338 | |||||||
Year Ended December 31, | ||||||||||||
| 2014 | 2013 | 2012 | ||||||||||
| In thousands | ||||||||||||
| Israel | $ | 32,040 | $ | 26,280 | $ | 30,336 | ||||||
| U.S.A. | 26,001 | 28,805 | 30,974 | |||||||||
| Europe | 5,265 | 6,737 | 3,370 | |||||||||
| Latin America | 5,121 | 5,943 | 4,367 | |||||||||
| Asia | 2,120 | 2,856 | 3,391 | |||||||||
| Others | 518 | 2 | 237 | |||||||||
| $ | 71,065 | $ | 70,623 | $ | 72,675 | |||||||
| Year Ended December 31, | ||||||||||||
| 2017 | 2016 | 2015 | ||||||||||
| In thousands | ||||||||||||
U.S.A. | $ | 60,405 | $ | 40,585 | $ | 26,559 | ||||||
Israel | 26,355 | 25,340 | 30,624 | |||||||||
Europe | 5,348 | 3,825 | 3,223 | |||||||||
Latin America | 5,248 | 4,221 | 6,036 | |||||||||
Asia | 4,979 | 3,028 | 2,900 | |||||||||
Others | 490 | 495 | 564 | |||||||||
| $ | 102,825 | $ | 77,494 | $ | 69,906 | |||||||
| Year Ended | |||||||||||||
| December 31, | |||||||||||||
| 2014 | 2013 | 2012 | |||||||||||
| In thousands | |||||||||||||
| b. | |||||||||||||
| Cost of materials | $ | 42,265 | $ | 35,334 | $ | 43,751 | |||||||
| Salary and related expenses | 12,026 | 10,425 | 10,438 | ||||||||||
| Depreciation and amortization | 2,019 | 2,245 | 2,581 | ||||||||||
| Other manufacturing expenses | (306 | ) | 588 | 656 | |||||||||
| 56,004 | 48,592 | 57,426 | |||||||||||
Decrease (increase) in inventories | 19 | (4,376 | ) | (7,444 | ) | ||||||||
| $ | 56,023 | $ | 44,216 | $ | 49,982 | ||||||||
| c. | Research and development | ||||||||||||
| Salary and related expenses | $ | 3,852 | $ | 3,877 | $ | 3,360 | |||||||
| Subcontractors | 6,593 | 6,072 | 5,981 | ||||||||||
| Materials | 4,287 | 1,846 | 1,738 | ||||||||||
| Others | 1,298 | 950 | 742 | ||||||||||
| $ | 16,030 | $ | 12,745 | $ | 11,821 | ||||||||
| d. | Selling and marketing | ||||||||||||
| Salary and related expenses | $ | 1,033 | $ | 546 | $ | 404 | |||||||
| Commissions | 106 | 110 | 142 | ||||||||||
| Packing, shipping and delivery | 403 | 355 | 169 | ||||||||||
| Marketing and advertising | 352 | 243 | 231 | ||||||||||
| Registration and marketing fees | 785 | 745 | 608 | ||||||||||
| Others | 219 | 101 | 299 | ||||||||||
| $ | 2,898 | $ | 2,100 | $ | 1,853 | ||||||||
| Note | Supplementary Information to the Statements of |
Year Ended December 31, | |||||||||||||
| 2014 | 2013 | 2012 | |||||||||||
| In thousands | |||||||||||||
| e. | General and administrative | ||||||||||||
| Salary and related expenses (1) | $ | 3,244 | $ | 3,824 | $ | 1,798 | |||||||
| Professional fees | 1,796 | 992 | 705 | ||||||||||
| Depreciation and amortization | 455 | 444 | 373 | ||||||||||
| Bad debt expenses, net | (53 | ) | 483 | - | |||||||||
| Others | 2,151 | 2,119 | 1,905 | ||||||||||
| $ | 7,593 | $ | 7,862 | $ | 4,781 | ||||||||
| (1) The Company incurred in 2013, $ 1,400 thousands of one-time management compensation expense related to the IPO | |||||||||||||
| f. | Financial incomes and expenses | ||||||||||||
| Financial incomes | |||||||||||||
Interest income and gains from marketable securities | $ | 1,611 | $ | 289 | $ | 578 | |||||||
| Financial expenses | |||||||||||||
| Interest and amortization from debentures | $ | 1,954 | $ | 3,089 | $ | 3,321 | |||||||
| Amortization of AFS debt securities | 1,207 | 11 | - | ||||||||||
| Fees paid to financial institutions | 109 | 32 | 34 | ||||||||||
| Others | 23 | 21 | 2 | ||||||||||
| $ | 3,293 | $ | 3,153 | $ | 3,357 | ||||||||
| Year Ended December 31, | ||||||||||||
| 2017 | 2016 | 2015 | ||||||||||
| In thousands | ||||||||||||
b. Cost of goods sold | ||||||||||||
| Cost of materials | $ | 41,179 | $ | 36,154 | $ | 38,848 | ||||||
| Salary and related expenses | 13,137 | 10,596 | 9,991 | |||||||||
| Depreciation and amortization | 2,504 | 2,443 | 2,383 | |||||||||
| Energy | 1,202 | 959 | 922 | |||||||||
| Subcontractors | 3,995 | 2,833 | 2,112 | |||||||||
| Other manufacturing expenses | 1,572 | 1,057 | 1,220 | |||||||||
| 63,589 | 54,042 | 55,476 | ||||||||||
| Decrease (increase) in inventories | 7,148 | 2,092 | (935 | ) | ||||||||
| $ | 70,737 | $ | 56,134 | $ | 54,541 | |||||||
c. Research and development | ||||||||||||
| Salary and related expenses | $ | 6,413 | $ | 5,237 | $ | 4,566 | ||||||
| Subcontractors | 3,392 | 8,318 | 8,002 | |||||||||
| Materials and allocation of facility costs | 1,101 | 1,907 | 3,386 | |||||||||
| Others | 1,067 | 783 | 576 | |||||||||
| $ | 11,973 | $ | 16,245 | $ | 16,530 | |||||||
d. Selling and marketing | ||||||||||||
| Salary and related expenses | $ | 1,470 | $ | 1,272 | $ | 1,227 | ||||||
| Marketing support | 95 | 79 | 368 | |||||||||
| Packing, shipping and delivery | 607 | 494 | 454 | |||||||||
| Marketing and advertising | 627 | 337 | 560 | |||||||||
| Registration and marketing fees | 1,162 | 796 | 794 | |||||||||
| Others | 437 | 265 | 249 | |||||||||
| $ | 4,398 | $ | 3,243 | $ | 3,652 | |||||||
| Note | Supplementary Information to the Statements of profit and loss (cont.) |
| Year Ended December 31, | ||||||||||||
| 2017 | 2016 | 2015 | ||||||||||
| In thousands | ||||||||||||
e. General and administrative | ||||||||||||
| Salary and related expenses | $ | 3,138 | $ | 3,029 | $ | 2,604 | ||||||
| Employees welfare | 2,182 | 1,465 | 1,391 | |||||||||
| Professional fees | 1,497 | 1,378 | 1,482 | |||||||||
| Depreciation, amortization and impairment | 649 | 712 | 524 | |||||||||
| Others | 807 | 769 | 606 | |||||||||
| $ | 8,273 | $ | 7,353 | $ | 6,607 | |||||||
f. Financial incomes and expenses | ||||||||||||
Financial incomes | ||||||||||||
Interest income and gains from marketable securities | $ | 500 | $ | 469 | $ | 463 | ||||||
Financial expenses | ||||||||||||
| Interest and amortization from debentures | $ | - | $ | - | $ | 731 | ||||||
| Fees and interest paid to financial institutions | 162 | 126 | 111 | |||||||||
| Others | - | - | 92 | |||||||||
| $ | 162 | $ | 126 | $ | 934 | |||||||
| Note 23: - | Income (Loss) per Share |
| a. | Details of the number of shares and income (loss) used in the computation of income (loss) per share |
Year Ended December 31, | ||||||||||||||||||||||||
| 2014 | 2013 | 2012 | ||||||||||||||||||||||
| Weighted Number of Shares | Loss Attributed to equity holders of the Company | Weighted Number of Shares | Income Attributed to equity holders of the Company | Weighted Number of Shares | Income Attributed to equity holders of the Company | |||||||||||||||||||
| In thousands | In thousands | In thousands | ||||||||||||||||||||||
| For the computation of basic income ( loss) | 35,971,335 | $ | (13,213 | ) | 32,714,631 | $ | 443 | 28,078,996 | $ | 260 | ||||||||||||||
| Effect of potential dilutive ordinary shares | - | 671,020 | - | 607,640 | - | |||||||||||||||||||
| For the computation of diluted income (loss) | 35,971,335 | $ | (13,213 | ) | 33,385,651 | $ | 443 | 28,686,636 | $ | 260 | ||||||||||||||
Year Ended December 31, | ||||||||||||||||||||||||
| 2017 | 2016 | 2015 | ||||||||||||||||||||||
| Weighted Number of Shares | Income Attributed to equity holders of the Company | Weighted Number of Shares | Loss Attributed to equity holders of the Company | Weighted Number of Shares | Loss Attributed to equity holders of the Company | |||||||||||||||||||
| In thousands | ||||||||||||||||||||||||
For the computation of basic income (loss) | 37,970,697 | $ | 6,901 | 36,418,833 | $ | (6,733 | ) | 36,245,813 | $ | (11,270 | ) | |||||||||||||
Effect of potential dilutive ordinary shares | 74,400 | - | - | - | - | - | ||||||||||||||||||
For the computation of diluted income (loss) | 38,045,097 | $ | 6,901 | 36,418,833 | $ | (6,733 | ) | 36,245,813 | $ | (11,270 | ) | |||||||||||||
| Note | Income (Loss) per Share |
| b. | The computation of the diluted income per share in |
| Note | Operating Segments |
| a. | General |
Proprietary Products | Develop and manufacture |
Distribution |
| Proprietary Products | Distribution | Total | ||||||||||
| In thousands | ||||||||||||
Year Ended December 31, 2017 | ||||||||||||
Revenues | $ | 79,559 | $ | 23,266 | $ | 102,825 | ||||||
Gross profit | $ | 28,224 | $ | 3,864 | $ | 32,088 | ||||||
Unallocated corporate expenses | (24,644 | ) | ||||||||||
Finance expense, net | (274 | ) | ||||||||||
Income before taxes on income | $ | 7,170 | ||||||||||
| Proprietary Products | Distribution | Total | ||||||||||
| In thousands | ||||||||||||
| Year Ended December 31, 2014 | ||||||||||||
| Revenues | $ | 44,389 | $ | 26,676 | $ | 71,065 | ||||||
| Gross profit | $ | 11,772 | $ | 3,270 | $ | 15,042 | ||||||
| Unallocated corporate expenses | (26,521 | ) | ||||||||||
| Finance expenses, net | (1,682 | ) | ||||||||||
| Loss before taxes on income | $ | (13,161 | ) | |||||||||
| Proprietary Products | Distribution | Total | ||||||||||
| In thousands | ||||||||||||
| Year Ended December 31, 2013 | ||||||||||||
| Revenues | $ | 50,658 | $ | 19,965 | $ | 70,623 | ||||||
| Gross profit | $ | 23,554 | $ | 2,853 | $ | 26,407 | ||||||
| Unallocated corporate expenses | (22,707 | ) | ||||||||||
| Finance expenses, net | (3,233 | ) | ||||||||||
| Income before taxes on income | $ | 467 | ||||||||||
| Proprietary Products | Distribution | Total | ||||||||||
| In thousands | ||||||||||||
| Year Ended December 31, 2012 | ||||||||||||
| Revenues | $ | 46,445 | $ | 26,230 | $ | 72,675 | ||||||
| Gross profit | $ | 19,534 | $ | 3,159 | $ | 22,693 | ||||||
| Unallocated corporate expenses | (18,455 | ) | ||||||||||
| Finance expenses, net | (3,455 | ) | ||||||||||
| Income before taxes on income | $ | 783 | ||||||||||
| Note 24: - | Operating Segments (cont.) |
| Proprietary Products | Distribution | Total | ||||||||||
| In thousands | ||||||||||||
Year Ended December 31, 2016 | ||||||||||||
Revenues | $ | 55,958 | $ | 21,536 | $ | 77,494 | ||||||
Gross profit | $ | 18,235 | $ | 3,125 | $ | 21,360 | ||||||
Unallocated corporate expenses | (26,841 | ) | ||||||||||
Finance income, net | 470 | |||||||||||
Loss before taxes on income | $ | (5,011 | ) | |||||||||
| Proprietary Products | Distribution | Total | ||||||||||
| In thousands | ||||||||||||
Year Ended December 31, 2015 | ||||||||||||
Revenues | $ | 42,952 | $ | 26,954 | $ | 69,906 | ||||||
Gross profit | $ | 12,051 | $ | 3,314 | $ | 15,365 | ||||||
Unallocated corporate expenses | (26,789 | ) | ||||||||||
Finance income, net | 154 | |||||||||||
Loss before taxes on income | $ | (11,270 | ) | |||||||||
| Note 25: |
| Year ended December 31, | ||||||||||||
| 2014 | 2013 | 2012 | ||||||||||
| In thousands | ||||||||||||
| Plasma derived products | $ | 43,206 | $ | 48,484 | $ | 44,070 | ||||||
| Others | 1,183 | 2,174 | 2,375 | |||||||||
| $ | 44,389 | $ | 50,658 | $ | 46,445 | |||||||
| Balances and Transactions with Related Parties |
| a. | Balances with related parties |
| December 31, 2017 | December 31, 2016 | |||||||
| In thousands | ||||||||
December 31, 2017 | ||||||||
| Other accounts payables | $ | 292 | $ | 230 | ||||
| Employee benefit liabilities, net | $ | 92 | $ | 170 | ||||
| Trade receivable | $ | 2,382 | $ | 675 | ||||
| Related Parties | ||||
| In thousands | ||||
| December 31, 2014 | ||||
| Other accounts payables | $ | 297 | ||
| Employee benefit liabilities, net | $ | 187 | ||
| The highest balance of trade receivable | $ | 648 | ||
| December 31, 2013 | ||||
| Other accounts payables | $ | 441 | ||
| Employee benefit liabilities, net | $ | 174 | ||
| The highest balance of trade receivable | $ | 83 | ||
Year Ended December 31, | ||||||||
| 2014 | 2013 | |||||||
| In thousands | ||||||||
| Salary and related expenses to those employed by the Company or on its behalf | $ | 1,316 | $ | 1,273 | ||||
| Salary of directors not employed by the Company or on its behalf | $ | 49 | $ | 53 | ||||
| Number of People to whom the Salary and Benefits Refer | ||||||||
| Related and related parties employed by the Company or on its behalf | 2 | 3 | ||||||
| Directors not employed by the Company | 8 | 8 | ||||||
| 10 | 11 | |||||||
| Note | Balances and Transactions |
| b. | Benefits to related parties |
| Year Ended December 31, | ||||||||
| 2017 | 2016 | |||||||
| In thousands | ||||||||
Salary and related expenses to those employed by the Company or on its behalf | $ | 460 | $ | 473 | ||||
Salary of directors not employed by the Company or on its behalf | $ | 107 | $ | 122 | ||||
Number of People to whom the Salary and Benefits Refer | ||||||||
Related and related parties employed by the Company or on its behalf | 2 | 2 | ||||||
Directors not employed by the Company | 2 | 3 | ||||||
| 4 | 5 | |||||||
| c. | Benefits to key executive personnel (including non-related parties) |
Year Ended December 31, | Year Ended December 31, | |||||||||||||||||||||||
| 2014 | 2013 | 2012 | 2017 | 2016 | 2015 | |||||||||||||||||||
| In thousands | In thousands | |||||||||||||||||||||||
| Short-term benefits | $ | 2,064 | $ | 2,884 | $ | 1,221 | $ | 2,719 | $ | 2,453 | $ | 2,144 | ||||||||||||
| Share-based payment | 1,165 | 617 | 179 | 310 | 460 | 650 | ||||||||||||||||||
| Other long-term benefits | (8 | ) | 5 | 3 | 6 | 28 | 61 | |||||||||||||||||
| $ | 3,221 | $ | 3,506 | $ | 1,403 | $ | 3,035 | $ | 2,941 | $ | 2,855 | |||||||||||||
| d. | Transactions with related parties |
| Controlling Shareholder | Related Parties | Year Ended December 31, | ||||||||||||||||||
| In thousands | 2017 | 2016 | 2015 | |||||||||||||||||
| In thousands | ||||||||||||||||||||
| Sales | $ | - | $ | 1,158 | $ | 3,455 | $ | 2,230 | $ | 2,795 | ||||||||||
| Selling and marketing expenses | $ | - | $ | 120 | $ | 121 | $ | 101 | $ | 114 | ||||||||||
| General and administrative expenses | $ | - | $ | 1,441 | $ | 446 | $ | 503 | $ | 526 | ||||||||||
| Controlling Shareholder | Related Parties | |||||||
| In thousands | ||||||||
| Sales | $ | - | $ | 453 | ||||
| Selling and marketing expenses | $ | - | $ | 110 | ||||
| General and administrative expenses | $ | - | $ | 2,015 | ||||
| Sales | $ | 272 | $ | - | ||||
| Purchases | $ | 3 | $ | - | ||||
| Selling and marketing expenses | $ | - | $ | 107 | ||||
| General and administrative expenses | $ | 45 | $ | 1,397 | ||||
| Financial expenses | $ | 541 | $ | - |
| Note | Balances and Transactions |
| e. | Revenues and Expenses from Related and Interested Parties |
| 1. | Sales to related parties are conducted at market prices. Balances that have yet to be repaid by the end of the year are not guaranteed, bear no interest and their settlement will be in cash. No guarantees were received or given for sums receivable or payable. For the years ended December 31, 2017, 2016 and 2015, the Company recorded no allowance for doubtful accounts for sums receivable from related parties. |
| 2. | On May 26, 2011, the Company announced its engagement in an amended agreement regarding the distribution of Glassia, that revises and replaces the distribution agreement signed in 2001 between the Company and Tuteur SACIFIA ("Tuteur"), a company registered in Argentina, currently under the control of the Hahn family. The amendment to the agreement was made as an arm’s length transaction. |
| 3. | Mr. Reuven Behar, a partner of Fischer Behar Chen Well Orion Co., the Company’s external legal counsel was a director in the Company until May 2016. Fees attributed to Fischer Behar Chen Well Orion Co. are included in the tables above for the period ending May 1, 2016. |
| Note |
Chief executive officer employment terms |