UNITED STATES
SECURITIES AND EXCHANGE COMMISSION
WASHINGTON, D.C. 20549
SECURITIES AND EXCHANGE COMMISSION
WASHINGTON, D.C. 20549
FORM 20-F
| ☐ | REGISTRATION STATEMENT PURSUANT TO SECTION 12(b) OR |
OR
| ☒ | ANNUAL REPORT PURSUANT TO SECTION 13 OR 15(d) OF THE SECURITIES EXCHANGE ACT OF 1934 |
For the fiscal year ended December 31, 20172020
OR
| ☐ | TRANSITION REPORT PURSUANT TO SECTION 13 OR 15(d) OF THE SECURITIES EXCHANGE ACT OF 1934 |
For the transition period from ____________________ to ____________________
OR
| ☐ | SHELL COMPANY REPORT PURSUANT TO SECTION 13 OR 15(d) OF THE SECURITIES EXCHANGE ACT OF 1934 |
Date of event requiring this shell company report____________________
Commission file number 001‑36349001-36349


MEDIWOUND LTD.
(Exact name of Registrant as specified in its charter)
(Exact name of Registrant as specified in its charter)
Not applicable
(Translation of Registrant’s name into English)
ISRAEL
(Jurisdiction of incorporation or organization)
(Jurisdiction of incorporation or organization)
42 Hayarkon Street
Yavne, 8122745 Israel
(Address of principal executive offices)
Yavne, 8122745 Israel
(Address of principal executive offices)
Yaron Meyer, Adv.
Executive Vice President, General Counsel and Corporate Secretary
Telephone: +972 (77)971‑4100971-4100
E‑mail:E-mail: yaronm@mediwound.com
MediWound Ltd.
42 Hayarkon Street
Yavne, 8122745 Israel
Executive Vice President, General Counsel and Corporate Secretary
Telephone: +972 (77)
MediWound Ltd.
42 Hayarkon Street
Yavne, 8122745 Israel
(Name, telephone,
Securities registered or to be registered pursuant to Section 12(b) of the Act:
| Title of each class | Trading Symbol(s) | Name of each exchange on which registered |
| Ordinary shares, par value NIS 0.01 per share | MDWD | Nasdaq Global Market |
Securities registered or to be registered pursuant to Section 12(g) of the Act: None.
Securities for which there is a reporting obligation pursuant to Section 15(d) of the Act: None.
Indicate the number of outstanding shares of each of the issuer’s classes of capital or common stock as of the close of the period covered by the annual report: As of December 31, 2017,2020, the registrant had outstanding 27,047,73727,236,752 ordinary shares, par value NIS 0.01 per share.share, outstanding.
Indicate by check mark if the registrant is a well‑knownwell-known seasoned issuer, as defined in Rule 405 of the Securities Act.
Yes ☐ No ☒
If this report is an annual or transition report, indicate by check mark if the registrant is not required to file reports pursuant to Section 13 or 15(d) of the Securities Exchange Act of 1934.
Yes ☐ No ☒
Indicate by check mark whether the registrant (1) has filed all reports required to be filed by Section 13 or 15(d) of the Securities Exchange Act of 1934 during the preceding 12 months (or for such shorter period that the registrant was required to file such reports), and (2) has been subject to such filing requirements for the past 90 days.
Yes ☒ No ☐
Indicate by check mark whether the registrant has submitted electronically and posted on its corporate website, if any, every Interactive Data File required to be submitted and posted pursuant to Rule 405 of Regulation S‑TS-T (§229.405232.405 of this chapter) during the preceding 12 months (or for such shorter period that the registrant was required to submit and post such files).
Yes ☐ ☒ No ☐
Indicate by check mark whether the registrant is a large accelerated filer, an accelerated file, a non‑acceleratednon-accelerated filer, or an emerging growth company. See the definitions of “large accelerated filer,” and “accelerated filer,” and “emerging growth company” in Rule 12b‑212b-2 of the Exchange Act.
Large accelerated filer ☐ | Accelerated filer | Emerging Growth Company |
If an emerging growth company that prepares its financial statements in accordance with U.S. GAAP, indicate by check mark if the registrant has elected not to use the extended transition period for complying with any new or revised financial accounting standards† provided pursuant to Section 13(a) of the Exchange Act. ☐
† The term “new or revised financial accounting standard” refers to any update issued by the Financial Accounting Standards Board to its Accounting Standards Codification after April 5, 2012.
Indicate by check mark whether the registrant has filed a report on and attestation to its management’s assessment of the effectiveness of its internal control over financial reporting under Section 404(b) of the Sarbanes-Oxley Act (15 U.S.C. 7262(b)) by the registered public accounting firm that prepared or issued its audit report. ☐
Indicate by check mark which basis for accounting the registrant has used to prepare the financing statements included in this filing:
U.S. GAAP ☐ | International Financial Reporting Standards as issued by the International Accounting Standards Board ☒ | Other ☐ |
If “Other” has been checked in response to the previous question, indicate by check mark which financial statement item the registrant has elected to follow.
☐ Item 17 ☐ Item 18
If this is an annual report, indicate by check mark whether the registrant is a shell company (as defined in Rule 12b‑212b-2 of the Exchange Act).
Yes ☐ No ☒

MEDIWOUND LTD.
FORM ANNUAL REPORT FOR THE FISCAL YEAR ENDED DECEMBER 31, |
TABLE OF CONTENTS
| i | |
| i | |
| PART I | |
| 1 | |
| 1 | |
| 1 | |
| PART II | |
| PART III | |
In this annual report, the terms “MediWound,” “we,” “us,” “our” and “the company” refer to MediWound Ltd. and its subsidiaries.
This annual report includes other statistical, market and industry data and forecasts which we obtained from publicly available information and independent industry publications and reports that we believe to be reliable sources. These publicly available industry publications and reports generally state that they obtain their information from sources that they believe to be reliable, but they do not guarantee the accuracy or completeness of the information. Although we believe that these sources are reliable, we have not independently verified the information contained in such publications. Certain estimates and forecasts involve uncertainties and risks and are subject to change based on various factors, including those discussed under the headings “Special Note Regarding Forward‑LookingForward-Looking Statements” and “ITEM 3.D. Risk Factors” in this annual report.
Throughout this annual report, we refer to various trademarks, service marks and trade names that we use in our business. The “MediWound” design logo, “MediWound,” “NexoBrid,” “EscharEx” and other trademarks or service marks of MediWound Ltd. appearing in this annual report are the property of MediWound Ltd. We have several other trademarks, service marks and pending applications relating to our solutions. Other trademarks and service marks appearing in this annual report are the property of their respective holders.
In addition to historical facts, this annual report on Form 20‑F20-F contains forward‑lookingforward-looking statements within the meaning of Section 27A of the U.S. Securities Act of 1933, as amended (the “Securities Act”), Section 21E of the U.S. Securities Exchange Act of 1934, as amended (the “Exchange Act”) and the safe harbor provisions of the U.S. Private Securities Litigation Reform Act of 1995. We make forward‑lookingforward-looking statements in this annual report that are subject to risks and uncertainties. These forward‑lookingforward-looking statements include information about possible or assumed future results of our business, financial condition, results of operations, liquidity, plans and objectives. In some cases, you can identify forward‑lookingforward-looking statements by terminology such as “believe,” “may,” “estimate,” “continue,” “anticipate,” “intend,” “should,” “plan,” “expect,” “predict,” “potential,” or the negative of these terms or other similar expressions. The statements we make regarding the following matters are forward‑lookingforward-looking by their nature:
the timing and conduct of our trials of NexoBrid, EscharEx and our pipeline product candidates, including statements regarding the timing, progress and results of current and future preclinical studies and clinical trials, and our research and development programs;
the clinical utility, potential advantages and timing or likelihood of regulatory filings and approvals of NexoBrid, EscharEx and our pipeline product candidates;
our plans to develop and commercialize NexoBrid, EscharEx and our pipeline product candidates;
our estimates regarding expenses, future revenues, capital requirements and the need for additional financing;
anticipated funding under our contracts with the U.S. Biomedical Advanced Research and Development Authority;
our expectations regarding future growth, including our ability to develop new products;
our commercialization, marketing and manufacturing capabilities and strategy and the ability of our marketing team to cover regional burn centers and units;
our ability to maintain adequate protection of our intellectual property;
our estimates regarding the market opportunity for NexoBrid, EscharEx and our pipeline product candidates;
our expectation regarding the duration of our inventory of intermediate drug substance and products;
the impact of our research and development expenses as we continue developing product candidates; and
the impact of government laws and regulations.
i
The preceding list is not intended to be an exhaustive list of all of our forward‑lookingforward-looking statements. The forward‑lookingforward-looking statements are based on our beliefs, assumptions and expectations of future performance, taking into account the information currently available to us. These statements are only predictions based upon our current expectations and projections about future events. There are important factors that could cause our actual results, level of activity, performance or achievements to differ materially from the results, level of activity, performance or achievements expressed or implied by the forward‑looking statements. These statements may be found in the sections of this annual report on Form 20‑F20-F entitled “ITEM 3.D. Risk Factors,” “ITEM 4. Information on the Company,” “ITEM 5. Operating and Financial Review and Prospects,” “ITEM 10.E. Taxation—United States Federal Income Taxation—Passive Foreign Investment Company Considerations” and elsewhere in this annual report, including the section entitled “ITEM 4.B. Business Overview” and “ITEM 4.B. Business Overview—Our Focus: Wounds,Focus,” which contain information obtained from independent industry sources. Actual results could differ materially from those anticipated in these forward‑lookingforward-looking statements due to various important factors, including all the risks discussed in “ITEM 3.D. Risk Factors” and information contained in other documents filed with or furnished to the Securities and Exchange Commission.
You should not rely upon forward‑lookingforward-looking statements as predictions of future events. Although we believe that the expectations reflected in the forward‑lookingforward-looking statements are reasonable, we cannot guarantee that future results, levels of activity, performance and events and circumstances reflected in the forward‑lookingforward-looking statements will be achieved or will occur. Except as required by law, we undertake no obligation to publicly update any forward‑lookingforward-looking statements for any reason after the date of this annual report to conform these statements to actual results or to changes in our expectations.
ii
PART I
| Item 1. | IDENTITY OF DIRECTORS, SENIOR MANAGEMENT AND ADVISERS |
Not applicable.
| Item 2. | OFFER STATISTICS AND EXPECTED TIMETABLE |
Not applicable.
| Item 3. | KEY INFORMATION |
| A. | [Reserved] |
| Year Ended December 31, | ||||||||||||||||||||
| 2013 | 2014 | 2015 | 2016 | 2017 | ||||||||||||||||
| (in thousands, except per share data) | ||||||||||||||||||||
| Consolidated statements of operations data: | ||||||||||||||||||||
| Revenues | $ | — | $ | 259 | $ | 601 | $ | 1,558 | $ | 2,496 | ||||||||||
Cost of revenues(1) | — | 2,785 | 2,519 | 2,158 | 1,578 | |||||||||||||||
| Gross (loss) profit | — | (2,526 | ) | (1,918 | ) | (600 | ) | 918 | ||||||||||||
| Operating expenses: | ||||||||||||||||||||
| Research and development, gross | 4,513 | 6,054 | 8,139 | 14,779 | 14,625 | |||||||||||||||
| Participation by BARDA and the Israeli Innovation Authority | (878 | ) | (705 | ) | (2,118 | ) | (7,711 | ) | (9,163 | ) | ||||||||||
Research and development, net of participations(1)(2) | 3,635 | 5,349 | 6,021 | 7,068 | 5,462 | |||||||||||||||
Selling and marketing(1) | 2,259 | 8,829 | 9,284 | 8,403 | 5,362 | |||||||||||||||
General and administrative(1) | 1,687 | 4,723 | 4,004 | 4,084 | 3,781 | |||||||||||||||
| Operating loss | (7,581 | ) | (21,427 | ) | (21,227 | ) | (20,155 | ) | (13,687 | ) | ||||||||||
| Financial income (expense), net | (920 | ) | 2,552 | (444 | ) | 1,270 | (846 | ) | ||||||||||||
Loss from continuing operations | (8,501 | ) | (18,875 | ) | (21,671 | ) | (18,885 | ) | (14,533 | ) | ||||||||||
Loss from discontinued operation(1)(3) | (6,850 | ) | — | (417 | ) | — | (7,616 | ) | ||||||||||||
Net loss | $ | (15,351 | ) | $ | (18,875 | ) | $ | (22,088 | ) | $ | (18,885 | ) | $ | (22,149 | ) | |||||
| Foreign currency translation adjustments | (32 | ) | 14 | 2 | 7 | (29 | ) | |||||||||||||
Total comprehensive loss | $ | (15,383 | ) | $ | (18,861 | ) | $ | (22,086 | ) | $ | (18,878 | ) | $ | (22,178 | ) | |||||
Basic loss per share(4) | $ | (0.98 | ) | $ | (0.95 | ) | $ | (1.02 | ) | $ | (0.86 | ) | $ | (0.95 | ) | |||||
Diluted loss per share(4) | $ | (0.98 | ) | $ | (0.95 | ) | $ | (1.02 | ) | $ | (0.86 | ) | $ | (0.95 | ) | |||||
Weighted average number of ordinary shares used in computing loss per ordinary share (in thousands): | ||||||||||||||||||||
| Basic: | 15,671 | 19,940 | 21,718 | 21,862 | 23,341 | |||||||||||||||
| Diluted: | 15,671 | 19,940 | 21,718 | 21,862 | 23,341 | |||||||||||||||
| As of December 31, | ||||||||||||||||||||
| 2013 | 2014 | 2015 | 2016 | 2017 | ||||||||||||||||
| (in thousands) | ||||||||||||||||||||
| Consolidated balance sheet data: | ||||||||||||||||||||
| Cash and cash equivalents and short‑term bank deposits | $ | 9,553 | $ | 64,853 | $ | 45,768 | $ | 30,029 | $ | 36,069 | ||||||||||
Working capital, net(5) | 10,042 | 64,600 | 45,189 | 28,232 | 36,087 | |||||||||||||||
| Total assets | 14,826 | 71,121 | 52,523 | 35,764 | 44,135 | |||||||||||||||
| Total non‑current liabilities | 32,607 | 24,353 | 23,847 | 22,614 | 29,082 | |||||||||||||||
| Total shareholders’ equity (deficit) | (19,804 | ) | 42,871 | 23,470 | 7,770 | 9,620 | ||||||||||||||
| Capitalization and Indebtedness |
| Year Ended December 31, | ||||||||||||||||||||
| 2013 | 2014 | 2015 | 2016 | 2017 | ||||||||||||||||
| (in thousands) | ||||||||||||||||||||
| Cost of revenues | $ | — | $ | 763 | $ | 372 | $ | 504 | $ | 188 | ||||||||||
| Research and development | 315 | 657 | 511 | 752 | 488 | |||||||||||||||
| Selling and marketing | 24 | 1,430 | 669 | 765 | 204 | |||||||||||||||
| General and administrative | 192 | 1,977 | 1,107 | 1,150 | 483 | |||||||||||||||
| Share‑based compensation expenses from continuing operations | 531 | 4,827 | 2,659 | 3,171 | 1,363 | |||||||||||||||
Discontinued operation(3) | 76 | — | — | — | — | |||||||||||||||
| Total share‑based compensation expenses | $ | 607 | $ | 4,827 | $ | 2,659 | $ | 3,171 | $ | 1,363 | ||||||||||
Not applicable.
| C. | Reasons for the Offer and Use of Proceeds |
Not applicable.
| D. | Risk Factors |
Our business faces significant risks. You should carefully consider all of the information set forth in this annual report and in our other filings with the United States Securities and Exchange Commission (the “SEC”), including the following risk factors which we face and which are faced by our industry. Our business, financial condition and results of operations could be materially and adversely affected by any of these risks. In that event, the trading price of our ordinary shares would likely decline and you might lose all or part of your investment. This report also contains forward‑lookingforward-looking statements that involve risks and uncertainties. Our results could materially differ from those anticipated in these forward‑lookingforward-looking statements, as a result of certain important factors including the risks described below and elsewhere in this report and our other SEC filings. See “Special Note Regarding Forward‑LookingForward-Looking Statements” on page i.
Risks Related to Our BusinessDevelopment, Clinical Testing and Our IndustryRegulatory Approval
Product development is a lengthy and expensive process, with an uncertain outcome.
We intend to develop and commercialize pipeline product candidates based on our patented proteolytic enzymeenzymatic technology platform for marketing authorization of NexoBrid and EscharEx in the U.S. and for new indications, such as for debridement of chronic and other hard‑to‑heal wounds and treatment of connective tissue and other indications. However, before obtaining regulatory approval for the sale of our pipeline product candidatescandidates in any jurisdiction, we must conduct, at our own expense, clinical studies to demonstrate that the products are safe and effective.
Preclinical and clinical testing is expensive, is difficult to design and implement, can take many years to complete and is uncertain as to outcome. A failure of one or more of our clinical trials can occur at any stage of testing. We may experience numerous unforeseen events during, or as a result of, preclinical testing and the clinical trial process. For example, on August 3, 2004, the U.S. Food and Drug Administration (the “FDA”) put one of our Phase 2 studies of NexoBrid on a clinical hold due to safety concerns in the study group, including four deaths and a higher incidence of pain and pyrexia compared to the standard of care (“SOC”) group. Although the Data Safety Monitoring Board unanimously concluded that no causal relationship between these deaths and the NexoBrid treatment was established and provided a reasoning for the higher incidence of such adverse events, the FDA delayed the continuation of the development plan until we proposed to initiate an additional smaller Phase 2 study to demonstrate the effectiveness of our proposed corrective measures. We successfully completed this smaller Phase 2 study, allowing us to continue the development plan, but experienced a significant delay and higher costs as a result. Even if preclinical or clinical trials are successful, we still may be unable to commercialize the product, as success in preclinical trials, early clinical trials, including Phase 2 trials or previous clinical trials does not ensure that later clinical trials will be successful.
regulators may not authorize us to conduct a clinical trial within a country or at a prospective trial site or may require us to change the design of a study;
delays may occur in reaching agreement on acceptable clinical trial terms with regulatory authorities or prospective sites, or obtaining institutional review board approval;
our preclinical tests or clinical trials may produce negative or inconclusive results, and we may decide, or regulators may require us, to conduct additional trials or to abandon strategic projects; |
the number of patients required for our clinical trials may be larger than we anticipate, enrollment in our clinical trials may be slower or more difficult than we expect, or patients may not participate in necessary follow-up visits to obtain required data, any of which would result in significant delays in our clinical testing process;
our third-party contractors, such as a research institute, may fail to comply with regulatory requirements or meet their contractual obligations to us;
we may be forced to suspend or terminate our clinical trials if the participants are being exposed, or are thought to be exposed, to unacceptable health risks or if any participant experiences an unexpected serious adverse event;
regulators or institutional review boards may require that we hold, suspend or terminate clinical research for various reasons, including noncompliance with regulatory requirements;
undetected or concealed fraudulent activity by a clinical researcher, if discovered, could preclude the submission of clinical data prepared by that researcher, lead to the suspension or substantive scientific review of one or more of our marketing applications by regulatory agencies, and result in the recall of any approved product distributed pursuant to data determined to be fraudulent;
the cost of our clinical trials may be greater than we anticipate;
an audit of preclinical or clinical studies by regulatory authorities may reveal noncompliance with applicable protocols or regulations, which could lead to disqualification of the results and the need to perform additional studies;
delays may occur in obtaining our clinical materials; and
epidemics or pandemics, such as the COVID-19 pandemic that can affect the overall healthcare infrastructure, including the ability to recruit patients, the ability to conduct studies at medical sites and the pace with which governmental agencies, such as the FDA, will review and approve regulatory submissions. Additional government-imposed quarantines and requirements to “shelter at home” or other incremental mitigation efforts also may impact our ability to source supplies for our operations or our ability or capacity to manufacture, sell and support the use of NexoBrid, EscharEx and other candidate products in the future.
Moreover, we do not know whether preclinical tests or clinical trials will begin or be completed as planned or will need to be restructured. Significant delays could also shorten the patent protection period during which we may have the exclusive right to commercialize our pipeline product candidates or could allow our competitors to bring products to the market before we do, impairing our ability to commercialize our pipeline product candidates.
We may be unable to successfully obtain approval of NexoBrid for treatment of severe burns in the United States and other markets.
In the short term, we plan to relyhave been relying, for a significant portion of our revenues from sales of products, on sales of NexoBrid in Europe and in other international markets for the treatment of severe burns and procurement of NexoBrid by the U.S. Biomedical Advanced Research and Development Authority (BARDA) for a significant portionemergency stockpile as part of our total revenues.the U.S. Department of Health and Human Services’ (HHS) mission to build national preparedness for public health medical emergencies. However, our continued growth depends, in large part, on our ability to develop and obtain marketing authorization for NexoBrid for treatment of severe burns in additional markets, especially in the United States (from the U.S. Food and Drug Administration (FDA)). We expect that marketing approval from the FDA,. Although if granted, would enable us to receive additional payments, including milestone payments, transfer price payments and royalties, from Vericel Corporation ("Vericel"), our U.S. commercial partner, who is responsible for commercializing NexoBrid in the North America. In January 2019, we initiated aannounced top-line results from the U.S. Phase 3 pivotal study in April 2015 to support a Biologics License Application (“BLA”) submission to the FDA, we will not be ableaccording to submit a BLA untilwhich the study is complete or until such time thathas met its primary and all secondary endpoints. In September 2020, the FDA acceptsaccepted for review our BLA, submission. We cannot predict whetherwhich was based on the above-available acute data, including primary, secondary and safety endpoints, as well as 12-month safety follow-up data. The 24-month long-term safety follow-up data from the Phase 3 pivotal study will be successful and, evensubmitted as a safety update as part of a post-approval commitment, if itour BLA is successful, whether theapproved. The FDA will acceptassigned a BLA submission following this study,Prescription Drug User Fee Act (“PDUFA”) goal date of June 29, 2021. We cannot predict how long the FDA willmay take to review and approve NexoBrid following our BLA submission, or whether any such approval in the United States will ultimately be granted.granted by the PDUFA goal date, or at all. For example, the FDA has requested additional information as a part of its review of the BLA for NexoBrid. However, there is no guarantee that FDA will consider our responses to be sufficient or timely to enable FDA approval by the PDUFA goal date, particularly in light of delays in the FDA’s review caused or exacerbated by the COVID-19 pandemic, including delays in conducting required inspections of our manufacturing facilities. Similarly, we cannot predict how long regulatory authorities outside of the United States and Europe willmay take to provide NexoBrid with marketing authorization in their jurisdictions or whether such authorizations will be granted at all. A number of companies in the pharmaceutical and biotechnology industry have suffered significant setbacks in advanced clinical trials, even after obtaining promising results in earlier clinical trials. See “—Product development is a lengthy and expensive process, with an uncertain outcome” and “—Development and commercialization of NexoBrid and EscharEx in the United States and our pipeline product candidates worldwide requires successful completion of the regulatory approval process, and may suffer delays or fail.” The failure to receive such marketing authorization, especially in the United States, would have a materiallymaterial adverse impact on our business prospects.
2
Development and commercialization of NexoBrid and EscharEx in the United States and our pipeline product candidates worldwide requires successful completion of the regulatory approval process, and may suffer delays or fail.
In the United States, and Europe, as well as other jurisdictions, we are required to apply for and receive marketing authorization before we can market our products, as we have already completedreceived for NexoBrid in the European Union, Israel, Argentina, Russia, South Korea and Argentina.Peru. This process can be time‑consumingtime-consuming and complicated and may result in unanticipated delays. To secure marketing authorization, an applicant generally is required to submit an application that includes the data supporting preclinical and clinical safety and efficacy as well as detailed information on the manufacturing and control of the product, proposed labeling and other information. Before marketing authorization is granted, regulatory authorities generally require the inspection of the manufacturing facility or facilities and quality systems (including those of third parties) at which the product candidate is manufactured and tested, to assess compliance with strictly enforced current good manufacturing practices (“cGMP”), as well as potential audits of the non‑clinicalnon-clinical and clinical trial sites that generated the data cited in the marketing authorization application.application to assess compliance with requisite good clinical practices ("GCP").
We cannot predict how long the applicable regulatory authority or agency will take to grant marketing authorization or whether any such authorizations will ultimately be granted. Regulatory agencies, including the FDA and the European Medicines Agency (the “EMA”), have substantial discretion in the approval process, and the approval process and the requirements governing clinical trials vary from country to country. The policies of the FDA, the EMA or other regulatory authorities may change or may not be explicit, and additional government regulations may be enacted that could prevent, limit or delay regulatory approval of NexoBrid, EscharEx or our pipeline product candidates. For example, in December 2016, the 21st Century Cures Act, or Cures Act, was signed into law in the United States. The Cures Act, among other things, is intended to modernize the regulation of drugs and biologics and spur innovation, but its ultimate implementation is unclear. If we are slow or unable to adapt to changes in existing requirements or the adoption of new requirements or policies, or if we are not able to maintain regulatory compliance, we may lose any marketing approval that we may have obtained and we may not achieve or sustain profitability. We also cannot predict the likelihood, nature or extent of government regulation that may arise from future legislation or administrative or executive action, either in the United States or abroad. For example, certain policiesthe results of the current U.S. presidential administrationelection may impact our business and industry. Namely, thisthe previous administration has takentook several executive actions, including the issuance of a number of executive orders, that could impose significant burdens on, or otherwise materially delay, the FDA’s ability to engage in routine regulatory and oversight activities such as implementing statutes through rulemaking, issuance of guidance, and review and approval of marketing applications. It is difficult to predict whether or how these requirements will be implemented, and the extent to whichor whether they will be rescinded or replaced under the Biden administration. The policies and priorities of the Biden administration are unknown and could materially impact the FDA’s ability to exercise its regulatory authority.framework governing our product candidates. If these executive actions impose constraints on the FDA’s ability to engage in oversight and implementation activities in the normal course, or if we slow are slow or unable to adapt to changes in existing requirements or the adoption of new requirements or policies, or if we are unable to maintain regulatory compliance, we may be subject to enforcement action and our business may be negatively impacted.
In addition, any regulatory approval that we will receive may also contain requirements for potentially costly post‑marketingpost-marketing testing, including Phase 4 clinical trials, and surveillance to monitor the safety and efficacy of the product candidate.candidate. For example, as part of the EMA regulatory approval process, we agreed to provide further data from a post‑marketingpost-marketing Phase 3 clinical trial of NexoBrid. We believe that our U.S. Phase 3 study will also serve to address this post‑marketingpost-marketing commitment to EMA. If the EMA does not accept such study or is not satisfied with the study results, we will need to perform another costly study to provide such data. Once a product is approved, the manufacturing processes, labeling, packaging, distribution, adverse event reporting, storage, advertising, promotion, import, export and recordkeeping for the product will be subject to extensive and ongoing regulatory requirements. These requirements include submission of safety and other post‑marketingpost-marketing information and reports, registration and continued compliance with cGMP and GCP for any clinical trials that we conduct post‑approval.post-approval. Although our manufacturing facility is cGMP‑certified,cGMP-certified, we may face difficulties in obtaining regulatory approval for the manufacturing and quality control process of our pipeline product candidates.
3
Any delays or failures in obtaining regulatory and marketing approval for NexoBrid in the United States, or for our pipeline product candidates worldwide, would adversely affect our business, prospects, financial condition and results of operations.
The ability of FDA to review and approve new products can be affected by a variety of factors, including government budget and funding levels, statutory, regulatory, and policy changes, FDA’s ability to hire and retain key personnel and accept the payment of user fees, and other events that may otherwise affect FDA’s ability to perform routine functions. Average review times at the agency have fluctuated in recent years as a result. In addition, government funding of other government agencies that fund research and development activities is subject to the political process, which is inherently fluid and unpredictable. Disruptions at FDA and other agencies may also slow the time necessary for new medical devices or modifications to cleared or approved medical devices to be reviewed and/or approved by necessary government agencies, which would adversely affect our business. For example, over the last several years, including for 35 days beginning on December 22, 2018, the U.S. government has shut down several times and certain regulatory agencies, such as FDA, have had to furlough critical FDA employees and stop critical activities.
Separately, in response to the COVID-19 pandemic, on March 10, 2020 FDA announced its intention to postpone most inspections of foreign manufacturing facilities, and on March 18, 2020, FDA temporarily postponed routine surveillance inspections of domestic manufacturing facilities. Subsequently, on July 10, 2020 FDA announced its intention to resume certain on-site inspections of domestic manufacturing facilities subject to a risk-based prioritization system. FDA intends to use this risk-based assessment system to identify the categories of regulatory activity that can occur within a given geographic area, ranging from mission critical inspections to resumption of all regulatory activities. Regulatory authorities outside the United States may adopt similar restrictions or other policy measures in response to the COVID-19 pandemic. If a prolonged government shutdown occurs, or if global health concerns continue to prevent FDA or other regulatory authorities from conducting their regular inspections, reviews, or other regulatory activities, it could significantly impact the ability of FDA or other regulatory authorities to timely review and process our regulatory submissions, which could have a material adverse effect on our contractbusiness.
NexoBrid, EscharEx, our current pipeline product candidates or future product candidates may cause unanticipated and undesirable side effects or have other properties, which are currently unknown to us.
NexoBrid, EscharEx and all of our current pipeline product candidates rely on our patented enzymatic platform technology, although their specific formulations or mode of applications may vary. Like most pharmaceutical products, our approval labels for NexoBrid in Europe, Israel, Argentina, South Korea, Russia and Peru list certain side effects. If we or others identify previously unknown problems with NexoBrid, EscharEx or their underlying proteolytic enzymes, including adverse events of unanticipated severity or frequency, problems with our manufacturers or manufacturing processes, or failure to comply with regulatory requirements, the following consequences, among others, may result, including, without limitation:
restrictions on the marketing or manufacturing of the product, withdrawal of the product from the market or voluntary or mandatory product recalls;
fines, warning letters or holds on clinical trials;
harm to our reputation, reduced demand for our products and loss of market acceptance;
4
refusal by the applicable regulatory authority to approve pending applications or supplements to approved applications filed by us, or suspension or revocation of product license approvals;
product seizure or detention, or refusal to permit the import or export of products; and
injunctions or the imposition of civil or criminal penalties.
Any of these events could prevent us from achieving or maintaining market acceptance of NexoBrid, our pipeline product candidates or future product candidates, which would adversely affect our business, prospects, financial condition and results of operations.
Regulatory approval for NexoBrid, EscharEx and other pipeline product candidates is and may be limited to specific indications and conditions for which clinical safety and efficacy have been demonstrated, and the prescription off-label uses could adversely affect our business.
The marketing approval for NexoBrid in the European Union, Israel, Argentina, South Korea, Russia and Peru is limited to the treatment of deep partial- and full-thickness burns in adults. In addition, any additional regulatory approval of NexoBrid for severe burns and any regulatory approval we may receive for any of our pipeline product candidates in the future, would be limited to those specific indications for which such pipeline product candidate had been deemed safe and effective by the EMA, the FDA or another regulatory authority and, like the EMA marketing approval for NexoBrid, would be subject to a renewal examination five years after the marketing approval was extended for an additional five years during 2017. Additionally, labeling restrictions in EU limit the manner in which a product may be used. For example, NexoBrid’s label provides that it may only be used in specialized burns centers or by burn specialists and that it is not to be applied to more than 15% of the patient’s total body surface area. If physicians prescribe the medication for unapproved, or “off-label,” uses or in a manner that is inconsistent with the U.S. Biomedical Advanced Researchmanufacturer’s labeling, it could produce results such as reduced efficacy or other adverse effects, and Development Authoritythe reputation of our products in the marketplace may suffer. In addition, should any of our future products have a significant price difference and if they are used interchangeably, off-label uses may cause a decline in our revenues or potential revenues. Furthermore, while physicians may choose to fundprescribe treatments for uses that are not described in the product’s labeling and for uses that differ from those approved by regulatory authorities, we cannot promote the products for any indications other than those that are specifically approved by the EMA, the FDA or other regulatory authorities. Regulatory authorities restrict communications by companies on the subject of off-label use. If our Phase 3 pivotal studiespromotional activities fail to comply with these regulations or guidelines, we may be subject to enforcement actions by those authorities. In the United States, “off-label promotion” by pharmaceutical companies has resulted in significant litigation under the Federal False Claims Act, violations of which may result in substantial civil penalties and other development activitiesfines as well as exclusion from government health care programs. More generally, failure to follow the rules and guidelines of regulatory agencies relating to promotion and advertising, such as that promotional materials not be false or misleading, can result in refusal to approve a product, the suspension or withdrawal of an approved product from the market, product recalls, fines, disgorgement of money, operating restrictions, injunctions or criminal prosecution.
Although we have received orphan drug designation for NexoBrid in the United States and if we do not continue to receive funding under this contract,the European Union and other countries, we may needbe unable to obtain alternative sources of funding.maintain the benefits associated with such designations, including the potential for market exclusivity.
Similarly, in Europe, the European Commission grants orphan designation after receiving the opinion of the development costsEMA Committee for Orphan Medicinal Products on an application for orphan designation. Such orphan designation is available to products that are intended for the diagnosis, prevention or treatment of NexoBrid requiredlife-threatening or chronically debilitating conditions affecting not more than 5 in 10,000 persons in Europe and for which no satisfactory method of diagnosis, prevention, or treatment has been approved (or the product would be a significant benefit to obtain marketing approvalthose affected). Additionally, designation is granted for products intended for the diagnosis, prevention, or treatment of a life-threatening, seriously debilitating or serious and chronic condition and when, without incentives, it is unlikely that sales of the drug in Europe would be sufficient to justify the necessary investment in developing the drug. Orphan designation in the United States, including our ongoing pediatric phase 3 study and its expansionEU entitles a party to include U.S. pediatric burn care sites, and has an option to further fund $10 million in development activities for other potential NexoBrid indications. BARDA has also made a $16.5 million commitment for procurement of NexoBrid, which is contingent upon the U.S. FDA Emergency Use Authorization (EUA) and/or FDA marketing authorization for NexoBrid, and has a $50 million option for additional procurement of NexoBrid. However, the contract provides that BARDA may terminate the contract at any time, at its convenience, without any further funding obligations. There can be no assurances that BARDA will not terminate the contract. Changes in government budgets and agendas may result in a decreased and de‑prioritized emphasis on supporting the development of products for the treatment of severe burns such as NexoBrid. Although we have used a portion of our cash to fund our NexoBrid development program, any reduction or delay in BARDA funding may force us to suspend the program or seek alternative funding, which may not be available on non‑dilutive terms, terms favorable to us or at all. Further, we cannot provide any assurances as to when or whether BARDA’s option to fund additional development activities for NexoBrid will be exercised.
sponsor.
5
Orphan designation neither shortens the development time or regulatory review time of a product nor gives the product any advantage in the regulatory review or approval process. While we may seek additional orphan designations for applicable indications for our current and any future product candidates, we may never receive such designations. Even if we do receive such designations, there is no guarantee that we will enjoy the benefits of those designations.
We may rely on the Animal Rule in conducting trials, which could be time consuming and expensive.
To obtain FDA approval for our product candidates, we may obtain clinical data from trials in healthy human subjects that demonstrate adequate safety, and efficacy data from adequate and well-controlled animal studies under regulations issued by the FDA in 2002, often referred to as the “Animal Rule.” Among other requirements, the animal studies must establish that the drug or biological product is reasonably likely to produce clinical benefits in humans. If we use this approach we may not be able to sufficiently demonstrate this correlation to the satisfaction of the FDA, as these corollaries are difficult to establish and are often unclear. Because the FDA must agree that data derived from animal studies may be extrapolated to establish safety and effectiveness in humans, seeking approval under the Animal Rule may add significant interesttime, complexity and uncertainty to the testing and approval process. The FDA may decide that our data are insufficient for approval and require additional preclinical, clinical or other studies, refuse to approve our product candidates, or place restrictions on our ability to commercialize the products. In addition, products approved under the Animal Rule are subject to additional requirements, including post-marketing study requirements, restrictions imposed on marketing or distribution, or requirements to provide information to patients. Further, regulatory authorities in promoting changesother countries may not have established an “Animal Rule” equivalent, and, consequently, there can be no assurance that we will be able to make a submission for marketing approval in healthcare systemsforeign countries based on such animal data
Risks Related to the COVID-19 Pandemic
The COVID-19 pandemic could adversely impact our business, financial condition and results of operations.
The ongoing COVID-19 pandemic has spread throughout Israel where our headquarters and plant are located and in other areas where we have business operations. The spread of COVID-19 could have a negative impact on the value of the Company and on the ability of the Company to raise capital (privately or publicly), conduct strategic deals, and continue to conduct clinical trials in medical centers, and could cause us to suspend the recruitment of patients in studies that remain open. In addition, it could negatively affect our manufacturing operations and global supply chain. In response to the outbreak, we have taken various measures to date, including cost containment plan, executing a global remote work policy, reduction of work related travel, including for our field-based employees, reduction of all in-person meetings and interactions with the stated goalshealthcare community until further notice, leveraging virtual tools and digital communication technologies to continue important interactions with our employees, healthcare professionals, patients and other stakeholders, conducting remote site monitoring, transportation reimbursement and arranging additional shipments of containing healthcare costs, improving quality and/or expanding access.investigational product to sites and we have instituted additional practices, including alternating shifts, to help ensure the health and safety of our employees who work on critical tasks in our labs and manufacturing facility, as we continue to deliver medicines for patients. In addition, COVID-19 has had an adverse impact on and may continue to adversely impact the United States,expected timelines of our clinical studies and contribute to delays in obtaining regulatory approvals and in receiving governmental funding. For example, from March 2020 through May 2020, we temporarily suspended the pharmaceuticalinitiation of additional clinical sites and new patient enrollment in our U.S. EscharEx phase 2 study for the treatment of venous leg ulcers (“VLUs”), which resulted in slower recruitment rate than planned. In January 2021, due to COVID-19 related enrollment delays and potentially future pandemic related implications on the conduct of our clinical studies, we decided to accelerate this study by adjusting its enrollment target to 120 patients, down from the 174 originally planned. In addition, in many instances across the industry the FDA’s facility inspection schedule has been a particular focus of these efforts and has been significantly affected by major legislative initiatives. In March 2010, President Obama signed into lawCOVID-19-related travel restrictions, which may have adverse impact on the Patient Protection and Affordable Care Act, as amendedFDA’s ability to complete its review of the NexoBrid BLA by the Health CarePDUFA goal date. Additional government-imposed quarantines and Education Reconciliation Act,requirements to “shelter at home” or collectively,other incremental mitigation efforts also may impact our ability to source our products and products candidates in the Affordable Care Act, a sweeping law intended to broaden access to health insurance, reduce or constrain the growth of healthcare spending, enhance remedies against fraudfuture. These existing measures have disrupted, and abuse, add new transparency requirements for the healthcare and health insurance industries, impose new taxes and fees on the health industry and impose additional health policy reforms.
business, and may negatively impact our results of operations and financial position.
6
Our suppliers, including Challenge Bioproducts Corporation Ltd. (“CBC”), may be adversely impacted by the COVID-19 pandemic. As a result, we may face delays or difficulty sourcing components and drug substances for our products and product candidates, which could negatively affect our business and financial results. Even if we are able to find alternate sources for such components and drug substances, they may cost more, which could adversely impact our profitability and financial condition.
As the magnitude of the impact on global markets from COVID-19 is difficult to predict, the extent to which the pandemic may negatively affect our clinical and operational activities, operating results and financial condition is uncertain.
Risks Related to Manufacturing
If our manufacturing facility in Yavne, Israel were to suffer a serious accident, or if a force majeure event were to materially affect our ability to operate and produce NexoBrid, EscharEx and our pipeline product candidates, all of our manufacturing capacity could be shut down for an extended period.
We currently rely on a single manufacturing facility in Yavne, Israel, and we expect that all of our revenues in the current U.S. presidential administrationnear future will be derived from products manufactured at this facility. If this facility were to continuesuffer an accident or a force majeure event such as war, missile or terrorist attack, earthquake, major fire or explosion, major equipment failure or power failure lasting beyond the capabilities of our backup generators or similar event, our revenues would be materially adversely affected and any of our clinical trials could be materially delayed. In this situation, our manufacturing capacity could be shut down for an extended period, we could experience a loss of raw materials, work in process or finished goods inventory and our ability to seek amendmentsoperate our business would be harmed. In addition, in any such event, the reconstruction of our manufacturing facility and storage facilities, and obtaining regulatory approval for the new facilities could be time-consuming. During this period, we would be unable to manufacture NexoBrid or repealour pipeline product candidates. In addition, we currently have limited inventory of NexoBrid that we can supply to our customers in the Affordable Care Act.event that we are unable to further manufacture NexoBrid.
7
We are subject to a number of other legislative changes have been proposedmanufacturing risks, any of which could substantially increase our costs and adopted sincelimit supply of NexoBrid, EscharEx and our pipeline product candidates.
The process of manufacturing NexoBrid, EscharEx and our pipeline product candidates is complex, highly regulated and subject to the Affordable Care Act was enacted. These changes included aggregate reductions to Medicare payments to providersrisk of 2% per fiscal year, which went into effect in April 2013 and,product loss due to subsequent legislative amendments,contamination, equipment failure or improper installation or operation of equipment, or vendor or operator error. Even minor deviations from normal manufacturing processes or quality requirements for our products could result in reduced production yields, product defects and other supply disruptions. If microbial, viral or other contaminations are discovered in NexoBrid or our pipeline product candidates or in the manufacturing facilities in which NexoBrid or our pipeline product candidates are or will stay in effect through 2025 unless additional Congressional action is taken. In January 2013, President Obama signed into lawbe made, such manufacturing facilities may need to be closed to investigate and remedy the American Taxpayer Relief Actcontamination.
Although we have not experienced any contaminations, major equipment failures, or other similar manufacturing problems of 2012, which, among other things, further reduced Medicare payments to several providers, and increased the statute of limitations periodsuch magnitude, any adverse developments affecting manufacturing operations for the government to recover overpayments to providers from three to five years. These lawsNexoBrid or our pipeline product candidates may result in shipment delays, inventory shortages, lot failures, withdrawals or recalls, or other interruptions in the supply of NexoBrid or our pipeline product candidates. We may also have to take inventory write-offs and incur other charges and expenses for our products that fail to meet specifications, undertake costly remediation efforts, or seek more costly manufacturing alternatives.
Our ability to continue manufacturing and distributing our products depends on our continued adherence to GMP regulations.
The manufacturing processes for our products are governed by detailed cGMP regulations, both for our marketed products in the EU and product candidates in clinical testing in the U.S., EU and Israel. Failure by our manufacturing and quality operations unit to adhere to established regulations or to meet a specification or procedure set forth in cGMP requirements could require that a product or material be rejected and destroyed. Our adherence to cGMP regulations and the effectiveness of our quality control systems are periodically assessed through inspections of our manufacturing facility by regulatory authorities. Such inspections could result in deficiency citations, which would require us to take action to correct those deficiencies to the satisfaction of the applicable regulatory authorities. If critical deficiencies are noted or if we are unable to prevent recurrences, we may have to recall products or suspend operations until appropriate measures can be implemented. Since cGMP reflects ever-evolving standards, we need to regularly update our manufacturing processes and procedures to comply with cGMP. These changes may cause us to incur additional reductionscosts and may adversely impact our profitability. For example, more sensitive testing assays (if and when they become available, or due to the discontinuation of the availability of the disposables currently used in Medicareproduction) may be required, or existing procedures or processes may require revalidation, all of which may be costly and time-consuming and could delay or prevent the manufacturing of NexoBrid or launch of a new product.
We may not be able to expand our production or processing capabilities or satisfy future demand.
We are currently seeking to expand our manufacturing capabilities in order to increase our capacity to manufacture NexoBrid and future product candidates and satisfy near term demand. We cannot guarantee that we will be able to obtain the requisite approvals, including meeting regulatory and quality requirements, or the necessary capital resources for procuring this facility, or if we do, that the facility will satisfy additional growing demand. Conversely, there can be no assurance that even if we obtain a new facility, demand for our products will increase proportionately to the increased production capability. Furthermore, we cannot assure that this or similar projects will be implemented in a timely and cost efficient manner, and that our current production will not be adversely affected by the operational challenges of implementing the expansion project.
8
We depend on a sole supplier to obtain our intermediate drug substance, bromelain SP, which is necessary for the production of our products.
We currently procure bromelain SP, substance key starting material in the manufacturing of NexoBrid, EscharEx and our pipeline product candidates, from a single supplier, Challenge Bioproducts Corporation Ltd. (“CBC”). CBC’s manufacturing facilities are located in the Republic of China and it uses proprietary methods to manufacture bromelain SP. Our supply agreement with CBC has no fixed expiration date and can be voluntarily terminated by us, with at least six months’ advance written notice, or by CBC, with at least 24 months’ advance written notice. Although we have a contractual right to procure this material from other healthcare funding,suppliers, subject to payment of a one-time, non-material licensing fee to CBC, procuring this material from any other source would require time and effort which may interrupt our supply of bromelain SP and may cause an interruption of the supply of NexoBrid, EscharEx and our pipeline product candidates to the marketplace and for future clinical trials or other development purposes. Regulatory authorities could require that we conduct additional studies in support of a new supplier, which could result in significant additional costs or delays. Furthermore, there can be no assurance that we would be able to procure alternative supplies of bromelain SP at all or at comparable quality or competitive prices or upon fair and reasonable contractual terms and conditions. Although we believe that we currently store sufficient inventory of bromelain SP in our warehouse and CBC warehouse to continue full capacity operations for approximately two years, this inventory may prove insufficient, and any interruption or failure to source additional bromelain SP from CBC or other third parties in a timely manner, or at all, would adversely affect our business, prospects, financial condition and results of operations. In addition, if CBC experiences any closures and labor shortages as a result of the COVID-19 pandemic, we may face difficulty sourcing bromelain SP, which could negatively impact the market for NexoBrid andaffect our other product candidates, if approved, and, accordingly,revenues.
Risks Related to Commercialization
Our revenue growth is depending initially on our financial operations. There has been heightened governmental scrutiny recently over the manner in which drug manufacturers set prices for their marketed products, which have resulted in several Congressional inquiries and proposed bills designedability to among other things, bring more transparency to product pricing, review the relationship between pricing and manufacturer patient programs, and reform government program reimbursement methodologies for drug products.commercialize NexoBrid.
We expect that other possible healthcare reform measures may resultare currently marketing a single product, NexoBrid, a concentrate of proteolytic enzymes enriched in additional reductionsbromelain, based on our patented enzymatic platform technology, which has been approved for marketing in Medicare and other healthcare funding, more rigorous coverage criteria, new payment methodologies and additional downward pressure on the price that we receive for any approved product. Any reduction in reimbursement from Medicare or other government programs may result in a similar reduction in payments from private payors. The implementation of cost containment measures or other healthcare reforms may prevent us from being able to generate revenue, attain profitability, or commercialize our drugs.
The commercial success of NexoBrid, EscharEx and our pipeline product candidates will depend upon their degree of market acceptance.
NexoBrid, EscharEx and our pipeline product candidates may not gain market acceptance by physicians and their teams, healthcare payors, patients and others in the medical community. Although many physicians in burn centers throughout Europe, the United States and other international markets have used NexoBrid for severe burns as part of our clinical trials or since NexoBrid’s commercial launch in Europe, Israel, Argentina, South Korea and Israel,Russia, we cannot guarantee that use of NexoBrid will be accepted in the market. We need to successfully integrate NexoBrid into the overall treatment of burns in burn centers. If we are unable to successfully commercialize NexoBrid in Europe, sales of NexoBrid will be severely affected, which will have a material adverse effect on our business, financial condition and results of operations. If NexoBrid, EscharEx and our pipeline product candidates do not achieve an adequate level of acceptance, we may not generate revenue and we may not achieve or sustain profitability. The degree of market acceptance of NexoBrid in Europe, Israel, Argentina, South Korea, Russia and ArgentinaPeru, and ifin other countries where we receive marketing approval, in other countries and of EscharEx and our pipeline product candidates, will depend on a number of factors, some of which are beyond our control, including:
the willingness of physicians, burn care teams and hospital administrators to administer our products and the acceptance of our products as part of the medical department routine;
the consent of hospitals to fund/purchase NexoBrid or obtain third-party coverage or reimbursement for our products;
the ability to offer NexoBrid, EscharEx and our pipeline product candidates for sale at an attractive value;
the efficacy and potential advantages of NexoBrid, EscharEx and our pipeline product candidates relative to current standard of care;
the prevalence and severity of any side effects; and
the efficacy, potential advantages and timing of introduction to the market of alternative treatments.
Failure to achieve market acceptance for NexoBrid, EscharEx or any of our pipeline product candidates, if and when they are approved for commercial sale, will have a material adverse effect on our business, financial condition and results of operations.
We may be unsuccessful in commercializing our products due to unfavorable pricing regulations or third‑partythird-party coverage and reimbursement policies.
While we are executing a country‑specificcountry-specific market access strategy, which includes pricing and/or reimbursement targets for NexoBrid in most of Europe, we cannot guarantee that we will receive favorable hospital, regional or national funding or pricing and reimbursement. Additionally, we cannot predict the pricing and reimbursement of NexoBrid, EscharEx or our pipeline product candidates in any other jurisdiction.candidates. The regulations that govern marketing approvals, pricing and reimbursement for new products vary widely from country to country, among regions within some countries and among some hospitals. In some foreign jurisdictions, including the European Union, the pricing of prescription pharmaceuticals is subject to governmental control. In other countries, coverage negotiations must occur at the regional or hospital level in order to be included in the hospital formulary. Pricing negotiations with governmental authorities at the regional or hospital level can take considerable time after the receipt of marketing approval for a product candidate.
As a result, even after obtaining regulatory approval for a product in a particular country, we may be subject to price regulations or denied or limited by reimbursement or formulary inclusion, which may delay or limit our commercial launch of the product and negatively impact the revenue we are able to generate from the sale of the product in that country. Adverse pricing limitations may hinder our ability to recoup our investment in NexoBrid, EscharEx or our pipeline product candidates, even after obtaining regulatory approval.
Additionally, we cannot be sure that coverage and reimbursement will be available for NexoBrid, EscharEx or any pipeline product candidate that we commercialize in the future, and, if reimbursement is available, whatwhether the level of reimbursement will be.be adequate. Coverage and reimbursement may affect the demand for, the price of, or the budget allocated for reimbursement for any product for which we obtain marketing approval. Obtaining coverage and adequate reimbursement for our products may be particularly difficult because of the higher prices often associated with products administered under the supervision of a physician. If coverage and reimbursement are not available or are available only at limited levels, we may not be able to successfully commercialize NexoBrid, EscharEx or any pipeline product candidate that we successfully develop. Eligibility for reimbursement does not guarantee that any product will be paid for in all cases or at a rate that covers our costs. Interim payments for new products, if applicable, may also not be sufficient to cover our costs and may not be made permanent. Payment rates may vary according to the use of the product and the clinical setting in which it is used, may be based on payments allowed for lower cost products that are already reimbursed and may be incorporated into existing payments for other services. Net prices for products may be reduced by mandatory discounts or rebates required by government healthcare programs or private payors and by any future relaxation of laws that presently restrict imports of products from countries where they may be sold at lower prices than in certain other countries, such as the United States. In the United States, third‑partythird-party payors often rely on the coverage policies and payment limitations imposed by Medicare and other government payors, in setting their own coverage policies and reimbursement rates. Our inability to promptly obtain coverage and profitable payment rates from hospital budget, government‑fundedgovernment-funded and private payors for NexoBrid, EscharEx or any pipeline product candidate could have a material adverse effect on our operating results, our ability to raise capital needed to commercialize products and our overall financial condition.
Recently enacted and future legislation may increase the difficulty and cost for us to obtain marketing approval for and, if approved, commercialize our product candidates in the United States and affect the prices at which our products may be sold.
The United States and several other jurisdictions are considering, or have already enacted, a number of legislative and regulatory proposals to change the healthcare system in ways that may affect our ability to sell NexoBrid, EscharEx or any of our pipeline product candidates profitably, if approved. We cannot predict the initiatives that may be adopted in the future. The continuing efforts of hospitals, governments, insurance companies, managed care organizations and other payors of healthcare services to contain or reduce costs of healthcare may adversely affect:
the market acceptance or demand for NexoBrid, EscharEx or any of our pipeline product candidates, if approved;
the ability to set a price that we believe is fair for NexoBrid, EscharEx or any of our pipeline product candidates, if approved;
our ability to generate revenues and achieve or maintain profitability;
the level of taxes that we are required to pay; and
the availability of capital.
Among policy makers and payors in the United States and elsewhere, there is significant interest in promoting changes in healthcare systems with the stated goals of containing healthcare costs, improving quality and/or expanding access. In the United States, the pharmaceutical industry has been a particular focus of these efforts and has been significantly affected by major legislative initiatives. In March 2010, the Patient Protection and Affordable Care Act, as amended by the Health Care and Education Reconciliation Act, or collectively, the Affordable Care Act, or ACA, was signed into law and intended to broaden access to health insurance, reduce or constrain the growth of healthcare spending, enhance remedies against fraud and abuse, add new transparency requirements for the healthcare and health insurance industries, impose new taxes and fees on the health industry and impose additional health policy reforms.
Among the provisions of the ACA of importance to our potential product candidates are the following:
an annual, nondeductible fee on any entity that manufactures or imports certain branded prescription drugs and biologic agents, apportioned among these entities according to their market share in certain government healthcare programs;
an increase in the statutory minimum rebates a manufacturer must pay under the Medicaid Drug Rebate Program to 23.1% and 13.0% of the average manufacturer price for branded and generic drugs, respectively;
addressed a new methodology by which rebates owed by manufacturers under the Medicaid Drug Rebate Program are calculated for drugs that are inhaled, infused, instilled, implanted or injected;
a new Medicare Part D coverage gap discount program, in which manufacturers must agree to offer 70% point-of-sale discounts off negotiated prices of applicable brand drugs to eligible beneficiaries during their coverage gap period, as a condition for the manufacturer’s outpatient drugs to be covered under Medicare Part D;
extension of manufacturers’ Medicaid rebate liability to covered drugs dispensed to individuals who are enrolled in Medicaid managed care organizations;
expansion of eligibility criteria for Medicaid programs by, among other things, allowing states to offer Medicaid coverage to additional individuals and by adding new mandatory eligibility categories for certain individuals with income at or below 133% of the Federal Poverty Level, thereby potentially increasing manufacturers’ Medicaid rebate liability;
expansion of the entities eligible for discounts under the Public Health Service pharmaceutical pricing program;
a new requirement to annually report drug samples that manufacturers and distributors provide to physicians; and
a new Patient-Centered Outcomes Research Institute to oversee, identify priorities in, and conduct comparative clinical effectiveness research.
There remain judicial and congressional challenges to certain aspects of the ACA, as well as efforts by the current U.S. presidential administration to amend or repeal of the ACA. For example, the Tax Cuts and Jobs Act of 2017 includes a provision repealing, effective January 1, 2019, the tax-based shared responsibility payment imposed by the Affordable Care Act on certain individuals who fail to maintain qualifying health coverage for all or part of a year that is commonly referred to as the “individual mandate.” On December 14, 2018, a U.S. District Court Judge in the Northern District of Texas, ruled that the individual mandate is a critical and inseverable feature of the Affordable Care Act, and therefore, because it was repealed as part of the Tax Act, the remaining provisions of the Affordable Care Act are invalid as well. The 2020 federal spending package permanently eliminated, effective January 1, 2020, the Affordable Care Act mandated “Cadillac” tax on high-cost employer-sponsored health coverage and medical device tax and, effective January 1, 2021, also eliminates the health insurer tax. Additionally, on December 18, 2019, the U.S. Court of Appeals for the 5th Circuit upheld the District Court ruling that the individual mandate was unconstitutional and remanded the case back to the District Court to determine whether the remaining provisions of the ACA are invalid as well. The U.S. Supreme Court is currently reviewing the case, although it is unclear how the Supreme Court will rule. It is also unclear how other efforts to challenge, repeal or replace the ACA will impact the ACA or our business. Congress may consider other legislation to repeal or replace elements of the ACA in the future. We cannot predict what legislation, if any, to repeal or replace the ACA will become law, or what impact any such legislation may have on our product candidate.
11
In addition, other legislative changes have been proposed and adopted since the Affordable Care Act was enacted. These changes included aggregate reductions to Medicare payments to providers of 2% per fiscal year, which went into effect in April 2013 and, due to subsequent legislative amendments, will stay in effect through 2030, with the exception of a temporary suspension from May 1, 2020 through March 31, 2021, unless additional Congressional action is taken. In January 2013, President Obama signed into law the American Taxpayer Relief Act of 2012, which, among other things, further reduced Medicare payments to several providers, and increased the statute of limitations period for the government to recover overpayments to providers from three to five years. These laws may result in additional reductions in Medicare and other healthcare funding, which could negatively impact the market for NexoBrid and our other product candidates, if approved, and, accordingly, our financial operations.
There has been heightened governmental scrutiny recently over the manner in which drug manufacturers set prices for their marketed products, which have resulted in several Congressional inquiries and proposed bills designed to, among other things, bring more transparency to product pricing, review the relationship between pricing and manufacturer patient programs, and reform government program reimbursement methodologies for drug products. The likelihood of implementation of any of these reform initiatives is uncertain, particularly in light of the new incoming Presidential administration. At the state level, legislatures have increasingly passed legislation and implemented regulations designed to control pharmaceutical and biological product pricing, including price or patient reimbursement constraints, discounts, restrictions on certain product access and marketing cost disclosure and transparency measures, and, in some cases, designed to encourage importation from other countries and bulk purchasing.
We expect that other possible healthcare reform measures may result in additional reductions in Medicare and other healthcare funding, more rigorous coverage criteria, new payment methodologies and additional downward pressure on the price that we receive for any approved product. Any reduction in reimbursement from Medicare or other government programs may result in a similar reduction in payments from private payors. The implementation of cost containment measures or other healthcare reforms may prevent us from being able to generate revenue, attain profitability, or commercialize our drugs.
Legislative and regulatory proposals have been made to expand post-approval requirements and restrict sales and promotional activities for drugs. We cannot be sure whether additional legislative changes will be enacted, or whether the FDA regulations, guidance or interpretations will be changed, or what the impact of such changes on the marketing approvals of our product candidates, if any, may be. In addition, increased scrutiny by the U.S. Congress of the FDA’s approval process may significantly delay or prevent marketing approval, as well as subject us to more stringent product labeling and post-marketing testing and other requirements.
We face competition from the existing standard of care, and we are furthermore subject to the risk that potential changes in medical practice and technology, or the development by our competitors of products, treatments or procedures that are similar, more advanced, safer or more effective than ours, will render our product candidates obsolete.
The medical, biotechnology and pharmaceutical industries are intensely competitive and subject to significant technological and practice changes. We may face competition from many different sources with respect to NexoBrid, our pipeline product candidates or any product candidates that we may seek to develop or commercialize in the future. Possible competitors may be medical practitioners, pharmaceutical and wound care companies, academic and medical institutions, governmental agencies and public and private research institutions, among others. Should any competitor’s product candidates receive regulatory or marketing approval prior to ours, they may establish a strong market position and be difficult to displace, or may diminish the need for our products.
12
Our success will depend initially oncommercial opportunity could be reduced or eliminated if our abilitycompetitors develop and commercialize products, treatments or procedures that are safer, more effective, have fewer or less severe side effects, are more convenient or are less expensive than any product that we may develop. In addition, we face competition from the current standard of care for eschar removal in severe burns, which includes surgery, where eschar removal can occur by tangential excision, dermabrasion or hydro jet, and non-surgical alternatives, such as topical medications applied to commercialize NexoBridthe eschar to facilitate the natural healing process. In chronic and other hard-to-heal wounds, we expect to face competition from current standard of care for debridement via sharp debridement or from the current non-surgical standard of care, either enzymatic debridement, primarily Smith & Nephew Plc’s Santyl, a collagenase-based product indicated for debriding chronic dermal ulcers and severely burned areas, or autolytic debridement.
Many of our current or future competitors may have significantly greater financial resources and expertise in Europe.research and development, manufacturing, preclinical testing, conducting clinical trials, obtaining regulatory approvals and marketing approved products than we may have. Mergers and acquisitions in the pharmaceutical and biotechnology industries or wound care markets may result in even more resources being concentrated among a smaller number of our competitors. For example, Healthpoint Biotherapeutics, which marketed Santyl, was acquired by Smith & Nephew Plc in 2012. Smaller and other early stage companies may also prove to be significant competitors, particularly through collaborative arrangements with large and established companies. These companies compete with us in recruiting and retaining qualified scientific and management personnel, establishing clinical trial sites and patient registration for clinical trials, as well as in acquiring technologies complementary to, or necessary for, our programs
Risks Related to Our Financial Position and Need for Additional Capital
We are currently marketing a single product, NexoBrid, baseddependent on our patented proteolytic enzyme technology, whichcontract with BARDA to fund our development activities for NexoBrid in the United States and to procure from us NexoBrid (and to thereby provide us with revenues). If we do not continue to receive funding under this contract, we may need to obtain alternative sources of funding. In addition, if BARDA will suspend or terminate its procurement obligation of NexoBrid it will adversely impact our future revenues.
We have a contract with BARDA, valued at up to $159 million, for the advancement of the development and manufacturing, as well as the procurement, of NexoBrid in the United States (the “First BARDA Contract”). Under the First BARDA Contract, BARDA has already been approved byagreed to fund $82 million of the EMAdevelopment costs of NexoBrid required to obtain marketing approval in the United States and the Israeliemergency readiness for NexoBrid deployment. Under the First BARDA Contract, BARDA began procurement valued at $16.5 million of NexoBrid from us for emergency stockpile as part of the HHS mission to build national preparedness for public health medical emergencies. In August 2020, BARDA accepted the first shipment of NexoBrid. We expect that additional deliveries will occur through the end of 2021. The First BARDA Contract also includes options for BARDA (i) to further fund $10 million in development activities for other potential NexoBrid indications, and Argentinean Ministries(ii) to further fund $50 million for additional procurement of Health for marketingNexoBrid from us.
However, BARDA may terminate the contract at any time, at its convenience, without any further funding obligations. There can be no assurances that BARDA will not terminate the contract. Changes in government budgets and agendas may result in a decreased and de-prioritized emphasis on supporting the European Union, Israel and Argentina, respectively,development of products for the treatment of adults with deep partial‑severe burns such as NexoBrid and full‑thickness burns,the cessation of the procurement. Any reduction or delay in BARDA funding may force us to suspend the program or seek alternative funding, which may not be available on non-dilutive terms, terms favorable to us or at all. Further, we refercannot provide any assurances as to as severe burns. NexoBrid is not currently approvedwhen or whether BARDA’s commitment for marketing in any other jurisdiction, including the United States, and has not been approved for any other indication or for use in children. We launched NexoBrid in Europe in 2014, in Israel in 2015, and in Argentina, through our local distributor in 2016. In November 2017, the European Commission granted a five‑year renewal of our NexoBrid marketing authorization. We anticipate that, for at least the next several years, our ability to generate revenues and become profitable will depend on the commercial successprocurement of NexoBrid in these markets.
We have a history of net losses. We expect to continue to incur substantial and increasing net losses for the foreseeable future, and we may never achieve or maintain profitability.
13
We expect to incur significant expenses and increasing operating losses for the foreseeable future.
We anticipate that our expenses and future capital requirements may increase if and as we:
accelerate our clinical development activities, particularly with respect to our clinical development of EscharEx for the debridement of chronic and other hard-to-heal wounds and our clinical trials for our other pipeline product candidates;
further scale-up the manufacturing process for NexoBrid;
seek regulatory and marketing approvals for NexoBrid and any pipeline product candidate that successfully completes clinical trials;
initiate additional preclinical, clinical or other studies for NexoBrid, EscharEx and our pipeline product candidates, and seek to identify and validate new products;
commercialize NexoBrid and any pipeline product candidates for which we obtain marketing approval;
acquire rights to other product candidates and technologies;
change or add suppliers;
maintain, expand and protect our intellectual property portfolio;
attract and retain skilled personnel; and
experience any delays or encounter issues with any of the above.
We may need substantial additional capital in the future, which may cause dilution to our existing shareholders, restrict our operations or require us to relinquish rights to our pipeline product candidates or intellectual property. If additional capital is not available, we may have to delay, reduce or cease operations.
We may seek additional funding in the future, which may consist of equity offerings, collaborations, licensing arrangements or any other means to develop our pipeline product candidates, increase our commercial manufacturing capabilities, operate our sales and marketing capabilities or other general corporate purposes. Under our shelf registration statement on Form F-3, we may offer from time to time up to $125 million in the aggregate of our ordinary shares, warrants and/or debt securities in one or more series or issuances. In February 2020, we entered into an Open Market Sales Agreement with Jefferies LLC to issue and sell our ordinary shares with gross sales proceeds of up to $15 million, from time to time, through an at the market offering under which Jefferies LLC will act as our sales agent. As of the date hereof, we have not issued or sold any ordinary shares pursuant to the Open Market Sales Agreement. Our prior registered equity offerings diluted then-existing shareholders, and to the extent that we raise additional capital through, for example, the sale of equity or convertible debt securities under our shelf registration statement, our existing shareholders’ ownership interest will be further diluted, and the terms may include liquidation or other preferences that adversely affect our shareholders’ rights. The incurrence of indebtedness or the issuance of certain equity securities could result in increased fixed payment obligations and could also result in certain restrictive covenants, such as limitations on our ability to incur additional debt or to issue additional equity, limitations on our ability to acquire or license intellectual property rights and other operating restrictions that could adversely impact our ability to conduct our business. In addition, the issuance of additional equity securities by us, or the possibility of such issuance, may cause the market price of our ordinary shares to decline. Securing additional financing may also divert our management’s attention from our day-to-day activities, which may adversely affect our ability to develop and commercialize NexoBrid, EscharEx and our pipeline product candidates.
14
Additional funding may not be available to us on acceptable terms, or at all. In the event that we enter into collaborations or licensing arrangements in order to raise capital, we may be required to accept unfavorable terms, including relinquishing or licensing to a third party on unfavorable terms our rights to product candidates or intellectual property that we otherwise would seek to develop or commercialize ourselves or reserve for future potential arrangements when we might be able to achieve more favorable terms.
If we are unable to raise additional capital when required or on acceptable terms, we may be required to:
delay, scale back or discontinue the development, manufacturing scale-up or commercialization of NexoBrid, EscharEx or our pipeline product candidates;
seek additional corporate partners for NexoBrid, EscharEx or one or more of our pipeline product candidates on terms that are less favorable than might otherwise be available; or
relinquish or license to additional parties, on unfavorable terms, our rights to NexoBrid, EscharEx or our pipeline product candidates that we otherwise would seek to develop or commercialize ourselves.
any such consequence will have a material adverse effect on our business, operating results and prospects and on our ability to develop our pipeline product candidates.
If we fail to manage our growth effectively, our business could be disrupted.
Our future financial performance and ability to successfully commercialize our products and to compete effectively will depend, in part, on our ability to manage any future growth effectively. We have made and expect to continue to make significant investments to enable our future growth through, among other things, new product development, clinical trials for new indications, expansion of our marketing and sales infrastructure and continues exploring for potential business development opportunities. While we believe that our current manufacturing capacity is sufficient to meet the expected near-term commercial demand for NexoBrid, we are planning to scale-up the current capacity by end of 2022, subject to successful authorities’ cGMP audit, and which we believe will cost approximately $8-10 million. We must also be prepared to expand our work force and train, motivate and manage additional employees as the need for additional personnel arises. Even following expansion, our facilities, personnel, systems, procedures and controls may not be adequate to support our future operations, or we may expand, but then fail to grow our sales of NexoBrid or our pipeline product candidates sufficiently to support such operational growth. Any failure to manage future growth effectively could have a material adverse effect on our business and results of operations.
We make business decisions based on forecasts of future sales of our products and pipeline product candidates that may be inaccurate.
Our market estimates are based on many assumptions, including, but not limited to, reliance on external market research, our own internal research, population estimates, estimates of disease diagnostic rates, treatment trends, and market estimates by third parties. Any of these assumptions can materially impact our forecasts and we cannot be assured that the assumptions are accurate. If the market for any of our products or product candidates is less than this data would suggest, the potential sales for the product or pipeline product candidates in question could be adversely affected, and our inventories and net losses could increase.
Because of the numerous risks and uncertainties associated with biopharmaceutical product development and commercialization, we are unable to accurately predict the timing or amount of future expenses or when, or if, we will be able to achieve or maintain profitability. We have financed our operations primarily through the sale of equity securities, licensing agreements and government grants. The size of our future net losses will depend, in part, on the rate of growth or contraction of our expenses and the level and rate of growth, if any, of our revenues. If we are unable to successfully commercialize NexoBrid, EscharEx or one or more of our pipeline product candidates or if revenue from NexoBrid, EscharEx or any pipeline product candidate that receives marketing approval is insufficient, we will not achieve profitability. Even if we do achieve profitability, we may not be able to sustain or increase profitability.
Exchange rate fluctuations between the U.S. dollar and the Israeli shekel, the Euro and other non‑U.S.non-U.S. currencies may negatively affect our earnings.
The dollar is our functional and reporting currency. However, a significant portion of our operating expenses are incurred in Israeli shekels and Euros. As a result, we are exposed to the risks that the shekel may appreciate relative to the dollar, or, if the shekel instead devalues relative to the dollar, that the inflation rate in Israel may exceed such rate of devaluation of the shekel, or that the timing of such devaluation may lag behind inflation in Israel. In any such event, the dollar cost of our operations in Israel would increase and our dollar‑denominateddollar-denominated results of operations would be adversely affected. We cannot predict any future trends in the rate of inflation in Israel or the rate of devaluation (if any) of the shekel against the dollar. For example, the dollar depreciated relative to the shekel by 9.8% and 1.5% in 2017 and 2016, respectively, while the dollar appreciated relative to the dollar by 7.0% and 7.8% in 2020 and 2019, respectively, while the shekel devalued relative to the dollar by 0.3%8.1% in 2015.2018. If the dollar or Euro cost of our operations in Israel increases, our dollar‑dollar- and Euro‑measuredEuro-measured results of operations will be adversely affected. Our operations also could be adversely affected if we are unable to effectively hedge against currency fluctuations in the future.
15
To the extent that we may receive revenues from sales in certain countries, such as certain countries in the Asia Pacific region, where our sales are expected to be denominated in dollars, a strengthening of the dollar in relation to other currencies could make our products less competitive in those foreign markets and collection of receivables more difficult. For further information, see “ITEM 11. Quantitative and Qualitative Disclosures About Market Risk” elsewhere in this annual report.
Risks Related to Healthcare Laws and Other Legal Compliance Matters
Certain of our business practices could become subject to scrutiny by regulatory authorities, as well as to lawsuits brought by private citizens. Failure to comply with applicable law or an adverse decision in lawsuits may result in adverse consequences to us.
The laws governing our conduct in the United States are enforceable by criminal, civil and administrative penalties. Violations of laws such as the Federal Food, Drug and Cosmetic Act (the “FDCA”), the Public Health Service Act, the Federal False Claims Act, provisions of the U.S. Social Security Act, including the “Anti‑Kickback“Anti-Kickback Statute,” or any regulations promulgated under their authority, may result in varioussignificant administrative, civil and criminal sanctions, jail sentences, fines or exclusion from federal and state programs, as may be determined by the U.S. Department of Justice, the Office of Inspector General of the U.S. Department of Health and Human Services (the “OIG”), the Centers for Medicare & Medicaid Services, ("CMS") other regulatory authorities and the courts. There can be no assurance that our activities will not come under the scrutiny of regulators and other government authorities or that our practices will not be found to violate applicable laws, rules and regulations or prompt lawsuits by private citizen “relators” under federal or state false claims laws.
The federal Anti‑KickbackAnti-Kickback Statute prohibits, among other things, knowingly and willfully offering, paying, soliciting or receiving any remuneration (including any kickback, bribe or rebate), directly or indirectly, overtly or covertly, to induce or in return for purchasing, leasing, ordering or arranging for or recommending the purchase, lease or order of any good, facility, item or service reimbursable, in whole or in part, under Medicare, Medicaid or other federal healthcare programs. The term “remuneration” has been broadly interpreted to include anything of value. Although there are a number of statutory exceptions and regulatory safe harbors protecting some common activities from prosecution, the exceptions and safe harbors are drawn narrowly. Practices that involve remuneration that may be alleged to be intended to induce prescribing, purchases or recommendations may be subject to scrutiny if they do not qualify for an exception or safe harbor.
For example, even common business arrangements, such as discounted terms and volume incentives for customers in a position to recommend or choose drugs and devices for patients, such as physicians and hospitals, can result in substantial legal penalties, including, among other things, exclusion from Medicare and Medicaid programs if not carefully structured to comply with applicable requirements. Also, certain business practices, such as payment of consulting fees to healthcare providers, sponsorship of educational or research grants, charitable donations, interactions with healthcare providers and financial support for continuing medical education programs, must be conducted within narrowly prescribed and controlled limits to avoid any possibility of unlawfully inducing healthcare providers to prescribe or purchase particular products or rewarding past prescribing. Failure to meet all of the requirements of a particular applicable statutory exception or regulatory safe harbor does not make the conduct per se illegal under the Anti‑KickbackAnti-Kickback Statute. Instead, the legality of the arrangement will be evaluated on a case‑by‑casecase-by-case basis based on a cumulative review of all its facts and circumstances. Several courts have interpreted the statute’s intent requirement to mean that if any one purpose of an arrangement involving remuneration is to induce referrals of federal healthcare covered business, the Anti‑KickbackAnti-Kickback Statute has been violated. In addition, a person or entity does not need to have actual knowledge of the statute or specific intent to violate it in order to have committed a violation. Violations of the federal Anti-Kickback Statute may result in significant civil monetary penalties for each violation, plus up to three times the remuneration involved. Moreover, a claim including items or services resulting from a violation of the federal Anti‑KickbackAnti-Kickback Statute constitutes a false or fraudulent claim for purposes of the federal civil False Claims Act.
Accordingly, civil penalties for such conduct can further be assessed under the federal False Claims Act. Violations can also result in criminal penalties, including criminal fines and imprisonment. Similarly, violations can result in exclusion from participation in government healthcare programs, including Medicare and Medicaid.
16
Significant enforcement activity has also taken place under federal and state false claims act statutes. Violations of the federal False Claims Act can result in treble damages, and a penalty of up to $21,563 for each false claim submitted for payment. Several pharmaceutical,Pharmaceutical, device and other healthcare companies have been prosecuted under these laws for, among other things, allegedly providing free product to customers with the expectation that the customers would bill federal programs for the product. Other companiesCompanies have been prosecuted for causing false claims to be submitted because of the companies’ marketing of products for unapproved, and thus non‑covered,non-covered, uses. The government may further prosecute conduct constituting a false claim under the criminal False Claims Act. The criminal False Claims Act prohibits the making or presenting of a claim to the government knowing such claim to be false, fictitious, or fraudulent and, unlike the civil False Claims Act, requires proof of intent to submit a false claim.
The federal False Claims Act, as well as certain state false claims acts, also permits relators to file complaints in the name of the United States (and if applicable, particular states). These relators may be entitled to receive up to 30% of total recoveries and have been active in pursuing cases against pharmaceutical companies. Where practices have been found to involve improper incentives to use products, the submission of false claims, or other improper conduct, government investigations and assessments of penalties against manufacturers have resulted in substantial damages and fines. In addition, to avoid exclusion from participation in federal healthcare programs, many manufacturers have been required to enter into Corporate Integrity Agreements that prescribe allowable corporate conduct and impose reporting and disclosure obligations by the manufacturer to the government. Failure to satisfy requirements under the FDCA can also result in a variety of administrative, civil and criminal penalties, including injunctions or consent decrees that prescribe allowable corporate conduct.
The federal Health Insurance Portability and Accountability Act of 1996, or HIPAA, created additional federal criminal statutes that prohibit, among other things, knowingly and willfully executing, or attempting to execute, a scheme to defraud any healthcare benefit program, including private third‑partythird-party payors, knowingly and willfully embezzling or stealing from a healthcare benefit program, willfully obstructing a criminal investigation of a healthcare offense, and knowingly and willfully falsifying, concealing or covering up a material fact or making any materially false, fictitious or fraudulent statement in connection with the delivery of or payment for healthcare benefits, items or services. Like the Anti‑KickbackAnti-Kickback Statute, the Affordable Care Act amended the intent standard for certain healthcare fraud statutes under HIPAA such that a person or entity no longer needsdoes not need to have actual knowledge of the statute or specific intent to violate it in order to have committed a violation. HIPAA, as amended by the Health Information Technology for Economic and Clinical Health (“HITECH”) Act and its implementing regulations, also imposes obligations, including mandatory contractual terms, on covered entities and their respective business associates that create, receive, maintain or transmit individually identifiable health information for or on their behalf, with respect to safeguarding the privacy, security and transmission of individually identifiable health information.
Additionally, there has been a recent trend of increased federal and state regulation of payments and transfers of value provided to healthcare professionals and/or entities. The Affordable Care Act, among other things, imposed annual reporting requirements on certain manufacturers of drugs, devices, biologicals and medical supplies for payments and other transfers of value provided by them, directly or indirectly, to physicians (defined to include doctors, dentists, optometrists, podiatrists and chiropractors), certain other healthcare professionals beginning in 2022, and teaching hospitals, as well as ownership and investment interests held by physicians and their family members. A manufacturer’s failure to submit timely, accurately and completely the required information for all payments, transfers of value or ownership or investment interests may result in significant civil monetary penalties of up to an aggregate of $150,000 per year, and up to an aggregate of $1 million per year for “knowing failures.” Any failure to comply could result in significant fines and penalties.
In addition, we are subject to analogous state and foreign laws and regulations, such as state anti‑kickbackanti-kickback and false claims laws, which may apply to sales or marketing arrangements and claims involving healthcare items or services reimbursed by non‑governmental third‑partynon-governmental third-party payors, including private insurers; state and foreign laws that require pharmaceutical companies to comply with the pharmaceutical industry’s voluntary compliance guidelines and the relevant compliance guidance promulgated by the federal government or otherwise restrict payments that may be made to healthcare providers; state and foreign laws that require drug manufacturers to report information related to payments and other transfers of value to physicians and other healthcare providers or marketing expenditures; state and local laws requiring the registration of pharmaceutical sales representatives, and state and foreign laws governing the privacy and security of health information in certain circumstances. Many of these laws differ from each other in significant ways and often are not preempted by the U.S. Health Insurance Portability and Accountability Act of 1996HIPAA thus complicating compliance efforts. For example, the California Consumer Privacy Act, or CCPA, which went into effect on January 1, 2020, among other things, creates new data privacy obligations for covered companies and provides new privacy rights to California residents, including the right to opt out of certain disclosures of their information. The CCPA also creates a private right of action with statutory damages for certain data breaches, thereby potentially increasing risks associated with a data breach. Although the law includes limited exceptions, including for “protected health information” maintained by a covered entity or business associate, it may regulate or impact our processing of personal information depending on the context. Further, the California Privacy Rights Act (CPRA) recently passed in California. The CPRA will impose additional data protection obligations on covered businesses, including additional consumer rights processes, limitations on data uses, new audit requirements for higher risk data, and opt outs for certain uses of sensitive data. It will also create a new California data protection agency authorized to issue substantive regulations and could result in increased privacy and information security enforcement. The majority of the provisions will go into effect on January 1, 2023, and additional compliance investment and potential business process changes may be required.
17
Efforts to ensure that our business arrangements with third parties will comply with applicable healthcare laws and regulations may involve substantial costs. It is possible that governmental authorities will conclude that our business practices do not comply with current or future statutes, regulations or case law involving applicable fraud and abuse or other healthcare laws and regulations. If our operations are found to be in violation of any of these laws or any other governmental regulations that may apply to us, we may be subject to significant civil, criminal and administrative penalties, including, without limitation, damages, fines, imprisonment, exclusion from participation in government healthcare programs, such as Medicare and Medicaid, and the curtailment or restructuring of our operations, which could have a material adverse effect on our business. If any of the physicians or other healthcare providers or entities with whom we expect to do business is found not to be in compliance with applicable laws, it may be subject to criminal, civil or administrative sanctions, including exclusions from participation in government healthcare programs, which could also materially affect our business.
As a public company with securities registered under the U.S. Securities Exchange Act of 1934, as amended (the “Exchange Act”), we are subject to the U.S. Foreign Corrupt Practices Act (the “FCPA”). The FCPA and similar worldwide anti‑briberyanti-bribery laws generally prohibit companies and their intermediaries from making improper payments to officials for the purpose of obtaining or retaining business. While we continue to maintain and enhance internal policies mandating compliance with these anti‑briberyanti-bribery laws, we may operate in parts of the world that have experienced governmental corruption to some degree and in certain circumstances, strict compliance with anti‑briberyanti-bribery laws may conflict with local customs and practices or may require us to interact with doctors and hospitals, some of which may be state controlled, in a manner that is different than in the United States. Our internal control policies and procedures may not be sufficient to effectively protect us against reckless or criminal acts committed by our employees or agents. Violations of these laws, or allegations of such violations, could disrupt our business and result in a material adverse effect on our financial condition, results of operations and cash flows.
Laws and regulations affecting government contracts make it more costly and difficult for us to successfully conduct our business.
We must comply with numerous laws and regulations relating to the formation, administration and performance of government contracts, which can make it more difficult for us to retain our rights under our BARDA contract.contracts. These laws and regulations affect how we conduct business with government agencies. Among the most significant government contracting regulations that affect our business are:
the Federal Acquisition Regulations (“FAR”) and agency-specific regulations supplemental to the FAR, which comprehensively regulate the procurement, formation, administration and performance of government contracts;
business ethics and public integrity obligations, which govern conflicts of interest and the hiring of former government employees, restrict the granting of gratuities and funding of lobbying activities and include other requirements such as the Anti-Kickback Statute and Foreign Corrupt Practices Act;
export and import control laws and regulations; and
laws, regulations and executive orders restricting the use and dissemination of information classified for national security purposes and the exportation of certain products and technical data.
18
Any material changes in applicable laws and regulations could restrict our ability to maintain our existing BARDA contractcontracts or obtain new contracts with the U.S. federal government.
We could be subject to product liability lawsuits, which could result in costly and time‑consumingtime-consuming litigation and significant liabilities.
The development of biopharmaceutical products involves an inherent risk of product liability claims and associated adverse publicity. Our products may be found to be harmful or to contain harmful substances. This exposes us to substantial risk of litigation and liability or may force us to discontinue production of certain products. Although we have product liability insurance covering up to $10.0$10 million for claims in the European Union, Israel, Argentina, South Korea, Russia and Argentina,Peru, the coverage may not insure us against all claims that may be asserted against us. Product liability insurance is costly and often limited in scope. There can be no assurance that we will be able to obtain or maintain insurance on reasonable terms or to otherwise protect ourselves against potential product liability claims that could impede or prevent commercialization of NexoBrid, EscharEx or our pipeline product candidates. Furthermore, a product liability claim could damage our reputation, whether or not such claims are covered by insurance or are with or without merit. A product liability claim against us or the withdrawal of a product from the market could have a material adverse effect on our business or financial condition. Furthermore, product liability lawsuits, regardless of their success, would likely be time‑consumingtime-consuming and expensive to resolve and would divert management’s time and attention, which could seriously harm our business.
We are subject to foreign data privacy and security laws.
We are subject to data privacy and security laws in the E.U. as well as the EEA, including Regulation (EU) 2016/679 (General Data Protection Regulation, or GDPR) in relation to our collection, control, processing, sharing, disclosure and other use of personal data (i.e. data relating to an identifiable living individual). The GDPR is directly applicable in each E.U. and EEA Member State, however, it provides that E.U. and EEA Member States may introduce further conditions, including limitations, which could limit our ability to collect, control, process, share, disclose and otherwise use personal data (including health and medical information), and/or could cause our compliance costs to increase, ultimately having an adverse impact on our business. The GDPR imposes a strict data protection compliance regime including with regard to engaging third party processors and cross-border transfers of personal data out of the E.U. and EEA. The law is also developing rapidly and, in July 2020, the Court of Justice of the EU limited how organizations could lawfully transfer personal data from the EEA to the U.S. Fines for certain breaches of the GDPR are significant: up to the greater of EUR 20 million or 4% of total global annual turnover. In addition to the foregoing, a breach of the GDPR could result in regulatory investigations, reputational damage, orders to cease/change our processing of our data, enforcement notices, assessment notices (for a compulsory audit), as well potential civil claims including class action type litigation where individuals suffer harm. Following Brexit, and the expiry of the transition period, we have to comply with the GDPR and separately the GDPR as implemented in the UK, each regime having the ability to fine up to the greater of €20 million/ £17.5 million or 4% of global turnover. The relationship between the UK and the EU in relation to certain aspects of data protection law remains unclear, e.g. how data transfers between EU member states and the UK will be treated. These changes may lead to additional compliance costs and could increase our overall risk. Pursuant to the EU-UK Trade and Cooperation Agreement of December 24, 2020, transfers of personal data from the European Union to the United Kingdom may continue to take place without a need for additional safeguards during a further transition period, to expire on (1) the date on which an adequacy decision with respect to the United Kingdom is adopted by the EU Commission; or (2) the expiry of four months, which shall be extended by a further two months unless either the European Union or the United Kingdom objects. It remains unclear whether the EU Commission will adopt an adequacy decision with respect to the United Kingdom. In the absence of such decision after the expiry of the additional transition period, companies may need to put in place additional safeguards for transfers of personal data from the European Union to the United Kingdom, such as standard contractual clauses approved by the EU Commission. As we expand into other foreign countries and jurisdictions, we may be subject to additional laws and regulations that may affect how we conduct business.
We are subject to extensive environmental, health and safety, and other laws and regulations.
Our business involves the controlled use of chemicals. The risk of accidental contamination or injury from these materials cannot be eliminated. If an accident, spill or release of any such chemicals or substances occurs, we could be held liable for resulting damages, including for investigation, remediation and monitoring of the contamination, including natural resource damages, the costs of which could be substantial. We are also subject to numerous environmental, health and workplace safety laws and regulations, including those governing laboratory procedures. Although we maintain workers’ compensation insurance to cover the costs and expenses that may be incurred because of injuries to our employees resulting from the use of these materials, this insurance may not provide adequate coverage against potential liabilities. Additional or more stringent laws and regulations affecting our operations may be adopted in the future. We may incur substantial capital costs and operating expenses and may be required to obtain consents to comply with any of these or certain other laws or regulations and the terms and conditions of any permits required pursuant to such laws and regulations, including costs to install new or updated pollution control equipment, modify our operations or perform other corrective actions at our respective facilities. In addition, fines and penalties may be imposed for noncompliance with environmental, health and safety and other laws and regulations or for the failure to have, or comply with the terms and conditions of, required environmental or other permits or consents.
19
The United Kingdom’s departure from the European Union could adversely affect our business.
Following a national referendum and enactment of legislation by the government of the United Kingdom, the United Kingdom formally withdrew from the European Union and ratified a trade and cooperation agreement governing its future relationship, commonly known as Brexit. The agreement, which is being applied provisionally from January 1, 2021 until it is ratified by the European Parliament and the Council of the European Union, addresses trade, economic arrangements, law enforcement, judicial cooperation and a governance framework including procedures for dispute resolution, among other things. Because the agreement merely sets forth a framework in many respects and will require complex additional bilateral negotiations between the United Kingdom and the European Union as both parties continue to work on the rules for implementation, significant political and economic uncertainty remains about how the precise terms of the relationship between the paries will differ from the terms before withdrawal. Brexit could materially impact the regulatory regime with respect to the approval of our product candidates in the United Kingdom or the European Union and could require us to obtain separate approvals for our product candidates in the United Kingdom and the European Union. Any delay in obtaining, or an inability to obtain, any regulatory approvals, as a result of Brexit or otherwise, would prevent us from commercializing our product candidates in the United Kingdom and/or the European Union and restrict our ability to generate revenue and achieve and sustain profitability. If any of these outcomes occur, we may be forced to restrict or delay efforts to seek regulatory approval in the United Kingdom and/or European Union for our product candidates, which could significantly and materially harm our business. Brexit could adversely affect European and worldwide economic and market conditions and could contribute to instability in global financial and foreign exchange markets, including volatility in the value of the sterling and euro. Any of these effects of Brexit, and others we cannot anticipate, could adversely affect our business, results of operations, financial condition and cash flows.
Risks Related to Our Intellectual Property Rights
Our success depends in part on our ability to obtain and maintain protection for the intellectual property relating to, or incorporated into, our technology and products.
Our commercial success depends in part on our ability to obtain and maintain patent protection and trade secret protection for our intellectual property and proprietary technologies, our products and their uses, as well as our ability to operate without infringing upon the proprietary rights of others. We rely on a combination of patent,patents, trademark and trade secret laws, non‑disclosurenon-disclosure and confidentiality agreements, licenses, assignments of invention agreements and other restrictions on disclosure and use to protect our intellectual property rights.
As of December 31, 2017,2020, we had been granted a total of 6561 patents and have 1532 pending patent applications. The family of patents that covers NexoBrid specifically includes 35 granted patents worldwide and 1 pending national phase application.worldwide. EscharEx is covered in 2 provisional patent applications (“PCT”)patents and 432 national phase applications. However, there can be no assurance that patent applications relating to our products, processes or technologies will result in patents being issued, that any patents that have been issued will be adequate to protect our intellectual property or that we will enjoy patent protection for any significant period of time. Additionally, any issued patents may be challenged by third parties, and patents that we hold may be found by a judicial authority to be invalid or unenforceable. Other parties may independently develop similar or competing technology or design around any patents that may be issued to or held by us. Our current patents will expire or they may otherwise cease to provide meaningful competitive advantage, and we may be unable to adequately develop new technologies and obtain future patent protection to preserve our competitive advantage or avoid adverse effects on our business.
20
Our patent protection may be limited, subjecting us to challenges by competitors.
At present, we consider our patents relating to our proteolytic enzymeenzymatic platform technology, which underlies NexoBrid, EscharEx and our current pipeline product candidates, to be material to the operation of our business as a whole. Our patents which cover NexoBrid claim specific mixtures of proteolytic enzymes, methods of producing such mixtures and methods of treatment using such mixtures. Although the protection achieved is significant for NexoBrid, EscharEx and our pipeline product candidates, when looking at our patents’ ability to block competition, the protection offered by our patents may be, to some extent, more limited than the protection provided by patents which claim chemical structures that were previously unknown. If our patents covering NexoBrid in various jurisdictions were subject to a successful challenge or if a competitor were able to successfully design around them, our business and competitive advantage could be significantly affected.
In addition, the patent landscape in the biotechnology field is highly uncertain and involves complex legal, factual and scientific questions, and changes in either patent laws or in the interpretation of patent laws in the United States and other countries may diminish the value and strength of our intellectual property or narrow the scope of our patent protection. In addition, we may fail to apply for or be unable to obtain patents necessary to protect our technology or products or enforce our patents due to lack of information about the exact use of our process by third parties. Even if patents are issued to us, they may be challenged, narrowed, invalidated, held to be unenforceable or circumvented, which could limit our ability to prevent competitors from using similar technology or marketing similar products, or limit the length of time our technologies and products have patent protection. In addition, we are a party to license agreementsagreement with each of Mark Klein, and L.R. R&D Ltd., an entity which is wholly‑owned by Prof. Lior Rosenberg, that imposeimposes various obligations upon us as a licensee, including with respect to the agreement with Mark Klein, the obligation to make milestone and royalty payments contingent on the sales of NexoBrid. If we fail to comply with these obligations, the licensor may terminate the license, in which event we might not be able to market any product that is covered by the licensed intellectual property, including NexoBrid.
In order to preserve and enforce our patentpatents and other intellectual property rights, we may need to assert claims or file lawsuits against third parties. Such lawsuits could entail significant costs to us and divert our management’s attention from developing and commercializing our products. Lawsuits may ultimately be unsuccessful and may also subject us to counterclaims and cause our intellectual property rights to be challenged, narrowed, invalidated or held to be unenforceable.
The timing of a patent application, grant, and expiration may put us at a disadvantage compared to our competitors.
Our material patents also may not afford us protection against competitors with similar technology. Because patent applications in the United States and many other jurisdictions are typically not published until 18 months after their filing, if at all, and because publications of discoveries in scientific literature often lag behind actual discoveries, neither we nor our licensors can be certain that we or they were the first to make the inventions claimed in our or their issued patents or pending patent applications, or that we or they were the first to file for protection of the inventions set forth in such patent applications. As a result, the patents we own and license may be invalidated in the future, and the patent applications we own and license may not be granted. For example, if a third party has also filed a patent application covering an invention similar to one covered in one of our patent applications, we may be required to participate in an adversarial proceeding known as an “interference proceeding,” declared by the U.S. Patent and Trademark Office or its foreign counterparts, to determine priority of invention. The costs of these proceedings could be substantial and our efforts in them could be unsuccessful, resulting in a loss of our anticipated patent position. In addition, if a third party prevails in such a proceeding and obtains an issued patent, we may be prevented from practicing technology or marketing products covered by that patent. Additionally, patents and patent applications owned by third parties may prevent us from pursuing certain opportunities such as entering into specific markets or developing certain products. Finally, we may choose to enter into markets where certain competitors have patents or patent protection over technology that may impede our ability to compete effectively.
We may not be able to protect our intellectual property rights in all jurisdictions.
Effective protection of our intellectual property rights may be unavailable or limited in some countries, and even if available, we may fail to pursue or obtain necessary intellectual property protection in such countries, including because filing, prosecuting, maintaining and defending patents on product candidates in all countries throughout the world would be prohibitively expensive. In addition, the legal systems of certain countries do not favor the aggressive enforcement of patents and other intellectual property rights, and the laws of certain foreign countries do not protect our rights to the same extent as the laws of the United States. As a result, our intellectual property may not provide us with sufficient rights to exclude others from commercializing products similar or identical to ours. Competitors may use our technologies in jurisdictions where we have not obtained patent protection to develop their own products, and we may be unable to prevent such competitors from importing such infringing products into territories where we have patent protection but where enforcement is not as strong as in the United States or into jurisdictions in which we do not have patent protection. These products may compete with our product candidates and our patents and other intellectual property rights may not be effective or sufficient to prevent them from competing in those jurisdictions.
Our currently issued NexoBrid Family patents are nominally due to expire at various dates between 2025 and 2029. However, because of the extensive time required for development, testing and regulatory review of a potential product, and although such delays may entitle us to patent term extensions, it is possible that, before NexoBrid can be commercialized in additional international jurisdictions and/or before any of our future products can be commercialized, any related patent may expire or remain in force for only a short period following commercialization, thereby reducing any advantages of the patent. The international PCT patent applications relating to EscharEx were filed on January 30, 2017. If nationalNational phase applications ofcorresponding to these PCT applications arewere filed in due courseseveral jurisdictions and if granted, the expiration date of thesethe two patents wouldthat issued and those that will be issued is January 30, 2037, absent patent‑termpatent-term adjustment and/or extensions. Our pending and future patent applications may not lead to the issuance of patents or, if issued, the patents may not be issued in a form that will provide us with any competitive advantage. We also cannot guarantee that:
any of our present or future patents or patent claims or other intellectual property rights will not lapse or be invalidated, circumvented, challenged or abandoned;
our intellectual property rights will provide competitive advantages or prevent competitors from making or selling competing products;
our ability to assert our intellectual property rights against potential competitors or to settle current or future disputes will not be limited by our agreements with third parties;
any of our pending or future patent applications will be issued or have the coverage originally sought;
our intellectual property rights will be enforced in jurisdictions where competition may be intense or where legal protection may be weak; or
we will not lose the ability to assert our intellectual property rights against, or to license our technology to, others and collect royalties or other payments.
We may be unable to identify all past or future unauthorized uses of our intellectual property.
Additionally, unauthorized use of our intellectual property may have occurred or may occur in the future. Any failure to identify unauthorized use of, and otherwise adequately protect, our intellectual property could adversely affect our business, including by reducing the demand for our products. Any reported adverse events involving counterfeit products that purport to be our products could harm our reputation and the sale of our products. Moreover, if we are required to commence litigation related to unauthorized use, whether as a plaintiff or defendant, such litigation would be time‑consuming,time-consuming, force us to incur significant costs and divert our attention and the efforts of our management and other employees, which could, in turn, result in lower revenue and higher expenses.
In addition to patented technology, we rely on our unpatented proprietary technology, trade secrets, processes and know‑how.know-how.
We rely on proprietary information, such as trade secrets, know‑howknow-how and confidential information, to protect intellectual property that may not be patentable or that we believe is best protected by means that do not require public disclosure. We generally seek to protect this proprietary information by entering into confidentiality agreements, or consulting, services or employment agreements that contain non‑disclosurenon-disclosure and non‑usenon-use provisions with our employees, consultants, contractors, scientific advisors and third parties. However, we may fail to enter into the necessary agreements, and even if entered into, these agreements may be breached or otherwise fail to prevent disclosure, third‑partythird-party infringement or misappropriation of our proprietary information, may be limited as to their term and may not provide an adequate remedy in the event of unauthorized disclosure or use of proprietary information. We have limited control over the protection of trade secrets used by our suppliers and service providers and could lose future trade secret protection if any unauthorized disclosure of such information occurs. In addition, our proprietary information may otherwise become known or be independently developed by our competitors or other third parties. To the extent that our employees, consultants, contractors, scientific advisors and other third parties use intellectual property owned by others in their work for us, disputes may arise as to the related rights in related or resulting know‑howknow-how and inventions. Costly and time‑consumingtime-consuming litigation could be necessary to enforce and determine the scope of our and relevant third parties’ proprietary rights and failure to obtain or maintain protection for our proprietary information could adversely affect our competitive business position. In addition, if a third party is able to establish that we are using their proprietary information without their permission, we may be required to obtain a license to such information or, if such a license is not available, re‑designre-design our products to avoid any such unauthorized use or temporarily delay or permanently stop manufacturing or sales of the affected products. Furthermore, laws regarding trade secret rights in certain markets where we operate may afford little or no protection to our trade secrets.
We also rely on physical and electronic security measures to protect our proprietary information, but we cannot provide assurance that these security measures will not be breached or will provide adequate protection for our property. There is a risk that third parties may obtain and improperly utilize our proprietary information to our competitive disadvantage. Attacks upon information technology systems are increasing in their frequency, levels of persistence, sophistication and intensity, and are being conducted by sophisticated and organized groups and individuals with a wide range of motives and expertise. As a result of the COVID-19 pandemic, we may also face increased cybersecurity risks due to our reliance on internet technology and the number of our employees who are working remotely, which may create additional opportunities for cybercriminals to exploit vulnerabilities. Furthermore, because the techniques used to obtain unauthorized access to, or to sabotage, systems change frequently and often are not recognized until launched against a target, we may be unable to anticipate these techniques or implement adequate preventative measures. We may also experience security breaches that may remain undetected for an extended period. We may not be able to detect or prevent the unauthorized use of such information or take appropriate and timely steps to enforce our intellectual property rights.
Some of our employees were previously employed at universities or other biotechnology or pharmaceutical companies, including potential competitors. While we take steps to prevent our employees from using the proprietary information or know‑howknow-how of others in their work for us, we may be subject to claims that we or these employees have inadvertently or otherwise used or disclosed intellectual property, trade secrets or other proprietary information of any such employee’s former employer. Litigation may be necessary to defend against these claims and, even if we are successful in defending ourselves, could result in substantial costs to us or be distracting to our management. If we fail to defend any such claims successfully, in addition to paying monetary damages, we may lose valuable intellectual property rights or personnel.
If we are unable to protect our trademarks from infringement, our business prospects may be harmed.
We own trademarks that identify “MediWound,” “NexoBrid” and “EscharEx,” among others, and have registered these trademarks in certain key markets. Although we take steps to monitor the possible infringement or misuse of our trademarks, it is possible that third parties may infringe, dilute or otherwise violate our trademark rights. Any unauthorized use of our trademarks could harm our reputation or commercial interests. In addition, our enforcement against third‑partythird-party infringers or violators may be unduly expensive and time‑consuming,time-consuming, and the outcome may be an inadequate remedy.
We may be subject to claims that we infringe, misappropriate or otherwise violate the intellectual property rights of third parties.
Our development, marketing or sale of NexoBrid, EscharEx or our pipeline product candidates may infringe or be accused of infringing one or more claims of an issued patent or may fall within the scope of one or more claims in a published patent application that may be subsequently issued and to which we do not hold a license or other rights. We may also be subject to claims that we are infringing, misappropriating or otherwise violating other intellectual property rights, such as trademarks, copyrights or trade secrets. Third parties could therefore bring claims against us or our strategic partners that would cause us to incur substantial expenses, including litigation costs or costs associated with settlement, and, if successful against us, could cause us to pay substantial damages. Further, if such a claim were brought against us, we could be forced to temporarily delay or permanently stop manufacturing or sales of NexoBrid, EscharEx or our pipeline product candidates that are the subject of the suit.
If we are found to be infringing, misappropriating or otherwise violating the patent or other intellectual property rights of a third party, or in order to avoid or settle claims, we may choose or be required to seek a license from a third party and be required to pay license fees or royalties or both, which could be substantial. These licenses may not be available on acceptable terms, or at all. Even if we were able to obtain a license, the rights may be nonexclusive, which could result in our competitors gaining access to the same intellectual property. Ultimately, we could be prevented from commercializing a product, or be forced to cease some aspect of our business operations, if, as a result of actual or threatened claims, we or our strategic partners are unable to enter into licenses on acceptable terms.
23
There have been substantial litigation and other proceedings regarding patent and other intellectual property rights in the pharmaceutical and biotechnology industries. In addition, to the extent that we gain greater visibility and market exposure as a public company in the United States, we face a greater risk of being involved in such litigation. In addition to infringement claims against us, we may become a party to other patent litigation and other proceedings, including interference, opposition, re‑examinationre-examination and similar proceedings before the U.S. Patent and Trademark Office and its foreign counterparts, regarding intellectual property rights with respect to NexoBrid, EscharEx or our pipeline product candidates. The cost to us of any patent litigation or other proceeding, even if resolved in our favor, could be substantial. A negative outcome could result in liability for monetary damages, including treble damages and attorneys’ fees if, for example, we are found to have willfully infringed a patent. A finding of infringement could prevent us from developing, marketing or selling a product or force us to cease some or all of our business operations. Some of our competitors may be able to sustain the costs of such litigation or proceedings more effectively than we can because of their substantially greater financial resources. Uncertainties resulting from the initiation and continuation of patent litigation or other proceedings could have a material adverse effect on our ability to compete in the marketplace, and patent litigation and other proceedings may also absorb significant management time.
Under applicable employment laws, we may not be able to enforce covenants not to compete.
We generally enter into non‑competitionnon-competition agreements with our employees. These agreements prohibit our employees, if they cease working for us, from competing directly with us or working for our competitors or clients for a limited period. We may be unable to enforce these agreements under the laws of the jurisdictions in which our employees work and it may be difficult for us to restrict our competitors from benefitting from the expertise our former employees or consultants developed while working for us. For example, Israeli labor courts have required employers seeking to enforce non‑competenon-compete undertakings of a former employee to demonstrate that the competitive activities of the former employee will harm one of a limited number of material interests of the employer which have been recognized by the courts, such as the protection of a company’s trade secrets or other intellectual property.
We may become subject to claims for remuneration or royalties for assigned service invention rights by our employees, which could result in litigation and adversely affect our business.
A significant portion of our intellectual property has been developed for us by our employees in the course of their employment. Under the Israeli Patent Law, 5727‑1967,5727-1967, or the Patent Law, inventions conceived by an employee in the course and as a result of or arising from his or her employment with a company are regarded as “service inventions,” which belong to the employer, absent a specific agreement between the employee and employer giving the employee proprietary rights. The Patent Law also provides under Section 134 that if there is no agreement between an employer and an employee as to whether the employee is entitled to consideration for service inventions, and to what extent and under which conditions, the Israeli Compensation and Royalties Committee, or the Committee, a body constituted under the Patent Law, shall determine these issues. Section 135 of the Patent law provides criteria for assisting the Committee in making its decisions. According to case law handed down by the Committee, an employee’s right to receive consideration for service inventions is a personal right and is entirely separate from the proprietary rights in such invention. Therefore, this right must be explicitly waived by the employee. A decision handed down in May 2014 by the Committee clarifies that the right to receive consideration under Section 134 can be waived and that such waiver can be made orally, in writing or by behavior like any other contract. The Committee will examine, on a case by case basis, the general contractual framework between the parties, using interpretation rules of the general Israeli contract laws. Further, the Committee has not yet determined one specific formula for calculating this remuneration, nor the criteria or circumstances under which an employee’s waiver of his right to remuneration will be disregarded. Similarly, it remains unclear whether waivers by employees in their employment agreements of the alleged right to receive consideration for service inventions should be declared as void being a depriving provision in a standard contract. We generally enter into assignment‑of‑inventionassignment-of-invention agreements with our employees pursuant to which such individuals assign to us all rights to any inventions created in the scope of their employment or engagement with us. Although our employees have agreed to assign to us service invention rights and have specifically waived their right to receive any special remuneration for such service inventions beyond their regular salary and benefits, we may face claims demanding remuneration in consideration for assigned inventions. As a consequence of such claims, we could be required to pay additional remuneration or royalties to our current or former employees or be forced to litigate such claims, which could negatively affect our business.
Risks Related to an Investment in Our Ordinary Shares
The market price of our ordinary shares may be subject to fluctuation and you could lose all or part of your investment.
Our ordinary shares were first offered publicly in our IPO in March 2014 at a price of $14.00 per share, and our ordinary shares have subsequently traded as high as 18.16$18.16 per share and as low as $3.56$1.47 per share through MarchFebruary 15, 2018.2021. The market price of our ordinary shares on the Nasdaq Global Market may fluctuate as a result of a number of factors, some of which are beyond our control, including, but not limited to:
actual or anticipated variations in our and our competitors’ results of operations and financial condition; |
market acceptance of our products;
general economic and market conditions and other factors, including factors unrelated to our operating performance;
the mix of products that we sell and related services that we provide;
changes in earnings estimates or recommendations by securities analysts, if our ordinary shares continue to be covered by analysts;
publication of the results of preclinical or clinical trials for NexoBrid, EscharEx or any of our pipeline product candidates;
failure by us to achieve a publicly announced milestone;
delays between our expenditures to develop and market new or enhanced products and the generation of sales from those products;
development of technological innovations or new competitive products by others;
announcements of technological innovations or new products by us;
regulatory developments and the decisions of regulatory authorities as to the marketing of our current products or the approval or rejection of new or modified products;
developments concerning intellectual property rights, including our involvement in litigation;
changes in our expenditures to develop, acquire or license new products, technologies or businesses;
changes in our expenditures to promote our products;
changes in the structure of healthcare payment systems;
our sale or proposed sale, or the sale by our significant shareholders, of our ordinary shares or other securities in the future;
changes in key personnel;
success or failure of our research and development projects or those of our competitors; and
the trading volume of our ordinary shares.
These factors and any corresponding price fluctuations may materially and adversely affect the market price of our ordinary shares and result in substantial losses being incurred by our investors. In the past, following periods of market volatility, public company shareholders have often instituted securities class action litigation. If we were involved in securities litigation, it could impose a substantial cost upon us and divert the resources and attention of our management from our business.
25
Future sales of our ordinary shares could reduce the market price of our ordinary shares.
If we or our existing shareholders, particularly certain of our directors or their affiliates or certain of our executive officers, sell a substantial number of our ordinary shares in the public market, the market price of our ordinary shares could decrease significantly. The perception in the public market that we or our shareholders might sell our ordinary shares could also depress the market price of our ordinary shares and could impair our future ability to obtain capital, especially through an offering of equity securities. On March 7, 2016,
We have made significant offerings of our ordinary shares in the past and may do so again in the future. For example, on April 23, 2019, the SEC declared effective our shelf registration statement on Form F‑3,F-3, which registered the resale of 11,640,82711,240,127 shares that are subject to registration rights. All shares sold pursuant to an offering covered by suchthat registration statement (or a subsequent shelf registration that we may file to replace it after it expires) will be freely transferable. See “ITEM 7.B. Related Party Transactions—Registration Rights Agreement.” In September 2017,February 2020, we completedentered into an underwritten public offering of 5,037,664 ofOpen Market Sales Agreement with Jefferies LLC to issue and sell our ordinary shares. shares with gross sales proceeds of up to $15 million, from time to time, through an at the market offering under which Jefferies LLC will act as our sales agent. As of the date hereof, we have not issued or sold any ordinary shares pursuant to the Open Market Sales Agreement. Sales by us or our shareholders of a substantial number of ordinary shares in the public market or the perception that these sales might occur, could cause the market price of our ordinary shares to decline or could impair our ability to raise capital through a future sale of, or pay for acquisitions using, our equity securities.
In addition, to these registration rights, as of MarchFebruary 15, 2018, 1,928,0682021, 3,672,212 ordinary shares arewere subject to outstanding option and RSU awards granted to employees and office holders under our share incentive plans, including 1,569,8181,952,014 ordinary shares issuable under currently exercisable share options.options and RSUs. On April 28, 2014, we filed a registration statement on Form S‑8S-8 registering the issuance of up to 3,032,742 ordinary shares issuable under our share incentive plans, which amount included 2,178,806960,932 ordinary shares issuable upon the exercise of option awards previously granted under our 2003 Israeli Share Option Plan and 853,9361,482,044 ordinary shares issuable under our 2014 Equity Incentive Plan. On January 1, 20152016, 2018, 2019 and 2018,2020, the shares available for issuance under our 2014 Equity Incentive Plan automatically increased by 431,006, 540,955, 543,577 and 540,955544,055 shares, respectively. As of MarchFebruary 15, 2018, 3,229,3862021, 3,989,019 shares remained available for issuance under our share incentive plans, which amount includes 1,301,318316,621 ordinary shares subject to outstanding awards. Shares included in such registration statement may be freely sold in the public market upon issuance, except for shares held by affiliates who have certain restrictions on their ability to sell.
The significant share ownership position of Clal Biotechnology Industries Ltd. may limit your ability to influence corporate matters.
As of MarchFebruary 15, 2018,2021, Clal Biotechnology Industries Ltd. (“CBI”), beneficially owns or controls, directly and indirectly, 34.9%34.6% of our issued and outstanding ordinary shares. Accordingly, CBI is able to significantly influence the outcome of matters required to be submitted to our shareholders for approval, including decisions relating to the election of our board of directors and the outcome of any proposed merger or consolidation of the company. CBI’s interests may not be consistent with those of our other shareholders. In addition, CBI’s significant interest in us may discourage third parties from seeking to acquire control of us, which may adversely affect the market price of our ordinary shares.
We have never paid cash dividends on our share capital, and we do not anticipate paying any cash dividends in the foreseeable future.
We have never declared or paid cash dividends on our share capital, nor do we anticipate paying any cash dividends on our share capital in the foreseeable future. We currently intend to retain all available funds and any future earnings to fund the development and growth of our business. As a result, capital appreciation, if any, of our ordinary shares will be an investor’s sole source of gain for the foreseeable future. In addition, Israeli law limits our ability to declare and pay dividends, and may subject our dividends to Israeli withholding taxes. See “ITEM 8.A. Consolidated Statements and Other Financial Information—Dividend Policy,” “ITEM 10.B. Articles of Association—Dividend and liquidation rights” and “ITEM 10.E. Taxation—Israeli Tax Considerations and Government Programs.”
26
As a foreign private issuer, we are permitted, and intend, to follow certain home country corporate governance practices instead of otherwise applicable SEC and Nasdaq requirements.
As a foreign private issuer, we are permitted to, and do, follow certain home country corporate governance practices instead of those otherwise required under the Nasdaq Stock Market listing rules for domestic U.S. issuers. For instance, we follow home country practice in Israel with regard to the (i) quorum requirement for shareholder meetings, (ii) independent director oversight of director nominations requirement, and (iii) independence requirement for the board of directors.directors and (iv) shareholder approval for certain transactions other than a public offering involving issuances of a 20% or more interest in the company. See “ITEM 16G. Corporate Governance.” We may in the future elect to follow home country practices in Israel with regard to other matters as well, such as the formation and composition of the nominating and corporate governance committee, separate executive sessions of independent directors and the requirement to obtain shareholder approval for certain dilutive events (such as for the establishment or amendment of certain equity‑basedequity-based compensation plans, issuances that will result in a change of control of the company, certain transactions other than a public offering involving issuances of a 20% or more interest in the company, and certain acquisitions of the stock or assets of another company). Following our home country governance practices as opposed to the requirements that would otherwise apply to a U.S. company listed on the Nasdaq Global Market may provide less protection to you than what is accorded to investors under the Nasdaq Stock Market listing rules applicable to domestic U.S. issuers. See “ITEM 16G. Corporate Governance.”
As a foreign private issuer, we are not subject to the provisions of Regulation FD or U.S. proxy rules and are exempt from filing certain Exchange Act reports.
As a foreign private issuer, we are exempt from the rules and regulations under the Exchange Act related to the furnishing and content of proxy statements, and our officers, directors and principal shareholders are exempt from the reporting and short‑swingshort-swing profit recovery provisions contained in Section 16 of the Exchange Act. In addition, we are not required under the Exchange Act to file annual and current reports and financial statements with the SEC as frequently or as promptly as U.S. domestic companies whose securities are registered under the Exchange Act, and we are generally exempt from filing quarterly reports with the SEC under the Exchange Act. Moreover, we are not required to comply with Regulation FD, which prohibits the selective disclosure of material nonpublic information to, among others, broker‑dealersbroker-dealers and holders of a company’s securities under circumstances in which it is reasonably foreseeable that the holder will trade in the company’s securities on the basis of the information. Even though we intend to comply voluntarily with Regulation FD, these exemptions and leniencies will reduce the frequency and scope of information and protections to which you are entitled as an investor.
For so long as we qualify as a foreign private issuer, we are not required to comply with the proxy rules applicable to U.S. domestic companies, including the requirement applicable to emerging growth companies to disclose the compensation of our Chief Executive Officer and other two most highly compensated executive officers on an individual, rather than an aggregate, basis. Nevertheless, the regulations promulgated under the Israeli Companies Law, 5759-1999 (the “Israeli Companies Law”) require us to disclose the annual compensation of our five most highly compensated officers on an individual, rather than on an aggregate, basis. See “ITEM 6.B. Compensation.” Under the Companies Law regulations, this disclosure is required to be included in the proxy statement for our annual meeting of shareholders each year, which we furnish to the SEC under cover of a Report of Foreign Private Issuer on Form 6‑K.6-K. Because of that disclosure requirement under Israeli law, we are also including such information in this annual report, pursuant to the disclosure requirements of Form 20‑F.20-F.
We would lose our foreign private issuer status if a majority of our outstanding ordinary shares are held of record by U.S. shareholders and we fail to meet additional requirements necessary to avoid loss of foreign private issuer status. Although we have elected to comply with certain U.S. regulatory provisions, our loss of foreign private issuer status would make such provisions mandatory. The regulatory and compliance costs to us under U.S. securities laws as a U.S. domestic issuer may be significantly higher. If we lose our foreign private issuer status, we will be required to file periodic reports and registration statements on U.S. domestic issuer forms with the SEC, which are more detailed and extensive than the forms available to a foreign private issuer. We would also be required to follow U.S. proxy disclosure requirements, including the requirement to disclose more detailed information about the compensation of our senior executive officers on an individual basis. We may also be required to modify certain of our policies to comply with accepted governance practices associated with U.S. domestic issuers. Such conversion and modifications will involve additional costs. In addition, we would lose our ability to rely upon exemptions from certain corporate governance requirements on U.S. stock exchanges that are available to foreign private issuers.
27
If we are unable to satisfy the requirements of Section 404 of the Sarbanes‑OxleySarbanes-Oxley Act, or if our internal control over financial reporting or our disclosure controls and procedures are not effective, investors may lose confidence in the accuracy and the completeness of the reports we furnish or file with the SEC, the reliability of our financial statements may be questioned and our share price may suffer.
We are required to comply with the internal control, evaluation and certification requirements of Section 404 of the Sarbanes‑OxleySarbanes-Oxley Act of 2002 (the “Sarbanes‑Oxley“Sarbanes-Oxley Act”). Pursuant to Section 404(a) of the Sarbanes‑OxleySarbanes-Oxley Act, we are required to furnish a report by management on the effectiveness of our internal control over financial reporting. Additionally, pursuantIf we become an accelerated filer or a large accelerated filer, we will be required to comply with the auditor attestation requirements of Section 404(b) of the Sarbanes‑Sarbanes Oxley Act, unless we lose our status as an “emerging growth company” under the JOBS Act prior to the end of the fiscal year in which the fifth anniversary of our IPO occurred, we will not be required to obtain an auditor attestation under Section 404 of the Sarbanes‑Oxley Act until the year ended December 31, 2019.Act.
To maintain the effectiveness of our disclosure controls and procedures and our internal control over financial reporting, we expect that we will need to continue to enhance existing, and implement new, financial reporting and management systems, procedures and controls to manage our business effectively and support our growth in the future. The process of evaluating our internal control over financial reporting requires an investment of substantial time and resources, including by our Chief Financial Officer and other members of our senior management. The determination and any remedial actions required could divert internal resources and take a significant amount of time and effort to complete and could result in us incurring additional costs that we did not anticipate, including the hiring of outside consultants.
Irrespective of compliance with Section 404, any failure of our internal controls could have a material adverse effect on our stated results of operations and harm our reputation. As a result, we may experience higher than anticipated operating expenses, as well as higher independent auditor fees during and after the implementation of these changes. If we are unable to implement any of the required changes to our internal control over financial reporting effectively or efficiently, it could adversely affect our operations, financial reporting or results of operations. Further, if our internal controls over financial reporting are not effective, the reliability of our financial statements may be questioned and our share price may suffer.
Our U.S. shareholders may suffer adverse tax consequences if we are characterized as a passive foreign investment company.
Generally, if for any taxable year 75% or more of our gross income is passive income, or at least 50% of the average quarterly value of our assets (which may be determined in part by the market value of our ordinary shares, which is subject to change) are held for the production of, or produce, passive income, we would be characterized as a passive foreign investment company (“PFIC”) for U.S. federal income tax purposes. Based on certainour current estimates of our gross income and gross assets and the nature of our business, we do not believe we were classified as a PFIC for the taxable year ended December 31, 2017.2020. There can be no assurance that we will not be considered a PFIC for the current or any future taxable year. PFIC status is determined as of the end of the taxable year and depends on a number of factors, including the value of a corporation’s assets and the amount and type of its gross income. Furthermore, because the value of our gross assets is likely to be determined in large part by reference to our market capitalization,capitalization. As such, a decline in the value of our ordinary shares or an increase in the value of our passive assets (including cash and short term investments), for example, may result in our becoming a PFIC. If we are characterized as a PFIC, our U.S. shareholders may suffer adverse tax consequences, including having gains realized on the sale of our ordinary shares treated as ordinary income, rather than as capital gain, the loss of the preferential rate that may be applicable to dividends received on our ordinary shares by individuals who are U.S. Holders (as defined in “ITEM 10.E. Taxation—United States Federal Income Taxation”), and having interest charges apply to distributions by us and the proceeds of share sales. Certain elections exist that may alleviate some of the adverse consequences of PFIC status and would result in an alternative treatment (such as mark‑to‑marketmark-to-market treatment) of our ordinary shares. However, we do not intend to provide the information necessary for U.S. holders to make qualified electing fund elections if we are classified as a PFIC. See “ITEM 10.E. Taxation—United States Federal Income Taxation—Passive Foreign Investment Company Considerations.”
28
Risks Primarily Related to our Operations in Israel
Our headquarters, manufacturing and other significant operations are located in Israel and, therefore, our results may be adversely affected by political, economic andor military instability in Israel and by conflicts between Israel and otherneighboring terrorist groups or countries.
Our headquarters, manufacturing and research and development facilities are located in Yavne, Israel. In addition, the majority of our key employees, officers and directors are residents of Israel. In recent years, there has been political, economic, and military instability in Israel, including four national elections within the last two-plus years. Over the past decade, there have been multiple hostilities between Israel and its Arab neighbors, Hezbollah (an Islamist militia and political group in Lebanon) and Hamas (an Islamist militia and political group in the Gaza strip).
In addition,recent years, Iran, which has threatened to attack Israel and is widely believed to be developing nuclear weapons, and has been expanding its influence in Syria and in Lebanon through Hezbollah and other proxy terrorist groups. Although Iran’s activities have not directly affected the political and economic conditions in Israel, Iran’s purpose is widely believed to take control of the Middle East, including Israel. Israel has responded with attacks on Iranian military operations in Syria. These events and any future political, economic and military instability have the potential to interrupt our operations by damaging our facilities (to the extent rocket attacks against Israel reach the region of our headquarters) or preventing our employees, officers and directors from working. Such interruptions or stoppages may result in a material adverse effect on our business, operations and results of operations.
Our commercial insurance may leave us subject to a risk of a loss if a terrorist attack or act of war occurs.
Our commercial insurance does not cover losses that may occur as a result of an event associated with the security situation in the Middle East. The reinstatement value of direct damages that are caused by terrorist attacks or acts of war that the Israeli government is currently committed to covering might not be maintained or, if maintained, might not be sufficient to compensate us fully for damages incurred. Any losses or damages incurred by us could have a material adverse effect on our business. Any armed conflict involving Israel could adversely affect our operations and results of operations.
Our operations may be disrupted by the obligation of our employees to perform military service.
As of December 31, 2017,2020, we had 6065 employees based in Israel, certain of whichwhom may be called upon to perform up to 54 days of military service in each three‑year period (and in the case of non‑officernon-officer commanders or officers, up to 70 or 84 days, respectively, in each three‑year period)respectively) of military reserve duty in each three-year period until they reach the age of 40 (and in some cases, depending on their specific military profession, up to 45 or even 49 years of age). In certain emergency circumstances, these employees may be called to immediate and unlimited active duty. Our operations could be disrupted by the absence of a significant number of employees related to military service, which could materially adversely affect our business and results of operations.
Boycotts and various Middle Eastern business restrictions in the region may adversely impact our ability to operate sell our products.
Several countries, principally in the Middle East, restrict doing business with Israel and Israeli companies, and additional countries may impose restrictions on doing business with Israel and Israeli companies whether as a result of hostilities in the region or otherwise. In addition, there have been increased efforts by activists to cause companies and consumers to boycott Israeli goods based on Israeli government policies. SuchRecently, Israel has signed bilateral peace agreements with several Middle Eastern (including Arab) countries, forging new economic ties with them. Nevertheless, if the actions particularly if theyby boycott activists become more widespread and successful, that may adversely impact our ability to sell our products.
Provisions of Israeli law and our articles of association may delay, prevent or otherwise impede a merger with, or an acquisition of, us, even when the terms of such a transaction are favorable to us and our shareholders.
Israeli corporate law regulates mergers, requires tender offers for acquisitions of shares above specified thresholds, requires special approvals for transactions involving directors, officers or significant shareholders and regulates other matters that may be relevant to such types of transactions. For example, a tender offer for all of a company’s issued and outstanding shares can only be completed if the acquirer receives positive responses from the holders of at least 95% of the issued share capital. Completion of the tender offer also requires approval of a majority of the offerees that do not have a personal interest in the tender offer, unless, following consummation of the tender offer, the acquirer would hold at least 98% of the company’s outstanding shares. Furthermore, the shareholders, including those who indicated their acceptance of the tender offer, may, at any time within six months following the completion of the tender offer, petition an Israeli court to alter the consideration for the acquisition, unless the acquirer stipulated in its tender offer that a shareholder that accepts the offer may not seek such appraisal rights. See “ITEM 10.B. Articles of Association—Acquisitions Under Israeli law” for additional information.
29
Furthermore, Israeli tax considerations may make potential transactions unappealing to us or to our shareholders whose country of residence does not have a tax treaty with Israel exempting such shareholders from Israeli tax. For example, Israeli tax law does not recognize tax‑freetax-free share exchanges to the same extent as U.S. tax law. With respect to mergers, Israeli tax law allows for tax deferral in certain circumstances but makes the deferral contingent on the fulfillment of a number of conditions, including, in some cases, a holding period of two years from the date of the transaction during which sales and dispositions of shares of the participating companies are subject to certain restrictions. Moreover, with respect to certain share swap transactions, the tax deferral is limited in time, and when such time expires, the tax becomes payable even if no disposition of the shares has occurred.
We have received Israeli government grants for certain research and development activities. The terms of those grants require us to satisfy specified conditions and to pay penalties in addition to repayment of the grants upon certain events.
Our research and development efforts were and arehave been financed in part through grants from the Israeli Innovation Authority (“IIA“IIA”), formerly operating as the Israeli Office of the Chief Scientist (the “OCS”). The total gross amount of grants actually received by us from the IIA, including accrued LIBOR interest (or such other interest rate that the IIA may set in the future) and net of royalties actually paid as of December 31, 2017,2020, totaled approximately $13.413.7 million and the amortized cost (using the interest method) of the liability as of that date totaled approximately $7.47.5 million. As of December 31, 2017,2020, we had accrued and paid net royalties to the IIA $152 thousands. We expect to receive additional grants fromin an amount of 0.2 million. In 2020 we have determined that currently we will not be supported by the IIA through March 2018, andIIA. As a result, we applied for further grants for 2018. However, as the funds availabledid not submit applications for IIA grants out of the annual budget of the State of Israel have been reduced in the past2020 and may be further reducedwe do not plan to submit in the future, we cannot predict whether we will be entitled to any future grants, or the amounts of any such grants.2021.
The IIA grants that we have received are repayable by payment of royalties from the sale of products developed as part of the programs for which grants were received. Our obligation to pay these royalties is contingent on our actual sale of such products and services. In the absence of such sales, no payment of such royalties is required.
Even following full repayment of any IIA grants, we must nevertheless continue to comply with the requirements of the Encouragement of Research, Development and Technological Innovation in the Industry Law, 5744‑19845744-1984 (formerly known as the Law for the Encouragement of Industrial Research and Development, 5744‑1984)5744-1984), and related regulations (collectively, the “Innovation Law”). When a company develops know‑how,know-how, technology or products using IIA grants, the terms of these grants and the Innovation Law restrict the transfer outside of Israel of such know‑how,know-how, and the manufacturing or manufacturing rights of such products, technologies or know‑how,know-how, without the prior approval of the IIA. Therefore, if aspects of our technologies are deemed to have been developed with IIA funding, the discretionary approval of an IIA committee would be required for any transfer to third parties outside of Israel of know‑howknow-how or manufacturing or manufacturing rights related to those aspects of such technologies. We may not receive those approvals. Furthermore, the IIA may impose certain conditions on any arrangement under which it permits us to transfer technology or development out of Israel.
The transfer of IIA‑supportedIIA-supported technology or know‑howknow-how or manufacturing or manufacturing rights related to aspects of such technologies outside of Israel may involve the payment of significant penalties and other amounts, depending upon the value of the transferred technology or know‑how,know-how, the amount of IIA support, the time of completion of the IIA‑supportedIIA-supported research project and other factors. If our products are manufactured outside of Israel, assuming we receive prior approval from the IIA for the foreign manufacturing, we may be required to pay increased royalties. The increase in royalties depends on the manufacturing volume that is performed outside of Israel. These restrictions and requirements for payment may impair our ability to sell our technology assets outside of Israel or to outsource or transfer development or manufacturing activities with respect to any product or technology outside of Israel. Furthermore, the consideration available to our shareholders in a transaction involving the transfer outside of Israel of technology or know‑howknow-how developed with IIA funding (such as a merger or similar transaction) may be reduced by any amounts that we are required to pay to the IIA.
30
It may be difficult to enforce a judgment of a U.S. court against us, our officers and directors or the Israeli experts named in this annual report in Israel or the United States, to assert U.S. securities laws claims in Israel or to serve process on our officers and directors and these experts.
We are incorporated in Israel. All of our executive officers and three of our directors listed in this annual report reside outside of the United States, and most of our assets and most of the assets of these persons are located outside of the United States. Therefore, a judgment obtained against us, or any of these persons, including a judgment based on the civil liability provisions of the U.S. federal securities laws, may not be collectible in the United States and may not be enforced by an Israeli court. It also may be difficult for you to effect service of process on these persons in the United States or to assert U.S. securities law claims in original actions instituted in Israel. Israeli courts may refuse to hear a claim based on an alleged violation of U.S. securities laws reasoning that Israel is not the most appropriate forum in which to bring such a claim. In addition, even if an Israeli court agrees to hear a claim, it may determine that Israeli law and not U.S. law is applicable to the claim. If U.S. law is found to be applicable, the content of applicable U.S. law must be proven as a fact by expert witnesses, which can be a time‑consumingtime-consuming and costly process. Certain matters of procedure will also be governed by Israeli law. There is little binding case law in Israel that addresses the matters described above. As a result of the difficulty associated with enforcing a judgment against us in Israel, you may not be able to collect any damages awarded by either a U.S. or foreign court.
Your rights and responsibilities as a shareholder will be governed by Israeli law, which differs in some material respects from the rights and responsibilities of shareholders of U.S. companies.
Since we are incorporated under Israeli law, the rights and responsibilities of our shareholders are governed by our articles of association and Israeli law. These rights and responsibilities differ in some respects from the rights and responsibilities of shareholders in U.S.‑basedU.S.-based corporations. In particular, a shareholder of an Israeli company has a duty to act in good faith and in a customary manner in exercising its rights and performing its obligations towards the company and other shareholders and to refrain from abusing its power in the company, including, among other things, in voting at the general meeting of shareholders on certain matters, such as an amendment to the company’s articles of association, an increase of the company’s authorized share capital, a merger of the company and approval of related party transactions that require shareholder approval. A shareholder also has a general duty to refrain from discriminating against other shareholders. In addition, a controlling shareholder or a shareholder who knows that it possesses the power to determine the outcome of a shareholders’ vote or to appoint or prevent the appointment of an office holder in the company or has another power with respect to the company, has a duty to act in fairness towards the company. However, Israeli law does not define the substance of this duty of fairness. See “ITEM 6.C. Board Practices.” Some of the parameters and implications of the provisions that govern shareholder behavior have not been clearly determined. These provisions may be interpreted to impose additional obligations and liabilities on our shareholders that are not typically imposed on shareholders of U.S. corporations.
Additionally, the quorum requirements for meetings of our shareholders are lower than is customary for domestic issuers. As permitted under the Companies Law, pursuant to our articles of association, the quorum required for an ordinary meeting of shareholders will consist of at least two shareholders present in person, by proxy or by other voting instrument in accordance with the Companies Law, who hold at least 25% of our outstanding ordinary shares (and in an adjourned meeting, with some exceptions, any number of shareholders).shares. For an adjourned meeting at which a quorum is not present, the meeting may generally proceed irrespective of the number of shareholders present at the end of half an hour following the time fixed for the meeting.
General Risk Factors
If equity research analysts do not continue to publish research or reports about our business or if they issue unfavorable commentary or downgrade our ordinary shares, the price of our ordinary shares could decline.
The trading market for our ordinary shares relies in part on the research and reports that equity research analysts publish about us and our business. We do not have control over these analysts and we do not have commitments from them to write research reports about us. The price of our ordinary shares could decline if no research reports are published about us or our business, or if one or more equity research analysts downgrades our ordinary shares or if those analysts issue other unfavorable commentary or cease publishing reports about us or our business.
31
| A. | History and Development of the Company |
Our History
MediWound Ltd. (“MediWound”("MediWound") was founded in January 2000 with the goal of developing, manufacturing and commercializing novel products to address unmet needs in the fields of severe burns as well as chronic and other hard‑to‑heal wounds and connective tissue disorders. In December 2012, our innovative biopharmaceutical product, NexoBrid, received marketing authorization from the EMA for removal of dead or damaged tissue in adults with severe burns, and in December 2013, we launched NexoBrid in the European Union.
Principal Capital Expenditures
See “ITEM 5.B. Liquidity and Capital Resources.”
| B. | Business Overview |
We are a fully integrated biopharmaceutical company that develops, manufactures and commercializes novel, cost effective, bio-therapeutic solutions for tissue repair and regeneration. Our strategy is centered around our validated enzymatic platform technology, focused on developing, manufacturingnext-generation bio-active therapies for burn and commercializing novel therapeuticswound care and biological medicinal products to address unmet needs in the fields of severe burns, chronic and other hard‑to‑heal wounds, connectivefor tissue disorders and other indications. repair.
Our first innovative biopharmaceutical product, NexoBrid, has received marketing authorization from the EMA and the Israeli, Argentinean, South Korean, Russian and ArgentineanPeruvian Ministries of Health for removal of dead or damaged tissue, known as eschar, in adults with deep partial‑partial- and full‑thicknessfull-thickness thermal burns, also referred to as severe burns. NexoBrid, which is based on our patenteda concentrate of proteolytic enzyme technology,enzymes enriched in bromelain, represents a new paradigm in burn care management, and our clinical trials have demonstrated, with statistical significance, its ability to non‑surgicallynon-surgically and rapidly remove the eschar earlier relative to existing standard of care upon patient admission, without harming viable tissues. We have establishedIn September 2020, the FDA accepted for review our Biologics License Application (“BLA”) for NexoBrid for severe burns and assigned a commercial organization forPrescription Drug User Fee Act (“PDUFA”) goal date of June 29, 2021. The BLA submission includes a comprehensive set of manufacturing data and multiple preclinical and clinical studies, including the marketing, sales and distributionpivotal U.S. Phase 3 (“DETECT”) study of NexoBrid including European headquarters in Germanyadult patients with deep partial and/or full-thickness thermal burns up to 30% of total body surface area. The DETECT study successfully met its primary endpoint and all secondary endpoints, with a comparable safety profile.
We commercialize NexoBrid globally through multiple sales and marketing teams throughout Europe.channels. We sell NexoBrid to burn centers in Europe,the European Union, United Kingdom and Israel, primarily through our commercial organization,direct sales force, focusing on key burn centers and Key Opinion Leaders (“KOL”) management, while establishing additional local distribution channels to extend our outreach in the European Union. In the United States, we entered into exclusive license and supply agreements with Vericel to commercialize NexoBrid in North America upon FDA's approval. We have signed distribution agreements with local distributors in multiple international markets, which are responsible for obtaining local marketing authorization within the relevant territory.
EscharEx, our next-generation bioactive topical therapeutic under development, is a topical biological drug candidate for the debridement of chronic and other hard-to-heal wounds. EscharEx active substance (API) is a concentrate of proteolytic enzymes enriched in bromelain. In two phase 2 trials, EscharEx was well tolerated and has demonstrated safety and efficacy in the debridement of various chronic and other hard-to-heal wounds, within a few daily applications. EscharEx is an investigational product, currently under a U.S. phase 2 adaptive design study.
32
Our third innovative product candidate, MWPC005, is a topically applied biological drug candidate for the treatment of non-melanoma skin cancers, based on the same active substance of NexoBrid and EscharEx products, a concentrate of proteolytic enzymes enriched in bromelain. We have launched recently a new clinical development program to evaluate our drug product candidate MWPC005 in patients with non-melanoma skin cancer. The Clinical development of MWPC005 is supported by the results from several toxicological and other preclinical studies as well as vast clinical experience from NexoBrid in Argentina, through our local distributor, during 2016. We are conducting U.S. Phase 3 pivotal study to support a BLA submission toand EscharEx, which share the FDA and a pediatric Phase 3 study to broaden the approved indication of NexoBrid. same active substance..
We manufacture NexoBrid and our product candidates in our state‑of‑the‑art, EMA‑certified, cGMP‑compliant,state-of-the-art, cGMP-compliant, sterile pharmaceutical products manufacturing facility at our headquarters in Yavne, Israel.
Recent Developments
In January 2020, the U.S. Biomedical Advanced Research and Development Authority, or BARDA, initiated the procurement of NexoBrid valued at $16.5 million for emergency stockpile as part of the U.S. Department of Health and Human Services (“HHS”) mission to build national preparedness for public health medical emergencies. Inventory purchased by BARDA will be managed by MediWound under vendor-managed inventory. In August 2020, BARDA accepted the first shipment of NexoBrid.
In March 2020, BARDA expanded its award contract with us providing supplemental funding of $5.5 million to support emergency readiness for NexoBrid deployment upon request of use of NexoBrid in mass casualty situations. Under the modified contract, including this supplemental amount, BARDA has agreed to provide technical assistance and a total of $82 million in funding for NexoBrid development activities towards U.S. marketing approval from the FDA and the emergency readiness for NexoBrid deployment. The modified contract maintains a $10 million option to fund development of other potential NexoBrid indications, and an option to fund up to $50 million for additional NexoBrid procurement. See “Our Focus—Burn Care—BARDA Contracts" below.
In June 2020, we submitted a BLA to the FDA seeking the approval of NexoBrid for eschar removal in adults with deep partial-thickness and/or full-thickness thermal burns. While the BLA was being reviewed by the FDA, burn centers across the U.S. are treating burn patients under the NexoBrid expanded access (NEXT) protocol. In September 2020, the FDA accepted for review our BLA for NexoBrid and assigned a PDUFA goal date of June 29, 2021.
In October 2020, we completed the enrollment stage of our NexoBrid Phase 3 pediatric clinical study (CIDS). This followed the FDA’s agreement in September 2020 to allow the NexoBrid expanded access (NEXT) protocol to be expanded to include pediatric as well as adult burn patients.
In November 2020, we completed the U.S Phase 3 (DETECT) study including patient long-term safety follow-up. The twenty-four-month safety data of cosmesis and function was comparable across all study arms with no new safety signals observed.
In December 2020, we successfully completed a pre-clinical study designed to evaluate the debridement efficacy of EscharEx in a porcine hard-to-heal wound model and compare its efficacy with an FDA approved and commercially available collagenase enzymatic debridement agent. The study concluded that EscharEx treatment was more effective than the commercially available collagenase agent in removing eschars in this model.
In January 2021, due to COVID-19 related enrollment delays and potentially future COVID-19 pandemic related implications on the conduct of our clinical studies, we accelerated our EscharEx Phase 2 adaptive design study, for the treatment of venous leg ulcers (VLUs), by adjusting its enrollment target to 120 patients, down from the 174 originally planned.
In January 2021, we announced that we submitted a protocol to the FDA for a pharmacology study and are preparing to initiate this study in the first half of 2021. The study is an open label, single arm study assessing the pharmacological effects of EscharEx in up to 15 patients with VLUs or diabetic foot ulcers (DFUs), including the effects on biofilm burden and wound inflammation, as well as the impact of EscharEx on wound healing progression.
In February 2021, we launched a new clinical development program to evaluate our drug product candidate MWPC005 in patients with non-melanoma skin cancer. We have submitted a protocol to the FDA for a phase I/II clinical study of MWPC005 for the treatment of basal cell carcinoma (BCC) and are preparing to initiate this study in the United States in the second quarter of 2021. In Addition, an investigator-initiated trial of MWPC005 in non-melanoma skin cancer will be conducted in parallel at the Soroka Medical Center in Israel.
Our Focus:
Burn Care
NexoBrid, a concentrate of proteolytic enzymes enriched in bromelain, is an easy to use, topically‑appliedtopically-applied product that removes eschar in four hours without harming the surrounding healthy tissues. TheEschar removal of eschar is a procedure also known as debridement. Debridement is a critical first step in the successful healing of severe burns and chronic and other hard‑to‑healhard-to-heal wounds. Under existing SOC, burn eschar may be removed either by employing certain existing topical agents that have been found to be minimally effective or that take a significantly longer period of time to work, or by resorting to non‑selectivenon-selective surgery, which is traumatic and may result in loss of blood and viable tissue. NexoBrid’s rapid and selective debridement alleviates the known risks associated with eschar, such as infection, eventual sepsis, wound deterioration and consequential scarring, and it allows physicians to reach an informed decision on further treatment at an earlier stage by direct visual assessment of the actual burn depth. Furthermore, NexoBrid minimizes the burden associated with invasive surgical procedures, reduces the need for skin grafting and sacrifice of healthy tissue from donor sites on a patient’s body and generally results in a more favorable overall long‑termlong-term patient outcome. NexoBrid has been investigated in hundreds of patients across more than 1522 countries and four continents in sevennine completed Phase 2, and Phase 3 and post-marketing clinical studies. studies. Over 7,000 burn patients have been treated with NexoBrid in the market since 2013 and the safety and efficacy data reported from post marketing data sources are consistent with the data available from clinical trials and no new safety signals were observed.
There have been hundreds of presentations and several award winning abstracts of NexoBrid in international and national scientific conferences, and NexoBrid has been presented in over 30 peer‑reviewedabout 80 peer-reviewed papers, as well as in a chapter in Total Burn Care, a leading medical textbook, resulting in support from hundreds of burn specialists and key opinion leaders. Awareness of NexoBrid continues to grow through our marketing efforts in countries where NexoBrid is approved and continuedour and multinational clinical development.
Burn Wounds
Burns are life threatening and debilitating traumatic injuries causing considerable morbidity and mortality. A burn may result from thermal, electrical or chemical means that destroy the skin to varying depths. According to Critical Care, an international clinical medical journal, burns are also among the most expensive traumatic injuries because of long and costly hospitalization, rehabilitation and wound and scar treatment.
Most burn injuries involve part of or the entire thickness of the skin and in some cases, the deeper subcutaneous fat tissue or underlying structures. The severity of the burn depends on three main factors:
The extent of the surface that the burn occupies is usually referred to as percent of total body surface area (“TBSA”). A burn on an adult’s entire palm would generally amount to 1% TBSA, and the average hospitalized patient has a burn covering approximately 9% TBSA. Burns covering more than 15-20% TBSA usually require hospitalization and may result in dehydration, shock and increased risk of mortality. |
The depth of the burn, referred to in terms of “degree” is generally classified into four categories:
Superficial or first degree burns. Such burns do not penetrate the basal membrane and usually heal naturally. |
Dermal/partial thickness or second degree burns. Such burns are characterized by varying amounts of damaged dermis and can be further subdivided into superficial and deep |
Full thickness or third degree burns. Such burns are characterized by death of the entire dermal tissue down to the subcutaneous fat and must be debrided and treated by autografting, which is the process of harvesting skin from healthy donor sites on a patient’s body and transplanting it on the |
Fourth degree burns. Such burns, which are rare, extend beyond the subcutaneous fat tissue into the underlying structures, such as muscle or bone, and also require debridement and further substantial treatment. |
34
Other factors include the age of the victim, the body part where the burn occurred and any co-morbidities of the patient. For example, some patients may require hospitalization regardless of the TBSA or degree of the burn, such as children, the elderly or victims with burns to the extremities, joints or head/neck area or with co-morbidities such as smoke inhalation, diabetes or obesity.
When patients are hospitalized for a severe burn, the first step in the treatment after patient stabilization and resuscitation is usually eschar removal. The eschar is the burned tissue in the wound, which is deprived of blood and isolated from all natural systemic defense mechanisms. Debridement is an essential first step in the treatment of patients with severe burns, allowing for:
the prevention of local infection, sepsis (a systemic inflammatory response caused by severe infection) and additional damage to surrounding viable tissue; and
the initiation of the body’s healing process and scar prevention.
In addition to minimizing the possibility of additional complications, once the eschar is removed, a physician may properly diagnose the true extent of the trauma by a direct visual assessment of the clean wound bed. An informed treatment strategy can be decided upon only if the depth of the burn and extent of the tissue damage is known. Diagnosis of burn depth is difficult, especially because the burn commonly changes its appearance during the first days after injury due to burn progression. Burns that are initially difficult to classify due to the presence of eschar are referred to as “indeterminate” burns. This ambiguity can delay the assessment of the burn depth and formulation of proper treatment. Unless the burns are life‑threatening,life-threatening, definitive treatment is postponed for several days post‑injurypost-injury until diagnosis is clearer, when burn progression by death of the surrounding and underlying tissue has already occurred and ended. During this delay, local and systemic effects of post‑burnpost-burn inflammation and bacterial contamination can occur. Therefore, earlier, selective eschar removal is essential to prevent eschar‑relatedeschar-related complications and to allow the physician to reach an informed decision on further treatment.
Currently, there are two main treatment modalities for debridement:
Surgical debridement
Surgical debridement predominantly includes tangential excision, a procedure in which a surgeon amputates the entire dead tissue mass, layer after layer, down to healthy, viable tissue. The excision is extended into healthy intact tissue to make sure that no trace of the eschar remains, resulting in up to an estimated |
The benefits of surgical eschar removal are that it is usually fast and effective. Disadvantages include the significant trauma of the procedure, associated blood loss, risk of surgery in delicate areas of the body such as hands, added costs, and, most importantly, the loss of viable tissue that necessitates additional surgical procedures for harvesting skin from healthy donor sites and autografting. |
Due to the disadvantages of surgery in extensive burns some surgeons limit their debriding surgery to only a part of the affected area in a single session |
Non-surgical debridement
35
The benefits of this approach are that it is |
As demonstrated in our clinical trials, NexoBrid combines the advantages of surgical and non‑surgicalnon-surgical debridement modalities by providing fastrapid and effective eschar removal while not harming viable tissues. This allows for earlier direct visual assessment of the burn wound in order to formulate proper treatment.
Market Opportunity
Severe burns require specialized care in hospitals or burn centers. Approximately 100,000 patients with severe burns are hospitalized every year in the United States and Europe. The prevalence of patients with severe burns is even higher in emerging economies. For example, approximately 400,000 patients are hospitalized every year with burns in India according to a study conducted by IMS Health. The severe burn patients are predominantly treated by specialists in approximately 250 burn centers in Europe and the United States, as well as at burn units of large hospitals in Europe. We believe these patients can benefit from NexoBrid’s effective and selective, non-surgical eschar removal.
In addition to our current marketing of NexoBrid in Europe, we have signed local distribution agreements for distribution of NexoBrid in Europe, Latin America, certain Asia-Pacific countries, members of the Commonwealth of Independent States (“CIS”), and the Middle East and we plan to target additional markets in these territories by leveraging our approved registration file for additional regional marketing authorizations.
In addition to the market opportunities for NexoBrid discussed above, we believe that NexoBrid has the potential to play a critical role in the event of a mass casualty incident (“MCI”), which is generally defined as any incident in which emergency medical services resources, such as personnel and equipment, are overwhelmed by the number and severity of casualties. A variety of public emergencies may give rise to an MCI, such as terrorist attacks, natural disasters, fires and explosions. One example of an MCI is a mass burn casualty disaster, which is defined by the American Burn Association as a catastrophic event in which the number of burn victims exceeds the capacity of the local burn center to provide optimal care. If a significant number of burn victims arrive at a burn center following an event, some victims may go untreated until the bottleneck is resolved. The use of non-surgical means that are capable of providing rapid eschar removal without harming healthy tissues, particularly during public health emergencies, could potentially reduce the time, labor and resource burdens associated with the current standard-of-care, thereby enabling the treatment of more patients. In the event of a mass burn casualty disaster, healthcare professionals can use NexoBrid to begin treatment at the patient’s bedside without the need for a surgical team and facilities. NexoBrid has demonstrated in clinical studies, with statistical significance, its ability to non-surgically and rapidly remove eschar in a single four-hour application. Once the acute treatment has been completed, the wound can be covered with available means and further managed once the MCI is under control and the bottlenecks resolved. NexoBrid has been recognized by BARDA as a medical countermeasure for treatment of burns in the event of a MCI. We were awarded a contract by BARDA valued at up to $159 million for the advancement of the development, manufacturing, and procurement, of NexoBrid as a medical countermeasure as part of BARDA’s preparedness for mass casualty events.
BARDA Contracts
In September 2015, BARDA awarded us the First BARDA Contract for treatment of thermal burn injuries, which was valued at up to $112 million. In July 2017 and in May 2019, BARDA expanded its commitment by an aggregate supplemental amount of $41 million, and in March 2020, BARDA further expanded its commitment by additional $5.5 million to support emergency readiness for NexoBrid deployment upon request of use of NexoBrid in mass casualty situations (collectively the "First BARDA Contract").
The First BARDA Contract is our primary contract with BARDA and relates to the advancement of the development and manufacturing, as well as the procurement of NexoBrid as a medical countermeasure as part of BARDA preparedness for mass casualty events.
36
Under the First BARDA Contract, BARDA has agreed to provide technical assistance and a total amount of up to $82 million in funding for NexoBrid development activities towards U.S. marketing approval from the FDA. These activities include the NexoBrid Phase 3 (DETECT) study and subsequent requirements for BLA submission, the ongoing Phase 3 pediatric (CIDS) study and the NexoBrid expanded access treatment protocol (NEXT). In addition, BARDA committed for procurement of NexoBrid valued at $16.5 million for emergency stockpile as part of the HHS mission to build national preparedness for public health medical emergencies, which was initiated in January 2020. In August 2020, BARDA accepted the first shipment of NexoBrid. The contract further includes a $10 million option to fund development of other potential NexoBrid indications and an option to procure up to $50 million for additional NexoBrid.
In September 2018, BARDA awarded us the second BARDA contract (the "Second BARDA Contract"), which is an additional, separate contract to develop NexoBrid for the treatment of Sulfur Mustard injuries as part of BARDA’s preparedness for mass casualty events. The Second BARDA Contract provides approximately $12 million of funding to support research and development activities up to pivotal studies in animals under the U.S. FDA Animal Rule and contains options for BARDA to provide additional funding of up to $31 million for additional development activities, animal pivotal studies, and the BLA submission for licensure of NexoBrid for the treatment of Sulfur Mustard injuries.
The total aggregate value of funding for NexoBrid under the BARDA Contracts is up to $202 million. As of December 31, 2020, the Company has recorded $63 million in the aggregate, from BARDA under the two contracts, of which $5.8 million for procurement of NexoBrid.
Each BARDA contract may be terminated by BARDA at any time at BARDA’s discretion.
NexoBrid Clinical History
NexoBrid, our innovative biopharmaceutical product, has received marketing authorization from the EMA and the Israeli, Argentinean, South Korean, Russian and Peruvian Ministries of Health for the removal of eschar in adults with deep partial- and full-thickness thermal burns. The active ingredient of NexoBrid is a concentrate of proteolytic enzymes enriched in bromelain extracted from the pineapple stems. Proteolysis is a breakdown of proteins into smaller building blocks, polypeptides or amino acids. Our research and development strategy is centered around our validated proteolytic enzyme platform technology, focused on next-generation bio-active therapies for burn and wound care and biological medicinal products for tissue repair. Our research and development team further developed and optimized our enzymatic platform technology, which is the basis for NexoBrid, EscharEx and all other pipeline product candidates. One vial of NexoBrid containing 2 grams of concentrate of proteolytic enzymes enriched in bromelain is sufficient for treating a burn wound area of 1% total body surface area (TBSA).
We developed NexoBrid to fulfill the previously unmet need for a non-surgical effective and selective debriding agent that combines the efficacy and speed of surgery with the non-invasiveness of non-surgical methods. NexoBrid enhances the ability of physicians to conduct an earlier direct visual assessment of the burn depth to reach an informed decision on further treatment as well as to reduce the surgical burden and achieve a favorable long-term patient outcome.
37
NexoBrid has been investigated in hundreds of patients across 22 countries and four continents in nine completed Phase 2 and Phase 3 and post-marketing clinical studies. While we are marketing our product for the removal of eschar in burn wounds under the name “NexoBrid,” in clinical trials the product has been referred to as “Debridase” and “Debrase.”
The following table sets forth information regarding the completed clinical trials of NexoBrid:
| Trial 1 | Trial 2 | Trial 3 | Trial 4 | Trial 5 | Trial 6 | Trial 7 | Trial 8 | Trial 9 | |
| Study Type | Retrospective Phase 2 Investigator initiated | Dose range Phase 2 | Prospective Phase 2 IND/FDA | Phase 2 IND/FDA | Phase 3 EMA | Phase 3b EMA | Phase 2 EMA | Post approval safety study EMA | Phase 3 IND/FDA |
| Design | Data collected from files of patients treated with NexoBrid | Parallel, controlled, observer- blind, randomized, single-center | Parallel, controlled, observer- blind, three-arm, randomized, multi-center | Parallel, controlled, open label, three-arm, randomized, single-center | Parallel, controlled, open label, two-arm, randomized, multi-center | Parallel, controlled, blinded, two-arm, multi-center | Open label, single-arm, multi-center | Observational retrospective data collection | Parallel, controlled, open label, three-arm, randomized, multi-center |
| Main Objectives | Safety and efficacy | Comparison of efficacy and safety | Safety and efficacy | Safety | Safety Efficacy | Long-term scar assessment Quality of life | Safety and pharmacokinetics Efficacy | Effectiveness of the risk minimization activities | Safety Efficacy |
| Wound Types | Deep partial/full thickness thermal burns | Deep partial /full thickness thermal burns | Deep partial /full thickness thermal burns | Deep partial /full thickness thermal burns | Deep partial/ full thickness thermal burns | Scar formation | Deep partial/full thickness thermal burns | Burns which were treated with NexoBrid in the market | Deep partial/ full thickness thermal burns |
| Number of Patients | 154 | 20 | 140 | 30 | 182 | 89 | 36 | 160 | 175 |
| Study Length | 1985-2000 | 2002-2005 | 2003-2004 | 2006-2007 | 2006-2009 | 2011 | 2009-2015 | 2017-2019 | 2015-2020 |
| Location | Israel | Israel | International | United States | International | International | International | Europe | International |
Recent completed clinical trials
U.S. Phase 3 Study – DETECT study
The DETECT study is a prospective, multicenter, multinational, randomized, controlled, assessor blinded Phase 3 study, performed in subjects with thermal burns, to evaluate the efficacy and safety of NexoBrid compared to Gel Vehicle and compared to SOC in 175 hospitalized patients with severe burns of up to 30% TBSA randomized in a 3:1:3 ratio, with 12-month and 24-month follow-ups. The study involves 44 burn centers. The study objectives are to evaluate the efficacy and safety of NexoBrid by removing burn eschar earlier and reducing surgical burden and related blood loss in hospitalized patients with severe burns. Complete eschar removal was the primary endpoint of the study and was tested against the Gel Vehicle control arm. The primary analysis was based on whether complete eschar removal was achieved in all target wounds of a patient. The analysis compared all randomized patients to the NexoBrid arm to all randomized patients to the Gel Vehicle control arm. Secondary endpoints included reduction in the need for surgical eschar removal (surgical burden), earlier eschar removal, and blood loss, which were tested against the SOC control arm. All secondary endpoints were analyzed and compared all patients randomized to the NexoBrid arm to all patients randomized to the SOC control arm. In January 2019, we announced positive top-line results. The study met its primary endpoint with statistical significance. Patients treated with NexoBrid demonstrated a significantly higher incidence of complete eschar removal compared with patients treated with the Gel Vehicle (NexoBrid: 93.3% (70/75) vs. Gel Vehicle: 4.0% (1/25), p<0.00011).
________________________________________
1 Fisher's exact test
38
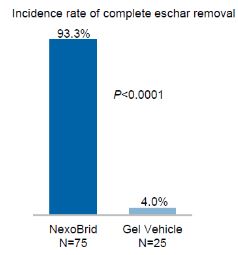
The study included secondary endpoints that were all met with statistical significance and provided further insight on several efficacy parameters: (i) Patients treated with NexoBrid demonstrated shorter time to achieve complete eschar removal compared with patients treated with SOC (median time - NexoBrid: 1 day vs. SOC: 3.8 days, p<0.00012); (ii) Patients treated with NexoBrid demonstrated a significantly lower incidence of surgical eschar removal compared with patients treated with SOC (NexoBrid: 4.0% (3/75) vs. SOC: 72.0% (54/75), p<0.00013); (iii) and Patients treated with NexoBrid incurred significantly lower blood loss during the eschar removal procedure compared with patients treated with SOC (mean volume – NexoBrid: 14.2 ml vs. SOC: 814.5 ml, p<0.00014). In addition, Patients treated with NexoBrid had a non-inferior time to complete wound closure compared with patients treated with SOC (p=0.00035). The study Data Safety Monitoring Board ("DSMB") concluded after all patients have been treated, that the overall safety profile of NexoBrid in the study is consistent with the safety data known from previous studies.
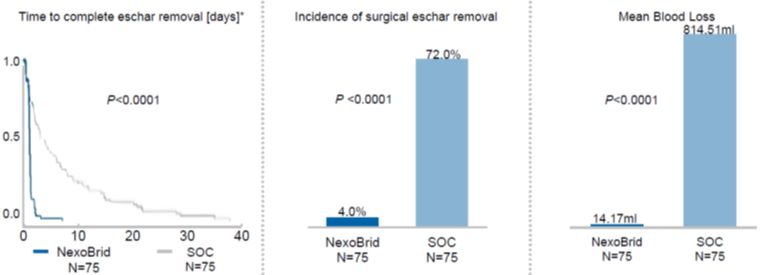
The twelve- and twenty four-month patients’ follow-up safety data of cosmesis, function and quality of life were found to be comparable across all study arms, and no new safety signals were observed.
In September 2020, the FDA accepted for review our BLA for this indication and assigned a PDUFA goal date of June 29, 2021. The BLA submission includes a comprehensive set of manufacturing data and multiple preclinical and clinical studies including the DETECT study and the 12-month safety data follow-up. The 24-month safety data will be submitted as a safety labeling update as part of a post-approval commitment, if our BLA is approved, as was agreed with the FDA at a pre BLA submission meeting held at the end of July 2019.
_______________________________
2 Generalized Wilcoxon-Gehan test
3 Logistic regression model - Wald test
4 Wilcoxon test pooled using Rubin's rules
5 Accelerated failure time model
* Kaplan-Meier analysis
39
The study also serves to address our post approval commitment to EMA. This study is funded by BARDA. See “—BARDA Contracts” above.
Ongoing clinical trials
Pediatric investigational plan – CIDS study
The CIDS study is a Phase 3, multicenter, multinational, randomized, controlled, open-label study in children with thermal burns. The study objectives are to evaluate the efficacy and safety of treatment with NexoBrid compared with SOC in hospitalized children with severe thermal burns of 1% to 30% total body surface area (TBSA). We expanded this study also to United States burn centers, following approval of the study protocol by the FDA. The study is underway in accordance with a study design endorsed by the FDA and the EMA as part of the agreed Pediatric Investigational Plan (“PIP”) to support extension of the indication to pediatric patients. The CIDS study includes pediatric patients of all ages, from newborn to eighteen years of age, offering NexoBrid to this important and sensitive group of patients. The primary endpoints evaluate early eschar removal, surgical burden and cosmesis and function with a 12-month follow-up. In October 2020, we completed the enrollment stage of the study. Interim results after a 12-month follow-up of all patients are expected to be available in the second half of 2021, with final results available in the second half of 2022. This study is funded by BARDA. See “—BARDA Contracts” above.
Expanded access treatment protocol (NEXT)
The NEXT protocol, which we initiated in October 2019, is an open-label, single-arm treatment protocol which allows for the treatment of up to 150 burn patients with deep partial- and full-thickness thermal burns up to 30 percent of total body surface area. NEXT has been designed to be consistent with current real-life burn treatment practices in the U.S. and up to 30 U.S. burn centers are anticipated to participate. We received FDA concurrence that patients can be treated under the NEXT protocol in a burn MCI that is not a declared national emergency. We have provided documents for consideration by the FDA supporting the use of NexoBrid in a declared national medical emergency contingent upon the FDA issuance of an Emergency Use Authorization (EUA). The EUA is a mechanism by which the FDA can allow an unapproved medical product that qualifies as a mass casualty medical countermeasure to be used in a public health emergency. In September 2020, the FDA agreed to allow the NEXT protocol to be expanded to include pediatric as well as adult burn patients. NEXT protocol is being funded by BARDA. See “—BARDA Contracts” above.
Wound Care
Our second innovative product candidate, EscharEx, is a bio-active therapeutic product under development in the United States for debridement of chronic and other hard-to-heal wounds and is complementary to the large number of existing advanced wound healing therapies, which require a clean wound bed in order to heal the wound. EscharEx active substance (API) is a concentrate of proteolytic enzymes enriched in bromelain and as such, benefits from the wealth of existing development data on NexoBrid. The mechanism of action of EscharEx is mediated by the proteolytic enzymes that cleaves and removes the necrotic tissue and prepare the wound bed for healing. In two Phase 2 studies that we conducted, EscharEx well-tolerated and demonstrated safety and efficacy in the debridement of chronic and other hard-to-heal wounds, in a few daily applications. In the U.S, we are conducting a Phase 2 adaptive design clinical study with the second generation EscharEx, for the treatment of venous leg ulcers (VLUs). The study is built on the positive data from the completed Phase 2 study of the first-generation EscharEx. The study is designed to assess the safety and efficacy of EscharEx compared to gel vehicle (placebo control) and non-surgical standard-of-care (either enzymatic or autolytic debridement).
40
Chronic and Other Hard‑to‑HealHard-to-Heal Wounds
The chronic and other hard‑to‑healhard-to-heal wound market consists of a broader addressable population of more than 14 million patients in Europe and the United States alone suffering from chronic wounds such as DFUs, VLUs, andDiabetic Foot Ulcers (DFUs), pressure ulcers and additional patients suffering from surgical/traumatic hard‑to‑healhard-to-heal wounds. Chronic and other hard‑to‑healhard-to-heal wounds represent a $25 billion burden to the U.S. healthcare system. Chronic and hard‑to‑healhard-to-heal wounds are caused by impairment in the biochemical and cellular healing processes due to local or systemic conditions and generally can take several weeks to heal, if not longer. Such wounds can lead to significant morbidity, including pain, infection, impaired mobility, hospitalization, reduced productivity, amputation and mortality. In each of the various wound types, the presence of the eschar is a frequent cause for “chronification” of wounds and the removal of eschar is the key step to commence healing. Eschar needs to be removed to prevent further deterioration of the wound that may result in additional adverse patient outcomes. If not effectively treated, these wounds can lead to potentially severe complications including further infection, osteomyelitis, fasciitis, amputation and mortality. Most advanced wound care therapies, including negative pressure wound therapy, such as V.A.C. Therapy, and skin substitutes such as Apligraf andDermagraftand Dermagraft and human amniotic tissue products, are complementary to our lead product candidate, EscharEx, as these products require a clean wound bed to effectively heal a wound. Four common chronic and other hard‑to‑healhard-to-heal wounds are:
Venous leg ulcers. VLUs develop as a result of vascular insufficiency, or the inability for the vasculature of the leg to return blood back toward the heart properly. Based on our comprehensive market research study on EscharEx that involved more than 200 healthcare professionals in the U.S. and Europe, which was updated in 2019, the VLU overall prevalence is approximately 3.3 million (1% of total U.S. population). Furthermore, the annual incidence of VLUs in the U.S. alone, is approximately 960,000 (accounting for 45% recurrence), of which approximately 690,000 undergo debridement in a given year. These ulcers usually form on the sides of the lower leg, above the ankle and below the calf, and are slow to heal and often recur if preventative steps are not taken. The risk of VLUs can increase as a result of a blood clot forming in the deep veins of the legs, obesity, smoking, lack of physical activity or work that requires many hours of standing. |
Pressure ulcers form as a result of pressure sores, or bed sores, which are injuries to the skin or the tissue beneath the skin. Constant pressure on an area of skin reduces blood supply to the area and over time can cause the skin to break down and form an open ulcer. These often occur in patients who are hospitalized or confined to a chair or bed, and usually form over bony areas, where there is little cushion between the bone and the skin, such as lower parts of the body. Annually, 2.5 million pressure ulcers are treated in the United States in acute care facilities alone.
Surgical/traumatic wounds. Surgical wounds form as a result of various types of surgical procedures such as investigative or corrective, minor or major, open (traditional) or minimal access surgery, elective or emergency, and incisions (simple cuts) or excision (removal of tissue), among others. Traumatic wounds form as a result of cuts, lacerations or puncture wounds, which have caused damage to the skin and underlying tissue. Severe traumatic wounds may require surgical intervention to close the wound and stabilize the patient. Surgical/traumatic hard-to-heal wounds develop for various reasons, such as local surgical complications, suboptimal closure techniques, presence of foreign materials, exposed bones or tendons and infection. In the United States, millions receive post-surgical wound care annually.
Market Opportunity
Currently, SOC for connective tissue disorders involvessurgery (sharp debridement) is generally considered a first-line option. Sharp debridement is an effective method to debride a wound, however, requires surgically skilled physicians performing surgery with patients under, anesthesia, which in elderly patients with various co-morbidities is accompanied with a higher risk of local and systemic complications. Surgery may also involve hemorrhage which could be more difficult to control due to a high incidence of use of anticoagulants in this population. Surgery on wounds may very high recurrence rate,easily become infected with the infection propagating to surrounding soft and some non‑surgical alternatives. Oneboney tissues ending in life threatening major complication or amputation. Very often even minor, limited sharp debridement exposes other sensitive tissue, such alternativeas tendons, deep vessels/nerves and bones that may become infected or may be severely damaged, necessitating additional, more extensive debridement or even amputation. Due to these limitations, chronic wounds are treated by conservative methods while autolytic and enzymatic debridement are most commonly-used non-sharp methods. This includes commercial enzymes, hydrogels and other topical dressings, which require numerous application sessions and a long time to achieve a clean wound bed, if they achieve this at all. Thus, there is an unmet medical need for a non-surgical rapid and effective debridement agent for the treatment of Dupuytren’soutpatient setting, nursery care facilities and Peyronie’s diseases is Xiaflex, a collagenase‑based injectable enzyme that has received orphan drug status in the United States.
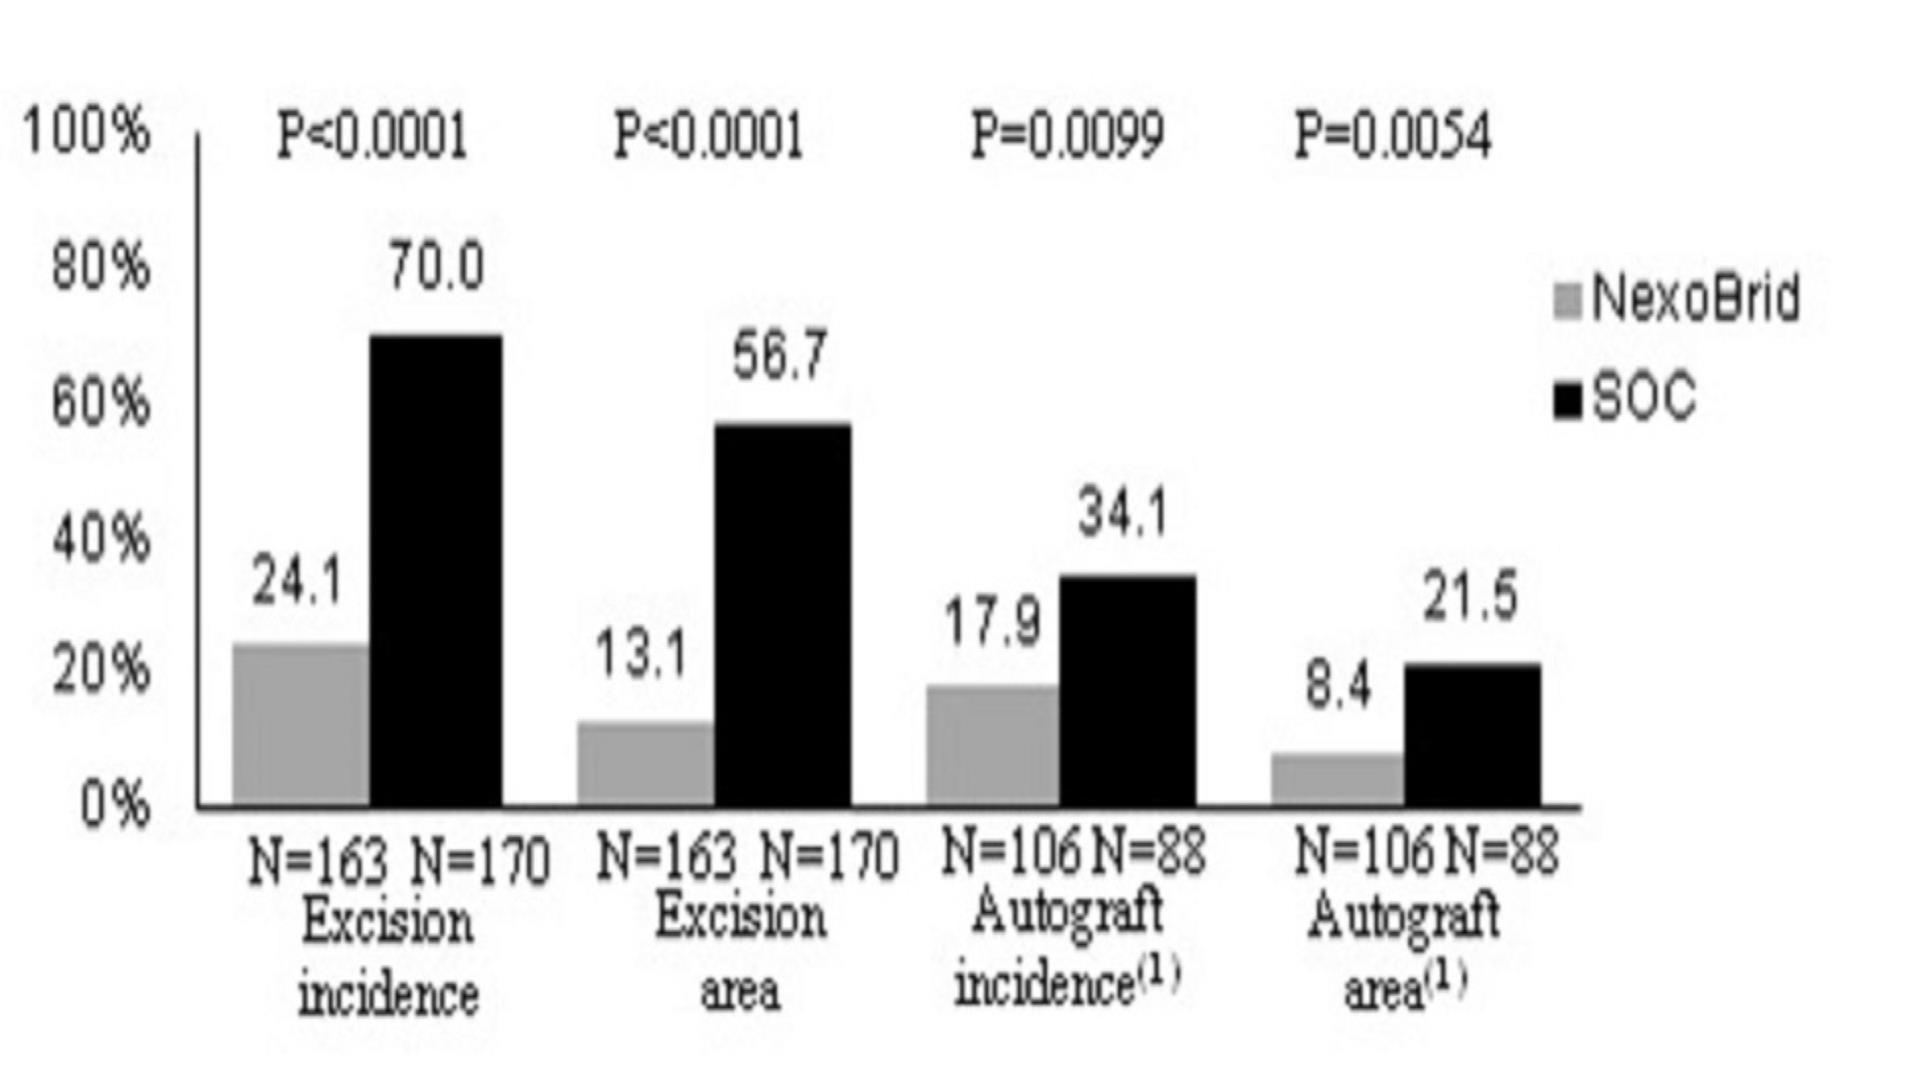
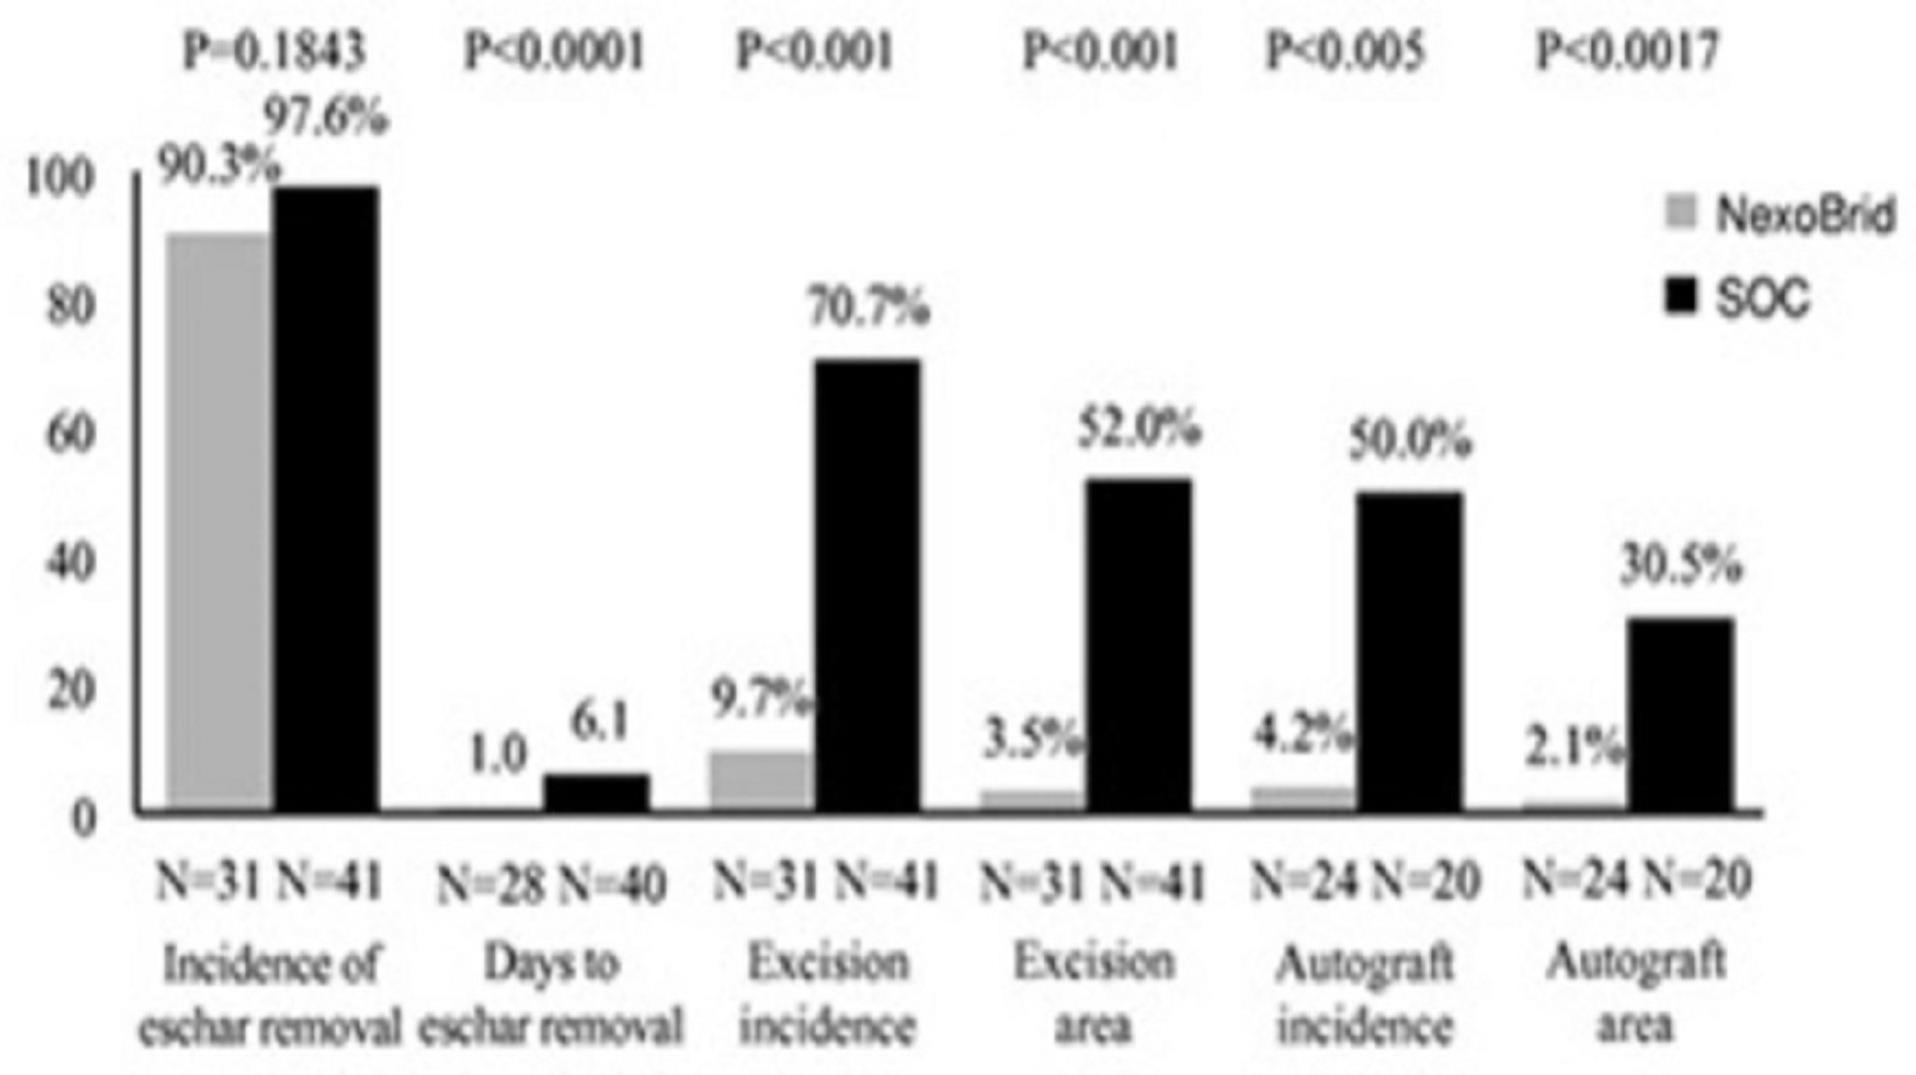
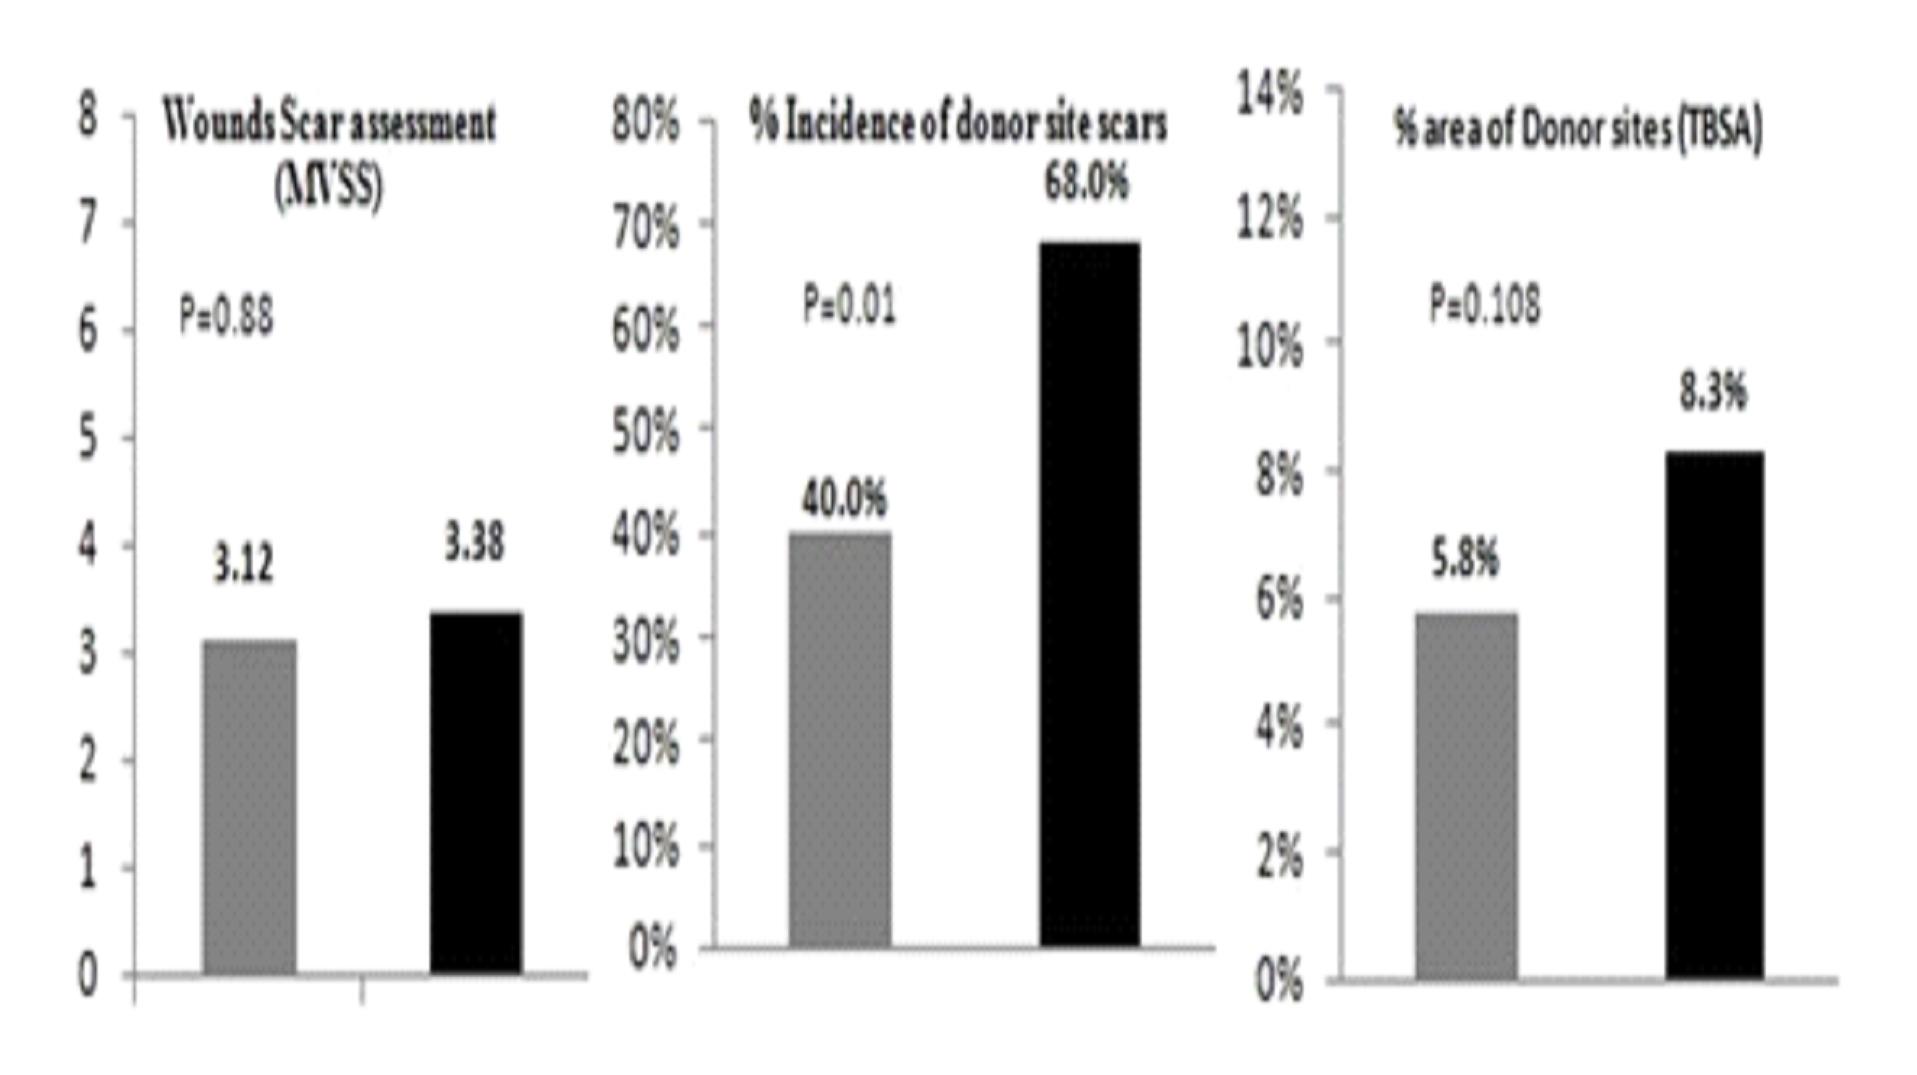
surgery.
41
EscharEx and Our Clinical History
EscharEx is a topical agent being developed for debridement of chronic and other hard‑to‑healhard-to-heal wounds, in order to fulfill an unmet need for ana non-surgical rapid and effective and non‑surgical debridement mean. EscharEx is based on the same patented proteolytic enzyme technologyactive substance as NexoBrid but differs in other aspects, such as in formulation and presentation. Based on our current pre-clinical studies, the second generation EscharEx demonstrated even higher potency in lower doses, which could further contribute to EscharEx’s efficacy and tolerability. This advanced generation of EscharEx has been designed in accordance with the current treatment workflow and reimbursement programs, providing a non-surgical easy-to-use, potent product for daily application, which we believe will enhance patient compliance and improve quality of care. Based on the feedback received from different stakeholders, we believe that our second generation EscharEx can better address the unmet medical need for a non-surgical rapid and effective product, particularly in the outpatient setting, where the majority of patients are treated, and has a greater potential to achieve substantial market share.
Second generation EscharEx is more differentiated from NexoBrid, which further limits the chances for competition between the two products.
Non-clinical safety studies performed with NexoBrid support EscharEx development, and we have already completed successfully bridging toxicology studies. In a pre-IND meeting the FDA stated that existing toxicology data for EscharEx, including cross-referenced NexoBrid data, could be sufficient to support initiation of clinical studies in the product. The FDA also stated that the second generation EscharEx formulation, manufacturing process and controls were sufficient to initiate dosing in Humans.
Completed clinical trials
We completed a first Phase 2 feasibility study in Israel for chronic and other hard‑to‑healhard-to-heal wound technology. In January 2017 we announced the final results of a second Phase 2 prospective study in Israel and Europe. In November 2017, we announced the final results of a second cohort of the second Phase 2 study. Based on the completed studies, we believe that our technology may be effective for debridement of chronic and other hard‑to‑healhard-to-heal wounds.
First Phase 2 feasibility study—Israel
This first Phase 2 feasibility study was conducted in Israel to study the efficacy of our technology on chronic and other hard‑to‑healhard-to-heal wounds. The study assessed 24 patients at two sites. The results showed that our technology was effective in debriding various chronic and other hard‑to‑healhard-to-heal wound etiologies, such as DFUs, VLUs, pressure sores and trauma on diseased skin.
Second Phase 2 study—Israel/E.U. – First Cohort
This second Phase 2 prospective study was conducted in Israel and Europe to evaluate the efficacy and safety of EscharEx in comparison to the Gel Vehicle1 at a ratio of 2:1 for the treatment of a variety of chronic and other hard‑to‑healhard-to-heal wounds, in three etiologies, DFUs, VLUs and post‑surgicalpost-surgical or traumatic hard‑to‑healhard-to-heal wounds. This was a prospective, controlled, assessor‑blinded,assessor-blinded, randomized, multi‑centermulti-center Phase 2 study in Israel and Europe.
The primary endpoint assessed incidence of complete non‑viablenon-viable tissue removal (debridement) at the end of the debridement period (up to 10 treatment days)daily applications) and the secondary endpoints assessed various efficacy and safety endpoints, including wound bed preparation and wound healing.
In January 2017 we reported final results of the first cohort of 73 patients.
patients.The average wound age in the EscharEx arm was more than double (72.8 weeks) that of the gel vehicle group (30.8 weeks). The average wound size was 33.6 cm2 in the EscharEx arm vs. 25.8 cm2 in the gel vehicle group. Despite the larger wounds and that wounds treated with EscharExwereEscharEx were older than wounds treated with gel vehicle (72.8 vs. 30.8 weeks), the study met its primary endpoint, as EscharEx demonstrated a statistically significant higher incidence of complete debridement at the end of the debridement period. Patients treated with EscharEx demonstrated a higher incidence of complete debridement (55% or 27/49) compared with patients treated with the hydrogel6 vehicle (29% or 7/24) with p=0.047.
42
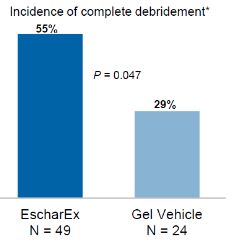 *w/i 10 daily applications
Predefined sub‑groupsub-group analyses showed that 50% of patients with DFUs treated with EscharEx (8/16) achieved complete debridement at the end of the debridement period compared with 14.3%14.3% of patients with DFUs treated with hydrogel vehicle (1/7). In addition,, 62.5% of patients with VLUs treated with EscharEx (10/16) achieved complete debridement at the end of the debridement period compared with 25% of patients with VLUs treated with hydrogel vehicle (2/8). Post hoc analysis showed that 56.3% of patients with DFU or VLU in the EscharEx group had complete debridement at the end of the debridement period compared with 20.0% in hydrogel vehicle group (p=0.028).
The study included secondary endpoints that provide further insight into number of efficacy and safety parameters. The secondary endpoint of time to complete debridement demonstrated a clear trend (p=0.075) that strongly suggests that not only is there a difference in the incidence of debridement, as confirmed by the primary endpoint, but that debridement occurred earlier in the group treated by EscharEx. The advantage in time to complete debridement was corroborated by the statistically significant post hoc result in the subgroup of patients with DFUs or VLUs that were treated with EscharEx (p=0.024).
Post hoc analysis showsshowed that of patients thatwho achieved complete debridement in the EscharEx group, 93% (25/27) completed the debridement within 7 days (4‑5(4-5 applications on average).
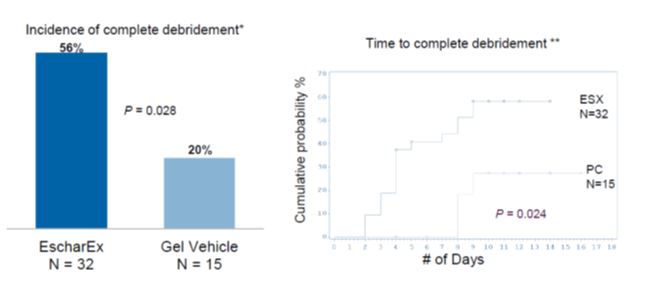
The overall patient demographics were comparable across both arms. No deleterious effect on wound healing was observed and no material differences were found in reported adverse events. The overall safety was comparable between the arms.
Second Phase 2 study—Israel/E.U. – Second Cohort
After successfully completing the first cohort of the study which included 73 patients recruited in 15 clinical sites, we initiated a second cohort of patients to demonstrate safety and tolerability over extended periods of application to further support the product’s convenient application. In this second cohort, we recruited 38 patients from two etiologies, either DFUs or VLUs, over extended periods of application (24‑72(24-72 hours) inwith up to eight applications, randomizing the patients to two study arms EscharEx or gel vehicle at a ratio of 2:1. The second cohort of the study included 38 patients. The primary objective was to assess safety.
6 Hydrogel is not a true sham placebo as it is a common and widely used treatment for the debridement of the second cohort of 38 patientschronic wounds.
43.
EscharEx met its primary safety endpoint in this cohort, and the overall patient demographics and wound baseline characteristics were comparable across the arms in the second cohort. No related systemic adverse events were reported and adverse events related to local application were mild to moderate, reversible and resolved during the trial. Vital signs, pain scores, infection rates, laboratory parameters and blood loss were comparable between the two arms of the trial. Overall, no material safety concerns were identified.
Ongoing clinical trials
EscharEx U.S. Phase 2 Adaptive Design Study in Venus Leg Ulcer (VLU) Patients
In December 2019, we initiated a U.S. Phase 2 adaptive design clinical study of EscharEx for the treatment of venous leg ulcers (VLUs). The study is designed to assess safety and efficacy of EscharEx compared to gel vehicle (placebo control) and non-surgical standard-of-care (either enzymatic or autolytic debridement), and includes a pre-defined futility analysis and sample size adjustment interim assessment.
efficacy results demonstrated in a previous Phase 2 clinical study with first generation EscharEx.
We continue to document that actively recruit patients and anticipate an interim assessment in mid-2021, complete patients' enrollment by the end of 2021 and top-line data in the second half of 2022.
EscharEx has no deleterious effect on wound closure. This design was used in ourPharmacology Study
We recently reported successful second Phase 2 study as well as in our on‑going NexoBrid U.S. Phase 3 study in burns. We have been working with U.S. experts to optimize the EscharEx clinical program and plan to finalize the preparations and submitsubmitted a protocol to the FDA for a pharmacology study and are preparing to initiate this study in the first half of 2021. The study is an open label, single arm study assessing the pharmacological effects of EscharEx in up to 15 patients with VLUs or DFUs, including the effects on biofilm burden and wound inflammation, as well as the impact of EscharEx on wound healing progression. We expect data from this study in the second half of 2018.
The development of EscharEx for chronic and other hard‑to‑healhard-to-heal wound indications is in Phase 2 studies, and there is no certainty that EscharEx will achieve all of the objectives of the trials as required or that the FDA will allow at this stage to initiate Phase 3further studies or that we will successfully complete the development to obtain a marketing authorization for EscharEx. See “ITEM 3.D. Risk Factors—Development and commercialization of NexoBrid and EscharEx in the United States and our pipeline product candidates worldwide requires successful completion of the regulatory approval process, and may suffer delays or fail.”
Non-Melanoma Skin Cancer
MWPC005, is a topically applied biological product candidate for the treatment of non-melanoma skin cancers, based on the same active substance of NexoBrid and EscharEx, a concentrate of proteolytic enzymes enriched in bromelain. The clinical development plan of MWPC005 is supported by the results from several toxicological and other preclinical studies, as well as vast clinical experience from NexoBrid and EscharEx, which share the same active substance. We have recently launched a new clinical program to evaluate its drug product candidate MWPC005 in patients with non-melanoma skin cancer.
44
Non-melanoma Skin Cancers
Cancers of the skin are by far the most common of all types of cancer with about approximately 5.4 million basal and squamous cell skin cancers are diagnosed each year in the US. The number of these cancers has been increasing for many years due to combination of better skin cancer detection, people getting more sun exposure, and people living longer.
Basal cell carcinomas - basal cell carcinoma (BCC) starts in the basal cell layer, which is the lower part of the epidermis. If not removed completely, basal cell carcinoma can come back (recur) in the same place on the skin. People who have had basal cell skin cancers are also more likely to get new ones in other places. BCCs are uncontrolled and abnormal growths that arise in the basal cells of the skin and the tumors primarily affect photoexposed areas, most commonly in the head, and infrequently appear on per genital and genitalia regions. The main cause of BCC is chronic ultraviolet (UV) exposure. BCC is the most common form of skin cancer, accounting for 75-80% of all skin cancers
Squamous cell carcinomas - Squamous cell carcinomas (SCC) start in the flat cells in the upper (outer) part of the epidermis
Actinic keratosis - Actinic keratosis (AK), also known as solar keratosis, is a pre-cancerous skin condition caused by too much exposure to the sun. People who have them usually develop more than one. A small percentage of AKs may turn into squamous cell skin cancer.
Bowen disease - Bowen disease (squamous cell carcinoma in situ), is the earliest form of squamous cell skin cancer
Market opportunity
Basal cell carcinoma is a non-melanoma skin cancer that arises from the basal layer of epidermis and its appendages and is the most diagnosed skin cancer in the US (~4.3 million cases annually).
Under existing standard of care, low-risk patients are treated with tumor resection via either standard surgical excision or Mohs micrographic surgery. Recurrence rates for these sharp methods of tumor removal are low (~5% at 5 years), and procedure is considered straightforward with limited patient downtime or side effects. Topical products (5-FU and Imiquimod) are used primarily in superficial lesions, but have limited use and are reserved for surgery ineligible patients. Drawbacks include longer treatment duration (>6 weeks), low efficacy (~14% at 5 years), and side effects such as scarring, skin-site reactions, and fatigue/flu-like illness. High-risk patients are also primarily treated with surgery; surgery-ineligible patients are treated with oral hedgehog pathway inhibitors, which are effective in the short-term, but have high recurrence rates / safety concerns. There is a need for more effective, safer topical products in low-risk superficial basal cell carcinoma for surgery-ineligible patients (e.g., site of tumor is challenging for excision or may result in cosmetic issues) or for patients for whom surgery is not appropriate (e.g., older / frail patients, or those with challenges in seeking pre and post-surgical appointments) and current topical agents may be avoided due to long treatment durations and because they result in an unpleasant treatment process for patients.
MWPC005 Clinical History
Ongoing clinical trials
U.S. Phase I/II Study in basal cell carcinoma Patients
We recently submitted a protocol to the FDA for a phase I/II clinical study of MWPC005 for the treatment of low-risk basal cell carcinoma and are preparing to initiate this study in the United States in the second quarter of 2021. The phase I/II open-label, randomized clinical study in BCC is designed to evaluate safety and tolerability of MWPC005 using different schedules of administration, as well as provide a preliminary evaluation of efficacy as measured by the percentage of target lesion with complete histological clearance. The trial will enroll up to 32 patients with histologically confirmed superficial or nodular BCC and will be conducted at three leading clinical centers in the U.S.
Although we have conducted preclinical trials, the development of MWPC005 for non-melanoma skin cancer indications is still in its preliminary phase and there is no certainty that it will achieve all the aims of the trials as required and/or successfully complete the approval process for such indication. See “ITEM 3.D. Risk Factors—Development and commercialization of NexoBrid and EscharEx in the United States and our pipeline product candidates worldwide requires successful completion of the regulatory approval process, and may suffer delays or fail.”
45
Other Therapeutics
We are also using our patented enzymatic platform technology, which underlies NexoBrid, and our wealth of data and experience gained during the NexoBrid development, to support the development of an injectable product for treatment of other indications of connective tissue disorders and scars, such as:
Dupuytren’s disease: a condition where one or more fingers are permanently flexed, caused by the formation of scar-like tissues below the palmar skin (Palmar Fascia), forming hard “cords” that freeze the fingers in non-functional flexion contraction. This condition affects approximately 6.2 million people in the United States alone.
Peyronie’s disease: the development of scar-like tissue, similar to Dupuytren’s cords in the shaft of the penis, causing pain and distortion on erection, preventing intercourse. Peyronie’s disease is typically caused by trauma and affects men over 50 years old. Surgical treatment may be an option in some cases, but can cause complications and may result in a shortening and even greater distortion of the penis. Approximately 3.7% to 7.1% of the male population above the age of 50 suffers from Peyronie’s disease in the United States and approximately 3.2% of such age group suffer from the disease in Europe.
Frozen shoulder syndrome: a disorder that causes the smooth tissues of the shoulder capsule to become thick, stiff and inflamed, affecting approximately 2% to 5% of the worldwide population and 10% to 20% of people with diabetes according to industry sources.
Excessive/unaesthetic scars: A scar is a mark on the skin which is formed due to infection, injury, surgery, inflammation of tissue, burns, and acne. Scars can be of various sizes, shapes, and colors, depending on the age of the scar, the site of the scar and family history. Scar formation is unpredictable and varies from person to person. Excessive scarring can have unpleasant physical, aesthetic, psychological and social consequences. Estimates indicate that each year around 100 million people in the developed world acquire scars following elective surgery and surgery for trauma. Of these, approximately 15% have excessive or unaesthetic scars.
MWPC003 and Our Pre‑ClinicalPre-Clinical History
We have performed preclinical model studies in Israel for the use of our patented proteolytic enzyme technology in treating connective tissue disorders. Our technology has shown promising results in preclinical model studies for the treatment of connective tissue pathologies. We are advancing the in‑househad established in-house production capacity of the injectable formulation and completed local toxicology studies to potentially allow us to initiate the clinical development of our pipeline product candidate, MWPC003, for connective tissue disorders.
We have 634 patents (in the United States and in other international markets) and 82 patent applications for MWPC003. These patents provide broad protection for the specific mixture of proteolytic enzymes in the treatment of a variety of connective tissue diseases. The patents are nominally set to expire on July 19, 2032.
Preclinical model study—Israel
In preclinical model studies, excised Dupuytren cords were injected with either MWPC003 or a saline solution (control) following Starkweather’s ex‑vivoex-vivo validated model. MWPC003 repeatedly provided enzymatic degradation of Dupuytren cords (fasciotomy) in a tearing test model confirming with statistical significance that MWPC003 completely dissolves Dupuytren’s cords (Fisher Exact test p<0.0001). In a second ex vivo study conducted in 71 cords injected with MWPC003 in descending doses, it was demonstrated that even very small doses of MWPC003 can dissolve the pathological cord in more than 80% of cases with the Cochran‑ArmitageCochran-Armitage test (p=0.0021) indicating that the probability for cord dissolution increases as the dose increases. Toxicology studies conducted in two species did not indicate systemic toxicity and the intra‑dermalintra-dermal local effect was reversible.
46
Although we have conducted preclinical trials, the development of MWPC003 for connective tissue disorder indications is still in its preliminary phase and there is no certainty that it will achieve all the aims of the trials as required and/or successfully complete the approval process for such indication. See “ITEM 3.D. Risk Factors—Development and commercialization of NexoBrid and EscharEx in the United States and our pipeline product candidates worldwide requires successful completion of the regulatory approval process, and may suffer delays or fail.”
Research and Development
Our research and development strategy is centered on developingaround our patentedvalidated proteolytic enzyme platform technology, focused on next-generation bio-active therapies for burn and wound care and biological medicinal products for tissue repair, which underlies NexoBrid and EscharEx, into additional product candidates for high‑valuehigh-value indications. For more information regarding our research and development expenses, see “ITEM 5.C. Research and Development, Patents and Licenses, etc.”
Pre-Clinical Clinical TrialsStudies
We conduct clinical testsstudies and preclinical studies to support the efficacy and safety of our products and their ingredients and to extend and validate their benefits for human health. Preclinical studies allow us to substantiate the safety of our products and obtain preliminarily indications of their pharmacological and safety profile. As of the date hereof, we had conducted more than 2050 non-GLP and GLP preclinical studies. All pre-clinical safety and toxicology studies were conducted according to the principles of Good Laboratory Practices (“GLP”), and more than seventwelve clinical studies, according to the principles of Good Clinical Practices (“GCP”), for NexoBrid, EscharEx and our pipeline product candidates. As a result, we have developed significant experience in planning, designing, executing, analyzing and publishing clinical studies.
Our research and development team manages our clinical studies and coordinates the project planning, trial design, execution, outcome analyses and clinical study report submission. During the design, execution and analyses of our studies, our research and development team consults with key opinion leaders and top‑tiertop-tier consultants in the relevant field of research to optimize both design and execution, as well as to strengthen the scientific, medical and regulatory compliance level of the investigational plan. Our clinical studies have been conducted in collaboration with leading medical and research centers throughout the world.
Manufacturing, Supply and Production
We operate a manufacturing facility in Yavne, Israel, in a building that we sub‑leasesub-lease from Clal Life Sciences L.P., with 6031 employees as of December 31, 2017.2020. This facility allows us to manufacture sterile biopharmaceutical products, such as NexoBrid. The facility meets current cGMP requirements, as certified by each of the EMA, and the Israeli Ministry of Health. Health and South Korean ministry of health. Our facility is subject to audits for reassessment of cGMP compliance, which are preformed periodically by regulatory authorities and was approved and, after passing a periodic ministry of health audit in May 2017, reapprovedre-approved as cGMP‑compliantcGMP-compliant for an additional three‑yearthree years term as of the audit date, until 2020 during which the Israeli Ministry of Health is scheduled to conduct its periodic audit for assessment of cGMP compliance renewal.2023. Additionally, as we seek regulatory approval NexoBrid in the United States and other international jurisdictions for NexoBrid, the FDA or other regional applicable authorities maywill need to inspect our plant to confirm it meets all regulatory requirements. In addition, other regional applicable authorities may also need to inspect our plant to confirm it meets all regulatory requirements in order to obtain marketing authorization in these jurisdictions. Applicable changes in our production processes for NexoBrid must be approved by the EMA and similar authorities in other jurisdictions.
While we believe that our current manufacturing capacity at the facility is sufficient to meet the expected near‑termnear-term commercial demand for NexoBrid, we are planning to increasescale-up the current capacity by constructing a new manufacturing facility, which we estimate will be valid and qualified,the end of 2022, subject to our successful authoritiesauthorities' cGMP audit, during 2022, and which we expect towill cost approximately $12‑15$8-10 million.
The intermediate drug substancestarting material used by us in the manufacturing of NexoBrid and our other product candidates is bromelain SP, which is derived from pineapple plant stems. We have entered into an agreement with CBC, dated January 11, 2001, as amended on February 28, 2010, pursuant to which CBC uses proprietary methods to manufacture bromelain SP and supplies us with this intermediate drug substance in bulk quantities. According to the terms of the agreement, CBC shall not, and shall not permit related companies or a third party to, manufacture, use, supply or sell the raw materials for the use or production of a product directly or indirectly competing with any of our products. Our supply agreement with CBC has no fixed expiration date and can be voluntarily terminated by us, with at least six months’ advance written notice, or by CBC, with at least 24 months’ advance written notice.
47
Upon obtaining bromelain SP from CBC, we further process it into the drug substance and then into the drug product to finally create the powder form of NexoBrid. The necessary inactive ingredients contained in NexoBrid, or the excipients, are readily available and generally sold to us by multiple suppliers. In addition to this powder, we manufacture a gel substance by combining water for injections produced by us at our facility and additional excipients. The powder and gel are kept in separate containers in one package of NexoBrid and are simply mixed by a healthcare professional prior to use. NexoBrid is authorized to be soldcomes in Europe, Israel and Argentinatwo sizes— in packages containing either a vial of two grams of powder and a jar of 20 grams of gel, or a vial of five grams of powder and a jar of 50 grams of gel. Once the powder and gel are mixed, NexoBrid should be applied within 15 minutes at a ratio of either 2 grams of powder and 20 grams of gel to a burn wound area of 100 cm21% TBSA or 5 grams of powder and 50 grams of gel to a burn wound area of 250 cm2,2.5% TBSA, as applicable; however, under current usage, NexoBrid’s label provides that it should not be applied to more than 15% TBSA. Prior to mixture and application, NexoBrid has a shelf life of three years when stored under refrigeration.
Marketing, Sales and Distribution
We sellcommercialize globally NexoBrid invia multiple sales channels:
Europe
In Europe and Israel, we sell NexoBrid, primarily through our own commercial organizationsales force consisting of a marketing team of specialized and launchedknowledgeable sales representatives in Europe, focusing on key burn centers and Key Opinion Leaders (KOL) management. We have obtained national reimbursement for NexoBrid in Argentina throughBelgium and Italy and we continue to locally execute our local distributor in 2016. We are marketing NexoBridmarket access strategy for most of Europe to obtain procurement by targeting a focused segment of burn specialists treating patients with severe burns in burn centers throughoutand hospitals as part of their budget, or under local, regional or national reimbursement, depending on the European Union.specific process required in each country. We believe that additional burn units in large hospitals as well as smaller hospitals will follow the treatment trends once established by the burn centers. In Europe, the marketing, sales and distribution of NexoBrid is carried out by our wholly‑owned German subsidiary, MediWound Germany GmbH, which consists of a marketing team of specialized and knowledgeable sales representatives throughout Europe. During 2016 we obtained national reimbursement in Belgium and Italy and we continue to locally execute our market access strategy for most of Europe to obtain procurement by hospitals as part of their budget, or under local, regional or national reimbursement, depending on the specific process required in each country. See “—Government Legislation and Regulation—Pharmaceutical Coverage, Pricing and Reimbursement.” Furthermore, we are establishing additional distribution channels through local partners to extend outreach in EU (Sweden, the Baltic states, France, Switzerland (Romandie region), Greece, Malta, Bulgaria, Cyprus, Portugal, the Netherlands and Luxemburg), where NexoBrid is already approved for marketing as part of the European marketing authorization. In addition to receiving marketing authorization for NexoBrid in the European Union, key opinion leaders in the burn care field worldwide are already aware of NexoBrid’s efficiency in removing eschar due to hundreds of scientific presentations and several award winning abstracts at international and national conferences over 30 peer‑reviewed papers as well as a chapter in Total Burn Care, the leading medical textbook on burns.and about 80 peer-reviewed papers.
Vericel License and Supply Agreements
On May 6, 2019, we entered into exclusive license and supply agreements with Vericel to commercialize NexoBrid in all countries of North America (which we refer to as the “Territory”).
NexoBrid is currently in clinical development in the Territory, and pursuant to the terms of the License Agreement described below, we will continue to conduct all clinical activities described in the development plan to support the filing of a BLA with the FDA under the supervision of a Central Steering Committee comprised of members of each of our Company and Vericel.
License Agreement.
We entered into a license agreement (the “License Agreement”) with Vericel pursuant to which we granted Vericel an exclusive license, with the right to grant sublicenses, to develop and commercialize NexoBrid and any improvements of NexoBrid (the “Licensed Product”) in the Territory.
Pursuant to the terms of the License Agreement, Vericel will have exclusive control regarding the commercialization of Licensed Products in the Territory and must use commercially reasonable efforts to commercialize Licensed Products within the Territory. We and Vericel have made customary representations and warranties and have agreed to certain customary covenants, including confidentiality and indemnification.
48
Within 10 days of signing the License Agreement, Vericel paid us an upfront fee of $17.5 million (the “Upfront Payment”). Vericel is obligated to pay us $7.5 million upon U.S. regulatory approval of the BLA for NexoBrid and up to $125 million upon certain sales milestones. The first sales milestone of $7.5 million is triggered when annual net sales of the Licensed Products in the Territory exceed $75 million. Vericel is also obligated to pay us tiered royalties on net sales of Licensed Products ranging from mid-high single-digit to mid-teen percentages, subject to certain customary reductions, a percentage of gross profits on committed purchases and a royalty on additional purchases by BARDA. The royalties will expire on a product-by-product and country-by-country basis upon the latest to occur of (i) twelve years following the first commercial sale of such Licensed Product in such country, (ii) the earliest date on which there are no valid claims of MediWound patent rights covering such Licensed Product in such country, and (iii) the expiration of the regulatory exclusivity period for such Licensed Product in such country (the “Royalty Term”). Such royalties are subject to reduction in the event that (a) Vericel must license additional third-party intellectual property in order to develop, manufacture or commercialize a Licensed Product, or (b) biosimilar competition occurs with respect to the Licensed Product in any country within the Territory. After the expiration of the applicable royalties for the Licensed Product in any country within the Territory, the license for such Licensed Product in such country would become a fully paid-up, royalty-free, perpetual and irrevocable license.
The License Agreement expires on the date of expiration of all royalty obligations due under the agreement unless earlier terminated in accordance with its terms. Either party may terminate the agreement upon the failure of the other party to comply with its material obligations under the agreement if that failure is not remedied within certain specified cure periods or in the event of a party’s insolvency. In addition, Vericel may terminate the agreement upon 150 days written notice to us.
Supply Agreement.
On May 6, 2019, concurrently with our entry into the License Agreement, we entered into a supply agreement (the “Supply Agreement”) with Vericel pursuant to which we are obligated to supply Vericel with NexoBrid for sale in the Territory on an exclusive basis for the first five years of the term of the Supply Agreement. The Supply Agreement requires us to take steps to ensure that our manufacturing capacity meets Vericel’s demand for NexoBrid. In addition, after the exclusivity period or upon supply failure, Vericel will be permitted to establish an additional or alternate source of supply.
Pursuant to the Supply Agreement, we will supply NexoBrid to Vericel based on Vericel’s fixed orders on a unit price basis. After a specified period, the unit price, on an annual basis, may be increased based on the United States Producer Price Index for Chemical Manufacturing published by the Bureau of Labor Statistics.
The Supply Agreement’s initial term is five years (the “Initial Term”), with Vericel required to provide us with notice regarding whether it plans to extend the Initial Term for an additional two years by the third anniversary of the Supply Agreement. After the Initial Term and optional two-year extension, Vericel, at its sole discretion, may choose to extend the Supply Agreement’s term for additional one-year periods for a potential total term of fifteen years.
The Supply Agreement will automatically terminate upon the expiration or termination of the License Agreement. Either party may terminate the Supply Agreement upon the failure of the other party to comply with its material obligations under the Supply Agreement if such failure is not remedied within certain specified cure periods. After the Initial Term, Vericel may terminate the Supply Agreement upon 12 months’ prior written notice to us, and we may terminate the Supply Agreement upon 36 months prior written notice to Vericel.
BARDA
Pursuant to the First BARDA Contract, BARDA has initiated the procurement of NexoBrid valued at $16.5 million, for emergency stockpile as part of the awarded contract with BARDA, we anticipate that, contingent upon the FDA Emergency Use Authorization and/or FDA marketing authorization for NexoBrid, BARDA’s procurement of $16.5 million of NexoBrid as a medical countermeasure forHHS mission to build national preparedness for mass casualty eventspublic health medical emergencies. BARDA purchased inventory is being managed by MediWound under vendor managed inventory. In August 2020, BARDA accepted the first shipment of NexoBrid. Additional deliveries are expected to occur throughout 2021.
Under our exclusive license and supply agreements with Vericel, we will be initiated followingequally split the completiongross profits on the initial procurement and receive a double-digit royalty on any additional future BARDA purchases of the DETECT study acute phase.NexoBrid. Please see “Vericel License and Supply Agreements” above.
49
Other International Markets
In addition, upon FDAother international markets, we sell NexoBrid through local distributors with which we have distribution agreements. We have launched NexoBrid in Argentina, South Korea and Russia, and expect additional launches following receipt of local marketing authorization, we anticipate that NexoBrid will require a focused commercial team on the ground in the United States to cover the specialty hospital call point and maximize NexoBrid’s commercial value.
authorizations. We plan to enter other international markets through collaboration with local distributors and leverage our approved registration file in Europe to obtain regional marketing authorizations. We have signed local distribution agreements for distribution in Argentina, Russia, South Korea, Colombia, Mexico, Colombia, Peru, Chile, Ecuador, Panama, India, Bangladesh, Sri Lanka, Japan, Australia, New-Zealand, Singapore, Ukraine, Taiwan and Taiwan.United Arab Emirates. Our distributordistributors in Argentina, South Korea, Russia and Peru have obtained marketing authorization and launched NexoBrid during 2016.authorization. Our additional distributors have filed or are in the process of filing for market authorization in their respective territories and are expected to launch NexoBrid after receipt of local regulatory approval, which may take a year or more to be granted, and, consequently, may occur in certain markets during 2018.2021.
For a breakdown of our consolidated revenues by geographic markets and by categories of operations for the years ended December 31, 2018, 2019 and 2020, please see “Item 5.A Operating and Financial Review and Prospects—Operating Results.”
Intellectual Property
Our intellectual property and proprietary technology are important to the development, manufacture and sale of NexoBrid, EscharEx and our future pipeline product candidates. We seek to protect our intellectual property, core technologies and other know‑howknow-how through a combination of patents, trademarks, trade secrets, non‑disclosurenon-disclosure and confidentiality agreements, licenses, assignments of invention and other contractual arrangements with our employees, consultants, partners, suppliers, customers and others. Additionally, we rely on our research and development program, clinical trials, know‑howknow-how and marketing and distribution programs to advance our products and product candidates. As of December 31, 2017,2020, we had been granted a total of 6561 patents and have 1532 pending patent applications. The family of patents that covers NexoBrid specifically includes 35 granted patents worldwide and 1 pending national phase application.worldwide. EscharEx is covered by 2 international patent applications (“PCT”)patents and 4 national phase applications. A patent application submitted under the Patent Cooperation Treaty (“PCT”) provides a unified procedure for filing a single initial patent application that allows the applicant to seek protection in any of the member states through29 national phase applications.
The main patents for our proteolytic enzyme technology which underlies NexoBrid, EscharEx and our current pipeline product candidates have been issued in Europe, the United States and other international markets. Our patents which cover NexoBrid claim specific mixtures of proteolytic enzymes, methods of producing such mixtures and methods of treatment using such mixtures. Although the protection achieved is significant for NexoBrid, EscharEx and our pipeline product candidates, when looking at our patents’ ability to block competition, the protection offered by our patents may be, to some extent, more limited than the protection provided by patents which claim chemical structures which were previously unknown. Absent patent‑termpatent-term extensions, the NexoBrid family patents in the United States are nominally set to expire in 2025 and in Europe and 2029 in the United States. PatentsThe NexoBrid patents issued in Europe and in other foreign jurisdictions willare nominally set to expire in 2025. The international PCT patent applications and the national phase applications relating to EscharEx, were filedif granted, will expire on January 30, 2017, January 31, 2017 and February 2, 2017. If national phase applications corresponding to these PCT applications are granted, the expiration date of the granted patents is expected to be January 30, 2037, absent any patent‑termpatent-term adjustment and/or extensions.
While our policy is to obtain patents by application, license or otherwise, to maintain trade secrets and to seek to operate without infringing on the intellectual property rights of third parties, technologies related to our business have been rapidly developing in recent years. Additionally, patent applications that we may file or license from third parties may not result in the issuance of patents, and our issued patents and any issued patents that we may receive in the future may be challenged, invalidated or circumvented. For example, we cannot predict the extent of claims that may be allowedgranted or enforcedenforceable in our patents nor can we be certain of the priority of inventions covered by pending third‑party patent applications.applications filed in the U.S. If third parties prepare and file patent applications that also claim technology or therapeutics to which we have rights, we may have to participate in proceedings to determine priority of invention, which could result in substantial costs to us, even if the eventual outcome is favorable to us. Moreover, because of the extensive time required for clinical development and regulatory review of a product we may develop, it is possible that, before NexoBrid can be commercialized in additional jurisdictions and/or before any of our future products can be commercialized, related patents will have expired or will expire a short period following commercialization, thereby reducing the advantage of such patent. Loss or invalidation of certain of our patents, or a finding of unenforceability or limited scope of certain of our intellectual property rights, could have a material adverse effect on us. See “ITEM 3.D. Risk Factors—Factors — Our success depends in part on our ability to obtain and maintain protection for the intellectual property relating to, or incorporated into, our technology and products.”
50
In addition to patent protection, we also rely on trade secrets, including unpatented know‑how, technology innovation, drawings, technical specifications and other proprietary information in attempting to develop and maintain our competitive position. We also rely on protection available under trademark laws, and we currently hold various registered trademarks, including “MediWound,” “NexoBrid” and “EscharEx” in various jurisdictions, including the United States, the European Union and Israel.
Klein License Agreement
In September 2000, we signed an exclusive license agreement, as amended in June 2007, with Mark Klein, a third party, for use of certain patents and intellectual property (the “Klein License Agreement”). Under the Klein License Agreement, we received an exclusive license to use the third party’s patents and intellectual property to develop, manufacture, market and commercialize NexoBrid and its pipeline product candidates for the treatment of burns and other wounds. The claims of such patents are directed to a process of preparing a mixture of escharase and proteolytic enzymes and cover the underlying proteolytic mixture of escharase and proteolytic enzymes prepared by that specific process. Pursuant to the Klein License Agreement, we are obligated to keep accounting records related to the sales of NexoBrid and its pipeline product candidates and pay royalties as discussed below. The Klein License Agreement may be terminated by Mark Klein, subject to notice and dispute resolution provisions of the Klein License Agreement, in the event of our breach, bankruptcy petition, insolvency or failure to achieve a development milestone within six months of a target date. We have already achieved all development milestones under the Klein License Agreement.
In consideration for the Klein License Agreement, we paid an aggregate amount of $1.0 million following the achievement of certain development milestones. In addition, we undertook to pay royalties of 1.5‑2.5% from revenues, 10% of royalties received from sublicensing and 2% of lump‑sum payments received from sublicensing up to $1 million and 4% above $1 million, in each case relating to products based on the licensed patents and intellectual property, for a term of 10‑15 years, as applicable, from the date of the first commercial delivery in a major country. In addition, under the Klein License Agreement, we agreed to pay a one‑time lump‑sum amount of $1.5 million upon reaching aggregate revenues of $100 million from the sale of such products.
Competition
NexoBrid received orphan drug status in the European Union on July 31, 2002 and in the United States on August 20, 2003 for debridement of deep partial‑ and full‑thickness burns in hospitalized patients. In the United States and the European Union, a sponsor that develops an orphan drug has marketing exclusivity for seven years post‑approval by the FDA and for ten years post‑approval by the EMA, respectively. The exclusive marketing rights in both regions are subject to certain exceptions, including the development of a clinically significant benefit over the prevalent SOC. Once the market exclusivity for our orphan indication expires in a given jurisdiction, subject to other protections such as patents, we could face competition from other companies that may attempt to develop other products for the same indication.
The medical, biotechnology and pharmaceutical industries are intensely competitive and subject to significant technological change and changes in practice. While we believe that our innovative technology, knowledge, experience and scientific resources provide us with competitive advantages, we may face competition from many different sources with respect to NexoBrid, EscharEx, MWPC005 and our existing pipeline product candidates or any product candidates that we may seek to develop or commercialize in the future. Possible competitors may include medical practitioners, pharmaceutical and wound care companies, academic and medical institutions, governmental agencies and public and private research institutions, among others. Any product that we successfully develop and commercialize will compete with existing therapies and new therapies that may become available in the future.
In addition, we face competition from the current SOC. The current SOC for eschar removal in severe burns is surgery, where debridementeschar removal can be performed by tangential excision, dermabrasion or hydro jet, or non‑surgical alternatives, such as applying topical medications to the eschar to facilitate the natural healing process. Consequently, we face competition from traditional surgical procedures and topical agents’.agents. However, based on our clinical trials, we believe that NexoBrid has a sustainable competitive advantage over the current non‑surgical alternatives and is less invasive than surgery in removing eschar in patients with burn wounds. See “—NexoBrid and Our Clinical History” for the results of our clinical trials.
51
Although we are in the clinical and preclinical phases for our pipeline product candidates for debridement of chronic and other hard‑to‑heal wounds and treatment of low risk basal cell carcinoma and connective tissue disorders and other indications, respectively, if one of our pipeline product candidates receives approval in the future, we would compete with traditional surgery and existing non‑surgical and other treatments. In chronic and other hard‑to‑heal wounds, we expect to face competition from other debriding agents and wound bed preparation techniques, such ascurrent standard of care for debridement by sharp debridement and surgery and topical medication such as gels and enzymes, such asor from the current non-surgical standard of care, either enzymatic debridement, primarily Smith & Nephew Plc’s Santyl.Santyl, a collagenase-based product indicated for debriding chronic dermal ulcers and severely burned areas or autolytic debridement.
The current standard of care for treatment of low risk basal cell carcinoma, is surgical excision. In superficial basal cell carcinoma and inoperable nodular basal cell carcinoma, we expect to face competition from current topical applications such as imiquimod and 5FU.
In addition to the currently available products, other products may be introduced to debride chronic and other hard‑to‑heal wounds or treat superficial and nodular basal cell carcinoma and connective tissue disorders during the time that we engage in necessary development. Accordingly, if one of our pipeline product candidates is approved, our main challenge in the market would be to convinceeducate physicians seeking alternatives to surgery to use our product instead of already existing treatments. While we are still in the development stages, based on our studies, we believe that our pipeline product candidates will be more effective than the current non‑surgical alternatives and less invasive than surgery in removing eschar in chronic and other hard‑to‑heal wounds or tumor resection and may be comparable or perhaps better than currently available treatments for connective tissue disorders.
Government Legislation and Regulation
Our business is subject to extensive government regulation. Regulation by governmental authorities in the United States, the European Union and other jurisdictions is a significant factor in the development, manufacture and marketing of NexoBrid and in ongoing research and development activities. NexoBrid has completed the EMA’s preclinical and clinical trials and other pre‑marketing approval requirements and received marketing authorization for the European Union on December 18, 2012. Our pipeline product candidates would also have to complete such steps in the European Union. Additionally, we must also complete the approval processes in the United States and other jurisdictions in order to market NexoBrid, EscharEx, MWPC005 or our pipeline product candidates.
European Union
The approval process of medicinal products in the European Union generally involves satisfactorily completing each of the following:
laboratory tests, animal studies and formulation studies all performed in accordance with the applicable E.U. GLP or GMP regulations;
submission to the relevant national authorities of a clinical trial application (“CTA”), which must be approved before human clinical trials may begin;
performance of adequate and well‑controlled clinical trials to establish the safety and efficacy of the product for each proposed indication;
submission to the relevant competent authorities of a marketing authorization application (“MAA”), which includes the data supporting preclinical and clinical safety and efficacy as well as detailed information on the manufacture and composition and control of the product development and proposed labeling as well as other information;
inspection by the relevant national authorities of the manufacturing facility or facilities and quality systems (including those of third parties) at which the product is produced, to assess compliance with strictly enforced cGMP;
potential audits of the non‑clinical and clinical trial sites that generated the data in support of the MAA; and
52
review and approval by the relevant competent authority of the MAA before any commercial marketing, sale or shipment of the product.
Quality/preclinical studies
In order to assess the potential safety and efficacy of a product, tests include laboratory evaluations of product characterization, analytical tests and controls, as well as studies to evaluate toxicity and pharmacological effects in animal studies. The conduct of the preclinical tests and formulation of the compounds for testing must comply with the relevant E.U. regulations and requirements. The results of such tests, together with relevant manufacturing control information and analytical data, are submitted as part of the CTA.
Clinical trial approval
Pursuant to the Clinical Trials Directive 2001/20/EC, as amended, a system for the approval of clinical trials in the European Union has been implemented through national legislation of the member states. Under this system, approval must be obtained from the competent national authority of a European Union member state in which a study is planned to be conducted. To this end, a CTA is submitted, which must be supported by an investigational medicinal product dossier and additional supporting information prescribed by the Clinical Trials Directive and other applicable guidance documents. Furthermore, a clinical trial may only be started after a competent ethics committee has issued a favorable opinion on the clinical trial application in that country.
Clinical drug development is often described as consisting of four temporal phases (Phase 1‑4). See, for example, the EMA’s note for guidance on general considerations for clinical trials (CPMP/ICH/291/95).
Phase 1 (Most typical kind of study: Human Pharmacology); |
Phase 2 (Most typical kind of study: Therapeutic Exploratory);
Phase 3 (Most typical kind of study: Therapeutic Confirmatory); and
Phase 4 (Variety of Studies: Therapeutic Use).
Studies in Phase 4 are all studies other than routine surveillance performed after drug approval and are related to the approved indication.indication. For example, as part of the EMA regulatory approval process, we agreed to provide further data from our post‑marketing clinical trial of NexoBrid, the U.S. Phase 3 study initiated in April 2015.(DETCET). While we believe that the EMA will accept this study to satisfy one of our post‑marketing commitments, if the EMA does not accept the study or is not satisfied by the study results, we will need to perform another costly study to provide such data.
The phase of development provides an inadequate basis for classification of clinical trials because one type of trial may occur in several phases. The phase concept is a description, not a set of requirements. The temporal phases do not imply a fixed order of studies since for some drugs in a development plan the typical sequence will not be appropriate or necessary.
Pediatric investigation plan (“PIP”)
We initiated a PIP study in November 2014.
On January 26, 2007, Regulation (EC) 1901/2006 came into force with its primary purpose being the improvement of the health of children without subjecting children to unnecessary trials, or delaying the authorization of medicinal products for use in adults. The regulation established the Pediatric Committee (“PDCO”), which is responsible for coordinating the EMA’s activities regarding pharmaceutical drugs for children. The PDCO’s main role is to determine which studies the applicant needs to perform in the pediatric population as part of the PIP.
All applications for marketing authorization for new pharmaceutical products that were not authorized in the European Union prior to January 26, 2007 must include the results of studies carried out in children of different ages. The PDCO determines the requirements and procedures of such studies, describing them in a PIP. This requirement also applies when a company wants to add a new indication, pharmaceutical form or route of administration for a medicine that is already authorized. The PDCO can grant deferrals for some medicines, allowing a company to delay development of the medicine in children until there is enough information to demonstrate its effectiveness and safety in adults. The PDCO can also grant waivers when development of a medicine in children is not needed or is not appropriate, such as for diseases that only affect the elderly population.
53
Before a marketing authorization application can be filed, or an existing marketing authorization can be amended, the EMA confirms that the applicant complied with the studies’ requirements and measures listed in the PIP. Since the regulation became effective, several incentives for the development of medicines for children become available in the European Union, including:
medicines that have been authorized for marketing in the European Union with the results of PIP studies included in the product information are eligible for an extension of their patent protection by six months. This is the case even when the studies’ results are negative; |
for orphan medicines, such as NexoBrid, the incentive is an additional two years of market exclusivity instead of one;
scientific advice and protocol assistance at the EMA are free of charge for questions relating to the development of medicines for children; and
medicines developed specifically for children that are already authorized, but are not protected by a patent or supplementary protection certificate, can apply for a pediatric use marketing authorization (“PUMA”). If a PUMA is granted, the product will benefit from 10 years of market protection as an incentive.
Marketing authorization
Authorization to market a product in the European Union member states proceeds under one of four procedures: a centralized authorization procedure, a mutual recognition procedure, a decentralized procedure or a national procedure. Marketing authorization may be granted only to an applicant established in the European Union. Through our wholly‑owned German subsidiary, we received approval for NexoBrid pursuant to the centralized authorization procedure.
The centralized procedure provides for the grant of a single marketing authorization that is valid for all E.U. member states as well as the European Economic Area (“EEA”) member states, Norway, Iceland and Lichtenstein. The centralized procedure is compulsory for medicines produced by certain biotechnological processes, products designated as orphan medicinal products and products with a new active substance indicated for the treatment of certain diseases, and is optional for products that are highly innovative or for which a centralized process is in the interest of patients. Products that have received orphan designation in the European Union, such as NexoBrid, will qualify for this centralized procedure, under which each product’s marketing authorization application is submitted to the EMA. Under the centralized procedure in the European Union, the maximum time frame for the evaluation of a marketing authorization application is 210 days (excluding clock stops, when additional written or oral information is to be provided by the applicant in response to questions asked by the Committee of Medicinal Products for Human Use).
In general, if the centralized procedure is not followed, there are three alternative procedures where applications are filed with one or more members state medicines regulators, each of which will grant a national marketing authorization:
Mutual recognition procedure. If an authorization has been granted by one-member state, or the Reference Member State, an application may be made for mutual recognition in one or more other member states, or the Concerned Member State(s). |
Decentralized procedure. The decentralized procedure may be used to obtain a marketing authorization in several European member states when the applicant does not yet have a marketing authorization in any country. |
National procedure. Applicants following the national procedure will be granted a marketing authorization that is valid only in a single member state. Furthermore, this marketing authorization is not based on recognition of another marketing authorization for the same product awarded by an assessment authority of another member state. If marketing authorization in only |
54
It is not always possible for applicants to follow the national procedure. In the case of medicinal products in the category for which the centralized authorization procedure is compulsory, that procedure must be followed. In addition, the national procedure is not available in the case of medicinal product dossiers where the same applicant has already obtained marketing authorization in one of the other European Union member state or has already submitted an application for marketing authorization in another member state and the application is under consideration. In the latter case, applicants must follow a mutual recognition procedure.
After a drug has been authorized and launched, it is a condition of maintaining the marketing authorization that all aspects relating to its quality, safety and efficacy must be kept under review. Sanctions may be imposed for failure to adhere to the conditions of the marketing authorization. In extreme cases, the authorization may be revoked, resulting in withdrawal of the product from sale.
Period of authorization and renewals
Marketing authorization is valid for an initial five‑year period and may be renewed thereafter on the basis of a re‑evaluation of the risk‑benefit balance by the EMA or by the competent authority of the authorizing member state. To this end, the marketing authorization holder shall provide the EMA or other applicable competent authority a consolidated version of the file in respect of quality, safety and efficacy, including all variations introduced since the marketing authorization was granted, at least six months before the end of the initial five‑year period. Once renewed, the marketing authorization is valid for an unlimited period, unless the EMA or other applicable competent authority decides, on justified grounds relating to pharmacovigilance, to proceed with one additional five‑year renewal. Any authorization which is not followed by the actual placing of the drug on the E.U. market (in case of centralized procedure) or on the market of the authorizing member state within three years after authorization shall cease to be valid. On November 2017, the European Commission granted a five‑year renewal of our NexoBrid marketing authorization.
Orphan designation
On July 31, 2002, NexoBrid received orphan drug status in the European Union, and on December 20, 2012, the EMA confirmed NexoBrid’s designation as an orphan drug for marketing authorization.
In the European Union, the Committee for Orphan Medicinal Products grants orphan drug designation to promote the development of products that are intended for the diagnosis, prevention or treatment of a life‑threatening or chronically debilitating condition affecting not more than five in 10,000 persons in the European Union. Additionally, designation is granted for products intended for the diagnosis, prevention or treatment of a life‑threatening, seriously debilitating or serious and chronic condition and when, without incentives, it is unlikely that sales of the drug in the European Union would be sufficient to justify the investment necessary to develop the drug or biological product.
In the European Union, orphan drug designation also entitles a party to financial incentives such as reduction of fees or fee waivers and ten years of market exclusivity following drug or biological product approval. This period may be reduced to six years if the orphan drug designation criteria are no longer met, including where it is shown that the product is sufficiently profitable not to justify maintenance of market exclusivity or a safer, more effective or otherwise clinically superior product is available.
Orphan drug designation does not convey any advantage in, or shorten the duration of, the regulatory review and approval process.
Regulatory data protection
Without prejudice to the law on the protection of industrial and commercial property, some marketing authorizations benefit from an “8+2(+1)” year period of regulatory protection. During the first eight years from the grant of the innovator company’s marketing authorization, data exclusivity applies. After the eight years have expired, a generic company can make use of the preclinical and clinical trial data of the originator in their regulatory applications but still cannot market their product until the end of 10 years. An additional one year of market exclusivity can be obtained if, during the first eight years of those 10 years, the marketing approval holder obtains an approval for one or more new therapeutic indications which, during the scientific evaluation prior to their approval, are determined to bring a significant clinical benefit in comparison with existing therapies. Under the current rules, a third party may reference the preclinical and clinical data of the reference product beginning eight years after first approval, but the third party may market a generic version only after 10 (or 11) years have lapsed.
55
Additional data protection can be applied for when an applicant has complied with all requirements as set forth in an approved PIP.
Data Privacy and Security Laws
We are also subject to data privacy and security laws in the E.U. as well as the EEA, including Regulation (EU) 2016/679 (General Data Protection Regulation, or GDPR) in relation to our collection, control, processing, sharing, disclosure and other use of personal data (i.e. data relating to an identifiable living individual). The GDPR is directly applicable in each E.U. and EEA Member State, however, it provides that E.U. and EEA Member States may introduce further conditions, including limitations, which could limit our ability to collect, control, process, share, disclose and otherwise use personal data (including health and medical information), and/or could cause our compliance costs to increase, ultimately having an adverse impact on our business. The GDPR imposes a strict data protection compliance regime including: providing detailed disclosures about how personal data is collected and processed (in a concise, intelligible and easily accessible form); demonstrating that valid consent or another an appropriate legal basis is in place or otherwise exists to justify data processing activities; appointing data protection officers in certain circumstances (and there are specific local law requirements, such as those in Germany, on the same); granting strengthened rights for data subjects in regard to their personal data (including the right to be “forgotten” and the right to data portability); introducing the obligation to notify data protection regulators or supervisory authorities (and in certain cases, affected individuals) of significant data breaches; imposing limitations on retention of personal data; maintaining a record of data processing; defining for the first time pseudonymized (i.e., key-coded) data; and complying with principal of accountability and complying with the obligation to demonstrate compliance through policies, procedures, training and audit. We are also subject to GDPR rules with respect to cross-border transfers of personal data out of the E.U. and EEA, which are evolving (for example, the European Commission has the ability to review adequacy decisions, such as the one in place for Israel); for example, in July 2020, the Court of Justice of the E.U. limited how organizations could lawfully transfer personal data from the EEA to the U.S.
Following Brexit, and the expiry of the transition period, we have to comply with the GDPR and separately the GDPR as implemented in the UK, each regime having the ability to fine up to the greater of €20 million/ £17.5 million or 4% of global turnover. The relationship between the UK and the EU in relation to certain aspects of data protection law remains unclear, e.g. how data transfers between EU member states and the UK will be treated. These changes may lead to additional compliance costs and could increase our overall risk as we expand into other foreign countries and jurisdictions, we may be subject to additional laws and regulations that may affect how we conduct business.
We are also subject to evolving EU data privacy laws on cookies and e-marketing. The EU is in the process of replacing the e-Privacy Directive (2002/58/EC) with a new set of rules taking the form of a regulation, which will be directly effective in the laws of each EU Member State. The draft e-Privacy Regulation imposes strict opt-in marketing rules with limited exceptions for business-to-business communications, alters rules on third-party cookies, web beacons and similar technology and significantly increases fining powers to the same levels as the GDPR (i.e. the greater of 20 million Euros or 4% of total global annual revenue). While the text of the e-Privacy Regulation is still under development, a recent European court decision and regulators’ recent guidance are driving increased attention to cookies and tracking technologies. If regulators start to enforce the strict approach in recent guidance, this could lead to substantial costs, require significant systems changes, limit the effectiveness of our marketing activities, divert the attention of our technology personnel, adversely affect our margins, increase costs and subject us to additional liabilities.
We depend on a number of third parties in relation to the operation of our business, a number of which process personal data on our behalf. There is no assurance that our own privacy and security-related safeguards and/or any contractual measures that we enter into with these providers will protect us from the risks associated with the third-party processing, storage and transmission of such information. Any violation of data or security laws by our third party processors could have a material adverse effect on our business and result in the fines and penalties outlined below.
56
Manufacturing
The manufacturing of authorized drugs, for which a separate manufacturer’s license is mandatory, must be conducted in strict compliance with the EMA’s cGMP requirements and comparable requirements of other regulatory bodies, which mandate the methods, facilities and controls used in manufacturing, processing and packing of drugs to assure their safety and proper identification. The EMA enforces its cGMP requirements through mandatory registration of facilities and inspections of those facilities. The EMA may have a coordinating role for these inspections while the responsibility for carrying them out rests with the competent authority of the member state under whose responsibility the manufacturer falls. Failure to comply with these requirements could interrupt supply and result in delays, unanticipated costs and lost revenues, and could subject the applicant to potential legal or regulatory action, including but not limited to warning letters, suspension of manufacturing, seizure of product, injunctive action or possible civil and criminal penalties. In January 2013, the European Union and Israel signed the Protocol on Conformity Assessment and Acceptance of Industrial Products (the “ACAA”), which covers medicinal products. The ACAA provides for mutual recognition of the conclusions of inspections of compliance of manufacturers and importers with the principles and guidelines of European Union cGMP and equivalent Israeli cGMP. Certification of the conformity of each batch to its specifications by either the importer or the manufacturer established in Israel or in the European Union shall be recognized by the other party without re‑control at import from one party to the other.
Marketing and promotion
The marketing and promotion of authorized drugs, including industry‑sponsored continuing medical education and advertising directed toward the prescribers of drugs and/or the general public, are strictly regulated in the European Union, notably under Directive 2001/83, as amended by Directive 2004/27. The applicable legislation aims to ensure that information provided by holders of marketing authorizations regarding their products is truthful, balanced and accurately reflects the safety and efficacy claims authorized by the EMA or by the applicable national authority of the authorizing member state. Failure to comply with these requirements can result in adverse publicity, warning letters, mandated corrective advertising and potential civil and criminal penalties.
United States
Review and approval of biologics
In addition to E.U. regulations, NexoBrid is an investigational drug in the United States and is therefore subject to various U.S. regulations. In the United States, the FDA regulates drugs and biologics under the FDCAFederal, Food, Drug and implementing regulations and other laws, includingCosmetic Act (“FDCA”), the Public Health Service Act.Act, and their respective implementation regulations. On March 24, 2011, the FDA classified NexoBrid as a biological product. Biologics require the submission of a BLA and approvallicensure by the FDA prior to being marketed in the United States. The process of obtaining regulatory approvals and the subsequent compliance with appropriate federal, state, local and foreign statutes and regulations requires the expenditure of substantial time and financial resources. Failure to comply with the applicable U.S. requirements at any time during the product development process, approval process or after approval may subject an applicant to a variety of administrative or judicial sanctions as well as enforcement actions brought by the FDA, the U.S. Department of Justice or other governmental entities. Possible sanctions may include the FDA’s refusal to approve pending BLAs or supplements, withdrawal of an approval, imposition of a clinical hold, issuance of warning letters, product recalls, product seizures, total or partial suspension of production or distribution, injunctions, fines, refusals of government contracts, restitution, disgorgement and civil or criminal penalties.
The process required by the FDA prior to marketing and distributing a biologic in the United States generally involves the following:
completion of laboratory tests, animal studies and formulation studies in compliance with the FDA’s GLP and GMP regulations, as applicable;
submission to the FDA of an investigational new drug application (“IND”), which must become effective before clinical trials may begin;
approval by an independent institutional review board (“IRB”) at each clinical site before each trial may be initiated; |
performance of adequate and well‑controlled clinical trials in accordance with GCP to establish the safety and efficacy of the product for each indication;
preparation and submission to the FDA on July 30, 2002.of a BLA;
satisfactory completion of an FDA advisory committee review, if applicable;
satisfactory completion of one or more FDA inspections of the manufacturing facility or facilities at which the product, or components thereof, are produced to assess compliance with cGMP requirements, and to assure that the facilities, methods and controls are adequate to preserve the product’s safety, purity and potency, and of selected clinical investigation sites to assess compliance with GCP; and
payment of user fees and FDA review and approval of the BLA to permit commercial marketing of the product for particular indications for use in the United States.
Preclinical studies
Preclinical studies include laboratory evaluation of product chemistry, toxicity and formulation, as well as animal studies to assess the potential safety and efficacy of the product candidate. Preclinical safety tests must be conducted in compliance with FDA regulations regarding good laboratory practices. The results of the preclinical tests, together with manufacturing information and analytical data, are submitted to the FDA as part of an IND which must become effective before clinical trials may commence. Some preclinical testing may continue even after the IND is submitted.
Clinical trials in support of a BLA
Clinical trials involve the administration of an investigational product to human subjects under the supervision of qualified investigators in accordance with GCP requirements, which include, among other things, the requirement that all research subjects provide their informed consent in writing before their participation in any clinical trial. Clinical trials are conducted under written study protocols detailing, among other things, the objectives of the study, the parameters to be used in monitoring safety and the effectiveness criteria to be evaluated. A protocol for each clinical trial and any subsequent protocol amendments must be submitted to the FDA as part of the IND. An IND automatically becomes effective 30 days after receipt by the FDA, unless before that time the FDA raises concerns or questions related to a proposed clinical trial and places the trial on clinical hold. In such a case, the IND sponsor and the FDA must resolve any outstanding concerns before the clinical trial can begin.
In addition, an IRB representing each institution participating in the clinical trial must review and approve the plan for any clinical trial before it commences at that institution, and the IRB must conduct continuing review and reapprove the study at least annually. The IRB must review and approve, among other things, the study protocol and informed consent information to be provided to study subjects. An IRB must operate in compliance with FDA regulations. Information about certain clinical trials must be submitted within specific timeframes to the National Institutes of Health for public dissemination on their website, ClinicalTrials.gov.
| Phase 1: | The |
| Phase 2: | The |
| Phase 3: | The |
58
In some cases, the FDA may require, or companies may voluntarily pursue, additional clinical trials after a product is approved to gain more information about the product. These so-called Phase 4 studies may be made a condition to approval of the BLA.
Progress reports detailing the results of the clinical trials must be submitted at least annually to the FDA and more frequently if serious adverse events occur. Phase 1, Phase 2 and Phase 3 clinical trials may not be completed successfully within any specified period, or at all. Furthermore, the FDA or the sponsor may suspend or terminate a clinical trial at any time on various grounds, including a finding that the research subjects are being exposed to an unacceptable health risk. Similarly, an IRB can suspend or terminate approval of a clinical trial at its institution if the clinical trial is not being conducted in accordance with the IRB’s requirements or if the drug has been associated with unexpected serious harm to patients.
Submission of a BLA to the FDA
Before approving a BLA, the FDA generally inspects the facilities at which the product is manufactured or facilities that are significantly involved in the product development and distribution process, and will not approve the product unless cGMP compliance is satisfactory. Additionally, before approving a BLA, the FDA will typically inspect one or more clinical sites to assure compliance with GCP. If the FDA determines that the application, manufacturing process or manufacturing facilities are not acceptable, it will outline the deficiencies in the submission and often will request additional testing or information. Notwithstanding the submission of any requested additional information, the FDA ultimately may decide that the application does not satisfy the regulatory criteria for approval. After the FDA evaluates a BLA and conducts inspections of manufacturing facilities where the investigational product will be produced, the FDA may issue an approval letter or a Complete Response letter. An approval letter authorizes commercial marketing of the product with specific prescribing information for specific indications. A Complete Response letter will describe all of the deficiencies that the FDA has identified in the BLA, except that where the FDA determines that the data supporting the application are inadequate to support approval, the FDA may issue the Complete Response letter without first conducting required inspections, testing submitted product lots, and/or reviewing proposed labeling. In issuing the Complete Response letter, the FDA may recommend actions that the applicant might take to place the BLA in condition for approval, including requests for additional information or clarification.
The FDA may deny approval of a BLA if applicable statutory or regulatory criteria are not satisfied, or may require additional testing or information, which can delay the approval process. FDA approval of any application may include many delays or may never be granted. If a product is approved, the approval will impose limitations on the indicated uses for which the product may be marketed, will require that warning statements be included in the product labeling, may impose additional warnings to be specifically highlighted in the labeling (e.g., a Black Box Warning), which can significantly affect promotion and sales of the product, may require that additional studies be conducted following approval as a condition of the approval and may impose restrictions and conditions on product distribution, prescribing or dispensing. For example, the FDA may approve the BLA with a Risk Evaluation and Mitigation Strategy, or REMS, to ensure the benefits of the product outweigh its risks. A REMS is a safety strategy to manage a known or potential serious risk associated with a product and to enable patients to have continued access to such medicines by managing their safe use. A REMS program may be required to include various elements, such as a medication guide or patient package insert, a communication plan to educate healthcare providers of the drug’s risks, or other elements to assure safe use, such as limitations on who may prescribe or dispense the drug, dispensing inonly under certain circumstances, special monitoring and the formuse of a risk management plan, or impose other limitations.patient registries.
59
Once a product is approved, marketing the product for other indicated uses or making certain manufacturing or other changes requires FDA review and approval of a supplemental BLA or a new BLA, which may require additional clinical data. In addition, further post‑marketing testing and surveillance to monitor the safety or efficacy of a product may be required. Also, product approvals may be withdrawn if compliance with regulatory standards is not maintained or if safety or manufacturing problems occur following initial marketing. In addition, new government requirements may be established that could delay or prevent regulatory approval of our product candidates under development.
Post‑approval requirements
Any drug or biologic products for which we receive FDA approvals are subject to pervasive continuing regulation by the FDA. Certain requirements include, among other things, record‑keeping requirements, reporting adverse experiences with the product, providing the FDA with updated safety and efficacy information annually or more frequently for specific events, product sampling and distribution requirements, complying with certain electronic records and signature requirements and complying with FDA promotion and advertising requirements. These promotion and advertising requirements include, among others, standards for direct‑to‑consumer advertising, prohibitions against promoting drugs for uses or in patient populations that are not described in the drug’s approved labeling, known as “off‑label use,” and other promotional activities, such as those considered to be false or misleading. Failure to comply with FDA requirements can have negative consequences, including the immediate discontinuation of noncomplying materials, adverse publicity, enforcement letters from the FDA, mandated corrective advertising or communications with doctors, and civil or criminal penalties. Such enforcement may also lead to scrutiny and enforcement by other government and regulatory bodies. Although physicians may prescribe legally available drugs for off‑label uses, manufacturers may not encourage, market or promote such off‑label uses. As a result, “off‑label promotion” has formed the basis for litigation under the Federal False Claims Act, violations of which are subject to significant civil fines and penalties.
The manufacturing of NexoBrid, EscharEx and our pipeline product candidates isare and will be required to comply with applicable FDA manufacturing requirements contained in the FDA’s cGMP regulations. NexoBrid is manufactured at our production plant in Yavne, Israel, which is cGMP certified. The FDA’s cGMP regulations require, among other things, quality control and quality assurance, as well as the corresponding maintenance of comprehensive records and documentation. Drug and biologicBiologic manufacturers and other entities involved in the manufacture and distribution of approved drugs and biologics are also required to register their establishments and list any products they make with the FDA and to comply with related requirements in certain states. These entities are further subject to periodic unannounced inspections by the FDA and certain state agencies for compliance with cGMP and other laws. Accordingly, manufacturers must continue to expend time, money and effort in the area of production and quality control to maintain cGMP compliance. In addition, a BLA holder must comply with post‑marketing requirement,requirements, such as reporting of certain adverse events. Such reports can present liability exposure, as well as increase regulatory scrutiny that could lead to additional inspections, labeling restrictions or other corrective action to minimize further patient risk. Discovery of problems with a product after approval may result in serious and extensive restrictions on the product, manufacturer or holder of an approved BLA, as well as lead to potential market disruptions. These restrictions may include recalls, suspension of a product until the FDA is assured that quality standards can be met, and continuing oversight of manufacturing by the FDA under a “consent decree,” which frequently includes the imposition of costs and continuing inspections over a period of many years, as well as possible withdrawal of the product from the market. In addition, changes to the manufacturing process generally require prior FDA approval before being implemented. Other types of changes to the approved product, such as adding new indications and additional labeling claims, are also subject to further FDA review and approval.
The FDA also may impose a number of post‑approval requirements as a condition of approval of a BLA. For example, the FDA may require post‑marketing testing, or Phase 4 testing, as well as risk minimization action plans andREMS and/or surveillance to monitor the effects of an approved product or place other conditions on an approval that could otherwise restrict the distribution or use of NexoBrid.
60
Orphan designation and exclusivity
On August 20, 2003, NexoBrid received orphan drug statusdesignation in the United States. Under the Orphan Drug Act, the FDA may designate a drug product as an “orphan drug” if it is intended to treat a rare disease or condition, (generally meaning that it affects fewer than 200,000 individuals in the United States, or more in cases in which there is no reasonable expectation that the cost of developing and making a drug product available in the United States for treatment of the disease or condition will be recovered from sales of the product).product. A company must request orphan product designation before submitting a BLA. If the request is granted, the FDA will disclose the identity of the therapeutic agent and its potential use. Orphan drug designation entitles a party to seven years of market exclusivity following drug or biological product approval, but does not convey any advantage in or shorten the duration of the regulatory review and approval process.
If a product with orphan status receives the first FDA approval for the disease or condition for which it has such designation, the product will be entitled to orphan product exclusivity. Orphan product exclusivity means that FDA may not approve any other applications for the same product for the same indication for seven years, except in certain limited circumstances.circumstances, such as a showing of clinical superiority to the product with orphan drug exclusivity. Competitors may receive approval of different products for the indication for which the orphan product has exclusivity and may obtain approval for the same product but for a different indication. If a drug or drug product designated as an orphan product ultimately receives marketing approval for an indication broader than that designated in its orphan product application, it may not be entitled to exclusivity. In addition, exclusive marketing rights in the United States may be lost if the FDA later determines that the request for designation was materially defective or if the manufacturer is unable to assure sufficient quantities of the product to meet the needs of patients with the rare disease or condition.
Expedited Development and Review Programs
The FDA offers a number of expedited development and review programs for qualifying product candidates. The fast track program is intended to expedite or facilitate the process for reviewing new products that meet certain criteria. Specifically, new products are eligible for fast track designation if they are intended to treat a serious or life-threatening disease or condition and demonstrate the potential to address unmet medical needs for the disease or condition. Fast track designation applies to the combination of the product and the specific indication for which it is being studied. The sponsor of a fast track product has opportunities for frequent interactions with the review team during product development and, once a BLA is submitted, the product may be eligible for priority review. A fast track product may also be eligible for rolling review, where the FDA may consider for review sections of the BLA on a rolling basis before the complete application is submitted, if the sponsor provides a schedule for the submission of the sections of the BLA, the FDA agrees to accept sections of the BLA and determines that the schedule is acceptable, and the sponsor pays any required user fees upon submission of the first section of the BLA.
A product intended to treat a serious or life-threatening disease or condition may also be eligible for breakthrough therapy designation to expedite its development and review. A product can receive breakthrough therapy designation if preliminary clinical evidence indicates that the product may demonstrate substantial improvement over existing therapies on one or more clinically significant endpoints, such as substantial treatment effects observed early in clinical development. The designation includes all of the fast track program features, as well as more intensive FDA interaction and guidance beginning as early as Phase 1 and an organizational commitment to expedite the development and review of the product, including involvement of senior managers.
Any marketing application for a biologic submitted to the FDA for approval, including a product with a fast track designation and/or breakthrough therapy designation, may be eligible for other types of FDA programs intended to expedite the FDA review and approval process, such as priority review and accelerated approval. A product is eligible for priority review if it has the potential to provide a significant improvement in the treatment, diagnosis or prevention of a serious disease or condition compared to marketed products. For products containing new molecular entities, priority review designation means the FDA’s goal is to take action on the marketing application within six months of the 60-day filing date, compared with ten months under standard review.
Additionally, products studied for their safety and effectiveness in treating serious or life-threatening diseases or conditions may receive accelerated approval upon a determination that the product has an effect on a surrogate endpoint that is reasonably likely to predict clinical benefit, or on a clinical endpoint that can be measured earlier than irreversible morbidity or mortality, that is reasonably likely to predict an effect on irreversible morbidity or mortality or other clinical benefit, taking into account the severity, rarity, or prevalence of the condition and the availability or lack of alternative treatments. As a condition of accelerated approval, the FDA will generally require the sponsor to perform adequate and well-controlled post-marketing clinical studies to verify and describe the anticipated effect on irreversible morbidity or mortality or other clinical benefit. In addition, the FDA currently requires as a condition for accelerated approval pre-approval of promotional materials, which could adversely impact the timing of the commercial launch of the product.
61
In 2017, FDA established a new regenerative medicine advanced therapy, or RMAT, designation as part of its implementation of the 21st Century Cures Act, which was signed into law in December 2016. To qualify for RMAT designation, the product candidate must meet the following criteria: (1) it qualifies as a RMAT, which is defined as a cell therapy, therapeutic tissue engineering product, human cell and tissue product, or any combination product using such therapies or products, with limited exceptions; (2) it is intended to treat, modify, reverse, or cure a serious or life-threatening disease or condition; and (3) preliminary clinical evidence indicates that the drug has the potential to address unmet medical needs for such a disease or condition. Like fast track and breakthrough therapy designation, RMAT designation provides potential benefits that include more frequent meetings with FDA to discuss the development plan for the product candidate and eligibility for rolling review and priority review. Products granted RMAT designation may also be eligible for accelerated approval on the basis of a surrogate or intermediate endpoint reasonably likely to predict long-term clinical benefit, or reliance upon data obtained from a meaningful number of sites, including through expansion to additional sites. Once approved, when appropriate, the FDA can permit fulfillment of post-approval requirements under accelerated approval through the submission of clinical evidence, clinical studies, patient registries, or other sources of real world evidence such as electronic health records; through the collection of larger confirmatory datasets; or through post-approval monitoring of all patients treated with the therapy prior to approval.
Fast track designation, breakthrough therapy designation, priority review, accelerated approval, and RMAT designation do not change the standards for approval but may expedite the development or approval process.
Pediatric studies and exclusivity
Under the Pediatric Research Equity Act of 2003, a BLA or supplement thereto must contain data that are adequate to assess the safety and effectiveness of the drug product for the claimed indications in all relevant pediatric subpopulations, and to support dosing and administration for each pediatric subpopulation for which the product is safe and effective. With enactment of the Food and Drug Administration Safety and Innovation Act (the “FDASIA”) in 2012, sponsorsSponsors must also submit pediatric study plans prior to the assessment data. Those plans must contain an outline of the proposed pediatric study or studies the applicant plans to conduct, including study objectives and design, any deferral or waiver requests, and other information required by regulation. The applicant, the FDA, and the FDA’s internal review committee must then review the information submitted, consult with each other and agree upon a final plan. The FDA or the applicant may request an amendment to the plan at any time.
The FDA may, on its own initiative or at the request of the applicant, grant deferrals for submission of some or all pediatric data until after approval of the product for use in adults, or full or partial waivers from the pediatric data requirements. Additional requirements and procedures relating to deferral requests and requests for extension of deferrals are contained in the FDASIA. Unless otherwise required by regulation, the pediatric data requirements do not apply to products with orphan designation. Accordingly, if NexoBrid is approved by
Separately, in the event the FDA issues a Written Request for adults, it will be exempt frompediatric data relating to a product, a BLA sponsor who submits such requirements upon expanding its indication to children. However, our pipeline product candidatesdata may be subjectentitled to such requirements.
pediatric exclusivity. Pediatric exclusivity is another type of non‑patent marketing exclusivity in the United States and,which, if granted, provides for the attachment of an additional six months of marketing protection to the term of any existing regulatory exclusivity, including theother non‑patent and orphan exclusivity. This six‑month exclusivity may be granted if a BLA sponsor submits pediatric data that fairly respond to a written requestthe Written Request from the FDA for such data. The data do not need to show that the product is effective in the pediatric population studied; rather, if the clinical trial is deemed to fairly respond to the FDA’s request, the additional protection is granted. If reports of requested pediatric studies are submitted to and accepted by the FDA within the statutory time limits, whatever statutory or regulatory periods of exclusivity or patent protection cover the product are extended by six months. This is not a patent term extension, but it effectively extends the regulatory period during which the FDA cannot accept or approve another application.
62
The Animal Rule
In the case of product candidates that are intended to treat certain rare life-threatening diseases, conducting controlled clinical trials to determine efficacy may be unethical or unfeasible. Under regulations issued by the FDA in 2002, often referred to as the “Animal Rule”, the approval of such products can be based on clinical data from trials in healthy human subjects that demonstrate adequate safety and efficacy data from adequate and well-controlled animal studies. Among other requirements, the animal studies must establish that the drug or biological product is reasonably likely to produce clinical benefits in humans. Because the FDA must agree that data derived from animal studies may be extrapolated to establish safety and effectiveness in humans, seeking approval under the Animal Rule may add significant time, complexity and uncertainty to the testing and approval process. In addition, products approved under the Animal Rule are subject to additional requirements including post-marketing study requirements, restrictions imposed on marketing or distribution or requirements to provide information to patients.
Patent term restoration and extension
A patent claiming a new drug product may be eligible for a limited patent term extension under the Drug Price Competition and Patent Term Restoration Act of 1984 (the “Hatch‑Waxman Act”), which permits a patent restoration of up to five years for the patent term lost during product development and the FDA regulatory review. The restoration period granted is typically one‑half the time between the effective date of an IND and the submission date of a BLA, plus the time between the submission date of a BLA and the ultimate approval date. Patent term restoration cannot be used to extend the remaining term of a patent past a total of fourteen years from the product’s approval date. Only one patent applicable to an approved drug product is eligible for the extension, and the application for the extension must be submitted prior to the expiration of the patent in question. A patent that covers multiple drugs for which approval is sought can only be extended in connection with one of the approvals. The U.S. Patent and Trademark Office reviews and approves the application for any patent term extension or restoration in consultation with the FDA.
Biosimilarity, which requires that there be no clinically meaningful differences between the biological product and the reference product in terms of safety, purity, and potency, can be shown through analytical studies, animal studies, and a clinical study or studies. Interchangeability requires that a product is biosimilar to the reference product and the product must demonstrate that it can be expected to produce the same clinical results as the reference product in any given patient and, for products that are administered multiple times to an individual, the biologic and the reference biologic may be alternated or switched after one has been previously administered without increasing safety risks or risks of diminished efficacy relative to exclusive use of the reference biologic. However, complexities associated with the larger, and often more complex, structures of biological products, as well as the processes by which such products are manufactured, pose significant hurdles to implementation of the abbreviated approval pathway that are still being worked out by the FDA.
Under the BPCIA, an application for a biosimilar product may not be submitted to the FDA until four years following the date that the reference product was first licensed by the FDA. In addition, the approval of a biosimilar product may not be made effective by the FDA until 12 years from the date on which the reference product was first licensed. During this 12‑year period of exclusivity, another company may still market a competing version of the reference product if the FDA approves a full BLA for the competing product containing the sponsor’s own preclinical data and data from adequate and well‑controlled clinical trials to demonstrate the safety, purity and potency of their product. The approval of a biologic product biosimilar to NexoBrid could have a materially adverse impact on our business, may be significantly less costly to bring to the market and may be priced significantly lower than NexoBrid, but such approval may only occur after our 12‑year exclusivity period.
The BPCIA also created certain exclusivity periods for biosimilars approved as interchangeable products. At this juncture, it is unclear whether products deemed “interchangeable” by the FDA will, in fact, be readily substituted by pharmacies, which are governed by state pharmacy law. The BPCIA is complex and continues to be interpreted and implemented by the FDA. In addition, recent government proposals have sought to reduce the 12‑year reference product exclusivity period. Other aspects of the BPCIA, some of which may impact the BPCIA exclusivity provisions, have also been the subject of recent litigation. As a result, the ultimate impact, implementation, and meaning of the BPCIA remains subject to significant uncertainty.
63
Review and Approval of Drug Products Outside the European Union and the United States
In addition to the above regulations, we must obtain approval of a product by the comparable regulatory authorities of foreign countries outside of the European Union and the United States before we can commence clinical trials or marketing of NexoBrid in those countries. The approval process varies from country to country and the time may be longer or shorter than that required for FDA or EMA approval. In addition, the requirements governing the conduct of clinical trials, product licensing, pricing and reimbursement vary greatly from country to country. In all cases, clinical trials are conducted in accordance with GCP and the applicable regulatory requirements and the ethical principles that have their origin in the Declaration of Helsinki.
Pharmaceutical Coverage, Pricing and Reimbursement
Significant uncertainty exists as to the coverage and reimbursement status of any products for which we obtain regulatory approval. In the United States, European Union and other markets, sales of any products for which we receive regulatory approval for commercial sale will depend to a large extent on the availability of reimbursement from third‑party payors. Third‑party payors include governments, government health administrative authorities, managed care providers, private health insurers and other organizations. The process for determining whether a payor will provide coverage for a drug product may be separate from the process for setting the price or reimbursement rate that the payor will pay for the drug product. Third‑party payors may limit coverage to specific drug products on an approved list, or formulary, which might not include all of the drug products approved for a particular indication by the FDA, EMA or National Ministries of Health. Third‑party payors are increasingly challenging the price and examining the medical necessity and cost‑effectiveness of medical products and services, in addition to their safety and efficacy. We may need to conduct expensive pharmacoeconomic studies in order to demonstrate the medical necessity and cost‑effectiveness of NexoBrid, in addition to the costs required to obtain the FDA or other Ministry of Health approvals. Additionally, NexoBrid may not be considered medically necessary or cost‑effective. A payor’s decision to provide coverage for a drug product does not guarantee that an adequate reimbursement rate will be approved. Adequate third‑party reimbursement may not be available to enable us to maintain price levels sufficient to realize an appropriate return on our investment in product development.
In the United States, the Affordable Care ActACA substantially changed the way healthcare is financed by both governmental and private insurers and significantly impacted the pharmaceutical industry. The Affordable Care ActACA contains a number of provisions, including those governing enrollment in federal healthcare programs, reimbursement changes and fraud and abuse provisions, which will impact existing government healthcare programs and will result in the development of new programs, including Medicare payment for performance initiatives and improvements to the physician quality reporting system and feedback program. Additionally, the ACA:
increases the minimum level of Medicaid rebates payable by manufacturers of brand‑name drugs from 15.1% to 23.1%;
requires collection of rebates for drugs paid by Medicaid managed care organizations; and
imposes a non‑deductible annual fee on pharmaceutical manufacturers or importers who sell certain “branded prescription drugs” to specified federal government programs.
There remain judicial and congressional challenges to certain aspects of the ACA, as well as efforts by the current U.S. presidential administration to continue to seek amendments to or repeal of the ACA. While Congress has not passed repeal legislation, several bills affecting the implementation of certain taxes under the ACA have been signed into law. For example, the Tax Cuts and Jobs Act of 2017 includes a provision repealing, effective January 1, 2019, the tax-based shared responsibility payment imposed by the ACA on certain individuals who fail to maintain qualifying health coverage for all or part of a year that is commonly referred to as the “individual mandate.” The 2020 federal spending package permanently eliminated, effective January 1, 2020, the ACA mandated “Cadillac” tax on high-cost employer-sponsored health coverage and medical device tax and, effective January 1, 2021, also eliminates the health insurer tax. On December 14, 2018, a U.S. District Court Judge in the Northern District of Texas, ruled that the individual mandate is a critical and inseverable feature of the ACA, and therefore, because it was repealed as part of the Tax Act, the remaining provisions of the ACA are invalid as well. Additionally, on December 18, 2019, the U.S. Court of Appeals for the 5th Circuit upheld the District Court ruling that the individual mandate was unconstitutional and remanded the case back to the District Court to determine whether the remaining provisions of the ACA are invalid as well. The U.S. Supreme Court is currently reviewing the case, although it is unclear how the Supreme Court will rule. It is also unclear how other efforts to challenge, repeal and replace the ACA will impact the ACA or our business. Congress may consider other legislation to repeal or replace elements of the ACA in the future. We cannot predict what legislation, if any, to repeal or replace the ACA will become law, or what impact any such legislation may have on our product candidate.
In the European Union, pricing and reimbursement schemes vary widely from country to country and often within regions or provinces of countries. Some countries provide that drug products may be marketed only after a reimbursement price has been agreed and may limit the annual budget of coverage or request that the company participate in the cost above certain use levels or for treatments perceived as unsuccessful and impose monitoring processes on the use of the product. Some countries and hospitals may require inclusion into the hospital formulary for payment from the hospital budget. Some countries and hospitals may require the completion of additional studies that compare the cost‑effectiveness of a particular drug candidate to currently available therapies. For example, the European Union provides options for its member states to restrict the range of drug products for which their national health insurance systems provide reimbursement and to control the prices of medicinal products for human use. European Union member states may approve a specific price for a drug product or may instead adopt a system of direct or indirect controls on the profitability of the company placing the drug product on the market. Other member states allow companies to fix their own prices for drug products, but monitor and control company profits. The downward pressure on health care costs in general, particularly prescription drugs, has become intense. As a result, increasingly high barriers are being erected to the entry of new products. In addition, in some countries, cross‑border imports from low‑priced markets exert competitive pressure that may reduce pricing within a country. Any country that has price controls or reimbursement limitations for drug products may not allow favorable reimbursement and pricing arrangements.
Healthcare Law and RegulationRegulation; Data Privacy and Security Laws
Healthcare providers, physicians and third‑party payors play a primary role in the recommendation and prescription of drug products that are granted marketing approval. Arrangements with healthcare providers, third‑party payors and other customers are subject to broadly applicable fraud and abuse and other healthcare laws and regulations. Such restrictions under applicable federal and state healthcare laws and regulations, include the following:
the federal healthcare Anti‑Kickback Statute prohibits, among other things, persons from knowingly and willfully soliciting, offering, receiving or providing remuneration, directly or indirectly, in cash or in kind, to induce or reward either the referral of an individual for, or the purchase, order or recommendation of, any good or service for which payment may be made, in whole or in part, under a federal healthcare program such as Medicare and Medicaid;
the federal False Claims Act imposes civil penalties, and provides for civil whistleblower or qui tam actions, against individuals or entities for knowingly presenting, or causing to be presented, to the federal government, claims for payment that are false or fraudulent or making a false statement to avoid, decrease or conceal an obligation to pay money to the federal government; |
HIPAA, imposes criminal and civil liability for executing a scheme to defraud any healthcare benefit program or making false statements relating to healthcare matters;
HIPAA, as amended by HITECH and its implementing regulations, also imposes obligations, including mandatory contractual terms, on covered entities and their respective business associates with respect to safeguarding the privacy, security and transmission of individually identifiable health information;
the federal false statements statute prohibits knowingly and willfully falsifying, concealing or covering up a material fact or making any materially false statement in connection with the delivery of or payment for healthcare benefits, items or services;
the federal physician payment transparency requirements under the Affordable Care Act require certain manufacturers of drugs, devices and medical supplies to report to Centers for Medicare & Medicaid Services information related to payments and other transfers of value to physicians (defined to include doctors, dentists, optometrists, podiatrists and chiropractors), certain other healthcare professionals, and teaching hospitals and physician ownership and investment interests;
analogous state and foreign laws and regulations, such as state anti‑kickback and false claims laws, may apply to sales or marketing arrangements and claims involving healthcare items or services reimbursed by non‑governmental third‑party payors, including private insurers; and
similar healthcare laws and regulations in the E.U. and other jurisdictions, including reporting requirements detailing interactions with and payments to healthcare providers and laws governing the privacy and security of personal data, including the General Data Protection Regulation (“GDPR”), which imposes obligations and restrictions on the collection and use of personal data relating to individuals located in the E.U. and EEA (including with regard to health data).
Violations of any of these laws or any other governmental laws and regulations that may apply include, without limitation, significant civil, criminal and administrative penalties, damages, fines, imprisonment, exclusion of products from government funded healthcare programs, such as Medicare and Medicaid, disgorgement, contractual damages, reputational harm, diminished profits and the curtailment or restructuring of our operations.
Some state laws require pharmaceutical companies to comply with the pharmaceutical industry’s voluntary compliance guidelines and the relevant compliance guidance promulgated by the federal government in addition to requiring drug manufacturers to report information related to payments to physicians and other health care providers or marketing expenditures. Additionally, certain state and local laws require the registration of pharmaceutical sales representatives. State and foreign laws also govern the privacy and security of health information in some circumstances, many of which differ from each other in significant ways and often are not preempted by HIPAA, thus complicating compliance efforts. For example, the California Consumer Privacy Act, or CCPA, which went into effect on January 1, 2020, among other things, creates new data privacy obligations for covered companies and provides new privacy rights to California residents, including the right to opt out of certain disclosures of their information. The CCPA also creates a private right of action with statutory damages for certain data breaches, thereby potentially increasing risks associated with a data breach. Although the law includes limited exceptions, including for “protected health information” maintained by a covered entity or business associate, it may regulate or impact our processing of personal information depending on the context. Further, the California Privacy Rights Act (CPRA), recently passed in California. The CPRA will impose additional data protection obligations on covered businesses, including additional consumer rights processes, limitations on data uses, new audit requirements for higher risk data, and opt outs for certain uses of sensitive data. It will also create a new California data protection agency authorized to issue substantive regulations and could result in increased privacy and information security enforcement. The majority of the provisions will go into effect on January 1, 2023, and additional compliance investment and potential business process changes may be required.
Environmental, Health and Safety Matters
We are subject to extensive environmental, health and safety laws and regulations in a number of jurisdictions, primarily Israel, governing, among other things: the use, storage, registration, handling, emission and disposal of chemicals, waste materials and sewage; chemicals, air, water and ground contamination; air emissions and the cleanup of contaminated sites, including any contamination that results from spills due to our failure to properly dispose of chemicals, waste materials and sewage. Our operations at our Yavne manufacturing facility use chemicals and produce waste materials and sewage. Our activities require permits from various governmental authorities including, local municipal authorities, the Ministry of Environmental Protection and the Ministry of Health. The Ministry of Environmental Protection and the Ministry of Health, local authorities and the municipal water and sewage company conduct periodic inspections in order to review and ensure our compliance with the various regulations.
66
These laws, regulations and permits could potentially require the expenditure by us of significant amounts for compliance or remediation. If we fail to comply with such laws, regulations or permits, we may be subject to fines and other civil, administrative or criminal sanctions, including the revocation of permits and licenses necessary to continue our business activities. In addition, we may be required to pay damages or civil judgments in respect of third‑party claims, including those relating to personal injury (including exposure to hazardous substances we use, store, handle, transport, manufacture or dispose of), property damage or contribution claims. Some environmental, health and safety laws allow for strict, joint and several liability for remediation costs, regardless of comparative fault. We may be identified as a responsible party under such laws. Such developments could have a material adverse effect on our business, financial condition and results of operations.
In addition, laws and regulations relating to environmental, health and safety matters are often subject to change. In the event of any changes or new laws or regulations, we could be subject to new compliance measures or to penalties for activities which were previously permitted. For instance, new Israeli regulations were promulgated in 2012 relating to the discharge of industrial sewage into the sewer system. These regulations establish new and potentially significant fines for discharging forbidden or irregular sewage into the sewage system.
Properties
Our principal executive offices are located at 42 Hayarkon Street, Yavne 8122745, Israel. We lease these facilities from our largest shareholder, Clal Life Sciences, L.P. (“CLS”), pursuant to a sub‑lease agreement, as amended, that expires on October 30, 2022. The facilities consist of approximately 20,00032,300 square feet of space, and the yearly lease fee is approximately $245,000.$446,000. These facilities house our administrative headquarters, our research and development laboratories and our manufacturing plant.
The sub-lease agreement includes an option to extend the lease period for additional 3 years at our sole discretion.C. Organizational Structure
The legal name of our company is MediWound Ltd. and we are organized under the laws of the State of Israel. Our corporate structure consists of MediWound Ltd., our Israeli parent company, (i) MediWound Germany GmbH, our active wholly‑owned subsidiary, which was incorporated on April 16, 2013 under the laws of the Federal Republic of Germany (ii) MediWound US, Inc., which was incorporated on December 8, 2020 under the laws of the State of Delaware and (ii)(iii) MediWound UK Limited, our inactive wholly‑owned subsidiary, which was incorporated on July 26, 2004 under the laws of England. To the best of our knowledge, we also hold approximately 8% ownership interest in Polyheal Ltd.
D. Property, Plants and Equipment
See “ITEM 4.B. Business Overview—Properties” and, “ITEM 4.B. Business Overview—Manufacturing, Supply and Production.”Production” and “ITEM 4.B. Business Overview—Environmental, Health and Safety Matters”.
None.
| A. | Operating Results |
The information contained in this section should be read in conjunction with our consolidated financial statements for the year ended December 31, 20172020 and related notes, and the information contained elsewhere in this annual report. Our financial statements have been prepared in accordance with IFRS, as issued by the IASB.
Company Overview
We are a fully integrated biopharmaceutical company that develops, manufactures and commercializes novel, cost effective, bio-therapeutic solutions for tissue repair and regeneration. Our strategy is centered around our validated enzymatic platform technology, focused on developing, manufacturingnext-generation bio-active therapies for burn and commercializing novel therapeuticswound care and biological medicinal products to address unmet needs in the fields of severe burns, chronic and other hard‑to‑heal wounds, connectivefor tissue disorders and other indications. repair.
67
Our first innovative biopharmaceutical product, NexoBrid, received marketing authorization from the EMA and the Israeli, Argentinean, South Korean, Russian and ArgentineanPeruvian Ministries of Health for removal of dead or damaged tissue, known as eschar, in adults with deep partial‑ and full‑thickness thermal burns, also referred to as severe burns. NexoBrid which is based oncurrently in clinical development in North America. In September 2020, the FDA accepted for review our patentedBLA for NexoBrid for eschar removal in adults with deep partial thickness and/or full thickness thermal burns. NexoBrid, a concentrated mixture of proteolytic enzyme technology,enzymes enriched in bromelain, represents a new paradigm in burn care management and our clinical trials have demonstrated, with statistical significance, its ability to non‑surgically and rapidly remove the eschar earlier relative to existing standard of care upon patient admission, without harming viable tissues.
We established a commercial organization for the marketing,commercialize globally NexoBrid via multiple sales and distribution of NexoBrid, including European headquarters in Germany and sales and marketing teams throughout Europe.channels. We sell NexoBrid to burn centers in the Europe and Israel, primarily through our commercial organization,sales force, focusing on key burn centers and key opinion leader management, and are establishing additional distribution channels in the European Union to extend the product's outreach. We have signed distribution agreements with local distributors in multiple international markets, which are responsible for obtaining local marketing authorization within the relevant territory. In the United States, we entered into exclusive license and supply agreements with Vericel to commercialize NexoBrid in North America, under which we received an up-front payment from Vericel of $17.5 million in 2019, and may be entitled to an additional $7.5 million, contingent upon approval of our BLA, and up to $125 million contingent upon NexoBrid meeting certain annual sales milestones, tiered royalties on net sales ranging from mid-high single-digit to mid-teen percentages, an equal split of gross profit on committed BARDA procurement orders, and a double-digit royalty on any additional future BARDA purchases of NexoBrid. In Addition, Pursuant to the First BARDA Contract, BARDA has initiated the procurement of NexoBrid valued at $16.5 million, for emergency stockpile as part of the HHS mission to build national preparedness for public health medical emergencies in the Unites States. In August 2020, BARDA accepted the first shipment of NexoBrid. Additional quarterly deliveries are expected to occur throughout 2021. In other international markets we sell NexoBrid through local distributors with which we have launcheddistribution agreements. For additional information on the commercialization of NexoBrid in Argentina, through our local distributor, during 2016. See ITEM 4.B. “Information on the Company - Marketing, Sales and Distribution.”
We are conducting an on‑goingexpanded access treatment protocol (NEXT) for NexoBrid to treat burn patients with deep partial- and full-thickness burns in the U.S. Phase 3 pivotal study, which is funded by BARDA and which will continue to supporttake place during the review of our BLA by the FDA. We are also conducting a BLA submission to the FDA and a European pediatric study to broaden the approved indication of NexoBrid, both of which areis also being funded by BARDA. BARDA, in which we completed the patients enrollment stage.
An additional product candidate is EscharEx, a topical bioactive drug candidate designed to enzymatically debride chronic and other hard-to-heal wounds. In January 2021, we determined that, due to COVID-19 enrollment delays and potentially future COVID-19 pandemic related implications on the conduct of its clinical studies, we are accelerating our EscharEx Phase 2 adaptive design study, for the treatment of venous leg ulcers (VLUs), by adjusting its enrollment target to 120 patients, down from the 174 originally planned.
Our third innovative product candidate, MWPC005, is a topically applied biological drug candidate for the treatment of non-melanoma skin cancers, based on the same active substance of NexoBrid and EscharEx products, a concentrated mixture of proteolytic enzymes enriched in bromelain. We have launched a new clinical development program to evaluate safety and tolerability of MWPC005 in patients with non-melanoma skin cancer.
We manufacture NexoBrid and our product candidates in our state‑of‑the‑art, EMA‑certified, cGMP‑compliant, sterile pharmaceutical products manufacturing facility at our headquarters in Yavne, Israel. Our securities are listed for trading on Nasdaq since March 2014 following our Initial Public Offering.
future, as research and development activities are central to our operations, which will offset by cash inflows from NexoBrid.
Key Components of Statements of Operations
Revenues
Sources of revenues. We derive revenues from direct and indirect sales of NexoBrid to burn centers and hospitals burn units in Europe and Israel as well as to local distributors in other countries in accordance with distribution agreements. Therefore,agreements we have in place. We generate revenues from BARDA procurement of NexoBrid for emergency stockpile pursuant to BARDA contract. We have also begun to generate revenues under our exclusive license and supply agreements with Vericel, under which we received an up-front payment and may be entitled to additional payments as we progress towards commercialization of NexoBrid in North America.
Starting in May 2019, following entrance into the Vericel license and supply agreements, funding by BARDA was classified as revenues from development services. As a result, we also generate revenues from development services provided to BARDA. Our ability to generate additional, more significant revenues will depend on the successful commercialization of NexoBrid.NexoBrid, which itself will be dependent in part upon receipt of approval from the FDA.
Cost of Revenues
Our total cost of revenues includes expenses for the manufacturing of NexoBrid, includingincluding: the cost of raw materials,materials; employee‑related expenses, including salaries, equity based‑compensation and other benefits and related expenses, rental fees, utilitieslease payments, utility payments, depreciation, changes in inventory of finished products, royalties and depreciation.other manufacturing expenses. These expenses are partially reduced by an allotment of manufacturing costs associated with research and development activities to research and development expenses.
Starting in May 2019, following entrance into the Vericel license and supply agreements, cost of revenues also includes costs associated with the research and development services provided to BARDA, including salaries and related expenses, clinical trials, sub‑contractors and external advisors. We expect that our cost of revenues from sale of products will continue to increase as we expand the sale of NexoBrid throughout the European Union, the United States and internationally. We expect that our cost of revenues as a percentage of our total revenues will decrease to the extent that our sales from NexoBrid increase.other international markets.
Operating Expenses
Research and Development Expenses, grossnet
Research and development activities are central to our business model. Product candidates in later stages of clinical development generally have higher development costs than those in earlier stages of clinical development, primarily due to the increased size and duration of later‑stage clinical trials. We expect research and development costs to increase significantly for the foreseeable future as EscharEx progresses in its clinical program in the U.S. and our other pipeline product candidates’candidates' progress in clinical trials. However, we do not believe that it is possible at this time to accurately project total program‑specific expenses to reach commercialization. There are numerous factors associated with the successful development of any of our product candidates, including future trial design and various regulatory requirements, many of which cannot be determined with accuracy at this time based on our stage of development. Additionally, future commercial and regulatory factors beyond our control will affect our clinical development programs and plans. Our actual spending could differ as our plans change and we invest in other drugs or potentially reduce our anticipated funding on research for existing products.
Research and development expenses consist primarily of compensation for employees engaged in research and development activities, including salaries, equity‑based compensation, and benefits and related expenses, clinical trials, contract research organization sub‑contractors, expenses, development materials, external advisors and the allotted cost of our manufacturing facility for research and development purposes.
Participation by BARDA and IIA
On September 29, 2015, we have cumulatively spent approximately $37.5 millionwere awarded a contract by the First BARDA Contract, which was amended on July 17, 2017, May 2019 and again on March 2020. The amended contract valued up to $159 million. See “ITEM 4.B. Our Focus—Burn Care—BARDA Contracts.” The participation by BARDA was classified as reimbursement of research and development primarilyexpenses. Starting in May 2019, following entrance into the Vericel license and supply agreements, participation by BARDA was classified as revenues from development services.
We received grants until 2018, subject to repayment through future royalty payments, as part of the NexoBrid and EscharEx research and development programs approved by the IIA. Research and development grants which were received from the IIA was recognized upon receipt as a liability, if future economic benefits are expected from the project that will result in royalty‑bearing sales. The amount of which $19.0 millionthe liability for the loan was funded by participation by BARDA funds andfirst measured at fair value using a discount rate that reflects a market rate of interest that reflects the Israeli government grants. Our totalappropriate degree of risks inherent in our business. The change in the fair value of the liability associated with grants from the IIA is reflected as an increase or decrease in our research and development expenses net of participations, were approximately $6.0 million, $7.1 million, and $5.5 million in 2015, 2016, and 2017 respectively. for the relevant period.
Our research and development expenses relatedrelate primarily to the development of NexoBrid and EscharEx. We charge all research and development expenses to operations as they are incurred.
69
The successful development of our patented proteolytic enzymeenzymatic platform technology used in NexoBrid, EscharEx and additional pipeline product candidates is highly uncertain. As such, at this time, we cannot reasonably estimate or know the nature, timing and estimated costs of the efforts that will be necessary to complete the remainder of the development of our technology for additional indications. This uncertainty is due to numerous risks and uncertainties associated with developing products, including the uncertainty of:
the scope, rate of progress and expense of our research and development activities;
preclinical results;
clinical trial results;
the terms and timing of regulatory approvals;
the expense of filing, prosecuting, defending and enforcing patent claims and other intellectual property rights; and
the ability to market, commercialize and achieve market acceptance for NexoBrid or any other product candidate that we may develop in the future.
A change in the outcome of any of these variables with respect to the development of other products that we may develop could result in a significant change in the costs and timing associated with their development. For example, if the EMA, the FDA or other regulatory authority were to require us to conduct preclinical and clinical studies beyond those which we currently anticipate for the completion of clinical development of our product candidates or if we experience significant delays in enrollment in any clinical trials, we could be required to expend significant additional financial resources and time on the completion of the clinical development.
Selling and Marketing Expenses
Selling and marketing expenses consist primarily of compensation expenses for personnel engaged in sales and marketing, including salaries, equity based‑compensation and benefits and related expenses, as well as promotion, advertising,marketing, market access, medical, and sales and distribution activities. These expenses also include costs related to the maintenance of our officessubsidiary in Germany, which is focused primarily on marketing NexoBrid, and cost related to maintain marketing authorization holder related costs.authorization.
General and Administrative Expenses
General and administrative expenses consist principally of compensation for employees in executive and administrative functions, including salaries, equity‑based compensation, benefits and other related expenses, professional consulting services, including legal and audit fees, as well as costs of office and overhead. We expect general and administrative expenses to remain stable.
Financial Income/Financial Expense
Financial income includes interest income, revaluation of financial instruments revaluation of derivative instruments and exchange rate differences. Financial expense consists primarily of revaluation of financial instruments, financial expenses in respect of deferred revenue, revaluation of lease liabilities and exchange rate differences. The market interest due on government grants received from the IIA is also considered a financial expense, and is recognized beginning on the date we receive the grant until the date on which the grant is expected to be repaid as part of the revaluation to fair value of liabilities in respect of government grants.
71
Discontinued Operation
Following the expiration of our PolyHeal license in 2013, we accounted for our operation related to PolyHeal as a discontinued operation in accordance with IFRS accounting standard 5, “Non‑current Assets Held for Sale and Discontinued Operations.” Accordingly, the results of operations of the development, manufacturing and sales of PolyHeal, including impairments of inventories, our exclusive global license of the PolyHeal product and other assetsany legal process profit or loss are reported separately as a discontinued operation in our statement of operations for the periods presented below, as well as for all historical periods to be presented in future quarterly and annual releases of our results of operations.below.
Taxes on Income
The standard corporate tax rate in Israel was 26.5%, 25%24% in the year 2017, and 24% for the 2015, 2016 and 2017 tax year, respectively. Effectiveas of January 1, 2018 and thereafter, the corporate tax rate is 23%.
We do not generate taxable income in Israel, as we have historically incurred operating losses resulting in carry forward tax losses totaling approximately $115$130 million as of December 31, 2017.2020. We anticipate that we will be able to carry forward these tax losses indefinitely to future tax years. Accordingly, we do not expect to pay taxes in Israel until we have taxable income after the full utilization of our carry forward tax losses.
Under the Law for the Encouragement of Capital Investments, 5719‑1959 (the “Investment Law”), we have been granted “Beneficiary Enterprise” status, which provides certain benefits, including tax exemptions and reduced corporate tax rates. Income not eligible for Beneficiary Enterprise benefits is taxed at athe regular corporate tax rate. The benefit entitlement period starts from the first year that the Beneficiary Enterprise first earns taxable income, and is limited to 12 years from the year in which the company requested to have tax benefits apply.
Comparison of Period to Period Results of Operations
We are providing within this section a supplemental discussion that compares our historical statement of operations data in accordance with IFRS, as issued by the IASB. The followingbelow table sets forthand the below discussion provides data for each of the years ended December 31, 2019 and 2020. The below discussion of our results of operations in dollars and asomits a percentagecomparison of revenuesour results for the periods indicated:
| Years Ended December 31, | ||||||||||||
| 2015 | 2016 | 2017 | ||||||||||
| (in thousands) | ||||||||||||
| Consolidated statements of operations data: | ||||||||||||
| Revenues | $ | 601 | $ | 1,558 | $ | 2,496 | ||||||
| Cost of revenues | 2,519 | 2,158 | 1,578 | |||||||||
| Gross (loss) profit | (1,918 | ) | (600 | ) | 918 | |||||||
| Operating expenses: | ||||||||||||
| Research and development, gross | 8,139 | 14,779 | 14,625 | |||||||||
| Participation by BARDA and IIA | (2,118 | ) | (7,711 | ) | (9,163 | ) | ||||||
| Research and development, net of participations | 6,021 | 7,068 | 5,462 | |||||||||
| Selling and marketing | 9,284 | 8,403 | 5,362 | |||||||||
| General and administrative | 4,004 | 4,084 | 3,781 | |||||||||
| Operating loss | (21,227 | ) | (20,155 | ) | (13,687 | ) | ||||||
| Financial income | 1,052 | 2,166 | 406 | |||||||||
| Financial expense | (1,496 | ) | (896 | ) | (1,252 | ) | ||||||
| Loss from continuing operations | (21,671 | ) | (18,885 | ) | (14,533 | ) | ||||||
| Loss from discontinued operation | (417 | ) | — | (7,616 | ) | |||||||
| Net loss | $ | (22,088 | ) | $ | (18,885 | ) | $ | (22,149 | ) | |||
years ended December 31, 2018 and 2019. In order to view that discussion, please see “Item 5. Operating and Financial Review and Prospects—A. Operating Results— Comparison of Period to Period Results of Operations— Year Ended December 31, 20162018 Compared to Year Ended December 31, 20172019” in our Annual Report on Form 20-F for the year ended December 31, 2019, which we filed with the SEC on February 25, 2020.
| Years Ended December 31, | ||||||||
| 2019 | 2020 | |||||||
| Consolidated statements of operations data: | ||||||||
| Revenue from sales of products | $ | 3,611 | $ | 7,828 | ||||
| Revenue from development services | $ | 10,678 | $ | 13,935 | ||||
| Revenue from license agreements | $ | 17,500 | $ | - | ||||
| Total Revenues | $ | 31,789 | $ | 21,763 | ||||
| Cost of revenues | 11,849 | 14,218 | ||||||
| Gross profit | 19,940 | 7,545 | ||||||
| Operating expenses: | ||||||||
| Research and development, net of participation | 4,969 | 7,698 | ||||||
| Selling and marketing | 4,064 | 3,228 | ||||||
| General and administrative | 5,242 | 5,459 | ||||||
| Other expenses | 1,172 | - | ||||||
| Operating profit (loss) | 4,493 | (8,840 | ) | |||||
| Financial income | 556 | 843 | ||||||
| Financial expense | (2,983 | ) | (1,279 | ) | ||||
| Profit (loss) from continuing operations | 2,066 | (9,276 | ) | |||||
| Profit from discontinued operation | 2,889 | 80 | ||||||
| Net profit (loss) | $ | 4,955 | $ | (9,196 | ) | |||
72
Year Ended December 31, 2019 Compared to Year Ended December 31, 2020
Revenues
We generated total revenues of approximately $21.8 million for the year ended December 31, 2020 compared to approximately $31.8 million for the year ended December 31, 2019. The decrease in total revenues was a result of the $17.5 million upfront payment from the Vericel Licensing agreement for NexoBrid, partially offset by the sale of products increase.
Revenues from sale of products
Revenues from sales of NexoBridproducts in 20162020 increase of approximately $1.6$4.2 million comparedand 117% in comparison to approximately $2.5the $3.6 million in revenues from the sale2019, primarily as a result of BARDA’s procurement of NexoBrid for emergency stockpile. In 2020, BARDA has initiated the procurement of NexoBrid valued at $16.5 million for emergency stockpile, of which we have supplied approximately $5.8 million during 2020. Revenues from BARDA’s procurement were recognized net of Vericel’s share pursuant to gross profit split. Additional quarterly deliveries to BARDA are expected through end of 2021.
Revenues from development services
Revenues from development services increases from $10.7 million in 2017. The increase was primarily due2019 to an increase$13.9 million in 2020. Up to May 2019, prior to entering the Vericel licensing and supply agreements, participation by BARDA in the volumeamount of sales$3.8 million was recorded as reimbursement of research and development expenses.
Revenues from license agreement
In 2019, we recognized $17.5 million as a result of one-time upfront license payment from Vericel pursuant to the license agreement.
BARDA contributed 34% and 83% of our total revenue, in 2019 and 2020, respectively. Vericel contributed 55% of our total revenues in 2019.
Our revenues, as reported in our consolidated financial statements, are based on the location of the customers, as shown in the EU.below table:
| Years Ended December 31, | ||||||||
| 2019 | 2020 | |||||||
International (excluding U.S.) | $ | 3,285 | $ | 3,733 | ||||
U.S. | $ | 28,504 | $ | 18,030 | ||||
| $ | 31,789 | $ | 21,763 | |||||
73
Costs and Expenses
Cost of revenues
Cost of revenues from sales of products as a percentage of revenues decreased 27%to approximately 40% for the year ended December 31, 2020 from approximately $2.2 million65% in the year ended December 31, 2016 to2019. The decrease of cost of revenues from sales of product is primarily driven by BARDA procurement for emergency response preparedness.
Cost of revenues from development services as a percentage of revenues was approximately $1.6 million79% in the year ended December 31, 2017.
Cost of revenues from license agreements as a percentage of revenues were 4% in the year ended December 31, 2019, due to royalty payments pursuant to a reductionlicense agreement with Mark Klein in the development activities of EscharEx in 2017. Change in inventory of finished products decreased $1.8 million from $0.8 million in 2016regard to $(1.0) in 2017.Vericel upfront payment.
Research and development expenses, net of participations
Research and development expenses, gross, decreased 1%net participation, increased by 35% from approximately $14.8 million in the year ended December 31, 2016 to approximately $14.6 million in the year ended December 31, 2017. The expenses primarily related to development of NexoBrid, which was predominantly funded by BARDA participation, and EscharEx. The decrease resulted primarily from a decrease in the allotment of cost of manufacturing for research and development purposes related to NexoBrid and EscharEx.
Starting in May 2019, following entrance into the Vericel licensing and supply agreements, participation by BARDA in the yearamounts of $10.7 and 13.9 million for the years ended December 31, 2017.
Selling and marketing expenses
Selling and marketing expenses decreased 9%,21% in 2020 compared to 2019, from approximately $9.3$4.1 million in the year ended December 31, 20152019 to approximately $8.4$3.2 million in the year ended December 31, 2016.2020. The decrease wasin selling and marketing expenses, were primarily due to decreasedriven from our headquarters' restructuring in marketing activities associated with the launch of NexoBrid in the E.U.Europe.
General and administrative expenses
General and administrative expenses remained stable atincreased 4% in 2020 compared to 2019 from approximately $4.0 ‑ 4.1$5.2 million forin the yearsyear ended December 31, 2015 and2019 to approximately $5.5 million in the year ended December 31, 2016.2020.
Other expenses
Other one-time expenses for the year ended December 31, 2019 were $1.2 million associated with the Vericel license and supply agreements.
Financial income
Financial income increased from approximately $1.1$0.6 million in the year ended December 31, 20152019 to approximately $2.2$0.8 million in the year ended December 31, 2016. The increase was primarily due to an increase2020 as a result of $0.9 million in revaluation of contingent consideration forliability with respect to purchase of shares.shares, described below under “Application of Critical Accounting Policies and Estimates - Contingent Consideration for Purchase of Shares”.
Financial expense
Financial expense decreased from approximately $1.5$3.0 million in the year ended December 31, 20152019 to approximately $0.9$1.3 million in the year ended December 31, 2016. Financial2020. The decrease in financial expenses in 2015 included $0.62020 was primarily driven by the Teva contingent liability revaluation, described below under “Application of Critical Accounting Policies and Estimates - Contingent Consideration for Purchase of Shares”.
Profit from Discontinued operations
Profit from discontinued operations was $0.1 million related to currency exchanges differences.for the year ended December 31, 2020 compared with $2.9 million for the year ended December 31, 2019. The profit in both years was as a result of the Polyheal settlement of the litigation with certain PolyHeal Ltd.'s ("PolyHeal") shareholders. See “ITEM 8.A. Consolidated Statements and Other Financial Information—Legal Proceedings”.
74
B. Liquidity and Capital Resources
Our primary uses of cash are to fund working capital requirements, manufacturing costs, research and development expenses of NexoBridEscharEx and EscharEx andother products candidates, as well as sales and marketing activities associated with the commercialization of NexoBrid in Europe. Historically, we have funded our operations primarily through private placements of equity securities, loans, convertible loans, participation by government grants from BARDA and the IIA.
In March 2014, we closed our IPO, resulting in net proceeds to us of approximately $71.7 million. In September 2015, we were awarded a contract by BARDA, which is currently valued at upwas modified in July 2017, May 2019 and March 2020, in each case in order to $132 million, for theexpand BARDA’s commitment to us, and further advancement of the development and manufacturing, emergency readiness for NexoBrid deployment as well as the procurement, of NexoBrid as a mass casualty medical countermeasure to be used in a public health emergency. The contract, as modified, provides up to $82 million of funding to us. The BARDA contract also includes options for BARDA (i) to further fund $10 million in development activities for other potential NexoBrid indications, and (ii) to further fund $50 million for further procurement of NexoBrid from us. In addition, we were awarded an additional contract to develop NexoBrid for the United States.treatment of Sulfur Mustard injuries as part of BARDA’s preparedness for mass casualty events. The contract provides approximately $12 million of funding to support research and development activities up to pivotal studies in animals under the U.S. FDA Animal Rule and contains options for additional funding of up to $31 million for additional development activities, animal pivotal studies, and the BLA submission for licensure of NexoBrid for the treatment of Sulfur Mustard injuries. See “ITEM 4.B. Business Overview—Our Focus—Burn Care—BARDA Contract.Contracts.” Since we expect a significant portion of the funding for our NexoBrid development plan will be funded by BARDA, we intend to use a portion of our proceeds raised during our IPO initially intended for the development of NexoBrid to further advance the development of EscharEx. Furthermore, on March 7, 2016, the SEC declared our shelf registration statement on Form F‑3 effective. Under this shelf registration statement, we may offer from time to time up to $125 million in the aggregate of our ordinary shares, warrants and/or debt securities in one or more series or issuances. In September 2017,addition, we completed an underwritten publicfollow-on offering ofin September 2017, whereby we issued and sold 5,037,664 ordinary shares and received net proceeds of approximately $22.7 million after(after deducting the underwriting discount and offering expenses payable by us. us), pursuant to our previous shelf registration statement on Form F‑3. We currently intendwill continue to use the net proceeds from the sale of securities offered by us pursuant to our registration statement on Form F‑3that follow-on offering to fund our research and development activities, primarily the clinical development of EscharEx, and the remainder, if any, for working capital and other general corporate purposes. The timing and amount of our actual expenditures will be based on many factors, including cash flows from operations and the anticipated growth of our business.
The table below summarizes our sources of financing for the periods presented. The below discussion beneath the table omits a description of the sources of financing for the year ended December 31, 2018. In order to view that discussion, please see “Item 5. Operating and Financial Review and Prospects—B. Liquidity and Capital Resources” in our Annual Report on Form 20-F for the year ended December 31, 2019, which we filed with the SEC on February 25, 2020.
| Issuance of Ordinary Shares and Warrants | Government Grants and BARDA Funding, net | Total | ||||||||||
| (in thousands) | ||||||||||||
| Year ended December 31, 2017 | $ | 22,665 | $ | 8,895 | $ | 31,560 | ||||||
| Year ended December 31, 2016 | $ | 7 | $ | 6,466 | $ | 6,473 | ||||||
| Year ended December 31, 2015 | $ | 26 | $ | 1,552 | $ | 1,578 | ||||||
| Issuance of Ordinary Shares | BARDA Funding | Total | ||||||||||
| (in thousands) | ||||||||||||
| Year ended December 31, 2020 | $ | - | $ | 20,241 | $ | 20,241 | ||||||
| Year ended December 31, 2019 | $ | - | $ | 14,773 | $ | 14,773 | ||||||
Our sources of financing in the year ended December 31, 20172020 totaled $31.6$20.2 million and consisted primarily of the underwritten public offering proceeds of $22.7 million, IIA government grants totaling $0.3 million and funding under the BARDA contract totaling $8.6 million.
contracts and includes $2.2 million of Vericel gross profits split in respect of the initial BARDA procurement.Our sources of financing in the year ended December 31, 20162019 totaled $6.5$14.8 million and consisted primarily of IIA government grants totaling $0.9 million and funding under the BARDA contract totaling $5.6 million.contracts. The participation by BARDA for 2019 in an amount of $3.8 million was classified as participation by BARDA in Research and development expenses, and BARDA participation in an amount of $10.7 million was classified as revenues from development services.
75
As of December 31, 2017,2020, we had $36.1$21.6 million of cash, cash equivalents and cash equivalents.short-term deposits. Our net operating losses were $21.2 million, $20.2 million and $13.7profit was $4.5 million for the yearsyear ended December 31, 2015, 20162019 and 2017, respectively.net operating loss was $8.8 million for the year ended December 31, 2020. As of December 31, 2017,2020, we had an accumulated deficit of $129.4$135 million. We expect to continue to incur significant expenses and operating losses for the foreseeable future. The net losses we will incur may fluctuate from quarter to quarter.
Our capital expenditures for fiscal years 2015, 2016,2018, 2019 and 20172020 amounted to $0.4$0.5 million, $0.7$0.8 million and $1.0$0.9 million, respectively. Capital expenditures consist primarily of investments in manufacturing equipment and laboratory equipment.leasehold improvements.
Our future capital requirements will depend on many factors, including our revenue growth, the timing and extent of our spending on research and development efforts, and international expansion. We may also seek to invest in or acquire complementary businesses or technologies. To the extent that existing cash and cash from operations are insufficient to fund our future activities, we may need to raise additional funding through debt and equity financing. Additional funds may not be available on favorable terms or at all. We believe our existing cash, cash equivalents and short‑term bank deposits will be sufficient to satisfy our liquidity requirements for at least the next 1224 months.
Cash Flows
The following table summarizes our consolidated statement of cash flows for the periods presented:presented. The below discussion beneath the table omits a description of our cash flows for the year ended December 31, 2018. In order to view that discussion, please see “Item 5. Operating and Financial Review and Prospects—B. Liquidity and Capital Resources—Cash Flows” in our Annual Report on Form 20-F for the year ended December 31, 2019, which we filed with the SEC on February 25, 2020:
| Year Ended December 31, | Year Ended December 31, | |||||||||||||||||||
| 2015 | 2016 | 2017 | 2019 | 2020 | ||||||||||||||||
| (in thousands) | ||||||||||||||||||||
| Net cash provided by (used in): | ||||||||||||||||||||
| Continuing operating activities | $ | (19,601 | ) | $ | (16,445 | ) | $ | (14,892 | ) | $ | 9,888 | $ | (6,700 | ) | ||||||
| Continuing investing activities | 36,046 | 1,816 | 437 | (5,658 | ) | 17,385 | ||||||||||||||
| Continuing financing activities | 778 | 907 | 22,995 | (1,006 | ) | (629 | ) | |||||||||||||
| Discontinued operating activities | — | — | (1,563 | ) | (1,599 | ) | (195 | ) | ||||||||||||
| Discontinued investing activities | (1,239 | ) | - | |||||||||||||||||
Net cash used inprovided by (used in) continuing operating activities
Net cash used inby continuing operating activities wasdecreased to approximately $16.4$6.7 million in the year ended December 31, 20162020 compared to net cash provided in continuing operating activities of approximately $14.9$9.9 million in the year ended December 31, 2017.2019. The decrease was attributed primarily toas a result of the decreaseupfront license payment from the Vericel license and supply agreements in operating loss, which was partially offset by an increase in change of working capital assets, net.2019.
Net cash used in discontinued operating activities
Net cash used in discontinued operating activities was approximately $0$0.2 million in the year ended December 31, 20162020, compared to approximately $1.6 million in the year ended December 31, 2017.2019. The increasecash used in 2019 and 2020 was attributed primarily attributable to the consideration paid to PolyHeal’s shareholders following the district court ruling.settlement of the litigation with certain PolyHeal's shareholders. See “ITEM 8.A. Consolidated Statements and Other Financial Information—Legal Proceedings” and “ITEM 3.D. Risk Factors—We may have continuing obligations or liabilities under our former agreements with Teva Pharmaceutical Industries Ltd. and PolyHeal Ltd..
76
Net cash provided byused in continuing investing activities
Net cash provided byused in discontinued investing activities
Net cash used in discontinued investing activities of $0.4 million duringwas zero in the year ended December 31, 2017. The decrease was attributable primarily2020, compared to decrease of proceeds from short‑term bank deposits and an increase$1.2 million in purchase of property and equipment.
Net cash (used in) provided by continuing financing activities
Net cash provided byused in continuing financing activities was $0.9$0.6 million during the year ended December 31, 20162020 compared to $23.0$1.0 million during the year ended December 31, 2017. The increase was attributable primarily to our receipt of $22.7 million net proceeds from our underwritten public offering in 2017.
Application of Critical Accounting Policies and Estimates
Our accounting policies and their effect on our financial condition and results of operations are more fully described in our consolidated financial statements included elsewhere in this annual report. We have prepared our financial statements in accordance with IFRS as issued by the IASB. The preparation of these financial statements requires us to make estimates and assumptions that affect the reported amounts of assets and liabilities and the disclosure of contingent assets and liabilities at the date of the financial statements, as well as the reported revenues and expenses during the reporting periods. Actual results may differ from these estimates under different assumptions or conditions. See “ITEM 3.D. Risk Factors” for a discussion of the possible risks which may affect these estimates.
While our significant accounting policies are more fully described in the notes to our consolidated financial statements appearing elsewhere in this annual report, we believe that the accounting policies discussed below are critical to our financial results and to the understanding of our past and future performance, as these policies relate to the more significant areas involving management’s estimates and assumptions. We consider an accounting estimate to be critical if: (a) it requires us to make assumptions because information was not available at the time or it included matters that were highly uncertain at the time we were making our estimate; and (b) changes in the estimate could have a material impact on our financial condition or results of operations.
77
Revenue Recognition
The accounting policy for revenue recognition in accordance with IFRS15, “Revenues from Contracts with Customers” (the “Standard”), is as follows:
Revenues from the sale of products:
We currently generate revenues from direct and indirect sales of our innovative biopharmaceutical product, NexoBrid, to burn centers and hospital burn units inacross Europe, and Israel as well as toand local distributors in other countries. international markets. We also generate revenues from sales to BARDA for U.S. emergency stockpile.
We also recognize revenues from licensing transactions over time when we provide the customer a right to access our intellectual property throughout the license period.
Revenues from sale of products are recognized in profit or loss at the point in time when the control of the products is transferred to the customer, generally upon delivery of the products to the customer.
Revenue from development services:
Revenues from development services are recognized over time, during the period the customer receives and consumes the benefits provided by our performance. We charge our customers based on payment terms agreed upon in specific agreements. When payments are made before or after the service is performed, we recognize the resulting contract asset or liability.
Revenues from license agreements:
We determine whether the license to the Intellectual Property ("IP") is the right to use the IP, which has significant stand-alone functionality, or a right to access, which does not have a stand-alone value.
We recognize revenues from licensing transactions at a point in time when we provide the customer a right to use our intellectual property as it exists at the point in time at which the license is granted to the customer.
Combination of contracts:
We account for multiple contracts as a single contract when all the contracts are signed at or near the same time with the same customer or with related parties of the customer, and when one of the following criteria is met:
The contracts are negotiated as a package with a single commercial objective.
The amount of consideration to be paid in one contract depends on the consideration or performance of another contract.
The goods or services that we will provide according to the contracts represent a single performance obligation for us.
We allocate the collaboration agreements transaction price to each performance obligation using the best estimate of the stand-alone selling price of each one of them.
Variable consideration:
We determine the transaction price separately for each contract with a customer. When exercising this judgment, we evaluate the effect of each variable amount in the contract, taking into consideration discounts, penalties, variations, claims, non-cash consideration and the nature of multiple phases of the product lifecycle. In determining the effect of the variable consideration, we use the "most likely amount" method described in the Standard. Pursuant to this method, the amount of the consideration is determined as the single most likely amount in the range of possible consideration amounts in the contract. According to the Standard, variable consideration is included in the transaction price only to the extent that it is highly probable that a significant reversal in the economic benefitsamount of revenues recognized will flow to the company and the revenues can be reliably measured, regardless ofnot occur when the paymentuncertainty associated with the variable consideration is being made. Revenues are measured at the fair value of the consideration received or receivable, taking into account contractually defined terms of payment and excluding taxes or duty and net of returns and allowances, trade discounts and volume rebates.subsequently resolved.
For contracts that consist of products are recognized when allmore than one performance obligation, at contract inception we allocate the significant risks and rewards of ownership ofcontract transaction price to each distinct performance obligation identified in the products have passedcontract based on a relative stand-alone selling price basis. A performance obligation is a promise in a contract to transfer a distinct good or service to the buyer andcustomer. The stand-alone selling price is the seller no longer retains continuing managerial involvement. The delivery date of the products is usually the date ofprice at which ownership passes to the buyer.
78
Research and Development Expenses
Research expenses are recognized as expenses when incurred. Costs incurred on development projects are recognized as intangible assets as of the date as of which it can be established that it is probable that future economic benefits attributable to the asset will flow to us, considering its commercial feasibility. This is generally the case when regulatory approval for commercialization is achieved and costs can be measured reliably. Given the current stage of the development of our products, no development expenditures have yet been capitalized. Intellectual property‑related costs for patents are part of the expenditure for the research and development projects. Therefore, registration costs for patents are expensed when incurred as long as the research and development project concerned does not meet the criteria for capitalization.
Equity‑Based Compensation
We account for our equity‑based compensation for employees in accordance with the provisions of IFRS 2 “Share‑based Payment,” which requires us to measure the cost of equity‑based compensation based on the fair value of the award on the grant date.
We have selected the binominal pricing model as the most appropriate method for determining the estimated fair value of our equity‑based awards. The resulting cost of an equity incentive award is recognized as an expense over the requisite service period of the award, which is usually the vesting period. We recognize compensation expense over the vesting period using the accelerated method pursuant to which each vesting tranche is treated as a separate amortization period from grant date to vest date, and classify these amounts in the consolidated financial statements based on the department to which the related employee reports.
The determination of the grant date fair value of options using an optionoptions pricing model is affected by estimates and assumptions regarding a number of complex and subjective variables. These variables include the expected volatility of our share price over the expected term of the options, share option exercise and cancellation behaviors, risk‑free interest rates and expected dividends, which are estimated as follows:
Fair value of our ordinary shares. After March 20, 2014, the date our ordinary shares began trading on Nasdaq, the grant date fair value for equity‑based awards is based on the closing price of our ordinary shares on Nasdaq on the date of grant and fair value for all other purposes related to share‑based awards is the closing price of our ordinary shares on Nasdaq on the relevant date. |
Volatility. The expected share price volatility was based on the historical equity volatility of the ordinary shares of comparable companies that are publicly traded. |
Early exercise factor. Since adequate historical experience is not available to provide a reasonable estimate, the early exercise factor is determined based on peer group imperial studies. |
Risk‑free rate. The risk‑free interest rate is based on the yield from U.S. Treasury zero‑coupon bonds with a term equivalent to the contractual life of the options. |
Expected dividend yield. We have never declared or paid any cash dividends and do not presently plan to pay cash dividends in the foreseeable future. Consequently, we use an expected dividend yield of zero. |
If any of the assumptions used in the option pricing models change significantly, equity‑based compensation for future awards may differ materially compared with the awards granted previously.
Government Grants from the Israeli Innovation Authority (formerly the Office of the Chief Scientist)
Research and development grants received from the IIA are recognized upon receipt as a liability if future economic benefits are expected from the project that will result in royalty‑bearing sales. The amount of the liability for the loan is first measured at fair value using a discount rate that reflects a market rate of interest that reflects the appropriate degree of risks inherent in our business. We useduse a discount rate of 12% based in part on our cost of capital determined by an independent valuation analysis conducted at the time of our initial recognition of IIA grants as a liability on our balance sheets. The difference between the amount of the grant received and the fair value of the liability is accounted for as a government grant and recognized as a reduction of research and development expenses. After initial recognition, the liability is measured at amortized cost using the effective interest method. Royalty payments are treated as a reduction of the liability. If no economic benefits are expected from the research activity, the grant receipts are recognized as a reduction of the related research and development expenses. In that event, the royalty obligation is treated as a contingent liability in accordance with IAS 37, “Provisions, Contingent Liabilities and Contingent Assets.”
79
At the end of each reporting period, we evaluate whether there is reasonable assurance that the liability recognized will be repaid based on our best estimate of future sales and, if not, the appropriate amount of the liability is derecognized against a corresponding reduction in research and development expenses.
Government Funding from BARDA
Non‑royalty bearing funds from BARDA for funding research and development activities of NexoBrid are recognized at the time we are entitled to such funds on the basis of the related costs incurred and arewere recorded as a reduction fromto our research and development expenses. Starting May 2019, under the Vericel license and supply agreements, where Vericel has an effective control over the BARDA agreements, BARDA's funding for research and development activities of NexoBrid are recognized as revenues from development services.
Contingent Consideration for Purchase of Shares
On September 2, 2013, in accordance with the terms of the Teva Pharmaceuticals Industries Ltd. ("Teva") Shareholders’ Rights Agreement entered into in 2007 and amended in 2010, we exercised our rights to repurchase all of our shares held by Teva in consideration for an obligation to pay Teva future royalty payments of 20% of our revenues from the sale or license of NexoBrid resulting in royalty payments up to a total amount of $30.6 million and from the sale or license of the PolyHeal Product resulting in royalty payments up to a total amount of $10.8 million. We account for this obligation as a liability on our balance sheet in an amount equal to the fair value of the future royalty payments. In order to determine the fair value, we estimated the amount and timing of the future payments to Teva based on our projected results of operations. The obligation to pay Teva future royalty payments no longer includes amounts from the sale or license of the PolyHeal Product since the license to the PolyHeal Product has expired. The resulting liability as
Pursuant to the terms of the exercise dateTeva Settlement Agreement signed in March 2019 (the " Settlement Agreement with Teva"), Teva has agreed to reduce the contingent consideration that is payable to Teva pursuant to the repurchase of our shares from Teva in 2013. We became obligated to pay Teva annual future royalty payments of 15% of our revenues from products or license of NexoBrid starting from January 1, 2019, up to a total amount of $10.2 million, and Teva paid us $4.0 million in cash. The fair value of the revised future royalty obligation to Teva was estimated at approximately $19.2 million. The contingent consideration was revalued4.9 million as of December 31, 20162019, using a discounted cash flow model based on sales projections. As a result we recorded financial expenses of $1.7million in our consolidated statements of comprehensive profit or loss in respect of that settlement in the year ended December 31, 2019.
Pursuant to an amendment to the Teva Settlement Agreement from December 2020, Teva has agreed to revised the payment consideration that is payable to Teva pursuant to the purchase of shares. According to the amendment, we agreed to pay Teva $1 million upon signing and 2017became obligated to pay an additioanl amount of $2 million over the years 2021-2023, in addition to a modified contingent consideration in amount of $7.2 million in quarterly fixed payments starting 2021, subject to revenues generated from sales of NexoBrid. See “ITEM 8.A. Consolidated Statements and Other Financial Information—Legal Proceedings. Pursuant to the amendment of the Teva Settlement Agreement, the fair value of the liabilities in respect of purchase of shares was revaluated to be approximately $14.5$6.6 million, and $14.4 million, respectively, and we recorded financial income of $1.6 million in 2016 and financial expense of $0.4 million in 2017.
Impairment of Non‑Financial Assets
80
An impairment loss of an asset, other than goodwill, is reversed only if there have been changes in the estimates used to determine the asset’s recoverable amount since the last impairment loss was recognized. Reversal of an impairment loss, as above, may not increase the value above the lower of (i) the carrying amount that would have been determined (net of depreciation or amortization) had no impairment loss been recognized for the asset in prior years and (ii) its recoverable amount.
Lease Assets and liabilities
The operating lease obligations consist of payments pursuant to lease agreements for office and laboratory facilities, as well as lease agreements for 13 vehicles, which generally run for a period of three years
We initially adopted IFRS 16 and elected to apply the provisions of this accounting standard using the modified retrospective method in which we account a contract as a lease when the contract terms convey the right to control the use of an identified asset for a period of time in exchange for consideration. We recognize on the commencement date of the lease a right-of-use asset and a lease liability, excluding leases whose term is up to 12 months and leases for which the underlying asset is of low value. In measuring the lease liability, we elected to apply the practical expedient in this standard and do not separate the lease components from the non-lease components (such as management and maintenance services, etc.) included in a single contract.
On the commencement date, the lease liability includes all unpaid lease payments discounted at the interest rate implicit in the lease, if that rate can be readily determined, or otherwise using our incremental borrowing rate. After the commencement date, we measure the lease liability using the effective interest rate method. The lease liability was valued as $2.3 million as of December 31, 2020.
On the commencement date, the right-of-use asset is recognized in an amount equal to the lease liability plus lease payments already made on or before the commencement date and initial direct costs incurred. The right-of-use asset is measured applying the cost model and depreciated over the shorter of its useful life and the lease term. The right of-use was valued as $1.9 million as of December 31, 2020.
Israeli Corporate-Level Tax Considerations and Government Programs
The following is a brief summary of the material Israeli tax laws applicable to us, and certain Israeli Government programs that benefit us and therefore impact our results of operations and financial condition. To the extent that the discussion is based on new tax legislation that has not yet been subject to judicial or administrative interpretation, we cannot assure you that the appropriate tax authorities or the courts will accept the views expressed in this discussion. The discussion below is subject to change, including due to amendments under Israeli law or changes to the applicable judicial or administrative interpretations of Israeli law, which change could affect the tax consequences described below.
General Corporate Tax Structure in Israel
Generally, Israeli companies are subject to a corporate tax on their taxable income. Effective January 1, 2018 and thereafter, the corporate tax rate is 23%. However, the effective tax rate payable by a company that derives income from an Approved Enterprise, a Beneficiary Enterprise, a Preferred Enterprise or Technology Enterprise (as discussed below) may be considerably less. Capital gains derived by an Israeli company are generally subject to the prevailing regular corporate tax rate.
Law for the Encouragement of Industry (Taxes), 5729-1969
The Law for the Encouragement of Industry (Taxes), 5729-1969 (the “Industry Encouragement Law”), provides several tax benefits for “Industrial Companies.”
The Industry Encouragement Law defines an “Industrial Company” as an Israeli resident-company which was incorporated in Israel, of which 90% or more of its income in any tax year, other than income from certain government loans, is derived from an “Industrial Enterprise” owned by it and located in Israel. An “Industrial Enterprise” is defined as an enterprise whose principal activity in a given tax year is industrial production.
81
The following tax benefits, among others, are available to Industrial Companies:
amortization of the cost of purchased a patent, rights to use a patent, and know-how, which are used for the development or advancement of the Industrial Enterprise, over an eight-year period, commencing on the year in which such rights were first exercised;
under limited conditions, an election to file consolidated tax returns with related Israeli Industrial Companies controlled by it; and
expenses related to a public offering are deductible in equal amounts over a three years period commencing on the year of the offering.
Eligibility for benefits under the Industry Encouragement Law is not contingent upon approval of any governmental authority.
We believe that we currently qualify as an Industrial Company within the meaning of the Industry Encouragement Law. However, there can be no assurance that we will continue to qualify as an Industrial Company or that the benefits described above will be available in the future.
Law for the Encouragement of Capital Investments, 5719-1959
The Investment Law provides certain incentives for capital investments in production facilities (or other eligible assets).
The Investment Law was significantly amended several times during recent years, with the three most significant changes effective as of April 1, 2005 (the “2005 Amendment”), as of January 1, 2011 (the “2011 Amendment”), and as of January 1, 2017 (the “2017 Amendment”). Pursuant to the 2005 Amendment, tax benefits granted in accordance with the provisions of the Investment Law prior to its revision by the 2005 Amendment remain in force but any benefits granted subsequently are subject to the provisions of the amended Investment Law. Similarly, the 2011 Amendment introduced new benefits to replace those granted in accordance with the provisions of the Investment Law in effect prior to the 2011 Amendment. However, companies entitled to benefits under the Investment Law as in effect prior to January 1, 2011 were entitled to choose to continue to enjoy such benefits, provided that certain conditions are met, or elect instead, irrevocably, to forego such benefits and have the benefits of the 2011 Amendment apply. The 2017 Amendment introduces new benefits for Technological Enterprises, alongside the existing tax benefits. Prior to 2011, we did not utilize any of the benefits for which we were eligible under the Investment Law.
The following is a summary of the Investment Law subsequent to its amendments as well as the relevant changes contained in the new legislation.
Tax Benefits Subsequent to the 2005 Amendment
The 2005 Amendment applies to new investment programs and investment programs commencing after 2004, but does not apply to investment programs approved prior to April 1, 2005 (“Approved Enterprise”). The 2005 Amendment provides that terms and benefits included in any certificate of approval that was granted before the 2005 Amendment became effective (April 1, 2005) will remain subject to the provisions of the Investment Law as in effect on the date of such approval. Pursuant to the 2005 Amendment, the Israeli Authority for Investments and Development of the Israeli Ministry of Economy (the “Investment Center”) will continue to grant Approved Enterprise status to qualifying investments. The 2005 Amendment, however, limits the scope of enterprises that may be approved by the Investment Center by setting criteria for the approval of a facility as an Approved Enterprise.
The 2005 Amendment provides that Approved Enterprise status will only be necessary for receiving cash grants. As a result, it is no longer necessary for a company to obtain the advance approval of the Investment Center in order to receive the tax benefits previously available under the alternative benefits track. Rather, a company may claim the tax benefits offered by the Investment Law directly in its tax returns, provided that its facilities meet the criteria for tax benefits set forth in the 2005 Amendment. Companies or programs under the new provisions receiving these tax benefits are referred to as Beneficiary Enterprises. Companies that have a Beneficiary Enterprise, are entitled to approach the Israel Tax Authority for a pre‑ruling regarding their eligibility for tax benefits under the Investment Law, as amended.
82
Tax benefits are available under the 2005 Amendment to production facilities (or other eligible facilities), which are generally required to derive more than 25% of their business income from export to specific markets with a population of at least 14 million in 2012 (such export criteria will further increase in the future by 1.4% per annum). In order to receive the tax benefits, the 2005 Amendment states that a company must make an investment which meets certain conditions, including exceeding a minimum investment amount specified in the Investment Law. Such investment allows a company to receive “Beneficiary Enterprise” status, and may be made over a period of no more than three years from the end of the year in which the company chose to have the tax benefits apply to its Beneficiary Enterprise. Where the company requests to apply the tax benefits to an expansion of existing facilities, only the expansion will be considered to be a Beneficiary Enterprise and the company’s effective tax rate will be the weighted average of the applicable rates. In this case, the minimum investment required in order to qualify as a Beneficiary Enterprise is required to exceed a certain percentage of the value of the company’s production assets before the expansion.
The extent of the tax benefits available under the 2005 Amendment to qualifying income of a Beneficiary Enterprise depends on, among other things, the geographic location in Israel of the Beneficiary Enterprise. The location will also determine the period for which tax benefits are available. Such tax benefits include an exemption from corporate tax on undistributed income for a period of between two to ten years, depending on the geographic location of the Beneficiary Enterprise in Israel, and a reduced corporate tax rate of between 10% to 25% for the remainder of the benefits period, depending on the level of foreign investment in the company in each year. A company qualifying for tax benefits under the 2005 Amendment which pays a dividend out of income attributed to its Beneficiary Enterprise during the tax exemption period will be subject to corporate tax in respect of the amount of the dividend distributed (grossed‑up to reflect the pre‑tax income that it would have had to earn in order to distribute the dividend) at the corporate tax rate that would have otherwise been applicable. Dividends paid out of income attributed to a Beneficiary Enterprise (or out of dividends received from a company whose income is attributed to a Beneficiary Enterprise) are generally subject to withholding tax at source at the rate of 15% or such lower rate as may be provided in an applicable tax treaty, applicable to dividends and distributions out of income attributed to a Beneficiary Enterprise. The reduced rate of 15% is limited to dividends and distributions out of income attributed to a Beneficiary Enterprise during the benefits period and actually paid at any time up to 12 years thereafter, except with respect to a qualified Foreign Investment Company (as such term is defined in the Investment Law), in which case the 12‑year limit does not apply.
The benefits available to a Beneficiary Enterprise are subject to the fulfillment of conditions stipulated in the Investment Law and its regulations. If a company does not meet these conditions, it would be required to refund the amount of tax benefits, as adjusted by the Israeli consumer price index, and interest, or other monetary penalties.
We currently have Beneficiary Enterprise programs under the Investment Law, which we believe will entitle us to certain tax benefits. The majority of any taxable income from our Beneficiary Enterprise programs (once generated) would be tax exempt for a period of ten years commencing in the year in which we will first earn taxable income relating to such enterprises, subject to the 12-year limitation from the year the company chose to have its tax benefits apply.
Tax Benefits Under the 2011 Amendment
The 2011 Amendment canceled the availability of the tax benefits granted under the Investment Law prior to 2011 and, instead, introduced new tax benefits for income generated by a “Preferred Company” through its “Preferred Enterprise” (as such terms are defined in the Investment Law) as of January 1, 2011. The definition of a Preferred Company includes a company incorporated in Israel that is not fully owned by a governmental entity, and that has, among other things, Preferred Enterprise status and is controlled and managed from Israel.
The tax benefits under the 2011 Amendment for a Preferred Company meeting the criteria of the law include, among others, a reduced corporate tax rate of 15% for preferred income attributed to a Preferred Enterprise in 2011 and 2012, unless the Preferred Enterprise was located in a specified development zone, in which case the rate was 10%. Under the 2011 Amendment, such corporate tax rate was reduced in 2013 from 15% and 10%, respectively, to 12.5% and 7%, respectively, and then increased to 16% and 9%, respectively, in 2014 and thereafter until 2016. Pursuant to the 2017 Amendment, in 2017 and thereafter, the corporate tax rate for Preferred Enterprise which is located in a specified development zone was decreased to 7.5%, while the reduced corporate tax rate for other development zones remains 16%. Income attributed to a Preferred Company from a “Special Preferred Enterprise” (as such term is defined in the Investment Law) would be entitled, during a benefits period of 10 years, to reduced tax rates of 8%, or 5% if the Special Preferred Enterprise is located in a certain development zone. As of January 1, 2017, the definition of “Special Preferred Enterprise” includes less stringent conditions. Dividends paid out of preferred income attributed to a Preferred Enterprise or to a Special Preferred Enterprise are generally subject to withholding tax at source at the rate of 20% or such lower rate as may be provided in an applicable tax treaty (subject to the receipt in advance of a valid certificate from the Israel Tax Authority allowing for a reduced tax rate). However, if such dividends are paid to an Israeli company, no tax is required to be withheld (although, if such dividends are subsequently distributed to individuals or a non‑Israeli company, withholding tax at a rate of 20% or such lower rate as may be provided in an applicable tax treaty will apply).
83
The 2011 Amendment also provided transitional provisions to address companies already enjoying existing tax benefits under the Investment Law. These transitional provisions provide, among other things, that: unless an irrevocable request is made to apply the provisions of the Investment Law as amended in 2011 with respect to income to be derived as of January 1, 2011, a Beneficiary Enterprise can elect to continue to benefit from the benefits provided to it before the 2011 Amendment came into effect, provided that certain conditions are met.
We have examined the possible effect, if any, of these provisions of the 2011 Amendment on our financial statements and have decided, at this time, not to opt to apply the new benefits under the 2011 Amendment. There can be no assurance that we will comply with the conditions required to remain eligible for benefits under the Investment Law in the future or that we will be entitled to any additional benefits thereunder.
New Tax benefits under the 2017 Amendment that became effective on January 1, 2017.
The 2017 Amendment was enacted as part of the Economic Efficiency Law that was published on December 29, 2016, and is effective as of January 1, 2017. The 2017 Amendment provides new tax benefits for two types of “Technology Enterprises,” as described below, and is in addition to the other existing tax beneficial programs under the Investment Law.
The 2017 Amendment provides that a technology company satisfying certain conditions will qualify as a “Preferred Technology Enterprise” and will thereby enjoy a reduced corporate tax rate of 12% on income that qualifies as “Preferred Technology Income,” as defined in the Investment Law. The tax rate is further reduced to 7.5% for a Preferred Technology Enterprise located in development zone A. In addition, a Preferred Technology Company will enjoy a reduced corporate tax rate of 12% on capital gain derived from the sale of certain “Benefitted Intangible Assets” (as defined in the Investment Law) to a related foreign company if the Benefitted Intangible Assets were acquired from a foreign company on or after January 1, 2017 for at least NIS 200 million, and the sale receives prior approval from the Israeli Innovation Authority.
The 2017 Amendment further provides that a technology company satisfying certain conditions will qualify as a “Special Preferred Technology Enterprise” and will thereby enjoy a reduced corporate tax rate of 6% on “Preferred Technology Income” regardless of the company’s geographic location within Israel. In addition, a Special Preferred Technology Enterprise will enjoy a reduced corporate tax rate of 6% on capital gain derived from the sale of certain “Benefitted Intangible Assets” to a related foreign company if the Benefitted Intangible Assets were either developed by Special Preferred Technology Enterprise or acquired from a foreign company on or after January 1, 2017, and the sale received prior approval from IIA. A Special Preferred Technology Enterprise that acquires Benefitted Intangible Assets from a foreign company for more than NIS 500 million will be eligible for these benefits for at least ten years, subject to certain approvals as specified in the Investment Law.
Dividends distributed by a Preferred Technology Enterprise or a Special Preferred Technology Enterprise, paid out of Preferred Technology Income, are generally subject to withholding tax at source at the rate of 20% or such lower rate as may be provided in an applicable tax treaty (subject to the recipient in advance of a valid certificate from the Israeli Tax Authority allowing for reduced tax rate). However, if such dividends are paid to an Israeli company, no tax is required to be withheld. If such dividends are distributed to a foreign company and other conditions are met, the withholding tax rate will be 4% (or a lower under the tax treaty, if applicable, subject to the receipt in advance of a valid certificate from the Israeli Tax Authority allowing for a reduced tax rate).
84
C. Research and Development, Patents and Licenses, etc.
Our research and development strategy is centered on developing our patented proteolytic enzyme technology, which underlies NexoBrid and EscharEx, into additional products for high‑value indications. Our research and development team is located at our facilities in Yavne, Israel, and consists of 2665 employees as of December 31, 20172020 and is supported by highly experienced consultants in various research and development disciplines.
We have received government grants (subject to payment ofour obligation to pay royalties) as part of the NexoBrid and EscharEx research and development programs approved by the IIA (in 2017 only for EscharEx).IIA. The total gross amount of grants actually received by us from the IIA, including accrued LIBOR interest and net of royalties actually paid, totaled approximately $13.7 million as of December 31, 2017, totaled approximately $13.4 million2020 and the amortized cost (using the interest method) of the liability totaled approximately $6.9 million and $7.4$7.3 million as of December 31, 20162019 and 2017,2020, respectively. Because the repayment of IIA grants is in the form of future royalties, the balance of the commitments to the IIA is presented as an amortized liability on our balance sheet. As of December 31, 2017,2020, we had accrued and paid royalties to the IIA totaling $0.2 million.
We received funds from BARDA in accordance with the terms of our BARDA contract.contracts. As of December 31, 20172020 we had accrued $14.9 million.
For a description of our research and development policies for the last three years, see “ITEM 4.B. Business Overview—Research and Development.”
D. Trend Information
The COVID-19 pandemic has impacted companies in Israel and around the world, and as its trajectory remains highly uncertain, we cannot predict the duration and severity of the outbreak and its containment measures. Further, we cannot predict impacts, trends and uncertainties involving the pandemic’s effects on economic activity, the size of our labor force, our third-party partners, our investments in marketable securities, and the extent to which our revenue, income, profitability, liquidity, or capital resources may be materially and adversely affected. See also “ITEM 3.D. – Risk Factors – “The coronavirus (COVID-19) outbreak could adversely impact our business, financial condition and results of operations.” and – “We depend on a sole supplier to obtain our intermediate drug substance, bromelain SP, which is necessary for the production of our products.”
Other than the foregoing and as disclosed elsewhere in this annual report, we are not aware of any trends, uncertainties, demands, commitments or events for the period from January 1, 20172020 to December 31, 2017the present time that are reasonably likely to have a material adverse effect on our net revenue, income, profitability, liquidity or capital resources, or that caused the disclosed financial information to be not necessarily indicative of future operating results or financial condition.
E. Off‑Balance Sheet Arrangements
We do not currently engage in off‑balance sheet financing arrangements. In addition, we do not have any interest in entities referred to as variable interest entities, which includes special purposes entities and other structured finance entities.
85
| Payments Due by Period | ||||||||||||||||
| Total | 2018 | 2019 | 2020 and thereafter | |||||||||||||
| (in thousands) | ||||||||||||||||
Operating lease obligations(1) | $ | 1,719 | $ | 522 | $ | 450 | $ | 747 | ||||||||
A. Directors and Senior Management
The following table sets forth the name, age and position of each of our executive officers and directors as of MarchFebruary 15, 2018:2021:
| Name | Age | Position | ||
| Executive Officers | ||||
| Sharon Malka | 49 | Chief Executive Officer | ||
| Boaz Gur-Lavie | 47 | Chief Financial | ||
| Lior Rosenberg, M.D. | Chief Medical Technology Officer | |||
| Ety Klinger Ph.D. | Chief Research and Development Officer | |||
| Yaron Meyer | Executive Vice President, General Counsel and Corporate Secretary | |||
| Directors | ||||
| Executive Chairman of the Board of Directors | ||||
| Ofer Gonen | 48 | Director | ||
| 49 | Director | |||
Vickie R. Driver, M.D(3) | 67 | Director | ||
Nissim Mashiach(1)(2)(3)(4) | 60 | Director | ||
Sharon Kochan(1)(2)(3)(4) | 52 | Director | ||
Samuel Moed (2)(3)(4) | 58 | Director | ||
David Fox(1)(3)(4) | 63 | Director |
________________
| (1) | Member of our audit committee. |
| (2) | Member of our compensation committee. |
| (3) | Independent director under the listing rules of the Nasdaq Stock Market. |
| (4) | External director under the Companies Law. |
Executive Officers
Sharon Malka has served as our Chief Executive Officer since May 2019. Prior to that time, he served as our Chief Financial and Operations Officer, sincebeginning in April 2007. From 2002 to 2007, Mr. Malka was a partner at Variance Economic Consulting Ltd., a multi‑disciplinary consulting boutique that specializes in financial and business services. Mr. Malka also served as a Senior Manager at Kesselman Corporate Finance, a division of PricewaterhouseCoopers Global Network, from 1998 to 2002. Mr. Malka holds a B.Sc. in Business Administration from the Business Management College in Israel and an M.B.A. from Bar Ilan University, Israel.
Boaz Gur-Lavie has served as our Chief Financial Officer since June 2019. Prior to joining MediWound, Mr. Gur-Lavie co-founded in 2015 the Center for Digital Innovation (CDI), a non-profit organization determined to improve the quality of lives by creating innovative new solutions for challenges in the space of healthy aging and digital health, while focusing on senior citizens. In early 2015, he also co-founded MDClone, which introduced the world’s first Healthcare Data Sandbox, unlocking healthcare data to enable exploration, discovery and collaboration. Previously, he served as the chief financial officer of the Nasdaq-listed company, Pluristem Therapeutics, a stem-cell development company, from 2013 to 2015. He also served as the chief financial officer of STARLIMS, a Nasdaq listed company, until it was acquired by Abbott Laboratories in 2010, after which he served as the chief financial officer of Abbott’s informatics division until 2013. Mr. Gur-Lavie is a certified public accountant and received his B.A. in economics and M.B.A. in finance from the Ben-Gurion University in Israel.
86
Lior Rosenberg is one of our co‑founders and has served as our Chief Medical Technology Officer since 2001 and served as a member of our board of directors from 2001 to 2013. Since 2001, Dr. Rosenberg has headed the unit for Cleft Lip Palate and Craniofacial Deformities at Soroka University Medical Center and Meir Medical Centers in Beer Sheva and Kfar Saba, Israel, respectively. Since 1987, he has served as a Full Professor of plastic surgery at the Ben‑Gurion University Medical School in Beer Sheva, Israel. He also serves as the Chairman of the Burn Disaster Committee for the International Society of Burn Injuries and the Israeli Ministry of Health. From 1987 to 2012, Dr. Rosenberg served as the chairman of the Department of Plastic Surgery and Burn Unit at Soroka University Medical Center in Beer Sheva, Israel. He is a founding member of the Israeli Burn Association and the Mediterranean Burn Council, a member of the American Burn Association and a national representative at the European Burn Association. Dr. Rosenberg holds a M.D. degree from Tel‑Aviv University, Israel and a Professor of Plastic Surgery degree from the Ben Gurion University, Israel.
Ety Klinger has served as our Chief Research and Development Officer since May 2014. Prior to joining MediWound, Dr. Klinger was Vice President of Research and Development at Proteologics Ltd since July 2011, where she was responsible for discovery projects in the ubiquitin system, conducted in collaboration with GlaxoSmithKline plc and Teva. Prior to this, Dr. Klinger served for 17 years in numerous leadership positions at Teva’s global innovative R&D division and served as Teva’s Board representative at various biotechnology companies. Dr. Klinger was a key member of the Copaxone® development team. As a project leader she led the chemistry, manufacture and control, preclinical, clinical and post‑marketing R&D activities of various innovative treatments for multiple sclerosis (MS), autoimmune and neurological diseases. From 2006 to 2011, as a Senior Director at Teva, Dr. Klinger was a member of Teva’s global innovative R&D management team. From 2006 to 2008, she served as the Head of MS and Autoimmune Diseases at Teva, and led the Life Cycle Management (LCM) of innovative R&D. Dr. Klinger holds a B.Sc. in Biology from the Hebrew University in Jerusalem, a M.S. and a Ph.D. in Biochemistry from Tel‑Aviv University and an MBA degree from Tel Aviv University and Northwestern University.
Directors
Ofer Gonen has served as a member of our board of directors since September 2003. Mr. Gonen is also the Chief Executive Officer of Clal Biotechnology Industries Ltd. (“CBI”). (TASE: CBI) since 2017. Mr. Gonen manages CBI’sCBI's life science investments and business development in both the U.S.‑based operations and investment supportIsrael. Previously Mr. Gonen served as a Vice President of CBI’s portfolio companies.CBI from 2003-2015. Mr. Gonen serves as an executive chairman anda board member of several companies:portfolio companies, including Gamida Cell Ltd., CureTech Ltd., Campus Bio L.P., Clal Life Sciences L.P. and Clal Application Center Ltd. (Nasdaq: GMDA). Prior to joining CBI, Mr. Gonen was the general manager of Biomedical Investments Ltd., a partner in Arte Venture Group as well as a technology consultant to various Israeli venture capital funds and an Academic Aide to the Governor of the Bank of Israel.funds. Mr. Gonen gained extensive experience in R&D theand management in defense‑orientedof defense-oriented projects within the prestigious “Talpiot”"Talpiot" program of the IsraelIsraeli Defense Forces, for which he was awarded the Israeli National Security Medal. Mr. Gonen holds a B.Sc. in Physics, Mathematics and Chemistry from the Hebrew University of Jerusalem and an M.A. in Economics and Finance from Tel Aviv University, Israel.Israel.
Assaf Segal has served as a member of our board of directors since October 2017. Mr. Segal has served as the Chief Financial Officer at Clal Biotechnology Industries Ltd. since July 2015. Mr. Segal serves as a board member of several companies, including FDNA Inc., Pi-Cardia Ltd., Biokine therapeutics Ltd., Campus Bio Ltd., Clal Life Sciences L.P. and Clal Application Center Ltd. Prior to that time, Mr. Segal was a Partner at Variance Economic Consulting Ltd., from 2004 until June 2015, where he provided in‑depth consulting for international and local clients in a wide range of industries, including telecommunications, internet, biotech, heavy industry and financial sectors. Previously, he founded a start‑up software company. Mr. Segal also previously held a managerial position at PriceWaterhouseCoopers Corporate Finance and was an Economic Department manager at the North American division of Amdocs Inc. His experience also includes risk management and house account (“Nostro”) trading at the Union Bank of Israel, and serving as an economist for capital markets in the Research Department of the Bank of Israel. Mr. Segal also has many years of experience in economic consulting and company valuations, joint ventures and financial instruments for investments, M&A, and IPOs. He has 15 years of experience in economic consulting for international and local clients in the Bio‑Tech sector as well as in Hi‑Tech, financial and other sectors. He holds a B.A. in Economics and Statistics and an M.B.A. (Finance and Information Systems) from the Hebrew University of Jerusalem.
University.
Nissim Mashiach has served as a member of our board of directors since June 2017. Mr. Mashiach served as President and Chief Executive Officer of Macrocure Ltd., a Nasdaq‑listed biotechnology company focused on the treatment of chronic and other hard‑to‑heal wounds, from June 2012 to January 2017. From 2009 to 2012, he served as General Manager at Ethicon, a Johnson & Johnson company. Prior to Ethicon, he served as President and Chief Operating Officer at Omrix Biopharmaceuticals, Inc., which was acquired by Johnson & Johnson in 2008. Prior to Omrix, Mr. Mashiach held leadership positions at several pharmaceutical companies. He holds an MBA from the University of Manchester in Manchester, England, an MPharmSc from the Hebrew University in Jerusalem, Israel, and a B.Sc, Chemical Engineering from the Technion‑Israel Institute of Technology in Haifa, Israel.
Sharon Kochan has served as a member of our board of directors since June 2017. Mr. Kochan has served as Executive Vice President & President International,pharmaceuticals, for Perrigo Company Plc., a global, over‑the‑counter, consumer goods and specialty pharmaceutical company listed on the New York Stock Exchange, since 2018, President International from 2012 to 2018 and has been a member of the Perrigo Executive Committee since 2007. From March 2007 to July 2012, he served as Executive Vice President, General Manager of Prescription Pharmaceuticals for PerrigoPerigo and from 2005 to 2007, he was Senior Vice President of Business Development and Strategy for Perrigo. Mr. Kochan was Vice President, Business Development of Agis Industries (1983) Ltd. from 2001 until Perrigo acquired Agis in 2005. He completed the Senior Management Program at the Technion Institute of Management in Haifa, Israel, received a Master of Science in Operations Research & Management Science from Columbia University in New York City and received a Bachelor of Science in Industrial and Management Engineering from Tel‑Aviv University in Tel‑Aviv, Israel.
Mr. Samuel Moed has served as a member of our board of directors since April 2020. Prior to joining our board, Mr. Moed served as an executive at Bristol-Myers Squibb, a global biopharma company focused on innovative therapeutics. In his most recent capacity as Senior Vice President, Corporate Strategy, Mr. Moed led the strategic planning of the company in all major business activities worldwide. Previously, Mr. Moed oversaw strategy for BMS’ Worldwide Pharmaceuticals Group, encompassing a range of global strategic initiatives, and managed a global portfolio of strategic alliances. Among other positions, he served as President of U.S. Pharmaceuticals and as President of Worldwide Consumer Healthcare. Mr. Moed received a BA in history from Columbia University in New York City.
Mr. David Fox has served as a member of our board of directors since April 2020. Mr. Fox was most recently a partner at Kirkland & Ellis LLP and served as a member of its Global Executive Management Committee until 2019. Prior to joining Kirkland, Mr. Fox was partner with Skadden, Arps, Slate, Meagher & Flom LLP, where he was a member of its top governing committee. Mr. Fox is a director of Israel Discount Bank of New York, Gamida Cell Ltd., Atrium European Real Estate Limited, Atlas Crest Investment Corp. (which he is expected to leave upon closing of the merger between atlas crest and archer aviation) and Atlas Crest Investment Corp. II. He is a member of the board of directors at the Park Avenue Armory, and a member of the advisory board of New Alternatives for Children. Mr. Fox serves on the executive committee of the board of governors, and is an honorary fellow of the Hebrew University, Jerusalem. He holds an LL.B. degree from Jerusalem University, Israel.
89
B. Compensation
Compensation of Directors and Executive Officers
The table below reflects the compensation granted to our five most highly compensated officers during or with respect to the year ended December 31, 2017.2020. All amounts reported in the table reflect the cost to the company, as recognized in our financial statements for the year ended December 31, 2017.2020.
| Name and Position | Salary & Social Benefits(1) | Bonus | Share‑Based Payment(2) | Other Compensation(3) | Total | |||||||||||||||
(U.S. dollars)(4) | ||||||||||||||||||||
Gal Cohen, President and Chief Executive Officer | 391,116 | 129,972 | 175,284 | (22,175 | ) | 674,197 | ||||||||||||||
Sharon Malka, Chief Financial and Operations Officer | 260,450 | 98,599 | 161,581 | 34,822 | 555,453 | |||||||||||||||
Lior Rosenberg, M.D., Chief Medical Technology Officer | 291,990 | 96,078 | 91,265 | 36,630 | 515,964 | |||||||||||||||
Carsten Henke, Chief Commercial Officer EU & Managing Director of MediWound Germany GmbH | 270,734 | 98,223 | 104,044 | 50,874 | 523,875 | |||||||||||||||
Ety Klinger, Chief Research & Development Officer | 220,303 | 77,311 | 104,424 | 11,625 | 413,662 | |||||||||||||||
| Name and Position | Salary & Social Benefits(1) | Bonus | Share‑Based Payment(2) | Other Compensation(3) | Total | |||||||||||||||
( thousand U.S. dollars)(4) | ||||||||||||||||||||
Sharon Malka, Chief Executive Officer | 398 | 119 | 250 | 3 | 770 | |||||||||||||||
Lior Rosenberg, M.D., Chief Medical Technology Officer | 313 | 104 | 45 | 23 | 485 | |||||||||||||||
Ety Klinger, Chief Research & Development Officer | 273 | 86 | 60 | 16 | 435 | |||||||||||||||
Boaz Gur-Lavie, Chief Financial Officer | 241 | 76 | 63 | 24 | 404 | |||||||||||||||
Yaron Meyer, Executive Vice president, General Counsel & Corporate Secretary | 238 | 72 | 49 | 5 | 364 | |||||||||||||||
| (1) | Represents the officer’s gross salary plus payment of mandatory social benefits made by the company on behalf of such officer. Such benefits may include, to the extent applicable to the executive, payments, contributions and/or allocations for savings funds (e.g., Managers’ Life Insurance Policy), education funds (referred to in Hebrew as “keren hishtalmut”), pension, severance, risk insurances (e.g., life or work disability insurance) and payments for social security. |
| (2) | Represents the equity‑based compensation expenses recorded in the company’s consolidated financial statements for the year ended December 31, |
| (3) | Represents the other benefits to such officer, which includes either or both of (i) car expenses, including lease costs, gas and maintenance, provided to the officers, and (ii) vacation benefits. |
| (4) | Converted (i) from NIS into U.S. dollars at the rate of 2020. |
The aggregate compensation paid and equity‑based compensation and other payments expensed by us and our subsidiaries to our directors and executive officers with respect to the year ended December 31, 20172020 was $3.1$0.9 million. As of December 31, 2017,2020, options to purchase 1,198,0371,421,249 ordinary shares, exercisable at a weighted average exercise price of $2.63 per share, and restricted share units (“RSUs”) that may be settled for 60,003 ordinary shares, in each case granted to our directors and executive officers, were outstanding under our share option plans at a weighted average exercise price of $9.44 per share.equity incentive plans. We do not have any written agreements with any director providing for benefits upon the termination of such director’s relationship with our company or its subsidiaries.
Employment Agreements with Executive Officers
We have entered into written employment agreements with all of our executive officers, which include standard provisions for a company in our industry regarding non‑competition/solicitation, confidentiality of information and assignment of inventions. Except for Prof. Rosenberg, our Chief Medical Technology Officer, our executive officers will not receive benefits upon the termination of their respective employment with us, other than payment of salary and benefits (and limited accrual of vacation days) during the required notice period for termination of their employment, which varies for each individual. Upon termination of his employment, Prof. Rosenberg is entitled to a one‑time termination payment of ten months of salary.
90
Directors’ Service Contracts
Other than with respect to our directors that are also executive officers, there are no arrangements or understandings between us, on the one hand, and any of our directors, on the other hand, providing for benefits upon termination of their service as directors of our company.
2003 Israeli Share Option Plan
In November 2003, we adopted our 2003 Israeli Share Option Plan (the “2003 Plan”). The 2003 Plan provides for the grant of options to our and our subsidiaries’ directors, employees, officers, consultants and service providers, among others.
The initial reserved pool under the 2003 Plan was 1,710,000 ordinary shares and subsequently increased to a total of 3,230,000 ordinary shares. The 2003 Plan expired on December 31, 2013. Options that remain outstanding under the 2003 Plan continue to be governed by the terms of the plan, notwithstanding that expiration. The 2003 Plan is administered by our board of directors or a committee designated by our board of directors, which determines, subject to Israeli law, the grantees of options, the terms of the options, including exercise prices, vesting schedules, acceleration of vesting, the type of option and the other matters necessary or desirable for, or incidental to the administration of the 2003 Plan. The 2003 Plan provides for the issuance of options under various tax regimes including, without limitation, pursuant to Sections 102 and 3(i) of the Israeli Income Tax Ordinance (New Version) 1961 (the “Ordinance”).
Section 102 of the Ordinance allows employees, directors and officers who are not controlling shareholders and who are Israeli residents to receive favorable tax treatment for compensation in the form of shares or options. Section 102 of the Ordinance includes two alternatives for tax treatment involving the issuance of options or shares to a trustee for the benefit of the grantees and also includes an additional alternative for the issuance of options or shares directly to the grantee. Section 102(b)(2) of the Ordinance, which provides the most favorable tax treatment for grantees, permits the issuance to a trustee under the “capital gains track.” In order to comply with the terms of the capital gains track, all options granted under a specific plan and subject to the provisions of Section 102 of the Ordinance, as well as the shares issued upon exercise of such options and other shares received following any realization of rights with respect to such options, such as share dividends and share splits, must be registered in the name of a trustee selected by the board of directors and held in trust for the benefit of the relevant employee, director or officer. The trustee may not release these options or shares to the relevant grantee before the second anniversary of the registration of the options in the name of the trustee. However, under this track, we are not allowed to deduct an expense with respect to the issuance of the options or shares.
The 2003 Plan provides that options granted to our employees, directors and officers who are not controlling shareholders and who are considered Israeli residents are intended to qualify for special tax treatment under the “capital gains track” provisions of Section 102(b)(2) of the Ordinance. Our Israeli non‑employee service providers and controlling shareholders may only be granted options under Section 3(i) of the Ordinance, which does not provide for similar tax benefits.
Options granted under the 2003 Plan are subject to vesting schedules and generally expire ten years from approval of the option and vest over a four‑year period commencing on the date of grant, such that 25% of the granted options vest annually on each of the first, second, third and fourth anniversaries of the date of grant. Under the 2003 Plan, in the event of termination of employment or services for reasons of disability or death, the grantee, or in the case of death, his or her legal successor, may exercise options that have vested prior to termination within a period of six months after the date of termination. If a grantee’s employment or service is terminated for cause, all of the grantee’s vested and unvested options expire on the date of termination. If a grantee’s employment or service is terminated for any other reason, the grantee may exercise his or her vested options within 90 days after the date of termination. Any expired or unvested options are returned to the pool for reissuance.
The 2003 Plan provides that in the event of a merger or consolidation of our company or a sale of all, or substantially all, of our assets, the unexercised options outstanding may be assumed, or substituted for an appropriate number of shares of each class of shares or other securities as were distributed to our shareholders in connection with such transaction and the exercise price will be appropriately adjusted. If not so assumed or substituted, all non‑vested and non‑exercised options will expire upon the closing of the transaction. Our board of directors or its designated committee, as applicable, may provide in the option agreement that if the acquirer does not agree to assume or substitute the options, vesting of the options shall be accelerated so that any unvested option or any portion thereof will vest 10 days prior to the closing of the transaction. In the event that such consideration received in the transaction is not solely in the form of ordinary shares of another company, the board of directors or the designated committee, as applicable, may, with the approval of the acquirer, provide that in lieu of the assumption or substitution of the options, the options will be substituted by another type of asset or property, including cash.
91
2014 Equity Incentive Plan
In March 2014, we adopted and obtained shareholder approval for our 2014 Equity Incentive Plan, which was amended as of December 18, 2018 (the “2014 Plan”). The 2014 Plan provides for the grant of options, restricted shares, restricted share unitsRSUs and other share‑based awards to our and our subsidiaries’ and affiliates’ directors, employees, officers, consultants and advisors, among others and to any other person whose services are considered valuable to us or them, to continue as service providers, to increase their efforts on our behalf or behalf of a subsidiary or affiliate and to promote the success of our business. Following the approval of the 2014 Plan by the Israeli tax authorities, we are only granting options or other equity incentive awards under the 2014 Plan, although previously‑granted options and awards will continue to be governed by our 2003 Plan and the shares underlying such options and awards will count against the reserved pool for the 2014 Plan. The initial reserved pool under the 2014 Plan was 3,032,742 ordinary shares, which will automatically increase on January 1 of each year by a number of ordinary shares equal to the lowest of (i) 2% of our outstanding shares, (ii) 600,000 shares and (iii) a number of shares determined by our board of directors, if so determined prior to January 1 of the year in which the increase will occur. Theoccur; provided that the pool of shares reserved under the Plan shall not exceed 15% (fifteen percent) of the then outstanding shares. Pursuant to an “evergreen” provision in the 2014 Plan, the reserved pool was increased by 431,006, 540,955, 543,577 and, 540,955544,055 ordinary shares as of January 1, 2015, January 1, 2018, January 1, 2019 and January 1, 2018,2020, respectively, representing 2% of our outstanding shares as of each such date. We did not increase the reserved pool in 2016 or 2017.
The 2014 Plan is administered by our board of directors or by a committee designated by the board of directors, which determine, subject to Israeli law, the grantees of awards and the terms of the grant, including exercise prices, vesting schedules, acceleration of vesting and the other matters necessary in the administration of the 2014 Plan. The 2014 Plan enables us to issue awards under various tax regimes, including, without limitation, pursuant to Sections 102 and 3(i) of the Ordinance, as discussed under “—2003 Share Incentive Plan” above, and under Section 422 of the U.S. Internal Revenue Code of 1986, as amended (the “Code”).
Options granted under the 2014 Plan to U.S. residents may qualify as “incentive stock options” within the meaning of Section 422 of the Code, or may be non‑qualified. The exercise price for “incentive stock options” must not be less than the fair market value on the date on which an option is granted, or 110% of the fair market value if the option holder holds more than 10% of our share capital.
We currently intend to grant awards under the 2014 Plan under the capital gains track of Section 102(b)(2) of the Ordinance only to our employees, directors and officers who are not controlling shareholders and are considered Israeli residents.
Awards under the 2014 Plan may be granted until ten years from the date on which the 2014 Plan was approved by our board of directors.
Options granted under the 2014 Plan generally vest over three or four years commencing on the date of grant, such that 33% or 25%, respectively, vests annually on the anniversary of the date of grant. Options, other than certain incentive share options, that are not exercised within ten years from the grant date expire, unless otherwise determined by our board of directors or its designated committee, as applicable. Share options that qualify as “incentive stock options” and are granted to a person holding more than 10% of our voting power will expire within five years from the date of the grant. In the event of the death of a grantee while employed by or performing service for us or a subsidiary or within three months thereafter, or the termination of a grantee’s employment or services for reasons of disability, the grantee, or in the case of death, his or her legal successor, may exercise options that have vested prior to termination within a period of one year from the date of disability or death. If we terminate a grantee’s employment or service for cause, all of the grantee’s vested and unvested options will expire on the date of termination. If a grantee’s employment or service is terminated for any other reason, the grantee may exercise his or her vested options within three months of the date of termination. Any expired or unvested options return to the pool for reissuance.
92
In the event of a merger or consolidation of our company or a sale of all, or substantially all, of our shares or assets or other transaction having a similar effect on us, then without the consent of the option holder, our board of directors or its designated committee, as applicable, may but is not required to (i) cause any outstanding award to be assumed or an equivalent award to be substituted by such successor corporation, or (ii) in case the successor corporation refuses to assume or substitute the award (a) provide the grantee with the option to exercise the award as to all or part of the shares or (b) cancel the options against payment in cash in an amount determined by the board of directors or the committee as fair in the circumstances. Notwithstanding the foregoing, our board of directors or its designated committee may upon such event amend or terminate the terms of any award, including conferring the right to purchase any other security or asset that the board of directors shall deem, in good faith, appropriate. Our board of directors or its designated committee may, in its discretion, approve that any awards granted under the 2014 Plan shall be subject to additional conditions in the case of a merger or a consolidation.
Restricted share awards are ordinary shares that are awarded to a participant subject to the satisfaction of the terms and conditions established by the board of directors or a committee designated by the board of directors. Until such time as the applicable restrictions lapse, restricted shares are subject to forfeiture and may not be sold, assigned, pledged or otherwise disposed of by the participant who holds those shares. Generally, if a grantee’s employment or service is terminated for any reason prior to the expiration of the time when the restrictions lapse, shares that are still restricted will be forfeited.
The following table provides information regarding the outstanding options to purchase our ordinary shares, and RSUs held by each of our directors and executive officers who beneficially ownowns greater than 1% of our ordinary shares (after including shares underlying options or options to purchase more than 1% of our ordinary sharesRSUs) as of MarchFebruary 15, 2018:2021:
| Name | Number of Options | Grant Date | Exercise Price | Vested Options as of March 15, 2018 | Expiration Date | |||||||||
Gal Cohen, President and Chief Executive Officer | 208,332 | 11/14/2006 | $ | 2.63 | 208,332 | 11/13/2020 | ||||||||
| 45,600 | 1/15/2011 | $ | 9.82 | 45,600 | 1/14/2021 | |||||||||
| 152,000 | 12/24/2013 | $ | 12.89 | 152,000 | 12/23/2023 | |||||||||
| 70,000 | 1/28/2016 | $ | 9.58 | 35,000 | 12/22/2025 | |||||||||
Lior Rosenberg, Chief Medical Technology Officer | 76,000 | 12/24/2013 | $ | 12.89 | 76,000 | 12/23/2023 | ||||||||
| 25,000 | 12/23/2015 | $ | 9.58 | 12,500 | 12/22/2025 | |||||||||
| Name | Number of Options | Number of RSUs | Grant Date | Exercise Price | Vested Options/RSU's as of February 15, 2021 | Expiration Date | ||||||||||||
Sharon Malka, Chief Executive Officer | 121,600 | 12/24/2013 | $ | 12.89 | 121,600 | 12/23/2023 | ||||||||||||
| 50,000 | 12/23/2015 | $ | 9.58 | 50,000 | 12/22/2025 | |||||||||||||
| 135,000 | 12/31/2018 | $ | 5.15 | 67,500 | 12/30/2028 | |||||||||||||
| 45,000 | 12/31/2018 | 22,500 | ||||||||||||||||
| 40,000 | 5/2/2019 | $ | 4.92 | 10,000 | 5/1/2029 | |||||||||||||
| 20,000 | 5/2/2019 | 5,000 | ||||||||||||||||
| 81,170 | 6/29/2020 | $ | 1.75 | - | 6/28/2030 | |||||||||||||
Lior Rosenberg, Chief Medical Technology Officers | 76,000 | 12/24/2013 | $ | 12.89 | 76,000 | 12/23/2023 | ||||||||||||
| 25,000 | 12/23/2015 | $ | 9.58 | 25,000 | 12/22/2025 | |||||||||||||
| 20,000 | 12/31/2018 | $ | 5.15 | 5,000 | 12/30/2028 | |||||||||||||
| 6,667 | 12/31/2018 | 3,334 | ||||||||||||||||
| 43,600 | 4/23/2020 | $ | 1.75 | - | 4/22/2030 | |||||||||||||
C. Board Practices
Board of Directors
Under the Israeli Companies Law, the management of our businesscompany is vested in our board of directors. Our board of directors may exercise all powers and may take all actions that are not specifically granted to our shareholders or to management. Our executive officers are responsible for our day‑to‑day management and have individual responsibilities established by our board of directors. Our Chief Executive Officer is appointed by, and serves at the discretion of, our board of directors, subject to the employment agreement that we have entered into with him. All other executive officers are also appointed by our board of directors, and are subject to the terms of any applicable employment agreements that we may enter into with them.
Under our articles of association, our board of directors must consist of at least five and not more than nine directors, including at least two external directors required to be appointed under the Israeli Companies Law. At any time the minimum number of directors (other than the external directors) shall not fall below three. Other than external directors, for whom special election requirements apply under the Israeli Companies Law, as detailed below, the Israeli Companies Law and our articles of association provide that directors are elected annually at the general meeting of our shareholders by a vote of the holders of a majority of the voting power represented present and voting, in person or by proxy, at that meeting. We have only one class of directors.
In accordance with the exemption available to foreign private issuers under Nasdaq rules, we doare not followrequired to comply with the requirements of the Nasdaq rules with regard to having a majority of independent directors on our board of directors, and instead,as long as we follow Israeli law and practice, in accordance with which our board of directors includes at least two external directors. Our board of directors has determined that four of our six current directors are independent under the Nasdaq Stock Market listing rules. The definition of “independent director” under the Nasdaq Stock Market listing rules and “external director” under the Israeli Companies Law overlap to a significant degree such that we would generally expect the two directors that serve as external directors to qualify as independent under the Nasdaq Stock Market listing rules. However, it is possible for a director to qualify as an “external director” under the Israeli Companies Law without qualifying as an “independent director” under the Nasdaq Stock Market listing rules, or vice‑versa. The definition of external director under the Israeli Companies Law includes a set of statutory criteria that must be satisfied, including criteria whose aim is to ensure that there is no factor that would impair the ability of the external director to exercise independent judgment. The definition of independent director under the Nasdaq Stock Market listing rules specifies similar, although less stringent, requirements in addition to the requirement that the board of directors consider any factor which would impair the ability of the independent director to exercise independent judgment. In addition, external directors serve for a period of three years pursuant to the requirements of the Israeli Companies Law. However, external directors must be elected by a special majority of shareholders while independent directors may be elected by an ordinary majority. See “—External Directors” for a description of the requirements under the Israeli Companies Law for a director to serve as an external director.
In accordance with the exemption available to foreign private issuers under Nasdaq rules, we do not follow the requirements of the Nasdaq rules with regard to the process of nominating directors, and instead follow Israeli law and practice, in accordance with which our board of directors (or a committee thereof) is authorized to recommend to our shareholders director nominees for election.
Under the Israeli Companies Law and our articles of association, nominees for directors may also be proposed by any shareholder holding at least 1% of our outstanding voting power. However, any such shareholder may propose a nominee only if a written notice of such shareholder’s intent to propose a nominee has been given to our Secretary (or, if we have no such Secretary, our Chief Executive Officer). AnyPursuant to our Articles of Association, any such notice must include certain information, including, among other things, a description of all arrangements between the nominating shareholder and the proposed director nominee(s) and any other person pursuant to which the nomination(s) are to be made by the nominating shareholder, the consent of the proposed director nominee(s) to serve as our director(s) if elected and a declaration signed by the nominee(s) declaring that there is no limitation under the Israeli Companies Law preventing their election, and that all of the information that is required under the Israeli Companies Law to be provided to us in connection with such election has been provided. Under the Israeli Companies Law regulations, any such shareholder nomination must be delivered to our registered Israeli office within seven days after we publish notice of our upcoming annual general meeting of shareholders (or within 14 days after we publish a preliminary notification of an upcoming annual general meeting).
In addition, our articles of association allow our board of directors to appoint directors to fill vacancies on our board of directors for a term of office equal to the remaining period of the term of office of the director(s) whose office(s) have been vacated. External directors are elected for an initial term of three years and may be elected for additional three‑year terms under the circumstances described below. External directors may be removed from office only under the limited circumstances set forth in the Israeli Companies Law. See “—External Directors.”
Under the Israeli Companies Law, our board of directors must determine the minimum number of directors who are required to have accounting and financial expertise. See “—External Directors” below. In determining the number of directors required to have such expertise, our board of directors must consider, among other things, the type and size of the company and the scope and complexity of its operations. Our board of directors has determined that the minimum number of directors of our company who are required to have accounting and financial expertise is one.
We are not a party to, and are not aware of, any voting agreements among our shareholders. In addition, there are no family relationships among our executive officers and directors.
Under regulations recently promulgated under the Israeli Companies Law, Israeli public companies whose shares are traded on certain U.S. stock exchanges, such as the Nasdaq Global Market, and that lack a controlling shareholder (as defined below) are exempt from the requirement to appoint external directors. Any such company is also exempt from the Israeli Companies Law requirements related to the composition of the audit and compensation committees of the Board. Eligibility for these exemptions is conditioned on compliance with U.S. stock exchange listing rules related to majority Board independence and the composition of the audit and compensation committees of the Board, as applicable to all listed domestic U.S. companies. Because we have a controlling shareholder (CBI), we are not eligible for these exemptions under the new regulations.
External Directors
Under the Israeli Companies Law, we areour board of directors is required to include at least two members who qualify as external directors. Our current external directors are Nissim Mashiach and Sharon Kochan, each of whom serves on our audit committee and compensation committee.
The provisions of the Israeli Companies Law set forth special approval requirements for the election of external directors. External directors must be elected by a majority vote of the shares present and voting at a meeting of shareholders, provided that either:
such majority includes at least a majority of the shares held by all shareholders who are not controlling shareholders and do not have a personal interest in the election of the external director (other than a personal interest not deriving from a relationship with a controlling shareholder) that are voted at the meeting, excluding abstentions, to which we refer as a disinterested majority; or
the total number of shares voted by non‑controlling shareholders and by shareholders who do not have a personal interest in the election of the external director against the election of the external director does not exceed 2% of the aggregate voting rights in the company.
The term “controlling shareholder” as used in the Israeli Companies Law for purposes of all matters related to external directors and for certain other purposes (such as the requirements related to appointment to the audit committee or compensation committee, as described below), means a shareholder with the ability to direct the activities of the company, other than by virtue of being an office holder. A shareholder is presumed to be a controlling shareholder if the shareholder holds 50% or more of the voting rights in a company or has the right to appoint the majority of the directors of the company or its general manager. With respect to certain matters (various related party transactions), a controlling shareholder is deemed to include a shareholder that holds 25% or more of the voting rights in a public company if no other shareholder holds more than 50% of the voting rights in the company, but excludes a shareholder whose power derives solely from his or her position as a director of the company or from any other position with the company.
The initial term of an external director is three years. Thereafter, an external director may be reelected by shareholders to serve in that capacity for up to two additional three‑year terms, provided that either:
| (i) | his or her service for each such additional term is recommended by one or more shareholders holding at least 1% of the company’s voting rights and is approved at a shareholders meeting by a disinterested majority, where the total number of shares held by non‑controlling, disinterested shareholders voting for such reelection exceeds 2% of the aggregate voting rights in the company, subject to additional restrictions set forth in the Israeli Companies Law with respect to affiliations of external director nominee; or |
| (ii) | his or her service for each such additional term is recommended by the board of directors and is approved at a meeting of shareholders by the same majority required for the initial election of an external director (as described above). |
The term of office for external directors for Israeli companies traded on certain foreign stock exchanges, including the Nasdaq Global Market, may be extended indefinitely in increments of additional three‑year terms, in each case provided that the audit committee and the board of directors of the company confirm that, in light of the external director’s expertise and special contribution to the work of the board of directors and its committees, the reelection for such additional period(s) is beneficial to the company, and provided that the external director is reelected subject to the same shareholder vote requirements (as described above regarding the reelection of external directors). Prior to the approval of the reelection of the external director at a general meeting of shareholders, the company’s shareholders must be informed of the term previously served by him or her and of the reasons why the board of directors and audit committee recommended the extension of his or her term.
External directors may be removed from office by a special general meeting of shareholders called by the board of directors, which approves such dismissal by the same shareholder vote percentage required for their election or by a court, in each case, only under limited circumstances, including ceasing to meet the statutory qualifications for appointment, or violating their duty of loyalty to the company.
If an external directorship becomes vacant and there are fewer than two external directors on the board of directors at the time, then the board of directors is required under the Israeli Companies Law to call a shareholders’ meeting as soon as practicable to appoint a replacement external director. Each committee of the board of directors that exercises the powers of the board of directors must include at least one external director, except that the audit committee and the compensation committee must include all external directors then serving on the board of directors and an external director must serve as chair thereof. Under the Israeli Companies Law, external directors of a company are prohibited from receiving, directly or indirectly, any compensation from the company other than for their services as external directors pursuant to the Israeli Companies Law and the regulations promulgated thereunder. Compensation of an external director is determined prior to his or her appointment and may not be changed during his or her term subject to certain exceptions.
The Israeli Companies Law provides that a person is not qualified to be appointed as an external director if (i) the person is a relative of a controlling shareholder of the company, or (ii) if that person or his or her relative, partner, employer, another person to whom he or she was directly or indirectly subordinate, or any entity under the person’s control, has or had, during the two years preceding the date of appointment as an external director: (a) any affiliation or other disqualifying relationship with the company, with any person or entity controlling the company or a relative of such person, or with any entity controlled by or under common control with the company; or (b) in the case of a company with no shareholder holding 25% or more of its voting rights, had at the date of appointment as an external director, any affiliation or other disqualifying relationship with a person then serving as chairman of the board or chief executive officer, a holder of 5% or more of the issued share capital or voting power in the company or the most senior financial officer.
The term “relative” is defined in the Israeli Companies Law as a spouse, sibling, parent, grandparent or descendant; spouse’s sibling, parent or descendant; and the spouse of each of the foregoing persons. Under the Israeli Companies Law, the term “affiliation” and the similar types of disqualifying relationships include (subject to certain exceptions):
an employment relationship;
a business or professional relationship even if not maintained on a regular basis (excluding insignificant relationships);
control; and
service as an office holder, excluding service as a director in a private company prior to the initial public offering of its shares if such director was appointed as a director of the private company in order to serve as an external director following the initial public offering.
The term “office holder” is defined in the Israeli Companies Law as a general manager (i.e., chief executive officer), chief business manager, deputy general manager, vice general manager, any other person assuming the responsibilities of any of these positions regardless of that person’s title, a director and any other manager directly subordinate to the general manager.
In addition, no person may serve as an external director if that person’s position or professional or other activities create, or may create, a conflict of interest with that person’s responsibilities as a director or otherwise interfere with that person’s ability to serve as an external director or if the person is an employee of the Israel Securities Authority of an Israeli stock exchange. A person may furthermore not continue to serve as an external director if he or she received direct or indirect compensation from the company including amounts paid pursuant to indemnification or exculpation contracts or commitments and insurance coverage for his or her service as an external director, other than as permitted by the Israeli Companies Law and the regulations promulgated thereunder.
Following the termination of an external director’s service on a board of directors, such former external director and his or her spouse and children may not be provided a direct or indirect benefit by the company, its controlling shareholder or any entity under its controlling shareholder’s control. This includes engagement as an office holder of the company or a company controlled by its controlling shareholder or employment by, or provision of services to, any such company for consideration, either directly or indirectly, including through a corporation controlled by the former external director. This restriction extends for a period of two years with regard to the former external director and his or her spouse or child and for one year with respect to other relatives of the former external director.
If at the time at which an external director is appointed all members of the board of directors who are not controlling shareholders or relatives of controlling shareholders of the company are of the same gender, the external director to be appointed must be of the other gender. A director of one company may not be appointed as an external director of another company if a director of the other company is acting as an external director of the first company at such time.
According to the Israeli Companies Law and regulations promulgated thereunder, a person may be appointed as an external director only if he or she has professional qualifications or if he or she has accounting and financial expertise (each, as defined below); provided that at least one of the external directors must be determined by our board of directors to have accounting and financial expertise. However, if at least one of our other directors (i) meets the independence requirements under the Exchange Act, (ii) meets the standards of the Nasdaq Stock Market listing rules for membership on the audit committee and (iii) has accounting and financial expertise as defined under the Israeli Companies Law, then neither of our external directors is required to possess accounting and financial expertise as long as each possesses the requisite professional qualifications.
A director with accounting and financial expertise is a director who, due to his or her education, experience and skills, possesses an expertise in, and an understanding of, financial and accounting matters and financial statements, such that he or she is able to understand the financial statements of the company and initiate a discussion about the presentation of financial data. A director is deemed to have professional qualifications if he or she has any of (i) an academic degree in economics, business management, accounting, law or public administration, (ii) an academic degree or has completed another form of higher education in the primary field of business of the company or in a field which is relevant to his/her position in the company or (iii) at least five years of experience serving in one of the following capacities, or at least five years of cumulative experience serving in two or more of the following capacities: (a) a senior business management position in a company with a significant volume of business, (b) a senior position in the company’s primary field of business or (c) a senior position in public administration or service. The board of directors is charged with determining whether a director possesses financial and accounting expertise or professional qualifications.
Our board of directors has determined that Sharon Kochan has accounting and financial expertise and possesses professional qualifications as required under the Israeli Companies Law.Law, while Nissim Mashiach possesses professional qualifications.
Leadership Structure of the Board
In accordance with the Israeli Companies Law and our articles of association, our board of directors is required to appoint one of its members to serve as chairman of the board of directors. Our board of directors has appointed StefanStephen T. Wills to serve as executive chairman of the board of directors.
Audit Committee
Israeli Companies Law composition requirements
Under the Israeli Companies Law, we are required to have an audit committee comprised of at least three directors, including all of the external directors, one of whom must serve as chairman of the committee. The audit committee may not include the chairman of the board, a controlling shareholder of the company, a relative of a controlling shareholder, a director employed by or providing services on a regular basis to the company, to a controlling shareholder or to an entity controlled by a controlling shareholder, or a director who derives most of his or her income from a controlling shareholder. In addition, under the Israeli Companies Law, the audit committee of a publicly traded company must consist of a majority of unaffiliated directors. In general, an “unaffiliated director’’ under the Israeli Companies Law is defined as either an external director or as a director who meets the following criteria:
he or she meets the qualifications for being appointed as an external director, except for the requirement (i) that the director be an Israeli resident (which does not apply to companies such as ours whose securities have been offered outside of Israel or are listed for trading outside of Israel) and (ii) for accounting and financial expertise or professional qualifications; and
he or she has not served as a director of the company for a period exceeding nine consecutive years. For this purpose, a break of less than two years in the service shall not be deemed to interrupt the continuation of the service.
Each member of our audit committee (each, as identified in the second paragraph under the sub-heading “Nasdaq listing rules composition requirements” below) is an unaffiliated director under the Israeli Companies Law, thereby fulfilling the foregoing Israeli law requirement for the composition of the audit committee.
Nasdaq listing rules composition requirements
Under the Nasdaq Stock Market listing rules, we are required to maintain an audit committee consisting of at least three independent directors, each of whom is financially literate and one of whom has accounting or related financial management expertise or, ifexpertise. If we choose to follow requirements under Israeli law in lieu of those Nasdaq requirements, we must disclose that fact in this annual report.
Our audit committee consists of Sharon Kochan (chairperson), Vickie R. DriverNissim Mashiach and Nissim Mashiach,David Fox each of whom is an independent director in accordance with Rule 10A‑3(b)(1) under the Exchange Act and satisfies the independent director requirements under the Nasdaq Stock Market listing rules. All members of our audit committee meet the requirements for financial literacy under the applicable listing rules of the Nasdaq Stock Market. Our board of directors has determined that Sharon Kochan is an “audit committee financial expert,” as defined in the SEC regulations.
Audit committee role
Our board of directors has adopted an audit committee charter that sets forth the responsibilities of the audit committee consistent with the rules and regulations of the SEC and the Nasdaq Stock Market listing rules, as well as the requirements for such committee under the Israeli Companies Law, including the following:
oversight of our independent registered public accounting firm and recommending the engagement, compensation or termination of engagement of our independent registered public accounting firm to the board of directors in accordance with Israeli law;
recommending the engagement or termination of the person filling the office of our internal auditor; and
recommending the terms of audit and non‑audit services provided by the independent registered public accounting firm for pre‑approval by our board of directors.
Our audit committee provides assistance to our board of directors in fulfilling its legal and fiduciary obligations in matters involving our accounting, auditing, financial reporting, internal control and legal compliance functions by pre‑approving the services performed by our independent accountants and reviewing their reports regarding our accounting practices and systems of internal control over financial reporting. Our audit committee also oversees the audit efforts of our independent accountants and takes those actions that it deems necessary to satisfy itself that the accountants are independent of management.
Under the Israeli Companies Law, our audit committee is responsible for:
determining whether there are deficiencies in the business management practices of our company, including in consultation with our internal auditor or the independent auditor, and making recommendations to the board of directors to improve such practices;
determining whether to approve certain related party transactions (including transactions in which an office holder has a personal interest and whether such transaction is extraordinary or material under the Israeli Companies Law) (see “—Approval of Related Party Transactions Under Israeli Law”);
establishing the approval process (including, potentially, the approval of the audit committee and conducting a competitive procedure supervised by the audit committee) for certain transactions with a controlling shareholder or in which a controlling shareholder has a personal interest;
where the board of directors approves the working plan of the internal auditor, examining such working plan before its submission to the board of directors and proposing amendments thereto;
examining our internal audit controls and internal auditor’s performance, including whether the internal auditor has sufficient resources and tools to fulfill his responsibilities;
examining the scope of our auditor’s work and compensation and submitting a recommendation with respect thereto to our board of directors or shareholders, depending on which of them is considering the appointment of our auditor; and
establishing procedures for the handling of employees’ complaints as to the management of our business and the protection to be provided to such employees.
Our audit committee may not approve any actions requiring its approval (see “—Approval of Related Party Transactions Under Israeli Law”), unless at the time of the approval a majority of the committee’s members are present, which majority consists of unaffiliated directors including at least one external director.
Compensation Committee and Compensation Policy
Under the Israeli Companies Law, the board of directors of a public company must appoint a compensation committee. The compensation committee generally (subject to certain exceptions that do not apply to our company) must be comprised of at least three directors, including all of the external directors, who must constitute a majority of the members of, and include the chairperson of, the compensation committee. However, subject to certain exceptions, Israeli companies whose securities are traded on stock exchanges such as the Nasdaq Global Market, and who do not have a controlling shareholder, do not have to meet this majority requirement so long as the compensation committee meets other Israeli Companies Law composition requirements, as well as the requirements of the jurisdiction where the company’s securities are traded. Each compensation committee member who is not an external director must be a director whose compensation does not exceed an amount that may be paid to an external director. The compensation committee is subject to the same Israeli Companies Law restrictions as the audit committee as to who may not be a member of the compensation committee. Each member of our compensation committee (each, as identified in the second paragraph under the sub-heading “Nasdaq listing rules compensation committee composition requirements” below) fulfills the foregoing Israeli law requirements related to the composition of the compensation committee.
Israeli Companies Law committee duties
The duties of the compensation committee include the recommendation to the company’s board of directors of a policy regarding the terms of engagement of office holders, which we refer to as a compensation policy. That policy must be adopted by the company’s board of directors, after considering the recommendations of the compensation committee, and must be approved by the company’s shareholders, which approval requires what we refer to as a Special Majority Approval for Compensation. A Special Majority Approval for Compensation requires shareholder approval by a majority vote of the shares present and voting at a meeting of shareholders called for such purpose, provided that either (a) such majority includes at least a majority of the shares held by all shareholders who are not controlling shareholders and do not have a personal interest in such compensation arrangement or (b) the total number of shares of non‑controllingnon-controlling shareholders and shareholders who do not have a personal interest in the compensation arrangement and who vote against the arrangement does not exceed 2% of the company’s aggregate voting rights.
Compensation policy requirements
We have adopted a compensation policy, which serves as the basis for decisions concerning the financial terms of employment or engagement of office holders, including exculpation, insurance, indemnification or any monetary payment or obligation of payment or other benefit in respect of employment or engagement. Under the Israeli Companies Law, the compensation policy must relate to certain factors, including advancement of the company’s objectives, the company’s business plan and its long‑termlong-term strategy, and creation of appropriate incentives for office holders. It must also consider, among other things, the company’s risk management, size and the nature of its operations. The compensation policy must furthermore consider the following additional factors:
the knowledge, skills, expertise and accomplishments of the relevant office holder;
the office holder’s roles and responsibilities and prior compensation agreements with him or her;
the relationship between the terms offered and the average compensation of the other employees of the company, including those employed through manpower companies;
the impact of disparities in salary upon work relationships in the company;
the possibility of reducing variable compensation at the discretion of the board of directors;
the possibility of setting a limit on the exercise value of non-cash variable equity-based compensation; and
as to severance compensation, the period of service of the office holder, the terms of his or her compensation during such service period, the company’s performance during that period of service, the person’s contribution towards the company’s achievement of its goals and the maximization of its profits, and the circumstances under which the person is leaving the company.
The compensation policy must also include the following principles:
the link between variable compensation and long-term performance, which variable compensation shall, other than office holder who report to the CEO, be primarily based on measurable criteria;
the relationship between variable and fixed compensation, and the ceiling for the value of variable compensation;
the conditions under which an office holder would be required to repay compensation paid to him or her if it was later shown that the data upon which such compensation was based was inaccurate and was required to be restated in the company’s financial statements;
the minimum holding or vesting period for variable, equity-based compensation; and
maximum limits for severance compensation.
The compensation committee is responsible for (a) recommending the compensation policy to the company’s board of directors for its approval (and subsequent approval by its shareholders) and (b) duties related to the compensation policy and to the compensation of a company’s office holders as well as functions previously fulfilled by a company’s audit committee with respect to matters related to approval of the terms of engagement of office holders, including:
recommending whether a compensation policy should continue in effect, if the then-current policy has a term of greater than three years (approval of either a new compensation policy or the continuation of an existing compensation policy must in any case occur every three years, other than following a company’s initial public offering, in which case such approval must occur within 5 years of the initial public offering);
recommending to the board of directors periodic updates to the compensation policy and assessing implementation of the compensation policy;
approving compensation terms of executive officers, directors and employees that require approval of the compensation committee;
determining whether the compensation terms of a chief executive officer nominee, which were determined pursuant to the compensation policy, will be exempt from approval of the shareholders because such approval would harm the ability to engage with such nominee; and
determining, subject to the approval of the board and under special circumstances, whether to override a determination of the company’s shareholders regarding certain compensation related issues.
Nasdaq listing rules compensation committee composition requirements
Under Nasdaq corporate governance rules, we are required to maintain a wholly-independent compensation committee consisting of at least two independent directors or, if we choose to follow requirements under Israeli law, we must disclose that fact in this annual report. Each of the members of the compensation committee is required to be independent under the Nasdaq rules relating to compensation committee members and Rule 10C‑1(b)(1) under the Exchange Act, which are different fromthan the general test for independence of board and committee members.Each of the members of our
Our compensation committee consists of Nissim Mashiach (chairperson), Sharon Kochan and Samuel Moed, each of whom is an independent director under the Nasdaq Stock Market listing rules and each of whom satisfies those requirements. the above-described additional requirements for compensation committee members under the Nasdaq rules and Exchange Act.
Compensation committee charter and role
Our board of directors has adopted a compensation committee charter setting forth the responsibilities of the compensation committee, which include:
the responsibilities set forth in the compensation policy;
reviewing and approving the granting of options and other incentive awards to the extent such authority is delegated by our board of directors; and
reviewing, evaluating and making recommendations regarding the compensation and benefits for our non-employee directors.
Internal Auditor
Under the Israeli Companies Law, the board of directors of an Israeli public company must appoint an internal auditor recommended by the audit committee. An internal auditor may not be:
a person (or a relative of a person) who holds 5% or more of the company’s outstanding shares or voting rights;
a person (or a relative of a person) who has the power to appoint a director or the general manager of the company (i.e., the chief executive officer);
an office holder (including a director) of the company (or a relative thereof); or
a member of the company’s independent accounting firm, or anyone on its behalf.
The role of the internal auditor is to examine, among other things, our compliance with applicable law and orderly business procedures.
The audit committee is required to oversee the activities and to assess the performance of the internal auditor as well as to review the internal auditor’s work plan. Our internal auditor is Mr. Yisrael Gewirtz.
Fiduciary Duties of Directors and Executive Officers
The Israeli Companies Law codifies the fiduciary duties that office holders owe to a company. Each person listed in the table under “—Executive Officers and Directors” is an office holder under the Israeli Companies Law.
An office holder’s fiduciary duties consist of a duty of care and a duty of loyalty. The duty of care requires an office holder to act with the level of care with which a reasonable office holder in the same position would have acted under the same circumstances. The duty of loyalty requires that an office holder act in good faith and in the best interests of the company.
The duty of care includes a duty to use reasonable means to obtain:
information on the advisability of a given action brought for his or her approval or performed by virtue of his or her position; and
all other important information pertaining to any such action.
The duty of loyalty includes a duty to:
refrain from any conflict of interest between the performance of his or her duties to the company and his or her other duties or personal affairs;
refrain from any activity that is competitive with the business of the company;
refrain from exploiting any business opportunity of the company to receive a personal gain for himself or herself or others; and
disclose to the company any information or documents relating to the company’s affairs which the office holder received as a result of his or her position as an office holder.
Disclosure of personal interests of an office holder and approval of certain transactions
The Israeli Companies Law requires that an office holder promptly disclose to the board of directors any personal interest that he or she may be aware of and all related material information or documents concerning any existing or proposed transaction with the company. An interested office holder’s disclosure must be made promptly and in any event no later than the first meeting of the board of directors at which the transaction is considered. A personal interest includes an interest of any person in an act or transaction of a company, including a personal interest of such person’s relative or of a corporate body in which such person or a relative of such person is a 5% or greater shareholder, director or general manager or in which he or she has the right to appoint at least one director or the general manager, but excluding a personal interest stemming from one’s ownership of shares in the company.
A personal interest furthermore includes the personal interest of a person for whom the office holder holds a voting proxy or the personal interest of the office holder with respect to his or her vote on behalf of a person for whom he or she holds a proxy even if such shareholder has no personal interest in the matter. An office holder is not, however, obliged to disclose a personal interest if it derives solely from the personal interest of his or her relative in a transaction that is not considered an extraordinary transaction. Under the Israeli Companies Law, an extraordinary transaction is defined as any of the following:
a transaction other than in the ordinary course of business; |
a transaction that is not on market terms; or
a transaction that may have a material impact on a company’s profitability, assets or liabilities.
If it is determined that an office holder has a personal interest in a transaction which is not an extraordinary transaction, approval by the board of directors is required for the transaction, unless the company’s articles of association provide for a different method of approval. Further, so long as an office holder has disclosed his or her personal interest in a transaction, the board of directors may approve an action by the office holder that would otherwise be deemed a breach of his or her duty of loyalty. However, a company may not approve a transaction or action that is not in the best interest of the company or that is not performed by the office holder in good faith. An extraordinary transaction in which an office holder has a personal interest requires approval first by the company’s audit committee and subsequently by the board of directors. The compensation of, or an undertaking to indemnify or insure, an office holder who is not a director requires approval first by the company’s compensation committee, then by the company’s board of directors. If such compensation arrangement or an undertaking to indemnify or insure is inconsistent with the company’s stated compensation policy, or if the office holder is the chief executive officer (apart from a number of specific exceptions), then such arrangement is further subject to a Special Majority Approval for Compensation. Arrangements regarding the compensation, indemnification or insurance of a director require the approval of the compensation committee, board of directors and shareholders by ordinary majority, in that order, and under certain circumstances, a Special Majority Approval for Compensation.
102
Generally, a person who has a personal interest in a matter which is considered at a meeting of the board of directors or the audit committee may not be present at such a meeting or vote on that matter unless the chairman of the relevant committee or board of directors (as applicable) determines that he or she should be present in order to present the transaction that is subject to approval. If a majority of the members of the audit committee or the board of directors (as applicable) has a personal interest in the approval of a transaction, then all directors may participate in discussions of the audit committee or the board of directors (as applicable) on such transaction and the voting on approval thereof, but shareholder approval is also required for such transaction.
Disclosure of personal interests of controlling shareholders and approval of certain transactions
Pursuant to Israeli law, the disclosure requirements regarding personal interests that apply to directors and executive officers also apply to a controlling shareholder of a public company. In the context of a transaction involving a shareholder of the company, a controlling shareholder also includes a shareholder who holds 25% or more of the voting rights in the company if no other shareholder holds more than 50% of the voting rights in the company. For this purpose, the holdings of all shareholders who have a personal interest in the same transaction will be aggregated. The approval of the audit committee or the compensation committee, the board of directors and the shareholders of the company, in that order, is required for (a) extraordinary transactions with a controlling shareholder or in which a controlling shareholder has a personal interest, (b) the engagement with a controlling shareholder or his or her relative, directly or indirectly, including through a company under the control of the controlling shareholder, for the provision of services to the company, (c) the terms of engagement and compensation of a controlling shareholder or his or her relative who is an office holder or (d) the employment of a controlling shareholder or his or her relative by the company, other than as an office holder. In addition, the shareholder approval requires one of the following, which we refer to as a Special Majority:
at least a majority of the shares held by all shareholders who do not have a personal interest in the transaction and who are present and voting at the meeting approves the transaction, excluding abstentions; or
the shares voted against the transaction by shareholders who have no personal interest in the transaction and who are present and voting at the meeting do not exceed 2% of the voting rights in the company.
To the extent that any such transaction with a controlling shareholder is for a period extending beyond three years, approval is required once every three years, unless, with respect to certain transactions, the audit committee determines that the duration of the transaction is reasonable given the circumstances related thereto. Arrangements regarding the compensation, indemnification or insurance of a controlling shareholder in his or her capacity as an office holder require the approval of the compensation committee, board of directors and shareholders by a Special Majority, in that order, and the terms thereof may not be inconsistent with the company’s stated compensation policy.
Pursuant to regulations promulgated under the Israeli Companies Law, certain transactions with a controlling shareholder or his or her relative, or with directors, that would otherwise require approval of a company’s shareholders may be exempt from shareholder approval upon certain determinations of the audit committee and board of directors.
As of MarchFebruary 15, 2018,2021, Clal Biotechnology Industries Ltd. beneficially owned or controlled, directly and indirectly, 34.9%34.6% of our issued and outstanding ordinary shares.shares and (assuming that no other shareholder holds more than 50% of the voting rights in our company) should therefore be deemed a “controlling shareholder” for purposes of the approval of related party transactions under the Israeli Companies Law.
103
Shareholder duties
Pursuant to the Israeli Companies Law, a shareholder has a duty to act in good faith and in a customary manner toward the company and other shareholders and to refrain from abusing his or her power in the company, including, among other things, in voting at a general meeting and at shareholder class meetings with respect to the following matters:
an amendment to the company’s articles of association;
an increase of the company’s authorized share capital;
a merger; or
the approval of related party transactions and acts of office holders that require shareholder approval.
A shareholder also has a general duty to refrain from discriminating against other shareholders. In addition, certain shareholders have a duty of fairness toward the company. These shareholders include any controlling shareholder, any shareholder who knows that he or she has the power to determine the outcome of a shareholder vote and any shareholder who has the power to appoint or to prevent the appointment of an office holder of the company or other power towards the company. The Israeli Companies Law does not define the substance of the duty of fairness, except to state that the remedies generally available upon a breach of contract will also apply in the event of a breach of the duty to act with fairness.
Exculpation, Insurance and Indemnification of Directors and Officers
Under the Israeli Companies Law, a company may not exculpate an office holder from liability for a breach of the duty of loyalty. An Israeli company may exculpate an office holder in advance from liability to the company, in whole or in part, for damages caused to the company as a result of a breach of duty of care but only if a provision authorizing such exculpation is included in its articles of association. Our articles of association include such a provision. A company may not exculpate in advance a director from liability arising out of a prohibited dividend or distribution to shareholders.
Under the Israeli Companies Law, a company may indemnify an office holder in respect of the following liabilities and expenses incurred for acts performed by him or her as an office holder, either pursuant to an undertaking made in advance of an event or following an event, provided its articles of association include a provision authorizing such indemnification:
financial liability imposed on him or her in favor of another person pursuant to a judgment, including a settlement or arbitrator’s award approved by a court. However, if an undertaking to indemnify an office holder with respect to such liability is provided in advance, then such an undertaking must be limited to events which, in the opinion of the board of directors, can be foreseen based on the company’s activities when the undertaking to indemnify is given, and to an amount or according to criteria determined by the board of directors as reasonable under the circumstances, and such undertaking shall detail the abovementioned foreseen events and amount or criteria;
reasonable litigation expenses, including attorneys’ fees, incurred by the office holder (1) as a result of an investigation or proceeding instituted against him or her by an authority authorized to conduct such investigation or proceeding, provided that (i) no indictment was filed against such office holder as a result of such investigation or proceeding, and (ii) no financial liability was imposed upon him or her as a substitute for the criminal proceeding as a result of such investigation or proceeding or, if such financial liability was imposed, it was imposed with respect to an offense that does not require proof of criminal intent; and (2) in connection with a monetary sanction; and
reasonable litigation expenses, including attorneys’ fees, incurred by the office holder or imposed by a court in proceedings instituted against him or her by the company, on its behalf, or by a third party, or in connection with criminal proceedings in which the office holder was acquitted, or as a result of a conviction for an offense that does not require proof of criminal intent.
Under the Israeli Companies Law, a company may insure an office holder against the following liabilities incurred for acts performed by him or her as an office holder, if and to the extent provided in the company’s articles of association:
a breach of the duty of loyalty to the company, provided that the office holder acted in good faith and had a reasonable basis to believe that the act would not harm the company;
a breach of duty of care to the company or to a third party, to the extent such a breach arises out of the negligent conduct of the office holder; and
a financial liability imposed on the office holder in favor of a third party.
Under the Israeli Companies Law, a company may not indemnify, exculpate or insure an office holder against any of the following:
a breach of the duty of loyalty, except for indemnification and insurance for a breach of the duty of loyalty to the company to the extent that the office holder acted in good faith and had a reasonable basis to believe that the act would not harm the company;
a breach of duty of care committed intentionally or recklessly, excluding a breach arising out of the negligent conduct of the office holder;
an act or omission committed with intent to derive illegal personal benefit; or
a fine or forfeit levied against the office holder.
Under the Israeli Companies Law, exculpation, indemnification and insurance of office holders in a public company must be approved by the compensation committee and the board of directors and, with respect to certain office holders or under certain circumstances, also by the shareholders. See “—Approval of Related Party Transactions Under Israeli Law.”
Our articles of association permit us to exculpate, indemnify and insure our office holders to the fullest extent permitted or to be permitted by the Israeli Companies Law. We have obtained directors’ and officers’ liability insurance for the benefit of our office holders and intend to continue to maintain such coverage and pay all premiums thereunder to the fullest extent permitted by the Israeli Companies Law. In addition, we have entered into agreements with each of our directors and executive officers exculpating them from liability to us for damages caused to us as a result of a breach of duty of care and undertaking to indemnify them, in each case, to the fullest extent permitted by our articles of association and Israeli Law.
The maximum indemnification amount set forth in suchthose agreements is limited to an amount equal to the greater of (x) 25% of our total shareholders’ equity based on our most recently financial statements of the time of the actual payment of the indemnification or (y) $25 million. The maximum amount set forth in suchthose agreements is in addition to amounts actually paid, if any, under insurance policies and/or by a third‑partythird-party pursuant to an indemnification arrangement.
| D. | Employees |
As of December 31, 2017,2020, we had 7675 employees, 6065 of whom were based in Israel and 16 (including 3 full time service providers)10 based throughout Europe and employed by our German subsidiary. The total number of our full‑time employees and the distribution of our employees according to main areas of activity is as of the end of each of the last three years, are set forthfollows: 8 employees in the following table:
| As of December 31, | ||||||||||||
| 2015 | 2016 | 2017 | ||||||||||
| Department | ||||||||||||
| Administrative | 6 | 7 | 8 | |||||||||
| Research and development | 16 | 22 | 26 | |||||||||
| Manufacturing | 20 | 23 | 26 | |||||||||
| Sales and marketing | 25 | 20 | 16 | |||||||||
| Total | 67 | 72 | 76 | |||||||||
Israeli labor laws govern the length of the workday and workweek, minimum wages for employees, procedures for hiring and dismissing employees, determination of severance pay, annual leave, sick days, advance notice of termination, payments to the National Insurance Institute and other conditions of employment, and include equal opportunity and anti‑discriminationanti-discrimination laws. While none of our employees is party to any collective bargaining agreements, certain provisions of the collective bargaining agreements between the Histadrut (General Federation of Labor in Israel) and the Coordination Bureau of Economic Organizations (including the Industrialists’ Associations) are applicable to our employees in Israel by order of the Israeli Ministry of the Economy. These provisions primarily concern pension fund benefits for all employees, insurance for work‑relatedwork-related accidents, recuperation pay and travel expenses. We generally provide our employees with benefits and working conditions beyond the required minimums.
105
We have never experienced any employment‑relatedemployment-related work stoppages and believe our relationships with our employees are good.
| E. | Share Ownership |
For information regarding the share ownership of our directors and executive officers, see “ITEM 6.B. Compensation—2014 Equity Incentive Plan” and “ITEM 7.A. Major Shareholders.”
| A. | Major Shareholders |
The following table sets forth information with respect to the beneficial ownership of our shares as of March 15, 2018February 16, 2021 by:
each person or entity known by us to own beneficially more than 5% of our outstanding shares;
each of our directors and executive officers individually; and
all of our executive officers and directors as a group.
The beneficial ownership of ordinary shares is determined in accordance with the rules of the SEC and generally includes any ordinary shares over which a person exercises sole or shared voting or investment power. The percentage of shares beneficially owned is based on 27,047,737 27,236,938 ordinary shares issued and outstanding as of March 15, 2018. We have deemed our ordinaryFebruary 16, 2021. Ordinary shares subject tothat are issuable under stock options or RSUs that are currently exercisable or exercisable within 60 days of March 15, 2018February 16, 2021 are deemed to be outstanding and to be beneficially owned by the person holding the stock option for the purpose of computing the number of shares and percentage ownership of that person. We didThose shares are not deem these sharesdeemed outstanding, however, for the purpose of computing the percentage ownership of any other person.
All of our shareholders, including the shareholders listed below, have the same voting rights attached to their ordinary shares. See “ITEM 10.B. Articles of Association.” None of our principal shareholders nor our directors andor executive officers will havepossesses different or special voting rights with respect to their ordinary shares. Unless otherwise noted below, each shareholder’s address is c/o MediWound Ltd., 42 Hayarkon Street, Yavne 8122745, Israel.
A description of any material relationship that our principal shareholders have had with us or any of our predecessors or affiliates within the past three years is included under “ITEM 7.B. Related Party Transactions.”
| Name of Beneficial Owner | Number of Shares Beneficially Held | Percentage of Class | ||||||
| Directors and Executive Officers | ||||||||
| Stefan T. Wills | * | * | ||||||
| Ofer Gonen | * | * | ||||||
| Assaf Segal | * | * | ||||||
| Vickie R. Driver | * | * | ||||||
| Nissim Mashiach | * | * | ||||||
| Sharon Kochan | * | * | ||||||
Gal Cohen(1) | 440,932 | 1.6 | % | |||||
| Sharon Malka | * | * | ||||||
Lior Rosenberg(2) | 1,939,072 | 7.1 | % | |||||
| Carsten Henke | * | * | ||||||
| Ety Klinger | * | * | ||||||
| Yaron Meyer | * | * | ||||||
All executive officers and directors as a group (12 persons)(3) | 2,877,316 | 10.6 | % | |||||
| Principal Shareholders | ||||||||
Clal Biotechnology Industries Ltd.(4) | 9,429,555 | 34.9 | % | |||||
Wellington Management Group LLP(5) | 3,642,979 | 13.5 | % | |||||
Migdal Insurance & Financial Holdings Ltd.(6) | 2,209,368 | 8.2 | % | |||||
Yelin Lapidot(7) | 1,432,381 | 5.3 | % | |||||
106
| Name of Beneficial Owner | Number of Shares Beneficially Held | Percentage of Class | ||||||
| Directors and Executive Officers | ||||||||
| Stephen T. Wills | * | * | ||||||
| Ofer Gonen | * | * | ||||||
| Assaf Segal | * | * | ||||||
| Vickie R. Driver | * | * | ||||||
| Nissim Mashiach | * | * | ||||||
| Sharon Kochan | * | * | ||||||
| David Fox | * | * | ||||||
| Samuel Moed | * | * | ||||||
| Sharon Malka | 378,772 | 1.4 | % | |||||
| Boaz Gur-Lavie | * | * | ||||||
Lior Rosenberg(1) | 1,964,905 | 7.2 | % | |||||
| Ety Klinger | * | * | ||||||
| Yaron Meyer | * | * | ||||||
All executive officers and directors as a group (13 persons)( 2) | 2,679,800 | 9.3 | % | |||||
| Principal Shareholders (who are not Directors or Executive Officers) | ||||||||
Clal Biotechnology Industries Ltd.(3) | 9,429,555 | 34.6 | % | |||||
Migdal Insurance & Financial Holdings Ltd.(4) | 2,126,058 | 7.8 | % | |||||
_____________________
| * | Less than 1%. |
| (1) |
| As reported on a Schedule 13G/A filed on February |
Shares beneficially owned consist of |
As reported on a Schedule 13G/A filed on February 12, 2019, shares beneficially owned consist of: (i) |
As reported on a Schedule |
Changes in Ownership of Major Shareholders
Registered Holders
As of MarchFebruary 15, 2018,2021, we had one holder of record of our ordinary shares in the United States, which is Cede & Co., the nominee of The Depository Trust Company. This shareholder held in the aggregate 57.3%57.4% of the 27,047,73727,236,938 ordinary shares issued and outstanding as of December 31, 2017.February 15, 2021. The number of record holders in the United States is not representative of the number of beneficial holders nor is it representative of where such beneficial holders are resident since many of these ordinary shares were held by brokers or other nominees.
| B. | Related Party Transactions |
Information Rights Agreement
We have entered into an information rights agreement with CBI which provides CBI with certain information rights relating to our financial information of the company and certain other information necessary for CBI to meet Israeli Securities Law requirements. CBI is not required to reimburse us for expenses we incur in providing such information.
Registration Rights Agreement
We have entered into a registration rights agreement with certain of our shareholders (the “Registration Rights Agreement”). The Registration Rights Agreement replaces the shareholders’ right agreement, dated August 2, 2007, as amended on December 30, 2010, among us and certain of our shareholders. The Registration Rights Agreement provides that certain holders of our ordinary shares have the right to demand that we file a registration statement or request that their ordinary shares be covered by a registration statement that we are otherwise filing. On March 7, 2016, the SEC declared effective our shelf registration statement on Form F‑3,F-3, which registered the resale of the 11,640,827 shares subject to registration rights. Following the expiration of that shelf registration statement upon the third anniversary of its effectiveness, we filed in March 2019, and the SEC declared effective, on April 22, 2019, a new shelf registration statement on Form F-3 that registered the resale of the remaining 11,240,827 shares subject to the registration rights. The registration rights will terminate on March 24, 2021. The registration rights are described in more detail under “ITEM 10.B. Articles of Association.”
Founders’ and Shareholders’ Agreement
In January 2001, we entered into a founders’ and shareholders’ agreement (the “Founders Agreement”), with CBI, Prof. Lior Rosenberg, our Chief Medical Technology Officer, and LR, a private company which is wholly‑ownedwholly-owned by Prof. Rosenberg. The Founders Agreement was amended in 2006. Pursuant to the Founders Agreement, in exchange for the issuance of ordinary shares and certain rights thereunder and the payment of certain fixed amounts, Prof. Rosenberg granted to us a perpetual, exclusive, non‑revocable, royalty‑free, sub‑licensable,non-revocable, royalty-free, sub-licensable, worldwide license for intellectual property relating to debridement using products based on our proteolytic enzyme technology. As of the date hereof, all of the payments under the Founders Agreement were paid by us to Prof. Rosenberg in accordance with the Founders Agreement. The Founders Agreement also provided for anti‑dilution, pre‑emptiveanti-dilution, pre-emptive rights, a right of first refusal on the sale of our ordinary shares and bring‑alongbring-along rights, all of which were subsequently terminated.
In January 2018, we entered into a sub‑leasesub-lease agreement (the “Sub‑Lease“Sub-Lease Agreement”), with Clal Life Sciences, L.P. (“CLS”), a subsidiary of CBI, our indirect parent company.controlling shareholder, which was amended in February 2019. Pursuant to the Sub‑LeaseSub-Lease Agreement, we currently sublease approximately 20,00032,300 square feet of laboratory, office and clean room space from CLS and our yearly rent is $245,000.$0.4 million. The Sub‑LeaseSub-Lease Agreement is scheduled to expire on October 30, 2022. The sub-lease agreement includes an option to extend the lease period for an additional 3 years at our sole discretion.
108
Agreements with Directors and Officers
Employment Agreements
We have entered into employment agreements with each of our executive officers, which include standard provisions for a company in our industry regarding non‑competition/non-competition/solicitation, confidentiality of information and assignment of inventions. However, the enforceability of the non‑competitionnon-competition provisions may be limited under applicable law. Our executive officers will not receive benefits upon the termination of their respective employment with us, other than payment of salary and benefits (and limited accrual of vacation days) during the required notice period for termination of their employment, which varies for each individual.
Options.
Since our inception, we have granted options to purchase our ordinary shares to our officersdirectors and certain of our directors.executive officers. Such option agreements may contain acceleration provisions upon certain merger, acquisition or change of control transactions. We describe our option plans under “ITEM 6.B. Compensation—2003 Israeli Share Option Plan” and “ITEM“ITEM 6.B. Compensation—2014 Equity Incentive Plan.” If an executive officer is involuntarily terminated without cause or the executive officer voluntarily terminates his employment for good reason (as defined in the employment agreement), all options will immediately vest. Upon the consummation of a merger or acquisition transaction, an executive officer’s options will be assumed or substituted by the surviving company, if applicable, or, in the compensation committee’s sole discretion, will vest immediately or be amended, modified or terminated. Our compensation committee approved accelerated vesting in the case of a merger or an acquisition transaction for certain of our directors and executive officers with respect to the option grantsagreements dated December 23, 2015.2015, June 22, 2017, January 16, 2018, December 31, 2018, May 2, 2019 and April 23, 2020.
RSUs
Under the 2014 Plan, we have granted RSUs to our executive officers and our chairman of the board. The RSU agreements generally provide for vesting of RSUs over a four-year period of continuous employment or service, with 25% of the RSUs vesting at the lapse of one year following the vesting commencement date, and the remaining 75% of the RSUs vesting in three equal installments, at the lapse of each of the following three years. Absent a specific acceleration provision, if a grantee’s service is terminated for any reason, all RSUs that have not vested will immediately terminate. RSUs that have vested but have not been settled yet for underlying ordinary shares may generally be settled within the three months following the termination of the service of the grantee, other than in the case of termination due to death or disability (in which case the grantee or his/her estate will have one year to settle the vested RSUs for underlying ordinary shares) or termination for cause (in which case all unsettled RSUs will immediately terminate). Upon the consummation of a merger or acquisition transaction, an executive officer’s or the chairman’s RSUs will be assumed or substituted by the surviving company, if applicable, or, in the compensation committee’s sole discretion, will vest immediately or be amended, modified or terminated. The RSUs that we grant may contain acceleration provisions upon certain merger, acquisition or change of control transactions, if approved by our board of directors with respect to a specific grant. The RSUs are generally subject to the further terms of the 2014 Plan, which we describe under “ITEM 6.B. Compensation—2014 Equity Incentive Plan.”
Exculpation, indemnification and insurance.
Our articles of association permit us to exculpate, indemnify and insure each of our directors and office holders to the fullest extent permitted by the Israeli Companies Law. Additionally, we have entered into indemnification agreements with each of our directors and executive officers, undertaking to indemnify them to the fullest extent permitted by Israeli law, including with respect to liabilities resulting from a public offering of our shares, to the extent that these liabilities are not covered by insurance. We have also obtained Directors and Officers insurance for each of our executive officers and directors. See “ITEM 6.C. Board Practices—Exculpation, Insurance and Indemnification of Directors and Officers.”
| C. | Interests of Experts and Counsel |
Not applicable.
| Item 8. | FINANCIAL INFORMATION |
| A. | Consolidated Statements and Other Financial Information |
Consolidated Financial Statements
Legal and Arbitration Proceedings
From time to time, we may be party to litigation or subject to claims incident to the ordinary course of business.
In March 2019, we entered into settlement agreements and mutual general releases with respect to our previously-reported litigation arising under a statementseries of claim wasagreements among PolyHeal, Teva and our company that we entered into in 2010 (collectively, the “2010 PolyHeal Agreements”). For a description of the history of the proceedings related to the 2010 PolyHeal Agreements and a dispute related to a collaboration agreement between Teva and our company that we entered into in 2007 (the "2007 Teva Agreement,") please see “ITEM 8. Financial Information— A. Consolidated Statements and Other Financial Information— Legal Proceedings” in our annual report on Form 20-F for the year ended December 31, 2018, filed againstwith the company bySEC on March 25, 2019 (the “2018 Form 20-F”).
As reported in the 2018 Form 20-F, on March 24, 2019, we entered into an initial settlement with the plaintiffs— certain shareholders of PolyHeal. ThePolyHeal — which settlement was subsequently approved by the Israeli Supreme Court, which settled any and all debts, obligations or liabilities that we and the plaintiffs allege thathad to one another in connection with the company is obligated to pay them a total amount of approximately $1.5 million in exchange for their respective portion of PolyHeal’s shares, following the milestone occurrencetransactions under the 2010 PolyHeal Agreement. This claim arises outAgreements. Pursuant to the terms of this settlement agreement, the plaintiffs were to repay a disputenon-material portion of the amount that was ruled in their favor under a November 2017 ruling, and the Israeli Supreme Court was to approve and accept the appeal that was filed by us in December, 2017, cancel the 2017 ruling that was issued by the Israeli District Court against us, and reject the PolyHeal shareholders’ cross-appeal.
Also as reported in the 2018 Form 20-F, on March 24, 2019, we entered into a settlement agreement and mutual general release with Teva, underwhich was contingent upon the 2010 PolyHeal Agreement. On December 14, 2014,Supreme Court’s approval of the company filed a petition for a right to defend (the “Petition”)settlement with the Tel Aviv‑Jaffa District Court, inPolyHeal plaintiffs (which approval was received), which the company: (i) rejected the arguments raised against it in the statementsettled any and all debts, obligations or liabilities that each party or any of claim; (ii) emphasized that its obligation under the 2010 PolyHeal Agreement to purchase the 7.5% of PolyHeal’s shares is subjectcontrolled affiliates had to the consumptionother party or any of its controlled affiliates in connection with certain transactions and collaboration agreements entered into between us and Teva from 2007 to 2012, which had terminated effective as of December 31, 2012 and September 2, 2013, as applicable, and which had related to NexoBrid and PolyHeal, including a milestone payment to PolyHeal and certain additional payments, which were primarily intended to serve as reimbursement for development and manufacturing costs, which we had believed were to be borne by Teva through the effective date of termination of those collaboration agreements in December 2012.
Pursuant to the terms of the deferred closing, as definedTeva settlement agreement, Teva agreed to pay us $4.0 million in cash, and to reduce the 2010 PolyHeal Agreement, including the receiptcontingent consideration that is payable to Teva pursuant to our repurchase of the fundsour shares from Teva on a “back to back” basis; and (iii) stated that since no such payment has been made by Teva, the company is not subject to any obligation to purchase PolyHeal shares and/or make any payments to PolyHeal’s shareholders.
On December 13, 2020, we signed an amendment to the basisTeva settlement agreement that replaces the revenue-based payment mechanism with a fixed payment schedule. The aggregate amount paid to Teva of their actual share holdingsup to $10.2 million and the other terms, including with respect to our indemnification obligations, in PolyHeal as of January 15, 2013, for approximately $1.3 million plus applicable interest (totaled in $1.5 million asthe Teva settlement agreement are unchanged. Out of the ruling date), within 15 days from the date$3 million already due to Teva we paid $1 million of the Court’s ruling. Onon December 27, 2017, we filed an appeal to the Supreme Court over the said ruling, alleging, among other things, that the agreement according to which the ruling was granted was misinterpreted by the District Court. We further alleged that both the wording of the agreement2020 and the conduct of the parties thereunder prove that our obligation to purchase PolyHeal’s shares was subject to the prior receipt of funds, which were never received, from Teva. On January 30, 2018, certain PolyHeal shareholders filed a cross appeal, alleging that they are entitled to receive from us a full repayment of their counsel’s fees in a sum equal to 12.5% of the consideration tobalance will be paid for their shares. The Appeal and Cross Appeal are currently scheduled to be heardin twelve quarterly equal installments during the period commencing on January 7, 2019.
the payment of such aggregate amount.
In September 2019, we entered into a series of additional settlement agreements and mutual general releases with certain shareholders of PolyHeal, including Clal Biotechnology Industries Ltd. (CBI), our controlling shareholder, which together constitute the majority of PolyHeal's shareholders. Those additional settlement agreements settle any and all debts, obligations or liabilities that each party or any of its affiliates had or has to the other party or any of its affiliates, in connection with or arising out of the series of 2010 PolyHeal Agreements. Pursuant to these settlement agreements, we paid an aggregate amount of approximately $2.8 million and received 14,473 shares of PolyHeal.
Dividend Policy
We have never declared or paid cash dividends to our shareholders and we do not intend to pay cash dividends in the foreseeable future. We intend to reinvest any earnings in developing and expanding our business. Any future determination relating to our dividend policy will be at the discretion of our board of directors and will depend on a number of factors, including future earnings, our financial condition, operating results, contractual restrictions, capital requirements, business prospects, our strategic goals and plans to expand our business, applicable law and other factors that our board of directors may deem relevant.
| B. | Significant Changes |
No significant changes have occurred since December 31, 2017,2020, except as otherwise disclosed in this annual report.
| Item 9. | THE OFFER AND LISTING |
| A. | Listing Details |
Our ordinary shares have been traded on Nasdaq under the symbol “MDWD” since March 20, 2014. Prior to that date, there was no public trading market for our ordinary shares. Our IPO was priced at $14.00 per share on March 19, 2014. The following table sets forth for the periods indicated the high and low sales prices per ordinary share as reported on Nasdaq:
| Low | High | |||||||
| Annual: | ||||||||
| 2017 | $ | 4.15 | $ | 8.25 | ||||
| 2016 | $ | 4.25 | $ | 9.29 | ||||
| 2015 | $ | 5.00 | $ | 10.47 | ||||
| 2014 (beginning March 20, 2014) | $ | 4.60 | $ | 19.31 | ||||
| Quarterly: | ||||||||
| First Quarter 2018 (through March 15, 2018) | $ | 3.95 | $ | 4.45 | ||||
| Fourth Quarter 2017 | $ | 4.15 | $ | 5.37 | ||||
| Third Quarter 2017 | $ | 4.75 | $ | 7.50 | ||||
| Second Quarter 2017 | $ | 5.70 | $ | 8.25 | ||||
| First Quarter 2017 | $ | 4.55 | $ | 6.80 | ||||
| Fourth Quarter 2016 | $ | 4.25 | $ | 7.91 | ||||
| Third Quarter 2016 | $ | 6.32 | $ | 8.58 | ||||
| Second Quarter 2016 | $ | 7.34 | $ | 8.90 | ||||
| First Quarter 2016 | $ | 5.66 | $ | 9.29 | ||||
| Most Recent Six Months: | ||||||||
| February 2017 | $ | 4.55 | $ | 3.56 | ||||
| January 2017 | $ | 4.83 | $ | 4.30 | ||||
| December 2017 | $ | 4.40 | $ | 4.95 | ||||
| November 2017 | $ | 4.15 | $ | 5.10 | ||||
| October 2017 | $ | 4.80 | $ | 5.37 | ||||
| September 2017 | $ | 4.75 | $ | 6.70 | ||||
| B. | Plan of Distribution |
Not applicable.
| C. | Markets |
See “—Listing Details” above.
| D. | Selling Shareholders |
Not applicable.applicable.
| E. | Dilution |
Not applicable.applicable.
| F. | Expenses of the Issue |
Not applicable.applicable.
| Item 10. | ADDITIONAL INFORMATION |
| A. | Share Capital |
Not applicable.applicable.
| B. | Articles of Association |
111
Election of directors
Our ordinary shares do not have cumulative voting rights for the election of directors. As a result, the holders of a majority of the voting power represented at a meeting of shareholders have the power to elect alleach of our directors, subject to the special approval requirements for external directors described under “ITEM 6.C. Board Practices—External Directors.” Under our articles of association, our board of directors must consist of at least five and not more than nine directors, including at least two external directors required to be appointed under the Israeli Companies Law. At any time the minimum number of directors (other than the external directors) shall not fall below three. Pursuant to our articles of association, each of our directors, other than the external directors, for whom special election requirements apply under the Israeli Companies Law, will be appointed by a simple majority vote of holders of our voting shares, participating and voting at an annual general meeting of our shareholders. Each director will serve until his or her successor is duly elected and qualified or until his or her earlier death, resignation or removal by a vote of the majority voting power of our shareholders at a general meeting of our shareholders or until his or her office expires by operation of law, in accordance with the Israeli Companies Law. In addition, ourOur articles of association allow our board of directors to appoint directors to fill vacancies on the board of directors to serve until the next annual general meeting of shareholders. External directors are elected for an initial term of three years, may be elected for additional terms of three years each under certain circumstances, and may be removed from office pursuant to the terms of the Israeli Companies Law. Under regulations recently promulgated under the Israeli Companies Law, Israeli public companies whose shares are traded on certain U.S. stock exchanges, such as the Nasdaq Global Market and that lack a controlling shareholder are exempt from the requirement to appoint external directors. See “ITEM 6.C. Board Practices—Board of Directors and External Directors.”
For a description of the registration rights present inthat are subject to our Registration Rights Agreement, see “ITEM 7.B. Related Party Transactions—Registration Rights Agreement.”
For a description of our contract with the U.S. Biomedical Advanced Research and Development Authority, see “ITEM 4.B. Business Overview—Our Focus—Burn Care—BARDA Contract.”
For a description of our license agreement with Mark Klein, see “ITEM 4.B. Business Overview—Klein License Agreement.”
We have entered into an agreement with Challenge Bioproducts Corporation Ltd. (“CBC”), a corporation organized and existing under the laws of the Republic of China, dated January 11, 2001, as amended on February 28, 2010, pursuant to which CBC uses proprietary methods to manufacture bromelain SP and supplies us with this intermediate drug substance in bulk quantities. According to the terms of the agreement, CBC shall not, and shall not permit related companies or a third party to, manufacture, use, supply or sell the raw materials for the use or production of a product directly or indirectly competing with any of our products. Our supply agreement with CBC has no fixed expiration date and can be voluntarily terminated by us, with at least six months’ advance written notice, or by CBC, with at least 24 months’ advance written notice.
| D. | Exchange Controls |
In 1998, Israeli currency control regulations were liberalized significantly, so that Israeli residents generally may freely deal in foreign currency and foreign assets, and non‑residentsnon-residents may freely deal in Israeli currency and Israeli assets. There are currently no Israeli currency control restrictions on remittances of dividends on the ordinary shares or the proceeds from the sale of the shares provided that all taxes were paid or withheld; however, legislation remains in effect pursuant to which currency controls can be imposed by administrative action at any time.
112
| E. | Taxation |
The following description is not intended to constitute a complete analysis of all tax consequences relating to the acquisition, ownership and disposition of our ordinary shares. You should consult your own tax advisor concerning the tax consequences of your particular situation, as well as any tax consequences that may arise under the laws of any state, local, foreign or other taxing jurisdiction.
Israeli Tax Considerations and Government Programs
Capital gains taxes applicable to non‑Israeli resident shareholders
A non‑Israeli resident (whether an individual or a corporation) who derives capital gains from the sale of shares in an Israeli resident company that were purchased after the company was listed for trading on the Tel Aviv Stock Exchange or on a recognized stock exchange outside of Israel, will generally be exempt from Israeli capital gain tax so long as the shares were not held through a permanent establishment that the non‑resident maintains in Israel (and with respect to shares listed on a recognized stock exchange outside of Israel, so long as neither the shareholder nor the particular capital gain is otherwise subject to the Israeli Income Tax Law (Inflationary Adjustments) 5745‑1985. These provisions dealing with capital gain are not applicable to a person whose gains from selling or otherwise disposing of the shares are deemed to be business income. However, non‑Israeli corporations will not be entitled to the foregoing exemption if Israeli residents (i) have a controlling interest of more than 25% or more in such non‑Israeli corporation or (ii) are the beneficiaries of, or are entitled to, 25% or more of the revenues or profits of such non‑Israeli corporation, whether directly or indirectly.
Additionally, a sale of shares by a non‑Israeli resident may also be exempt from Israeli capital gains tax under the provisions of an applicable tax treaty. For example, under the Convention Between the Government of the United States of America and the Government of the State of Israel with respect to Taxes on Income, as amended (the “United States‑Israel Tax Treaty”), the sale, exchange or other disposition of shares by a shareholder who is a United States resident (for purposes of the United States‑Israel Tax Treaty) holding the shares as a capital asset and is entitled to claim the benefits afforded to such a resident by the United States‑Israel Tax Treaty (a “Treaty U.S. Resident”) is generally exempt from Israeli capital gains tax unless: (i) the capital gain arising from such sale, exchange or disposition is attributed to real estate located in Israel; (ii) the capital gain arising from such sale, exchange or disposition is attributed to royalties; (iii) the capital gain arising from the such sale, exchange or disposition can be attributable to a permanent establishment of the shareholder maintained in Israel, under certain terms; (iv) such Treaty U.S. Resident holds, directly or indirectly, shares representing 10% or more of the voting capital of a company during any part of the 12‑month period preceding such sale, exchange or disposition, subject to certain conditions; or (v) such Treaty U.S. Resident is an individual and was present in Israel for a period or periods aggregating to 183 days or more during the relevant taxable year. In each case, the sale, exchange or disposition of our ordinary shares would be subject to such Israeli tax, to the extent applicable; However, under the United States‑Israel Tax Treaty, such Treaty U.S. Resident would be permitted to claim a credit for such taxes against the U.S. federal income tax imposed with respect to such sale, exchange or disposition, subject to the limitations in U.S. laws applicable to foreign tax credits.
In some instances where our shareholders may be liable for Israeli tax on the sale of their ordinary shares, the payment of the consideration may be subject to the withholding of Israeli tax at source. Shareholders may be required to demonstrate that they are exempt from tax on their capital gains in order to avoid withholding at source at the time of sale. Specifically, in transactions involving a sale of all of the shares of an Israeli resident company, in the form of a merger or otherwise, the Israel Tax Authority may require from shareholders who are not liable for Israeli tax to sign declarations in forms specified by this authority or obtain a specific exemption from the Israel Tax Authority to confirm their status as non‑Israeli resident, and, in the absence of such declarations or exemptions, may require the purchaser of the shares to withhold taxes at source.
Taxation of non‑Israeli shareholders on receipt of dividends
Non‑Israeli residents (whether individuals or corporations) are generally subject to Israeli income tax on the receipt of dividends paid on our ordinary shares at the rate of 25% unless a relief is provided in a treaty between Israel and a shareholder's country of residence (provided that a certificate from the Israeli Tax Authority allowing for a reduced withholding tax rate is obtained in advance). With respect to a person who is a “substantial shareholder” at the time of receiving the dividend or on any time during the preceding 12 months, the applicable tax rate is 30%. A “substantial shareholder” is generally a person who alone or together with such person’s relative or another person who collaborates with such person on a permanent basis, holds, directly or indirectly, at least 10% of any of the “means of control” of the corporation. “Means of control” generally include the right to vote, receive profits, nominate a director or an executive officer, receive assets upon liquidation, or order someone who holds any of the aforesaid rights how to act, regardless of the source of such right. Such dividends are generally subject to Israeli withholding tax at a rate of 25% so long as the shares are registered with a nominee company (whether or not the recipient is a substantial shareholder), unless relief is provided in a treaty between Israel and the shareholder’s country of residence and provided that a certificate from the Israel Tax Authority allowing for a reduced withholding tax rate is obtained in advance. However, a distribution of dividends to non‑Israeli residents is subject to withholding tax at source at a rate of 15% if the dividend is distributed from income attributed to an Approved Enterprise or a Beneficiary Enterprise and 20% if the dividend is distributed from income attributed to a Preferred Enterprise, unless a reduced tax rate is provided under an applicable tax treaty, and provided that a certificate from the Israel Tax Authority allowing for a reduced withholding tax rate is obtained in advance. For example, under the United States‑Israel Tax Treaty, the maximum rate of tax withheld at source in Israel on dividends paid to a holder of our ordinary shares who is a Treaty U.S. Resident is 25%. However, generally, the maximum rate of withholding tax on dividends, not generated by an Approved Enterprise or Beneficiary Enterprise, that are paid to a U.S. corporation holding 10% or more of the outstanding voting capital throughout the tax year in which the dividend is distributed as well as during the previous tax year, is 12.5%, provided that not more than 25% of the gross income for such preceding year consists of certain types of dividends and interest. Notwithstanding the foregoing, dividends distributed from income attributed to an Approved Enterprise or Beneficiary Enterprise are not entitled to such reduction under the tax treaty but are subject to a withholding tax rate of 15% for such a U.S. corporation, provided that the condition related to our gross income for the previous year (as set forth in the previous sentence) is met. If the dividend is attributable partly to income derived from an Approved Enterprise, Beneficiary Enterprise or Preferred Enterprise, and partly to other sources of income, the withholding rate will be a blended rate reflecting the relative portions of the two types of income. We cannot assure you that we will designate the profits that we may distribute in a way that will reduce shareholders’ tax liability.
113
A non‑Israeli resident who receives dividends from which tax was withheld, is generally exempt from the obligation to file tax returns in Israel with respect to such income, provided that (i) such income was not derived from a business conducted in Israel by the taxpayer, and (ii) the taxpayer has no other taxable sources of income in Israel with respect to which a tax return is required to be filed.filed and (iii) the tax payer is not obligated to pay the excess tax (as further explained below).
Excess Tax
Individuals who are subject to tax in Israel are also subject to an additional tax at a rate of 3% on annual income exceeding NIS 640,000 for 2017,a certain level, which amount is linked to the annual change in the Israeli consumer price index, including but not limited to, dividends, interest and capital gain. In 2018,2020, the additional tax will be at a rate of 3% on annual income exceeding NIS 641,880.651,600.
United States Federal Income Taxation
The following is a description of the material U.S. federal income tax consequences of the ownership and disposition of our ordinary shares by a U.S. Holder that holds the ordinary shares as capital assets. This description does not address tax considerations applicable to holders that may be subject to special tax rules, including, without limitation:
banks, financial institutions or insurance companies;
real estate investment trusts, regulated investment companies or grantor trusts;
dealers or traders in securities, commodities or currencies;
tax‑exempt entities or organizations, including an “individual retirement account” or “Roth IRA” as defined in Section 408 or 408A of the Code, respectively;
certain former citizens or long‑term residents of the United States;
persons that received our shares as compensation for the performance of services;
persons that holds our shares as part of a “hedging,” “integrated” or “conversion” transaction or as a position in a “straddle” for U.S. federal income tax purposes;
partnerships (including entities classified as partnerships for U.S. federal income tax purposes) or other pass‑through entities, or holders that will hold our shares through such an entity;
S corporations;
holders that acquired ordinary shares as a result of holding or owning our preferred shares;
U.S. Holders (as defined below) whose “functional currency” is not the U.S. dollar;
persons that are residents of ordinarily resident in or have a permanent establishment in a jurisdiction outside the United States; or
holders that own directly, indirectly or through attribution 10.0% or more of the voting power or value of our shares.
Moreover, this description does not address the U.S. federal estate, gift or alternative minimum tax tax consequences, Medicare consequences, or any state, local or foreign tax consequences, of the ownership and disposition of our ordinary shares.
This summary is based on the Internal Revenue Code of 1986, as amended (the “Code”), administrative pronouncements, judicial decisions and final, temporary and proposed Treasury regulations, all as currently in effect and available. These authorities are subject to change or differing interpretation, possibly with retroactive effect. U.S. Holders should consult their own tax advisers concerning the U.S. federal, state, local and foreign tax consequences of owning and disposing of our ordinary shares in their particular circumstances.
For purposes of this summary, a “U.S. Holder” is a beneficial owner of our ordinary shares who is, for U.S. federal income tax purposes:
a citizen or individual resident of the United States;
a corporation, or other entity taxable as a corporation for U.S. federal income tax purposes, created or organized in or under the laws of the United States, any state thereof, or the District of Columbia;
an estate, the income of which is subject to U.S. federal income taxation regardless of its source; or
a trust that (1) is subject to the primary supervision of a U.S. Court and one or more U.S. persons that have the authority to control all substantial decisions of the trust or (2) has a valid election in effect under applicable Treasury regulations to be treated as a U.S. person.
If a partnership (or other entity treated as a partnership for U.S. federal income tax purposes) holds our ordinary shares, the tax treatment of a partner in such partnership generally will depend upon the status of the partner and upon the activities of the partnership. Investors who are partners in a partnership should consult their tax advisers as to the particular U.S. federal income tax consequences of owning and disposing of our ordinary shares in their particular circumstances.
A “Non‑U.S. Holder” is a beneficial owner of our ordinary shares that is neither a U.S. Holder nor a partnership for U.S. federal income tax purposes.
Unless otherwise indicated, this discussion assumes that the company is not, and will not become, a “passive foreign investment company,” or a PFIC, for U.S. federal income tax purposes. See “ITEM 10.E. Taxation—United States Federal Income Taxation—Passive Foreign Investment Company Considerations” below. Further, this summary does not address the U.S. federal estate and gift, state, local or non‑U.S. tax consequences to U.S. Holders of owning and disposing of our ordinary shares. Investors should consult their own tax advisors regarding the U.S. federal, state and local, as well as non‑U.S. income and other tax consequences of owning and disposing of our ordinary shares in their particular circumstances.
Distributions
If you are a U.S. Holder, the gross amount of any distribution made to you with respect to our ordinary shares before reduction for any Israeli taxes withheld therefrom, other than certain distributions, if any, of our ordinary shares distributed pro rata to all our shareholders, generally will be includible in your income as dividend income to the extent such distribution is paid out of our current or accumulated earnings and profits as determined under U.S. federal income tax principles. We do not expect to maintain calculations of our earnings and profits under U.S. federal income tax principles. Therefore, if you are a U.S. Holder you should expect that the entire amount of any distribution generally will be reported as dividend income to you. Non‑corporate U.S. Holders may qualify for the lower rates of taxation with respect to dividends on ordinary shares applicable to long‑term capital gains (i.e., gains from the sale of capital assets held for more than one year), provided that certain conditions are met, including certain holding period requirements and the absence of certain risk reduction transactions. However, such dividends will not be eligible for the dividends received deduction generally allowed to corporate U.S. Holders.
115
If you are a U.S. Holder, dividends paid to you with respect to our ordinary shares will generally be treated as foreign source income, which may be relevant in calculating your foreign tax credit limitation. Subject to certain conditions and limitations, Israeli tax withheld on dividends may be deducted from your taxable income or credited against your U.S. federal income tax liability. The limitation on foreign taxes eligible for credit is calculated separately with respect to specific classes of income. For this purpose, dividends that we distribute generally should constitute “passive category income,” or, in the case of certain U.S. Holders, “general category income.” A foreign tax credit for foreign taxes imposed on distributions may be denied if you do not satisfy certain minimum holding period requirements. The rules relating to the determination of the foreign tax credit are complex, and you should consult your tax advisor to determine whether and to what extent you will be entitled to this credit.
Subject to the discussion below under “—Backup Withholding Tax and Information Reporting Requirements,” if you are a Non‑U.S. Holder, you generally will not be subject to U.S. federal income (or withholding) tax on dividends received by you on your ordinary shares, unless you conduct a trade or business in the United States and such income is effectively connected with that trade or business (or, if required by an applicable income tax treaty, the dividends are attributable to a permanent establishment or fixed base that such holder maintains in the United States).
Sale, Exchange or Other Taxable Disposition of Ordinary Shares
If you are a U.S. Holder, you generally will recognize gain or loss on the sale, exchange or other taxable disposition of our ordinary shares equal to the difference between the amount realized on such sale, exchange or other taxable disposition and your adjusted tax basis in our ordinary shares, and such gain or loss will be capital gain or loss. The initial tax basis in an ordinary share generally will be equal to the cost of such ordinary share. Except as discussed below with respect to foreign currency gain or loss, if you are a non‑corporate U.S. Holder, capital gain from the sale, exchange or other taxable disposition of ordinary shares is generally eligible for a preferential rate of taxation applicable to capital gains, if your holding period for such ordinary shares exceeds one year (i.e., such gain is long‑term capital gain). The deductibility of capital losses for U.S. federal income tax purposes is subject to limitations under the Code. Any such gain or loss that a U.S. Holder recognizes generally will be treated as U.S. source income or loss for foreign tax credit limitation purposes.
Subject to the discussion below under “—Backup Withholding Tax and Information Reporting Requirements,” if you are a Non‑U.S. Holder, you generally will not be subject to U.S. federal income or withholding tax on any gain realized on the sale or exchange of such ordinary shares unless:
such gain is effectively connected with your conduct of a trade or business in the United States (or, if required by an applicable income tax treaty, the gain is attributable to a permanent establishment or fixed base that such holder maintains in the United States); or |
you are an individual and have been present in the United States for 183 days or more in the taxable year of such sale or exchange and certain other conditions are met.
Passive Foreign Investment Company Considerations
If we were to be classified as a “passive foreign investment company,” or “PFIC,” in any taxable year, a U.S. Holder would be subject to special rules generally intended to reduce or eliminate any benefits from the deferral of U.S. federal income tax that a U.S. Holder could derive from investing in a non‑U.S. company that does not distribute all of its earnings on a current basis.
A non‑U.S. corporation will be classified as a PFIC for federal income tax purposes in any taxable year in which, after applying certain look‑through rules with respect to the income and assets of subsidiaries, either:
at least 75% of its gross income is “passive income”; or
116
at least 50% of the average quarterly value of its total gross assets (which may be determined in part by the market value of our ordinary shares, which is subject to change) is attributable to assets that produce “passive income” or are held for the production of passive income.
Passive income for this purpose generally includes dividends, interest, royalties, rents, gains from commodities and securities transactions, the excess of gains over losses from the disposition of assets which produce passive income, and includes amounts derived by reason of the temporary investment of funds raised in offerings of our ordinary shares. If a non‑U.S. corporation owns at least 25% by value of the stock of another corporation, the non‑U.S. corporation is treated for purposes of the PFIC tests as owning its proportionate share of the assets of the other corporation and as receiving directly its proportionate share of the other corporation’s income. If we are classified as a PFIC in any year with respect to which a U.S. Holder owns our ordinary shares, we will continue to be treated as a PFIC with respect to such U.S. Holder in all succeeding years during which the U.S. Holder owns our ordinary shares unless we cease to be a PFIC and the U.S. holder has made a “deemed sale” election under the PFIC rules.
Based on certainour current estimates of our gross income and the estimated fair market value of our gross assets and the nature of our business, we do not believe we were classified as a PFIC for the taxable year ending December 31, 2017.2020. However, we must determine our PFIC status annually based on tests which are factual in nature, and our status in future years will depend on our income, assets and activities in those years. Further, because the value of our gross assets is likely to be determined in large part by reference to our market capitalization, a decline in the value of our ordinary shares or an increase in the value of our passive assets (including cash and short term investments) may result in our becoming a PFIC .PFIC. There can be no assurance that we will not be considered a PFIC for any taxable year. If we were a PFIC and you are a U.S. Holder, then unless you make one of the elections described below, a special tax regime will apply to both (a) any “excess distribution” by us to you (generally, your ratable portion of distributions in any year which are greater than 125% of the average annual distribution received by you in the shorter of the three preceding years or your holding period for our ordinary shares) and (b) any gain realized on the sale or other disposition of the ordinary shares. Under this regime, any excess distribution and realized gain will be treated as ordinary income and will be subject to tax as if (a) the excess distribution or gain had been realized ratably over your holding period, (b) the amount deemed realized in each year had been subject to tax in each year of that holding period at the highest marginal rate for such year (other than income allocated to the current period or any taxable period before we became a PFIC, which would be subject to tax at the U.S. Holder’s regular ordinary income rate for the current year and would not be subject to the interest charge discussed below) and (c) the interest charge generally applicable to underpayments of tax had been imposed on the taxes deemed to have been payable in those years. In addition, dividend distributions made to you will not qualify for the lower rates of taxation applicable to long‑term capital gains discussed above under “Distributions.” Certain elections may be available that would result in an alternative treatment (such as mark‑to‑market treatment) of our ordinary shares.
If a U.S. Holder makes a valid mark‑to‑market election for the first tax year in which such U.S. Holder holds (or is deemed to hold) ordinary shares in a corporation and for which such corporation is determined to be a PFIC, the U.S. Holder generally will recognize as ordinary income any excess of the fair market value of the ordinary shares at the end of each taxable year over their adjusted tax basis, and will recognize an ordinary loss in respect of any excess of the adjusted tax basis of the ordinary shares over their fair market value at the end of the taxable year (but only to the extent of the net amount of income previously included as a result of the mark‑to‑market election). If a U.S. Holder makes the election, the U.S. Holder’s tax basis in the ordinary shares will be adjusted to reflect these income or loss amounts. Any gain recognized on the sale or other disposition of ordinary shares in a year when we are a PFIC will be treated as ordinary income and any loss will be treated as an ordinary loss (but only to the extent of the net amount of income previously included as a result of the mark‑to‑market election). The mark‑to‑market election is available only if we are a PFIC and our ordinary shares are “regularly traded” on a “qualified exchange.” Our ordinary shares will be treated as “regularly traded” in any calendar year in which more than a de minimis quantity of the ordinary shares, are traded on a qualified exchange on at least 15 days during each calendar quarter. Nasdaq is a qualified exchange for this purpose and, consequently, if the ordinary shares are regularly traded, the mark‑to‑market election will be available to a U.S. Holder.
If we are a PFIC, the general tax treatment for U.S. Holders described in this section would apply to indirect distributions and gains deemed to be realized by U.S. Holders in respect of any entity in which we hold equity that is also a PFIC (a "lower tier PFIC"). Because a mark‑to‑market election generally would not be available with respect to any lower‑tier PFICs, that we may own, a U.S. Holder may continue to be subject to the PFIC rules with respect to such holder’s indirect interest in any investments held by us that are treated as an equity interest in a PFIC for U.S. federal income tax purposes.such lower-tiers PFICs.
117
We do not intend to provide the information necessary for U.S. Holders to make qualified electing fund elections if we are classified as a PFIC. U.S. Holders should consult their tax advisors to determine whether any of these elections would be available and if so, what the consequences of the alternative treatments would be in their particular circumstances.
If a U.S. Holder owns ordinary shares during any year in which we are a PFIC, the U.S. Holder generally will be required to file an IRS Form 8621 (Information Return by a Shareholder of a Passive Foreign Investment Company or Qualified Electing Fund) or successor form with respect to the company, generally with the U.S. Holder’s federal income tax return for that year. If the company was a PFIC for a given taxable year, then you should consult your tax advisor concerning your annual filing requirements.
U.S. Holders should consult their tax advisors regarding whether we are a PFIC and the potential application of the PFIC rules.
Backup Withholding Tax and Information Reporting Requirements
U.S. backup withholding tax and information reporting requirements may apply to certain payments to certain holders of stock. Information reporting generally will apply to payments of dividends on, and to proceeds from the sale, exchange or redemption of, our ordinary shares made within the United States, or by a United States payor or United States middleman, to a holder of our ordinary shares, other than an exempt recipient (including a payee that is not a United States person that provides an appropriate certification and certain other persons). Payments made (and sales or other dispositions effected at an office) outside the U.S. will be subject to information reporting in limited circumstances. A payor will be required to withhold backup withholding tax from any payments of dividends on, or the proceeds from the sale or redemption of, ordinary shares within the United States, or by a United States payor or United States middleman, to a holder, other than an exempt recipient, if such holder fails to furnish its correct taxpayer identification number or otherwise fails to comply with, or establish an exemption from, such backup withholding tax requirements, or to report dividends required to be shown on the holder’s U.S. federal income tax returns. Any amounts withheld under the backup withholding rules will be allowed as a credit against the beneficial owner’s U.S. federal income tax liability, if any, and any excess amounts withheld under the backup withholding rules may be refunded, provided that the required information is timely furnished to the IRS.
Foreign Asset Reporting
Certain U.S. Holders who are individuals and certain entities may be required to report information relating to an interest in our ordinary shares, subject to certain exceptions (including an exception for shares held in accounts maintained by certain financial institutions) by filing IRS Form 8938 (Statement of Specified Foreign Financial Assets) with their federal income tax return. U.S. Holders are urged to consult their tax advisors regarding their information reporting obligations, if any, with respect to their ownership and disposition of our ordinary shares.
F. Dividends and Paying Agents
Not applicable.
G. Statement by Experts
Not applicable.
H. Documents on Display
We are currently subjectrequired to the informational requirements of the Exchange Act applicable to foreign private issuers and fulfill the obligations of these requirements by filing reportsmake certain filings with the SEC. As a foreign private issuer, we are exempt from the rules under the Exchange Act relating to the furnishing and content ofThe SEC maintains an internet website that contains reports, proxy statements and our officers, directors and principal shareholders are exempt from the reporting and short‑swing profit recovery provisions contained in Section 16 of the Exchange Act. In addition, we are not required under the Exchange Act to file periodic reports and financial statements with the SEC as frequently or as promptly as U.S. companies whose securities are registered under the Exchange Act. However, we are required to file with the SEC, within 120 days after the end of each subsequent fiscal year, an annual report on Form 20‑F containing financial statements which will be examined and reported on, with an opinion expressed, by an independent public accounting firm. We also file with the SEC reports on Form 6‑K containing quarterly unaudited financial information.
We also make available to the public through this web site at http://www.sec.gov. As permitted under Nasdaq Stock Market Rule 5250(d)(1)(C), we will poston our website, free of charge, our annual reports on Form 20-F and the text of our reports on Form 6-K, including any amendments to these reports, as well as certain other SEC filings, as soon as reasonably practicable after they are electronically filed with or furnished to the SEC on ourSEC. Our website at http://address is www.mediwound.com. We will not furnish hard copies of such reports to our shareholders unless we are requested to do so in writing. Upon receipt of such a request, we will provide a hard copy of such reports to such requesting shareholder free of charge. The information contained on our website is not part ofincorporated by reference in this or any other report filed with or furnished to the SEC.document.
118
I. Subsidiary Information
Not applicable.
We are exposed to a variety of risks, including foreign currency exchange fluctuations, changes in interest rates and inflation. We regularly assess currency, interest rate and inflation risks to minimize any adverse effects on our business as a result of those factors.
Foreign Currency Risk
The U.S. dollar is our functional and reporting currency. A significant portion of our operating expenses are denominated in Israeli shekels, accounting for approximately 28%45%, 28%,40% and 40%44% of our operating expenses in the years ended December 31, 2015, 20162018, 2019 and 2017,2020, respectively. We also have expenses in other non‑dollar currencies, in particular the Euro, and for the next few years, we expect that thea substantial majorityportion of our revenue, if any,revenues will be denominated in Euros from the sale of NexoBrid in the European Union.U.S dollar. A devaluation of the shekel in relation to the U.S. dollar has the effect of reducing the U.S. dollar amount of our expenses or payables that are payable in shekels, unless those expenses or payables are linked to the U.S. dollar. Conversely, any increase in the value of the shekel in relation to the U.S. dollar has the effect of increasing the U.S. dollar value of our unlinked shekel expenses, which would have a negative impact on our profit margins.
Because exchange rates between the U.S. dollar and both the shekel and the Euro (as well as between the U.S. dollar and other currencies) fluctuate continuously, such fluctuations have an impact on our results and period‑to‑period comparisons of our results. The effects of foreign currency re‑measurements are reported in our consolidated financial statements of operations.
The following table presents information about the changes in the exchange rates of the shekel against the U.S. dollar and changes in the exchange rates of the Euro against the U.S. dollar:
| Change in | Exchange Rate | |||||||
| Period | Shekel against the U.S. dollar (%) | Euro against the U.S. dollar (%) | ||||||
| 2013 | 7.0 | 4.5 | ||||||
| 2014 | (12.0 | ) | (11.8 | ) | ||||
| 2015 | (0.3 | ) | (10.4 | ) | ||||
| 2016 | 1.5 | (3.4 | ) | |||||
| 2017 | 9.8 | 13.9 | ||||||
| Appreciation (Devaluation) of | ||||||||
| Period | Shekel against the U.S. dollar (%) | Euro against the U.S. dollar (%) | ||||||
| 2018 | (8.1 | ) | (4.4 | ) | ||||
| 2019 | 7.8 | (2.0 | ) | |||||
| 2020 | 7.0 | 8.0 | ||||||
A 10% increase (decrease) in the value of the NIS and Euro against the U.S. dollar would have decreased (increased)increased (decreased) our net lossprofit by (loss) approximately $0.4$1.3 million in 2017.for the year ended December 31, 2020.
As we beginare marketing and sales ofselling NexoBrid in Europe and conducting clinical trials of NexoBrid inoutside the United States, we will continue to monitor exposure to currency fluctuations. We do not currently engage in currency hedging activities in order to reduce this currency exposure, but we may begin to do so in the future. Instruments that may be used to hedge future risks may include foreign currency forward and swap contracts. These instruments may be used to selectively manage risks, but there can be no assurance that we will be fully protected against material foreign currency fluctuations.
Other Market Risks
We do not believe that we have material exposure to interest rate risk due to the fact that we have no long‑term borrowings. debt.
We do not believe that we have any material exposure to inflationary risks. We do not believe that the rate of inflation in Israel has had a material impact on our business to date. However, our costs in Israel will increase if inflation in Israel exceeds the devaluation of the shekel against the U.S. dollar (to the extent that it devalues at all) or if the timing of such devaluation lags behind inflation in Israel.
Not applicable.
PART II
None.
(a) Disclosure Controls and Procedures
Our management, including our Chief Executive Officer and Chief Financial Officer, has evaluated the effectiveness of our disclosure controls and procedures (as such term is defined in Rules 13a‑15(e) and 15d‑15(e) under the Exchange Act) as of December 31, 2017.2020. Based on such evaluation, our Chief Executive Officer and Chief Financial Officer have concluded that, as of December 31, 2017,2020, our disclosure controls and procedures were effective.
(b) Management Annual Report on Internal Control over Financial Reporting
Our management, under the supervision of our Chief Executive Officer and Chief Financial Officer, is responsible for establishing and maintaining adequate internal control over financial reporting as defined in Rules 13a‑15(f) and 15d‑15(f) under the Exchange Act.
Our management, including our Chief Executive Officer and Chief Financial Officer, assessed the effectiveness of our internal control over financial reporting as of December 31, 2017.2020. In making this assessment, our management used the criteria established in Internal Control—Integrated Framework (2013) issued by the Committee of Sponsoring Organizations of the Treadway Commission (COSO). Our management has concluded, based on its assessment, that our internal control over financial reporting was effective as of December 31, 2017.
2020.(d) Changes in Internal Control over Financial Reporting
There were no changes in our internal control over financial reporting (as such term is defined in Rules 13a‑15(f) and 15d‑15(f) under the Exchange Act) that occurred during the period covered by this annual report that have materially affected, or that are reasonably likely to materially affect, our internal control over financial reporting.
Our board of directors has determined that Sharon KocahnKochan qualifies as an “audit committee financial expert,” as defined under the U.S. federal securities laws and has the requisite financial experience defined by the Nasdaq Marketplace Rules. In addition, Sharon Kochan is independent as such term is defined in Rule 10A‑3(b)(1) under the Exchange Act and under the listing standards of the Nasdaq Global Market.
120
We have adopted a code of ethicsbusiness conduct and proper business conductethics applicable to our executive officers, directors and all other employees. A copy of the code is delivered to every employee of MediWound Ltd. and its subsidiaries and is available to our investors and others on our website http://ir.mediwound.com/ or by contacting our investor relations department. Information contained on, or that can be accessed through, our website does not constitute a part of this annual report and is not incorporated by reference herein. Any waivers of this code for executive officers or directors will be disclosed through the filing of a Form 6‑K or on our website.website. We granted no waivers under our code of ethics in 2017.2020.
Principal Accountant Fees and Services
We paid the following fees for professional services rendered Kost Forer Gabbay & Kasierer, a member of Ernst & Young Global, an independent registered public accounting firm, for the years ended December 31, 20172019 and 2016:2020:
| 2016 | 2017 | 2019 | 2020 | ||||||||||||
| Audit Fees | $ | 140,000 | $ | 290,000 | $ | 240,000 | $ | 170,000 | |||||||
| Audit‑Related Fees | — | — | 35,000 | 33,500 | |||||||||||
| Tax Fees | — | — | — | — | |||||||||||
| Total | $ | 140,000 | $ | 290,000 | $ | 275,000 | $ | 203,500 | |||||||
“Audit fees” are the aggregate fees paid for the audit of our annual financial statements.statements and SOX for the year 2020. This category also includes services that generally the independent accountant provides, such as consents and assistance with and review of documents filed with the SEC, including the registration statement filed in connection with our September 2017 equity offering.SEC.
“Audit‑related fees” are the aggregate fees paid for assurance and related services that are reasonably related to the performance of the audit and are not reported under audit fees. These fees primarily include accounting consultations regarding the accounting treatment of matters that occur in the regular course of business, implications of new accounting pronouncements and other accounting issues that occur from time to time.
“Tax fees” include fees for professional services rendered by our independent registered public accounting firm for tax compliance, transfer pricing and tax advice on actual or contemplated transactions.
The Audit Committee pre‑approves all audit and non‑audit services provided by the independent accountant.
Not applicable.
Not applicable.
Not applicable.
121
As a foreign private issuer, we are permitted to comply with Israeli corporate governance practices instead of the Nasdaq Stock Market requirements, provided that we disclose those Nasdaq Stock Market requirements with which we do not comply and the equivalent Israeli requirement that we follow instead. We currently rely on this “foreign private issuer exemption” with respect to the following requirements:
Quorum. As permitted under the Israeli Companies Law pursuant to our articles of association, the quorum required for an ordinary meeting of shareholders will consist of at least two shareholders present in person, by proxy or by other voting instrument in accordance with the Israeli Companies Law, who hold at least 25% of the voting power of our shares (and in an adjourned meeting, with some exceptions, at least two shareholders), instead of 33 1/3% of the issued share capital required under the Nasdaq Stock Market listing rules. |
Nomination of directors. With the exception of external directors and directors elected by our board of directors due to vacancy, our directors are elected by an annual meeting of our shareholders to hold office until the next annual meeting following one year from his or her election. The nominations for directors, which are presented to our shareholders by our board of directors, are generally made by the entire board of directors itself, in accordance with the provisions of our articles of association and the Israeli Companies Law. Nominations need not be made by a nominating committee of our board of directors consisting solely of independent directors or otherwise, as required under the Nasdaq Stock Market listing rules. |
Majority of independent directors. Under the Israeli Companies Law, we are only required to appoint at least two external directors, within the meaning of the Israeli Companies Law, to our board of directors. Currently, four of our directors (of whom two are external directors, within the meaning of the Israeli Companies Law) qualify as independent directors under the rules of the U.S. federal securities laws and the Nasdaq Stock Market listing rules. If at any time we no longer have a controlling shareholder, we will no longer be required to have external directors, Shareholder approval. We do not intend to follow Nasdaq Stock Market rules which require shareholder approval in order to enter into any transaction, other than a public offering, involving the sale, issuance or potential issuance by the Company of ordinary shares (or securities convertible into or exercisable for ordinary shares) equal to 20% or more of the outstanding share capital of the Company or 20% or more of the voting power outstanding before the issuance for less than the greater of book or market value of the ordinary shares. We will follow Israeli law with respect to any requirement to obtain shareholder approval in connection with any private placements of equity securities. |
Not applicable.
PART III
Not applicable.
See pages F‑2 through F‑4046 of this annual report.
| Exhibit No. | Description | |
123
| 100 | The following financial information from the Registrant’s Annual Report on Form 20‑F for the year ended December 31, | |
| † | Portions of this exhibit have been omitted pursuant to Instruction 4(a) to Exhibits to Form 20-F because they are both (i) not material and |
| (1) | Previously filed with the SEC on February 25, 2020 pursuant to the Registrant’s annual report on Form 20-F for the year ended December 31, 2019 (File No. 001-36349) and incorporated by reference herein. |
| (2) | Previously filed with the SEC on March |
Previously filed with the SEC on |
| (4) | Previously |
Previously filed with the SEC on January 25, 2016 |
Previously filed with the SEC on February 21, 2017 |
| (7) | Previously filed with the SEC on March 19, 2018 as Exhibit 4.16 to the Registrant’s annual report on Form 20‑F for the year ended December 31, 2017 (File No. 001‑36349) and incorporated by reference herein. |
| (8) | Previously filed with the SEC on March 25, 2019 as Exhibit 4.17 to the Registrant’s annual report on Form 20‑F for the year ended December 31, 2018 (File No. 001‑36349) and incorporated by reference herein. |
| (9) | Previously filed with the SEC on March 19, 2018 as Exhibit 4.17 to the Registrant’s annual report on Form 20‑F for the year ended December 31, 2017 (File No. 001‑36349) and incorporated by reference herein |
| (10) | Previously filed with the SEC on March 25, 2019 as Exhibit 4.20 to the Registrant’s annual report on Form 20‑F for the year ended December 31, 2018 (File No. 001‑36349) and incorporated by reference herein. |
| (11) | Previously filed with the SEC on March 25, 2019 as Exhibit 4.21 to the Registrant’s annual report on Form 20‑F for the year ended December 31, 2018 (File No. 001‑36349) and incorporated by reference herein |
| (12) | Previously filed with the SEC by Vericel Corporation on August 6, 2019 as Exhibit 10.9 to its quarterly report on Form 10-Q for the quarter ended June 30, 2019 (File No. 001‑35280) and incorporated by reference herein. |
| (13) | Previously filed with the SEC by Vericel Corporation on August 6, 2019 as Exhibit 10.10 to its quarterly report on Form 10-Q for the quarter ended June 30, 2019 (File No. 001‑35280) and incorporated by reference herein |
The registrant hereby certifies that it meets all of the requirements for filing on Form 20‑F and that it has duly caused and authorized the undersigned to sign this annual report on its behalf.
MediWound Ltd. | ||
| Date: February 25, 2021 | ||
Boaz Gur-Lavie | ||
| Chief Financial |
125
MEDIWOUND LTD. AND ITS SUBSIDIARIES
CONSOLIDATED FINANCIAL STATEMENTS
DECEMBER 31, 20172020
INDEX
Page | |
F -5 | |
- - - - - - - - - - - - - - - - - - - - -
  | Kost Forer Gabbay & Kasierer 144 Menachem Begin Rd. Tel-Aviv 6492102, Israel | Tel: +972-3-6232525 Fax: +972-3-5622555 ey.com |
To the Shareholders and
Board of Directors of
MEDIWOUND LTD. AND ITS SUBSIDIARIES
Opinion on the Financial Statements
We have audited the accompanying consolidated balance sheets of MediWound Ltd.Ltd and its subsidiaries (the “Company”"Company") as of December 31, 20162020 and 2017 and2019, the related consolidated statements of comprehensive profit or loss, changes inshareholders' equity and cash flows for each of the three years in the period ended December 31, 20172020, and the related notes (collectively referred to as the “financial“consolidated financial statements”). In our opinion, the consolidated financial statements present fairly, in all material respects, the consolidated financial position of the Company at December 31, 20162020 and 2017,2019, and the consolidated results of its operations and its cash flows for each of the three years in the period ended December 31, 2017,2020, in conformity with International Financial Reporting Standards as issued by the International Accounting Standards Board.
Basis for Opinion
These financial statements are the responsibility of the Company's management. Our responsibility is to express an opinion on the Company’s financial statements based on our audits. We are a public accounting firm registered with the Public Company Accounting Oversight Board (United States) (PCAOB) and are required to be independent with respect to the Company in accordance with the U.S. federal securities laws and the applicable rules and regulations of the Securities and Exchange Commission and the PCAOB.
We conducted our audits in accordance with the standards of the PCAOB. Those standards require that we plan and perform the audit to obtain reasonable assurance about whether the financial statements are free of material misstatement, whether due to error or fraud. The Company is not required to have, nor were we engaged to perform, an audit of its internal control over financial reporting. As part of our audits we are required to obtain an understanding of internal control over financial reporting but not for the purpose of expressing an opinion on the effectiveness of the Company's internal control over financial reporting. Accordingly, we express no such opinion.
Our audits included performing procedures to assess the risks of material misstatement of the financial statements, whether due to error or fraud, and performing procedures that respond to those risks. Such procedures included examining, on a test basis, evidence regarding the amounts and disclosures in the financial statements. Our audits also included evaluating the accounting principles used and significant estimates made by management, as well as evaluating the overall presentation of the financial statements. We believe that our audits provide a reasonable basis for our opinion.
F - 2
| Kost Forer Gabbay & Kasierer 144 Menachem Begin Rd. Tel-Aviv 6492102, Israel | Tel: +972-3-6232525 Fax: +972-3-5622555 ey.com |
Description of the matter | As described in Notes 3 and 16b to the consolidated financial statements, the Company’s research and development efforts have been financed in part through grants from the Israeli Innovation Authority (“IIA”). Grants received from the IIA are recognized as a liability if future economic benefits are expected from the research and development activity that will result in royalty‑bearing sales. The Company undertook to pay royalties of 3% on the revenues derived from sales of products or services developed in whole or in part using IIA grants, up to the amount of total grants received, plus LIBOR interest. The liability to the IIA is measured at amortized cost using the effective interest method and amounted as of December 31, 2020 to $7,529 thousands. Auditing the Company's IIA liability involved a high degree of subjectivity as it is based on assumptions about future revenue forecasts, such as long-term demand for the Company’s products and licenses and revenue growth rates. These significant assumptions are forward-looking and could be affected by future economic and market conditions. |
How we addressed the matter in our audit | Our substantive audit procedures included, among others, evaluating the significant assumptions and operating data used by management. For example, we compared the significant assumptions and operating data used by management to historical trends, we performed look-back analyses by comparing the Company's historical financial forecasted revenues with the actual results and we agreed future revenues to approved budgets. In addition, we considered the phases of development of the Company's products and the Company’s ability of obtaining regulatory approvals. We also tested the completeness and accuracy of the relevant data used in management's calculation, tested the mathematical accuracy of management’s calculations and performed sensitivity analyses over significant assumptions used by management related to revenue growth rates. |
Tel-Aviv, Israel February 25, 2021 | KOST FORER GABBAY & KASIERER A Member of Ernst & Young Global |
We have served as the Company's auditor since 2001
F - 3
U.S. dollars in thousands
| December 31, | December 31, | ||||||||||||||||||||
| Note | 2016 | 2017 | Note | 2019 | 2020 | ||||||||||||||||
| CURRENT ASSETS: | |||||||||||||||||||||
| Cash and cash equivalents | 5 | 28,866 | 36,069 | 4 | 7,242 | 17,376 | |||||||||||||||
| Restricted deposits | 5 | 180 | 184 | ||||||||||||||||||
| Short-term bank deposits | 6 | 1,163 | - | 5 | 22,036 | 4,024 | |||||||||||||||
| Trade receivables | 332 | 369 | 6 | 4,107 | 2,767 | ||||||||||||||||
| Inventories | 7 | 844 | 1,886 | 7 | 1,613 | 1,380 | |||||||||||||||
| Other receivables | 8, 22 | 2,407 | 3,196 | 8, 24 | 450 | 462 | |||||||||||||||
| 33,612 | 41,520 | 35,628 | 26,193 | ||||||||||||||||||
| LONG-TERM ASSETS: | |||||||||||||||||||||
| Long term deposits | 103 | 56 | |||||||||||||||||||
| Property, plant and equipment, net | 9 | 1,276 | 1,924 | 9 | 2,304 | 2,630 | |||||||||||||||
| Right of-use assets, net | 10 | 2,229 | 1,884 | ||||||||||||||||||
| Intangible assets, net | 10 | 773 | 635 | 11 | 429 | 363 | |||||||||||||||
| 2,152 | 2,615 | 4,962 | 4,877 | ||||||||||||||||||
| 35,764 | 44,135 | 40,590 | 31,070 | ||||||||||||||||||
| CURRENT LIABILITIES: | |||||||||||||||||||||
| Current maturities of long-term liabilities | 569 | 1,750 | |||||||||||||||||||
| Trade payables and accrued expenses | 3,320 | 3,251 | 4,067 | 2,992 | |||||||||||||||||
| Other payables | 11, 22 | 2,060 | 2,182 | 12, 24 | 5,737 | 3,524 | |||||||||||||||
| 5,380 | 5,433 | 10,373 | 8,266 | ||||||||||||||||||
| LONG‑TERM LIABILITIES: | |||||||||||||||||||||
| Deferred revenues | 1,023 | 988 | 1,135 | 1,234 | |||||||||||||||||
| Liabilities in respect of IIA grants | 12,13 | 6,839 | 7,380 | 13, 16b | 6,811 | 7,267 | |||||||||||||||
| Contingent consideration for purchase of shares | 13,16 | 14,533 | 14,381 | ||||||||||||||||||
| Liability in respect of discontinued operation | 19 | - | 6,003 | ||||||||||||||||||
| Liabilities in respect of purchase of shares | 16c | 4,853 | 4,998 | ||||||||||||||||||
| Lease liabilities | 10 | 2,006 | 1,741 | ||||||||||||||||||
| Severance pay liability, net | 14 | 219 | 330 | 15 | 243 | 292 | |||||||||||||||
| 22,614 | 29,082 | 15,048 | 15,532 | ||||||||||||||||||
| SHAREHOLDERS' EQUITY: | 16 | 18 | |||||||||||||||||||
| Ordinary shares of NIS 0.01 par value: | |||||||||||||||||||||
| Authorized: 32,244,508 shares as of December 31, 2016 and 2017; Issued and Outstanding 21,930,449 and 27,047,737 shares respectively. | 60 | 75 | |||||||||||||||||||
| Authorized: 50,000,000 shares as of December 31, 2020 and December 31, 2019; Issued and Outstanding 27,236,752 shares as of December 31, 2020 and 27,202,795 shares as of December 31, 2019 | 75 | 75 | |||||||||||||||||||
| Share premium | 114,979 | 138,992 | 140,871 | 142,193 | |||||||||||||||||
| Foreign currency translation adjustments | (9 | ) | (38 | ) | (17 | ) | (40 | ) | |||||||||||||
| Accumulated deficit | (107,260 | ) | (129,409 | ) | (125,760 | ) | (134,956 | ) | |||||||||||||
| 7,770 | 9,620 | 15,169 | 7,272 | ||||||||||||||||||
| 35,764 | 44,135 | 40,590 | 31,070 | ||||||||||||||||||
The accompanying notes are an integral part of the consolidated financial statements.
F - 34
U.S. dollars in thousands (except of share and per share data)
Year ended December 31, | |||||||||||||
| Note | 2015 | 2016 | 2017 | ||||||||||
| Revenues | 601 | 1,558 | 2,496 | ||||||||||
| Cost of revenues | 20a | 2,519 | 2,158 | 1,578 | |||||||||
| Gross profit (loss) | (1,918 | ) | (600 | ) | 918 | ||||||||
| Operating expenses: | |||||||||||||
| Research and development, net of participations | 20b | 6,021 | 7,068 | 5,462 | |||||||||
| Selling and marketing | 20c | 9,284 | 8,403 | 5,362 | |||||||||
| General and administrative | 20d | 4,004 | 4,084 | 3,781 | |||||||||
| Total operating expenses | 19,309 | 19,555 | 14,605 | ||||||||||
| Operating loss | (21,227 | ) | (20,155 | ) | (13,687 | ) | |||||||
| Financial income | 20e | 1,052 | 2,166 | 406 | |||||||||
| Financial expense | 20e | (1,496 | ) | (896 | ) | (1,252 | ) | ||||||
| Loss from continuing operations | (21,671 | ) | (18,885 | ) | (14,533 | ) | |||||||
| Loss from discontinued operation | 19 | (417 | ) | - | (7,616 | ) | |||||||
| Net loss | (22,088 | ) | (18,885 | ) | (22,149 | ) | |||||||
| Other comprehensive income (loss): | |||||||||||||
| Items to be reclassified to profit or loss in subsequent periods: | |||||||||||||
| Foreign currency translation adjustments | 2 | 7 | (29 | ) | |||||||||
| Total comprehensive loss | (22,086 | ) | (18,878 | ) | (22,178 | ) | |||||||
| Basic and diluted net loss per share: | 21 | ||||||||||||
| Basic and diluted net loss per share from continuing operations | (1.00 | ) | (0.86 | ) | (0.62 | ) | |||||||
| Basic and diluted net loss per share from discontinued operations | (0.02 | ) | - | (0.33 | ) | ||||||||
| Total Basic and diluted net loss per share | (1.02 | ) | (0.86 | ) | (0.95 | ) | |||||||
Year ended December 31, | ||||||||||||||||
| Note | 2018 | 2019 | 2020 | |||||||||||||
| Revenues from sale of products | 3,401 | 3,611 | 7,828 | |||||||||||||
| Revenues from development services | - | 10,678 | 13,935 | |||||||||||||
| Revenues from license agreements | - | 17,500 | - | |||||||||||||
| Total revenues | 22a | 3,401 | 31,789 | 21,763 | ||||||||||||
| Cost of revenues | 22b | 2,088 | 11,849 | 14,218 | ||||||||||||
| Gross profit | 1,313 | 19 ,940 | 7,545 | |||||||||||||
| Research and development, net of Participations | 22c | 4,072 | 4,969 | 7,698 | ||||||||||||
| Selling and marketing | 22d | 4,188 | 4,064 | 3,228 | ||||||||||||
| General and administrative | 22e | 3,799 | 5,242 | 5,459 | ||||||||||||
| Other income from settlement agreement | 16c | (7,537 | ) | - | - | |||||||||||
| Other expenses | 22f | 751 | 1,172 | - | ||||||||||||
| Total operating expenses | 5,273 | 15,447 | 16,385 | |||||||||||||
| Operating profit (loss) | (3,960 | ) | 4,493 | (8,840 | ) | |||||||||||
| Financial income | 22g | 412 | 556 | 843 | ||||||||||||
| Financial expense | 22g | (2,117 | ) | (2,983 | ) | (1,279 | ) | |||||||||
| Profit (loss) from continuing operations | (5,665 | ) | 2,066 | (9,276 | ) | |||||||||||
| Profit from discontinued operation | 16c,21 | 4,608 | 2,889 | 80 | ||||||||||||
| Net profit (loss) | (1,057 | ) | 4,955 | (9,196 | ) | |||||||||||
| Other comprehensive income (loss): | ||||||||||||||||
| Foreign currency translation adjustments | 13 | 8 | (23 | ) | ||||||||||||
| Total comprehensive income (loss) | (1,044 | ) | 4,963 | (9,219 | ) | |||||||||||
| 23 | ||||||||||||||||
| Basic and diluted net profit (loss) per share from continuing operations | (0.21 | ) | 0.08 | (0.34 | ) | |||||||||||
| Basic and diluted net profit per share from discontinued operations | 0.17 | 0.10 | - | |||||||||||||
| Total Basic and diluted net profit (loss) per share | (0.04 | ) | 0.18 | (0.34 | ) | |||||||||||
The accompanying notes are an integral part of the consolidated financial statements.
F - 5
U.S. dollars in thousands
| Share capital | Share premium | Foreign currency translation reserve | Accumulated deficit | Total Equity | ||||||||||||||||
| Balance as of January 1, 2018 | 75 | 138,992 | (38 | ) | (129,658 | ) | 9,371 | |||||||||||||
| Net loss | - | - | - | (1,057 | ) | (1,057 | ) | |||||||||||||
| Other comprehensive income | - | - | 13 | - | 13 | |||||||||||||||
| Total comprehensive (loss) income | - | - | 13 | (1,057 | ) | (1,044 | ) | |||||||||||||
| Exercise of options | (* | ) | (* | ) | - | - | (* | ) | ||||||||||||
| Share-based compensation | - | 645 | - | - | 645 | |||||||||||||||
| Balance as of December 31, 2018 | 75 | 139,637 | (25 | ) | (130,715 | ) | 8,972 | |||||||||||||
| Net profit | - | - | - | 4,955 | 4,955 | |||||||||||||||
| Other comprehensive income | - | - | 8 | - | 8 | |||||||||||||||
| Total comprehensive income | - | - | 8 | 4,955 | 4,963 | |||||||||||||||
| Exercise of options | (* | ) | - | - | - | (* | ) | |||||||||||||
| Share-based compensation | - | 1,234 | - | - | 1,234 | |||||||||||||||
| Balance as of December 31, 2019 | 75 | 140,871 | (17 | ) | (125,760 | ) | 15,169 | |||||||||||||
| Net loss | - | - | - | (9,196 | ) | (9,196 | ) | |||||||||||||
| Other comprehensive loss | - | - | (23 | ) | - | (23 | ) | |||||||||||||
| Total comprehensive loss | - | - | (23 | ) | (9,196 | ) | (9,219 | ) | ||||||||||||
| Exercise of options | (* | ) | - | (* | ) | - | - | |||||||||||||
| Share-based compensation | - | 1,322 | - | - | 1,322 | |||||||||||||||
| Balance as of December 31, 2020 | 75 | 142,193 | (40 | ) | (134,956 | ) | 7,272 | |||||||||||||
* Represents an amount lower than $1.
The accompanying notes are an integral part of the consolidated financial statements.
F - 46
U.S. dollars in thousands
| Share capital | Share premium | Foreign currency translation Adjustments | Accumulated deficit | Total Equity | ||||||||||||||||
| Balance as of January 1, 2015 | 59 | 109,117 | (18 | ) | (66,287 | ) | 42,871 | |||||||||||||
| Loss for the period | - | - | - | (22,088 | ) | (22,088 | ) | |||||||||||||
| Other comprehensive income | - | - | 2 | - | 2 | |||||||||||||||
| Total comprehensive (loss) income | - | - | 2 | (22,088 | ) | (22,086 | ) | |||||||||||||
| Exercise of options | 1 | 25 | - | - | 26 | |||||||||||||||
| Share-based compensation | - | 2,659 | - | - | 2,659 | |||||||||||||||
| Balance as of December 31, 2015 | 60 | 111,801 | (16 | ) | (88,375 | ) | 23,470 | |||||||||||||
| Loss for the period | - | - | - | (18,885 | ) | (18,885 | ) | |||||||||||||
| Other comprehensive income | - | - | 7 | - | 7 | |||||||||||||||
| Total comprehensive (loss) income | - | - | 7 | (18,885 | ) | (18,878 | ) | |||||||||||||
| Exercise of options | * | 7 | - | - | 7 | |||||||||||||||
| Share-based compensation | - | 3,171 | - | - | 3,171 | |||||||||||||||
| Balance as of December 31, 2016 | 60 | 114,979 | (9 | ) | (107,260 | ) | 7,770 | |||||||||||||
| Loss for the period | - | - | - | (22,149 | ) | (22,149 | ) | |||||||||||||
| Other comprehensive loss | - | - | (29 | ) | - | (29 | ) | |||||||||||||
| Total comprehensive loss | - | - | (29 | ) | (22,149 | ) | (22,178 | ) | ||||||||||||
| Exercise of options | * | 7 | - | - | 7 | |||||||||||||||
| Issuance of ordinary shares of NIS 0.01 par value net of issuance expenses | 15 | 22,643 | - | - | 22,658 | |||||||||||||||
| Share-based compensation | - | 1,363 | - | - | 1,363 | |||||||||||||||
| Balance as of December 31, 2017 | 75 | 138,992 | (38 | ) | (129,409 | ) | 9,620 | |||||||||||||
Year ended December 31, | ||||||||||||
| 2018 | 2019 | 2020 | ||||||||||
Cash Flows from operating activities: | ||||||||||||
| Net Profit (loss) | (1,057 | ) | 4,955 | (9,196 | ) | |||||||
| Adjustments to reconcile net loss to net cash provided by (used in) continuing operating activities: | ||||||||||||
| Adjustments to profit and loss items: | ||||||||||||
| Profit from discontinued operation | (4,608 | ) | (2,889 | ) | (80 | ) | ||||||
| Depreciation and amortization | 577 | 1,149 | 1,090 | |||||||||
| Share-based compensation | 645 | 1,234 | 1,322 | |||||||||
| Revaluation of liabilities in respect of IIA grants | 287 | (392 | ) | 828 | ||||||||
| Revaluation of liabilities in respect of purchase of shares | 758 | 1,690 | (433 | ) | ||||||||
| Other income from settlement agreement | (7,537 | ) | - | - | ||||||||
| Revaluation of lease liabilities | - | 340 | 305 | |||||||||
| Increase (decrease) in severance pay liability, net | 19 | (105 | ) | 33 | ||||||||
| Net financing income | (412 | ) | (434 | ) | (297 | ) | ||||||
| Un-realized foreign currency (gain) loss | 182 | (152 | ) | (211 | ) | |||||||
| (10,089 | ) | 441 | 2,557 | |||||||||
| Changes in asset and liability items: | ||||||||||||
| Decrease (increase) in trade receivables | (211 | ) | (3,553 | ) | 1,386 | |||||||
| Decrease in inventories | 206 | 67 | 141 | |||||||||
| Decrease (increase) in other receivables | (306 | ) | 6,376 | (13 | ) | |||||||
| Increase (decrease) in trade payables and accrued expenses | (536 | ) | 1,355 | (1,096 | ) | |||||||
| Increase (decrease) in other payables and deferred revenues | (161 | ) | 247 | (479 | ) | |||||||
| (1,008 | ) | 4,492 | (61 | ) | ||||||||
| Net cash provided by (used in) continuing operating activities | (12,154 | ) | 9,888 | (6,700 | ) | |||||||
| Net cash used in discontinued operating activities | - | (1,599 | ) | (195 | ) | |||||||
| Net cash provided by (used in) operating activities | (12,154 | ) | 8,289 | (6,895 | ) | |||||||
The accompanying notes are an integral part of the consolidated financial statements.
F - 57
U.S. dollars in thousands
Year ended December 31, | ||||||||||||
| 2015 | 2016 | 2017 | ||||||||||
Cash Flows from Operating Activities: | ||||||||||||
| Net loss | (22,088 | ) | (18,885 | ) | (22,149 | ) | ||||||
| Adjustments to reconcile net loss to net cash used in continuing operating activities: | ||||||||||||
| Adjustments to profit and loss items: | ||||||||||||
| Loss from discontinued operation | 417 | - | 7,616 | |||||||||
| Depreciation and amortization | 503 | 589 | 567 | |||||||||
| Share-based compensation | 2,659 | 3,171 | 1,363 | |||||||||
| Revaluation of liabilities in respect of IIA grants | (474 | ) | (1,298 | ) | 229 | |||||||
| Revaluation of contingent consideration for purchase of shares | (764 | ) | (1,621 | ) | 351 | |||||||
| Increase in severance pay liability, net | 90 | 125 | 111 | |||||||||
| Net financing income | (288 | ) | (414 | ) | (349 | ) | ||||||
| Un-realized foreign currency (gain) loss | 69 | (94 | ) | (185 | ) | |||||||
| 2,212 | 458 | 9,703 | ||||||||||
| Changes in asset and liability items: | ||||||||||||
| Decrease (increase) in trade receivables | (181 | ) | (107 | ) | 28 | |||||||
| Decrease (increase) in inventories | (273 | ) | 873 | (1,042 | ) | |||||||
| Decrease (increase) in other receivables and long term deposits | (556 | ) | 33 | (1,227 | ) | |||||||
| Increase (decrease) in trade payables and accrued expenses | 33 | 2,195 | (135 | ) | ||||||||
| Increase (decrease) in other payables and deferred revenues | 1,252 | (1,012 | ) | (70 | ) | |||||||
| 275 | 1,982 | (2,446 | ) | |||||||||
| Net cash used in continuing operating activities | (19,601 | ) | (16,445 | ) | (14,892 | ) | ||||||
| Net cash used in discontinued operating activities | - | - | (1,563 | ) | ||||||||
| Net cash used in operating activities | (19,601 | ) | (16,445 | ) | (16,455 | ) | ||||||
Year ended December 31, | ||||||||||||
| 2018 | 2019 | 2020 | ||||||||||
Cash Flows from Investing Activities: | ||||||||||||
| Purchase of property and equipment | (522 | ) | (792 | ) | (923 | ) | ||||||
| Purchase of intangible assets | (12 | ) | - | - | ||||||||
| Interest received | 106 | 184 | 274 | |||||||||
| Proceeds from (investments in) short term bank deposits, net | (16,612 | ) | (5,050 | ) | 18,034 | |||||||
| Net cash provided by (used in) continuing investing activities | (17,040 | ) | (5,658 | ) | 17,385 | |||||||
| Net cash used in discontinued investing activities | - | (1,239 | ) | - | ||||||||
| Net cash provided by (used in) investing activities | (17,040 | ) | (6,897 | ) | 17,385 | |||||||
Cash Flows from Financing Activities: | ||||||||||||
| Repayment of leases liabilities | - | (630 | ) | (508 | ) | |||||||
| Proceeds from exercise of options | (* | ) | - | - | ||||||||
| Proceeds from (repayment of) IIA grants, net | 46 | (376 | ) | (121 | ) | |||||||
| Net cash provided by (used in) continuing financing activities | 46 | (1,006 | ) | (629 | ) | |||||||
| Exchange rate differences on cash and cash equivalent balances | (205 | ) | 140 | 273 | ||||||||
| Increase (decrease) in cash and cash equivalents from continuing activities | (29,353 | ) | 3,364 | 10,329 | ||||||||
| Decrease in cash and cash equivalents from discontinued activities | - | (2,838 | ) | (195 | ) | |||||||
| Balance of cash and cash equivalents at the beginning of the year | 36,069 | 6,716 | 7,242 | |||||||||
| Balance of cash and cash equivalents at the end of the year | 6,716 | 7,242 | 17,376 | |||||||||
Supplement disclosure of Non-cash transactions: | ||||||||||||
| ROU asset, net recognized with corresponding lease liability | - | 209 | 261 | |||||||||
| Exercise of RSU’s | - | 97 | 147 | |||||||||
Year ended December 31, | ||||||||||||
| 2015 | 2016 | 2017 | ||||||||||
Cash Flows from Investing Activities: | ||||||||||||
| Purchase of property and equipment | (376 | ) | (671 | ) | (1,045 | ) | ||||||
| Purchase of intangible assets | (30 | ) | (30 | ) | (30 | ) | ||||||
| Interest received | 287 | 407 | 349 | |||||||||
| Proceeds from short term bank deposits, net | 36,165 | 2,110 | 1,163 | |||||||||
| Net cash provided by investing activities | 36,046 | 1,816 | 437 | |||||||||
Cash Flows from Financing Activities: | ||||||||||||
| Proceeds from exercise of options | 26 | 7 | 7 | |||||||||
| Proceeds from issuance of shares, net | - | - | 22,658 | |||||||||
| Proceeds from the IIA grants, net of re-payment | 752 | 900 | 330 | |||||||||
| Net cash provided by financing activities | 778 | 907 | 22,995 | |||||||||
| Exchange rate differences on cash and cash equivalent balances | (143 | ) | 86 | 226 | ||||||||
| Increase (decrease) in cash and cash equivalents from continuing activities | 17,080 | (13,636 | ) | 8,766 | ||||||||
| Decrease in cash and cash equivalents from discontinued activities | - | - | (1,563 | ) | ||||||||
| Balance of cash and cash equivalents at the beginning of the year | 25,422 | 42,502 | 28,866 | |||||||||
| Balance of cash and cash equivalents at the end of the year | 42,502 | 28,866 | 36,069 | |||||||||
The accompanying notes are an integral part of the consolidated financial statements.
F - 78
MEDIWOUND LTD. AND ITS SUBSIDIARIES
U.S. dollars in thousands (except of share and per share data)
| NOTE 1: | GENERAL |
| a. | General description of the Company and its operations: |
MediWound Ltd. which incorporated in Yavne, Israel (the "Company" or "MediWound"), is a fully integrated biopharmaceutical company develops, manufactures and commercializes novel, cost effective, bio- therapeutic solutions for tissue repair and regeneration. The Company’s strategy is centered around its validated proteolytic enzyme platform technology, focused on developing, manufacturingnext-generation bio-active therapies for burn and commercializing novelwound care and biological medicinal products to address unmet needs in the fields of severe burns, as well as chronic and other hard to heal wounds, connectivefor tissue disorders and other indications.repair.
The Company's first innovative biopharmaceutical product, NexoBrid, received marketing authorization from the European Medicines Agency ("EMA") andas well as the Israeli, Argentinean, South-Korean, Russian and Argentinean ministriesPeruvian Ministries of healthHealth, for removal of dead or damaged tissue, known as eschar, in adults with deep partial and full thickness thermal burns.
On June 29, 2020, the Company has submitted a Biologics License Application (BLA) to the U.S. Food and Drugs Administration (FDA) seeking the approval of NexoBrid in USA.
On 16 September, 2020, FDA provided the Company with notification of acceptance of the BLA for review and assigned a Prescription Drug User Fee Act (“PDUFA”) goal date of June 29, 2021.
The Company sells NexoBrid in Europe and in Israel through its commercial organization andorganizations while establishing additional local distribution channels to extend its outreach in the European Union. In other territories the company sells NexoBrid through local distributers.distribution channels. In 2019, the Company entered into exclusive license and supply agreements with Vericel Corporation (“Vericel”) to commercialize NexoBrid in North America.
The Company hassecond investigational innovative product, EscharEx, is a contract with the U.S. Biomedical Advanced Researchtopical biological drug being developed for debridement of chronic and Development Authority ("BARDA"), which was modified on July 2017,other hard-to-heal wounds.
The third innovative product candidate, MWPC005, is a topically applied biological drug candidate for the advancementtreatment of the development and manufacturing, as well as the procurement of NexoBrid, as a medical countermeasure as part of BARDA preparedness for mass casualty events (see also Note 15e).
non-melanoma skin cancers,| b. | The Company's securities are listed for trading on NASDAQ since March 2014. |
The Company has In addition, the Company owns approximately |
The |
F - 89
MEDIWOUND LTD. AND ITS SUBSIDIARIES
NOTES TO CONSOLIDATED FINANCIAL STATEMENTS
U.S. dollars in thousands (except of share and per share data)
| NOTE 1: | GENERAL (Cont.) |
| e. | The COVID-19 pandemic has developed rapidly in 2020, with a significant number of cases. Measures taken by various governments to contain the virus have affected economic activity.The Company addressed the challenges associated with the COVID-19 pandemic during the year ended 2020, while prioritizing the health and safety of its workforce and maintaining operational efficiency and flexibility.The Company continued its operations and had no impact on its revenues while achieving cost reduction in its Sales and marketing As well as general and administration expenditures. |
| NOTE 2:- | SIGNIFICANT ACCOUNTING POLICIES |
| a. | Basis of presentation of financial statements: |
These financial statements have been prepared in accordance with International Financial Reporting Standards ("IFRS") as issued by the International Accounting Standards Board ("IASB").
The Company's consolidated financial statements have been prepared on a cost basis, except for financial instruments which are measured at fair value through profit or loss.
| b. |
| Consolidated financial statements include the financial statements of companies that the Company controls (subsidiaries). Control is achieved when the Company is exposed, or has rights, to variable returns from its investment with the investee and has the ability to affect those returns through its power over the investee. |
The financial statements of the Company and its subsidiaries are prepared as of the same dates and periods. The consolidated financial statements are prepared using uniform accounting policies by all entities in the Group. Significant intercompany balances and transactions and gains or losses resulting from intercompany transactions are eliminated in full in the consolidated financial statements.
Functional currency, reporting currency and foreign currency: |
| 1. | Functional currency and reporting currency: |
The reporting currency of the financial statements is the U.S. dollar.
The Company determines the functional currency based on the currency in which it primarily generates and expends cash. The Company determined that its functional currency is the U.S. dollar since most of the Company's expenses are in U.S. dollars and the economic environment in which the Company operates in and performs its transactions is mostly affected by the U.S dollar. A certain portion of the Company's costs are denominated in NIS mainly due to payroll and related benefit costs incurred in Israel. To further support the Company's determination, the Company has analyzed the currency in which funds from financing activities are generated or held and the currency in which receipts from operating activities are usually retained. In this respect, funds from financing activities were principally derived from significant funds raised in U.S. dollars including the public offering completed in 2014, the follow-on offering completed in 2017 and U.S governmental funds.
The Company operates and plans its activities in U.S. dollars and accordingly its periodic budgets and internal management reports are prepared and monitored using the U.S. dollar as the primary currency and provides the basis for the determination of share-based compensation.
F - 910
MEDIWOUND LTD. AND ITS SUBSIDIARIES
NOTES TO CONSOLIDATED FINANCIAL STATEMENTS
U.S. dollars in thousands (except of share and per share data)
| NOTE 2:- | SIGNIFICANT ACCOUNTING POLICIES (Cont.) |
The functional currency of the Company's subsidiary in Germany has been determined to be its local currency - the EURO. Assets and liabilities of this subsidiary are translated at year end exchange rates and its statement of operations
items are translated using the actualaveregae exchange rates at the datesquarter of which those items are recognized. Such translation adjustments are recorded as a separate component of accumulated other comprehensive income (loss) in shareholders' equity.
| 2. | Transactions, assets and liabilities in foreign currency: |
Transactions denominated in foreign currency are recorded upon initial recognition at the exchange rate on the date of the transaction. After initial recognition, monetary assets and liabilities denominated in foreign currency are translated at the end of each reporting period into the functional currency at the exchange rate at that date. Exchange differences are recognized in profit or loss.
Cash equivalents: |
Cash equivalents are considered as highly liquid investments, including unrestricted short‑term bank deposits with an original maturity of three months or less from the date of deposit.
Short-term bank deposits: |
Short-term bank deposits have a maturity of more than three months, but less than one year, from the deposit date.
Inventories: |
Inventories are measured at the lower of cost and net realizable value. Net realizable value is the estimated selling price in the ordinary course of business less the estimated costs of completion and the estimated selling costs. The Company periodically evaluates the condition and age of inventories and makes provisions for slow moving inventories accordingly.
Cost of inventories is determined as follows:
| Raw materials | - | At cost of purchase using the first-in, first-out method. |
| Finished goods | - | On the basis of average standard costs (which approximates actual cost on a weighted average basis) including materials, labor and other direct and indirect manufacturing costs based on practical capacity. |
F - 1011
MEDIWOUND LTD. AND ITS SUBSIDIARIES
NOTES TO CONSOLIDATED FINANCIAL STATEMENTS
U.S. dollars in thousands (except of share and per share data)
| NOTE 2:- | SIGNIFICANT ACCOUNTING POLICIES (Cont.) |
Liability in respect of Israeli Innovation Authority ("IIA"): |
Government grants are recognized when there is reasonable assurance that the grants will be received and the Company will comply with the attendant conditions.
Research and development grants received from the Israeli Innovation Authority ("IIA"), formerly the Office of the Chief Scientist in Israel ("OCS"),IIA, are recognized upon receipt as a liability if future economic benefits are expected from the project that will result in royalty-bearing sales.revenues from sale of products and services. In that event, the royalty obligation is treated as a contingent liability in accordance with IAS 37, "Provisions, Contingent Liabilities and Contingent Assets" ("IAS 37").
A liability for the grant is first measured at fair value (Level 3 of the fair value hierarchy) using a discount rate that reflects a market interest rate. The difference between the amount of the grant received and the fair value of the liability is accounted for as a government grant and recognized as a deduction from research and development expenses. After initial recognition, the liability is measured at amortized cost using the effective interest method. Royalty payments are treated as a reduction of the liability.
At the end of each reporting period, the Company evaluates whether there is reasonable assurance that the liability recognized, in whole or in part, will not be repaid based on its best estimate of future sales and, if so, the appropriate amount of the liability is derecognized against a corresponding reduction in research and development expenses.
| h. | Leases: |
The Company accounts for funding research and development projects are recognized ata contract as a lease when the contract terms convey the right to control the use of an identified asset for a period of time in exchange for consideration.
For leases in which the Company is entitled to such grantsthe lessee, the Company recognizes on the basiscommencement date of the relatedlease a right-of-use (“ROU”) asset and a lease liability, excluding leases whose term is up to 12 months and leases for which the underlying asset is of low value. For these excluded leases, the Company has elected to recognize the lease payments as an expense in profit or loss on a straight-line basis over the lease term. In measuring the lease liability, the Company has elected to apply the practical expedient in the Standard and does not separate the lease components from the non-lease components (such as management and maintenance services, etc.) included in a single contract.
On the commencement date, the lease liability includes all unpaid lease payments discounted at the interest rate implicit in the lease, if that rate can be readily determined, or otherwise using the Company's incremental borrowing rate. After the commencement date, the Company measures the lease liability using the effective interest rate method.
F - 12
MEDIWOUND LTD. AND ITS SUBSIDIARIES
NOTES TO CONSOLIDATED FINANCIAL STATEMENTS
U.S. dollars in thousands (except of share and per share data)
| NOTE 2:- | SIGNIFICANT ACCOUNTING POLICIES (Cont.) |
On the commencement date, the ROU asset is recognized in an amount equal to the lease liability plus lease payments already made on or before the commencement date and initial direct costs incurredincurred. The ROU asset is measured applying the cost model and depreciated over the shorter of its useful life and the lease term.
Following are the amortization periods of the ROU assets by class of underlying asset:
| Years | ||||
| Motor vehicles | 3 | |||
| Buildings and equipment | 5-8 | |||
The Company tests for impairment of the ROU asset whenever there are indications of impairment pursuant to the provisions of IAS 36.
Variable lease payments that depend on an index:
On the commencement date, the Company uses the index rate prevailing on the commencement date to calculate the future lease payments.
For leases in which the Company is the lessee, the aggregate changes in future lease payments resulting from a change in the index are discounted (without a change in the discount rate applicable to the lease liability) and recorded as an adjustment of the lease liability and the ROU assets, only when there is a deductionchange in the cash flows resulting from research and development expenses.the change in the index (that is, when the adjustment to the lease payments takes effect).
Lease extension and termination options:
A non-cancelable lease term includes both the periods covered by an option to extend the lease when it is reasonably certain that the extension option will be exercised and the periods covered by a lease termination option when it is reasonably certain that the termination option will not be exercised.
In the event of any change in the expected exercise of the lease extension option or in the expected non-exercise of the lease termination option, the Company remeasures the lease liability based on the revised lease term using a revised discount rate as of the date of the change in expectations. The total change is recognized in the carrying amount of the ROU asset until it is reduced to zero, and any further reductions are recognized in profit or loss.
Lease modifications:
If a lease modification does not reduce the scope of the lease and does not result in a separate lease, the Company remeasures the lease liability based on the modified lease terms using a revised discount rate as of the modification date and records the change in the lease liability as an adjustment to the ROU asset.
F - 13
MEDIWOUND LTD. AND ITS SUBSIDIARIES
NOTES TO CONSOLIDATED FINANCIAL STATEMENTS
U.S. dollars in thousands (except of share and per share data)
| NOTE 2:- |
If a lease modification reduces the scope of the lease, the Company recognizes a gain or loss arising from the partial or full reduction of the carrying amount of the ROU asset and the lease liability. The Company subsequently remeasures the carrying amount of the lease liability according to the revised lease terms, at the revised discount rate as of the modification date and records the change in the lease liability as an adjustment to the ROU asset.
The accounting policy for leases applied until December 31, 2018, is as follows:
The criteria for classifying leases as finance or operating leases depend on the substance of the agreements and are made at the inception of the lease in accordance with the following principles as set out in IAS 17.
Operating leases:leases:
Leases in which substantially all the risks and rewards of ownership of the leased asset are not transferred to the CompanyGroup are classified as operating leases. Lease payments are recognized as an expense in profit or loss on a straight-line basis over the lease term.
| i. | Property, plant and equipment, net: |
Property, plant and equipment are measured at cost, including directly attributable costs, less accumulated depreciation, accumulated impairment losses and excluding day-to-dayday-to-day servicing expenses. Cost includes spare parts and auxiliary equipment that are used in connection with the plant and equipment.
Depreciation is calculated on a straight‑line basis over the useful life of the assets at annual rates as follows:
| % | ||||
| Office furniture | 6-15 | |||
| 15-33 | ||||
| Computers | 33 | |||
| Leasehold improvements | See below | |||
Leasehold improvements are depreciated on a straight‑line basis over the shorter of the lease term (including the renewal option held by the Company which is expected to be exercised) and the expected life of the improvement.
The useful life, depreciation method and residual value of an asset are reviewed at least each year-end and any changes are accounted for prospectively as a change in accounting estimate.
Intangible assets, net: |
Separately acquired intangible assets with finite useful life are measured on initial recognition at cost.
Intangible assets are amortized over their useful life using the straight‑line method beginning in the period in which the intangible assets generates net cash inflows to the Company. The useful life is over the length of the patent or knowledge life. The intangible assets are reviewed for impairment at each reporting date until they begin generating net cash inflows and subsequently whenever there is an indication that the asset may be impaired.
F - 14
MEDIWOUND LTD. AND ITS SUBSIDIARIES
NOTES TO CONSOLIDATED FINANCIAL STATEMENTS
U.S. dollars in thousands (except of share and per share data)
| NOTE 2:- | SIGNIFICANT ACCOUNTING POLICIES (Cont.) |
Revenues recognition: |
The revenue recognition is in accordance with IFRS 15, "Revenues from Contracts with Customers" ("the Standard").
Revenues recognition:
Revenues from contracts with customers is recognized when the control over the goods or services is transferred to the customer. The transaction price is the amount of the consideration that is expected to be received based on the contract terms, excluding amounts collected on behalf of third parties (such as taxes).
Revenues from the sale of products:
The Company currently generates revenues from direct and indirect sales of its innovative biopharmaceutical product, NexoBrid, to burn centers and hospital burn units in Europe, and Israel as well as toand local distributors in other countries. Revenues are recognized to the extent that it is probable that the economic benefits will flow to the Company and the revenues can be reliably measured, regardless of when the payment is being made. Revenues are measured at the fair value of the consideration received or receivable, taking into account contractually defined terms of payment and excluding taxes or duty and net of returns and allowances, trade discounts and volume rebates.international markets.
Revenues from the sale of products aregoods is recognized in profit or loss at the point in time when all the significant risks and rewards of ownershipcontrol of the products have passedgoods is transferred to the buyer and the seller no longer retains continuing managerial involvement. Thecustomer, generally upon delivery date of the productsgoods to the customer.
Revenues from development services:
Revenues from development services is usuallyrecognized over time, during the date of which ownership passes.
period the customer receives and consumes the benefits provided by the Company's performance. The Company charges its customers based on payment terms agreed upon inspecific agreements. When payments are made before or after the service is performed, the Company recognizes the resulting contract asset or liability.
F - 1215
MEDIWOUND LTD. AND ITS SUBSIDIARIES
NOTES TO CONSOLIDATED FINANCIAL STATEMENTS
U.S. dollars in thousands (except of share and per share data)
| NOTE 2:- | SIGNIFICANT ACCOUNTING POLICIES (Cont.) |
Revenues from distributors agreementslicense agreements:
The Company determine whether the license to the Intellectual Property ("IP") is right to use the IP, which comprised of multiple elements (including licensehas significant standalone functionality or a right to access, which does not have a stand alone value. The Company recognizes Revenues from licensing transactions at a point in time when the Company provides the customer a right to use the Company's intellectual property as it exists.
The Company recognizes Revenues from licensing transactions over time when the Company provides the customer a right to access the Company's intellectual property and exclusive distribution rights), provide for varying consideration terms, such as upfront payments and milestone payments, are recognized when the criteria for revenue recognition have been met and only to the extent of the consideration that is not contingent upon completion or performance of future services under the contract. The Company concluded that the components do not have "stand alone value" to the customer and accordingly they are accounted for as one unit of account. Consequently, revenues from these components are recognized on the straight line basis overthroughout the license period.
The Company accounts for multiple contracts as a single contract when all the contracts are signed at or near the same time with the same customer or with related parties of the customer, and when one of the following criteria is met:
The contracts are negotiated as a package with a single commercial objective. |
| - | The amount of consideration to be paid in one contract depends on the consideration or performance of another contract. |
| - | The goods or services that the Company will provide according to the contracts represent a single performance obligation for the Company. |
Variable consideration:
The Company determines the transaction price separately for each contract with a customer. When exercising this judgment, the Company evaluates the effect of each variable amount in the contract, taking into consideration discounts, penalties, variations, claims, non-cash consideration and the nature of multiple phases of the product lifecycle. In determining the effect of the variable consideration, the Company uses the "most likely amount" method described in the Standard. Pursuant to this method, the amount of the consideration is determined as the single most likely amount in the range of possible consideration amounts in the contract. According to the Standard, variable consideration is included in the transaction price only to the extent that it is highly probable that a significant reversal in the amount of Revenues recognized will not occur when the uncertainty associated with the variable consideration is subsequently resolved.
F - 16
MEDIWOUND LTD. AND ITS SUBSIDIARIES
NOTES TO CONSOLIDATED FINANCIAL STATEMENTS
U.S. dollars in thousands (except of share and per share data)
| NOTE 2:- | SIGNIFICANT ACCOUNTING POLICIES (Cont.) |
Allocating the transaction price:
For contracts that consist of more than one performance obligation, at contract inception the Company allocates the contract transaction price to each performance obligation identified in the contract on a relative stand-alone selling price basis. A performance obligation is a promise in a contract to transfer a distinct good or service to the customer. The stand-alone selling price is the price at which the Company would sell the promised goods or services separately to a customer. When the stand-alone selling price is not directly observable by reference to similar transactions with similar customers, the Company applies suitable methods for estimating the stand-alone selling price including: the adjusted market assessment approach, the expected cost plus a margin approach and the residual approach. The Company may also use a combination of these approaches to allocate the transaction price in the contract.
| l. | Research and development expenses: |
Research and development expenses are recognized in profit or loss when incurred. An intangible asset arising from a development project or from the development phase of an internal project is recognized if the Company can demonstrate the technical feasibility of completing the intangible asset so that it will be available for use or sale; the Company's intention to complete the intangible asset and use or sell it; the Company's ability to use or sell the intangible asset; how the intangible asset will generate future economic benefits; the availability of adequate technical, financial and other resources to complete the intangible asset; and the Company's ability to measure reliably the expenditure attributable to the intangible asset during its development. Since the Company's research and development projects are often subject to regulatory approval procedures and other uncertainties, the conditions for the capitalization of costs incurred before receipt of approvals are not normally satisfied and, therefore, research and development expenses are recognized in profit or loss when incurred.
| m. | Funding by BARDA: |
Non-royalty bearing funds from BARDA for funding research and development projects were recognized at the time the Company was entitled to such grants on the basis of the related costs incurred.
The participation by BARDA was classified as reimbursement (deduction) of research and development expenses. Starting May 2019, following entrance into the Vericel license and supply agreements, in which Vericel has assumed the effective control over the BARDA contracts, funding by BARDA was classified as Revenues from development services.
| n. | Impairment of non-financial assets: |
The Company evaluates the need to record an impairment of the carrying amount of non-financial assets whenever events or changes in circumstances indicate that the carrying amount is not recoverable. If the carrying amount of non‑financial assets exceeds their recoverable amount, the assets are reduced to their recoverable amount. The recoverable amount of an asset that does not generate independent cash flows is determined for the cash‑generating unit to which the asset belongs, and is calculated based on the projected cash flows that will be generated by the cash generating unit.
An impairment loss of an asset, is reversed only if there have been changes in the estimates used to determine the asset's recoverable amount since the last impairment loss was recognized. Reversal of an impairment loss, as above, may not increase the value above the lower of (i) the carrying amount that would have been determined (net of depreciation or amortization) had no impairment loss been recognized for the asset in prior years, and (ii) its recoverable amount.
F - 1317
MEDIWOUND LTD. AND ITS SUBSIDIARIES
NOTES TO CONSOLIDATED FINANCIAL STATEMENTS
U.S. dollars in thousands (except of share and per share data)
| NOTE 2:- | SIGNIFICANT ACCOUNTING POLICIES (Cont.) |
| o. | Financial instruments: |
The accounting policy for financial instruments in accordance with IFRS 9, "Financial Instruments" ("the Standard") applied commencing from January 1, 2018, is as follows:
| 1. | Financial assets: |
Financial assets within the scope of IAS 39, are initially recognizedmeasured upon initial recognition at fair value plus transaction costs that are directly attributable transaction costs,to the acquisition of the financial assets, except for financial assets measured at fair value through profit or loss in respect of which transaction costs are recorded in profit or loss.
The Company classifies and measures debt instruments in the financial statements based on the following criteria:
| - | The Company's business model for managing financial assets; and |
| - | The contractual cash flow terms of the financial asset. |
Debt instruments are measured at amortized cost when:
The Company's business model is to hold the financial assets in order to collect their contractual cash flows, and the contractual terms of the financial assets give rise on specified dates to cash flows that are solely payments of principal and interest on the principal amount outstanding. After initial recognition, the accounting treatmentinstruments in this category are measured according to their terms at amortized cost using the effective interest rate method, less any provision for impairment.
On the date of initial recognition, the Company may irrevocably designate a debt instrument as measured at fair value through profit or loss if doing so eliminates or significantly reduces a measurement or recognition inconsistency, such as when a related financial liability is also measured at fair value through profit or loss.
Impairment of financial assets is based on their classification as follows:assets:
The Company has receivables that areshort-term financial assets with fixed or determinable payments that are not quotedsuch as trade receivables in respect of which the Company applies a simplified approach and measures the loss allowance in an active market.amount equal to the lifetime expected credit losses.
F - 18
MEDIWOUND LTD. AND ITS SUBSIDIARIES
NOTES TO CONSOLIDATED FINANCIAL STATEMENTS
U.S. dollars in thousands (except of share and per share data)
| NOTE 2:- | SIGNIFICANT ACCOUNTING POLICIES (Cont.) |
An impairment loss on debt instruments measured at amortized cost is recognized in profit or loss with a corresponding loss allowance that is offset from the carrying amount of the financial asset.
| 2. | Financial liabilities: |
Financial |
Financial liabilities within the scope of IAS 39 are initially measuredrecognized at fair value.value less transaction costs that are directly attributable to the issue of the financial liability.
After initial recognition, the accounting treatment of financial liabilities is based on their classification as follows:
| b) | Financial liabilities measured at fair value through profit or loss: |
At initial recognition, the Company measures financial liabilities that are not measured at amortized cost at fair value. Transaction costs are recognized in profit or loss.
After initial recognition, changes in fair value are recognized in profit or loss.
| 3. | Fair value: |
Fair value is the price that would be received to sell an asset or paid to transfer a liability in an orderly transaction between market participants at the measurement date.
Fair value measurement is based on the assumption that the transaction will take place in the asset's or the liability's principal market, or in the absence of a principal market, in the most advantageous market.
The fair value of an asset or a liability is measured using the assumptions that market participants would use when pricing the asset or liability, assuming that market participants act in their economic best interest.
A fair value measurement of a non-financial asset takes into account a market participant's ability to generate economic benefits by using the asset in its highest and best use or by selling it to another market participant that would use the asset in its highest and best use.
The Company uses valuation techniques that are appropriate in the circumstances and for which sufficient data are available to measure fair value, maximizing the use of relevant observable inputs and minimizing the use of unobservable inputs.
F - 19
MEDIWOUND LTD. AND ITS SUBSIDIARIES
NOTES TO CONSOLIDATED FINANCIAL STATEMENTS
U.S. dollars in thousands (except of share and per share data)
| NOTE 2:- | SIGNIFICANT ACCOUNTING POLICIES (Cont.) |
4. Classification of financial instruments that are traded in an active market is determined by reference to market prices at the end of the reporting period. For financial instruments where there is no active market, fair value is determined using valuation techniques. Such techniques include using recent arm's length market transactions; reference to the current market value of another instrument which is substantially the same; discounted cash flow or other valuation models.hierarchy:
All assets and liabilities for which fair value is measured or disclosed in the financial statements are categorized within the fair value hierarchy, described as follows, based on the lowest level input that is significant to the fair value measurement as a whole: |
| Level 1 | - | quoted prices (unadjusted) in active markets for identical assets or liabilities. |
| Level 2 | - | inputs other than quoted prices included within level 1 that are observable either directly or indirectly. |
| Level 3 | - | inputs that are not based on observable market data (valuation techniques which use inputs that are not based on observable market data). |
| 5. | Offsetting financial instruments: |
Financial assets and financial liabilities are offset and the net amount is reported in the consolidated statement of financial position if there is a currently enforceable legal right to offset the recognised amounts and there is an intention to settle on a net basis, to realise the assets and settle the liabilities simultaneously.
| 6. | De-recognition of financial instruments: |
| a) | Financial assets: A financial asset is derecognized when the contractual rights to the cash flows from the financial asset expire or the Company has transferred its contractual rights to receive cash flows from the financial asset or assumes an obligation to pay the cash flows in full without material delay to a third party and has transferred substantially all the risks and rewards of the asset, or has neither transferred nor retained substantially all the risks and rewards of the asset, but has transferred control of the asset. |
| b) | Financial liabilities: A financial liability is derecognized when it is extinguished, that is when the obligation is discharged or cancelled or expires. A financial liability is extinguished when the debtor (the Company) discharges the liability by paying in cash, other financial assets, goods or services; or is legally released from the liability. |
| 7. | Contingent consideration for purchase of shares: The contingent consideration liability for purchase of shares is measured at fair value (Level 3 of the fair value hierarchy) and initially recorded against equity. Subsequent changes in the fair value are recognized in profit or loss. |
F - 1420
MEDIWOUND LTD. AND ITS SUBSIDIARIES
NOTES TO CONSOLIDATED FINANCIAL STATEMENTS
U.S. dollars in thousands (except of share and per share data)
| NOTE 2:- | SIGNIFICANT ACCOUNTING POLICIES (Cont.) |
| p. | Provisions: |
A provision in accordance with IAS 37 is recognized when the Company has a present (legal or constructive) obligation as a result of a past event, it is expected to require the use of economic resources to clear the obligation and a reliable estimate can be made of it.has been made.
| q. | Short-term employee benefits and severance pay liability, net: |
The Company has several employee benefit plans:
| 1. | Short-term employee benefits: |
Short-term employee benefits include salaries, paid annual leave, paid sick leave, recreation and social security contributions and are recognized as expenses as the services are rendered. A liability in respect of a cash bonus is recognized when the Company has a legal or constructive obligation to make such payment as a result of past service rendered by an employee and a reliable estimate of the amount can be made.
| 2. | Post-employment benefits: |
The Company has liabilities for severance pay for its employees in several of jurisdictions and in Israel.
Post-employment benefit plans in Israel are normally financed by contributions to insurance companies and classified as defined contribution plans or as defined benefit plans. The Company has defined contribution plans for Israeli employees pursuant to the Severance Pay Law into which the Company pays fixed contributions and has no legal or constructive obligation to pay further contributions on account of severance pay if the fund does not hold sufficient amounts to pay all employee benefits relating to employee service in current and prior periods.
The Company recognizes liability for severance pay due to its employees in EU in accordance with local laws.
| r. | Share-based compensation: Certain Company employees and directors are entitled to remuneration in the form of equity-settled share-based compensation. |
Equity-settled transactions
The cost of equity-settled transactions with employees is measured at the fair value of their equity instruments granted at grant date. The fair value is determined using the binomial option pricing model.
The cost of equity-settled transactions is recognized in profit or loss, together with a corresponding increase in equity, during the period which the performance or service conditions are to be satisfied, ending on the date on which the relevant employees become fully entitled to the award.
F - 21
MEDIWOUND LTD. AND ITS SUBSIDIARIES
NOTES TO CONSOLIDATED FINANCIAL STATEMENTS
U.S. dollars in thousands (except of share and per share data)
| NOTE 2:- | SIGNIFICANT ACCOUNTING POLICIES (Cont.) |
| s. | Discontinued operation: |
A discontinued operation is a component of the Company that either has been disposed of or is classified as held for sale. Disposal group to be abandoned meets the criteria for being a discontinued operation at the date of which it ceases to be used. The operating results relating to the discontinued operation are separately presented in the consolidated statements of comprehensive income.income or loss.
| t. | Profit / Loss per share: |
Furthermore, potential ordinary shares converted during the period are included in diluted loss per share only until the conversion date and from that date in basic loss per share.
Certain amounts previously reported in the consolidated financial statements have been reclassified to conform to current year presentation. Such reclassifications did not affect net loss, Changes in Stockholders' Equity or cash flows. |
| NOTE 3:- | SIGNIFICANT ACCOUNTING JUDGMENTS, ESTIMATES AND ASSUMPTIONS USED IN THE PREPARATION OF THE FINANCIAL STATEMENTS |
The preparation of the financial statements requires management to make estimates and assumptions that have an effect on the application of the accounting policies and on the reported amounts of assets, liabilities and expenses.
Discussed below are the key assumptions made in the financial statements concerning uncertainties at the end of the reporting period and the critical estimates computed by the Company that may result in a material adjustment to the carrying amounts of assets and liabilities within the next financial year.
Determining the fair value of share based compensation to employees and directors:
The fair value of share based compensation to employees and directors is determined using the binomial option pricing models.
The assumptions used in the models include the expected volatility, early exercise factor, expected dividend and risk-free interest rate.
Liabilities in respect to IIA grants:
Government grants received from the IIA are recognized as a liability if future economic benefits are expected from the research and development activity that will result in royalty‑bearing sales. As the contingent liability is calculated based on future royalty-bearingroyalty- bearing sales, there is uncertainty regarding the estimated future cash flows and the estimated discount rate used to measure the amortized cost of the liability.
| December 31, | ||||||||
| 2016 | 2017 | |||||||
| USD cash for immediate withdrawal | 25,863 | 26,700 | ||||||
| Non-USD cash for immediate withdrawal | 3,003 | 9,369 | ||||||
| 28,866 | 36,069 | |||||||
| December 31, | ||||||||
| 2016 | 2017 | |||||||
| USD bank deposits | 1,163 | - | ||||||
| 1,163 | - | |||||||
Year ended December 31, | ||||||||
| 2016 | 2017 | |||||||
| Raw materials | 296 | 339 | ||||||
| Finished goods | 548 | 1,547 | ||||||
| 844 | 1,886 | |||||||
Year ended December 31, | ||||||||
| 2016 | 2017 | |||||||
| Government authorities | 61 | 226 | ||||||
| BARDA funds | 953 | 2,175 | ||||||
| Prepaid expenses and other | 224 | 129 | ||||||
| Former shareholder, net (see Note 15d) | 1,169 | 666 | ||||||
| 2,407 | 3,196 | |||||||
Office furniture | Electronic machinery and laboratory equipment | Computers | Leasehold improvements | Total | ||||||||||||||||
| Cost | ||||||||||||||||||||
| Balance as of January 1, 2017 | 227 | 2,551 | 185 | 2,120 | 5,083 | |||||||||||||||
| Disposals | - | - | (74 | ) | - | (74 | ) | |||||||||||||
| Additions | 9 | 1,010 | 26 | - | 1,045 | |||||||||||||||
| Foreign currency translation | 12 | - | 2 | - | 14 | |||||||||||||||
| Balance as of December 31, 2017 | 248 | 3,561 | 139 | 2,120 | 6,068 | |||||||||||||||
| Accumulated Depreciation | ||||||||||||||||||||
| Balance as of January 1, 2017 | 126 | 1,508 | 118 | 2,057 | 3,809 | |||||||||||||||
| Disposals | - | - | (74 | ) | - | (74 | ) | |||||||||||||
| Additions | 20 | 294 | 47 | 38 | 399 | |||||||||||||||
| Foreign currency translation | 8 | - | 2 | - | 10 | |||||||||||||||
| Balance as of December 31, 2017 | 154 | 1,802 | 93 | 2,095 | 4,144 | |||||||||||||||
| Depreciated cost as of December 31, 2017 | 94 | 1,759 | 46 | 25 | 1,924 | |||||||||||||||
Office furniture | Electronic machinery and laboratory equipment | Computers | Leasehold improvements | Total | ||||||||||||||||
| Cost | ||||||||||||||||||||
| Balance as of January 1, 2016 | 221 | 1,955 | 174 | 2,095 | 4,445 | |||||||||||||||
| Disposals | - | - | (27 | ) | - | (27 | ) | |||||||||||||
| Additions | 12 | 596 | 38 | 25 | 671 | |||||||||||||||
| Foreign currency translation | (6 | ) | - | - | - | (6 | ) | |||||||||||||
| Balance as of December 31, 2016 | 227 | 2,551 | 185 | 2,120 | 5,083 | |||||||||||||||
| Accumulated Depreciation | ||||||||||||||||||||
| Balance as of January 1, 2016 | 102 | 1,205 | 86 | 2,012 | 3,405 | |||||||||||||||
| Disposals | - | - | (27 | ) | - | (27 | ) | |||||||||||||
| Additions | 27 | 303 | 59 | 47 | 436 | |||||||||||||||
| Foreign currency translation | (7 | ) | - | - | - | (7 | ) | |||||||||||||
| Balance as of December 31, 2016 | 122 | 1,508 | 118 | 2,059 | 3,807 | |||||||||||||||
| Depreciated cost as of December 31, 2016 | 105 | 1,043 | 67 | 61 | 1,276 | |||||||||||||||
F - 22
MEDIWOUND LTD. AND ITS SUBSIDIARIES
NOTES TO CONSOLIDATED FINANCIAL STATEMENTS
U.S. dollars in thousands (except of share and per share data)
| NOTE |
Year ended December 31, | ||||||||
| 2019 | 2020 | |||||||
| USD cash for immediate withdrawal | 5,766 | 13,067 | ||||||
| Non-USD cash for immediate withdrawal | 1,476 | 4,309 | ||||||
| 7,242 | 17,376 | |||||||
| NOTE 5:- | SHORT-TERM BANK DEPOSITS |
Year ended December 31, | ||||||||
| 2019 | 2020 | |||||||
| USD bank deposits (1) | 22,036 | 4,024 | ||||||
| Restricted bank deposits (2) | 180 | 184 | ||||||
| 22,216 | 4,208 | |||||||
Year ended December 31, | ||||||||
| 2016 | 2017 | |||||||
| Employees and payroll accruals | 1,566 | 1,621 | ||||||
| Current maturities of IIA grants | 49 | 57 | ||||||
| Related parties | 295 | 324 | ||||||
| Deferred revenues | 122 | 131 | ||||||
| Other | 28 | 49 | ||||||
| 2,060 | 2,182 | |||||||
| (1) | The USD deposits bear annual interest of 1.12% for the period of 282 days for 2020 and 2.48%-3.10% for the period of 357-368 days for 2019. |
| (2) | Restricted bank deposits which are primarily used as security for the Company’s office leases. |
| NOTE |
Year ended December 31, | ||||||||
| 2016 | 2017 | |||||||
| Balance as of January 1 | 7,303 | 6,888 | ||||||
| Grants received | 929 | 401 | ||||||
| Royalties | (46 | ) | (81 | ) | ||||
| Amounts carried to Profit or Loss | (1,298 | ) | 229 | |||||
| Balance as of Decmber 31 | 6,888 | 7,437 | ||||||
| Current maturities | (49 | ) | (57 | ) | ||||
| Long term liabilities in respect of IIA grants | 6,839 | 7,380 | ||||||
Year ended December 31, | ||||||||
| 2019 | 2020 | |||||||
| BARDA (see also Note 17a) | 3,267 | 2,189 | ||||||
| Others receivables | 840 | 578 | ||||||
| 4,107 | 2,767 | |||||||
F - 2423
MEDIWOUND LTD. AND ITS SUBSIDIARIES
NOTES TO CONSOLIDATED FINANCIAL STATEMENTS
U.S. dollars in thousands (except of share and per share data)
| NOTE 7:- | INVENTORIES |
Year ended December 31, | ||||||||
| 2019 | 2020 | |||||||
| Raw materials | 709 | 631 | ||||||
| Finished goods | 904 | 749 | ||||||
| 1,613 | 1,380 | |||||||
| NOTE 8:- | OTHER RECEIVABLES |
Year ended December 31, | ||||||||
| 2019 | 2020 | |||||||
| Government authorities | 228 | 73 | ||||||
| Prepaid expenses and other | 222 | 389 | ||||||
| 450 | 462 | |||||||
| NOTE 9:- | PROPERTY, PLANT AND EQUIPMENT, NET |
Balance as of December 31, 2020:
Office furniture | Manufacturing machinery and lab equipment | Computers | Leasehold improvements | Total | ||||||||||||||||
| Cost | ||||||||||||||||||||
| Balance as of January 1, 2020 | 301 | 4,534 | 124 | 2,315 | 7,274 | |||||||||||||||
| Disposals | - | - | (29 | ) | - | (29 | ) | |||||||||||||
| Additions | 20 | 241 | 73 | 445 | 779 | |||||||||||||||
Re-classified from RSU assets | - | - | - | 144 | 144 | |||||||||||||||
| Foreign currency translation | 11 | - | 1 | - | 12 | |||||||||||||||
| Balance as of December 31, 2020 | 332 | 4,775 | 169 | 2,904 | 8,180 | |||||||||||||||
| Accumulated Depreciation | ||||||||||||||||||||
| Balance as of January 1, 2020 | 175 | 2,606 | 60 | 2,129 | 4,970 | |||||||||||||||
| Disposals | - | - | (29 | ) | - | (29 | ) | |||||||||||||
| Additions | 18 | 486 | 44 | 49 | 597 | |||||||||||||||
| Foreign currency translation | 11 | - | 1 | - | 12 | |||||||||||||||
| Balance as of December 31, 2020 | 204 | 3,092 | 76 | 2,178 | 5,550 | |||||||||||||||
| Depreciated cost | ||||||||||||||||||||
| December 31, 2020 | 128 | 1,683 | 93 | 726 | 2,630 | |||||||||||||||
F - 24
MEDIWOUND LTD. AND ITS SUBSIDIARIES
NOTES TO CONSOLIDATED FINANCIAL STATEMENTS
U.S. dollars in thousands (except of share and per share data)
| NOTE 9:- | PROPERTY, PLANT AND EQUIPMENT, NET (Cont.) |
Balance as of December 31, 2019:
Office furniture | Manufacturing machinery and lab equipment | Computers | Leasehold improvements | Total | ||||||||||||||||
| Cost | ||||||||||||||||||||
| Balance as of January 1, 2019 | 243 | 4,054 | 102 | 2,123 | 6,522 | |||||||||||||||
| Disposals | - | - | (38 | ) | - | (38 | ) | |||||||||||||
| Additions | 60 | 480 | 60 | 192 | 792 | |||||||||||||||
| Foreign currency translation | (2 | ) | - | - | - | (2 | ) | |||||||||||||
| Balance as of December 31, 2019 | 301 | 4,534 | 124 | 2,315 | 7,274 | |||||||||||||||
| Accumulated Depreciation | ||||||||||||||||||||
| Balance as of January 1, 2019 | 161 | 2,153 | 70 | 2,118 | 4,502 | |||||||||||||||
| Disposals | - | - | (38 | ) | - | (38 | ) | |||||||||||||
| Additions | 17 | 453 | 28 | 11 | 509 | |||||||||||||||
| Foreign currency translation | (3 | ) | - | - | - | (3 | ) | |||||||||||||
| Balance as of December 31, 2019 | 175 | 2,606 | 60 | 2,129 | 4,970 | |||||||||||||||
| Depreciated cost | ||||||||||||||||||||
| December 31, 2019 | 126 | 1,928 | 64 | 186 | 2,304 | |||||||||||||||
| NOTE 10:- | LEASES |
| a. | Lease Agreements: The Company's offices and its production facility in Israel are located in a building that the Company leases from its Parent Company (see Note 24a), in accordance with a sub-lease agreement. The Company subleases approximately 3,000 square meters of laboratory, office and clean room space at a monthly rent fee of NIS 119 (approximately $37). This sub-lease agreement which was amended on January 1, 2019, expires in October 2022 and provides with 3 years extention period at the sole discretion of the Company which were included in the calculation of the lease liability and ROU asset. In addition the Company and its subsidiary have operating lease agreements for 14 vehicles for a period of three years. |
| b. | Lease extension and termination options: The Company has leases that include extension and termination options. These options provide flexibility in managing the leased assets and align with the Company's business needs. The Company exercises significant judgement in deciding whether it is reasonably certain that the extension and termination options will be exercised. |
F - 25
MEDIWOUND LTD. AND ITS SUBSIDIARIES
NOTES TO CONSOLIDATED FINANCIAL STATEMENTS
U.S. dollars in thousands (except of share and per share data)
| NOTE 10:- | LEASES (Cont.) In leases of motor vehicles, the Company does not include in the lease term the exercise of extension options since the Company does not ordinarily exercise options that extend the lease period beyond 3 years. |
| c. | Information on leases: |
Year ended December 31, | ||||||||
| 2019 | 2020 | |||||||
| Interest expense on lease liabilities | 139 | 144 | ||||||
| Expenses relating to short-term leases | 444 | 566 | ||||||
| Total cash outflow for leases (1) | 630 | 652 | ||||||
| (1) | As of the year ended December 31,2020 the cash flow for leases includes $144 which was classified under CAPEX as Leashold improvments. |
The Company was assisted by external third party valuation expert in determining the appropriate interest rate for discounting its leases based on: credit risk, the weighted average term of the leases and other economic variables. A weighted average incremental borrowing in a range of 0.1% to 6.7% was used to discount future lease payments in the calculation of the lease liability on the date of initial application of the Standard.
| c. | Disclosures in respect of RSU assets: |
Right-of-use assets
Balance as of December 31, 2020:
| Buildings | Motor vehicles | Total | ||||||||||
| Cost | ||||||||||||
| Balance as of January 1, 2020 | 2,362 | 442 | 2,804 | |||||||||
| New leases | - | 305 | 305 | |||||||||
| Adjustments for indexation | (17 | ) | (18 | ) | (35 | ) | ||||||
| Disposals | (76 | ) | (217 | ) | (293 | ) | ||||||
| Termination of leases | (44 | ) | - | (44 | ) | |||||||
| Balance as of December 31, 2020 | 2,225 | 512 | 2,737 | |||||||||
| Accumulated depreciation | ||||||||||||
| Balance as of January 1, 2020 | 381 | 194 | 575 | |||||||||
| Depreciation and amortization | 249 | 178 | 427 | |||||||||
| Re-classified to Leasehold improvements | 144 | - | 144 | |||||||||
| Disposals | (76 | ) | (217 | ) | (293 | ) | ||||||
| Balance as of December 31, 2020 | 698 | 155 | 853 | |||||||||
| Disposals | ||||||||||||
| Depreciated cost | ||||||||||||
| Balance as of December 31, 2020 | 1,527 | 357 | 1,884 | |||||||||
F - 26
MEDIWOUND LTD. AND ITS SUBSIDIARIES
NOTES TO CONSOLIDATED FINANCIAL STATEMENTS
U.S. dollars in thousands (except of share and per share data)
| NOTE 10:- | LEASES (Cont.) |
Balance as of December 31, 2019:
| Buildings | Motor vehicles | Total | ||||||||||
| Cost | ||||||||||||
| Balance as of January 1, 2019 | - | 46 | 46 | |||||||||
Cumulative effect adjustment on accumulated ROU assets as a result of adopting IFRS 16 | 2,335 | 187 | 2,522 | |||||||||
| New leases | - | 209 | 209 | |||||||||
| Adjustments for indexation | 27 | - | 27 | |||||||||
| Balance as of December 31, 2019 | 2,362 | 442 | 2,804 | |||||||||
| Accumulated depreciation | ||||||||||||
| Balance as of January 1, 2019 | - | - | - | |||||||||
| Depreciation and amortization | 381 | 194 | 575 | |||||||||
| Balance as of December 31, 2019 | 381 | 194 | 575 | |||||||||
| Depreciated cost | ||||||||||||
| Balance as of December 31, 2019 | 1,981 | 248 | 2,229 | |||||||||
The Company recognized depreciation expenses in the amount of $571 which comprise of $427 recorded in the profit and loss and $144 which was re-classified to Leasehold improvements as of 31 December 2020. |
| d. | Disclosures in respect of lease liabilities: |
Lease liabilities
Balance as of December 31, 2020:
| Buildings | Motor vehicles | Total | ||||||||||
| Balance as of January 1, 2020 | 2,225 | 225 | 2,450 | |||||||||
| Repayment of leases liabilities | (479 | ) | (173 | ) | (652 | ) | ||||||
| Effect of changes in exchange rates | 134 | 28 | 162 | |||||||||
| New finance lease obligation recognized | - | 283 | 283 | |||||||||
| Adjustments for indexation | (17 | ) | (18 | ) | (35 | ) | ||||||
| Interest | 134 | 10 | 144 | |||||||||
| Disposals-Termination of leases | (44 | ) | (1 | ) | (45 | ) | ||||||
| Balance as of December 31, 2020 | 1,953 | 354 | 2,307 | |||||||||
| Current maturities of long-term leases | (396 | ) | (170 | ) | (566 | ) | ||||||
| Lease liability Balance as of December 31, 2020 | 1,557 | 184 | 1,741 | |||||||||
F - 27
MEDIWOUND LTD. AND ITS SUBSIDIARIES
NOTES TO CONSOLIDATED FINANCIAL STATEMENTS
U.S. dollars in thousands (except of share and per share data)
| NOTE 10:- | LEASES (Cont.) |
Balance as of December 31, 2019:
| Buildings | Motor vehicles | Total | ||||||||||
| Balance as of January 1, 2019 | - | - | - | |||||||||
| Cumulative effect adjustment on accumulated liabilities as a result of adopting IFRS 16 | 2,344 | 178 | 2,522 | |||||||||
| Repayment of leases liabilities | (458 | ) | (172 | ) | (630 | ) | ||||||
| Effect of changes in exchange rates | 189 | 10 | 199 | |||||||||
| New finance lease obligation recognized | - | 193 | 193 | |||||||||
| Adjustments for indexation | 11 | 16 | 27 | |||||||||
| Interest | 139 | - | 139 | |||||||||
| Balance as of December 31, 2019 | 2,225 | 225 | 2,450 | |||||||||
| Current maturities of long-term leases | (403 | ) | (41 | ) | (444 | ) | ||||||
| Lease liability Balance as of December 31, 2019 | 1,822 | 184 | 2,006 | |||||||||
At the initial application date, the Company recognized a lease liability in the amount of about $2,522 under Long term debt and current maturity, according to the present value of the future lease payments discounted using the Company's incremental interest rate at that date, and concurrently recognized a ROU asset in the same amount with certain adjustments. The Company's incremental interest rates used for measuring the lease liability are in the range of 0.1% to 6.7%. Depreciation is calculated on a straight-line basis over the remaining contractual lease period. |
| NOTE 11:- | INTANGIBLE ASSETS, NET |
License and Knowhow | ||||||||
| 2019 | 2020 | |||||||
| Cost | ||||||||
| Balance as of January 1, | 1,538 | 1,538 | ||||||
| Additions | - | - | ||||||
| Balance as of December 31, | 1,538 | 1,538 | ||||||
| Accumulated Amortization | ||||||||
| Balance as of January 1, | 1,043 | 1,109 | ||||||
| Additions | 66 | 66 | ||||||
| Balance as of December 31, | 1,109 | 1,175 | ||||||
| Amortized cost | ||||||||
| Balance as of December 31, | 429 | 363 | ||||||
Intangible assets include exclusive licenses to use patents, know-how and intellectual property for the development, manufacturing and marketing of products related to burn treatments and other products in the field of wound care. These licenses were purchased from third parties and from one of the Company's shareholders. |
F - 28
MEDIWOUND LTD. AND ITS SUBSIDIARIES
NOTES TO CONSOLIDATED FINANCIAL STATEMENTS
U.S. dollars in thousands (except of share and per share data)
| NOTE 12:- | OTHER PAYABLES |
Year ended December 31, | ||||||||
| 2019 | 2020 | |||||||
| Employees and payroll accruals | 1,723 | 1,910 | ||||||
| Liability in respect of purchase of shares (see Note 16c) | 3,167 | 667 | ||||||
| Related parties | 214 | 225 | ||||||
| Deferred Revenues | 249 | 462 | ||||||
| Other | 384 | 260 | ||||||
| 5,737 | 3,524 | |||||||
| NOTE 13:- | LIABILITIES IN RESPECT OF IIA GRANTS |
Year ended December 31, | ||||||||
| 2019 | 2020 | |||||||
| Balance as of January 1, | 7,714 | 6,935 | ||||||
| Grants received | 248 | - | ||||||
| Royalties | (635 | ) | (235 | ) | ||||
| Amounts carried to Profit or Loss | (392 | ) | 828 | |||||
| Balance as of Decmber 31, | 6,935 | 7,528 | ||||||
| Current maturities | (124 | ) | (261 | ) | ||||
| Long term liabilities in respect of IIA grants | 6,811 | 7,267 | ||||||
The Company is committed to pay royalties to the IIA up to the total grants received plus the applicable accrued interest. The total amount of grants actually received by the Company from the IIA including accrued LIBOR interest, net of royalties as of December 31, 2020 is approximately $ 15,787, while the amortized cost of this liability as of that date is $ 7,528, using the interest method. |
| NOTE 14:- | FINANCIAL INSTRUMENTS |
| a. | Financial risk factors: |
The Company's activities expose it to various market risks (mainly foreign currency risk and interest rate risk). The Company's Board of Directors has provided guidelines for risk management and specific policies for various risk exposures.
Foreign currency risk
The Company operates primarily in an international environment and is exposed to foreign exchange risk resulting from the fact that a certain portion of the Company's costs are denominated in NIS and EURO, mainly due to payroll and related benefit costs incurred in Israel and in Europe, and additionally due to marketing expenses incurred in Europe.
F - 29
MEDIWOUND LTD. AND ITS SUBSIDIARIES
NOTES TO CONSOLIDATED FINANCIAL STATEMENTS
U.S. dollars in thousands (except of share and per share data)
| NOTE 14:- | FINANCIAL INSTRUMENTS (Cont.) |
Sensitivity tests relating to changes in market factors: |
The Company operates in an international environment and is exposed to foreign exchange risk resulting from the exposure to different currencies, mainly NIS and EURO. Foreign exchange risks arise from recognized assets and liabilities denominated in a foreign currency other than the functional currency.
| December 31, | ||||||||||||
| 2018 | 2019 | 2020 | ||||||||||
| Gain (loss) from change: | ||||||||||||
| 5% increase in exchange rate | $ | 31 | $ | 285 | $ | 76 | ||||||
| 5% decrease in exchange rate | $ | (31 | ) | $ | (285 | ) | $ | (76 | ) | |||
Sensitivity tests and principal work assumptions:
The selected changes in the relevant risk variables were determined based on management's estimate as to reasonable possible changes in these risk variables.
The Company has performed sensitivity tests of principal market risk factors that may affect its reported operating results or financial position.
The sensitivity tests present the profit or loss for the relevant risk variables chosen as of each reporting date.
| b. | Fair value: |
The carrying amount of cash and cash equivalents, short‑term bank deposits, trade and other receivables and trade and other payables approximates their fair value due to the short‑term maturities of such instruments.
The fair value of liabilities in respect to IIA grants with fixed interest is based on a calculation of the present value of the cash flows at the interest rate for a loan with similar terms. The Company used a discount rate of 12% based in part of the Company's estimation at the time of the Company's recognition of the IIA grants which approximates the fair value at the respective balance sheet date.
The fair value of the contingent consideration for purchase of shares is based on a calculation of the present value of future royalty payments using a discount rate that reflectspayments. The expected cash flows already reflect assumptions about the applicable market rate of interest atuncertainty in future defaults, and therefore the date of the initial recognition. The Company used a discount rate of 16% based14% that is commensurate with the risk inherent in part on the Company's estimation, at the time of the Company's initial recognition of the contingent consideration. The amount and timing of the future royalty payments are based on the Company's projected revenues.expected cash flows.
F - 2530
MEDIWOUND LTD. AND ITS SUBSIDIARIES
NOTES TO CONSOLIDATED FINANCIAL STATEMENTS
U.S. dollars in thousands (except of share and per share data)
| NOTE |
| December 31, | ||||||||||||
| 2015 | 2016 | 2017 | ||||||||||
| Sensitivity test to changes in NIS and EURO exchange rates | ||||||||||||
| Gain (loss) from change: | ||||||||||||
| 5% increase in exchange rate | $ | 361 | $ | 11 | $ | 346 | ||||||
| 5% decrease in exchange rate | $ | (361 | ) | $ | (11 | ) | $ | (346 | ) | |||
| SEVERANCE PAY LIABILTY, NET |
The Company has liabilities for severance pay for its employees in Israel and in several EU jurisdictions. The Company's liability for employee benefits is based on local laws, valid labor agreements, the employee's salary and the applicable terms of employment, which together generate a right to severance compensation. Post‑employment employee benefits are partially financed by deposits with defined contribution plans, as detailed below.
The Israeli Severance Pay Law, 1963 ("Severance Pay Law"), specifies that Israeli employees are entitled to severance payment, following the termination of their employment. Under the Severance Pay Law, the severance payment is calculated as one month salary for each year of employment, or a portion thereof. Under Section 14 of the Severance Pay Law ("Section 14"), employees are entitled to have monthly deposits, at a rate of 8.33% of their monthly salary, made on their behalf to their insurance funds.
Payments in accordance with Section 14 release the Company from the liability for any future severance payments in respect of those employees.
The majority of the Company's liability for severance pay is covered by Section 14. Acordingly, the Company does not recognize any liability for severance pay due to these employees and the deposits under Section 14 are not recorded as an asset in the Company's balance sheet. These contributions for compensation represent defined contribution plans. The Company recognizes liability for severance pay due to its employees in EU in accordance with local laws and its Israeli employees which are not under Section 14.
| NOTE | CONTINGENT LIABILITIES AND COMMITMENTS |
| a. | In 2000, the Company signed an exclusive license agreement (as amended in 2007) with a third party with regard to its patents and intellectual property. Pursuant to the agreement, the Company received an exclusive license to use the third party's patents and intellectual property, for the purpose of developing, manufacturing, marketing, and commercializing products for treatment of burns and other wounds. |
In consideration for this exclusive license, the Company paid an aggregate amount of $ 950 following the achievement of certain development milestones as set forth in the agreement. In addition, the Company undertook to pay royalties of 1.5% to 2.5% from future revenuesRevenues from sales of products which are based on this patent for a period ranging between 10 to 15 years from the first commercial delivery in a major country, and thereafter the Company will have a fully paid-up royalty-free license for these patents. In addition, royalties will be paid at the rate of 10% - 20% from sub-licensing of such patents.patents and for lump sum amounts paid to the company by a third party, the company will pay 2% of the proceeds up to $1,000 and 4% of the proceeds above this amount. Moreover, the Company agreed to pay a one-time lump-sum amount of $ 1,500 when the aggregate revenuesRevenues based on these patents reach $ 100,000. The amount of royalty payments for the years 2015, 20162018 and 20172019 amounted to $11, $57$ 72 and $48,$ 732, respectively.
| b. | Under the Research and Development Law, (the "R&D Law") the Company undertook to pay royalties of 3% on the |
F - 2731
MEDIWOUND LTD. AND ITS SUBSIDIARIES
NOTES TO CONSOLIDATED FINANCIAL STATEMENTS
U.S. dollars in thousands (except of share and per share data)
| NOTE | CONTINGENT LIABILITIES AND COMMITMENTS |
| c. | Beginning in 2007, the Company entered into a number of agreements with Teva Pharmaceutical Industries Limited (“Teva”) related to collaboration in the development, manufacturing and commercialization of solutions for the burn and chronic wound care markets. In consideration for these agreements, Teva made investments in the Company's ordinary shares and agreed to fund certain research and development expenses and manufacturing costs and perform all marketing activities for both NexoBrid, under the 2007 Teva Agreement, and the PolyHeal Product, under the 2010 PolyHeal Agreements (see also Note 21a). As of December 31, 2012, all of these agreements were terminated. |
On September 2, 2013, in accordance with the terms of the Teva Shareholders’ Rights Agreement, the Company exercised its rights to repurchase all of its shares held by Teva, and purchased 755,492 ordinary shares, in consideration for an obligation to pay Teva future royalty payments of 20% of the Company’s revenuesRevenues from the sale or license of NexoBrid up to a total amount of $30,600$ 30,600 and from the sale or license of the PolyHeal Product up to a total amount of $10,800.$ 10,800. The obligation to pay Teva future royalty payments no longer includes amounts from the sale or license of the PolyHeal Product since the license to the PolyHeal Product has expired.
In addition, the Company also agreed to indemnify, defend and hold harmless Teva and its directors, officers, agents and employees from and against claims relating to a certain milestone related to PolyHeal under an agreement associated with the Collaboration Agreements, up to an amount of $10,200, if a notice of such claim has been received by the Company prior to December 31, 2023.
In December 2020, Teva has agreed to a revised consideration that is payable to Teva, in which the company paid $1,000 in cash and became obligated to pay an amount of $2,000 over 2021-2023, in addition to a modified contingent consideration up to the amount of $7,200 in quarterly fixed payments starting 2021 subject to revenues generated from sales of NexoBrid. Total liabilities were initially account at their estimated fair value at the exercise date on September 2, 2013, using a discounted cash flow model based on sales projections. Subsequent changes in this liability arerecorded as of December 31, 2020 to be approximately $6,587, and financial income of $433 was recorded in profit or loss within financial income of financial expenses. Accordingly, the liability was remeasured to $ 14,533 and $14,381 as of December 31, 2016 and 2017, respectivaly, as a result of a revaluation in the amount of $ 1,621 and $ (351), respectively, Pwhich was recorded within financial income and financial expenses, respectively. As of December 31, 2017, the Company did not pay royalties to Teva and an accrued royalty payments resulting from actual sales are classified as former shareholder net (see also Note 8).
F - 2832
MEDIWOUND LTD. AND ITS SUBSIDIARIES
NOTES TO CONSOLIDATED FINANCIAL STATEMENTS
| 2018 | 522 | |||
| 2019 | 450 | |||
| 2020 | 296 | |||
| 2021 | 246 | |||
| 2022 | 205 | |||
| 1,719 |
U.S. dollars in thousands (except of share and per share data)
| NOTE | MATERIAL AGREEMENTS |
| a. | The Company has awarded a contract with BARDA which was modified in July 2017 and May 2019 providing supplemental funds and support. In addition, in March 2020 the company was awarded with $5,500 to support emergency readiness for NexoBrid deployment. The amended contract valued up to $159,000. The modified contract includes $82,000 of funding to support development activities to complete the FDA approval process for NexoBrid for use in thermal burn injuries and emergency readiness for NexoBrid deployment, as well as procurement of NexoBrid. |
On January 2020, BARDA initiated the procurement of NexoBrid for emergency stockpile as part of the HHS mission to build national preparedness for public health medical emergencies. The initial BARDA order is valued at $16,500, with the first delivery of NexoBrid which accepted in August 2020 followed by a second delivery in the forth quarter of 2020. Additional deliveries are expected to occur throughout 2021 on a quarterly basis.
The First BARDA Contract also includes options for BARDA (i) to further fund $10,000 in development activities for other potential NexoBrid indications, and (ii) to further fund $50,000 for additional procurement of NexoBrid.
In September 2018, the Company has awarded additional contract with BARDA to develop NexoBrid for the treatment of Sulfur Mustard injuries as a medical countermeasure as part of BARDA preparedness for mass casualty events.
The contract provides approximately $12,000 of funding to support research and development activities up to pivotal studies in animals under the FDA Animal Rule. The contract also contains options for additional funding of up to approximately $31,000 for additional development activities, animal pivotal studies, and the FDA Biologics License Application (BLA) submission for approval of NexoBrid for the treatment of Sulfur Mustard injuries.
The total potential value of funding commitments from BARDA under the two contracts is currently $202,000, in the aggregate.
As of December 31, 2020, the Company has recorded $63,183 in funding, in the aggregate, from BARDA under the two contracts as well as the procurement of NexoBrid as a medical countermeasure. The participation by BARDA comprises $31,955 which was classified as reimbursement of research and development expenses. Starting May 2019, following entrance into the Vericel license and supply agreements, participation by BARDA in the amount of $24,613 was classified as Revenues from development services, clinical supply in the amount of $596 was recorded as Revenues from sales of products as well as $6,036 of BARDA procurement which were recorded at the net amount of $3,825 following the split of gross profit agreement with Vericel for the initial BARDA procurement . |
| b. | On May 6, 2019, the Company entered into exclusive license and supply agreements with Vericel to commercialize NexoBrid in North America (the “Collaboration Agreements”). Pursuant to the Collaboration Agreements, Vericel will obtain the authority over and control of the development, regulatory approval and commercialization of licensed products in the North America territory. MediWound will be responsible for the development of the product through BLA approval, supported and funded by BARDA, as well as the manufacture and supply of NexoBrid. In addition, MediWound retains the commercial rights to NexoBrid in non-North American territory. |
F - 33
MEDIWOUND LTD. AND ITS SUBSIDIARIES
NOTES TO CONSOLIDATED FINANCIAL STATEMENTS
U.S. dollars in thousands (except of share and per share data)
| NOTE 17:- | MATERIAL AGREEMENTS (Cont.) |
Under the terms of the license agreement, Vericel has made an upfront payment to MediWound of $17,500 and agreed to make an additional $7,500 payment contingent upon BLA approval and up to $125,000 in payments contingent upon meeting certain annual sales milestones. Vericel has also agreed to pay MediWound tiered royalties on net sales ranging from high single-digit to teen-digit percentages, a split of gross profit on committed BARDA procurement orders and a teen-digits royalty on any additional future BARDA purchases of NexoBrid. Under the terms of the supply agreement, Vericel will procure NexoBrid from MediWound at a transfer price of cost plus a fixed margin percentage.
The Collaboration Agreements have multiple performance obligations, due to the contract covering multiple phases of the product lifecycle. Under the Vericel licnese and supply agreements, the Company identified three distinct performance obligations: (i) license rights (ii) development services for BLA approval and (iii) manufacturing and supply of NexoBrid.
The Company allocated the Collaboration Agreements transaction price to each performance obligation using the best estimate of the standalone selling price of each distinct good or service in the contract.
The Company determined the license to the Intellectual Property ("IP") to be a right to use the IP, which has significant standalone functionality. Since Vericel has sublicensing rights, effective control over the development strategy in the Territoty and also entitled to generate Revenues from BARDA procurement prior to BLA approval, the license is a distinct performance obligation and as such Revenues are recognized at the point in time that control of the license is transferred to the customer. Since the manufacturing and development services are at market value, then the upfront payment was fully attributed to the license performance obligation. Consequently, during the second quarter of 2019, the Company has recognized Revenues in the amount of $17,500.
Future milestone payments are considered variable consideration and are subject to the variable consideration constraint (i.e. will be recognized once concluded that it is “probable” that a significant reversal of the cumulative Revenues recognized under the contract will not occur in future periods when the uncertainty related to the variable considerations are resolved). Therefore, as the milestone payments are not probable, revenues were not recognized in respect to such milestone payments.
Sales related royalties to be received in exchange for license are recognized at the later of when (i) the subsequent sale occurs or (ii) the performance obligation to which some or all of the sales royalty has been allocated is satisfied (in whole or in part). As royalties are payable based on future commercial sales, as defined in the agreement, which did not occur as of the financial statements date, the Company did not recognize any Revenues from royalties.
Revenues from the sale of products to Vericel will be recognized when all the significant risks and rewards of ownership of the products have passed to the buyer and the seller no longer retains continuing managerial involvement. The delivery date of the products is usually the date of which ownership passes.
F - 34
MEDIWOUND LTD. AND ITS SUBSIDIARIES
NOTES TO CONSOLIDATED FINANCIAL STATEMENTS
U.S. dollars in thousands (except of share and per share data)
| NOTE 17:- | MATERIAL AGREEMENTS (Cont.) |
Under the Vericel license agreement, in which Vericel has consumed effective control over the BARDA contracts. As a result, participation from BARDA for funding research and development projects are now classified as Revenues from development services.
In Addition, the Revenues drerived by procurement from BARDA will be recognized on their net amount.
| NOTE 18:- | EQUITY |
| a. | Share |
| Year ended December 31, | ||||||||
| 2019 | 2020 | |||||||
| Authorized number of shares | 50,000,000 | 50,000,000 | ||||||
| Issued and outstanding number of shares | 27,202,795 | 27,236,752 | ||||||
| Year ended December 31, | ||||||||
| 2016 | 2017 | |||||||
| Authorized number of shares | 32,244,508 | 32,244,508 | ||||||
| Issued and outstanding number of shares | 21,930,449 | 27,047,737 | ||||||
| b. | Rights attached to shares: |
An ordinary share confers upon its holder(s) a right to vote at the general meeting, a right to participate in distribution of dividends, and a right to participate in the distribution of surplus assets upon liquidation of the Company.
| c. | In March 2014, the Company completed its IPO, and its securities are listed for trading on NASDAQ. |
| d. | Movement in |
During 2019, the authorized number of shares was increased by 12,755,492 shares which has a nominal value of $40.
On December 31, 2019, the company issued additional 23,956 ordinary shares upon vesting of outstanding RSU’s.
During 2020, the company issued additional 33,958 ordinary shares upon vesting of outstanding RSU’s.
F - 35
MEDIWOUND LTD. AND ITS SUBSIDIARIES
NOTES TO CONSOLIDATED FINANCIAL STATEMENTS
U.S. dollars in thousands (except of share and per share data)
| NOTE | SHARE‑BASED COMPENSATION |
| a. | Expense recognized in the financial statements: |
The expenses that was recognized for services received from employees and directors is as follows:
Year ended December 31, | Year ended December 31, | |||||||||||||||||||||||
| 2015 | 2016 | 2017 | 2018 | 2019 | 2020 | |||||||||||||||||||
| Cost of revenues | 372 | 504 | 188 | |||||||||||||||||||||
| Cost of Revenues | 71 | 226 | 115 | |||||||||||||||||||||
| Research and development | 511 | 752 | 488 | 181 | 375 | 179 | ||||||||||||||||||
| Selling and marketing | 669 | 765 | 204 | 63 | 40 | 3 | ||||||||||||||||||
| General and administrative | 1,107 | 1,150 | 483 | 330 | 593 | 1,025 | ||||||||||||||||||
| Total share-based compensation | 2,659 | 3,171 | 1,363 | 645 | 1,234 | 1,322 | ||||||||||||||||||
| b. | Share-based payment plan for employees and directors: |
The Company has reserved for issuance stock options aand restricted stock units ("RSUs") for total of 3,229,3863,672,399 ordinary shares.
As of December 31, 2017, 1,294,6512020, 316,621 ordinary shares of the Company were still available for future grant.
Any options or RSUs, which are forfeited or not exercised before expiration, become available for future grants.
Options granted under the Company's 2003 Israeli Share Option Plan ("Plan") are exercisable in accordance with the terms of the Plan, within 105-10 years from the date of grant, against payment of an exercise price.price or cashless exercise. The options generally vest over a period of three or four3-4 years.
In March 2014, the Company adopted and obtained shareholder approval for its 2014 Equity Incentive Plan (the “2014 Plan”).
Options and RSU's granted under the Company's 2014 Plan are exercisable in accordance with the terms of the Plan,Plan. Options are exercisable within 105-10 years from the date of grant, against payment of an exercise price or cashless exercise.exercise and share units are granted immediately upon vesting of the RSU's. The options and the RSU's generally vest over a period of three or four3-4 years.
F - 36
MEDIWOUND LTD. AND ITS SUBSIDIARIES
NOTES TO CONSOLIDATED FINANCIAL STATEMENTS
U.S. dollars in thousands (except of share and per share data)
| NOTE 19:- | SHARE‑BASED COMPENSATION (Cont.) |
| c. | Share options activity: |
The following table lists the number of share options, the weighted average exercise prices of share options and changes that were made in the option plan to employees and directors:directors
| 2015 | 2016 | 2017 | ||||||||||||||||||||||
Number of options | Weighted Average Exercise price | Number of options | Weighted Average Exercise price | Number of options | Weighted Average Exercise price | |||||||||||||||||||
| Outstanding at beginning of year | 1,902,324 | 7.98 | 2,313,224 | 9.35 | 2,181,075 | 9.62 | ||||||||||||||||||
| Granted | 739,500 | 9.27 | 47,500 | 8.56 | 40,000 | 6.72 | ||||||||||||||||||
| Exercised | (300,000 | ) | 0.09 | (80,149 | ) | 0.09 | (79,624 | ) | 0.09 | |||||||||||||||
| Forfeited | (28,600 | ) | 12.69 | (99,500 | ) | 10.80 | (206,716 | ) | 8.93 | |||||||||||||||
| Outstanding at end of year | 2,313,224 | 9.35 | 2,181,075 | 9.62 | 1,934,735 | 10.02 | ||||||||||||||||||
| Exercisable at end of year | 1,535,055 | 9.39 | 1,401,866 | 9.35 | 1,562,235 | 10.25 | ||||||||||||||||||
| 2018 | 2019 | 2020 | ||||||||||||||||||||||
Number of options | Weighted Average Exercise price | Number of options | Weighted Average Exercise price | Number of options | Weighted Average Exercise price | |||||||||||||||||||
| Outstanding Options at beginning of year | 1,934,735 | 10.02 | 2,313,249 | 9.31 | 2,334,432 | 9.18 | ||||||||||||||||||
| Option's Granted | 665,000 | 5.12 | 95,000 | 4.45 | 1,274,379 | 1.43 | ||||||||||||||||||
| Option's Exercised | (208,332 | ) | 2.63 | - | - | - | - | |||||||||||||||||
| Option's Forfeited and/or expired | (78,154 | ) | 9.06 | (73,817 | ) | 5.17 | (11,000 | ) | 7.19 | |||||||||||||||
| Outstanding options and at end of year | 2,313,249 | 9.31 | 2,334,432 | 9.18 | 3,597,811 | 6.55 | ||||||||||||||||||
| Option's Exercisable at end of year | 1,475,451 | 11.23 | 1,753,803 | 4.76 | 1,952,014 | 9.98 | ||||||||||||||||||
The following table summarizes information about share options outstanding as of December 31, 2017:
Options outstanding as of December 31, 2017 | ||||||||||||
| Range of exercise prices ($ ) | Number of options | Weighted Average Remaining contractual life | Weighted average exercise price | |||||||||
| 2.63 | 208,332 | 0.86 | 2.63 | |||||||||
| 7.26 ‑ 9.82 | 903,703 | 6.49 | 9.06 | |||||||||
| 12.89 ‑ 13.76 | 822,700 | 5.92 | 12.94 | |||||||||
| Total | 1,934,735 | 5.64 | 10.02 | |||||||||
Options and outstanding as of December 31, 2020 | ||||||||||||
| Range of exercise prices | Number of options | Weighted Average Remaining contractual life | Weighted average exercise price | |||||||||
1.75-5.15 | 1,988,129 | 6.67 | 2.93 | |||||||||
| 6.72- 9.82 | 790,782 | 3.86 | 9.05 | |||||||||
| 12.89 ‑ 13.76 | 818,900 | 2.92 | 12.94 | |||||||||
| Total | 3,597,811 | 5.20 | 6.55 | |||||||||
The following table summarizes information about RSU's outstanding as of December 31, 2020:
RSU's 2018 | RSU's 2019 | RSU's 2020 | ||||||||||
| Outstanding at beginning of year | - | 95,833 | 108,544 | |||||||||
| Granted | 95,833 | 36,667 | - | |||||||||
| Forfeited | - | - | - | |||||||||
| Vested | - | (23,956 | ) | (33,958 | ) | |||||||
| Outstanding at the end of the period | 95,833 | 108,544 | 74,587 | |||||||||
The fair value of the options and RSU's granted to employees and directors at the grant date for the years ends December 31, 2015, 20162018, 2019 and 20172020 was $4,336, $193$1,824 ,$441 and $172,$1,819 respectively.
The options and RSU’s of the Company are managed by a trustee.
F - 37
MEDIWOUND LTD. AND ITS SUBSIDIARIES
NOTES TO CONSOLIDATED FINANCIAL STATEMENTS
U.S. dollars in thousands (except of share and per share data)
| NOTE 19:- | SHARE‑BASED COMPENSATION (Cont.) |
| 1. | On |
| $76. On June |
| 2. | On December 31, 2018, the Company's Board of Directors approved the grant of 625,000 options to purchase ordinary shares, for an exercise price of $ 5.15 per share, and the grant of 95,833 RSU's to its employees. The fair value of the options and RSU's granted, as of the grant date, was estimated at approximately $1,261 and $389, respectivaly. |
| 3. | On March 24, 2019, the Company granted to its incoming CEO and chairman of the board 60,000 options (40,000 and 20,000 respectively) to purchase ordinary shares, for an exercise price of $ 4.92 per share, and 30,000 RSU's (20,000 and 10,000 respectively), under the "2014 Share Incentive Plan". The options are exercisable in accordance with the terms of the plan and will vest over three-four years. The fair value of the options and RSU's granted, as of the grant date, was estimated at approximately $164 and $158, respectively. On May 2, 2019, the general meeting of the Company approved the abovementioned grants. |
| 4. | On June 6, 2019, the Company granted to its incoming CFO 40,000 options to purchase ordinary shares, for an exercise price of $ 3.84 per share, and 6,667 RSU's, under the "2014 Share Incentive Plan". The options are exercisable in accordance with the terms of the plan and will vest over four years. The fair value of the options and RSU's granted, as of the grant date, was estimated at approximately $93 and $26, respectively. |
| 5. | On April 23, 2020, the Company's Board of Directors approved the grant of 1,274,379 options to purchase ordinary shares under the |
| d. | The fair value of the Company's share options granted to employees and directors for the years ended December 31, |
| December 31, | ||||||||||||
| 2018 | 2019 | 2020 | ||||||||||
| Dividend yield (%) | 0 | 0 | 0 | |||||||||
| Expected volatility of the share prices (%) | 44-54 | 41-53 | 51-71 | |||||||||
| Risk‑free interest rate (%) | 1.63-2.69 | 1.85-2.45 | 0.2-0.9 | |||||||||
| Early exercise factor (%) | 100-150 | 150 | 100-150 | |||||||||
| Weighted average share prices (Dollar) | 4.07 | 4.83 | 2.43 | |||||||||
F - 38
MEDIWOUND LTD. AND ITS SUBSIDIARIES
| December 31, | ||||||||||||
| 2015 | 2016 | 2017 | ||||||||||
| Dividend yield (%) | 0 | 0 | 0 | |||||||||
| Expected volatility of the share prices (%) | 71 | 72 | 63 | |||||||||
| Risk‑free interest rate (%) | 0.25-2.24 | 0.28-2.0 | 1.22-2.15 | |||||||||
| Early exercise factor (%) | 100-150 | 100-150 | 150 | |||||||||
| Weighted average share prices (Dollar) | 8.98 | 8.56 | 7.80 | |||||||||
NOTES TO CONSOLIDATED FINANCIAL STATEMENTS
U.S. dollars in thousands (except of share and per share data)
| NOTE | TAXES ON INCOME |
| a. | The Company operates in two main tax jurisdictions: Israel and Germany. As such, the Company is subject to the applicable tax rates in the jurisdictions in which it conducts its business. |
| b. | Corporate tax rates in Israel: |
The Israeli corporate income tax rate was 23% in 2020, 2019 and 2018.
In December 2016, the Israeli Parliament approved the Economic Efficiency Law 2017 (Legislative Amendments for Applying the Economic Policy for the 2017 and 2018 Budget Years), which reduces the corporate income tax rate to 24% (instead of 25%) effective from January 1, 2017 and to 23% effective from January 1, 2018.
Tax benefits under the Israel Law for the Encouragement of Capital Investments, 1959 (the "Investment Law"):
Under the Investment Law, the Company has been granted "Beneficiary Enterprise" status which provides certain benefits, including tax exemptions and reduced tax rates. Income not eligible for Beneficiary Enterprise benefits is taxed at a regular rate.
During the benefit period, the Company will be tax exempt in the first two years of the benefit period and subject to tax at the reduced rate of 10%- 25% for an additional period of five to eight years (depending on the percentage of foreign investments in the Company) of the benefit period. The benefit entitlement period starts from the first year that the Beneficiary Enterprise first earned taxable income, and is limited to 12 years from the year in which the Company requested to have tax benefits apply. In the event of distribution of dividends from the said tax exempt income, the amount distributed will be subject to corporate tax at the reduced rate ordinarily applicable to the Beneficiary Enterprise's income.
Tax exempt income generated under the Company's "Beneficiary Enterprise" program will be subject to taxes upon dividend distribution or complete liquidation. The entitlement to the above benefits is conditional upon the Company's fulfilling the conditions stipulated by the Investment Law and regulations published thereunder. Should the Company fail to meet such requirements in the future, income attributable to its Beneficiary Enterprise programs could be subject to the statutory Israeli corporate tax rate and the Company could be required to refund a portion of the tax benefits already received, with respect to such programs.
| c. | The principal tax rates applicable to the subsidiary whose place of incorporation is outside Israel are: The statutory corporate tax rate in |
| d. | Final tax assessments: The Company has finalized its tax assessments through the 2014 tax year. |
F - 39
MEDIWOUND LTD. AND ITS SUBSIDIARIES
NOTES TO CONSOLIDATED FINANCIAL STATEMENTS
U.S. dollars in thousands (except of share and per share data)
| NOTE 20:- | TAXES ON INCOME (Cont.) |
The statutory corporate tax rate in Germany was 30.53% in 2017, 29.72% in 2016 and 30% in 2015.
| e. | Net operating carryforward losses for tax purposes and other temporary differences: |
As of December 31, 2017,2020, the Company had carryforward losses and other temporary differences mainly from R&D expenses together amounting to approximately $115,000.
| f. | Deferred taxes: |
The Company did not recognize deferred tax assets for carryforward losses and other temporary differences at the amount of approximately $6,700 because their utilization in the foreseeable future is not probable.
| g. | Current taxes on income: |
The Company did not record any current taxes for the years ended December 31, 2015, 20162018, 2019 and 20172020 as a result of its carryforward losses.
| h. | Theoretical tax: |
The reconciliation between the |
F - 3440
MEDIWOUND LTD. AND ITS SUBSIDIARIES
NOTES TO CONSOLIDATED FINANCIAL STATEMENTS
U.S. dollars in thousands (except of share and per share data)
| NOTE | DISCONTINUED OPERATION |
On September 15, 2014, a Statement of Claim was filed against the Company by some shareholders of Polyheal and on November 12, 2017, the Tel Aviv District Court issued its ruling. On December 27, 2017(the "Plaintiffs") related to '2010 PolyHeal Agreement' in which PolyHeal granted the Company filed an appealexclusive global license to manufacture, develop and a hearing will be held on January 2019 (see also Note 15f).commercialize all the Polyheal Products in consideration for royalty payments.
During December 2017, following the TelAviv District Court Ruling, the Company paid the Plaintiffs approximately $1,497 in consideration for PolyHeal's shares. Since the Company believes that the carrying amount of its royalty rights arising from the Company's ownership of shares of Polyheal would not be recoverable,and recorded a full impairmentprovision of these royalty rights is included within the loss from discontinued operation for the year ended December 31, 2017. In addition, the Company born legal expenses totaled $116.
On March 24, 2019, the Company entered into a settlement agreement and mutual general release with the Plaintiffs (the "Polyheal Settlement Agreement"). Pursuant to the terms of Polyheal Settlement Agreement, the Plaintiffs repaid to MediWound a portion of the amount that was ruled in their favor under the Tel Aviv District Court Ruling, and it resulted in the acceptance of the Company’s appeal that was filed on December, 2017, and the cancellation of the 2017 Ruling that was issued by the District Court against MediWound.
In September 2019, the Company entered a new series of settlement agreements (the "New PolyHeal Settlement Agreements") with the majority of the shareholders of Polyheal, including Clal Biotechnology Industries Ltd., its controlling shareholder. Pursuant to the terms of New PolyHeal Settlement Agreements, the company paid an aggregate amount of approximately $2,800 and received 14,473 shares of PolyHeal, which was classified as royalty rights arising from the Company’s ownership of shares of Polyheal.
As a result of the New PolyHeal Settlement Agreements, the Company recognized one-time profit from discontinued operation of $2,889, following the decrease of the provision which was offset by an impairment of the royalty rights and settlement fees. As of December 31, 2019, the provision for liability in respect of discontinued operation, which was classifief as short term other payables, was $275.
In 2020 the Company finalized PolyHeal Settlement Agreements and paid $195 for 1,558 shares of PolyHeal. As of December 31, 2020, the provision for liability in respect of discontinued operation, was fully offset.
F - 3541
MEDIWOUND LTD. AND ITS SUBSIDIARIES
NOTES TO CONSOLIDATED FINANCIAL STATEMENTS
Year ended December 31, | ||||||||||||
| 2015 | 2016 | 2017 | ||||||||||
| Salary and benefits (including share-based compensation) | 1,961 | 2,112 | 2,073 | |||||||||
| Subcontractors | 67 | 66 | 121 | |||||||||
| Depreciation and amortization | 417 | 475 | 457 | |||||||||
| Cost of materials | 486 | 410 | 535 | |||||||||
| Other manufacturing expenses | 657 | 892 | 989 | |||||||||
| Decrease (increase) in inventory of finished products | (309 | ) | 780 | (999 | ) | |||||||
| Allotment of manufacturing costs to R&D | (760 | ) | (2,577 | ) | (1,598 | ) | ||||||
| 2,519 | 2,158 | 1,578 | ||||||||||
Year ended December 31, | ||||||||||||
| 2015 | 2016 | 2017 | ||||||||||
| Salary and benefits (including share-based compensation) | 2,610 | 3,171 | 3,840 | |||||||||
| Subcontractors | 4,464 | 8,517 | 8,780 | |||||||||
| Depreciation and amortization | 5 | 28 | 42 | |||||||||
| Cost of materials | 81 | 351 | 223 | |||||||||
| Allotment of manufacturing costs | 760 | 2,577 | 1,598 | |||||||||
| Other research and development expenses | 219 | 135 | 142 | |||||||||
| Research and development, gross | 8,139 | 14,779 | 14,625 | |||||||||
| Participations: | ||||||||||||
| BARDA funds | (800 | ) | (5,566 | ) | (8,565 | ) | ||||||
| Revaluation of liabilities in respect of IIA grants | (1,318 | ) | (2,145 | ) | (598 | ) | ||||||
| 6,021 | 7,068 | 5,462 | ||||||||||
U.S. dollars in thousands (except of share and per share data)
| NOTE | SUPPLEMENTARY INFORMATION TO THE STATEMENTS OF COMPREHENSIVE |
Year ended December 31, | ||||||||||||
| 2015 | 2016 | 2017 | ||||||||||
| Salary and benefits (including share based compensation) | 5,631 | 5,438 | 3,062 | |||||||||
| Marketing and medical support | 2,835 | 2,444 | 1,628 | |||||||||
| Depreciation and amortization | 22 | 18 | 12 | |||||||||
| Shipping and delivery | 180 | 111 | 236 | |||||||||
| Registration and marketing license fees | 616 | 392 | 424 | |||||||||
| 9,284 | 8,403 | 5,362 | ||||||||||
Additional information on Revenues: |
Major customers:
Year ended December 31, | ||||||||||||
| 2015 | 2016 | 2017 | ||||||||||
| Salary and benefits (including share‑based compensation) | 2,670 | 2,361 | 2,032 | |||||||||
| Professional fees | 1,054 | 1,241 | 1,224 | |||||||||
| Depreciation and amortization | 59 | 66 | 56 | |||||||||
| Other | 221 | 416 | 469 | |||||||||
| 4,004 | 4,084 | 3,781 | ||||||||||
BARDA and No other customer contributed 10% or more of our Revenues in 2020 and 2019. |
Revenue Re-classification:
Year ended December 31, | ||||||||||||
| 2015 | 2016 | 2017 | ||||||||||
| Financial income: | ||||||||||||
| Interest income | 288 | 414 | 349 | |||||||||
| Revaluation of contingent consideration for the purchase of shares | 764 | 1,621 | - | |||||||||
| Exchange differences, net | - | 131 | 57 | |||||||||
| 1,052 | 2,166 | 406 | ||||||||||
| Financial expense: | ||||||||||||
| Interest in respect of IIA grants | 844 | 847 | 827 | |||||||||
| Revaluation of contingent consideration for the purchase of shares | - | - | 351 | |||||||||
| Exchange differences, net | 614 | - | - | |||||||||
| Other | 38 | 49 | 74 | |||||||||
| 1,496 | 896 | 1,252 | ||||||||||
Revenues from distributions agreements which recognized as right to access and does not have a stand alone value were classified as revenues from sale of products in the year ended 31, December 2018, 2019 in the amount of $176, $218 respectively.
Geographic information:
The Revenues reported in the financial statements are based on the location of the customers, as follows: |
| Year ended December 31, | ||||||||||||
| 2018 | 2019 | 2020 | ||||||||||
| USA ( see also Note 17a, 17b) | - | 28,504 | 18,030 | |||||||||
| EU and other international markets | 3,401 | 3,285 | 3,733 | |||||||||
| 3,401 | 31,789 | 21,763 | ||||||||||
| b. | Cost of Revenues: |
| 1. | Cost of Revenues from sale of products |
Year ended December 31, | ||||||||||||
| 2018 | 2019 | 2020 | ||||||||||
| Salary and benefits (including share-based compensation) | 2,212 | 1,916 | 2,139 | |||||||||
| Subcontractors | 72 | 89 | 153 | |||||||||
| Depreciation and amortization | 474 | 512 | 554 | |||||||||
| Cost of materials | 468 | 456 | 704 | |||||||||
| Other manufacturing expenses | 783 | 657 | 840 | |||||||||
| Decrease in inventory of finished products | 299 | 344 | 155 | |||||||||
| Allotment of manufacturing costs to R&D | (2,220 | ) | (1,621 | ) | (1,394 | ) | ||||||
| 2,088 | 2,353 | 3,151 | ||||||||||
| 2. | Cost of Revenues from development services |
Year ended December 31, | ||||||||||||
| 2018 | 2019 | 2020 | ||||||||||
| Salary and benefits | - | 1,404 | 2,320 | |||||||||
| Subcontractors | - | 7,412 | 8,747 | |||||||||
| - | 8,816 | 11,067 | ||||||||||
F - 3742
MEDIWOUND LTD. AND ITS SUBSIDIARIES
NOTES TO CONSOLIDATED FINANCIAL STATEMENTS
U.S. dollars in thousands (except of share and per share data)
| NOTE | SUPPLEMENTARY INFORMATION TO THE STATEMENTS OF COMPREHENSIVE PROFIT OR LOST (Cont.) |
| 3. | Cost of Revenues from license agreements |
Year ended December 31, | ||||||||||||
| 2018 | 2019 | 2020 | ||||||||||
| Royalties payments | - | 680 | - | |||||||||
| - | 680 | - | ||||||||||
| c. | Research and development expenses, net of participations: |
Year ended December 31, | ||||||||||||
| 2018 | 2019 | 2020 | ||||||||||
| Salary and benefits (including share-based compensation) | 3,703 | 2,965 | 2,094 | |||||||||
| Subcontractors | 11,423 | 4,694 | 3,173 | |||||||||
| Depreciation and amortization | 51 | 342 | 346 | |||||||||
| Cost of materials | 309 | 311 | 517 | |||||||||
| Allotment of manufacturing costs | 2,220 | 1,621 | 1,394 | |||||||||
| Other research and development expenses | 209 | 137 | 174 | |||||||||
| Research and development, gross | 17,915 | 10,070 | 7,698 | |||||||||
| Participations: | ||||||||||||
| BARDA funds | (13,238 | ) | (3,785 | ) | - | |||||||
| Revaluation of liabilities in respect of IIA grants | (605 | ) | (1,316 | ) | - | |||||||
| 4,072 | 4,969 | 7,698 | ||||||||||
d. Selling and marketing expenses:
Year ended December 31, | ||||||||||||
| 2018 | 2019 | 2020 | ||||||||||
| Salary and benefits (including share based compensation) (1) | 2,343 | 2,028 | 1,700 | |||||||||
| Marketing and medical support | 1,055 | 1,298 | 740 | |||||||||
| Depreciation and amortization | 9 | 49 | 82 | |||||||||
| Shipping and delivery | 192 | 200 | 282 | |||||||||
| Registration and marketing license fees | 589 | 489 | 424 | |||||||||
| 4,188 | 4,064 | 3,228 | ||||||||||
| (1) | The salary costs for the year ended December 31,2020 Includes one time payment of $243 derived from restructuring astrategy at the EU subsidery. |
F - 43
MEDIWOUND LTD. AND ITS SUBSIDIARIES
NOTES TO CONSOLIDATED FINANCIAL STATEMENTS
U.S. dollars in thousands (except of share and per share data)
| NOTE 22:- | SUPPLEMENTARY INFORMATION TO THE STATEMENTS OF COMPREHENSIVE PROFIT OR LOST (Cont.) |
| e. | General and administrative expenses: |
Year ended December 31, | ||||||||||||
| 2018 | 2019 | 2020 | ||||||||||
| Salary and benefits (including share‑based compensation) | 2,035 | 2,621 | 2,784 | |||||||||
| Professional fees | 1,361 | 1,628 | 2,267 | |||||||||
| Depreciation and amortization | 43 | 247 | 108 | |||||||||
| Other | 360 | 746 | 300 | |||||||||
| 3,799 | 5,242 | 5,459 | ||||||||||
| f. | Other expenses: The other one-time expenses amounted $751 and $1,172 for the years ended December 31, 2018 and 2019 respectivally, are associated with the review and assessment of the strategic deal. |
| g. | Financial income and expense: |
Year ended December 31, | ||||||||||||
| 2018 | 2019 | 2020 | ||||||||||
| Financial income: | ||||||||||||
| Interest income | 412 | 434 | 297 | |||||||||
| Revaluation of liabilities in respect of the purchase of shares | - | - | 433 | |||||||||
| Exchange differences, net | - | 122 | 113 | |||||||||
| 412 | 556 | 843 | ||||||||||
| Financial expense: | ||||||||||||
| Interest in respect of IIA grants | 892 | 925 | 832 | |||||||||
| Revaluation of liabilities in respect of IFRS16 | - | 140 | 144 | |||||||||
| Revaluation of liabilities in respect of the purchase of shares | 758 | 1,690 | - | |||||||||
| Exchange differences, net | 219 | - | - | |||||||||
| Finance expenses in respect of deferred Revenues | 164 | 161 | 247 | |||||||||
| Other | 84 | 67 | 56 | |||||||||
| 2,117 | 2,983 | 1,279 | ||||||||||
F - 44
MEDIWOUND LTD. AND ITS SUBSIDIARIES
NOTES TO CONSOLIDATED FINANCIAL STATEMENTS
U.S. dollars in thousands (except of share and per share data)
| NOTE 23:- | NET PROFIT (LOSS) PER SHARE |
| a. | Details of the number of shares and loss used in the computation of loss per share from continuing operations: |
| Year ended December 31, | ||||||||||||||||||||||||
| 2018 | 2019 | 2020 | ||||||||||||||||||||||
Weighted average number of shares | Loss | Weighted average number of shares | Profit | Weighted average number of shares | Loss | |||||||||||||||||||
Basic and diluted profit (loss) | 27,113,617 | (5,665 | ) | 27,178,839 | 2,066 | 27,209,878 | (9,276 | ) | ||||||||||||||||
| Year ended December 31, | ||||||||||||||||||||||||
| 2015 | 2016 | 2017 | ||||||||||||||||||||||
Weighted average number of shares | Loss | Weighted average number of shares | Loss | Weighted average number of shares | Loss | |||||||||||||||||||
| Basic and diluted loss | 21,718,401 | (21,671 | ) | 21,862,169 | (18,885 | ) | 23,341,040 | (14,533 | ) | |||||||||||||||
| b. | Details of the number of shares and |
| Year ended December 31, | ||||||||||||||||||||||||
| 2018 | 2019 | 2020 | ||||||||||||||||||||||
Weighted average number of shares | Profit | Weighted average number of shares | Profit | Weighted average number of shares | Profit | |||||||||||||||||||
| Basic and diluted profit | 27,113,617 | 4,608 | 27,178,839 | 2,889 | 27,209,878 | 80 | ||||||||||||||||||
Year ended December 31, | ||||||||||||||||||||||||
| 2015 | 2016 | 2017 | ||||||||||||||||||||||
Weighted average number of shares | Loss | Weighted average number of shares | Loss | Weighted average number of shares | Loss | |||||||||||||||||||
| Basic and diluted loss | 21,718,401 | (417 | ) | - | - | 23,341,040 | (7,616 | ) | ||||||||||||||||
| c. | Net profit (loss) per share from continuing and discontinued operations: |
Year ended December 31, | ||||||||||||
| 2018 | 2019 | 2020 | ||||||||||
| Basic and Diluted loss per share: | ||||||||||||
| Profit (loss) from from continuing operations | (0.21 | ) | 0.08 | (0.34 | ) | |||||||
| Profit from discontinued operation | 0.17 | 0.10 | - | |||||||||
| Profit (loss) per share | (0.04 | ) | 0.18 | (0.34 | ) | |||||||
Year ended December 31, | ||||||||||||
| 2015 | 2016 | 2017 | ||||||||||
| Basic and Diluted loss per share: | ||||||||||||
| Net loss from continuing operations | (1.00 | ) | (0.86 | ) | (0.62 | ) | ||||||
| Loss from discontinued operation | (0.02 | ) | - | (0.33 | ) | |||||||
| Net loss per share | (1.02 | ) | (0.86 | ) | (0.95 | ) | ||||||
| NOTE | BALANCES AND TRANSACTIONS WITH RELATED PARTIES AND KEY OFFICERS |
| a. | Related parties consist of: |
Clal Biotechnologies Industries Ltd.-theLtd.- Parent Company.
Directors of the Company.
CureTech Ltd.-Sister Company.
F - 3845
MEDIWOUND LTD. AND ITS SUBSIDIARIES
NOTES TO CONSOLIDATED FINANCIAL STATEMENTS
U.S. dollars in thousands (except of share and per share data)
| NOTE | BALANCES AND TRANSACTIONS WITH RELATED PARTIES AND KEY OFFICERS |
| b. | Balances of related parties: |
| Other Payables | ||||
Parent Company (1): | ||||
| As of December 31, | ||||
| As of December 31, | ||||
| Other related parties: | ||||
| As of December 31, | ||||
| As of December 31, | 86 | |||
| c. | Transactions with related parties: |
Professional Fee (1) | Rent expenses | |||||||
| Parent company: | ||||||||
| 2015 | 52 | 730 | ||||||
| 2016 | 27 | 804 | ||||||
| 2017 | 35 | 817 | ||||||
| Other related parties: | ||||||||
| 2015 | 127 | - | ||||||
| 2016 | 159 | - | ||||||
| 2017 | 225 | - | ||||||
Professional Fee (1) | Rent expenses and other | |||||||
| Parent company: | ||||||||
| 2018 | 44 | 292 | ||||||
| 2019 | 52 | 415 | ||||||
| 2020 | 54 | 446 | ||||||
| Other related parties: | ||||||||
| 2018 | 162 | (246 | ) | |||||
| 2019 | 249 | (59 | ) | |||||
| 2020 | 272 | - | ||||||
| (1) | Professional fees do not include short-term employee benefits and share-based compensation to one of the Company's shareholders, who is a key officer, in the amounts of |
| d. | Compensation of officers of the Company: The following amounts disclosed in the table are recognized as an expense during the reporting period related to officers: |
Year ended December 31, | ||||||||||||
| 2018 | 2019 | 2020 | ||||||||||
| Short-term employee benefits (*) | 2,304 | 2,533 | 1,993 | |||||||||
| Share-based compensation | 276 | 565 | 467 | |||||||||
| 2,580 | 3,098 | 2,460 | ||||||||||
| Number of officers | 6 | 7 | 5 | |||||||||
Year ended December 31, | ||||||||||||
| 2015 | 2016 | 2017 | ||||||||||
| Short-term employee benefits | 2,639 | 2,108 | 2,324 | |||||||||
| Share-based compensation | 1,702 | 1,445 | 731 | |||||||||
| 4,341 | 3,553 | 3,055 | ||||||||||
| Number of officers | 7 | 7 | 6 | |||||||||
(*) The amount for 2019 includes one-time payments for previous-CEO on the amount of $196.
In December 2007, the Company's board of directors approved one‑time bonus payments to the Chief Executive Officer and Chief Medical Officer in the amounts of $ 120, each, to be paid upon achieving marketing approval in the United States.
-------