Real estate held through Rotem | Land on which the Rotem Power Plant was built | | Mishor Rotem | | Lease | | About 55 dunams |
Real estate held through Hadera | Hadera Energy Center and the Hadera power plant (including emergency road) | | Hadera | | Rental | | About 30 dunams (Power Plant and Hadera Energy Center) |
Real estate (including options for land) held by Hadera for Hadera 2 Hadera Expansion – Expansion—Land near the area of the Hadera Power Plant | | Hadera | | Rental option through the end of 2028 | | About 68 dunams |
Rotem 2’s land agreement
Land Agreement of Rotem 2 | Land near to space on which Rotem Power Plant was built | | Mishor Rotem | | Lease | | About 55 dunams |
Land held by Tzomet (through Tzomet HLH General Partner Ltd. and Tzomet Netiv Limited Partnership) | Land on which Tzomet is situated | | Plugot Intersection | | Tzomet Netiv Limited Partnership – (byPartnership—(by force of a development agreement with Israel Lands Authority) – —Lease | | About 85 dunams |
Right-of-use of the land for Sorek
Right-of-use of the land for Sorek 2 | Land on which Sorek 2 is being constructed | | Sorek 2 Desalination Facility | | Right of use | | About 2 dunams | | Land held through Kiryat Gat | | Land on which Kiryat Gat is being constructed | | Kiryat Gat | | Ownership | | About 12 dunams |
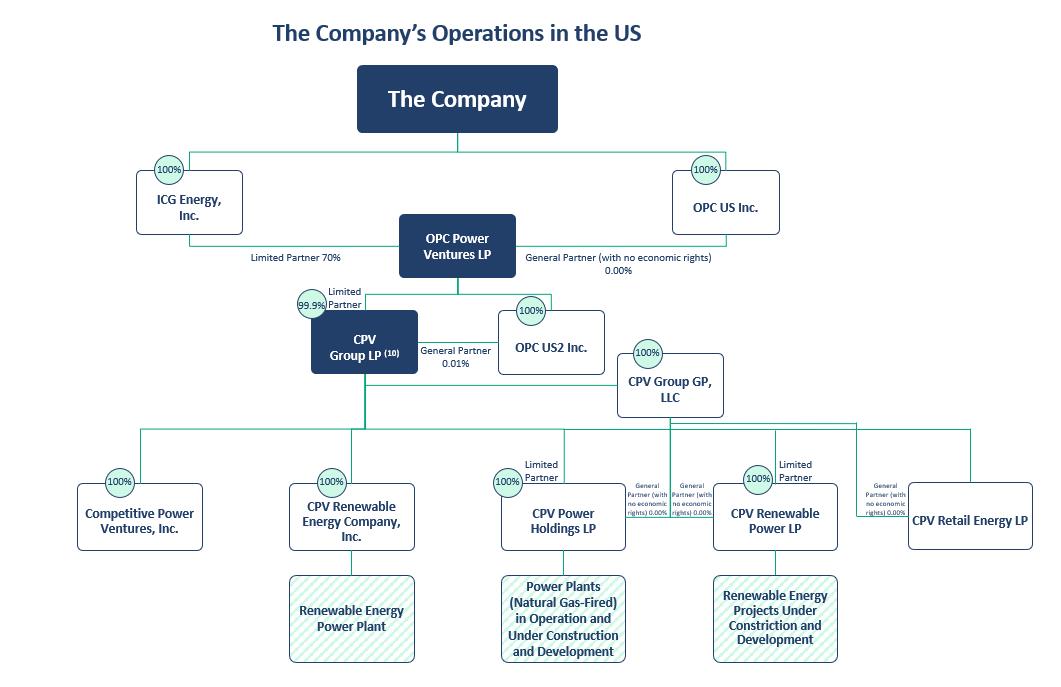
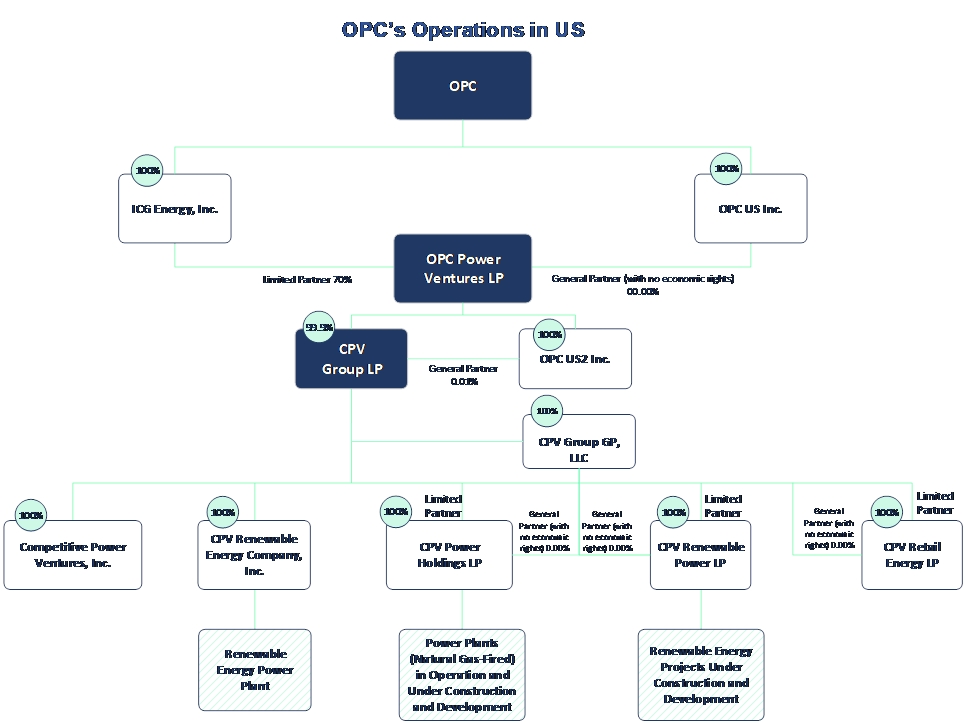
United States In general, the land on which the projects are situated (both the active projects and the projects under construction) is held in a number of ways – ways—ownership, lease with use right, under a permit and licenses. In some cases, the facilities themselves are located on owned land, where there are easements in land surrounding the facility for purposes of connectioninterconnection and transmission. In addition to the project lands, CPV leases office space for use by the headquarters in Silver Spring, Maryland, Sugar Land, Texas, and in Braintree, Massachusetts pursuant to multiyearmulti-year lease agreements. CPV plants in commercial operation | | | | The right in the property | | | | |
Conventional Energy Projects
| Shore | | Land on which the Shore power plant was constructed | | Middlesex County, New Jersey | | Ownership | | About 111,290 square meters (28 acres) | | N/A |
| Maryland | | Land on which the Maryland power plant was constructed | | Charles County, Maryland | | Ownership / easements / licenses and permits / authority | | About 308,290 square meters (76 acres) | | N/A |
| Valley | | Land on which the Valley power plant was constructed | | Wawayanda, Orange County, New York | | Substantive Ownership(1) / easements or permits | | About 121,406 square meters (30 acres) | | N/A |
Towantic
| Towantic | | Land on which the Towantic power plant was constructed | | New Haven County, Connecticut | | Ownership / easements | | About 107,242 square meters (26 acres) | | N/A |
| Fairview | | | | | | | | | | | Land on which the Fairview power plant was constructed | | Cambria County, Jackson Township, Pennsylvania | | Ownership / easements | | About 352,077 square meters (87 acres) | | N/A |
| Three Rivers | | Land on which the Three Rivers power plant was constructed | | Grundy County, Illinois | | Ownership / easements | | About 485,623 square meters (120 acres) | | N/A |
Renewable Energy Projects
| Keenan II | | Land on which the Keenan II wind farm was constructed | | Woodward County, Oklahoma | | Contractual easements | | Rights to land and the equipment | | December 31, 2040 |
Maple Hill
| Mountain Wind | Land on which the CPV Mountain Wind wind farms were constructed (information is aggregated for the four wind farms of Mountain Wind) | Franklin, Oxford and Waldo Counties, Maine | | Contractual easements and leases | | Approx. 15,000,000 square meters (3,700 acres) | | Forty years (Thirty years for 20% of Spruce Mountain) Various 2046—2055 | | Maple Hill | Land on which the Maple Hill power plant is beingwas constructed | | Cambria County, Jackson Township, Pennsylvania | | Ownership / easements | | About 3,063,470 square meters (757 acres, of which 11 acres are leased) | | With regard to the leased area December 1, 20612058 |
| Stagecoach | | Land on which the Stagecoach power plant is being built | | Macon County, Georgia | | Lease Agreement | | Approx. 2,541,426 m² (628 acres) | | May 22, 2042 with option to extend for an additional 20 years | | Land on which the Backbone power plant will be built | | Garrett County, Maryland | | Lease agreement | | Approximately 2,559 acres | | The earlier of March 31, 2025 or commencement of the operating period, plus an option to extend by five consecutive periods of seven years during operations. |
_______________________________________________________________________
| (1) | This land is held for the benefit of Valley, which is entitled to transfer it to its name. |
Insurance OPC and its subsidiaries, including CPV, hold various insurance policies in order to reduce the damage for various risks, including “all-risks” insurance. OPC’s sites (similar to most private business activities in Israel) could be exposed to physical damage as a result of the War in Israel. The existing insurance policies maintained by OPC and its subsidiaries may not cover certain types of damages or may not cover the entire scope of damage caused (and such policies include deductibles and exceptions as customary in the areas of activity). In addition, OPC or CPV may not be able to obtain insurance on comparable terms in the future. Insurance policies for OPC-Rotem, OPC-Hadera will expire at the end of July 2024. Insurance policies for Tzomet will expire at the end of May 2024 and for Kiryat Gat—at the end of April 2024. OPC and its subsidiaries, including CPV, may be adversely affected if they incur losses that are not fully covered by their insurance policies. Employees Israel As of December 31, 2022,2023, in Israel, OPC had a total of 150169 employees, of which 108114 employees are in the OPC Israel division (including plant operation, corporate management, finance, commercial and other), and 4255 are at OPC’s headquarters. Substantially all of OPC’s employees are employed on a full-time basis. The table below sets forth breakdown of employees in Israel by main category of activity as of the dates indicated: | | | | | | | | | | | | | | | | | | | | | | | | | | | | | Number of employees by category of activity: | | | | | | | | | | | | | | | | | | | | Headquarters | | | 42 | | | | 34 | | | | 66 | | | | 55 | | | | 50 | | | | 34 | | | Plant operation, corporate management, finance, commercial and other | | | 108 | | | | 86 | | | | 50 | | | | 114 | | | | 100 | | | | 86 | | | OPC Total (in Israel) | | | 150 | | | | 120 | | | | 116 | | | | 169 | | | | 150 | | | | 120 | |
Most of OPC-Rotem and OPC-Hadera power plants’ operations employees are employed under collective employment agreements. OPC-Rotem is currently negotiating with its employees the engagement in a revised collective agreement to come into force immediately upon the end of the term of the said agreement. .The term of the OPC-Rotem collective agreement ended on March 31, 2023, and a revised collective agreement was signed in respect of OPC-Rotem’s employees for a period of four years until March 31, 2027. Approximately 70 of the employees in OPC-Hadera are employed under a collective agreement which was signed in December 2022 and will be in effect through March 2026. United States As of December 31, 2022,2023, CPV had a total of 131150 employees. In general, CPV does not enter into employment contracts with its employees. All employees of CPV are “at-will” employees and are typically not physically present at the project companies facilities. Rather, day-to-day operations at the project facilities are performed by contractors who are employed directly by the applicable O&M service providers. Shareholders’ Agreements OPC Israel Upon completion of the Veridis transaction, aA shareholders’ agreement is in place between OPC and Veridis regarding OPC Israel entered into force. This agreement replaced shareholder arrangements made between the parties regarding OPC-Rotem and which were in effect until the completion of the Veridis transaction.
Israel. The shareholders’ agreement regarding OPC Israel includes customary terms and conditions, including, inter alia provisions regarding shareholder meetings, rights to appoint directors (such that OPC, as the controlling shareholder, has the right to appoint the majority of directors), shareholder rights in case of share allocation, and more.allocation. In addition, the shareholders’ agreement grants Veridis veto rights in connection with certain material decisions regarding OPC Israel, including: (i) changing the incorporation papers so as to adversely affect or change Veridis’ rights and obligations; (ii) liquidation; (iii) extraordinary transactions (as the term is defined by the Israeli Companies Law -1999, or the Companies Law)-1999) with related parties, with the exception of the exceptions set forth; (iv) entry into new substantial projects that are not included in OPC Israel’s area of activity; (v) restructuring or a merger as a result of which OPC Israel is not the surviving company, subject to the exception set forth in the case of a drag-along sale; (vi) appointing an independent auditor to OPC Israel or a material subsidiary thereof that is not one of the “Big Five” CPA firms; and (vii) approval of a transaction or project in which the planned investment amount is highly material, in accordance with criteria set forth, and subject to exceptions set forth. The agreement provides for additional rights in the event of the sale of OPC Israel’Israel’s shares held by any of the parties, such as the right of first refusal, the tag-along right, the drag-along right – right—all in accordance with the terms and conditions set forth. UnderAn amendment to the shareholders’ loan agreement was signed as part of the Veridis transaction, an amount ofsuch that OPC Israel provided to OPC-Rotem (whether directly or indirectly) NIS 400 million was used by OPC-Rotem(approximately $118 million) for repayment purposes as stated above, and provisions were set regarding the partial repayment of shareholder loans that were advanced to OPC-Rotemthe Shareholder Loans in 2021 (in lieu of Rotem’s project financing). Following the partial repayment and the balance of shareholders’ loans, divided (pro rata) between OPC and Veridis, amounts to approximately NIS 545 million, such that OPC’s share is approximately NIS 436 million (the “Shareholder Loans”). The Shareholders Loans are unlinked and bear interest (representing market conditions) at a rate of 2.65% or interest according to Section 3(J) of the Income Tax Ordinance, whichever is higher. The loans shall be repaid in quarterly unequal paymentsfuture, taking into account OPC-Rotem’s free cash flow in accordance with provisions of the mechanism set in the Shareholder Loans agreement, and in any case no later than October 2031.agreement. CPV-related OPC Partnership Agreement In October 2020, OPC signed a partnership agreement with three institutional investors in connection with the formation of OPC Power (the “Partnership”) and acquisition of CPV by the Partnership. OPC is the general partner and owns 70% of the Partnership interests. The limited partners of the Partnership are: OPC (70% interest; directly or through a subsidiary), Clal Insurance Group (12.75% interest), Migdal Insurance Group (12.75% interest) and a company from the PoalimHapoalim Capital Markets Group (4.5% interest) (together, these three investors, the “Financial Investors”). The percentages above do not include participation rights in the profits allocated to the CPV managers. The total investment commitments and shareholder loans of all the partners amount to $815$1,215 million, based on their respective ownership interests, representing commitments for acquisition consideration, as well as funding of additional investments in CPV for implementation of certain new projects being developed by CPV. In September 2021, the Financial Investors in the Partnership confirmed their participation in an additional undertaking to invest in developing and expanding CPV’s operations, each according to their proportional share, an additional investment of $400 million. During 2022, OPCIn 2023, CPV and the Financial Investors invested in the equity of the Partnership OPC Power (both directly and shareholders’ loans at theindirectly) a total amount of $122approximately $150 million, and $38extended it approximately $45 million in loans, respectively, based on their stake in accordance with their proportionate share in Partnership’s ownership interests.the Partnership. As of March 2023,22, 2024, total investments in the total amountPartnership’s equity and the outstanding balance of the investment is $1,156loans (including accrued interest) amount to approximately $927 million, (net of accrued interest, which – as of December 31, 2022 stood at $29 million).and approximately $339 million, respectively. In March 2023, OPCCPV and the Financial Investors approved their participation in a facility for an additional investment commitment for backing guarantees that were or will be provided for the purpose of development and expansion of projects –- each based on its pro rataproportionate share, as outlined above, for a total of approximately $75 million. In September 2023, after utilizing the entire investment commitment and the shareholder loans advanced, the facility was increased by $100 million, in accordance with each partner’s proportionate share (the CPV’s share in the facility is $70 million). As of March 22, 2024, the total balance of investment undertakings and shareholders’ loans advanced by all partners under the facility is estimated at approximately $100 million (excluding the guarantee facility). The general partner of the Partnership, an entity wholly-owned by OPC, manages the ownership of CPV, with certain material actions (or actions which may involve a conflict of interest between the general partner and the limited partners) requiring approval of a majority or special majority (according to the specific action) of the institutional investors which are limited partners. The general partner is entitled to management fees and success fees subject to meeting certain achievements. There are limits on transfers of partnership interests, with OPC not permitted to sell its interest in the Partnership for a period of three years (except in the case of a public offering by the Partnership), tag along rights for the Financial Investors, drag along rights, and rights of first offer (ROFO) for OPC and the Financial Investors in the case of transfers by the other party. OPC and the Financial Investors have entered into put and call arrangements, with the Financial Investors being granted put options and OPC being granted a call option (if the put options are not exercised), with respect to their holdings in the Partnership. These options are exercisable after 10 years from the date of the CPV acquisition and to the extent that up to such time the Partnership rights are not traded on a recognized stock exchange. Legal Proceedings For a discussion of other significant legal proceedings to which OPC’s businesses are party, see Note 1718 to our financial statements included in this annual report. Industry Overview Overview of Israeli Electricity Generation Industry Electricity generation and supply in Israel In general, the Israeli electricity market is divided into four sectors: the (i) generation sector, (ii) transmission sector (transmitting electricity from generation facilities to switching stations and substations through the electricity transmission grid), (iii) distribution sector (transmitting electricity from substations to consumers through the distribution grid including high voltage and low voltage lines), and the supply sector (sale of electricity to private customers). None of the actions provided in the Electricity Sector Law shall be carried out except pursuant to a license, subject to legal restrictions, and in accordance with activity in each of the segments requiring a relevant license. As of December 31, 2022, the installed electricity production capacity in Israel (of the IEC and independent producers) was 17,434 MW excluding renewable energies, and approximately 4,800 MW of renewable energies, with actual generation constituting approximately 10.1% of total actual consumption in the economy in 2022. According to publications of the EA, the annual rate of increase in demand for electricity in 2023 is expected to be at less than 1%. According to the Electricity Sector Status Report, in 2022 the sectoral generation amounted to 76.9 TWh; in 2025, the annual generation forecast is expected to be 81.7 TWh. In 2023, the EA reviewed key points of progress in the renewable energy market, and stated that at the end of 2023 the rate of actual consumption of renewable energy in the Israeli economy was 12.5%; the rate of renewable energy installed capacity out of total capacity in Israel as of the end of 2023 was 24.4%. The Israeli electricity market includes a number of key players: the EA, the IEC, Noga, the Ministry of Energy and Infrastructures (the “Ministry of Energy”), independent power producers and suppliers and electricity consumers. The Ministry of Energy oversees of the energy and natural resources markets of Israel, including electricity, fuel, cooking gas, natural gas, energy conservation, oil and gas exploration, etc. The Ministry of Energy regulates the public and private entities involved in these fields. In addition, the Minister of Energy has powers under the Electricity Sector Law, including regarding licenses and policy setting on matters regulated under the Law. The EA reports to the Ministry of Energy and operates in accordance with its policy. The EA has the power to issue licenses in accordance with the Electricity Sector Law, to supervise license holders (including private license holders), to set tariffs and criteria for the level and quality of service required from an “essential service provider” license holder. Accordingly, the EA supervises both the IEC and Noga as well as independent power producers and suppliers. According to the Electricity Sector Law, the EA is authorized to determine the electricity tariffs in the market (including the generation component) based, among other things, on the IEC’s costs that are recognized by the EA. The IEC supplies electricity to most of the customers in Israel in accordance with licenses granted to it under the Electricity Sector Law, and transmits and distributes almost all of the electricity in Israel. In general, the IEC is responsible for the installation and reading of the electricity meters of electricity consumers and generators and for transfer of the information to Noga and suppliers in accordance with the decisions of the EA. Noga is a government company, whose operations commenced in November 2021, and is in charge of the management of the electricity system in the generation and transmission segments, including constant balancing out between the supply of electricity and the demand for planning of the transmission system, including, among other things, drawing up a development plan for the transmission and generation segments. Pursuant to the Electricity Sector Law, the IEC and Noga are each defined as an “essential service provider” and as such, they are subject to the criteria and tariffs set by the EA. As of 2022, the IEC’s share amounted to 51.5% in the generation segment and 69% in the supply segment. According to the Electricity Market Report, as of 2022, independent power producers (including OPC power plants), including those using renewable energy, active in Israel have an aggregate generation capacity of approximately 11,706 MW, constituting 53% of the total installed generation capacity in Israel. According to Electricity Market Report, at the end of 2025 (the end of the IEC Reform), the market share of the independent power producers, including renewable energies, is expected to amount to approximately 66% of the total installed capacity in the sector. In generation terms, in 2025 the market share of the independent power producers (including OPC power plants), and including renewable energies, is expected to amount to approximately 60% of the total generation in the market.
The generation component and changes in the IEC’s costs In accordance with the Electricity Sector Law, the EA determines the tariffs, including the rate of the IEC electricity generation component, in accordance with the costs principle and the other considerations provided for in the Electricity Sector Law, as applied by the EA. The generation component is based on, inter alia, the IEC’s fuel costs, comprising mainly of the IEC’s gas and coal costs, the costs of purchasing electricity from independent producers, the IEC’s capital costs, and the EA’s policy on classification of costs to either the generation component and the IEC’s system costs or the recognition of such costs of the IEC. The generation component may also change based on the IEC’s other expenses and revenues and may also be affected by other factors, such as, sale of power plants as part of the IEC Reform. Under the agreements with the private customers, OPC charges its customers the load and time tariff (the “DSM Tariff”), net of the generation component discount. Since the electricity price in the agreements between OPC-Rotem, OPC-Hadera and Kiryat Gat (and of the generation facilities) and their customers is impacted directly by the generation component (such that a decline in the generation component would generally decrease the profitability and vice versa) and the generation component is the linkage base for the natural gas price in accordance with the gas supply agreements of OPC in Israel (subject to a minimum price), OPC is exposed to changes in the generation component, including, among other things, changes in the generation costs and the energy acquisition costs of the IEC, including the price of coal and the IEC’s gas cost. In addition, OPC is exposed to changes in the methodology for determining the generation component and recognizing IEC costs by the EA. In general, an increase in the generation component has a positive effect on OPC’s results. In Israel, the TAOZ tariffs are supervised (controlled) and published by the EA. Generally, the electricity tariffs in Israel in the summer and the winter are higher than those in the transition seasons. Acquisition of the gas, which constitutes the main cost in this business operations, is not impacted by seasonality of the TAOZ (or the demand hours’ brackets). The hourly demand brackets change the breakdown of OPC revenues over the quarters in such a manner that it increases the summer months (and mainly the third quarter) at the expense of the other quarters, and particularly the first and fourth quarters. The summer on-peak (August) high voltage tariff for 2023 indicates that the generation component in 2023 accounted for about 91% of TAOZ. In addition, the TAOZ includes system costs at the rate of 7% and public utilities at the rate of about 2%. On January 1, 2023, an annual update of the tariff for 2023 came into effect for the IEC’s electricity consumers. In accordance with the resolution, the high cost of coal was the main reason for the increase in electricity tariffs. In accordance with the update, the generation component stood at NIS 0.312 per kWh, a 0.6% decrease compared to the generation component that applied in the last few months of 2022. On February 1, 2023, the EA resolution to revise the costs recognized to the IEC and Noga and the tariffs paid by electricity consumers came into effect. This came into effect after the Ministry of Finance signed, on January 23, 2023, orders that extend the reduction in the purchase tax and excise tax rates applicable to coal, such that the reduction shall be in effect through the end of 2023. Pursuant to the resolution, a further update to the generation component for 2023 came into effect, whereby the generation component was changed to NIS 0.3081 per kWh, approximately 1.2% decrease compared to the tariff set on January 1, 2023. At the beginning of March 2023, a hearing was published in connection with the revision of the costs recognized to the IEC and the tariffs paid by electricity consumers, following the decline in coal prices, and increase in other costs. The tariff of NIS 0.3081 which came into effect on April 1, 2023 was reduced by approximately 1.4% from the tariff set in February 2023 to NIS 0.3039. An update to the hourly demand brackets, which became effective from January 2023, had a negative impact on our results from Israel activities and caused a change in the seasonality of our revenues, which resulted in a significant increase in our results during the summer period at the expense of the other months of the year (particularly the first quarter). On February 1, 2024, an annual update of the tariff for 2024 came into effect for the IEC’s electricity consumers. According to the decision, the generation component was updated to NIS 0.3007 per KWh, a decline of 1.1%, mainly due to the excess proceeds expected from the sale of the Eshkol power plant, which led to a reduction in the generation segment. Furthermore, as part of the resolution regarding the updating of the tariff, and according to a decision about the designation of proceeds from the sale of Eshkol, the surplus proceeds from the sale will be first used to cover costs incurred during the War, including diesel fuel costs, and only then will the surplus proceeds be used to cover past one-off costs. Updates in the demand hour clusters On August 28, 2022, the EA also published a resolution amending the demand hour clusters in order to, according to the publication, adjust the structure of the DSM tariff, such that it integrates a significant portion of solar energy and storage. According to the published resolution, the following key revisions were set: (i) changing peak hours from the afternoon to the evening; (ii) increasing the number of months during which peak time applies in the summer to from two months to four months; (iii) increasing the difference between peak time and off-peak time; and (iv) defining a maximum of two clusters for each day of the year (without the mid-peak cluster that was in force until the resolution went into effect). Changing the hour categories in accordance with the decision is expected to increase the tariffs paid by the household consumers and decrease the tariffs paid by DSM tariff consumers. In accordance with the resolution, the revised tariff structure came into force with the revision of the tariff for consumers for 2023. The resolution also stipulated that in view of the frequent changes in the sector and the need to reflect the appropriate sectoral cost, the hour clusters shall be updated more frequently, in accordance with actual changes. The revision of the demand hour clusters had a negative effect on OPC’s results, mainly in view of the consumption profile of OPC’s customers (who are mostly industrial and commercial customers), which generally have low level of consumption fluctuations during the day compared to the sectoral consumption profile as reflected in the tariffs and regulations set as part of the revision for off-peak and on-peak hours. In addition, a change of the demand hour clusters changes the breakdown of OPC’s revenues and profits from its operations in Israel between the different quarters, such that revenues and profits in the summer (June-September), and mainly the third quarter, increase at the expense of the other quarters. The IEC Reform and development of the private electricity market in Israel The entrance of the independent power producers and suppliers has led to a significant decrease in the IEC’s market share in the sale of electricity to large electricity consumers (high and medium voltage consumers). The market share of independent producers in the generation and supply segments is expected continue to grow in coming years as a result of, inter alia, construction of power plants by independent producers (using natural gas and renewable energies), and as a result of the IEC Reform, which includes the sale of power plants and their transfer from the IEC to independent producers, and imposed limitations on the IEC with respect to construction of new power plants, as well as a result of opening the supply segment to competition, including providing licenses to suppliers without generation means and the resolution regarding smart meters installation rules. The following table presents data on the share of independent power producers and the IEC in the electricity market, as well as renewable energy production in 2021 and 2022, as published by the EA. | | | | | | | | | | | | | | % of Total Installed Capacity in the Market | | | | | | % of Total Installed Capacity in the Market | | | IEC | | | 11,615 | | | | 54 | % | | | 10,527 | | | | 47 | % | | Independent power producers (without renewable energy) | | | 6,231 | | | | 29 | % | | | 6,907 | | | | 31 | % | | Renewable energy (independent power producers) | | | | | | | | | | | | | | | | | | Total in the market | | | 21,502 | | | | 100 | % | | | 22,233 | | | | 100 | % |
| | | Energy generated (thousands of MWh) | | | % of total energy produced in Israel | | | Energy generated (thousands of MWh) | | | % of total energy produced in Israel | | | IEC | | | 38,223 | | | | 52 | % | | | 39,224 | | | | 51 | % | | Independent power producers (without renewable energy) | | | 30,077 | | | | 41 | % | | | 30,155 | | | | 39 | % | | Renewable energy (independent power producers) | | | | | | | | | | | | | | | | | | Total in the market | | | 73,975 | | | | 100 | % | | | 76,886 | | | | 100 | % |
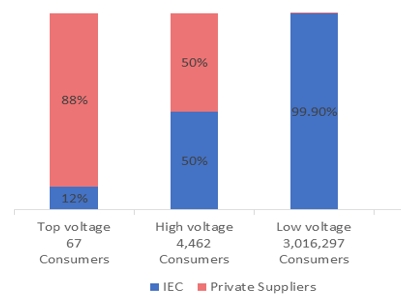
Set forth below are data about the distribution of consumers between private suppliers and the default supplier (in accordance with the IEC’s data): Pursuant to the IEC Reform, an 8-year plan was formed, under which the IEC was required, among other things, to sell certain generation sites (including the Eshkol, which is under a process of completing a sale to an independent producer)), and the system operation activities will be spun off from the IEC and executed by a separate government company. Accordingly, Noga started operating as an entity separate to the IEC in November 2021. The Reading power plant, was also supposed to be sold as part of the IEC Reform; a government taskforce was set up, which considered alternatives to such power plant in order to secure the supply of electricity to Gush Dan. A final decision as to the selected alternative is expected to be made in July 2024. In May 2023, OPC submitted, through a joint special-purpose corporation, held in equal parts by OPC Power Plants and a corporation held by the Noy Fund ("OPC Eshkol"), a bid to purchase the Eshkol Power Plant as part of an IEC tender. In June 2023, OPC was notified that the Tenders Committee declared that an offer submitted by Eshkol Power Energies Ltd. is the winning offer in the Tender, and that OPC Eshkol was declared a "second qualifier" according to the tender documents. Since the winning bidder did not complete the signing of the acquisition agreement, in July 2023, the IEC announced the cancellation of the tender, and its decision to hold a new tender between the bidders that took part in the first bid (and which includes a minimum price of NIS 9 billion (approximately $2 billion) (the "Tender"). In August 2023, OPC Eshkol filed an administrative petition to the Tel Aviv Administrative Court. On September 14, 2023, the Administrative Court rejected the petition. OPC Eshkol did not submit a bid as part of the tender that took place on October 30, 2023. Forecast of potential growth in natural gas in the Israeli electricity market According to the hearings and resolutions of the EA, four gas-powered conventional generation units are expected to be constructed, including the unit that is expected to be constructed as part of the Sorek tender, with a capacity of up to 900 MW, the replaced generation unit in the Eshkol site with a capacity of up to 850 MW, and two conventional units with a capacity of up to 900 MW each. The assessment as to the growth potential in natural gas generation units in the upcoming decade is conditional upon compliance with the renewable energy targets. According to external data available to OPC, OPC believes new natural gas generation capacity of 5,400 to 9,000 MW will be required between 2030 and 2040. In September 2022, Noga published a long-term demand forecast for 2022-2050, according to which the demand is expected to increase by 3.1% per year by 2030 and 3.7% in 2030-2040, based mainly on growth forecasts in connection with the introduction of electric vehicles into Israel. Virtual supply—Opening of the supply segment to suppliers without means of generation and to household consumers In February 2021, the EA reached a resolution to regulate virtual supply license, which allows suppliers who do not have means of production to purchase energy from the System Operator to sell to their customers (the “Virtual Supply”). Suppliers who did not have means of production had been restricted by certain a quota set by the EA. In July 2021, OPC was awarded a virtual supply license. OPC began entering into virtual supply agreements with customers for a total capacity of 50 MW. OPC also entered into a virtual supply agreement with Noga. In March 2022, the EA removed all quotas that were set for virtual supply, and amended the tariff for acquisition of electricity from the System Operator. Overview of United States Electricity Generation Industry Overview The electricity market in the United States, in which CPV operates, is the largest private electricity market in the world with installed capacity of approximately 1,300 gigawatts of generation facilities. The generation mix has changed significantly over the last several years. In 2016, natural gas overtook coal as the primary fuel source for electricity production in the United States, after coal comprised over 50% of the electricity supply since the 1980s. These changes have been driven by federal and state environmental policies, as well as the relative cost of the fuel sources and the advancement in technologies. These factors also have greatly contributed to the growth in renewable technologies over the last several years. Alongside the increasing demand for renewable energy, environmental goals of large commercial and industrial customers are driving demand for renewable energy. The wholesale electric marketplace in the United States operates within the framework of several FERC-approved regional or state market operators, including RTO or ISO. RTO/ISOs are responsible for the day-to-day operation of the transmission system, the administration of the wholesale markets in the regions in which they operate, and for the long-term transmission planning and resource adequacy functions. In most cases the ISO’s and RTO’s powers are concentrated under a single entity. The RTOs and ISOs are supervised by FERC, except for ERCOT (the Texas electricity market). In addition to FERC, other state regulators regulate the sale and transmission of electricity, within each state, and the RTOs/ISOs, which are the key players in the wholesale electricity markets in the United States, in which the CPV Group operates, include other electricity producers and local utility companies, that serve both wholesale and retail customers. Most of the other electricity producers (especially producers that joined recently), and local electricity companies operating in these wholesale markets, are privately owned entities; however, those market players include a number of publicly held cooperatives, government utility companies and federal system administrators. Each of the ISOs and RTOs operates energy markets and related services, and buyers and sellers can submit in those markets bids to sell or supply electricity and related services, such as capacity services, frequency stabilization, backup, etc. Some of the ISOs and RTOs also operate capacity markets. ISOs and RTOs operating in advanced markets use a demand-based electricity selling system, and a marginal price set by electricity producers to meet the regional consumption needs. In large parts of the United States, the electricity management system has a more traditional structure where the local electric utility company is in charge of load management and the production mix. The CPV Group operates mainly in advanced markets managed by ISOs or RTOs. In addition to revenues from the sale of energy, related services and availability, manufacturers of renewable energy and manufacturers of low-carbon energies benefit from government mechanisms and incentives. Both U.S. federal and state governments offer incentives to suppliers in order to meet the renewable energy targets. A number of states require the local electric utility company to acquire a certain quantity of RECs in accordance with the total consumption of their consumers. In addition, there are federal tax incentives in connection with production of and investment in renewable energies and other low-carbon technologies, which also constitute a financial incentive to develop specific production technologies. Furthermore, each state has in place environmental protection regulations, which may provide incentives and encourage the closure of existing production facilities that use fossil fuels. While each of the ISOs and RTOs has the same function on the federal level, there are significant differences between markets in terms of their structure and activity; those differences may affect the execution and the economic feasibility of new projects, and promote or delay investments in new projects. The CPV Group operates mainly in advanced markets managed by ISOs or RTOs. Market Developments The increasing demand for renewable energy led to an unprecedented increase in interconnection applications by projects, and to an increase in interconnection survey applications by solar projects. These demands may affect the planning functions of ISOs or RTOs and utility and electric distribution companies, and lead to delays in interconnection approvals; the demand may also affect the process and pace of promoting the CPV Group’s projects under development. In addition, projects under construction and development are affected by disruptions or delays in supply chains. Some of the CPV’s projects under development or construction have signed certain agreements including PPAs and capacity agreements, as well as RECs, which include provisions relating to delays in commercial operation. If the delays are longer than certain periods, the other parties to the agreements may terminate the agreements, and the CPV Group’s compensation shall be limited to the collateral provided under the agreements. The amount of collateral provided in connection with development projects (including pre-construction) which were provided due to various needs and purposes in the execution stages may increase or decrease pursuant to the terms of applicable agreements in connection with certain milestones being reached for the development projects. The transition in the United States to renewable energy and low-carbon emission generation has been accelerating in recent years. Hydroelectric generation has been a mainstay of the industry from its early days, and certain parts of the country have a significant resource base thereto. During the past decade there has been a significant decrease in the less efficient, less flexible coal fired generation, mainly due to introduction of carbon capture power plants but coal still constitutes more than 17% of the total electricity generation in the United States. While in recent years there has been a significant increase in the capacity of power plants powered by wind and solar energy, the build out of these facilities in the northeast has been slower than expected. A key factor driving the increase in renewable technologies are state policies supporting the decarbonization of the economy which includes energy, transportation, and heating. Twenty-three states (including Maryland, New York, New Jersey, Connecticut and Illinois, states in which the CPV Group operates), the District of Columbia and Puerto Rico have adopted mandatory generation targets using renewable energy to support state demand, and others have policy targets aimed at reducing CO2 emissions over time. Plans implemented by states for renewable energy development require local utility companies to acquire a certain rate of electricity from renewable sources through plans commonly referred to as RECs, which are tradable on a number of exchanges throughout the country. Federal regulations require the reporting of greenhouse gas emissions under the federal Clean Air Act (“CAA”). Federal regulations also impose limits on CO2 emissions from new (commenced construction after January 8, 2014) or reconstructed (commenced reconstruction after June 8, 2014) combined-cycle power plants. States may also impose additional regulations or limitations on such emissions. For example, CPV’s conventional, natural gas-fired power plants in Connecticut, New York, New Jersey and Maryland are subject to the Regional Greenhouse Gas Initiative (“RGGI”), which requires CPV’s natural gas-fired plants to obtain, either through auctions or trading, greenhouse gas emission allowances to offset each facility’s emission of CO2. Pennsylvania may also adopt the RGGI regulation pending the outcome of legal proceedings challenging its implementation. Under RGGI, an independent market monitor provides oversight of the auctions for CO2 allowances, as well as activity on the secondary market, to ensure integrity of, and confidence in, the market. In 2023, the price of carbon dioxide allowances averaged $11.92 per allowance in the four quarterly RGGI auctions. In addition, federal and state tax policies have incentivized investment in certain low or no carbon technologies through PTC, which provide a tax benefit for every kWh generated by renewables during a ten-year period and through ITC, which provide tax benefits based upon the amount of investment made in a renewable or a battery storage project; and tax credit for carbon emissions that either used or sequestered. In 2022, the IRA was signed into law by President Biden. Among other things, this law awards significant tax benefits to renewable energies and technologies aimed at reducing carbon emissions. One of the IRA’s key objective is to increase the production of electricity using renewable energies and to increase regulatory stability in this sector. For more information on the IRA, see “Item 4.B Business Overview—Regulatory, Environmental and Compliance Matters—United States—The Inflation Reduction Act of 2022.” For information on the PJM market, see “Item 4.B Business Overview—Regulatory, Environmental and Compliance Matters—United States—The PJM market.” Regulatory, Environmental and Compliance Matters Israel The IEC generates and supplies most of the electricity in Israel in accordance with licenses granted by virtue of the Israeli Electrical Market Law, and distributes and supplies almost all of the electricity in Israel. In June 2020, the System Operator was granted a license to manage the Israeli electricity system (which was revised in November 2020), pursuant to which the Minister of Energy and the EA approved commencement of gradual activities of the System Operator in two stages. The System Operator’s Technological Planning and Development Unit is responsible for planning the transmission system and, among other things, preparing a development plan for the transmission and generation of electricity, determining criteria for development of the electricity system, formulating forecasts, engineering and statutory planning of the transmission system, and performing studies with respect to connection to generation facilities. The System Operators’ Market Statistic Unit is responsible for the current ongoing operation of the transmission system and is intended to, among other things, maintain a balance in levels of supply and demand in the electricity market, manage the transmission of energy from power stations to substations at the reliability and quality required (by passing through the power grids), timing and performing maintenance works in production units and in transmission systems, managing commerce in Israel under competitive, equal and optimal terms, including performing agreements to purchase available capacity and energy from private electricityindependent power producers and for planning and developing the transmission and distribution systems. Pursuant to the Electricity Sector Law, the IEC and the System OperatorNoga are each defined as an “essential service provider” and as such they are subject to the criteria and tariffs provided by the EA. In addition, the IEC was declared a monopoly by the Israeli Antitrust Authority in the electricity sector, in the field of power supply — electricity production and sale, transmission and distribution of electricity and providing backup services to electricity consumers and producers. IEC Reform Pursuant to the Israeli Government’s electricity sector reform, the IEC will bewas required to sell five of its power plants through a tender process over the 7 years. The IEC will be permitted to build and operate two new gas-powered stations (through a subsidiary), but will not be authorized to construct any new stations or recombine existing stations. The IEC will also cease acting as the System Operator. Following the Israeli Government’s electricity sector reform, as part of which the IEC is expected to sell five of its sites, the Israel Competition Authority issued guiding principles for sector concentration consultation in such sale process. According to such principles, which are subject to change and review considering the relevant circumstances: An entity may not hold more than 20% of the total planned installed capacity on the date of sale of all the sites being sold. The generation capacity of an entity’s related parties with generation licenses will be counted towards such entity’s capacity for purposes of this 20% limitation. In addition, the EA published proposed regulations in respect of maximum holdings in generation licenses which are not identical to the Competition Authority principles. The Competition Authority has stated that the relevant limit is 20% of 10,500 MW (which is the anticipated capacity in the market held by private players by 2023, excluding capacity of the IEC), while, the EA has proposed regulation whereby the relevant limit is 20% of 16,000 MW (including capacity of the IEC). OPC may be subject to a more restrictive interpretation. The MW currently attributable to OPC, including Oil Refineries Ltd., or ORL, and Israel Chemicals Ltd. as parties with generation licenses that are related to OPC, is approximately 1,480 MW; and An entity holding a right to a fuel venture may not acquire any of the sites being sold. OPC participated in the tenders of the Alon Tabor plant and Ramat Hovav plants — the first two plants that have been sold out of the five plants to be sold by the IEC — but was not the winning bidder. Ministry of Energy and EA The Ministry of Energy regulates the energy and natural resources markets of the State of Israel: electricity, fuel, cooking gas, natural gas, energy conservation, water, sewerage, oil exploration, minerals, scientific research of the land and water, etc. The Ministry of Energy regulates public and private entities involved in these fields, and operates to ensure the markets’ adequate supply under changing energy and infrastructure needs, while regulating the markets, protecting consumers and preserving the environment. According to publications of the Ministrypolicy principles set by the Minister of Energy from November 2019, by the Ministryend of Energy’s multi-year goals include diversified energy resources2025, production units 5-6 at the Orot Rabin site in Hadera and ensuring reliability of supply during peacetime and emergency, developing effective and significantgeneration units 1-4 at the “Rutenberg” site in Ashkelon will be converted to natural gas and determining long-terms policies and appropriate regulationsthe use of coal will cease. In accordance with information published by the EA, the first combined cycle in “Orot Rabin” is expected to start operations in May 2024. After its operation, the two units are expected to be decommissioned (units 3-4 in “Orot Rabin”). In addition, the project for the conversion of the market’s electricity. 109
The Ministry of Energy’s main objectives in the electricity field are securing a reliable supply of electricity to the Israeli market, formulating development procedures to the electricity production sections, energy transmission and distribution, promoting policies to integrate renewable energies in electricity production in accordance with governmental decisions, formulating policies changing the market’s electricity structure, performing control and supervision of the implementation of the IEC’s and private producers’ development plans, performing control, supervision and enforcement of implementing safety regulations according to the Electricity Law, 5714-1954, and handling legislature in the electricity market fields, rules of performing electricity works and security in electricity. The main objectives of the Ministry of Energy in its workplan for 2019 included achieving an efficient and competitive electricity sector by focusing on the reform of the sector through the initiation of tenders for the sale of the IEC power plants and the transfer of system management activities from the IEC to the new System Operator. Energy Sector Targets for 2050 In April 2021, the Ministry of Energy published the roadmap for a low-carbon energy sector by 2050. The Ministry of Energy has set four “primary targets” that will reflect the strategic goal of reducing emissions, and also supportive sectoral objectives which will help to achieve them. The “super target” is defined as a reduction of greenhouse gas emissions from the energy sector by 80%at least 85% compared to the 2015 reference year, by 2050. The targets and indices for the energy sector are presented by the Ministry of Energy in the following table. | | | | | | | | | | Reducing greenhouse gas in the energy sector | | Percentage reduction of greenhouse gas over 2015 | | 0% | | 22% | | 80% | | Reducing greenhouse gas in the electricity sector | | Percentage reduction of greenhouse gas over 2015 | | 7.5% | | 30% | | 75%-85% | | Energy efficiency | | Percentage of annual improvement in energy intensity (TW/NUS million) | | 0.7% | | Annual improvement of 1.3% in energy intensity | | Annual improvement of 1.3% in energy intensity | | Use of coal | | Percentage of coal in the electricity generation mix | | 30% | | 0% | | 0% |
| | | | | | | | | | Reducing greenhouse gas emissions in the energy sector | | Percentage reduction of greenhouse gas emissions compared with 2015 | | 0% | | 22% | | 80% | | Reducing greenhouse gas emissions in the electricity sector | | Percentage reduction of greenhouse gas emissions compared with 2015 | | 7.5% | | 30% | | 75%-85% | | Energy efficiency | | Average annual improvement in energy intensity (TW/NIS million) | | 0.7% | | Annual improvement of 1.3% in energy intensity | | Annual improvement of 1.3% in energy intensity | | Use of coal | | Percentage of coal in the electricity generation mix | | 30% | | 0% | | 0% |
In February 2022, Israeli Knesset discussedFurther to Government Decision No. 171 from July 2021 regarding a transition to a low carbon economy, in January 2024, the Climate Law bill,Government passed Government Resolution No. 1261 regarding the objectivepricing of which is to preventemissions of local pollutants and reduce greenhouse gas emissions andgases, for the damages of global warming in Israel, as partimplementation of the State of Israel’s commitmentprinciple that requires polluting entity to take steps for tackling global warming, including setting targets and drawing up plans for reducing greenhouse gas emissions.pay. As part of the bill, it was suggestedresolution, the Minister of Finance will revise the Excise Tax on Fuel Order (Imposition of Excise Tax), 2004 (“the Excise Tax on Fuel Order”) and the Customs Tariff and Exemptions and Purchase Tax of Goods Order, 2017, to ensure a gradual charge to an entity for the external and environmental costs of carbon emissions, commencing from 2025, within the scope of the resolution. The Minister of Finance has yet not approved the Excise Tax on Fuel Order within the scope of the resolution. OPC believes that the amendment of the Excise Tax on Fuel Order pursuant to the government will take stepsresolution (if advanced) would increase OPC’s costs of acquiring natural gas (renewable energy projects are not exposed to reduce annualthe natural gas costs), where this impact is expected to be offset, partly or fully, to the extent the costs deriving from the resolution are included in the generation component. In September 2023, the Israeli Ministerial Legislation Committee approved the government Climate Bid, which specifies a strategic national net-zero target by 2050, and an interim target of a 30% reduction in greenhouse gas emissions such that emissions willby 2030. The law sets government implementation mechanisms, national plans, and transparency, monitoring and reporting duties to secure compliance with the targets. To the best of OPC’s knowledge, the law has not exceedyet been passed and the following targets (in relation to 2015 asfinal wording of the base year):legislation is uncertain.
| (1) | In 2030 and through 2049 – no more than 73% of the annual quantity measured in the base year. |
| (2) | In 2050 and thereafter – no more than 15% of the annual quantity measured in the base year. |
Closure of the IEC’s Coal-Fired Production Units As of March 19, 2023, theThe IEC’s generation units run on coal, natural gas, fuel oil or diesel fuel as their secondary or primary fuel, as the case may be. The power plants operated by the independent electricity producers are powered by natural gas as primary fuel and diesel fuel as backup. Use of natural gas for power generation reduces air pollution and greenhouse gas emissions in the power generation process compared to the use of coal.
According to Government Decision 4080, by June 2022, the generation of electricity in units 1-4 will bewas stopped, subject to the existence of two cumulative conditions: (i) connection of a third gas reservoir (Karish Tanin reservoir) to the national gas transmission system, (ii) commencement of operation of the first combined cycle with a capacity of 600 MW at the “Orot Rabin” site in Hadera. As of March 19, 2023, theThe generation units of units 1-44-1 at the Orot Rabin site has not yet terminated and there is no certainty regarding compliance with the conditions and the cessation of generation in these units. According to the policy principles set by the Minister of Energy from November 2019, untilby the end of 2025, production units 5-6 at the Orot Rabin site in Hadera and generation units 1-4 at the “Rutenberg” site in Ashkelon will be converted to natural gas and the use of coal will cease. In accordance with information published by the EA, as part of the tariff update, the first combined cycle in “Orot Rabin” is expected to start operations in July 2023.May 2024. After theits operation, of the combined cycle, the two units are expected to be decommissioned.decommissioned (3-4 in “Orot Rabin”). In addition, the project for the conversion of the coal-fired power plants is delayed and is expected to be completed onlystarted in April 2023.the first unit in January 2024. The EA The EA, which is subordinated to the Ministry of Energy and operates in accordance with its policy, was established in January 2016, and replaced the Public Utility Authority (“PUAE”), which operated until that time by virtue of the Electricity Sector Law. The EA has the authority to grant licenses in accordance with the Electricity Sector Law, to supervise license holders, to set electricity tariffs and criteria for them, including the level and quality of services required from an “essential service provider” license holder, supply license holder, a transmission and distribution license holder, an electricity producer and a private electricityan independent power producer. Thus, the EA supervises both the IEC and private producers. The Minister of Energy can dispute EA rulings and request a renewed discussion on specific rulings, except in the matter of the electricity tariffs, which the EA has full authority to set. In addition, the Minister of Energy has the authority to propose the appointment of some of the members of the EA board, as well as the authority to rule on electricity market policy on the subjects defined in the Electricity Sector Law. According to the Electricity Sector Law, the EA may set the power rates in the market, based, among others, on the IEC costs that the EA elects to recognize, and yield on capital. The EA sets different rates for different electricity sectors. According to the Electricity Sector Law, the IEC shall charge customers in accordance with rates set by the EA and shall pay another license holder or a customer in accordance with the relevant rates. In addition, the EA sets the tariffs paid by private electricityindependent power producers to the IEC for various services provided by the IEC, including measurement and meter services, system services, and infrastructure services. In 2022, the EA continued to publish resolutions intended to promote the construction of solar facilities, storage facilities, and installation of EV charging stations in the land divisions, updated the demand hours clusters and underlying tariffs, revised the criteria for promoting competition in the supply segment, established principles for installing smart meters, and approved virtual supply licenses. In addition, the EA published a resolution to amend criteria for the purpose of applying the market model to existing private electricity generation.
For further information on related EA tariffs, see “—Industry Overview— Overview of Israeli Electricity Generation Industry.” For further information on the effect of EA tariffs on OPC’s revenues and margins, see “Item 5. Operating and Financial Review and Prospects—Material Factors Affecting Results of Operations—OPC— Revenue—EA Tariffs.” Independent Power Producers (IPPs) Activity by IPPs, including the construction of private power stations and the sale of electricity produced therein, is regulated by IPP Regulations and the Cogeneration Regulations, as well as the rules, decisions, and standards established by the EA. OPC-Rotem has a unique regulation by virtue of a tender, as detailed below. According to the Electricity Sector Law, none of the actions set in the Electricity Sector Law shall be carried out by anyone other than a license holder. The Licenses Regulations include provisions and conditions in the matter of issuing licenses, rules for operating under such licenses and the obligations borne by license holders. In order to obtain a production license, an applicant must file a request in accordance with the relevant regulations, and meet the threshold conditions. Among others, the manufacturer bears the burden to prove that the corporation requesting the license has a link to the land relevant to the facility. According to EA rulings, subject to meeting the terms (and with the approval of the Minister of Energy for licenses exceeding 100 MW), the developer is granted a conditional license and, upon completion of construction of the facility and successful compliance with acceptance tests, a generation license. The conditional license holder must meet certain milestones for constructing its facility as detailed in the conditional license, and must also prove financial closing. Only after meeting these milestones and the commercial operation of the facility, the developer is granted a generation license (or Permanent License) determined by the EA for the period determined in such license (for licenses exceeding 100 MW, the license must be approved by the Minister of Energy).
This model, which is based on receiving a conditional license followed by a permanent license (subject to meeting the regulatory and statutory milestones), is applicable to both the production of electricity using all types of technology, with the exception of facilities with an installed capacity under 16 MW, for which no license is required for their operation. A party requesting a supply license must demonstrate compliance with the shareholders’ equity requirements as provided by the EA as a condition for receipt of a supply license for suppliers without means of generation.
According to the 20212022 Electricity MarketSector Status Report, as of 2021,2022, IPPs (including OPC-Rotem and OPC-Hadera)OPC power plants), including those using renewable energy, active in Israel have an aggregate generation capacity of 9,887approximately 11,706 MW, constituting 46%53% of the total installed generation capacity in the country. According to the Electricity Sector Status Report for 2021,2022, by the end of the IEC Reform period, the market share of the independent electricitypower producers (including OPC-Rotem and OPC-Hadera), including renewable energies, is expected to amount to approximately 69%66% of the total installed capacity in the sector. In generation terms, in 2025, the market share of the independent electricitypower producers (including OPC-Rotem and OPC-Hadera), including renewable energies, is expected to amount to approximately 62%60% of the total generation in the market. The regulatory arrangements applicable to IPPs were determined while distinguishing between the different generation technologies they use and the various levels of voltage they will be connected to (according to installed capacity). The following are the key electricity production technologies used by private producers in Israel:
| • | Conventional technology – —electricity generation using fossil fuel (natural gas, diesel oil or carbon). As of December 31, 2021,2022, the total installed capacity in this technology which is primarily held by the independent producers, is about 5,931 megawatts.6,607 MW. Gas-fired combined cycle generation facilities are planned to be operational during most hours over the year. Conventional open cycle power plants (the “peaker power plants”) are generally planned to operate for a number of hours during the day; these power plants are operated when the demand for electricity exceeds the supply supply–- whether due to demand peaks, as backup in case of malfunctions in other generation facilities, or as a supplement when solar energy is unavailable – unavailable—whether in the early morning hours or at night. |
| • | Cogeneration technology – —electricity generation using facilities that simultaneously generate both electrical energy and useful thermal energy (steam) from a single source of energy. Exercise of the quota of generatorsfor producers using this technology amounts to approximately 990 MW assigned under the current regulation.is fully utilized. |
| • | Renewable energy – —generation of electric power the source of energy of which includes, inter alia, sun, wind, water or waste. In November 2020, the Israeli government updated the generation targets for renewable energy to 30% of the consumption up to 2030. As of the end of 2022, the installed capacity of renewable energy generation facilities was 4,795 MW. In recent years, there has been an uptick in the entrance of electricity producers and generation facilities that use renewable energies in to the electricity generation market, including solar energy, wind energy, and storage; that use the grid resources. MostIn 2023, most of the renewable energy generation activities arewas sold to the System Operator or for producer’s own consumption and to the onsite consumers. |
| • | Pumped storage energy – —generation of electricity using an electrical pump connected to the power grid in order to pump water from a lower water reservoir to an upper water reservoir, while taking advantage of the height differences between them in order to power an electric turbine. The capacity of one of the production facilities (which is in operation) using this technology amounts to 300 MW, with two additional facilities using this technology with capacity of approximately 800 MW are under construction. |
| • | Energy storage – —this is possible through a range of technologies, including, among others, pumped storage, mechanical storage (for example compressed air) and chemical storage (for example batteries). Considering the Israeli government decision that provides a target for generation of electricity using renewable energies (mainly solar energy) at the rate of 30% out of the generation up to 2030, the EA estimates that the electricity sector in Israel will need to prepare for construction of facilities for energy storage. The use of this technology is currently negligible; however, it is expected to increase significantly in the upcoming years due to the need for storage facilities as a result of the anticipated increase in renewable energies.energies, due to, among other things, the renewable energies generation targets. In particular, based on study conducted by EA, publications, compliance with the target for renewable energies up to 2030 will require construction of storage facilities with a capacity of thousands of MWh, deriving from the readiness of the technology and the economic feasibility of its use. OPC takes steps to integrate energy storage. For example, OPC entered into a number of agreements for generation of electricity at the consumers’ premises, which allow OPC to build storage facilities.facilities as well as in the Ramat Beka Solar Project. |
According to the Electricity Sector Law, the IEC, as an essential service provider, is committed to purchasing electricity from IPPs at the rates and under the conditions set in the Electricity Sector Law and the regulations and standards promulgated thereunder (and, in relation to OPC-Rotem, by virtue of the tender and OPC-Rotem’s PPA with the IEC). In addition, the IEC is committed to connecting the IPPs facilities to the distribution and transmission grid and providing them with infrastructure services in order to allow IPPs to provide power to private customers and system administration service. In accordance with the EA’s resolution entitled “Principles for the Integration of the IEC into the Field of Energy Storage in the Transmission and Distribution Grid” of January 18, 2023, the IEC’s market share in the field of storage shall not exceed 15% of the market share of the private market. The deployment plan that will be filed by the IEC for the construction of storage facilities will be coordinated with the System Operator and approved by the EA in view of the purpose of the storage facilities it will build, for system-wide purposes. The facilities will be operated by the IEC under the directives of the System Operator, and its supervision and control. Independent Electricity Suppliers The electricity suppliers operate through supply licenses, by virtue of which they are allowed to sell–- to consumers or to suppliers–- electricity they generate or purchase, in accordance with the terms and conditions of the licenses and the regulations that apply to them. During 2023, following EA regulations in respect of the suppliers without means of production, the private activity in the supply segment expanded, including offers to sell electricity to household consumers. Further to the above, in February 2024, the EA published a hearing regarding the incorporation of basic meters in the competition in the supply segment; according to the EA, in order to remove barriers and promote competition in the supply segment, to allow household consumers to belong to independent suppliers regardless of the installation of a smart meter. Accordingly, the proposed resolution regulates the netting procedure of suppliers with the System Operator, and the latter’s netting with the IEC, such that a household consumer without a smart meter will be able to join the competitive supply segment, allowing private electricity suppliers to be able to sell electricity to consumers who own a basic meter, as part of the virtual supply activity. Electricity Consumers In recent years more so than in the past, due to the Israeli government’s targets with respect to renewable energies and the targets of the Minister of Energy for decentralized generation, the impact of electricity consumers on the market has strengthened. In recent years, there is a global trend of transition from generation of electricity using fossil fuels to generation using renewable energy technologies due to, among other things, the increasing awareness of the climate change crisis, as well as in light of the decline in the construction costs of the renewable energy facilities, particularly the photovoltaic generation facilities. In addition, recently, including due to technology developments, including the introduction of electric vehicles, and the definition of the renewable energy targets set by the Israeli government and the targets set by the Ministry of Energy for decentralized generation, the status of the electricity consumers consumers–- as active stakeholders stakeholders–- has strengthened. In accordance with the regulations forecast as per the EA’s decision to deploy smart meters, in 2023, the number of smart meters will reach 300,000. OPC believes, the steps taken by the EA to open up the supply segment to competition, including decisions regarding installation of smart meters and licensing suppliers without means of production, are expected to expandincreased the number of entities operating in the households consumption segment, and the scope of consumption associated with independent suppliers and in a manner that is expected to enhance the growing competition in this segment. For example, in June 2023, the EA approved a plan to expand the deployment of the smart meters, where an essential service provider shall complete the replacement of the meters of all Israeli consumers to smart meters by December 31, 2028. The deployment plan is expected to include the replacement of approximately 2.7 million meters, including the installation of smart meters with new connections. The number of smart meters in Israel in 2029 is expected to reach approximately 3.5 million. In February 2024 the EA published a hearing on the “incorporation of basic meters in the supply competition,” pursuant to which the supply of electricity to household consumers will be allowed also through a uniform meter, regardless of installation of a smart meter. Market model for generation and storage facilities connected to or integrated into the distribution grid In September 2022, the EA published a resolution on “market model for generation and storage facilities connected to or integrated into the distribution grid.” The resolution regulates the generation activity of generation (all(using all different technologies) and storage facilities in the distribution grid, and determines their option to sell electricity directly to virtual suppliers as from January 2024. The resolution allows forAs a practical matter, the decision permits opening of the supply segmentsector to competition while removing the quotas that were previously setprovided regarding this matter. The main goalprinciples of the resolution is: (i)are: allowing the possibility of sale of energy from a generation facility to a private virtual provider assupplier commencing from January 2024, and (ii)2024; allowing the transferpossibility of transitioning from other existing regulations forwith respect to the generation facility tounder this regulation; implementationand acceptance of a generation plan forof high voltagetension facilities by the distributor and provision of a load plan. AsProducers connected to the distribution grid may also sell to consumers (through virtual suppliers) as part of the resolution, the formula for acquiring electricity through the virtual supplier was amended such that the difference between the cost of acquiring the supplier’s energy and the cost of selling the energy to IEC’s consumers was minimized, and a unified tariff was set (which is based on an economy-wide profile) in respect of acquisition of electricity during peak demand hours net. In fact, the resolution allows for the opening of the supply segment to competition, while removing the quotas that were previously set regarding this matter.market distribution model. OPC expects that, in the short term, the resolution reduces the economic viability of the virtual supply activity, compared to the conditions prior to the resolution, and in the long term, the resolution encourages increased competition in the supply segment while integrating generation facilities and storage facilities. Regulatory Framework for Conventional IPPs The regulatory framework for current and under construction conventional IPPs was set by the PUAE in 2008. An IPP may choose to allocate its generation capacity, as “permanently available capacity,” or PAC, or as “variable available capacity,” or VAC. PAC refers to capacity that is allocated to the IEC and is dispatched according to the IEC’s instructions. PAC receives a capacity payment for the capacity allocated to the IEC, as well as energy payment to cover the energy costs, in the event that the unit is dispatched. VAC refers to capacity that is allocated to private consumers, and sold according to an agreement between the IPP and a third party. Under VAC terms, IPP shall be entitled to receive availability payments for excess energy not sold to private customers. In addition, the IEC can purchase electricity allocated to it at variable availability, on a price quote basis. Within this regulatory framework, a private electricity producer can choose to allocate between 70% and 90% of their production capacity at high availability, and the rest at variable availability. Upon the development of the electricity sector and the full utilization of EA Regulation 241 quotas, the EA published a follow-up arrangement for conventional producers, and implemented dispatch of IPPs according to the economic dispatch order. According to this regulation, the production units shall be dispatched in accordance with an economic dispatch principle and independent of PPAs between producers and customers, and shall apply to producers with an installed capacity higher than 16 MW and up to a total output of 1,224 MW. This regulation is referred to as “Regulation 914.” In May 2017, the EA amended Regulation 914. Under the amendment, a higher tariff was adopted for production facilities that comply with certain flexible requirements. The amendment also offers open-cycle producers several alternatives including receiving surplus gas from the gas agreementsas part of other producers.Regulation 914. The total quota for new facilities pursuant to this arrangement was limited to 1,100 MW distributed across various plants (at least 450 MW and up to 700 MW for combined cycle facilities, at least 400 MW and up to 650 MW for flexible open cycle facilities). Furthermore, under the amendment the EA prohibits entry into bilateral transactions by open-cycle facilities and demands that combined-cycle facilities sell at least 15% of their capacity to private consumers. For example, Tzomet operates in accordance with Regulation 914. Finally, in order to grant IPPs sufficient time to reach financial closing, Regulation 914 was extended to apply to producers who will receive licenses no later than January 1, 2020. In November 2018, the EA published a decision regarding the activity arrangement of natural gas generation facilities connected to the distribution network. Pursuant to this decision, generators under 16 MW are encouraged to construct power plants within customers’ facilities. These power plants will only be permitted to sell electricity to customers within the facility (and not other private customers) and the System Operator. In 2019, the EA announced a tender to establish and allot the capacity tariff for facilities connected to the distribution grid producing electricity with natural gas. In March 2019, the EA published a decision regarding the establishment of generators connected to the high-voltage network without a tender process. This decision would permit the establishment of generation facilities that are connected to the transmission grid or integrated in the connection of a consumer connected to the transmission grid (excluding renewable energy) for a maximuman aggregate installed capacity of 500 MW and provided they receive tariff approval by May 1, 2024 as extended by EA resolution on November 29, 2023 which postponed the enddeadlines for construction of 2023.electricity generation facilities due to the security condition. These generation facilities will only be permitted to sell electricity to customers within the facility (and not other private customers) and to provide the rest of their available capacity to the System Operator, that will upload the capacity to the grid according to central upload system. The EA has stated that it intends to publish information on the tender process for construction of such generation facilities in the future.
In December 2021, the Electricity Sector Regulations (Promotion of Competition in the Generation Segment) (Temporary Order), 2021 were issued by the Minister of Energy after consultation with the Competition Commissioner. The regulations were published under a temporary order and are in effect for three years, i.e. until November 30, 2024.years. The purpose of the regulations is to promote competition in the generation segment of the electricity sector. Pursuant to the regulations, a person will not be granted a generation license or approval in accordance with Sections 12 or 13 of the Electricity Sector Law upon existence of one of the following: (i) following the issuance, the person will hold generation licenses or connection commitment for gas-fired power plants the total capacity of which exceeds 20% of the planned capacity for this type of power plant. As of March 19, 2023, accordingplants. According to the appendix attached to the regulations - regulations—the planned capacity for 2024 for gas-fired power generation units is 16,700 MW; (ii) after the allocation, the person will hold generation licenses or connection commitment for more than one power plant using pumped storage technology; (iii) after the allocation, the person will hold generation licenses or connection commitment for wind-powered power plants where the total capacity exceeds 60% of the planned capacity for this type of power plant, which, according to the appendix, is 730 MW for 2024. Pursuant to the regulations, notwithstanding the above, the EA may grant such a generation license or approval on special grounds that shall be recorded (after consultation with the Israel Competition Authority) and for the benefit of the electricity sector. Furthermore, the EA may refrain from granting a generation license or from approving a connection to the grid if it believes that the allocation is likely to prevent or reduce competition in the electricity sector after taking into account additional considerations, including the impact of holdings of a person in other generation licenses that do not constitute a holding of a right as defined in the regulations, the impact of joint holdings in companies with a holder of other rights, as well as the impact of holdings of a person in holders of licenses that were granted under the Natural Gas Market Law. For the purpose of calculating the holdings in rights or a connection commitment, a person shall be viewed as a holder regarding the entire installed capacity of the generation license or the connection commitment. It is noted that theThe “planned capacity” of gas-fired power plants for 2024 in accordance with the regulations (16,700 MW) includes gas-fired generation facilities without distinguishing between an essential service provider (IEC)(the IEC), independent electricitypower producers and the relevant types of arrangements, as opposed to the “planned installed capacity” stated in the Sector Consulting Principles published by the Competition Commissioner (10,500 MW, and it does not include the capacity owned by the IEC), which preceded the regulations. OPC-Rotem’s Regulatory Framework OPC-Rotem operates according to a tender issued by the state of Israel in 2001 and, in accordance therewith, OPC-Rotem signed a PPA with the IEC in 2009 (the “IEC PPA”), which stipulates OPC’s regulatory framework. This PPA will be assigned by the IEC to the System Operator. OPC-Rotem’s framework differs from the general regulatory framework for IPPs, as set by the PUAE and described above. According to the IEC PPA, OPC-Rotem may sell electricity in one or more of the following ways:
| 1. | Capacity and Energy to the IEC: according to the IEC PPA, OPC-Rotem is obligated to allocate its full capacity to the IEC. In return, the IEC shall pay OPC-Rotem a monthly payment for each available MW, net, that was available to the IEC. In addition, when the IEC requests to dispatch OPC-Rotem, the IEC shall pay a variable payment based on the cost of fuel and the efficiency of the station. This payment will cover the variable cost deriving from the operation of the OPC-Rotem Power station and the generation of electricity. Subject to the provisions of the IEC PPA, in the event of ongoing failure in the supply of natural gas, OPC-Rotem is entitled to make OPC-Rotem power plant’s capacity available to the System Operator against reimbursement in respect of the cost of using diesel fuel (in respect of which Rotem pays an annual premium), and receipt of payment for capacity. The provision of capacity to the System Operator has a significantly lower economic viability than that of sale to consumers. |
| 2. | Sale of energy to end users: OPC-Rotem is allowed to inform the IEC, subject to the provision of advanced notice, that it is releasing itself in whole or in part from the allocation of capacity to the IEC, and extract (in whole or in part) the capacity allocated to the IEC, in order to sell electricity to private customers pursuant to the Electricity Sector Law. OPC-Rotem may, subject to 12-months’ advancedadvance notice, re-include the excluded capacity (in whole or in part) as capacity sold to the IEC. |
OPC-Rotem informed the IEC, as required by the IEC PPA, of the exclusion of the entire capacity of its power plant, in order to sell such capacity to private customers. Since July 2013, the entire capacity of OPC-Rotem has been allocated to private customers. The IEC PPA includes a transmission and backup appendix, which requires the IEC to provide transmission and backup services to OPC-Rotem and its customers, for private transactions between OPC-Rotem and its customers, and the tariffs payable by OPC-Rotem to the IEC for these services. Moreover, upon entering a PPA between OPC-Rotem and an individual consumer, OPC-Rotem becomes the sole electricity provider for this customer, and the IEC is required to supply power to this customer when OPC-Rotem is unable to do so, in exchange for a payment by OPC-Rotem according to the tariffs set by the EA for this purpose. For further information on the risks associated with the indexation of the EA’s generation tariff and its potential impact on OPC-Rotem’s business, financial condition and results of operations, see “Item 3.D Risk Factors—Risks Related to OPC’s Israel operations—Operations—OPC’s profitability depends on the EA’s electricity rates.rates and tariff structure.” In November 2017, OPC-Rotem applied to the EA to obtain a supply license for the sale of electricity to customers in Israel. In February 2018, the EA responded that OPC-Rotem needs a supply license to continue selling electricity to customers and that the license will not change the terms of the PPA between OPC-Rotem and the IEC. The EA also stated that it will consider OPC-Rotem’s supply license once the issue of electricity trade in the Israeli economy has been comprehensively dealt with. OPC-Rotem has not received a supply license to date and there is no assurance regarding the receipt of the license and its terms. If OPC-Rotem does not receive a supply license, it may adversely affect OPC-Rotem’s operations. In February 2020, the EA publishedpursuant to the resolution made in Meeting 573 regarding deviationsdeviation from the consumption plan. Pursuant to the resolution, a supplier may not sell more to its consumers than the total capacity that is the object of all the engagements it has entered into with independent production license holders. Actual energy consumption at a rate higher than 3% of the installed capacity allocated to the supplier will trigger payment of an annual tariff reflecting the annual cost of the capacity the supplier used as a result of the deviation, as detailed in the resolution. In addition, the resolution stipulates a settlement of accounts mechanism due to a deviation from the daily consumption plan (surpluses and deficiencies), that will apply in addition to such annual tariff payment. The decision applies to OPC-Hadera and is expected to apply to OPC-Rotem after the complementary arrangements are set. On February 19, 2023, the EA published a proposed resolution to apply criteria to OPC-Rotem as part of a move that was designed to unify the regulations that apply to OPC-Rotem and all other bilateral producers, including the application of the market model to OPC-Rotem. In February 19, 2023, the EA published a proposed resolution for the application of covenantscriteria and complementary arrangements to OPC-Rotem. In March 2024, the EA issued a resolution that addresses the application of certain standards to OPC-Rotem, including those regarding deviations from consumptions plans submitted by private electricity suppliers, and the award of a supply license to OPC-Rotem (if it applies for one and complies with the conditions for receipt thereof). The resolution will come into force on May 1, 2024. This proposed resolution should it be passed, aligns in many respects the regulation applicable to OPC-Rotem with that applicable to generation facilities that are allowed to enter bilateral transactions, and enableswill enable OPC-Rotem to operate in the energy market in a manner that is similar and equal manner to that of other electricity generation facilities that are allowed to conduct bilateral transactions. As of March 19, 2023, the final resolution has not yet been made, and therefore, the extent of the resolution’s effect on OPC-Rotem is uncertain, and it depends, among other things, on the final supplementary arrangements to be determined. Regulatory Framework for Cogeneration IPPs The regulatory framework for current and under construction cogeneration IPPs was established by the PUAE in its 2008 and 2016 decisions.decisions (“Cogeneration Regulations”). A cogeneration IPP can sell electricity in the following ways:
| 1. | At peak and mid-peak times, one of the following shall apply: |
| a. | each year, the IPP may sell up to 70% of the total electrical energy, calculated annually, produced in its facility to the IEC—for up to 12 years from the date of the grant of the license; or |
| b. | each year, the IPP may sell up to 50% of the total electrical energy, calculated annually, produced in its facility to the IEC—for up to 18 years from the date of the grant of the license. |
| 2. | At low demand times, IPPs with units with an installed capacity of up to 175 MW, may sell electrical energy produced by it with a capacity of up to 35 MW, calculated annually or up to 20% of the produced power, inasmuch as the installed output of the unit is higher than 175 MW, all calculated on an annual basis. |
According to the regulations, if a cogeneration facility no longer qualifies as a “Cogeneration Production Unit,” other rate arrangements are applied to it, which are inferior to the rate arrangements applicable to cogeneration producers. In March 2019, the EA published a proposed decision for hearing regarding arrangements for high voltage generators that are established without a tender process.process which sets out regulatory principles applicable to generation facilities that are connected to the transmission grid or are integrated into a consumer connection that is connected to the transmission grid (excluding renewable energies) that will receive tariff approval up to December 31, 2023, subject to a maximum total quota of 500 MW (of which at least 250 MW will be allocated to generation facilities that are constructed on premises of desalinization facilities under a tender issued by the Accountant General in the Finance Ministry of Finance). This would also enableregulation enables the establishmentconstruction of generation facilities, such as generation facilities on the premises of desalination facilities, cogeneration facilities.facilities and facilities for independent generation. Such facilities will be allowed to supply the electricity generated by them directly to the onsite consumer and to transfer any surplus to the electrical grid—all in accordance with the Trade Rules. The Sorek 2 power plant is expected, among other things, to operate by virtue of this regulation, subject to the completion of its construction. In January 2024, the EA published a hearing regarding regulation for conventional generation units, which regulates a quota and a tariff for the construction of generation facilities using conventional technology with a capacity of over 630 MW. According to the hearing, the capacity tariff for a generation facility in a site that does not have existing generation facilities, or after financial closing shall be determined at a later date, based, among other things, on the capacity tariff in the winning bid in the Sorek tender; and for an adjacent generation facility–- the tariff will be lower by 1.0 agorot from the said tariff. The tariff quota is limited to two generation units at most, with each unit having a capacity of 630–- 900 MW under ISO conditions (subject to a discharge restriction of 670 MW until 2035), and is conditional upon arriving to financial closing, no later than December 31, 2025. If a resolution is passed further to the hearing, OPC intends to promote the development activities of Hadera 2 in this framework, all subject to the completion of the planning procedures and receipt of government approval. OPC-Hadera’s Regulatory Framework In connection with construction of a cogeneration power station in Israel, OPC-Hadera reached its COD on July 1, 2020. In June 2020, the EA granted a permanent license to the OPC-Hadera power plant for generation of electricity using cogeneration technology having installed capacity of 144 MW and a supply license. The generation license is for a period of 20 years, as is the supply license so long as a valid generation license is held (the generation license may be extended by an additional 10 years). In connection with above, OPC-Hadera must meet certain conditions before it will be subject to the regulatory framework for cogeneration IPPs and be considered a “Cogeneration Production Unit.” For example, OPC-Hadera will have to obtain a certain efficiency rate which will depend, in large part, upon the steam consumption of OPC-Hadera’s consumers. In circumstances where OPC-Hadera no longer satisfies such conditions and therefore no longer qualifies as a “Cogeneration Production Unit,” other rate arrangements, are applied to it, which are inferior to the rate arrangements applicable to cogeneration producers. Tzomet’s Regulatory Framework The Tzomet power plant is expected to be constructed pursuant to Regulation 914 and will beis subject to the conditions and limitations thereunder, see “—Regulatory Framework for Conventional IPPs.” In September 2019, Tzomet received the results of an interconnection study performed by the System Operator. The study included a limitation on output of the power plant’s full capacity to the grid beyond a limited number of hours per year, up to completion of transmission projects by the IEC, which are expected to be completed by the end of 2023. In December 2019, the EA approved Tzomet’s tariff rates, which will be applicable upon completion of the power plant and receipt of a permanent generation license.license, which took place in June 2023. Given the limitation included in the interconnection study, Tzomet will bewas subject to a reduced availability tariff during 2023. See “Item 3.D Risk Factors—Risks Related to OPC’s Israel operations—Operations—OPC faces limitations under Israeli law in connection with the expansion of its business.” In January 2020, Tzomet entered into a PPA with the IEC, the government-owned electricity generation, transmission and distribution company in Israel, or the Tzomet PPA (in October 2020, OPC-Rotem received notice of assignment by the IEC to the System Operator which was subsequently reassigned to Noga). The term of the Tzomet PPA is for 20 years after the power station’s COD. According to the terms of the Tzomet PPA, (i) Tzomet will sell energy and available capacity to the IEC and the IEC will provide Tzomet infrastructure and management services for the electricity system, including back-up services (ii) all of the Tzomet plant’s capacity will be sold pursuant to a fixed availability arrangement, which will require compliance with criteria set out in Regulation 914, (iii) the plant will be operated pursuant to the System Operator’s directives and the System Operator will be permitted to disconnect supply of electricity to the grid if Tzomet does not comply with certain safety conditions and (iv) Tzomet will be required to comply with certain availability and credibility requirements set out in its license and Regulation 914, and pay penalties for any non-compliance. Once the Tzomet plant reaches its COD, itsplant’s entire capacity will beis allocated to the System Operator pursuant to the terms of the Tzomet PPA, and Tzomet will not be permitted to sign agreements with private customers unless the electricity trade rules are updated. Tzomet License In June 2023, the EA issued a permanent license to the Tzomet power plant for electricity generation using conventional technology at a capacity of 396 MW. The license is granted for 20 years, and may be extended by the EA upon the request of the license holder. The EA may, subject to approval of the Minister of Energy, alter the terms and conditions of the license, (a) if there is a change in the license holder’s ability to comply with the terms and conditions or to perform the actions and services covered by the license, which does not justify revoking the license; (b) there are changes in the electricity market; (c) to ensure competition in the electricity sector; (d) to ensure compliance with the level of service prescribed by the license; and (e) there are changes to be made to the facility or technology; (f) there are changes to be made to the facility or technology, which is the subject matter of the license. In addition, the EA may cancel the license or attach conditions thereto before the end of its term, under certain circumstances that were set in the license. Restrictions are in place regarding changes to the generation facility, which is the subject matter of the license, including changes to the facility’s capacity, the facility’s model, its technology, including improvements to an existing facility. Provisions were set regarding the emptying of each of the diesel fuel containers and the fuel refreshing capabilities of each of the diesel fuel containers, including emptying the bottom of the containers. The license may not be transferred, pledged or foreclosed without the advance approval of the EA. The assets to which the license relates may not be sold, leased or pledged without first obtaining the approval of the EA. In addition, any change, restructuring, or transfer of control in Tzomet requires approval of the EA as specified in the license. The license imposes additional obligations on Tzomet, including the provision of a lawful guarantee, regular and efficient operation in compliance with the license, compliance with a minimum equivalent operating capacity of 88% at all hours during the first year of operation and 92% at all hours during subsequent years, testing and compliance with insurance requirements, and restriction of activity, by way of an act or omission, that might restrict the competition in the electricity sector or have an adverse effect thereon. Tzomet has not entered into a gas supply agreement yet, but has the option to engage with a gas supplier or have its gas supplied by the IEC. Kiryat Gat’s Regulatory Framework In November 2019, the Israeli Electricity Authority decided to issue an electricity supply license to Kiryat Gat. The validity of the supply license is twenty years, subject to Kiryat Gat holding a valid generation license. The electricity supply license allows it to sell electricity to consumers which have a consecutive meter installed in their consumption location—at the higher of the following two amounts: (a) 33% of electricity capacity sold by holders of private supply licenses to consumers; and (b) the capacity that is the subject of the generation licenses held by the license holder less the capacity it allocated to the System Operator. The license holder will enter into a contract agreement with a consumer for the provision of the service, which will be prepared in accordance with the guidelines specified in the license. The EA may alter the terms and conditions of the license, add or detract therefrom, among other things, and without detracting from the provisions of the law, in cases that are similar to those listed above in relation to Kiryat Gat’s production license. In addition, the EA may cancel the license or attach conditions thereto before the end of its term, under certain circumstances that were set in the license. The license holder may contract with a consumer connected to the low voltage grid under an agreement that includes a commitment to meet the terms and conditions regarding the scope of consumption of the services, the payment amount or the terms of payment for a period not exceeding twelve months. United States The electricity market in the United States has both Federal oversight (wholesale sales of electricity and inter-state transmission) and State oversight (retail sales of electricity and provision of distribution service to end users). The major players in the US electricity sector are RTO, FERC, and ISO, electricity producers (which are, in general, private entities) and electric utility companies and electricity distribution companies operating on behalf of the different consumers (such as private and commercial consumers). The primary federal regulator is the Federal Energy Regulatory Commission (FERC), alongside separate state-level Public Service Commission’s exercising oversight in their respective states. The wholesale electric marketplace in the United States operates within the framework of several FERC-approved regional or state market operators, including RTO or ISO. RTO/ISOs are responsible for the day-to-day operation of the transmission system, the administration of the wholesale markets in the regions in which they operate, and for the long-term transmission planning and resource adequacy functions. The PJM market The PJM Interconnection (PJM) is an RTO and ISO that operates a wholesale electricity market and serves as an administrator of the electric transmission system which covers parts of Delaware, Illinois, Indiana, Kentucky, Maryland, Michigan, New Jersey, North Carolina, Ohio, Pennsylvania, Tennessee, Virginia, West Virginia, and the District of Columbia, serving more than 65 million residents. The PJM market is the largest among the RTOs with approximately 187195 gigawatts of installed capacity and peak demand of approximately 150149 gigawatts in 2022.2023 and its internal forecasts indicate a peak demand of approximately 150 GW for 2024. PJM oversees the operation of more than 150,000 kilometers of transmission lines and its internal forecasts indicate a peak demand of approximated 163 GW for 2023.lines. Sale of electricity in the organized PJM market is supervised and managed by PJM to assure supply of the electricity, based on price offers of the electricity generators. The PJM is supervised by and receives its authority from the FERC and is financed by payments from participants in the market. PJM collects payments for capacity, electricity, transmission, accompanying services and other services required for operation of the electricity system from utilities and electric distribution companies acting on behalf of consumers (households, commerce and industry), and distributes the payments to the generators and transmitters, by means of a variety of market mechanisms, including purchase of capacity (Forward Capacity Market) and an electricity acquisition mechanism in the Day-Ahead and Real-Time markets. In general, the capacity price is determined in an annual tender for operations over one year three years in advance and is guaranteed without reference to the actual amount of electricity generated. For the supply year starting 2023/2024, the capacity tender on the PJM was postponed due to FERC’s procedure for assessing the fairness and reasonableness of the methodology and inputs used to determine the tender prices in PJM’s reserves capacity tender. The capacity tenders for 2023/2024 took place in June 2022; they are expected to be held every six months until the normal timelines for three-year forward tenders is renewed. Subsequently, the tenders are expected to continue as stated above. Payments for electricity are made for actual electricity generation and are determined on the basis of the marginal price in the market. A capacity auction for 2024/2025 was held in December 2022, and its results were published in February 2023. 117
The 2025/2026 capacity auction is currently on hold pending FERC approval of PJM’s proposed capacity market rule revisions. PJM has tentatively scheduled the 2025/2026 capacity auction for July 2024 and the final schedule is expected to be determined once FERC has issued a decision in the matter. Requests for network connections. The increasing demand for renewable energy in the PJM, MISO and SPP electricity markets, led to an increase in demand for connections to the grid and requests for connection surveys of projects to the grid. These demands cause overload and delays in processes for approving the connection, and may affect the procedure and pace of advancing the project. In April 2021,2022, the Interconnection Process Reform in the PJM set up a dedicated task force for applyingmarket was approved; the reform was designed to regulate the process of the interconnection process; the task force is comprised of PJM’s teams and teams of stakeholders thereof; the objective of the task force is to assess and suggest reforms in PJM’s electricity transmission system that will address, among other things,addressing the large backlog of proposed projects that await the completion of their interconnection surveys, and include system upgrade costs for each proposed project. PJM’s teams and management suggested a new work framework for the system interconnection process, including an interim process that regulates the period of transition from the existing process to the new work framework.applications by PJM. In November 2022, the reform was approved by the FERC (subject to conditions), and entered into effect in January 2023. In July 2023, FERC denied the frameworkrequest for rehearing of its order, and the changes,order has been appealed to the U.S. Court of Appeals for the D.C. Circuit. Under the current protocol, PJM will make preparations forholds a comprehensive, three-phased interconnection analysis procedure that will applyapplies to all applicants who have filed an interconnection application within the samerelevant time frame. At the end of the three phases, there will beis a period during which entities will beare able to engage in interconnect agreements. ProjectsHowever, projects that do not need grid upgrades will beare allowed to progress to the interconnect agreement phase after the first two stages. CPV is of the opinion that the implementation of this reform may cause aan up to two-year delay in the construction and commercial operation of certain projects in the PJM market, depending, among other things, on the costs of the required grid upgrades, and on how far they are in the interconnection process. The Maple Hill and Three Rivers projects which are presently in the construction stages are not expected to be impacted by the reform. The NYISO market The NYISO market has operated since 1999, and is one of the most advanced electricity markets in the United States and in the world. The NYISO market includes about 41 gigawatts of installed capacity and more than 18,000 kilometers of transmission lines, serving about 20 million customers with a peak demand of about 32 gigawatts. The market is divided into 11 regions (zones). The pricing of the electricity and the capacity varies among the regions based on demand and available supply. The NYISO electricity market includes a Day-Ahead and Real-Time market for the sale of electricity and other ancillary services. In addition, the NYISO has operated a capacity market since 2003. Capacity prices are determined on a monthly basis, with up to six-month forward auctions. Capacity payments are guaranteed without reference to the amount of electricity actually generated. The electricity prices are determined on the basis of the marginal price on the market. ISO–NE is the ISO responsible for managing the day-to-day operation of the New England transmission system, as well as administering the wholesale electricity and capacity markets in New England. ISO–NE was created in 1997 to operate the wholesale power market under the direction of the New England Power Pool (NEPOOL). In 2005, it became an independent RTO, assuming broader authority over the day-to-day operation of the power system, market administration, and transmission planning with direct control over the transmission rates and market rules. The ISO-NE managed footprint covers Connecticut, Massachusetts, New Hampshire, Rhode Island, Vermont, and most of Maine. It serves about 15 million residents with a generation scope of about 33 gigawatts and peak demand of about 28 gigawatts. ISO-NE administers more than 14,000 kilometers of transmission lines ranging from 69kv to 345kv and including several tie lines to neighboring control areas NY, Quebec, and New Brunswick. ISO–NE is a non-profit FERC-regulated entity which operates pursuant to a tariff on file with FERC. The markets in New England includeincludes a Day Ahead and Real Time Energy Market for the sale of electricity, a Forward Capacity Market of tenders for operations over one year three years in advance. New projects have the option of ensuring capacity for a longer period, and other ancillary services. Regulation permits/licenses In general, CPV’s facilities and operations are regulated under a variety of federal and state laws and regulations. For example, the construction and operation of CPV’s natural gas-fired power plants are subject to permitting and emission limitations pursuant to the CAA and related state laws and regulations that implement the CAA, which laws and regulations and may be more stricter than the provisions of the federal CAA depending on the state in which a plant is located. The CPV Group is required to hold major source permits (mostly issued by the environmental protection agencies in each state) before the commencement of the construction of such power plants. Depending on air quality in a certain region and its being in line with air quality standards, CPV may be required to obtain emission reduction credit in order to offset potential emissions of each power plant (as it’s the case in connection with natural gas-fired power plants that were or will be built by the CPV Group in New York, New Jersey, Connecticut and Illinois). Furthermore, the CPV project companies are generally required to obtain Title V operating permits in order to operate these plants. Such permits will incorporate regulatory standards that apply to air-polluting emissions for natural gas-fired power plants and relevant conditions that are to be met under the building permits issued for such plants. Those standards include technology-based pollution control limitations, and also include restrictions on allowed emissions of SO2 and/or NOx on an annual basis or on the basis of “ozone” season for offsetting annual or ozone season emission, pursuant to the Federal Acid Rain Regulations (which applies in all states to annual SO2 emissions from fossil-to-fuel fired power plants) and the Cross-State Air Pollution Rule. Most of CPV’s natural gas-fired power plants are subject to the Cross State Air Pollution Rule, which requires certain state in the eastern half the United States (“upwind” states) to improve air quality by reducing NOx and/or SO2 emissions of power plants that cross state lines and contribute to smog and soot pollution in the downwind states. In April 2022,2015, the U.S.United States Environmental Protection Agency ("EPA") revised its ozone gas standards and states were required to submit state implementation plans by 2018 to comply with the new, more stringent standards. In February 2023, EPA disapproved of 21 states’ submissions; each of these states had proposed taking no action to revise their existing plans. On March 15, 2023, EPA issued a number of revisions tofederal implementation plan, called the Cross-State Air Pollution Rule“Good Neighbor Plan,” covering those 21 states. The Good Neighbor Plan imposes requirements on fossil fuel-fired plants in 22 states and industrial sources in 20 states. The plan establishes an allowance-based NOx emissions trading program for power plants in order to ensure that emissions from upwind states aredo not contributinginterfere with downwind statesstates’ ability to achieve and maintain compliance with the 2015 ozone national ambient air quality standard,standard. There have been numerous lawsuits filed challenging the Good Neighbor Plan and related EPA actions. As of January 24, 2024, the plan’s requirements for power plants are in effect in ten states that are not subject to judicial stays or interfering with downwind states’ abilityinterim final rules: Illinois, Indiana, Maryland, Michigan, New Jersey, New York, Ohio, Pennsylvania, Virginia, and Wisconsin. The Court is scheduled to maintain compliance with such standard. The regulation, when finalized, will result in the revised state NOx ozone season emissions budgets and will also modify various aspectshear arguments on petitions to postpone implementation of the program, including making dynamic adjustmentsrule in February 2024 until the lawsuits challenging the plan have been resolved. The emission limits enforced by the EPA’s Good Neighbor Plan exceed the emission rates of the CPV Group’s power plants, under such circumstances, the Good Neighbor Plan is not expected to emissions budgets over timematerially impact the CPV Group’s operations if it were to reflect to changes in the generation fuel mix, and to modify the rules relating to the use of banked allowances.be upheld. Federal regulations require entities to report the emission of greenhouse gases emissions under the Clean Air Act (CAA). The CAA regulates emissions of air pollutants from various industrial sources, such as natural gas-fired power plants, including by requiring Title V Permits to Operate for such sources of air pollution emissions above certain thresholds. Furthermore, federal regulations also impose restrictions on carbon dioxide emissions from new combined cycle plants (whose construction commenced after January 8, 2014) or reconstructed (commenced reconstruction after June 8, 2014) combined-cycle power plants. States may also impose additional regulations or limitations on such emissions. Furthermore, 2223 states including(including Maryland, New York, New Jersey, Connecticut and Illinois, states in which the CPV Group operates, inoperates), the United StateDistrict of Columbia and Puerto Rico adopted legislative agendas and/or administrative orders in order to achieve carbon neutrality or 100% zero-emission electricity supply within the next 20-30 years. For example, CPV’s natural gas-fired power plants in Connecticut, New York, New Jersey and Maryland are subject to the RGGI, which requires CPV’s natural gas-fired plants to obtain, either through auctions or trading, greenhouse gas emission allowances to offset each facility’s emission of CO2. In its Title V application process, Valley was required to address New York legislation on such matters. Under the RGGI, an independent market monitor provides oversight of the auctions for CO2 allowances, as well as activity on the secondary market, to ensure integrity of, and confidence in, the market. In 2022,2023, the minimum price that carbon dioxide allowances could be sold for was $13.49$11.92 per allowance. A legal proceeding is outstanding in the state of Pennsylvania regarding whether the sale of carbon dioxide allowances pursuant to Pennsylvania’s carbon cap and trade budget program is an authorized “fee” or a “tax” that can only be imposed by the state legislature. ShouldOn November 1, 2023 a Pennsylvania court ruled that the RGGI constitutes a tax that requires legislative processes in order to enter into effect. This decision cancels the Pennsylvania courts upholdgovernor’s plan to impose RGGI by means of an administrative decision. The governor has appealed this ruling, and that appeal remains pending. Should RGGI be imposed and the court of Pennsylvania decide that the regulation applies, the power plants operating in Pennsylvania (including the Fairview power plant) are expected towould be required to purchase carbon dioxide allowances, as is the case for the Valley, Maryland, Shore, and Towantic power plants. The cost of acquiring the allowances in Pennsylvania is estimated at approximately $10 million per year (the CPV Group’s share), as from the date on which the decision is made (if made);however, the CPV Group believes that the cost may result in an increase in electricity prices across PJM.PJM which potentially could at least partially offset the cost of purchasing the allowances. CPV’s natural gas-fired projects are also subject to regulation under the CWA and related state laws in connection with any discharges of wastewater and storm water from its facilities. The CWA prohibits the discharge of pollutants into waters of the United States except pursuant to appropriate permits, including wastewater and stormwater permits under the National Pollutant Discharge Elimination System. The discharge of wastewater into public water sources may be subject to federal standards (depending on the source of the wastewater). For discharges from a facility that are directed to a publicly owned treatment works, the main regulator that regulates such discharges is, generally, a municipal authority that operates system for treating the wastewater. The projects of CPV are also subject, as applicable, to requirements under federal and state laws governing the management, disposal and release of hazardous and solid wastes and materials at or from its facilities, including the federal Resource Conservation and Recovery Act (“RCRA”) and the CERCLA (and equivalent state laws). RCRA requires owners and operators of facilities that generate and dispose of hazardous waste in third-party sites to obtain facility identification numbers from the EPA and to comply with the regulations that apply to storage and disposal of such waste. Facilities that store hazardous waste for periods longer than those set in the regulations, or which treat or dispose of the hazardous waste in the facility’s site are required to hold such a permit and operate in accordance with the provisions of RCRA Subtitle C permits. CPV facilities are operated in a manner whereby they are not required to RCRA Subtitle C permits. CERCLA, together with other state laws, stipulate that the current or previous owners, that operated facilities in which hazardous substances were discharged to the environment, or which transported waste containing hazardous substances to third parties’ waste sites, might be held liable by the United States government, state agencies or private entities, in respect of response costs borne by such entities to investigate and treat pollution in the said sites, or that might be subject to orders to investigate and treat such pollution as issued by the EPA or state agencies (under state regulations). Parties that were found liable under the CERCLA might also be found liable to damages caused to natural resources as a result of discharge of waste as stated above. Generally, parties that were found liable under the CERCLA and similar state laws are not covered by the defense claim whereby they acted in accordance with the applicable law. Furthermore, the liability generally applies “jointly and severally”; that is to say, the liable party may be liable to a share of the response costs amount that is larger than its share in the disposal of waste in the relevant site. The sites and operation of CPV’s renewable power projects are subject to a variety of federal environmental laws, including with respect to protection of threatened and endangered plant and animal species, such as the Endangered Species Act, the Migratory Bird Treaty Act, and the Bald and Golden Eagle Protection Act. These laws and their state and local equivalents provide for significant civil and criminal penalties for unpermitted activities that result in harm to or harassment of certain protected animals and plants, including damage to their habitats. The CPV Group’s operations in areas where there are threatened or endangered species, or in areas where there are critical natural habitats, may require certain permits or be subject to harsh restrictions or requirements to take protective measures in connection with these species. The CPV Group may also be prevented from developing projects in these areas. Furthermore, the CPV Group’s natural gas-fired projects are also subject to the said laws; however, these regulations have larger effect onlaws although to a lesser extent than wind and solar projects, given the area required to build such projects, their location, and in the case of wind projects, there is higher probability that birds and listed species of bats will be affected.solar. Projects that were awarded federal funding, or which are required to obtain a federal permit or other discretionary permit (except for a number of exceptions) are subject to the National Environmental Protection Act (“NEPA”), that requires federal agencies to assess the potential environmental impact of those permits and approvals. For example, if, due to the project’s impact on the ‘Waters of the U.S.’, it is required to hold an ‘Individual Section 404 Permit’ issued by the United States Army Corps of Engineers (the “ACOE”), which permits such an impact, then the project will be required to undergo an environmental impact survey under NEPA. The environmental impact survey might cause significant delays in the project’s development, depending on the project’s potential environmental impact. If a project is required to obtain federal approval, it will also be subject to the National Historic Preservation Act, which requires federal agencies to consider the effects of federal projects on significant historic, cultural and archaeological resources. The CPV Group’s project companies may be subject to other federal permits, licensing arrangements, approvals and other requirements by other federal agencies under various legislation, including the Advisory Council on Historic Preservation; the ACOE referred to above (in connection with the ‘Waters of the U.S.’); the United States Fish and Wildlife Service in connection with potential effects on endangered species, migratory birds, certain species of eagle, and natural habitats that are critical for those animals; and the Federal Bureau of Land Management (“BLM”), in connection with projects that require the use of federal land managed by the BLM and the EPA.federal government. Local or state regulations (including dedicated regulations requiring entities to obtain conditional or special use permits for the purpose of building a project), including, for example, the New York Accelerated Renewable Energy and Community Benefit Act (that applies to large-scale renewable energy projects in New York), may require a similar consultation with state agencies and/or conducting environmental impact surveys in accordance with state laws. CPV’s operations also are subject to a number of federal and state laws and regulations designed to protect the safety and health of workers, including the Federal Occupational Safety and Health Act, and equivalent state laws. Permits/licenses required in connection with operational projects As part of its activities, CPV is required to obtain and hold permits due to various federal, state and local legislation and regulations relating to power plant operations and environmental protection. Such permits are required both due to the activities of the power plants involving generation therein based on natural gas and the impact of the generation process on the air and water in the area of the facilities, as well as a result of construction of the renewable energy facilities (wind farms and solar fields) that could constitute environmental hazards and have a harmful impact on the area in which they are located. The main required permits/licenses (without distinction between different requirements of the various jurisdictions in which the power plants / facilities are located):
| 1. | CPV is required to hold permits in order to operate and/or construct the power plants, the purpose of which is prevention or reduction of air pollution. The power plants may also be required to hold permits for flowing water, waste-water and other waste into the local sewer systems or into other water sources in the United States. |
| 2. | Due to the height and location of the exhaust stacks and other components of the generation facilities, which could endanger the air traffic, the power plants are required to hold a permit for construction of the stacks and additional components in the generation facilities. This permit is issued by the Federal Aviation Authority (FAA). |
| 3. | Electricity production facilities using renewable energy are often required to hold coverage in accordance with general permits applicable to flood water and, the discharge of dredged and fill materials to the ‘Waters of the U.S.’ Depending on the area of the affected site, these facilities may be required to obtain individual permits from ACOE in respect of those effects; however, generally, it is possible to build projects in places that will not require such permits. |
| 4. | State and local permits for renewable energy facilities (the permit’s requirements depend on the state in which the project is built and its location within the state). |
All of CPV’s active plants, as well as the plant under construction, hold relevant valid permits for their operational and/or construction activities. With respect to Valley, it commenced operations in January 2018 under a combined Air State Facility and a pre-construction Prevention of Significant Deterioration permit (together, the “ASF Permit”), among other permits and approvals. Valley subsequently filed its Title V Air Permit Application on August 24, 2018, (which is required to replace the ASF Permit) and continued operations under the automatic permit extension provision in the State Administrative Procedure Act, which also extends the ASF Permit. The New York State Department of Environmental Conservation (“NYSDEC”) published notice on May 29, 2019 that the Title V application was complete. NYSDEC was required to make a final determination on Valley’s Title V permit application within eighteen months after the application was deemed complete. Rather than making a final determination within that time frame, however, NYSDEC revoked its prior application completeness determination and issued a Notice of Incomplete Application on November 29, 2020. NYSDEC stated that Valley was required to provide an assessment of how NYSDEC’s issuance of a Title V permit would be consistent with the statewide greenhouse gas emissions limits (including a 40% reduction in greenhouse gas emissions in New York by 2030, zero (0) greenhouse gas emissions by 2050, and 100% zero emissions electric from electricity production by 2040), that were established in the New-York Climate Leadership and Community Protection Act (the “CLCPA”) passed in July 2019. During 2022, Valley was engaged in discussions with NYSDEC staff to identifydefine the scope of the information the NYSDEC seeksrequired under the CLCPA.
In January 2023, March and MarchApril 2023, Valley submitted supplement filings of the Title V application. Valley received additional information requests from NYSDEC in May 2023 with respect to the supplemental filings and Valley submitted and conveyed responses to the additional requests. The NYSDEC has a period of time to request further information or to determine that the application and is in contact withcomplete. After the NYDEC authority which has not yet determined if the revised application is deemed complete, the NYSDEC is required to complete the application process and whethermake a final determination on Valley’s Title V permit application within 18 months. NYSDEC may not need the full 18 months to make a final determination on the application, however, this stage of the process has not begun. When Valley's application is considered complete (including a determination that an additional informationenvironmental review is not necessary), Valley expects that several procedural steps will be requested. completed before the NYSDEC makes its final determination: (1) Publication of Valley's application and opening it to public written comments; (2) Public hearing, to provide verbal comments; (3) Performing an additional administrative review to determine whether any comment raises a substantive and significant issue that the NYSDEC should address; (4) An additional technical screening of the application; and (5) Coordination with the EPA. After completing these steps (which are currently partially completed), NYSDEC is required to perform one of three actions with respect to the application: (1) Approve the application and issue the Permit; (2) Approve the application while adding additional conditions to the Permit; or (3) Deny the application. If the NYSDEC takes alternative (2) or (3), Valley is eligible to submit an administrative appeal on NYSDEC's decision. If the appeal is submitted within the 30 day permitted period, the relevant directives to the SAPA (401) will continue to apply and allow Valley to operate until the completion of the administrative process and determination in the administrative appeal. If an adverse decision is made after the administrative appeals process, Valley may appeal NYSDEC's final decision to the New York Supreme Court. In such scenario, New York State law allows Valley to seek the court for an injunction allowing to continue its operation under Section 401 of the SAPA during the pendency of the court proceedings. Valley can continue to operate under the ASF Permit until a final determination (after exhausting an appeal in case of rejection) is made regarding the Title V permit. NYSDEC and Valley entered into a tolling agreement reserving Valley’s rights to appeal on the revocation of the completion of the application submission, which was extended from time to time, and is now in effect until March 31, 2023.2024. Valley is coordinating with NYSDEC to further extend the tolling agreement for another six months and expects the extension will be authorized prior to March 31, 2024. Until the Title V permit is issued (if issued), the terms of new or amendedthe future financing agreements of Valley may be adversely affected by the permit receipt which has not been completed. There isAs of March 12, 2024, there are no certainty regarding receipt ofoutstanding information requests from NYSDEC and Valley continues to wait for a Title V permit or timing thereof. Should the NYSDEC reject the Title Vdetermination on whether its application and such rejection will remain in place, Valley would not be permitted to continue with its activity; alternatively, the NYSDEC may approve the Title V and include in the Title V permit conditions that that might adversely affect Valley’s activity and its financial performance.has been deemed complete. A direct or indirect change in ownership or control of voting rights in a corporation that provides infrastructure services (“public utilities”) (including onepart of the CPV project companies in the U.S.), or in any property used for infrastructure services, may be subject to FERC approval, pursuant to the Federal Power Act. Such approval may also be required for holding the position of officers or directors in corporations that provide infrastructure services or certain other companies that provide financing or equipment for infrastructure services. TheIn addition, the FERC also applies the requirements in the Public Utility Holding Company Act of 2005 to companies that directlydirect or indirectly hold at leastindirect holders of 10% or more of the voting rights in companies that, among other activities, own or operate facilities that generate electricity, for sale, including renewable energy facilities. There is similar state regulation in someseveral states that regulates ownership or control, directly or indirectly, through subsidiaries, of voting rights in corporations that provide infrastructure services. Therefore, the acquisition of 10% or more of the share capital of OPC, or Kenon may be subject to the FERC approval, and such direct or indirect acquisition may also be subject to the approval of state regulatory authorities in some U.S. states where the company has business operations. Property taxes/community payments In general, each CPV project company is subject to property taxes annually paid to the local jurisdiction in which it is located. In some cases (Shore, Maryland, Valley, Towantic, Maple Hill, Backbone and Stagecoach), the projects have come to an arrangement for a long-term payment which replaces the regular assessment and taxation process or recognizes certain exemption provisions in relevant laws or regulations. The long-term payment arrangements run between 20 and 35 years from COD for each applicable project. In other cases (Fairview &and Keenan), the projects are subject to an annual assessment on the value of their taxable property and then pay property taxes at the relevant taxing jurisdiction rates. Certain CPV project companies (Fairview and Valley) entered into agreements for the benefit of community purposes in their respective local communities. The long-term payments by virtue of such agreements fund community entities or reimburse the local community for the impact during construction. These payments are spread over periods of 20 to 30 years from COD. Renewable energies The Inflation Reduction Act of 2022 In 2022, the IRA was signed into law by President Biden. Among other things, this law awards significant tax benefits to renewable energies and technologies aimed at reducing carbon emissions. One of the IRA’s key objective is to increase the production of electricity using renewable energies and to increase regulatory stability in this sector. Following are key arrangements set forth in the IRA which may be relevant for the CPV Group’s activities: The IRA includes a number of benefits available to renewable energy projects. The IRA extends the ITC and the PTC for renewable energy projects that commence construction before January 1, 2025. The base level for the investment tax credit is 6% and the base level for the production tax credit is 0.3 cents/kWh (adjusted for inflation). Projects that meet prevailing wage and registered apprenticeship requirements may be eligible for an investment tax credit of up to 30% or a production tax credit of up to 1.5 cents/kWh (adjusted for inflation). Bonus credit amounts, may be earned, increasing by 10% the PTC or 10 percentage points the ITC if the applicable project meets domestic steel, iron and manufactured products requirements. An additional bonus credit amounts may also be earned, increasing by 10% the PTC or 10 percentage points the ITC if the applicable project is located in specially designated energy communities, such as (i) brownfield sites, (ii) locations with above national average unemployment and oil, gas or and/or coal industry contributions to direct employment or local tax revenues above specified levels, and (iii) census tracts in or adjacent to those in which a coal mine has closed since December 31, 1999, or coal-fired power plant has closed since December 31, 2009. These tax credits are transferable to unrelated entities. Electric generation projects placed in service after December 31, 2024, that emit zero or less greenhouse gases are eligible for a technology neutral ITC or PTC established under IRA, at the same credit levels as described above for the existing ITC and PTC.PTC and are also transferable to unrelated parties. These tax credits are subject to phase out, starting from the later of 2032 and when U.S. greenhouse gas emissions from electricity generation equal or are less than 25% of 2022 electricity generation emissions levels. Projects eligible for these tax credits will also be eligible to use 5-year accelerated depreciation for project assets. The CPV Group is of the opinion that the IRA is expected to have a positive effect on renewable energy projects under development and construction, including Maple HillStagecoach, Backbone, and Stagecoach;Rogue’s Wind; among other things, the IRA is expected to increase the tax credit amounts receivable compared to the amounts that were receivable prior to its enactment. Although some of the regulatory arrangements have not yet been finalized, some of the CPV Group’s renewable energy projects will be eligible to higher tax credit rates due to their location (for instance, in the sites of closed coal mines), including in the Maple Hill, project.Backbone, and Rogue’s Wind projects. The CPV Group is assessing the effect of the IRA on Maple Hill, and believes that the project complies with the criteria for receiving an additional 10% ITC (40% in total). In addition, the CPV Group is analyzing the impact of the IRA on StagecoachBackbone and Rogue’s Wind, and the economic benefits that will arise from opting for ITC or PTC in respect of the project, as well as the project’s eligibility for an additional tax credit. The CPV Group believes that it will optopted for an ITC for Maple Hill at the rate of 40% in 2023 and currently plans to opt for another project under development; the Group assessesa PTC for Stagecoach. The CPV will assess the economic feasibility of ITCs or PTCs for StagecoachBackbone and Rogue’s Wind, taking into consideration the arrangements that will be set. In addition, the option of selling the tax benefitscredits is expected to increase CPV Group’s capability to realize some of the value of its renewable energy projects’ tax credits, and to improve the terms of investment. Other Relevant Legislation In November 2021, the US Congress approved a bipartisan infrastructure law, signed by the President of the US (the “Infrastructure Act”). The Infrastructure Act is the first part of legislation (which includes two parts) addressing many sectors of the US economy, including transportation, construction, and energy. A significant part of the Infrastructure Act addresses the expansion of transmission infrastructure, research and development of technologies, including carbon capture and use of hydrogen, reinforcement of the grid, and energy efficiency. However, there are several provisions within the legislation that provide funding opportunities through the Department of Energy to support the development of zero and low emitting generation projects. A second piece of relevant legislation, known as the Build Back Better (“BBB”) Act from an energy perspective focuses on tax incentives to support numerous zero and low carbon technologies. The BBB Act bill (the “BBB Act”) that passed the House of Representatives in November of 2021 was passed largely along a party line vote (one democrat and all republicans voting against) included refundable production and investment tax credits for the expansion of renewable energy production facilities, carbon capture technologies and hydrogen investments. The BBB Act remains in negotiations in the US Senate. There is uncertainty regarding the enactment of the BBB Act as a singular piece of legislation or whether it can be passed at least in part incrementally through smaller limited scope standalone bills. If the energy provisions of the BBB Act are passed in separate bills, such legislation may have a significant effect on electricity demand by promoting low-carbon transport and a low-carbon economy while raising standards for electricity generation using clean energy. In April 2021, PJM established an Interconnection Process Reform Task Force that includes PJM staff and PJM member stakeholders to study and propose reforms to PJM’s interconnection process to address, among other items, a large backlog of proposed projects awaiting the completion of their interconnection studies and its effect on the iterative cost-causation process that allocates network upgrade costs to a proposed project. PJM staff and management have proposed a new interconnection process framework as well as options for transitioning from the current process to the new framework. Each of these are expected to be voted on by the task force in the first quarter of 2022 with the corresponding PJM FERC tariff changes to be developed and filed for approval at FERCFERC by the end of the 3rd quarter of 2022, and with the transition to the new systemsystem to start in the 4th quarter of 2022. Under the proposed process the interconnection study and cost allocation construct would shift to cluster/cycle group study process and the current first-in/first-out processing construct would shift to a first-ready/first-out processing. Under the transition proposal PJM will stop accepting new interconnection requests from the transition effective date until the new framework begins to be used—which under the different transition options under consideration could be from one year up to as long as four years. During the FERC review process and prior to implementation, PJM has stated that they will continue to work to complete existing interconnection requests. The exact impact on CPV’s projects is yet to be determined although some of CPV’s projects that are expected to operate in the PJM market may be delayed. Qoros Qoros
Kenon holds a 12% interest in Qoros, a China-based automotive company. Kenon previously held a 50% stake in Qoros prior to the Majority Qoros Shareholder’s investment in Qoros, and was one of the founding members of the company. In 2018, the The Majority Shareholder acquired 51% of Qoros from Kenon and Chery for RMB 3.315 billion, as part of a total investment of approximately RMB 6.63 billion by the Majority Shareholder. As a result of this investment, Kenon and Chery had 24% and 25% stakes in Qoros, respectively. In April 2020, Kenon sold half of its remaining interest in Qoros (i.e., 12%) to the Majority Shareholder for RMB1.56 billion (approximately $220 million), which was based on the same post-investment valuation as the initial investment by the Majority Shareholder. As a result, Kenon holds a 12% interest in Qoros, the Majority Shareholder holds 63% of Qoros and Chery holds 25%.
123
Substantially all of Quantum’s interest in Qoros is pledged to secure Qoros’ RMB 1.2 billion loan facility. In April 2021, Kenon’s subsidiary Quantum entered into an agreementa Sale Agreement with the Majority Qoros Shareholder to sell its remaining 12% interest in Qoros for RMB 1.56 billion (approximately $245$220 million). and Baoneng Group has provided a guarantee of the Majority Qoros Shareholder’s obligations under the Sale Agreement. The agreement provided that a deposit of 5% was due July 30, 2021 and that the purchase price would be payable in installments from September 2021 through March 2023. The agreement also provides that any payment delayed for more than 30 days is subject to interest. Neither the deposit norMajority Qoros Shareholder had not made any of the installments were paid. Inrequired payments under the Sale Agreement, and in the fourth quarter of 2021, Quantum initiated arbitral proceedings against the Majority Qoros Shareholder and Baoneng Group with CIETAC. In February 2024, CIETAC issued a final award, not subject to any conditions, in favor of Quantum. The proceedingstribunal ruled that the Majority Qoros Shareholder and Baoneng Group are ongoing. As a resultobligated to pay Quantum approximately RMB 1.9 billion (approximately $268 million), comprising the purchase price set forth in the Sale Agreement (as adjusted for inflation) of approximately RMB 1.7 billion (approximately $239 million), together with pre-award and post-award interest (which will accrue until payment of the non-payment of amounts dueaward), legal fees and expenses. Kenon intends to seek to enforce this award against the Majority Qoros Shareholder and Baoneng Group since they have failed to perform their payment obligations under the agreementaward. In connection with the Majority Shareholder, Quantum had the right to exercise the put option it had to sell its remaining interest to the Majority Shareholder for RMB 1.56 billion (approximately $220 million), subject to adjustments.this arbitration, Kenon has exercised this option, but the Majority Shareholder has not complied with its obligationsobtained a court order freezing assets of Baoneng Group at different rankings (primarily comprising equity interests in entities owning directly and indirectly listed and unlisted equity interests in various businesses). See “Item 3.D—Risks Related to purchase Kenon’sOur Strategy and Operations—We face risks in relation to our remaining 12% interest in Qoros.
Kenon had outstanding “back-to-back” guarantee obligations of approximately $16 millionQoros, including risks relating to Chery in respect of guarantees that Chery has given in respect of 50%collection of the RMB 3 billion and 100% of the RMB 700 million loan facilities. In the fourth quarter of 2021, Chery paid the full amount of its guarantee obligations relating to these two loans. Chery had issued to Kenon demand notices to pay these guaranteed amounts. Kenon has paid the amount demanded by Chery, and does not have any remaining guarantee obligationsarbitration award in connection with respect to Qoros debt.this agreement.”
Substantially all of Quantum’s interests in Qoros are pledgedIn addition to secure Qoros’ RMB 1.2 billion loan facility. Althoughthe Sale Agreement, the Majority Qoros Shareholder was required to assume its pro rata share of pledgeQuantum’s obligations in lieu of Quantum’s, it has not yet provided such pledges, andrelating to Quantum’s pledge has not been released.of its remaining shares in Qoros. Baoneng Group has provided Kenona guarantee. Baoneng Group has failed to comply with the obligations of the guarantee and as a guarantee for a certain percentage, and up to all, of Quantum’s pledge obligations.
As Quantum has exercises its put option, the Majority Shareholder is required to assume the full pledge of obligations under Kenon’s pledge of its shares in Qoros, but it has not yet done so. In November 2021,result, Kenon filed a claim against Baoneng Group at the Shenzhen Intermediate People’s Court relating to the breaches of the guarantee agreement by Baoneng Group, which was then transferred to the Majority Shareholder.Supreme People’s Court for trial. The court proceedings are ongoing. Kenon has obtained an order freezing certain assets of Baoneng Group in connection with the litigation pursuant to a court order. There is no assurance as to the outcome of suchthese proceedings. See further details about the claim in “Item 3.D—Risks Related to Our Strategy and Operations—We face risks in relation to our remaining 12% interest in Qoros, including risks relating to collection of the arbitration award in connection with this agreement.”
Qoros has been in default under certain loan facilities for a number of years, including its RMB 1.2 billion loan facility. The lenders under Qoros’ RMB 1.2 billion loan facility have obtained a court order in respect of a payment default by Qoros. See further details about the court order in “Item 3.D—Risks Related to Our Strategy and Operations—We face risks in relation to our remaining 12% interest in Qoros, including risks relating to collection of the arbitration award in connection with this agreement.” There is no assurance as to the collection of the arbitration award and the outcome of legal proceedings described above or any value Kenon may realize in respect of its remaining shares in Qoros. Since April 2020, Kenon no longer accounts for Qoros pursuant to the equity method of accounting and in 2021, Kenon wrote down the value of Qoros to zero. Qoros’ Description of Operations
Qoros is an automobile manufacturer See “Item 3.D—Risks Related to Our Strategy and Operations—We face risks in China.
Kenon understands that manufacturing production at Qoros has been shut down since July 2021.
Agreements relatingrelation to Sales of Kenon’s interests in Qoros
Qoros’ Investment Agreement
In January 2018, the Majority Shareholder acquired 51% of Qoros from Kenon and Chery for RMB 3.315 billion (approximately $526 million), which was part of an investment structure to invest a total of approximately RMB 6.63 billion (approximately $1,053 million) by the Majority Shareholder. As a result of the 2018 investment, Kenon’s and Chery’s interests in Qoros were reduced to 24% and 25%, respectively. In April 2020, we sold half of our remaining interest in Qoros (i.e., 12%) to the Majority Shareholder for a price of RMB 1.56 billion (approximately $220 million), which was based on the same post-investment valuation as the initial investment by the Majority Shareholder. Kenon now holds a 12% interest in Qoros, the Majority Shareholder holds 63% and Chery holds 25%. For purposes of this section, references to Kenon include Quantum (Kenon’s wholly-owned subsidiary which owns Kenon’s interest in Qoros) and references to Chery include Wuhu Chery (the direct owner of Chery’s interest in Qoros).
In connection with the 2018 investment, Kenon received initial cash proceeds of RMB 1.69 billion (approximately $260 million) and Chery received cash proceeds of RMB 1.625 billion (approximately $250 million).
Guarantee Obligations and Equity Pledges
Kenon had outstanding “back-to-back” guarantee obligations of approximately $16 million to Chery in respect of guarantees that Chery has given in respect of 50% of the RMB 3 billion and 100% of the RMB 700 million loan facilities. In the fourth quarter of 2021, Chery paid the full amount of its guarantee obligations under these two loans. Kenon had total outstanding back-to-back guarantees to Chery of approximately $16 million in respect of these loans, and Chery had issued to Kenon demand notices to pay these guaranteed amounts. Kenon has paid the $16 million back-to-back guarantees to Chery, and Kenon does not have any additional credit guarantee obligations with respect to Qoros debt.
Quantum has pledged substantially all of its interests in Qoros to secure Qoros’ RMB 1.2 billion loan facility. Although the Majority Shareholder was required to assume its pro rata share of pledge obligations, it has not yet assumed all such pledges. Baoneng Group has provided Kenon with a guarantee for a certain percentage, and up to all, of Quantum’s pledge obligations.
Kenon’s Put Option
Kenon had a put option over its remaining equity interest in Qoros, giving Kenon with the right to cause the Majority Shareholder to purchase all of its remaining equity interests in Qoros for RMB 1.56 billion (approximately $220 million), subject to adjustment for inflation. Another company within the Baoneng Group guarantees the Majority Shareholder’s obligations under this put option by granting a similar option. Kenon has exercised this put option, but the Majority Shareholder has not complied with its obligations to purchase Kenon’s remaining stake in Qoros and Baoneng Group has not complied with its obligations in respect of the guarantee of this put option.
The investment agreement provides that any changes in the equity holdings of Qoros by Kenon, Chery or the Majority Shareholder, including as a result of the put option described above, will result in adjustments to the respective parties’ pro rata obligations of the Qoros bank guarantees and pledges described above according to their equity ownership in Qoros.
Because Quantum has exercised the put option, the Majority Shareholder is required to assume the full pledge. The guarantee by Baoneng Group of Quantum’s pledge obligations provides for a number of obligations, including the obligation for Baoneng Group to reimburse Kenon in the event of foreclosure over Quantum’s shares. Baoneng Group is required to deposit an amount sufficient in escrow to ensure sufficient collateral to avoid the banks foreclosing the Qoros shares pledged by Quantum. Baoneng Group has failed to do so after Kenon made a demand in the fourth quarter of 2021, and in November 2021, Kenon filed a claim against Baoneng Group at the Shenzhen Intermediate People’s Court relating to the breaches of the guarantee agreement by the Majority Shareholder. The court proceedings are ongoing. Kenon has obtained an order freezing certain assets of Baoneng Group in connection with the litigation pursuant to a court order. There is no assurance as to the outcome of such proceedings or any value Kenon may realize any value in respect of Kenon’s remaining shares in Qoros. Kenon understands that manufacturing production at Qoros has been shut down since July 2021. Since April 2020, Kenon no longer accounts for Qoros pursuant to the equity method of accounting and in 2021, Kenon wrote down the value of Qoros to zero.
Kenon’s 2020 Sale of 12% interest in Qoros to the Majority Shareholder
In April 2020, Kenon sold half of its remaining interest in Qoros (i.e., 12%) to the Majority Shareholder for a price of RMB 1.56 billion (approximately $220 million), which was based on the same post-investment valuation as the initial 2018 investment by the Majority Shareholder. As a result, Kenon holds a 12% interest in Qoros, the Majority Shareholder holds 63% and Chery holds 25%. The Majority Shareholder has agreed to assume its pro rata share of the pledge obligations with respect to the RMB 1.2 billion loan facility after which Kenon will also be proportionately released from its pledge obligations thereunder, subject to the Qoros bank lender consent. As a result of the initial investment in 2018 and the 2020 sale by Kenon, the Majority Shareholder is required to pledge additional shares or to provide other support acceptable to the lender banks. The Majority Shareholder has not provided such pledges and Kenon has not been proportionately released by the bank lenders from these pledge obligations. The Majority Shareholder has provided Kenon with a guarantee for a certain percentage, and up to all, of Quantum’s share of the pledge obligations.
Kenon’s Agreement to Sell its Remaining 12% Interest in Qoros to the Majority Shareholder
In April 2021, Kenon’s subsidiary Quantum entered into an agreement with the Majority Shareholder to sell its remaining 12% interest in Qoros, for RMB 1.56 billion (approximately $241 million). The agreement provided that a depositincluding risks relating to collection of 5% was due July 30, 2021 and that the purchase price would be payablearbitration award in installments from September 2021 through March 31, 2023.connection with this agreement.”
Neither the deposit nor any of the installments have been paid. In the fourth quarter of 2021, Quantum initiated arbitral proceedings against the Majority Shareholder and Baoneng Group with the CIETAC. The proceedings are ongoing.
The agreement also provides that any payment delayed for more than 30 days is subjectWe previously had back to interest. In addition, Quantum exercised the put option it has over its remaining shares in Qoros, but the Majority Shareholder has not complied with its obligations to purchase Kenon’s remaining stake in Qoros and Baoneng group has not complied with itsback guarantee obligations in respect of thecertain of Qoros’ debt but we have previously settled these obligations and have no further guarantee of this put option.
Substantially all of Quantum’s shares in Qoros remain pledged to Qoros’ lenders and any transfer of Kenon’s remaining stake in Qoros would require a release of the pledge over Kenon’s shares in Qoros as well as obtaining necessary regulatory approvals and registrations.
Qoros’ Joint Venture Agreementobligations.
We are party to a joint venture agreement, or the Joint Venture Agreement, with respect to our and the outour joint venture parties’partners’ interest in Qoros. The Joint Venture Agreement sets forth certain rights and obligations of each of Quantum, the wholly-owned subsidiary through which we own our equity interest in Qoros, Wuhu Chery and the Majority Qoros Shareholder with respect to Qoros. The Joint Venture Agreement is governed by Chinese law. Under the Joint Venture Agreement, certain matters require the unanimous approval of Qoros’ board of directors, while other matters require a two-thirds or a simple majority board approval. Matters requiring unanimous approval of the Qoros board include amendments to Qoros’ articles of association, changes to Qoros’ share capital, the merger, division, termination or dissolution of Qoros, the sale or otherwise disposal of all or a material part of Qoros’ fixed assets for an amount equal or greater than RMB 200 million (approximately $29 million) and the issuance of debentures or the creation of third-party security interests over any of Qoros’ material fixed assets (other than those provided in connection with legitimate Qoros loans). Matters requiring approval by two-thirds of the board include the acquisition of majority equity interests in another entity for an amount exceeding 5% of Qoros’ net asset value, termination of any material partnership or joint venture contract, profit distribution plans, the sale or otherwise disposal of all or a material part of Qoros’ fixed assets for an amount equal or greater than RMB 60 million (approximately $9 million) but less than RMB 200 million (approximately $29 million), and capital expenditures and investments which are equal to or greater than the higher of $4 million or 10% of the approved annual budget. Pursuant to the terms of the Joint Venture Agreement, we have the right to appoint two of Qoros’ nine directors, Wuhu Chery has the right to appoint two of Qoros’ directors and the Majority Shareholder has the right to appoint the remaining five of Qoros’ directors. If the Majority Shareholder’s stake in Qoros increases to 67% through a new investment in Qoros, the board of directors of Qoros will be further adjusted such that Qoros will have a six-member board of directors, of which the Majority Shareholder will have the right to appoint four directors, while Kenon and Wuhu Chery will each have the right to appoint one director. The Majority Shareholder has the right to nominate Qoros’ Chief Executive Officer and Chief Financial Officer. The nomination of Qoros’ Chief Executive Officer and Chief Financial Officer are each subject to the approval of Qoros’ board of directors by a simple majority vote. Quantum and Wuhu Chery each have the right to nominate one of Qoros’ deputy Chief Financial Officers. Such nominations by Quantum and Wuhu Chery are subject to the approval of Qoros’ board of directors by a simple majority vote. The Joint Venture Agreement restricts transfers of interests in Qoros by the shareholders (other than transfers to affiliates). Quantum may transfer all of its interest in Qoros to any third party, subject to the rights of first refusal discussed below. During the five-year period following the closing of the initial investment by the Majority Shareholder, Wuhu Chery and the Majority Shareholder may not transfer any or all their interests in Qoros to any third-party without consent of the other joint venture partners (except for assignments in relation to an initial public offering of Wuhu Chery’s interest in Qoros).
Subject to the lock-up restrictions set forth above, if any of the joint venture partners elects to sell any of its equity interest in Qoros to a third party (i.e., other than an affiliate), the other joint venture partners have the right to purchase all, but not less than all, of the equity interests to be transferred, subject to certain conditions relating to the minimum price for such sale. In the event that more than one joint venture partner elects to exercise its right of first refusal, the shareholders shall purchase the equity interest to be transferred in proportion to their respective interests in Qoros at such time.
The Joint Venture Agreement also reflects Kenon’s put option and the Majority Shareholder’s right to make further investments in Qoros.
The Joint Venture Agreement expires in 2042. The Joint Venture Agreement terminates prior to this date only (i) if the joint venture partners unanimously agree to dissolve Qoros (ii) in the event of any other reasons for dissolution specified in the Joint Venture Agreement and Articles of Association of Qoros or (iii) upon occurrence of any other termination event, as specified in PRC laws and regulations.
ZIM Information in this report on ZIM is based on ZIM’s annual report on Form 20-F filed with the SEC on March 13, 2023.2024. Overview ZIM is a global container liner shipping company with leadership positions in niche markets where ZIM believes itZIM has distinct competitive advantages that allow ZIM to maximize its market position and profitability. Founded in Israel in 1945, ZIM is one of the oldest shipping liners, with over 75nearly 80 years of experience, providing customers with innovative seaborne transportation and logistics services with a reputation for industry leading transit times, schedule reliability and service excellence.services. As of December 31, 2022,2023, ZIM operated a fleet of 150144 vessels and chartered-in 94.2ֵ%95% of its TEU capacity and 94.0ֵ%93.8% of the vessels in its fleet. For comparison, according to Alphaliner, ZIM’s competitors chartered-in on average approximately 45.3%44% of their fleets as of the end of 20222023 (in accordance with the Alphaliner JanuaryDecember 2023 Report). During 2021 and 2022 ZIM has entered into several strategic long-term charter agreements, including two strategic agreements with Seaspan for the long-term charter of ten 15,000 TEU and fifteen 7,000uniquely designed 7,700-class TEU liquifiedLNG (liquified natural gas (LNG dual-fuel) container vessels to serve ZIM’s Asia-US East Coast Trade and other global-niche trades, with the first vessel14 vessels already delivered to ZIM in February 2023, and the other nine vessels expected to be delivered to ZIM during 2023-2024.ZIM. ZIM has also entered into a newan eight-year charter agreement with a shipping company that is an affiliate of its largest shareholder, Kenon Holdings Ltd., according to which ZIM will charter three 7,0007,700-class TEU LNG dual fuel container vessels, expectedwith one vessel delivered to be delivered during the first and second quarters of 2024.ZIM. Furthermore, in February 2022 ZIM announced a new chartering agreement with Navios Maritime Partners L.P. for a total of 13 vessels (five(including five of which are secondhand), ranging from 3,500 to 5,300 TEUs each, of which two newbuild vessels and all five secondhand vessels were delivered to ZIM, and in March 2022 ZIM announced it hadZIM has entered into a seven-year charter transaction for six 5,500 TEU wide beam newbuild vessels with MPC Container Ships ASA and MPC Capital AG, scheduledof which three vessels were already delivered to ZIM. ZIM expect the rest of the vessels to be delivered between May 2023 and Februaryto ZIM during the remainder of 2024. See “Item 4.B Business OverviewSee“—Our Businesses—ZIM—ZIM’s vessel fleet—Strategic Chartering Agreements.Agreements”. During the second half of 2021 ZIM has completed the purchase of eight secondhand vessels, ranging from 1,100 to 4,250 TEU, in several separate transactions, for an aggregated amount of $355 million. In February 2024, ZIM completed the acquisition of an additional three secondhand 10,000 TEU vessels and two 8,500 vessels that ZIM already chartered by exercising an option to acquire them for approximately $129 million, with allso that on March 1, 2024, ZIM owned a total of 14 vessels deliveredof its operated fleet, including one vessel ZIM already previously owned prior to ZIM. See “—these acquisitions. See—“ZIM’s Vessel Fleetvessel fleet.” below.
As of December 31, 2022,2023, ZIM chartered-in most of its capacity; in addition, 80.9%74.8% of its chartered-in vessels are under leases having a remaining charter duration of more than one year (or 83.1%81.9% in terms of TEU capacity). ZIM continues to adjust its operations in response to the effects of global and regional geopolitical and economic events, including the Houthi attacks on the Red Sea, the Israel-Hamas and Russia-Ukraine wars, long terms effect of the COVID-19 pandemic and other recent geopolitical trends (including the Russia-Ukraine conflict).trends. ZIM’s fleet, mainly in terms of the size of its vessels, enables ZIM to optimize vessel deployment to match the needs of both mainlane and regional routes and to ensure high utilization of its vessels and specific trade advantages. Almost all of ZIM’s operated vessels have capacities that range from less than 1,000 TEUs to almost 12,000 TEUs, with one 15,000 TEU LNG (dual fuel) vessel delivered to ZIM in February 2023 in accordance with its long-term charter agreement with Seaspan, and nine other vessels expected to be delivered during 2023-2024 (See “Item 4.B Business Overview—Our Businesses—ZIM—Strategic Chartering Agreements”).TEUs. Furthermore, ZIM operates a modern and specialized container fleet, which ZIM significantly increased during 2021, to aand its current container fleet capacity of nearly one millionreaches approximately 885 thousand TEUs. ZIM operates across five geographic trade zones that provide ZIM with a global footprint. These trade zones include (for the year ended December 31, 2022,2023, of carried TEUs): (i)(1) Transpacific (34%(38.4%), (ii)(2) Atlantic (15%(13.1%), (iii)(3) Cross Suez (13%(11.8%), (iv)(4) Intra-Asia (31%(27.9%) and (v)(5) Latin America (7%(8.8%). Within these trade zones, ZIM strives to increase and sustain profitability by selectively competing in niche trade lanes where ZIM believes that the market is underserved and that ZIM has a competitive advantage versus its peers. These include both trade lanes where ZIM has an in-depth knowledge, long-established presence and outsized market position as well as new trade lanes into which ZIM is often driven by demand from its customers as they are not serviced in-full by its competitors. Several examples of niche trade lanes within ZIM’s geographic trade zones include: (i)(1) US East Coast & Gulf to Mediterranean lane (Atlantic trade zone) where ZIM maintains a 13.4%7.9% market share, (ii)(2) East Mediterranean & Black Sea to Far East lane (Cross Suez trade zone), 8.5%6.3% market share and (iii)(3) Far East (not including the Indian subcontinent) to US East Coast (Pacific trade zone), 8.6%11.2% market share, in each case according to the Port Import/Export Reporting Service (“PIERS”)(PIERS) and Container Trade Statistics.Statistics (“CTS”). During 2022,2023 and as at March 13, 2024, ZIM announced the following main newly launched services and service upgrades: (i)(1) a new operational cooperation with MSC encompassing seven services, including three services on the extension of ZIM service connecting the Indian sub-continent andsoutheast Asia-Oceana trade, two services from India to the East Mediterranean to serviceand Israel (currently rerouted), and two services from the East Mediterranean-Mediterranean and Israel to North Europe trade; (ii) aEurope; (2) two new Venezuela feeder line and the upgrade of two existing central American lines; (iii) a new speedy e-commerce service fromindependent services, ZIM Albatross (ZAT), connecting China and South EastSoutheast Asia to the U.S. East Coast, which was further upgraded in February 2023; (iv)west coast South America, and ZIM Gulf Toucan (ZGT), connecting South America to the commencementGulf of two separateMexico, and independent new Asia Pacific North West and Asia Mediterraneanreplacing previous services in April 2022; (v)cooperation with other carriers; (3) the upgraderelaunch of ZEX, ZIM eCommerce Xpress service, providing a premium, speedy China-US West Coast service; (4) the expansion of the Turkey – USECZXB service calling from Port Kelang to Baltimore and Boston to include direct calls to Mexico and Colombia; (5) the upscaling of ZIM’s vessels on its independently operated ZCP service line (as part of its agreement with the 2M Alliance) to a weekly service; (vi) a new Thailand Fremantle Express Service, covering major ports in South East15,000 TEU LNG dual-fuel container vessels; and (6) the launch of an independent service connecting Asia and Australia; and (vii) the ZIM Colibri Xpress, a new premium line from South America West Coast to the USEC.US via Vancouver (ZPX). In addition to containerized cargo, in an effort to respond to increased demand for car carrier services, and specifically to the increase in vehicle exports from China (and electric and hybrid cars in particular), ZIM also transports vehicles (such as cars, buses and trucks) via dedicated car carrier vessels westbound from Asia, and primarily from China, Japan, South Korea and India. Currently, ZIM charters 1116 car carrier vessels and ZIM has expanded the volume and its range of services to include additional calls to ports in Europe, the Mediterranean and South America. Despite the uncertainty caused by the geopolitical situation, the outlook for the car carrier industry remains relatively positive thanks to modest fleet growth in 2023 and slight increase in demand for lighter vehicles. In 2024, car carrier fleet growth is estimated to be more robust, with an increase of 6.5% capacity by year end.  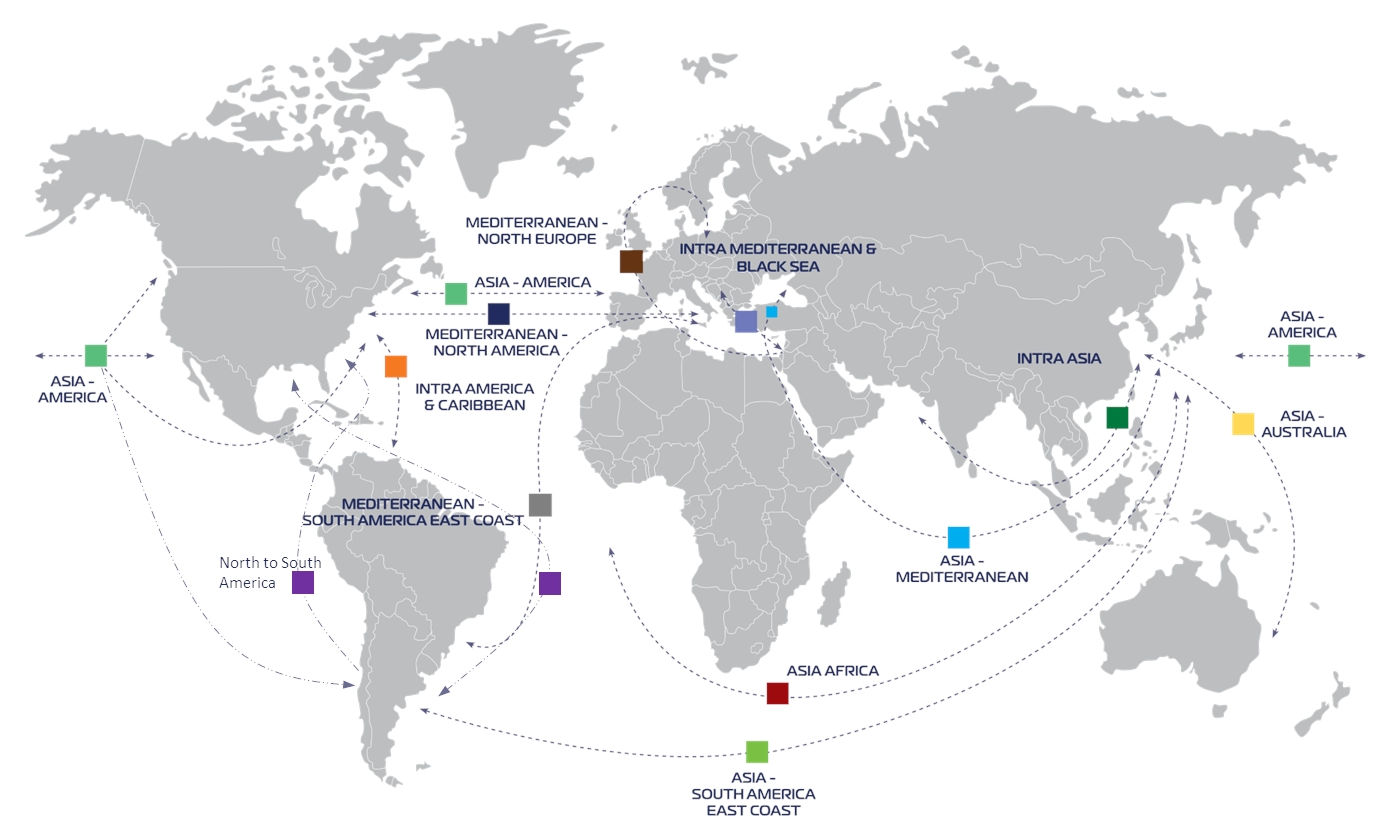
As of December 31, 2022,2023, ZIM operated a global network of 67 weekly lines, calling at approximately 300310 ports, delivering cargo to and from more than 90 countries. ZIM’s complex and sophisticated network of lines allows ZIM to be agile as it identifies markets in which to compete. Within its global network ZIM offers value-added and tailored services, including operating several logistics subsidiaries to provide complimentary services to its customers. ZIM continues to develop its network of additional logistics companies in order to provide comprehensive services to its customers. These subsidiaries, which ZIM operates, among others, in China, Vietnam, Canada, Brazil, India, Singapore, Hong Kong and the U.S.,U.S, are asset-light and provide services such as land transportation, custom brokerage, LCL, project cargo and air freight services. Out of ZIM’s total volume in the twelve months ended December 31, 2022,2023, approximately 20%18% of its TEUs carried utilized additional elements of land transportation. ZIM’s network is significantly enhanced by cooperation agreements with other container liner companies and alliances, allowing ZIM to maintain a high degree of agility while optimizing fleet utilization by sharing capacity, expanding its service offering and benefiting from cost savings. Such cooperation agreements include vessel sharing agreements (VSAs), slot purchase and slot swaps. ZIM’sOne of these cooperations is the strategic collaboration with the 2M Alliance, comprised of the two largest global carriers, (MaerskMaersk and MSC, whichwho both announced the termination of the 2M Alliance will terminate in January 2025),2025. ZIM’s agreement with the 2M Alliance which was launched in September 2018 and amended in February 2022, provides faster, wider and more efficient service in the Asia-USECAsia-US East Coast and the Asia-USGCAsia-US Gulf Coast with two trade lanes, seven services and approximately 15,00015,500 weekly TEUs. Another example is ZIM’s new operational cooperation with MSC encompassing seven services on the southeast Asia-Oceana, India-East Mediterranean (currently rerouted) and East Mediterranean-North Europe trades, that ZIM entered into in September 2023. In addition to its collaboration with the 2M Alliance,these collaborations, ZIM also maintainsmaintain a number of partnerships with various global and regional liners in different trades. For example, in the Intra-Asia trade, ZIM partners with both global and regional liners in order to extend its services in the region.region (See“—ZIM’s operational partnerships”). ZIM has a highly diverse and global customer base with approximately 34,00032,600 customers (which considers each of ZIM’sits customer entities separately, also when itincluding in instances where the entity is a subsidiary or branch of another customer)customer, or on a non-consolidated basis) using ZIM’sits services. In 2022,2023, ZIM’s 10 largest customers represented approximately 16%13% of its freight revenues and itsZIM’s 50 largest customers represented approximately 31%28% of its freight revenues. One of the key principles of ZIM’sits business is its customer-centric approach and ZIM strives to offer value-added services designed to attract and retain customers. ZIM’s strong reputation, high-quality service offering, and schedule reliability has generated a loyal customer base, with 89 of its 10 top customers in 20222023 having a relationship with ZIM lasting longer than 10 years. ZIM has focused on developing technologies to support its customers, including improvements in its digital capabilities to enhance both commercial and operational excellence. ZIM uses its technology and innovation to power new services, improve its customer experience and enhance its productivity and portfolio management. Several recent examples of ZIM’s digital services include: (i) ZIMonitor, which is an advanced tracking device that provides 24/7 online alerts to support high value cargo; (ii) eZIM, ZIM’sits easy-to-use online booking platform; (iii) eZQuote, a digital tool that allows customers the ability to receive instant quotes with a fixed price and guaranteed terms; (iv) Draft B/L, an online tool that allows export users to view, edit and approve their bill of lading online without speaking with a representative; and (v) ZIMGuard, an artificial intelligence-based internal tool designed to detect possible misdeclarations of dangerous cargo in real-time. Furthermore, ZIM has formed a number of partnerships and collaborations with third-party start-ups for the development of multiple engines of growth which are adjacent to ZIM’sits traditional container shipping business. These technological partnerships and initiatives include: (i) “ZKCyberStar,” a collaboration with Konfidas, an Israeli cyber-security consulting company, to provide bespoke cyber-security solutions, guidance, methodology and training to the maritime industry; (ii) “ZIMARK,”“ZIMARK”, a new initiative in cooperation with Sodyo (in which ZIM made an additional investment in August 2022), an early-stageearly stage scanning technology company, aimed to provide visual identification solutions for the entire logistics sector (inventory management, asset tracking, fleet management, shipping, access control, etc.), whose This technology is extremely fast and is suitable for multiple types of media; (iii)(ii) ZIM’s investment in and partnership with WAVE, ana leading electronic bill of lading based on blockchain technology, to replace and secure original documents of title; (iv)(iii) ZIM’s investment in Hoopo Systems Ltd. (“Hoopo”), a provider of cutting edge tracking solutions for unpowered assets; (v)assets, as well as its new agreement to deploy Hoopo’s tracking devices on ZIM’s dry-van container fleet; (iv) Ship4wd, a digital freight forwarding platform offering an online, simple and reliable self-service end-to-endend to end shipping solution, that is initially targeting U.S. & Canadian small and medium-sized businesses importing and exporting from China, Vietnamthe US, Canada, the far East and Israel; (vi) ZIM’s(v) its investment in Data Science Consulting Group (DSG), a leading technology company specializing in artificial intelligence (AI)Artificial Intelligence based products, solutions and services, developer of e-volve, a holistic AI governance and decision management system, and itsZIM’s co-creator of a center of excellence for the development of AI tools for the maritime shipping industry; (vii)and (vi) 40Seas, aan innovative fintech company serving as a platform for cross-border trade financing, in which ZIM has made an equity investment in addition to extending an approximatelyapproximate $100 million credit facility, with a possibilityan option subject to both parties’ agreement to increase this credit facility by up to $200 million if mutually agreedmillion. To support and enhance ZIM’s commercial partnerships and investments in technology companies, ZIM has formed a ZIM team of professionals that specializes in the ecosystem of investing and collaborating with early-stage technology companies, and function as a “corporate venture capital”, or CVC, dedicating a substantial part of their time to such CVC activities. The members of this CVC team support ZIM’s portfolio companies throughout the life cycles of their businesses, starting from identifying promising startups which are synergetic to ZIM’s business, conducting due diligence over potential investments, negotiating investment and commercial agreements with ZIM’s portfolio companies, and supporting them in additional investment and commercial transactions and in their operations, often by the parties.holding board membership positions in such companies. Over the past three years ZIM has taken initiatives to reduce and avoid costs across its operating activities through various cost-control measures and equipment cost reduction (including, but not limited to, equipment interchanges such as swapping containers in surplus locations, street turns to reduce trucking of empty containers and domestic repositioning from inland ports). ZIM is headquartered in Haifa, Israel. As of December 31, 2022,2023, ZIM had approximately 6,5306,460 full-time employees worldwide (including contract workers). In 20222023 and 2021,2022, ZIM carried 3.383.28 million TEUs and 3.483.38 million TEUs, respectively, for its customers worldwide. During the same periods, ZIM’s revenues were $12,562$5,162 million and $10,729$12,562 million, its net income (loss) was $4,629$(2,688) million and 4,649$4,629 million and its Adjusted EBITDA was $7,541$1,049 million and $6,597$7,541 million, respectively. ZIM’s services With a global footprint of more than 200 offices and agencies in more than 90 countries, ZIM offers both door-to-door and port-to-port transportation services for all types of customers, including end-users, consolidators and freight forwarders. Comprehensive logistics solutions ZIM offers its customers comprehensive logistics solutions to fit their transportation needs from door-to- door.door-to-door. ZIM’s wide range of transportation services, handled by its highly trained sea and shore crews and supported with personalized customer service and its unified information technology platform, allows ZIM to offer its customers higher quality and tailored services and solutions at any time around the world. ZIM has also partnered with a Chinese multinational company through its logistics subsidiary in China to expand its offerings to small- and medium-sized enterprises who conduct their business through the company’s platform. ZIM’s commercial cooperation agreement with this company was extended until March 2024.
ZIM’s services and geographic trade zones As of December 31, 2022,2023, ZIM operated a global network of 67 weekly lines, calling at approximately 290310 ports delivering cargo to and from more than 90 countries. ZIM’s shipping lines are linked through hubs that strategically connect main lines and feeder lines, which provide regional transport services, creating a vast network with connections to and from smaller ports within the vicinity of main lines. ZIM has achieved leadership positions in specific markets by focusing on trades where itZIM has distinct competitive advantages and can attain and grow its overall profitability. ZIM’s shipping lines are organized into geographic trade zones by trade. The table below illustrates ZIM’s primary geographic trade zones and the primary trades they cover, as well as the percentage of ZIM’sits total TEUs carried by geographic trade zone for the years ended December 31, 2023, 2022 2021 and 2020:2021: | | | | | | | | Geographic trade zone
(percentage of total TEUs carried for the period) | | | | | | | | | | | | | Geographic trade zone
| | | | | | | (percentage of total TEUs carried for the period) | | | | | | | | | | | | | | Pacific | | Transpacific | | | 34 | % | | | 39 | % | | | 40 | % | | Transpacific | | | 38 | % | | | 34 | % | | | 39 | % | | Cross-Suez | | Asia-Europe | | | 13 | % | | | 10 | % | | | 12 | % | | Asia-Europe | | | 12 | % | | | 13 | % | | | 10 | % | | Atlantic-Europe | | Atlantic | | | 15 | % | | | 18 | % | | | 21 | % | | Atlantic | | | 13 | % | | | 15 | % | | | 18 | % | | Intra-Asia | | Intra-Asia | | | 31 | % | | | 27 | % | | | 21 | % | | Intra-Asia | | | 28 | % | | | 31 | % | | | 27 | % | | Latin America | | Intra-America | | | | | | | | | | | | | | Intra-America | | | | | | | | | | | | | | | | | | | 100 | % | | | 100 | % | | | 100 | % | | | | | 100 | % | | | 100 | % | | | 100 | % |
Pacific geographic trade zone. The Pacific geographic trade zone serves the Transpacific trade, which covers trade between Asia, including China, Korea, Southeast Asia, the Indian subcontinent, and the Caribbean, Central America, the Gulf of Mexico and the east coast and west coast of the United States and Canada. ZIM’s services within this geographic trade zone also connect to Intra-Asia and Intra-America regional feeder lines, which provide onward connections to additional ports.ports Pacific Northwest service. Based on information from PIERS,Piers, Port of Vancouver and Prince Rupert Port Authority, approximately 44%45% of all goods shipped to the United States are transported via ports located in the west coast of the United States and Canada. These include local discharge as well as delivery by train or trucks to their final destinations, mainly to the Midwestern United States and to the central and eastern parts of Canada. ZIM holds a position within the Pacific Northwest,PNW, via the Canadian gateway Vancouver, port, which enablesenable ZIM to serve the very large Canadian and U.S. Midwest markets quickly and efficiently. ZIM believes that itsZIM’s strategic relationships in these markets with Canadian National Railway Company (“CN”), a rail operator, have allowed itZIM to obtain competitive rates and provide consistent, high-quality service to its customers. In April 2022,Since July 2023, ZIM launched anhas started to charter slots from MSC to serve the Pacific Northwest, replacing its independent service line tolaunched after the Pacific Northwest trade, replacingtermination of the previous cooperation with the 2M Alliance. 130
Alliance for this service in April 2022. In January 2024, ZIM launched a new independent line connecting Asia and the US through the Vancouver gateway (ZPX). Pacific Southwest Coast services. In response to the growing trend in eCommerce, during 2020 and 2021, ZIM launched three eCommerce Xpress high-speed services, focusing on e-Commerce between South China and Los Angeles, (ZEX,the ZEX, ZX2 and ZX3 lines). As a resultlines. ZIM suspended these lines because of current globalheavy port congestion due to COVID-19. In November 2023, ZIM relaunched ZEX as market conditions due to COVID-19, ZIM has experienced heavy congestion in U.S. West Coast ports throughout 2021. In 2022 this trade experienced a softening of demand.improved. Asia-U.S. All-Water service. With respect to the Asia-U.S. east coast trade, “all-water” refers to trade between Asia and the U.S. east coast and Gulf Coast using marine transportation only, via the Suez or Panama Canal. In accordance with its agreement with the 2M Alliance as amended in February 2022 effective from April 2022, ZIM operates one out of the five joint Asia to USEC services (ZCP) as well as a vessel sharing agreement on one of two joint Asia to USGC services (ZGX). ZIM has stated that it plans to deploy ZIM’sdeployed all 15,000 TEU LNG dual fuel vessels delivered to ZIM so far on the independently operated ZCP service, and intend to deploy the remainder expected to be delivered to ZIM during 20232024 on the ZCP. Seethis service as well (See, “Item 4.B Business Overview—Our Businesses—ZIM—Strategic Chartering Agreements.Agreements”). As of December 31, 2022,2023, ZIM offered 1110 services in the Pacific geographic trade zone, which had an effective weekly capacity of 23,58924,657 TEUs and covered all major international shipping ports in the Transpacific trade. ZIM’s services in the Pacific geographic trade zone accounted for 50%45% of its freight revenues from containerized cargo for the year ended December 31, 2022.2023. Cross-Suez geographic trade zone. The Cross-Suez geographic trade zone serves the Asia-Europe trade, which covers trade between Asia and Europe (including the Indian sub-continent) through the Suez Canal, primarily focusing on the Asia-Black Sea/East Mediterranean Sea sub-trade, which is one of ZIM’sits key strategic zones. In previous years this trade was characterized by intense competition, and ZIM has undertaken several initiatives to help itZIM remain competitive within it. In September 2023, ZIM entered into a cooperation agreement with MSC covering seven services, including two services from the India subcontinent (ISC) to Israel and the East Mediterranean and two services from Israel and the East Mediterranean to N. Europe. These services replace ZIM’s cooperationprevious independent service (ZMI), which was initiated following the termination of two joint services with the 2M Alliance which began in March 2019 as a slot charter agreement on two services fromcovering Asia to the East Mediterranean was terminated effective asin April 2022. In response to the Yemeni Houthis’ attacks against vessels sailing in the Red Sea, ZIM has taken proactive measures by rerouting some of April 2022. Consequently, ZIM launched an independent service lineits vessels and restructuring its services on the Asia-Mediterranean trade replacing its cooperation with the 2M Alliance on this trade. In addition, ZIM terminated its slot purchase from MSC which began in October 2018 on two lines in India-EastIndian subcontinent to East Mediterranean trade, which also currently limits its access to the Suez Canal (See, “Item 3.D Risk Factors—Risks Related to our Interest in ZIM—Global economic downturns and geopolitical challenges throughout the world could have a material adverse effect on ZIM’s business, financial condition and results of operations,” and “Item 3.D Risk Factors—Risks Related to our Interest in ZIM—ZIM replaced this cooperation with an independent service line on this tradeis incorporated and based in December 2021 (ZMI)Israel and, therefore, ZIM’s results may be adversely affected by political, economic and military instability in Israel. Specifically, the current war between Israel and Hamas and the additional armed conflicts in the Middle East may adversely affect ZIM’s business”). This service was extended to North Europe as of February 2022. As of December 31, 2022,2023, ZIM offersoffered two services in the Cross-Suez geographic trade zone (currently rerouted), which had an effective weekly capacity of 6,0003,940 TEUs and covered all major international shipping ports in the East Mediterranean, the Black Sea, China, East and Southeast Asia and India. The Cross-Suez geographic trade zone accounted for 14%12% of ZIM’sits freight revenues from containerized cargo for the year ended December 31, 2022.2023. Atlantic-Europe geographic trade zone. The Atlantic-Europe geographic trade zone serves the Atlantic trade, which covers trade between North America and the Mediterranean, along with Intra-Europe/Mediterranean trade. ZIM’s services within this geographic trade zone also connect to Intra-Mediterranean and Intra-America regional feeder lines which provide onward connections to additional ports. Since 2014, ZIM has had a cooperation agreement with Hapag-Lloyd and other companies in its Atlantic services. In addition, ZIM has terminated its cooperation agreements with MSC in the Intra-Europe/Mediterranean trade and intends to replace this cooperation with an extension to North Europe on its ISC-Mediterranean independent service. ZIM also has aZIM’s new cooperation agreement with COSCO inMSC also includes two joint services from Israel and the Intra-Mediterranean trade. 131
East Mediterranean to North Europe. As of December 31, 2022,2023, ZIM offered 910 services within this geographic trade zone, with an effective weekly capacity of 8,7598,707 TEUs, covering major international shipping ports in the East and West Mediterranean, the Black Sea, Northern Europe, the Caribbean, the Gulf of Mexico, and the east and west coasts of North America. The Atlantic-Europe geographic trade zone accounted for 11%16% of ZIM’s freight revenues from containerized cargo for the year ended December 31, 2022.2023. Intra-Asia geographic trade zone. The Intra-Asia and Asia-Africa geographic trade zone serves the Intra-Asia trade, which covers trades within regional ports in Asia, including ISC (Indian sub-continent), Africa and Australia. The Intra-Asia geographic trade zone accounted for 18% of ZIM’s freight revenues from containerized cargo for the year ended December 31, 2022.Oceana. ZIM’s services within this geographic trade zone feed into the global lines of the Pacific and Cross-Suez trades. This geographic trade zone is characterized by extensive structural changes that ZIM has made to respond to changes in trade and market conditions. The Intra-Asia market is highly fragmented with many active carriers, all with relatively small market shares. Local shipping companies have a significant presence within this trade, which is primarily serviced by relatively small vessels. However, larger vessels that operate in the intercontinental trade also serve this trade and call at ports within the region. For example, ZIM has cooperationrecently upscaled its vessels on one of its Intra-Asia services calling India subcontinent ports to 10,000 TEUs. ZIM has operational agreements with several other shipping companies within this trade. As of December 31, 2022,2023, ZIM offers 32offered 27 services within this geographic trade zone with an effective weekly capacity of 20,50514,712 TEUs. The Intra-Asia geographic trade zone accounted for 16% of ZIM’s freight revenues from containerized cargo for the year ended December 31, 2023. ZIM’s services within this geographic trade zone cover major regional ports, including those in China, Korea, Thailand, Vietnam and other ports in Southeast Asia, India, Africa, Thailand, Vietnam, New Zealand and Australia, and connect to shipping lines within its Cross-Suez and Pacific geographic trade zones. Latin America geographic trade zone. The Latin America geographic trade zone consists of the Intra-America trade, which covers trade within regional ports in the Americas, as well as trade between the South American east coast and Asia and trade between the South American east coast and West Mediterranean. The regional services within this geographic trade zone are linked to ZIM’sits Pacific and Atlantic-Europe geographic trade zones. ZIM cooperates with other carriers within the regional services: ZIM cooperates with Maersk via a vessel sharing agreement in the Asia-East Coast South America, and ZIM cooperates with other carriers on the Mediterranean- EastMediterranean-East Coast South America sub-trades mostly by slots purchase. In addition, ZIM replaced several joint services with its newly launched service, ZIM Gulf Toucan (ZGT), connecting South America to the Gulf of Mexico. ZIM also launched a second independent service, ZIM Albatross (ZAT), connecting China and Southeast Asia to the west coast of South America. These new services facilitated a significant growth in the scope of ZIM’s activities in the Latin America geographic trade zone during 2023. As of December 31, 2022,2023, ZIM offers 13offered 18 services within this geographic trade zone as well as a complementary feeder network with an effective weekly capacity of 3,6428,696 TEUs and operated between major regional ports, including ports in Brazil, Argentina, Uruguay, Mexico, the Caribbean, Central America, China, U.S. Gulf Coast, U.S. east coast and the West Mediterranean, and connect to ZIM’sits Pacific and Atlantic- EuropeAtlantic-Europe services. The Latin America geographic trade zone accounted for 7%11% of ZIM’s freight revenues from containerized cargo for the year ended December 31, 2022.2023. Types of cargo The following table sets forth details of the types of cargo ZIM shipped during the twelve months ended December 31, 20222023, as well as the related quantities and volume of containers (owned and leased). | | | | | | | | | | | | | | | | | | Dry van containers | | Most general cargo, including commodities in bundles, cartons, boxes, loose cargo, bulk cargo and furniture | | | 1,860,853 | | | | 3,131,023 | | | Most general cargo, including commodities in bundles, cartons, boxes, loose cargo, bulk cargo and furniture | | | 1,824,378 | | | | 3,092,964 | | | Reefer containers | | Temperature controlled cargo, including pharmaceuticals, electronics and perishable cargo | | | 96,200 | | | | 189,610 | | | Temperature controlled cargo, including pharmaceuticals, electronics and perishable cargo | | | 100,510 | | | | 198,907 | | | Other specialized containers | | Heavy cargo and goods of excess height and/or width, such as machinery, vehicles and building | | | | | | | | | | Heavy cargo and goods of excess height and/or width, such as machinery, vehicles and building | | | | | | | | | | Total | | | | | 2,005,831 | | | | 3,379,986 | | | | | | 1,981,061 | | | | 3,362,619 | |
ZIM’s vessel fleet As of December 31, 2022,2023, ZIM’s fleet included 150144 vessels (139(128 container vessels and 1116 vehicle transport vessels), of which nine vessels were owned by ZIM and 141135 vessels are chartered-in (including 136 vessels accounted as right-of-use assets under the lease accounting guidance of IFRS 16 and 4 vessels accounted under sale and leaseback refinancing agreements).chartered-in. As of December 31, 2022,2023, ZIM’s operating fleet (including both owned and chartered vessels) had a capacity of 549,278638,801 TEUs. The average size of ZIM’s vessels is approximately 3,9524,991 TEUs, compared to an industry average of 4,5644,689 TEUs. During the second half of 2021 ZIM has completed the purchase transaction of eight secondhand vessels, ranging from 1,100 to 4,250 TEUs each, in several separate transactions, for an aggregated amount of $355$ 355 million with all purchased vessels delivered during 2021 and 2022. In February 2024, ZIM completed the acquisition of an additional three 10,000 TEU vessels and two 8,500 TEU vessels that ZIM already chartered by exercising an option to acquire them, so as of March 1, 2024, following these purchases, in addition to one vessel already previously owned by us, ZIM owned 14 vessels in its operated fleet. ZIM may purchase additional secondhand vessels if itZIM evaluates that such purchase is more suited to its needs than other available alternatives. ZIM charters-in vessels under charter party agreements for varying periods. With the exception of certain vessels for which charter rates were set in connection with a restructuring arrangement ZIM undertook in 2014, ZIM’s charter rates are fixednegotiated and predetermined at the time of entry into the charter party agreement and depend upon market conditions existing at that time. As of December 31, 2022,2023, all of ZIM’s chartered vesselsvessel agreements consistsconsist of chartering-in the vessel capacity for a given period of time against a daily charter fee, with 137 vessels chartered while the crewing and technical operation of the vessel is handled by its owner, including six3 vessels chartered-in under a time charter from related parties, and four vessels chartered-in under a “bareboat charter,” which consists of chartering a vessel for a given period of time against a charter fee, with the operation of the vessel being handled by ZIM.parties. Subject to any restrictions in the applicable arrangement, ZIM determines the type and quantity of cargo to be carried as well as the ports of loading and discharging. ZIM’s vessels operate worldwide within the trading limits imposed by its insurance terms. As of December 31, 2022,2023, the remaining average duration of ZIM’s chartered fleet was approximately 2633 months, based on the earliest perioddate of redelivery. As of December 31, 2022,2023, ZIM’s fleet was comprised of vessels of various sizes, ranging from less than 1,000 TEUs to 12,00015,000 TEUs, which allows for flexible deployment in terms of port access and is optimally suited for deployment in the sub-trades in which ZIM operates. As of March 1, 2023, ZIM’s fleet included 149 vessels (138 container vessels and 11 vehicle transport vessels), of which nine vessels are owned by ZIM and 140 vessels are chartered-in (including four vessels accounted under sale and leaseback refinancing agreements) and ZIM’s owned and chartered container vessels had a capacity of 559,004 TEUs. As of March 1, 2023, this fleet included the newly built vessel ZIM Sammy Ofer, a modern dual-fuel LNG vessel with a capacity of 15,000 TEUs, which is the first among ten vessels of this type that ZIM chartered in a long term chartering transaction with Seaspan that are expected to be delivered to ZIM during 2023-2024.
Further, as of March 1, 2023, approximately 113 of ZIM’s chartered-in vessels are under long-term leases with a remaining charter duration of more than one year, as ZIM continues to actively manage its asset mix.
The following table provides summary information, as of December 31, 2022,2023, about ZIM’s fleet: | | | | | | | | | | | | | | | Vessels owned by ZIM | | | 9 | | | | 31,842 | | | | — | | | | 9 | | | Vessels chartered from parties related to ZIM | | | 5 | | | | 20,660 | | | | 1 | | | | 6 | | | Periods up to 1 year (from December 31, 2022) | | | 3 | | | | 12,154 | | | | | | | | 3 | | | Periods between 1 to 5 years (from December 31, 2022) | | | 2 | | | | 8,506 | | | | 1 | | | | 3 | | | Periods over 5 years (from December 31, 2022) | | | — | | | | — | | | | — | | | | — | | Vessels chartered from third parties(2) | | | 125 | | | | 496,776 | | | | 10 | | | | 135 | | | Periods up to 1 year (from December 31, 2022) | | | 27 | | | | 75,285 | | | | 1 | | | | 28 | | | Periods between 1 to 5 years (from December 31, 2022) | | | 95 | | | | 408,732 | | | | 9 | | | | 99 | | | Periods over 5 years (from December 31, 2022) | | | 3 | | | | 12,759 | | | | — | | | | 3 | | Total(3) | | | 139 | | | | 549,278 | | | | 11 | | | | 150 | |
| | | | | | | | | | | | | | | Vessels owned by ZIM | | | 9 | | | | 31,842 | | | | — | | | | 9 | | | Vessels chartered from parties related to ZIM | | | 1 | | | | 4,253 | | | | 2 | | | | 3 | | | Periods up to 1 year (from December 31, 2023) | | | 1 | | | | 4,253 | | | | 1 | | | | 2 | | | Periods between 1 to 5 years (from December 31, 2023) | | | — | | | | — | | | | 1 | | | | 1 | | | Periods over 5 years (from December 31, 2023) | | | — | | | | — | | | | — | | | | — | | | Vessels chartered from third parties | | | 118 | | | | 602,706 | | | | 14 | | | | 132 | | | Periods up to 1 year (from December 31, 2023) | | | 32 | | | | 105,526 | | | | — | | | | 32 | | | Periods between 1 to 5 years (from December 31, 2023) | | | 74 | | | | 355,584 | | | | 14 | | | | 88 | | | Periods over 5 years (from December 31, 2023) | | | 12 | | | | 141,596 | | | | — | | | | 12 | | Total(1) | | | 128 | | | | 638,801 | | | | 16 | | | | 144 | |
_________________________________________________________________________________
| (1) | Includes 136 vessels accounted as right-of-use assets under the accounting guidance of IFRS 16.
|
(2) | Includes 130 vessels accounted as right-of-use assets under the accounting guidance of IFRS 16 and 4 vessels accounted under sale and leaseback refinancing agreements.
|
(3) | Under ZIM’s time charters, the vessel owner is responsible for operational costs and technical management of the vessel, such as crew, maintenance and repairs including periodic drydocking, cleaning and painting and maintenance work required by regulations, and certain insurance costs. Transport expenses such as bunker and port canal costs are borne by ZIM. For some of the vessels that ZIM owns and for its vessels ZIM charters under “bareboat” terms, ZIM provides its own operational and technical management services or through a third-party ship management service provider. ZIM’s operationalOperational management services include the chartering-in, sale and purchase of vessels and accounting services, while its technical management services include, among others, selecting, engaging, and training competent personnel to supervise the maintenance and general efficiency of itsZIM’s vessels; arranging and supervising the maintenance, drydockings, repairs, alterations and upkeep of itsthe vessels, in accordance with the standards developed by ZIM, the requirements and recommendations of each vessel’s classification society, and relevant international regulations and maintaining necessary certifications and ensuring that itsthe vessels comply with the law of their flag state. |
As of March 1, 2024, ZIM’s operated fleet included 150 vessels (134 container vessels and 16 vehicle transport vessels), of which 14 vessels are owned by ZIM and 136 vessels are chartered-in. ZIM’s owned and chartered container vessels had a capacity of 703,380 TEUs. As of March 1, 2023, this operated fleet included 24 new-build vessels out of a total of 46 new-build modern vessels long term chartered by us, with an additional 22 vessels expected to be delivered to us during 2024. Further, as of March 1, 2024, approximately 74.8 of ZIM’s chartered-in vessels (84.5% in terms of TEU capacity) are under long-term leases with a remaining charter duration of more than one year, as ZIM continues to actively manage its asset mix. Strategic Chartering Agreements Long term charter agreement for LNG-Fueled Vessels from Seaspan Corporation In February 2021 ZIM and Seaspan Corporation entered into a strategic agreement for the long-term charter of ten 15,000 TEU liquified natural gas (LNG dual-fuel) container vessels, expected to be delivered between February 2023 and March 2024.vessels. Pursuant to the agreement, ZIM will charter the vessels for a period of 12 years with the option to extend it by additional charter periods. ZIM’s total cost during the term of the agreement will depend on the charter period and the initial payment ZIM selects to pay. ZIM was further granted by Seaspan a right of first refusal to purchase the chartered vessels should Seaspan choose to sell them during the charter period, and an option to purchase the vessels at the end of the charter term. ZIM has stated that it intends to deploy these vessels on its Asia-US East Coast Trade as an enhancement to its service on this strategic trade. In addition, in July 2021 ZIM announced a second strategic agreement with Seaspan for the long-term charter for a consideration in excess of $1.5 billion, of ten 7,000uniquely designed 7,700-class TEU LNG dual fuel container vessels with an option for additional five vessels, to serve across ZIM’s various global niche trades, with vessels expected to be delivered during the fourth quarter of 2023 and throughout 2024.trades. In September 2021 ZIM announced the exercise of an option granted to itZIM under this agreement to long term charter five additional 7,0007,700-class TEU LNG vessels, to be delivered during the third and fourth quarters of 2024 for an additional consideration in excess of $750 million. Following the exercise of this option, the total vessels to be chartered under this second strategic agreement is fifteen. To date, nine 15,000 TEU and five 8,420 TEU LNG dual fuel LNG container vessels have been delivered to ZIM announced that itwith the remaining vessels expected to be delivered during 2024. ZIM expects to incur, in annualized charter hire costs per vessel (in addition to down payments made on the delivery of each vessel), approximately $17 million in respect of the abovementioned 15,000 TEU vessels, and approximately $13 million in respect of the abovementioned 7,000 TEU vessels, over the term of the agreements. Long-term charter agreement for LNG-fueled vessels from a shipping company affiliated with Kenon In January 2022 ZIM announced that it entered into a new eight-year charter agreement with a shipping company that is affiliated with Kenon Holdings Ltd., its largest shareholder, according to which ZIM will charter three 7,0007,700-class TEU LNG dual-fuel container vessels to be deployed in its global niche trades for a total consideration of approximately $400 million. The vessels will be constructed at Korean-based shipyard, Hyundai Samho Heavy Industries, with one 7,920 TEU LNG dual fuel vessel already delivered and the remaining vessels are scheduled to be delivered during the first and second quartershalf of 2024. Charter agreement with Navios Maritime Holdings Inc. In February 2022, ZIM announced that it and Navios Maritime Holdings Inc. entered into a charter agreement for the charter of thirteen container vessels comprising of five secondhand vessels and eight newbuild vessels of total consideration of approximately $870 million. The five secondhand vessels’ capacity range from 3,500 to 4,360 TEUs and were delivered during the first and second quarter of 2022 and deployed across ZIM’s global network. TheToday two of the eight 5,300 TEU wide beam newbuilds are scheduled tohave been delivered and the rest will be delivered during the third quarter of 2023 through the fourth quarter of 2024 and are expected to be deployed in trades between Asia and Africa. The charter period of the secondhand vessels is approximately 4.5 years, whereas the charter duration of the newbuild vessels is approximately five years. Charter agreement with MPC Container Ships ASA and MPC Capital AG In March 2022 ZIM announced that it and MPC Container Ships ASA and MPC Capital AG entered into a new charter agreement according to which ZIM has announced it will charter a total of six 5,500 TEU wide beam newbuild vessels for a period of seven years and a total consideration of approximately $600 million. The vessels will beare being constructed at a Korean-based shipyard HJ Shipbuilding & Construction (formally known as Hanjin Heavy Industries & Construction Co.), and are scheduled. Three of these vessels have been delivered, with the remaining vessels to be delivered between May 2023 and Februarythroughout 2024. ZIM’s containers In addition to the vessels that itZIM owns and charters, ZIM owns and charters a significant number of shipping containers. As of December 31, 2022,2023, ZIM held approximately 537,000508 thousand container units with a total capacity of approximately 936,000885 thousand TEUs, of which 37%44% were owned by ZIM and 63%56% were leased (including 55%49% accounted as right-of-use assets). In some cases, the terms of theits leases provide that ZIM will have the option to purchase the container at the end of the lease term. Container fleet management ZIM announced that it aims to reposition empty containers in the most cost-efficient way in order to minimize its overall empty container moves and container fleet while meeting demand. Due to a natural imbalance in demand between trade areas, ZIM has said that it seeks to optimize its container fleet by repositioning empty containers at minimum cost in order to timely and efficiently meet its customers’ demands. ZIM’s global logistics team oversees the internal management of empty containers and equipment to support this optimization effort. In addition to repairing and maintaining ZIM’s container fleet, ZIM’sits logistics team continuously optimizes the flow of empty containers based on commercial demands and operational constraints. Below is a summary of ZIM’sits logistics initiatives relating to container fleet management:
| • | Slot swap agreements. ZIM enters into agreements with other carriers for the exchange of vessel space, or “slots,”“slots”, for repositioning of empty containers. Under these agreements, other carriers offer ZIM space on their own operated vessels, in exchange for space on its vessels for the purpose of repositioning empty containers. ZIM has greatly developed this type of cooperation. ZIM has slot swap agreements with 1415 carriers and exchange thousands of TEUs each year. |
| • | Slot sale agreements. ZIM sells slots on board its vessels to transport empty containers. |
| • | One-way container lease. ZIM uses leasing companies and other shipping liners’ empty containers to move cargo from locations with increased demand to over-supplied locations. ZIM is a global leader in one-way container volumes. |
| • | Equipment sub-leases. ZIM leases its equipment to other carriers and freight forwarders in order to reduce its container repositioning and evacuation costs. |
135In January 2024, ZIM entered into an agreement with Hoopo to deploy Hoopo’s tracking device on ZIM’s dry-van container fleet, which offers its customers comprehensive tracking information including geofence alerts and open/close door notifications and more, while ensuring high reliability and durability combined with significant cost and energy efficiencies.
ZIM’s operational partnerships ZIM is party to a large number of cooperation agreements with other shipping companies and alliances, which generally provide for the joint operation of shipping services by vessel sharing agreements, the exchange of capacity and the sale or purchase of slots on vessels operated by ZIM or other shipping companies. ZIM does not participate in any alliances, which are a type of vessel sharing agreement that involves joint operations of fleets of vessels and sharing of vessel space in multiple trades, although ZIM does partner with the 2M Alliance in a strategic cooperation as described below. Strategic Cooperation Agreement with the 2M Alliance In April 2022 ZIM amended and extended its agreement with the 2M Alliance to include the extension of its collaboration on the Asia-USECAsia-U.S. East Coast (USEC) and Asia-USGCAsia-U.S. Gulf Coast (USGC) under a full slot exchange and vessel sharing agreement originally established in September 2018 and August 2019, respectively. The strategic cooperation on the Asia-USEC currently includes a joint network of five loops between Asia and USEC, out of which one is operated by ZIM (ZCP) and four are operated by the 2M Alliance. ZIM is currently in the process of upscaling its vessels on this service to 10 15,000 TEU LNG dual-fueled container vessels. In addition, ZIM and the 2M Alliance agreed to swap slots on all five loops under the agreement and ZIM has the right tocould purchase additional slots in order to meet total demand in these trades. The strategic cooperation on the Asia-USGC currently includes two services, of which one is operated by ZIM,through a vessel sharing agreement, and one is operated by the 2M Alliance. ZIM has replacedterminated its previous cooperation with the 2M Alliance established in March 2019 on the Asia – Mediterranean Asia—Mediterranean—and Asia –- American Pacific Northwest with ZIM’s ownand are currently serving the Asia-Mediterranean trade independently and the Asia-Pacific Northwest trade by a slot purchase from MSC and an independent services.service. Under ZIM’s newits amended collaboration agreement with the 2M Alliance, ZIM or the 2M Alliance may terminate the agreement by providing a six-month prior written notice following the initial 12-month period from the effective date of the agreement which is a shorter period compared to(April 2022), and in any event, in accordance with the original agreement terms. Furthermore, in January 2023announcement made by the members of the 2M Alliance, announced the termination of the 2M Alliance will terminate in January 2025. ZIM has stated that it intends to deploy its 15,000 TEU LNG dual fuel vessels expected to be delivered during 2023-2024 on its operated service, ZCP, as part of its joint Asia-USEC networkThis strategic cooperation with the 2M Alliance.Alliance enables ZIM to provide its customers with improved port coverage and transit time, while generating cost efficiencies. Operational Collaboration Agreement with MSC on Multiple Trades In July 2023 ZIM entered into a new slot charter agreement with MSC on the Asia-PNW trade. In September 2023, ZIM entered into new operational agreements with MSC, encompassing several trades and seven service lines. The cooperation scope includes services connecting the Indian Subcontinent with the East Mediterranean (currently rerouted), the East Mediterranean with Northern Europe, and services connecting East Asia with Oceania. The joint services include a vessel sharing agreement, slots swaps and slot purchase arrangements. The agreements are in effect for a period of two years, may be extended for additional periods and may be terminated by providing a six-month period prior notice provided that such notice will not be given before 18 months after the effective date of the agreements. The table below shows ZIM’s operational partners by geographic trade zone as of December 31, 2022:2023: | | | | | | | | | | | | | | | A.P. Moller-Maersk(1)
| | ✓ | | | | ✓ | | | | ✓ | Mediterranean Shipping Company(1)
| | ✓ | | ✓ | | ✓ | | ✓ | | ✓ | CMA CGM S.A.
| | | | | | ✓ | | | | | Evergreen Marine Corporation
| | | | | | ✓ | | | | | Hapag-Lloyd AG(2)
| | | | | | ✓ | | ✓ | | ✓ | China Ocean Shipping Company (COSCO)
| | | | | | ✓ | | ✓ | | | ONE
| | | | | | ✓ | | ✓ | | | | Orient Overseas Container Line Limited (OOCL) | | | | | | ✓ | | | | | Yang Ming Marine Transport Corporation
| | | | | | ✓ | | ✓ | | | Hyundai Merchant Marine Co., Ltd.
| | | | | | ✓ | | | | | Others
| | | | | | ✓ | | | | ✓ |
_____________________________________
| (1) | ZIM’s cooperation with Maersk and MSC is under the 2M Alliance framework. However, in the Latin America ZIM also has aframework, except: (i) its collaboration agreements with MSC as of July and September 2023 (as detailed above); (ii) its separate bilateral cooperation agreement with MSC in the Latin America; and (iii) its separate bilateral cooperation with MSC on the Atlantic terminated effective as of April 2022. ZIM also has a separate bilateral cooperation agreement with Maersk in the Latin America and Intra AsiaIntra-Asia trades. |
| (2) | With respect to the Atlantic-Europe trade, ZIM has a swap agreement with THE Alliance member Hapag-Lloyd, supporting ZIM loadings on THE Alliance service on this trade. ZIM also has a separate bilateral agreement with respect to the Atlantic-Europe trade with Hapag-Lloyd in its standalone capacity. |
ZIM’s Customers In 2022,2023, ZIM had more than 34,00032,600 customers using its services on(on a non-consolidated basis.basis) using ZIM’s service. ZIM’s customer base is well-diversified, and itZIM does not depend upon any single customer for a material portion of its revenue. For the twelve monthsyear ended December 31, 2022,2023, no single customer represented more than 3%2% of ZIM’sits revenues. ZIM’s customers are divided into “end-users,” including exporters and importers, and “freight forwarders.” Exporters include a wide range of enterprises, from global manufacturers to small family-owned businesses that may ship just a few TEUs each year. Importers are usually the direct purchasers of goods from exporters, but may also comprise sales or distribution agents and may or may not receive the containerized goods at the final point of delivery. Freight forwarders are non-vessel operating common carriers that assemble cargo from customers for forwarding through a shipping company. End-users generally have long-term commitments that facilitate planning for future volumes, which results in high entry barriers for competing carriers due to customer loyalty. Freight forwarders have short-term contracts at renegotiated rates. As a result, entry barriers are low for competing carriers for this customer base. During the last five years, end-users have constituted approximately 26%30% of ZIM’s customers in terms of TEUs carried, and the remainder of its customers were freight forwarders. ZIM’s contracts with its main customers are typically for a fixed term of one year on all trades. ZIM’s contracts with customers may be for a certain voyage or period of time and typically do not include exclusivity clauses in ourits favor. ZIM’s customer mix varies within each of the markets in which it operates. For the years ended December 31, 2023, 2022 2021 and 2020,2021, ZIM’s five largest customers in the aggregate accounted for approximately 6%, 10%, 12% and 10%12% of its freight revenues and related services, respectively, and 6%7%, 6% and 8% and 7% of ZIM’sits TEUs carried for each year. Suppliers Vessel owners As of December 31, 2022,2023, ZIM chartered approximately 94.2%95.0% of its TEU capacity and 94.0%93.8% of the vessels in its fleet. Access to chartered-in vessels of varying capacities, as appropriate for each of the trades in which ZIM operates,operate, is necessary for the operation of its business. See “Item 3.D 3.D—Risk Factors—Risks Related to Operating ZIM’s Vessel Fleet—ZIM charters-in most of its fleet, which makes it more sensitive to fluctuations in the charter market, and as a result of its dependency on the vessel charter market, the costs associated with chartering vessels are unpredictableunpredictable..” ZIM may face a possible shortage of vessel for hire in the future. Port operators ZIM has Terminal Services Agreements (TSAs) with terminal operators and contractual arrangements with other relevant vendors to conduct cargo operations in the various ports and terminals that itZIM uses around the world. Access to terminal facilities in each port is necessary for the operation of ZIM’sits business. Although ZIM believes it has been able to contract for sufficient capacity at appropriate terminal facilities in the past five years, possible increase in demand, congestion in ports and terminals and other geopolitical and macroeconomic events may increase its costs and dependency on berthing windows in terminals. This dependency is especially critical for express or expediated services such as its ZEX service connecting China and southeast Asia to the U.S. west coast, where the speed of service and avoiding bottlenecks is a key factor for its customers. Bunker suppliers ZIM has contractual agreements to purchase approximately 85%%80% of its annual bunker estimated requirements with suppliers at various ports around the world. ZIM has been able to secure sufficient bunker supply under contract or on a spot basis. For ZIM’sits strategic agreement with Shell and risks relating to the supply of LNG see “Item 3.D 3.D—Risk Factors—Risks Related to Operating ZIM’s Vessel Fleet—factors—Rising energy and bunker prices (including LNG) may have an adverse effect on ZIM’sits results of operations.” Land transportation providers ZIM has services agreements with third-party land transportation providers, including providers of rail, truck and river barge transport. ZIM is a party to a rail services agreement with some of the Class-1 service providers to main inland locations in the U.S.United States and Canada. ZIM’s Sustainability and Focus on ESG Through itsZIM’s core value of sustainability, and in accordance with its Code of Ethics, ZIM aims to uphold and advance a set of principles regarding ethical,environmental, social and environmentalgovernance concerns, and with ZIM’sits supplier code of conduct itZIM aims to withhold a strong, secure and responsible supply chain. ZIM’s goal is to work resolutely to eliminate corruption risks, promote diversity among its teams and continuously reduce the environmental impact of its operations, both at sea and onshore. Furthermore, ZIM has elected to enter into long term charter transactions of LNG dual-fuel vessels to reduce pollutant emissions as a result of bunker consumption, and five of these vessels are also ablepartly ready to be powered by ammoniaAmmonia in the event it will become a feasible “cleaner” fuel. In addition to actively working to reduce accidents and security risks in its operations, ZIM also endeavors to eliminate corruption risks as a member of the Maritime Anti-Corruption Network (MACN), with a vision of a maritime industry that enables fair trade. ZIM also fosters quality throughout the service chain, by selectively working with qualified partners to advance its business interests. Finally, ZIM promotes diversity among its teams, with a focus on developing high-quality training courses for all employees. ZIM has invested efforts and resources in promoting diversity in theits company, such as monitoring gender diversity of theits company on an annual basis, collaborating with .nonprofitnonprofit organization to increase the hiring of employees from diverse backgrounds and with disabilities, participating in special events to raise awareness to diversity and globally communicating its efforts, both internally and externally. As ZIM continues to grow, sustainability remains a core value. ZIM expects ESG regulation will intensify in the future. ZIM’s Competition ZIM competes with a large number of global, regional and niche shipping companies to provide transport services to customers worldwide. In each of its key trades, ZIM competes primarily with global shipping companies. The market is significantly concentrated with the top three carriers — A.P. Moller-Maersk Line, MSC and COSCOCMA-CGM — accounting for approximately 46.3%46.7% of global capacity, and the remaining carriers together contributing 53.7%53.3% of global capacity as of FebruaryDecember 2023, according to Alphaliner. As of FebruaryDecember 2023, ZIM controlled approximately 2.0%2.1% of the global cargo shipshipping capacipityng capacity and ranked 10trahnked 10th among shipping carriers globally in terms of TEU operated capacity, according to Alphaliner. In addition to the large global carriers, regional carriers generally focus on a number of smaller routes within a regional market and typically offer services to a wider range of ports within a particular market as compared to global carriers. Niche carriers are similar to regional carriers but tend to be even smaller in terms of capacity and the number and size of the markets in which they operate. Niche carriers often provide an intra-regional service, focusing on ports and services that are not served by global carriers. ZIM’s Seasonality ZIM’s business has historically been seasonal in nature. As a result, ZIM’s average freight rates have reflected fluctuations in demand for container shipping services, which affect the volume of cargo carried by ZIM’sits fleet and the freight rates which ZIM charges for the transport of such cargo. ZIM’s income from voyages and related services are typically higher in the third and fourth quarters than the first and second quarters due to increased shipping of consumer goods from manufacturing centers in Asia to North America in anticipation of the major holiday period in Western countries. The first quarter is affected by a decrease in consumer spending in Western countries after the holiday period and reduced manufacturing activities in China and Southeast Asia due to the Chinese New Year. However, operating expenses such as expenses related to cargo handling, charter hire of vessels, fuel and lubricant expenses and port expenses are generally not subject to adjustment on a seasonal basis. As a result, seasonality can have an adverse effect on ZIM’s business and results of operations. Recently, as a result of the continuing volatility within the shipping industry, seasonality factors have not been as apparent as they have been in the past. As global trends that affect the shipping industry have changed rapidly in recent years, including trends resulting from the COVID-19 pandemic and other geopolitical events, it remains difficult to predict these trends and the extent to which seasonality will be a factor impacting ZIM’s results of operations in the future. ZIM’s Legal Proceedings For information on ZIM’s legal proceedings, see Note 27 to ZIM’s audited consolidated financial statements that have been incorporated by reference herein. In respect of the alleged patent infringement claim against ZIM, as disclosed in Note 27(h) to ZIM’s audited consolidated financial statements, in March 2022, the plaintiff voluntarily withdrew the claim and the proceeding has been terminated. ZIM’s Regulatory Matters Environmental and other regulations in the shipping industry Government regulations and laws significantly affect the ownership and operation of ZIM’s vessels. ZIM is subject to international conventions and treaties, national, state and local laws and national and international regulations in force in the jurisdictions in which ZIM’s vessels operate or are registered relating to the protection of the environment. Such requirements are subject to ongoing developments and amendments and relate to, among other things, the storage, handling, emission, transportation and discharge of hazardous and non-hazardous substances, such as sulfur oxides, nitrogen oxides and the use of low-sulfur fuel or shore power voltage, and the remediation of contamination and liability for damages to natural resources. These laws and regulations include OPA 90, CERCLA, the CWA, the U.S. Clean Air Act of 1970 (including its amendments of 1977 and 1990) (CAA), and regulations adopted by the IMO, including the International Convention for Prevention of Pollution from Ships (MARPOL), and the International Convention for Safety of Life at Sea (the SOLAS Convention), as well as regulations enacted by the European Union and other international, national and local regulatory bodies. Compliance with such requirements, where applicable, entails significant expense, including vessel modifications and implementation of certain operating procedures. If such costs are not covered by ZIM’s insurance policies, ZIM could be exposed to high costs in respect of environmental liability damages, administrative and civil penalties, criminal charges or sanctions, and could suffer substantive harm to its operations and goodwill to the extent that environmental damages are caused by its operations. ZIM instructs the crews of its vessels on environmental requirements and it operates in accordance with procedures that are intended to ensure compliance with such requirements. ZIM also insures its activities, where effective for ZIM to do so, in order to hedge its environmental risks. In July 2021 the European Commission presented its ‘Fit for 55’ package, which includes, among others, a legislative proposal to apply the EU emissions Trading System (ETS) on maritime shipping. ETS are market-based “cap and trade” scheme in which entities trade emissions rights within an area under a cap placed on the quantity of specified pollutants. ZIM expects to incur additional expenses as a result if and when this proposal becomes effective, and ZIM may not be able to recover or minimize its additional costs by increasing its fees ZIM collects from its customers. The European Union’s Emissions Trading System, or ETS, which entered into effect on January 1, 2024, sets a limit on the total amount of greenhouse gases that we as a shipping company are permitted to emit on route to or from European Union members’ ports. Such cap is expressed in emission allowances, where one allowance gives the right to emit one ton of carbon dioxide equivalent. Each year, ZIM will be required to surrender enough allowances to fully account for ZIM’s emissions, otherwise ZIM will be subject to heavy fines. The ETS Regulations require ZIM to purchase and surrender allowances equal to a percentage of ZIM’s emissions that gradually increases over time, from 40% of reported emissions in 2024 to 100% of reported emissions in 2026. ZIM anticipates it will be required to purchase allowances from the EU carbon market on an ongoing basis, which will increase ZIM’s operating costs. ZIM has implemented a New Emission Factor, or NEF, surcharge, intended to pass on to customers the additional costs associated with compliance with the ETS Regulations, however there is no assurance that this surcharge will enable ZIM to mitigate the possible increase costs in full or at all. The IMO 2020 Regulations, the ETS and any future air emissions regulations with which ZIM must comply may cause ZIM to incur substantial additional operating costs. ZIM has been, and continues to be, subject to investigations and party to legal proceedings relating to competition concerns. In recent years, a number of liner shipping companies, including ZIM, have been the subject of antitrust investigations in the U.S., the EU and other jurisdictions into possible anti-competitive behavior. Furthermore, the recent spike in freight rates and related charges during 2020 and 2021 following the past two yearsCOVID-19 pandemic outbreak has resulted in increased scrutiny by governments and regulators around the world, including U.S. President Biden’sBiden's administration and the U.S. FMC in the U.S., and the ministry of transportation in China. FMC in the U.S., and the ministry of transportation in China. In the U.S., the Ocean Shipping Reform Act of 2022 (OSRA) signed into law in June 2022 requires ZIM and all other carriers to immediately implement certain requirements in detention and demurrage invoices, which if not included will eliminate any obligation of the charged party to pay the charge, including certifying that all detention and demurrage invoices are issued in compliance with the FMC’s Interpretive Rule on Detention and Demurrage of May 18, 2020. These requirements in detention and demurrage invoices may affect ZIM’s ability to effectively collect these fees from itsZIM’s customers, heighten the risk of civil litigation and adversely affect itsZIM’s financial results. OSRA further mandates a series of rule-making projects by FMC, including: (i) defining prohibited practices by common carriers and other industry players when assessing detention and demurrage; (ii) defining what is an “unreasonable” refusal of cargo space, as well as unfair or unjustly discriminatory methods; (iii) defining what is “unreasonable refusal” to deal or negotiate with respect to vessel space, and (iv) authorizing the FMC to determine “essential terms” that are deemed by FMC necessary to be included in maritime shipping service. Subsequently, the FMC published in June 2023 a proposed rule that defines when it is unreasonable for a carrier to deny cargo space accommodations when those are available, and in February 2023 published a final rule that prohibits the collection of detention and demurrage from U.S. truckers and consignees on import. In addition to the FMC rulemaking projects, other new legislation initiatives have been introduced in Congress, which, if passed, could further restrict ZIM’s commercial position vis-à-vis supply chain providers and customers, create new regulatory (including environmental) requirements, as well as cancel or limit the applicable U.S. Shipping Act antitrust exemptions. Any new rule issued by the FMC addressing these topics or other related matterslegislative-related initiatives may have an adverse effect on ZIM’s business and financial results, including on itsZIM’s ability to negotiate commercial terms with itsZIM’s customers in itsZIM’s favor and itsZIM’s ability to collect itsZIM’s fees in exchange for ZIM’s services. If ZIM is found to be in violation of the applicable regulation, ZIM could be subject to various sanctions, including monetary sanctions. Specifically, in September 2022, an FMC complaint was filed against ZIM claiming ZIM overcharged detention and demurrage fees in violation of the FMC’s interpretive Rule on Detention and Demurrage of May 18, 2020, and is currently in preliminarydiscovery stages. ZIM’s operations involving the European Union are subject to E.U.EU competition rules, particularly Articles 101 and 102 of the Treaty on the Functioning of the European Union, as modified by the Treaty of Amsterdam and Lisbon. Article 101 generally prohibits and declares void any agreement or concerted actions among competitors that adversely affects competition. Article 102 prohibits the abuse of a dominant position held by one or more shipping companies. However, certain joint operation agreements in the shipping industry such as vessel sharing agreements and slot swap agreements are block exempted from certain prohibitions of Article 101 by Commission Regulation (EC) No 906/2009 as amended by Commission Regulation (EU) No 697/2014 and in effect until April 2024.2024 (Consortia Block Exemption Regulation, or “CBER”). This regulation permits joint operation of services among competitors under certain conditions, with the exception of price fixing, capacity and sales limitation and allocation of markets and customers, under certain conditions. During 2022, the European Union launched a legal review of the CBER to decide whether to renew, modify or allow the CBER to lapse. A similar review was also initiated by the UK competition authority as well. Theauthority. In October 2023, the EU competition authority, or the DG Competition, announced its intention not to renew the CBER following its expected expiry in April 2024. Following the expiry of the CBER, operational agreements remain legally permitted if they fall within the conditions of Article 101 of Treaty on the Functioning of the European Union and are subject to a self-assessment. A similar decision was taken by the United Kingdom’s Competition and Markets Authority (CMA) not to enact a UK block exemption that will replace the CBER following the Brexit. Although ZIM currently does not believe the non-renewal of the block exemptions regulation in the EU and UK will have a material impact on its operations as currently conducted, the non-renewal is expected to publish its conclusions onincrease legal costs, increase legal uncertainty and delay the futureimplementation of the CBER following a call for evidence published to industry stakeholders, with most of the responses received arguing for either modification or non-renewal of the CBER. If the Block Exemption Regulation is not extended or its terms are amended, this could have an adverse effect on the shipping industry and limitoperational cooperation agreements between carriers, thus potentially limiting ZIM’s ability to enter into cooperation arrangements with other shipping companies and effectively compete with other carriers, which could adversely affect ZIM’s business, financial condition and results of operations.carriers. In addition, the non-renewal or modification of the existing CBER is expected tomay adversely affect the review and renewal processes of similar block exemptions regulations in other jurisdictions, and the uncertainty of the future of the CBER may contribute to the shortening of block exemption regulation effective periods in other jurisdictions. See “Item 3.D “Risk Factors—Risks Related to Regulation—ZIM is subject to competition and antitrust regulations in the countries where itZIM operates, and has been subject to antitrust investigations by competition authorities.authorities in the past and may be subject to antitrust investigations in the future. Moreover, the sharp increase in freight rates and related charges during 2021ZIM relies on applicable competition exemptions for operational agreement with other carriers, and the first halfrevocation of 2022 has resulted in increased scrutiny by regulators around the world and ZIM may face antitrust investigationsthese exemptions could negatively affect ZIM’s business..” MARPOL Annex IV was amended effective as of November 1, 2022 and requires vessels to improve their energy efficiency and greenhouse gas emissions (GHG). See “Item 3.D Risk Factors—Risks Related to Regulation—Regulations relating to ballast water discharge may adversely affect ZIM’s results of operation and financial condition.” ZIM’s Special State Share When the State of Israel sold 100% of its interest in ZIM in 2004 to IC, ZIM ceased to be a “mixed company” (as defined in the Israeli Government Companies Law, 5735-1975) and issued a Special State Share to the State of Israel whose terms were amended as part of the Company’sZIM’s 2014 debt restructuring. The objectives underlying the Special State Share are to (i) safeguard ZIM’s existence as an Israeli company, (ii) ensure ZIM’s operating ability and transport capacity so as to enable the State of Israel to effectively access a minimal fleet in a time of emergency or for national security purposes and (iii) prevent parties hostile to the State of Israel or parties liable to harm the State of Israel’s interest in ZIM or its foreign or security interests or its shipping relations with foreign countries, from having influence on its management. The key terms and conditions of the Special State Share include the following requirements: ZIM must be, at all times, a company incorporated and registered in Israel, with its headquarters and principal and registered office domiciled in Israel. Subject to certain exceptions, ZIM must maintain a minimal fleet of 11 seaworthy vessels that are fully owned by ZIM, either directly or indirectly through its subsidiaries, at least three of which must be capable of carrying general cargo. Subject to certain exceptions, any transfer of vessels in violation thereof shall be invalid unless approved in advance by the State of Israel pursuant to the mechanism set forth in ZIM’s amended and restated articles of association. Currently, as a result of waivers received from the State of Israel, ZIM owns fewer vessels than the minimum fleet requirement. At least a majority of the members of ZIM’s board of directors, including the chairperson of the board and ZIM’s chief executive officer, must be Israeli citizens. The State of Israel must provide prior written consent for any holding or transfer or issuance of shares that confers possession of 35% or more of ZIM’s issued share capital, or that provides control over ZIM, including as a result of a voting agreement. Any transfer of shares that confers its owner with a holding of more than 24% but not more than 35% of ZIM’s issued share capital will require an advance notice to the State of Israel which will include full details regarding the proposed transferor and transferee, the percentage of shares to be held by the transferee after the transfer and relevant details regarding the transaction, including voting agreements and agreements for the appointment of directors (if any). If the State of Israel shall be of the opinion that the transfer of shares may possibly harm the security interests of the State of Israel or any of its vital interests or that it has not received the relevant information for the purpose of reaching its decision, the State of Israel shall be entitled to serve notice, within 30 days, that it objects to the transfer, giving reason for its objection. In such circumstances, the party requesting the transfer may initiate proceedings in connection with this matter with the competent court, which will consider and rule on the matter. The State of Israel must consent in writing to any winding-up, merger or spin-off, except for certain mergers with subsidiaries that would not impact the Special State Share or the minimal fleet. ZIM must provide governance, operational and financial information to the State of Israel similar to information that ZIM provides to its ordinary shareholders. In addition, ZIM must provide the State of Israel with particular information related to ZIM’s compliance with the terms of the Special State share and other information reasonably required to safeguard the State of Israel’s vital interests. Any amendment, review or cancellation of the rights afforded to the State of Israel by the Special State Share must be approved in writing by the State of Israel prior to its effectiveness. Other than the rights enumerated above, the Special State Share does not grant the State any voting or equity rights. The full provisions governing the rights of the Special State Share appear in ZIM’s amended and restated articles of association. ZIM reports to the State of Israel on an ongoing basis in accordance with the provisions of ZIM’s amended and restated articles of association. Certain asset transfer or sale transactions that in ZIM’s opinion require approval, have received the approval of the State (either explicitly or implicitly by not objecting to ZIM’s request). Kenon’s ownership of ZIM’s shares is subject to the terms and conditions of the Special State Share, which limit Kenon’s ability to transfer its equity interest in us to third parties. The holder of ZIM’s Special State Share has granted a permit (the “Permit”), to Kenon and Mr. Idan Ofer, individually and collectively referred to in this paragraph as a “Permitted Holder” of ZIM’s shares, pursuant to which the Permitted Holders may hold 24% or more of the means of control of ZIM (but no more than 35% of the means of control of ZIM), and only to the extent that this does not grant the Permitted Holders control in ZIM. The Permit further stipulates that it does not limit the Permitted Holder from distributing or transferring ZIM’s shares. However, the terms of the Permit provide that the transfer of the means of control of ZIM is limited in instances where the recipient is required to obtain the consent of the holder of ZIM’s Special State Share, or is required to notify the holder of ZIM’s Special State Share of its holding of ZIM’s ordinary shares pursuant to the terms of the Special State Share, unless such consent was obtained by the recipient or the State of Israel did not object to the notice provided by the recipient. In addition, the terms of the Permit provide that, if Mr. Idan Ofer’s holding interest in Kenon, directly or indirectly, falls below 36% or if Mr. Idan Ofer ceases to be the sole controlling shareholder of Kenon, then the shares held by Kenon will not grant Kenon any right in respect of its ordinary shares that would otherwise be granted to an ordinary shareholder holding more than 24% of ZIM’s ordinary shares (even if Kenon holds a greater percentage of ZIM’s ordinary shares), until or unless the State of Israel provides its consent, or does not object to, such decrease in holding interest or control in Kenon. “Control,” for the purposes of the Permit, shall bear the meaning ascribed to it in the Permit with respect to certain provisions. Additionally, the State of Israel may revoke Kenon’s permit if there is a material change in the facts upon which the State of Israel’s consent was based, or upon a breach of the provisions of the Special State Share by Kenon, Mr. Idan Ofer, or ZIM. According to the Permit, the obligations of the Permitted Holder under the Permit will apply only for as long as the Permitted Holder holds more than 24% of ZIM’s shares. Discontinued Operations — Inkia Business Sale of the Inkia Business Share Purchase Agreement
In November 2017, Kenon, through its subsidiaries Inkia and IC Power Distribution Holdings Pte. Ltd. (“ICPDH”), entered into a share purchase agreement with Nautilus Inkia Holdings LLC which is an entity controlled by I Squared Capital, pursuant to which Inkia and ICPDH agreed to sell all of their interests in power generation and distribution companies in Latin America and the Caribbean (the “Inkia Business”). The sale was completed in December 2017. The consideration for the sale was $1,332 million, consisting of (i) $935 million cash proceeds paid by the buyer, (ii) retained cash at Inkia of $222 million, and (iii) $175 million, which was deferred in the form of a Deferred Payment Obligation, which was repaid (prior to scheduled maturity) in October 2020. The consideration was subject to post-closing adjustments which were not significant. The buyer also assumed Inkia’s obligations under Inkia’s $600 million 5.875% Senior Unsecured Notes due 2027.
The consideration that Inkia received in the transaction was before estimated transaction costs, management compensation, advisor fees, other expenses and taxes, were in the aggregate approximately $263 million, of which $27 million comprised taxes to be paid upon payment of the $175 million Deferred Payment Obligation. The estimated tax payment includes taxes payable in connection with a restructuring of some of the companies remaining in the Kenon group, which is intended to simplify Kenon’s holding structure. As a result of this restructuring, Kenon now holds its interest in OPC directly. Kenon does not expect any further tax liability in relation to any future sales of its interest in OPC.
Indemnification
In the share purchase agreement for the sale, the sellers, Inkia and ICPDH, gave representations and warranties in respect of the Inkia Business and the transaction. Subject to specified deductibles, caps and time limitations, the sellers agreed to indemnify the buyer and its successors, permitted assigns, and affiliates, and its officers, employees, directors, managers, members, partners, stockholders, heirs and personal representatives from and against any and all losses arising out of:
prior to their expiration in July 2019 (or December 2020 in the case of representations relating to environmental matters), a breach of any of the sellers’ representations and warranties (other than fundamental representations) up to a maximum amount of $176.55 million;
prior to their expiration upon the expiration of the statute of limitations applicable to breach of contract claims in New York, a breach of any of the sellers’ covenants or agreements set forth in the share purchase agreement;
prior to their expiration thirty days after the expiration of the applicable statute of limitations, certain tax liabilities for pre-closing periods and certain transfer taxes, breach of certain tax representations and the incurrence of certain capital gain taxes by the transferred companies in connection with the transaction; and
without limitation with respect to time, a breach of any of the sellers’ fundamental representations (including representations relating to due authorization, ownership title, and capitalization).
The sellers’ obligation to indemnify Nautilus Inkia Holdings LLC shall not exceed the base purchase price. The sellers’ indemnification obligations for any claims under the share purchase agreement that were agreed between the buyer and the sellers, or that were subject to a final non-appealable judgment, were supported by the following:
Kenon’s pledge of OPC shares representing 29% of OPC’s outstanding shares as of March 31, 2021, which pledge was agreed to expire on December 31, 2021; and
to the extent any obligations remain outstanding after the exercise of the above-described pledge (or payments of amounts equal to the value of the pledge), a corporate guarantee from Kenon which guarantee is now expired.
The indemnification obligations were previously also supported by a deferred payment agreement owing from the buyers to the sellers, which was, however, repaid in October 2020 (prior to scheduled maturity).
Pledge Agreement with respect to OPC Shares
In connection with the sale of the Inkia Business, IC Power (which was the holder of Kenon’s shares in OPC at the time of the sale) entered into a pledge agreement with the buyer of the Inkia Business (Nautilus Inkia Holdings LLC) to pledge OPC shares (at the time representing 25% of OPC’s outstanding shares) in favor of the buyer to secure the sellers’ indemnification obligations under the share purchase agreement for the sale. Following the salehad been secured by a pledge of the Inkia Business, IC Power transferred all of its shares in OPC, to Kenon. As a result, Kenon and the buyer entered into an amended pledge agreement, pursuant toall of which Kenon became the pledgor and assumed IC Power’s obligations under the pledge agreement. The pledge agreement was further amended in October 2020 in connection with the early repayment of the deferred payment agreement to increase the amount of pledged shares and the term of the pledge, and the pledged shares represented 29% of the outstanding shares of OPC as of February 27, 2022. Following the amendment of the pledge agreement in October 2020, Kenon had pledged 55 million shares of OPC. In accordance with the pledge agreement, 53.5 million shares of OPC werehave now been released from the pledge and 1.5 million shares of OPC remain pledged in light ofthe parties have settled certain minor claims under the agreement for an indemnity claim relating to a tax assessment claim inimmaterial amount and the amount of $11 million.parties have released each other from further claims under the agreement.
Claims Relating to the Inkia Business Set forth below is a description of the investment treaty claims that are being or may be pursued by Kenon or its subsidiaries and the other claims related to of the Inkia Business to which Kenon or its subsidiaries have rights. The claims require funding for legal expenses and Kenon is considering its options with respect to meeting these funding needs, including potentially third-party funding for such claims in exchange for a portion of the awards or settlements (which it has done, as described below). Kenon may also sell its rights under or the rights to proceeds resulting from claims. Bilateral Investment Treaty (“BIT”) Claims Relating to Peru In June 2017 and November 2018, IC Power and Kenon respectively sent Notices of Dispute to the Republic of Peru under the Free Trade Agreement between Singapore and the Republic of Peru, or the FTA, relating to two disputes described below, based on events that occurred while Kenon, through IC Power, owned and operated their Peruvian subsidiaries Kallpa and Samay I, later sold as part of the Inkia sale. In AprilThe first concerned Secondary Frequency Regulation (or “SFR”) and the second concerned the use of the secondary and complementary transmission systems (“Transmission Tolls”). The claims are described in detail in prior disclosures. On June 12, 2019, IC Power and Kenon notified the Republic of Peru of their intent to submit the disputes to arbitration pursuant to the FTA. In June 2019, IC Power and Kenon submitted the disputes to arbitration beforefiled a Request for Arbitration with the International Centre for Settlement of Investment Disputes. In June 2020,Disputes (“ICSID”) against Peru alleged breaches of the FTA. On October 4, 2023, an arbitration tribunal constituted by ICSID delivered a final award (the “Award”). The arbitration tribunal concluded that Peru's resolution relating to secondary frequency regulation breached Peru's obligations under Article 10.5 of the Free Trade Agreement. The tribunal dismissed the claim relating to transmission tolls. Pursuant to the Award, Peru has been ordered to pay Kenon and IC Power a total of $110.7 million in damages together with $5.5 million in fees and Kenon submitted a Memorialcosts and pre-award and post-award interest. In accordance with the Award, pre-award interest is payable on the Merits, claiming compensationAward from November 24, 2017 to the date of the Award at Peru’s cost of debt, and post-award interest is payable from the date of the Award at the same rate. Pursuant to Article 49 of the ICSID Convention, the parties have submitted requests seeking rectification of and/or supplementation to the Award relating to the Tribunal’s award of interest and costs. These requests do not impact the Tribunal’s principal award of damages. Pursuant to the ICSID Convention, Peru has 120 days from the date of any decision rendered in excess of $200 million. In February 2021, Peru submitted a Counter-Memorialconnection with the parties’ Article 49 requests to file an application to annul the Award on the Meritslimited grounds established by the ICSID Convention. On November 14, 2023, Kenon and a Memorial on Jurisdiction. After a further exchange of written pleadings,IC Power filed an action in the final oral hearing was held virtually from 13 to 20 December 2021. There is no fixed deadlineU.S. District Court for the issuanceDistrict of Columbia seeking recognition of and the award. Set forth below is a summaryentry of judgment on the claims.Award in the United States. IC Power and Kenon have entered into an agreement with a capital provider to provide capital for expenses in relation to the pursuit of their arbitration claims against the Republic of Peru and other costs. The obligations of Kenon and IC Power are secured by pledges relating to the agreement. Security has been provided relating to the obligations of Kenon and IC Power. The agreement contains certain representations and covenants by IC Power and the Kenon and events of default in event of breach of such representations and covenants. In the event that Kenon or IC Power receivedreceives proceeds from a successful awardin connection with the Award or settlement of their claims,thereof, the capital provider will be entitled to be repaid the amount committed by the capital provider and to receive a portion of the claim proceeds. Secondary Frequency Regulation Claim
The Secondary Frequency Regulation, or SFR, is a complementary service requiredcapital provider will be entitled to adjust power generation in orderbe repaid the amount committed by the capital provider (which to maintain the frequencydate has equaled $12 million) and to receive up to approximately 55% of the system in certain situations. In March 2014, OSINERGMIN (the mining and energy regulator in Peru) approved Technical Procedure 22, or PR 22, establishing thatnet claim proceeds, subject to the SFR would be provided through a firm and variable base provision. The firm base provisionterms of the SFR would have priority in the daily electricity dispatch to keep turbines permanently on to respond to frequency changes in the system. OSINERGMIN provided that the SFR service would be tendered through a bid. Kallpa submitted a bid offering to provide the firm base provision of SFR. In April 2016, Kallpa was awarded the SFR firm base provision for three years, from August 2016 until July 2019 on an exclusive basis, independently of its declared generation costs, and in exchange for a reserve assignment price of zero, plus certain reimbursable costs.
In June 2016, OSINERGMIN issued a resolution that materially modified PR 22 (the “Resolution”). Under the Resolution, the firm base SFR provider can only render the SFR service when it is programmed in the daily electricity dispatch based on its declared generation costs. This retroactive amendment to PR 22 withdrew Kallpa’s exclusive right to provide the firm base SFR service that had been awarded to it in April 2016.agreement among Kenon, and IC Power suffered losses as a result.
Transmission Tolls Claim
Until July 2016,and the responsibility for the payment for the use of the secondary and complementary transmission systems was apportioned between generators based on the use of each transmission line. OSINERGMIN identified the generators that made use of particular transmission lines and proceeded to determine payment based on actual use (or the “relevance of use” requirement).
However, in July 2016, OSINERGMIN issued a resolution, referred to as the Transmission Toll Resolution, eliminating the “relevance of use” requirement, replacing it with a methodology that required each generation company to pay for a number of transmission lines, irrespective of the transmission lines the company actually uses. The change in methodology benefited the state-owned electricity companies, including Electroperu, to the detriment of Kenon and IC Power’s Peruvian subsidiaries, causing significant losses to Kenon and IC Power.capital provider.
Entitlement to Payments in Respect of Certain Proceedings and Claims
As discussed below, certain of our subsidiaries are pursuing claims or are entitled to receive certain payments from the buyer of the Inkia Business in connection with certain claims held by companies within the Inkia Business or as a result of the resolution of, and/or a change in regulations or cash payments received relating to the transmission tolls claim or the SFR claim. These payments are subject to conditions and may be subject to deduction for taxes incurred as a result of the relevant payment.
Transmission Toll Regulation
In the event of certain changes in or revocation of regulation in Peru or a final court order relating to the Transmission Toll Resolution (described above under “—Bilateral Investment Treaty Claims Relating to Peru—Transmission Tolls Claim”) which change, revocation or order has the effect of increasing operating profits of Kallpa or Samay I (which are part of the Inkia Business) then the buyer of the Inkia Business is required to pay or cause to be paid to Inkia in cash 75% of an amount equal to 70% of the increase in operating profits of Kallpa and Samay I attributable directly and solely to the changes in regulation through December 31, 2024.
In addition, in the event of any cash payments made to Kallpa or Samay I as a result certain changes in regulation in Peru relating to the Transmission Toll Resolution or as a result certain claims being pursued in Peru in connection with this resolution, the buyer is required to pay or cause to be paid in cash 75% of an amount equal to 70% of such cash proceeds.
Secondary Frequency Regulation Claim
In the event of certain changes to or revocation of PR 22 (as described under “—Bilateral Investment Treaty Claims Relating to Peru—Secondary Frequency Regulation Claim”) which result in a cash payment to Kallpa or Samay I, the buyer is required to pay or cause to be paid in cash 75% of an amount equal to 70% of such cash proceeds.
| C. | Organizational Structure |
The chart below represents a summary of our organizational structure, excluding intermediate holding companies, as of December 31, 2022.2023. This chart should be read in conjunction with the explanation of our ownership and organizational structure above.
| D. | Property, Plants and Equipment |
For information on our property, plants and equipment, see “Item 4.B Business Overview.” | ITEM 4A. | Unresolved Staff Comments |
Not Applicable. | ITEM 5. | Operating and Financial Review and Prospects |
This section should be read in conjunction with our audited consolidated financial statements, and the related notes thereto, for the years ended December 31, 2023, 2022 2021 and 2020,2021, included elsewhere in this annual report. Our financial statements have been prepared in accordance with IFRS. The financial information below also includes certain non-IFRS measures used by us to evaluate our economic and financial performance. These measures are not identified as accounting measures under IFRS and therefore should not be considered as an alternative measure to evaluate our performance. Certain information included in this discussion and analysis includes forward-looking statements that are subject to risks and uncertainties, and which may cause actual results to differ materially from those expressed or implied by such forward-looking statements. For further information on important factors that could cause our actual results to differ materially from the results described in the forward-looking statements contained in this discussion and analysis, see “Special Note Regarding Forward-Looking Statements” and “Item 3.D Risk Factors.” Business Overview For a discussion of our strategy, see “Item 4.B Business Overview.” Overview of Financial Information Presented As a holding company, Kenon’s results of operations primarily comprise the financial results of each of its businesses. The following table sets forth the method of accounting for our businesses for each of the two years ended December 31, 20222023 and our ownership percentage as of December 31, 2022:2023: | | | | | | Treatment in Consolidated
Financial Statements | OPC
| 54.7%(1) | | Consolidated | | Consolidated | ZIM
| 20.7%(2) | | Equity | | Share in profits of associated company,companies, net of tax | Other
| | | | | |
_______________________________________
(1) | In 2021 and 2022, OPC has issued new shares in public and private and Kenon has participated in some of these share offerings. See details below.
|
In January 2021, OPC issued 10,300,000 million ordinary shares for total gross proceeds of NIS 350 million (approximately $107 million), and as results a result, Kenon’s interest in OPC decreased from 62.1% to 58.2%.
In September 2021, OPC issued 13 million new shares in a rights offering to fund the development and expansion of OPC’s activity in the U.S. for total gross proceeds of approximately NIS 329 million (approximately $102 million). Kenon purchased approximately 8 million shares in the rights offering for total consideration of approximately NIS 206 million (approximately $64 million), which included its pro rata share and additional rights it purchased during the rights trading period plus the cost to purchase these additional rights.
In July 2022, OPC issued 9,443,800 new shares for total gross proceeds of NIS 331 million (approximately $94 million). Kenon purchased 3,898,000 shares in this offering for total consideration of NIS 136 million (approximately $39 million).
In September 2022, OPC issued 12,500,000 new shares for total gross proceeds of NIS 500 million (approximately $141 million).
As a result of the share issuance and Kenon’s participation as described above, Kenon holds approximately 54.7% of the outstanding shares of OPC.
(2) | In February 2021, ZIM completed an initial public offering of its shares on the New York Stock Exchange and, as a result of the offering, our interest in ZIM decreased from 32% to 27.8%. Between September and November 2021, Kenon sold approximately 1.2 million ZIM shares for total consideration of approximately $67 million. As a result of the sales, Kenon held a 26% interest in ZIM (25.6% on a fully diluted basis). In March 2022, Kenon sold 6 million ZIM shares for total consideration of $463 million. As a result of the sale, Kenon now holds a 20.7% interest in ZIM and remains the largest shareholder in ZIM.
|
The results of ZIM are included in Kenon’s statements of profit and loss as share in profits of associated company,companies, net of tax, for the years set forth below, except as otherwise indicated. The following tables set forth selected financial data for Kenon’s reportable segments for the periods presented: | | | | Year Ended December 31, 2023 | | | | | Year Ended December 31, 2022 | | | | | | | | | | | | | | | | | | | | | | | | | | | | | | | | | | | | | | | | | | | | | | | | | | | | (in millions of USD, unless otherwise indicated) | | | (in millions of USD, unless otherwise indicated) | | | Revenue | | | 517 | | | | 57 | | | | — | | | | — | | | | 574 | | | | 619 | | | | 73 | | | | — | | | | — | | | | 692 | | | Depreciation and amortization | | | (47 | ) | | | (16 | ) | | | — | | | | — | | | | (63 | ) | | | (66 | ) | | | (25 | ) | | | — | | | | — | | | | (91 | ) | | Financing income | | | 10 | | | | 25 | | | | — | | | | 10 | | | | 45 | | | | 6 | | | | 6 | | | | — | | | | 27 | | | | 39 | | | Financing expenses | | | (42 | ) | | | (7 | ) | | | — | | | | (1 | ) | | | (50 | ) | | | (48 | ) | | | (17 | ) | | | — | | | | (1 | ) | | | (66 | ) | | Share in profit of associated companies | | | — | | | | 85 | | | | 1,033 | | | | — | | | | 1,118 | | | | Share in profit / (loss) of associated companies | | | | — | | | | 66 | | | | (266 | ) | | | — | | | | (200 | ) | | Losses related to ZIM | | | — | | | | — | | | | (728 | ) | | | — | | | | (728 | ) | | | — | | | | — | | | | (1 | ) | | | — | | | | (1 | ) | | Profit / (Loss) before taxes | | | 24 | | | | 61 | | | | 305 | | | | (2 | ) | | | 388 | | | | 49 | | | | 17 | | | | (267 | ) | | | 15 | | | | (186 | ) | | Income tax (expense)/benefit | | | | | | | | | | | | | | | | | | | | | | | | | | | | | | | | | | | | | | | | | | Profit / (Loss) from continuing operations | | | | | | | | | | | | | | | | | | | | | | | | | | | | | | | | | | | | | | | | | Segment assets(2) | | | 1,504 | | | | 553 | | | | — | | | | 636 | | | | 2,693 | | | | 1,673 | | | | 1,103 | | | | — | | | | 629 | | | | 3,405 | | | Investments in associated companies | | | — | | | | 652 | | | | 427 | | | | — | | | | 1,079 | | | | — | | | | 703 | | | | — | | | | — | | | | 703 | | | Segment liabilities | | | | | | | | | | | | | | | | | | | | | | | | | | | | | | | | | | | | | | | | |
_________________________________
(1)
| Includes the results of Kenon’s, Qoros’ and IC Power’s holding company (including assets and liabilities) and general and administrative expenses. |
(2)
| Excludes investments in associates. |
| | | | Year Ended December 31, 2022 | | | | | Year Ended December 31, 2021 | | | | | | | | | | | | | | | | | | | | | | | | | | | | | | | | | | | | | | | | | | | | | | | | | | | | (in millions of USD, unless otherwise indicated) | | | (in millions of USD, unless otherwise indicated) | | | Revenue | | | 437 | | | | 51 | | | | — | | | | — | | | | 488 | | | | 517 | | | | 57 | | | | — | | | | — | | | | 574 | | | Depreciation and amortization | | | (44 | ) | | | (13 | ) | | | — | | | | (1 | ) | | | (58 | ) | | | (47 | ) | | | (16 | ) | | | — | | | | — | | | | (63 | ) | | Financing income | | | 3 | | | | — | | | | — | | | | — | | | | 3 | | | | 10 | | | | 25 | | | | — | | | | 10 | | | | 45 | | | Financing expenses | | | (119 | ) | | | (25 | ) | | | — | | | | — | | | | (144 | ) | | | (42 | ) | | | (7 | ) | | | — | | | | (1 | ) | | | (50 | ) | | Losses related to Qoros | | | — | | | | — | | | | — | | | | (251 | ) | | | (251 | ) | | | Share in (losses)/profit of associated companies | | | — | | | | (11 | ) | | | 1,261 | | | | — | | | | 1,250 | | | | (Loss) / Profit before taxes | | | (57 | ) | | | (61 | ) | | | 1,261 | | | | (263 | ) | | | 880 | | | | Income tax benefit/(expense) | | | | | | | | | | | | | | | | | | | | | | | (Loss) / Profit from continuing operations | | | | | | | | | | | | | | | | | | | | | | | Gains related to ZIM | | | | — | | | | — | | | | (728 | ) | | | — | | | | (728 | ) | | Share in profit of associated companies | | | | — | | | | 85 | | | | 1,033 | | | | — | | | | 1,118 | | | Losses related to ZIM | | | | — | | | | — | | | | (728 | ) | | | — | | | | (728 | ) | | Profit / (Loss) before taxes | | | | 24 | | | | 61 | | | | 305 | | | | (2 | ) | | | 388 | | | Income tax (expense)/benefit | | | | | | | | | | | | | | | | | | | | | | | Profit / (Loss) from continuing operations | | | | | | | | | | | | | | | | | | | | | | Segment assets(2) | | | 1,512 | | | | 431 | | | | — | | | | 227 | | | | 2,170 | | | | 1,504 | | | | 553 | | | | — | | | | 636 | | | | 2,693 | | | Investments in associated companies | | | — | | | | 545 | | | | 1,354 | | | | — | | | | 1,899 | | | | — | | | | 652 | | | | 427 | | | | — | | | | 1,079 | | | Segment liabilities | | | | | | | | | | | | | | | | | | | | | | | | | | | | | | | | | | | | | | | | |
________________________________________________________________________
| (1) | Includes the results of Kenon’s, Qoros’ and IC Power’s holding company (including assets and liabilities) and general and administrative expenses. |
| (2) | Excludes investments in associates. |
OPC The following table sets forth summary financial information for OPC (including CPV) for the years ended December 31, 20222023 and 2021:2022: | | | | | | | | | | | | | | | Revenue | | | 574 | | | | 488 | | | | 692 | | | | 574 | | | Cost of Sales (excluding depreciation and amortization) | | | (417 | ) | | | (337 | ) | | | (494 | ) | | | (417 | ) | | Net Profit/(Loss) | | | 65 | | | | (94 | ) | | | Net Profit | | | | 47 | | | | 65 | | Adjusted EBITDA(1) | | | 77 | | | | 91 | | | | 304 | | | | 250 | | Proportionate share of EBITDA of associated companies(1) | | | 168 | | | | 106 | | | Total Debt(2) | | | 1,163 | | | | 1,215 | | | | 1,530 | | | | 1,163 | |
______________________________
| (1) | OPC defines “EBITDA” for each period as earnings (losses)net profit/(loss) before depreciation and amortization, financing expenses, ornet, share of depreciation and amortization and financing expenses, net, included within share of profit of associated companies, net and income and taxes on income,tax expense (benefit), and “Adjusted EBITDA” for each period as earnings (losses)EBITDA after adjustments in respect of changes in fair value of derivative financial instruments and items not in the ordinary course of OPC’s business and changes in net expenses, not in the ordinary course of business and/or havingof a non-recurring nature.
EBITDA and Adjusted EBITDA are not recognized under IFRS or any other generally accepted accounting principles as a measure of financial performance and should not be considered as a substitute for net income or loss, cash flow from operations or other measures of operating performance or liquidity determined in accordance with IFRS. EBITDA and Adjusted EBITDA are not intended to represent funds available for dividends or other discretionary uses because those funds may be required for debt service, capital expenditures, working capital and other commitments and contingencies. EBITDA and Adjusted EBITDA present limitations that impair its use as a measure of OPC’s profitability since it does not take into consideration certain costs and expenses that result from its business that could have a significant effect on OPC’s net loss, such as finance expenses, taxes and depreciation and amortization. |
| (2) | Includes short-term and long-term debt. |
The following table sets forth a reconciliation of OPC’s net profit/loss(loss) to its EBITDA, Adjusted EBITDA and proportionate share of net profit to share of EBITDA of its associated companies for the periods presented. Other companies may calculate EBITDA and Adjusted EBITDA differently, and therefore this presentation of EBITDA and Adjusted EBITDA may not be comparable to other similarly titled measures used by other companies: | | | | | | | | | | | | | | | Net profit/(loss) for the period | | | 65 | | | | (94 | ) | | | 47 | | | | 65 | | | Depreciation and amortization | | | 63 | | | | 57 | | | | 91 | | | | 63 | | | Financing expenses, net | | | 14 | | | | 141 | | | | 53 | | | | 14 | | | Share of depreciation and amortization and financing expenses, net, included within share of profit of associated companies, net | | | | 91 | | | | 83 | | | Income tax expense/(benefit) | | | | | | | | | | | | | | | | | | EBITDA | | | | | | | | | | | | | | | | | | Share in (profits)/losses of associated companies, net | | | | | | | | | | | Changes in net expenses, not in the ordinary course of business and/or of a non-recurring nature | | | | | | | | | | | Share of changes in fair value of derivative financial instruments | | | | | | | | | | | Adjusted EBITDA | | | | | | | | | | | | | | | | |
| Share in profits/(losses) of associated companies, net | | | 85 | | | | (11 | ) | | Share of depreciation and amortization | | | 44 | | | | 39 | | | Share of financing expenses, net | | | 39 | | | | 78 | | | Proportionate share of EBITDA of associated companies | | | 168 | | | | 106 | |
Qoros In April 2020, we have reduced our interest in Qoros to 12%. Since that date, we no longer account for Qoros pursuant to the equity method of accounting. In 2021, we wrote down the value of Qoros to zero. We have agreedentered into an agreement to sell our remaining interest in Qoros to the Majority Qoros Shareholder butand Baoneng Group has provided a guarantee of the Majority Qoros Shareholder’s obligations under the Sale Agreement. The Majority Qoros Shareholder had not made any of the required payments under the Sale Agreement, and Quantum initiated arbitral proceedings. The arbitration tribunal ruled that shareholder has not compliedthe Majority Qoros Shareholder and Baoneng Group are obligated to pay Quantum approximately RMB 1.9 billion (approximately $268 million), comprising the purchase price set forth in the Sale Agreement (as adjusted for inflation) of approximately RMB 1.7 billion (approximately $239 million), together with its purchase obligationspre-award and we have initiatedpost-award interest (which will accrue until payment of the award), legal proceedingsfees and expenses. See “Item 4.B. Business Overview—Qoros” and “Item 3.D Risks Factors—Risks Related to Our Strategy and Operations—We face risks in relation to our remaining 12% interest in Qoros, including risks relating to collection of the arbitration award in connection with respect to this matter.
ZIM ZIM’s results of operations for the years ended December 31, 20222023 and 20212022 are reflected in Kenon’s share in profits of associated companies, net of tax. Material Factors Affecting Results of Operations OPC Set forth below is a discussion of the material factors affecting the results of operations of OPC for the periods under review. OPC acquired CPV in January 2021. The discussion below refers to OPC without giving effect to CPV business except where expressly indicated. Revenue – Revenue—EA Tariffs
In Israel, sales by IPPs are generally made on the basis of PPAs for the sale of energy to customers, with prices predominantly linked to the tariff issued by the EA and denominated in NIS. Changes in the electricity generation tariff have material effect on OPC’s results of operations. The EA operates a “Time of Use” tariff, which provides different energy rates for different seasons (e.g., summer and winter) and different periods of time during the day. Within Israel, the price of energy varies by season and demand period. For further information on Israel’s seasonality and the related EA tariffs, see “Item 4.B Business Overview—Our Businesses—OPC—Industry Overview—Overview of Israeli Electricity Generation Industry.” The EA’s rates have affected OPC’s revenues and income in the periods under review. In February 2022, the EA generation component tariff increased by approximately 13.6% from NIS 0.253 per kWh to NIS 0.287 per kWh. In May 2022, due to a reduction in excise tax on use of coal, an additional update to the electricity tariff became effective for the remaining 2022. The generation component after the reduction was NIS 0.276 per MWh being a reduction of 3.7% from the tariff determined in February 2022. On August 1, 2022, the electricity tariff was further updated to NIS 0.314 per kWh for the remainder of 2022, being an increase of 13.6% over the tariff that came into effect in May 2022 and of 9.4% of the tariff determined in February 2022. This tariff update was made against the background of the sharp increase in the coal prices index due to the worldwide energy crisis along with the increase in the dollar/shekel exchange rate and the CPI.
2023 EA Tariffs
On January 1, 2023, an annual update of the tariff for 2023 came into effect for the IEC’s electricity consumers with generation component decreasing to NIS 0.312 per kWh, an 0.6% decrease compared to the generation component that applied in the last few months of 2022. On February 1, 2023, a decision of the EA entered into effect to update the costs recognized to the Electricity Company and the Systems Operators and the tariffs to the electricity consumers. Pursuant to the decision, an additional update to the generation component for 2023 entered into effect whereby the generation component is NIS 0.3081 per kWh, a decrease of 1.2% compared to the tariff set on January 1, 2023 due to extension of the excise tax on fuel order, which calls for a decrease in the purchase tax and excise tax applicable to the coal. In MarchOn April 1, 2023, a hearing was published for the revision of the costs recognizedan additional decision entered into effect that provided an update to the IEC andgeneration component to NIS 0.3039 per kilowatt hour—a decrease of about 1% compared with the tariffs paid by electricity consumers,tariff set in February 2023, following a 30% decline in coal prices compared to the price on which the latest tariff revision was based, and increase in other costs. Thecosts relating to the IEC. Therefore, the average generation component for 2022 was set at NIS 0.2927 per kilowatt hour. On February 1, 2024, the annual update to the tariff will be reduced by approximately 1%for 2024 for electricity consumers entered into effect. Pursuant to the decision, the generation component was updated to NIS 0.3007 per kilowatt hour, a decrease of 1.1% compared with the generation component at the end of 2023—this being mainly due to the surplus receipts expected from sale of the Eshkol power plant, which led to a reduction in the generation sector. In addition, as respect of the decision on tariff update and pursuant to the decision on designation of the receipts from sale of Eshkol—the surplus receipts from the sale will first be used to cover expenses incurred during the War, including costs of diesel oil, with the remaining surplus receipts to be used to cover the non recurring past expenses. The results of OPC’s activities in Israel are materially impacted by changes in the electricity generation component tariff, setsuch that an increase in February 2023.
150
2023 Gas price
In JanuaryCommencing from 2023, the gas price was equal to the Minimum Price, and later in 2023, if no changes take place in the generation component, OPC-Rotem’s gas price is expected to be higher than the Minimum Price; as a result, OPC’s exposure to changes in the NIS to USD exchange rate may decrease compared to the exposure in the event that the gas price is equal to or lower than the Minimum Price.
At the end of August 2022, the EA revised decision in respect of the time of use (“TOU”)(TOU) demand categories for purposes of adjusting the TAOZ structure for integration of solar energy and storage. An update of the TOU demand categories is expected to encourage steering consumption to the noon hours wherein there is higher generation of renewable energy as opposed to consumption in the peak evening demand hours – this being by means of, among other things, raising the tariff in the demand hours and applying the following main updates: (i) moving the peak hours from the noon hours to the evening hours; (ii) expanding the number of months wherein the peak hours apply in the summer season to 4 months in place of 2 months; (iii) increase of the gap between the peak hours and the low demand hours; and (iv) definition of a maximum of two TOU categories for every day of the year. Change(brackets).
The change of the TOU categories and the updated tariff structure entered into effect upon update of the tariff to the consumer in 2023. These changes increasedwill increase the tariffs paid by household consumers and reducedreduce the tariffs paid by TAOZ consumers. In addition, in August 2022, The update to the EA publishedhourly demand brackets, which became effective from January 2023, had a decision for hearing that is primarily aimed at making of adjustments tonegative impact on our results from Israel activities and caused a number of arrangements relating to generation facilities that are impacted by changeschange in the tariff structure (including an arrangement for cogeneration facilities). In 2022,seasonality of our revenues, which resulted in a significant increase in our results during the EA decided, among other things, not to makesummer period at the adjustments included as partexpense of the hearing to the cogeneration facilities. OPC is taking actions to adjust the mix of its sales in Israel to the structureother months of the updated demand-hours categories.year (particularly the first quarter).
For more discussion, see “Item 4.B Business Overview—Our Businesses—OPC—Industry Overview—Overview of Israeli Electricity Generation Industry.” Market model for generation and storage facilities connected to or integrated into the distribution network148
In September 2022, the EA published a decision that governs the activities of the generation and storage facilities in the distribution network and provides the possibility for them to sell electricity directly to the suppliers, commencing from January 2024. As part of the decision, the EA revised formula for acquisition of electricity through a virtual supplier. This decision opens the supply sector to further competition by removing the quotas previously set for this matter. OPC believes, that on a short run, the decision reduces the viability of the virtual supplier activities and in the long run the decision encourages increased competition in the supply area while integrating solar generation facilities and storage facilities.
Cost of Sales OPC’s principal costs of sales are natural gas, transmission, distribution and system services costs, personnel, third-party services and maintenance costs. Natural Gas The prices at which OPC-Rotem and OPC-Hadera purchase their natural gas from their sole natural gas supplier, the Tamar Group, is predominantly indexed to changes in the EA’s generation component tariff, pursuant to the price formula set forth in OPC-Rotem’s and OPC-Hadera’s supply agreements with the Tamar Group. As a result, increases or decreases in this tariff have a related effect on OPC-Rotem’s and OPC-Hadera’s cost of sales and margins. Additionally, the natural gas price formula in OPC-Rotem’s and OPC-Hadera’s supply agreement is subject to a floor price mechanism. In addition, for OPC-Hadera, the effect on profit margins depends on the USD/NIS exchange rate fluctuations. In 2023, the gas price in the OPC Tamar agreement was equal to the Minimum Price over 8 months in total. For OPC-Rotem, the effect of changes in tariff on profit margins depends on the USD/NIS exchange rate fluctuations. In 2023, OPC-Hadera’s and OPC-Rotem’s gas prices were atprice was higher than the minimum price. In addition, in 2024, if there will be no changes to the generation component, OPC-Hadera’s gas price until January 2022 (OPC-Rotem) and February 2022 (OPC-Hadera), and were aboveis expected to be higher than the minimum price forprice. Therefore, the remainder of 2022. Therefore, such increase in the EA generation component (see discussion above) had a positive impact on OPC’s profits in 2022.2023. For information on the risks associated with the impact of the EA’s generation tariff on OPC’s supply agreements with the Tamar Group, see “Item 3.D Risk Factors—Risks Related to OPC’s Israel Operations—OPC’s profitability depends on the EA’s electricity rates.rates and tariff structure.” AccordingIn respect of OPC-Rotem, according to the annual update of the productiongeneration component for 2023,2024, the price of gas (of both OPC-Rotem and OPC-Hadera) is expected to be above the minimum price byMinimum Price in 2024 (if there will be no changes to the end of 2023 asgeneration component). In addition, in 2024 if there will be no changes to the generation component, OPC-Hadera’s gas price is unlikelyexpected to change in 2023.be higher than the Minimum Price. Transmission, Distribution and System Services Costs
OPC’s costs for transmission, distribution and systems services vary primarily according to the quantity of energy that OPC sells. These costs are passed on to its customers. OPC incurs personnel and third-party services costs in the operation of its plants. These costs are usually independent of the volumes of energy produced by OPC’s plants. OPC incurs maintenance costs in connection with the ongoing and periodic maintenance of its generation plants. These costs are usually correlated to the volumes of energy produced and the number of running hours of OPC’s plants.
Maintenance Costs OPC-Rotem: Under the existing maintenance agreement with Mitsubishi for the OPC-Rotem power plant, maintenance work for the OPC-Rotem power plant is scheduled every 12,000 work hours (about 18 months). The next maintenance is scheduled to be performed in Springspring 2024, during which the power plant and related energy generation activity will be shut down for an estimated period of 15 days. During the maintenance period scheduled for Springspring 2024, the supply of electricity to the customers of the OPC-Rotem power plant will continue as usual, based on the covenants published by the EA and OPC-Rotem’s PPA with the IEC. This timetables could change as a result of various factors, among others, the scope of operation of the power plant or revision of the scheduled works with the maintenance contractor or the COVID-19 related delays. The power plant’s activities during maintenance will be suspended, which may adversely affect OPC’s operating results. The existing maintenance agreement with Mitsubishi expires in October 2025. In accordance with the New Rotem Maintenance Agreement, which OPC-Rotem and Mitsubishi entered into in December 2023, the timetable for the execution of scheduled maintenance works in the power plant was updated to approximately every 25,000 working hours, or estimated approximately every three years. OPC-Hadera: Under the maintenance agreement with General Electric International Ltd., or GEI, and GE Global Parts & Products GmbH or GEGPP these two companies provide maintenance treatments for the two gas turbines of GEI, generators and auxiliary facilities of the OPC-Hadera plant for a period commencing on the date of commercial operation until the earlier of: (i) the date on which all of the covered units (as defined in the service agreement) have reached the end-date of their performance and (ii) 25 years from the date of signing the service agreement. The service agreement contains a guarantee of reliability and other obligations concerning the performance of the OPC-Hadera plant and indemnification to OPC-Hadera in the event of failure to meet the performance obligations. OPC-Hadera has undertaken to pay bonuses in the event of improvement in the performance of the plant as a result of the maintenance work, up to a cumulative ceiling for every inspection period. Energy margins
149 The increase in energy margin in the period year of the report compared to the corresponding period last year stems mainly from an increase in the generation component tariff that gave rise to an increase in the electricity prices and the natural gas prices. The natural gas prices were also impacted by an increase in the U.S. Dollar to NIS exchange rate (which led to an increase of about NIS 11 million in the cost of the natural gas).
Changes in Exchange Rates Fluctuations in the exchange rates between currencies in which certain of OPC’s agreements are denominated (such as the U.S. Dollar) and the NIS, which is OPC’s functional and reporting currency, will generate either gains or losses on monetary assets and liabilities denominated in such currencies and can therefore affect OPC’s profitability. For example, the price of the natural gas paid by OPC-Hadera is denominated in dollars and, therefore, it has full exposure to changes in the currency exchange rate. In addition, the price set forth in the Energean Agreements is fully linked to the U.S. Dollar. In addition, OPC’s activities in Israel are exposed to a change in the exchange rate of the dollar, directly and indirectly, due to the linkage of a significant part of its revenues to the generation tariff (which is impacted, in part, by changes in the exchange rate of the dollar), while on the other hand acquisitions of the natural gas, some of which are linked to the dollar exchange rate and/or are denominated based on the dollar exchange rate, are also linked to the generation tariff (which is impacted in part by changes in the dollar exchange rate) and include dollar floor prices. Therefore, the structure of OPC’s activities in Israel includes a partial natural (intrinsic) hedge—even though strengthening of the dollar increases the cost of the natural gas purchased by OPC, the structure of the revenues reduces the said exposure significantly. Generally the generation component is updated once a year, and accordingly timing differences are possible between the impact of a strengthening of the rate of the dollar on the current gas cost and its impact on the revenues and, in turn, on OPC’s gross margin. These timing differences could have a negative effect on OPC’s current profit and cash flows in the short run. In the medium term, strengthening of the dollar will lead to a certain increase in the generation tariff and, in turn, to an increase in OPC’s revenues corresponding to the increase in the gas costs, such that a strengthening of the dollar could adversely impact OPC’s profits. In addition, from time to time OPC signs significant construction and maintenance contracts that are denominated in different currencies, particularly the dollar and the euro. Furthermore, OPC is indirectly influenced by changes in the U.S. Dollar to NIS exchange rate, including as a result of the following factors (i) OPC’s investment in CPV which operates in the US, (ii) the expected investment in CPV’s existing project backlog and (iii) the IEC electricity tariff is partially linked to increases in fuel prices (mainly coal and gas) that are denominated in U.S. Dollars. In general, CPVOPC believes that a decline in the exchange rate of the U.S. Dollar exchange rate may have a positive effect on OPC’s operating activities, and on the other hand an adverse effect on the investment in OPC’s activities. From time to time and based on the business considerations, OPC makes use of currency forwards. Nonetheless, the above does not provide full protection from such exposures, and OPC could incur costs due to said hedging transactions. In addition, Kenon’s functional currency is the U.S. Dollar, so Kenon reports OPC’s NIS-denominated results of operations and balance sheet items in U.S. Dollars, translating OPC’s results into U.S. Dollars at the average exchange rate (for results of operation) or rate in effect on the balance sheet date (for balance sheet items). Accordingly, changes in the USD/NIS exchange rate impact Kenon’s reported results for OPC. In 2022,2023, the U.S. Dollar was stronger versus the NIS as compared to 2021.2022. Macroeconomic Environment In 2022, macroeconomicMacroeconomic trends, both globally and in Israel, led to a sharpan increase in prices, due to, among other things, geopolitical events, including the War in Israel, the war in Ukraine, which triggered a sharp increase in energy and electricity prices, continued disruption to the supply chain and the long-term effects of the COVID-19 pandemic. These and other factors led to a significant increase in inflation rates in the U.S. and Israel, and to an increase in interest rates particularly in 2022.
In 2023, in Israel and in the U.S. there was a moderation of the rates of inflation and stability of the interest rates. In the United States, the US Federal Reserve Bank kept the interest rate unchanged based on the US regulator’s estimates of three rate reductions of 0.25% during 2024, down to a rate of about 4.6%. In Israel, the Bank of Israel decided to reduce the interest rate to 4.5% in January 2024 and kept the rate unchanged from February 2024 and thereafter based on the Bank of Israel’s forecasts of the interest rate continuing to gradually decline in 2024 and at the end of the year be in the range of 3.75% to 4%. These inflation and interest trends have had a significant effect on the policies of the central banks and, in turn, on the general global macroeconomic environment, including in Israel and globally and on economic growth as a whole,in the U.S., as well as on the business environment in which OPC operates, which is affected,operates. The impacts on the business environment could be reflected in, among other things, bythe scope of the financing expenses (which increase as the interest rate increases), growth data and extent of the business activities in the economy (in Israel and the U.S.), the financial markets and the possibility of raising debt and equity, the prices of energy, electricity and natural gas, tariffs in the Israeli electricity sector, cost of construction of projects, finance costs, among others. During 2022,In addition, geopolitical tensions in Israel and worldwide may impact the Israeli Consumer Price Index increased by approximately 5.3%, and themacro-economic environment (including policy considerations of Bank of Israel raised its interest ratewith respect to war circumstances). In Israel, 2023 was characterized by significant instability with respect to domestic policies and the geopolitical security situation. In the beginning of 2023, the Israeli Government began advancement of a numberplan for making changes in Israel’s judicial system—a step that impacted the stability of timesthe State’s population and economy. In the fourth quarter of 2023, on October 7, 2023, the War in 2022, with the interest rate reaching a level of 3.25%. Subsequent toIsrael broke out, which as at the date of this report is still underway. The War led to impacts and restrictions on the report,Israeli economy that included, among other things, reduction of economic activities, a large call for military reserves duty (soldiers), limitations on gatherings in work places and public areas, restrictions on carrying on classes in the CPIeducational system, etc. Most of the restrictions have been gradually relaxed according to the security (defense) situation in Israel roseand in the combat areas. For risk factors in connection with the War relating to 4.25%OPC business operations, see “Item 3.D Risk Factors—Risks Related to Legal, Regulatory and Compliance Matters—We could be adversely affected by the War in Israel.” In addition, the United States, duringWar has had external (consequential) impacts including, among others, interruptions in the 2022,marine routes to Israel due to attacks on supply ships and a significant cutback of the US Consumer Price Index increased by approximately 6.5%,activities of the airline companies. These impacts could have an adverse impact on the arrival of equipment and foreign teams to Israel (including equipment and teams required for purposes of maintenance and construction of OPC’s activity sites in Israel) and the U.S. Federal Bank raisedtime schedules for their arrival. Supplementary arrangements and granting of a supply license to OPC-Rotem In February 2023, the dollar interest rateElectricity Authority published a numberproposed decision that includes granting of timesa supplier license to Rotem with language (terms) similar to the existing suppliers along with imposition of covenants on Rotem, including covenants relating to a deviation from the consumption plans plus arrangements and covenants relating to this. A final decision had not yet been published and the arrangements included as part of the EA’s proposed decision had not yet entered into effect. OPC believes that arrangements proposed in 2022,the decision are expected to settle certain disputes between OPC-Rotem and the System Operator. In March 2024, the EA issued a resolution that addresses the application of certain standards to OPC-Rotem, including those regarding deviations from consumptions plans submitted by private electricity suppliers, and the award of a supply license to OPC-Rotem (if it applies for one and complies with the interest rate reaching a level of 4.50%-4.75%conditions for receipt thereof). For further details, see “Item 3D Risk Factors—Risks Related to OPC’s Israel Operations—OPC’s operations are significantly influenced by regulations.” Availability and cost of financing Generally, OPC’s activity in Israel is financed through project financing, credit facilities from banks and financial institutions and through its own capital. In particular, the operations of OPC-Hadera, Kiryat Gat and Tzomet are currently financed mainly through project financing received from banks and financial institutions on the basis of generally accepted arrangements in project financing, with adjustments for the relevant projects. For example, the Kiryat Gat financing agreement was signed, among other things, in connection with the acquisition of the Kiryat Gat Power Plant. Changes in the cost of financing and its availability and the amount of credit available in the bank and non-bank systems affect OPC’s operations as well as the energy sector and its profitability. An economic downturn in Israel and around the world, or a decline in the scope in the economic activity might impact the availability and costs of credit in the market, and accordingly have an adverse effect on OPC’s liquidity. Due to the structural reforms implemented in the Israeli capital market in recent years, the share of bank credit out of the total credit for the business sector has decreased and a non-bank credit market developed as an alternative for project financing and investments. The Israeli capital market ismarkets are also a source for raising funds to finance and expand OPC’s business activity, by issuing debentures and raising capital, and accordingly –OPC is affected by changes and accessibility to the capital market, by macroeconomic and other factors that affect the liquidity of the capital market as a whole, and by the energy sector in particular. Changes in the CPI and changes in the interest raterates A portion of the liabilities of OPC and of its subsidiaries is linked to the CPI, including OPC’s Debentures (Series B), and some of the loans of OPC-Hadera are linked to the CPI, such that changes in the CPI impact OPC’s finance expenses and its outstanding debt. Changes in the CPI may affect OPC throughin other parametersaspects as well. During 2023, the Israeli Consumer Price Index increased by approximately 3.3% and the US Consumer Price Index increased by approximately 3.1%. As of December 31, 2022,2023, OPC has a transaction in derivatives, intended to hedge some of the risks related to changes in the Consumer Price Index in connection with the Hadera loans, that are partly linked to the Consumer Price Index, and that OPC chose to designate as accounting hedging. In addition, OPC is generally exposed to changes in the CPI, directly and indirectly, mainly due to linkage of a significant part of its revenues to the generation component (which is impacted partly by a change in the CPI), and due to the fact the most of its availability revenues are linked to the CPI. On the other hand, purchases of the natural gas are partly linked to the generation tariff and include, as stated, floor prices. Therefore, the structure of OPC’s activities in Israel includes a partial natural (intrinsic) hedge—despite the fact that an increase in the CPI increases OPC’s costs (including financing costs) and investments, the structure of the revenues reduces the exposure, such that OPC’s profits could be positively affected by an increase in the CPI. OPC has loans and liabilities bearing variable interest that are based on prime or SOFR plus a margin. An increase in the variable interest rates could cause an increase in OPC’s financing costs. In addition, an increase in the interest rates could trigger an increase in the financing costs in respect of new debt taken out by OPC (for purposes of refinancing and/or growth). Furthermore, an increase in the interest rates could impact the discount rates for projects (operating, under construction and in development) and could also lead to a lack of economic feasibility of continued development and/or acquisition of projects and a slowdown in OPC’s growth processes, along with an existence of signs of impairment of value of assets and/or recording of impairment losses in the financial statements. For example, Tzomet’s loans bear variable interest such that a change in the interest rate will impact Tzomet’s finance expenses and its outstanding debt after the commercial operation date. During the financial year and throughUntil Tzomet’s commercial operation date, the finance expenses have been capitalizedcapitalized. In order to reduce the assetexposure to changes in the interest rates in Israel, OPC makes use of mix of loans (including credit facilities) and profitdebentures in such a manner that part of the loans and loss data as per OPC’s financial statements have not been affected.the debentures bear fixed interest and part of them bear variable interest. Loans in connection with the active projects and a project under construction in the U.S. bear interest based on LIBORvariable interest plus a margin, such that a change in this interest rate will impact their finance expenses(mainly SOFR) and debt balances. The SOFR interest is expectedhave exposure to replace the LIBOR interest in 2023, and accordingly changes in this interest rate may affect the finance costs and debt balances.rates. CPV Group enters into hedge transactions in respect of the interest rates; however, those transactions do not fully mitigate the exposure. Global trends in commodity and raw material prices and the supply chain Natural gas is the main fuel in OPC’s activecommercially operational power plants in Israel and in the United States. Therefore, OPC is affected by changes in the natural gas market (including prices, availability, competition, demand, regulation) in each of the markets in which it operates. Furthermore, in recent years the introduction of renewable energies has been on the rise, in view of, among other things, the setting of targets by regulators, and the setting of incentives and ESG trends that affect the demand for renewable energies. Moreover, in recent years, there has been an increasing awareness among investors – investors—mainly around the world but also in Israel – Israel—as well as among other stakeholders such as customers, employees, credit providers, etc., regarding the climate and environmental impacts of various activities. As part of this trend, existing and potential investors, and other stakeholders, take into account ESG considerations relating to environmental, social and corporate governance aspects, as part of their investment and business policies, including in relation to the provision of credit. This trend may manifest itself in various ways, including subjecting investments and/or provision of credit to compliance with ESG standards, investors’ implementing a policy of refraining from advancing debt or making investments in OPC, especially in the capital market, due to its natural gas activity; increase in finance costs; difficulty in recruiting employees, and more. In addition, the imposition of various regulatory provisions in this area, particularly regarding the environment, may cause the company to incur significant costs. These trends might have an adverse effect on OPC’s business and financial position, including loss of customers, impairment of some of its assets, increase in the price of its debt, and difficulty to raise capital. In addition, OPC believes that the broad global trends that started as a result of the COVID-19 on the markets and factors relating to OPC’s business activities, such as an adverse impact on the supply chains, including global delays of the equipment supply dates along with an increase in the prices of raw materials and equipment and transport costs, an impact was visible on the construction, equipment and maintenance costs, as well as on the timetables for completion may potentially have long-term impact (including in connection with the costs and timing of completion of the construction projects). In 2023, the raw material prices were lower than in 2022 and the disruptions in the supply chain were not as severe comparing to previous period. Nonetheless, certain aspects of OPC’s activities are still being impacted by the disruptions in the supply chain, where regional conflicts affecting marine transport could trigger additional complications. These events could have a negative impact on OPC’s activities, particularly with respect to the construction costs of projects and maintenance activities, as well as on the timetables for their completion. There is no certainty with respect to the continuation of the trends and the scope of the impact thereof on OPC’s activities, if any at all. Regulation Electricity and energy activities are regulated and supervised by the relevant regulators in each country. DifferentVarious legislative and regulatory processes in the countries OPC operates have a significant impact on OPC’s operations and results. For example, in Israel, OPC’s results are derived significantly from the generation component determined by the EA, and OPC’s activity in this field is affected by the provisions of the law relevant to this field, including the resolutions of the EA. The operations of the CPV Group in the electricity generation area in the U.S. (including using renewable energy and natural gas) are subject to the provisions of the US law, to compliance with the terms and conditions of the licenses granted to CPV’s projects and power plants, to obtaining approvals, and to local, state and federal regulatory arrangements (including in connection with the holding, acquisition and/or transfer of rights in the CompanyOPC and/or in the CPV Group). In addition, regulatory processes affect the electricityelectrical grid and natural gas infrastructure (including connection to infrastructures). In recent years there has been a trend of developing incentives for renewable energies by regulators in OPC’s operating markets, which affect the projects under development and the competition in OPC’s business environment. These regulatory arrangements may also apply in the context of the encouragement of competition in this area. Changes in regulation, in the regulators’ policies of governments and regulators or their approach to the interpretation of regulation may have different effects on the power plants owned by the Group or on the power plants that the Group intends to develop as well as on the viability in the construction of new power plants. Furthermore, the Group’s activities in Israel and the US are subject to and affected by legislation and regulation aimed at increasing environmental protection and mitigating damage from environmental hazards, including reducing emissions. Impact of COVID-19
In March 2020, the World Health Organization declared COVID-19 to be a worldwide pandemic. Despite taking preventative measures in order to reduce the risk of spread of the virus, the virus continued to spread, including different variants that developed, and it caused significant business and economic uncertainty. The restrictions on movement (travel) and carrying on of business and trade in OPC’s areas of activity were lifted. In light of the dynamic nature of the virus (development of additional variants) and the consequences of ongoing events that are related to the virus (such as an increase in the prices of raw materials and transport costs, outbreak of the virus and imposition of restrictions in countries that are central to the global economy, such as China), there are still broad-sweeping impacts of the COVID-19 crisis, on the markets and factors relating OPC’s activities. However, OPC believes most of the current impacts of the virus are long-term impacts.
In 2021 and the year of the report, due to high global demand for raw materials and transport and dispatch, the trend of a significant increase in the costs of the raw materials and inputs continued, along with a sharp rise in the rates of inflation in the 2022, and delays in the generation and supply chain are visible. Accordingly, global delays have been caused in the equipment supply dates along with an increase in the prices of raw materials and equipment used for construction and maintenance of OPC’s generation facilities and power plants. This trend impacted the construction and/or maintenance costs of OPC’s projects in its activity markets and the timetables for their completion. In addition, the impact of this trend is particularly visible in connection with development projects (including energy generation facilities) and with respect to availability and prices of solar panels for solar projects in the development stage or under construction of the CPV Group. There is no certainty with respect to the continuation of the trend and the scope of the impact thereof on the Group’s activities.
Activities in the U.S. Electricity and natural gas prices CPV’s results of operations are impacted to a significant extent by the electricity prices in effect in the areas in which the CPV’s power plants operate. The main factors impacting the electricity prices are demand for electricity, available generation capacity (supply) and the natural gas price in the area in which the power plant operates. With respect to “energy transition” activities, the natural gas price is significant in the determination of the price of the electricity in most of the regions in which the power plants of the CPV Group operate that are powered by natural gas. InFor the estimation of the CPV Group, in general,most part, in the existing production mix, over time, to the extent the natural‑gas prices are higher, the marginal energy prices will also be higher, and will have a positive impact on the energy margins of the CPV Group due to the high efficiency of the power plants it owns compared with other power plants operating in the relevant activity markets (the impact could be different among the projects taking into account their characteristics and the area (region) in which they are located). This impact could be offset,
Electricity prices The following table summarizes the average electricity prices in whole oreach of the main regions in part,which the power plants in energy transition activities of the CPV Group are active (the prices are denominated in dollars per MWh)*: | | | Year Ended | | | Region | | | | | | | | | | | | | | | | | | | | | | | | | | PJM West (Shore, Maryland) | | | 33.06 | | | | 73.09 | | | | (55 | )% | | PJM AEP Dayton (Fairview) | | | 30.81 | | | | 69.42 | | | | (56 | )% | | New York Zone G (Valley) | | | 33.27 | | | | 82.21 | | | | (60 | )% | | Mass Hub (Towantic) | | | 36.82 | | | | 85.56 | | | | (57 | )% | | PJM ComEd (Three Rivers) | | | 26.68 | | | | 60.40 | | | | (56 | )% |
*Based on Day‑Ahead prices as published by programs hedging electricity margins in the natural‑relevant ISO. The actual gas poweredprices of the power plants of the CPV Group which are intended to reduce volatilitycould be significantly different. The actual electricity prices of the power plants of the CPV Group could be higher or lower than the regional price shown in the CPV Group’s electricity marginsabove table due to changesthe existence of a Power Basis (the difference between the power plant’s specific electricity price and the regional price). The Power Basis is a function of transport pressures, local cost of electricity generation, local demand for electricity, losses in the commoditytransmission lines and additional factors. The following table shows the average Power Basis data for each power plant (the prices are denominated in dollars per megawatt hour): | | | For the year ended December 31 | | | | | | | | | | | | | | | | | | | | | | | | Shore | | | (8.32 | ) | | | (8.90 | ) | | | (6.45 | ) | | Maryland | | | 2.47 | | | | 5.27 | | | | 2.29 | | | Fairview | | | (1.90 | ) | | | (4.14 | ) | | | (4.03 | ) | | Valley | | | (1.41 | ) | | | (4.74 | ) | | | (2.04 | ) | | Towantic | | | (3.02 | ) | | | (4.11 | ) | | | (2.83 | ) | | Three Rivers | | | (1.18 | ) | | | (0.99 | ) | | | (0.44 | ) |
The decrease in the electricity prices in 2023 and in the energy market.fourth quarter of 2023 compared to the corresponding periods last year, corresponds to the trend of decreasing natural gas prices. The decline in the electricity prices was much more moderate than the decline in the natural gas prices due to the supply and demand trends impacting the CPV Group: an increase in the demand for electricity due to electrification (electricity) trends in transportation, real estate and industry, alongside a decline in the available capacity as a result of closure of old inefficient and polluting conventional power plants (mainly power plants powered by coal), on the one hand, and limited new supply of power plants due to a relatively slow rate of entry of renewable energies and a lack of construction of new conventional power plants, on the other hand. Natural gas prices Natural gas prices are impacted by a large number of variables, including demand in the industrial, residential and electricity sectors, production and supply of natural gas, natural‑gas production costs, changes in the pipeline infrastructure, international trade and the financial profile and the hedging profile of the natural‑gas customers and producers. The price for import of liquid natural gas impacts the natural gas and electricity prices, in the winter months in New England and New York, where high prices of liquid natural gas had a positive impact on the profits of the Fairview and Valley power plants during the winter months. Set forth below are the average natural gas in each of the main markets in which the power plants of the CPV Group operate (the prices are denominated in dollars per MMBtu)*: | | | Year Ended | | | Region | | | | | | | | | | | | | | | | | | | | | | | | | | TETCO M3 (Shore, Valley) | | | 6.80 | | | | 3.40 | | | | 100 | % | | Transco Zone 5 North (Maryland) | | | 8.55 | | | | 3.91 | | | | 119 | % | | TETCO M2 (Fairview) | | | 5.53 | | | | 3.08 | | | | 80 | % | | Dominion South (Valley) | | | 5.51 | | | | 3.06 | | | | 80 | % | | Algonquin (Towantic) | | | 9.15 | | | | 4.51 | | | | 103 | % | | | | | | | | | | | | | | |
| | | Year Ended | | | Region | | | | | | | | | | | | | | | Texas Eastern M‑3 (Shore, Valley—70%) | | | 1.90 | | | | 6.80 | | | | (72 | )% | | Transco Zone 5 North (Maryland) | | | 2.74 | | | | 8.55 | | | | (68 | )% | | Texas Eastern M‑2 (Fairview) | | | 1.63 | | | | 5.53 | | | | (71 | )% | | Dominion South Pt (Valley—30%) | | | 1.63 | | | | 5.51 | | | | (70 | )% | | Algonquin City Gate (Towantic) | | | 2.94 | | | | 9.15 | | | | (68 | )% | | Chicago City Gate (Three Rivers) | | | N/A | | | | N/A | | | | N/A | |
| * | Source: The Day‑Ahead prices at gas Midpoints as reported in Platt’s Gas Daily. The actual gas prices of the power plants of the CPV Group could be significantly different. |
The natural gas prices in CPV’s activitythe U.S. started to rise in the second half of 2021 due to the recovery from the economic crisis that took place against the outbreak of COVID-19 and even more so as a result of the outbreak of the war between Russia and the Ukraine in the beginning of 2022. The natural gas prices remained high in 2022, while the generation levels of the natural gas were relatively low. At the end of December 2022, the natural gas prices fell sharply upon the rise in levels of generation of natural gas and the slowdown of the demand owing to the warm winter, and they remained at a significantly lower rate in 2023 compared with the prior year due to the relatively high inventory levels. In January and February 2024, the trend continued against the background of moderate winter weather and an increase in the inventory levels of natural gas. Some of the gas generators began giving notice of cutbacks in the scope of the generation in response to the low natural gas price, where there is no certainty regarding the continuation of this trend or its impact on the natural gas prices. Electricity margin in the operating markets increased significantlyof the CPV Group (Spark Spread with Power Basis) Electricity margins for the CPV Group’s Energy Transition business line is highly correlated with the Spark Spread, which is calculated as the difference between: 1) price of the electricity in 2022the region plus or minus any Power Basis, and the result of 2) the price of the natural gas (used for generation of the electricity) in the relevant area (zone) applied to thermal conversion ratio (“Heat Rate”). The Spark Spread is calculated based on the following formula: Spark Spread ($/MWh) = price of the electricity ($/MWh) +/-Power Basis ($MWh) – [the gas price ($/MMBtu) x Heat Rate (MMBtu/MWh)] Set forth below are the average Spark Spread for each of the main markets in the power plants of the CPV Group are operating (the prices are denominated in dollars per megawatt/hour)*: | | | For the | | | | | Year Ended | | | Power Plant | | | | | | | | | | | | | | | Shore | | | 19.95 | | | | 26.17 | | | | (24 | )% | | Maryland | | | 14.15 | | | | 14.10 | | | | – | | | Valley | | | 20.72 | | | | 37.96 | | | | (45 | )% | | Towantic | | | 17.71 | | | | 26.09 | | | | (32 | )% | | Fairview | | | 20.22 | | | | 33.48 | | | | (40 | )% | | Three Rivers | | | – | | | | – | | | | – | |
| * | Based on electricity prices as shown in the above table, with a discount for the thermal conversion ratio (heat rate) of 6.9 MMBtu/MWh for Maryland, Shore and Valley, and a thermal conversion ratio of 6.5 MMBtu/MWh for Three Rivers, Towantic and Fairview. The actual energy margins of the power plants of the CPV Group could be significantly different due to, among other things, the existence of Power Basis as described above. |
The decrease in the electricity margins (Spark Spread with Power Basis) in 2023 and in the fourth quarter of 2023 compared towith the corresponding periods last year. In the estimation of the CPV Group, the said increase stems from, among other things, an increase in demand for electricity in the U.S., a strengtheningprior year, as shown by the above table, corresponds to the trend of the global demand for natural gas, inventory levels of natural gas that are lower than in the past, and a limited increase in production of natural gas. Since the beginning of 2023, there has been a significant declinedecrease in the natural gas prices mainly due to warm winteralong with a more moderate decline in the regions whereelectricity prices.
The hedging of the electricity margins in the power plants of the CPV operates along with high seasonalGroup that are powered by natural gas levels.is intended to reduce the fluctuations of the CPV Group’s electricity margin resulting from changes in the natural gas and electricity prices in the energy market. Electricity prices
The following table summarizesSet forth below is the average electricity prices in eachscope of the main marketshedging for 2024 as at March 12, 2024 (the data presented in which power plantsthe tables below is on the basis of the rate of holdings of the CPV Group are active (the prices are denominated in dollars per MWh):the associated companies).
| | | Year Ended | | | Region | | | | | | | | | | | | | | | | | | | | | | | | | | PJM West (Shore and Maryland) | | | 73.09 | | | | 38.92 | | | | 88 | % | | PJM AD Hub (Fairview) | | | 69.42 | | | | 38.35 | | | | 81 | % | | NYISO Zone G (Valley) | | | 82.21 | | | | 40.74 | | | | 102 | % | | ISO‑NE Mass Hub (Towantic) | | | 85.56 | | | | 45.92 | | | | 86 | % |
| 2024 | | | | Expected generation (MWh) | 9,773,754 | | | | Net scope of the hedged energy margin (% of the power plant’s capacity based on the expected generation) (1) | 50% | | | | Net hedged energy margin (millions of $) | ≈ 74.9 | | | | Net hedged energy margin (MWh/$) | 15.30 | | | | Net market prices of energy margin (MWh/$) (2) | 16.49 |
Based on Day‑Ahead prices as published by(1) Pursuant to the relevant ISO.policy for hedging electricity margins in general, the CPV Group seeks to hedge up to 50% of the scope of the expected generation. The actual gashedge rate could ultimately be different. In general, the hedge is made for a period of 24 months and most of it is for a period of 12 months forward and, accordingly, as at December 31, 2023, the scope of the hedges made for 2025 is not material.
(2) The net energy margin is the energy margin (Spark Spread) plus/minus Power Basis less carbon tax and other variable costs. The market prices of the power plants of the CPV Group could be significantly different. The increase in thenet hedged energy are based on future contracts for electricity prices in 2022 and in the fourth quarter compared to the corresponding periods last year, stems mainly from the increase in the natural gas prices as detailed above, and this situation became more severe due to the premium on the natural gas price in the northwest region in the market areas referred to.
Since the beginning of 2023, there has been a significant decline in the natural gas prices – present and future, as detailed above.gas.
Capacity PaymentsRevenues Capacity is a component that is paid by regulatory bodies that manage demand and loads (system operators) for electricity generators, with respect to their ability to generate energy at the required times for purposes of reliability of the system. This revenue component is an additional component, separate from the component based on the energy prices (which is paid in respect of sale of the electricity). The payment component includes an entitlement to revenue for availability of the electricity, including provisions regarding bonus or penalty payments, which are governed by the tariffs determined by the FERC of every market. Accordingly, NY-ISO, PJM and ISO-NE publish mandatory public tenders for determination of the capacity tariffs. Set forth below is the scope of the secured capacity revenues for 2024:
| 2024 | | | | Scope of the secured capacity revenues (% of the power plant’s capacity) | 89% | | | | Capacity payments (millions of $) | ≈ 56 |
The PJM market In the PJM market, capacity payments vary between sub-zones in the market, as a function of local supply and demand and transmission capabilities. Below are the capacity rates in the sub-zones relevant to the projects of the CPV Group and in the general market (prices are denominated in USD for megawatt per day). Generally, the capacity prices have declined from period to period as illustrated in the table below: | Sub-zone | CPV power plants2 | 2024/2025 | 2023/20243 | 2022/2023 | 2021/2022 | CPV power plants(1) | 2024/2025 | 2023/2024(2) | 2022/2023 | 2021/2022 | | PJM – RTO | -- | 28.92 | 34.13 | 50 | 140 | | | PJM—RTO | | -- | 28.92 | 34.13 | 50 | 140 | | PJM COMED | Three Rivers | 28.92 | 34.13 | - | - | Three Rivers | 28.92 | 34.13 | - | - | | PJM MAAC | Fairview, Maryland, Maple Hill | 49.49 | 49.49 | 95.79 | 140 | Fairview, Maryland, Maple Hill | 49.49 | 49.49 | 95.79 | 140 | | PJM EMAAC | Shore | 54.95 | 49.49 | 97.86 | 165.73 | Shore | 54.95 | 49.49 | 97.86 | 165.73 |
Source: PJM. (1) The Three Rivers project, which is under construction, will be eligible for capacity payments as from its commercial operation date, subject to completion of construction. (2) As stipulated in the capacity tenders which took place in June 2022. In October 2023, PJM submitted to FERC changes in the format for the capacity market for the purpose of applying the changes to the tenders planned for July 2024 (for a one year period that starts in the middle of 2025). The proposed changes include changes in the modeling of risks, a recognition process for the source of the capacity, requirements for examination of generators, a ceiling for an annual penalty on the performance levels and a ceiling for recognized bids. In the estimation of the CPV Group, the proposed changes, if approved, are expected to have a positive impact on the capacity tariffs. The NYISO market Similar to the PJM market, in the NYISO market, capacity payments are made as part of a centralized capacity purchase mechanism. The NYISO market has a number of sub-markets, which may have different capacity requirements as a function of local supply and demand and transmission capacities. NYISO holds seasonal tenders every spring for the coming summer (May to October), and in the fall for the coming winter (November to April). In addition, monthly supplementary tenders are held for the unsold capacity in the seasonal tenders. The power plants are permitted to guarantee the capacity paymentstariffs in the seasonal and monthly tenders or through bilateral sales. The Valley power plant is located in Zone G (Lower Hudson Valley).
2 The Three Rivers project, which is under construction, will be eligible for capacity payments as from its commercial operation date, subject to the completion of the construction.
3 As stipulated in the capacity tenders which took place in June 2022.
Below are the capacity prices set in the seasonal tenders held on the NYISO market. It should be noted thatThe Valley power plant is located in Zone G (Lower Hudson Valley) and the actual capacity prices for Valley are affected by seasonal and monthly tenders and SPOTspot prices, with variable monthly capacity prices and bilateral agreements with energy suppliers on the market (prices are denominated in USD for Kilowattmegawatt per month). | Sub-zone | CPV power plants | Winter 2022/2023 | Summer 2022 | Winter 2021/2022 | CPV power plants | Winter 2023/2024 | Summer 2023 | Winter 2022/2023 | Summer 2022 | | NYISO Rest of the Market | - | 1.18 | 3.40 | 1.00 | - | 127.25 | 153.26 | 39.23 | 110.87 | | Lower Hudson Valley | Valley | 1.31 | 4.65 | 1.01 | Valley | 128.9 | 164.35 | 43.43 | 151.63 |
Source: NYISO. The ISO-NE market Similar to the PJM market, in the ISO-NEISO NE market capacity payments are made in the frameworkas part of a central mechanism for acquisition of capacity. The ISO-NEIn the ISO NE market, hasthere are a number of sub-markets,submarkets, in which may have different capacity requirements differ as a function of local supply and demand and transmission capacities. Forward capacitytransport capacity. ISO NE executes forward tenders are heldfor a period of one year, commencing from June 1, three years ahead for a given capacity year.from the year of the tender. In addition, there are supplementary monthly supplementaryand annual tenders are held for the unsoldbalance of the capacity not sold in the forward tenders. When Towantic enteredThe power plants are permitted to guarantee the capacity market, the project ensured a fixed capacity payment for seven years given to new players. The capacity payment as stated above shall apply through May 2025. In respect of June 2025 to May 2026 and June 2026 to May 2027, Towantic took partpayments in the annualforward tenders, the supplementary tenders or through bilateral sales. Set forth below are the capacity tenders, that were closed at USD 2.59 per kW/monthpayments determined in the areasub regions that are relevant to the Towantic power plant (the prices are denominated in which the project is located.dollars per megawatt per day): | Sub-area | CPV power plants | 2026/2027 | 2025/2026 | CPV power plants | 2027/2028 | 2026/2027 | 2025/2026 | | ISO-NE Rest of the market | Towantic | 2.59 | 2.59 | Towantic | 117.70 | 85.15 | 85.15 |
The actual capacity payments for the Towantic power plant are impacted by forward tenders, supplemental annual tenders, monthly tenders with variable capacity prices in every month and bilateral agreements with the energy suppliers in the market. Hedging In general, with the current generation mix of less efficient units compared to those of CPV, the higher the gas prices – prices—the higher the marginal energy prices, having a positive effect on the energy margin of the CPV Group in view of the efficiency of the power plants it ownsfacilities (the effect may vary between different projects due to their characteristics and location). This effect may be partially or fully offset by hedging plans in respect of some of the electricity and capacity margins, with the aim of moderating the volatility in the commodities market in general and the energy and natural gas prices in particular, and withparticular. In general, the aim of locking margins that it believesCPV Group seeks to be high both in historical terms and in viewhedge up to 50% of the analysisscope of the current (SPOT) and future market. The purpose of these hedging plans is to fix the energy and capacity margin by entering into hedging agreements or future sale of electricity, RECs and gas (that is to say, the electricity margin), and the capacity, in accordance with the relevant characteristics of each power plant for which hedging is carried out;expected generation. Generally, the agreements are normally for shorttime periods mostlyof up to 24 months (mostly for the next 12 monthsmonths) for natural gas-fired projects and areEnergy Transition power plants for longer periods for renewable energy projects.a portion of the output. During the reporting period,2023, hedging agreements and future sale agreements arewere in place in Keenan, Maple Hill, Stagecoach, Shore, Maryland, Fairview and Towantic, and as from the third quarter of 2022 – also Valley. In addition to the current hedging plans as stated above, CPV Group has Revenue Put Option (RPO) agreements, that were signed by some of the CPV Group’s power plants in order to ensure minimum cash flow available for debt service; those agreements are not expected to be in effect or renewed beyond their original expiry dates. The CPV Group holds energy hedging agreements ensure the energy margins as well as the capacity margin for the nominal hedged capacity of the facility (approximate, in percentage). 157
The Inflation Reduction Act In August 2022, the Inflation Reduction Act of 2022 was signed by the President of the U.S. and it became law which, among other things, grants significant tax credits for renewable energies and technologies for carbon capture, and one of the targets of the IRA is to lead to an increase of the generation of renewable energies and the regulatory stability in the area. The following are key arrangements set forth in the IRA that may be relevant for CPV Group’s activities. RenewableCPV believes that the IRA is expected to have a positive impact on initiation, development and construction projects involving renewable energies
The IRA includes, a number and, among other things, on increasing the value of the tax credits that are expected to be received compared with the situation existing prior to passage of the IRA. In addition, the possibility of selling the tax benefits for renewable energy projects. The IRA extendsis expected to increase the ITC andCPV Group’s ability to realize part of the PTC invalue of the tax credits of its renewable energy projects and to improve the construction of whichinvestment conditions.
Regarding projects under development that include carbon capture technologies, CPV believes that the IRA is started priorexpected to January 1, 2025. The base level for the ITC is 6% and the base level for the PTC is 0.3 cents per kilowatt (adjusted for inflation). Projects that meet customary earnings and registration requirements should be entitled to ITC of up to 30% or PTC of up to 1.5 cents per kilowatt (adjusted for inflation). It is possible to earn additional bonus credits, which increase the PTC by 10% or 10% points for the ITC,have a positive impact due to the extentbenefits it provides. The IRS published some of the relevant project meets the local steel, iron and product manufacturing requirements. It is possible to earn additional bonus credits, which increase the PTC by 10% or 10% points for the ITC,arrangements relating to the extent the relevant project is located in special designated energy communities, such as: (i) Brownfield sites; (ii) locations with unemployment in excessmanner of implementation of the natural average and contributions to direct employment in the oil, gas or coal industry or local tax income above the levels determined; and (iii) a population region that is proximate to regions wherein a coal mine or coal powered power plant were closed after December 31, 2009. The said tax credits may be transferred to unrelated entities. CPV Group is examining the impactIRA. Nonetheless, some of the IRA on Maple Hill. The CPV Group believes the project meets the conditions for ITC at the rate of an additional 10% (and in total 40%). In addition, the CPV Group is analyzing the impacts of the IRA on Stagecoach and Rogue’s Wind and the economic feasibility that will derive frommanner of its choiceapplication have not yet been fully clarified and they are expected to be clarified upon publication of the ITC or the PTC benefit for the project, as well as the project’s entitlement to additional bonus tax benefits.detailed arrangements.
Projects for generation of electricity that start their activities after December 31, 2024, that emit zero or less greenhouse gases, are entitled to ITC or PTC neutral technology under the IRA, in accordance with the same credit levels described above for the existing ITC or PTC. These tax credits are expected to gradualgradually decline commencing from the later of 2032 or when emissions of greenhouse gases in the U.S. from generation of electricity will be equal to or less than 25% of the emission levels from generation of electricity for 2022. ProjectProjects entitled to these tax credits will also be entitled to five-year accelerated depreciation for the project’s assets. Natural gas with reduced emissions In addition,The IRA includes a tax credit for electricity generation facilities having carbon capture capability at the rate of about 75% of the emission. The rate of the credit will be $60 per ton of carbon for carbon removed by injection into active oil wells (Enhanced Oil Recovery) and $85 per ton of carbon for carbon interred in a permanent manner. This benefit is granted as a direct payment during the first five years and as a tax credit during an additional seven years.
In the estimation of the CPV Group,believes that the IRA is expected to have a favorablepositive impact on the renewable energy initiation, development and construction projects including Maple Hill and Stagecoachinvolving renewable energies and, among other things, an increase inon increasing the value of the tax credits that isare expected to be received compared towith the situation existing prior to passage of the law. It is noted that even though some of the regulatory arrangements have not yet been finalized, there is a possible positive impact on the entitlement of some of the Group’s renewable energy projects to a higher tax credit due to their location (for example, on areas that were former coal mines), including the Maple Hill project. The CPV Group estimates that it will choose tax benefits of the ITC type for the Maple Hill project and for an additional project that is presently in the advanced development stages and it is examining the economic feasibility of ITC or PTC benefits for Stagecoach and Rogue’s projects, taking into the arrangements provided. Also,IRA. In addition, the possibility of selling the tax creditsbenefits is expected to increase the CPV Group’s ability to realize part of the value of the tax credits of its renewable energy projects and to improve the investment conditions.
Regarding projects under development that include carbon capture technologies, CPV believes that the IRA is expected to have a positive impact due to the benefits it provides. The IRS published some of the arrangements relating to the manner of implementation of the IRA. Nonetheless, some of the impacts of the IRA and the manner of its application have not yet been fully clarified and they are expected to be fully understood upon publication of all of the detailed arrangements. Carbon capture projects The IRA broadens the generation tax credits available PTC tofor capture and/or use of carbon dioxide. For electricity generation facilities that install carbon capture technologytechnologies with the capability of capturing 75% or more of the generation base of the carbon dioxide, the said generation tax credit for the first 12 years after commencement of activities if the relevant electricity generation facility captures at least 18,750 metric tons of carbon dioxide per year. The amount of the base credit is $17 per metric ton of carbon dioxide captured and separated and $12 per metric ton of carbon dioxide invested in intensified restoration of fuel oil (EOR) or is used in another generation process. Similar to the ITC and PTC for renewable energies, PTC for carbon capture can be increased if the project meets the usual earnings and registration processes. The ceiling for the credit for separated carbon dioxide is $85 per metric ton and the ceiling for the EOR credit and other beneficial re uses (recycling) is $60 per metric ton. In addition, the tax credit permits direct payment up to the first five years on carbon capture equipment that is placed into service after December 31, 2022. With reference to theFor projects of the CPV Group that are in the development stage, and that integrate technologies for carbon capture, the IRA is expected to have a positive impact in all that relating to the technological benefits for carbon capture provided in the IRA. The full impacts of the IRA have not yet been finally clarified, and they are expected to be clarified upon formulation of the detailed arrangements (regulations).arrangements.
ZIM Kenon had a 21% equity interest in ZIM as of December 31, 20222023 (following completion of ZIM’s IPO in February 2021 and share sales of approximately 1.2 million ZIM shares between September and November 2021). ZIM’s results of operations for the years ended December 31, 20222023 and 20212022 are reflected in Kenon’s share in losses/(profit) of associated companies, net of tax, pursuant to the equity method of accounting. Market Volatility. The container shipping industry continues to be characterized in recent years by volatility in freight rates, charter rates and bunker prices, accompanied by significant uncertainties in the global trade (including the implications of the War in Israel, the ongoing military conflictconflicts between Israel and Hamas and Hezbollah and Russia and Ukraine, the rise of inflation in certain countries, or the continuing trade restrictions between the US and China). Market conditions impact during 2021 and 2022 was positive, resulting in the ZIM’s improved results and strengthened capital structure, mainly driven by increased freight rates, although decreasing followingrates. Following the peak levels inreached during 2021 and the first quarter partially offset byof 2022, freight rates have decreased in most trades throughout the impactremainder of the year 2022 and during 2023 as a result of reduced demand and increased charter hirecapacity as well as the easing of both COVID-19 restrictions and bunker costs.congestion in ports, although some increases were demonstrated in certain trades towards the end of 2023, related to security concerns raised in the Red Sea. Volume of cargo carried. The volume of cargo that ZIM carries affects its income and profitability from voyages and related services and varies significantly between voyages that depart from, or return to, a port of origin. The vast majority of the containers ZIM carries are either 20 or 40 foot containers. ZIM measures its performance in terms of the volume of cargo it carries in a certain period in 20 foot equivalent units carried, or TEUs carried. ZIM’s management uses TEUs carried as one of the key parameters to evaluate ZIM’s performance, used in real-time and take actions, to the extent possible, to improve performance. Additionally, ZIM’s management monitors TEUs carried from a longer-term perspective, to deploy the right capacity to meet expected market demand. Although the volume of cargo that ZIM carries is principally a function of demand for container shipping services in each of its trade routes, it is also affected by factors such as: local shipping agencies’ effectiveness in capturing such demand; level of customer service, which affects ZIM’s ability to retain and attract customers; ability to effectively deploy capacity to meet such demand; operating efficiency; and ability to establish and operate existing and new services in markets where there is growing demand. The volume of cargo that ZIM carries is also impacted by its participation in strategic alliances (in which we currently do not participate) and other cooperation agreements. In periods of increased demand and increased volume of cargo, ZIM adjusts capacity by chartering-in additional vessels and containers and/or purchasing additional slots from partners, to the extent feasible. During these periods, increased competition for additional vessels and containers may increase its costs. ZIM may deploy its capacity through additional vessels and containers in existing services, through new services that ZIM operates independently or through the exchange of capacity with vessels operated by other shipping companies or other cooperative agreements. In periods of decreased volumes of cargo, ZIM may adjust capacity to demand by electing to reduce its fleet size in order to reduce operating expenses mainly by redelivering chartered-in vessels and not renewing their charters, or by cancelling specific voyages (which are referred to as “blank sailings”). ZIM may also elect to close existing services within, or exit entirely from, less attractive trades. As a substantial portion of its fleet is chartered-in, ZIM retains a relatively high level of flexibility even though it is less so when it concerns vessels that are long-term chartered. Freight rates. Freight rates are largely established by the freight market and ZIM has a limited influence over these rates. ZIM uses average freight rate per TEU as one of the key parameters of its performance. Average freight rate per TEU is calculated as revenues from containerized cargo during a certain period, divided by total TEUs carried during that period. Container shipping companies have generally experienced volatility in freight rates. Freight rates vary widely as a result of, among other factors: cyclical demand for container shipping services relative to the supply of vessel and container capacity; competition in specific trades; bunker prices;
costs of operation;operation (including bunker, terminal and charter costs); the particular dominant leg on which the cargo is transported; average vessel size in specific trades; the origin and destination points selected by the shipper; and the type of cargo and container type. As a result of some of these factors, including cyclical fluctuations in demand and supply, container shipping companies have experienced volatility in freight rates. For example, the comprehensive Shanghai (Export) Containerized Freight Index (SCFI) increased from 818 points on April 23, 2020, with the global outbreak of COVID-19, to 5,047 as of December 31, 2021, but since then decreased to 1,108 as of December 30, 2022.31, 2023, was 1,760. Freight rates have significantly declined in the second half of 2022 as a result of reduced demand as well as the easing of both COVID-19 restrictions and congestion in ports.2023. Furthermore, rates within the charter market, through which ZIM sourceswe source most of itsour capacity, may also fluctuate significantly based upon changes in supply and demand for shipping services. The severe shortage of vessels available for hire during 2021 and the first half of 2022 has resulted in increased charter rates and longer charter periods dictated by owners. Since September 2022, charter hire rates have been normalizing, with vessel availability for hire still very low. In addition, according to Alphaliner, global container ship capacity is expected to increase by 8.2%9.9% in 2023,2024, with a vessel order book of 7.57.1 million TEU, the highest since 2010, while demand for shipping services is projected to increase only by 1.4%2.2%. Therefore, the increase in ship capacity is expected to be more than the increase in demand for container shipping. There are certain cargo segments whichtypes that require more expertise; for example, ZIM charges a premium over the base freight rate for handling specialized cargo, such as refrigerated, liquid, over-dimensional, or hazardous cargo, which require more complex handling and more costly equipment and are generally subject to greater risk of damage. ZIM believes that its commercial excellence and customer centric approach across itsZIM’s network of shipping agencies enable usZIM to recognize and attract customers who seek to transport such specialized types of cargo, which are less commoditized services and more profitable. ZIM has stated that it intends to focus on growing the specialized cargo transportation portion of its business: the portion of dangerous and hazardous cargo out of its total TEU carried grew by approximately 3% during 2022 compared to 2021,business and the portion of reefer cargo out of its total TEU carried grew by approximately 8%6% during 20222023 compared to 2021.2022. ZIM also charges a premium over the base freight rate for global land transportation services ZIMit provides. Further, from time to time ZIM imposes surcharges over the base freight rate, in part to minimize its exposure to certain market-related risks, such as fuel price adjustments, increased insurance premiums in war zones, exchange rate fluctuations, terminal handling charges and extraordinary events, although usually these surcharges are not sufficient to recover all of itsZIM’s costs. Amounts received related to these adjustment surcharges are allocated to freight revenues. Cargo handling expenses. Cargo handling expenses represent the most significant portion of ZIM’s operating expenses. Cargo handling expenses primarily include variable expenses relating to a single container, such as stevedoring and other terminal expenses, feeder services, storage costs, balancing expenses arising from repositioning containers with unutilized capacity on the non-dominantcounter-dominant leg, and expenses arising from inland transport of cargo. ZIM manages the container repositioning costs that arise from the imbalance between the volume of cargo carried in each direction using various methods, such as triangulating its land transportation activities and services. If ZIM is unable to successfully match requirements for container capacity with available capacity in nearby locations, it may incur balancing costs to reposition its containers in other areas where there is demand for capacity. Cargo handling accounted for 43.0%, 41.6%, 48.1% and 50.5%48.1% of ZIM’s operating expenses and cost of services for the years ended December 31, 2023, 2022 2021 and 2020. Bunker expenses. FuelBunker expenses, in particular bunkermainly comprised of fuel expenses,and marine LNG consumption, represent a significant portion of ZIM’s operating expenses. As a result, changes in the price of bunker or in ZIM’s bunker consumption patterns can have a significant effect on ZIM’s results of operations. Bunker price has historically been volatile, can fluctuate significantly and is subject to many economic and political factors that are beyond ZIM’s control. Bunker prices have been relatively low during 2020, have increased during 2021, and have increased further duringdecreased in 2023, following an increase in 2022, partially due to the outbreak of the Russian-Ukrainemilitary conflict between Russia and inflation.Ukraine. ZIM has entered into a sale and purchase agreement with Shell to supply LNG for its 15,000 TEU LNG dual fuel vessels, expected to bewhich have been delivered, during 2023-2024, and ZIM reliesexpects to rely on Shell and other LNG suppliers for the purchase and supply of LNG for the remaining of its LNG dual fuel fleet to be delivered. ZIM’s bunker fuel consumption is affected by various factors, including the number of vessels being deployed, vessel size, pro forma speed, vessel efficiency, weight of the cargo being transported and sea state. ZIM’s fuel expenses, which consist primarily of bunker expenses, accounted for 28.3%, 30.1%, 18.9% and 12.8%18.9% of its operating expenses and cost of services for the years ended December 31, 2023, 2022 and 2021, and 2020, respectively. Vessel charter portfolio. Most of ZIM’s capacity is chartered in. As of December 31, 2022,2023, ZIM chartered-in 141144 vessels, (including 136 vessels accounted as right-of-use assets under the lease accounting guidance of IFRS 16 and four vessels accounted under sale and leaseback refinancing agreements), which accounted for 94.2%95.0% of ZIM’s TEU capacity and 94.0%93.8% of the vessels in ZIM’s fleet. Of such vessels, all are under a “time charter,” including three vessels chartered in from related parties, which consists of chartering-in the vessel capacity for a given period of time against a daily charter fee and 137 of which are with the owner handling the crewing and technical operation of the vessel, including 6 vessels chartered-in from related parties.vessel. Four of ZIM’s vessels arewere chartered-in under a “bareboat charter,” which consists of chartering a vessel for a given period of time against a charter fee, with ZIM handling the operation of the vessel.vessel but they were re-delivered to their owners during 2023, so currently none of ZIM’s vessels are chartered-in under a bareboat charter. Under these arrangements, both parties are committed for the charter period; however, vessels temporarily unavailable for service due to technical issues will qualify for relief from charges during such period (off hire). Further to the implementation of IFRS 16 (‘Leases’) on January 1, 2019, vessel charters with an expected term exceeding one year, are accounted through depreciation and interest expenses. Accordingly, the composition of our charter fleet in respect of expected term, affects the classification of our costs related to vessel charters. ZIM also purchases “slot charters,” which involve the purchase of slots on board of another shipping company’s vessel. Generally, these rates are based primarily on demand for capacity as well as the available supply of container ship capacity. As a result of macroeconomic conditions affecting trade flow between ports served by container shipping companies and economic conditions in the industries which use container shipping services, bareboat, time and slot charter rates can, and do, fluctuate significantly and are generally affected by similar factors that influence freight rates. ZIM’s results of operations may be affected by the composition of its general chartered-in vessels portfolio. Slots purchase and charter hire of vessels (other than those recognized as right-of-use-assets) accounted for 2.0%, 8.4%, 13.6% and 17.6%13.6%, of its operating expenses and cost of services for the years ended December 31, 2023, 2022 and 2021, and 2020, respectively. EBITDA, Adjusted EBIT and Adjusted EBITDA We present EBITDA and Adjusted EBITDA of OPC and Adjusted EBIT and Adjusted EBIT of ZIM. These are all is a non-IFRS financial measure that we define as net income (loss) adjusted to exclude financial expenses (income), netmeasures, and income taxes,are defined in order to reach our results from operating activities, or EBIT, and further adjusted to exclude impairment of assets, non-cash charter hire expenses, capital gains (losses) beyond the ordinary course of business and expenses related to legal contingencies. Adjusted EBITDA is a non-IFRS financial measure that we define as net income (loss) adjusted to exclude financial expenses (income), net, income taxes, depreciation and amortization in order to reach EBITDA, and further adjusted to exclude impairments of assets, non-cash charter hire expenses, capital gains (losses) beyond the ordinary course of business and expenses related to legal contingencies.this report where these figures are presented. We present EBITDA, Adjusted EBIT and Adjusted EBITDA in this annual report because each is a key measure used by our management and board of directorsbusinesses to evaluate ourtheir operating performance. Accordingly, we believe that EBITDA, Adjusted EBIT and Adjusted EBITDA provide useful information to investors and others in understanding and evaluating ourthe operating results of our businesses and comparing oursuch operating results between periods on a consistent basis, in the same manner as our management and board of directors.businesses. Adoption of New Accounting Standards in 20222023 For information on the impact of the adoption of new accounting standards, see Note 3 to our financial statements included in this annual report. Impairment Tests of ZIM For the purposes of Kenon’s impairment assessment of its investment, ZIM is considered one CGU, which consists of all of ZIM’s operating assets. The recoverable amount is based on the higher of the value-in-use and the fair value less cost of disposal (“FVLCOD”). Kenon did not identify any objective evidence that its net investment in ZIM was impaired as atIn December 31, 2021 and therefore, in accordance with IAS 28, no assessment of the recoverable amount of ZIM was performed.
2022, Kenon identified indicators of impairment in accordance with IAS 28 as a result of a significant decrease in ZIM’s market capitalization towards the end of 2022. Therefore, the carrying value of Kenon’s investment in ZIM was tested for impairment in accordance with IAS 36. Kenon assessed the fair value of ZIM to be its market value as at December 31, 2022 and also assessed that, based solely on publicly available information within the current volatile shipping industry, no reasonable VIU (value-in-use) calculation could be performed. As a result, Kenon concluded that the recoverable amount of its investment in ZIM is the market value. ZIM is accounted for as an individual share making up the investment and that no premium is added to the fair value of ZIM. Kenon measures the recoverable amount based on FVLCOD (fair value less costs of disposal), measured at Level 1 fair value measurement under IFRS 13. Given that market value is below carrying value, Kenon recognized an impairment of $929 million. As of December 31, 2023, the carrying amount of ZIM had been reduced to zero after taking into account the equity accounted losses of ZIM and therefore, no assessment of further impairment of ZIM was necessary. Further, as of December 31, 2023, Kenon did not identify any objective evidence that the previously recognized impairment loss no longer exists or the previously assessed impairment amount may have decreased, and therefore, in accordance with IAS 36, no reversal of impairment was recognized. Sale of ZIM shares In March 2022, Kenon sold approximately 6 million ZIM shares at an average price of $77 per share for total consideration of approximately $463 million. As a result of the sale, Kenon recognized a gain on sale of approximately $205 million in its consolidated financial statements. Recent Developments Kenon DividendDividends
In March 2023, Kenon’s board of directors approved2024, Kenon announced a cash dividend of approximately $150$200 million ($2.793.80 per share), payable to Kenon’s shareholders of record as of the close of trading on April 10, 2023, for payment on or about April 19, 2023. Share repurchase plan
In March 2023, Kenon’s board of directors authorized a share repurchase plan of up to $50 million. Repurchases may be made from time to time through open market purchases on the TASE or the NYSE or by way of off-market purchases in accordance with an equal access scheme, or by other means that comply with applicable laws. Repurchases may be made using trading plans intended to qualify under Rule 10b5-1 under the Securities Exchange Act of 1934 and the similar safe harbor under Israeli law and Israel Securities Authority guidelines, in accordance with applicable securities laws and other restrictions.
To implement the share repurchase plan, Kenon has entered into an initial repurchase mandate for repurchases of up to $12 million of shares through open market purchases on the TASE only, to be implemented by a broker who will have discretion as to repurchases pursuant to irrevocable instructions which include parameters as to price and volume set by Kenon, within the safe harbor from insider trading liability pursuant relating to the “Israel Securities Authority Opinion 199-8.” Such initial mandate will expire on May 25, 2023, shortly before the expected date of Kenon’s forthcoming AGM (the “2023 AGM”). Kenon will seek approval at the 2023 AGM to renew its authority to enter into further mandates and, subject to such shareholder approval, expects to enter into such further mandates to make purchases to implement the share repurchase plan for up to $50 million. Share repurchases under the share repurchase plan will be funded through available cash. The considerations for implementing the share repurchase plan include enhancing shareholder value while taking into account Kenon’s available funds.
Pursuant to the terms of the share purchase authorization which was renewed at the AGM held on May 19, 2022 (the “2022 AGM”), the board of directors is authorized to repurchase up to 5% of issued and outstanding shares as at the date of that AGM (excluding any shares which were held as treasury shares, or which were held by a subsidiary of the Company under Sections 21(4B) or 21(6C) of the Companies Act 1967 of Singapore (the “Companies Act”), as at that date). Kenon intends to seek shareholder approval at the 2023 AGM to increase this limit (from the current 5%) to up to 10% of its issued and outstanding shares as of that date (excluding any shares which are held as treasury shares, or which are held by a subsidiary of the Company under Sections 21(4B) or 21(6C) of the Companies Act, as at that date).
The implementation of the share repurchase plan is subject to the authority of the share purchase authorization which was renewed by shareholders at the 2022 AGM (and which will, unless varied or revoked by our shareholders at a general meeting, continueyear ending December 31, 2024 payable in force until the earlier of the date of the 2023 AGM or the date by which the 2023 AGM is required by law to be held) or, as the case may be, any subsisting share purchase authorization in force at the time of the share repurchases (including the share repurchase authorization which will be proposed for shareholder approval at the 2023 AGM). The share repurchase plan may be suspended for periods, modified or discontinued at any time and may not be completed up to the full amount of the share repurchase plan. Any ordinary shares acquired or purchased will be deemed cancelled immediately upon purchase or acquisition, unless held as treasury shares.
AGM resolution regarding share dividend
Kenon intends to seek shareholder approval at the 2023 AGM to alter its constitution to facilitate payment of its cash dividends in the form of new shares, or a combination of cash and new shares, at the election of shareholders, in accordance with such scheme as may be adopted by Kenon from time to time.April 2024.
OPC Acquisition of four operating wind-powered electricity power plants in Maine, U.S.Gnrgy Separation Agreement
On January 4, 2023,15, 2024, OPC Israel (which owns 51% in Gnrgy Ltd.) entered into a separation agreement (the “Separation Agreement”) with the minority shareholder in Gnrgy, who holds the remaining 49% interest in Gnrgy (the “Founder”). Pursuant to the Separation Agreement, OPC Israel has a first right to purchase all of the Founder’s shares in Gnrgy on the dates and terms set forth in the Separation Agreement. If OPC Israel (or a third party acting on its behalf) does not within the agreed period of time issue a notice to purchase the Founder’s shares in Gnrgy on the terms set forth in the Separation Agreement, the Founder would have the right to purchase OPC Israel’s shares in Gnrgy on the terms set in the Separation Agreement. If no such notice is delivered by the Founder (or a third party acting on its behalf) during the prescribed time period, the Separation Agreement would terminate, and the parties’ holdings in Gnrgy would remain unchanged. OPC also announced that OPC Israel has entered into a non-binding memorandum of understanding with a third party regarding a potential merger of operations between Gnrgy and the third party, whereby, among other things, OPC Israel would sell to the third party its shares in Gnrgy in exchange for shares in the third party (which is not expected to give OPC Israel control over the third party), and the third party would acquire all of the Founder’s shares in Gnrgy (the “Gnrgy Transaction”). The Gnrgy Transaction, including whether or not the parties proceed with the transaction, its structure and final conditions (if finalized) are subject to, among other things, the execution of binding agreements with the third party and the holders of rights in the third party, and to mutual due diligence to be conducted by the parties within a time period set forth in the memorandum of understanding. In connection with this transaction, OPC recognized an impairment loss in respect of goodwill recorded in connection with the acquisition of approximately NIS 23 million ($6 million). Issuance of Bonds (Series D) In January 2024, OPC issued a series of bonds at a par value of approximately NIS 200 million (approximately $53 million), with the proceeds of the issuance designated for OPC’s subsidiary, CPV Group LP, through a 100% owned subsidiary,needs, including for recycling of an existing financial debt (Series D). The bonds are listed on the TASE, are not CPI-linked and bear annual interest of 6.2%. The principal and interest for Series D bonds will be repaid in unequal semi-annual payments (on March 25, and September 25), as set out in the amortization schedule, starting from March 25, 2026 in relation to the principal and September 25, 2024 in relation to interest. In February 2024, OPC-Rotem entered into an agreement with Partner Communications for the purpose of selling electricity to acquire four operating wind-poweredPartner Communications’ consumers, who are household consumers or small businesses (SMB) as decided between the parties. The agreement will allow the diversification of OPC’s customer mix and production facilities. According to the agreement, OPC will supply electricity power plantsat maximum quantities and under the conditions as defined therein, to Partner Communications’ customers, who will enter into an agreement with OPC and Partner Communications for the supply of electricity by OPC. Partner Communications will be required to maintain interfaces with the electricity consumers in Maine, United States,connection with an aggregate capacitythe sale of approximately 81.5 MW.the electricity thereto, and will be entitled to the payments that it will collect from the electricity consumers in respect of the supply of the electricity. OPC is required to supply the electricity, and is entitled to payment from Partner Communications in accordance with the quantity of electricity that the consumers will consume in accordance with the tariff set in the agreement. The plantsagreement is not subject to an undertaking by Partner Communications to purchase a minimum quantity of electricity or to sign-on a minimum number of consumers. However, the agreement provides for an undertaking by Partner Communications not to sign-on or supply electricity to its customers from any source other than through OPC, so long as a certain number of its customers has not signed-on to OPC in accordance with the agreement. The agreement sets a maximum number of household electricity consumers that can be signed-on to OPC, and a maximum hourly consumption in relation to SMBs, unless it is agreed otherwise by Partner Communications and OPC. The agreement is effective from April 1, 2024 to March 31, 2030, subject to early termination provisions. MOU for construction and operation of the power plant for Intel Israel On March 3, 2024, a subsidiary of OPC entered into the non-binding MoU with Intel, an existing customer of OPC, pursuant to which OPC’s subsidiary will construct and operate a power plant with a capacity of at least 450 MW (and OPC does not expect capacity to exceed 650 MW) (the “Project”). The Project will supply electricity to Intel’s facilities in Kiryat Gat, including an expansion of the facilities which is currently taking place, for a period of 20 years from the commercial operation date. OPC estimates that the construction cost of the Project will be approximately $1.3 - $1.4 million per MW, and that subject to the completion of the development and planning procedures, the Project is expected to reach the construction stage during 2026. For further details about the project, see “Item 4B—Business Overview—Our Businesses—OPC—OPC Description of Operations—Israel—Potential Expansions and Projects in Various Stages of Development.” OPC-Rotem Supply License In March 2024, OPC reported that the EA issued a resolution (the “Supply License Resolution”) regarding the hearing on complementary arrangements and the application of certain regulatory standards to OPC-Rotem (in which OPC has an 80% indirect stake). The Supply License Resolution addresses the application of certain standards to OPC-Rotem, including those regarding deviations from consumption plans submitted by private electricity suppliers, and the award of a supply license to OPC-Rotem (if it applies for one and complies with the conditions for receipt thereof). This is in light of the Israeli Electricity Authority’s stated intention to consolidate the regulation that applies to OPC-Rotem with the regulation applicable to other power producers entering into bilateral transactions with customers, thereby allowing OPC-Rotem to operate in the ISO-NEenergy market in the United States, and started commercial operations between 2008 and 2017. These plantsIsrael in a manner that is similar to that of other electricity generation facilities that are expectedallowed to sell their entire electricity output and green energy certificates (RECs), under existing PPAs over the next 13 to 19 years.conduct bilateral transactions. The Supply License Resolution will come into force on May 1, 2024. Qoros In February 2024, CIETAC issued a final award, not subject to any conditions, in favor of Kenon’s wholly-owned subsidiary Quantum. The tribunal ruled that the Majority Qoros Shareholder and Baoneng Group are obligated to pay Quantum approximately RMB 1.9 billion (approximately $268 million), comprising the purchase price for the acquisition is $172 million, subject to adjustments and the terms and conditions set forth in the agreement. CPVSale Agreement (as adjusted for inflation) of approximately RMB 1.7 billion (approximately $239 million), together with pre-award and post-award interest (which will accrue until payment of the award), legal fees and expenses. Kenon intends to finance approximately 50%seek to enforce this award against the Majority Qoros Shareholder and Baoneng Group since they have failed to perform their payment obligations under the award. In connection with this arbitration, Kenon has obtained a court order freezing assets of the purchase price using external financing, including senior debt including collateralsBaoneng Group at different rankings (primarily comprising equity interests in entities owning directly and indirectly listed and unlisted equity interests in various businesses). Any value that could be realized in respect of and equity rights in the projects. The acquisitionthis award is subject to conditions,significant risks and uncertainties, including the receiptrisk that Quantum may be unable to enforce the award or otherwise collect the amounts awarded or otherwise owing to it, risks relating to any action that may be taken seeking to challenge the award or enforcement of regulatory approvals.the award, risks relating to the process for enforcement of judgments in this proceeding/jurisdiction, risks relating to the financial condition of the parties subject to the award, risks related to the value in respect of any frozen assets pursuant to court orders as well as the risk of competing claims and Kenon’s ability to realize any value in respect of such assets or otherwise in connection with the award, including the risk that Kenon does not realize any value from such assets or any value that is realized is less than amounts owed to Kenon and other risks and uncertainties which could impact Quantum’s ability to realize any value from this award. See “Item 3.D—Risks Related to Our Strategy and Operations—We face risks in relation to our remaining 12% interest in Qoros, including risks relating to collection of the arbitration award in connection with this agreement.” ZIM On March 13, 2023, ZIM’s boardIn February 2024, ZIM completed the acquisition of directors declared a cash dividend of approximately $769 million, or $6.40 per ordinary share, resulting in a cumulative annual dividend amount of approximately 44% of 2022 net income,additional three 10,000 TEU vessels and two 8,500 TEU vessels that ZIM already chartered by exercising an option to be paid on April 3, 2023, to holders of the ordinary sharesacquire them, so as of March 24, 2023. Since the foregoing declared dividend amount per ordinary share constitutes more than 25% of the1, 2024, ZIM owned 14 vessels in ZIM’s ordinary share price on the declaration date (March 13, 2023), per the instructions of the NYSE, the ex-dividend date with respect to this dividend distribution will be April 4, 2023. Kenon expects to receive $159 million ($151 million net of tax).operated fleet.
Our consolidated financial statements for the years ended December 31, 20222023 and 20212022 are comprised of OPC, and the results of our associated company.companies. For a comparison of Kenon’s operating results for the fiscal year ended December 31, 20212022 with the fiscal year ended December 31, 2020,2021, please see Item 5.A of Kenon’s Annual Report on Form 20-F for the fiscal year ended December 31, 2021.2022. Kenon’s consolidated results of operations from its operating companies essentially comprise the consolidated results of OPC. Our share of the results of ZIM (and CPV’s associated companies) is reflected under results from associated companies. Year Ended December 31, 20222023 Compared to Year Ended December 31, 20212022 The following tables set forth summary information regarding our operating segment results for the years ended December 31, 20222023 and 2021.2022.
| | | Year Ended December 31, 2022 | | | Year Ended December 31, 2023 | | | | | | | | | | | | | | | | | | | | | | | | | | | | | | | | | | | | | | | | | | | | | (in millions of USD, unless otherwise indicated) | | | (in millions of USD, unless otherwise indicated) | | | Revenue | | | 517 | | | | 57 | | | | — | | | | — | | | | 574 | | | | 619 | | | | 73 | | | | — | | | | — | | | | 692 | | | Depreciation and amortization | | | (47 | ) | | | (16 | ) | | | — | | | | — | | | | (63 | ) | | | (66 | ) | | | (25 | ) | | | — | | | | — | | | | (91 | ) | | Financing income | | | 10 | | | | 25 | | | | — | | | | 10 | | | | 45 | | | | 6 | | | | 6 | | | | — | | | | 27 | | | | 39 | | | Financing expenses | | | (42 | ) | | | (7 | ) | | | — | | | | (1 | ) | | | (50 | ) | | | (48 | ) | | | (17 | ) | | | — | | | | (1 | ) | | | (66 | ) | | Share in profit of associated companies | | | — | | | | 85 | | | | 1,033 | | | | — | | | | 1,118 | | | | Share in profit/(loss) of associated companies | | | | — | | | | 66 | | | | (266 | ) | | | — | | | | (200 | ) | | Losses related to ZIM | | | | — | | | | — | | | | (1 | ) | | | — | | | | (1 | ) | | Profit / (Loss) before taxes | | | 24 | | | | 61 | | | | 305 | | | | (2 | ) | | | 388 | | | | 49 | | | | 17 | | | | (267 | ) | | | 15 | | | | (186 | ) | | Income tax (expense)/benefit | | | | | | | | | | | | | | | | | | | | | | | Income tax expense | | | | | | | | | | | | | | | | | | | | | | | Profit / (Loss) from continuing operations | | | | | | | | | | | | | | | | | | | | | | | | | | | | | | | | | | | | | | | | | Segment assets(2) | | | 1,504 | | | | 553 | | | | — | | | | 636 | | | | 2,693 | | | | 1,673 | | | | 1,103 | | | | — | | | | 629 | | | | 3,405 | | | Investments in associated companies | | | | | | | | | | | | | | | | | | | | | | | | | | | | | | | | | | | | | | | | | | Segment liabilities | | | | | | | | | | | | | | | | | | | | | | | | | | | | | | | | | | | | | | | | |
_________________________________________________________________________
| (1) | Includes the results of Kenon’s, Qoros’ and IC Power’s holding company (including assets and liabilities) and general and administrative expenses. |
| (2) | Excludes investments in associates. |
| | | Year Ended December 31, 2021 | | | Year Ended December 31, 2022 | | | | | | | | | | | | | | | | | | | | | | | | | | | | | | | | | | | | | | | | | | | | | | | | | | | | | | | | | (in millions of USD, unless otherwise indicated) | | | (in millions of USD, unless otherwise indicated) | | | Revenue | | | 437 | | | | 51 | | | | — | | | | — | | | | 488 | | | | 517 | | | | 57 | | | | — | | | | — | | | | 574 | | | Depreciation and amortization | | | (44 | ) | | | (13 | ) | | | — | | | | (1 | ) | | | (58 | ) | | | (47 | ) | | | (16 | ) | | | — | | | | — | | | | (63 | ) | | Financing income | | | 3 | | | | — | | | | — | | | | — | | | | 3 | | | | 10 | | | | 25 | | | | — | | | | 10 | | | | 45 | | | Financing expenses | | | (119 | ) | | | (25 | ) | | | — | | | | — | | | | (144 | ) | | | (42 | ) | | | (7 | ) | | | — | | | | (1 | ) | | | (50 | ) | | Losses related to Qoros | | | — | | | | — | | | | — | | | | (251 | ) | | | (251 | ) | | | Share in (losses)/profit of associated companies | | | — | | | | (11 | ) | | | 1,261 | | | | — | | | | 1,250 | | | | (Loss) / Profit before taxes | | | (57 | ) | | | (61 | ) | | | 1,261 | | | | (263 | ) | | | 880 | | | | Income tax benefit/(expense) | | | | | | | | | | | | | | | | | | | | | | | (Loss) / Profit from continuing operations | | | | | | | | | | | | | | | | | | | | | | | Gains related to ZIM | | | | — | | | | — | | | | (728 | ) | | | — | | | | (728 | ) | | Share in profit of associated companies | | | | — | | | | 85 | | | | 1,033 | | | | — | | | | 1,118 | | | Profit / (Loss) before taxes | | | | 24 | | | | 61 | | | | 305 | | | | (2 | ) | | | 388 | | | Income tax expense | | | | | | | | | | | | | | | | | | | | | | | Profit / (Loss) from continuing operations | | | | | | | | | | | | | | | | | | | | | | Segment assets(2) | | | 1,512 | | | | 431 | | | | — | | | | 227 | | | | 2,170 | | | | 1,504 | | | | 553 | | | | — | | | | 636 | | | | 2,693 | | | Investments in associated companies | | | — | | | | 545 | | | | 1,354 | | | | — | | | | 1,899 | | | | | | | | | | | | | | | | | | | | | | | Segment liabilities | | | | | | | | | | | | | | | | | | | | | | | | | | | | | | | | | | | | | | | | |
_________________________________________
| (1) | Includes the results of Kenon’s, Qoros’ and IC Power’s holding company (including assets and liabilities) and general and administrative expenses. |
| (2) | Excludes investments in associates. |
Currency fluctuations in the USD/NIS exchange rate on the translation of OPC’s results from NIS into USD did not have a significanthad an impact on the results of 20222023 versus 20212022 discussed below. Revenues Our revenues increased by $86$118 million to $692 million for the year ended December 31, 2023 from $574 million for the year ended December 31, 2022 from $488 million for the year ended December 31, 2021.2022. The table below sets forth OPC’s revenue for 20222023 and 2021,2022, broken down by country. | | | For the year ended
December 31, | | | For the year ended
December 31, | | | | | | | | | | | | | | | | | | | | | | | | | Israel | | | 517 | | | | 437 | | | | 619 | | | | 517 | | | U.S. | | | 57 | | | | 488 | | | | 73 | | | | 57 | | | Total | | | 574 | | | | 488 | | | | 692 | | | | 574 | |
OPC’s revenue increased by $118 million in 2023 as compared to 2022. Set forth below is a discussion of significant changes in revenue between 2023 and 2022. OPC’s revenue from the sale of electricity to private customers derivesis derived from electricity sold at the generation component tariffs, as published by the EA, with some discount. Accordingly, changes in the generation component tariffs generally affect the prices paid under PPAsPower Purchase Agreements by customers of OPC-Rotem and OPC-Hadera. The weighted-average generation component tariff effective February 1, 2022, as published by the EA,in 2023 was NIS 0.286930.53 per kWh,KW hour, which wasis approximately 13.6%4% higher than the weighted-average generation component tariff in 2021 of NIS 0.2526 per kWh. In April 2022, due to a reduction in excise tax on use of coal and to combat the high cost of living, the EA published a new weighted average generation component tariff effective May 1, 2022 of NIS 0.276429.27 per kWh, whichKW hour.
Set forth below is approximately 3.7% lower thana discussion of changes in the rate effected on February 1, 2022. Subsequent to that,key components in August 2022, as a result of rising energy cost exacerbated by the conflict in Ukraine, the EA published a new weighted average generation component tariff effective August 1, 2022 of NIS 0.314 per kWh, which is approximately increase of 13.6%revenue for 2023 as compared to the rate effected on May 1, 2022.
| • | Revenue from sale of energy to private customers in Israel—Increased by $25 million in 2023 as compared to 2022. Excluding the impact of translating OPC’s revenue from NIS to USD, such revenues increased by $57 million primarily as a result of (i) an increase of $49 million from an increase in customer consumption and (ii) an increase of $24 million from the consolidation of results of the Kiryat Gat Power Plant which was consolidated starting in Q2 2023, partially offset by (iii) a decrease of $9 million as a result of the change in demand hour brackets; |
| • | Revenue from private customers in respect of infrastructure services—Increased by $36 million in 2023 as compared to 2022. Excluding the impact of translating OPC’s revenue from NIS to USD, such revenues increased by $45 million, primarily as a result of (i) an increase of $26 million from an increase in the infrastructure tariff, (ii) an increase of $12 million from an increase in customer consumption and (iii) an increase of $8 million from the consolidation of results of the Kiryat Gat Power Plant beginning in Q2 2023; |
| • | Revenue from sale of energy to private customersthe System Operator and to other suppliers—Increased by $16 million in Israel –2023 as compared to 2022. Excluding the impact of exchange rate fluctuations,translating OPC’s revenue from NIS to USD, such revenues increased by $73$18 million, primarily as a result of (i) an $49increase of $18 million increasefrom the commencement of commercial operations of Tzomet Power Plant in the generation component tariffJune 2023 and (ii) $24an increase of $4 million from the consolidation of results of the Kiryat Gat Power Plant beginning in Q2 2023; |
| • | Revenue from capacity payments— Increased by $16 million in 2023 as compared to 2022, primarily as a result of an increasethe commencement of commercial operations of Tzomet Power Plant in customer consumption.June 2023; and |
| • | Other revenue— Increased by $5 million in Israel – Revenue from2023 as compared to 2022, primarily as a result of the commencement of commercial operations of Gnrgy amounted to $12 millionTzomet Power Plant in 2022 and reflects the commencement of operations of Gnrgy, which is engaged in the business of charging services for electric vehicles.June 2023. |
Cost of Sales and Services (excluding Depreciation and Amortization) Our cost of sales (representing OPC’s cost of sales) increased by $80$77 million to $494 million for the year ended December 31, 2023, as compared to $417 million for the year ended December 31, 2022, as compared to $337 million for the year ended December 31, 2021.2022. The following table sets forth OPC’s cost of sales for 20222023 and 2021.2022. | | | For the year ended
December 31, | | | For the year ended
December 31, | | | | | | | | | | | | | | | | | | | | | | | | | Israel | | | 385 | | | | 312 | | | | 453 | | | | 385 | | | U.S. | | | 32 | | | | 25 | | | | 41 | | | | 32 | | | Total | | | 417 | | | | 337 | | | | 494 | | | | 417 | |
| • | Natural gas and diesel oil consumption in Israel – Excluding the impact of exchange rate fluctuations, such costs increased by $11 million primarily as a result of (i) an $18 million increase due to the increase in gas prices as a result of an increase in the generation component tariff and movements in the USD/NIS exchange rate and (ii) compensation paid in 2021 (reducing costs in that year) to OPC-Rotem and OPC-Hadera of $5 million due to the delay in the commercial operation of the Karish reservoir. These increases were partially offset by a decrease of $11 million due to lower consumption of natural gas as a result of maintenance at the OPC-Rotem power plant.Set forth below is a discussion of significant changes in cost of sales between 2023 and 2022. |
| • | Expenses for acquisition of energy• Natural gas and diesel oil consumption in Israel— Excluding the impact of exchange rate fluctuations, such cost of sales increased by $57 million in 2022, as compared to 2021 primarily as a result of (i) a $37 million increase reflecting the commencement of virtual supply in 2021 and (ii) a $20 million increase due to maintenance at the OPC-Rotem power plant.—Increased by $23 million in 2023 as compared to 2022. Excluding the impact of translating these costs from NIS to USD, such costs increased by $37 million primarily due to (i) an increase of $11 million from the consolidation of results of the Kiryat Gat Power Plant beginning in Q2 2023, (ii) the commencement of commercial operations of Tzomet Power Plant in June 2023, (iii) an increase of $14 million due to an increase in the generation component and the USD/NIS exchange rate and (iv) an increase of $14 million as a result of an increase in the quantity of gas consumed, partially offset by (v) a decrease in gas expenses of $14 million as a result of the commencement of delivery of gas from Energean from Q2 2023; |
| • | Other expenses — Cost from the commencement of operations of Gnrgy amounted to $9•Expenses for infrastructure services in Israel—Increased by $36 million in 2023 as compared to 2022. Excluding the impact of translating these costs from NIS to USD, such costs increased by $45 million primarily as a result of (i) an increase of $26 million linked to the infrastructure tariff, (ii) an increase of $12 million due to an increase in customer consumption and (iii) an increase of $8 million from the consolidation of results of the Kiryat Gat Power Plant beginning in Q2 2023; and •Operating expenses and other expenses—Increased by $20 million in 2023 as compared to 2022. Excluding the impact of translating these costs from NIS to USD, such costs increased by $22 million primarily as a result of (i) the commencement of commercial operations of Tzomet Power Plant in June 2023 and (ii) the consolidation of results of the Kiryat Gat Power Plant beginning in Q2 2023. |
Depreciation and Amortization Our depreciation and amortization expenses (representing OPC’s depreciation and amortization expenses) increased by $5$28 million to $91 million for the year ended December 31, 2023 from $63 million for the year ended December 31, 2022 from $53 million for the year ended December 31, 2021.2022. Selling, General and Administrative Expenses Our selling, general and administrative expenses consist of payroll and related expenses, depreciation and amortization, and other expenses. Our selling, general and administrative expenses (excluding depreciation and amortization) increaseddecreased to $85 million for the year ended December 31, 2023, as compared to $100 million for the year ended December 31, 2022, as compared to $76 million for the year ended December 31, 2021.2022. This increasedecrease was primarily driven by an increasea decrease in OPC’s selling, general and administrative expenses. OPC’s selling, general and administrative expenses increaseddecreased by $22$13 million, or 34%15%, to $73 million for the year ended December 31, 2023 from $86 million for the year ended December 31, 2022 from $64 million for the year ended December 31, 2021 primarily reflecting an increase in expenses for wages in respect of projects in Israel, in the amount of about $5 million (including an increase of about $2 million in respect of non-cash equity remuneration expenses), in light of, among other things, expansion of OPC’s activities. Financing Expenses, Net Our financing expenses, net, decreasedincreased by $136$22 million to $27 million for the year ended December 31, 2023, as compared to $5 million for the year ended December 31, 2022, as compared to $141 million for the year ended December 31, 2021.2022. This decreaseincrease was primarily driven by a decreaseincrease in OPC’s financing expenses, net. OPC’s financing expenses, net decreasedincreased by approximately $127$39 million to $53 million in 2023 from $14 million in 2022, from $141 million in 2021. Finance expenses, net decreased by $127 million in 2022, as compared to 2021 primarily due to (i) a non-recurring interest expense in 2021 of $75 million as a result of early repayment of OPC-Rotem’s project financing debt in October 2021, (ii) a $16 million decreasean increase in interest expense in respectrelating to loans for the Kiryat Gat Power Plant and the Mountain Wind project of OPC-Rotem’s senior debt,$7 million and $4 million, respectively, and (ii) non-recurringan increase in interest expense in 2021from the commencement of $12commercial operations of Tzomet Power Plant of $8 million, due to the purchase of the remaining minority stake in a CPV subsidiary and (iv)partially offset by an increase of about $30 million from financingin interest income from bank deposits.
Share in Losses/(Profit)Profit/(Losses) of Associated Companies, Net of Tax Our share in profitlosses of associated companies, net of tax decreasedincreased to approximately $1,118$200 million for the year ended December 31, 2022,2023, compared to share of profit of associated companies, net of tax of approximately $1,250$1,118 million for the year ended December 31, 2021.2022. Set forth below is a discussion of losses/(profit) for our associated companies, net of tax. ZIM The following table sets forth summary information regarding the results (100%) of operations of ZIM, our equity-method business for the periods presented: | | | Year Ended
December 31, 2022 | | | Year Ended
December 31, 2021 | | | Year Ended
December 31, 2023 | | | Year Ended
December 31, 2022 | | | | | (in millions of USD) | | | (in millions of USD) | | Revenue | | | 12,562 | | | | 10,729 | | | | 5,162 | | | | 12,562 | | | Operating expenses and cost of services | | | 4,765 | | | | 3,906 | | | | (3,885 | ) | | | 4,765 | | | Operating profit | | | 6,136 | | | | 5,816 | | | | Profit before taxes on income | | | 6,027 | | | | 5,659 | | | | Operating (loss)/profit | | | | (2,511 | ) | | | 6,136 | | | (Loss)/profit before taxes on income | | | | (2,816 | ) | | | 6,027 | | | Income tax expense | | | | | | | | | | | | | | | | | Profit for the period | | | | | | | | | | | (Loss)/profit for the period | | | | | | | | | | Adjusted EBITDA(1) | | | 7,541 | | | | 6,597 | | | | 1,049 | | | | 7,541 | | Share of Kenon in total comprehensive income | | | 1,024 | | | | 1,261 | | | | (266 | ) | | | 1,024 | | Book value of ZIM investment in Kenon’s books | | | 427 | | | | 1,354 | | | | — | | | | 427 | |
_______________________________________
| (1) | Adjusted EBITDA is a non-IFRS financial measure that ZIM defines as net profit adjusted to exclude financial expenses (income), net, income taxes, depreciation and amortization in order to reach EBITDA, and further adjusted to exclude non-cash charter hire expenses, capital gains (losses) beyond the ordinary course of business and expenses related to contingencies. Adjusted EBITDA is a key measure used by ZIM’s management and board of directors to evaluate ZIM’s operating performance. Accordingly, ZIM believes that Adjusted EBITDA provides useful information to investors and others in understanding and evaluating ZIM’s operating results and comparing its operating results between periods on a consistent basis, in the same manner as ZIM’s management and board of directors. The table below sets forth a reconciliation of ZIM’s net (loss)/profit, to EBITDA and Adjusted EBITDA for each of the periods indicated. |
| | | Year Ended
December 31, 2022 | | | Year Ended
December 31, 2021 | | | | | (in millions of USD) | | Net profit | | | 4,629 | | | | 4,649 | | | Financing expenses, net | | | 109 | | | | 157 | | | Income tax expense | | | 1,398 | | | | 1,010 | | | Depreciation and amortization | | | | | | | | | EBITDA | | | | | | | | | Non-cash charter hire expenses(1) | | | — | | | | (1 | ) | | Capital gains, beyond the ordinary course of business | | | (1 | ) | | | — | | | Expenses related to contingencies | | | | | | | | | Adjusted EBITDA | | | 7,541 | | | | 6,597 | |
__________________________________________
(1) | Mainly related to amortization of deferred charter hire costs, recorded in connection with the 2014 restructuring. Following the adoption of IFRS 16 on January 1, 2019, part of the adjustments are recorded as amortization of right-of-use assets.
|
| | | Year Ended
December 31, 2023 | | | Year Ended
December 31, 2022 | | | | | (in millions of USD) | | | Net (loss)/profit for the period | | | (2,688 | ) | | | 4,629 | | | Depreciation and amortization | | | 1,472 | | | | 1,396 | | | Financing expenses, net | | | 305 | | | | 109 | | | Income tax (benefits)/expense | | | | | | | | | | EBITDA | | | | | | | | | | Impairment of assets | | | 2,063 | | | | - | | | Capital losses/(gains) beyond the ordinary course of business | | | 20 | | | | (1 | ) | | Expenses related to legal contingencies | | | 5 | | | | 10 | | | Adjusted EBITDA | | | | | | | | |
Pursuant to the equity method of accounting, our share in ZIM’s results of operations was a loss of approximately $266 million for the year ended December 31, 2023 and a profit of approximately $1,033 million and $1,261 million for the yearsyear ended December 31, 2022 and 2021.2022. Set forth below is a summarydiscussion of ZIM’s consolidated results for the year ended December 31, 20222023 and 2021:2022. The number of TEUs carried for the year ended December 31, 20222023, decreased by 10199 thousand TEUs, or 2.9%, from 3,481 thousand TEUs for the year ended December 31, 2021 to 3,380 thousand TEUs for the year ended December 31, 2022, to 3,281 thousand TEUs for the year ended December 31, 2023, primarily driven by increased number of blank voyages across all trades, mainly due to port congestion. shifting to slots purchase instead of vessel deployment in the Pacific North West and in India—Mediterranean / North Europe sub-trades, along with the termination of services in the Pacific South West, South East Asia and Asia—Australia sub-trades, as well as due to a decrease in vessel utilization in the Atlantic trade zone, and in the dominant leg of the Pacific trade zone, as a result of weak consumers demand. On the other hand, the above was partially offset by changes in the operation mode of the lines (an increase in Intra-Asia and Cross Suez trades, partially offset by a decreaseby: (i) deploying larger vessels in the Pacific All Water sub-trade, (ii) launching new services in the Latin America trade zone, (iii) an increase in the number of voyages across most trades, as ports congestion was largely relieved during 2023, and Atlantic trades) and(iv) an increase in vessel utilization (an increase in Intra-Asia and Latin America trades, partially offset by a decrease inof the other trades). . counter-dominant leg of the Pacific trade zone. The average freight rate per TEU carried for the year ended December 31, 2022, increased2023 decreased by $454,$2,037, or 16.3%62.9%, from $2,786 for the year ended December 31, 2021 to $3,240 for the year ended December 31, 2022. ZIM’s revenues increased by $1.9 billion, or 17.8%, from $10.7 billion2022, to $1,203 for the year ended December 31, 2021 to $12.6 billion2023.
ZIM’s revenues decreased by $7,399 million, or 58.9%, from $12,561.6 million for the year ended December 31, 2022, to $5,162.2 million for the year ended December 31, 2023, primarily driven by an increase(i) a decrease of $7,003.8 million in revenuesrevenue from containerized cargo, reflecting increasesmainly due to the decrease in bothaverage freight rates.rates and (ii) a decrease of $485.7 million in income from demurrage, partially offset by an increase of $226.1 million in income from non-containerized cargo (mainly related to vehicle shipping services). ZIM’s operating expenses and cost of services for the year ended December 31, 2022 increased by $0.9 billion,2023 decreased $879.4 million, or 22.0%(18.5%), from $3.9 billion for the year ended December 31, 2021 to $4.8 billion$4,764.5 million for the year ended December 31, 2022 to $3,885.1 million for the year ended December 31, 2023, primarily driven by (i) an increasea decrease of $695.0$335.9 million (94.0%(23.4%) in bunker expenses, (ii) an increase of $103.6 million (40.5%) in port expenses (iii) an increase of $101.6 million (5.4%) in cargo handling expenses, and (iv) an increase of $45.2 million (26.4%) in cost of related services and sundry, partially offset by (v) a decrease of $131.7$319.4 million (24.8%(80.1%) in slot purchases and hire of vessels, and containers.(iii) a decrease of $310.1 million (15.7%) in cargo handling expenses, partially offset by (iv) an increase of $141.7 million (39.5%) in port expenses. ZIM publishes its resultson the SEC’sSEC’s website at http://www.sec.gov. This website, and any information referenced therein, is not incorporated by reference herein. CPV As a result of the completion of the acquisition of CPV in January 2021, Kenon’s share of results in CPV’s associated companies was a profit of approximately $66 million for the year ended December 31, 2023 compared to approximately $85 million for the year ended December 31, 2022 compared to loss of approximately $11 million for the year ended December 31, 2021.2022. The table below sets forth OPC’s share of profit of associated companies, net, which consists of the six operating plants in which CPV has interests, which are accounted for as associated companies. | | | | | | | | | | | | | | | | (in millions of USD) | | | Share in profits/(losses) of associated companies, net | | | 85 | | | | (11 | ) |
| | | | | | | | | | | | | | | | (in millions of USD) | | | Share in profits of associated companies, net | | | 66 | | | | 85 | |
The result for the year includes losses on changes in fair value of derivative financial instruments totaling $2 million. As at December 31, 2022,2023, OPC’s proportionate share of net debt (including interest payable) of CPV associated companies was approximately $865$839 million.
Set forth below is information regarding the revenues from electricity sales and availability and the rate of CPV's total revenue for associated companies (on a proportionate basis, based on the rate of CPV holdings): | Presentation method in the CPV's consolidated financial statements | | Revenues from electricity sales and availability (in $ million) | | | Rate of the total revenues of the group and included companies (proportionately according to the percentage of holding) * | | | Included and consolidated companies | | | 458 | | | | 40 | % |
*Rate of the total revenues in the consolidated plus the group's share in the revenues of affiliated companies. For further details of the performance of associated companies of CPV, refer to OPC’s immediate report published on the TASE on March 19, 202312, 2024 and the convenience English translations furnished by Kenon on Form 6-K on March 19, 2023.12, 2024. Such report published on the TASE is not incorporated by reference herein. Income Tax Expenses Our income tax expense for the year ended December 31, 20222023 was $38$25 million, compared to $5$38 million for the year ended December 31, 2021.2022. ProfitProfit/(loss) For the Year
As a result of the above, our profitloss for the year from continuing operations amounted to $211 million for the year ended December 31, 2023, compared to a profit for the year of $350 million for the year ended December 31, 2022, compared to $875 million for the year ended December 31, 2021.2022. | B. | Liquidity and Capital Resources |
Kenon’s Liquidity and Capital Resources As of December 31, 2022,2023, Kenon had approximately $638$634 million in cash on a stand-alone basis and no material debt. Kenon’s stand-alone cash position includes cash and cash equivalents and other treasury management instruments. Kenon seeks to generate attractive returns on its cash and cash equivalents, and seeks to use treasury products with credit ratings that are at least rated investment grade. Kenon’s sources of liquidity include dividends from and sales of interests in its subsidiaries and associated companies. Accordingly, the dividend policies of and dividends paid by ZIM and OPC impact Kenon’s liquidity. ZIM Dividends ZIM has announced a dividend policy, which was recently amended in August 2022, to distribute a dividend to shareholders on a quarterly basis at a rate of approximately 30% of the net income derived during such fiscal quarter with respect to the first three fiscal quarters of the year, while the cumulative annual dividend amount to be distributed by ZIM (including the interim dividends paid during the first three fiscal quarters of the year) will total 30-50% of the annual net income, and provided that such distribution would not be detrimental to ZIM’s cash needs or to any plans approved by ZIM’s board of directors. ZIM has stated that any dividends would take into account various factors including, inter alia, ZIM’s profits, investment plan, financial position, the progress relating to ZIM’s strategy plan, the conditions prevailing in the market and additional factors it deems appropriate. While ZIM has indicated that it initially intends to distribute 30-50% of its annual net income, the actual payout ratio could be anywhere from 0% to 50% of its net income, and may fluctuate depending on its cash flow needs and such other factors. During 2022, ZIM paid cash dividends of approximately $3.30 billion for the first three quarters of the year, and in March 2023, ZIM declared a Q4 divided in respect of 2022 of $769 million, payableor $6.40 per ordinary share on April 3, 2023, pursuant to which Kenon expects to receive $151 million (net of taxes). During 2021, ZIM paid a special cash dividend of approximately $237 million, and a cash dividend of approximately $299 million.4, 2023.
In 2022,2023, Kenon received approximately $766$159 million in cash dividends from ZIM (excluding the Q4 dividend which was declared in March 2023), compared to dividends of $141 million in 2021. In addition, Kenon expects to receive $151 million in respect of the Q4 dividend declared in March 2023, which is payable on April 3, 2023. ZIM. OPC Dividends In 20212022 and 2022,2023, OPC did not distributepay dividends to its shareholders. As of December 31, 2022, OPC had no balance of distributable earnings. According to OPC’s dividend policy, adopted in July 2017, a dividend will be distributed that is equal to at least 50% of OPC’s after-tax net income in the calendar year preceding the dividend distribution date. In addition,However, OPC has announced that in light of the growth strategy and expansion of operations targets adopted by OPC as well as the need to maintain OPC’s financial strength and adequate leveraging ratios, and noting the economic environment in which OPC operates, in March 2024, the board of OPC made a decision to suspend OPC’s dividend distribution policy (adopted in 2017) for a period of two years from the decision date. At the end of the suspension period, OPC's board will reconsider the applicability of the dividend distribution policy. OPC’s board has the power to assess and change this resolution at any time, and/or to decide the distribution of dividends, taking into account, among other things, relevant circumstances, provisions of law and the above considerations, all as OPC’s board will deem appropriate at its discretion. The financing arrangements theof OPC’s group companies (including CPV) also include restrictions on the distributiondistributions by the OPC’s investees. Dividends Paid by Kenon In November 2021, Kenon’s board of directors approvedwe paid a cash dividend of $3.50 per share (an aggregate amount of approximately $189 million) to Kenon’s shareholders of record as of the close of trading on January 19, 2022, paid on January 27, 2022.million ($3.50 per share). In 2022, we received the requisite shareholder approval and the approval of the High Court of the Republic of Singapore to return share capital amounting todistributed approximately $552 million to shareholders ($10.25 per share). The distribution was paid on July 5, 2022. Following this capital reduction, Kenon’s share capital is approximately $50 million. In March 2023, Kenon’s board of directors approved an interim cashwe paid a dividend of approximately $150 million ($2.79 per share). In March 2024, we announced a dividend of approximately $200 million ($3.80 per share) relating to the year ending December 31, 2023,2024 payable to Kenon’s shareholders of record as of the close of trading onin April 10, 2023, to be paid on or about April 19, 2023.2024. Share Repurchase Plan
In March 2023, Kenon’s board of directors authorized a share repurchase plan of up to $50 million. For more details onThrough the end of 2023, Kenon repurchased approximately 1.1 million shares for approximately $28 million. Kenon intends to continue making repurchases under this plan. Repurchases under the share repurchase plan see “Item 5. Operatingare subject to the authority of the share purchase authorization which was renewed by shareholders at the 2023 AGM and Financial Reviewwhich will, continue in force until the earlier of the date of the 2024 AGM or the date by which the 2024 AGM is required by law to be held. At this meeting, we intend to seek authorization to renew such authorization. The share repurchase plan may be suspended for periods, modified or discontinued at any time and Prospects—Recent Developments—Kenon—Sharemay not be completed up to the full amount of the share repurchase plan.”
Kenon’s Liquidity Requirements Kenon’s liquidity requirements include investments in its businesses, including OPC, and other investments it may make, as well as holding company costs, as well as dividend payments. In 2023, Kenon used cash mainly for dividends and administrative expenses. We believe that Kenon’s working capital (on a stand-alone basis) is sufficient for its present requirements. Our principal needs for liquidity are expenses related to our day-to-day operations, as well asoperations. We also require capital for investments that we choose to make in our existing businesses whichand potentially new acquisitions. For example, in 2022, and 2021 mainly consisted ofKenon made investments in OPC in connection with an equity capital raise by OPC. OPC’s strategy contemplates continuing development of projects, particularly at CPV, and potentially further acquisitions which will require significant financing, via equity or debt facilities, to further its development. We may, in furtherance of the development of our businesses, make further investments, via debt or equity financings, in our businesses and we may make investments in new businesses. See “Item 4.B—Information on the Company—Business OverviewOverview.”. The cash resources on Kenon’s balance sheet may not be sufficient to fund additional investments that we deem appropriate in our businesses. As a result, Kenon may seek additional liquidity from its businesses (via dividends, loans or advances, or the repayment of loans or advances to us, which may be funded by sales of assets or minority interests in our businesses), or obtain external financing, which may result in dilution of shareholders (in the event of equity financing) or additional debt obligations for the company (in the event of debt financing). Consolidated Cash Flow Statement Set forth below is a discussion of our cash and cash equivalents and our cash flows as of and for the years ended December 31, 20222023 and 2021. Year Ended December 31, 20222023 Compared to Year Ended December 31, 20212022 Cash and cash equivalents increased to approximately $697 million for the year ended December 31, 2023, as compared to approximately $535 million for the year ended December 31, 2022, as compared to approximately $475 million for the year ended December 31, 2021, primarily as a result of improved results in ZIM.2022. The following table sets forth our summary cash flows from our operating, investing and financing activities for the years ended December 31, 20222023 and 2021:2022: | | | | | | | | | | | | | | | | | | | | | | | | | (in millions of USD) | | | (in millions of USD) | | | Continuing operations | | | | | | | | | | | | | | Net cash flows provided by operating activities | | | | | | | | | | | | | | OPC | | | 63 | | | | 119 | | | | 135 | | | | 63 | | | Other | | | 708 | | | | 121 | | | | 142 | | | | 708 | | | Total | | | 771 | | | | 240 | | | | 277 | | | | 771 | | | Net cash flows used in investing activities | | | (203 | ) | | | (205 | ) | | | (432 | ) | | | (203 | ) | | Net cash flows provided by financing activities | | | (494 | ) | | | 147 | | | | Net cash flows provided by/(used in) financing activities | | | | 324 | | | | (494 | ) | | Net change in cash from continuing operations | | | 74 | | | | 182 | | | | 169 | | | | 74 | | | Cash—opening balance | | | 475 | | | | 286 | | | | 535 | | | | 475 | | | Effect of exchange rate fluctuations on balances of cash and cash equivalents | | | | | | | | | | | | | | | | | Cash—closing balance | | | 535 | | | | 475 | | | | 697 | | | | 535 | |
Cash Flows Provided by Operating Activities
Net cash flows from operating activities increaseddecreased to $277 million for the year ended December 31, 2023 compared to $771 million for the year ended December 31, 2022 compared to $240 million for the year ended December 31, 2021.2022. The increasedecrease is primarily driven by decrease in dividends received from associated companies,ZIM, offset with a decreasean increase in OPC’s cash provided by operating activities as discussed below. Cash flows provided by OPC’s operating activities decreasedincreased to $135 million for the year ended December 31, 2023 from $63 million for the year ended December 31, 2022, from $119 million for the year ended December 31, 2021, primarily as a result of decrease(i) an increase in income on a cash basis, in the amount of approximately $58 million, and (ii) an increase in OPC’s working capital, of $31 million, decrease in the current operating activitiesamount of $11 million and a decrease in dividend income from associated companies of $9approximately $18 million. Cash Flows Used in Investing Activities Net cash flows used in our investing activities decreasedincreased to approximately $203$432 million for the year ended December 31, 2022,2023, compared to cash flows used in investing activities of approximately $205$203 million for the year ended December 31, 2021.2022. This decreaseincrease in cash flow used was primarily driven by Kenon’s purchaseOPC’s acquisitions of other investments of $651 million.new projects as discussed below. This is offset primarily by the proceeds from salesa release of interest in ZIM of $464 million and an increase in OPC’s investing activitiesshort term deposit as discussed below. Cash flows used in OPC’s investing activities increased to $594 million for the year ended December 31, 2023 from $329 million for the year ended December 31, 2022 from $256 million for2022. Most of the increase in the cash used in investing activities in the year ended December 31, 2021, primarily as a result of2023 stems from acquisition of intangible assetsthe Kiryat Gat Power Plant, for a consideration of $9approximately $151 million, and the Mountain Wind project, for a consideration of approximately $172 million. In addition, the investments in property, plant and equipment in the U.S. increased by approximately $111 million and OPC provided a subordinated loan to an associated company in the U.S., in the amount of approximately $24 million. The increase was partly offset by a release of short-term deposits, in the amount of approximately $34 million, which were deposited in 2022. In addition, there was an increase of approximately $47 million, in respect of release of collateral, net, relating to hedging electricity margins in the CPV Group, and there was a decrease, in the amount of approximately $32 million, in investments in projectsproperty, plant and equipment in Israel, mainly in connection with commercial operation of $35 million and short-term deposits madeTzomet at the end of $36 million.the second quarter of 2023. Cash Flows Provided by the Financing Activities Net cash flows used inprovided by financing activities of our consolidated businesses was approximately $324 million for the year ended December 31, 2023, compared to cash flows used in financing activities of approximately $494 million for the year ended December 31, 2022, compared to cash flows provided by financing activities of approximately $147 million for the year ended December 31, 2021.2022. The net outflowinflow in 20222023 was primarily driven by Kenon’s capital reduction amounting to $10.25 per share ($552repurchase of $28 million in total) to Kenon’s shareholders of record as of the close of trading on June 27, 2022, paid on July 5, 2022 and dividend of $3.50$2.79 per share (an aggregate amount of approximately $189$150 million), to Kenon’s shareholders of record as of the close of trading on January 19, 2022, paid on January 27, 2022,April 19, 2023, offset withby OPC’s inflow, as described below.
Cash flows provided by OPC’s financing activities decreasedincreased to $286$503 million for the year ended December 31, 2022,2023, as compared to $311$286 million used for the year ended December 31, 2021, primarily as2022. Most of the increase in the cash flows provided by financing activities stems from a resultreceipt in the year ended December 31, 2023, in the amount of repaymentsapproximately $125 million, in respect of a swap of shares of transaction and investment with Veridis and long-term loans, in the amounts of approximately $124 million and debenturesapproximately $74 million, for purposes of $76 million. The decrease was partly offset by cash provided to OPCfinancing a transaction for acquisition of the Kiryat Gat Power Plant and a transaction for acquisition of the Mountain Wind project, respectively, taking out a long-term loan in the amount of about NIS 359 million (approximately $99 million), in connection with the commercial operation of the Maple Hill project and for financing construction of projects in the renewable energy segment in the U.S., from thean increase of approximately $33 million, in investments and loans from holders of non-controlling interests in(in the CPV Group and Veridis), from short-term loans and credit agreements in the amount of $46 million.approximately $57 million, and from a receipt, in the amount of approximately $84 million, relating to a commitment of the tax partner in the Maple Hill project. In the year ended December 31, 2023, OPC repaid a loan to the prior holders of the rights in the Kiryat Gat Power Plant, in the amount of approximately $84 million, there was an increase, in the amount of approximately $44 million, in OPC’s repayments to banks and others (mainly in respect of new loans taken out in Israel and the U.S., as detailed above, and in respect of the start of repayment of the senior debt in Tzomet commencing from the fourth quarter of 2023) and there was an increase of approximately $18 million in costs paid in advance in respect of loans (mainly relating to loans in the U.S.). Furthermore, in 2022, OPC raised approximately $225 million from an issuance of shares. Kenon’s Commitments and Obligations As of December 31, 2022,2023, Kenon had consolidated liabilities of $1.5$2 billion, primarily consisting of OPC liabilities. Other than loans from subsidiaries at the Kenon level, we have no outstanding indebtedness or financial obligations and are not party to any credit facilities or other committed sources of external financing. The following discussion sets forth the liquidity and capital resources of each of our businesses. OPC’s Liquidity and Capital Resources As of December 31, 2022, OPC had cash and cash equivalents of $241 million. OPC’s total outstanding consolidated indebtedness was $1,163 million as of December 31, 2022.
OPC’s principal sources of liquidity have traditionally consisted of cash flows from operating activities, short- and long-term borrowings under loan facilities, bond issuances and public and private equity offerings. OPC’s principal needs for liquidity generally consist of capital expenditures related to the development and construction of generation projects (including OPC-Hadera, Tzomet and other projects OPC may pursue), capital expenditures relating to maintenance (e.g., maintenance and diesel inventory), working capital requirements (e.g., maintenance costs that extend the useful life of OPC’s plants) and other operating expenses. OPC believes that its liquidity is sufficient to cover its working capital needs in the ordinary course of OPC’s business. OPC has financed the development of its projects and its acquisitions through equity and debt financing. Set forth below is an overview of equity issuances from 2019 to 20222023 and a description of OPC’s loan facilities and bonds. OPC’s Share Issuances from 2019 to 20222023 In August 2017, OPC completed an initial public offering in Israel, and a listing on the TASE, resulting in net proceeds to OPC of approximately $100 million and Kenon retaining 75.8% stake. In 2019, 2020, 2021 and 2022, OPC issued new shares in multiple offerings: In 2019, OPC issued a total of 11,028,240 new ordinary shares (representing approximately 8% of OPC’s issued and outstanding share capital at the time on a fully diluted basis) in two share issuances, for total cash consideration net of issuance expenses of approximately NIS 272 million (approximately $76 million). As a result of these share issuances, Kenon’s interest in OPC decreased from 75.8% to 69.8%.
In October 2020, OPC issued 11,713,521 new ordinary shares (representing approximately 7.5% of OPC’s issued and outstanding share capital at the time on a fully diluted basis) for total (gross) consideration of NIS 350 million (approximately $103 million) to two institutional investors in a private placement in connection with the acquisition of CPV.
Also in October 2020, OPC issued 23,022,100 new ordinary shares (representing approximately 14.8% of OPC’s issued and outstanding share capital at the time on a fully diluted basis) for a total (gross) consideration of NIS 737 million (approximately $217 million) in a public offering. Kenon was allocated 10,700,200 shares in the public offering for a total purchase price of approximately $101 million.
In January 2021, OPC issued 10,300,000 ordinary shares (representing approximately 5.5% of OPC’s issued and outstanding share capital at the time on a fully diluted basis) in a private placement for a total (gross) consideration of NIS 350 million (approximately $107 million). In September 2021, OPC issued rights to purchase approximately 13 million OPC shares to fund the development and expansion of OPC’s activity in the U.S., with investors purchasing approximately 99.7% of the total shares offered in the rights offering. The gross proceeds from the offering amounted to approximately NIS 329 million (approximately $102 million). Kenon exercised rights for the purchase of approximately 8 million shares for total consideration of approximately NIS 206 million (approximately $64 million), which included its pro rata share and additional rights it purchased during the rights trading period plus the cost to purchase these additional rights. In July 2022, OPC issued 9,443,800 ordinary shares of NIS0.01 par value per share to the public as part of the shelf offering. Gross issuance proceeds amounted to NIS 331 million (approximately $94 million). Kenon took part in the issuance and was issued 3,898,000 ordinary shares for a gross amount of NIS 136 million (approximately $39 million). In September 2022, OPC offered 12,500,000 ordinary shares of NIS 0.01 par value per share to qualified investors as part of private offering. Gross issuance proceeds amounted to NIS 500 million (approximately $141 million). During 2023, OPC did not issue any shares to the public. As a result of these share issuances, Kenon’s interest in OPC is now 54.7%. OPC’s Cash and Material Indebtedness As of December 31, 2022,2023, OPC had cash and cash equivalents of $241$278 million (excluding restricted cash)cash and including debt service reserves of $91 million), restricted cash (used for debt service reserves) of $14$17 million, and total outstanding consolidated indebtedness of $1,163$1,530 million, consisting of $39$170 million of short-term indebtedness, including the current portion of long-term indebtedness, and $1,124$1,360 million of long-term indebtedness. Israel 172As at March 21, 2024, OPC Israel entered into credit facilities with banks (which are used by all OPC group companies in Israel) for an aggregate amount of approximately $69 million, and other binding credit facilities for CPV Group for the purpose of providing guarantees (mainly letters of credit and bank guarantees) amounting to approximately $20 million, to finance the development activity of CPV Group. Furthermore, OPC provided guarantees in respect of binding credit facilities provided to CPV Group for the purpose of providing guarantees and letters of credit at the total amount of approximately $75 million. The undertakings under such agreements include customary obligations, including restrictions on pledges, compliance with financial ratios and maintaining liquidity in accordance with certain criteria, cross default provisions, restrictions on the distribution of dividends and payments to shareholders, restrictions on changes in OPC’s holdings in OPC Israel, changes in control in OPC-Hadera, and in OPC’s holdings in Tzomet and OPC-Rotem, restrictions on debt incurred by OPC Power Plants (except for immaterial amounts) and others. OPC has debt (comprising its debentures and project financing) with an aggregate amount of approximately NIS 3.6 billion (approximately $993 million), which is subject to cross-default provisions.
Furthermore, OPC Israel entered into non-binding credit facilities (for the use of all OPC group companies in Israel), which are mainly used for the purpose of letters of credit and bank guarantees (for example, to the EA, the System Operator, etc.). The following table sets forth selected information regarding OPC’s principal outstanding short-term and long-term debt, as of December 31, 20222023 (excluding CPV): | | Outstanding
Principal
Amount as
of December
31, 2022* ($ millions) | | Interest Rate
($ millions) | | | | | Outstanding
Principal
Amount as
of December
31, 2023* ($ millions) | | Interest Rate
($ millions) | | | | | | | | | | | OPC-Hadera: | | | | | | | | | | | | | | | Financing agreement(1) | 194 | | 2.4%-3.9%, CPI linked (2/3 of the loan) 3.6%-5.4% (1/3 of the loan) | | September 2037 | | Quarterly principal payments to maturity, commencing 6 months following commercial operations of OPC-Hadera power plant | 180 | | 2.4%-3.9%, CPI linked (2/3 of the loan) 3.6%-5.4% (1/3 of the loan) | | September 2037 | | Quarterly principal payments to maturity, commencing 6 months following commercial operations of OPC-Hadera power plant | | Tzomet: | | | | | | | | | | | | | | | Financing agreement(2) | 150 | | CPI or USD-linked with interest equal to prime plus margin of 0.5-1.5% - agreement includes provisions for conversion of interest from variable to CPI-linked debenture interest plus margin of 2-3% | | Earliest of 19 years from commercial operations date of Tzomet power plant and 23 years from the signing date, but no later than December 31, 2042 | | Quarterly principal payments to maturity, commencing close to the end of the first or second quarter following commercial operations of the Tzomet power plant | 315 | | CPI or USD-linked with interest equal to prime plus margin of 0.5-1.5% - agreement includes provisions for conversion of interest from variable to CPI-linked debenture interest plus margin of 2-3% | | Earliest of 19 years from commercial operations date of Tzomet power plant and 23 years from the signing date, but no later than December 31, 2042 | | Quarterly principal payments to maturity, commencing close to the end of the first or second quarter following commercial operations of the Tzomet power plant | | Kiryat Gat | | | | | | | | | Financing agreement(3) | | 121 | | Variable interest at a rate equal to the Prime interest rate of 0.65%; NIS government bond plus 2.3% | | May 2039 | | Quarterly repayment of principal and interest in accordance with amortization schedule | OPC4: | | | | | | | | | | | | | | | Bonds (Series B)(3) | 272 | | 2.75% (CPI-Linked) | | September 2028 | | Semi-annual principal payments commencing on September 30, 2020 | | Bonds (Series C)(4) | 242 | | 2.5% | | August 2030 | | 12 semi-annual payments (which repayment amounts vary, and range from 5% up to 16% of the total issued amount) commencing in February 2024 | | Bonds (Series B)(4)(6) | | 271 | | 2.75% (CPI-Linked) | | September 2028 | | Semi-annual principal payments commencing on September 30, 2020 | Bonds (Series C)(5)(6) | | 214 | | 2.5% | | August 2030 | | 12 semi-annual payments (which repayment amounts vary, and range from 5% up to 16% of the total issued amount) commencing in February 2024 | | | | | | | | | | | | | | | |
__________________________________________________________________________________
| * | Includes interest payable, net of expenses. |
| (1) | Represents NIS 681652 million converted into USD at the exchange rate for NIS into USD of NIS 3.523.627 to $1.00. All debt has been issued in NIS, of which 2/3 is linked to CPI and 1/3 is not linked to CPI. |
| (2) | Represents NIS 5281,142 million converted into U.S. Dollars at the exchange rate for NIS into U.S. Dollar of NIS 3.523.627 to $1.00. All debt has been issued in NIS, part of which is linked to CPI and partthe loan principal of which is not linked to CPI. |
| (3) | Represents NIS 438 million converted into U.S. Dollars at the exchange rate for NIS into U.S. Dollar of NIS 3.627 to $1.00. All debt has been issued in NIS, the loan principal of which is not linked to CPI. |
| (4) | In April 2020, OPC completed an offering of NIS 400 million (approximately $113$ 113 million) of Series B bonds on the TASE, at an annual interest rate of 2.75%. In October 2020, OPC issued 555,555 units of NIS 1,000 Series B bonds, totaling gross proceeds of NIS 584 million ($171 million). The offering was an extension of the existing Series B bonds previously issued by OPC. The proceeds of the additional Series B issuance were used to redeem Series A bonds (NIS 313 million ($92(approximately $ 86 million)) and in part to fund the CPV acquisition. |
(4)(5) | In September 2021, OPC issued Series C debentures at a par value of NIS 851 million (approximately $266$ 266 million), bearing annual interest of 2.5%. The Series C bonds are repayable over 12 semi-annual payments (which repayment amounts vary, and range from 5% up to 16% of the total issued amount) commencing in February 2024 with the final payment in August 2030. OPC used the proceeds from the Series C bonds for the early repayment of project financing debt of OPC-Rotem as described below. |
| (6) | As of December 31, 2023, the balance of interest payable in respect of the Series B and C debentures amounts to approximately NIS 14 million (approximately $ 4 million). |
The debt instruments to which OPC and its operating companies are party to require compliance with financial covenants. Under each of these debt instruments, the creditor has the right to accelerate the debt or restrict the company from declaring and paying dividends if, at the relevant testing date the applicable entity is not in compliance with the defined financial covenants ratios. The instruments governing a substantial portion of the indebtedness of OPC operating companies contain clauses that would prohibit these companies from paying dividends or making other distributions in the event that the relevant entity was in default on its obligations under the relevant instrument. For further information on OPC’s financing arrangements, see Note 1415 to our financial statements included in this annual report. OPC-Rotem Financing Agreement
In January 2011, OPC-Rotem entered into a financing agreement with a consortium of lenders led by Bank Leumi Le-Israel Ltd., or Bank Leumi, for the financing of its power plant project. In October 2021, OPC-Rotem repaid the project financing debt in the amount NIS 1,292 million (approximately $400 million) (including early repayment fees). As part of the early repayment, OPC-Rotem recognized a one-off expense totaling NIS 244 million (approximately $75 million), in respect of an early repayment fee of approximately NIS 188 million (approximately $58 million), net of tax. OPC and the minority investor in OPC-Rotem extended to OPC-Rotem loans (pro rata to their ownership) to finance the early repayment totaling (principal) NIS 1,130 million (approximately $363 million). A significant portion of OPC’s portion of NIS 904 million (approximately $280 million) was funded by the issuance of Series C debentures as described below.
OPC-Hadera Financing Agreement In July 2016, OPC-Hadera entered into a NIS 1 billion (approximately $311$323 million) senior facility agreement with Israel Discount Bank Ltd. And Harel Company Ltd. Toto finance the construction of OPC-Hadera’s power plant in Hadera. Pursuant to the agreement, the lenders undertook to provide OPC-Hadera with financing in several facilities, (includingincluding a term loan facility, a standby facility, a debt service reserve amount, or DSRA, facility to finance the DSRA deposit, and a guarantee facility to facilitate the issuance of bank guarantees to be issued to third parties, a VAT facility (for the construction period only), a hedging facility (for the construction period only), and a working capital facility (for the operation period only)). In March 2020, the lenders under this agreement granted OPC-Hadera’s request to extend the COD under the agreement to June 2020. In December 2017, Israel Discount Bank Ltd. Assigned 43.5% of its share in the long-term credit facility (including the facility for variances in construction and related costs) to Clal Pension and Femel Ltd. And Atudot Pension Fund for Salaried and Self-employed Ltd.
The loans under the facility agreement accrue interest at the rates specified in the relevant agreement. The loans willloan is to be repaid in quarterly installments according to repayment schedules specified in the agreement. The financing will maturematures 18 years after the commencement of repayments in accordance with the provisions of the agreement which will commencecommenced approximately half a year following the commencement of commercial operation of the OPC-Hadera plant. In connection with theThe senior facility agreement is secured by liens were placed onover some of OPC-Hadera’s existing and future assets and on certain OPC and OPC-Hadera rights, in favor of Israel Discount Bank Ltd., as collateral agent on behalf of the lenders. The senior facility agreement also contains certain restrictions and limitations, including:
minimum projected DSCR, average projected DSCR (in relation to long-term loans at the commercial operation date of the power plant) and LLCR (at the commercial operation date of the power plant): 1.10 – 1.10—on the withdrawal dates the ratio must be at least 1.20; maintenance of minimum amounts in the reserve accounts in accordance with the agreement; and other non-financial covenants and limitations such as restrictions on dividend distributions, repayments of shareholder loans, asset sales, pledges investments and incurrence of debt as well as reporting obligations. As of December 31, 2022, following the full investment of the project’s equity contribution,2023, OPC-Hadera has made drawings in the aggregate amount of NIS 669652 million (approximately $190$180 million) under the NIS 1 billion (approximately $284 million) loan agreement relating to the project.agreement. Tzomet Financing Agreement In December 2019, Tzomet entered into a NIS 1.4 billion (approximately $435$441 million) senior facility agreement with a syndicate of lenders led by Bank Hapoalim Ltd, or Bank Hapoalim, to finance the construction of Tzomet’s power plant. Pursuant to the agreement, the lenders undertook to provide Tzomet with financing in several facilities, (includingincluding a term loan facility, a standby facility, a DSRA facility to finance the DSRA deposit, and a guarantee facility to facilitate the issuance of bank guarantees to be issued to third parties, a VAT facility (for the construction period only), a hedging facility (for the construction and operating periods), and a working capital facility (for the operation period only)).parties. The loans under the facility agreement accrue interest at the rates specified in the relevant agreement. The loans willare to be repaid in quarterly installments according to repayment schedules specified in the agreement. The financing will mature at the earliest of 19 years from the commencement of commercial operation of the Tzomet plant and 23 years from the signing date of the facility agreement, but no later than December 31, 2042, in accordance with the provisions of the agreement. In connection with the facility agreement, OPC’s shares in Tzomet (including any shares that OPC acquires from the minority shareholders) certain OPC and Tzomet rights were pledged in favor of Bank Hapoalim, asthe collateral agent on behalf of the lenders. The facility agreement also contains certain restrictions and limitations, including: minimum projected average debt service coverage ratio (ADSCR), average projected ADSCR and LLCR: 1.05 – 1.05—on the withdrawal dates, Tzomet is required to comply with a minimum contractual ADSCR (i.e., the lowest contractual ADSCR of all the contractual ADSCRs up to the date of final repayment) an average contractual ADSCR (i.e., the average contractual ADSCR of all the contractual ADSCRs up to the date of final repayment), and a contractual LLCR on the commencement date of the commercial operation of at least 1.3; maintenance of minimum amounts in the reserve accounts in accordance with the agreement; and other non-financial covenants and limitations such as restrictions on dividend distributions, repayments of shareholder loans, asset sales, pledge investments and incurrence of debt. As of December 31, 2022,2023, Tzomet has made drawings in the aggregate amount of NIS833NIS 1,142 million (approximately $237$315 million) under the facility agreement. Kiryat Gat Financing Agreement In March 2023, the Gat Partnership and Bank Leumi le-Israel B.M. (“Bank Leumi”) signed a financing agreement for a senior debt (project financing) to finance the acquisition of the Kiryat Gat Power Plant. As part of the financing agreement, Bank Leumi advanced to the Gat Partnership a long-term loan at the total amount of NIS 450 million (approximately $128 million). The loan is to be repaid in quarterly installments, starting from September 25, 2023, and the final repayment date is May 10, 2039 (subject to early repayment provisions). The loan bears an annual interest equal to the Prime interest adjusted by a spread ranging from 0.4% to 0.9% per annum. The Kiryat Gat financing agreement contains provisions on converting the interest on the loan from a variable interest to a fixed and unlinked interest. The loan bears the unlinked government bond interest, as defined in the agreement, adjusted by a 2.05% to 2.55% spread. The Kiryat Gat financing agreement is secured by all of the Gat Partnership’s assets and interests in it, including the real estate, bank accounts, insurances, and the Gat Partnership’s assets and rights in connection with the Project Agreements (as defined in the agreement). In addition, a lien was placed on the rights of the entities holding the Gat Partnership. On the completion date, OPC and Veridis, each in accordance with its proportionate (indirect) share in the Gat Partnership, as well as OPC Power Plants, gave a guarantee to pay all principal and accrued interest payments. Distributions by the Gat Partnership is subject to a number of conditions described in the said loan agreement, including, among other things: compliance with the following covenants: historic debt service coverage ratio (“DSCR”) and Average Projected DSCR and loan life coverage ratio at a minimal rate of 1.15, the first quarterly principal and interest payment having been made, the provisions of the agreement having been complied with, and no more than four distributions may be carried out in a 12-month period. In March 2023, the Gat Partnership, the entities holding the Gat Partnership, including OPC Power Plants, and Bank Leumi signed an equity subscription agreement, under which these entities and OPC Power Plants made certain undertakings (debt service and equity capital requirements, guarantees, meeting certain financial covenants) toward Bank Leumi in connection with the Gat Partnership's activity. OPC Bonds (Series B) In April 2020, OPC issued NIS 400 million (approximately $113 million) of bonds (Series B), which were listed on the TASE. The bonds bear annual interest at the rate of 2.75% and are repayable every six months, commencing on September 30, 2020 (on March 31 and September 30 of every calendar year) through September 30, 2028. In addition, an unequal portion of principal is repayable every six months. The principal and interest are linked to an increase in the Israeli consumer product index of March 2020 (as published on April 15, 2020). The bonds have received a rating of A3 from Midroog and A- from S&P Global Ratings Maalot Ltd. In October 2020, OPC issued NIS 584 million ($171(approximately $171 million) of Series B bonds. The offering was an extension of the existing Series B bonds previously issued by OPC. The proceeds of the additional Series B issuance were used to redeem OPC’s Series A bonds (NIS 310 million ($90 million)) and in part to fund the CPV acquisition (approximately NIS 250 million (approximately $78 million)). The outstanding principal amount (net of expenses) as of December 31, 2022 is NIS 956 million (approximately $272 million). The bonds are unsecured and the trust deed includes limitations on OPC’s ability to impose a floating lien on its assets and rights in favor of a third party. The trust deed contains customary clauses for callinggiving bondholders the right to call for the immediate redemption of the bonds, including events of default, including insolvency, liquidation proceedings, receivership, stay of proceedings and creditors’ arrangements, certain types of restructuring, material downturn in the position of OPC. The bondholders’ right to call for immediate redemption also arises upon: (i) the occurrence of certain events of loss of control by Kenon; (ii) the call for immediate repayment of other debts (or guarantees) of OPC or of a consolidated subsidiary in certain predefined minimum amounts; (iii) a sale of one or more assets of the company which constitutes more than 50% of the value of company’s assets, in less than 12 consecutive months, or a change in the area of operation of OPC such that OPC’s main area of activity is not in the energy sector, including electricity generation in power plants and with renewable energy sources; (iv) a rating being discontinued over a certain period of time; (v) the company breaching its covenant obligations under the deed of trust and executes an extraordinary transaction with the controlling shareholders (as these terms are defined under the Israeli Companies Law-1999); (vi) the company’s financial reports containing a going concern notice addressing the company itself, for two consecutive quarters; and (vii) a suspension of trading for a certain time period if the bonds are listed for trade on the main list of the stock exchange. The trust deed includes covenants on the basis of OPC’s stand-alone financial statements: coverage ratio between net financial debt deducting financial debt of projects yet to produce EBITDA, and Adjusted EBITDA of no more than 13, minimum equity of NIS 250 million (approximately $71$69 million) and an equity-to-balance sheet ratio of at least 17%. The trust deed also includes an undertaking by OPC to monitor the rating by a rating agency. Furthermore, restrictions are imposed on distributions and payment of management fees to the controlling shareholder, including compliance with certain covenants and certain legal restrictions. The terms of the bonds also provide for the possible raising of the interest rate in certain cases of lowering the rating and in certain cases of breach of financial covenants. The ability of OPC to expand the series of the bonds has been limited under certain circumstances, including maintaining the rating of the bonds at its level shortly prior to the expansion of the series and the lack of breach. Additionally, should OPC raise additional bonds that are not secured (and as long as they are not secured), such bonds will not have preference over the bonds (Series B) upon liquidation. Should OPC raise additional bonds that are secured, these will not have preference over the bonds (Series B) upon liquidation, except with respect to the security. OPC Bonds (Series C) In September 2021, OPC issued a series of bonds at a par value of approximately NIS 851 million, with the proceeds of the issuance designated, among other things, for early repayment of OPC-Rotem’s financing (Series C). The bonds are listed on the TASE. The bonds are not CPI-linked and bear annual interest of 2.5%. The bonds are repayable in twelve semi-annual and unequal installments (on February 28 and August 31) as set out in the amortization schedule, starting on February 28, 2024 through August 31, 2030 (the first interest payment was due February 28, 2022). The bonds are rated A- by Maalot. The issuance expenses amounted to about NIS 9 million. The bonds are unsecured and the trust deed includes limitations on OPC’s ability to impose a floating lien on its assets and rights in favor of a third party without fulfilling the conditions in the Bond C deed of trust. OPC has the right to make early repayment pursuant to the conditions in the trust certificate. The Bonds C deed of trust includes customary causes for calling for the immediate repayment (subject to stipulated remediation periods), including as a result of, among others, events of default, liquidation proceedings, receivership, suspension of proceedings and creditors’ arrangements, merger under certain conditions without obtaining bondholders’ approval or statement by the survivor entity, material deterioration in the position of OPC, and failure to publish financial statements in a timely manner. Furthermore, a bondholders’ right to call for immediate repayment arises, among others, upon the following circumstances: (i) the call for immediate repayment of another series of bonds (traded on the TASE or on the TACT Institutional system) issued by OPC; or of another financial debt (or a number of cumulative debts) of OPC and its consolidated companies (except in the case of a non-recourse debt), including forfeiture of a guarantee (that secures payment of a debt to a financial creditor) that OPC or investee companies made available to a creditor, in an amount not less than $75 million; (ii) upon breach of financial covenants on two consecutive review dates or on one review date; (iii) failure to obtain prior approval of the bondholders by special resolution in the case of an extraordinary transaction with a controlling shareholder, excluding transactions to which the Companies Regulations (Expedients in Transactions with an Interested Party), 2000 apply; (iv) if an asset or a number of assets of OPC are sold in an amount representing over 50% of the value of its assets according to OPC’s consolidated financial statements during a period of 12 consecutive months, or if a change is made to the main operations of OPC, except where the consideration of the sale is intended for the purchase of an asset or assets within OPC’s main area of operations (such as energy, including electricity generation in power plants and from renewable energies); (v) upon the occurrence of certain events leading to a loss of control; (vi) if a rating is discontinued over a certain period of time (except due to reasons not under the control of OPC); (vii) if trading in the bonds is suspended for a certain period of time or if the bonds are delisted; (viii) if OPC ceases to be a reporting corporation; (ix) if the company’s financial reports contain a going concern notice addressing the company itself, for two consecutive quarters; (x) if OPC breaches its undertaking not to place a general floating charge on its current and future assets and rights, in favor of any third party, without the criteria set in the Bond C deed of trust being met; and (xi) distribution in breach of the provisions of the Bond C deed of trust. Furthermore, the Bond C deed of trust includes an undertaking by OPC to comply with financial covenants and restrictions (including restrictions as to distribution, expansion of series without, among other things, maintaining the same rating of the bonds subsequent to such expansion, and provisions as to interest adjustment in the event of change in rating or non-compliance with financial covenants). The financial covenants include maintaining the ratio between net consolidated financial debt (less the financial debt designated for the construction of projects that have not yet started generating EBITDA) and Adjusted EBITDA at no more than 13 (and for the purpose of distribution as defined in the Bond C deed of trust - not more than 11), minimum equity (standalone) of NIS 1 billion (and for the purpose of distribution - NIS 1.4 billion), equity to asset ratio (standalone) of no less than 20% (and for the purpose of distribution - no less than 30%), and equity to (consolidated) balance sheet ratio of no less than 17%. As at December 31, 2022,2023, OPC met the following financial covenants: (i)covenants. OPC Bonds (Series D) In January 2024, OPC issued a series of bonds at a par value of approximately NIS 200 million (approximately $53 million), with the ratio betweenproceeds of the net consolidatedissuance designated for OPC’s needs, including for recycling of an existing financial debt less(Series D). The bonds are listed on the TASE, are not CPI-linked and bear annual interest of 6.2%. The principal and interest for Series D bonds will be repaid in unequal semi-annual payments (on March 25, and September 25), as set out in the amortization schedule, starting from March 25, 2026 in relation to the principal and September 25, 2024 in relation to interest. The Bonds D deed of trust includes customary terms similar to Bond B and Bond C deeds of trust described above except, mainly, in relation to the payment schedule, the annual interest (6.2%) and the financial debt earmarked for the constructioncovenant of projects that have not yet started generating EBITDA,minimum equity (NIS 2 billion) and the Adjusted EBITDA is 5.6; (ii) OPC’s equity amounts to NIS 3,507 million; (iii) OPC’s equity to total assets ratio is 65%; and (iv) the equity to balance sheet (consolidated) ratio is 46%purpose of distribution (NIS 2.4 billion). MasterCredit facility agreements for purchase of gas and electricity surpluses and intercompanyintra-group agreements in the segment
OPC’s operating companies in Israel are assessing the optionengage from time to enter into credit facilitytime in various intragroup agreements, including a master agreement for the purchase and sale of electricity or transfer of customers and natural gas with each other,or agreements for assignment of customer agreements, subject to any applicable regulations. These agreements aim to create a platform for mutual purchase of natural gas and electricity between them. If such agreements are signed, they will be subject, among other things, to the approval of the financing entities, (asas the case may be), and if any other approvals are required by law. United States EachGenerally, each CPV active CPV project company and Three Rivers (which is under construction) has taken out senior debt underwith similar structures, i.e., project, asset level financing (other than financings of Maple Hill, Stagecoach and Backbone, which are arranged on a several project portfolio basis and the Mountain Wind financing, which is also arranged on the basis of the Mountain Wind portfolio of projects), on non-recourse financing terms subject to specific terms and exceptions set for each project. On financial closing of each loan,financing (excluding Mountain Wind financing agreement, which was on acquisition) debt and equity capital iswere committed in an amount sufficient to cover the project’s projected capital costs during construction, along with ancillary credit facilities. The ancillary credit facilities are provided by a subset of the project’s lenders and in some cases by financial institutions who are not direct lenders to the relevant project and are comprised of letters of credit, which support collateral obligations under the financing arrangements and commercial arrangements, and a working capital revolver facility, which supports the project’s ancillary credit needs. The senior credit facilities are generally structured such that, subject to certain conditions precedent, they are converted from facilities to finance the construction phase (if relevant) to long-termterm facilities (term loans) with maturity dates generallyoften tied to the term of the commercial agreements anchoring expected operating cash flows of each project. For the Energy Transition projects, the term loans generally span the construction period plus 5-7 years after launch of commercial operation (a “mini-perm“miniperm financing”). The mini-permminiperm financing is repaid based on a combination of (i) predetermined amounts per project in accordance with set quarter end repayment dates, and (ii) result-based metrics, which result in partial or full application of free cash flow to term loan repayment on such quarter-end dates (cash sweeps), which in the aggregate, result in partial repayment during the loan term, with a balance payable or refinanced upon final repayment date. CPV seeks to take advantage of opportunities to recycle its credit according to market conditions and, in any case, prior to the scheduled final repayment date. The credit facilities in place during construction are sourced from a consortium of international lenders (10-20 for each gas-fired project, fewer for renewable energy projects with lower capital needs) and executed in the “Term Loan A” market, which is substantially comprised of commercial banks, investment banks, institutional lenders, insurance companies, international funds, and equipment suppliers’ credit affiliates. CPV project companies have refinanced loans for gas-fired projects on both the Term Loan A market and the Term Loan B market, which includes mainly institutional lenders, international funds, and a number of commercial bank. While the credit facility terms and conditions have certain provisions specific to the project being financed, an overwhelming majority of the standard key terms and conditions (first lien security on assets and rights, covenants, events of default, equity cure rights, distribution restrictions, reserve requirements, etc.) are similar across the CPV project Term Loan A refinancing, while the Term Loan B market refinancing terms, aregenerally, may be slightly less restrictive,more flexible, as customary in this market.market considering the project and the market conditions. In each market and often within each project loan, lenders extended loans to the CPV Group’s projects either according to a credit margin based on the LIBOR,LIBOR/SOFR, variable base interest rate or fixed interest. Following June 30, 2023, LIBOR as a market reference rate was discontinued and replaced with SOFR, which was identified by the Alternative Reference Rates Committee (hereinafter “ARRC”) identified rate to represent best practices for use in certain new USD derivatives and other financial contracts. The debt facilities and interest rate-related agreements for CPV projects were amended to replace LIBOR with SOFR. To minimize exposure to potential interest rate risk, CPV executes interest rate hedges for the main exposure at each project level, whereby the CPV project companies pay the major financial institutions fixed interest and receive variable interest payments for certain terms, according to the terms and conditions of the project and loan. For most existing LIBOR-based credit facilities, the credit agreements and interest rate hedging arrangements include market-standard provisions to accommodate the replacement of LIBOR by SOFR as a benchmark interest rate. Remaining LIBOR rates will be discontinued after June 30, 2023. The Alternative Reference Rates Committee (“ARRC”) has identified SOFR as the rate that represents best practices for use in certain new USD derivatives and other financial contracts. The projects of the CPV Group are expected to enter into amendments to reflect the transfer to SOFR based interest rate. The CPV Group has commenced processes for revision of the credit agreements and the agreements hedging the interest rate for transfer (replacement) of all the LIBOR-based financed to SOFR-based financed under every specific project financing agreement. All of the said transfers are slated to take place prior to June 30, 2023, the date on which the LIBOR interest will be discontinued. All such transitions are expected to conclude prior to the June 30, 2023, LIBOR discontinuation date New variable credit facilities and refinancingrefinancings of future debt bearing variable interest of the CPV Group project companies are expected towill have the SOFR as their benchmark interest rate (with United States prime rate as an alternative, in a manner that corresponds to the existing credit facilities of the CPV Group project companies).Such amendments are still pending execution. The.The table below sets forth summaries of the key commercial terms of the senior credit facilities associated with each CPV project financing. The term loan commitment amounts are referenced as of the date noted and once drawn and repaid, may not be drawn again, while ancillary credit facilities and working capital facilities are revolving in nature. The events of default consist of customary events of default, including, among others: breach of commitments and representations having a material adverse effect, failure of equity contributing party to fund during construction, nonpayment events, failure to adhere to certain covenants, various insolvency events, termination of the project’s activities or of significant parties in the project (as defined in the agreement), various events in connection with its regulatory status and maintenance of government approvals, certain changes in ownership of the project company, certain events in connection with the project, existence of legal proceedings in connection with the project, and the project not having the right to receive payments for its capacity and electricity – electricity—all of this in accordance with and subject to the terms, definitions and cure periods as stated in the relevant credit agreement.
| | | | Total Commitment (approximately in $millions) | | Total Outstanding/ Issued (approximately in $millions) as of Dec. 31, 20222023 | | | | | | |
| Fairview | | March 24, 2017 | | 710 | | 503625(1)
| | June 30, 2025(2) | | LIBOR plus margin of 2.5%Fixed debt interest rate – 5.4%
SOFR – 8.2% Weighted-average interest as at December 31, 2022: 4.9%2023: 5.6% | | Distribution is subject to the project company’s compliance with several terms and conditions, including compliance with a minimum debt service coverage ratio of 1.2 during the 4 quarters that preceded the distribution, compliance with reserve requirements (pursuant to the terms of the financing agreement), compliance with the debt balances target defined in the agreement, and that no ground for repayment or breach event exists (as defined in the financing agreement). | | Towantic | | March 11, 2016 | | 753 | | 556(3)
| | June 30, 2025655(2)
| | June 30, 2025 | | LIBOR plus margin of 3.1%Fixed debt interest rate – 5.1%
SOFR – 8.7% Weighted-average interest as at December 31, 2022: 5.7%2023: 5.9% | | Similar to Fairview (see above) |
| Project | | Financial Closing Date | | Total Commitment (approximately in $millions) | | Total Outstanding/ Issued (approximately in $millions) as of Dec. 31, 2023 | | Maturity Date | | Annual interest | | Covenants | | Maryland | | August 8, 2014 | | 450 | | 340350(4)(3)
| | May 11, 2028 (Term Loan B)(2) November 11, 2027(2) (Ancillary Facilities) | | LIBOR plus margin of 3.6%Fixed debt interest rate – 5.9%
SOFR – 8.9% Weighted-average interest as at December 31, 2022: 6.5%2023: 7.0% | | Historical debt service coverage ratio of 1:1 during the last 4 quarters. As of March 19, 2023, Maryland is currently in compliance with the covenant. Execution of aA distribution is conditional on the project company complying with several terms and conditions, including, compliance with a reserve requirements (as provided in the agreement), and that no ground for repayment or breach event exists in accordance with the financing agreement. | | Shore | | December 2018 | | 545535 | | 459425(5)(4)
| | Dec. 27, 2025 (Term Loan) Dec. 27, 2023 (Ancillary Facilities)(2) | | Term Loan: LIBOR plus margin of 3.5%Fixed debt interest rate – 4.1%
SOFR – 9.1% Weighted-average interest as at December 31, 2022: 6.1%2023: 5.4% | | Historic rolling 4 quarter debt service coverage ratio of 1:1. CPV is currently in compliance with this covenant. Distribution isDistributions are subject to, among others, certain reserve requirements, and having no existing default or event of default. |
| | | | Total Commitment (approximately in $millions)
| | Total Outstanding/ Issued (approximately in $millions) as of Dec. 31, 2022
| | | | | | |
| Valley | | June 12, 2015 as amended in June 2023 | | 680470 | | 502360(6)(5)
| | June 30, 2023Extended to May 31, 2026 | | LIBOR plus margin of 3.8%
SOFR – 10.8% Weighted-average interest as at December 31, 2022: 7.2%2023: 10.8% | | Distribution isDistributions are subject to the project company meeting conditions, including compliance with a minimum debt service coverage ratio of 1.2 during the 4 quarters that preceded the distribution, compliance with reserve requirements (pursuant to the terms of the financing agreement), compliance with requirements for receipt of a certain permit, compliance with the debt balances target defined in the agreement, and that no ground for repayment or default event exists (as defined in the financing agreement). Valley is in discussions with the lenders to extend the loan for at least an additional 2 years. The terms for extension, all of which are subject to negotiation, include extension fees, increase in interest margins, credit spread increases, and debt reduction, which is expected to include equity contribution in a range, estimated by CPV, of $40 million to $100 million (of which the CPV Group’s share is 50%) as a condition to extension. As of March 19, 2023, the parties are still in discussion and there is no certainty as to the execution of such extension or its terms. In case such extension is not agreed, Valley will be required to repay the loan on the original repayment date of June 30, 2023.
| | Keenan II | | August 2021 | | 120 | | 102104(7)(6)
| | December 31, 2030 | | LIBOR + margin 1.1%Fixed debt interest rate – 2.0%
SOFR – 6.5% Weighted-average interest as at December 31, 2022:2023: 3.0% | | Execution of a distribution isDistributions are subject to the project company’s compliance with several terms and conditions, including compliance with a minimum debt service coverage ratio of 1.15 during the 4 quarters that preceded the distribution, and that no grounds for repayment or breach event exist (as defined in the financing agreement) |
| Three Rivers | | | | Total Commitment (approximately in $millions)
| | Total Outstanding/ Issued (approximately in $millions) as of Dec. 31, 2022
| | | | | | |
Three Rivers (under construction) | | Aug.August 21, 2020 | | 875 | | 823750(8)(7)
| | June 30, 2028(2) | | LIBOR plus margin of 3.6%Fixed debt interest rate – 4.6%
SOFR – 9.1% Weighted-average interest as at December 31, 2022: 4.7%2023: 5.3% | | Similar to Fairview (see above) |
_________________________________________182
| Project | | Financial Closing Date | | Total Commitment (approximately in $millions) | | Total Outstanding/ Issued (approximately in $millions) as of Dec. 31, 2023 | | Maturity Date | | Annual interest | | Covenants | | Mountain Wind | | April 6, 2023 | | 92 | | 75(8) | | April 6, 2028 | | Fixed debt interest rate – 4.9% SOFR – 7.0% Weighted-average interest as at December 31, 2023: 5.4% | | Distributions aresubject to the project company’s compliance with several terms and conditions, including compliance with a minimum debt service coverage ratio of 1.20 during the preceding 12-month period that preceded the distribution, and that no grounds for repayment or breach event exist (as defined in the financing agreement). | | CPV Maple Hill, Stagecoach, CPV Backbone | | August 23, 2023 | | 370(9) | | 331 | | August 23, 2027 or a year after the conversion date of the third qualifying project | | Fixed debt interest rate – 6.4% SOFR – 7.9% Weighted-average interest as at December 31, 2023: 6.6% | | Each project is required to meet a projected minimum DSCR ratio(10) of 1.3, based on the stream of income from PPAs and green certificates, and 1.8 based on the stream of income from market sales |
____________________________________________
| (1) | Consisting of Term Loan (Variable): $375$510 million, Term Loan (Fixed, 5.78%)(Fixed): $101$115 million, Ancillary Facilities (Working Capital Loan: $0;$30; Letters of Credit/LC Loans: approximately $27$55 million). |
| (2) | The rate and scopeConsisting of repaymentTerm Loan: $655 million, Ancillary Facilities (Working Capital Loan: $21; Letters of loan principal varies until final repayment, in accordance with integration of amortization and cash sweep repayment mechanisms (“mini perm” financing)
Credit/LC Loans: $77 million) |
| (3) | Consisting of Term Loan: $350 million, Ancillary Facilities (Working Capital Loan (Variable): $478and Letters of Credit: $100 million) |
| (4) | Consisting of Term Loan: $425 million, Ancillary Facilities ($110 million) (reduced to $95 million as of November 2023). |
| (5) | Consisting of Term Loan: $360 million, Ancillary Facilities (Working Capital Loan: $0;$10; Letters of Credit/LC Loans: $78$100 million). |
(4) | Consisting of Term Loan (Variable): $306 million, Ancillary Facilities ($34 million).
|
(5) | Consisting of Term Loan (Variable): $379 million, Ancillary Facilities ($80 million).
|
| (6) | Consisting of Term Loan (Variable): $424Loan: $104 million, Ancillary Facilities (Working Capital Loan: $0;Loan and Letters of Credit/LC Loans: $78 million (of which approximately $25 million was withdrawn re: debt service reserve as of December 31, 2022)). In April 2021, Valley received certain concessions on the ancillary facilities in exchange for a $10 million aggregate capital commitment from the project sponsors ($5 million from CPV). The concessions waive the annual, mandatory full repayment of the working capital loans through June 29, 2022 and release $5 million of working capital capacity that is currently restricted due to the Title V permit matter. Valley is holding discussions with the lenders on extension of the Loan for at least an additional 2 years. The terms for extension, all of which are subject to negotiation, include extension fees, credit spread increases, and debt reduction which is expected to include equity contribution in a range estimated by CPV of $40 to $100Credit: $16 million) as conditions to extension. Currently, the parties are still in discussions and there is no certainty as to the execution of such extension or its terms. In case such extension will not be agreed Valley will be required to repay the loan on June 30, 2023. |
| (7) | Consisting of Term Loan (Variable): $88$650 million, Term Loan (Fixed): $100 million, Ancillary Facilities (Working Capital Loan: $0; Letters of Credit/LC Loans: $14($125 million). The amortization schedule of the term loan is based on the December 2030 maturity date, with a 100% cash sweep mechanism starting March 2027, so that the term loan is expected to be repaid in full by the December 2028 maturity date. |
| (8) | Consisting of:of Term Loan (Variable): $632$19 million, Term Loan (Fixed, 4.5%)(Fixed): $100 million;$56 million, Ancillary Facilities (Working Capital Loan: $0; Letters($17 million). |
| (9) | Consisting of Credit/LC Loans: $91Total Financing Commitment: $181 million, Ancillary Facilities (Letters of Credit: $39 million, Bridge Loan $150 million). |
| (10) | The ratio between the free cash flow for debt service and the principal and interest payments for the relevant period. |
The $370 million financing agreement with Israeli banks. In August 2023, the CPV Group entered into a $370 million financing agreement with lenders including Israeli banking corporations for the purpose of financing the construction and initial operating period of qualifying projects in the field of renewable energy in the United States. CPV’s Maple Hill and Stagecoach projects are qualifying projects, and CPV’s Backbone project is expected to meet the criteria set for a qualifying project during the first half of 2024. The total amount provided under the facility is $370 million, of which (i) $181 million is expected to be advanced for the financing of the projects’ construction and their initial commercial operating period, (ii) $39 million is expected to be advanced for the provision of letters of credit to projects, and (iii) $150 million is expected to be advanced as a bridge loan to projects after engagement with a “tax equity partner”. The final repayment date is the earlier of four years after the Financial Closing Date (which would be August 23, 2027) or one year after the conversion date of the third qualifying project based on the CPV Group’s assessment that Backbone achieving its conversion date in July 2025). The financing agreement contains conditions for drawing, including minimum equity, meeting certain ratios and other conditions. The loans for construction may be converted into loans to finance the initial commercial operating period if certain conditions are met. The loan under the financing agreement bears annual interest based on SOFR plus a margin for loans for financing of construction of 2% (and if such loans are converted to financing the initial operating period, a margin of 2.75%); and for bridge financing of 1.25%. The financing agreement provides for letters of credit to be issued subject to customary annual issuance fees. The financing agreement further provides for customary facility fees in respect of unutilized amounts. The three projects named above are pledged to secure the financing agreement, and a cross default provision is in place between the projects. CPV Group provided a guarantee to secure certain undertakings in connection with the financing agreement. In accordance with the financing agreement, as of the date each project becomes a qualifying project, it is required on a forward basis to hedge the exposure to changes in the SOFR interest rate for at least 75% of such project’s forecasted amortizing loan balance over its approximate first 10 operating years. In August 2023, the CPV Group entered into a hedging agreement by executing interest rate swap contracts with lenders for an initial aggregate amount of approximately $101.3 million and chose to apply cash flow hedge accounting rules. Letters of Credit (LCs). During 2022,2023, the CPV Group entered to several LC arrangements with banking institutions in an aggregate scope of approximately $24$95 million (which were withdrawn).which are valid up to the second half of 2024. Such LCs were used mainly for collaterals to development projects and the Valley hedging transaction. The LC’s are secured by collateral as required by the issuing corporations (including a guarantee by CPV or cash deposit, as the case may be). Qoros’ZIM’s Liquidity and Capital Resources
Qoros has three major credit facilities, being its RMB 3 billion, RMB 700 million and RMB 1.2 billion loan facilities. Qoros did not make payments under these loan facilities, and as a result, the lenders under these facilities accelerated these loans. These loans remain in default and accelerated.
Kenon paid approximately $16 million to satisfy its guarantee obligations to Chery in respect of Qoros debt and has no further guarantee obligations. Kenon has pledged substantially all of its interest in Qoros to secure the RMB 1.2 billion loan facility.
Kenon understands Qoros has also taken loans and other advances from parties related to the Majority Shareholder.
ZIM’s Liquidity and Capital Resources
ZIM operates in the capital-intensive container shipping industry. Its principal sources of liquidity are cash inflows received from operating activities, generally in the form of income from voyages and related services. ZIM’s principal needs for liquidity are operating expenses, expenditures related to debt service and capital expenditures. ZIM’s long-term capital needs generally result from its need to fund its growth strategy. ZIM’s ability to generate cash from operations depends on future operating performance which is dependent, to some extent, on general economic, financial, legislative, regulatory and other factors, many of which are beyond its control, as well as the other factors discussed in “Item 3.D Risk factors—Factors—Risks Related to ourOur Interest in ZIM.” ZIM’s cash and cash equivalents were $922 million, $1,022 million and $1,543 million and $570.4 million as of December 31, 2023, 2022 2021 and 2020,2021, respectively. In addition, ZIM’s bank deposits and other investment instruments amounted to $3,588.6$1,755 million, $2,306.5$3,589 million, and $55.8$2,307 million as of December 31, 2023, 2022, 2021 and 2020,2021, respectively. ZIM’s total outstanding indebtedness as of December 31, 20222023 consisted of $2,855$3,318 million in long-term debt and $1,477$1,693 million in current installments of long-term debt and short-term borrowings. ZIM’s long-term debt is mostly comprised of lease liabilities, related to vessels and equipment. The weighted average interest rate paid per annum as of December 31, 20222023 under all of ZIM’s indebtedness was 7.7%8.1%. During the years ended December 31, 2023, 2022 2021, and 2020,2021, ZIM’s capital expenditures were $345.5, $1,005.0$116 million, $346 million and $42.7$1,005 million, respectively. Such expenditures, which do not include additions of leased assets, were mainly related to investments in equipment and vessels, as well as in its information systems. ZIM’s projected capital expenditures for the next 12 months are aimed to support its ongoing operational needs. For further information on the risks related to ZIM’s liquidity, see “Item 3.D Risk Factors—Risks Related to ourOur Interest in ZIM.” Its leverage may make it difficult for ZIM to operate its business, and ZIM may be unable to meet related obligations, which could adversely affect its business, financial condition, results of operations and liquidity. | C. | Research and Development, Patents and Licenses, Etc. |
Not applicable. The following key trends contain forward-looking statements and should be read in conjunction with “Special Note Regarding Forward-Looking Statements” and “Item 3.D Risk Factors.” For further information on the recent developments of Kenon and our businesses, see “Item 5. Operating and Financial Review and Prospects—Recent Developments.” Trend InformationOPC
Israel OPC’s revenue from the sale of electricity to private customers is derived from electricity sold at the generation component tariffs, as published by the EA, with some discount. Under the agreements with the private customers, OPC Israel— charges its customers generation component tariffs, as published by the EA, with some discount. In general, an increase or decrease in the generation component has a positive or negative, as applicable, effect on OPC’s results. On February 1, 2023, a decision of the EA entered into effect to update the costs recognized to the Electricity Company and the Systems Operator and the tariffs to the electricity consumers. Pursuant to the decision,2024, an additional update to the generation component for 2023 entered into effect whereby the generation component is NIS 0.3081 per kWh, a decrease of 1.2% compared to the tariff set on January 1, 2023, resulting from extension of the excise tax on fuel order, which calls for a decrease in the purchase tax and excise tax applicable to the coal. In March 2023, a hearing was published for the revision of the costs recognized to the IEC and the tariffs paid by electricity consumers, following a 30% decline in coal prices compared to the price on which the latest tariff revision was based, and increase in other costs. The tariff will be reduced by approximately 1% from the tariff set in February 2023. For further information, see “Item 5. Operating and Financial Review and Prospects—Material Factors Affecting Results of Operations—OPC—Revenue—EA Tariffs.” In August 2022, the EA published a decision to revise, the time of use (TOU) demand categories for purposes of adjusting the structure of the load and time tariffs (TAOZ) for a significant integration of solar energy and storage. Pursuant to the publication, the update of the TOU demand categories is expected to encourage steering consumption to the noon hours where there is higher generation of renewable energy as opposed to consumption in the peak evening demand hours. Change of the TOU categories in accordance with the decision is expected to increase the tariffs paid by household consumers and reduce the tariffs paid by TAOZ consumers. Based on the decision, the updated tariff structure will enter into effect uponannual update of the tariff for 2024 came into effect for the IEC’s electricity consumers. According to the consumer in 2023. decision, the generation component was updated to NIS 0.3007 per KWh, a decline of 1.1%.
In addition,2023, the decision provides that in light of the frequent sectorial changes and the need to express the correct sec0torial cost, the TOU categories will be updated more frequently. As result of the decision, OPC is taking actions to adjust the mix of its sales in Israel, to the extent possible, to thetariff structure of the updated demand hours categories. Updatefor consumers was revised. The revision of the demand hours categories is expected to havehour clusters generally had a negative impacteffect on OPC’s results, since,mainly in general,view of the consumption profile of OPC’s customers which(who are mostly industrial and commercial customers, has lowcustomers), which generally have lower levels of consumption volatilityfluctuation during the day.day compared to retail or other users. In addition, a change of the demand hour clusters changes the breakdown of OPC’s revenues and profits from its operations in Israel between the different quarters, such that revenues and profits in the summer (June-September), and mainly the third quarter, increase at the expense of the other quarters. There is a significant uncertainty as to the development of the War (which started in October 2023 and as at the date of this report is still underway) and its impact on OPC and its operations, and there is also significant uncertainty as to the impact of the War on macroeconomic and financial factors in Israel, including the situation in the Israeli capital markets and the credit rating of the State of Israel and Israeli financial institutions (particularly the Israeli banking system) For example, in February 2024, the Moody’s rating agency downgraded the State of Israel’s credit rating to A2 from A1 with a negative rating outlook and of Israeli financial institutions, particularly the Israeli banking system (against the background of the reduction of Israel’s rating, in February 2024 the international rating company “Moody’s” gave notice of a reduction of the credit rating of the five large banks in Israel to a level of A3 with a negative rating outlook)), which could adversely affect investments in the Israeli economy and trigger a removal of money and investments from Israel, increase the costs of the financing sources in Israel, cause a weakening of the exchange rate of the shekel against the other currencies (particularly the dollar), harm business activities and create instability in the Israeli capital markets (including increased volatility, falling prices of traded securities, and limited liquidity and accessibility). See, “Item 5. Operating and Financial Review and Prospects—Material Factors Affecting Results of3D Risk Factors—Risks Related to OPC’s Israel Operations—OPC—Revenue—EA TariffsThe War may affect OPC Operations in Israel..”
United States—States The energy sector in the United States is affected by global and domestic trends. Disruptions to the supply chain, government levies, exchange and interest rates and federal and state policies all affect the activity of the energy sector, as well as the pace and direction of the change trends to the energy infrastructures and the energy markets. The price of natural gas is significant in setting the price of electricity in most territories where CPV has projects (the main fuel of the natural gas-fired power plants of CPV).projects. The natural gas prices are impacted by numerous variables, including demand in the industrial, residential and electricity sectors, productivity and supply of the natural gas, natural gas production costs, location and changes in the pipeline infrastructure, international trade and the financial profile and the hedging profile of natural gas customers and producers. The price of imported liquefied natural gas affects the natural gas prices during the winter in New England and New York, which has a direct effect on the Towantic and Valley power plants. Accordingly, electricity and natural gas prices are key factors in the profitability of CPV, as well as capacity prices in the operating areas of the power plants of CPV. A number of variables impact the profitability of the natural gas-fired power plants of CPV Group, including the price of various fuels, the weather, load increases, and unit capacity, which cumulatively affect the gross margin and the profitability of CPV Group. Electricity prices inwithin the PJM market (PJM Western Hub)for the CPV’s Energy Transition projects were 88% higherapproximately 56% lower in 2022,2023, compared to 2021.2022. Electricity prices in the ISO-NE (NEPOOL Hub) and NYISO (Zone G) markets were 86%57% and 102% higher60% lower in 2022,2023, respectively, compared to 2021.2022. In 2022,2023, average Henry Hub natural gas prices were 67% higher62% lower compared to 2021.2022. The increasechanges in in electricity stemsprices stem mainly from the increasedecrease in natural gas prices and exacerbatedas evidenced by the northeast gas price premium in these threethe following market areas. | | | | | | | | | PJM West
(Shore, Maryland) | | $54.39 | | $38.92 | | $68.74 | | $73.09 | | PJM AD Hub (Fairview) | | $51.88 | | $38.35 | | $64.70 | | $69.42 | | NYISO Zone G (Valley) | | $51.33 | | $40.74 | | $73.04 | | $82.21 | | ISO-NE Mass Hub (Towantic) | | $59.88 | | $45.92 | | $76.92 | | $85.56 |
The average 24x7 power prices are based on day-ahead settlement prices as published by the respective ISOs. | | | | | | | | | | | | | | | | | PJM West
(Shore, Maryland) | | $ | 36.31 | | | $ | 33.06 | | | $ | 68.74 | | | $ | 73.09 | | | PJM AD Hub (Fairview) | | $ | 31.30 | | | $ | 30.81 | | | $ | 64.70 | | | $ | 69.42 | | | NYISO Zone G (Valley) | | $ | 31.52 | | | $ | 33.27 | | | $ | 73.04 | | | $ | 82.21 | | | ISO-NE Mass Hub (Towantic) | | $ | 34.66 | | | $ | 36.82 | | | $ | 76.92 | | | $ | 85.56 | | | PJM ComEd (Three Rivers) | | $ | 26.31 | | | $ | 26.68 | | | $ | 52.30 | | | $ | 60.40 | |
Natural gas prices in the marketsU.S. started to rise in which the CPV Group operates increased in 2022 significantly comparedsecond half of 2021 due to last year. CPV believes the increase arises, among other things,recovery from the increaseeconomic crisis associated with the economic recovery following the coronavirus and even more so as a result of the outbreak of the war between Russia and the Ukraine in the beginning of 2022. Prices remained high during 2022, while the production levels of the natural gas were low. Comparatively, at the end of December 2022 the natural gas prices fell sharply upon the rise in levels of production of natural gas and the slowdown of the demand owing to the warm winter (2022/2023), and remained at a very low rate during 2023 compared with last year against the background of relatively high inventory levels. The trends in the Energy Transition segment are also influenced by reliability concerns and limited new conventional generation in certain areas. The United States demand for electricity has started to increase after nearly a decade of limited or flat growth. In 2010 and 2020, total electricity consumption in the United States stronger globalwas 3.9 thousand TWh, whereas in 2022 it was 4.05 thousand TWh. The system operators in areas in which CPV Group primarily operates, PJM, NY-ISO and ISO-NE, are expecting between 0.5%-1.6% summer peak load growth over the next 10 years. PJM’s forecasted demand for natural gas, inventory levels which are lower compared to the past, and a limited increase in natural gas production. Since the beginning of 2023, spot and forward natural gas prices decreased significantly, mainlygrowth doubled year over year. Load growth is increased due to mild winterdata centers and strong seasonal natural gas storage levels.electrification of the economy. The higher load growth combined with fewer dispatchable resources is expected to affect the overall level of electricity prices and capacity, and on the instability in prices. OPC businesses require significant capital investment to implement its growth strategy including development and construction of projects. Development of new projects in the field of electricity generation requires, for the most part, several years of work before external financing for construction can be secured, and financial robustness is needed in order to raise the required amounts of capital. OPC businesses may require additional debt and equity financing for their projects. Additional equity financing by OPC may involve Kenon participating in equity raises of OPC. Additional financing for CPV Group may involve equity financing at the CPV Group level which would dilute OPC (to the extent OPC is not the investor), which would indirectly dilute Kenon’s interest in CPV. ZIM Total global container shipping demand totaled approximately 236.8233.6 million TEUsTEU in 20222023 (including inland transportation) according to Drewry Container Forecaster (Drewry) as of December 2022.2023. Global container demand has seen steady and resilient growth equaling a 5.6%5.5% CAGR since 2000 accordinglyaccording to Drewry, driven by multiple factors. These include economic drivers such as GDP growth, containerization and industrial production, as well as other non-economic drivers such as geopolitics, consumer preferences and demographic changes. The breakout of the COVID-19 pandemic has led to the second crisis in the container shipping industry since 2000, (with the first crisis occurring during 2009 following the 2008 financial crisis). 2020 commenced with lockdowns and reduced exports from China, reduction of shipping capacity, however during the second half of 2020 manufacturing capacity increased, together with a spike in e-commerce and goods sales, and inventory restocking. Following the supply chain disruptions experienced in 2021, which were a factor driving significant upgrades to freight rates, supply chains have been normalizing duringsince the second half of 2022, mainly due to a shift in consumer spending. According to Drewry, demand is expected to achieve an approximately 1.8%2.4% CAGR from 20212022 to 2025. See also “—Material Factors Affecting Results of Operation.”2026. | E. | Critical Accounting Policies and Significant Estimates |
In preparing our financial statements, we make judgments, estimates and assumptions about the carrying amounts of assets and liabilities that are not readily apparent from other sources. Our estimates and associated assumptions are reviewed on an ongoing basis and are based upon historical experience and various other assumptions that we believe to be reasonable under the circumstances. Actual results may differ from these estimates under different assumptions or conditions. We believe that the estimates, assumptions and judgments involved in the accounting policies described below have the greatest potential impact on our financial statements: allocation of acquisition costs; long-term investment (Qoros); Recoverable amount of cash-generating unit that includes goodwill (CPV);goodwill; and Recoverable amount of cash-generating unit of investment in equity-accounted companies (ZIM). For further information on the estimates, assumptions and judgments involved in our accounting policies and significant estimates, see Note 2 to Kenon’s financial statements included in this annual report. | F. | Disclosure of Registrant’s Action to Recover Erroneously Awarded Compensation |
Not applicable. | ITEM 6. | Directors, Senior Management and Employees |
| A. | Directors and Senior Management |
Board of Directors The following table sets forth information regarding our board of directors:
| | | | | | Original Appointment Date | | | | | | | | | | Original Appointment Date | | | | | | Antoine Bonnier | | 40 | | Board Member | | 2016 | | 2021 | | 2022 | | 40 | | Board Member | | 2016 | | | | 2024 | | Laurence N. Charney | | 76 | | Chairman of the Audit Committee, Compensation Committee Member, Board Member, ESG Committee Member | | 2014 | | 2021 | | 2022 | | 76 | | Chairman of the Audit Committee, Compensation Committee Member, Board Member, ESG Committee Member | | 2014 | | 2023 | | 2024 | | Barak Cohen | | 41 | | Board Member | | 2018 | | 2021 | | 2022 | | 42 | | Board Member | | 2018 | | 2023 | | 2024 | | Cyril Pierre-Jean Ducau | | 44 | | Chairman of the Board, Nominating and Corporate Governance Committee Chairman, ESG Committee Member | | 2014 | | 2021 | | 2022 | | 45 | | Chairman of the Board, Nominating and Corporate Governance Committee Chairman, ESG Committee Member | | 2014 | | 2023 | | 2024 | | N. Scott Fine | | 66 | | Audit Committee Member, Compensation Committee Chairman, Board Member | | 2014 | | 2021 | | 2022 | | 67 | | Audit Committee Member, Compensation Committee Chairman, Board Member | | 2014 | | 2023 | | 2024 | | Bill Foo | | 65 | | Board Member, Nominating and Corporate Governance Committee Member | | 2017 | | 2021 | | 2022 | | 66 | | Board Member, Nominating and Corporate Governance Committee Member | | 2017 | | 2023 | | 2024 | | Aviad Kaufman | | 52 | | Compensation Committee Member, Board Member, Nominating and Corporate Governance Committee Member | | 2015 | | 2021 | | 2022 | | 53 | | Compensation Committee Member, Board Member, Nominating and Corporate Governance Committee Member | | 2015 | | 2023 | | 2024 | Robert L. Rosen1 | | | 51 | | Board Member and CEO | | 2023 | | 2023 | | 2024 | | Arunava Sen | | 62 | | Board Member, Audit Committee Member, ESG Committee Chairman | | 2017 | | 2021 | | 2022 | | 63 | | Board Member, Audit Committee Member, ESG Committee Chairman | | 2017 | | 2023 | | 2024 | Tan Beng Tee2 | | | 66 | | Board Member | | 2023 | | 2023 | | 2024 |
__________ 1. Appointment effective from July 19, 2023 2. Appointment effective from August 30, 2023 Our constitutionConstitution provides that, unless otherwise determined by a general meeting, the minimum number of directors is five and the maximum number is 12. Senior Management
| | | | | | Robert L. Rosen | | 5051 | | Chief Executive Officer & Director | Mark HassonDeepa Joseph | | 4748 | | Chief Financial Officer |
Biographies Directors Antoine Bonnier. Mr. Bonnier is the Chief Executive Officer of Quantum Pacific (UK) LLP and serves as a member of the board of directors of Club Atletico de Madrid SAD, of CPVI, OPC, Cool Company Ltd and EkwaterEkwateur SA, each of which may be associated with the same ultimate beneficiary, Mr. Idan Ofer. Mr. Bonnier was previously a Managing Director of Quantum Pacific (UK) LLP. Prior to joining Quantum Pacific Advisory Limited in 2011, Mr. Bonnier was an Associate in the Investment Banking Division of Morgan Stanley & Co. During his tenure there, from 2005 to 2011, he held various positions in the Capital Markets and Mergers and Acquisitions teams in London, Paris and Dubai. Mr. Bonnier graduated from ESCP Europe Business School and holds a Master of Science in Management. Laurence N. Charney. Mr. Charney currently serves as the chairman of our audit committee. Mr. Charney retired from Ernst & Young LLP in June 2007, where, over the course of his more than 37-year career, he served as Senior Audit Partner, Practice Leader and Senior Advisor. Since his retirement from Ernst & Young, Mr. Charney has served as a business strategist and financial advisor to boards, senior management and investors of early stage ventures, private businesses and small to mid-cap public corporations across the consumer products, energy, high-tech/software, media/entertainment, and non-profit sectors. His most recent directorships also include board tenure with Marvel Entertainment, Inc. (through December 2009) and TG Therapeutics, Inc. (from March 2012 through the current date). Mr. Charney is a graduate of Hofstra University with a Bachelor’s degree in Business Administration (Accounting), and has also completed an Executive Master’s program at Columbia University. Mr. Charney maintains active membership with the American Institute of Certified Public Accountants and the New York State Society of Certified Public Accountants. Barak Cohen. Mr. Cohen is a Managing Director at Quantum Pacific (UK) LLP, and a board member of ZIM and of Qoros, each of which may be associated with the same ultimate beneficiary, Mr. Idan Ofer. In September 2018, Mr. Cohen was appointed to the board of directors of Kenon, having served as Co-CEO of Kenon till that time. Prior to serving as Kenon’s Co-CEO, Mr. Cohen served as Kenon’s Vice President of Business Development and Investor Relations from 2015 to September 2017. Prior to joining Kenon in 2015, Mr. Cohen worked in various capacities at IC since 2008 most recently as IC’s Senior Director of Business Development and Investor Relations. Prior to joining IC, Mr. Cohen held positions at Lehman Brothers (UK) and Ernst & Young (Israel). Mr. Cohen holds Bachelor’s degrees in Economics, summa cum laude, and Accounting & Management, magna cum laude, both from Tel Aviv University. Cyril Pierre-Jean Ducau. Mr. Ducau is the Chief Executive Officer of Ansonia and the Chief Executive Officer of Eastern Pacific Shipping Pte Ltd, a leading shipping company based in Singapore. He is a member of the board of directors of Ansonia as well as other private companies, each of which may be associated with the same ultimate beneficiary, Mr. Idan Ofer. He is also currently the Chairman of Cool Company Ltd, a NYSE-listed shipping company and an independent director of the Singapore Maritime Foundation and of the Global Centre for Maritime Decarbonisation Limited, which were established by the Maritime and Port Authority of Singapore. He is also a member of the board of directors of Gard P&I (Bermuda) Ltd, a leading maritime insurer. He was previously Head of Business Development of Quantum Pacific Advisory Limited in London from 2008 to 2012 and acted as Director and then Chairman of Pacific Drilling SA untilbetween 2011 and 2018. Prior to joining Quantum Pacific Advisory Limited, in 2008, Mr. Ducau was Vice President in the Investment Banking Division of Morgan Stanley & Co. International Ltd. In London.in London and, during his tenure there from 2000 to 2008, he held various positions in the Capital Markets, Leveraged Finance and Mergers and Acquisitions teams. Mr. Ducau graduated from ESCP Europe Business School (Paris, Oxford, Berlin) and holds a Master of Science in business administration and a Diplom Kaufmann. N. Scott Fine. Mr. Fine is the Chief Executive Officer and an Executive Director of Cyclo Therapeutics, Inc., a biotechnology company focused on developing novel therapeutics based on cyclodextrin technologies. Mr. Fine has been involved in investment banking for over 35 years, working on a multitude of debt and equity financings, buy and sell side mergers and acquisitions, strategic advisory work and corporate restructurings. Much of his time has been focused on transactions in the healthcare and consumer products area, including time with The Tempo Group of Jakarta, Indonesia. Mr. Fine was the lead investment banker on the IPO of Keurig Green Mountain Coffee Roasters and Central European Distribution Corporation, or CEDC, a multi-billion-dollar alcohol company. He was also involved in an Equity Strategic Alliance between Research Medical and the Tempo Group. Mr. Fine continued his involvement with CEDC, serving as a director from 1996 until 2014, during which time he led the CEDC Board’s successful efforts in 2013 to restructure the company through a pre-packaged Chapter 11 process whereby CEDC was acquired by the Russian Standard alcohol group. Recently, Mr. Fine served as Vice Chairman and Chairman of the Restructuring Committee of Pacific Drilling SA from 2017 to 2018 where he successfully led the Independent Directors to a successful reorganization. He also served as Sole Director of Better Place Inc. from 2013 until 2015. In that role, Mr. Fine successfully managed the global wind down of the company in a timely and efficient manner which was approved by both the Delaware and Israeli courts. Mr. Fine devotes time to several non-profit organizations, including through his service on the Board of Trustees for the IWM American Air Museum in Britain. He and his wife, Cathy are also the Executive Producers of “The Concert for Newtown” with Peter Yarrow of Peter, Paul, and Mary. Mr. Fine has been a guest lecturer at Ohio State University’s Moritz School of Law and Fordham University Law School. Bill Foo. Dr. Bill Foo is a director and corporate advisor of several private, listed and non-profit entities, including Mewah International Inc., CDL Hospitality Trusts, Tung Lok Restaurants (2000) Ltd., M&C REIT Management Ltd and chairing Investible Funds VCC as well as the Salvation Army and James Cook University Singapore organizations. In May 2017, Dr. Foo was appointed to the board of directors of Kenon, having served as a director of IC Power between November 2015 and January 2018. Prior to his retirement, Dr. Foo worked in financial services for over 30 years, including serving as CEO of ANZ Singapore and South East Asia Head of Investment Banking for Schroders. Dr. Foo has also worked in various positions at Citibank and Bank of America and has been a director of several listed and government-related entities, including International Enterprise Singapore (Trade Agency), where he chaired the Audit Committee for several years. Dr. Foo has a Master’s Degree in Business Administration from McGill University and a Bachelor of Business Administration from Concordia University and an honorary Doctor of Commerce from James Cook University Australia. Aviad Kaufman. Mr. Kaufman is the Chief Executive Officer of One Globe Business Advisory Ltd, the chairman of IC, and a board member of ICL Group Ltd., OPC and other private companies, each of which may be associated with Mr. Idan Ofer. From 2017 until July 2021, Mr. Kaufman served as the Chief Executive Officer of Quantum Pacific (UK) LLP and from 2008 until 2017 as Chief Financial Officer of Quantum Pacific (UK) LLP (and its predecessor Quantum Pacific Advisory Limited). From 2002 until 2007, Mr. Kaufman fulfilled different senior corporate finance roles at Amdocs Ltd. Previously, Mr. Kaufman held various consultancy positions with KPMG. Mr. Kaufman is a certified public accountant and holds a Bachelor’s degree in Accounting and Economics from the Hebrew University in Jerusalem (with distinction), and a Master’s of Business Administration in Finance from Tel Aviv University. Robert L. Rosen. Mr. Rosen has served as CEO of Kenon since September 2017 and also serves on the board of Kenon as an executive director and on the board of OPC as director. Prior to becoming CEO, Mr. Rosen served as General Counsel of Kenon upon joining Kenon in 2014. Prior to joining Kenon, Mr. Rosen spent 15 years in private practice with top tier law firms, including Linklaters LLP and Milbank LLP. Mr. Rosen is admitted to the Bar in the State of New York, holds a Bachelor’s degree with honors from Boston University and a JD and MBA, both from the University of Pittsburgh, where he graduated with high honors. Arunava Sen. Mr. Sen is Director of Coromandel Advisors Pte Ltd, a Singapore-based company that provides strategic and transactional advice to global investors in the infrastructure and clean energy sectors. In May 2017, Mr. Sen was appointed to the board of directors of Kenon, having served as a director of IC Power between November 2015 and January 2018. Between August 2010 and February 2015, Mr. Sen was CEO and Managing Director of Lanco Power International Pte Ltd, a Singapore-registered company focused on the development of power projects globally. Previously, Mr. Sen held several senior roles at Globeleq Ltd, a Houston-based power investment company, including COO, CEO—Latin America and CEO—Asia. In 1999, Mr. Sen cofounded and was COO of Hart Energy International, a Houston-based company that developed and invested in power businesses in Latin America and the Caribbean. Mr. Sen currently serves on the investment committeescommittee of SUSI Asia Energy Transition Fund and Armstrong SE Asia Clean Energy Fund. A qualified Chartered Accountant, Mr. Sen holds a B.Com. degree from the University of Calcutta and an M.S. degree in Finance from The American University in Washington, DC. Tan Beng Tee. Ms. Tan is the Executive Director of the Singapore Maritime Foundation. She started her career in the public service and spent the next 40 years with the statutory boards under the Ministry of Trade and Industry (Trade Development Board and International Enterprise Singapore) and the Ministry of Transport (Maritime and Port Authority of Singapore). From 2012 to 2020, Ms. Tan was the Assistant Chief Executive (Development) of MPA. She remains at MPA as Senior Advisor. Prior to joining MPA in 2004, Ms. Tan was Director at the International Enterprise Singapore (now merged into Enterprise Singapore). For her service in developing Singapore as an International Maritime Centre, Ms. Tan received the Public Administration Medal (Silver) in 1997, (Silver)(Bar) in 2012, and (Gold) in 2020. From the industry, Ms. Tan received a Lifetime Achievement Award from Lloyd's List in 2008, and Seatrade in 2018. Ms. Tan serves on the boards of the Singapore Chamber of Maritime Arbitration and the National University of Singapore’s Centre for Maritime Studies. She also serves on the committees of the Nanyang Technological University’s College of Civil and Environmental Engineering, the Singapore Maritime Academy at Singapore Polytechnic, Singapore War Risk Mutual and on the Marine Insurance Committee of the General Insurance Association. Ms. Tan holds a degree in Business Administration from the National University of Singapore and a Diploma in Shipping from the Norad Fellowship in Oslo, Norway. Senior Management Robert Rosen.Deepa Joseph. Mr. Rosen has served as CEO of Kenon since September 2017 and is a board member of OPC. Prior to becoming CEO, Mr. Rosen served as General Counsel of Kenon upon joiningMs. Joseph joined Kenon in 2014. Prior to joining Kenon, Mr. Rosen spent 15 years in private practice with top tier law firms, including Linklaters LLPJune 2023 and Milbank LLP. Mr. Rosen is admitted to the Bar in the State of New York, holds a Bachelor’s degree with honors from Boston University and a JD and MBA, both from the University of Pittsburgh, where he graduated with high honors.
Mark Hasson. Mr. Hasson has served as Chief Financial Officer at Kenon since October 2017.from September 2023. Ms. Joseph also serves as Chief Financial Officer of Ansonia. Prior to joining Kenon in 2017, Mr. HassonAnsonia, Ms. Joseph served in various senior finance positions from 2012 to 2023 in SingaporeEastern Pacific Shipping Pte. Ltd. and Australia. He holds a Bachelor’s degree in Finance and Accounting fromQuantum Pacific Shipping Services Pte. Ltd, each of which may be associated with the University of Cape Town in South Africa andsame ultimate beneficiary, Mr. Idan Ofer. She is a Chartered Accountant (Institute of Singapore Chartered AccountantsAccountants). She holds a Masters in EnglandBusiness Administration (specializing in Accountancy) from Nanyang Business School, Singapore and Wales).Bachelors in Science (Mathematics) from Mahatma Gandhi University, India.
We pay our directors compensation for serving as directors, including per meeting fees. For the year ended December 31, 2022,2023, the aggregate compensation accrued (comprising remuneration and the aggregate fair market value of equity awards granted) for our directors and executive officers was approximately $3 million. For further information on Kenon’s Share Incentive Plan 2014 and Share Option Plan 2014, see “Item 6.E Share Ownership.” As a foreign private issuer, we are permitted to follow certain home country corporate governance practices instead of those otherwise required under the NYSE’s rules for domestic U.S. issuers, provided that we disclose which requirements we are not following and describe the equivalent home country requirement. Nonetheless, we have elected to applygenerally follow the corporate governance rules of the NYSE that are applicable to U.S. domestic registrants that are not “controlled” companies. Board of Directors Our constitutionConstitution gives our board of directors general powers to manage our business. The board of directors, which consists of eightten directors, oversees and provides policy guidance on our strategic and business planning processes, oversees the conduct of our business by senior management and is principally responsible for the succession planning for our key executives. Cyril Pierre-Jean Ducau serves as our Chairman. Director Independence Pursuant to the NYSE’s listing standards, listed companies are required to have a majority of independent directors. Under the NYSE’s listing standards, (i) a director employed by us or that has, or had, certain relationships with us during the last three years, cannot be deemed to be an independent director, and (ii) directors will qualify as independent only if our board of directors affirmatively determines that they have no material relationship with us, either directly or as a partner, shareholder or officer of an organization that has a relationship with us. Ownership of a significant amount of our shares, by itself, does not constitute a material relationship. Although we are permitted to follow home country practice in lieu of the requirement to have a board of directors comprised of a majority of independent directors according to NYSE listing standards, we have determined that we are in compliance with this requirement and that all of our board of directors is independent according to the NYSE’s listing standards. Our board of directors has affirmatively determined that each of Antoine Bonnier, Arunava Sen, Aviad Kaufman, Barak Cohen, Bill Foo, Cyril Pierre-Jean Ducau, Laurence N. Charney and N. Scott Fine, representing all of our eight directors, are currently “independent directors” as defined under the applicable rules and regulations of the NYSE. Election and Removal of Directors See “Item 10.B Constitution.” Service Contracts None of our board members have service contracts with us or any of our businesses providing for benefits upon termination of employment. Indemnifications and Limitations on Liability For information on the indemnification and limitations on liability of our directors, see “Item 10.B Constitution.” Committees of our Board of Directors We have established four committees, which report regularly to our board of directors on matters relating to the specific areas of risk the committees oversee: the audit committee, the nominating and corporate governance committee, the compensation committee and the ESG committee. Although we are permitted to follow home country practices with respect to our establishment of the nominating and corporate governance and compensation committees, we have determined that we are in compliance with the NYSE’s requirements in these respects. Audit Committee We have established an audit committee to review and discuss with management significant financial, legal and regulatory risks and the steps management takes to monitor, control and report such exposures; our audit committee also oversees the periodic enterprise-wide risk evaluations conducted by management. Specifically, our audit committee oversees the process concerning: the quality and integrity of our financial statements and internal controls; the compensation, qualifications, evaluation and independence of, and making a recommendation to our board for recommendation to the annual general meeting for appointment of, our independent registered public accounting firm; the performance of our internal audit function; our compliance with legal and regulatory requirements; and review of related party transactions. All three members of our audit committee, Laurence N. Charney, N. Scott Fine and Arunava Sen, are independent directors. Our board of directors has determined that Laurence N. Charney is an audit committee financial expert, as defined under the applicable rules of the SEC, and that each of our audit committee members has the requisite financial sophistication as defined under the applicable rules and regulations of each of the SEC and the NYSE. Our audit committee operates under a written charter that satisfies the applicable standards of each of the SEC and the NYSE. Nominating and Corporate Governance Committee Our nominating and corporate governance committee oversees the management of risks associated with board governance, director independence and conflicts of interest. Specifically, our nominating and corporate governance committee is responsible for identifying qualified candidates to become directors, recommending to the board of directors candidates for all directorships, overseeing the annual evaluation of the board of directors and its committees and taking a leadership role in shaping our corporate governance. Our nominating and corporate governance committee considers candidates for directordirectors who are recommended by its members, by other board members and members of our management, as well as those identified by any third-party search firms retained by it to assist in identifying and evaluating possible candidates. The nominating and corporate governance committee also considers recommendations for director candidates submitted by our shareholders. The nominating and corporate governance committee evaluates and recommends to the board of directors qualified candidates for election, re-election or appointment to the board, as applicable. When evaluating director candidates, the nominating and corporate governance committee seeks to ensure that the board of directors has the requisite skills, experience and expertise and that its members consist of persons with appropriately diverse and independent backgrounds. The nominating and corporate governance committee considers all aspects of a candidate’s qualifications in the context of our needs, including: personal and professional integrity, ethics and values; experience and expertise as an officer in corporate management; diversity considerations; experience in the industry of any of our portfolio businesses and international business and familiarity with our operations; experience as a board member of another publicly traded company; practical and mature business judgment; the extent to which a candidate would fill a present need on the board of directors; and the other ongoing commitments and obligations of the candidate. The nominating and corporate governance committee does not have any minimum criteria for director candidates. Consideration of new director candidates will typically involve a series of internal discussions, review of information concerning candidates and interviews with selected candidates. As a foreign private issuer, we are permitted to follow home country practice in lieu of the requirement to have a nominating and corporate governance committee comprised entirely of independent directors. Nonetheless, we have determined that all three members of our nominating and corporate governance committee, Cyril Pierre-Jean Ducau, Bill Foo and Aviad Kaufman are independent directors as defined under the applicable rules of the NYSE.
The members of our nominating and corporate governance committee are Cyril Pierre-Jean Ducau, Bill Foo and Aviad Kaufman. Our nominating and corporate governance committee operates under a written charter that satisfies the applicable standards of the NYSE for foreign private issuers. Compensation Committee Our compensation committee assists our board in reviewing and approving the compensation structure of our directors and officers, including all forms of compensation to be provided to our directors and officers. The compensation committee is responsible for, among other things: reviewing and determining the compensation package for our Chief Executive Officer and other senior executives; reviewing and making recommendations to our board with respect to the compensation of our non-employee directors; reviewing and approving corporate goals and objectives relevant to the compensation of our Chief Executive Officer and other senior executives, including evaluating their performance in light of such goals and objectives; and reviewing periodically and approving and administering stock options plans, long-term incentive compensation or equity plans, programs or similar arrangements, annual bonuses, employee pension and welfare benefit plans for all employees, including reviewing and approving the granting of options and other incentive awards. As a foreign private issuer, we are permitted to follow home country practice in lieu of the requirement to have a compensation committee comprised entirely of independent directors. Nonetheless, we have determined that all threeThe members of our compensation committee are N. Scott Fine, Laurence N. Charney and Aviad Kaufman are independent directors as defined under the applicable rules of the NYSE. Our compensation committee operates under a written charter that satisfies the applicable standards of the NYSE.Kaufman.
ESG Committee We have established an ESG committee to carry out the responsibilities delegated by the board of directors regarding the oversight of Kenon’s risks, opportunities, strategies, goals, and policies and procedures related to environmental, social, and governance. Specifically, our ESG committee’s responsibilities include: monitoring and advising the board of directors on our risks and opportunities related to ESG matters; reviewing and discussing with management our goals, strategies, and policies and procedures to address ESG risks and opportunities; reviewing and advising the board of directors on our performance related to the ESG goals, strategies, and policies and procedures; reviewing and approving policies and procedures used to prepare ESG-related statements and disclosures, including statements and disclosures to be furnished or filed with the SEC; monitoring disclosure requirements under applicable laws, regulations and stock exchange rules and overseeing our plans and processes to comply with such disclosure requirements; overseeing our ESG-related engagement efforts with shareholders, other key stakeholders and reviewing and advising the board of directors on ESG-related shareholder proposals; reviewing our government relations strategies and activities, including any political activities and contributions and lobbying activities; and reviewing our charitable programs and community investment activities. The members of our ESG committee are Arunava Sen, Cyril Pierre-Jean Ducau, and Laurence N. Charney.Charney and Robert L. Rosen. Our ESG committee operates under a written charter. Code of Ethics and Ethical Guidelines Our board of directors has adopted a code of ethics that describes our commitment to, and requirements in connection with, ethical issues relevant to business practices and personal conduct. As of December 31, 2022,2023, we and our consolidated subsidiaries employed 288325 individuals, respectively, as follows: | Company | | | | OPC(1) | | | 281319 | | | Kenon | | | | | | Total | | | | |
_____________________________________________________________________________
| (1) | This table includes CPV’s employees. |
OPC As of December 31, 2022,2023, OPC employed 281319 employees (including 131150 CPV employees). For further information on OPC’s employees, see “Item 4.B Business Overview—Our Businesses—OPC—OPC’s Description of Operations—Employees.” ZIM As of December 31, 2022,2023, ZIM employed 6,5306,460 employees worldwide (including contract workers), including 830860 employees based in Israel. A significant number of ZIM’s Israeli employees are unionized and ZIM is party to numerous collective agreements with respect to its employees. For further information on the risks related to ZIM’s unionized employees, see “Item 3.D Risk Factors—Risks Related to the Industries in Whichwhich Our Businesses Operate—Our businesses may be adversely affected by work stoppages, union negotiations, labor disputes and other matters associated with our labor force.” Interests of our Directors and our Employees Kenon has established the Share Incentive Plan 2014 and the Share Option Plan 2014 for its directors and management. The Share Incentive Plan 2014 and the Share Option Plan 2014 provide grants of Kenon’s shares, and stock options in respect of Kenon’s shares, respectively, to management and directors of Kenon, or to officers of Kenon’s subsidiaries or associated companies, pursuant to awards, which may be granted by Kenon from time to time. The total number of shares underlying awards which may be granted under the Share Incentive Plan 2014 or delivered pursuant to the exercise of options granted under the Share Option Plan 2014 shall not, in the aggregate, exceed 3% of the total issued shares (excluding treasury shares) of Kenon. Kenon granted awards of shares to directors and certain members of its management under the Share Incentive Plan 2014 in 2022,2023, with a value of $0.4 million. Equity Awards to Certain Executive Officers—Subsidiaries and Associated Companies Kenon’s subsidiaries and associated companies may, from time to time, adopt equity compensation arrangements for officers and directors of the relevant entity. Kenon expects any such arrangements to be on customary terms and within customary limits (in terms of dilution). | ITEM 7. | Major Shareholders and Related Party Transactions |
The following table sets forth information regarding the beneficial ownership of our ordinary shares as of March 29, 2023,26, 2024, by each person or entity beneficially owning 5% or more of our ordinary shares, based upon the 53,894,41352,776,671 ordinary shares outstanding as of such date, which represents our entire issued and outstanding share capital as of such date. The information set out below is based on public filings with the SEC as of March 29, 2023.26, 2024. As of March 29, 2023, 53,891,43422, 2024, 52,775,030 of our shares (99.99%) were held by one holder of record in the United States, Cede & Co., as nominee for the Depository Trust Company, which indirectly holds our shares traded on the NYSE and the TASE. Such numbers are not representative of the portion of our shares held in the United States nor are they representative of the number of beneficial holders residing in the United States. Our remaining shares were held by 96 shareholders of record as of that date. All of our ordinary shares have the same voting rights. | Beneficial Owner (Name/Address) | | | | | Percentage of
Ordinary Shares | | Ansonia Holdings Singapore B.V.(1) | | | 32,497,569 | | | | 60.3 | % | Gilad Altshuler(2) | | | 3,615,360 | | | | 6.7 | % | | Laurence N. Charney | | | 49,180 | (3) | | | * | (4) | | Bill Foo | | | 16,420 | (3) | | | * | (4) | | Arunava Sen | | | 16,420 | (3) | | | * | (4) | | Nathan Scott Fine | | | 1,804 | (3) | | | * | (4) | Directors and Senior Management (Executive Officers)(5) | | | — | | | | * | (4) |
| Beneficial Owner | | | | | Percentage of
Ordinary Shares | | Ansonia Holdings Singapore B.V.(1) | | | 32,497,569 | | | | 61.6 | % | Gilad Altshuler(2) | | | 3,475,486 | | | | 6.6 | % | | Directors and Senior Management (Executive Officers) | | | — | | | | * | (3) |
________________________________________________________________________________
| (1) | Based solely on the Schedule 13-D/A (Amendment No. 5) filed by Ansonia Holdings Singapore B.V. with the SEC on July 7, 2021. A discretionary trust, in which Mr. Idan Ofer is the beneficiary, indirectly holds 100% of Ansonia Holdings Singapore B.V. |
| (2) | Based solely on the Schedule 13-G13-G/A filed by Gilad Altshuler with the SEC on February 21, 2023.12, 2024. According to the Schedule 13-G, the 3,615,3603,475,486 ordinary shares consists of (i) 3,325,657 ordinary shares by provident and pension funds managed by Altshuler Shaham Provident & Pension Funds Ltd., a majority-owned, indirect subsidiary of Altshuler-Shaham Ltd., (ii) 277,203143,829 ordinary shares held by mutual funds managed by Altshuler Shaham Mutual Funds Management Ltd., also a majority-owned subsidiary of Altshuler-Shaham Ltd, and (iii) 12,4,5006,000 ordinary shares held by hedge funds managed by Altshuler Shaham Owl, Limited Partnership, an affiliate of Altshuler-Shaham Ltd. |
| (3) | Based solely on Exhibit 99.3 to the Form 6-K furnished by Kenon with the SEC on April 27, 2022.
|
(4) | Owns less than 1% of Kenon’s ordinary shares. |
(5) | Excludes shares held by Laurence N. Charney, Bill Foo, Arunava Sen and Nathan Scott Fine.
|
Beneficial ownership is determined in accordance with the rules and regulations of the SEC. In computing the number of shares beneficially owned by a person and the percentage ownership of that person, we have included shares that such person has the right to acquire within 60 days, including through the exercise of any option, warrant or other right or the conversion of any other security. These shares, however, are not included in the computation of the percentage ownership of any other person. We are not aware of any arrangement that may, at a subsequent date, result in a change of our control. | B. | Related Party Transactions |
Kenon Pursuant to its charter, the audit committee must review and approve all related party transactions. The audit committee has a written policy with respect to the approval of related party transactions. In addition, we have undertaken that, for so long as we are listed on the NYSE, to the extent that we or our subsidiaries will enter into transactions with related parties, such transactions will be considered and approved by us or our wholly-owned subsidiaries in a manner that is consistent with customary practices followed by companies incorporated in Delaware and shall be reviewed in accordance with the requirements of Delaware law. We are party to several related party transactions with certain of our affiliates. Set forth below is a summary of these transactions. For further information, see Note 27 to our financial statements included in this annual report. OPC Sales of Electricity and Gas OPC-Rotem sells electricity through PPAs to some entities that are considered to be related parties, including the ORL Group. OPC-Rotem recorded revenues fromGroup which was considered a related parties in the amountparty for a portion of $252 million in2023 but is no longer considered a related party during the year ended December 31, 2022.2023. OPC-Rotem and OPC-Hadera Financing Agreements OPC-Rotem and OPC-Hadera have entered into financing agreements for the financing of their power plant projects, see “Item 5.B Liquidity and Capital Resources—OPC’s Liquidity and Capital Resources—OPC’s Material Indebtedness—OPC-Hadera Financing Agreement” and “Item 5.B Liquidity and Capital Resources—OPC’s Liquidity and Capital Resources—OPC’s Material Indebtedness—OPC-Rotem Financing Agreement.” One of the lenders under both of these agreements is a financial institution that is an OPC related party. ZIM Vessels chartered-in from interested and related parties ZIM has been chartering in vessels from corporations affiliated with Kenon and/or its controlling shareholders. Yair Caspi, Yoav Sebba and Barak Cohen, who serve on ZIM’s Board of Directors, also serve as either employees, officers or directors in Kenon or in other entities affiliated with Kenon. All such charters were approved as non-extraordinary transactions within the meaning of such term in the Companies Law (i.e., transactions conducted in the ordinary course of business, on market terms and which do not have a material impact on ZIM’s assets, liabilities or profits). The aggregate amount paid in connection with these charters during the year ended December 31, 2023 was $42.7 million. | C. | Interests of Experts and Counsel |
Not applicable. | ITEM 8. | Financial Information |
| A. | Consolidated Statements and Other Financial Information |
For information on the financial statements filed as a part of this annual report, see “Item 18. Financial Statements.” For information on our legal proceedings, see “Item 4.B Business Overview” and Note 20 to our financial statements included in this annual report. For information on our dividend policy, see “Item 10.B Constitution.” For information on any significant changes that may have occurred since the date of our annual financial statements, see “Item 5. Operating and Financial Review and Prospects—Recent Developments.”
| ITEM 9. | The Offer and Listing |
| A. | Offer and Listing Details |
Kenon’s ordinary shares are listed on the TASE (trading symbol: KEN), our primary host market, and the NYSE (trading symbol: KEN), our principal market outside our host market. Not applicable. Our ordinary shares are listed on each of the NYSE and the TASE under the symbol “KEN.” Not applicable. Not applicable. Not applicable. | ITEM 10. | Additional Information |
Not applicable. The following description of our constitutionConstitution is a summary and is qualified by reference to the constitution,Constitution, a copy of which has been filed with the SEC. Subject to the provisions of the Singapore Companies Act and any other written law and its constitution,Constitution, the Company has full capacity to carry on or undertake any business or activity, do any act or enter into any transaction. New Shares Under Singapore law, new shares may be issued only with the prior approval of our shareholders in a general meeting. General approval may be sought from our shareholders in a general meeting for the issue of shares. Approval, if granted, will lapse at the earliest of: the conclusion of the next annual general meeting; the expiration of the period within which the next annual general meeting is required by law to be held (i.e., within six months after our financial year end, being December 31); or the subsequent revocation or modification of approval by our shareholders acting at a duly convened general meeting. Our shareholders have provided such general authority to issue new shares until the conclusion of our 20212024 annual general meeting. Subject to this and the provisions of the Singapore Companies Act and our constitution,Constitution, all new shares are under the control of the directors who may allot and issue new shares to such persons on such terms and conditions and with the rights and restrictions as they may think fit to impose. Preference Shares Our constitutionConstitution provides that we may issue shares of a different class with preferential, deferred or other special rights, privileges or conditions as our board of directors may determine. Under the Singapore Companies Act, our preference shareholders will have the right to attend any general meeting insofar as the circumstances set forth below apply and on a poll at such general meeting, to have at least one vote for every preference share held: upon any resolution concerning the winding-up of our company under section 160 of the Insolvency, Restructuring and Dissolution Act 2018; and upon any resolution which varies the rights attached to such preference shares. We may, subject to the prior approval in a general meeting of our shareholders, issue preference shares which are, or at our option, subject to redemption provided that such preference shares may not be redeemed out of capital unless: all the directors have made a solvency statement in relation to such redemption; and we have lodged a copy of the statement with the Singapore Registrar of Companies. Further, the shares must be fully paid-up before they are redeemed. Transfer of Ordinary Shares Subject to applicable securities laws in relevant jurisdictions and our constitution,Constitution, our ordinary shares are freely transferable. Shares may be transferred by a duly signed instrument of transfer in any usual or common form or in a form acceptable to our directors. The directors may decline to register any transfer unless, among other things, evidence of payment of any stamp duty payable with respect to the transfer is provided together with other evidence of ownership and title as the directors may require. We will replace lost or destroyed certificates for shares upon notice to us and upon, among other things, the applicant furnishing evidence and indemnity as the directors may require and the payment of all applicable fees. Election and Re-election of Directors Under our constitution,Constitution, our shareholders by ordinary resolution, or our board of directors, may appoint any person to be a director as an additional director or to fill a casual vacancy, provided that any person so appointed by our board of directors shall hold office only until the next annual general meeting, and shall then be eligible for re-election. Our constitutionConstitution provides that, subject to the Singapore Companies Act, no person other than a director retiring at a general meeting is eligible for appointment as a director at any general meeting, without the recommendation of the Board for election, unless (i) in the case of a member or members who in aggregate hold(s) more than 50% of the total number of our issued and paid-up shares (excluding treasury shares), not less than ten days, or (ii) in the case of a member or members who in aggregate hold(s) more than 5% of the total number of our issued and paid-up shares (excluding treasury shares), not less than 120 days, before the date of the notice provided to members in connection with the general meeting, a written notice signed by such member or members (other than the person to be proposed for appointment) who (iii) are qualified to attend and vote at the meeting for which such notice is given, and (iv) have held shares representing the prescribed threshold in (i) or (ii) above, for a continuous period of at least one year prior to the date on which such notice is given, is lodged at our registered office. Such a notice must also include the consent of the person nominated. Shareholders’ Meetings We are required to hold an annual general meeting each year. Annual general meetings must be held within six months after our financial year end, being December 31. The directors may convene an extraordinary general meeting whenever they think fit and they must do so upon the written request of shareholders representing not less than one-tenth of the paid-up shares as at the date of deposit carries the right to vote at general meetings (disregarding paid-up shares held as treasury shares). In addition, two or more shareholders holding not less than one-tenth of our total number of issued shares (excluding our treasury shares) may call a meeting of our shareholders. The Singapore Companies Act requires not less than: 14 days’ written notice to be given by Kenon of a general meeting to pass an ordinary resolution; and 21 days’ written notice to be given by Kenon of a general meeting to pass a special resolution, to every member and the auditors of Kenon. Our constitutionConstitution further provides that in computing the notice period, both the day on which the notice is served, or deemed to be served, and the day for which the notice is given shall be excluded. Unless otherwise required by law or by our constitution,Constitution, voting at general meetings is by ordinary resolution, requiring the affirmative vote of a simple majority of the shares present in person or represented by proxy at the meeting and entitled to vote on the resolution. An ordinary resolution suffices, for example, for appointments of directors. A special resolution, requiring an affirmative vote of not less than three-fourths of the shares present in person or represented by proxy at the meeting and entitled to vote on the resolution, is necessary for certain matters under Singapore law, such as an alteration of our constitution.Constitution. Voting Rights Voting at any meeting of shareholders is by a show of hands unless a poll is duly demanded before or on the declaration of the result of the show of hands. If voting is by a show of hands, every shareholder who is entitled to vote and who is present in person or by proxy at the meeting has one vote. On a poll, every shareholder who is present in person or by proxy or by attorney, or in the case of a corporation, by a representative, has one vote for every share held by him or which he represents. Dividends We have no current plans to pay annual or semi-annual cash dividends. However, we may, in the event that we divest a portion of, or our entire equity interest in, any of our businesses, distribute such cash proceeds or declare a distribution-in-kind of shares in our investee companies. Any dividends would be limited by the amount of available distributable reserves, which, under Singapore law, will be assessed on the basis of Kenon’s stand-alone accounts (which will be based upon the SFRS). Under Singapore law, it is also possible to effect a capital reduction exercise to return cash and/or assets to our shareholders. The completion of a capital reduction exercise may require the approval of the Singapore Courts, and we may not be successful in our attempts to obtain such approval. Additionally, because we are a holding company, our ability to pay cash dividends, or declare a distribution-in-kind of the ordinary shares of any of our businesses, may be limited by restrictions on our ability to obtain sufficient funds through dividends from our businesses, including restrictions under the terms of the agreements governing the indebtedness of our businesses. Subject to the foregoing, the payment of cash dividends in the future, if any, will be at the discretion of our board of directors and will depend upon such factors as earnings levels, capital requirements, contractual restrictions, our overall financial condition, available distributable reserves and any other factors deemed relevant by our board of directors. Generally, a final dividend is declared out of profits disclosed by the accounts presented to the annual general meeting, and requires approval of our shareholders. However, our board of directors can declare interim dividends without approval of our shareholders. Bonus Issues In a general meeting, our shareholders may, upon the recommendation of the directors, capitalize any reserves or profits and distribute them as fully paid bonus shares to the shareholders in proportion to their shareholdings. Takeovers The Singapore Code on Take-overs and Mergers, the Singapore Companies Act and the Securities and Futures Act 2001 regulate, among other things, the acquisition of ordinary shares of Singapore-incorporated public companies. Any person acquiring an interest, whether by a series of transactions over a period of time or not, either on his own or together with parties acting in concert with such person, in 30% or more of our voting shares, or, if such person holds, either on his own or together with parties acting in concert with such person, between 30% and 50% (both amounts inclusive) of our voting shares, and if such person (or parties acting in concert with such person) acquires additional voting shares representing more than 1% of our voting shares in any six-month period, must, except with the consent of the Securities Industry Council in Singapore, extend a mandatory takeover offer for the remaining voting shares in accordance with the provisions of the Singapore Code on Take-overs and Mergers. “Parties acting in concert” comprise individuals or companies who, pursuant to an agreement or understanding (whether formal or informal), cooperate, through the acquisition by any of them of shares in a company, to obtain or consolidate effective control of that company. Certain persons are presumed (unless the presumption is rebutted) to be acting in concert with each other. They include: a company and its related companies, the associated companies of any of the company and its related companies, companies whose associated companies include any of these companies and any person who has provided financial assistance (other than a bank in the ordinary course of business) to any of the foregoing for the purchase of voting rights; a company and its directors (including their close relatives, related trusts and companies controlled by any of the directors, their close relatives and related trusts); a company and its pension funds and employee share schemes; a person and any investment company, unit trust or other fund whose investment such person manages on a discretionary basis but only in respect of the investment account which such person manages; a financial or other professional adviser, including a stockbroker, and its clients in respect of shares held by the adviser and persons controlling, controlled by or under the same control as the adviser; directors of a company (including their close relatives, related trusts and companies controlled by any of such directors, their close relatives and related trusts) which is subject to an offer or where the directors have reason to believe a bona fide offer for the company may be imminent; partners; and an individual and such person’s close relatives, related trusts, any person who is accustomed to act in accordance with such person’s instructions and companies controlled by the individual, such person’s close relatives, related trusts or any person who is accustomed to act in accordance with such person’s instructions and any person who has provided financial assistance (other than a bank in the ordinary course of business) to any of the foregoing for the purchase of voting rights. Subject to certain exceptions, a mandatory takeover offer must be in cash or be accompanied by a cash alternative at not less than the highest price paid by the offeror or parties acting in concert with the offeror during the offer period and within the six months preceding the acquisition of shares that triggered the mandatory offer obligation. Under the Singapore Code on Take-overs and Mergers, where effective control of a company is acquired or consolidated by a person, or persons acting in concert, a general offer to all other shareholders is normally required. An offeror must treat all shareholders of the same class in an offeree company equally. A fundamental requirement is that shareholders in the company subject to the takeover offer must be given sufficient information, advice and time to consider and decide on the offer. These legal requirements may impede or delay a takeover of our company by a third party. In October 2014, the Securities Industry Council of Singapore waived application of the Singapore Code on Take-overs and Mergers to Kenon, subject to certain conditions. Pursuant to the waiver, for as long as Kenon is not listed on a securities exchange in Singapore, and except in the case of a tender offer (within the meaning of U.S. securities laws) where the offeror relies on a Tier 1 exemption to avoid full compliance with U.S. tender offer regulations, the Singapore Code on Take-overs and Mergers shall not apply to Kenon. Insofar as the Singapore Code on Take-overs and Mergers applies to Kenon, the Singapore Code on Take-overs and Mergers generally provides that the board of directors of Kenon should bring the offer to the shareholders of Kenon in accordance with the Singapore Code on Take-overs and Mergers and refrain from an action which will deny the shareholders from the possibility to decide on the offer. Liquidation or Other Return of Capital On a winding-up or other return of capital, subject to any special rights attaching to any other class of shares, holders of ordinary shares will be entitled to participate in any surplus assets in proportion to their shareholdings. Limitations on Rights to Hold or Vote Ordinary Shares Except as discussed above under “—Takeovers,” there are no limitations imposed by the laws of Singapore or by our constitutionConstitution on the right of non-resident shareholders to hold or vote ordinary shares. Limitations of Liability and Indemnification Matters Our constitutionConstitution currently provides that, subject to the provisions of the Singapore Companies Act and every other act applicable to Kenon, every director, secretary or other officer of our company or our subsidiaries and affiliates shall be entitled to be indemnified by our company against all costs, interest, charges, losses, expenses and liabilities incurred by him or her in the execution and discharge of his or her duties (and where he serves at our request as a director, officer, employee or agent of any of our subsidiaries or affiliates) or in relation thereto and in particular and without prejudice to the generality of the foregoing, no director, secretary or other officer of our company shall be liable for the acts, receipts, neglects or defaults of any other director or officer or for joining in any receipt or other act for conformity or for any loss or expense happening to our company through the insufficiency or deficiency of title to any property acquired by order of the directors for or on behalf of our company or for the insufficiency or deficiency of any security in or upon which any of the moneys of our company shall be invested or for any loss or damage arising from the bankruptcy, insolvency or tortious act of any person with whom any moneys, securities or effects shall be deposited or left or for any other loss, damage or misfortune whatever which shall happen in the execution of the duties of his or her office or in relation thereto unless the same shall happen through his or her own negligence, willful default, breach of duty or breach of trust. The limitation of liability and indemnification provisions in our constitutionConstitution may discourage shareholders from bringing a lawsuit against directors for breach of their fiduciary duties. They may also reduce the likelihood of derivative litigation against directors and officers, even though an action, if successful, might benefit us and our shareholders. A shareholder’s investment may be harmed to the extent we pay the costs of settlement and damage awards against directors and officers pursuant to these indemnification provisions. Insofar as indemnification for liabilities arising under the Securities Act of 1933, or the Securities Act, may be permitted to our directors, officers and controlling persons pursuant to the foregoing provisions, or otherwise, we have been advised that, in the opinion of the SEC, such indemnification is against public policy as expressed in the Securities Act, and is, therefore, unenforceable. Comparison of Shareholder Rights We are incorporated under the laws of Singapore. The following discussion summarizes material differences between the rights of holders of our ordinary shares and the rights of holders of the common stock of a typical corporation incorporated under the laws of the state of Delaware which result from differences in governing documents and the laws of Singapore and Delaware. This discussion does not purport to be a complete statement of the rights of holders of our ordinary shares under applicable law in Singapore and our constitutionConstitution or the rights of holders of the common stock of a typical corporation under applicable Delaware law and a typical certificate of incorporation and bylaws. | Delaware | | Singapore—Kenon Holdings Ltd. |
| Board of Directors | | A typical certificate of incorporation and bylaws would provide that the number of directors on the board of directors will be fixed from time to time by a vote of the majority of the authorized directors. Under Delaware law, a board of directors can be divided into classes and cumulative voting in the election of directors is only permitted if expressly authorized in a corporation’s certificate of incorporation. | | The constitution of companies will typically state the minimum and maximum number of directors as well as provide that the number of directors may be increased or reduced by shareholders via ordinary resolution passed at a general meeting, provided that the number of directors following such increase or reduction is within the maximum and minimum number of directors provided in the constitution and the Singapore Companies Act, respectively. Our constitutionConstitution provides that, unless otherwise determined by a general meeting, the minimum number of directors is five and the maximum number is 12. | | | | Limitation on Personal Liability of Directors | | A typical certificate of incorporation provides for the elimination of personal monetary liability of directors for breach of fiduciary duties as directors to the fullest extent permissible under the laws of Delaware, except for liability (i) for any breach of a director’s loyalty to the corporation or its stockholders, (ii) for acts or omissions not in good faith or which involve intentional misconduct or a knowing violation of law, (iii) under Section 174 of the Delaware General Corporation Law (relating to the liability of directors for unlawful payment of a dividend or an unlawful stock purchase or redemption) or (iv) for any transaction from which the director derived an improper personal benefit. A typical certificate of incorporation would also provide that if the Delaware General Corporation Law is amended so as to allow further elimination of, or limitations on, director liability, then the liability of directors will be eliminated or limited to the fullest extent permitted by the Delaware General Corporation Law as so amended. | | Pursuant to the Singapore Companies Act, any provision (whether in the constitution, contract or otherwise) purporting to exempt or indemnify a director (to any extent) from any liability attaching in connection with any negligence, default, breach of duty or breach of trust in relation to Kenon will be void except as permitted under the Singapore Companies Act. Nevertheless, a director can be released by the shareholders of Kenon for breaches of duty to Kenon, except in the case of fraud, illegality, insolvency and oppression or disregard of minority interests.
Our constitutionConstitution currently provides that, subject to the provisions of the Singapore Companies Act and every other act for the time being in force concerning companies and affecting Kenon, every director, auditor, secretary or other officer of Kenon and its subsidiaries and affiliates shall be entitled to be indemnified by Kenon against all liabilities incurred by him in the execution and discharge of his duties and where he serves at the request of Kenon as a director, officer, employee or agent of any subsidiary or affiliate of Kenon or in relation thereto, including any liability incurred by him in defending any proceedings, whether civil or criminal, which relate to anything done or omitted or alleged to have been done or omitted by him as an officer or employee of Kenon, and in which judgment is given in his favor (or the proceedings otherwise disposed of without any finding or admission of any material breach of duty on his part) or in which he is acquitted, or in connection with an application under statute in respect of such act or omission in which relief is granted to him by the court. |
| Delaware | | Singapore—Kenon Holdings Ltd. |
| Interested Shareholders | Section 203 of the Delaware General Corporation Law generally prohibits a Delaware corporation from engaging in specified corporate transactions (such as mergers, stock and asset sales, and loans) with an “interested stockholder” for three years following the time that the stockholder becomes an interested stockholder. Subject to specified exceptions, an “interested stockholder” is a person or group that owns 15% or more of the corporation’s outstanding voting stock (including any rights to acquire stock pursuant to an option, warrant, agreement, arrangement or understanding, or upon the exercise of conversion or exchange rights, and stock with respect to which the person has voting rights only), or is an affiliate or associate of the corporation and was the owner of 15% or more of the voting stock at any time within the previous three years.
A Delaware corporation may elect to “opt out” of, and not be governed by, Section 203 through a provision in either its original certificate of incorporation, or an amendment to its original certificate or bylaws that was approved by majority stockholder vote. With a limited exception, this amendment would not become effective until 12 months following its adoption. | | There are no comparable provisions in Singapore with respect to public companies which are not listed on the Singapore Exchange Securities Trading Limited. |
Delaware | | Singapore—Kenon Holdings Ltd. |
| Removal of Directors | | A typical certificate of incorporation and bylaws provide that, subject to the rights of holders of any preferred stock, directors may be removed at any time by the affirmative vote of the holders of at least a majority, or in some instances a supermajority, of the voting power of all of the then outstanding shares entitled to vote generally in the election of directors, voting together as a single class. A certificate of incorporation could also provide that such a right is only exercisable when a director is being removed for cause (removal of a director only for cause is the default rule in the case of a classified board). | | According to the Singapore Companies Act, directors of a public company may be removed before expiration of their term of office with or without cause by ordinary resolution (i.e., a resolution which is passed by a simple majority of those shareholders present and voting in person or by proxy). Notice of the intention to move such a resolution has to be given to Kenon not less than 28 days before the meeting at which it is moved. Kenon shall then give notice of such resolution to its shareholders not less than 14 days before the meeting. Where any director removed in this manner was appointed to represent the interests of any particular class of shareholders or debenture holders, the resolution to remove such director will not take effect until such director’s successor has been appointed.
Our constitutionConstitution provides that Kenon may by ordinary resolution of which special notice has been given, remove any director before the expiration of his period of office, notwithstanding anything in our constitutionConstitution or in any agreement between Kenon and such director and appoint another person in place of the director so removed. |
| Delaware | | Singapore—Kenon Holdings Ltd. |
| Filling Vacancies on the Board of Directors | | A typical certificate of incorporation and bylaws provide that, subject to the rights of the holders of any preferred stock, any vacancy, whether arising through death, resignation, retirement, disqualification, removal, an increase in the number of directors or any other reason, may be filled by a majority vote of the remaining directors, even if such directors remaining in office constitute less than a quorum, or by the sole remaining director. Any newly elected director usually holds office for the remainder of the full term expiring at the annual meeting of stockholders at which the term of the class of directors to which the newly elected director has been elected expires. | | The constitution of a Singapore company typically provides that the directors have the power to appoint any person to be a director, either to fill a vacancy or as an addition to the existing directors, but so that the total number of directors will not at any time exceed the maximum number fixed in the constitution. Any newly elected director shall hold office until the next following annual general meeting, where such director will then be eligible for re-election. Our constitutionConstitution provides that the shareholders may by ordinary resolution, or the directors may, appoint any person to be a director as an additional director or to fill a vacancy provided that any person so appointed by the directors will only hold office until the next annual general meeting, and will then be eligible for re-election. | | | | | | Amendment of Governing Documents | | Under the Delaware General Corporation Law, amendments to a corporation’s certificate of incorporation require the approval of stockholders holding a majority of the outstanding shares entitled to vote on the amendment. If a class vote on the amendment is required by the Delaware General Corporation Law, a majority of the outstanding stock of the class is required, unless a greater proportion is specified in the certificate of incorporation or by other provisions of the Delaware General Corporation Law. Under the Delaware General Corporation Law, the board of directors may amend bylaws if so authorized in the charter. The stockholders of a Delaware corporation also have the power to amend bylaws. | | Our constitutionConstitution may be altered by special resolution (i.e., a resolution passed by at least a three-fourths majority of the shares entitled to vote, present in person or by proxy at a meeting for which not less than 21 days’ written notice is given). The board of directors has no right to amend the constitution. |
| Delaware | | Singapore—Kenon Holdings Ltd. |
| Meetings of Shareholders | Annual and Special Meetings
Typical bylaws provide that annual meetings of stockholders are to be held on a date and at a time fixed by the board of directors. Under the Delaware General Corporation Law, a special meeting of stockholders may be called by the board of directors or by any other person authorized to do so in the certificate of incorporation or the bylaws.
Quorum Requirements
Under the Delaware General Corporation Law, a corporation’s certificate of incorporation or bylaws can specify the number of shares which constitute the quorum required to conduct business at a meeting, provided that in no event shall a quorum consist of less than one-third of the shares entitled to vote at a meeting. | | Annual General Meetings
All companies are required to hold an annual general meeting once every calendar year. The first annual general meeting was required to be held within 18 months of Kenon’s incorporation and subsequently, annual general meetings must be held within six months after Kenon’s financial year end.
Extraordinary General Meetings
Any general meeting other than the annual general meeting is called an “extraordinary general meeting.”meeting”. Two or more members (shareholders) holding not less than 10% of the total number of issued shares (excluding treasury shares) may call an extraordinary general meeting. In addition, the constitution usually also provides that general meetings may be convened in accordance with the Singapore Companies Act by the directors.
Notwithstanding anything in the constitution, the directors are required to convene a general meeting if required to do so by requisition (i.e., written notice to directors requiring that a meeting be called) by shareholder(s) holding not less than 10% of the total number of paid-up shares of Kenon carrying voting rights.
Our constitutionConstitution provides that the directors may, whenever they think fit, convene an extraordinary general meeting.
Quorum Requirements
Our constitutionConstitution provides that shareholders entitled to vote holding 33 and 1/3% of our issued and paid-up shares, present in person or by proxy at a meeting, shall be a quorum. In the event a quorum is not present, the meeting (i) (if not requisitioned by shareholders) may be adjourned for one week.week; and (ii) (if requisitioned by shareholders) shall be dissolved. |
| Delaware | | Singapore—Kenon Holdings Ltd. |
| Indemnification of Officers, Directors and Employers | Under the Delaware General Corporation Law, subject to specified limitations in the case of derivative suits brought by a corporation’s stockholders in its name, a corporation may indemnify any person who is made a party to any third-party action, suit or proceeding on account of being a director, officer, employee or agent of the corporation (or was serving at the request of the corporation in such capacity for another corporation, partnership, joint venture, trust or other enterprise) against expenses, including attorney’s fees, judgments, fines and amounts paid in settlement actually and reasonably incurred by him or her in connection with the action, suit or proceeding through, among other things, a majority vote of a quorum consisting of directors who were not parties to the suit or proceeding, if the person:
• acted in good faith and in a manner he or she reasonably believed to be in or not opposed to the best interests of the corporation or, in some circumstances, at least not opposed to its best interests; and
• in a criminal proceeding, had no reasonable cause to believe his or her conduct was unlawful.
Delaware corporate law permits indemnification by a corporation under similar circumstances for expenses (including attorneys’ fees) actually and reasonably incurred by such persons in connection with the defense or settlement of a derivative action or suit, except that no indemnification may be made in respect of any claim, issue or matter as to which the person is adjudged to be liable to the corporation unless the Delaware Court of Chancery or the court in which the action or suit was brought determines upon application that the person is fairly and reasonably entitled to indemnity for the expenses which the court deems to be proper.
To the extent a director, officer, employee or agent is successful in the defense of such an action, suit or proceeding, the corporation is required by Delaware corporate law to indemnify such person for expenses (including attorneys’ fees) actually and reasonably incurred thereby. Expenses (including attorneys’ fees) incurred by such persons in defending any action, suit or proceeding may be paid in advance of the final disposition of such action, suit or proceeding upon receipt of an undertaking by or on behalf of that person to repay the amount if it is ultimately determined that that person is not entitled to be so indemnified. | | The Singapore Companies Act specifically provides that Kenon is allowed to:
• purchase and maintain for any officer insurance against any liability attaching to such officer in respect of any negligence, default, breach of duty or breach of trust in relation to Kenon;
• indemnify such officer against liability incurred by a director to a person other than Kenon except when the indemnity is against (i) any liability of the director to pay a fine in criminal proceedings or a sum payable to a regulatory authority by way of a penalty in respect of non-compliance with any requirement of a regulatory nature (however arising); or (ii) any liability incurred by the officer (1) in defending criminal proceedings in which he is convicted, (2) in defending civil proceedings brought by Kenon or a related company of Kenon in which judgment is given against him or (3) in connection with an application for relief under specified sections of the Singapore Companies Act in which the court refuses to grant him relief; • indemnify any auditor against any liability incurred or to be incurred by such auditor in defending any proceedings (whether civil or criminal) in which judgment is given in such auditor’s favor or in which such auditor is acquitted; or
• indemnify any auditor against any liability incurred by such auditor in connection with any application under specified sections of the Singapore Companies Act in which relief is granted to such auditor by a court.
In cases where, inter alia, an officer is sued by Kenon, the Singapore Companies Act gives the court the power to relieve directors either wholly or partially from the consequences of their negligence, default, breach of duty or breach of trust. However, Singapore case law has indicated that such relief will not be granted to a director who has benefited as a result of his or her breach of trust. In order for relief to be obtained, it must be shown that (i) the director acted reasonably; (ii) the director acted honestly; and (iii) it is fair, having regard to all the circumstances of the case including those connected with such director’s appointment, to excuse the director.
Our constitutionConstitution currently provides that, subject to the provisions of the Singapore Companies Act and every other act for the time being in force concerning companies and affecting Kenon, every director, auditor, secretary or other officer of Kenon and its subsidiaries and affiliates shall be entitled to be indemnified by Kenon against all liabilities incurred by him in the execution and discharge of his duties and where he serves at the request of Kenon as a director, officer, employee or agent of any subsidiary or affiliate of Kenon or in relation thereto, including any liability incurred by him in defending any proceedings, whether civil or criminal, which relate to anything done or omitted or alleged to have been done or omitted by him as an officer or employee of Kenon, and in which judgment is given in his favor (or the proceedings otherwise disposed of without any finding or admission of any material breach of duty on his part) or in which he is acquitted, or in connection with an application under statute in respect of such act or omission in which relief is granted to him by the court. |
| Delaware | | Singapore—Kenon Holdings Ltd. |
| Shareholder Approval of Business Combinations | Generally, under the Delaware General Corporation Law, completion of a merger, consolidation, or the sale, lease or exchange of substantially all of a corporation’s assets or dissolution requires approval by the board of directors and by a majority (unless the certificate of incorporation requires a higher percentage) of outstanding stock of the corporation entitled to vote.
The Delaware General Corporation Law also requires a special vote of stockholders in connection with a business combination with an “interested stockholder” as defined in section 203 of the Delaware General Corporation Law. For further information on such provisions, see “—Interested Shareholders” above. | | The Singapore Companies Act mandates that specified corporate actions require approval by the shareholders in a general meeting, notably:
• notwithstanding anything in Kenon’s constitution,our Constitution, directors are not permitted to carry into effect any proposals for disposing of the whole or substantially the whole of Kenon’s undertaking or property unless those proposals have been approved by shareholders in a general meeting;
• subject to the constitution of each amalgamating company, an amalgamation proposal must be approved by the shareholders of each amalgamating company via special resolution at a general meeting; and
• notwithstanding anything in Kenon’s constitution,our Constitution, the directors may not, without the prior approval of shareholders, issue shares, including shares being issued in connection with corporate actions. |
| Shareholder Action Without a Meeting | | Under the Delaware General Corporation Law, unless otherwise provided in a corporation’s certificate of incorporation, any action that may be taken at a meeting of stockholders may be taken without a meeting, without prior notice and without a vote if the holders of outstanding stock, having not less than the minimum number of votes that would be necessary to authorize such action, consent in writing. It is not uncommon for a corporation’s certificate of incorporation to prohibit such action. | | There are no equivalent provisions under the Singapore Companies Act in respect of passing shareholders’ resolutions by written means that apply to public companies listed on a securities exchange. | | | | | | Shareholder Suits | | Under the Delaware General Corporation Law, a stockholder may bring a derivative action on behalf of the corporation to enforce the rights of the corporation. An individual also may commence a class action suit on behalf of himself or herself and other similarly situated stockholders where the requirements for maintaining a class action under the Delaware General Corporation Law have been met. A person may institute and maintain such a suit only if such person was a stockholder at the time of the transaction which is the subject of the suit or his or her shares thereafter devolved upon him or her by operation of law. Additionally, under Delaware case law, the plaintiff generally must be a stockholder not only at the time of the transaction which is the subject of the suit, but also through the duration of the derivative suit. Delaware Law also requires that the derivative plaintiff make a demand on the directors of the corporation to assert the corporate claim before the suit may be prosecuted by the derivative plaintiff, unless such demand would be futile. | | Derivative actions
The Singapore Companies Act has a provision which provides a mechanism enabling any registered shareholder to apply to the court for permission to bring a derivative action on behalf of the company.
In addition to registered shareholders, courts are given the discretion to allow such persons as they deem proper to apply as well (e.g., beneficial owners of shares or individual directors).
This provision of the Singapore Companies Act is primarily used by minority shareholders to bring an action in the name and on behalf of the company or intervene in an action to which the company is a party for the purpose of prosecuting, defending or discontinuing the action on behalf of the company.
Class actions
The concept of class action suits, which allows individual shareholders to bring an action seeking to represent the class or classes of shareholders, generally does not exist in Singapore. However, it is possible as a matter of procedure for a number of shareholders to lead an action and establish liability on behalf of themselves and other shareholders who join in or who are made parties to the action.
Further, there are certain circumstances in which shareholders may file and prove their claims for compensation in the event that Kenon has been convicted of a criminal offense or has a court order for the payment of a civil penalty made against it.
Additionally, for as long as Kenon is listed in the U.S. or in Israel, Kenon has undertaken not to claim that it is not subject to any derivative/class action that may be filed against it in the U.S. or Israel, as applicable, solely on the basis that it is a Singapore company. |
| Delaware | | Singapore—Kenon Holdings Ltd. |
| Dividends or Other Distributions; Repurchases and Redemptions | The Delaware General Corporation Law permits a corporation to declare and pay dividends out of statutory surplus or, if there is no surplus, out of net profits for the fiscal year in which the dividend is declared and/or for the preceding fiscal year as long as the amount of capital of the corporation following the declaration and payment of the dividend is not less than the aggregate amount of the capital represented by the issued and outstanding stock of all classes having a preference upon the distribution of assets.
Under the Delaware General Corporation Law, any corporation may purchase or redeem its own shares, except that generally it may not purchase or redeem these shares if the capital of the corporation is impaired at the time or would become impaired as a result of the redemption. A corporation may, however, purchase or redeem out of capital shares that are entitled upon any distribution of its assets to a preference over another class or series of its shares if the shares are to be retired and the capital reduced. | | The Singapore Companies Act provides that no dividends can be paid to shareholders except out of profits.
The Singapore Companies Act does not provide a definition on when profits are deemed to be available for the purpose of paying dividends and this is accordingly governed by case law. Our constitutionConstitution provides that no dividend can be paid otherwise than out of profits of Kenon.
Acquisition of a company’s own shares
The Singapore Companies Act generally prohibits a company from acquiring its own shares subject to certain exceptions. Any contract or transaction by which a company acquires or transfers its own shares is void. However, provided that it is expressly permitted to do so by its constitution and subject to the special conditions of each permitted acquisition contained in the Singapore Companies Act, Kenon may:
• redeem redeemable preference shares (the redemption of these shares will not reduce the capital of Kenon). Preference shares may be redeemed out of capital if all the directors make a solvency statement in relation to such redemption in accordance with the Singapore Companies Act;
• whether listed (on an approved exchange in Singapore or any securities exchange outside Singapore) or not, make an off-market purchase of its own shares in accordance with an equal access scheme authorized in advance at a general meeting;
• whether listed on a securities exchange (in Singapore or outside Singapore) or not, make a selective off-market purchase of its own shares in accordance with an agreement authorized in advance at a general meeting by a special resolution where persons whose shares are to be acquired and their associated persons have abstained from voting; and
• whether listed (on an approved exchange in Singapore or any securities exchange outside Singapore) or not, make an acquisitiona purchase of its own shares under a contingent purchase contract which has been authorized in advance at a general meeting by a special resolution.
Kenon may also purchase its own shares by an order of a Singapore court.
The total number of ordinary shares that may be acquired by Kenon in a relevant period may not exceed 20% of the total number of ordinary shares in that class as of the date of the resolution pursuant to the relevant share repurchase provisions under the Singapore Companies Act. Where, however, Kenon has reduced its share capital by a special resolution or a Singapore court made an order to such effect, the total number of ordinary shares shall be taken to be the total number of ordinary shares in that class as altered by the special resolution or the order of the court. Payment must be made out of Kenon’s distributable profits or capital, provided that Kenon is solvent. Such payment may include any expenses (including brokerage or commission) incurred directly in the purchase or acquisition by Kenon of its ordinary shares.
Financial assistance for the acquisition of shares
Kenon may not give financial assistance to any person whether directly or indirectly for the purpose of:
• the acquisition or proposed acquisition of shares in Kenon or units of such shares; or
• the acquisition or proposed acquisition of shares in its holding company or ultimate holding company, as the case may be, or units of such shares.
Financial assistance may take the form of a loan, the giving of a guarantee, the provision of security, the release of an obligation, the release of a debt or otherwise.
However, Kenon may provide financial assistance for the acquisition of its shares or shares in its holding company if it complies with the requirements (including, where applicable, approval by the board of directors or by the passing of a special resolution by its shareholders) set out in the Singapore Companies Act. Our constitutionConstitution provides that subject to the provisions of the Singapore Companies Act, we may purchase or otherwise acquire our own shares upon such terms and subject to such conditions as we may deem fit. These shares may be held as treasury shares or cancelled as provided in the Singapore Companies Act or dealt with in such manner as may be permitted under the Singapore Companies Act. On cancellation of the shares, the rights and privileges attached to those shares will expire. |
| Delaware | | Singapore—Kenon Holdings Ltd. |
| Transactions with Officers and Directors | | Under the Delaware General Corporation Law, some contracts or transactions in which one or more of a corporation’s directors has an interest are not void or voidable because of such interest provided that some conditions, such as obtaining the required approval and fulfilling the requirements of good faith and full disclosure, are met. Under the Delaware General Corporation Law, either (i) the stockholders or the board of directors must approve in good faith any such contract or transaction after full disclosure of the material facts or (ii) the contract or transaction must have been “fair” as to the corporation at the time it was approved. If board approval is sought, the contract or transaction must be approved in good faith by a majority of disinterested directors after full disclosure of material facts, even though less than a majority of a quorum. | | Under the Singapore Companies Act, the chief executive officer and directors are not prohibited from dealing with Kenon, but where they have an interest in a transaction with Kenon, that interest must be disclosed to the board of directors. In particular, the chief executive officer and every director who is in any way, whether directly or indirectly, interested in a transaction or proposed transaction with Kenon must, as soon as practicable after the relevant facts have come to such officer or director’s knowledge, declare the nature of such officer or director’s interest at a board of directors’ meeting or send a written notice to Kenon containing details on the nature, character and extent of his interest in the transaction or proposed transaction with Kenon.
In addition, a director or chief executive officer who holds any office or possesses any property which, directly or indirectly, duties or interests might be created in conflict with such officer’s duties or interests as director or chief executive officer, is required to declare the fact and the nature, character and extent of the conflict at a meeting of directors or send a written notice to Kenon containing details on the nature, character and extent of the conflict.
The Singapore Companies Act extends the scope of this statutory duty of a director or chief executive officer to disclose any interests by pronouncing that an interest of a member of the director’s or, as the case may be, the chief executive officer’s family (including spouse, son, adopted son, step-son, daughter, adopted daughter and step-daughter) will be treated as an interest of the director.
There is however no requirement for disclosure where the interest of the director or chief executive officer (as the case may be) consists only of being a member or creditor of a corporation which is interested in the transaction or proposed transaction with Kenon if the interest may properly be regarded as immaterial. Where the transaction or proposed transaction relates to any loan to Kenon, no disclosure need be made where the director or chief executive officer has only guaranteed or joined in guaranteeing the repayment of such loan, unless the constitution provides otherwise.
Further, where the proposed transaction is to be made with or for the benefit of a related corporation (i.e., the holding company, subsidiary or subsidiary of a common holding company) no disclosure need be made of the fact that the director or chief executive officer is also a director or chief executive officer of that corporation, unless the constitution provides otherwise.
Subject to specified exceptions, including a loan to a director for expenditure in defending criminal or civil proceedings, etc. or in connection with an investigation, or an action proposed to be taken by a regulatory authority in connection with any alleged negligence, default, breach of duty or breach of trust by him in relation to Kenon, the Singapore Companies Act prohibits Kenon from: (i) making a loan or quasi-loan to its directors or to directors of a related corporation (each, a “relevant director”); (ii) giving a guarantee or security in connection with a loan or quasi-loan made to a relevant director by any other person; (iii) entering into a credit transaction as creditor for the benefit of a relevant director; (iv) giving a guarantee or security in connection with such credit transaction entered into by any person for the benefit of a relevant director; (v) taking part in an arrangement where another person enters into any of the transactions in (i) to (iv) above or (vi) below and such person obtains a benefit from Kenon or a related corporation; or (vi) arranging for the assignment to Kenon or assumption by Kenon of any rights, obligations or liabilities under a transaction in (i) to (v) above. Kenon is also prohibited from entering into the transactions in (i) to (vi) above with or for the benefit of a relevant director’s spouse or children (whether adopted or naturally or step-children). |
| Delaware | | Singapore—Kenon Holdings Ltd. |
| Dissenters’ Rights | | Under the Delaware General Corporation Law, a stockholder of a corporation participating in some types of major corporate transactions may, under varying circumstances, be entitled to appraisal rights pursuant to which the stockholder may receive cash in the amount of the fair market value of his or her shares in lieu of the consideration he or she would otherwise receive in the transaction. | | There are no equivalent provisions under the Singapore Companies Act. | | | | | | Cumulative Voting | | Under the Delaware General Corporation Law, a corporation may adopt in its bylaws that its directors shall be elected by cumulative voting. When directors are elected by cumulative voting, a stockholder has the number of votes equal to the number of shares held by such stockholder times the number of directors nominated for election. The stockholder may cast all of such votes for one director or among the directors in any proportion. | | There is no equivalent provision under the Singapore Companies Act in respect of companies incorporated in Singapore. |
| Anti-Takeover Measures | Under the Delaware General Corporation Law, the certificate of incorporation of a corporation may give the board the right to issue new classes of preferred stock with voting, conversion, dividend distribution, and other rights to be determined by the board at the time of issuance, which could prevent a takeover attempt and thereby preclude shareholders from realizing a potential premium over the market value of their shares.
In addition, Delaware law does not prohibit a corporation from adopting a stockholder rights plan, or “poison pill,” which could prevent a takeover attempt and also preclude shareholders from realizing a potential premium over the market value of their shares. | | The constitution of a Singapore company typically provides that the company may allot and issue new shares of a different class with preferential, deferred, qualified or other special rights as its board of directors may determine with the prior approval of the company’s shareholders in a general meeting. Our constitutionConstitution provides that our shareholders may grant to our board the general authority to issue such preference shares until the next general meeting. For further information, see “Item 3.D Risk Factors—Risks Relating to Our Ordinary Shares—Our directors have general authority to allot and issue new shares on terms and conditions and with any preferences, rights or restrictions as may be determined by our board of directors in its sole discretion, which may dilute our existing shareholders. We may also issue securities that have rights and privileges that are more favorable than the rights and privileges accorded to our existing shareholders” and “—Preference Shares.”
Singapore law does not generally prohibit a corporation from adopting “poison pill” arrangements which could prevent a takeover attempt and also preclude shareholders from realizing a potential premium over the market value of their shares.
However, under the Singapore Code on Take-overs and Mergers, if, in the course of an offer, or even before the date of the offer announcement, the board of the offeree company has reason to believe that a bona fide offer is imminent, the board must not, except pursuant to a contract entered into earlier, take any action, without the approval of shareholders at a general meeting, on the affairs of the offeree company that could effectively result in any bona fide offer being frustrated or the shareholders being denied an opportunity to decide on its merits.
For further information on the Singapore Code on Take-overs and Mergers, see “—Takeovers.” |
For information concerning our material contracts, see “Item 4. Information on the Company” and “Item 5. Operating and Financial Review and Prospects.” There are currently no exchange control restrictions in effect in Singapore. The following summary of the United States federal income tax and Singapore tax considerations of ownership and disposition of our ordinary shares is based upon laws, regulations, decrees, rulings, income tax conventions (treaties), administrative practice and judicial decisions in effect at the date of this annual report. Legislative, judicial or administrative changes or interpretations may, however, be forthcoming that could alter or modify the statements and conclusions set forth herein. Any such changes or interpretations may be retroactive and could affect the tax consequences to holders of our ordinary shares. This summary does not purport to be a legal opinion or to address all tax aspects that may be relevant to a holder of our ordinary shares. Each prospective holder should consult its tax adviser as to the particular tax considerations to such holder of the ownership and disposition of our ordinary shares, including the applicability and effect of any other tax laws or tax treaties, of pending or proposed changes in applicable tax laws as of the date of this annual report, and of any actual changes in applicable tax laws after such date. U.S. Federal Income Tax Considerations The following summarizes certain U.S. federal income tax considerations of owning and disposing of our ordinary shares. This summary applies only to U.S. Holders (defined below) that hold our ordinary shares as capital assets for U.S. federal income tax purposes (generally, property held for investment) and that have the U.S. Dollar as its functional currency. This summary is based on the Internal Revenue Code of 1986, as amended, or the Code, Treasury regulations promulgated thereunder and on judicial and administrative interpretations of the Code and the Treasury regulations, all as in effect on the date hereof, and all of which are subject to change, possibly with retroactive effect and that could affect the tax considerations described below. This summary does not purport to be a complete description of the U.S. federal income tax consequences of the transactions described in this annual report,ownership and disposition of our ordinary shares, nor does it address the application of estate, gift or other non-income U.S. federal tax considerations or any state, local or foreign tax considerations. Moreover, this summary does not address all the tax considerations that may be relevant to holders of our ordinary shares in light of its particular circumstances, including theany alternative minimum tax, the Medicare tax on certain investment income and special rules that apply to certain holders such as (but not limited to): persons that are not U.S. Holders; persons that are subject to alternative minimum taxes; insurance companies; cooperatives; pension plans; regulated investment companies; real estate investment trusts; tax-exempt entities; banks and other financial institutions; broker-dealers; pass-through entities; persons that hold our ordinary shares through partnerships (or other entities or arrangements classified as partnerships for U.S. federal income tax purposes); persons that acquire our ordinary shares through any employee share option or otherwise as compensation; persons that actually or constructively own 10% or more of the total combined voting power of all classes of our voting stock or 10% or more of the total value of shares of all classes of our stock; traders in securities that elect to apply a mark-to-market method of accounting; investors that will hold our ordinary shares as part of a “hedge,” “straddle,” “conversion,” “constructive sale” or other integrated transaction for U.S. federal income tax purposes; investors that have a functional currency other than the U.S. Dollar; and individuals who receive our ordinary shares upon the exercise of compensatory options or otherwise as compensation. Moreover, no advance rulings have been or will be sought from the U.S. Internal Revenue Service, or IRS, regarding any matter discussed in this annual report, and counsel to Kenon has not rendered any opinion with respect to any of the U.S. federal income tax considerations relating to the transactions addressed herein. No assurance can be given that the IRS would not assert, or that a court would not sustain, a position contrary to any of the tax aspectsconsiderations set forth below. HOLDERS AND PROSPECTIVE INVESTORS SHOULD CONSULT ITSTHEIR TAX ADVISORS REGARDING THE APPLICATION OF THE U.S. FEDERAL TAX RULES TO ITS PARTICULAR CIRCUMSTANCES AS WELL AS THE STATE, LOCAL, NON-U.S. AND OTHER TAX CONSEQUENCES TO THEM OF THE OWNERSHIP AND DISPOSITION OF OUR ORDINARY SHARES. For purposes of this summary, a “U.S. Holder” is a beneficial owner of our ordinary shares that is, for U.S. federal income tax purposes: an individual who is a citizen or resident of the United States; a corporation (or other entity treated as a corporation for U.S. federal income tax purposes) created in, or organized under the laws of the United States or any state thereof or the District of Columbia; an estate, the income of which is subject to U.S. federal income taxation regardless of its source; or a trust that (i) is subject to the primary supervision of a U.S. court and which has one or more U.S. persons who have the authority to control all substantial decisions of the trust orand (ii) that has otherwise validly elected to be treated as a U.S. person under the Code. If a partnership (or other entity or arrangement taxable as a partnership for U.S. federal income tax purposes) is a beneficial owner of our ordinary shares, the tax treatment of a partner in such partnership will generally depend upon the status of the partner and the activities of the partnership. Partnerships holding our ordinary shares and its partners should consult itstheir tax advisors regarding an investment in our ordinary shares. Taxation of Dividends and Other Distributions on the Ordinary Shares We were likely classified as a PFIC forSubject to the taxable year ended December 31, 2022 and could continue to be for foreseeable future taxable years. Accordingly, the most likely treatment of a U.S. Holder isdiscussion set forth below under “—Passive Foreign Investment Company.Company,” If we were not a PFIC, the following rules would apply. The gross amount of any distribution made to a U.S. Holder with respect to our ordinary shares, including the amount of any non-U.S. taxes withheld from the distribution, will generally be includible in income as dividend income on the day on which the distribution is actually or constructively received by a U.S. Holder as dividend income to the extent the distribution is paid out of our current or accumulated earnings and profits as determined for U.S. federal income tax purposes. A distribution in excess of our current and accumulated earnings and profits (as determined for U.S. federal income tax purposes), including the amount of any non-U.S. taxes withheld from the distribution, will be treated as a non-taxable return of capital to the extent of the U.S. Holder’s adjusted basis in our ordinary shares and as a capital gain to the extent it exceeds the U.S. Holder’s basis.adjusted basis in our ordinary shares. We do not expect to maintain calculations of our earnings and profits under U.S. federal income tax principles; therefore, U.S. Holders should expect that aggregate amount of distributions will generally be treated as dividends for U.S. federal income tax purposes. Dividends received on our ordinary shares will not be eligible for the dividends-received deduction generally allowed to corporations in respect of dividends received from U.S. corporations.
Distributions treated as dividends that are received by individuals and other non-corporate U.S. Holders from “qualified foreign corporations” generally qualify for a reduced maximum tax rate so long as certain holding period and other requirements are met. Dividends paid on our ordinary shares should qualify for the reduced rate if we are treated as a “qualified foreign corporation.” For this purpose, a qualified foreign corporation means any foreign corporation provided that: (i) the corporation was not, in the year prior to the year in which the dividend was paid, and is not, in the year in which the dividend is paid, a PFIC (as discussed below), (ii) certain holding period requirements are met and (iii) either (A) the corporation is eligible for the benefits of a comprehensive income tax treaty with the United States that the IRS has approved for the purposes of the qualified dividend rules or (B) the stock with respect to which such dividend was paid is readily tradable on an established securities market in the United States. The United States does not currently have a comprehensive income tax treaty with Singapore. However, the ordinary shares should be considered to be readily tradable on established securities markets in the United States if they are listed on the NYSE. Therefore,As discussed below under “—Passive Foreign Investment Company,” however, although we expectbelieve that our ordinary shares should generallywe were not a PFIC for the taxable year ended December 31, 2023, we likely were treated as a PFIC for the taxable year ended December 31, 2022 and could again be considered to be readily tradable on an established securities market in the United States, and we expect thattreated as a PFIC for foreseeable future taxable years. Therefore, dividends with respect to suchour ordinary shares shouldmay not qualify for the reduced rate. U.S. Holders should consult itstheir tax advisors regarding the availability of the lower rate for dividends paid with respect to our ordinary shares. DividendsFor U.S. foreign tax credit purposes, dividends on our ordinary shares received by a U.S. Holder will generally be treated as foreign source income for U.S. foreign tax credit purposes.purposes and will generally constitute passive category income. The rules with respect to foreign tax credits are complex and their application depends in large part on the U.S. Holder’s individual facts and circumstances. Accordingly, U.S. Holders should consult itstheir tax advisors regarding the availability of the foreign tax credit in light of its particular circumstances.
Taxation of Dispositions of the Ordinary Shares Subject to the discussion below under “—Passive Foreign Investment Company,” a U.S. Holder will generally recognize gain or loss upon the sale or other taxable disposition of our ordinary shares in an amount equal to the difference between the amount realized on such sale or other taxable disposition and such U.S. Holder’s adjusted tax basis in our ordinary shares. Such gain or loss will generally be long-term capital gain (taxable at a reduced rate for non-corporate U.S. Holders) or loss if, on the date of sale or disposition, the U.S. Holder’s holding period in such ordinary shares were held by such U.S. Holder for more thanexceeds one year. The deductibility of capital losses is subject to significant limitations. Any For foreign tax credit purposes, any gain or loss recognized by a U.S. Holder will generally be treated as U.S. source gain or loss, as the case may be, for foreign tax credit purposes, which will generally limit the availability of foreign tax credits. U.S. Holders should consult their tax advisors regarding the availability of the foreign tax credit in light of its particular circumstances. The amount realized on a sale or other taxable disposition of our ordinary shares in exchange for foreign currency will generally equal the U.S. Dollar value of the foreign currency at the spot exchange rate in effect on the date of sale or other taxable disposition or, if the ordinary shares are traded on an established securities market (such as the NYSE or the TASE), in the case of a cash method or electing accrual method U.S. Holder of our ordinary shares, the settlement date. A U.S. Holder will have a tax basis in the foreign currency received equal to the U.S. Dollar amount realized. Any gain or loss realized by a U.S. Holder on a subsequent conversion or other disposition of the foreign currency will be foreign currency gain or loss, which is treated as ordinary income or loss and U.S. source ordinary income or loss for foreign tax credit purposes. Passive Foreign Investment Company In general, a non-U.S. corporation, such as our company, will be classified as a PFIC, for U.S. federal income tax purposes, for any taxable year if either (i) 75% or more of its gross income for such year is passive income or (ii) 50% or more of the value of its assets (based(generally based on an average of the quarterly values of the assets during a taxable year) is attributable to assets that produce or are held for the production of passive income. For this purpose,purposes of these tests, “passive income” generally includes, among other items, dividends, interest and certain rents and royalties, and net gains from the sale or exchange of property that gives rise to such income. In addition, cash is generally categorized as a passive asset, and our goodwill and other unbooked intangibles will be taken into account and generally treated as passive or non-passive assets. Wedepending on the income such assets produce or are held to produce. Moreover, we will be treated as owning our proportionate share of the assets and earning our proportionate share of the income of any other corporation in which we own, directly or indirectly, 25% or more (by value) of the shares. Whether we are, or will be, classified as a PFIC is a factual determination made annual that will depend, in part, upon composition of our income and assets in that year. The sale of the Inkia Business, the investment in Qoros by the Majority Shareholder in Qoros in 2018 (which reduced our equity interest in Qoros to 24%), the sale of half of our then remaining interest in Qoros to the Majority Shareholder in Qoros in April 2020 (which reduced our equity interest in Qoros to 12%) and the sale of all of our remaining interest in Qoros to the Majority Shareholder in Qoros in April 2021 (which will eliminate our equity interest in Qoros) each may increase the value of our assets that produce, or are held for the production of, passive income and/or our passive income and result in us becoming a PFIC for our current, and any future, taxable year. Similarly, after ZIM completed its initial public offering in February 2021 (which reduced our equity interest in ZIM to 28%) and after we completed sales of our ZIM shares between September and November 2021 (which reduced our equity interest in ZIM to 26%) and in March 2022 (which reduced our equity interest in ZIM to approximately 21%), our equity interest in ZIM fell below 25%. The reduction in our equity interest in ZIM to below 25% limits our ability to treat our proportionate share of ZIM’s businesses and earnings as directly owned, which increased the value of our assets that produce, or are held for the production of, passive income and/or our passive income, and likely results in us becoming a PFIC for our current, and any foreseeable future taxable years.
Based upon our current and projected income and assets (including unbooked goodwill), taking into account our proportionate share of the income and assets of other corporations in which we own, directly or indirectly, 25% or more (by value) of the stock, and the market price of our ordinary shares, we believe that we were not treated as a PFIC for the taxable year ended December 31, 2023. Although we believe that we were not a PFIC for the taxable year ended December 31, 2023, we were likely treated as a PFIC for the taxable year ended December 31, 2022. DependingAdditionally, depending upon the composition of our income and assets and the market price of our ordinary shares during 20232024 and subsequent taxable years, we could continue toagain be classified as a PFIC for 2023the taxable year ending December 31, 2024 and any foreseeable future taxable years. Whether we are, or will be, classified as a PFIC, however, is a factual determination made annually that will depend, in part, upon composition of our income and assets in that year. Furthermore, because there are uncertainties in the application of the relevant rules, it is possible that the IRS may challenge our classification of certain income or assets as non-passive, or our valuation of our goodwill and other unbooked intangibles, each of which may increase the likelihood of us being classified as a PFIC for the current or subsequent taxable years. Accordingly, U.S. Holders of our ordinary shares should be willing to assume the risks of investing in a PFIC. Further, if we are classified as a PFIC for any taxable year during which a U.S. Holder holds our ordinary shares and any subsidiary we own is also classified as a PFIC (a “Subsidiary PFIC”), such U.S. Holder would be treated as owning a proportionate amount (by value) of the shares of each such subsidiary a lower tier PFIC, for purposes of the application of these rules. Accordingly, U.S. Holders should be aware that they could be subject to tax under the PFIC rules even if no distributions are received and no redemptions or other dispositions of the securities are made.rules. U.S. Holders should consult their tax advisors regarding the application of the PFIC rules to any subsidiary we own. If we are classified as a PFIC for any taxable year during which a U.S. Holder holds our ordinary shares, we will generally continue to be treated as a PFIC with respect to such U.S. Holder for all succeeding years during which the holder holds our ordinary shares.shares, even if we do not meet the threshold requirements for PFIC status for any such succeeding years. However, if we cease to meet the threshold requirements for PFIC status, provided that the U.S. Holder has not made a QEF Election or a Mark-to-Market Election, as described below, such holder may avoid some of the adverse effects of the PFIC regimerules described below by making a “deemed sale” election with respect to our ordinary shares held by such U.S. Holder. If such election is made, the U.S. Holder will be deemed to have sold our ordinary shares it holds on the last day of the last taxable year in which we were classified as a PFIC at its fair market value and any gain from such deemed sale will be taxed under the PFIC rules described above.below. After the deemed sale election, so long as we do not become classified as a PFIC in a subsequent taxable year, the ordinary shares with respect to which such election was made will not be treated as shares in a PFIC and the U.S. Holder will not be subject to the PFIC rules described abovebelow with respect to any “excess distribution” received from us or any gain from an actual sale or other disposition of the ordinary shares. The rules dealing with deemed sale elections are very complex. U.S. Holders of our ordinary shares should consult itstheir tax advisors as to the possibility and consequences of making a deemed sale election if we cease to be classified as a PFIC and such election becomes available. If a U.S. Holder owns our ordinary shares during any taxable year that we are a PFIC, such U.S. Holder may be subject to certain reporting obligations with respect to our ordinary shares, including annual reporting on IRS Form 8621 regarding distributions received on, and any gain realized on the disposition of, our ordinary shares. U.S. Holders should consult itstheir tax advisoradvisors regarding our PFIC status and the U.S. federal income tax consequences of owning and disposing of our ordinary shares if we are, or become, classified as a PFIC, including the possibility of making a QEF Election, Mark-to-Market Election or deemed sale election. The PFIC rules are complex, and each U.S. Holder should consult its own tax advisor regarding the PFIC rules (including the applicability and advisability of a QEF Election and Mark-to-Market Election) and how the PFIC rules may affect the U.S. federal income tax consequences of the ownership, and disposition of our ordinary shares. If we are classified as a PFIC, the U.S. federal income tax consequences to a U.S. Holder of the ownership, and disposition of our ordinary shares will depend on whether such U.S. Holder makes a QEF electionElection or makes a mark-to-market election with respect to our ordinary shares. A U.S. Holder that does not make either a QEF Election or a Mark-to-Market Election (a “Non-Electing U.S. Holder”) will be taxable as described below. AIf we are classified as a PFIC for any taxable year during which a Non-Electing U.S. Holder holds our ordinary shares, the holder will generally be subject to the PFIC rules with respect to (i) any excess distribution that we makemade to the U.S. Holder (which generally means any distribution paid during a taxable year to a U.S. Holder that is greater than 125% of the average annual distributions paid in the three preceding taxable years or, if shorter, the U.S. Holder’s holding period for the ordinary shares), and (ii) any gain realized on the sale or other disposition of our ordinary shares. In addition, dividends paid in respect of our ordinary shares would not be eligible for the lower tax rate described under “—Taxation of Dividends and Other Distributions on the Ordinary Shares” above.
Under the PFIC rules: the excess distribution or gain will be allocated ratably over the U.S. Holder’s holding period for the ordinary shares; the amount allocated to the taxable year of the excess distribution, or sale or other disposition, and to any taxable years in the U.S. Holder’s holding period prior to the first taxable year in which we are classified as a PFIC (each, a “pre-PFIC year”), will be taxable as ordinary income; the amount allocated to each prior taxable year, other than a pre-PFIC year, will be subject to tax at the highest tax rate in effect for individuals or corporations, as appropriate, for that year; and the interest charge generally applicable to underpayments of tax will be imposed on the tax attributable to each prior taxable year, other than a pre-PFIC year. QEF Election A U.S. Holder that makes a QEF Election for the first tax year in which its holding period of its ordinary shares begins will generally will not be subject to the adverse PFIC rules discussed above with respect to its ordinary shares. However, a U.S. Holder that makes a QEF Election will be subject to U.S. federal income tax on such U.S. Holder’s pro rata share of (i) our net capital gain, which will be taxed as long-term capital gain to such U.S. Holder, and (ii) our ordinary earnings, which will be taxed as ordinary income to such U.S. Holder. Generally, “net capital gain” is the excess of (i) net long-term capital gain over (ii) net short-term capital loss, and “ordinary earnings” are the excess of (i) “earnings and profits” over (ii) net capital gain. A U.S. Holder that makes a QEF Election will be subject to U.S. federal income tax on such amounts for each tax year in which we are a PFIC, regardless of whether such amounts are actually distributed to such U.S. Holder by us.Holder. However, for any tax year in which we are a PFIC and have no net income or gain, U.S. Holders that have made a QEF Election would not have any income inclusions as a result of the QEF Election. If a U.S. Holder that made a QEF Election has an income inclusion, such a U.S. Holder may, subject to certain limitations, elect to defer payment of current U.S. federal income tax on such amounts, subject to an interest charge. If such U.S. Holder is not a corporation, any such interest paid will be treated as “personal interest,” which is not deductible. A U.S. Holder that makes a timely QEF Election generally (i) may receive a tax-free distribution from us to the extent that such distribution represents “earnings and profits” that were previously included in income by the U.S. Holder because of such QEF Election and (ii) will adjust such U.S. Holder’s tax basis in the common shares to reflect the amount included in income or allowed as a tax-free distribution because of such QEF Election. In addition, a U.S. Holder that makes a QEF Election generally will recognize capital gain or loss on the sale or other taxable disposition of ordinary shares. The procedure for making a QEF Election, and the U.S. federal income tax consequences of making a QEF Election, will depend on whether such QEF Election is timely. A QEF Election will be treated as “timely” for purposes of avoiding the default PFIC rules discussed above if such QEF Election is made for the first year in the U.S. Holder’s holding period for the ordinary shares in which we were a PFIC. The QEF Election is made on a shareholder-by-shareholder basis and, once made, can only be revoked with the consent of the IRS. A U.S. Holder generally makes a QEF Election by attaching a completed IRS Form 8621, including a PFIC Annual Information Statement, to a timely filed U.S. federal income tax return for the year to which the election relates. A QEF Election will apply to the tax year for which such QEF Election is made and to all subsequent tax years, unless such QEF Election is invalidated or terminated or the IRS consents to revocation of such QEF Election. If a U.S. Holder makes a QEF Election and, in a subsequent tax year, we cease to be a PFIC, the QEF Election will remain in effect (although itthe QEF rules described above will not be applicable) during those tax years in which we are not a PFIC. Accordingly, if we become a PFIC in another subsequent tax year, the QEF Election will be effective and the U.S. Holder will be subject to the QEF rules described above during any subsequent tax year in which we qualify as a PFIC. In order to comply with the requirements of a QEF Election, a U.S. Holder must receive a PFIC annual information statementAnnual Information Statement from us. We will endeavor to provide U.S. Holders withus for each year for which we are treated as a PFIC annual information statement for our 2022 taable year in order to enable U.S. Holders to make a QEF ElectionHowever,PFIC. However, there is no assurance that we will have timely knowledge of our status as a PFIC in the future, or of the required information to be provided. Weand we have not determined if we will provide U.S. Holders such information for any subsequent taxable year.year for which we may be treated as a PFIC. If we do not provide the required information with regard to us or any of our Subsidiary PFICs for any taxable year, U.S. Holders will not be able to make or maintain a QEF Election for such entity and will continue to be subject to the PFIC rules discussed above that apply to Non-Electing U.S. Holders with respect to the taxation of gains and excess distributions. Mark-to-Market Election As an alternative to the foregoing rules, a U.S. Holder of “marketable stock” in a PFIC may make a Mark-to-Market Election with respect to such stock. A Mark-to-Market Election may be made with respect to our ordinary shares, provided they are actively traded, defined for this purpose as being traded on a “qualified exchange,” other than in de minimis quantities, on at least 15 days during each calendar quarter. We anticipate that our ordinary shares should qualify as being actively traded, but no assurances may be given in this regard. If a U.S. Holder of our ordinary shares makes this election with respect to our ordinary shares, the U.S. Holder will generally (i) include as ordinary income for each taxable year that we are classified as a PFIC the excess, if any, of the fair market value of oursuch ordinary shares held at the end of the taxable year over the adjusted tax basis of such ordinary shares and (ii) deduct as an ordinary loss in each such taxable year the excess, if any, of the adjusted tax basis of oursuch ordinary shares over the fair market value of such ordinary shares held at the end of the taxable year, but such deduction will only be allowed to the extent of the net amount previously included in income as a result of the Mark-to-Market Election. The U.S. Holder’s adjusted tax basis in our ordinary shares would be adjusted to reflect any income or loss resulting from the Mark-to-Market Election. If a U.S. Holder makes a Mark-to-Market Election in respect of our ordinary shares and we cease to be classified as a PFIC, the holder will not be required to take into account the gain or loss described above during any period that we are not classified as a PFIC. In addition, any gain such U.S. Holder recognizes upon the sale or other taxable disposition of our ordinary shares in a year when we are classified as a PFIC will be treated as ordinary income and any loss will be treated as ordinary loss, but such loss will only be treated as ordinary loss to the extent of the net amount previously included in income as a result of the Mark-to-Market Election. If a U.S. Holder makes a Mark-to-Market Election in respect of a corporation classified as a PFIC and such corporation ceases to be classified as a PFIC, the U.S. Holder will not be required to take into account the gain or loss described above during any period that such corporation is not classified as a PFIC. In the case of a U.S. Holder who has held our ordinary shares during any taxable year in respect of which we were classified as a PFIC and continues to hold such ordinary shares (or any portion thereof) and has not previously made a Mark-to-Market Election, and who is considering making a Mark-to-Market Election, special tax rules may apply relating to purging the PFIC taint of such ordinary shares. Because a Mark-to-Market Election cannot technically be made for any Subsidiary PFICs that we may own, a U.S. Holder may continue to be subject to the PFIC rules with respect to such U.S. Holder’s indirect interest in any investments held by us that are treated as an equity interest in a PFIC for U.S. federal income tax purposes. A U.S. Holder makes a Mark-to-Market Election by attaching a completed IRS Form 8621 to a timely filed U.S. federal income tax return. A timely Mark-to-Market Election applies to the tax year in which such Mark-to-Market Election is made and to each subsequent tax year, unless the securities cease to be “marketable stock” or the IRS consents to revocation of such election. Each U.S. Holder should consult its own tax advisor regarding the availability of, and procedure for making, a Mark-to-Market Election. Foreign Financial Asset Reporting
A U.S. Holder may be required to report information relating to an interest in our ordinary shares, generally by filing IRS Form 8938 (Statement of Specified Foreign Financial Assets) with the U.S. Holder’s federal income tax return. A U.S. Holder may also be subject to significant penalties if the U.S. Holder is required to report such information and fails to do so. U.S. Holders should consult their tax advisors regarding information reporting obligations, if any, with respect to ownership and disposition of our ordinary shares. THE SUMMARY OF U.S. FEDERAL INCOME TAX CONSIDERATIONS SET OUT ABOVE IS FOR GENERAL INFORMATIONAL PURPOSES ONLY. YOU SHOULD CONSULT YOUR TAX ADVISOR ABOUT THE APPLICATION OF THE U.S. FEDERAL TAX RULES TO YOUR PARTICULAR CIRCUMSTANCE AS WELL AS THE STATE, LOCAL, NON-U.S. AND OTHER TAX CONSEQUENCES OF OWNING AND DISPOSING OF OUR ORDINARY SHARES.
Material Singapore Tax Considerations The following discussion is a summary of Singapore income tax, goods and services tax, or GST, stamp duty and estate duty considerations relevant to the ownership and disposition of our ordinary shares by an investor who is not tax resident or domiciled in Singapore and who does not carry on business or otherwise have a presence in Singapore. The statements made herein regarding taxation are general in nature and based upon certain aspects of the current tax laws of Singapore and administrative guidelines issued by the relevant authorities in force as of the date hereof and are subject to any changes in such laws or administrative guidelines or the interpretation of such laws or guidelines occurring after such date, which changes could be made on a retrospective basis. The statements made herein do not purport to be a comprehensive or exhaustive description of all of the tax considerations that may be relevant to a decision to own or dispose of our ordinary shares and do not purport to deal with the tax considerations applicable to all categories of investors, some of which (such as dealers in securities) may be subject to special rules. Prospective shareholders should consult its tax advisers as to the Singapore or other tax considerations of the ownership or disposal of our ordinary shares, taking into account its own particular circumstances. The statements below are based upon the assumption that Kenon is a tax resident in Singapore for Singapore income tax purposes. It is emphasized that neither Kenon nor any other persons involved in this annual report accepts responsibility for any tax effects or liabilities resulting from the holding or disposal of our ordinary shares. Income Taxation Under Singapore Law Dividends or Other Distributions with Respect to Ordinary Shares Under the one-tier corporate tax system which currently applies to all Singapore tax resident companies, tax on corporate profits is final, and dividends paid by a Singapore tax resident company are not subject to withholding tax and will be tax exempt in the hands of a shareholder, whether or not the shareholder is a company or an individual and whether or not the shareholder is a Singapore tax resident. Capital Gains upon Disposition of Ordinary Shares Under current Singapore tax laws, there is no tax on capital gains. There are no specific laws or regulations which deal with the characterization of whether a gain is income or capital in nature. Gains arising from the disposal of our ordinary shares may be construed to be of an income nature and subject to Singapore income tax, if they arise from activities which the Inland Revenue Authority of Singapore regards as the carrying on of a trade or business in Singapore. However, under Singapore tax laws and subject to certain exceptions, any gains derived by a divesting company from its disposal of ordinary shares in an investee company between June 1, 2012 and December 31, 2027 are generally not taxable if immediately prior to the date of the relevant disposal, the investing company has held at least 20% of the ordinary shares in the investee company for a continuous period of at least 24 months (“safe harbor rule”). Goods and Services Tax The issue or transfer of ownership of our ordinary shares should be exempt from Singapore GST. Hence, the holders would not incur any GST on the subscription or subsequent transfer of the shares. Stamp Duty Where our ordinary shares evidenced in certificated forms are acquired in Singapore, stamp duty is payable on the instrument of their transfer at the rate of 0.2% of the consideration for or market value of our ordinary shares, whichever is higher. Where an instrument of transfer is executed outside Singapore or no instrument of transfer is executed, no stamp duty is payable on the acquisition of our ordinary shares. However, stamp duty may be payable if the instrument of transfer is executed outside Singapore and is received in Singapore. The stamp duty is borne by the purchaser unless there is an agreement to the contrary. On the basis that any transfer instruments in respect of our ordinary shares traded on the NYSE and the TASE are executed outside Singapore through our transfer agent and share registrar in the United States for registration in our branch share register maintained in the United States (without any transfer instruments being received in Singapore), no stamp duty should be payable in Singapore on such transfers. Tax Treaties Regarding Withholding Taxes There is no comprehensive avoidance of double taxation agreement between the United States and Singapore which applies to withholding taxes on dividends or capital gains. | F. | Dividends and Paying Agents |
Not applicable. Not applicable. Our SEC filings are available to you on the SEC’s website at http://www.sec.gov. This site contains reports, proxy and information statements and other information regarding issuers that file electronically with the SEC. The information on that website is not part of this registration statement. We also make available on our website free of charge, our annual reports on Form 20-F and the text of our reports on Form 6-K, including any amendments to these reports, as well as certain other SEC filings, as soon as reasonably practicable after they are electronically filed with or furnished to the SEC. We maintain a corporate website at http://www.kenon-holdings.com. Information contained on, or that can be accessed through, our website does not constitute a part of this annual report on Form 20-F. We have included our website address in this annual report solely as an inactive textual reference. As a foreign private issuer, we will be exempt from the rules under the Exchange Act related to the furnishing and content of proxy statements, and our officers, directors and principal shareholders will be exempt from the reporting and short-swing profit recovery provisions contained in Section 16 of the Exchange Act. In addition, we will not be required under the Exchange Act to file annual, quarterly and current reports and financial statements with the SEC as frequently or as promptly as United States companies whose securities are registered under the Exchange Act. However, for so long as we are listed on the NYSE, or any other U.S. exchange, and are registered with the SEC, we will file with the SEC, within 120 days after the end of each fiscal year, or such applicable time as required by the SEC, an annual report on Form 20-F containing financial statements audited by an independent registered public accounting firm. We also submit to the SEC on Form 6-K the interim financial information that we publish. Not applicable. | J. | Annual Report to Security Holder |
Not applicable. | ITEM 11. | Quantitative and Qualitative Disclosures about Market Risk |
Our multinational operations expose us to a variety of market risks, which embody the potential for changes in the fair value of the financial instruments or the cash flows deriving from them. Our risk management policies and those of each of our businesses seek to limit the adverse effects of these market risks on the financial performance of each of our businesses and, consequently, on our consolidated financial performance. Each of our businesses bear responsibility for the establishment and oversight of their financial risk management framework and have adopted individualized risk management policies to address those risks specific to their operations. Our primary market risk exposures are to: currency risk, as a result of changes in the rates of exchange of various foreign currencies (in particular, the Euro and the New Israeli Shekel) in relation to the U.S. Dollar, our functional currency and the currency against which we measure our exposure; index risk, as a result of changes in the Consumer Price Index; interest rate risk, as a result of changes in the market interest rates affecting certain of our businesses’ issuance of debt and related financial instruments; and price risk, as a result of changes in market prices, such as the price of certain commodities (e.g., natural gas and heavy fuel oil). For further information on our market risks and the sensitivity analyses of these risks, see Note 28—Financial Instruments to our financial statements included in this annual report. | ITEM 12. | Description of Securities Other than Equity Securities |
Not applicable. Not applicable. Not applicable. | D. | American Depositary Shares |
Not applicable. PART II | ITEM 13. | Defaults, Dividend Arrearages and Delinquencies |
None. | ITEM 14. | Material Modifications to the Rights of Security Holders and Use of Proceeds |
None. | ITEM 15. | Controls and Procedures |
Evaluation of Disclosure Controls and Procedures Our management, with the participation of our chief executive officer and chief financial officer, has performed an evaluation of the effectiveness of our disclosure controls and procedures (as defined in Rule 13a-15(e) under the Exchange Act) as of the end of the period covered by this annual report, as required by Rule 13a-15(b) under the Exchange Act. Based upon this evaluation, our management, with the participation of our chief executive officer and chief financial officer, has concluded that, as of the end of the period covered by this annual report, our disclosure controls and procedures were effective in ensuring that the information required to be disclosed by us in the reports that we file or submit under the Exchange Act is recorded, processed, summarized and reported within the time periods specified in by the SEC’s rules and forms, and that the information required to be disclosed by us in the reports that we file or submit under the Exchange Act is accumulated and communicated to our management, including our chief executive officer and chief financial officer, as appropriate, to allow timely decisions regarding required disclosure. Management’s Report on Internal Control over Financial Reporting Our management is responsible for establishing and maintaining adequate “internal control over financial reporting,” as defined in Rules 13a-15(f) and 15d-15(f) under the Exchange Act. These rules define internal control over financial reporting as a process designed by, or under the supervision of, a company’s chief executive officer and chief financial officer and effected by our board of directors, management and other personnel, to provide reasonable assurance regarding the reliability of financial reporting and the preparation of financial statements for external purposes in accordance with generally accepted accounting principles and includes those policies and procedures that (i) pertain to the maintenance of records that, in reasonable detail, accurately and fairly reflect the transactions and dispositions of the assets of the company; (ii) provide reasonable assurance that transactions are recorded as necessary to permit preparation of financial statements in accordance with generally accepted accounting principles, and that receipts and expenditures of the company are being made only in accordance with authorizations of management and directors of the company; and (iii) provide reasonable assurance regarding prevention or timely detection of unauthorized acquisition, use, or disposition of the company’s assets that could have a material effect on the financial statements. Our management has assessed the design and operating effectiveness of our internal control over financial reporting as of December 31, 2022.2023. This assessment was performed under the direction and supervision of our chief executive officer and chief financial officer, and based on criteria established in Internal Control—Integrated Framework (2013) issued by the Committee of Sponsoring Organizations of the Treadway Commission. Based on that evaluation, management concluded that as of December 31, 2022,2023, our internal control over financial reporting was effective. The effectiveness of our internal control over financial reporting as of December 31, 20222023 has been audited by our independent registered public accounting firm and their report thereon is included elsewhere in this annual report. Changes in Internal Control over Financial Reporting During the year ended December 31, 2022,2023, there have been no changes in our internal control over financial reporting that have materially affected, or are reasonably likely to materially affect, our internal control over financial reporting. Inherent Limitations of Disclosure Controls and Procedures in Internal Control over Financial Reporting It should be noted that any system of controls, however well-designed and operated, can provide only reasonable, and not absolute, assurance that the objectives of the system will be met. In addition, the design of any control system is based in part upon certain assumptions about the likelihood of future events. Projections regarding the effectiveness of a system of controls in future periods are subject to the risk that such controls may become inadequate because of changes in conditions or deterioration in the degree of compliance with the policies or procedures. | ITEM 16A. | Audit Committee Financial Expert |
Our board of directors has determined that Mr. Laurence N. Charney is an “audit committee financial expert” as defined in Item 16A of Form 20-F under the Exchange Act. Our board of directors has also determined that Mr. Laurence N. Charney satisfies the NYSE’s listed company “independence” requirements. We have adopted a Code of Ethics that applies to all our employees, officers and directors, including our chief executive officer and our chief financial officer. Our Code of ConductEthics is available on our website at www.kenon-holdings.com.www.kenon-holdings.com. | ITEM 16C. | Principal Accountant Fees and Services |
KPMG LLP, a member firm of KPMG International, is our independent registered public accounting firm for the audits of the years ending December 31, 20222023 and 2021.2022. Our audit committee charter requires that all audit and non-audit services provided by our independent auditors are pre-approved by our audit committee. In particular, pursuant to our audit committee charter, the chairman of the audit committee shall pre-approve all audit services to be provided to Kenon, whether provided by our independent registered public accounting firm or other firms, and all other services (review, attest and non-audit) to be provided to Kenon by the independent registered public accounting firm. Any decision of the chairman of the audit committee to pre-approve audit or non-audit services shall be presented to the audit committee. The following table sets forth the aggregate fees by categories specified below in connection with certain professional services rendered by KPMG LLP, and other member firms within the KPMG network, for the years ended December 31, 20222023 and 20212022 for Kenon and its consolidated entities. The figures below have been updated from Kenon’s Annual Report on Form 20-F for the fiscal year ended December 31, 20212023 and in accordance with Section 14(a) of the Exchange Act. | | | | | | | | | | | | | | | | | | | | | | | | | (in thousands of USD) | | | (in thousands of USD) | | Audit Fees(1) | | | 3,960 | | | | 3,054 | | | | 5,030 | | | | 3,960 | | | Audit-Related Fees | | | 2 | | | | 3 | | | | 2 | | | | 2 | | Tax Fees(2) | | | | | | | | | | | | | | | | | | Total | | | | | | | | | | | | | | | | |
_____________________________________________________________________
| (1) | Includes fees billed or accrued for professional services rendered by the principal accountant, and member firms in their respective network, for the audit of our annual financial statements, and those of our consolidated subsidiaries, as well as additional services that are normally provided by the accountant in connection with statutory and regulatory filings or engagements, except for those not required by statute or regulation. |
| (2) | Tax fees consist of fees for professional services rendered during the fiscal year by the principal accountant mainly for tax compliance and assistance with tax audits and appeals. |
| ITEM 16D. | Exemptions from the Listing Standards for Audit Committees |
None. | ITEM 16E. | Purchases of Equity Securities by the Issuer and Affiliated Purchasers |
None.In March 2023, Kenon announced a $50 million share repurchase plan. Repurchases under the share repurchase plan are subject to the authority of the share purchase authorization which was renewed by shareholders at the 2023 AGM and which will, continue in force until the earlier of the date of the 2024 AGM or the date by which the 2024 AGM is required by law to be held. At this meeting, we intend to seek authorization to renew such authorization. The plan has no expiration date. Kenon has purchased a total of 1.1 million shares for a total purchase price of approximately $28 million under the program. Our share repurchase plan may be suspended for periods, modified or discontinued at any time and may not be completed up to the full amount of the share repurchase plan. The table below is a summary of our repurchases in 2023, which were all conducted in the open market pursuant to such share repurchase plan. From January 1, 2024 to the date of this annual report, no shares have been repurchased. | Period | | (a) Total number of shares purchased | | | (b) Average price paid per share | | | (c) Total number of shares purchased as part of publicly announced plans or programs | | | (d) Maximum number (or approximate dollar value) of shares that may yet be purchased under the plans or programs | | | January 1 - 31, 2023 | | | | | | | | | | | | | | February 1 - 28, 2023 | | | | | | | | | | | | | | March 1 - 31, 2023 | | | | | | | | | | | $ | 50,000,000 | | | April 1 - 30, 2023 | | | 96,187 | | | $ | 27.29 | | | | 96,187 | | | $ | 47,374,943 | | | May 1 - 31, 2023 | | | 143,876 | | | $ | 28.41 | | | | 240,063 | | | $ | 43,287,235 | | | June 1 - 30, 2023 | | | 305,521 | | | $ | 25.31 | | | | 545,584 | | | $ | 35,553,697 | | | July 1 - 31, 2023 | | | 275,800 | | | $ | 24.68 | | | | 821,384 | | | $ | 28,747,399 | | | August 1 - 31, 2023 | | | 120,404 | | | $ | 25.51 | | | | 941,788 | | | $ | 25,676,202 | | | September 1 - 30, 2023 | | | 22,725 | | | $ | 23.45 | | | | 964,513 | | | $ | 25,143,213 | | | October 1 - 31, 2023 | | | 92,468 | | | $ | 20.22 | | | | 1,056,981 | | | $ | 23,273,305 | | | November 1 - 30, 2023 | | | 71,587 | | | $ | 19.62 | | | | 1,128,568 | | | $ | 21,868,789 | | | | | | | | | | | | | | | | | | |
| ITEM 16F. | Change in Registrant’s Certifying Accountant |
None. | ITEM 16G. | Corporate Governance |
There are no significant differences between Kenon’s corporate governance practices and those followed by domestic companies under the listing standards of the NYSE. | ITEM 16H. | Mine Safety Disclosure |
Not applicable. | ITEM 16I. | Disclosure Regarding Foreign Jurisdictions that Prevent Inspection |
Not applicable. | ITEM 16J. | Insider Trading Policies |
Not applicable. The Company recognizes that the threat of cybersecurity breaches may create significant risks for the Company. Accordingly, the Company is committed to an ongoing and comprehensive program to protect all Company data, as well as data in our supply chain, from cybersecurity threats. As a foundation to this approach, Kenon maintains a comprehensive set of cybersecurity policies and standards. These policies and standards were developed in collaboration with a wide range of disciplines, such as information technology, cybersecurity, legal, compliance and business. The Company’s cybersecurity strategy and policies are regularly re-assessed to ensure they identify and proactively address the constant changes in the global threat environment. The Company’s decision makers are regularly kept up to date on cybersecurity trends, and ongoing collaboration with stakeholders throughout the business help ensure continued awareness and visibility of future needs. Our cybersecurity program includes three key components: training and awareness, the implementation of sophisticated and protective technologies, and an incident response framework in the event of a cybersecurity incident. The Company also has in place policies and procedures governing the specific responsibilities at the employee, management, and board of directors levels to ensure cybersecurity risks are properly assessed, identified, reported, and managed on an ongoing basis. Among other requirements to adhere to as set forth in our cybersecurity policy, our employees must exercise professional judgment and care when storing intellectual property or other sensitive information on electric or computing devices, and are required to seek consent from management or directors when accessing or sharing confidential information. Management must ensure that our employees are provided with adequate resources and training to fully understand the guidelines and expectations for cybersecurity. Management may also assist with IT security investigations, document any violations of the policy or cybersecurity, and may engage our third-party IT representative if unaware of the best course of action in dealing with any IT-related matter. The Board of Directors are responsible for reviewing the policy periodically and to oversee the implementation of the measures to observe its effectiveness. The Board must also keep apprised of applicable legislation, regulations, and principles to guide the objectives set forth in our policy. Cybersecurity risks and threats, including as a result of any previous cybersecurity incidents, have not materially impacted us to date. However, we recognize the evolving risks posed by cybersecurity risks and cannot provide any assurances that we will not be subject to a material cybersecurity incident in the future. See Item 3.D Risk Factors for a discussion of cybersecurity risks. | ITEM 17. | Financial Statements |
Not applicable. | ITEM 18. | Financial Statements |
The financial statements and the related notes required by this Item 18 are included in this annual report beginning on page F-1. See Exhibit 15.4 of this annual report on Form 20-F for the consolidated financial statements of ZIM, incorporated by reference in this annual report on Form 20-F. Index to Exhibits | | | |
| | | | | |
| | | | | |
| | | | | |
| | | | | |
| Gas Sale and Purchase Agreement, dated as of November 25, 2012, among Noble Energy Mediterranean Ltd., Delek Drilling Limited Partnership, Isramco Negev 2 Limited Partnership, Avner Oil Exploration Limited Partnership, Dor Gas Exploration Limited Partnership, and O.P.C. Rotem Ltd. (Incorporated by reference to Exhibit 10.8 to Amendment No. 1 to IC Power Pte. Ltd.’s Form F-1, filed on November 2, 2015) (1) | | | | |
| Share Purchase Agreement, dated November 24, 2017, among Inkia Energy, Ltd., IC Power Distribution Holdings, PTE. LTD., Nautilus Inkia Holdings LLC, Nautilus Distribution Holdings LLC and Nautilus Isthmus Holdings LLC (Incorporated by reference to Exhibit 4.14 to Kenon’s Annual Report on Form 20-F for the fiscal year ended December 31, 2017, filed on April 9, 2018) | 4.2
|
| | |
| Qoros Automobile Company Limited Investment Agreement, dated May 23, 2017, as amended, among Hangzhou Chengmao Investment Co., Ltd., Wuhu Chery Automobile Investment Company Limited, Quantum (2007) LLC and Qoros Automobile Company Limited (Incorporated by reference to Exhibit 4.17 to Kenon’s Annual Report on Form 20-F for the fiscal year ended December 31, 2017, filed on April 9, 2018) | | | | |
| | | 4.4 |
| |
|
| | | | | |
| | |
| | |
| | |
| | |
| | |
| | |
| | | | | | 101.INS* |
| Inline XBRL Instance Document | | 101.SCH* |
| Inline XBRL Taxonomy Extension Schema Document | | 101.CAL* |
| Inline XBRL Taxonomy Extension Calculation Linkbase Document | | 101.DEF* |
| Inline XBRL Taxonomy Extension Definition Linkbase Document | | 101.LAB* |
| Inline XBRL Taxonomy Extension Label Linkbase Document | | 101.PRE* |
| Inline XBRL Taxonomy Extension Presentation Linkbase Document | | 104* |
| Inline XBRL for the cover page of this Annual Report on Form 20-F, included in the Exhibit 101 Inline XBRL Document Set. |
___________________________________________________
| (1) | Portions of this exhibit have been omitted pursuant to a request for confidential treatment under Rule 24b-2 of the Exchange Act. Omitted information has been filed separately with the SEC. |
Kenon Holdings Ltd. and subsidiaries Consolidated Financial Statements As at December 31, 20222023 and 20212022 and for the three years ended December 31, 20222023 Kenon Holdings Ltd. Consolidated Financial Statements as at December 31, 20222023 and 20212022 and for the three years ended December 31, 20222023 Contents | | Page | | | | | F-1 – F-4 | | | | | F-5 – F-6 | | | | | F-7 | | | | | F-8 | | | | | F-9 – F-11 | | | | | F-12 – F-13 | | | | | F-14 – F-86F-80 |
 | KPMG LLP Asia Square Tower 2 Singapore 018961 | Telephone +65 6213 3388 Fax +65 6225 0984 Internet kpmg.com.sg | | | |
Report of Independent Registered Public Accounting Firm To the Stockholders and Board of Directors
Kenon Holdings Ltd.:
Opinion on the Consolidated Financial Statements We have audited the accompanying consolidated statementstatements of financial position of Kenon Holdings Ltd. and subsidiaries (the Company) as of December 31, 20222023 and 2021,2022, the related consolidated statements of profit and loss, other comprehensive income, changes in equity, and cash flows for each of the years in the three year period ended December 31, 2022,2023, and the related notes (collectively, the consolidated financial statements). In our opinion, the consolidated financial statements present fairly, in all material respects, the financial position of the Company as of December 31, 20222023 and 2021,2022, and the results of its operations and its cash flows for each of the years in the three‑year period ended December 31, 2022,2023, in conformity with International Financial Reporting Standards as issued by the International Accounting Standards Board. We also have audited, in accordance with the standards of the Public Company Accounting Oversight Board (United States) (PCAOB), the Company’s internal control over financial reporting as of December 31, 2022,2023, based on criteria established in Internal Control – Integrated Framework (2013) issued by the Committee of Sponsoring Organizations of the Treadway Commission, and our report dated March 30, 202326, 2024 expressed an unqualified opinion on the effectiveness of the Company’s internal control over financial reporting. Basis for Opinion These consolidated financial statements are the responsibility of the Company’s management. Our responsibility is to express an opinion on these consolidated financial statements based on our audits. We are a public accounting firm registered with the PCAOB and are required to be independent with respect to the Company in accordance with the U.S. federal securities laws and the applicable rules and regulations of the Securities and Exchange Commission and the PCAOB. We conducted our audits in accordance with the standards of the PCAOB. Those standards require that we plan and perform the audit to obtain reasonable assurance about whether the consolidated financial statements are free of material misstatement, whether due to error or fraud. Our audits included performing procedures to assess the risks of material misstatement of the consolidated financial statements, whether due to error or fraud, and performing procedures that respond to those risks. Such procedures included examining, on a test basis, evidence regarding the amounts and disclosures in the consolidated financial statements. Our audits also included evaluating the accounting principles used and significant estimates made by management, as well as evaluating the overall presentation of the consolidated financial statements. We believe that our audits provide a reasonable basis for our opinion. | KPMG LLP (Registration No. T08LL1267L), an accounting limited liability partnership registered in Singapore under the Limited Liability Partnership Act (Chapter 163A) and a member firm of the KPMG global organization of independent member firms affiliated with KPMG International Limited, a private English company limited by guarantee. | |
Kenon Holdings Ltd. | Independent auditors’ report | Year ended December 31, 2023 |
Critical Audit Matter The critical audit matter communicated below is a matter arising from the current period audit of the consolidated financial statements that was communicated or required to be communicated to the audit committee and that: (1) relates to accounts or disclosures that are material to the consolidated financial statements and (2) involved our especially challenging, subjective, or complex judgments. The communication of a critical audit matter does not alter in any way our opinion on the consolidated financial statements, taken as a whole, and we are not, by communicating the critical audit matter below, providing a separate opinion on the critical audit matter or on the accounts or disclosures to which it relates. KPMG LLP (Registration No. T08LL1267L), an accounting limited liability partnership registered in Singapore under the Limited Liability Partnership Act (Chapter 163A) and a member firm of the KPMG global organization of independent member firms affiliated with KPMG International Limited, a private English company limited by guarantee.
|
Impairment assessments of goodwill arising from the acquisition of CPV Group As discussed in Notes 3.J3.G and 13.C to the consolidated financial statements, the carrying amount of the cash generating unit (CGU) to which goodwill is allocated is reviewed at each reporting date for impairment. As of December 31, 2022,2023, the Group’s goodwill assigned to the renewable energies segment arising from the acquisition of CPV Group amounted to $105$126 million (Renewable Energy CGU). The Company estimates the recoverable amount of the Renewable Energy CGU based on discounted expected future cash flows. An impairment loss is recognized if the carrying value of the Renewable Energy CGU exceeds its estimated recoverable amount. We identified the evaluation of the impairment assessments of the goodwill as a critical audit matter. Specifically, a high degree of auditor judgement was required to evaluate the discount rates to determine the recoverable amount of the Renewable Energy CGU. Additionally, the audit effort associated with evaluating the discount rates required involvement of valuation professionals with specialized skills and knowledge. The following are the primary procedures we performed to address this critical audit matter. We evaluated the design and tested the operating effectiveness of certain internal controls relating to the impairment assessment of Renewable Energy CGU, including the control related to evaluating the discount rates used in the discounted cashflows. In addition, we involved valuation professionals with specialized skills and knowledge to assist us in evaluating the discount rates by comparing them against an independently developed range of discount rates using inputs from publicly available information. KPMG LLP Public Accountants and Chartered Accountants We have served as the Company’s auditor since 2015. Singapore
March 26, 2024 | | | | KPMG LLP 12 Marina View #15-01 Asia Square Tower 2 Singapore 018961 | Telephone +65 6213 3388 Fax +65 6225 0984 Internet kpmg.com.sg |
Report of Independent Registered Public Accounting Firm To the Stockholders and Board of Directors Kenon Holdings Ltd.: Opinion on Internal Control Over Financial Reporting We have audited Kenon Holdings Ltd.’s and subsidiaries’ (the Company) internal control over financial reporting as of December 31, 2022,2023, based on criteria established inInternal Control – Integrated Framework (2013) issued by the Committee of Sponsoring Organizations of the Treadway Commission. In our opinion, the Company maintained, in all material respects, effective internal control over financial reporting as of December 31, 2022,2023, based on criteria established in Internal Control – Integrated Framework (2013) issued by the Committee of Sponsoring Organizations of the Treadway Commission. We also have audited, in accordance with the standards of the Public Company Accounting Oversight Board (United States) (PCAOB), the consolidated statements of financial position of the Company as of December 31, 20222023 and 2021,2022, the related consolidated statements of profit and loss, other comprehensive income, changes in equity, and cash flows for each of the years in the three-year period ended December 31, 2022,2023, and the related notes (collectively, the consolidated financial statements), and our report dated March 30, 202326, 2024 expressed an unqualified opinion on those consolidated financial statements. Basis for Opinion The Company’s management is responsible for maintaining effective internal control over financial reporting and for its assessment of the effectiveness of internal control over financial reporting, included in the accompanying Management’s Report on Internal Control Over Financial Reporting. Our responsibility is to express an opinion on the Company’s internal control over financial reporting based on our audit. We are a public accounting firm registered with the PCAOB and are required to be independent with respect to the Company in accordance with the U.S. federal securities laws and the applicable rules and regulations of the Securities and Exchange Commission and the PCAOB. We conducted our audit in accordance with the standards of the PCAOB. Those standards require that we plan and perform the audit to obtain reasonable assurance about whether effective internal control over financial reporting was maintained in all material respects. Our audit of internal control over financial reporting included obtaining an understanding of internal control over financial reporting, assessing the risk that a material weakness exists, and testing and evaluating the design and operating effectiveness of internal control based on the assessed risk. Our audit also included performing such other procedures as we considered necessary in the circumstances. We believe that our audit provides a reasonable basis for our opinion. | KPMG LLP (Registration No. T08LL1267L), an accounting limited liability partnership registered in Singapore under the Limited Liability Partnership Act (Chapter 163A) and a member firm of the KPMG global organization of independent member firms affiliated with KPMG International Limited, a private English company limited by guarantee. | |
Kenon Holdings Ltd. | Independent auditors’ report | Year ended December 31, 2023 |
Definition and Limitations of Internal Control Over Financial Reporting A company’s internal control over financial reporting is a process designed to provide reasonable assurance regarding the reliability of financial reporting and the preparation of financial statements for external purposes in accordance with generally accepted accounting principles. A company’s internal control over financial reporting includes those policies and procedures that (1) pertain to the maintenance of records that, in reasonable detail, accurately and fairly reflect the transactions and dispositions of the assets of the company; (2) provide reasonable assurance that transactions are recorded as necessary to permit preparation of financial statements in accordance with generally accepted accounting principles, and that receipts and expenditures of the company are being made only in accordance with authorizations of management and directors of the company; and (3) provide reasonable assurance regarding prevention or timely detection of unauthorized acquisition, use, or disposition of the company’s assets that could have a material effect on the financial statements. KPMG LLP (Registration No. T08LL1267L), an accounting limited liability partnership registered in Singapore under the Limited Liability Partnership Act (Chapter 163A) and a member firm of the KPMG global organization of independent member firms affiliated with KPMG International Limited, a private English company limited by guarantee.
|
Because of its inherent limitations, internal control over financial reporting may not prevent or detect misstatements. Also, projections of any evaluation of effectiveness to future periods are subject to the risk that controls may become inadequate because of changes in conditions, or that the degree of compliance with the policies or procedures may deteriorate. KPMG LLP Public Accountants and Chartered Accountants Singapore
March 26, 2024 Kenon Holdings Ltd. and subsidiaries Consolidated Statements of Financial Position as at December 31, 20222023 and 20212022 | | | | | | As at December 31, | | | | | | | | 2022 | | | 2021 | | | | | Note | | | $ Thousands | | | | | | | | | | | | | Current assets | | | | | | | | | | Cash and cash equivalents | | 5 | | | | 535,171 | | | | 474,544 | | Short-term deposits and restricted cash | | 6 | | | | 45,990 | | | | 229 | | Trade receivables | | | | | | 73,900 | | | | 62,643 | | Short-term derivative instruments | | | | | | 2,918 | | | | 798 | | Other investments | | 7 | | | | 344,780 | | | | - | | Other current assets | | 8 | | | | 58,956 | | | | 43,379 | | Total current assets | | | | | | 1,061,715 | | | | 581,593 | | | | | | | | | | | | | | | Non-current assets | | | | | | | | | | | | Investment in ZIM (associated company) | | 9 | | | | 427,059 | | | | 1,354,212 | | Investment in OPC's associated companies | | 9 | | | | 652,358 | | | | 545,242 | | Long-term restricted cash | | | | | | 15,146 | | | | 21,463 | | Long-term derivative instruments | | 29.D.1 | | | | 16,077 | | | | | | Deferred taxes | | 24.C.2 | | | | 6,382 | | | | 19,016 | | Property, plant and equipment, net | | 12 | | | | 1,222,421 | | | | 1,125,820 | | Intangible assets, net | | 13 | | | | 220,795 | | | | 224,282 | | Long-term prepaid expenses and other non-current assets | | 14 | | | | 50,814 | | | | 57,266 | | Right-of-use assets, net | | 17 | | | | 99,293 | | | | 97,883 | | Total non-current assets | | | | | | 2,710,345 | | | | 3,456,821 | | | | | | | | | | | | | | | Total assets | | | | | | 3,772,060 | | | | 4,038,414 | |
| | | | | | As at December 31, | | | | | | | | 2023 | | | 2022 | | | | | Note | | | $ Thousands | | | | | | | | | | | | | Current assets | | | | | | | | | | Cash and cash equivalents | | 5 | | | | 696,838 | | | | 535,171 | | Short-term deposits and restricted cash | | 6 | | | | 532 | | | | 45,990 | | Trade receivables | | | | | | 67,994 | | | | 73,900 | | Short-term derivative instruments | | | | | | 3,177 | | | | 2,918 | | Other investments | | 7 | | | | 215,797 | | | | 344,780 | | Other current assets | | 8 | | | | 111,703 | | | | 58,956 | | Total current assets | | | | | | 1,096,041 | | | | 1,061,715 | | | | | | | | | | | | | | | Non-current assets | | | | | | | | | | | | Investment in ZIM (associated company) | | 9 | | | | - | | | | 427,059 | | Investment in OPC’s associated companies | | 9 | | | | 703,156 | | | | 652,358 | | Long-term restricted cash | | | | | | 16,237 | | | | 15,146 | | Long-term derivative instruments | | | | | | 14,178 | | | | 16,077 | | Deferred taxes | | 24.C.2 | | | | 15,862 | | | | 6,382 | | Property, plant and equipment, net | | 12 | | | | 1,714,825 | | | | 1,222,421 | | Intangible assets, net | | 13 | | | | 321,284 | | | | 220,795 | | Long-term prepaid expenses and other non-current assets | | 14 | | | | 52,342 | | | | 23,323 | * | Right-of-use assets, net | | 17 | | | | 174,515 | | | | 126,784 | * | Total non-current assets | | | | | | 3,012,399 | | | | 2,710,345 | | | | | | | | | | | | | | | Total assets | | | | | | 4,108,440 | | | | 3,772,060 | |
* The Group made an immaterial correction of classification error of $30 million in non-current deferred taxes from assets to liabilities as at December 31, 2021. ReclassifiedThe accompanying notes are an integral part of the consolidated financial statements. Kenon Holdings Ltd. and subsidiaries Consolidated Statements of Financial Position as at December 31, 20222023 and 2021,2022, continued | | | | | As at December 31, | | | | | As at December 31, | | | | | | | 2022 | | 2021 | | | | | 2023 | | 2022 | | | | | Note | | $ Thousands | | | Note | | $ Thousands | | Current liabilities | | | | | | | | | | | | | | | | | Current maturities of loans from banks and others | | 15 | | 39,262 | | 38,311 | | | 15 | | 169,627 | | 39,262 | | Trade and other payables | | 16 | | 133,415 | | 171,537 | | | 16 | | 181,898 | | 133,415 | | Dividend payable | | 19.D | | | - | | 188,607 | | | Short-term derivative instruments | | 29.D.1 | | 889 | | 8,688 | | | | | 2,311 | | 889 | | Current tax liabilities | | | | | 653 | | 34 | | | | | - | | | 653 | | Deferred taxes | | 24.C.2 | | 1,285 | | 21,117 | | | 24.C.2 | | - | | 1,285 | | Current maturities of lease liabilities | | | | | 17,474 | | | 18,991 | | | | | | 4,963 | | | 17,474 | | Total current liabilities | | | | | | 192,978 | | | 447,285 | | | | | | | 358,799 | | | | 192,978 | | | | | | | | | | | | | | | | | | Non-current liabilities | | | | | | | | | | | | | | | | | | | Long-term loans from banks and others | | 15 | | 610,434 | | 596,489 | | | 15 | | 906,243 | | 610,434 | | Debentures | | 15 | | 513,375 | | | | | 15 | | 454,163 | | 513,375 | | Deferred taxes | | 24.C.2 | | 97,800 | | 95,080 | | | 24.C.2 | | 136,590 | | 97,800 | | Other non-current liabilities | | | | 41,388 | | 28,817 | | | 16 | | 109,882 | | 41,388 | | Long-term derivative instruments | | | | 10 | | 192 | | | | | 15,996 | | 10 | | Long-term lease liabilities | | | | | 20,157 | | | 14,951 | | | | | | 56,543 | | | 20,157 | | Total non-current liabilities | | | | | | 1,283,164 | | | 1,310,843 | | | | | | | 1,679,417 | | | | 1,283,164 | | | | | | | | | | | | | | | | | | | | | | Total liabilities | | | | | | 1,476,142 | | | 1,758,128 | | | | | | 2,038,216 | | | 1,476,142 | | | | | | | | | | | | | | | | | | | | | | Equity | | 19 | | | | | | | 19 | | | | | | Share capital | | | | | 50,134 | | | 602,450 | | | | | | 50,134 | | | 50,134 | | Translation reserve | | | | | 1,206 | | | 25,680 | | | | | | (3,658 | ) | | 1,206 | | Capital reserve | | | | | 42,553 | | | 25,783 | | | | | | 69,792 | | | 42,553 | | Accumulated profit | | | | | | 1,504,592 | | | | 1,139,775 | | | | | | | 1,087,041 | | | | 1,504,592 | | Equity attributable to owners of the Company | | | | | 1,598,485 | | | 1,793,688 | | | | | | 1,203,309 | | | 1,598,485 | | Non-controlling interests | | | | | | 697,433 | | | | 486,598 | | | | | | | 866,915 | | | | 697,433 | | Total equity | | | | | | 2,295,918 | | | | 2,280,286 | | | | | | | 2,070,224 | | | | 2,295,918 | | | | | | | | | | | | | | | | | | | | | | Total liabilities and equity | | | | | | 3,772,060 | | | | 4,038,414 | | | | | | | 4,108,440 | | | | 3,772,060 | |
* The Group made an immaterial correction of classification error of $30 million in non-current deferred taxes from assets to liabilities as at December 31, 2021.
_________________________________________________________
| _____________________________
| _____________________________
| Cyril Pierre-Jean Ducau Chairman of Board of Directors | ____________________________ Robert L. Rosen CEO | ____________________________ Mark HassonDeepa Joseph
CFO |
Approval date of the consolidated financial statements: March 30, 202326, 2024 The accompanying notes are an integral part of the consolidated financial statements. Kenon Holdings Ltd. and subsidiaries Consolidated Statements of Profit & Loss for the years ended December 31, 2023, 2022 2021 and 20202021 | | | | | | For the year ended December 31, | | | | | | | | 2022 | | | 2021 | | | 2020 | | | | | Note | | | $ Thousands | | | | | | | | | | | | | | | | Revenue | | 20 | | | | 573,957 | | | | 487,763 | | | | 386,470 | | Cost of sales and services (excluding depreciation and amortization) | | 21 | | | | (417,261 | ) | | | (336,298 | ) | | | (282,086 | ) | Depreciation and amortization | | | | | | (56,853 | ) | | | (53,116 | ) | | | (33,135 | ) | Gross profit | | | | | | 99,843 | | | | 98,349 | | | | 71,249 | | Selling, general and administrative expenses | | 22 | | | | (99,936 | ) | | | (75,727 | ) | | | (49,957 | ) | Other income/(expenses) | | | | | | 2,918 | | | | (81 | ) | | | 1,721 | | Operating profit | | | | | | 2,825 | | | | 22,541 | | | | 23,013 | | Financing expenses | | 23 | | | | (50,397 | ) | | | (144,295 | ) | | | (51,174 | ) | Financing income | | 23 | | | | 44,686 | | | | 2,934 | | | | 14,291 | | Financing expenses, net | | | | | | (5,711 | ) | | | (141,361 | ) | | | (36,883 | ) | | | | | | | | | | | | | | | | | | (Losses)/gains related to Qoros | | 10 | | | | - | | | | (251,483 | ) | | | 309,918 | | (Losses)/gains related to ZIM | | 9.B.a | | | | (727,650 | ) | | | (204 | ) | | | 43,505 | | Share in profit/(losses) of associated companies, net | | | | | | | | | | | | | | | | - ZIM | | 9.A.2 | | | | 1,033,026 | | | | 1,260,993 | | | | 167,142 | | - OPC's associated companies | | 9.A.2 | | | | 85,149 | | | | (10,844 | ) | | | - | | - Qoros | | 9.A.2 | | | | - | | | | - | | | | (6,248 | ) | Profit before income taxes | | | | | | 387,639 | | | | 879,642 | | | | 500,447 | | Income tax expense | | 24 | | | | (37,980 | ) | | | (4,325 | ) | | | (4,698 | ) | Profit for the year from continuing operations | | | | | | 349,659 | | | | 875,317 | | | | 495,749 | | Gain for the year from discontinued operations | | 26 | | | | | | | | | | | | | | -Recovery of retained claims, net | | | | | | - | | | | - | | | | 8,476 | | Profit for the year | | | | | | 349,659 | | | | 875,317 | | | | 504,225 | | | | | | | | | | | | | | | | | | | Attributable to: | | | | | | | | | | | | | | | | Kenon’s shareholders | | | | | | 312,652 | | | | 930,273 | | | | 507,106 | | Non-controlling interests | | | | | | 37,007 | | | | (54,956 | ) | | | (2,881 | ) | Profit for the year | | | | | | 349,659 | | | | 875,317 | | | | 504,225 | | | | | | | | | | | | | | | | | | | Basic/diluted profit per share attributable to Kenon’s shareholders (in dollars): | | 25 | | | | | | | | | | | | | | Basic/diluted profit per share | | | | | | 5.80 | | | | 17.27 | | | | 9.41 | | Basic/diluted profit per share from continuing operations | | | | | | 5.80 | | | | 17.27 | | | | 9.25 | | Basic/diluted profit per share from discontinued operations | | | | | | - | | | | - | | | | 0.16 | |
| | | | | | For the year ended December 31, | | | | | | | | 2023 | | | 2022 | | | 2021 | | | | | Note | | | $ Thousands | | | | | | | | | | | | | | | | Revenue | | 20 | | | | 691,796 | | | | 573,957 | | | | 487,763 | | Cost of sales and services (excluding depreciation and amortization) | | 21 | | | | (494,312 | ) | | | (417,261 | ) | | | (336,298 | ) | Depreciation and amortization | | | | | | (78,025 | ) | | | (56,853 | ) | | | (53,116 | ) | Gross profit | | | | | | 119,459 | | | | 99,843 | | | | 98,349 | | Selling, general and administrative expenses | | 22 | | | | (84,715 | ) | | | (99,936 | ) | | | (75,727 | ) | Other income/(expense), net | | | | | | 7,819 | | | | 2,918 | | | | (81 | ) | Operating profit | | | | | | 42,563 | | | | 2,825 | | | | 22,541 | | Financing expenses | | 23 | | | | (66,333 | ) | | | (50,397 | ) | | | (144,295 | ) | Financing income | | 23 | | | | 39,361 | | | | 44,686 | | | | 2,934 | | Financing expenses, net | | | | | | (26,972 | ) | | | (5,711 | ) | | | (141,361 | ) | | | | | | | | | | | | | | | | | | Losses related to Qoros | | 10 | | | | - | | | | - | | | | (251,483 | ) | Losses related to ZIM | | 9.B.a | | | | (860 | ) | | | (727,650 | ) | | | (204 | ) | Share in (losses)/profit of associated companies, net | | | | | | | | | | | | | | | | - ZIM | | 9.A.2 | | | | (266,046 | ) | | | 1,033,026 | | | | 1,260,993 | | - OPC’s associated companies | | 9.A.2 | | | | 65,566 | | | | 85,149 | | | | (10,844 | ) | (Loss)/profit before income taxes | | | | | | (185,749 | ) | | | 387,639 | | | | 879,642 | | Income tax expense | | 24 | | | | (25,199 | ) | | | (37,980 | ) | | | (4,325 | ) | (Loss)/profit for the year | | | | | | (210,948 | ) | | | 349,659 | | | | 875,317 | | | | | | | | | | | | | | | | | | | Attributable to: | | | | | | | | | | | | | | | | Kenon’s shareholders | | | | | | (235,978 | ) | | | 312,652 | | | | 930,273 | | Non-controlling interests | | | | | | 25,030 | | | | 37,007 | | | | (54,956 | ) | (Loss)/profit for the year | | | | | | (210,948 | ) | | | 349,659 | | | | 875,317 | | | | | | | | | | | | | | | | | | | Basic/diluted (loss)/profit per share attributable to Kenon’s shareholders (in dollars): | | 25 | | | | | | | | | | | | | | Basic/diluted (loss)/profit per share | | | | | | (4.42 | ) | | | 5.80 | | | | 17.27 | |
The accompanying notes are an integral part of the consolidated financial statements. Kenon Holdings Ltd. and subsidiaries Consolidated Statements of Other Comprehensive Income for the years ended December 31, 2023, 2022 2021 and 20202021 | | | For the year ended December 31, | | | For the year ended December 31, | | | | | 2022 | | | 2021 | | | 2020 | | | 2023 | | | 2022 | | | 2021 | | | | | $ Thousands | | | $ Thousands | | | | | | | | | | | | | | | | | | Profit for the year | | 349,659 | | 875,317 | | 504,225 | | | (Loss)/Profit for the year | | | (210,948 | ) | | 349,659 | | 875,317 | | | | | | | | | | | | | | | | | | Items that are or will be subsequently reclassified to profit or loss | | | | | | | | | | | | | | | Foreign currency translation differences in respect of foreign operations | | (40,694 | ) | | 17,489 | | 36,354 | | | (10,068 | ) | | (40,694 | ) | | 17,489 | | Reclassification of foreign currency and capital reserve differences on loss of significant influence | | - | | - | | (23,425 | ) | | Group’s share in other comprehensive income of associated companies | | 13,611 | | 12,360 | | 1,873 | | | (15,905 | ) | | 13,611 | | 12,360 | | Effective portion of change in the fair value of cash-flow hedges | | 14,774 | | 8,772 | | (45,322 | ) | | (11,027 | ) | | 14,774 | | 8,772 | | Change in fair value of other investments at FVOCI | | (2,100 | ) | | - | | - | | | 6,773 | | (2,100 | ) | | - | | Change in fair value of derivative financial instruments used for hedging cash flows recorded to the cost of the hedged item | | (1,043 | ) | | 37,173 | | 3,067 | | | (1,433 | ) | | (1,043 | ) | | 37,173 | | Change in fair value of derivatives financial instruments used to hedge cash flows transferred to the statement of profit & loss | | (4,125 | ) | | (2,121 | ) | | 6,300 | | | (5,474 | ) | | (4,125 | ) | | (2,121 | ) | Income taxes in respect of components of other comprehensive income | | | (2,658 | ) | | | (423 | ) | | | 1,346 | | | | 1,552 | | | (2,658 | ) | | | (423 | ) | Total other comprehensive income for the year | | | (22,235 | ) | | | 73,250 | | | (19,807 | ) | | | (35,582 | ) | | | (22,235 | ) | | | 73,250 | | Total comprehensive income for the year | | | 327,424 | | | 948,567 | | | 484,418 | | | | (246,530 | ) | | | 327,424 | | | 948,567 | | | | | | | | | | | | | | | | | | Attributable to: | | | | | | | | | | | | | | | Kenon’s shareholders | | 290,985 | | 969,862 | | 486,165 | | | (246,936 | ) | | 290,985 | | 969,862 | | Non-controlling interests | | | 36,439 | | | (21,295 | ) | | | (1,747 | ) | | | 406 | | | 36,439 | | | (21,295 | ) | Total comprehensive income for the year | | | 327,424 | | | 948,567 | | | 484,418 | | | | (246,530 | ) | | | 327,424 | | | 948,567 | |
The accompanying notes are an integral part of the consolidated financial statements.
Kenon Holdings Ltd. and subsidiaries
Consolidated Statements of Changes in Equity
For the years ended December 31, 2022, 2021 and 2020
| | | | | | | | | | | | | | | | | | | | | Non- | | | | | | | | | | | | | | | | | | | | | | | | | | controlling | | | | | | | | | | | Attributable to the owners of the Company | | | interests | | | Total | | | | | | | | Share | | | Translation | | | Capital | | | Accumulated | | | | | | | | | | | | | | | | | Capital | | | reserve | | | reserve | | | profit | | | Total | | | | | | | | | | | Note | | | $ Thousands | | | | | | | | | | | | | | | | | | | | | | | | | | | | Balance at January 1, 2022 | | | | | | 602,450 | | | | 25,680 | | | | 25,783 | | | | 1,139,775 | | | | 1,793,688 | | | | 486,598 | | | | 2,280,286 | | Transactions with owners, recognised directly in equity | | | | | | | | | | | | | | | | | | | | | | | | | | | | | | | | Contributions by and distributions to owners | | | | | | | | | | | | | | | | | | | | | | | | | | | | | | | | Cash distribution to owners of the Company | | 19.F | | | | (552,316 | ) | | | - | | | | - | | | | - | | | | (552,316 | ) | | | - | | | | (552,316 | ) | Share-based payment transactions | | | | | | - | | | | | | | | 8,502 | | | | | | | | 8,502 | | | | 2,104 | | | | 10,606 | | Total contributions by and distributions to owners | | | | | | (552,316 | ) | | | - | | | | 8,502 | | | | - | | | | (543,814 | ) | | | 2,104 | | | | (541,710 | ) | | | | | | | | | | | | | | | | | | | | | | | | | | | | | | | | | | Changes in ownership interests in subsidiaries | | | | | | | | | | | | | | | | | | | | | | | | | | | | | | | | Dilution in investment in subsidiary | | 11.A.5 | | | | - | | | | - | | | | - | | | | 57,585 | | | | 57,585 | | | | 135,567 | | | | 193,152 | | Acquisition of subsidiary with non-controlling interest | | | | | | - | | | | - | | | | 41 | | | | - | | | | 41 | | | | - | | | | 41 | | Investments from holders of non-controlling
interests in equity of subsidiary | | | | | | - | | | | - | | | | - | | | | - | | | | - | | | | 36,725 | | | | 36,725 | | Total changes in ownership interests in subsidiaries | | | | | | - | | | | - | | | | 41 | | | | 57,585 | | | | 57,626 | | | | 172,292 | | | | 229,918 | | | | | | | | | | | | | | | | | | | | | | | | | | | | | | | | | | | Total comprehensive income for the year | | | | | | | | | | | | | | | | | | | | | | | | | | | | | | | | Net profit for the year | | | | | | - | | | | - | | | | - | | | | 312,652 | | | | 312,652 | | | | 37,007 | | | | 349,659 | | Other comprehensive income for the year, net of tax | | | | | | - | | | | (24,474 | ) | | | 8,227 | | | | (5,420 | ) | | | (21,667 | ) | | | (568 | ) | | | (22,235 | ) | Total comprehensive income for the year | | | | | | - | | | | (24,474 | ) | | | 8,227 | | | | 307,232 | | | | 290,985 | | | | 36,439 | | | | 327,424 | | | | | | | | | | | | | | | | | | | | | | | | | | | | | | | | | | | Balance at December 31, 2022 | | | | | | 50,134 | | | | 1,206 | | | | 42,553 | | | | 1,504,592 | | | | 1,598,485 | | | | 697,433 | | | | 2,295,918 |
The accompanying notes are an integral part of the consolidated financial statements.
Kenon Holdings Ltd. and subsidiaries
Consolidated Statements of Changes in Equity
For the years ended December 31, 2023, 2022 2021 and 20202021 | | | | | | | | | | | | | | | Non- | | | | | | | | | | | | | | | | | Non- | | | | | | | | | | | | | | | | | | | controlling | | | | | | | | | | | | | | | | | controlling | | | | | | | | | Attributable to the owners of the Company | | interests | | Total | | | | | Attributable to the owners of the Company | | interests | | Total | | | | | | | Share | | Translation | | Capital | | Accumulated | | | | | | | | | | | | | | | | | | | | | | | | | | | | | | Capital | | reserve | | reserve | | profit | | Total | | | | | | | | | Share | | Translation | | Capital | | Accumulated | | | | | | | | | | | Note | | $ Thousands | | | | | Capital | | reserve | | reserve | | profit | | Total | | | | | | | | | | | | | | | | | | | | | | | | | | Note | | $ Thousands | | Balance at January 1, 2021 | | | | 602,450 | | 15,896 | | (11,343 | ) | | 459,820 | | 1,066,823 | | 209,185 | | 1,276,008 | | | | | | | | | | | | | | | | | | | | | | | Balance at January 1, 2023 | | | | | 50,134 | | 1,206 | | 42,553 | | 1,504,592 | | 1,598,485 | | 697,433 | | 2,295,918 | | Transactions with owners, recognised directly in equity | | | | | | | | | | | | | | | | | | | | | | | | | | | | | | | | | | | Contributions by and distributions to owners | | | | | | | | | | | | | | | | | | | | | | | | | | | | | | | | | | | Dividend declared and paid | | | 19.D | | | - | | - | | - | | (150,365 | ) | | (150,365 | ) | | - | | (150,365 | ) | Share-based payment transactions | | | | - | | - | | 7,371 | | - | | 7,371 | | 1,187 | | 8,558 | | | | | - | | - | | 4,753 | | - | | 4,753 | | 1,386 | | 6,139 | | Dividends declared | | 19.D | | | - | | | - | | | - | | | (288,811 | ) | | | (288,811 | ) | | | (10,214 | ) | | | (299,025 | ) | | Own shares acquired | | | 19.G | | | | - | | | - | | | - | | | (28,130 | ) | | | (28,130 | ) | | | - | | | (28,130 | ) | Total contributions by and distributions to owners | | | | - | | - | | 7,371 | | (288,811 | ) | | (281,440 | ) | | (9,027 | ) | | (290,467 | ) | | | | - | | - | | 4,753 | | (178,495 | ) | | (173,742 | ) | | 1,386 | | (172,356 | ) | | | | | | | | | | | | | | | | | | | | | | | | | | | | | | | | | | | | | Changes in ownership interests in subsidiaries | | | | | | | | | | | | | | | | | | | | | | | | | | | | | | | | | | | Dilution in investment in subsidiary | | 11.A.5 | | | - | | - | | - | | 38,443 | | 38,443 | | 103,891 | | 142,334 | | | Non-controlling interests in respect of business combinations | | | | - | | - | | - | | - | | - | | 6,769 | | 6,769 | | | Acquisition of shares of subsidiary from holders of rights not conferring control | | | 11.A.2 | | - | | - | | 25,502 | | - | | 25,502 | | 103,812 | | 129,314 | | Investments from holders of non-controlling
interests in equity of subsidiary | | | | | - | | | - | | | - | | | - | | | - | | | 197,075 | | | 197,075 | | | | | | - | | | - | | | - | | | - | | | - | | | 63,878 | | | 63,878 | | Total changes in ownership interests in subsidiaries | | | | - | | - | | - | | 38,443 | | 38,443 | | 307,735 | | 346,178 | | | | | - | | - | | 25,502 | | - | | 25,502 | | 167,690 | | 193,192 | | | | | | | | | | | | | | | | | | | | | | | | | | | | | | | | | | | | | | Total comprehensive income for the year | | | | | | | | | | | | | | | | | | | | | | | | | | | | | | | | | | | Net profit for the year | | | | - | | - | | - | | 930,273 | | 930,273 | | (54,956 | ) | | 875,317 | | | Net (loss)/profit for the year | | | | | - | | - | | - | | (235,978 | ) | | (235,978 | ) | | 25,030 | | (210,948 | ) | Other comprehensive income for the year, net of tax | | | | | - | | | 9,784 | | | 29,755 | | | 50 | | | 39,589 | | | 33,661 | | | 73,250 | | | | | | - | | | (4,864 | ) | | | (3,016 | ) | | | (3,078 | ) | | | (10,958 | ) | | | (24,624 | ) | | | (35,582 | ) | Total comprehensive income for the year | | | | | - | | | 9,784 | | | 29,755 | | | 930,323 | | | 969,862 | | | (21,295 | ) | | | 948,567 | | | | | | - | | | (4,864 | ) | | | (3,016 | ) | | | (239,056 | ) | | | (246,936 | ) | | | 406 | | | (246,530 | ) | | | | | | | | | | | | | | | | | | | | | | | | | | | | | | | | | | | | | Balance at December 31, 2021 | | | | | 602,450 | | | 25,680 | | | 25,783 | | | 1,139,775 | | | 1,793,688 | | | 486,598 | | | 2,280,286 | | | Balance at December 31, 2023 | | | | | | 50,134 | | | (3,658 | ) | | | 69,792 | | | 1,087,041 | | | 1,203,309 | | | 866,915 | | | 2,070,224 | |
The accompanying notes are an integral part of the consolidated financial statements. Kenon Holdings Ltd. and subsidiaries Consolidated Statements of Changes in Equity For the years ended December 31, 2023, 2022 2021 and 20202021 | | | | | | | | | | | | | | | Non- | | | | | | | | | | | | | | | | | | | | | | Non- | | | | | | | | | | | | | | | | | | | | controlling | | | | | | | | | | | | | | | | | | | | | | controlling | | | | | | | | | | Attributable to the owners of the Company | | interests | | Total | | | | | | Attributable to the owners of the Company | | | interests | | | Total | | | | | | | Share | | Translation | | Capital | | Accumulated | | | | | | | | | | | | | | | | | | | | | | | | | | | | | | | | | | | | Capital | | reserve | | reserve | | profit | | Total | | | | | | | | | Share | | | Translation | | | Capital | | | Accumulated | | | | | | | | | | | | | | Note | | $ Thousands | | | | | | Capital | | | reserve | | | reserve | | | profit | | | Total | | | | | | | | | | | | | | | | | | | | | | | | | | | | Note | | | $ Thousands | | Balance at January 1, 2020 | | | | 602,450 | | 17,889 | | 13,962 | | (10,949 | ) | | 623,352 | | 88,436 | | 711,788 | | | | | | | | | | | | | | | | | | | | | | | | | | | | | Balance at January 1, 2022 | | | | | | | 602,450 | | | | 25,680 | | | | 25,783 | | | | 1,139,775 | | | | 1,793,688 | | | | 486,598 | | | | 2,280,286 | | Transactions with owners, recognised directly in equity | | | | | | | | | | | | | | | | | | | | | | | | | | | | | | | | | | | | | | | | | | | | | | | | | Contributions by and distributions to owners | | | | | | | | | | | | | | | | | | | | | | | | | | | | | | | | | | | | | | | | | | | | | | | | | Cash distribution to owners of the Company | | | 19.F | | | | (552,316 | ) | | | - | | | | - | | | | - | | | | (552,316 | ) | | | - | | | | (552,316 | ) | Share-based payment transactions | | | | - | | - | | 874 | | - | | 874 | | 236 | | 1,110 | | | | | | | - | | | | | | | | 8,502 | | | | | | | | 8,502 | | | | 2,104 | | | | 10,606 | | Dividend to holders of non-controlling interests in subsidiaries | | | | | | | | | | | | - | | | | - | | | Dividends declared and paid | | 19.D | | | | - | | | - | | | - | | | (120,133 | ) | | | (120,133 | ) | | | (12,412 | ) | | | (132,545 | ) | | Total contributions by and distributions to owners | | | | - | | - | | 874 | | (120,133 | ) | | (119,259 | ) | | (12,176 | ) | | (131,435 | ) | | | | | | (552,316 | ) | | | - | | | | 8,502 | | | | - | | | | (543,814 | ) | | | 2,104 | | | | (541,710 | ) | | | | | | | | | | | | | | | | | | | | | | | | | | | | | | | | | | | | | | | | | | | | | | | | | | | Changes in ownership interests in subsidiaries | | | | | | | | | | | | | | | | | | | | | | | | | | | | | | | | | | | | | | | | | | | | | | | | | Dilution in investment in subsidiary | | 11.A.5 | | | - | | - | | - | | 80,674 | | 80,674 | | 136,170 | | 216,844 | | | | | | | - | | | | - | | | | - | | | | 57,585 | | | | 57,585 | | | | 135,567 | | | | 193,152 | | Acquisition of non-controlling interests without a change in control | | | | | - | | | - | | | (4,109 | ) | | | - | | | (4,109 | ) | | | (1,498 | ) | | | (5,607 | ) | | Acquisition of subsidiary with non-controlling interest | | | | | | | - | | | | - | | | | 41 | | | | - | | | | 41 | | | | - | | | | 41 | | Investments from holders of non-controlling interests in equity of subsidiary | | | | | | | - | | | | - | | | | - | | | | - | | | | - | | | | 36,725 | | | | 36,725 | | Total changes in ownership interests in subsidiaries | | | | - | | - | | (4,109 | ) | | 80,674 | | 76,565 | | 134,672 | | 211,237 | | | | | | | - | | | | - | | | | 41 | | | | 57,585 | | | | 57,626 | | | | 172,292 | | | | 229,918 | | | | | | | | | | | | | | | | | | | | | | | | | | | | | | | | | | | | | | | | | | | | | | | | | | | | Total comprehensive income for the year | | | | | | | | | | | | | | | | | | | | | | | | | | | | | | | | | | | | | | | | | | | | | | | | | Net profit for the year | | | | - | | - | | - | | 507,106 | | 507,106 | | (2,881 | ) | | 504,225 | | | | | | | - | | | | - | | | | - | | | | 312,652 | | | | 312,652 | | | | 37,007 | | | | 349,659 | | Other comprehensive income for the year, net of tax | | | | | | | | (1,993 | ) | | | (22,070 | ) | | | 3,122 | | | (20,941 | ) | | | 1,134 | | | (19,807 | ) | | | | | | - | | | | (24,474 | ) | | | 8,227 | | | | (5,420 | ) | | | (21,667 | ) | | | (568 | ) | | | (22,235 | ) | Total comprehensive income for the year | | | | | - | | | (1,993 | ) | | | (22,070 | ) | | | 510,228 | | | 486,165 | | | (1,747 | ) | | | 484,418 | | | | | | | - | | | | (24,474 | ) | | | 8,227 | | | | 307,232 | | | | 290,985 | | | | 36,439 | | | | 327,424 | | | | | | | | | | | | | | | | | | | | | | | | | | | | | | | | | | | | | | | | | | | | | | | | | | | | Balance at December 31, 2020 | | | | | 602,450 | | | 15,896 | | | (11,343 | ) | | | 459,820 | | | 1,066,823 | | | 209,185 | | | 1,276,008 | | | Balance at December 31, 2022 | | | | | | | 50,134 | | | | 1,206 | | | | 42,553 | | | | 1,504,592 | | | | 1,598,485 | | | | 697,433 | | | | 2,295,918 | |
The accompanying notes are an integral part of the consolidated financial statements. Kenon Holdings Ltd. and subsidiaries Consolidated Statements of Changes in Equity For the years ended December 31, 2023, 2022 and 2021 | | | | | | | | | | | | | | | | | | | | | Non- | | | | | | | | | | | | | | | | | | | | | | | | | | controlling | | | | | | | | | | | Attributable to the owners of the Company | | | interests | | | Total | | | | | | | | | | | | | | | | | | | | | | | | | | | | | | | | | | Share | | | Translation | | | Capital | | | Accumulated | | | | | | | | | | | | | | | | | Capital | | | reserve | | | reserve | | | profit | | | Total | | | | | | | | | | | Note | | | $ Thousands | | | | | | | | | | | | | | | | | | | | | | | | | | | | Balance at January 1, 2021 | | | | | | 602,450 | | | | 15,896 | | | | (11,343 | ) | | | 459,820 | | | | 1,066,823 | | | | 209,185 | | | | 1,276,008 | | Transactions with owners, recognised directly in equity | | | | | | | | | | | | | | | | | | | | | | | | | | | | | | | | Contributions by and distributions to owners | | | | | | | | | | | | | | | | | | | | | | | | | | | | | | | | Share-based payment transactions | | | | | | - | | | | - | | | | 7,371 | | | | - | | | | 7,371 | | | | 1,187 | | | | 8,558 | | Dividends declared | | 19.D | | | | - | | | | - | | | | - | | | | (288,811 | ) | | | (288,811 | ) | | | (10,214 | ) | | | (299,025 | ) | Total contributions by and distributions to owners | | | | | | - | | | | - | | | | 7,371 | | | | (288,811 | ) | | | (281,440 | ) | | | (9,027 | ) | | | (290,467 | ) | | | | | | | | | | | | | | | | | | | | | | | | | | | | | | | | | | Changes in ownership interests in subsidiaries | | | | | | | | | | | | | | | | | | | | | | | | | | | | | | | | Dilution in investment in subsidiary | | 11.A.7 | | | | - | | | | - | | | | - | | | | 38,443 | | | | 38,443 | | | | 103,891 | | | | 142,334 | | Non-controlling interests in respect of business combinations | | | | | | - | | | | - | | | | - | | | | - | | | | - | | | | 6,769 | | | | 6,769 | | Investments from holders of non-controlling interests in equity of subsidiary | | | | | | - | | | | - | | | | - | | | | - | | | | - | | | | 197,075 | | | | 197,075 | | Total changes in ownership interests in subsidiaries | | | | | | - | | | | - | | | | - | | | | 38,443 | | | | 38,443 | | | | 307,735 | | | | 346,178 | | | | | | | | | | | | | | | | | | | | | | | | | | | | | | | | | | | Total comprehensive income for the year | | | | | | | | | | | | | | | | | | | | | | | | | | | | | | | | Net profit for the year | | | | | | - | | | | - | | | | - | | | | 930,273 | | | | 930,273 | | | | (54,956 | ) | | | 875,317 | | Other comprehensive income for the year, net of tax | | | | | | - | | | | 9,784 | | | | 29,755 | | | | 50 | | | | 39,589 | | | | 33,661 | | | | 73,250 | | Total comprehensive income for the year | | | | | | - | | | | 9,784 | | | | 29,755 | | | | 930,323 | | | | 969,862 | | | | (21,295 | ) | | | 948,567 | | | | | | | | | | | | | | | | | | | | | | | | | | | | | | | | | | | Balance at December 31, 2021 | | | | | | 602,450 | | | | 25,680 | | | | 25,783 | | | | 1,139,775 | | | | 1,793,688 | | | | 486,598 | | | | 2,280,286 | |
The accompanying notes are an integral part of the consolidated financial statements. Kenon Holdings Ltd. and subsidiaries Consolidated Statements of Cash Flows For the years ended December 31, 2023, 2022 2021 and 20202021 | | | | | For the year ended December 31, | | | | | For the year ended December 31, | | | | | | | 2022 | | | 2021 | | | 2020 | | | | | 2023 | | 2022 | | 2021 | | | | | Note | | $ Thousands | | | Note | | $ Thousands | | | | | | | | | | | | | | | | | | | | | | Cash flows from operating activities | | | | | | | | | | | | | | | | | | | Profit for the year | | | | 349,659 | | 875,317 | | 504,225 | | | (Loss)/Profit for the year | | | | | (210,948 | ) | | 349,659 | | 875,317 | | Adjustments: | | | | | | | | | | | | | | | | | | | Depreciation and amortization | | | | 62,876 | | 57,640 | | 34,171 | | | | | 90,939 | | 62,876 | | 57,640 | | Financing expenses, net | | 23 | | 5,711 | | 141,361 | | 36,883 | | | 23 | | 26,972 | | 5,711 | | 141,361 | | Share in profit of associated companies, net | | 9.A.2 | | (1,118,175 | ) | | (1,250,149 | ) | | (160,894 | ) | | Gains on disposal of property, plant and equipment, net | | | | - | | - | | (1,551 | ) | | Losses/(gains) related to Qoros | | 10 | | - | | 251,483 | | (309,918 | ) | | Losses/(gains) related to ZIM | | 9.B.a | | 727,650 | | 204 | | (43,505 | ) | | Recovery of retained claims | | 26 | | - | | - | | (9,923 | ) | | Share in losses/(profit) of associated companies, net | | | 9.A.2 | | 200,480 | | (1,118,175 | ) | | (1,250,149 | ) | Losses related to Qoros | | | 10 | | - | | - | | 251,483 | | Losses related to ZIM | | | 9.B.a | | 860 | | 727,650 | | 204 | | Share-based payments | | | | 18,855 | | 18,369 | | 1,110 | | | | | (1,547 | ) | | 18,855 | | 18,369 | | Other expenses, net | | | | | 4,461 | | - | | - | | Income taxes | | | | | 37,980 | | | 4,325 | | | 6,145 | | | | | | 25,199 | | | 37,980 | | | 4,325 | | | | | | | 84,556 | | 98,550 | | 56,743 | | | | | 136,416 | | 84,556 | | 98,550 | | Change in trade and other receivables | | | | (28,819 | ) | | (1,171 | ) | | (9,669 | ) | | | | (2,932 | ) | | (28,819 | ) | | (1,171 | ) | Change in trade and other payables | | | | | (10,100 | ) | | | (429 | ) | | | 45,061 | | | | | | (9,514 | ) | | | (10,100 | ) | | | (429 | ) | Cash generated from operating activities | | | | 45,637 | | 96,950 | | 92,135 | | | | | 123,970 | | 45,637 | | 96,950 | | Dividends received from associated companies, net | | | | 727,309 | | 143,964 | | - | | | | | 154,672 | | 727,309 | | 143,964 | | Income taxes (paid)/refunded, net | | | | | (1,565 | ) | | | (385 | ) | | | 61 | | | Income taxes paid, net | | | | | | (1,854 | ) | | | (1,565 | ) | | | (385 | ) | Net cash provided by operating activities | | | | | 771,381 | | | 240,529 | | | 92,196 | | | | | | 276,788 | | | 771,381 | | | 240,529 | |
The accompanying notes are an integral part of the consolidated financial statements. Kenon Holdings Ltd. and subsidiaries Consolidated Statements of Cash Flows, continued For the years ended December 31, 2023, 2022 2021 and 20202021 | | | | | For the year ended December 31, | | | | | For the year ended December 31, | | | | | | | 2022 | | 2021 | | 2020 | | | | | 2023 | | 2022 | | 2021 | | | | | Note | | $ Thousands | | | Note | | $ Thousands | | Cash flows from investing activities | | | | | | | | | | | | | | | | | Short-term deposits and restricted cash, net | | | (46,266 | ) | | 558,247 | | (501,618 | ) | | | 49,827 | | (46,266 | ) | | 558,247 | | Short-term collaterals deposits, net | | | (19,180 | ) | | - | | - | | | | | 29,864 | | (19,180 | ) | | - | | Investment in long-term deposits, net | | | 12,750 | | 51,692 | | 6,997 | | | | | 154 | | 12,750 | | 51,692 | | Investments in associated companies, less cash acquired | | | | | (7,619 | ) | | (2,932 | ) | | (8,566 | ) | Acquisition of subsidiary, less cash acquired | | | 11.A.4 | | (327,108 | ) | | - | | (659,169 | ) | Acquisition of property, plant and equipment, intangible assets and payment of
long-term advance deposits and prepaid expenses | | | | | (332,117 | ) | | (281,286 | ) | | (239,663 | ) | Proceeds from sales of interest in ZIM | | | 9.B.a.4 | | - | | 463,549 | | 67,087 | | Proceeds from distribution from associated companies | | | | | 3,000 | | 4,444 | | 46,729 | | Proceeds from sale of subsidiary, net of cash disposed off | | | | | 2,000 | | - | | - | | Proceeds from sale of other investments | | | | | 193,698 | | 308,829 | | - | | Purchase of other investments | | | (650,777 | ) | | - | | - | | | | | (50,000 | ) | | (650,777 | ) | | - | | Proceeds from sale of other investments | | | 308,829 | | - | | - | | | Long-term advance deposits and prepaid expenses | | | (11,013 | ) | | (6,976 | ) | | (57,591 | ) | | Long-term loan to an associate | | | - | | (5,000 | ) | | - | | | | | (23,950 | ) | | - | | (5,000 | ) | Proceeds from sale of subsidiary, net of cash disposed off | | | - | | - | | 407 | | | Acquisition of subsidiary, less cash acquired | | 11.A.4 | | - | | (659,169 | ) | | - | | | Investments in associated companies, less cash acquired | | | | (2,932 | ) | | (8,566 | ) | | - | | | Acquisition of property, plant and equipment | | | | (259,820 | ) | | (231,235 | ) | | (74,456 | ) | | Acquisition of intangible assets | | | | (10,453 | ) | | (1,452 | ) | | (368 | ) | | Proceeds from sale of property, plant and equipment and intangible assets | | | | - | | - | | 546 | | | Reimbursement in respect of right-of-use asset | | | | - | | 4,823 | | - | | | | | - | | - | | 4,823 | | Interest received | | | | 6,082 | | 269 | | 709 | | | | | 27,968 | | 6,082 | | 269 | | Income tax paid | | | | - | | - | | (32,332 | ) | | Deferred consideration in respect of acquisition of subsidiary | | | | - | | - | | (13,632 | ) | | Proceeds from/(payment of) transactions in derivatives, net | | | | 1,349 | | (5,635 | ) | | (3,963 | ) | | | | 2,047 | | 1,349 | | (5,635 | ) | Proceeds from distribution from associated companies | | | | 4,444 | | 46,729 | | - | | | Proceeds from deferred payment | | | | - | | - | | 217,810 | | | Proceeds from sales of interest in ZIM | | 9.B.a.4 | | 463,549 | | 67,087 | | - | | | Proceeds from sale of interest in Qoros | | 10.3 | | - | | - | | 219,723 | | | (Payment)/recovery of financial guarantee | | 10.6 | | - | | (16,265 | ) | | 6,265 | | | Recovery of retained claims | | 26 | | | - | | | - | | | 9,923 | | | Payment of financial guarantee | | | 10.6 | | | - | | | - | | | (16,265 | ) | Net cash used in investing activities | | | | | (203,438 | ) | | | (205,451 | ) | | | (221,580 | ) | | | | | (432,236 | ) | | | (203,438 | ) | | | (205,451 | ) | | | | | | | | | | | | | | | | | | | | | Cash flows from financing activities | | | | | | | | | | | | | | | | | | | Dividends paid to holders of non-controlling interests | | | | - | | (10,214 | ) | | (12,412 | ) | | Cash distribution and dividends paid | | 19.D, 19.F | | | (740,922 | ) | | (100,209 | ) | | (120,115 | ) | | Investments from holders of non-controlling interests in equity of subsidiary | | | | 36,725 | | 197,076 | | 32 | | | Costs paid in advance in respect of taking out of loans | | | | (2,845 | ) | | (4,991 | ) | | (8,556 | ) | | Payment of early redemption commission with respect to the debentures | | 15.1.B | | | - | | (75,820 | ) | | (11,202 | ) | | Payment in respect of derivative financial instruments, net | | | | (923 | ) | | (13,933 | ) | | - | | | Proceeds from issuance of share capital by a subsidiary to non-controlling
interests, net of issuance expenses | | 11.A.5, 11.A.6 | | 193,148 | | 142,334 | | 216,844 | | | Receipt of long-term loans | | | | 102,331 | | 343,126 | | 73,236 | | | Proceeds from issuance of debentures, less issuance expenses | | 15.2 | | - | | 262,750 | | 280,874 | | | Repayment of long-term loans, debentures and lease liabilities | | | | (55,762 | ) | | (562,016 | ) | | (130,210 | ) | | | | (167,769 | ) | | (55,762 | ) | | (562,016 | ) | Short-term credit from banks and others, net | | | | - | | - | | (134 | ) | | | | 62,187 | | - | | - | | Acquisition of non-controlling interests | | | | - | | - | | (7,558 | ) | | Proceeds from Veridis transaction | | | 11.A.2 | | 129,181 | | - | | - | | Proceeds from issuance of share capital by a subsidiary to non-controlling
interests, net of issuance expenses | | | | | - | | 193,148 | | 142,334 | | Investments from holders of non-controlling interests in equity of subsidiary | | | | | 63,878 | | 36,725 | | 197,076 | | Tax Equity Investment | | | 18.A.4.d | | | 82,405 | | - | | - | | Receipt of long-term loans | | | | | 391,447 | | 102,331 | | 343,126 | | Proceeds from/(payment of) derivative financial instruments, net | | | | | 2,385 | | (923 | ) | | (13,933 | ) | Repurchase of own shares | | | | | (28,130 | ) | | - | | - | | Costs paid in advance in respect of taking out of loans | | | | | (19,508 | ) | | (2,845 | ) | | (4,991 | ) | Cash distribution and dividends paid | | | 19.D, 19.F | | | (150,362 | ) | | (740,922 | ) | | (100,209 | ) | Dividends paid to holders of non-controlling interests | | | | | - | | - | | (10,214 | ) | Payment of early redemption commission with respect to the debentures | | | 15.1.B | | | - | | - | | (75,820 | ) | Proceeds from issuance of debentures, less issuance expenses | | | 15.2 | | - | | - | | 262,750 | | Interest paid | | | | | (25,428 | ) | | | (31,523 | ) | | | (24,989 | ) | | | | | (41,135 | ) | | | (25,428 | ) | | | (31,523 | ) | Net cash (used in)/provided by financing activities | | | | | (493,676 | ) | | | 146,580 | | | 255,810 | | | Net cash provided by/(used in) financing activities | | | | | | 324,579 | | | (493,676 | ) | | | 146,580 | | | | | | | | | | | | | | | | | | | | | | Increase in cash and cash equivalents | | | | 74,267 | | 181,658 | | 126,426 | | | | | 169,131 | | 74,267 | | 181,658 | | Cash and cash equivalents at beginning of the year | | | | 474,544 | | 286,184 | | 147,153 | | | | | 535,171 | | 474,544 | | 286,184 | | Effect of exchange rate fluctuations on balances of cash and cash equivalents | | | | | (13,640 | ) | | | 6,702 | | | 12,605 | | | | | | (7,464 | ) | | | (13,640 | ) | | | 6,702 | | Cash and cash equivalents at end of the year | | | | | 535,171 | | | 474,544 | | | 286,184 | | | | | | 696,838 | | | 535,171 | | | 474,544 | |
The accompanying notes are an integral part of the consolidated financial statements. Kenon Holdings Ltd. Notes to the consolidated financial statements Note 1 – Financial Reporting Principles and Accounting Policies Kenon Holdings Ltd. (the “Company” or “Kenon”) was incorporated on March 7, 2014 in the Republic of Singapore under the Singapore Companies Act. Our principal place of business is located at 1 Temasek Avenue #37-02B, Millenia Tower, Singapore 039192. The Company is a holding company and was incorporated to receive investments spun-off from their former parent company, Israel Corporation Ltd. (“IC”). The Company serves as the holding company of several businesses (together referred to as the “Group”). Kenon shares are traded on New York Stock Exchange (“NYSE”) and on Tel Aviv Stock Exchange (“TASE”) (NYSE and TASE: KEN). In these consolidated financial statements - 1. Subsidiaries – Companiescompanies whose financial statements are fully consolidated with those of Kenon, directly or indirectly. 2. Associates – Companiescompanies in which Kenon has significant influence and Kenon’s investment is stated, directly or indirectly, on the equity basis. 3. Investee companies – subsidiaries and/or associated companies and/or long-term investment (Qoros). 4. Related parties – within the meaning thereof in International Accounting Standard (“IAS”) 24 Related Parties. Note 2 – Basis of Preparation of the Financial Statements | A. | Declaration of compliance with International Financial Reporting Standards |
The consolidated financial statements were prepared by management of the Group in accordance with International Financial Reporting Standards (“IFRS”) as issued by the International Accounting Standards Board (“IASB”). The consolidated financial statements were approved for issuance by the Company’s Board of Directors on March 30, 2023.26, 2024. | B. | Functional and presentation currency |
These consolidated financial statements are presented in US dollars (“$”), which is Kenon’s functional currency, and have been rounded to the nearest thousands, except where otherwise indicated. The US dollar is the currency that represents the principal economic environment in which Kenon operates. The consolidated financial statements were prepared on the historical cost basis, with the exception of the following assets and liabilities: | | • | Deferred tax assets and liabilities |
| | • | Assets and liabilities in respect of employee benefits |
| | • | Investments in associated companies |
| | • | Long-term investment (Qoros) |
For additional information regarding measurement of these assets and liabilities – see Note 3 SignificantMaterial Accounting Policies. Note 2 – Basis of Preparation of the Financial Statements (Cont’d) | D. | Use of estimates and judgment |
The preparation of consolidated financial statements in conformity with IFRS requires management to make judgments, estimates and assumptions that affect the application of accounting policies and the reported amounts of assets, liabilities, income and expenses. Actual results may differ from these estimates. Estimates and underlying assumptions are reviewed on an ongoing basis. Revisions to accounting estimates are recognized in the period in which the estimates are revised and in any future periods affected. | 1. | Allocation of acquisition costs (CPV) |
The Group makes estimates with respect to allocation of excess consideration to tangible and intangible assets and to liabilities. The Group has considered the report from a qualified external valuer to establish the appropriate valuation techniques and inputs for this assessment. The valuation technique used for measuring the fair values of the material assets: property, plant and equipment, investment in associated companies, and intangible assets is the income approach, a present value technique to convert future amounts to a single current amount using relevant discount rates. The respective discount rates are estimates and require judgment and minor changes to the discount rates could have had a significant effect on the Group’s evaluation of the transaction completion date fair values of the material assets. Refer to Note 11.A.411.A.1.1, Note 11.A.5 and Note 11.A.6 for further details. In addition, in determining the depreciation rates of the tangible, intangible assets and liabilities, the Group estimates the expected life of the asset or liability. | 2. | Long-term investment (Qoros) |
Following the sale of half of the Group’s remaining interest in Qoros (i.e. 12%) as described in Note 10.3, as atof December 31, 2020, the Group owned a 12% interest in Qoros. The long-term investment (Qoros) was a combination of the Group’s remaining 12% interest in Qoros and the non-current portion of the put option (as described in Note 10.2). The long-term investment (Qoros) was determined using a combination of market comparison technique based on market multiples derived from the quoted prices of comparable companies adjusted for various considerations, and the binomial model. Fair value measurement of the long-term investment (Qoros) took into account the underlying asset’s price volatility. In April 2021, Quantum entered into an agreement to sell its remaining 12% equity interest in Qoros. As a result, Kenon accounted for the fair value of the long-term investment (Qoros) based on the present value of the expected cash flows. Refer to Note 10.5 for further details. | 3. | Recoverable amount of cash-generating unit that includes goodwill (CPV) |
The calculation of the recoverable amount of cash-generating units to which goodwill balances are allocated is based, among other things, on the projected expected cash flows and discount rate. For further information, see Note 13.C and Note 13.D. | 4. | Recoverable amount of cash-generating unit of investment in equity-accounted companies (ZIM) |
The carrying amounts of investments in equity-accounted companies are reviewed at each reporting date to determine whether there is any indication of impairment. If any such indication exists, the recoverable amount of the investments is estimated. For further information, see Note 9.B.a.5. | E. | Israel Hamas War (“the War”) |
On October 7, 2023, the War broke out in Israel. The War has led to consequences and restrictions that have affected the Israeli economy, which include, among other things, a decline in business activity, extensive recruitment of reservists, restrictions on gatherings in workplaces and public spaces, restrictions on the activity of the education system, which also includes a uncertainty as to the War’s impact on macroeconomic factors in Israel and on the financial position of the State of Israel, including potential adverse effects on the credit rating of the State of Israel and Israeli financial institutions. There is a significant uncertainty as to the development of the War, its scope and duration. There is also significant uncertainty as to the impact of the War on macroeconomic and financial factors in Israel, including the situation in the Israeli capital market. Therefore, at this stage, it is not possible to assess the effect that the War will have on OPC, nor is it possible to assess the magnitude of the War’s effect on OPC and its results of operations, if any, in the short and medium term. Note 3 – Significant- Material Accounting Policies The principal accounting policies applied in the preparation of these consolidated financial statements are set out below. The Group has consistently applied the following accounting policies to all periods presented in these consolidated financial statements, unless otherwise stated. | A. | First-time application of new accounting standards, amendments and interpretations |
The Group has adopted a few new standards which are effective from January 1, 2022,2023, including those listed below. These new standards and amendments do not have a material effect on the Group’s consolidated financial statements. Note 3 – Significant Accounting Policies (Cont’d)
Amendments to IAS 16 – Property, plant1 and equipment: Proceeds before intended useIFRS Practice Statement 2 The amendments require the disclosure of ‘material’, rather than ‘significant’, accounting policies. The amendments also provide guidance on the application of materiality to disclosure of accounting policies, assisting entities to provide useful, entity-specific accounting policy information that users need to understand other information in the financial statements. The amendments prohibit a company from deducting fromGroup has reviewed the cost of property, plantaccounting policies and equipment amounts received from selling items produced whilemade updates to the company is preparinginformation disclosed below to be in line with the asset for its intended use. Instead, the company will recognize such sales proceeds and related cost in its consolidated profit or loss.amendments. The amendments require companies to apply the amendments retrospectively to items of property, plant and equipment that were brought to the location and condition necessary for them to be capable of operating in the manner intended by management on or after the beginning of the earliest period presented in the consolidated financial statements. The impact of the amendments to the Group are immaterial, hence prior year numbers are not restated.
| B. | Basis for consolidation/combination |
The Group accounts for all business combinations according to the acquisition method when the acquired set of activities and assets meets the definition of a business and control is transferred to the Group. In determining whether a particular set of activities and assets is a business, the Group assesses whether the set of assets and activities acquired includes, at a minimum, an input and substantive process and whether the acquired set has the ability to produce outputs. The Group has an option to apply a ‘concentration test’ that permits a simplified assessment of whether an acquired set of activities and assets is not a business. The optional concentration test is met if substantially all of the fair value of the gross assets acquired is concentrated in a single identifiable asset or group of similar identifiable assets. The acquisition date is the date on which the Group obtains control over an acquiree. Control exists when the Group is exposed, or has rights, to variable returns from its involvement with the acquiree and it has the ability to affect those returns through its power over the acquiree. Substantive rights held by the Group and others are taken into account when assessing control. The Group recognizes goodwill on acquisition according to the fair value of the consideration transferred less the net amount of the fair value of identifiable assets acquired less the fair value of liabilities assumed. Goodwill is initially recognized as an asset based on its cost, and is measured in succeeding periods based on its cost less accrued losses from impairment of value. For purposes of examining impairment of value, goodwill is allocated to each of the Group’s cash‑generating units that is expected to benefit from the synergy of the business combination. Cash‑generating units to which goodwill was allocated are examined for purposes of assessment of impairment of their value every year or more frequently where there are signs indicating a possible impairment of value of the unit, as stated. Where the recoverable amount of a cash‑generating unit is less than the carrying value in the books of that cash‑generating unit, the loss from impairment of value is allocated first to reduction of the carrying value in the books of any goodwill attributed to that cash‑generating unit. Thereafter, the balance of the loss from impairment of value, if any, is allocated to other assets of the cash‑generating unit, in proportion to their carrying values in the books. A loss from impairment of value of goodwill is not reversed in subsequent periods. If the Group pays a bargain price for the acquisition (meaning including negative goodwill), it recognizes the resulting gain in profit or loss on the acquisition date. The Group recognizes contingent consideration at fair value at the acquisition date. The contingent consideration that meets the definition of a financial instrument that is not classified as equity will be measured at fair value through profit or loss; contingent consideration classified as equity shall not be remeasured and its subsequent settlement shall be accounted for within equity. Note 3 - Material Accounting Policies (Cont’d) Furthermore, goodwill is not adjusted in respect of the utilization of carry-forward tax losses that existed on the date of the business combination. Costs associated with acquisitions that were incurred by the acquirer in the business combination such as: finder’s fees, advisory, legal, valuation and other professional or consulting fees are expensed in the period the services are received. Note 3 – Significant Accounting Policies (Cont’d)
Subsidiaries are entities controlled by the Company. The financial statements of subsidiaries are included in the consolidated financial statements from the date that control commences until the date when control ceased. The accounting policies of subsidiaries have been changed when necessary to align them with the policies adopted by the Company. | (3) | Non-Controlling Interest (“NCI”) |
NCI comprises the equity of a subsidiary that cannot be attributed, directly or indirectly, to the parent company, and they include additional components such as: share-based payments that will be settled with equity instruments of the subsidiaries and options for shares of subsidiaries. NCIs are measured at their proportionate share of the acquiree’s identifiable net assets at the acquisition date. Changes in the Group’s interest in a subsidiary that do not result in a loss of control are accounted for as equity transactions. Measurement of non-controlling interests on the date of the business combination Non-controlling interests, which are instruments that convey a present ownership right and that grant to their holder a share in the net assets in a case of liquidation, are measured on the date of the business combination at fair value or based on their relative share in the identified assets and liabilities of the entity acquired, on the basis of every transaction separately. Transactions with NCI, while retaining control Transactions with NCI while retaining control are accounted for as equity transactions. Any difference between the consideration paid or received and the change in NCI is included directly in equity. Allocation of comprehensive income to the shareholders Profit or loss and any part of other comprehensive income are allocated to the owners of the Group and the NCI. Total comprehensive income is allocated to the owners of the Group and the NCI even if the result is a negative balance of NCI. Furthermore, when the holding interest in the subsidiary changes, while retaining control, the Group re-attributes the accumulated amounts that were recognized in other comprehensive income to the owners of the Group and the NCI. Cash flows deriving from transactions with holders of NCI while retaining control are classified under “financing activities” in the statement of cash flows. Loss of control
When the Group loses control over a subsidiary, it derecognizes the assets and liabilities of the subsidiary, and any related NCI and other components of equity. Any resulting gain or loss is recognized in profit or loss. Any interest retained in the former subsidiary is measured at fair value when control is lost.
| (4) | Investments in equity-accounted investees |
Associates are entities in which the Group has the ability to exercise significant influence, but not control, over the financial and operating policies. In assessing significant influence, potential voting rights that are currently exercisable or convertible into shares of the investee are taken into account. Joint-ventures are arrangements in which the Group has joint control, whereby the Group has the rights to assets of the arrangement, rather than rights to its assets and obligations for its liabilities. Associates and joint-venture are accounted for using the equity method (equity accounted investees) and are recognized initially at cost. The cost of the investment includes transaction costs. The consolidated financial statements include the Group’s share of the income and expenses in profit or loss and of other comprehensive income of equity accounted investees, after adjustments to align the accounting policies with those of the Group, from the date that significant influence commences until the date that significant influence ceases. Note 3 – Significant- Material Accounting Policies (Cont’d) The Group’s share of post-acquisition profit or loss is recognized in the income statement, and its share of post-acquisition movements in other comprehensive income is recognized in other comprehensive income with a corresponding adjustment to the carrying amount of the investment. When the Group’s share of losses exceeds its interest in an equity accounted investee, the carrying amount of that interest, including any long-term interests that form part thereof, is reduced to zero. When the Group’s share of long-term interests that form a part of the investment in the investee is different from its share in the investee’s equity, the Group continues to recognize its share of the investee’s losses, after the equity investment was reduced to zero, according to its economic interest in the long-term interests, after the equity interests were reduced to zero. When the group’s share of losses in an associate equals or exceeds its interest in the associate, including any long-term interests that, in substance, form part of the entity’s net investment in the associate, the recognition of further losses is discontinued except to the extent that the Group has an obligation to support the investee or has made payments on behalf of the investee. | (5)C. | Loss of significant influenceFinancial Instruments
|
The Group discontinues applying the equity method from the date it loses significant influence in an associate and it accounts for the retained investment as a financial asset, as relevant.
On the date of losing significant influence, the Group measures at fair value any retained interest it has in the former associate. The Group recognizes in profit or loss any difference between the sum of the fair value of the retained interest and any proceeds received from the partial disposal of the investment in the associate or joint venture, and the carrying amount of the investment on that date.
Amounts recognized in equity through other comprehensive income with respect to such associates are reclassified to profit or loss or to retained earnings in the same manner that would have been applicable if the associate had itself disposed the related assets or liabilities.
| (6) | Change in interest held in equity accounted investees while retaining significant influence
|
When the Group increases its interest in an equity accounted investee while retaining significant influence, it implements the acquisition method only with respect to the additional interest obtained whereas the previous interest remains the same.
When there is a decrease in the interest in an equity accounted investee while retaining significant influence, the Group derecognizes a proportionate part of its investment and recognizes in profit or loss a gain or loss from the sale under other income or other expenses.
Furthermore, on the same date, a proportionate part of the amounts recognized in equity through other comprehensive income with respect to the same equity accounted investee are reclassified to profit or loss or to retained earnings in the same manner that would have been applicable if the associate had itself realized the same assets or liabilities.
| (7) | Intra-group transactions
|
Intra-group balances and transactions, and any unrealized income and expenses arising from intra-group transactions, are eliminated. Unrealized gains arising from transactions with equity accounted investees are eliminated against the investment to the extent of the Group’s interest in the investee. Unrealized losses are eliminated in the same way as unrealized gains, but only to the extent that there is no evidence of impairment.
| (8) | Reorganizations under common control transactions
|
Common control transactions that involve the setup of a new group company and the combination of entities under common control are recorded using the book values of the parent company.
Note 3 – Significant Accounting Policies (Cont’d)
| | (1)a) | Foreign currency transactions
|
Transactions in foreign currencies are translated into the respective functional currencies of Group entities at exchange rates at the dates of the transactions.
Monetary assets and liabilities denominated in foreign currencies at the reporting date are translated into the functional currency at the exchange rate at that date. Non-monetary items measured at historical cost would be reported using the exchange rate at the date of the transaction.
Foreign currency differences are generally recognized in profit or loss, except for differences relating to qualifying cash flow hedges to the extent the hedge is effective which are recognized in other comprehensive income.
The assets and liabilities of foreign operations, including goodwill and fair value adjustments arising on acquisition, are translated into US dollars at exchange rates at the reporting date. The income and expenses of foreign operations are translated into US dollars at average exchange rates over the relevant period.
Foreign operation translation differences are recognized in other comprehensive income.
When the foreign operation is a non-wholly-owned subsidiary of the Group, then the relevant proportionate share of the foreign operation translation difference is allocated to the NCI.
When a foreign operation is disposed of such that control or significant influence is lost, the cumulative amount in the translation reserve related to that foreign operation is reclassified to profit or loss as a part of the gain or loss on disposal.
Furthermore, when the Group’s interest in a subsidiary that includes a foreign operation changes, while retaining control in the subsidiary, a proportionate part of the cumulative amount of the translation difference that was recognized in other comprehensive income is reattributed to NCI.
When the Group disposes of only part of its investment in an associate that includes a foreign operation, while retaining significant influence, the proportionate part of the cumulative amount of the translation difference is reclassified to profit or loss.
Generally, foreign currency differences from a monetary item receivable from or payable to a foreign operation, including foreign operations that are subsidiaries, are recognized in profit or loss in the consolidated financial statements.
Foreign exchange gains and losses arising from a monetary item receivable from or payable to a foreign operation, the settlement of which is neither planned nor likely in the foreseeable future, are considered to form part of a net investment in a foreign operation and are recognized in other comprehensive income, and are presented within equity in the translation reserve.
D. | Cash and Cash Equivalents
|
In the consolidated statement of cash flows, cash and cash equivalents includes cash on hand, deposits held at call with banks, other short-term highly liquid investments with original maturities of three months or less and are subject to an insignificant risk of changes in their fair value.
Note 3 – Significant Accounting Policies (Cont’d)
| a) | Classification and measurement of financial assets and financial liabilities |
Initial recognition and measurement The Group initially recognizes trade receivables and other investments on the date that they are originated. All other financial assets and financial liabilities are initially recognized on the date on which the Group becomes a party to the contractual provisions of the instrument. As a rule, a financial asset, other than a trade receivable without a significant financing component, or a financial liability, is initially measured at fair value with the addition, for a financial asset or a financial liability that are not presented at fair value through profit or loss, of transaction costs that can be directly attributed to the acquisition or the issuance of the financial asset or the financial liability. Trade receivables that do not contain a significant financing component are initially measured at the transaction price. Trade receivables originating in contract assets are initially measured at the carrying amount of the contract assets on the date of reclassification from contract assets to receivables. Financial assets - classification and subsequent measurement On initial recognition, financial assets are classified as measured at amortized cost; fair value through other comprehensive income (“FVOCI”); or fair value through profit or loss (“FVTPL”). Financial assets are not reclassified in subsequent periods, unless, and only to the extent that the Group changes its business model for the management of financial assets, in which case the affected financial assets are reclassified at the beginning of the reporting period following the change in the business model. A financial asset is measured at amortized cost if it meets the two following cumulative conditions and is not designated for measurement at FVTPL: | | - | The objective of the entity'sentity’s business model is to hold the financial asset to collect the contractual cash flows; and |
| | - | The contractual terms of the financial asset create entitlement on specified dates to cash flows that are solely payments of principal and interest on the principal amount outstanding. |
A debt investment is measured at FVOCI if it meets both of the following conditions and is not designated as at FVTPL: | | - | It is held within a business model whose objective is achieved by both collecting contractual cash flows and selling financial assets; and |
| | - | Its contractual terms give rise on specified dates to cash flows that are solely payments of principal and interest on the principal amount outstanding. |
The Group has balances of trade and other receivables and deposits that are held under a business model the objective of which is collection of the contractual cash flows. The contractual cash flows in respect of such financial assets comprise solely payments of principal and interest that reflects consideration for the time-value of the money and the credit risk. Accordingly, such financial assets are measured at amortized cost. Note 3 - Material Accounting Policies (Cont’d) In subsequent periods, financial assets at amortized cost are measured at amortized cost, using the effective interest method and net of impairment losses. Interest income, currency exchange gains or losses and impairment are recognized in profit or loss. Any gains or losses on derecognition are also recognized in profit or loss. Debt investments measured at FVOCI are subsequently measured at fair value. Interest income calculated using the effective interest method, foreign exchange gains and impairment are recognized in profit or loss. Other net gains and losses are recognized in OCI. On derecognition, gains and losses accumulated in OCI are reclassified to profit or loss. All financial assets not classified as measured at amortized cost or FVOCI as described above are measured at FVTPL. On initial recognition, the Group may irrevocably designate a financial asset that otherwise meets the requirements to be measured at amortized cost or at FVOCI as at FVTPL if doing so eliminates or significantly reduces an accounting mismatch that would otherwise arise. In subsequent periods, these assets are measured at fair value. Net gains and losses are recognized in profit or loss. Note 3 – Significant Accounting Policies (Cont’d)
Financial assets: Business model assessment The Group makes an assessment of the objective of the business model in which a financial asset is held at a portfolio level because this best reflects the way the business is managed and information is provided to management. The information considered includes: | | the stated policies and objectives for the portfolio and the operation of those policies in practice. These include whether management’s strategy focuses on earning contractual interest income, maintaining a particular interest rate profile, matching the duration of the financial assets to the duration of any related liabilities or expected cash outflows or realising cash flows through the sale of the assets; |
| | how the performance of the portfolio is evaluated and reported to the Group’s management; |
| | the risks that affect the performance of the business model (and the financial assets held within that business model) and how those risks are managed; |
| | how managers of the business are compensated –- e.g. whether compensation is based on the fair value of the assets managed or the contractual cash flows collected; and |
| | the frequency, volume and timing of sales of financial assets in prior periods, the reasons for such sales and expectations about future sales activity. |
Non-derivative financial assets: Assessment whether contractual cash flows are solely payments of principal and interest For the purposes of this assessment, ‘principal’ is defined as the fair value of the financial asset on initial recognition. ‘Interest’ is defined as consideration for the time value of money and for the credit risk associated with the principal amount outstanding during a particular period of time and for other basic lending risks and costs (e.g. liquidity risk and administrative costs), as well as a profit margin. In assessing whether the contractual cash flows are solely payments of principal and interest, the Group considers the contractual terms of the instrument. This includes assessing whether the financial asset contains a contractual term that could change the timing or amount of contractual cash flows such that it would not meet this condition. In making this assessment, the Group considers: | | contingent events that would change the amount or timing of cash flows; |
| | terms that may adjust the contractual coupon rate, including variable rate features; |
| | prepayment and extension features; and |
| | terms that limit the Group’s claim to cash flows from specified assets (e.g. non-recourse features). |
A prepayment feature is consistent with the solely payments of principal and interest criterion if the prepayment amount substantially represents unpaid amounts of principal and interest on the principal amount outstanding, which may include reasonable additional compensation for early termination of the contract. Additionally, for a financial asset acquired at a significant discount or premium to its contractual par amount, a feature that permits or requires prepayment at an amount that substantially represents the contractual par amount plus accrued (but unpaid) contractual interest (which may also include reasonable additional compensation for early termination) is treated as consistent with this criterion if the fair value of the prepayment feature is insignificant at initial recognition. Note 3 - Material Accounting Policies (Cont’d) Derecognition of financial assets The Group derecognizes a financial asset when the contractual rights to the cash flows from the financial asset expire, or it transfers the rights to receive the contractual cash flows in a transaction in which substantially all of the risks and rewards of ownership of the financial asset are transferred or in which the Group neither transfers nor retains substantially all of the risks and rewards of ownership and it does not retain control of the financial asset. If the Group enters into transactions whereby it transfers assets recognized in its statement of financial position, but retains either all or substantially all of the risks and rewards of the transferred assets, the transferred assets are not derecognized. Financial liabilities –- Initial classification, subsequent measurement and gains and losses Financial liabilities are classified as measured at amortized cost or at FVTPL. Financial liabilities are classified as measured at FVTPL if it is held for trading or it is designated as such on initial recognition, and are measured at fair value, and any net gains and losses, including any interest expenses, are recognized in profit or loss. Other financial liabilities are initially measured at fair value less directly attributable transaction costs. They are measured at amortized cost in subsequent periods, using the effective interest method. Interest expenses and currency exchange gains and losses are recognized in profit or loss. Any gains or losses on derecognition are also recognized in profit or loss. Note 3 – Significant Accounting Policies (Cont’d)
Derecognition of financial liabilities Financial liabilities are derecognized when the contractual obligation of the Group expires or when it is discharged or canceled. Additionally, a significant amendment of the terms of an existing financial liability, or an exchange of debt instruments having substantially different terms, between an existing borrower and lender, are accounted for as an extinguishment of the original financial liability and the recognition of a new financial liability at fair value. The difference between the carrying amount of the extinguished financial liability and the consideration paid (including any other non-cash assets transferred or liabilities assumed), is recognized in profit or loss. Interest rate benchmark reformOffset
When the basis for determining the contractual cash flows of a financial asset or financial liability measured at amortized cost changes as a result of interest rate benchmark reform, the Group updates the effective interest rate of the financial asset or financial liability to reflect the change that is required by the reform. No immediate gain or loss is recognized. A change in the basis for determining the contractual cash flows is required by interest rate benchmark reform if the following conditions are met:
| -
| the change is necessary as a direct consequence of the reform; and
|
| - | the new basis for determining the contractual cash flows is economically equivalent to the previous basis – i.e. the basis immediately before the change.
|
When changes were made to a financial asset or financial liability in addition to changes to the basis for determining the contractual cash flows required by interest rate benchmark reform, the Group first updates the effective interest rate of the financial asset or financial liability to reflect the change that is required by interest rate benchmark reform. After that, the Group applies the policies on accounting for modifications to the additional changes.
Offset
Financial assets and financial liabilities are offset and the net amount presented in the consolidated statement of financial position when, and only when, the Group currently has a legally enforceable right to offset the amounts and intends either to settle them on a net basis or to realize the asset and settle the liability simultaneously. Financial assets, contract assets and receivables on a lease The Group creates a provision for expected credit losses in respect of: - | -
| Contract assets (as defined in IFRS 15); |
- | -
| Financial assets measured at amortized cost; |
Simplified approach The Group applies the simplified approach to provide for expected credit losses (“ECLs”) for all trade receivables (including lease receivables) and contract assets. The simplified approach requires the loss allowance to be measured at an amount equal to lifetime ECLs. General approach The Group applies the general approach to provide for ECLs on all other financial instruments and financial guarantees. Under the general approach, the loss allowance is measured at an amount equal to the 12-month ECLs at initial recognition. At each reporting date, the Group assess whether the credit risk of a financial instrument has increased significantly since initial recognition. When credit risk has increased significantly since initial recognition, loss allowance is measured at an amount equal to lifetime ECLs. Note 3 – Significant- Material Accounting Policies (Cont’d) In assessing whether the credit risk of a financial asset has significantly increased since initial recognition and in assessing expected credit losses, the Group takes into consideration information that is reasonable and verifiable, relevant and attainable at no excessive cost or effort. Such information comprises quantitative and qualitative information, as well as an analysis, based on the past experience of the Group and the reported credit assessment, and contains forward-looking information. If credit risk has not increased significantly since initial recognition or if the credit quality of the financial instruments improves such that there is no longer a significant increase in credit risk since initial recognition, loss allowance is measured at an amount equal to 12-month ECLs. The Group assumes that the credit risk of a financial asset has increased significantly since initial recognition whenever contractual payments are more than 30 days in arrears. The Group considers a financial asset to be in default if: | - | It is not probable that the borrower will fully meet its payment obligations to the Company, and the Company has no right to perform actions such as the realization of collaterals (if any); or |
| - | - | The contractual payments in respect of the financial asset are more than 90 days in arrears. |
The Group considers a contract asset to be in default when the customer is unlikely to pay its contractual obligations to the Group in full, without recourse by the Group to actions such as realizing security. The Group considers a debt instrument as having a low credit risk if its credit risk coincides with the global structured definition of “investment rating”. The ECLs expected over the life of the instrument are ECLs arising from all potential default events throughout the life of the financial instrument. ECLs in a 12-month period are the portion of the ECLs arising from potential default events during the period of 12 months from the reporting date. The maximum period that is taken into account in assessing the ECLs is the maximum contractual period over which the Group is exposed to credit risk. Measurement of ECLs ECLs represent a probability-weighted estimate of credit losses. Credit losses are measured at the present value of the difference between the cash flows to which the Group is entitled under the contract and the cash flows that the Group expects to receive. Expected credit losses are discounted at the effective interest rate of the financial asset. The Group’s credit risk exposure for trade receivables and contract asset are set out in Note 2928 Financial Instruments. Financial assets impaired by credit risk At each reporting date, the Group assesses whether financial assets that are measured at amortized cost and debt instruments that are measured at FVOCI have become impaired by credit risk. A financial asset is impaired by credit risk upon the occurrence of one or more of the events (i.e. significant financial difficulty of the debtor) that adversely affect the future cash flows estimated for such financial asset. Presentation of impairment and allowance for ECLs in the statement of financial position A provision for ECLs in respect of a financial asset that is measured at amortized cost is presented as a reduction of the gross carrying amount of the financial asset. Note 3 – Significant- Material Accounting Policies (Cont’d) For debt investments at FVOCI, loss allowances are charged to profit or loss and recognized in OCI. Loss allowances are presented under financing expenses. Impairment losses in respect of trade and other receivables, including contract assets and lease receivables, are presented separately in the statements of profit or loss and other comprehensive income. Impairment losses in respect of other financial assets are presented under financing expenses. Derivative financial instruments, including hedge accounting The Group holds derivative financial instruments. Derivatives are recognized initially at fair value. Subsequent to initial recognition, derivatives are measured at fair value, and changes therein are generally recognized in profit or loss. The Group designates certain derivative financial instruments as hedging instruments in qualifying hedging relationships. At inception of designated hedging relationships, the Group documents the risk management objective and strategy for undertaking the hedge. The Group also documents the economic relationship between the hedged item and the hedging instrument, including whether the changes in cash flows of the hedged item and hedging instrument are expected to offset each other. Hedge accounting As of December 31, 20222023 and 2021,2022, hedge relationships designated for hedge accounting under IAS 39 qualify for hedge accounting under IFRS 9, and are therefore deemed as continuing hedge relationships. Hedges directly affected by interest rate benchmark reform Phase 1 amendments: Prior to interest rate benchmark reform –- when there is uncertainty arising from Interest rate benchmark reform For the purpose of evaluating whether there is an economic relationship between the hedged item(s) and the hedging instrument(s), the Group assumes that the benchmark interest rate is not altered as a result of interest rate benchmark reform. For a cash flow hedge of a forecast transaction, the Group assumes that the benchmark interest rate will not be altered as a result of interest rate benchmark reform for the purpose of assessing whether the forecast transaction is highly probable and presents an exposure to variations in cash flows that could ultimately affect profit or loss. In determining whether a previously designated forecast transaction in a discontinued cash flow hedge is still expected to occur, the Group assumes that the interest rate benchmark cash flows designated as a hedge will not be altered as a result of interest rate benchmark reform. The Group will cease to apply the specific policy for assessing the economic relationship between the hedged item and the hedging instrument (i) to a hedged item or hedging instrument when the uncertainty arising from interest rate benchmark reform is no longer present with respect to the timing and the amount of the contractual cash flows of the respective item or instrument or (ii) when the hedging relationship is discontinued. For its highly probable assessment of the hedged item, the Group will no longer apply the specific policy when the uncertainty arising from interest rate benchmark reform about the timing and the amount of the interest rate benchmark-based future cash flows of the hedged item is no longer present, or when the hedging relationship is discontinued. Note 3 – Significant- Material Accounting Policies (Cont’d) Phase 2 amendments: Replacement of benchmark interest rates –- when there is no longer uncertainty arising from interest rate benchmark reform When the basis for determining the contractual cash flows of the hedged item or the hedging instrument changes as a result of interest rate benchmark reform and therefore there is no longer uncertainty arising about the cash flows of the hedged item or the hedging instrument, the Group amends the hedge documentation of that hedging relationship to reflect the change(s) required by interest rate benchmark reform. A change in the basis for determining the contractual cash flows is required by interest rate benchmark reform if the following conditions are met: | | - | the change is necessary as a direct consequence of the reform; and |
| | - | the new basis for determining the contractual cash flows is economically equivalent to the previous basis –- i.e. the basis immediately before the change. |
For this purpose, the hedge designation is amended only to make one or more of the following changes: | | - | designating an alternative benchmark rate as the hedged risk; |
| | - | updating the description of hedged item, including the description of the designated portion of the cash flows or fair value being hedged; or |
| | - | updating the description of the hedging instrument. |
The Group amends the description of the hedging instrument only if the following conditions are met: | | - | it makes a change required by interest rate benchmark reform by using an approach other than changing the basis for determining the contractual cash flows of the hedging instrument; |
| | - | it chosen approach is economically equivalent to changing the basis for determining the contractual cash flows of the original hedging instrument; and |
| | - | the original hedging instrument is not derecognized |
The Group also amends the formal hedge documentation by the end of the reporting period during which a change required by interest rate benchmark reform is made to the hedged risk, hedged item or hedging instrument. These amendments in the formal hedge documentation do not constitute the discontinuation of the hedging relationship or the designation of a new hedging relationship. If changes are made in addition to those changes required by interest rate benchmark reform described above, then the Group first considers whether those additional changes result in the discontinuation of the hedge accounting relationship. If the additional changes do not result in discontinuation of the hedge accounting relationship, then the Group amends the formal hedge documentation for changes required by interest rate benchmark reform as mentioned above. When the interest rate benchmark on which the hedged future cash flows had been based is changed as required by interest rate benchmark reform, for the purpose of determining whether the hedged future cash flows are expected to occur, the Group deems that the hedging reserve recognized in OCI for that hedging relationship is based on the alternative benchmark rate on which the hedged future cash flows will be based. Cash flow hedges The Group designates certain derivatives as hedging instruments to hedge the variability in cash flows associated with highly probable forecast transactions arising from changes in foreign exchange rates and interest rates. When a derivative is designated as a cash flow hedging instrument, the effective portion of changes in the fair value of the derivative is recognized in OCI and accumulated in the hedging reserve. The effective portion of changes in the fair value of the derivative that is recognized in OCI is limited to the cumulative change in fair value of the hedged item, determined on a present value basis, from inception of the hedge. Any ineffective portion of changes in the fair value of the derivative is recognized immediately in profit or loss. Note 3 – Significant Accounting Policies (Cont’d)
The Group designates only the change in fair value of the spot element of forward exchange contracts as the hedging instrument in cash flow hedging relationships. The change in fair value of the forward element of forward exchange contracts (‘forward points’) is separately accounted for as a cost of hedging and recognized in a cost of hedging reserve within equity. When the hedged forecast transaction subsequently results in the recognition of a non-financial item such as inventory, the amount accumulated in the hedging reserve and the cost of hedging reserve is included directly in the initial cost of the non-financial item when it is recognized. Note 3 - Material Accounting Policies (Cont’d) For all other hedged forecast transactions, the amount accumulated in the hedging reserve and the cost of hedging reserve is reclassified to profit or loss in the same period or periods during which the hedged expected future cash flows affect profit or loss. If the hedge no longer meets the criteria for hedge accounting or the hedging instrument is sold, expires, is terminated or is exercised, then hedge accounting is discontinued prospectively. When hedge accounting for cash flow hedges is discontinued, the amount that has been accumulated in the hedging reserve and the cost of hedging reserve remains in equity until, for a hedge of a transaction resulting in recognition of a non-financial item, it is included in the non-financial item’s cost on its initial recognition or, for other cash flow hedges, it is reclassified to profit or loss in the same period or periods as the hedged expected future cash flows affect profit or loss. If the hedged future cash flows are no longer expected to occur, then the amounts that have been accumulated in the hedging reserve and the cost of hedging reserve are immediately reclassified to profit or loss. Financial guarantees The Group irrevocably elects on a contract by contract basis, whether to account for a financial guarantee in accordance with IFRS 9. The Group considers a financial guarantee to be in default when the debtor of the loan is unlikely to pay its credit obligations to the creditor. When the Group elects to account for financial guarantees in accordance with IFRS 9, they are initially measured at fair value. Subsequently, they are measured at the higher of the loss allowance determined in accordance with IFRS 9 and the amount initially recognized less, when appropriate, the cumulative amount of income recognized in accordance with the principles of IFRS 15. | F.D. | Property, plant and equipment, net |
| | (1) | Recognition and measurement |
Items of property, plant and equipment comprise mainly power station structures, power distribution facilities and related offices. These items are measured at historical cost less accumulated depreciation and accumulated impairment losses. Historical cost includes expenditure that is directly attributable to the acquisition of the items. • | • | The cost of materials and direct labor; |
• | • | Any other costs directly attributable to bringing the assets to a working condition for their intended use; |
• | • | Spare parts, servicing equipment and stand-by equipment; |
• | • | When the Group has an obligation to remove the assets or restore the site, an estimate of the costs of dismantling and removing the items and restoring the site on which they are located; and |
• | • | Capitalized borrowing costs. |
If significant parts of an item of property, plant and equipment items have different useful lives, then they are accounted for as separate items (major components) of property, plant and equipment. Any gain or loss on disposal of an item of property, plant and equipment is recognized in profit or loss in the year the asset is derecognized. Subsequent expenditure is capitalized only if it is probable that the future economic benefits associated with the expenditure will flow to the Group, and its cost can be measured reliably. Note 3 – Significant- Material Accounting Policies (Cont’d) Depreciation is calculated to reduce the cost of items of property, plant and equipment less their estimated residual values using the straight-line method over their estimated useful lives, and is generally recognized in profit or loss. Leasehold improvements are depreciated over the shorter of the lease term and their useful lives unless it is reasonably certain that the Group will obtain ownership by the end of the lease term. Freehold land is not depreciated. Diesel oil and spare parts are expensed off when they are used or consumed. Depreciation methods, useful lives and residual values are reviewed by management of the Group at each reporting date and adjusted if appropriate. The following useful lives shown on an average basis are applied across the Group: | | | Years | | Roads, buildings and leasehold improvementsland (*) | | 323 – 30
| | Facilities, machinery and equipmentPower plants
| | 523 – 3040
| | Wind turbinesMaintenance work
| | 351.5 – 15 years
| | ComputersBack up diesel fuel
| 3
| Office furniture and equipmentby consumption
| 3 – 16
| Others
| 5 – 15
|
* The shorter of the lease term and useful lifeFreehold land is not depreciated. | G.E.
| Intangible assets, net |
| | (1) | Recognition and measurement |
| | Goodwill | Goodwill arising on the acquisition of subsidiaries is measured at cost less accumulated impairment losses. In respect of equity accounted investees, the carrying amount of goodwill is included in the carrying amount of the investment; and any impairment loss is allocated to the carrying amount of the equity investee as a whole. | | | | Other intangible assets | Other intangible assets, including licenses, patents and trademarks, which are acquired by the Group having finite useful lives are measured at cost less accumulated amortization and any accumulated impairment losses. |
Amortization is calculated to charge to expense the cost of intangible assets less their estimated residual values using the straight-line method over their useful lives, and is generally recognized in profit or loss. Goodwill is not amortized. The estimated useful lives for current and comparative year are as follows: | | • | Power purchase agreement | 10 years |
Amortization methods and useful lives are reviewed by management of the Group at each reporting date and adjusted if appropriate. | | (3) | Subsequent expenditure |
Subsequent expenditure is capitalized only when it increases the future economic benefits embodied in the specific asset to which it relates. All other expenditure, including expenditure on internally generated goodwill is expensed as incurred. Note 3 - Material Accounting Policies (Cont’d) Definition of a lease The Group assesses whether a contract is or contains a lease by assessing if the contract conveys a right to control the use of an identified asset for a period of time in exchange for consideration. Note 3 – Significant Accounting Policies (Cont’d)
At inception or on reassessment of a contract that contains a lease component, the Group allocates the consideration in the contract to each lease and non-lease component on the basis of their relative stand-alone prices. For lease contracts that include components that are not lease components, such as services or maintenance which relate to the lease component, the Group elected to treat the lease component separately. As a lessee The Group recognizes right-of-use assets and lease liabilities for most leases –- i.e. these leases are on-balance sheet. However, the Group has elected not to recognize right-of-use assets and lease liabilities for some leases of low-value assets. The Group recognizes the lease payments associated with these leases as an expense on a straight-line basis over the lease term. The Group recognizes a right-of-use asset and a lease liability at the lease commencement date. The right-of-use asset is initially measured at cost, and subsequently at cost less any accumulated depreciation and impairment losses, and adjusted for certain remeasurements of the lease liability. The lease liability is initially measured at the present value of the lease payments that are not paid at the commencement date, discounted using the interest rate implicit in the lease or, if that rate cannot be readily determined, the Group’s incremental borrowing rate. The lease liability is subsequently increased by the interest cost on the lease liability and decreased by lease payments made. It is remeasured when there is a change in future lease payments arising from a change in an index or rate, a change in the estimate of the amount expected to be payable under a residual value guarantee, or as appropriate, changes in the assessment of whether a purchase or extension option is reasonably certain to be exercised or a termination option is reasonably certain not to be exercised. The Group has applied judgement to determine the lease term for some lease contracts in which it is a lessee that include renewal options. The assessment of whether the Group is reasonably certain to exercise such options impacts the lease term, which affects the amount of lease liabilities and right-of-use assets recognized. Depreciation of right-of-use asset Subsequent to the commencement date of the lease, a right-of-use asset is measured using the cost method, less accumulated depreciation and accrued losses from decline in value and is adjusted in respect of re‑measurements of the liability in respect of the lease. The depreciation is calculated on the “straight‑line” basis over the useful life or the contractual lease period –- whichever is shorter. | | | Years | | Land | | 19 – 49 | | Pressure regulation and management system facilityOthers
| 24
| Offices12 - 16
| 3 – 9
|
I.G. | Borrowing costsImpairment of non-financial assets
|
Specific and non-specific borrowing costs are capitalized to qualifying assets throughout the period required for completion and construction until they are ready for their intended use. Non-specific borrowing costs are capitalized in the same manner to the same investment in qualifying assets, or portion thereof, which was not financed with specific credit by means of a rate which is the weighted-average cost of the credit sources which were not specifically capitalized. Foreign currency differences from credit in foreign currency are capitalized if they are considered an adjustment of interest costs. Other borrowing costs are expensed as incurred. Income earned on the temporary investment of specific credit received for investing in a qualifying asset is deducted from the borrowing costs eligible for capitalization.
J. | Impairment of non-financial assets
|
At each reporting date, management of the Group reviews the carrying amounts of its non-financial assets (other than inventories and deferred tax assets) to determine whether there is any indication of impairment. If any such indication exists, then the asset’s recoverable amount is estimated. Goodwill is tested annually for impairment, and whenever impairment indicators exist. For impairment testing, assets are grouped together into smallest group of assets that generates cash inflows from continuing use that are largely independent of the cash inflows of other assets or CGU. Goodwill arising from a business combination is allocated to CGUs or group of CGUs that are expected to benefit from these synergies of the combination. Note 3 – Significant- Material Accounting Policies (Cont’d) The recoverable amount of an asset or CGU is the greater of its value in use and its fair value less costs to sell. Value in use is based on the estimated future cash flows, discounted to their present value using a pre-tax discount rate that reflects current market assessments of the time value of money and the risks specific to the asset or CGU. An impairment loss is recognized if the carrying amount of an asset or CGU exceeds its recoverable amount. Impairment losses are recognized in profit or loss. They are allocated first to reduce the carrying amount of any goodwill allocated to the CGU, and then to reduce the carrying amounts of the other assets in the CGU on a pro rata basis. An impairment loss in respect of goodwill is not reversed. For other assets, an assessment is performed at each reporting date for any indications that these losses have decreased or no longer exist. An impairment loss is reversed if there has been a change in the estimates used to determine the recoverable amount and is reversed only to the extent that the asset’s carrying amount does not exceed the carrying amount that would have been determined, net of depreciation or amortization, if no impairment loss had been recognized. | (1) | Short-term employee benefitsRevenue recognition
|
Short-term employee benefits are expensed as the related service is provided. A liability is recognized for the amount expected to be paid if the Group has a present legal or constructive obligation to pay this amount as a result of past service provided by the employee, and the obligation can be estimated reliably. The employee benefits are classified, for measurement purposes, as short-term benefits or as other long-term benefits depending on when the Group expects the benefits to be wholly settled.
| (2) | Bonus plans transactions
|
The Group’s senior executives receive remuneration in the form of share-appreciations rights, which can only be settled in cash (cash-settled transactions). The cost of cash-settled transactions is measured initially at the grant date and is recognized as an expense with a corresponding increase in liabilities over the period that the employees become unconditionally entitled to payment. With respect to grants made to senior executives of OPC, this benefit is calculated by determining the present value of the settlement (execution) price set forth in the plan. The liability is re-measured at each reporting date and at the settlement date based on the formulas described above. Any changes in the liability are recognized as operating expenses in profit or loss.
Severance pay is charged to income statement when there is a clear obligation to pay termination of employees before they reach the customary age of retirement according to a formal, detailed plan, without any reasonable chance of cancellation. The benefits given to employees upon voluntary retirement are charged when the Group proposes a plan to the employees encouraging voluntary retirement, it is expected that the proposal will be accepted and the number of employee acceptances can be estimated reliably.
The calculation of defined benefit obligation is performed at the end of each reporting period by a qualified actuary using the projected unit credit method. Remeasurements of the defined benefit liability, which comprise actuarial gains and losses and the effect of the asset ceiling (if any, excluding interest), are recognized immediately in OCI. Interest expense and other expenses related to defined benefit plan are recognized in profit or loss.
When the benefits of a plan are changed or when a plan is curtailed, the resulting change in benefit that relates to past service or the gain or loss on curtailment is recognized immediately in profit or loss. The Group recognizes gains and losses on the settlement of a defined benefit plan when the settlement occurs.
Note 3 – Significant Accounting Policies (Cont’d)
| (5) | Share-based compensation plans
|
Qualifying employees are awarded grants of the Group’s shares under the Group’s 2014 Share Incentive Plan (“Share Incentive Plan”). The fair value of the grants are recognized as an employee compensation expense, with a corresponding increase in equity over the service period – the period that the employee must remain employed to receive the benefit of the award. At each balance sheet date, the Group revises its estimates of the number of grants that are expected to vest. It recognizes the impact of the revision of original estimates in employee expenses and in a corresponding adjustment to equity over the remaining vesting period.
Provisions are recognized when the Group has a present legal or constructive obligation as a result of past events, it is probable that an outflow of resources embodying economic benefits will be required to settle the obligation and a reliable estimate can be made of the amount of the obligation.
Provisions are determined by discounting the expected future cash flows at a pre-tax rate that reflects current market assessments of the time value of money and the risks specific to the liability. The unwinding of the discount is recognized as finance cost.
The Group recognizes revenue when the customer obtains control over the promised goods or services. The revenue is measured according to the amount of the consideration to which the Group expects to be entitled in exchange for the goods or services promised to the customer. Revenues from the sale of electricity and steam are recognized in the period in which the sale takes place in accordance with the price set in the electricity sale agreements and the quantities of electricity supplied. Furthermore, the Group’s revenues include revenues from the provision of asset management services to power plants and recognized in accordance to the service provision rate. When setting the transaction price, the Group takes into consideration fixed amounts and amounts that may vary as a result of discounts, credits, price concessions, penalties, claims and disputes and contract modifications that the consideration in their respect has not yet been agreed by the parties. The Group includes variable consideration, or part of it, in the transaction price only when it is highly probable that its inclusion will not result in a significant revenue reversal in the future when the uncertainty has been subsequently resolved. At the end of each reporting period and if necessary, the Group revises the amount of the variable consideration included in the transaction price. The Group recognizes compensation paid to customers in respect of delays in the commercial operation date of the power plant on payment date within long-term prepaid expenses, and amortizes them throughout the term of the contract, from the date of commercial operation of the power plant, against a decrease in revenue from contracts with customers. Key agent or a principal When another party is involved in providing goods or services to a customer, the Group shall determine whether the nature of its promise is a performance obligation to provide the specified or services itself (i.e., the Group is a principal) or to arrange for those services to be provided by the other party (i.e., the Group is an agent), and therefore recognizes the revenue as the net fee amount. The Group is a principal if it controls the specified service before that service is transferred to a customer. Indicators that the Group controls the specified service before it is transferred to the customer include the following: The Group is primarily responsible for fulfilling the promise to provide the specified service; the entity bears a risk before the specified service has been transferred to a customer; and the Group has discretion in establishing the price for the specified service. Note 3 – Significant- Material Accounting Policies (Cont’d) N.I. | Government grantsIncome taxes
|
Government grants related to distribution projects are not recognized until there is reasonable assurance that the Group will comply with the conditions attaching to them and that the grants will be received. Government grants are recorded at the value of the grant received and any difference between this value and the actual construction cost is recognized in profit or loss of the year in which the asset is released.
Government grants related to distribution assets are deducted from the related assets. They are recognized in statement of income on a systematic basic over the useful life of the related asset reducing the depreciation expense.
O. | Deposits received from consumers
|
Deposits received from consumers, plus interest accrued and less any outstanding debt for past services, are refundable to the users when they cease using the electric energy service rendered by the Group. The Group has classified these deposits as current liabilities since the Group does not have legal rights to defer these payments in a period that exceed a year. However, the Group does not anticipate making significant payments in the next year.
P. | Financing income and expenses
|
Financing income includes income from interest on amounts invested and gains from exchange rate differences. Interest income is recognized as accrued, using the effective interest method.
Financing expenses include interest on loans received, commitment fees on borrowings, and changes in the fair value of derivatives financial instruments presented at fair value through profit or loss, and exchange rate losses. Borrowing costs, which are not capitalized, are recorded in the income statement using the effective interest method.
In the statements of cash flows, interest received is presented as part of cash flows from investing activities. Dividends received are presented as part of cash flows from operating activities. Interest paid and dividends paid are presented as part of cash flows from financing activities. Accordingly, financing costs that were capitalized to qualifying assets are presented together with interest paid as part of cash flows from financing activities. Gains and losses from exchange rate differences and gains and losses from derivative financial instruments are reported on a net basis as financing income or expenses, based on the fluctuations on the rate of exchange and their position (net gain or loss).
The Group’s finance income and finance costs include:
| • | The net gain or loss on the disposal of held-for-sale financial assets;
|
| • | The net gain or loss on financial assets at fair value through profit or loss;
|
| • | The foreign currency gain or loss on financial assets and financial liabilities;
|
| • | The fair value loss on contingent consideration classified as financial liability;
|
| • | Impairment losses recognized on financial assets (other than trade receivables);
|
| • | The net gain or loss on hedging instruments that are recognized in profit or loss; and
|
| • | The reclassification of net gains previously recognized in OCI.
|
Interest income or expense is recognized using the effective interest method.
Note 3 – Significant Accounting Policies (Cont’d)
Income tax expense comprises current and deferred tax. It is recognized in profit or loss except to the extent that it relates to a business combination, or items recognized directly in equity or in OCI. (i) Current tax Current tax comprises the expected tax payable or receivable on the taxable income or loss for the year and any adjustment to tax payable or receivable in respect of previous years. It is measured using tax rates enacted or substantively enacted at the reporting date. Current tax also includes any tax liability arising from dividends. Current tax assets and liabilities are offset only if certain criteria are met. (ii) Deferred tax Deferred tax is recognized in respect of temporary differences between the carrying amounts of assets and liabilities for financial reporting purposes and the amounts used for taxation purposes. Deferred tax is not recognized for: | | • | Temporary differences on the initial recognition of assets or liabilities in a transaction that is not a business combination and that affects neither accounting nor taxable profit or loss; |
| | • | Temporary differences related to investments in subsidiaries and associates where the Group is able to control the timing of the reversal of the temporary differences and it is not probable that they will reverse it in the foreseeable future; and |
| | • | Taxable temporary differences arising on the initial recognition of goodwill. |
Deferred tax assets are recognized for unused tax losses, unused tax credits and deductible temporary differences to the extent that it is probable that future taxable profits will be available against which they can be used. Deferred tax assets are reviewed at each reporting date and are reduced to the extent that it is no longer probable that the related tax benefit will be realized; such reductions are reversed when the probability of future taxable profit improves. Unrecognized deferred tax assets are reassessed at each reporting date and recognized to the extent that it has become probable that future taxable profits will be available against which they can be used. Deferred tax is measured at the tax rates that are expected to be applied to temporary differences when they reverse, using tax rates enacted or substantively enacted at the reporting date. Deferred tax assets and liabilities are offset if there is a legally enforceable right to offset current tax liabilities and assets, and they relate to taxes levied by the same tax authority on the same taxable entity, or on different tax entities, but they intend to settle current tax liabilities and assets on a net basis or their tax assets and liabilities will be realized simultaneously. Management of the Group regularly reviews its deferred tax assets for recoverability, taking into consideration all available evidence, both positive and negative, including historical pre-tax and taxable income, projected future pre-tax and taxable income and the expected timing of the reversals of existing temporary differences. In arriving at these judgments, the weight given to the potential effect of all positive and negative evidence is commensurate with the extent to which it can be objectively verified. Management believes the Group’s tax positions are in compliance with applicable tax laws and regulations. Tax benefits are recognized only for tax positions that are more likely than not to be sustained upon examination by tax authorities. The Group believes that its liabilities for unrecognized tax benefits, including related interest, are adequate in relation to the potential for additional tax assessments. There is a risk, however, that the amounts ultimately paid upon resolution of audits could be materially different from the amounts previously included in our income tax expense and, therefore, could have a material impact on our tax provision, net income and cash flows. (iii) Uncertain tax positions A provision for uncertain tax positions, including additional tax and interest expenses, is recognized when it is more probable than not that the Group will have to use its economic resources to pay the obligation. Note 3 – Significant- Material Accounting Policies (Cont’d) R.J. | Earnings per shareAgreements with the tax equity partner
|
TheGovernment grants related to distribution projects are not recognized until there is reasonable assurance that the Group presents basicwill comply with the conditions attaching to them and diluted earnings per share data for its ordinary share capital. The basic earnings per share are calculated by dividing income or loss allocable tothat the Group’s ordinary equity holders by the weighted-average number of ordinary shares outstanding during the period. The diluted earnings per share are determined by adjusting the income or loss allocable to ordinary equity holders and the weighted-average number of ordinary shares outstanding for the effect of all potentially dilutive ordinary shares including options for shares granted to employees.grants will be received.
S. | Share capital – ordinary shares
|
Incremental costs directly attributableCPV Group entered into an agreement with an entity that has a federal tax liability in the USA (hereinafter - the “Tax Equity Partner”) for the purpose of financing the construction and operation of a photovoltaic project in the USA within a partnership owned and controlled by the Group (hereinafter - the “Project”). The project’s tax benefits include an Investment Tax Credit (“ITC”), and a proportionate share in the taxable income of the partnership (hereinafter - the “Tax Benefits”).
Future amounts that will be paid to the issueTax Equity Partner out of ordinary shares, netthe free cash flow for distribution constitute a financial liability, which is measured using an amortized cost model in accordance with the effective interest method. The tax credit is accounted for as a government grant, which is related to the acquisition of anyassets in accordance with the provisions of IAS 20. The Group opted to present the tax effects,credit as a deferred income, under the other long-term liabilities line item, which will be amortized on a straight line basis over the useful life of the photovoltaic facilities. The amounts attributed to the Tax Equity Partner’s right to receive a proportionate share of the taxable income of the partnership are recognized as a deduction from equity.non-financial liability, which is carried to profit and loss over a period of 5 years. Refer to Note 8, Note 16 and Note 18.4.d further information. T. | Discontinued operations
|
A discontinued operation is a component of the Group´s business, the operations and cash flows of which can be clearly distinguished from the rest of the Group and which:
| • | Represents a separate major line of business or geographic area of operations,
|
| • | Is part of a single coordinated plan to dispose of a separate major line of business or geographic area of operations; or
|
| • | Is a subsidiary acquired exclusively with a view to re-sell.
|
Classification as a discontinued operation occurs at the earlier of disposal or when the operation meets the criteria to be classified as held-for-sale. When an operation is classified as a discontinued operation, the comparative statement of profit or loss and other comprehensive income is re-presented as if the operation had been discontinued from the start of the comparative year.
The changes in each cash flow based on operating, investing and financing activities are reported in Note 26 Discontinued Operations.
U.K. | Operating segment and geographic information |
The Company'sCompany’s CEO and CFO are considered to be the Group'sGroup’s chief operating decision maker ("CODM"(“CODM”). As atof December 31, 2022,2023, based on the internal financial information provided to the CODM, the Group has determined that it has three reportable segments, which are OPC Power Plants, CPV Group, and ZIM. These segments are based on the different services offered in different geographical locations and also based on how they are managed. The following summary describes the Group’s reportable segments: | 1. | OPC Power Plants – OPC Power Plants Ltd. (“OPC Power Plants”) (formerly OPC Israel Energy Ltd.) is a wholly owned subsidiary of OPC Energy Ltd. (“OPC”), which generates and supply electricity and energy in Israel. |
| 2. | CPV Group – CPV Group LP (“CPV Group”) is a limited partnership owned by OPC, which generates and supply electricity and energy in the United States. |
| 3. | ZIM – ZIM Integrated Shipping Services, Ltd., an associated company, is an Israeli global container shipping company. |
In addition to the segments detailed above, the Group has other activities, such as investment holding categorized as Others. Apart from ZIM, the CODM evaluates the operating segments performance based on Adjusted EBITDA. Adjusted EBITDA is defined as the net income (loss) excluding depreciation and amortization, financing income, financing expenses, income taxes and other items. The CODM evaluates segment assets based on total assets and segment liabilities based on total liabilities. The CODM evaluates the operating segment performance of ZIM based on share of results and dividends received. The accounting policies used in the determination of the segment amounts are the same as those used in the preparation of the Group'sGroup’s consolidated financial statements, Inter-segment pricing is determined based on transaction prices occurring in the ordinary course of business. Note 3 – Significant Accounting Policies (Cont’d)
In determining the information to be presented on a geographical basis, revenue is based on the geographic location of the customer and non-current assets are based on the geographic location of the assets. Note 3 - Material Accounting Policies (Cont’d) V.L. | Transactions with controlling shareholders
|
Assets, liabilities and benefits with respect to which a transaction is executed with the controlling shareholders are measured at fair value on the transaction date. The Group records the difference between the fair value and the consideration in equity.
W. | New standards and interpretations not yet adopted |
A number of new standards andand-- amendments to standards and interpretations are effective for annual periods beginning after January 1, 20222023 and have not been applied in preparing these consolidated financial statements. The following amended standards and interpretations are not expected to have a significant impact on the Group’s consolidated financial statements: | | -a) | Classification of Liabilities as Current or Non-current (Amendments to IAS 1), |
| | -b) | Deferred Tax related to Assets and Liabilities arising from a Single TransactionSupplier Finance Arrangements (Amendments to IAS 12)7 and IFRS 7)
|
| | -c) | Disclosure of Accounting PoliciesLease Liability in a Sale and Leaseback (Amendments to IAS 1 and IFRS Practice Statement 2)16)
|
| | -d) | DefinitionLack of Accounting EstimateExchangeability (Amendments to IAS 8)21)
|
Note 4 – Determination of Fair Value | A. | Derivatives and Long-term investment (Qoros) |
See Note 2928 Financial Instruments. | B. | Non-derivative financial liabilities |
Non-derivative financial liabilities are measured at their respective fair values, at initial recognition and for disclosure purposes, at each reporting date. Fair value for disclosure purposes, is determined based on the quoted trading price in the market for traded debentures, whereas for non-traded loans, debentures and other financial liabilities is determined by discounting the future cash flows in respect of the principal and interest component using the market interest rate as atof the date of the report. C. | Fair value of equity-accounted investments (ZIM) |
The fair value of equity-accounted investments may be accounted for based on: | | 1. | the investment as a whole; or |
| | 2. | each individual share making up the investment. |
In determining the fair value of equity-accounted investments, the Group has elected to account for as an individual share making up the investment and that no premium is added to the fair value of equity-accounted investments. Note 5 – Cash and Cash Equivalents | | | As at December 31, | | | | | 2023 | | | 2022 | | | | | $ Thousands | | Cash and cash equivalents in banks | | | 537,478 | | | | 361,580 | | Time deposits | | | 159,360 | | | | 173,591 | | | | | | 696,838 | | | | 535,171 | |
| | | As at December 31, | | | | | 2022 | | | 2021 | | | | | $ Thousands | | Cash and cash equivalents in banks | | | 361,580 | | | | 425,017 | | Time deposits | | | 173,591 | | | | 49,527 | | | | | | 535,171 | | | | 474,544 | |
The Group held cash and cash equivalents which are of investment grade based on Standard and Poor’s Ratings. Note 6 – Short-Term Deposits and Restricted Cash | | | As at December 31, | | | | | 2023 | | | 2022 | | | | | $ Thousands | | Short-term deposits with bank and others | | | - | | | | 35,662 | | Short-term restricted cash | | | 532 | | | | 10,328 | | | | | | 532 | | | | 45,990 | |
| | | As at December 31, | | | | 2022 | | | 2021 | | | | $ Thousands | Short-term deposits with bank and others | | | 35,662 | | | | 50 | | Short-term restricted cash | | | 10,328 | | | | 179 | | | | | | 45,990 | | | | 229 | |
The Group held short-term deposits and restricted cash which are of investment grade based on Standard and Poor’s Ratings. Note 7 – Other Investments | | | As at December 31, | | | | | 2022 | | | 2021 | | | | | $ Thousands | | Debt investments - at FVOCI | | | 344,780 | | | | - | |
| | | As at December 31, | | | | | 2023 | | | 2022 | | | | | $ Thousands | | Debt investments - at FVOCI | | | 215,797 | | | | 344,780 | |
The Group held debt investments at FVOCI which are of investment grade based on Standard and Poor’s Ratings and have stated interest rates of 0.25% to 7.625% (2022: 0.26% to 5.94% (2021: Nil)) with an average maturity of 2 years.years (2022: 2 years). These debt investments are expected to be realized within the next 12 months. Information about the Group’s exposure to credit and market risks, and fair value measurement, is included in Note 2928 Financial Instruments. Note 8 – Other Current Assets | | | As at December 31, | | | | | 2023 | | | 2022 | | | | | $ Thousands | | Advances to suppliers | | | - | | | | 1,219 | | Prepaid expenses | | | 12,909 | | | | 10,004 | | Input tax receivable | | | 8,291 | | | | 4,660 | | Grant receivable (1) | | | 74,522 | | | | - | | Deposits in connection with projects under construction (2) | | | 3,755 | | | | 35,475 | | Others | | | 12,226 | | | | 7,598 | | | | | | 111,703 | | | | 58,956 | |
| | | As at December 31, | | | | | 2022 | | | 2021 | | | | | $ Thousands | | Advances to suppliers | | | 1,219 | | | | 459 | | Inventories | | | 1,928 | | | | 1,706 | | Prepaid expenses | | | 10,004 | | | | 6,639 | | Input tax receivable | | | 4,660 | | | | 5,029 | | Indemnification asset (1) | | | - | | | | 9,047 | | Deposits in connection with projects under construction (2) | | | 35,475 | | | | 16,398 | | Others | | | 5,670 | | | | 4,101 | | | | | | 58,956 | | | | 43,379 | |
| | (1) | Relates to compensation receivable from OPC Hadera contractor as a result of the delay in the construction of the Hadera Power Plant. Please refer toSee Note 18.A.2.a18.A.4.d for further details.more information.
|
| | (2) | Relates to collateralCollateral provided to secure a hedging agreement in CPV Valley amounting to $20 million (2021: Nil) and collaterals provided in connection with renewable energy projects under development in the United States amounting to $15 million.million in 2022 were released during the year. |
Note 9 – Investment in Associated Companies | A. | Condensed information regarding significant associated companies |
| 1. | Condensed financial information with respect to the statement of financial position |
| | | | | | CPV | | | CPV | | | CPV | | | CPV | | | CPV | | | CPV | | | | | ZIM | | | Fairview | | | Maryland | | | Shore | | | Towantic | | | Valley | | | Three Rivers | | | | | As at December 31, | | | | | 2023 | | | 2022 | | | 2023 | | | 2022 | | | 2023 | | | 2022 | | | 2023 | | | 2022 | | | 2023 | | | 2022 | | | 2023 | | | 2022 | | | 2023 | | | 2022 | | | | | $ Thousands | | Principal place of business | | International | | | US | | | US | | | US | | | US | | | US | | | US | | Proportion of ownership interest | | | 21% | | | | 21% | | | | 25% | | | | 25% | | | | 25% | | | | 25% | | | | 37.5% | | | | 37.5% | | | | 26% | | | | 26% | | | | 50% | | | | 50% | | | | 10% | | | | 10% | | | | | | | | | | | | | | | | | | | | | | | | | | | | | | | | | | | | | | | | | | | | | | | | | | | | | | | | | | | | Current assets | | | 2,571,400 | | | | 4,271,600 | | | | 44,500 | | | | 98,942 | | | | 46,586 | | | | 73,985 | | | | 54,014 | | | | 92,808 | | | | 74,591 | | | | 86,698 | | | | 48,015 | | | | 59,191 | | | | 52,425 | | | | 32,626 | | Non-current assets | | | 5,774,600 | | | | 7,353,700 | | | | 911,763 | | | | 938,869 | | | | 650,720 | | | | 654,720 | | | | 935,750 | | | | 983,576 | | | | 880,572 | | | | 936,268 | | | | 673,339 | | | | 678,540 | | | | 1,393,984 | | | | 1,338,392 | | Current liabilities | | | (2,518,100 | ) | | | (2,662,200 | ) | | | (64,909 | ) | | | (166,468 | ) | | | (64,155 | ) | | | (73,883 | ) | | | (64,360 | ) | | | (53,619 | ) | | | (201,226 | ) | | | (133,746 | ) | | | (105,317 | ) | | | (542,176 | ) | | | (120,546 | ) | | | (47,939 | ) | Non-current liabilities | | | (3,369,900 | ) | | | (3,067,200 | ) | | | (344,274 | ) | | | (400,309 | ) | | | (314,069 | ) | | | (320,518 | ) | | | (645,995 | ) | | | (649,860 | ) | | | (222,946 | ) | | | (490,610 | ) | | | (371,771 | ) | | | (6,450 | ) | | | (711,571 | ) | | | (820,943 | ) | Total net assets | | | 2,458,000 | | | | 5,895,900 | | | | 547,080 | | | | 471,034 | | | | 319,082 | | | | 334,304 | | | | 279,409 | | | | 372,905 | | | | 530,991 | | | | 398,610 | | | | 244,266 | | | | 189,105 | | | | 614,292 | | | | 502,136 | | | | | | | | | | | | | | | | | | | | | | | | | | | | | | | | | | | | | | | | | | | | | | | | | | | | | | | | | | | | Group’s share of net assets | | | 507,019 | | | | 1,217,797 | | | | 136,770 | | | | 117,759 | | | | 79,771 | | | | 83,576 | | | | 104,862 | | | | 139,951 | | | | 138,058 | | | | 103,639 | | | | 122,133 | | | | 94,553 | | | | 62,370 | | | | 60,609 | | Adjustments: | | | | | | | | | | | | | | | | | | | | | | | | | | | | | | | | | | | | | | | | | | | | | | | | | | | | | | | | | Excess cost | | | 150,884 | | | | 138,071 | | | | 79,018 | | | | 80,414 | | | | (13,943 | ) | | | (14,396 | ) | | | (48,999 | ) | | | (52,777 | ) | | | 26,561 | | | | 26,615 | | | | (503 | ) | | | (806 | ) | | | 8,368 | | | | 8,379 | | Total impairment loss | | | (928,809 | ) | | | (928,809 | ) | | | - | | | | - | | | | - | | | | - | | | | - | | | | - | | | | - | | | | - | | | | - | | | | - | | | | - | | | | - | | Unrecognised losses* | | | 270,906 | | | | - | | | | - | | | | - | | | | - | | | | - | | | | - | | | | - | | | | - | | | | - | | | | - | | | | - | | | | - | | | | - | | | | | | | | | | | | | | | | | | | | | | | | | | | | | | | | | | | | | | | | | | | | | | | | | | | | | | | | | | | | Book value of investment | | | - | | | | 427,059 | | | | 215,788 | | | | 198,173 | | | | 65,828 | | | | 69,180 | | | | 55,863 | | | | 87,174 | | | | 164,619 | | | | 130,254 | | | | 121,630 | | | | 93,747 | | | | 70,738 | | | | 68,988 | | | | | | | | | | | | | | | | | | | | | | | | | | | | | | | | | | | | | | | | | | | | | | | | | | | | | | | | | | | | Investments in associated companies | | | - | | | | 427,059 | | | | 215,788 | | | | 198,173 | | | | 65,828 | | | | 69,180 | | | | 55,863 | | | | 87,174 | | | | 164,619 | | | | 130,254 | | | | 121,630 | | | | 93,747 | | | | 70,738 | | | | 68,988 | |
As of December 31, 2023, the Group also has interests in a number of individually immaterial associates. * As of December 31, 2023, additional share of losses of $271 million were unrecognized as the carrying amount of ZIM has been reduced to zero. Note 9 – Investment in Associated Companies (Cont’d) | 2. | Condensed financial information with respect to results of operations |
| | | | | | CPV | | | CPV | | | CPV | | | CPV | | | CPV | | | CPV | | | | | ZIM** | | | Fairview | | | Maryland | | | Shore | | | Towantic | | | Valley | | | Three Rivers | | | | | For the year ended December 31, | | | | | 2023 | | | 2022 | | | 2021 | | | 2023 | | | 2022 | | | 2021 | | | 2023 | | | 2022 | | | 2021 | | | 2023 | | | 2022 | | | 2021 | | | 2023 | | | 2022 | | | 2021 | | | 2023 | | | 2022 | | | 2021 | | | 2023 | | | 2022 | | | 2021 | | | | | $ Thousands | | | | | | | | | | | | | | | | | | | | | | | | | | | | | | | | | | | | | | | | | | | | | | | | | | | | | | | | | | | | | | | | | | | Revenue | | | 5,162,200 | | | | 12,561,600 | | | | 10,728,698 | | | | 273,763 | | | | 373,967 | | | | 199,030 | | | | 238,800 | | | | 243,710 | | | | 170,292 | | | | 134,805 | | | | 261,386 | | | | 189,985 | | | | 395,779 | | | | 494,665 | | | | 258,292 | | | | 239,165 | | | | 405,548 | | | | 139,473 | | | | 145,380 | | | | (2,722 | ) | | | 174 | | | | | | | | | | | | | | | | | | | | | | | | | | | | | | | | | | | | | | | | | | | | | | | | | | | | | | | | | | | | | | | | | | | | | | | | | | | | | | | | | | | | | | | | Loss/income* | | | (2,695,600 | ) | | | 4,619,400 | | | | 4,640,305 | | | | 106,110 | | | | 98,907 | | | | 9,666 | | | | 23,956 | | | | 33,249 | | | | 5,420 | | | | (74,767 | ) | | | 6,853 | | | | 16,247 | | | | 163,651 | | | | 47,436 | | | | 18,520 | | | | 32,527 | | | | 69,138 | | | | (58,793 | ) | | | 603 | | | | (7,934 | ) | | | (9,281 | ) | | | | | | | | | | | | | | | | | | | | | | | | | | | | | | | | | | | | | | | | | | | | | | | | | | | | | | | | | | | | | | | | | | | | | | | | | | | | | | | | | | | | | | | Other comprehensive income * | | | 12,300 | | | | (41,200 | ) | | | (3,462 | ) | | | (17,066 | ) | | | 15,730 | | | | 11,192 | | | | (25,678 | ) | | | 6,419 | | | | 10,983 | | | | (18,728 | ) | | | 16,301 | | | | 7,779 | | | | (31,270 | ) | | | 22,616 | | | | 11,140 | | | | 22,637 | | | | 1,178 | | | | 3,710 | | | | (12,310 | ) | | | 53,814 | | | | 19,361 | | | | | | | | | | | | | | | | | | | | | | | | | | | | | | | | | | | | | | | | | | | | | | | | | | | | | | | | | | | | | | | | | | | | | | | | | | | | | | | | | | | | | | | | Total comprehensive income | | | (2,683,300 | ) | | | 4,578,200 | | | | 4,636,843 | | | | 89,044 | | | | 114,637 | | | | 20,858 | | | | (1,722 | ) | | | 39,668 | | | | 16,403 | | | | (93,495 | ) | | | 23,154 | | | | 24,026 | | | | 132,381 | | | | 70,052 | | | | 29,660 | | | | 55,164 | | | | 70,316 | | | | (55,083 | ) | | | (11,707 | ) | | | 45,880 | | | | 10,080 | | | | | | | | | | | | | | | | | | | | | | | | | | | | | | | | | | | | | | | | | | | | | | | | | | | | | | | | | | | | | | | | | | | | | | | | | | | | | | | | | | | | | | | | Kenon’s share of comprehensive income | | | (279,236 | ) | | | 1,023,567 | | | | 1,258,913 | | | | 22,261 | | | | 28,659 | | | | 5,214 | | | | (431 | ) | | | 9,917 | | | | 4,101 | | | | (35,089 | ) | | | 8,690 | | | | 9,017 | | | | 34,419 | | | | 18,214 | | | | 7,711 | | | | 27,582 | | | | 35,158 | | | | (27,542 | ) | | | (1,171 | ) | | | 4,588 | | | | 1,008 | | | | | | | | | | | | | | | | | | | | | | | | | | | | | | | | | | | | | | | | | | | | | | | | | | | | | | | | | | | | | | | | | | | | | | | | | | | | | | | | | | | | | | | | Adjustments | | | 13,190 | | | | 558 | | | | 1,116 | | | | (1,928 | ) | | | (1,267 | ) | | | (1,249 | ) | | | 453 | | | | 458 | | | | 2,354 | | | | 3,777 | | | | 3,554 | | | | 3,644 | | | | (54 | ) | | | (184 | ) | | | 50 | | | | 301 | | | | 413 | | | | 681 | | | | (11 | ) | | | - | | | | - | | | | | | | | | | | | | | | | | | | | | | | | | | | | | | | | | | | | | | | | | | | | | | | | | | | | | | | | | | | | | | | | | | | | | | | | | | | | | | | | | | | | | | | | Kenon’s share of comprehensive income presented in the books | | | (266,046 | ) | | | 1,024,125 | | | | 1,260,029 | | | | 20,333 | | | | 27,392 | | | | 3,965 | | | | 22 | | | | 10,375 | | | | 6,455 | | | | (31,312 | ) | | | 12,244 | | | | 12,661 | | | | 34,365 | | | | 18,030 | | | | 7,761 | | | | 27,883 | | | | 35,571 | | | | (26,861 | ) | | | (1,182 | ) | | | 4,588 | | | | 1,008 | |
| * | Excludes portion attributable to non-controlling interest. |
| ** | As of December 31, 2023, additional share of losses of $271 million were unrecognized as the carrying amount of ZIM has been reduced to zero. |
Note 9 – Investment in Associated Companies (Cont’d) | 1. | Financial position As of December 31, 2023, ZIM’s total equity amounted to $2.5 billion (2022: $5.9 billion) and its working capital amounted to $53 million (2022: $1.6 billion). During the year ended December 31, 2023, ZIM recorded operating loss of $2.5 billion (2022: operating profit of $6.1 billion; 2021: operating profit of $5.8 billion) and net loss of $2.7 billion (2022: net profit of $4.6 billion; 2021: net profit of $4.6 billion). |
| | | | For the year ended | | | | | | December 31 | | | | | | 2023 | | | 2022 | | | 2021 | | | | Note | | $ Thousands | | | $ Thousands | | | $ Thousands | | Gain on dilution from ZIM IPO | 9.B.a.2 | | | - | | | | - | | | | 9,724 | | Loss on dilution from ZIM options exercised | 9.B.a.3 | | | (860 | ) | | | (3,475 | ) | | | (39,438 | ) | Gain on sale of ZIM shares | 9.B.a.4 | | | - | | | | 204,634 | | | | 29,510 | | (Impairment)/write back of ZIM investment | 9.B.a.5 | | | - | | | | (928,809 | ) | | | - | | | | | | | (860 | ) | | | (727,650 | ) | | | (204 | ) |
| 2. | Initial public offering In February 2021, ZIM completed its initial public offering (“IPO”) of 15,000,000 ordinary shares (including shares issued upon the exercise of the underwriters’ option), for gross consideration of $225 million (before deducting underwriting discounts and commissions or other offering expenses). ZIM’s ordinary shares began trading on the NYSE on January 28, 2021. Prior to the IPO, ZIM obtained waivers from its notes holders, subject to the completion of ZIM’s IPO, by which certain requirements and limitations in respect of repurchase of debt, incurrences of debt, vessel financing, reporting requirements and dividend distributions, were relieved or removed. As a result of the IPO, Kenon’s interest in ZIM was diluted from 32% to 28%. Following the IPO, Kenon recognized a gain on dilution of $10 million in its consolidated financial statements in 2021. |
| 3. | Exercise of ZIM options In 2023, ZIM issued approximately 137 thousand (2022: 407 thousand; 2021: 5.2 million) shares as a result of options being exercised. As a result of the issuance, Kenon recognized a loss on dilution of approximately $1 million (2022: $3 million, 2021: $39 million) in its consolidated financial statements. |
| 4. | Sales of ZIM shares Between September and November 2021, Kenon sold approximately 1.2 million ZIM shares at an average price of $58 per share for a total consideration of approximately $67 million. As a result, Kenon recognized a gain on sale of approximately $30 million in its consolidated financial statements. As of December 31, 2021, as a result of the sales of ZIM shares and the issuance of new shares described in Note 9.B.a.3, Kenon’s interest in ZIM reduced from 28% to 26%. In March 2022, Kenon sold approximately 6 million ZIM shares at an average price of $77 per share for total consideration of approximately $463 million. As a result of the sale, Kenon recognized a gain on sale of approximately $205 million in its consolidated financial statements. As of December 31, 2023 and 2022, as a result of the sales of ZIM shares and the issuance of new shares described in Note 9.B.a.3, Kenon’s interest in ZIM reduced from 26% to 21%. |
Note 9 – Investment in Associated Companies (Cont’d) | 5. | Impairment assessment For the purposes of Kenon’s impairment assessment of its investment, ZIM is considered one CGU, which consists of all of ZIM’s operating assets. The recoverable amount is based on the higher of the value-in-use and the fair value less cost of disposal (“FVLCOD”). Year Ended December 31, 2023 As of December 31, 2023, the carrying amount of ZIM has been reduced to zero after taking into account the equity accounted losses of ZIM and therefore, no assessment of further impairment of ZIM was necessary. Further, as of December 31, 2023, Kenon did not identify any objective evidence that the previously recognized impairment loss no longer exists or the previously assessed impairment amount may have decreased, and therefore, in accordance with IAS 36, no reversal of impairment was recognized. Year Ended December 31, 2022 Kenon identified indicators of impairment in accordance with IAS 28 as a result of a significant decrease in ZIM’s market capitalization towards the end of 2022. Therefore, the carrying value of Kenon’s investment in ZIM was tested for impairment in accordance with IAS 36. Kenon assessed the fair value of ZIM to be its market value as of December 31, 2022 and also assessed that, based solely on publicly available information within the current volatile shipping industry, no reasonable VIU calculation could be performed. As a result, Kenon concluded that the recoverable amount of its investment in ZIM is the market value. ZIM is accounted for as an individual share making up the investment and therefore no premium is added to the fair value of ZIM. Kenon measures the recoverable amount based on FVLCOD, measured at Level 1 fair value measurement under IFRS 13. Given that market value is below carrying value Kenon recognized an impairment of $929 million. Year Ended December 31, 2021 Kenon did not identify any objective evidence that its net investment in ZIM was impaired as of 31 December 31, 2021 and therefore, in accordance with IAS 28, no assessment of the recoverable amount of ZIM was performed. |
| C. | OPC’s associated companies |
| | | | | | | Ownership interest as at December 31 | | | | | Note | | Main location of company’s activities | | 2023 | | | 2022 | | CPV Valley Holdings, LLC | | 9.C.1 | | New York | | | 50 | % | | | 50 | % | CPV, Three Rivers, LLC | | | | Illinois | | | 10 | % | | | 10 | % | CPV Fairview, LLC | | | | Pennsylvania | | | 25 | % | | | 25 | % | CPV Maryland, LLC | | | | Maryland | | | 25 | % | | | 25 | % | CPV Shore Holdings, LLC | | | | New Jersey | | | 38 | % | | | 38 | % | CPV Towantic, LLC | | | | Connecticut | | | 26 | % | | | 26 | % |
| 1. | CPV Valley Holdings, LLC (“CPV Valley”) CPV Valley’s financial statements as of December 31, 2022 included a disclosure of circumstances related to CPV Valley’s ability to repay its liabilities under its credit agreement of over $400 million at the repayment date of the liabilities, i.e. June 30, 2023. During 2023, CPV Valley’s financing agreement was amended and extended to May 31, 2026. On the signing date of the new financing agreement, CPV Valley repaid $55 million of the financing arrangement, of which shareholders’ loans of $17 million were extended to CPV Valley from OPC. Subsequently, the total loan amount under the new financing agreement is $415 million. |
Note 9 – Investment in Associated Companies
A. | Condensed information regarding significant associated companies
|
| 1. | Condensed financial information with respect to the statement of financial position
|
| | | | | | | | | CPV | | | CPV | | | CPV | | | CPV | | | CPV | | | CPV | | | | | ZIM | | | Fairview | | | Maryland | | | Shore | | | Towantic | | | Valley | | | Three Rivers | | | | | As at December 31, | | | | | 2022 | | | 2021 | | | 2022 | | | 2021 | | | 2022 | | | 2021 | | | 2022 | | | 2021 | | | 2022 | | | 2021 | | | 2022 | | | 2021 | | | 2022 | | | 2021 | | | | | $ Thousands | | Principal place of business | | International | | | US | | | US | | | US | | | US | | | US | | | US | | Proportion of ownership interest | | | 21% | | | | 26% | | | | 25% | | | | 25% | | | | 25% | | | | 25% | | | | 37.5% | | | | 37.5% | | | | 26% | | | | 26% | | | | 50% | | | | 50% | | | | 10% | | | | 10% | | | | | | | | | | | | | | | | | | | | | | | | | | | | | | | | | | | | | | | | | | | | | | | | | | | | | | | | | | | | Current assets | | | 4,271,600 | | | | 5,084,865 | | | | 98,942 | | | | 107,380 | | | | 73,985 | | | | 26,649 | | | | 92,808 | | | | 45,538 | | | | 86,698 | | | | 38,558 | | | | 59,191 | | | | 35,783 | | | | 32,626 | | | | 2,997 | | Non-current assets | | | 7,353,700 | | | | 4,756,973 | | | | 938,869 | | | | 986,321 | �� | | | 654,720 | | | | 669,668 | | | | 983,576 | | | | 1,039,153 | | | | 936,268 | | | | 952,997 | | | | 678,540 | | | | 705,501 | | | | 1,338,392 | | | | 949,385 | | Current liabilities | | | (2,662,200 | ) | | | (2,756,595 | ) | | | (166,468 | ) | | | (136,136 | ) | | | (73,883 | ) | | | (37,067 | ) | | | (53,619 | ) | | | (7,904 | ) | | | (133,746 | ) | | | (124,247 | ) | | | (542,176 | ) | | | (85,176 | ) | | | (47,939 | ) | | | (20,921 | ) | Non-current liabilities | | | (3,067,200 | ) | | | (2,485,714 | ) | | | (400,309 | ) | | | (591,169 | ) | | | (320,518 | ) | | | (356,838 | ) | | | (649,860 | ) | | | (727,037 | ) | | | (490,610 | ) | | | (538,750 | ) | | | (6,450 | ) | | | (537,310 | ) | | | (820,943 | ) | | | (708,402 | ) | Total net assets | | | 5,895,900 | | | | 4,599,529 | | | | 471,034 | | | | 366,396 | | | | 334,304 | | | | 302,412 | | | | 372,905 | | | | 349,750 | | | | 398,610 | | | | 328,558 | | | | 189,105 | | | | 118,798 | | | | 502,136 | | | | 223,059 | | | | | | | | | | | | | | | | | | | | | | | | | | | | | | | | | | | | | | | | | | | | | | | | | | | | | | | | | | | | Group's share of net assets | | | 1,217,797 | | | | 1,182,810 | | | | 117,759 | | | | 91,599 | | | | 83,576 | | | | 75,603 | | | | 139,951 | | | | 131,261 | | | | 103,639 | | | | 85,425 | | | | 94,553 | | | | 59,399 | | | | 60,609 | | | | 56,021 | | Adjustments: | | | | | | | | | | | | | | | | | | | | | | | | | | | | | | | | | | | | | | | | | | | | | | | | | | | | | | | | | Excess cost | | | 138,071 | | | | 171,402 | | | | 80,414 | | | | 81,678 | | | | (14,396 | ) | | | (14,854 | ) | | | (52,777 | ) | | | (56,330 | ) | | | 26,615 | | | | 26,799 | | | | (806 | ) | | | (1,223 | ) | | | 8,379 | | | | 8,379 | | Total impairment loss | | | (928,809 | ) | | | - | | | | - | | | | - | | | | - | | | | - | | | | - | | | | - | | | | - | | | | - | | | | - | | | | - | | | | - | | | | - | | | | | | | | | | | | | | | | | | | | | | | | | | | | | | | | | | | | | | | | | | | | | | | | | | | | | | | | | | | | Book value of investment | | | 427,059 | | | | 1,354,212 | | | | 198,173 | | | | 173,277 | | | | 69,180 | | | | 60,749 | | | | 87,174 | | | | 74,931 | | | | 130,254 | | | | 112,224 | | | | 93,747 | | | | 58,176 | | | | 68,988 | | | | 64,400 | | | | | | | | | | | | | | | | | | | | | | | | | | | | | | | | | | | | | | | | | | | | | | | | | | | | | | | | | | | | Investments in associated companies | | | 427,059 | | | | 1,354,212 | | | | 198,173 | | | | 173,277 | | | | 69,180 | | | | 60,749 | | | | 87,174 | | | | 74,931 | | | | 130,254 | | | | 112,224 | | | | 93,747 | | | | 58,176 | | | | 68,988 | | | | 64,400 | |
As at December 31, 2022, the Group also has interests in a number of individually immaterial associates.
Note 9 – Investment in Associated Companies (Cont’d)
| 2. | Condensed financial information with respect to results of operations
|
| | | | | | | | | | | | CPV | | | CPV | | | CPV | | | CPV | | | CPV | | | CPV | | | | | | | | ZIM | | | Fairview | | | Maryland | | | Shore | | | Towantic | | | Valley | | | Three Rivers | | | Qoros** | | | | | For the year ended December 31, | | | | | 2022 | | | 2021 | | | 2020 | | | 2022 | | | 2021 | | | 2022 | | | 2021 | | | 2022 | | | 2021 | | | 2022 | | | 2021 | | | 2022 | | | 2021 | | | 2022 | | | 2021 | | | 2020*** | | | | | $ Thousands | | | | | | | | | | | | | | | | | | | | | | | | | | | | | | | | | | | | | | | | | | | | | | | | | | | | | Revenue | | | 12,561,600 | | | | 10,728,698 | | | | 3,991,696 | | | | 373,967 | | | | 199,030 | | | | 243,710 | | | | 170,292 | | | | 261,386 | | | | 189,985 | | | | 494,665 | | | | 258,292 | | | | 405,548 | | | | 139,473 | | | | (2,722 | ) | | | 174 | | | | 23,852 | | | | | | | | | | | | | | | | | | | | | | | | | | | | | | | | | | | | | | | | | | | | | | | | | | | | | | | | | | | | | | | | | | | | Income / loss* | | | 4,619,400 | | | | 4,640,305 | | | | 517,961 | | | | 98,907 | | | | 9,666 | | | | 33,249 | | | | 5,420 | | | | 6,853 | | | | 16,247 | | | | 47,436 | | | | 18,520 | | | | 69,138 | | | | (58,793 | ) | | | (7,934 | ) | | | (9,281 | ) | | | (52,089 | ) | | | | | | | | | | | | | | | | | | | | | | | | | | | | | | | | | | | | | | | | | | | | | | | | | | | | | | | | | | | | | | | | | | | Other comprehensive income * | | | (41,200 | ) | | | (3,462 | ) | | | 5,854 | | | | 15,730 | | | | 11,192 | | | | 6,419 | | | | 10,983 | | | | 16,301 | | | | 7,779 | | | | 22,616 | | | | 11,140 | | | | 1,178 | | | | 3,710 | | | | 53,814 | | | | 19,361 | | | | (3 | ) | | | | | | | | | | | | | | | | | | | | | | | | | | | | | | | | | | | | | | | | | | | | | | | | | | | | | | | | | | | | | | | | | | | Total comprehensive income | | | 4,578,200 | | | | 4,636,843 | | | | 523,815 | | | | 114,637 | | | | 20,858 | | | | 39,668 | | | | 16,403 | | | | 23,154 | | | | 24,026 | | | | 70,052 | | | | 29,660 | | | | 70,316 | | | | (55,083 | ) | | | 45,880 | | | | 10,080 | | | | (52,092 | ) | | | | | | | | | | | | | | | | | | | | | | | | | | | | | | | | | | | | | | | | | | | | | | | | | | | | | | | | | | | | | | | | | | | Kenon’s share of comprehensive income | | | 1,023,567 | | | | 1,258,913 | | | | 167,621 | | | | 28,659 | | | | 5,214 | | | | 9,917 | | | | 4,101 | | | | 8,690 | | | | 9,017 | | | | 18,214 | | | | 7,711 | | | | 35,158 | | | | (27,542 | ) | | | 4,588 | | | | 1,008 | | | | (6,251 | ) | | | | | | | | | | | | | | | | | | | | | | | | | | | | | | | | | | | | | | | | | | | | | | | | | | | | | | | | | | | | | | | | | | | Adjustments | | | 558 | | | | 1,116 | | | | 1,394 | | | | (1,267 | ) | | | (1,249 | ) | | | 458 | | | | 2,354 | | | | 3,554 | | | | 3,644 | | | | (184 | ) | | | 50 | | | | 413 | | | | 681 | | | | - | | | | - | | | | 3 | | | | | | | | | | | | | | | | | | | | | | | | | | | | | | | | | | | | | | | | | | | | | | | | | | | | | | | | | | | | | | | | | | | | Kenon’s share of comprehensive income presented in the books | | | 1,024,125 | | | | 1,260,029 | | | | 169,015 | | | | 27,392 | | | | 3,965 | | | | 10,375 | | | | 6,455 | | | | 12,244 | | | | 12,661 | | | | 18,030 | | | | 7,761 | | | | 35,571 | | | | (26,861 | ) | | | 4,588 | | | | 1,008 | | | | (6,248 | ) |
* | Excludes portion attributable to non-controlling interest.
|
** | The depreciation and amortization, interest income, interest expense and income tax expenses recorded by Qoros during 2020 were approximately $13 million, $1 million, $18 million and $nil thousand respectively.
|
*** | The 2020 equity accounted results reflect Kenon’s share of losses in Qoros until the completion date of the sale, i.e. April 29, 2020. Subsequent to that, Qoros was reclassified as to Long-term investment (Qoros). Refer to Note 10 for further details.
|
Note 9 – Investment in Associated Companies (Cont’d)
As of December 31, 2022, ZIM’s total equity amounted to $5.9 billion (2021: $4.6 billion) and its working capital amounted to $1.6 billion (2021: $2.3 billion). During the year ended December 31, 2022, ZIM recorded operating profit of $6.1 billion (2021: $5.8 billion; 2020: $722 million) and net profit of $4.6 billion (2021: 4.6 billion; 2020: $524 million).
| | | | For the year ended | | | | | | December 31 | | | | | | 2022 | | | 2021 | | | 2020 | | | | Note | | $ Thousands | | | $ Thousands | | | $ Thousands | | Gain on dilution from ZIM IPO | 9.B.a.2 | | | - | | | | 9,724 | | | | - | | Loss on dilution from ZIM options exercised | 9.B.a.3 | | | (3,475 | ) | | | (39,438 | ) | | | - | | Gain on sale of ZIM shares | 9.B.a.4 | | | 204,634 | | | | 29,510 | | | | - | | (Impairment)/write back of ZIM investment | 9.B.a.5 | | | (928,809 | ) | | | - | | | | 43,505 | | | | | | | (727,650 | ) | | | (204 | ) | | | 43,505 | |
| 2. | Initial public offering
|
In February 2021, ZIM completed its initial public offering (“IPO”) of 15,000,000 ordinary shares (including shares issued upon the exercise of the underwriters’ option), for gross consideration of $225 million (before deducting underwriting discounts and commissions or other offering expenses). ZIM’s ordinary shares began trading on the NYSE on January 28, 2021.
Prior to the IPO, ZIM obtained waivers from its notes holders, subject to the completion of ZIM’s IPO, by which certain requirements and limitations in respect of repurchase of debt, incurrences of debt, vessel financing, reporting requirements and dividend distributions, were relieved or removed.
As a result of the IPO, Kenon’s interest in ZIM was diluted from 32% to 28%. Following the IPO, Kenon recognized a gain on dilution of $10 million in its consolidated financial statements in 2021.
| 3. | Exercise of ZIM options
|
In 2022, ZIM issued approximately 407 thousand (2021: 5.2 million) shares as a result of options being exercised. As a result of the issuance, Kenon recognized a loss on dilution of approximately $3 million (2021: $39 million) in its consolidated financial statements.
Between September and November 2021, Kenon sold approximately 1.2 million ZIM shares at an average price of $58 per share for a total consideration of approximately $67 million. As a result, Kenon recognized a gain on sale of approximately $30 million in its consolidated financial statements. As at December 31, 2021, as a result of the sales of ZIM shares and the issuance of new shares described in Note 9.B.a.3, Kenon’s interest in ZIM reduced from 28% to 26%.
In March 2022, Kenon sold approximately 6 million ZIM shares at an average price of $77 per share for total consideration of approximately $463 million. As a result of the sale, Kenon recognized a gain on sale of approximately $205 million in its consolidated financial statements. As at December 31, 2022, as a result of the sales of ZIM shares and the issuance of new shares described in Note 9.B.a.3, Kenon’s interest in ZIM reduced from 26% to 21%.
Note 9 – Investment in Associated Companies (Cont’d)
For the purposes of Kenon’s impairment assessment of its investment, ZIM is considered one CGU, which consists of all of ZIM’s operating assets. The recoverable amount is based on the higher of the value-in-use and the fair value less cost of disposal (“FVLCOD”).Year Ended December 31, 2022
Kenon identified indicators of impairment in accordance with IAS 28 as a result of a significant decrease in ZIM’s market capitalization towards the end of 2022. Therefore, the carrying value of Kenon’s investment in ZIM was tested for impairment in accordance with IAS 36.
Kenon assessed the fair value of ZIM to be its market value as at December 31, 2022 and also assessed that, based solely on publicly available information within the current volatile shipping industry, no reasonable VIU calculation could be performed. As a result, Kenon concluded that the recoverable amount of its investment in ZIM is the market value. ZIM is accounted for as an individual share making up the investment and therefore no premium is added to the fair value of ZIM. Kenon measures the recoverable amount based on FVLCOD, measured at Level 1 fair value measurement under IFRS 13.Given that market value is below carrying value Kenon recognized an impairment of $929 million.
Year Ended December 31, 2021
Kenon did not identify any objective evidence that its net investment in ZIM was impaired as at 31 December 31, 2021 and therefore, in accordance with IAS 28, no assessment of the recoverable amount of ZIM was performed.Year Ended December 31, 2020
Due to an improvement in ZIM’s financial performance in 2020, Kenon, independently from ZIM, appointed a third-party to perform a valuation of its 32% equity investment in ZIM in accordance with IAS 28 and IAS 36. For the year ended December 31, 2020, Kenon concluded that the carrying amount of the investment in ZIM is lower than the recoverable amount, and therefore, a $44 million reversal of previously recorded impairment was recognized.
The valuation was based on publicly available information and earnings of ZIM over the 12-month period to December 31, 2020.
The independent valuer arrived at a range of equity for ZIM between $430 million and $585 million after adjustments for net debt. The fair value measurement was categorized as a Level 3 fair value based on the inputs in the valuation technique used.
Note 9 – Investment in Associated Companies (Cont’d)
C. | OPC’s associated companies
|
| | | | | | | Ownership interest as at December 31 | | | | | Note | | Main location of company's activities | | 2022 | | | 2021 | | CPV, Three Rivers, LLC | | | 9.C.1 | | Illinois | | | 10 | % | | | 10 | % | CPV Fairview, LLC | | | 9.C.2 | | Pennsylvania | | | 25 | % | | | 25 | % | CPV Maryland, LLC | | | 9.C.3 | | Maryland | | | 25 | % | | | 25 | % | CPV Shore Holdings, LLC | | | 9.C.4 | | New Jersey | | | 38 | % | | | 38 | % | CPV Towantic, LLC | | | 9.C.5 | | Connecticut | | | 26 | % | | | 26 | % | CPV Valley Holdings, LLC | | | 9.C.6 | | New York | | | 50 | % | | | 50 | % |
| 1. | CPV Three Rivers, LLC (“CPV Three Rivers”)
|
CPV Three Rivers is a project under construction in Illinois, United States. The commercial operation date is expected to be in Q2 2023.
In respect of an interest of 17.5% in the rights to the Three Rivers construction project (the “Construction Project”), a Sellers’ Loan in the amount of $95 million (the “Sellers’ Loan”) was provided to the CPV Group. The Seller’s Loan was granted for a period of up to two years from the Transaction Completion Date, bore interest at an annual rate of 4.5%, to be paid quarterly and was secured by a lien on shares of the holding company that owns the rights in the project under construction and rights pursuant to the management agreement of the project under construction.
On February 3, 2021, the transaction for sale of 7.5% of the rights in the Construction Project was completed for a consideration of approximately $41 million which was served for repayment as part of the Sellers’ Loan. No gain or loss was recognized on the sale. The remaining 10% equity interest continued to be subject to the Sellers’ Loan of approximately $55 million, which was repaid in October 2021.
| 2. | CPV Fairview, LLC (“CPV Fairview”)
|
CPV Fairview is a power plant in Pennsylvania, United States using natural gas and combined cycle technology whose commercial operations started in 2019.
Note 9 – Investment in Associated Companies (Cont’d)
| 3. | CPV Maryland, LLC (“CPV Maryland”)
|
CPV Maryland is a power plant in Maryland, United States using natural gas and combined cycle technology whose commercial operations started in 2017.
| 4. | CPV Shore Holdings, LLC (“CPV Shore”)
|
CPV Shore is a power plant in New Jersey, United States using natural gas and combined cycle technology whose commercial operations started in 2016.
| 5. | CPV Towantic, LLC (“CPV Towantic”)
|
CPV Towantic is a power plant in Connecticut, United States using natural gas/dual-fuel and combined cycle technology whose commercial operations started in 2018.
| 6. | CPV Valley Holdings, LLC (“CPV Valley”)
|
CPV Valley is a power plant in New York, United States using natural gas/dual-fuel and combined cycle technology whose commercial operations started in 2018.
CPV Valley’s financial statements as at December 31, 2022 included a disclosure of circumstances related to CPV Valley's ability to repay its liabilities under its credit agreement of over $400 million at the repayment date of the liabilities, i.e. June 30, 2023. CPV Valley's management is negotiating with its financing entities in an effort to defer or refinance its liabilities under the credit agreement. As of the approval date of the consolidated financial statements, CPV Valley is not expected to be able to repay its liabilities under the credit agreement using its cash flows from operating activities. However, CPV Valley management believes that it will be able to defer or refinance its credit agreement by June 30, 2023. As at December 31, 2022, there is no impact to the consolidated financial statements.
Note 10 – Long-term investment (Qoros) | | | | | | For the year ended December 31, | | | | | | | | 2022 | | | 2021 | | | 2020 | | | | | Note | | | $ Thousands | | Fair value (loss)/gain on remaining 12% interest in Qoros | | 10.3, 10.5 | | | | - | | | | (235,218 | ) | | | 154,475 | | (Payment)/recovery of financial guarantee | | 10.6 | | | | - | | | | (16,265 | ) | | | 6,195 | | Gain on sale of 12% interest in Qoros | | 10.3 | | | | - | | | | - | | | | 152,610 | | Fair value loss on put option | | 10.3 | | | | - | | | | - | | | | (3,362 | ) | | | | | | | | - | | | | (251,483 | ) | | | 309,918 | |
| | | | | | For the year ended December 31, | | | | | | | | 2023 | | | 2022 | | | 2021 | | | | | Note | | | $ Thousands | | Fair value loss on remaining 12% interest in Qoros | | | 10.3, 10.5 | | | | - | | | | - | | | | (235,218 | ) | Payment of financial guarantee | | | 10.6 | | | | - | | | | - | | | | (16,265 | ) | | | | | | | | | - | | | | - | | | | (251,483 | ) |
| 1. | As atof December 31, 2022,2023, the Group holds a 12% (2021:(2022: 12%) equity interest in Qoros through a wholly-owned and controlled company, Quantum (2007) LLC (“Quantum”). Chery Automobiles Limited (“Chery”), a Chinese automobile manufacturer, holds a 25% (2021:(2022: 25%) equity interest and the remaining 63% (2021:(2022: 63%) interest is held by an entity related to the Baoneng Group (“New Qoros Investor” or “New Strategic Partner”). |
| 2. | Qoros introduced a New Strategic Partner In January 2018, the New Qoros Investor purchased 51% of Qoros from Kenon and Chery for RMB 3.315 billion (approximately $504 million), resulting in Kenon’s and Chery’s interest in Qoros dropping from 50% each to 24% and 25%, respectively. This was part of an investment structure (“Investment Agreement”) to invest a total of approximately RMB 6.63 billion (approximately $1,002 million) by the New Qoros Investor. The Investment Agreement provided Kenon with a put option over its remaining equity interest in Qoros. |
In January 2018, the New Qoros Investor purchased 51% of Qoros from Kenon and Chery for RMB 3.315 billion (approximately $504 million), resulting in Kenon’s and Chery’s interest in Qoros dropping from 50% each to 24% and 25%, respectively. This was part of an investment structure (“Investment Agreement”) to invest a total of approximately RMB 6.63 billion (approximately $1,002 million) by the New Qoros Investor. The Investment Agreement provided Kenon with a put option over its remaining equity interest in Qoros.
Note 10 – Long-term investment (Qoros) (Cont’d)
| 3. | Kenon sells down from 24% to 12% |
In January 2019, Kenon, on behalf of its wholly owned subsidiary Quantum (2007) LLC, announced that it had entered into an agreement to sell half (12%) of its remaining interest (24%) in Qoros to the New Qoros Investor for RMB1,560 million (approximately $220 million), which was based on the same post-investment valuation as the initial investment by the New Qoros Investor. In April 2020, Kenon completed the sale of this half of its remaining interest in Qoros and received payment of RMB1,560 million (approximately $220 million). Kenon recognized a gain of approximately $153 million from the sale of its 12% interest in Qoros and the derecognition of the current portion of the put option pertaining to the 12% interest sold. Subsequent to the sale, the remaining 12% interest in Qoros was accounted for on a fair value basis through profit and loss and, together with the non-current portion of the put option pertaining to the remaining 12% interest (see Note 10.2), was reclassified in the statement of financial position as a long-term investment (Qoros). Upon reclassification, Kenon immediately recognized a fair value gain of approximately $139 million and the long-term investment (Qoros) was initially measured at a combined fair value of approximately $220 million. By the end of 2020, primarily due to the appreciation of RMB against the USD, the fair value of the long-term investment (Qoros) increased by approximately $15 million to $235 million.
In 2020 up until the completion date of the sale and prior to the reclass detailed above, the aggregate current and non-current put option fair value was reduced by approximately $3 million to $68 million. The sale was not made pursuant to the put option described above in Note 10.2.
Subsequent to the sale, the remaining 12% interest in Qoros was accounted for on a fair value basis through profit and loss and, together with the non-current portion of the put option pertaining to the remaining 12% interest (see Note 10.2), was reclassified in the statement of financial position as a long-term investment (Qoros). | | 4. | Agreement to sell remaining 12% interest |
In April 2021, Quantum entered into an agreement with the New Qoros Investor to sell all of its remaining 12% interest in Qoros. The total purchase price is RMB1.56 billion (approximately $245 million). To date, the New Qoros Investor has failed to make any of the required payments under this agreement.
In the fourth quarter of 2021, Kenon started arbitration proceedings against the New Qoros Investor for breach of the agreement and Kenon also started litigation proceedings against the New Qoros Investor with regards to the New Qoros Investor’s obligations to Kenon’s pledged shares in relation to Qoros’ RMB 1.2 billion loan (as described below). The outcomes of these legal proceedings and any related awards are uncertain.
As a result of the payment delay, Quantum had exercised the Put Option it has to sell its remaining shares to the New Qoros Investor.
To date, the New Qoros Investor has failed to make any of the required payments under this agreement. In the fourth quarter of 2021, Kenon started arbitration proceedings against the New Qoros Investor for breach of the agreement and Kenon also started litigation proceedings against the New Qoros Investor with regards to the New Qoros Investor’s obligations to Kenon’s pledged shares in relation to Qoros’ RMB 1.2 billion loan (as described below). As of December 31, 2023, the court proceedings are still ongoing. As a result of the payment delay, Quantum had exercised the Put Option it has to sell its remaining shares to the New Qoros Investor. | | 5. | Fair value assessment In September 2021, in light of the events described above, Kenon performed an assessment of the fair value of the long-term investment (Qoros) under IFRS 13 Fair value measurement.measurement. Kenon concluded that the fair value of the long-term investment (Qoros) is zero. Therefore, in 2021 Kenon recognized a fair value loss of $235 million in its consolidated financial statements for the year ended 2021. There were no significant changes in circumstances in 20222023 as compared to 2021, therefore, management has assessed that there is no change in fair value of Qoros. |
6. | Financial Guarantees Provision and Releases
|
Following completion of the transaction in 2019 as described in Note 10.3, the New Qoros Investor assumed its proportionate obligations with respect to the Qoros loans. As a result of this and repayments by Qoros in relation to its loans, Chery’s obligations under the loan guarantees were reduced. As at December 31, 2019, Kenon’s back-to-back guarantee obligations to Chery were reduced to approximately $23 million.
In April 2020, Kenon received $6 million from Chery following repayments by Qoros in relation to its loans. As at December 31, 2020, Kenon’s back-to-back guarantee obligations to Chery were reduced to approximately $16 million.
In the fourth quarter of 2021, Chery paid the full amount of its guarantee obligations. As discussed above, Kenon had back-to-back guarantee obligations of approximately $16 million to Chery in respect of guarantees Chery had given for these two loans. Kenon paid the $16 million to Chery and recognized a corresponding $16 million expense in its consolidated statements of profit and loss. Following this payment, Kenon does not have any remaining guarantee obligations with respect to Qoros debt.
| Note 10 – Long-term investment (Qoros) (Cont’d) As at December 31, 2022, Kenon has pledged substantially all of its interests in Qoros to secure Qoros’ RMB 1.2 billion loan facility. The New Qoros Investor was required to assume its pro rata share of pledge obligations. It has not yet provided all such pledges but has provided Kenon with a guarantee in respect of its pro rata share, and up to all, of Quantum's pledge obligations.
Qoros continues to engage in discussions with the lenders and other relevant stakeholders relating to its other outstanding bank loans and resumption of manufacturing production which was shut down in 2021.
| 7.6. | RestrictionsFinancial Guarantees Provision and Releases
Following completion of the transaction in 2019 as described in Note 10.3, the New Qoros Investor assumed its proportionate obligations with respect to the Qoros loans. As a result of this and repayments by Qoros in relation to its loans, Chery’s obligations under the loan guarantees were reduced. As of December 31, 2020, Kenon’s back-to-back guarantee obligations to Chery were reduced to approximately $16 million. In the fourth quarter of 2021, Chery paid the full amount of its guarantee obligations. Kenon paid $16 million to Chery and recognized a corresponding $16 million expense in its consolidated statements of profit and loss. Following this payment, Kenon does not have any remaining guarantee obligations with respect to Qoros debt. As of December 31, 2023, Kenon has pledged substantially all of its interests in Qoros to secure Qoros’ RMB 1.2 billion loan facility. The New Qoros Investor was required to assume its pro rata share of pledge obligations. It has not yet provided all such pledges but has provided Kenon with a guarantee in respect of its pro rata share, and up to all, of Quantum’s pledge obligations. |
Qoros has restrictions with respect to distribution of dividends and sale of assets deriving from legal and regulatory restrictions, restrictions under the joint venture agreement and the Articles of Association and restrictions stemming from credit received. | 7. | Restrictions Qoros has restrictions with respect to distribution of dividends and sale of assets deriving from legal and regulatory restrictions, restrictions under the joint venture agreement and the Articles of Association and restrictions stemming from credit received. |
Note 11 – Subsidiaries OPC Energy Ltd. OPC is a publicly-traded company whose securities are listed on the TASE. OPC is engaged in three reportable segments: | | i. | generation and supply of electricity and energy (electricity, steam and charging services for electric vehicles) in Israel to private customers, Israel Electric Company (“IEC”) and Noga – The Israel Independent System Operator Ltd. (“System Operator” or “Noga’), including initiation, development, construction and operation of power plants and facilities for energy generation; |
| | ii. | generation and supply of electricity and energy in the United States using renewable energy, including development, construction and management of renewable energy power plants; and |
| | iii. | generation and supply of electricity and energy in the United States using conventional (natural gas) power plants, including development, construction and management of conventional energy power plants in the United States. |
In 2022, CPV Group supplied retail electricity sale activities that complement its electricity generation activity through CPV Group.Material subsidiaries
OPC manages most of its operations in Israel through OPC Power Plants, and its operations in the United States through CPV Group, of which 70% is indirectly held by OPC.
Material subsidiaries
Set forth below are details regarding OPC’s material subsidiaries: | | | | | | | Ownership interest as at December 31 | | | | Note | | Main location of company's activities | | 2023 | | | 2022 | OPC Power Plants Ltd. | | 11.A.1 | | Israel | | 80 | % | | | 100 | % | OPC Holdings Israel Ltd. | | 11.A.2 | | Israel | | 80 | % | | | - | | CPV Group LP | | 11.A.3 | | USA | | 70 | % | | | 70 | % |
| | | | | | | | | | Ownership interest as at December 31 | | | | | | Note | | | Main location of company's activities | | | 2022 | | | 2021 | | OPC Power Plants Ltd. (formerly OPC Israel Energy Ltd.) | | | 11.A. 1 | | | | Israel | | | | 100 | % | | | 100 | % | CPV Group LP | | | 11.A. 2 | | | | USA | | | | 70 | % | | | 70 | % |
| 1. | OPC Power Plants Ltd. (“OPC Power Plants”) |
OPC Power Plants, (formerly OPC Israel Energy Ltd.),directly holds most of OPC’s businesses in Israel, such as OPC’s interests in OPC Rotem Ltd. (“OPC Rotem”), OPC Hadera Ltd. (“OPC Hadera”), Tzomet Energy Ltd. (“OPC Tzomet”), OPC Sorek 2 Ltd. (“OPC Sorek 2”) and OPC Sorek 2.Gat Power Plant (“Gat Partnership”). These businesses are mainly engaged in the generation and supply of electricity and energy, mainly to private customers and to the System Operator, and in the development, construction and operation in Israel of power plants and energy generation facilities powered using natural gas and renewable energy. Note 11 – Subsidiaries (Cont’d) | 1.1 | OPC Gat Power Plant (“Gat Partnership”) On March 30, 2023, the transaction between OPC Power Plants, together with Dor Alon Energy in Israel (1988) Ltd. (“Dor Alon”), and Dor Alon Gas Power Plants Limited Partnership (the “Seller”) for purchase of the rights in a power plant located in Kiryat Gat Industrial Zone (“Gat Partnership”) was completed, and all rights in the Gat Partnership were transferred to OPC. The transaction was completed for a consideration of NIS 870 million (approximately $242 million), after adjustments to working capital. Consideration of NIS 270 million (approximately $75 million) were paid to acquire all the rights in the Gat Partnership, and consideration of NIS 303 million (approximately $84 million) were used to repay the shareholders’ loan. The remaining consideration of NIS 300 million (approximately $83 million) represents a deferred consideration that was paid in 2023.
Determination of provisional fair value of identified assets and liabilities
The acquisition of the Gat Partnership was accounted for according to the provisions of IFRS 3 - “Business Combinations”. On the Transaction Completion Date, OPC included the net assets of the Gat Partnership in accordance with their fair value.
As of the approval date of the financial statements, OPC has yet to complete the attribution of acquisition cost to the identifiable assets and liabilities. As a result, some of the fair value data are provisional and there may be changes that will affect the data included below. Set forth below is the fair value of the identifiable assets and liabilities acquired (according to provisional amounts): |
| | $ Million | | Cash and cash equivalents | | | 1 | | Trade and other receivables | | | 6 | | Property, plant, and equipment - facilities and electricity generation and
supply license (1) | | | 172 | | Property, plant, and equipment - land owned by the Gat Partnership (2) | | | 23 | | Trade and other payables | | | (7 | ) | Loans from former right holders (3) | | | (84 | ) | Deferred tax liabilities | | | (19 | ) | Identifiable assets, net | | | 92 | | Goodwill (4) | | | 61 | | Total consideration (5) | | | 153 | |
| (1) | The Group applied IFRS 3 and allocate the fair value of the facilities and the electricity supply license to a single asset. The fair value was determined by an independent appraiser using the income approach, the MultiPeriod Excess Earning Method. The valuation methodology included several key assumptions that constituted the basis for cash flow forecasts, including, among other things, electricity and gas prices, and nominal post-tax discount rate of 8%-8.75%. The said assets are amortized over 27 years from the acquisition date, considering an expected residual value at the end of the assets’ useful life. |
| (2) | The fair value of the land was determined by an external and independent land appraiser using the discounted cash flow technique (the discount rate used is 8%). |
| (3) | The loans were repaid immediately after the acquisition date. |
| (4) | The goodwill arising as part of the business combination reflects the synergy between the activity of the Gat Partnership and the Rotem Power Plant. |
| (5) | The consideration includes a cash payment of NIS 270 million (approximately $75 million) plus deferred consideration, whose present value is estimated at NIS 285 million (approximately $79 million). |
| | The aggregate cash flows that were used by the Group as a result of the acquisition transaction: |
| | $ Million | | Cash and other cash equivalents paid (excluding consideration used to repay shareholders’ loan) | | | 152 | | Cash and other cash equivalents acquired | | | (1 | ) | | | | 151 | |
Note 11 – Subsidiaries (Cont’d) | a.2. | OPC RotemHoldings Israel Ltd. (“OPC Rotem”Holdings Israel”) |
OPC Rotem operates the Rotem Power Plant located in the Rotem Plain. Its operations commenced on July 6, 2013, and OPC Rotem has a license which allows it to produce and sell electricity for a period of 30 years from that date. As at December 31, 2022, OPC Power Plants held 80% interest in OPC Rotem with the remaining 20% is held by Veridis Power Plants Ltd. (“Veridis”). Subsequent to the year-end, OPC Rotem became a wholly-owned subsidiary of OPC Power Plants. Refer to Note 30 for further details.
| In May 2022, OPC had entered into an agreement with Veridis Power Plants (“Veridis”) to form OPC Holdings Israel Ltd. (“OPC Holdings Israel”), which will hold and operate all of OPC’s business activities in the energy and electricity generation and supply sectors in Israel (“Veridis Transaction”). b.
Upon completion of the Veridis Transaction in 2023, OPC transferred to OPC Holdings Israel, among other things, its 80% interest in OPC Rotem, its interest in Gnrgy Ltd., as well as other operations in Israel including OPC Hadera, OPC Tzomet, OPC Sorek, energy generation facilities on consumers’ premises and virtual electricity supply activities, and Veridis transferred its 20% interests in OPC Rotem to OPC Holdings Israel. In addition, Veridis invested approximately NIS 452 million (approximately $129 million) in cash in OPC Holdings Israel (after adjustments to the original transaction amount which totaled NIS 425 million (approximately $125 million)), of which approximately NIS 400 million (approximately $118 million) was used by OPC Rotem to repay a portion of the shareholders’ loans provided to OPC Rotem in 2021 by OPC and Veridis.
As a result of the Veridis Transaction, OPC holds 80% and Veridis holds the remaining 20% of OPC Holdings Israel, which holds 100% of the business activities in the energy and electricity generation and supply sectors in Israel transferred by OPC.
The Veridis transaction is accounted for in accordance with the provisions of IFRS 10 – “Consolidated Financial Statements”. Accordingly, all differences between the cash received from Veridis as stated above and the increase in the non-controlling interests were recognized in capital reserve from transactions with non-controlling interests. |
| 3. | OPC Hadera Ltd. (“OPC Hadera”)
|
OPC Hadera holds a permanent power generation license using cogeneration technology for the Hadera Power Plant (i.e. generating both electricity and steam), with 144 MW installed capacity, and a supply license. The generation license has a validity of 20 years, and may be extended for an additional 10 years subject to regulatory approval. OPC Hadera owns the Energy Center (boilers and turbines on the premises of Infinya Ltd. (“Infinya”)). The Energy Center operates as a back-up for the supply of steam.
OPC Hadera supplies all the electricity and steam needs of Infinya, which is located adjacent to the Hadera Power Plant, for a contracted period of 25 years, through the Hadera Power Plant and the Energy Center, which serves as a back-up for the supply of steam. In October 2021 the Hadera Power Plant was connected to Infinya by way of a direct electricity line.
| c. | Tzomet Energy Ltd. (“OPC Tzomet”)
|
In April 2019, OPC Tzomet received a conditional license for construction of the Tzomet power plant. In December 2019, OPC Tzomet received tariff approval from the IEA for the power plant. Under the tariff approval, the commercial operation date is expected to be 36 months from the completion of financial closing as described above. Subject to completion of the power plant and receipt of a permanent generation license, OPC Tzomet will be entitled to tariffs in respect of sale of availability and energy to the System Operator for a period of twelve months commencing from the date of receipt of the permanent generation license. It is noted that the connection study OPC Tzomet received included approval of a reduced availability tariff in 2023, pursuant to the decision of the IEA.
Lease of OPC Tzomet land
In January 2020, Israel Lands Authority (“ILA”) approved allotment of an area measuring about 8.5 hectares for the construction of the Tzomet Power Plant (hereinafter in this Section – the “Land”). ILA signed a development agreement with Kibbutz Netiv Halamed Heh (hereinafter – the “Kibbutz”) in connection with the Land, which is valid up to November 5, 2024 (hereinafter – the “Development Agreement”), which after fulfilment of its conditions a lease agreement will be signed for a period of 24 years and 11 months from approval of the transaction, i.e. up to November 4, 2044. Tzomet Netiv Limited Partnership (“Joint Company’) own the rights in the Land, and the composition is as follows i) General Partner of the Tzomet Netiv Limited Partnership holds 1%, in which the Kibbutz and OPC Tzomet hold 26% and 74% respectively, ii) Limited partners hold 99%, where the Kibbutz (26%) and OPC Tzomet (73%) hold rights as limited partners.
In February 2020, an updated lease agreement was also signed whereby the Joint Company, as the owner of the Land, will lease the Land to OPC Tzomet, for the benefit of the project.
In January 2020, a financial specification was received from ILA in respect of the capitalization fees, whereby value of the Land (not including development expenses) of about NIS 207 million (approximately $60 million) (not including VAT) was set (hereinafter – “the Initial Assessment”). OPC Tzomet, on behalf of the Joint Company, arranged payment of the Initial Assessment in January 2020 at the rate of 75% of amount of the Initial Assessment and provided through OPC, the balance, at the rate of 25% as a bank guarantee in favor of ILA. In January 2021, a final assessment was received from ILA where the value of the usage fees in the land for a period of 25 years, to construct a power plant with a capacity of 396 MW was NIS 200 million (approximately $62 million) (the “Final Assessment”). In March 2021, a reimbursement of NIS 7 million (approximately $2 million), which included linkage differences and interest in respect of the difference between capitalized fees paid and the Final Assessment amount, was received. In addition, the bank guarantee was also reduced by the amount of 25% of said difference.
Note 11 – Subsidiaries (Cont’d)
In February 2021, the Joint Company submitted a legal appeal regarding the Final Assessment amount, which the ILA dismissed in August 2021. In November 2021, the Joint Company filed an assessor objection.
As at December 31, 2022, the amounts paid in respect of the land was classified in the consolidated statement of financial position under “Right‑of‑use assets, net”. The unpaid balance of the Initial Assessment of approximately NIS 4 million (approximately $2 million) [2021: NIS 52 million (approximately $17 million)] was classified in the consolidated statement of financial position as at December 31, 2022 as current maturities of lease liabilities.
| d. | OPC Sorek 2 Ltd. (“OPC Sorek 2”)
|
In May 2020, OPC Sorek 2 signed an agreement with SMS IDE Ltd., which won a tender of the State of Israel for construction, operation, maintenance and transfer of a seawater desalination facility on the “Sorek B” site (the “Sorek B Desalination Facility”), where OPC Sorek 2 will construct, operate and maintain an energy generation facility (“Sorek B Generation Facility) with a generation capacity of about 87 MW on the premises of the Sorek 2 Desalination Facility, and will supply the energy required for the Sorek B Desalination Facility for a period of 25 years after the operation date of the Sorek B Desalination Facility. At the end of the aforesaid period, ownership of the Sorek B Generation Facility will be transferred to the State of Israel. OPC undertook to construct the Sorek B Generation Facility within 24 months from the date of approval of the National Infrastructure Plan (approved in November 2021), and to supply energy at a specific scope of capacity to the Sorek B Desalination Facility.
Establishment of the Sorek B Generation Facility is contingent on, among other things, completion of the planning and/or licensing processes and receipt of approval with respect to the ability to output electricity from the site, which as at the submission date of the report had not yet been received.
| e. | Additional subsidiaries in Israel
|
OPC Holdings Israel Ltd. (“OPC Holdings Israel”)
In May 2022, OPC formed a new subsidiary, OPC Holdings Israel and entered into an investment and share exchange transaction with Veridis to hold and operate all of OPC’s business activities in the energy and electricity generation and supply sectors in Israel (“Veridis Transaction”). Refer to Note 30 for further details.
OPC Operations Ltd. (“Hadera Operations Company”)
In July 2016, OPC Hadera engaged in an agreement for the ongoing operation and maintenance of the Hadera Power Plant with Hadera Operations Company, for a period of 20 years from the date of commencement of commercial operation. Under the engagement, Hadera Operations Company undertook to provide services to the Hadera Power Plant in the construction, maintenance and operation of Hadera Power Plant after its commercial operation. In October 2019, OPC provided a corporate execution guarantee of NIS 21 million (approximately $6 million) to secure the commitments of Hadera Operations Company towards OPC Hadera.
AGS Rotem Ltd. (“Rotem 2”)
Rotem 2 is a privately-held company that is advancing the construction of a power plant on land adjacent to the Rotem Power Plant. As at December 31, 2022, OPC held 80% of the issued and paid up share capital of Rotem 2 and the remaining shares of Rotem 2 are held by Veridis. Subsequent to the year-end, Rotem 2 is a wholly-owned subsidiary of OPC Holdings Israel. Refer to Note 30 for further details.
OPC Gas Limited Partnership (“OPC Gas”)
OPC Gas is a limited partnership that, as part of the Group's energy production and supply activity, supplies natural gas for OPC’s needs, including for OPC’s projects to establish energy generation facilities at the consumer's premises, as well as selling natural gas to third parties.
Note 11 – Subsidiaries (Cont’d)
OPC Hadera Expansion Ltd. (“OPC Hadera 2”)
OPC Hadera 2 is involved in the construction of a power plant for the generation of electricity using natural gas on land owned by Infinya located adjacent to the Hadera Power Plant. OPC Hadera 2 entered into an agreement with Infinya to lease a 6.8 hectares plot near the Hadera Power Plant, which had its lease option extended in December 2022 by 5 years. In December 2022, NIS 8 million (approximately $2 million) was paid to Infinya for the exercise of the option.
Gnrgy Ltd. (“Gnrgy”)
Gnrgy is a private company offering electric vehicles charging services. In April 2021, OPC entered into an agreement to purchase an interest in Gnrgy, whose business focuses on e-mobility charging stations. Pursuant to the purchase agreement, in May 2021 OPC acquired a 27% interest for a consideration of NIS 25 million (approximately $8 million), and in December 2021 acquired a further 24% interest for a consideration of NIS 42 million (approximately $14 million), of which NIS 13 million (approximately $4 million) was paid in installments bearing 5% additional interest. As at December 31, 2022, OPC held a 51% (2021: 51%) interest in Gnrgy.
Gnrgy's founder retained the remaining interests in Gnrgy and entered into a shareholders’ agreement with OPC, which among other things gave OPC an option to acquire a 100% interest in Gnrgy (the “Purchase Option”). The exercise price of the Purchase Option will be derived from the fair value of Gnrgy on the exercise date, assuming an agreed‑to rate, but no less than a price based on the value of the original transaction. The exercise period of the Purchase Option will be the period of time determined after approval of Gnrgy’s financial statements for each of the years 2024 through 2026.
To the extent the entire exercise period of the Purchase Option passes without OPC exercising the Purchase Option, and on the assumption that no capital investments have been made in Gnrgy so as to dilute the founder’s share and subject to additional conditions stipulated in the shareholders’ agreement, the founder has an option to acquire shares of Gnrgy from OPC such that after the acquisition, he will hold 2% more than OPC in Gnrgy’s share capital, and will once again become the controlling shareholder of Gnrgy. In addition, to the extent OPC does not exercise the Purchase Option within the first period for exercise of the Purchase Option, and the founder will hold less than 15% of Gnrgy’s share capital, the founder will have an option to require OPC purchase his shares based on the fair value that will be determined in accordance with that stated in the shareholders’ agreement at a discount rate as provided in the agreement.
In July 2021, Gnrgy received a virtual supply license.
| 2. | CPV Group LP (“CPV Group”) CPV Group is engaged in the development, construction and management of power plants using renewable energy and conventional energy (power plants running on natural gas of the advanced‑generation combined‑cycle type) in the United States. The CPV Group holds rights in active power plants that it initiated and developed – both in the area of conventional energy and in the area of renewable energy. In addition, through an asset management group the CPV Group is engaged in provision of management services to power plants in the United States using a range of technologies and fuel types, by means of signing asset‑management agreements, usually for short to medium periods. Refer to Note 9.C for further details on associates of CPV Group. |
CPV Group is engaged in the development, construction and management of power plants using renewable energy and conventional energy (power plants running on natural gas of the advanced‑generation combined‑cycle type) in the United States. The CPV Group holds rights in active power plants that it initiated and developed – both in the area of conventional energy and in the area of renewable energy. In addition, through an asset management group the CPV Group is engaged in provision of management services to power plants in the United States using a range of technologies and fuel types, by means of signing asset‑management agreements, usually for short to medium periods. Refer to Note 9.C for further details on associates of CPV Group.
| 3.4. | OPC Power Ventures LP (“OPC Power”) In October 2020, OPC signed a partnership agreement (the “Partnership Agreement” and the “Partnership”, where applicable) with three financial entities to form OPC Power, whereby the limited partners in the Partnership are OPC which holds a 70% interest, Clal Insurance Group which holds a 12.75% interest, Migdal Insurance Group which holds a 12.75% interest, and a corporation from Poalim Capital Markets which holds a 4.5% interest.
The General Partner of the Partnership, a wholly-owned company of OPC, will manage the Partnership’s business as its General Partner, with certain material actions (or which may involve a conflict of interest between the General Partner and the limited partners), requiring approval of a majority a of special majority (according to the specific action) of the institutional investors which are limited partners. The General Partner is entitled to management fees and success fees subject to meeting certain achievements. OPC also entered into an agreement with entities from the Migdal Insurance Group with respect to their holdings in the Partnership, whereby OPC granted said entities a put option, and they granted OPC a call option (to the extent that the put option is not exercised), which is exercisable after 10 years in certain circumstances. The total investment undertakings and provision of shareholders’ loans provided by all partners under the Partnership Agreement pro rata to the holdings discussed above is $1,215 million. The amount is designated for acquisition of all the rights in the CPV Group and for financing additional investments. |
In October 2020, OPC signed a partnership agreement (the “Partnership Agreement” and the “Partnership”, where applicable) with three financial entities to form OPC Power, whereby the limited partners in the Partnership are OPC which holds a 70% interest, Clal Insurance Group which holds a 12.75% interest, Migdal Insurance Group which holds a 12.75% interest, and a corporation from Poalim Capital Markets which holds a 4.5% interest.
Note 11 – Subsidiaries (Cont’d) The General Partner of the Partnership, a wholly-owned company of OPC, will manage the Partnership’s business as its General Partner, with certain material actions (or which may involve a conflict of interest between the General Partner and the limited partners), requiring approval of a majority a of special majority (according to the specific action) of the institutional investors which are limited partners. The General Partner is entitled to management fees and success fees subject to meeting certain achievements.
| OPC also entered into an agreement with entities from the Migdal Insurance Group with respect to their holdings in the Partnership, whereby OPC granted said entities a put option, and they granted OPC a call option (to the extent that the put option is not exercised), which is exercisable after 10 years in certain circumstances.
The total investment undertakings and provision of shareholders’ loans provided by all partners under the Partnership Agreement pro rata to the holdings discussed above is $1,215 million. The amount is designated for acquisition of all the rights in the CPV Group and for financing additional investments.
In 2021, OPC and the holders of the non-controlling interests provided OPC Power in partnership capital and loans of approximately $657 million and $204 million respectively. The loans are denominated in dollars and bear interest at an annual rate of 7%. The loan principal is repayable at any time, but not later than January 2028. The accrued interest is to be paid on a quarterly basis. To the extent the payment made by OPC Power is lower than the amount of the accrued interest, the payment in respect of the balance will be postponed to the next quarter, but not later than January 2028. In January 2021, the loans and rights of OPC Power were subsequently transferred to ICG Energy, Inc. OPC Power holds 99.99% of the CPV Group, and the remaining interest is held by the General Partner of the Partnership. In 2022, the Limited Partners in the Partnership provided OPC Power with equity investments totaling $122 million (NIS 409 million) and provided it with loans for a total amount of $38 million (NIS 127 million), respectively, each in accordance with its proportionate share. As December 31, 2022, total investments in the Partnership’s equity and the outstanding balance of the loans (including accrued interest) amount to $779 million (approximately NIS 2,741 million), and $271 million (approximately NIS 953 million), respectively. Subsequent to the reporting date, further investments in equity and shareholders’ loans totaling NIS 370 million ($103 million) and NIS 115 million ($32 million), respectively, were advanced. As at the date of the approval of the financial statements, the total balance of investment undertakings and shareholders’ loans of all partners is estimated at $135 million (NIS 475 million).
In 2022, the Limited Partners in the Partnership provided OPC Power with equity investments totaling $122 million (NIS 409 million) and provided it with loans for a total amount of $38 million (NIS 127 million), respectively, each in accordance with its proportionate share. As December 31, 2022, total investments in the Partnership’s equity and the outstanding balance of the loans (including accrued interest) amount to $779 million (approximately NIS 2,741 million), and $271 million (approximately NIS 953 million), respectively. In 2023, OPC and non-controlling interests made equity investments in the partnership OPC Power Ventures LP (both directly and indirectly) of NIS 565 million (approximately $150 million), and extended NIS 175 million (approximately $45 million) in loans, based on their stake in the partnership. In September 2023, after utilizing the entire investment commitment and shareholder loans in July 2023, the facility was increased by $100 million (OPC’s share in the facility is $70 million). |
| 4.5. | Acquisition of CPV Group |
On January 25, 2021 (“Transaction Completion Date”), the Group acquired 70% of the rights and holdings in CPV Power Holdings LP; Competitive Power Ventures Inc.; and CPV Renewable Energy Company Inc through the limited partnership, CPV Group LP (the “Buyer”). For the year ended December 31, 2021, the Group’s consolidated results comprised results of the CPV Group from Transaction Completion Date through to year end.
On the Transaction Completion Date, in accordance with the mechanism for determination of the consideration as defined in the acquisition agreement, the Buyer paid the sellers approximately $648 million, and about $5 million for a deposit which remains in the CPV Group. OPC partially hedged its exposure to changes in the cash flows from payments in US dollars in connection with the agreement for acquisition of the CPV Group by means of forward transactions and dollar deposits. OPC chose to designate the forward transactions as an accounting hedge. On the Transaction Completion Date, OPC recorded an amount of approximately NIS 103 million (approximately $32 million) that was accrued in a hedge capital reserve to the investment cost in the CPV Group.
The contribution of the CPV Group to the Group’s revenue and consolidated loss from the acquisition date until December 31, 2021 amounted to $51 million and $47 million, respectively.
Following the acquisition of CPV Group, the fair value of identifiable assets and liabilities as of the acquisition date had been determined to be $580 million. Accordingly, goodwill of $105 million (including goodwill arising from hedging) was recognized, which reflects the potential of future activities of CPV Group in the market in which it operates.
OPC partially hedged its exposure to changes in the cash flows from payments in US dollars in connection with the agreement for acquisition of the CPV Group by means of forward transactions and dollar deposits. OPC chose to designate the forward transactions as an accounting hedge. On the Transaction Completion Date, OPC recorded an amount of approximately NIS 103 million (approximately $32 million) that was accrued in a hedge capital reserve to the investment cost in the CPV Group. The contribution of the CPV Group to the Group’s revenue and consolidated loss from the acquisition date until December 31, 2021 amounted to $51 million and $47 million, respectively. Following the acquisition of CPV Group, the fair value of identifiable assets and liabilities as of the acquisition date had been determined to be $580 million. Accordingly, goodwill of $105 million (including goodwill arising from hedging) was recognized, which reflects the potential of future activities of CPV Group in the market in which it operates. | | 6. | Acquisition of Mountain Wind Power Plant In January 2023, CPV Group through its 100% owned subsidiary entered into an agreement to acquire all rights in four operating wind-powered electricity power plants in Maine, United States, with an aggregate capacity of 81.5 MW.
On April 5, 2023, the transaction was completed and CPV Group received all rights in the Mountain Wind Project for consideration of $175 million. |
Note 11 – Subsidiaries (Cont’d) | Determination of fair value of identified assets and liabilities The acquisition of the Mountain Wind Project was accounted for according to the provisions of IFRS 3 - “Business Combinations”. On the Transaction Completion Date, OPC included the net assets of the Mountain Wind Project in accordance with their fair value. Set forth below is the fair value of the identifiable assets and liabilities acquired: |
| | $ Million | | Trade and other receivables | | | 4 | | Property, plant, and equipment (1) | | | 127 | | Intangible assets (1) | | | 26 | | Trade and other payables | | | (1 | ) | Liabilities in respect of evacuation and removal | | | (2 | ) | Identifiable assets, net | | | 154 | | Goodwill (2) | | | 21 | | Total consideration | | | 175 | |
| | 5.(1) | The fair value was determined using the discounted cash flow method. The valuation methodology included a number of key assumptions that constituted the basis for cash flow forecasts, including, among other things, electricity and gas prices, and nominal post-tax discount rate of 5.75% - 6.25%. Intangible assets are amortized over 13 to 17 years, and property, plant, and equipment items are depreciated over 20 to 29 years. |
| (2) | The goodwill in the transaction reflects the business potential of the Group’s entry into the renewable energies market in New England, USA. CPV Group expects that the entire amount of the goodwill will be deductible for tax purposes. |
| 7. | Issuances of new shares by OPC |
In October 2020, OPC published a shelf offer report for issuance of ordinary shares of NIS 0.01 par value each to the public through a uniform offer with a range of quantities by means of a tender on the price per unit and the quantity. Kenon submitted bids for participation in the tender at prices not less than the uniform price determined in the tender, and as part of the issuance it was issued 10,700,200 shares for a consideration of approximately $101 million. A total of 23,022,100 shares were issued to the public. The gross proceeds from the issuance amount to approximately NIS 737 million (approximately $217 million) and the issuance expenses amounted to approximately NIS 5 million (approximately $1 million).
In addition, in October 2020, OPC completed a private offer of 11,713,521 ordinary shares to institutional entities from the Clal group and Phoenix group. The price per ordinary share with respect to each of the offerees was NIS 29.88, which was determined through negotiations between the offerees. The gross proceeds from the issuance amount to approximately NIS 350 million (approximately $103 million) and the issuance expenses amount to approximately NIS 5 million (approximately $1 million). Following completion of the share issuances in 2020, as at December 31, 2020 Kenon registered a decrease of 8% in equity interest in OPC from 70% to 62%. Accordingly, in 2020 the Group recognized $136 million in non-controlling interests and $182 million in accumulated profits arising from changes in the Group’s proportionate share of OPC.
In February 2021, OPC issued to Altshuler Shaham Ltd. and entities managed by Altschuler Shalam (collectively, the “Offerees”), 10,300,000 ordinary shares of NIS 0.01 par value each. The price of the shares issued to the Offerees was NIS 34 per ordinary share, and the gross proceeds from the issuance was about NIS 350 million (approximately $106 million). The issuance expenses were about NIS 4 million (approximately $1 million). Accordingly, the Group recognized $63 million in non-controlling interests and $42 million in accumulated profits arising from changes in the Group’s proportionate share of OPC. In July 2022, OPC issued to the public 9,443,800 ordinary shares of NIS0.01 par value each. The issuance was carried out by way of uniform offering with a quantity range, and a tender for the unit price and quantity. Gross issuance proceeds amounted to NIS 331 million (approximately $94 million), and issuance expenses were approximately NIS 9 million (approximately $2 million). Kenon took part in the issuance, and was issued 3,898,000 ordinary shares for a gross amount of $39 million. In September 2022, OPC issued to qualified investors 12,500,000 ordinary shares of NIS 0.01 par value each. Gross issuance proceeds amounted to NIS 500 million (approximately $141 million), and issuance expenses were approximately NIS 6 million (approximately $1 million). Kenon did not take part in the issuance. Following completion of the share issuances in 2022, Kenon registered a decrease of 4% in equity interest in OPC from 59% to 55%. Accordingly, the Group recognized $136 million in non-controlling interests and $58 million in accumulated profits arising from changes in the Group’s proportionate share of OPC. Note 11 – Subsidiaries (Cont’d) In September 2021, OPC issued rights to purchase 13,174,419 ordinary OPC shares of NIS 0.01 per value each (hereinafter - the “Rights”), in connection with the development and expansion of OPC’s activity in the USA. The Rights were offered such that each holder of ordinary shares of OPC who held 43 ordinary shares was entitled to purchase one right unit comprising of three shares at a price of NIS 75 (NIS 25 per share). Through the deadline for exercising the rights, notices of exercise were received for the purchase of 13,141,040 ordinary shares (constituting approximately 99.7% of the total shares offered in the rights offering). The gross proceeds from the exercised rights amounted to approximately NIS 329 million (approximately $102 million). In October 2021, Kenon exercised rights for the purchase of approximately 8 million shares for total consideration of approximately NIS 206 million (approximately $64 million), which included its pro rata share and additional rights it purchased during the rights trading period plus the cost to purchase these additional rights. As a result, Kenon now holdsthen held approximately 58.8% of the outstanding shares of OPC. Accordingly, the Group recognized $41 million in non-controlling interests and $60 million in accumulated profits arising from changes in the Group’s proportionate share of OPC. Following completion of the share issuance as described in Note 11.511.7 and the above rights issuances in 2021, Kenon registered a decrease in equity interest in OPC from 59% to 55%. Accordingly, the Group recognized $104 million in non-controlling interests and $38 million in accumulated profits arising from changes in the Group’s proportionate share of OPC. Following the growth strategy adopted by OPC and the expansion of operation targets in recent years, taking into account OPC’s financial strength, from March 2024, OPC’s dividend distribution policy will be suspended for two years. After the said suspension period, the Board of Directors will discuss the possible resumption of the dividend distribution policy and its applicability to the circumstances, if any. Note 11 – Subsidiaries (Cont’d)
| B. | The following table summarizes the information relating to the Group’s subsidiary in 2023, 2022 2021 and 20202021 that has material NCI: |
| | | As at and for the year ended December 31, | | | | | 2023 | | | 2022 | | | 2021 | | | | | OPC Energy Ltd. | | | OPC Energy Ltd. | | | OPC Energy Ltd. | | | | | $ Thousands | | NCI percentage * | | | 59.88 | % | | | 56.20 | % | | | 53.14 | % | Current assets | | | 460,810 | | | | 419,636 | | | | 346,380 | | Non-current assets | | | 3,018,434 | | | | 2,289,101 | | | | 2,141,744 | | Current liabilities | | | (353,735 | ) | | | (184,418 | ) | | | (230,518 | ) | Non-current liabilities | | | (1,679,847 | ) | | | (1,283,445 | ) | | | (1,341,962 | ) | Net assets | | | 1,445,662 | | | | 1,240,874 | | | | 915,644 | | Carrying amount of NCI | | | 865,676 | | | | 697,433 | | | | 486,598 | | | | | | | | | | | | | | | | Revenue | | | 691,796 | | | | 573,957 | | | | 487,763 | | Profit/(loss) after tax | | | 46,955 | | | | 65,352 | | | | (93,898 | ) | Other comprehensive income | | | (38,017 | ) | | | (11,249 | ) | | | 74,219 | | Profit/(loss) attributable to NCI | | | 25,030 | | | | 37,007 | | | | (54,022 | ) | OCI attributable to NCI | | | (24,624 | ) | | | (568 | ) | | | 33,661 | | Cash flows from operating activities | | | 134,973 | | | | 62,538 | | | | 119,264 | | Cash flows used in investing activities | | | (594,303 | ) | | | (328,610 | ) | | | (256,200 | ) | Cash flows from financing activites excluding dividends paid to NCI | | | 503,245 | | | | 285,898 | | | | 311,160 | | Dividends paid to NCI | | | - | | | | - | | | | (10,214 | ) | Effect of changes in the exchange rate on cash and cash equivalents | | | (7,435 | ) | | | (13,545 | ) | | | 6,717 | | Net increase/(decrease) in cash and cash equivalents | | | 36,480 | | | | 6,281 | | | | 170,727 | |
| | | As at and for the year ended December 31, | | | | | 2022 | | | 2021 | | | 2020 | | | | | OPC Energy Ltd. | | | OPC Energy Ltd. | | | OPC Energy Ltd. | | | | | $ Thousands | | | NCI percentage * | | | 56.20 | % | | | 53.14 | % | | | 39.09 | % | | Current assets | | | 419,636 | | | | 346,380 | | | | 693,913 | | | Non-current assets | | | 2,289,101 | | | | 2,141,744 | | | | 1,040,400 | | | Current liabilities | | | (184,418 | ) | | | (230,518 | ) | | | (221,975 | ) | | Non-current liabilities | | | (1,283,445 | ) | | | (1,341,962 | ) | | | (980,028 | ) | | Net assets | | | 1,240,874 | | | | 915,644 | | | | 532,310 | | | Carrying amount of NCI | | | 697,433 | | | | 486,598 | | | | 208,080 | | | | | | | | | | | | | | | | | | | | | | | | | | | | | | | Revenue | | | 573,957 | | | | 487,763 | | | | 385,625 | | | Profit/(loss) after tax | | | 65,352 | | | | (93,898 | ) | | | (12,583 | ) | | Other comprehensive income | | | (11,249 | ) | | | 74,219 | | | | (2,979 | ) | | Profit/(loss) attributable to NCI | | | 37,007 | | | | (54,022 | ) | | | (2,567 | ) | | OCI attributable to NCI | | | (568 | ) | | | 33,661 | | | | (616 | ) | | Cash flows from operating activities | | | 62,538 | | | | 119,264 | | | | 104,898 | | | Cash flows from investing activities | | | (328,610 | ) | | | (256,200 | ) | | | (643,942 | ) | | Cash flows from financing activites excluding dividends paid to NCI | | | 285,898 | | | | 311,160 | | | | 489,919 | | | Dividends paid to NCI | | | - | | | | (10,214 | ) | | | (12,412 | ) | | Effect of changes in the exchange rate on cash and cash equivalents | | | (13,545 | ) | | | 6,717 | | | | 12,566 | | | Net increase/(decrease) in cash and cash equivalents | | | 6,281 | | | | 170,727 | | | | (48,971 | ) |
* The NCI percentage represents the effective NCI of the Group Note 12 – Property, Plant and Equipment, Net | | | Roads,
buildings and
leasehold
improvements | | | Facilities,
machinery and
equipment | | | Wind turbines | | | Computers | | | Office
furniture and
equipment | | | Assets under
construction | | | Other | | | Total | | | Roads, buildings and leasehold improvements | | | Facilities, machinery and equipment | | | Wind turbines | | | Office furniture and equipment | | | Assets under construction | | | Other | | | Total | | | | | $ Thousands | | | $ Thousands | | Cost | | | | | | | | | | | | | | | | | | | | | | | | | | | | | | | | | Balance at January 1, 2021 | | 72,222 | | 763,828 | | - | | 763 | | 1,132 | | 127,116 | | 43,840 | | 1,008,901 | | | Additions | | 5,709 | | 2,527 | | 894 | | - | | 240 | | 252,096 | | 5,761 | | 267,227 | | | Disposals | | (453 | ) | | - | | (972 | ) | | - | | (150 | ) | | - | | (1,885 | ) | | (3,460 | ) | | Reclassification | | 2,242 | | - | | - | | (763 | ) | | (808 | ) | | - | | (671 | ) | | - | | | Acquisitions as part of a business | | 1,682 | | - | | 29,922 | | - | | - | | 18,990 | | - | | 50,594 | | | Differences in translation reserves | | | 2,554 | | | 25,920 | | | - | | | - | | | - | | | 11,578 | | | 1,097 | | | 41,149 | | | | | | | | | | | | | | | | | | | | | | | Balance at December 31, 2021 | | 83,956 | | 792,275 | | 29,844 | | - | | 414 | | 409,780 | | 48,142 | | 1,364,411 | | | Balance at January 1, 2022 | | | 83,956 | | 792,275 | | 29,844 | | 414 | | 409,780 | | 48,142 | | 1,364,411 | | Additions | | 3,442 | | 18,657 | | 191 | | - | | (8 | ) | | 185,938 | | 46,025 | | 254,245 | | | 3,442 | | 18,657 | | 191 | | (8 | ) | | 185,938 | | 46,025 | | 254,245 | | Disposals | | (160 | ) | | (13,007 | ) | | (43 | ) | | - | | - | | (1,969 | ) | | (12,769 | ) | | (27,948 | ) | | (160 | ) | | (13,007 | ) | | (43 | ) | | - | | (1,969 | ) | | (12,769 | ) | | (27,948 | ) | Reclassification | | - | | - | | - | | - | | - | | 3 | | (3 | ) | | - | | | - | | - | | - | | - | | 3 | | (3 | ) | | - | | Differences in translation reserves | | | (9,633 | ) | | | (75,558 | ) | | | - | | | - | | | - | | | (41,164 | ) | | | (6,016 | ) | | | (132,371 | ) | | | (9,633 | ) | | | (75,558 | ) | | | - | | | - | | | (41,164 | ) | | | (6,016 | ) | | | (132,371 | ) | | | | | | | | | | | | | | | | | | | | | | | | | | | | | | | | | | | Balance at December 31, 2022 | | | 77,605 | | | 722,367 | | | 29,992 | | | - | | | 406 | | | 552,588 | | | 75,379 | | | 1,458,337 | | | 77,605 | | 722,367 | | 29,992 | | 406 | | 552,588 | | 75,379 | | 1,458,337 | | | | | | | | | | | | | | | | | | | | | | Accumulated depreciation | | | | | | | | | | | | | | | | | | | Balance at January 1, 2021 | | 12,799 | | 175,633 | | - | | 511 | | 757 | | - | | 640 | | 190,340 | | | Additions | | 3,453 | | 36,620 | | 634 | | - | | 71 | | - | | - | | 40,778 | | | 2,915 | | 3,977 | | - | | 5 | | 269,502 | | 34,800 | | 311,199 | | Disposals | | (240 | ) | | - | | (71 | ) | | - | | (151 | ) | | - | | - | | (462 | ) | | (590 | ) | | (3,841 | ) | | - | | - | | (11,235 | ) | | (39,960 | ) | | (55,626 | ) | Reclassification | | 1,585 | | - | | - | | (511 | ) | | (434 | ) | | - | | (640 | ) | | - | | | 9,316 | | 334,132 | | 160,666 | | - | | (504,114 | ) | | - | | - | | Acquisitions through business combination | | | 23,667 | | 159,036 | | 126,200 | | - | | - | | 6,307 | | 315,210 | | Differences in translation reserves | | | 551 | | | 7,384 | | | - | | | - | | | - | | | - | | | - | | | 7,935 | | | | (1,584 | ) | | | (13,265 | ) | | | - | | | - | | | (16,371 | ) | | | (1,308 | ) | | | (32,528 | ) | | | | | | | | | | | | | | | | | | | | | | | | | | | | | | | | | | | Balance at December 31, 2021 | | 18,148 | | 219,637 | | 563 | | - | | 243 | | - | | - | | 238,591 | | | Balance at December 31, 2023 | | | | 111,329 | | | 1,202,406 | | | 316,858 | | | 411 | | | 290,370 | | | 75,218 | | | 1,996,592 | | | | | | | | | | | | | | | | | | | | Accumulated depreciation | | | | | | | | | | | | | | | | | Balance at January 1, 2022 | | | 18,148 | | 219,637 | | 563 | | 243 | | - | | - | | 238,591 | | Additions | | 3,864 | | 37,057 | | 1,109 | | - | | 80 | | - | | - | | 42,110 | | | 3,864 | | 37,057 | | 1,109 | | 80 | | - | | - | | 42,110 | | Disposals | | (10 | ) | | (13,007 | ) | | (21 | ) | | - | | (8 | ) | | - | | - | | (13,046 | ) | | (10 | ) | | (13,007 | ) | | (21 | ) | | (8 | ) | | - | | - | | (13,046 | ) | Differences in translation reserves | | | (3,557 | ) | | | (28,182 | ) | | | - | | | - | | | - | | | - | | | - | | | (31,739 | ) | | | (3,557 | ) | | | (28,182 | ) | | | - | | | - | | | - | | | - | | | (31,739 | ) | | | | | | | | | | | | | | | | | | | | | | | | | | | | | | | | | | | Balance at December 31, 2022 | | | 18,445 | | | 215,505 | | | 1,651 | | | - | | | 315 | | | - | | | - | | | 235,916 | | | 18,445 | | 215,505 | | 1,651 | | 315 | | - | | - | | 235,916 | | Additions | | | 3,993 | | 47,661 | | 5,007 | | 81 | | - | | - | | 56,742 | | Disposals | | | (235 | ) | | (4,426 | ) | | - | | - | | - | | - | | (4,661 | ) | Differences in translation reserves | | | | (471 | ) | | | (5,759 | ) | | | - | | | - | | | - | | | - | | | (6,230 | ) | | | | | | | | | | | | | | | | | | | Balance at December 31, 2023 | | | | 21,732 | | | 252,981 | | | 6,658 | | | 396 | | | - | | | - | | | 281,767 | | | | | | | | | | | | | | | | | | | | | | | | | | | | | | | | | | | | Carrying amounts | | | | | | | | | | | | | | | | | | | | | | | | | | | | | | | | | At January 1, 2021 | | | 59,423 | | | 588,195 | | | - | | | 252 | | | 375 | | | 127,116 | | | 43,200 | | | 818,561 | | | At December 31, 2021 | | | 65,808 | | | 572,638 | | | 29,281 | | | - | | | 171 | | | 409,780 | | | 48,142 | | | 1,125,820 | | | At January 1, 2022 | | | | 65,808 | | | 572,638 | | | 29,281 | | | 171 | | | 409,780 | | | 48,142 | | | 1,125,820 | | At December 31, 2022 | | | 59,160 | | | 506,862 | | | 28,341 | | | - | | | 91 | | | 552,588 | | | 75,379 | | | 1,222,421 | | | | 59,160 | | | 506,862 | | | 28,341 | | | 91 | | | 552,588 | | | 75,379 | | | 1,222,421 | | | At December 31, 2023 | | | | 89,597 | | | 949,425 | | | 310,200 | | | 15 | | | 290,370 | | | 75,218 | | | 1,714,825 | |
Note 12 – Property, Plant and Equipment, Net (Cont’d) | B. | The amount of borrowing costs capitalized in 20222023 was approximately $22 million (2022: $16 million (2021: $7 million). |
| C. | Fixed assets purchased on credit in 20222023 was approximately $31 million (2022: $47 million (2021: $39 million). |
| D. | The composition of depreciation expenses from continuing operations is as follows: | | |
| | | As at December 31, | | | As at December 31, | | | | | 2022 | | | 2021 | | | 2023 | | | 2022 | | | | | $ Thousands | | | $ Thousands | | Depreciation and amortization included in gross profit | | 56,853 | | 53,116 | | | 78,025 | | 56,853 | | Depreciation and amortization charged to selling, general and administrative expenses | | | 6,023 | | | 4,524 | | | | 12,914 | | | 6,023 | | Depreciation and amortization from continuing operations | | | 62,876 | | | 57,640 | | | | 90,939 | | | 62,876 | |
Note 13 – Intangible Assets, Net | | | Goodwill* | | | PPA** | | | Others | | | Total | | | | | $Thousands | | Cost | | | | | | | | | | | | | Balance as at January 1, 2021 | | | 21,596 | | | | - | | | | 2,372 | | | | 23,968 | | Acquisitions as part of business combinations | | | 118,458 | | | | 110,446 | | | | 3,410 | | | | 232,314 | | Additions | | | - | | | | - | | | | 1,451 | | | | 1,451 | | Translation differences | | | 158 | | | | - | | | | 237 | | | | 395 | | Balance as at December 31, 2021 | | | 140,212 | | | | 110,446 | | | | 7,470 | | | | 258,128 | | Additions | | | - | | | | - | | | | 10,799 | | | | 10,799 | | Translation differences | | | (1,599 | ) | | | - | | | | (1,316 | ) | | | (2,915 | ) | Balance as at December 31, 2022 | | | 138,613 | | | | 110,446 | | | | 16,953 | | | | 266,012 | | | | | | | | | | | | | | | | | | | | Amortization | | | | | | | | | | | | | | | | | Balance as at January 1, 2021 | | | 21,455 | | | | - | | | | 1,061 | | | | 22,516 | | Amortization for the year | | | - | | | | 10,947 | | | | 339 | | | | 11,286 | | Translation differences | | | - | | | | - | | | | 44 | | | | 44 | | Balance as at December 31, 2021 | | | 21,455 | | | | 10,947 | | | | 1,444 | | | | 33,846 | | Amortization for the year | | | - | | | | 10,569 | | | | 991 | | | | 11,560 | | Translation differences | | | - | | | | - | | | | (189 | ) | | | (189 | ) | Balance as at December 31, 2022 | | | 21,455 | | | | 21,516 | | | | 2,246 | | | | 45,217 | | | | | | | | | | | | | | | | | | | | Carrying value | | | | | | | | | | | | | | | | | As at January 1, 2021 | | | 141 | | | | - | | | | 1,311 | | | | 1,452 | | As at December 31, 2021 | | | 118,757 | | | | 99,499 | | | | 6,026 | | | | 224,282 | | As at December 31, 2022 | | | 117,158 | | | | 88,930 | | | | 14,707 | | | | 220,795 | |
| | | Goodwill* | | | PPA** | | | Others | | | Total | | | | | $ Thousands | | Cost | | | | | | | | | | | | | Balance as at January 1, 2022 | | | 140,212 | | | | 110,446 | | | | 7,470 | | | | 258,128 | | Additions | | | - | | | | - | | | | 10,799 | | | | 10,799 | | Translation differences | | | (1,599 | ) | | | - | | | | (1,316 | ) | | | (2,915 | ) | | | | | | | | | | | | | | | | | | | Balance as at December 31, 2022 | | | 138,613 | | | | 110,446 | | | | 16,953 | | | | 266,012 | | Additions | | | - | | | | - | | | | 13,738 | | | | 13,738 | | Acquisitions through business combination | | | 80,761 | | | | 25,968 | | | | - | | | | 106,729 | | Impairment | | | (6,196 | ) | | | - | | | | - | | | | (6,196 | ) | Translation differences | | | 559 | | | | - | | | | (225 | ) | | | 334 | | | | | | | | | | | | | | | | | | | | Balance as at December 31, 2023 | | | 213,737 | | | | 136,414 | | | | 30,466 | | | | 380,617 | | | | | | | | | | | | | | | | | | | | Amortization | | | | | | | | | | | | | | | | | Balance as at January 1, 2022 | | | 21,455 | | | | 10,947 | | | | 1,444 | | | | 33,846 | | Amortization for the year | | | - | | | | 10,569 | | | | 991 | | | | 11,560 | | Translation differences | | | - | | | | - | | | | (189 | ) | | | (189 | ) | | | | | | | | | | | | | | | | | | | Balance as at December 31, 2022 | | | 21,455 | | | | 21,516 | | | | 2,246 | | | | 45,217 | | Amortization for the year | | | - | | | | 11,115 | | | | 3,036 | | | | 14,151 | | Translation differences | | | - | | | | - | | | | (35 | ) | | | (35 | ) | | | | | | | | | | | | | | | | | | | Balance as at December 31, 2023 | | | 21,455 | | | | 32,631 | | | | 5,247 | | | | 59,333 | | | | | | | | | | | | | | | | | | | | Carrying value | | | | | | | | | | | | | | | | | As at January 1, 2022 | | | 118,757 | | | | 99,499 | | | | 6,026 | | | | 224,282 | | As at December 31, 2022 | | | 117,158 | | | | 88,930 | | | | 14,707 | | | | 220,795 | | As at December 31, 2023 | | | 192,282 | | | | 103,783 | | | | 25,219 | | | | 321,284 | |
| * | Relates mainly to goodwill arising from the acquisition of CPV Group and Gnrgy of $105 million and $14 million respectively. Gat Power Plants of $61 million. Refer to Note 11.A.411.A.5 for further information. |
| **
| Relates to the power purchase agreement from the acquisition of CPV Keenan, which is part of the CPV Group.
|
** Relates to the power purchase agreement from the acquisition of CPV Keenan, which is part of the CPV Group. Note 13 – Intangible Assets, Net (Cont’d) | B. | The total carrying amounts of intangible assets with a finite useful life and with an indefinite useful life or not yet available for use |
| | | As at December 31, | | | As at December 31, | | | | | 2022 | | | 2021 | | | 2023 | | 2022 | | | | | $ Thousands | | | $ Thousands | | Intangible assets with a finite useful life | | 103,637 | | 105,525 | | | 128,998 | | 103,637 | | Intangible assets with an indefinite useful life or not yet available for use | | | 117,158 | | | 118,757 | | | | 192,286 | | | 117,158 | | | | | | 220,795 | | | 224,282 | | | | 321,284 | | | 220,795 | |
| C. | ImpairmentImpairment testing of goodwill arising from acquisition of CPV Group
|
As part of the acquisition of the CPV Group as described in Note 11.A.4,11.A.5, on the acquisition date, OPC recognized goodwill of $105 million, which reflects the future growth potential of the CPV Group’s operations. In 2022, OPC reallocated the goodwill to the renewable energies segment in the United States, since it believes that this allocation reflects fairly the nature of the goodwill that had arisen from the acquisition., especially through renewable energy, which OPC recognizes as a cash-generating unit. In 2023, subsequent to the acquisition of mountain wind power plant as detailed in Note 11.6, the goodwill assigned to the renewable energies segment in the United States has been increased to $126 million. OPC conducted an impairment test as of December 31, 2022.2023 for the goodwill recognized as part of the acquisition of CPV Group as well as acquisition of Mountain Wind Power Plant as detailed in Note 11.6. OPC has considered the report from a qualified external valuer regarding the recoverable amount of the cash-generating unit based on discounted expected future cash flows providedFVLCOD, estimated by OPC.an independent external appraiser. Projects under commercial operation and projects under construction were estimated by discounting expected future cash flows before tax by applying the discount rate, which is represented by the weighted average cost of capital (“WACC”) after tax. Projects under development were estimated at cost. Below are the main assumptions used in the valuation: | | 1. | Forecast years - represents the period spanning from January 1, 20232024 to December 31, 2054, based on the estimate of the economic life of the power plants and their value as at the end of the forecast period. |
| | 2. | Market prices and capacity - market prices (electricity, gas, capacity, RECs, etc.) were provided by anare based on PPAs and market forecasts received from external and independent appraiser, the cash flow forecasts were made for each power plant separately,information sources, taking into account the relevant electricityarea and market (NYISO, ISO-NE, PJM and SPP)for each project and the relevant regulation. |
| | 3. | Estimated construction costs of the projects, and entitlement to tax benefits in respect of projects under construction (ITC or production tax credit, as applicable). |
| 4. | The annual long-term inflation rate of 2.3%2.2% equals the derived 10-year inflation rate as of the estimate date. |
| | 4.5. | The WACC - calculated for each material project separately, and ranges between 6.75%6% (project with agreementsPPAs for sale of the entire capacity) and 8%7.25%. |
OPC used a relevant discount rate reflecting the specific risks associated with the future cash flow of a cash-generating unit. As of December 31, 2022,2023, the recoverable amount of the cash-generating unit of the CPV Group, which is relating to the renewable energies segment in the United States exceeds its book value and therefore, no impairment has been recognized for them.recognized. The fair value measurement was classified at Level 3 due to the use of input that is not based on observable market inputs in the assessment model. As of the report date, in accordance with management'smanagement’s assessments regarding future industry trends, which are based on external and internal sources, OPC has not identified any key assumptions in which possible likely changes may occur, which would cause the CPV Group'sGroup’s recoverable amount to decrease below its carrying amount. | D. | ImpairmentImpairment testing of goodwill arising from acquisition of GnrgyGat Power Plant
|
As of December 31, 2023, goodwill of $61 million, which arose as part of the acquisition of Gnrgy in December 2021, as set out in Note 11.A.1.e, OPC recognized goodwill totaling $14 million, whichthe Gat Power Plant reflects the potential of futuresynergy between the activities of Gnrgythe power plants in the market in which it operates.Israel, whose business model is based on sale to private customers (OPC Rotem, OPC Hadera and Gat Power Plant). The annual impairment testing of goodwill as of December 31, 2023, was carried out at the level of the cash-generating unit comprising the three power plants (hereinafter - the “Cash-Generating Unit”), since this is the lowest level at which goodwill is subject to monitoring for internal reporting purposes. Note 13 – Intangible Assets, Net (Cont’d) The recoverable amount of the Cash-Generating Unit is determined as follows: | 1. | For the OPC Rotem Power Plant - based on fair value less cost to sell |
| 2. | For the OPC Hadera and Gat Power Plant - according to their carrying amounts |
Set forth below are the key assumptions used in determining OPC Rotem’s fair value: | 1. | EBITDA for 2023 at of NIS 391 million (approximately $108 million) |
| 2. | An EV/EBITDA multiple of 11.4, based on the OPC’s experience in transactions carried out in the Israeli market in the field of power plants. |
The fair value measurement was classified at Level 3 due to the use of significant input that is not based on observable market inputs in the valuation model. As of December 31, 2022,2023, the Company conducted annual impairment testing in accordance with the provisions of IAS 36. The recoverable amount of Gnrgy’s activity, which represents the lowest level in which goodwill is monitored, was set using the fair value method, net of costs to sell, based on discounting expected future cash flows. As of December 31, 2022, Gnrgy’s recoverable amountCash-Generating Unit exceeds its carrying amount,book value and therefore, no impairment loss was recognized in respect of goodwill. As of the report date, in accordance with management’s assessments,has been recognized. OPC determines that a potential reasonable change in the key assumptions used to determinein determining the recoverable amount willof the Cash-Generating Unit as of December 31, 2023, would not causehave caused a recognition of anmaterial impairment loss in respect of goodwill.loss.
Note 14 – Long-Term Prepaid Expenses and Other Non-Current Assets | | | As at December 31, | | | As at December 31, | | | | | 2022 | | | 2021 | | | 2023 | | 2022 | | | | | $ Thousands | | | $ Thousands | | Deferred expenses, net (1) | | 32,840 | | 42,840 | | | 7,786 | | 5,349 | * | Loan to associated company (2) | | | 30,138 | | 5,100 | | Contract costs | | 4,337 | | 5,119 | | | 6,347 | | 4,337 | | Other non-current assets | | | 13,637 | | | 9,307 | | | | 8,071 | | | 8,537 | | | | | | 50,814 | | | 57,266 | | | | 52,342 | | | 23,323 | * |
| (1) | Relates to deferred expenses, net for OPC’s connection fees to the gas transmission network and the electricity grid. |
| (2) | Mainly relates to loan to CPV Valley with SOFR-based interest plus a weighted average interest margin of approximately 5.75%, with the final repayment date on May 31, 2026. |
Note 15 – Loans and Debentures FollowingThe following are the contractual conditions of the Group’s interest-bearing loans and credit, which are measured based on amortized cost. Additional information regarding the Group’s exposure to interest risks, foreign currency and liquidity risk is provided in Note 29,28, in connection with financial instruments.
| | | As at December 31 | | | | | 2023 | | | 2022 | | | | | $ Thousands | | Current liabilities | | | | | | | Current maturities of long-term liabilities: | | | | | | | Loans from banks and others | | | 107,739 | | | | 26,113 | | Non-convertible debentures | | | 52,980 | | | | 9,497 | | Others | | | 8,908 | | | | 3,652 | | | | | | 169,627 | | | | 39,262 | | | | | | | | | | | | Non-current liabilities | | | | | | | | | Loans from banks and others | | | 906,243 | | | | 610,434 | | Non-convertible debentures | | | 454,163 | | | | 513,375 | | | | | | 1,360,406 | | | | 1,123,809 | | | | | | | | | | | | Total | | | 1,530,033 | | | | 1,163,071 | |
| | | As at December 31 | | | | | 2022 | | | 2021 | | | | | $ Thousands | | Current liabilities | | | | | | | Current maturities of long-term liabilities: | | | | | | | Loans from banks and others | | | 26,113 | | | | 21,861 | | Non-convertible debentures | | | 9,497 | | | | 7,125 | | Others | | | 3,652 | | | | 9,325 | | | | | | 39,262 | | | | 38,311 | | | | | | | | | | | | Non-current liabilities | | | | | | | | | Loans from banks and others | | | 610,434 | | | | 596,489 | | Non-convertible debentures | | | 513,375 | | | | 575,314 | | | | | | 1,123,809 | | | | 1,171,803 | | | | | | | | | | | | Total | | | 1,163,071 | | | | 1,210,114 | |
Note 15 – Loans and Debentures (Cont’d) A.1 | Classification based on currencies and interest rates | | |
| | | As at December 31, | | | | | 2023 | | | 2022 | | | | | $ Thousands | | Debentures (1) | | | | | | | In shekels(1) | | | 507,143 | | | | 522,872 | | | | | | | | | | | | Loans from banks and others (2) | | | | | | | | | In shekels | | | 1,022,890 | | | | 640,199 | | | | | | | | | | | | | | | | 1,530,033 | | | | 1,163,071 | |
| 1. | Annual interest rates between 2.5% to 2.75%. |
| 2. | Hadera: Annual interest between 2.4% to 3.9% (for the linked loans) and between 3.6% to 5.4% (for the unlinked loans); Tzomet: Annual interest of prime plus 0.55%; and Gat: Annual interest of prime interest plus spread between 0.4% to 0.9%. |
| | | Weighted-
average
interest rate
December 31 | | | As at December 31, | | | | | 2022 | | | 2022 | | | 2021 | | | | | % | | | $Thousands | | | | | | | | | | | | | Debentures | | | | | | | | | | In shekels | | | 2.50% - 2.75 | % | | | 522,872 | | | | 582,439 | | | | | | | | | | | | | | | | Loans from banks and others | | | | | | | | | | | | | In shekels | | | 2.40% - 5.40 | % | | | 640,199 | | | | 627,675 | | | | | | | | | | | | | | | | | | | | | | | | 1,163,071 | | | | 1,210,114 | |
| As of December 31, 2023 and 2022, all loans and debentures relate to liabilities incurred by OPC and its subsidiaries. |
As at December 31, 2022 and December 31, 2021, all loans and debentures relate to liabilities incurred by OPC and its subsidiaries.
A.2 | Reconciliation of movements of liabilities to cash flows arising from financing activities | | |
| | | Financial liabilities (including interest payable) | | | | | Loans and credit | | | Loans from holders of interests that do not confer financial control | | | Debentures | | | Financial instruments designated for hedging | | | | | $ Thousands | | | | | | | | | | | | | | | | Balance as at January 1, 2023 | | | 516,195 | | | | 124,152 | | | | 526,771 | | | | (16,087 | ) | Changes as a result of cash flows from financing activities | | | | | | | | | | | | | | | | | Payment in respect of derivative financial instruments, net | | | - | | | | - | | | | - | | | | 2,385 | | Receipt of loans | | | 405,460 | | | | 30,357 | | | | - | | | | - | | Repayment of debentures and loans | | | (123,237 | ) | | | (33,389 | ) | | | (8,451 | ) | | | - | | Interest paid | | | (30,270 | ) | | | (593 | ) | | | (6,133 | ) | | | - | | | | | | | | | | | | | | | | | | | | Net cash provided by/(used in) financing activities | | | 251,953 | | | | (3,625 | ) | | | (14,584 | ) | | | 2,385 | | | | | | | | | | | | | | | | | | | | Effect of changes in foreign currency exchange rates | | | (533 | ) | | | 2,218 | | | | - | | | | (241 | ) | Interest and CPI expenses | | | 51,180 | | | | 7,179 | | | | 21,658 | | | | (3,027 | ) | Changes in fair value, application of hedge accounting and other | | | 10,179 | | | | (463 | ) | | | (7,061 | ) | | | 2,065 | | Business combination | | | 83,385 | | | | - | | | | - | | | | - | | | | | | | | | | | | | | | | | | | | Balance as at December 31, 2023 | | | 912,359 | | | | 129,461 | | | | 526,784 | | | | (14,905 | ) |
| | | Financial liabilities (including interest payable) | | | | | Loans and
credit | | | Loans from
holders of
interests that
do not confer
financial control | | | Debentures | | | Financial
instruments
designated for
hedging | | | | | $ Thousands | | | | | | | | | | | | | | | | Balance as at January 1, 2022 | | | 488,455 | | | | 139,838 | | | | 586,600 | | | | (8,305 | ) | Changes as a result of cash flows from financing activities | | | | | | | | | | | | | | | | | Payment in respect of derivative financial instruments, net | | | - | | | | - | | | | - | | | | (923 | ) | Receipt of loans | | | 88,651 | | | | 13,680 | | | | - | | | | - | | Repayment of debentures and loans | | | (21,601 | ) | | | (25,617 | ) | | | (5,972 | ) | | | - | | Interest paid | | | (11,058 | ) | | | (2,094 | ) | | | (11,889 | ) | | | - | | Prepaid costs for loans taken | | | (2,845 | ) | | | - | | | | - | | | | - | | | | | | | | | | | | | | | | | | | | Net cash provided by/(used in) financing activities | | | 53,147 | | | | (14,031 | ) | | | (17,861 | ) | | | (923 | ) | | | | | | | | | | | | | | | | | | | Effect of changes in foreign currency exchange rates | | | (51,435 | ) | | | (8,419 | ) | | | (68,696 | ) | | | 967 | | Interest and CPI expenses | | | 27,444 | | | | 6,764 | | | | 26,728 | | | | - | | Changes in fair value, application of hedge accounting and other | | | (1,416 | ) | | | - | | | | - | | | | (7,826 | ) | | | | | | | | | | | | | | | | | | | Balance as at December 31, 2022 | | | 516,195 | | | | 124,152 | | | | 526,771 | | | | (16,087 | ) |
Note 15 – Loans and Debentures (Cont’d) | | | Financial liabilities (including interest payable) | | | | | Loans and
credit | | | Loans from
holders of
interests that
do not confer
financial control | | | Debentures | | | Financial
instruments
designated for
hedging | | | | | $ Thousands | | | | | | | | | | | | | | | | Balance as at January 1, 2021 | | | 615,403 | | | | 439 | | | | 304,701 | | | | 11,014 | | Changes as a result of cash flows from financing activities | | | | | | | | | | | | | | | | | Payment in respect of derivative financial instruments | | | - | | | | - | | | | - | | | | (13,933 | ) | Proceeds from issuance of debentures
less issuance expenses | | | - | | | | - | | | | 262,750 | | | | - | | Receipt of long-term loans from banks | | | 211,738 | | | | 131,388 | | | | - | | | | - | | Repayment of loans, debentures and lease liabilities | | | (601,474 | ) | | | - | | | | (5,876 | ) | | | - | | Interest paid | | | (25,095 | ) | | | - | | | | (6,093 | ) | | | - | | Costs paid in advance in respect of taking out loans | | | (4,991 | ) | | | - | | | | - | | | | - | | Net cash (used in)/provided by financing activities | | | (419,822 | ) | | | 131,388 | | | | 250,781 | | | | (13,933 | ) | | | | | | | | | | | | | | | | | | | Changes due to gain of control in subsidiaries | | | 172,163 | | | | - | | | | - | | | | 12,176 | | Effect of changes in foreign exchange rates | | | 10,820 | | | | 2,497 | | | | 17,993 | | | | (487 | ) | Changes in fair value | | | - | | | | - | | | | - | | | | (13,726 | ) | Interest in the period | | | 38,803 | | | | 4,275 | | | | 13,125 | | | | - | | Other changes and additions during the year | | | 71,088 | | | | 1,239 | | | | - | | | | (3,349 | ) | Balance as at December 31, 2021 | | | 488,455 | | | | 139,838 | | | | 586,600 | | | | (8,305 | ) |
| | | Financial liabilities (including interest payable) | | | | | Loans and credit | | | Loans from holders of interests that do not confer financial control | | | Debentures | | | Financial instruments designated for hedging | | | | | $ Thousands | | | | | | | | | | | | | | | | Balance as at January 1, 2022 | | | 488,455 | | | | 139,838 | | | | 586,600 | | | | (8,305 | ) | Changes as a result of cash flows from financing activities | | | | | | | | | | | | | | | | | Payment in respect of derivative financial instruments, net | | | - | | | | - | | | | - | | | | (923 | ) | Receipt of loans | | | 88,651 | | | | 13,680 | | | | - | | | | - | | Repayment of debentures and loans | | | (21,601 | ) | | | (25,617 | ) | | | (5,972 | ) | | | - | | Interest paid | | | (11,058 | ) | | | (2,094 | ) | | | (11,889 | ) | | | - | | Prepaid costs for loans taken | | | (2,845 | ) | | | - | | | | - | | | | - | | | | | | | | | | | | | | | | | | | | Net cash provided by/(used in) financing activities | | | 53,147 | | | | (14,031 | ) | | | (17,861 | ) | | | (923 | ) | | | | | | | | | | | | | | | | | | | Effect of changes in foreign currency exchange rates | | | (51,435 | ) | | | (8,419 | ) | | | (68,696 | ) | | | 967 | | Interest and CPI expenses | | | 27,444 | | | | 6,764 | | | | 26,728 | | | | - | | Changes in fair value, application of hedge accounting and other | | | (1,416 | ) | | | - | | | | - | | | | (7,826 | ) | | | | | | | | | | | | | | | | | | | Balance as at December 31, 2022 | | | 516,195 | | | | 124,152 | | | | 526,771 | | | | (16,087 | ) |
| 1. | Long-term loans from banks and others |
B.A. | OPC RotemGat Financing Agreement
|
OPC RotemIn March 2023, the Gat Partnership and Bank Leumi le-Israel B.M. (“Bank Leumi”) signed a financing agreement for a senior debt (project financing) to finance the construction of the Gat Power Plant. As part of the financing agreement, Bank Leumi advanced to the Gat Partnership a long-term loan at the total amount of NIS 450 million (approximately $128 million). The loan will be repaid in quarterly installments, starting from September 25, 2023, and the final repayment date is May 10, 2039 (subject to the stipulated early repayment provisions).
The loan will bear an annual interest equal to the Prime interest adjusted by a spread ranging from 0.4% to 0.9% per annum. The Gat Financing Agreement contains provisions on converting the interest on the said loan from a variable interest to a fixed and unlinked interest. The loan will bear the unlinked government bond interest, as defined in the agreement, adjusted by a 2.05% to 2.55% spread.
To secure the Gat Financing Agreement, there are collateral on all of the Gat Partnership’s assets and rights in it, including the real estate, bank accounts, insurances, the Gat Partnership’s assets and rights in connection with the Project Agreements (as defined in the agreement). In addition, a lien was placed on the rights of the entities holding the Gat Partnership. On the Completion Date, OPC and Veridis, each in accordance with its proportionate (indirect) share in the Gat Partnership, as well as OPC Power Plants, made a guarantee to pay all principal and accrued interest payments, in connection with the completion of the registration of the collateral and the payment of the deferred consideration balance under the circumstances and subject to the terms set in the said letter of guarantee. Distributions by the Gat Partnership is subject to a number of conditions described in the said loan agreement, including, among other things: compliance with the following financial covenants: Historic debt service coverage ratio (“DSCR”) and Average Projected DSCR and loan life coverage ratio at a minimal rate of 1.15, a first quarterly principal and interest payment will be made, the provisions of the agreement will be complied with, and no more than four distributions will be carried out in a 12-month period. Note 15 – Loans and Debentures (Cont’d) In March 2023, the Gat Partnership, the entities holding the Gat Partnership, including OPC Power Plants, and Bank Leumi signed an equity subscription agreement, under which the said entities and OPC Power Plants made certain undertakings (debt service and equity capital requirements, guarantees, meeting certain financial covenants) toward Bank Leumi in connection with the Gat Partnership's activity. | B. | OPC Rotem financing agreement |
The power plant project of OPC Rotem was financed by the project financing method (hereinafter – “Rotem Financing Agreement”) with a consortium of lenders led by Bank Leumi Le-Israel Ltd. (hereinafter respectively – “Rotem’s Lenders” and “Bank Leumi”). In October 2021, the early repayment of the full outstanding balance of OPC Rotem’s project financing of amount NIS 1,292 million (approximately $400 million) (including early repayment fees as described below) was completed. A debt service reserve and restricted cash of amount NIS 125 million (approximately $39 million) were also released. As part of the early repayment, OPC Rotem recognized a one-off expense totaling NIS 244 million (approximately $75 million) in 2021, in respect of an early repayment fee of approximately NIS 188 million (approximately $58 million), net of tax. In proportion to their interests in OPC Rotem, OPC and Veridis extended to OPC Rotem loans for the financing of the early repayment of amounts NIS 904 million (approximately $291 million) and NIS 226 million (approximately $72 million), respectively, totaling NIS 1,130 million (approximately $363 million) (hereinafter - the “Shareholders’ Loans”). The Shareholders'Shareholders’ Loans bear annual interest at the higher of 2.65% or interest in accordance with Section 3(J) of the Israel Income Tax Ordinance, whichever is higher. The Shareholders’ Loans shall be repaid in quarterly unequal payments in accordance with the mechanism set in the Shareholders’ Loans agreement, and in any case no later than October 2031. A significant portion of OPC’s portion of NIS 904 million (approximately $280 million), was funded by the issuance of Series C debentures as described in Note 15.2.A.15.2.B. Note 15 – Loans and Debentures (Cont’d)
| C. | OPC Haderafinancing agreement |
Hadera financing agreement
In July 2016, Hadera entered into a financing agreement for the senior debt (hereinafter – “the Hadera Financing Agreement”) with a consortium of lenders (hereinafter – “Hadera’s Lenders”), headed by Israel Discount Bank Ltd. (hereinafter – “Bank Discount”) and Harel Insurance Company Ltd. (hereinafter – “Harel”) to finance the construction of the Hadera Power Plant, whereby the lenders undertook to provide Hadera credit facilities, mostly linked to the CPI, in the amount of NIS 1,006 million (approximately $323 million) in several facilities (some of which are alternates): (1) a long‑term credit facility (including a facility for changes in construction and related costs); (2) a working capital facility; (3) a debt service reserves account and a VAT facility; (4) a guarantees facility; and (5) a hedge facility. Some of the loans in the Hadera Financing Agreement are linked to the CPI and some are unlinked. The loans bear interest rates between 2.4% and 3.9% on the CPI-linked loans, and between 3.6% and 5.4% on the unlinked loans, and are repaid in quarterly installments up to 2037 and commenced from the first quarter of 2020. In addition, OPC Hadera undertook, commencing from the commercial operation date, to provide a debt service reserve in an amount equal to the amount of the debt payments for two successive quarters (as atof December 31, 2021, NIS 30 million (approximately $10 million)), and an owner’s guarantee fund of NIS 15 million (approximately $5 million). As at December 31, 2022, OPC Hadera and OPC were in compliance with all of the covenants pursuant to the Hadera Financing Agreement. OPC Hadera has a guarantee facility in the amount of NIS 60 million (approximately $17 million) [2021: NIS 60 million (approximately $19 million of which NIS 26 million (approximately $7 million)] [2021: NIS 26 million (approximately $8 million)] has been used, a hedge facility in the amount of NIS 68 million (approximately $19 million) [2021: NIS 68 million (approximately $22 million)] (of which an insignificant amount has been used), and a working capital facility of NIS 30 million (approximately $9 million) [2021: NIS 30 million (approximately $10 million)] which has not been used.
| D. | OPC Tzomet financing agreement |
Tzomet financing agreement
In December 2019, a financing agreement for the senior debt (project financing) was signed between OPC Tzomet and a syndicate of financing entities led by Bank Hapoalim Ltd. (hereinafter – “Bank Hapoalim”, and together with the other financing entities hereinafter – “Tzomet’s Lenders”), to finance construction of the Tzomet power plant (hereinafter – “Tzomet Financing Agreement”). Under the Tzomet Financing Agreement, Tzomet’s Lenders undertook to provide OPC Tzomet a long‑term loan facility, a standby facility, a working capital facility, a debt service reserve, a VAT facility, third‑party guarantees and a hedge facility, in the aggregate amount of NIS 1.372 billion1,372 million (approximately $441 million). Part of the amounts under these facilities will be CPI-linked and part of the amounts will be USD-linked. The loans accrue interest at the rates set out in the Tzomet Financing Agreement. Note 15 – Loans and Debentures (Cont’d) As part of the Tzomet Financing Agreement, terms were provided with reference to conversion of interest on the long-term loans from variable interest to CPI linked interest. Such a conversion will take place in three cases: (a) automatically at the end of 6 years after the signing date of the Tzomet Financing Agreement; (b) at OPC Tzomet’s request during the first 6 years commencing from the signing date of the Tzomet Financing Agreement; (c) at Bank Hapoalim’s request, in certain cases, during the first 6 years commencing from the signing date of the Tzomet Financing Agreement. In addition, OPC Tzomet has the right to make early repayment of the loans within 6 years after the signing date of the Tzomet Financing Agreement, subject to a one time reduced payment (and without payment of an early repayment penalty), and provided that up to the time of the early repayment, the loans were not converted into loans bearing fixed interest linked to the CPI. The Tzomet Financing Agreement also includes certain restrictions with respect to distributions and repayment of shareholders’ loans. As atof December 31, 2022,2023, OPC Tzomet and OPC were in compliance with all the covenants in accordance with the Tzomet Financing Agreement. The loans are to be repaid quarterly, which will begin shortly before the end of the first or second quarter after the commencement date of the commercial operation up to the date of the final payment, which will take place on the earlier of the end of 19 years from the commencement date of the commercial operation or 23 years from the signing date of the Tzomet Financing Agreement (however not later than December 31, 2042). Note 15 – Loans and Debentures (Cont’d)
OPC Tzomet equity subscription agreement
In December 2019, an equity subscription agreement (hereinafter – “Tzomet’s Equity Subscription Agreement”) was signed. As part of the said agreement, OPC undertook certain commitments to the Lenders in connection with OPC Tzomet and its activities, including investment of shareholders’ equity in OPC Tzomet of about NIS 293 million (approximately $94 million). As at December 31, 2021, OPC had provided OPC Tzomet with the amount of equity that it had undertaken.
| E. | OPCCPV Keenan financing agreement
|
Short-term loans
As at December 31, 2022, OPC has a facility agreement for short-term credit loans of up to three years of NIS 300 million (approximately $85 million), of which NIS 100 million (approximately $28 million) is taken from Bank Mizrahi Tafahot Ltd. (“Bank Mizrahi”), a related party of the Group. The facility bore interest at the annual rate of prime plus 2% to 3%. At December 31, 2022, the unutilized credit facility was NIS 290 million (approximately $82 million).
Hedge agreement
In June 2019, OPC entered into a hedge agreement with Bank Hapoalim Ltd. for hedge of 80% of the exposure to the CPI with respect to the principal of loans from financial institutions, in exchange for payment of additional interest at the annual rate of between 1.7% and 1.76% (hereinafter – “the CPI Transactions”). OPC chose to designate the CPI Transactions as an “accounting hedge”.
In 2020 and 2021, due to changes in the inflationary expectations and in light of the changes in the projected interest rates, OPC recorded an increase in the assets and liabilities, respectively, following revaluation of the financial derivative in respect of the CPI Transactions (hereinafter – “the Derivative”), in the amount of NIS 43 (approximately $13 million) million and NIS 42 million (approximately $13 million), respectively, which was recorded as part of other comprehensive income. OPC deposits collaterals to secure its loans from the bank in connection with the Derivative. The value of the Derivative was calculated by means of discounting the linked shekel cash flows expected to be received less the discounted fixed shekel cash flows payable. An adjustment was made to this valuation for the credit risks of the parties.
Keenan financing agreement
In August 2021, CPV Keenan and a number of financial entities entered into a $120 million financing agreement (hereinafter - the “Keenan Financing Agreement”). Concurrently with the closing, comprising a loan of the Keenan Financing Agreement, CPV Keenan repaid its former financing agreement entered into in 2014 (as of the repayment date, the outstanding principal was approximately $67NIS 335 million (approximately $104 million). No financial penalties were imposed on the early repayment of the former financing agreement. The previous annual interest rate was LIBOR plus a 2.25%-2.75% spread on the Term Loan, and a 1% spread on the ancillary credit facilities.facilities (working capital and letters of credit) of approximately NIS 52 million (approximately $16 million). The loan and the ancillary credit facilities in the Keenan Financing Agreement shall be repaid in installments over the term of the agreement; the final repayment date is December 31, 2030. The loan and the ancillary credit facilities in the Keenan Financing Agreement shall carry an annual interest of LIBORSOFR + 1.28%. (LIBOR + 1% to- 1.375% through July 2023). As part of the Keenan Financing Agreement, collateral and pledges on the project's assets held by CPV Keenan were provided in favor of the lenders. It should be noted that the Keenan Financing Agreement includes, among other things, and as customary in agreements of this type, provisions regarding mandatory prepayments, fees in respect of credit facilities, annual fees relating to the issuance of LC and additional customary terms and conditions, including hedging of the base interest rate in respect ofGroup hedged approximately 70% of its exposure to changes in the loan.SOFR interest through an interest swap, that was designated to hedge an accounting cash flow with the weighted interest of approximately 3.37%.
As at December 31, 2022, CPV Keenan utilized NIS 47 million ($13 million) of the said credit facilities.
Note 15 – Loans and Debentures (Cont’d)
As part of the Keenan Financing Agreement, collateral and pledges on the project'sproject’s assets held by CPV Keenan were provided in favor of the lenders. The Keenan Financing Agreement includes a number of restrictions, such as compliance with a minimum debt service coverage ratio of 1.15 during the 4 quarters that preceded the distribution, and a condition whereby no grounds for repayment or breach event exists (as defined in the financing agreement). The Keenan Financing Agreement includes grounds for calling for immediate repayment as customary in agreements of this type, including, among others – breach of representations and covenants that have a material adverse effect, non-payment events, non-compliance with certain obligations, various insolvency events, termination of the activities of the project or termination of significant parties in the project (as defined in the agreement), occurrence of certain events relating to the regulatory status of the project and maintaining of government approvals, certain changes in the project’s ownership, certain events in connection with the project, existence of legal proceedings relating to the project, and a situation wherein the project is not entitled to receive payments for electricity – all in accordance with and subject to the terms and conditions, definitions and cure periods detailed in the financing agreement. Completion of the Keenan Financing Agreement generated the CPV Group approximately $26 million in cash (after making payments in respect of: repayment of CPV Keenan's previous outstanding loan balance, transaction costs, early closing of an interest rate hedging transaction of approximately $11 million, and additional costs). Similarly, in light of the repayment of CPV Keenan’s previous financing, in the reporting period, the Group recognized a gain on derecognition of financial liability of $3 million under Financing income.
G.F. | OPC PowerMountain Wind Financing Agreement
|
Shareholder loansOn April 6, 2023, a CPV Group and a banking corporation entered into a financing agreement that includes: (1) a term loan of $75 million that was used to fund part of the purchase consideration of the Mountain Wind Project (hereinafter - the “Loan”); and (2) ancillary credit facilities for working capital of $17 million for the current credit needs of the Mountain Wind Project (hereinafter jointly with the Loan - the “Credit Facilities”).
In 2021,The Loan and Credit Facilities was pledged on the assets of the Mountain Wind Project and its rights and has a term of 5 years. The Loan bears annual interest of SOFR plus a fixed margin and a variable margin of between 1.63% and 1.75% over the term of the loan, of which the interest will be paid at least every quarter. CPV Group hedged the exposure to changes in variable SOFR interest by entering into an interest rate swap in respect of 75% of the balance of the Loan and opted to apply cash flow hedge accounting rules. The weighted interest as of the report date is approximately 5.4%.
Note 15 – Loans and Debentures (Cont’d) | G. | Financing Agreement for Construction in the US Renewable Energies Segment |
On August 24, 2023, certain entities in CPV group have entered into a financing agreement of $370 million for the purpose of financing the construction and initial operating period of qualifying projects in the field of renewable energy in the United States, of which a total of approximately $59 million were withdrawn by CPV Group as at December 31, 2023. Subsequent to the reporting period, an additional drawdown of approximately $93 million were withdrawn by CPV Group. CPV Group hedged the exposure to changes in variable SOFR interest by entering into an interest rate swap in respect of 75% of the balance of the loan and opted to apply cash flow hedge accounting rules. H. | OPC Power – Shareholder Loans |
During the reporting period, OPC (through a wholly-owned subsidiary) and non-controlling interests provided loans toinvested in the equity of the partnership OPC Power (both directly and indirectly) a total of approximately NIS 565 million (approximately $150 million) and extended by approximately NIS 175 million (approximately $45 million) in loans, based on their stake in the amounts of $143 million and $61 million, respectively. In 2022, OPC (through a wholly owned subsidiary) and non-controlling interests provided additional loans to OPC Power in the amounts of $27 million and $11 million, respectively.partnership. The loans are denominated in US Dollars and bear an annual interest at a rate of 7%. The loan principal will be repayable at any time as will be agreed on between the parties, but no later than January 2028. Accrued interestAfter utilizing the entire investment commitment and shareholder loans in July 2023, the facility was increased by $100 million (OPC’s share in the facility is payable on a quarterly basis. To the extent that payment made by OPC Power is lower than the amount of the accrued interest, payment in respect of the balance will be postponed to the following quarter – but not later than January 2028.$70 million). Series B Debentures
In April 2020, OPC issued debentures (Series B) with a par value of NIS 400 million (approximately $113 million), which were listed on the TASE. As a result, approximately $111 million representing the par value, net of issuance cost is recognized as debentures. The debentures are linked to the Israeli consumer price index and bear annual interest at the rate of 2.75%. The principal and interest of the debentures (Series B) are repayable every six months, commencing on March 31, 2021 (on March 31 and September 30 of every calendar year) through September 30, 2028. In October 2020, OPC issued additional Series B debentures of par value NIS 556 million (approximately $162 million) (the “Expansion of Series B”). The gross proceeds of the issuance amount to approximately NIS 584 million (approximately $171 million) and the issuance costs were approximately NIS 7 million (approximately $2 million). A trust certificate was signed between OPC and Reznik Paz Nevo Trusts Ltd. in April 2020, which details customary grounds for calling the debentures for immediate repayment (subject to cure periods), including insolvency events, liquidation proceedings, receivership, a stay of proceedings and creditors’ arrangements, certain structural changes, a significant worsening in OPC’s financial position, etc. The trust certificate also includes a commitment of OPC to comply with certain financial covenants and restrictions. AtOn December 31, 2022,2023, OPC meets the said financial covenants, as follows: (1) OPC’s equity is NIS 9,532 million (approximately $2,709) [2021: NIS 2,270 million (approximately $730 million) (minimum required is NIS 250 million, and for purposes of a distribution, NIS 350 million)]; (2) OPC's equity to asset ratio is 65% [2021: 55% (minimum required is 17%, and for purposes of distribution, 27%)]; (3) the ratio between net consolidated financial debt less the financial debt designated for the construction of projects that have not yet started generating EBITDA and adjusted EBITDA is 5.6 [2021: 7.3 (maximum allowed is 13, and for purposes of a distribution, 11)].
Note 15 – Loans and Debentures (Cont’d)
Series C Debenturescovenants.
In September 2021, OPC issued Series C debentures at a par value of NIS 851 million (approximately $266 million), with the proceeds designated primarily for the early repayment of OPC Rotem’s financing (refer to Note 15.1.B). The debentures are listed on the TASE, are not CPI-linked and bear annual interest of 2.5%. The debentures shall be repaid in twelve semi-annual and unequal installments (on February 28 and August 31) as set out in the amortization schedule, starting on February 28, 2024 through August 31, 2030 (the first interest payment is due on February 28, 2022). The issuance expenses amounted to about NIS 9 million (approximately $3 million). OPC is required to comply with certain financial covenants and restrictions. As atOn December 31, 2022,2023, OPC meets the said financial covenants, as follows: (1) OPC’s shareholders’ equity was NIS 9,532 million (approximately $2,709 million [2021: NIS 2,270 million (approximately $730 million)] (minimum required is NIS 1 billion, and for purposes of a distribution, NIS 1.4 billion); (2) the ratio of OPC’s shareholders’ equity to OPC’s total assets was 65% (2021: 55% ) (minimum required is 20%, and for purposes of distribution, 30%); (3) the ratio of the net consolidated financial debt less the financial debt designated for construction of projects that have not yet commenced producing EBITDA and Adjusted EBITDA is 5.6 (2021 :7.3) (maximum allowed is 13, and for purposes of a distribution, 11); (4) equity to consolidated balance sheet ratio of 46% (2021: 37%) (minimum required is 17%).covenants.
Note 16 – Trade and Other Payables | | | As at December 31, | | | | | 2023 | | | 2022 | | | | | $ Thousands | | | | | | | | | | Trade Payables | | | 70,661 | | | | 95,036 | | Liability to tax equity partner (1) | | | 74,466 | | | | - | | Accrued expenses and other payables | | | 8,256 | | | | 10,833 | | Government institutions | | | 1,204 | | | | 2,083 | | Employees and payroll institutions | | | 14,573 | | | | 14,491 | | Interest payable | | | 4,984 | | | | 4,472 | | Others | | | 7,754 | | | | 6,500 | | | | | | 181,898 | | | | 133,415 | |
| | | As at December 31, | | | | | 2022 | | | 2021 | | | | | $ Thousands | | | | | | | | | | Trade Payables | | | 95,036 | | | | 136,505 | | Accrued expenses and other payables | | | 10,833 | | | | 11,479 | | Government institutions | | | 2,083 | | | | 2,459 | | Employees and payroll institutions | | | 14,491 | | | | 11,625 | | Interest payable | | | 4,472 | | | | 5,213 | | Others | | | 6,500 | | | | 4,256 | | | | | | 133,415 | | | | 171,537 | |
Other non-current liabilities include approximately $79 million deferred income in respect to ITC grant. Refer to Note 18.A.4.d for more information. Note 17 – Right-Of-Use Assets, Net, and Lease Liabilities and Long-term Deferred Expenses | A) | The Group leases the following items: |
In Israel, the leases are typically entered into with government institutions for the construction and operation of OPC Power Plants’s power plants. They typically run for a period of more than 20 years, with an option for renewal. In the United States, the leases are typically entered into with private companies or individuals for the development, construction and operation of the CPV Group’s power plants. | | ii) | OPC gas transmission infrastructure |
The lease for the gas Pressure Regulation and Measurement Station (“PRMS”) relates to the facility at OPC Hadera’s power plant. For further details, please refer to Note 18.B. The leases range from 3 to 9 years, with options to extend. The total for low-value items on short-term leases are not material. Accordingly, the Group has not recognized right-of-use assets and lease liabilities for these leases. Note 17 – Right-Of-Use Assets, Net and Lease Liabilities (Cont’d)
| | | As at December 31, 2023 | | | | | Balance at beginning of year | | | Depreciation charge for the year | | | Adjustments | | | Balance at end of year | | | | | $ Thousands | | | | | | | | | | | | | | | | Land | | | 76,963 | | | | (3,770 | ) | | | 18,300 | | | | 91,493 | | PRMS facility | | | 13,977 | | | | (1,209 | ) | | | 1,766 | | | | 14,534 | | Offices | | | 8,353 | | | | (2,538 | ) | | | 5,135 | | | | 10,950 | | | Long-term deferred expenses | | | 27,491 | | | | (1,246 | ) | | | 31,293 | | | | 57,538 | | | | | | 126,784 | | | | (8,763 | ) | | | 56,494 | | | | 174,515 | |
Note 17 – Right-Of-Use Assets, Net, Lease Liabilities and Long-term Deferred Expenses (Cont’d) | | | As at December 31, 2022 | | | As at December 31, 2022 | | | | | Balance at
beginning of
year | | | Depreciation
charge for
the year | | | Adjustments | | | Balance at
end of year | | | Balance at beginning of year | | | Depreciation charge for the year | | | Adjustments | | | Balance at end of year | | | | | $ Thousands | | | $ Thousands | | | | | | | | | | | | | | | | | | | | | | Land | | 81,355 | | (3,484 | ) | | (908 | ) | | 76,963 | | | 81,355 | | (3,484 | ) | | (908 | ) | | 76,963 | | PRMS facility | | 6,239 | | (660 | ) | | 8,398 | | 13,977 | | | 6,239 | | (660 | ) | | 8,398 | | 13,977 | | Offices | | 10,282 | | (2,142 | ) | | 213 | | 8,353 | | | 10,282 | | (2,142 | ) | | 213 | | 8,353 | | Others | | | 7 | | | (6 | ) | | | (1 | ) | | | - | | | Long-term deferred expenses | | | | 33,459 | | | (1,129 | ) | | | (4,839 | ) | | | 27,491 | * | | | | | 97,883 | | | (6,292 | ) | | | 7,702 | | | 99,293 | | | | 131,335 | | | (7,415 | ) | | | 2,864 | | | 126,784 | * |
| | | As at December 31, 2021 | | | | | Balance at
beginning of
year | | | Depreciation
charge for
the year | | | Adjustments | | | Balance at
end of year | | | | | $ Thousands | | | | | | | | | | | | | | | | Land | | | 77,011 | | | | (3,375 | ) | | | 7,719 | | | | 81,355 | | PRMS facility | | | 6,514 | | | | (480 | ) | | | 205 | | | | 6,239 | | Offices | | | 2,499 | | | | (1,716 | ) | | | 9,499 | | | | 10,282 | | Others | | | - | | | | - | | | | 7 | | | | 7 | | | | | | 86,024 | | | | (5,571 | ) | | | 17,430 | | | | 97,883 | |
| C) | Amounts recognized in the consolidated statements of profit & loss and cash flows |
| | | As at December 31, | | | As at December 31, | | | | | 2023 | | | 2022 | | | | | $ Thousands | | | $ Thousands | | | | | | | | | | Interest expenses in respect of lease liability | | | 689 | | | | 572 | | | | | | | | | | | | Total cash outflow for leases | | | 2,692 | | | | 2,572 | |
| i) | Lease of OPC Tzomet land |
| | | As at
December 31, | | | As at
December 31, | | | | | 2022 | | | 2021 | | | | | $ Thousands | | | $ Thousands | | | | | | | | | | Interest expenses in respect of lease liability | | | 572 | | | | 550 | | | | | | | | | | | | Total cash outflow for leases | | | 2,572 | | | | 1,993 | |
In February 2020, an updated lease agreement was also signed whereby the Joint Company, as the owner of the Land, will lease the Land to OPC Tzomet, for the benefit of the project. In January 2020, a financial specification was received from ILA in respect of the capitalization fees, whereby value of the Land (not including development expenses) of about NIS 207 million (approximately $60 million) (not including VAT) was set (hereinafter – “the Initial Assessment”). OPC Tzomet, on behalf of the Joint Company, arranged payment of the Initial Assessment in January 2020 at the rate of 75% of amount of the Initial Assessment and provided through OPC, the balance, at the rate of 25% as a bank guarantee in favor of ILA. In January 2021, a final assessment was received from ILA where the value of the usage fees in the land for a period of 25 years, to construct a power plant with a capacity of 396 MW was NIS 200 million (approximately $62 million) (the “Final Assessment”). In March 2021, a reimbursement of NIS 7 million (approximately $2 million), which included linkage differences and interest in respect of the difference between capitalized fees paid and the Final Assessment amount, was received. In addition, the bank guarantee was also reduced by the amount of 25% of said difference. In January 2023, a decision was made regarding the initial appeal, whereby the amount of the Final Assessment was reduced to NIS 154 million (approximately $44 million), excluding VAT. OPC Tzomet filed an appeal on the said decision. As of December 31, 2023, the amounts paid in respect of the land, including the amount of the Final Assessment was classified in the consolidated statement of financial position under “Right of use assets, net” which amounted to approximately NIS 200 million (approximately $55 million). Note 17 – Right-Of-Use Assets, Net, Lease Liabilities and Long-term Deferred Expenses (Cont’d) | ii) | Purchase of leasehold rights in land |
On May 10, 2023, OPC (through OPC Power Plants Ltd.) won the tender issued by Israel Lands Administration (hereinafter - “ILA”) for planning and an option to purchase leasehold rights in land for the construction of renewable energy electricity generation facilities using photovoltaic technology in combination with storage in relation to three compounds in the Neot Hovav Industrial Local Council, with a total area of approximately 227 hectares. The amount of total bid submitted by OPC for all three compounds, in aggregate, was approximately NIS 484 million (approximately $133 million). Upon notice by the ILA, a planning authorization agreement will be signed between the winning bidder and the ILA for a period of 3 years. In August 2023, consideration equivalent to 20% of the bid amount for each compound was paid. Upon authorizing a new outline plan, a lease agreement will be signed for a period of 24 years and 11 months, to construct and operate the project(s), of which consideration of the remaining 80% of the bid amount per compound will be set against. As of the approval date of the report, it is uncertain that approvals, consents, or actions required for the completion of the project(s) will be completed with respect to any of the compounds. | iii) | Backbone lease of land |
In 2023, an agreement for the lease of land for the Backbone project was entered into force. The term of the agreement is 37 years, with an option to extend the term by five further periods of seven years each. Lease liability and right-of-use asset of NIS 122 million (approximately $33 million) were recognized. Note 18 – Contingent Liabilities and Commitments | | 1. | OPC Rotem Power Purchase Agreement In 2014 (commencing in August), letters were exchanged between OPC Rotem and IEC regarding the tariff to be paid by OPC Rotem to IEC in respect of electricity that it had purchased from the electric grid, in connection with sale of electricity to private customers, where the electricity generation in the power plant was insufficient to meet the electricity needs of such customers. It is OPC Rotem’s position that the applicable tariff is the “ex-post” tariff, whereas according to IEC in the aforesaid exchange of letters, the applicable tariff is the TAOZ tariff, and based on part of the correspondences even a tariff that is 25% higher than the TAOZ tariff (and some of the correspondences also raise allegations of default of the PPA with IEC). In order to avoid a specific dispute, Rotem paid IEC the TAOZ tariff for the aforesaid purchase of electricity and commencing from that date, it pays IEC the TAOZ tariff on the purchase of electricity from IEC for sale to private customers. IEC raised contentions regarding past accountings in respect of the acquisition cost of energy for OPC Rotem’s customers in a case of a load reduction of the plant by the System Operator, and collection differences due to non-transfer of meter data in the years 2013 through 2015. In addition, IEC stated its position with respect to additional matters in the arrangement between the parties relating to the acquisition price of surplus energy and the acquisition cost of energy by OPC Rotem during performance of tests. OPC Rotem’s position regarding the matters referred to by IEC, based on its legal advisors, is different and talks are being held between the parties. In March 2022, OPC Rotem and the IEC signed a settlement agreement regarding past accounting in respect of the acquisition cost of energy for OPC Rotem’s customers in a case of a load reduction of the plant by Noga, and collection differences due to non-transfer of meter data between 2013 and 2015. As part of the settlement, OPC Rotem paid a total of approximately $2 million (approximately NIS 5.5 million) to the IEC. Subsequent to this, the System Operator contacted OPC Rotem with a claim that OPC Rotem had transmitted excess energy without coordinating the transmission with the System Operator, to which OPC Rotem disputes the claim. As of December 31, 2023, in OPC Rotem’s estimation, it is more likely than not that OPC Rotem will not pay any additional amounts in respect of the period ended December 31, 2023. Therefore, no provision was included in the financial statements. |
In 2014 (commencing in August), letters were exchanged between OPC Rotem and IEC regarding the tariff to be paid by OPC Rotem to IEC in respect of electricity that it had purchased from the electric grid, in connection with sale of electricity to private customers, where the electricity generation in the power plant was insufficient to meet the electricity needs of such customers.
It is OPC Rotem’s position that the applicable tariff is the “ex-post” tariff, whereas according to IEC in the aforesaid exchange of letters, the applicable tariff is the TAOZ tariff, and based on part of the correspondences even a tariff that is 25% higher than the TAOZ tariff (and some of the correspondences also raise allegations of default of the PPA with IEC). In order to avoid a specific dispute, Rotem paid IEC the TAOZ tariff for the aforesaid purchase of electricity and commencing from that date, it pays IEC the TAOZ tariff on the purchase of electricity from IEC for sale to private customers.
Note 18 – Contingent Liabilities and Commitments (Cont’d) IEC raised contentions regarding past accountings in respect of the acquisition cost of energy for OPC Rotem’s customers in a case of a load reduction of the plant by the System Operator, and collection differences due to non-transfer of meter data in the years 2013 through 2015. In addition, IEC stated its position with respect to additional matters in the arrangement between the parties relating to the acquisition price of surplus energy and the acquisition cost of energy by OPC Rotem during performance of tests. OPC Rotem’s position regarding the matters referred to by IEC, based on its legal advisors, is different and talks are being held between the parties.
In March 2022, OPC Rotem and the IEC signed a settlement agreement regarding past accounting in respect of the acquisition cost of energy for OPC Rotem’s customers in a case of a load reduction of the plant by Noga, and collection differences due to non-transfer of meter data between 2013 and 2015. As part of the settlement, OPC Rotem paid a total of approximately $2 million (approximately NIS 5.5 million) to the IEC. Subsequent to this, the System Operator contacted OPC Rotem with a claim that OPC Rotem had transmitted excess energy without coordinating the transmission with the System Operator, to which OPC Rotem disputes the claim.
As at December 31, 2022, in OPC Rotem’s estimation, it is more likely than not that OPC Rotem will not pay any additional amounts in respect of the period ended December 31, 2022. Therefore, no provision was included in the financial statements.
| a. | OPC Hadera In January 2016, an agreement was signed between OPC Hadera and SerIDOM Servicios Integrados IDOM, S.A.U (“IDOM”), for the design, engineering, procurement and construction of a cogeneration power plant, in consideration of about approximately $185 million (approximately NIS 639 million) (as amended several times as part of change orders, including an amendment made in 2019 and described below), which is payable on the basis of the progress of the construction and compliance with milestones (hereinafter – “the Hadera Construction Agreement”). IDOM has provided bank guarantees and a corporate guarantee of its parent company to secure the said obligations, and OPC has provided a corporate guarantee to IDOM, in the amount of $10.5 million, to secure part of OPC Hadera’s liabilities. In addition, as part of an addendum to OPC Hadera’s construction agreement which was signed in October 2018, the parties agreed to waiver of past claims up to the signing date of the addendum. In accordance with the construction agreement, OPC Hadera is entitled to certain compensation from IDOM in respect of the delay in completion of the construction of the Hadera Power Plant or compensation (limited to the amount of the limit set in the Agreement) in the event of failure to comply with the terms set out in the Agreement with regard to the Power Plant performance. The said compensation is capped by the amounts specified in the construction agreement, and up to an aggregate of $36 million. According to the Construction Agreement, OPC Hadera has a contractual right to deduct any amount due to it under the Construction Agreement, including for the foregoing compensation, from any amounts that it owes to the construction contractor. In 2022, OPC Hadera deducted a total of $14 million from amounts payable to the construction contractor in respect of the final milestones. In December 2023, Hadera and the Construction Contractor signed a settlement agreement, according to which, among other things, in exchange for the withdrawal from, and full and final settlement of, the parties' claims in connection with the disputes between Hadera and the Construction Contractor that are the subject of the arbitration proceeding, the Contractor will pay Hadera compensation in the amount of approx. NIS 74 million (approximately $21 million) (hereinafter - the "Compensation Amount"). It is clarified that the Compensation Amount includes the amounts offset by Hadera for the Construction Contractor totaling approximately $14 million, as mentioned above, such that the net balance of the Compensation Amount is approximately NIS 25 million (approximately $7 million). In addition, following the payment of the remaining Compensation Amount, the contractor's guarantees were released in accordance with the terms and conditions stipulated in the settlement agreement, and the Construction Contractor is entitled to a final acceptance certificate of the power plant under the construction agreement. Upon the signing of the settlement agreement, the arbitration proceeding between the parties also concluded. As a result of the signing of the settlement agreement with the Construction Contractor, as of December 31, 2023, Hadera recognized in its statement of income approximately NIS 41 million (approximately $11 million) income before tax and the remaining of approximately NIS 33 million (approximately $9 million) against property, plant and equipment. |
In January 2016, an agreement was signed between OPC Hadera and SerIDOM Servicios Integrados IDOM, S.A.U (“IDOM”), for the design, engineering, procurement and construction of a cogeneration power plant, in consideration of about approximately $185 million (approximately NIS 639 million) (as amended several times as part of change orders, including an amendment made in 2019 and described below), which is payable on the basis of the progress of the construction and compliance with milestones (hereinafter – “the Hadera Construction Agreement”).
IDOM has provided bank guarantees and a corporate guarantee of its parent company to secure the said obligations, and OPC has provided a corporate guarantee to IDOM, in the amount of $10.5 million, to secure part of OPC Hadera’s liabilities. In addition, as part of an addendum to OPC Hadera’s construction agreement which was signed in October 2018, the parties agreed to waiver of past claims up to the signing date of the addendum.
In accordance with the construction agreement, OPC Hadera is entitled to certain compensation from IDOM in respect of the delay in completion of the construction of the Hadera Power Plant or compensation (limited to the amount of the limit set in the Agreement) in the event of failure to comply with the terms set out in the Agreement with regard to the Power Plant performance. The said compensation is capped by the amounts specified in the construction agreement, and up to an aggregate of $36 million.
According to the Construction Agreement, OPC Hadera has a contractual right to deduct any amount due to it under the Construction Agreement, including for the foregoing compensation, from any amounts that it owes to the construction contractor. In 2022, OPC Hadera deducted a total of $14 million from amounts payable to the construction contractor in respect of the final milestones.
As at December 31, 2022, an arbitration proceeding was conducted between OPC Hadera and the construction contractor, of which a hearing is scheduled for in June 2024.
In September 2018, OPC Tzomet signed a planning, procurement and construction agreement (hereinafter – “the Agreement”) with PW Power Systems LLC (hereinafter – “Tzomet Construction“Construction Contractor” or “PWPS”), for construction of the Tzomet project. The Agreement is a “lump sum turnkey” agreement wherein the Tzomet Construction Contractor committed to construct the Tzomet project in accordance with the technical and engineering specifications determined and includes various undertakings of the contractor. Note 18 – Contingent Liabilities and Commitments (Cont’d)
In OPC Tzomet’s estimation, based on the work specifications, the aggregate consideration that will be paid in the framework of the Agreement is about $300 million, and it will be paid based on the milestones provided. Pursuant to the Agreement, the Tzomet Construction Contractor undertook to complete the construction work of the Tzomet project, including the acceptance tests by January 2023. The continuity of construction has been affected by COVID-19 due to the need to transport equipment and foreign crews to the site. As of December 31, 2022, the Company believes that the constructioncommercial operation period of the OPC Tzomet Power Plant is expected to end in the first half ofcommenced on June 22, 2023. Delays in the completion of the construction work beyond the original date scheduled in OPC Tzomet’s conditional license might affect OPC Tzomet’s ability to meet its undertakings in connection with the construction of the project.
Note 18 – Contingent Liabilities and Commitments (Cont’d) | It is noted that, according to the Construction Contractor, the continuity of construction work was affected, inter alia, by the COVID-19 Crisis, in light of the need for equipment and foreign work teams to arrive, and by delays in the global supply chains of components and equipment required for the project. As of December 31, 2023, OPC Tzomet is holding discussions with the Construction Contractor. |
| | 3.c. | OPC Sorek 2 In May 2020, OPC Sorek 2 signed an agreement with SMS IDE Ltd., which won a tender of the State of Israel for construction, operation, maintenance and transfer of a seawater desalination facility on the “Sorek B” site (the “Sorek B Desalination Facility”), where OPC Sorek 2 will construct, operate and maintain an energy generation facility (“Sorek B Generation Facility”) with a generation capacity of about 87 MW on the premises of the Sorek 2 Desalination Facility, and will supply the energy required for the Sorek B Desalination Facility for a period of 25 years after the operation date of the Sorek B Desalination Facility. At the end of the aforesaid period, ownership of the Sorek B Generation Facility will be transferred to the State of Israel. OPC undertook to construct the Sorek B Generation Facility within 24 months from the date of approval of the National Infrastructure Plan (approved in November 2021), and to supply energy at a specific scope of capacity to the Sorek B Desalination Facility. OPC Sorek 2’s share of the amount payable to the construction contractor is estimated at approximately $42 million. The construction agreement includes provisions of capped agreed compensation in respect of delays, non-compliance with execution and availability requirements. The agreement also sets the scope of liability and requirements for provision of guarantees in the different stages of the project. As a result of the outbreak of the War, Construction Contractor served OPC Sorek 2 with a force majeure notice and OPC Sorek 2 served on its behalf a force majeure notice to IDE. |
| 3. | Agreements for the acquisition of natural gas |
| a. | OPC Rotem and OPC Hadera
|
OPC Rotem and OPC Hadera has an agreement with Tamar Group in connection to the supply of natural gas to the power plants. Both OPC Rotem and OPC Hadera undertook to continue to consume all the gas required for its power plants from Tamar Group (including quantities exceeding the minimum quantities) up to the completion date of the commissioning of the Karish Reservoir, except for a limited consumption of gas during the commissioning period of the Karish Reservoir.
In December 2017, OPC Rotem, OPC Hadera, Israel Chemicals Ltd. and Bazan Ltd., engaged in agreements with Energean Israel Ltd. (hereinafter – “Energean”), which has holdings in the Karish Reservoir, for the purchase natural gas. In 2020, Energean notified OPC that “force majeure” events happened during the year, in accordance with the clauses pursuant to the agreements, and that the flow of the first gas from the Karish reservoir is expected to take place during the second half of 2021. OPC rejected the contentions that a “force majeure” event is involved.
Due to the delay in supply of the gas from the Karish Reservoir, OPC Rotem and OPC Hadera will be required to acquire the quantity of gas it had planned to acquire from Energean for purposes of operation of the power plants at present gas prices, which is higher than the price stipulated in the Energean agreement. The delays in the commercial operation date of Energean, and in turn, a delay in supply of the gas from the Karish Reservoir, will have an unfavorable impact on OPC’s profits. In the agreements with Energean, compensation for delays had been provided, the amount of which depends on the reasons for the delay, where the limit with respect to the compensation in a case where the damages caused is “force majeure” is lower. It is noted that the damages that will be caused to OPC stemming from a delay could exceed the amount of the said compensation.
In 2021, OPC Rotem and OPC Hadera received reduced compensation of approximately $3 million (approximately NIS 9 million) and approximately $2 million (approximately NIS 7 million), respectively.
In May 2022, an amendment to the Energean Agreements was signed, which set out, among other things, arrangements pertaining to bringing forward the reduction of the quantities of gas supplied by OPC Rotem and OPC Hadera, of which the scope of reduction was not yet determined as at December 31, 2022.
| 4. | Other contingent liabilities
|
| | a. | Bazan electricity purchase claimOPC Rotem and OPC Hadera
|
In November 2017, a request was filed with the Tel Aviv-Jaffa District Court to approve a derivative claim on behalf of Bazan. The request is based on the petitioner's contention that the undertaking in the electricity purchase transaction between Bazan and OPC Rotem is an extraordinary interested party transaction that did not receive the approval of the general assembly of Bazan shareholders on the relevant dates. The respondents to the request include Bazan, OPC Rotem, the Israel Corporation Ltd. and the members of Bazan's Board of Directors at the time of entering into the electricity purchase transaction. The requested remedies include remedies such as an injunction and financial remedies.
OPC Rotem and OPC Hadera has an agreement with Tamar Group in connection to the supply of natural gas to the power plants. Both OPC Rotem and OPC Hadera undertook to continue to consume all the gas required for its power plants from Tamar Group (including quantities exceeding the minimum quantities) up to the completion date of the commissioning of the Karish Reservoir, except for a limited consumption of gas during the commissioning period of the Karish Reservoir. In December 2017, OPC Rotem, OPC Hadera, Israel Chemicals Ltd. and Bazan Ltd., engaged in agreements with Energean Israel Ltd. (hereinafter – “Energean”), which has holdings in the Karish Reservoir, for the purchase natural gas. In 2020, Energean notified OPC that “force majeure” events happened during the year, in accordance with the clauses pursuant to the agreements, and that the flow of the first gas from the Karish reservoir is expected to take place during the second half of 2021. OPC rejected the contentions that a “force majeure” event is involved. Due to the delay in supply of the gas from the Karish Reservoir, OPC Rotem and OPC Hadera will be required to acquire the quantity of gas it had planned to acquire from Energean for purposes of operation of the power plants at present gas prices, which is higher than the price stipulated in the Energean agreement. The delays in the commercial operation date of Energean, and in turn, a delay in supply of the gas from the Karish Reservoir, will have an unfavorable impact on OPC’s profits. In the agreements with Energean, compensation for delays had been provided, the amount of which depends on the reasons for the delay, where the limit with respect to the compensation in a case where the damages caused is “force majeure” is lower. It is noted that the damages that will be caused to OPC stemming from a delay could exceed the amount of the said compensation. In 2021, OPC Rotem and OPC Hadera received reduced compensation of approximately $3 million (approximately NIS 9 million) and approximately $2 million (approximately NIS 7 million), respectively. In May 2022, an amendment to the Energean Agreements was signed, which set out, among other things, arrangements pertaining to bringing forward the reduction of the quantities of gas supplied by OPC Rotem and OPC Hadera. | Note 18 – Contingent Liabilities and Commitments (Cont’d) In July 2018, OPC Rotem submitted its response to the request. Bazan’s request for summary judgement was denied. Negotiations are being held for entering into a compromise agreement that will settle a lawsuit against Rotem and others, which was filed in July 2022. As at December 2022, OPC filed a settlement agreement for approval with the Court. In February 2023, the Court handed down a judgement that approves the settlement agreement, of which the settlement amount is immaterial to OPC. | | Energean issued OPC Hadera with a notice regarding the completion of the commissioning in relation to the OPC Hadera agreement and OPC Rotem agreement on February 28, 2023 and March 25, 2023 respectively. On March 26, 2023, Energean issued OPC Rotem with a notice in relation to commencement of commercial operation. OPC Rotem and OPC Hadera recognized contractual financial amount in respect of a netting arrangement by bringing forward of the reduction notice. The total amount of NIS 18 million (approximately $5 million) was offset from cost of goods sold. |
| 4. | Other contingent liabilities |
| | b.a. | Bazan electricity purchase claim In November 2017, a request was filed with the Tel Aviv-Jaffa District Court to approve a derivative claim on behalf of Bazan. The request is based on the petitioner's contention that the undertaking in the electricity purchase transaction between Bazan and OPC Rotem is an extraordinary interested party transaction that did not receive the approval of the general assembly of Bazan shareholders on the relevant dates. The respondents to the request include Bazan, OPC Rotem, the Israel Corporation Ltd. and the members of Bazan's Board of Directors at the time of entering into the electricity purchase transaction. The requested remedies include remedies such as an injunction and financial remedies. In July 2018, OPC Rotem submitted its response to the request. Bazan’s request for summary judgement was denied. Negotiations are being held for entering into a compromise agreement that will settle a lawsuit against Rotem and others, which was filed in July 2022. In February 2023 the court handed down a judgment that approved the settlement agreement and OPC Rotem paid NIS 2 million (approximately $523 thousand), representing its share as set out in the settlement agreement. |
| b. | Oil Refineries Ltd. (now known as “Bazan”) gas purchase claim In January 2018, a request was filed with the Tel Aviv-Jaffa District Court to approve a derivative claim by a shareholder of Bazan against former and current directors of Bazan, Israel Chemicals Ltd., OPC Rotem, OPC Hadera and IC (collectively the "Group Companies"), over: (1) a transaction of the Group Companies for the purchase of natural gas from Tamar Partners, (2) transactions of the Group Companies for the purchase of natural gas from Energean Israel Ltd. (“Energean”) and (3) transaction for sale of surplus gas to Bazan. In August 2018, the Group Companies submitted their response to the claim filed. OPC rejected the contentions appearing in the claim and requested summary dismissal of the claim. Evidentiary hearings were held in the second half of 2021, after which summations were submitted in November 2022. In November 2023, the Court dismissed the entire motion. |
In January 2018, a request was filed with the Tel Aviv-Jaffa District Court to approve a derivative claim by a shareholder of Bazan against former and current directors of Bazan, Israel Chemicals Ltd., OPC Rotem, OPC Hadera and IC (collectively the "Group Companies"), over: (1) a transaction of the Group Companies for the purchase of natural gas from Tamar Partners, (2) transactions of the Group Companies for the purchase of natural gas from Energean Israel Ltd. (“Energean”) and (3) transaction for sale of surplus gas to Bazan.
In August 2018, the Group Companies submitted their response to the claim filed. OPC rejected the contentions appearing in the claim and requested summary dismissal of the claim. Evidentiary hearings were held in the second half of 2021, after which summations were submitted in November 2022.
Based on advice from OPC’s legal advisors, it is more likely than not that the claim will not be accepted by the Court and, accordingly, no provision has been included in the financial statements in respect of the claim as at December 31, 2022.
| | c. | Purchase of rights in Alon Energy Centers Limited Partnership
|
In June 2022, OPC Holdings Israel entered into an agreement with Dor Alon Energy Israel (1988) Ltd. and Dor Alon Gas Power Plants Limited Partnership for the purchase of rights in Alon Energy Centers Limited Partnership, a partnership which owns a combined-cycle power plant powered by conventional energy with installed capacity of 75 MW located in the Kiryat Gat Industrial Zone. The consideration of the purchase is NIS 535 million (approximately $160 million), subject to adjustments for cash balances and working capital. The consideration is also subject to adjustments in connection with repayment or non-repayment of senior debt extended to the power plant as agreed between the parties to the purchase agreement.
In accordance with the terms of the Acquisition Agreement, including adjustments made thereto, the Acquirer will acquire the sold rights in consideration for NIS 870 million ($248 million) (hereinafter - the “Consideration”), which will be paid on the transaction completion date except for a total of NIS 300 million ($86 million) that will be paid by December 31, 2023. Completion of the transaction is subject to certain conditions being fulfilled and approvals obtained. As of the approval date of the financial statements, the completion of the transaction is subject to the fulfillment of conditions precedent on the dates set in the Acquisition Agreement and through March 31, 2023. As of the approval date of the financial statements, all of the conditions precedent have yet to be met.
| d. | Inkia Energy Limited (liquidated in 2019) |
As part of the sale described in Note 26,In December 2017, Kenon, through its wholly-owned subsidiary Inkia Energy Limited (“Inkia”), sold its Latin American and Caribbean power business to an infrastructure private equity firm, I Squared Capital (“ISQ”). Inkia agreed to indemnify the buyer and its successors, permitted assigns, and affiliates against certain losses arising from a breach of Inkia’s representations and warranties and certain tax matters, subject to certain time and monetary limits depending on the particular indemnity obligation. These indemnification obligations were supported by (a) a three-year pledge of shares of OPC which represented 25% of OPC’s outstanding shares, (b) a deferral of $175 million of the sale price in the form of a four-year $175 million Deferred Payment Agreement, accruing interest at 8% per year and payable in-kind, and (c) a three-year corporate guarantee from Kenon for all of the Inkia’s indemnification obligations, all of the foregoing periods running from the closing date of December 31, 2017. In December 2018, the indemnification commitment was assigned by Inkia to a fellow wholly owned subsidiary of Kenon. In October 2020, as part of an early repayment of the deferred payment agreement where Kenon received $218 million ($188 million net of taxes), Kenon agreed to increase the number of OPC shares pledged to the buyer of the Inkia business to 55,000,000 shares and to extend the pledge of OPC shares and the corporate guarantee from Kenon for all of Inkia’s indemnification obligations until December 31, 2021.
In March 2022, 53,500,000 shares were released from pledge, and 1,500,000 shares of OPC remain pledged in light of an indemnity claim relating to a tax assessment claim in the amount of $11 million.
In October 2020, as part of an early repayment of the deferred payment agreement where Kenon received $218 million ($188 million net of taxes), Kenon agreed to increase the number of OPC shares pledged to the buyer of the Inkia business to 55,000,000 shares and to extend the pledge of OPC shares and the corporate guarantee from Kenon for all of Inkia’s indemnification obligations until December 31, 2021.
| Note 18 – Contingent Liabilities and Commitments (Cont’d)
| | In March 2022, 53,500,000 shares were released from pledge, and 1,500,000 shares of OPC remain pledged in light of an indemnity claim relating to a tax assessment claim in the amount of $11 million. In August 2023, all of OPC shares that were previously pledged as part of the Inkia sale were released as part of a settlement agreement. |
| B.d. | Tax equity partner agreement in Maple Hill On May 12, 2023, CPV Group entered into an investment agreement with a tax equity partner totaling approximately $82 million in the Maple Hill project (hereinafter - the “Project”). Pursuant to the Agreement, the tax equity partner’s investment in the Project shall be provided in part (20%) on the date of completion of the construction works (Mechanical Completion) and the remainder (80%) on the Commercial Operation Date In consideration for its investment in the project corporation, the tax equity partner is expected to receive most of the project’s tax benefits, including Investment Tax Credit (“ITC”) at a higher rate of 40%, and participation in the distributable free cash flow from the project. In addition, the tax equity partner is entitled to participate in the project's loss for tax purposes. In December 2023, the terms and conditions for the commercial operation of the project were fully met in accordance with the tax equity investment agreement in the project, and the tax equity partner completed its entire investment in the project. Immediately prior to the completion of the advancement of the tax equity partner’s investment, CPV Group and a third party entered into an agreement for the sale of the ITC grant in consideration for approximately $75 million, which constitute approximately 95% of its nominal value. As of December 31, 2023, CPV Group recognized the sale amount under “other current assets” financial caption, and an undertaking to transfer the sale amount to the tax equity partner under “trade and other payables” financial caption. |
| a. | OPC Power Plants OPC entered into long-term service maintenance contracts for its operating power plants. The number of maintenance hours and price are specified in the agreements. OPC entered into long-term infrastructure contracts with Israel National Gas Lines Ltd. (“INGL”) for use of PRMS at its operating power plants. The price is specified in the agreements. OPC entered into long-term PPAs with its customers (of which some included construction of generation facilities) for sale of electricity and gas. The supply quantity, period and pricing are specified in the agreements. OPC has also entered into long-term PPAs with its suppliers for purchase of electricity and gas. The minimum purchase quantity, period and pricing are specified in the agreements. OPC entered into long-term service maintenance contracts for its operating power plants. The number of maintenance hours and price are specified in the agreements.
OPC entered into long-term infrastructure contracts with Israel National Gas Lines Ltd. (“INGL”) for use of PRMS at its operating power plants. The price is specified in the agreements.
OPC entered into long-term PPAs with its customers (of which some included construction of generation facilities) for sale of electricity and gas. The supply quantity, period and pricing are specified in the agreements. OPC has also entered into long-term PPAs with its suppliers for purchase of electricity and gas. The minimum purchase quantity, period and pricing are specified in the agreements.
OPC entered into long-term construction agreements for constructing its power plants. The price, technical and engineering specifications, and work milestones are specified in the agreements. For more information relating to the construction of the Tzomet power plant, refer to 18.A.2.b. |
| b. | CPV Group In June 2023, CPV Group entered into an Engineering, Procurement and Construction ("EPC”) agreement with a construction contractor in respect of the Backbone project. As of the approval date of the financial statements, the total consideration in the EPC agreement was set at a fixed amount of NIS 650 million (approximately $175 million), which will be paid in accordance with the milestones set in the EPC agreement. |
Note 19 – Share Capital and Reserves | | | Company | | | Company | | | | | No. of shares | | | No. of shares | | | | | (’000) | | | ('000) | | | | | 2022 | | | 2021 | | | 2023 | | | 2022 | | Authorised and in issue at January, 1 | | 53,879 | | 53,871 | | | | 53,887 | | | | 53,879 | | Share repurchase and cancelled | | | | (1,128 | ) | | | - | | Issued for share plan | | | 8 | | | 8 | | | | 7 | | | | 8 | | Authorised and in issue at December. 31 | | | 53,887 | | | 53,879 | | | | 52,766 | | | | 53,887 | |
All shares rank equally with regardsregard to the Company’s residual assets. The holders of ordinary shares are entitled to receive dividends as declared from time to time, and are entitled to one vote per share at meetings of the Company. All issued shares are fully paid with no par value. The capital structure of the Company comprises of issued capital and accumulated profits and the capital structure is managed to ensure that the Company will be able to continue to operate as a going concern. The Company is not subjected to externally imposed capital requirements. In 2022, 8,037 (2021: 7,958)2023, 7,259 (2022: 8,037) ordinary shares were granted under the Share Incentive Plan to key management at an average price of $47.22 (2021: $29.41)$31.62 (2022: $47.22) per share. The translation reserve includes all the foreign currency differences stemming from translation of financial statements of foreign activities as well as from translation of items defined as investments in foreign activities commencing from January 1, 2007 (the date IC first adopted IFRS). The capital reserve reflects the portion of the gain or loss on the hedging instrument that is determined to be an effective hedge (i.e. the portion that is offset by the change in the cash flow hedge reserve). Approximately 407 thousand (2021: 4.7 million) share options of ZIM were exercised, resulting in a proportionate share of increase in capital reserve attributable to owners of the Company of $5.5 million (2021: $5.4 million). Approximately 272 thousand (2021: 250 thousand) share options of OPC were exercised, resulting in an increase in capital reserve attributable to owners of the Company of $2.7 million (2021: $1.6 million).
Note 19 – Share Capital and Reserves (Cont’d)
In October 2020, Kenon’s shareholders approved a cash dividend of $2.23 per share (an aggregate amount of approximately $120 million), to Kenon’s shareholders of record as of the close of trading on November 3, 2020, paid on November 10, 2020.
In April 2021, Kenon’s board of directors approved a cash dividend of $1.86 per share (an aggregate amount of approximately $100 million), to Kenon’s shareholders of record as of the close of trading on April 29, 2021, paid on May 6, 2021. In November 2021, Kenon’s board of directors approved a cash dividend of $3.50 per share (an aggregate amount of approximately $189 million), to Kenon’s shareholders of record as of the close of trading on January 19, 2022, paid on January 27, 2022. In March 2023, Kenon’s board of directors approved a cash dividend of $2.79 per share (an aggregate amount of approximately $150 million), payable to Kenon’s shareholders of record as of the close of trading on April 10, 2023, paid on April 19, 2023. Note 19 – Share Capital and Reserves (Cont’d) Kenon has established a Share Incentive Plan for its directors and management. The plan provides grants of Kenon shares, as well as stock options in respect of Kenon’s shares, to directors and officers of the Company pursuant to awards, which may be granted by Kenon from time to time, representing up to 3% of the total issued shares (excluding treasury shares) of Kenon. During 2023, 2022 2021 and 2020,2021, Kenon granted awards of shares to certain members of its management. Such shares are vested upon the satisfaction of certain conditions, including the recipient’s continued employment in a specified capacity and Kenon’s listing on each of the NYSE and the TASE. The fair value of the shares granted in 20222023 is $229 thousand (2022: $267 thousand, (2021:2021: $234 thousand, 2020: $267 thousand) and was determined based on the fair value of Kenon’s shares on the grant date. Kenon recognized $292$296 thousand as general and administrative expenses in 2022 (2021:2023 (2022: $292 thousand, 2021: $258 thousand, 2020: $350 thousand). In May 2022 and June 2022, Kenon received shareholder approval at its annual general meeting and approval of the High Court of the Republic of Singapore, respectively, for a capital reduction to return share capital amounting to $10.25 per share ($552 million in total) to Kenon’s shareholders of record as of the close of trading on June 27, 2022, paid on July 5, 2022. F - 65In 2023, the Company repurchased approximately 1.1 million of its own shares out of accumulated profit for approximately $28 million under the ongoing share repurchase plan. These shares were cancelled during the year ended December 31, 2023.
Note 20 – Revenue | | | For the Year Ended December 31, | | | | | 2022 | | | 2021 | | | 2020 | | | | | $ Thousands | | Revenue from sale of electricity and infrastructure services in Israel | | | 486,680 | | | | 419,395 | | | | 369,421 | | Revenue from sale of electricity in US | | | 25,780 | | | | 25,605 | | | | - | | Revenue from sale of steam in Israel | | | 18,476 | | | | 17,648 | | | | 16,204 | | Revenue from provision of services in US | | | 31,509 | | | | 25,115 | | | | - | | Other revenue in Israel | | | 11,512 | | | | - | | | | 845 | | | | | | 573,957 | | | | 487,763 | | | | 386,470 | |
| | | For the Year Ended December 31, | | | | | 2023 | | | 2022 | | | 2021 | | | | | $ Thousands | | Revenue from sale of electricity and infrastructure services in Israel | | | 593,941 | | | | 486,680 | | | | 419,395 | | Revenue from sale of electricity in US | | | 36,959 | | | | 25,780 | | | | 25,605 | | Revenue from sale of steam in Israel | | | 16,006 | | | | 18,476 | | | | 17,648 | | Revenue from provision of services and other revenue in US | | | 36,007 | | | | 31,509 | | | | 25,115 | | Other revenue in Israel | | | 8,883 | | | | 11,512 | | | | - | | | | | | 691,796 | | | | 573,957 | | | | 487,763 | |
Note 21 – Cost of Sales and Services (excluding Depreciation and Amortization) | | | For the Year Ended December 31, | | | | | 2022 | | | 2021 | | | 2020 | | | | | $ Thousands | | Fuels | | | 155,760 | | | | 153,122 | | | | 135,706 | | Electricity and infrastructure services | | | 192,723 | | | | 133,502 | | | | 125,782 | | Salaries and related expenses | | | 30,598 | | | | 21,095 | | | | 7,244 | | Generation and operating expenses and outsourcing | | | 17,283 | | | | 16,798 | | | | 8,625 | | Insurance | | | 5,190 | | | | 4,989 | | | | 3,503 | | Others | | | 15,707 | | | | 6,792 | | | | 1,226 | | | | | | 417,261 | | | | 336,298 | | | | 282,086 | |
| | | For the Year Ended December 31, | | | | | 2023 | | | 2022 | | | 2021 | | | | | $ Thousands | | Fuels | | | 178,663 | | | | 155,760 | | | | 153,122 | | Electricity and infrastructure services | | | 130,199 | | | | 93,804 | | | | 92,086 | | Salaries and related expenses | | | 10,033 | | | | 9,661 | | | | 8,259 | | Generation and operating expenses and outsourcing | | | 82,166 | | | | 88,055 | | | | 31,729 | | Insurance | | | 11,040 | | | | 9,440 | | | | 9,997 | | Cost in respect of sale of renewable energy | | | 13,455 | | | | 8,757 | | | | 7,988 | | Cost in respect of provision of services revenue and other costs | | | 27,683 | | | | 23,856 | | | | 16,499 | | Others | | | 41,073 | | | | 27,928 | | | | 16,618 | | | | | | 494,312 | | | | 417,261 | | | | 336,298 | |
Note 22 – Selling, General and Administrative Expenses | | | For the Year Ended December 31, | | | For the Year Ended December 31, | | | | | 2022 | | | 2021 | | | 2020 | | | 2023 | | 2022 | | 2021 | | | | | $ Thousands | | | $ Thousands | | Payroll and related expenses (1) | | 46,660 | | 41,930 | | 11,360 | | | 26,877 | | 46,660 | | 41,930 | | Depreciation and amortization | | 3,259 | | 2,623 | | 1,023 | | | 4,212 | | 3,259 | | 2,623 | | Professional fees | | 15,798 | | 16,069 | | 8,386 | | | 18,190 | | 15,798 | | 16,069 | | Business development expenses | | 15,186 | | 1,566 | | 1,998 | | | 15,607 | | 15,186 | | 1,566 | | Expenses in respect of acquisition of CPV Group | | - | | 752 | | 12,227 | | | - | | - | | 752 | | Office maintenance | | 4,581 | | 3,022 | | 936 | | | 6,524 | | 4,581 | | 3,022 | | Other expenses | | | 14,452 | | | 9,765 | | | 14,027 | | | | 13,305 | | | 14,452 | | | 9,765 | | | | | | 99,936 | | | 75,727 | | | 49,957 | | | | 84,715 | | | 99,936 | | | 75,727 | |
(1) A portion of this relates to profit sharing for CPV Group employees The fair value of the CPV Group’s Profit-Sharing Plan is recognized as an expense, against a corresponding increase in liability, over the period in which the unconditional right to payment is achieved. The liability is remeasured at each reporting date until the settlement date. Any change in the fair value of the liability is recognized in the consolidated statements of profit and loss. In 2022,2023, the CPV Group recorded expenses in the amount of approximately NIS 89 million (approximately $24 million) (2022: NIS 46 million (approximately $13 million) [2021: NIS 50 million (approximately $15 million)]). Note 23 – Financing Expenses, Net | | | For the Year Ended December 31, | | | | | 2023 | | | 2022 | | | 2021 | | | | | $ Thousands | | | | | | | | | | | | | Interest income from bank deposits | | | 36,754 | | | | 12,108 | | | | 167 | | Amount reclassified to consolidated statements of profit & loss from capital reserve in respect of cash flow hedges | | | 6 | | | | 4,125 | | | | 2,121 | | Net change in exchange rates | | | 700 | | | | 28,453 | | | | - | | Net change in fair value of derivative financial instruments | | | - | | | | - | | | | 443 | | Net change in the fair value of financial assets held for trade and available for sale | | | 422 | | | | - | | | | - | | Other income | | | 1,479 | | | | - | | | | 203 | | Financing income | | | 39,361 | | | | 44,686 | | | | 2,934 | | | | | | | | | | | | | | | | Interest expenses to banks and others | | | (52,306 | ) | | | (47,542 | ) | | | (51,924 | ) | Amount reclassified to consolidated statements of profit & loss from capital reserve in respect of cash flow hedges | | | (1,563 | ) | | | - | | | | - | | Impairment loss on debt securities at FVOCI | | | (642 | ) | | | (732 | ) | | | - | | Net change in fair value of financial assets held for trade | | | - | | | | (45 | ) | | | - | | Net change in exchange rates | | | - | | | | - | | | | (5,997 | ) | Net change in fair value of derivative financial instruments | | | - | | | | (291 | ) | | | - | | Early repayment fee (Note 15.B, Note 15.E) | | | - | | | | - | | | | (84,196 | ) | Other expenses | | | (11,822 | ) | | | (1,787 | ) | | | (2,178 | ) | Financing expenses | | | (66,333 | ) | | | (50,397 | ) | | | (144,295 | ) | Net financing expenses | | | (26,972 | ) | | | (5,711 | ) | | | (141,361 | ) |
Note 23 – Financing Expenses, Net
| | | For the Year Ended December 31, | | | | | 2022 | | | 2021 | | | 2020 | | | | | $ Thousands | | | | | | | | | | | | | Interest income from bank deposits | | | 12,108 | | | | 167 | | | | 780 | | Amount reclassified to consolidated statements of profit & loss from capital reserve in respect of cash flow hedges | | | 4,125 | | | | 2,121 | | | | - | | Net change in exchange rates | | | 28,453 | | | | - | | | | - | | Net change in fair value of derivative financial instruments | | | - | | | | 443 | | | | - | | Interest income from deferred payment | | | - | | | | - | | | | 13,511 | | Other income | | | - | | | | 203 | | | | - | | Financing income | | | 44,686 | | | | 2,934 | | | | 14,291 | | | | | | | | | | | | | | | | Interest expenses to banks and others | | | (47,542 | ) | | | (51,924 | ) | | | (24,402 | ) | Amount reclassified to consolidated statements of profit & loss from capital reserve in respect of cash flow hedges | | | - | | | | - | | | | (6,300 | ) | Impairment loss on debt securities at FVOCI | | | (732 | ) | | | - | | | | - | | Net change in fair value of financial assets held for trade | | | (45 | ) | | | - | | | | - | | Net change in exchange rates | | | - | | | | (5,997 | ) | | | (5,645 | ) | Net change in fair value of derivative financial instruments | | | (291 | ) | | | - | | | | (1,569 | ) | Early repayment fee (Note 15.B, Note 15.E) | | | - | | | | (84,196 | ) | | | (11,852 | ) | Other expenses | | | (1,787 | ) | | | (2,178 | ) | | | (1,406 | ) | Financing expenses | | | (50,397 | ) | | | (144,295 | ) | | | (51,174 | ) | Net financing expenses | | | (5,711 | ) | | | (141,361 | ) | | | (36,883 | ) |
Note 24 – Income Taxes | A. | Components of the Income Taxes |
| | | For the Year Ended December 31, | | | | | 2022 | | | 2021 | | | 2020 | | | | | $Thousands | | Current taxes on income | | | | | | | | | | In respect of current year | | | 39,559 | | | | 6,892 | * | | | 734 | | In respect of prior years | | | - | | | | - | | | | 1 | | Deferred tax expense/(income) | | | | | | | | | | | | | Creation and reversal of temporary differences | | | (1,579 | ) | | | (2,567 | )* | | | 3,963 | | Total tax expense on income | | | 37,980 | | | | 4,325 | | | | 4,698 | |
* The Group made an immaterial correction of reclassification error of $21 million in income taxes on income and deferred tax income as at December 31, 2021.
| | | For the Year Ended December 31, | | | | | 2023 | | | 2022 | | | 2021 | | | | | $ Thousands | | Current taxes on income | | | | | | | | | | In respect of current year | | | 11,049 | | | | 39,559 | | | | 6,892 | | Deferred tax expense/(income) | | | | | | | | | | | | | Creation and reversal of temporary differences | | | 14,150 | | | | (1,579 | ) | | | (2,567 | ) | Total tax expense on income | | | 25,199 | | | | 37,980 | | | | 4,325 | |
No previously unrecognized tax benefits were used in 2020,2023, 2022 or 2021 or 2022 to reduce our current tax expense. Note 24 – Income Taxes (Cont’d)
| B. | Reconciliation between the theoretical tax expense (benefit) on the pre-tax income (loss) and the actual income tax expenses |
| | | For the Year Ended December 31, | | | For the Year Ended December 31, | | | | | 2022 | | 2021 | | 2020 | | | 2023 | | 2022 | | 2021 | | | | | $ Thousands | | | $ Thousands | | Profit from continuing operations before income taxes | | | 387,639 | | | 879,642 | | | 500,447 | | | (Loss)/Profit from continuing operations before income taxes | | | | (185,749 | ) | | | 387,639 | | | 879,642 | | Statutory tax rate | | 17.00 | % | | 17.00 | % | | 17.00 | % | | 17.00 | % | | 17.00 | % | | 17.00 | % | Tax computed at the statutory tax rate | | 65,899 | | 149,539 | | 85,076 | | | (31,577 | ) | | 65,899 | | 149,539 | | | | | | | | | | | | | | | | | | (Decrease) increase in tax in respect of: | | | | | | | | | | | | | | | Elimination of tax calculated in respect of the Group’s share in profit of associated companies | | (45,464 | ) | | (190,539 | ) | | (27,353 | ) | | 72,258 | | (45,464 | ) | | (190,539 | ) | Different tax rate applicable to subsidiaries operating overseas | | 6,429 | | (9,297 | ) | | - | | | 4,371 | | 6,429 | | (9,297 | ) | Income subject to tax at a different tax rate | | 116 | | - | | 441 | | | 178 | | 116 | | - | | Non-deductible expenses | | 158,811 | | 44,851 | | 1,028 | | | (2,826 | ) | | 158,811 | | 44,851 | | Exempt income | | (164,822 | ) | | (23,937 | ) | | (61,415 | ) | | (26,862 | ) | | (164,822 | ) | | (23,937 | ) | Taxes in respect of prior years | | (739 | ) | | (361 | ) | | 1 | | | 522 | | (739 | ) | | (361 | ) | Tax in respect of foreign dividend | | 18,447 | | 28,172 | | - | | | 6,665 | | 18,447 | | 28,172 | | Share of non-controlling interests in entities transparent for tax purposes | | (1,082 | ) | | 5,528 | | - | | | - | | (1,082 | ) | | 5,528 | | Tax losses and other tax benefits for the period regarding which deferred taxes were not recorded | | 511 | | 95 | | 7,647 | | | 608 | | 511 | | 95 | | Other differences | | | (126 | ) | | | 274 | | | (727 | ) | | | 1,862 | | | (126 | ) | | | 274 | | Tax expense on income included in the statement of profit and loss | | | 37,980 | | | 4,325 | | | 4,698 | | | | 25,199 | | | 37,980 | | | 4,325 | |
C. | Deferred tax assets and liabilities |
| 1. | Deferred tax assets and liabilities recognized |
The deferred taxes are calculated based on the tax rate expected to apply at the time of the reversal as detailed below. Deferred taxes in respect of subsidiaries were calculated based on the tax rates relevant for each country. | Note 24 – Income Taxes (Cont’d) The deferred tax assets and liabilities are derived from the following items: | | | Property
plant and
equipment | | | Carryforward
of losses and
deductions for
tax purposes | | | Financial
instruments | | | Other* | | | Total | | | | | $ Thousands | | Balance of deferred tax (liability) asset as at January 1, 2021 | | | (95,674 | ) | | | 1,691 | | | | 1,816 | | | | 5,205 | | | | (86,962 | ) | Changes recorded on the statement of profit and loss | | | (23,591 | ) | | | 106,643 | | | | 49 | | | | (80,534 | ) | | | 2,567 | | Changes recorded in other comprehensive income | | | - | | | | - | | | | (423 | ) | | | (2,847 | ) | | | (3,270 | ) | Change as a result of sale of subsidiary | | | (4,050 | ) | | | 2,882 | | | | (232 | ) | | | (5,350 | ) | | | (6,750 | ) | Translation differences | | | (3,915 | ) | | | 1,126 | | | | 50 | | | | (27 | ) | | | (2,766 | ) | Balance of deferred tax (liability) asset as at December 31, 2021 | | | (127,230 | ) | | | 112,342 | | | | 1,260 | | | | (83,553 | ) | | | (97,181 | ) | Changes recorded on the statement of profit and loss | | | (20,103 | ) | | | 8,116 | | | | (235 | ) | | | 13,801 | | | | 1,579 | | Changes recorded in other comprehensive income | | | - | | | | - | | | | (2,657 | ) | | | (4,439 | ) | | | (7,096 | ) | Translation differences | | | 14,615 | | | | (4,370 | ) | | | (103 | ) | | | (147 | ) | | | 9,995 | | Balance of deferred tax (liability) asset as at December 31, 2022 | | | (132,718 | ) | | | 116,088 | | | | (1,735 | ) | | | (74,338 | ) | | | (92,703 | ) |
| | | Property plant and equipment | | | Carryforward of losses and deductions for tax purposes | | | Financial instruments | | | Other* | | | Total | | | | | $ Thousands | | Balance of deferred tax (liability) asset as at January 1, 2022 | | | (127,230 | ) | | | 112,342 | | | | 1,260 | | | | (83,553 | ) | | | (97,181 | ) | Changes recorded on the statement of profit and loss | | | (20,103 | ) | | | 8,116 | | | | (235 | ) | | | 13,801 | | | | 1,579 | | Changes recorded in other comprehensive income | | | - | | | | - | | | | (2,657 | ) | | | (4,439 | ) | | | (7,096 | ) | Translation differences | | | 14,615 | | | | (4,370 | ) | | | (103 | ) | | | (147 | ) | | | 9,995 | | Balance of deferred tax (liability) asset as at December 31, 2022 | | | (132,718 | ) | | | 116,088 | | | | (1,735 | ) | | | (74,338 | ) | | | (92,703 | ) | Changes recorded on the statement of profit and loss | | | (9,626 | ) | | | 6,054 | | | | 24 | | | | (10,601 | ) | | | (14,149 | ) | Changes recorded in other comprehensive income | | | - | | | | - | | | | 354 | | | | 2,851 | | | | 3,205 | | Changes recorded from business combinations | | | (18,468 | ) | | | - | | | | - | | | | - | | | | (18,468 | ) | Translation differences | | | 3,313 | | | | (1,364 | ) | | | 7 | | | | (569 | ) | | | 1,387 | | Balance of deferred tax (liability) asset as at December 31, 2023 | | | (157,499 | ) | | | 120,778 | | | | (1,350 | ) | | | (82,657 | ) | | | (120,728 | ) |
| * | This amount includes deferred tax arising from intangibles, undistributed profits, non-monetary items, associated companies and trade receivables distribution. |
| 2. | The deferred taxes are presented in the statements of financial position as follows: |
| | | As at December 31, | | | | | 2022 | | | 2021 | | | | | $ Thousands | | As part of non-current assets | | | 6,382 | | | | 19,016 | * | As part of current liabilities | | | (1,285 | ) | | | (21,117 | ) | As part of non-current liabilities | | | (97,800 | ) | | | (95,080 | )* | | | | | (92,703 | ) | | | (97,181 | ) |
* The Group made an immaterial correction of classification error of $30 million in non-current deferred taxes from assets to liabilities as at December 31, 2021.
| | | As at December 31, | | | | | 2023 | | | 2022 | | | | | $ Thousands | | As part of non-current assets | | | 15,862 | | | | 6,382 | | As part of current liabilities | | | - | | | | (1,285 | ) | As part of non-current liabilities | | | (136,590 | ) | | | (97,800 | ) | | | | | (120,728 | ) | | | (92,703 | ) |
Income tax rate in Israel is 23% for the years ended December 31, 2023, 2022 2021 and 2020.2021. The tax rate applicable to US companies are (i) federal corporate tax of 21% and (ii) state tax ranging from 4% to 11.5%. According to the provisions of the tax treaty between Israel and the United States, interest payments are subject to withholding tax of 17.5%, and dividend payments are subject to withholding tax of 12.5%. In Singapore, the corporate tax rate is 17%. Dividends received by Kenon from ZIM, an associated company incorporated in Israel, is subject to a withholding tax rate of 5%. On January 4, 2016, Amendment 216 to the Income Tax Ordinance (New Version) – 1961 (hereinafter – “the Ordinance”) was passed in the Knesset. As part of the amendment, OPC’s and Hadera’s income tax rate was reduced by 1.5% to a rate of 25% as from 2016. Furthermore, on December 22, 2016 the Knesset plenum passed the Economic Efficiency Law (Legislative Amendments for Achieving Budget Objectives in the Years 2017 and 2018) – 2016, by which, inter alia, the corporate tax rate would be reduced from 25% to 23% in two steps. The first step will be to a rate of 24% as from January 2017 and the second step will be to a rate of 23% as from January 2018. As a result of reducing the tax rate to 23%, the deferred tax balance as at December 31, 2022 and 2021 were calculated according to the new tax rates specified in the Economic Efficiency Law (Legislative Amendments for Achieving Budget Objectives in the years 2017 and 2018), at the tax rate expected to apply on the reversal date.
Note 24 – Income Taxes (Cont’d) | 3. | Tax and deferred tax balances not recorded |
Unrecognized deferred tax assets | | | As at December 31, | | | | | 2022 | | | 2021 | | | | | $ Thousands | | Losses for tax purposes | | | 153,907 | | | | 167,758 | |
| | | As at December 31, | | | | | 2023 | | | 2022 | | | | | $ Thousands | | Losses for tax purposes | | | 130,147 | | | | 153,907 | |
According to IsraeliIn Israel, as of December 31, 2023, the Group has tax law, there is no time limit on the utilizationloss carryforwards of approximately NIS 650 million (approximately $179 million). OPC did not recognize a deferred tax asset in respect of approximately NIS 150 million (approximately $41 million) in tax losses, and the utilization of the deductible temporary differences. Deferred tax assets were not recognized for these items, since it isdoes not expectedexpect that there will be an expected foreseeable taxable income in the future, against which the tax benefits can be utilized.
In the United States, as of December 31, 2022,2023, the Group hadhas tax loss carryforwards of approximately $470 million at the federal level. In respect of net operating losses for which no deferred taxes have been created, as detailed below: • | Net operating losses for tax purposes of $108tax purposes, the Group has tax losses of $89 million, which may be offset for tax purposes in the United States against future income, subject to complying with the conditions of the law, some of which are not under the OPC’s control and, therefore, OPC did not recognize deferred tax assets in respect thereof. These losses will expire in 2027-2037.
|
• | $2 million in tax credits, offsetable for tax purposes in the United States against future profits in the United States, are subject to complying with the conditions of the law, some of which are not under the OPC’s control and, therefore, OPC did not recognize deferred tax assets. These losses will expire in 2027-2037.
|
Unrecognized deferred tax liabilities The tax effect on taxable temporary differences of $32$5 million (2021: $112(2022: $32 million) has not been recorded as this arises from undistributed profits of the Group’s associated companies which the Group does not expect to incur. Singapore does not impose taxes on disposal gains, which are considered to be capital in nature, but imposes tax on income and gains of a trading nature. As such, whenever a gain is realized on the disposal of an asset, the practice of the Inland Revenue Authority of Singapore is to rely upon a set of commonly-applied rules in determining the question of capital (not taxable) or revenue (taxable). Under Singapore tax laws, any gains derived by a divesting company from its disposal of ordinary shares in an investee company between June 1, 2012 and December 31, 2027 are generally not taxable if, immediately prior to the date of such disposal, the divesting company has held at least 20% of the ordinary shares in the investee company for a continuous period of at least 24 months. Note 25 – Earnings per Share Data used in calculation of the basic / diluted earnings per share | A. | (Loss)/Profit allocated to the holders of the ordinary shareholders |
| | | For the year ended December 31, | | | | | 2022 | | | 2021 | | | 2020 | | | | | $ Thousands | | Profit for the year attributable to Kenon’s shareholders | | | 312,652 | | | | 930,273 | | | | 507,106 | | Profit for the year from discontinued operations (after tax) attributable to Kenon’s shareholders | | | - | | | | - | | | | 8,476 | | Profit for the year from continuing operations attributable to Kenon’s shareholders | | | 312,652 | | | | 930,273 | | | | 498,630 | |
| | | For the year ended December 31, | | | | | 2023 | | | 2022 | | | 2021 | | | | | $ Thousands | | (Loss)/Profit for the year attributable to Kenon’s shareholders | | | (235,978 | ) | | | 312,652 | | | | 930,273 | |
| B. | Number of ordinary shares |
| | | For the year ended December 31 | | | | | 2022 | | | 2021 | | | 2020 | | | | | Thousands | | Weighted Average number of shares used in calculation of basic/diluted earnings per share | | | 53,885 | | | | 53,879 | | | | 53,870 | |
| | | For the year ended December 31 | | | | | 2023 | | | 2022 | | | 2021 | | | | | Thousands | | Weighted Average number of shares used in calculation of basic/diluted earnings per share | | | 53,360 | | | | 53,885 | | | | 53,879 | |
Note 26 – Discontinued Operations
(a) | I.C. Power (Latin America businesses)
|
In December 2017, Kenon, through its wholly-owned subsidiary Inkia, sold its Latin American and Caribbean power business to an infrastructure private equity firm, I Squared Capital (“ISQ”). As a result, the Latin American and Caribbean businesses were classified as discontinued operations.
Kenon’s subsidiaries are entitled to receive payments in connection with certain claims held by companies within Inkia’s businesses. In 2020, following the completion of a tax review related to the sale, Kenon recognized income of $8 million, net of taxes.
Set forth below are the results attributable to the discontinued operations
| | Year ended
December 31,
2022
| | | Year ended
December 31,
2021
| | | Year ended
December 31,
2020
| | | | $ Thousands
| | Recovery of retained claims
| | | -
| | | | -
| | | | 9,923
| | Income taxes
| | | -
| | | | -
| | | | (1,447
| )
| Profit after income taxes
| | | -
| | | | -
| | | | 8,476
| | | | | | | | | | | | | | | Net cash flows provided by investing activities
| | | -
| | | | -
| | | | 8,476
| |
Note 2726 – Segment, Customer and Geographic Information Financial information of the reportable segments is set forth in the following tables: | | | OPC Israel | | | CPV Group | | | ZIM | | | Others | | | Total | | | | | $ Thousands | | 2023 | | | | | | | | | | | | | | | | Revenue | | | 618,830 | | | | 72,966 | | | | - | | | | - | | | | 691,796 | | | | | | | | | | | | | | | | | | | | | | | | Profit/(loss) before taxes | | | 48,750 | | | | 16,515 | | | | (266,906 | ) | | | 15,892 | | | | (185,749 | ) | Income tax expense | | | (14,174 | ) | | | (4,136 | ) | | | - | | | | (6,889 | ) | | | (25,199 | ) | Profit/(loss) from continuing operations | | | 34,576 | | | | 12,379 | | | | (266,906 | ) | | | 9,003 | | | | (210,948 | ) | | | | | | | | | | | | | | | | | | | | | | | Depreciation and amortization | | | 65,659 | | | | 25,056 | | | | - | | | | 224 | | | | 90,939 | | Financing income | | | (6,038 | ) | | | (5,641 | ) | | | - | | | | (27,682 | ) | | | (39,361 | ) | Financing expenses | | | 48,182 | | | | 16,790 | | | | - | | | | 1,361 | | | | 66,333 | | Other items: | | | | | | | | | | | | | | | | | | | | | Losses related to ZIM | | | - | | | | - | | | | 860 | | | | - | | | | 860 | | Share in profit of CPV excluding share of depreciation and amortization and financing expenses, net | | | - | | | | 156,636 | | | | - | | | | - | | | | 156,636 | | Changes in net expenses, not in the ordinary course of
business and/or of a non-recurring nature | | | - | | | | 4,878 | | | | - | | | | - | | | | 4,878 | | Share of changes in fair value of derivative financial instruments | | | - | | | | (2,168 | ) | | | - | | | | - | | | | (2,168 | ) | Share in (profit)/loss of associated companies | | | - | | | | (65,566 | ) | | | 266,046 | | | | - | | | | 200,480 | | | | | | 107,803 | | | | 129,985 | | | | 266,906 | | | | (26,097 | ) | | | 478,597 | | | | | | | | | | | | | | | | | | | | | | | | Adjusted EBITDA | | | 156,553 | | | | 146,500 | | | | - | | | | (10,205 | ) | | | 292,848 | | | | | | | | | | | | | | | | | | | | | | | | Segment assets | | | 1,673,149 | | | | 1,102,939 | | | | - | | | | 629,196 | | | | 3,405,284 | | Investments in associated companies | | | - | | | | 703,156 | | | | - | | | | - | | | | 703,156 | | | | | | | | | | | | | | | | | | | | | | 4,108,440 | | Segment liabilities | | | 1,423,624 | | | | 609,958 | | | | - | | | | 4,634 | | | | 2,038,216 | |
| | | OPC Israel | | | CPV Group | | | ZIM | | | Others* | | | Total | | | | | $ Thousands | | 2022 | | | | | | | | | | | | | | | | Revenue | | | 516,668 | | | | 57,289 | | | | - | | | | - | | | | 573,957 | | | | | | | | | | | | | | | | | | | | | | | | Profit before taxes | | | 23,728 | | | | 61,039 | | | | 305,376 | | | | (2,504 | ) | | | 387,639 | | Income tax expense | | | (9,522 | ) | | | (9,892 | ) | | | - | | | | (18,566 | ) | | | (37,980 | ) | Profit/(loss) from continuing operations | | | 14,206 | | | | 51,147 | | | | 305,376 | | | | (21,070 | ) | | | 349,659 | | | | | | | | | | | | | | | | | | | | | | | | Depreciation and amortization | | | 47,134 | | | | 15,519 | | | | - | | | | 223 | | | | 62,876 | | Financing income | | | (10,301 | ) | | | (25,197 | ) | | | - | | | | (9,188 | ) | | | (44,686 | ) | Financing expenses | | | 42,062 | | | | 7,521 | | | | - | | | | 814 | | | | 50,397 | | Other items: | | | | | | | | | | | | | | | | | | | | | Losses related to ZIM | | | - | | | | - | | | | 727,650 | | | | - | | | | 727,650 | | Share in profit of associated companies | | | - | | | | (85,149 | ) | | | (1,033,026 | ) | | | - | | | | (1,118,175 | ) | | | | | 78,895 | | | | (87,306 | ) | | | (305,376 | ) | | | (8,151 | ) | | | (321,938 | ) | | | | | | | | | | | | | | | | | | | | | | | Adjusted EBITDA | | | 102,623 | | | | (26,267 | ) | | | - | | | | (10,655 | ) | | | 65,701 | | | | | | | | | | | | | | | | | | | | | | | | Segment assets | | | 1,503,811 | | | | 552,569 | | | | - | | | | 636,263 | | | | 2,692,643 | | Investments in associated companies | | | | | | | 652,358 | | | | 427,059 | | | | - | | | | 1,079,417 | | | | | | | | | | | | | | | | | | | | | | 3,772,060 | | Segment liabilities | | | 1,226,395 | | | | 241,468 | | | | - | | | | 8,279 | | | | 1,476,142 | |
| | | OPC Israel | | | CPV Group | | | ZIM | | | Others* | | | Total | | | | | $ Thousands | | 2021 | | | | | | | | | | | | | | | | Revenue | | | 437,043 | | | | 50,720 | | | | - | | | | - | | | | 487,763 | | | | | | | | | | | | | | | | | | | | | | | | (Loss)/profit before taxes | | | (57,040 | ) | | | (60,709 | ) | | | 1,260,789 | | | | (263,398 | ) | | | 879,642 | | Income tax benefit/(expense) | | | 10,155 | | | | 13,696 | | | | - | | | | (28,176 | ) | | | (4,325 | ) | (Loss)/profit from continuing operations | | | (46,885 | ) | | | (47,013 | ) | | | 1,260,789 | | | | (291,574 | ) | | | 875,317 | | | | | | | | | | | | | | | | | | | | | | | | Depreciation and amortization | | | 44,296 | | | | 13,102 | | | | - | | | | 242 | | | | 57,640 | | Financing income | | | (2,730 | ) | | | (37 | ) | | | - | | | | (167 | ) | | | (2,934 | ) | Financing expenses | | | 119,392 | | | | 24,640 | | | | - | | | | 263 | | | | 144,295 | | Other items: | | | | | | | | | | | | | | | | | | | | | Losses related to Qoros | | | - | | | | - | | | | - | | | | 251,483 | | | | 251,483 | | Losses related to ZIM | | | - | | | | - | | | | 204 | | | | - | | | | 204 | | Share in losses/(profit) of associated companies | | | 419 | | | | 10,425 | | | | (1,260,993 | ) | | | - | | | | (1,250,149 | ) | | | | | 161,377 | | | | 48,130 | | | | (1,260,789 | ) | | | 251,821 | | | | (799,461 | ) | | | | | | | | | | | | | | | | | | | | | | | Adjusted EBITDA | | | 104,337 | | | | (12,579 | ) | | | - | | | | (11,577 | ) | | | 80,181 | | | | | | | | | | | | | | | | | | | | | | | | Segment assets | | | 1,481,149 | | | | 431,474 | | | | - | | | | 226,337 | | | | 2,138,960 | | Investments in associated companies | | | - | | | | 545,242 | | | | 1,354,212 | | | | - | | | | 1,899,454 | | | | | | | | | | | | | | | | | | | | | | 4,038,414 | | Segment liabilities | | | 1,324,217 | | | | 218,004 | | | | - | | | | 215,907 | | | | 1,758,128 | |
Note 2726 – Segment, Customer and Geographic Information (Cont’d) | | | OPC Israel | | | CPV Group | | | ZIM | | | Others | | | Total | | | | | $ Thousands | | 2022 | | | | | | | | | | | | | | | | | | | | | Revenue | | | 516,668 | | | | 57,289 | | | | - | | | | - | | | | 573,957 | | | | | | | | | | | | | | | | | | | | | | | | Profit before taxes | | | 23,728 | | | | 61,039 | | | | 305,376 | | | | (2,504 | ) | | | 387,639 | | Income tax expense | | | (9,522 | ) | | | (9,892 | ) | | | - | | | | (18,566 | ) | | | (37,980 | ) | Profit/(loss) from continuing operations | | | 14,206 | | | | 51,147 | | | | 305,376 | | | | (21,070 | ) | | | 349,659 | | | | | | | | | | | | | | | | | | | | | | | | Depreciation and amortization | | | 47,134 | | | | 15,519 | | | | - | | | | 223 | | | | 62,876 | | Financing income | | | (10,301 | ) | | | (25,197 | ) | | | - | | | | (9,188 | ) | | | (44,686 | ) | Financing expenses | | | 42,062 | | | | 7,521 | | | | - | | | | 814 | | | | 50,397 | | Other items: | | | | | | | | | | | | | | | | | | | | | Losses related to ZIM | | | - | | | | - | | | | 727,650 | | | | - | | | | 727,650 | | Share in profit of CPV excluding share of depreciation and
amortization and financing expenses, net | | | - | | | | 167,862 | | | | - | | | | - | | | | 167,862 | | Changes in net expenses, not in the ordinary course of
business and/or of a non-recurring nature | | | - | | | | 2,978 | | | | - | | | | - | | | | 2,978 | | Share of changes in fair value of derivative financial instruments | | | - | | | | 2,383 | | | | - | | | | - | | | | 2,383 | | Share in profit of associated companies | | | - | | | | (85,149 | ) | | | (1,033,026 | ) | | | - | | | | (1,118,175 | ) | | | | | 78,895 | | | | 85,917 | | | | (305,376 | ) | | | (8,151 | ) | | | (148,715 | ) | | | | | | | | | | | | | | | | | | | | | | | Adjusted EBITDA | | | 102,623 | | | | 146,956 | | | | - | | | | (10,655 | ) | | | 238,924 | | | | | | | | | | | | | | | | | | | | | | | | Segment assets | | | 1,503,811 | | | | 552,569 | | | | - | | | | 636,263 | | | | 2,692,643 | | Investments in associated companies | | | - | | | | 652,358 | | | | 427,059 | | | | - | | | | 1,079,417 | | | | | | | | | | | | | | | | | | | | | | 3,772,060 | | Segment liabilities | | | 1,226,395 | | | | 241,468 | | | | - | | | | 8,279 | | | | 1,476,142 | |
| | | OPC Israel | | | CPV Group | | | ZIM | | | Others* | | | Total | | | | | $ Thousands | | 2020 | | | | | | | | | | | | | | | | Revenue | | | 385,625 | | | | - | | | | - | | | | 845 | | | | 386,470 | | | | | | | | | | | | | | | | | | | | | | | | (Loss)/profit before taxes | | | (8,620 | ) | | | - | | | | 210,647 | | | | 298,420 | | | | 500,447 | | Income tax expense | | | (3,963 | ) | | | - | | | | - | | | | (735 | ) | | | (4,698 | ) | (Loss)/profit from continuing operations | | | (12,583 | ) | | | - | | | | 210,647 | | | | 297,685 | | | | 495,749 | | | | | | | | | | | | | | | | | | | | | | | | Depreciation and amortization | | | 33,981 | | | | - | | | | - | | | | 190 | | | | 34,171 | | Financing income | | | (354 | ) | | | - | | | | - | | | | (13,937 | ) | | | (14,291 | ) | Financing expenses | | | 50,349 | | | | - | | | | - | | | | 825 | | | | 51,174 | | Other items: | | | | | | | | | | | | | | | | | | | | | Net gains related to Qoros | | | - | | | | - | | | | - | | | | (309,918 | ) | | | (309,918 | ) | Write back of impairment of investment | | | - | | | | - | | | | (43,505 | ) | | | - | | | | (43,505 | ) | Share in losses/(profit) of associated companies | | | - | | | | - | | | | (167,142 | ) | | | 6,248 | | | | (160,894 | ) | | | | | 83,976 | | | | - | | | | (210,647 | ) | | | (316,592 | ) | | | (443,263 | ) | | | | | | | | | | | | | | | | | | | | | | | Adjusted EBITDA | | | 75,356 | | | | - | | | | - | | | | (18,172 | ) | | | 57,184 | | | | | | | | | | | | | | | | | | | | | | | | Segment assets | | | 1,723,967 | | | | - | | | | - | | | | 461,218 | | | | 2,185,185 | | Investments in associated companies | | | - | | | | - | | | | 297,148 | | | | - | | | | 297,148 | | | | | | | | | | | | | | | | | | | | | | 2,482,333 | | Segment liabilities | | | 1,200,363 | | | | - | | | | - | | | | 5,962 | | | | 1,206,325 | |
* Financial information of Quantum were consolidated into a single segment, “Others”, as it is no longer a material reportable segment. Refer to Note 10 for further details.26 – Segment, Customer and Geographic Information (Cont’d)
| | | OPC Israel | | | CPV Group | | | ZIM | | | Others | | | Total | | | | | $ Thousands | | 2021 | | | | | | | | | | | | | | | | Revenue | | | 437,043 | | | | 50,720 | | | | - | | | | - | | | | 487,763 | | | | | | | | | | | | | | | | | | | | | | | | (Loss)/profit before taxes | | | (57,040 | ) | | | (60,709 | ) | | | 1,260,789 | | | | (263,398 | ) | | | 879,642 | | Income tax benefit/(expense) | | | 10,155 | | | | 13,696 | | | | - | | | | (28,176 | ) | | | (4,325 | ) | (Loss)/profit from continuing operations | | | (46,885 | ) | | | (47,013 | ) | | | 1,260,789 | | | | (291,574 | ) | | | 875,317 | | | | | | | | | | | | | | | | | | | | | | | | Depreciation and amortization | | | 44,296 | | | | 13,102 | | | | - | | | | 242 | | | | 57,640 | | Financing income | | | (2,730 | ) | | | (37 | ) | | | - | | | | (167 | ) | | | (2,934 | ) | Financing expenses | | | 119,392 | | | | 24,640 | | | | - | | | | 263 | | | | 144,295 | | Other items: | | | | | | | | | | | | | | | | | | | | | Losses related to Qoros | | | - | | | | - | | | | - | | | | 251,483 | | | | 251,483 | | Losses related to ZIM | | | - | | | | - | | | | 204 | | | | - | | | | 204 | | Share in profit of CPV excluding share of depreciation and
amortization and financing expenses, net | | | - | | | | 105,668 | | | | - | | | | - | | | | 105,668 | | Changes in net expenses, not in the ordinary course of
business and/or of a non-recurring nature | | | - | | | | 929 | | | | - | | | | - | | | | 929 | | Share of changes in fair value of derivative financial instruments | | | - | | | | 44,901 | | | | - | | | | - | | | | 44,901 | | Share in losses/(profit) of associated companies | | | 419 | | | | 10,425 | | | | (1,260,993 | ) | | | - | | | | (1,250,149 | ) | | | | | 161,377 | | | | 199,628 | | | | (1,260,789 | ) | | | 251,821 | | | | (647,963 | ) | | | | | | | | | | | | | | | | | | | | | | | Adjusted EBITDA | | | 104,337 | | | | 138,919 | | | | - | | | | (11,577 | ) | | | 231,679 | | | | | | | | | | | | | | | | | | | | | | | | Segment assets | | | 1,481,149 | | | | 431,474 | | | | - | | | | 226,337 | | | | 2,138,960 | | Investments in associated companies | | | - | | | | 545,242 | | | | 1,354,212 | | | | - | | | | 1,899,454 | | | | | | | | | | | | | | | | | | | | | | 4,038,414 | | Segment liabilities | | | 1,324,217 | | | | 218,004 | | | | - | | | | 215,907 | | | | 1,758,128 | |
| A. | Customer and Geographic Information |
Major customers Following is information on the total sales of the Group to material customers and the percentage of the Group’s total revenues (in $ Thousands): | | 2022 | | | 2021 | | | 2020 | | | 2023 | | | 2022 | | | 2021 | | | | Total
revenues | | | Percentage
of revenues
of the Group | | | Total
revenues | | | Percentage
of revenues
of the Group | | | Total
revenues | | | Percentage
of revenues
of the Group | | | Total revenues | | | Percentage of revenues of the Group | | | Total revenues | | | Percentage of revenues of the Group | | | Total revenues | | | Percentage of revenues of the Group | | | | | | | | | | | | | | | | | | | | | | | | | | | | | | | | | | | | | | 107,081 | | | | 18.66 | % | | | 93,959 | | | | 19.26 | % | | | 86,896 | | | | 22.48 | % | | 99,945 | | 14.45 | % | | 107,081 | | 18.66 | % | | 93,959 | | | 19.26 | % | | | | 73,518 | | | | 12.81 | % | | | 70,801 | | | | 14.52 | % | | | 74,694 | | | | 19.33 | % | | 79,000 | | 11.42 | % | | 73,518 | | 12.81 | % | | 70,801 | | | 14.52 | % | | | | - | * | | | - | * | | | - | * | | | - | * | | | - | * | | | - | * | | 71,013 | | 10.27 | % | | - | * | | - | * | | - | * | | - | * | | | | - | * | | | - | * | | | - | * | | | - | * | | | - | * | | | - | * | | Customer 5
| | | - | * | | | - | * | | | - | * | | | - | * | | | - | * | | | - | * | |
* Represents an amount less than 10% of the revenues. Note 2726 – Segment, Customer and Geographic Information (Cont’d) Information based on geographic areas The Group’s geographic revenues are as follows: | | | For the year ended December 31, | | | | | 2022 | | | 2021 | | | 2020 | | | | | $ Thousands | | Israel | | | 516,668 | | | | 437,043 | | | | 385,625 | | United States | | | 57,289 | | | | 50,720 | | | | - | | Others | | | - | | | | - | | | | 845 | | Total revenue | | | 573,957 | | | | 487,763 | | | | 386,470 | |
| | | For the year ended December 31, | | | | | 2023 | | | 2022 | | | 2021 | | | | | $ Thousands | | Israel | | | 618,830 | | | | 516,668 | | | | 437,043 | | United States | | | 72,966 | | | | 57,289 | | | | 50,720 | | Total revenue | | | 691,796 | | | | 573,957 | | | | 487,763 | |
The Group’s non-current assets* based on the basis of geographic location: | | | As at December 31, | | | As at December 31, | | | | | 2022 | | 2021 | | | 2023 | | 2022 | | | | | $ Thousands | | | $ Thousands | | Israel | | 1,050,386 | | 1,039,505 | | | 1,290,652 | | 1,050,386 | | United States | | 392,734 | | 310,426 | | | 745,442 | | 392,734 | | Others | | | 96 | | | 171 | | | | 15 | | | 96 | | Total non-current assets | | | 1,443,216 | | | 1,350,102 | | | | 2,036,109 | | | 1,443,216 | |
* Composed of property, plant and equipment and intangible assets. Seasonality OPC’s activity in Israel is subject to seasonal fluctuations as a result of changes in the Electricity Authority’s published regulated Time of Use Electricity Tariff (hereinafter – "the TAOZ"). The year is divided into 3 seasons, as follows: Summer (July and August), Winter (December, January and February) and Transition (March through June and September through November). For each season a different tariff is set. The results of OPC are based on the generation component which is part of the TAOZ. OPC’s activity in the US (through the CPV Group) from generation of electricity are seasonal and are impacted by variable demand, gas and electricity prices, as well as the weather. In general, with respect to power plants running on natural gas, there is higher profitability in periods of the year where the temperatures are the highest or lowest, which are usually in summer and in winter, respectively. Similarly, the profitability of renewable energy production is subject to production volume, which varies based on wind and solar constructions, as well as its electricity price, which tends to be higher in winter, unless there is a fixed contractual price for the project. Note 2827 – Related-party Information | A. | Identity of related parties: |
The Group’s related parties include Kenon’s beneficial owners and Kenon’s subsidiaries, affiliates and associates companies. Kenon’s immediate holding company is Ansonia Holdings Singapore B.V. A discretionary trust, in which Mr. Idan Ofer is the ultimate beneficiary, indirectly holds 100% of Ansonia Holdings Singapore B.V. In the ordinary course of business, some of the Group’s subsidiaries and affiliates engage in business activities with each other. Ordinary course of business transactions are aggregated in this note. Other than disclosed elsewhere in the consolidated financial statements during the period, the Group engaged the following material related party transactions. Key management personnel of the Company are those persons having the authority and responsibility for planning, directing and controlling the activities of the Company. The directors, CEO and CFO are considered key management personnel of the Company. Note 27 – Related-party Information (Cont’d) | B. | Transactions with directors and officers (Kenon's directors and officers): |
Key management personnel compensation | | | For the year ended
December 31, | | | | | 2022 | | | 2021 | | | | | $ Thousands | | Short-term benefits | | | 2,229 | | | | 1,994 | | Share-based payments | | | 292 | | | | 258 | | | | | | 2,521 | | | | 2,252 | |
Note 28 – Related-party Information (Cont’d)
| | | | | | |
| | | | | | | | | | | For the year ended December 31, | | | | | 2023 | | | 2022 | | | | | $ Thousands | | Short-term benefits | | | 2,316 | | | | 2,229 | | Share-based payments | | | 296 | | | | 292 | | | | | | 2,612 | | | | 2,521 | |
| C. | Transactions with related parties (including associates): |
| | | For the year ended December 31, | | | | | 2023 | | | 2022 | | | 2021 | | | | | $ Thousands | | Sale of electricity and revenues from provision of services | | | 31,694 | | | | 94,264 | | | | 88,004 | | Cost of sales | | | (2,620 | ) | | | (658 | ) | | | 7,802 | | Dividend received from associate | | | 154,672 | | | | 727,309 | | | | 143,964 | | Other expenses/(income), net | | | 479 | | | | - | | | | (337 | ) | Financing (income)/expenses, net | | | (4,130 | ) | | | 580 | | | | 39,901 | |
| | | For the year ended December 31, | | | | | 2022 | | | 2021 | | | 2020 | | | | | $ Thousands | | Sale of electricity and revenues from provision of services | | | 94,264 | | | | 88,004 | | | | 80,416 | | Cost of sales | | | (658) | | | | 7,802 | | | | 16 | | Dividend received from associate | | | 727,309 | | | | 143,964 | | | | - | | Other income, net | | | - | | | | (337 | ) | | | (90 | ) | Financing expenses, net | | | 580 | | | | 39,901 | | | | 2,156 | | Interest expenses capitalized to property plant and equipment | | | - | | | | - | | | | 119 | |
| D. | Balances with related parties (including associates): |
| | | As at December 31, | | | | | 2023 | | | 2022 | | | | | Other related parties * | | | | | $ Thousands | | Cash and cash equivalent | | | 55,505 | | | | 176,246 | | Short-term deposits and restricted cash | | | - | | | | 35,662 | | Trade receivables and other receivables | | | 33,668 | | | | 15,421 | | Other payables | | | (108 | ) | | | (535 | ) | | | | | | | | | | | Loans and Other Liabilities | | | | | | | | | In US dollar or linked thereto | | | (43,171 | ) | | | (34,524 | ) |
| | | As at December 31, | | | | | 2022 | | | 2021 | | | | | Other related parties * | | | | | $ Thousands | | Cash and cash equivalent | | | 176,246 | | | | 89,814 | | Short-term deposits and restricted cash | | | 35,662 | | | | - | | Trade receivables and other receivables | | | 15,421 | | | | 14,860 | | Other payables | | | (535 | ) | | | (424 | ) | | | | | | | | | | | Loans and Other Liabilities | | | �� | | | | | | In US dollar or linked thereto | | | (34,524 | ) | | | (27,587 | ) |
| | * IC, Israel Chemicals Ltd (“ICL”), Oil Refineries Ltd (“Bazan”). |
These balances relate to amounts with entities that are related to Kenon's beneficial owners. |
| E. | For further investment by Kenon into OPC, see Note 11.A.511.A.7 and 11.A.6.11.A.8. |
Note 2928 – Financial Instruments The Group has international activity in which it is exposed to credit, liquidity and market risks (including currency, interest, inflation and other price risks). In order to reduce the exposure to these risks, the Group holds derivative financial instruments, (including forward transactions, interest rate swap (“SWAP”) transactions, and options) for the purpose of economic (not accounting) hedging of foreign currency risks, inflation risks, commodity price risks, interest risks and risks relating to the price of inputs. This note presents information about the Group’s exposure to each of the above risks, and the Group’s objectives, policies and processes for measuring and managing the risk. The risk management of the Group companies is executed by them as part of the ongoing current management of the companies. The Group companies monitor the above risks on a regular basis. The hedge policies with respect to all the different types of exposures are discussed by the boards of directors of the companies. The comprehensive responsibility for establishing the base for the risk management of the Group and for supervising its implementation lies with the Board of Directors and the senior management of the Group. Counterparty credit risk is the risk that the financial benefits of contracts with a specific counterparty will be lost if a counterparty defaults on their obligations under the contract. This includes any cash amounts owed to the Group by those counterparties, less any amounts owed to the counterparty by the Group where a legal right of set-offs exists and also includes the fair values of contracts with individual counterparties which are included in the financial statements. The maximum exposure to credit risk at each reporting date is the carrying value of each class of financial assets mentioned in this note. | (1) | Exposure to credit risk The carrying amount of financial assets represents the maximum credit exposure. The maximum exposure to credit risk as of year end was: |
The carrying amount of financial assets represents the maximum credit exposure. The maximum exposure to credit risk as at year end was:| | | As at December 31, | | | | | 2023 | | | 2022 | | | | | $ Thousands | | | | | Carrying amount | | Cash and cash equivalents | | | 696,838 | | | | 535,171 | | Short-term and long-term deposits and restricted cash | | | 16,769 | | | | 61,136 | | Trade receivables and other assets | | | 189,001 | | | | 122,797 | | Short-term and long-term derivative instruments | | | - | | | | 16,730 | | Other investments | | | 215,797 | | | | 344,780 | | | | | | 1,118,405 | | | | 1,080,614 | |
| | | As at December 31, | | | | | 2022 | | | 2021 | | | | | $ Thousands | | | | | Carrying amount | | Cash and cash equivalents | | | 535,171 | | | | 474,544 | | Short-term and long-term deposits and restricted cash | | | 61,136 | | | | 21,692 | | Trade receivables and other assets | | | 122,797 | | | | 97,580 | | Short-term and long-term derivative instruments | | | 16,730 | | | | 9,103 | | Other investments | | | 344,780 | | | | - | | | | | 1,080,614 | | | | 602,919 | |
Based on the credit risk profiles of the Group’s counterparties relating to the Group’s cash and cash equivalents, short-term and long-term deposits and restricted cash, trade receivables and other assets, short-term and long-term derivative instruments, the Group has assessed expected credit losses on the financial assets to be immaterial. The maximum exposure to credit risk for trade receivables as atof year end, by geographic region was as follows: | | | As at December 31, | | | | | 2022 | | | 2021 | | | | | $ Thousands | | Israel | | | 67,177 | | | | 56,632 | | Other regions | | | 6,723 | | | | 6,011 | | | | | | 73,900 | | | | 62,643 | |
| | | As at December 31, | | | | | 2023 | | | 2022 | | | | | $ Thousands | | Israel | | | 55,865 | | | | 67,177 | | United States | | | 12,129 | | | | 6,723 | | | | | | 67,994 | | | | 73,900 | |
Note 2928 – Financial Instruments (Cont’d) Set forth below is an aging of the trade receivables: | | | As at December 31 | | | | | 2022 | | | 2021 | | | | | $ Thousands | | Not past due nor impaired | | | 73,900 | | | | 62,643 | |
| | | As at December 31 | | | | | 2023 | | | 2022 | | | | | $ Thousands | | Not past due nor impaired | | | 67,994 | | | | 73,900 | |
No ECL has been recorded on any trade receivable amounts based on historical credit loss data and the Group’s view of economic conditions over the expected lives of the receivables. The following table provides information about the movement of ECL on other investments as atof December 31, 2022:2023: | | | For the year ended December 31, | | | | | 2022 | | | 2021 | | | 2020 | | | | | $ Thousands | | Impairment loss on debt securities at FVOCI | | | 732 | | | | - | | | | - | |
| | | ECL on other investments | | | | | 2023 | | | 2022 | | | 2021 | | | | | $ Thousands | | Balance as at 1 January | | | 732 | | | | - | | | | - | | Impairment loss on debt securities at FVOCI | | | 642 | | | | 732 | | | | - | | Balance as at 31 December | | | 1,374 | | | | 732 | | | | - | |
Liquidity risk is the risk that the Group will not be able to meet its financial obligations as they fall due. The Group’s approach to managing liquidity is to ensure, as far as possible, that it will always have sufficient liquidity to meet its liabilities when due, under both normal and adverse credit and market conditions, without incurring unacceptable losses or risking damage to the Group’s reputation. The Group manages its liquidity risk by means of holding cash balances, short-term deposits, other liquid financial assets and credit lines. Set forth below are the anticipated repayment dates of the financial liabilities, including an estimate of the interest payments. This disclosure does not include amounts regarding which there are offset agreements: | | | As at December 31, 2022 | | | As at December 31, 2023 | | | | | Book value | | | Projected
cash flows | | | Up to 1 year | | | 1-2 years | | | 2-5 years | | | More than 5
years | | | Book value | | | Projected cash flows | | | Up to 1 year | | | 1-2 years | | | 2-5 years | | | More than 5 years | | | | | $ Thousands | | | $ Thousands | | Non-derivative financial liabilities | | | | | | | | | | | | | | | | | | | | | | | | | | | Trade payables | | 95,036 | | 95,036 | | 95,036 | | - | | - | | - | | | 70,661 | | 70,661 | | 70,661 | | - | | - | | - | | Other current liabilities | | 17,681 | | 17,681 | | 17,681 | | - | | - | | - | | | 84,656 | | 84,656 | | 84,656 | | - | | - | | - | | Lease liabilities including interest payable * | | 37,570 | | 46,938 | | 17,812 | | 2,855 | | 6,756 | | 19,515 | | | 61,428 | | 140,049 | | 4,725 | | 4,856 | | 12,923 | | 117,545 | | Debentures (including interest payable) * | | 526,771 | | 588,997 | | 22,413 | | 66,467 | | 223,939 | | 276,178 | | | 511,030 | | 559,419 | | 65,669 | | 68,921 | | 313,293 | | 111,536 | | Loans from banks and others including interest * | | | 640,348 | | | 793,946 | | | 44,142 | | | 74,438 | | | 172,343 | | | 503,023 | | | | 1,023,916 | | | 1,316,647 | | | 173,743 | | | 100,209 | | | 375,479 | | | 667,216 | | | | | | | | | | | | | | | | | | | | | | | | | | | | | | | | | | | | | | | | 1,317,406 | | | 1,542,598 | | | 197,084 | | | 143,760 | | | 403,038 | | | 798,716 | | | | 1,751,691 | | | 2,171,432 | | | 399,454 | | | 173,986 | | | 701,695 | | | 896,297 | |
| * Includes current portion of long-term liabilities. |
Note 28 – Financial Instruments (Cont’d) | | | As at December 31, 2022 | | | | | Book value | | | Projected cash flows | | | Up to 1 year | | | 1-2 years | | | 2-5 years | | | More than 5 years | | | | | $ Thousands | | Non-derivative financial liabilities | | | | | | | | | | | | | | | | | | | Trade payables | | | 95,036 | | | | 95,036 | | | | 95,036 | | | | - | | | | - | | | | - | | Other current liabilities | | | 17,681 | | | | 17,681 | | | | 17,681 | | | | - | | | | - | | | | - | | Lease liabilities including interest payable * | | | 37,570 | | | | 46,938 | | | | 17,812 | | | | 2,855 | | | | 6,756 | | | | 19,515 | | Debentures (including interest payable) * | | | 526,771 | | | | 588,997 | | | | 22,413 | | | | 66,467 | | | | 223,939 | | | | 276,178 | | Loans from banks and others including interest * | | | 640,348 | | | | 793,946 | | | | 44,142 | | | | 74,438 | | | | 172,343 | | | | 503,023 | | | | | | | | | | | | | | | | | | | | | | | | | | | | | | | | 1,317,406 | | | | 1,542,598 | | | | 197,084 | | | | 143,760 | | | | 403,038 | | | | 798,716 | |
| | * | Includes current portion of long-term liabilities. |
Note 29 – Financial Instruments (Cont’d)
| | | As at December 31, 2021 | | | | | Book value | | | Projected
cash flows | | | Up to 1 year | | | 1-2 years | | | 2-5 years | | | More than 5
years | | | | | $ Thousands | | Non-derivative financial liabilities | | | | | | | | | | | | | | | | | | | Trade payables | | | 136,505 | | | | 136,505 | | | | 136,505 | | | | - | | | | - | | | | - | | Other current liabilities | | | 204,686 | | | | 204,686 | | | | 204,686 | | | | - | | | | - | | | | - | | Lease liabilities including interest payable * | | | 33,395 | | | | 38,375 | | | | 19,492 | | | | 2,602 | | | | 6,232 | | | | 10,049 | | Debentures (including interest payable) * | | | 586,600 | | | | 669,883 | | | | 21,326 | | | | 24,431 | | | | 236,364 | | | | 387,762 | | Loans from banks and others including interest * | | | 628,293 | | | | 772,875 | | | | 44,244 | | | | 70,895 | | | | 325,201 | | | | 332,535 | | | | | | | | | | | | | | | | | | | | | | | | | | | | Financial liabilities – hedging instruments | | | | | | | | | | | | | | | | | | | | | | | | | Forward exchange rate contracts | | | 5,014 | | | | 6,368 | | | | 6,230 | | | | 138 | | | | - | | | | - | | Other forward exchange rate contracts | | | 1,199 | | | | 1,790 | | | | 1,790 | | | | - | | | | - | | | | - | | | | | | | | | | | | | | | | | | | | | | | | | | | | | | | | 1,595,692 | | | | 1,830,482 | | | | 434,273 | | | | 98,066 | | | | 567,797 | | | | 730,346 | |
| *D. | Includes current portion of long-term liabilities.Market risks
|
D. Market risks
Market risk is the risk that changes in market prices, such as foreign exchange rates, the CPI, interest rates and prices of capital products and instruments will affect the fair value of the future cash flows of a financial instrument. The Group buys and sells derivatives in the ordinary course of business, and also incurs financial liabilities, in order to manage market risks. All such transactions are carried out within the guidelines set by the Boards of Directors of the companies. For the most part, the Group companies enter into hedging transactions for purposes of avoiding economic exposures that arise from their operating activities. Most of the transactions entered into do not meet the conditions for recognition as an accounting hedge and, therefore, differences in their fair values are recorded on the statement of profit and loss. | (1) | CPI and foreign currency risk |
(1) CPI and foreign currency risk
Currency risk The Group’s functional currency is the U.S. dollar. The exposures of the Group companies are measured with reference to the changes in the exchange rate of the dollar vis-à-vis the other currencies in which it transacts business. The Group is exposed to currency risk on sales, purchases, assets and liabilities that are denominated in a currency other than the respective functional currencies of the Group entities. The primary exposure is to the Shekel (“NIS”). The Group uses options and forward exchange contracts on exchange rates for purposes of hedging short-term currency risks, usually up to one year, in order to reduce the risk with respect to the final cash flows in dollars deriving from the existing assets and liabilities and sales and purchases of goods and services within the framework of firm or anticipated commitments, including in relation to future operating expenses. The Group is exposed to currency risk in relation to loans it has taken out and debentures it has issued in currencies other than the dollar. The principal amounts of these bank loans and debentures have been hedged by swap transactions the repayment date of which corresponds with the payment date of the loans and debentures. Note 2928 – Financial Instruments (Cont’d) The Group has no exposure to foreign currency risk in respect of non-hedging derivative financial instruments in 2022, relevant2023. Relevant information for 20212023 is as follows: | | As at December 31, 2021 | | | | Currency/
linkage
receivable | | Currency/
linkage
payable | | Amount
receivable | | | Amount
payable | | | Expiration
dates | | | Fair value | | | | | | | | $ Thousands | | | | | | | | | | | | | | | | | | | Forward contracts on exchange rates | Dollar | | NIS | | | 3,135 | | | | 9,746 | | | | 2022 | | | | 3 | | Forward contracts on exchange rates | EURO | | NIS | | | 4,929 | | | | 18,571 | | | | 2022 | | | | (1,199 | ) | Call options on foreign currency | Dollar | | NIS | | | 17,828 | | | | 67,231 | | | | 2022 | | | | 4 | |
| | As at December 31, 2023 | | | | Currency/
linkage
receivable | | Currency/
linkage
payable | | Amount
receivable | | | Amount
payable | | | Expiration
dates | | | Fair value | | | | | | | | $ Thousands | | | | | | | | | | | | | | | | | | | Forward contracts on exchange rates | Dollar | | NIS | | | 5,762 | | | | 21,066 | | | | 2024 | | | | (175 | ) |
The Group’s exposure to foreign currency risk in respect of non‑hedging derivative financial instruments is as follows: | | As at December 31, 2023 | | | | Currency/
linkage
receivable | | Currency/
linkage
payable | | Amount
receivable | | | Amount
payable | | | Expiration
dates | | | Fair value | | | | | | | | $ Thousands | | | | | | | | | | | | | | | | | | | Forward contracts on exchange rates | Dollar | | NIS | | | 2,622 | | | | 9,498 | | | | 2024 | | | | 4 | |
| | As at December 31, 2022 | | | | Currency/
linkage
receivable | | Currency/
linkage
payable | | Amount
receivable | | | Amount
payable | | | Expiration
dates | | | Fair value | | | | | | | | $ Thousands | | | | | | | | | | | | | | | | | | | Forward contracts on exchange rates | Dollar | | NIS | | | 5,566 | | | | 18,912 | | | | 2023 | | | | 641 | |
| | As at December 31, 2021 | | | | Currency/
linkage
receivable | | Currency/
linkage
payable | | Amount
receivable | | | Amount
payable | | | Expiration
dates | | | Fair value | | | | | | | | $ Thousands | | | | | | | | | | | | | | | | | | | Forward contracts on exchange rates | Dollar | | NIS | | | 33,333 | | | | 109,259 | | | | 2022-2023 | | | | (5,014 | ) |
Inflation risk The Group has CPI-linked loans. The Group is exposed to payments of higher interest and principal as the result of an increase in the CPI. It is noted that part of the Group’s anticipated revenues will be linked to the CPI. The Group does not hedge this exposure beyond the expected hedge included in its revenues. | a. | Breakdown of CPI-linked derivative instruments The Group’s exposure to index risk with respect to derivative instruments used for hedging purposes is shown below: |
| | As at December 31, 2023 | | | | Index receivable | | Interest payable | | | Expiration date | | | Amount of linked principal | | | Fair value | | | | | | | | | | | | $ Thousands | | | CPI-linked derivative instruments | | | | | | | | | | | | | | | Interest exchange contract | CPI | | | 1.76 | % | | | 2036 | | | | 81,051 | | | | 10,268 | |
| | As at December 31, 2022 | | | | Index receivable | | Interest payable | | | Expiration date | | | Amount of linked principal | | | Fair value | | | | | | | | | | | | $ Thousands | | | CPI-linked derivative instruments | | | | | | | | | | | | | | | Interest exchange contract | CPI | | | 1.76 | % | | | 2036 | | | | 89,619 | | | | 9,353 | |
Note 2928 – Financial Instruments (Cont’d) | | | a.b. | Breakdown of CPI-linked derivative instruments
|
The Group’s exposure to index risk with respect to derivative instruments used for hedging purposes is shown below:
| | As at December 31, 2022 | | | | Index
receivable | | Interest
payable | | | Expiration
date | | | Amount of
linked
principal | | | Fair value | | | | | | | | | | | | $ Thousands | | CPI-linked derivative instruments | | | | | | | | | | | | | | Interest exchange contract | CPI | | | 1.76 | % | | | 2036 | | | | 89,619 | | | | 9,353 | |
| | As at December 31, 2021 | | | | Index
receivable | | Interest
payable | | | Expiration
date | | | Amount of
linked
principal | | | Fair value | | | | | | | | | | | | $ Thousands | | CPI-linked derivative instruments | | | | | | | | | | | | | | Interest exchange contract | CPI | | | 1.76 | % | | | 2036 | | | | 107,598 | | | | 7,369 | |
For additional details, please refer to Note 15.1.E.
Note 29 – Financial Instruments (Cont’d)
| | b. | Exposure to CPI and foreign currency risks The Group’s exposure to CPI and foreign currency risk, based on nominal amounts, is as follows: |
| | | As at December 31, 2023 | | | | | Foreign currency | | | | | Shekel | | | | | | | | Unlinked | | | CPI linked | | | Other | | | | | | | Non-derivative instruments | | | | | | | | | | Cash and cash equivalents | | | 91,247 | | | | - | | | | 2,263 | | Short-term deposits and restricted cash | | | 15,218 | | | | - | | | | - | | Trade receivables | | | 55,865 | | | | - | | | | - | | Other current assets | | | 10,841 | | | | - | | | | 72 | | Total financial assets | | | 173,171 | | | | - | | | | 2,335 | | | | | | | | | | | | | | | | Trade payables | | | 28,479 | | | | - | | | | 1,633 | | Other current liabilities | | | 7,545 | | | | 4,680 | | | | 116 | | Loans from banks and others and debentures | | | 779,808 | | | | 413,811 | | | | - | | Total financial liabilities | | | 815,832 | | | | 418,491 | | | | 1,749 | | | | | | | | | | | | | | | | Total non-derivative financial instruments, net | | | (642,661 | ) | | | (418,491 | ) | | | 586 | | Derivative instruments | | | - | | | | 10,268 | | | | - | | Net exposure | | | (642,661 | ) | | | (408,223 | ) | | | 586 | |
The Group’s exposure to CPI and foreign currency risk, based on nominal amounts, is as follows:
| | | As at December 31, 2022 | | | | | Foreign currency | | | | | Shekel | | | | | | | | Unlinked | | | CPI linked | | | Other | | | | | | | Non-derivative instruments | | | | | | | | | | Cash and cash equivalents | | | 165,186 | | | | - | | | | 1,102 | | Short-term deposits and restricted cash | | | 35,695 | | | | - | | | | - | | Trade receivables | | | 10,007 | | | | - | | | | - | | Other current assets | | | 58,006 | | | | - | | | | 212 | | Long-term deposits and restricted cash | | | 15,146 | | | | - | | | | - | | Total financial assets | | | 284,040 | | | | - | | | | 1,314 | | | | | | | | | | | | | | | | Trade payables | | | 36,669 | | | | - | | | | 14,734 | | Other current liabilities | | | 20,930 | | | | 5,494 | | | | 640 | | Loans from banks and others and debentures | | | 583,651 | | | | 414,071 | | | | - | | Total financial liabilities | | | 641,250 | | | | 419,565 | | | | 15,374 | | | | | | | | | | | | | | | | Total non-derivative financial instruments, net | | | (357,210 | ) | | | (419,565 | ) | | | (14,060 | ) | Derivative instruments | | | - | | | | 9,353 | | | | - | | Net exposure | | | (357,210 | ) | | | (410,212 | ) | | | (14,060 | ) |
| | | As at December 31, 2021 | | | | | Foreign currency | | | | | Shekel | | | | | | | | Unlinked | | | CPI linked | | | Other | | | | | | | Non-derivative instruments | | | | | | | | | | Cash and cash equivalents | | | 159,838 | | | | - | | | | 1,329 | | Short-term deposits and restricted cash | | | 179 | | | | - | | | | 50 | | Trade receivables | | | 56,632 | | | | - | | | | 81 | | Other current assets | | | 1,308 | | | | - | | | | 4 | | Long-term deposits and restricted cash | | | 21,463 | | | | - | | | | - | | Total financial assets | | | 239,420 | | | | - | | | | 1,464 | | | | | | | | | | | | | | | | Trade payables | | | 59,381 | | | | | | | | 11,842 | | Other current liabilities | | | 23,536 | | | | 7,044 | | | | 190 | | Loans from banks and others and debentures | | | 592,102 | | | | 459,732 | | | | - | | Total financial liabilities | | | 675,019 | | | | 466,776 | | | | 12,032 | | | | | | | | | | | | | | | | Total non-derivative financial instruments, net | | | (435,599 | ) | | | (466,776 | ) | | | (10,568 | ) | Derivative instruments | | | - | | | | 7,369 | | | | (1,199 | ) | Net exposure | | | (435,599 | ) | | | (459,407 | ) | | | (11,767 | ) |
Note 2928 – Financial Instruments (Cont’d) | | | c. | A strengthening of the dollar exchange rate by 5% – 10% against the following currencies and change of the CPI in rate of 1% – 2% would have increased (decreased) the net income or net loss and the equity by the amounts shown below. This analysis assumes that all other variables, in particular interest rates, remain constant. |
A strengthening of the dollar exchange rate by 5%–10% against the following currencies and change of the CPI in rate of 1%–2% would have increased (decreased) the net income or net loss and the equity by the amounts shown below. This analysis assumes that all other variables, in particular interest rates, remain constant.| | | As at December 31, 2023 | | | | | 10% increase | | | 5% increase | | | 5% decrease | | | 10% decrease | | | | | $ Thousands | | Non-derivative instruments | | | | | | | | | | | | | Shekel/dollar | | | 1,208 | | | | 604 | | | | (604 | ) | | | (1,208 | ) | Shekel/EUR | | | 43 | | | | 22 | | | | (22 | ) | | | (43 | ) | dollar/EUR | | | (15,855 | ) | | | (7,928 | ) | | | 7,928 | | | | 15,855 | | | | | | | | | | | | | | | | | | | | | | | As at December 31, 2023 | | | | | 2% increase | | | 1% increase | | | 1% decrease | | | 2% decrease | | | | | $ Thousands | | Non-derivative instruments | | | | | | | | | | | | | | | | | CPI | | | (6,114 | ) | | | (3,058 | ) | | | 3,058 | | | | 6,114 | | | | | | | | | | | | | | | | | | | | | | | As at December 31, 2022 | | | | | 10% increase | | | 5% increase | | | 5% decrease | | | 10% decrease | | | | | $ Thousands | | Non-derivative instruments | | | | | | | | | | | | | | | | | Shekel/dollar | | | (7,375 | ) | | | (3,687 | ) | | | 3,687 | | | | 7,375 | | Shekel/EUR | | | (1,094 | ) | | | (547 | ) | | | 547 | | | | 1,094 | | | | | | | | | | | | | | | | | | | | | | | As at December 31, 2022 | | | | | 2% increase | | | 1% increase | | | 1% decrease | | | 2% decrease | | | | | $ Thousands | | Non-derivative instruments | | | | | | | | | | | | | | | | | CPI | | | (6,306 | ) | | | (3,153 | ) | | | 3,153 | | | | 6,306 | |
| | | As at December 31, 2022 | | | | | 10% increase | | | 5% increase | | | 5% decrease | | | 10% decrease | | | | | $ Thousands | | Non-derivative instruments | | | | | | | | | | | | | Shekel/dollar | | | (7,375 | ) | | | (3,687 | ) | | | 3,687 | | | | 7,375 | | Shekel/EUR | | | (1,094 | ) | | | (547 | ) | | | 547 | | | | 1,094 | |
| | | As at December 31, 2022 | | | | | 2% increase | | | 1% increase | | | 1% decrease | | | 2% decrease | | | | | $ Thousands | | Non-derivative instruments | | | | | | | | | | | | | CPI | | | (6,306 | ) | | | (3,153 | ) | | | 3,153 | | | | 6,306 | |
| | | As at December 31, 2021 | | | | | 10% increase | | | 5% increase | | | 5% decrease | | | 10% decrease | | | | | $ Thousands | | Non-derivative instruments | | | | | | | | | | | | | Shekel/dollar | | | (9,219 | ) | | | (4,609 | ) | | | 4,609 | | | | 9,219 | | Shekel/EUR | | | (728 | ) | | | (364 | ) | | | 364 | | | | 728 | |
| | | As at December 31, 2021 | | | | | 2% increase | | | 1% increase | | | 1% decrease | | | 2% decrease | | | | | $ Thousands | | Non-derivative instruments | | | | | | | | | | | | | CPI | | | (6,639 | ) | | | (3,320 | ) | | | 3,320 | | | | 6,201 | |
The Group is exposed to changes in the interest rates with respect to loans bearing interest at variable rates, as well as in relation to swap transactions of liabilities in foreign currency for dollar liabilities bearing a variable interest rate. The Group has not set a policy limiting the exposure and it hedges this exposure based on forecasts of future interest rates.
The Group enters into transactions mainly to reduce the exposure to cash flow risk in respect of interest rates. The transactions include interest rate swaps and “collars”. In addition, options are acquired and written for hedging the interest rate at different rates. Note 2928 – Financial Instruments (Cont’d) Type of interest Set forth below is detail of the type of interest borne by the Group’s interest-bearing financial instruments: | | | As at December 31, | | | As at December 31, | | | | | 2022 | | | 2021 | | | 2023 | | 2022 | | | | | Carrying amount | | | Carrying amount | | | | | $ Thousands | | | $ Thousands | | Fixed rate instruments | | | | | | | | | | | Financial assets | | 549,467 | | 16,137 | | | 311,951 | | 549,467 | | Financial liabilities | | | (837,698 | ) | | | (941,733 | ) | | | (864,953 | ) | | | (837,698 | ) | | | | | (288,231 | ) | | | (925,596 | ) | | | (553,002 | ) | | | (288,231 | ) | | | | | | | | | | | | | | | Variable rate instruments | | | | | | | | | | | | | Financial assets | | 4,827 | | | 55,033 | | | 54,408 | | | 4,827 | | Financial liabilities | | | (324,887 | ) | | | (267,882 | ) | | | (665,080 | ) | | | (324,887 | ) | | | | | (320,060 | ) | | | (212,849 | ) | | | (610,672 | ) | | | (320,060 | ) |
The Group’s assets and liabilities bearing fixed interest are not measured at fair value through the statement of profit and loss and the Group does not designate derivatives interest rate swaps as hedging instruments under a fair value hedge accounting model. Therefore, a change in the interest rates as atof the date of the report would not be expected to affect the income or loss with respect to changes in the value of fixed – interest assets and liabilities. A change of 100 basis points in interest rate at reporting date would have (decreased)/increased profit and loss before tax by the amounts below. This analysis assumes that all variables, in particular foreign currency rates, remain constant. | | | As at December 31, 2022 | | | | | 100bp increase | | | 100 bp decrease | | | | | $ Thousands | | Variable rate instruments | | | (3,201 | ) | | | 3,201 | |
| | | As at December 31, 2023 | | | | | 100bp increase | | | 100 bp decrease | | | | | $ Thousands | | Variable rate instruments | | | (6,107 | ) | | | 6,107 | |
| | | As at December 31, 2021 | | | | | 100bp increase | | | 100 bp decrease | | | | | $ Thousands | | Variable rate instruments | | | (2,128 | ) | | | 2,128 | |
| | | As at December 31, 2022 | | | | | 100bp increase | | | 100 bp decrease | | | | | $ Thousands | | Variable rate instruments | | | (3,201 | ) | | | 3,201 | |
A change of 1.0%–1.5% in the LIBORSOFR interest rate at reporting date would have increased/(decreased) the net income or net loss and the equity by the amounts below. This analysis assumes that all variables, in particular foreign currency rates, remain constant. | | | As at December 31, 2022 | | | | | 1.5% decrease | | | 1.0% decrease | | | 1.0% increase | | | 1.5% increase | | | | | $ Thousands | | | | | | | | | | | | | | | | | Long-term loans (US LIBOR) | | 1,357 | | | 904 | | | (904 | ) | | (1,357 | ) | | Interest rate swaps (US LIBOR) | | | (959 | ) | | | (638 | ) | | | 638 | | | | 959 |
| | | As at December 31, 2023 | | | | | 1.5% decrease | | | 1.0% decrease | | | 1.0% increase | | | 1.5% increase | | | | | $ Thousands | | | | | | | | | | | | | | | | Long-term loans (SOFR) | | | (2,538 | ) | | | (1,691 | ) | | | 1,691 | | | | 2,538 | | Interest rate swaps (SOFR) | | | 1,555 | | | | 1,036 | | | | (1,036 | ) | | | (1,555 | ) |
Note 2928 – Financial Instruments (Cont’d) The Group’s exposure to LIBORSOFR interest rate risk for derivative financial instruments used for hedging is as follows: | | | | As at December 31, 2022 | | | | Linkage
receivable | | Interest
rate | | | Expiration
date | | | Amount of
the linked
reserve | | | Fair value | | | | | | | | | | | | $ Thousands | | | | | | | | | | | | | | | | | Interest rate swaps | USD LIBOR interest | | | 0.93 | % | | | 2030 | | | | 62,256 | | | | 6,734 | |
| | As at December 31, 2023 | | | | Linkage receivable | | Interest rate | | | Expiration date | | | Amount of the linked reserve | | | Fair value | | | | | | | | | | | | $ Thousands | | | | | | | | | | | | | | | | | | Interest rate swaps | USD SOFR interest | | | 0.83%-4.0 | % | | | 2030-2041 | | | | 185,478 | | | | 4,138 | |
| (1) | Fair value compared with carrying value |
The Group’s financial instruments include mainly non-derivative assets, such as: cash and cash equivalents, investments, deposits and short-term loans, receivables and debit balances, investments and long-term receivables; non-derivative liabilities: such as: short-term credit, payables and credit balances, long-term loans, finance leases and other liabilities; as well as derivative financial instruments. In addition, fair value disclosure of lease liabilities is not required.
Due to their nature, the fair value of the financial instruments included in the Group’s working capital is generally identical or approximates the book value.
The following table shows in detail the carrying amount and the fair value of financial instrument groups presented in the financial statements not in accordance with their fair value. | | | | As at December 31, 2023 | | | | | Carrying amount | | | Fair value | | Liabilities | | $ Thousands | | Non-convertible debentures | | | 511,030 | | | | 485,196 | | Long-term loans from banks and others (excluding interest) | | | 898,546 | | | | 906,911 | | Loans from non-controlling interests | | | 125,252 | | | | 127,960 | |
| | | As at December 31, 2022 | | | | | Carrying amount | | | Fair value | | Liabilities | | $ Thousands | | Non-convertible debentures | | | 526,771 | | | | 492,714 | | Long-term loans from banks and others (excluding interest) | | | 516,195 | | | | 528,011 | | Loans from non-controlling interests | | | 124,153 | | | | 113,673 | |
Due to their nature, the fair value of the financial instruments included in the Group’s working capital is generally identical or approximates the book value.
The following table shows in detail the carrying amount and the fair value of financial instrument groups presented in the financial statements not in accordance with their fair value.
| | | As at December 31, 2022 | | | | | Carrying
amount | | | Fair value | | Assets | | $ Thousands | | Other investments | | | 344,780 | | | | 344,780 | | | | | | | | | | | | Liabilities | | | | | | | | | Non-convertible debentures | | | 526,771 | | | | 492,714 | | Long-term loans from banks and others (excluding interest) | | | 516,195 | | | | 528,011 | | Loans from non-controlling interests | | | 124,153 | | | | 113,673 | |
| | | As at December 31, 2021 | | | | | Carrying
amount | | | Fair value | | Liabilities | | $ Thousands | | Non-convertible debentures | | | 586,600 | | | | 642,077 | | Long-term loans from banks and others (excluding interest) | | | 488,455 | | | | 545,806 | | Loans from non-controlling interests | | | 138,050 | | | | 141,596 | |
The fair value of long-term loans from banks and others (excluding interest) is classified as level 2, and measured using the technique of discounting the future cash flows with respect to the principal component and the discounted interest using the market interest rate on the measurement date. (2) Hierarchy of fair value
The following table presents an analysis of the financial instruments measured at fair value, using an evaluation method. The various levels were defined as follows:| (2) | Hierarchy of fair value – Level 1: Quoted prices (not adjusted) in an active market for identical instruments.
– Level 2: Observed data, direct or indirect, not included in Level 1 above.
– Level 3: Data not based on observed market data.The following table presents an analysis of the financial instruments measured at fair value, using an evaluation method. The various levels were defined as follows: – Level 1: Quoted prices (not adjusted) in an active market for identical instruments. – Level 2: Observed data, direct or indirect, not included in Level 1 above. – Level 3: Data not based on observed market data. |
Note 2928 – Financial Instruments (Cont’d) Other investments are measured at fair value through other comprehensive income (Level 1). Derivative instruments are measured at fair value using a Level 2 valuation method – observable data, directly or indirectly, which are not included in quoted prices in an active market for identical instruments. See Note 29.D.128.D.1 for further details. Level 3 financial instrument measured at fair value As atAs of December 31, 2022,2023, the fair value of long-term investment (Qoros) remains at zero (2021:(2022: $nil).
| (3) | Data and measurement of the fair value of financial instruments at Level 2 and 3 |
(3) Data and measurement of the fair value of financial instruments at Level 2 and 3 The fair value of forward contracts on foreign currency is determined using trading programs that are based on market prices. The market price is determined based on a weighting of the exchange rate and the appropriate interest coefficient for the period of the transaction along with an index of the relevant currencies. The fair value of contracts for exchange (SWAP) of interest rates and fuel prices is determined using trading programs which incorporate market prices, the remaining term of the contract and the credit risks of the parties to the contract. The fair value of currency and interest exchange (SWAP) transactions is valued using discounted future cash flows at the market interest rate for the remaining term. The fair value of transactions used to hedge inflation is valued using discounted future cash flows which incorporate the forward CPI curve, and market interest rates for the remaining term. If the inputs used to measure the fair value of an asset or liability might be categorized in different levels of the fair value hierarchy, then the fair value measurement is categorized in its entirety in the same level of the fair value hierarchy as the lowest level input that is significant to the entire measurement. The fair value of marketable securities held for trade is determined using the ‘Discounts for Lack of Marketability’ (“DLOM”) valuation method, which is a method used to calculate the value of restricted securities. The method purports that the only difference between a company’s common stock and its restricted securities is the lack of marketability of the restricted securities which is derived from the price difference between both prices. Level 3 As atof December 31, 20222023 and 2021,2022, the fair value of the long-term investment (Qoros) was based on the present value of the expected cash flows. Included in the long-term investment (Qoros) are the 12% interests in Qoros (as described in Note 10.3) and the put option (as described in Note 10.2). For the purposes of management’s fair value assessment of the long-term investment (Qoros), management takes into consideration factors including market risk and credit risk exposures, publicly available information and financial information of the New Qoros Investor and Qoros for the year ended December 31, 20222023 and 2021.2022. The following table shows the valuation techniques used in measuring Level 3 fair values as atof December 31, 20222023 and 2021,2022, as well as the significant unobservable inputs used. Type | Valuation technique | Significant unobservable data | Inter-relationship between significant unobservable inputs and fair value measurement | Long-term investment (Qoros) | The Group assessed the fair value of the long-term investment (Qoros) using the present value of the expected cash flows. | The likelihood of expected cash flows. | The estimated fair value would increase if the likelihood of expected cash flows increase. |
Note 3029 – Subsequent Events | A. | Dividend
In March 2023, Kenon’s board of directors approved a cash dividend of $2.79 per share (an aggregate amount of approximately $150 million), payable to Kenon’s shareholders of record as of the close of trading on April 10, 2023, for payment on or about April 19, 2023.
|
| B. | Share repurchase plan
In March 2023, Kenon’s board of directors authorized a share repurchase plan of up to $50 million.
|
In May 2022, OPC had entered into an agreement with Veridis to form OPC Holdings Israel Ltd., which will hold and operate all of OPC's business activities in the energy and electricity generation and supply sectors in Israel (“Veridis Transaction”).
In January 2023, the Veridis Transaction was completed. Following the completion of the Veridis Transaction, OPC transferred to OPC Holdings Israel, among other things, its 80% interest in OPC Rotem, its interest in Gnrgy Ltd., as well other operations in Israel including OPC Hadera, OPC Tzomet, OPC Sorek, energy generation facilities on consumers’ premises and virtual electricity supply activities, and Veridis transferred its 20% interests in OPC Rotem to OPC Holdings Israel. In addition, Veridis invested approximately $128 million (approximately NIS 452 million) in cash in OPC Holdings Israel (after adjustments to the original transaction amount which totaled NIS 425 million [$125 million]), of which approximately $118 million (approximately NIS 400 million) was used by OPC Rotem to repay a portion of the shareholders’ loans provided to OPC Rotem in 2021 by OPC and Veridis.
As a result of the Veridis Transaction, OPC holds 80% and Veridis holds the remaining 20% of OPC Holdings Israel, which holds 100% of OPC Rotem and the other business activities in the energy and electricity generation and supply sectors in Israel transferred by OPC. The financial impact is still being assessed by Kenon.
| B. | Agreement by CPV to Acquire Wind Energy Power Plants in the United States
|
In January 2023, CPV Group through its 100% owned subsidiary entered into an agreement to acquire all rights in four operating wind-powered electricity power plants in Maine, United States, with an aggregate capacity of 81.5 MW.
The purchase price for the acquisition is $172 million, subject to adjustments and the terms and conditions set forth in the agreement. CPV intends to finance approximately 50% of the purchase price using external financing. OPC intends to finance its portion of the remaining amount of the purchase price through its own resources, by raising equity and/or through external financing.
The agreement contains certain representations of the parties, including the sellers’ representations on the power plants, which expire on the closing date and contains waivers of certain claims CPV Group may bring against the sellers. Due to such limits to the sellers’ liability, CPV intends to obtain a standard representations and warranties insurance policy, which would limit the coverage to 10% of the purchase price and for a limited period. The acquisition is subject to conditions, including the receipt of regulatory approvals, which are expected to be obtained within the next 2 to 5 months.
OnDividend
In March 13, 2023, ZIM announced2024, Kenon’s board of directors approved a cash dividend for Q4 2022of $3.80 per share (an aggregate amount of approximately $769 million, or $6.40 per ordinary share,$200 million), payable to be paidKenon’s shareholders of record as of the close of trading on April 3, 2023. Kenon expects to receive $159 million ($151 million net of tax).8, 2024, for payment on or about April 15, 2024. AsSeries D Debentures
In January 2024, OPC issued Series D debentures at a par value of approximately NIS 200 million (approximately $55 million), with the date of approvalproceeds of the consolidatedissuance designated for OPC’s needs, including for restructuring of an existing financial statements,debt. The debentures are listed on the fair valueTASE, are not CPI-linked and bear annual interest of ZIM, represented by its share price, had increased which may result in a reversal of impairment in 2023. The financial impact on Kenon from the increase in market capitalization of ZIM has yet to be determined.6.2%. SIGNATURES The registrant hereby certifies that it meets all of the requirements for filing on Form 20-F and that it has duly caused and authorized the undersigned to sign this annual report on its behalf. | Kenon Holdings Ltd. By: /s/ Robert L. Rosen
Name:Robert L. Rosen
Title: Chief Executive Officer |
Date: March 30, 202326, 2024
Index to Exhibits | | | | | | | | | | | | | | | | | | | | | | | | | | | | | Gas Sale and Purchase Agreement, dated as of November 25, 2012, among Noble Energy Mediterranean Ltd., Delek Drilling Limited Partnership, Isramco Negev 2 Limited Partnership, Avner Oil Exploration Limited Partnership, Dor Gas Exploration Limited Partnership, and O.P.C. Rotem Ltd. (Incorporated by reference to Exhibit 10.8 to Amendment No. 1 to IC Power Pte. Ltd.’s Form F-1, filed on November 2, 2015) (1) | | | | | | Share Purchase Agreement, dated November 24, 2017, among Inkia Energy, Ltd., IC Power Distribution Holdings, PTE. LTD., Nautilus Inkia Holdings LLC, Nautilus Distribution Holdings LLC and Nautilus Isthmus Holdings LLC (Incorporated by reference to Exhibit 4.14 to Kenon’s Annual Report on Form 20-F for the fiscal year ended December 31, 2017, filed on April 9, 2018) | | | | | | Qoros Automobile Company Limited Investment Agreement, dated May 23, 2017, as amended, among Hangzhou Chengmao Investment Co., Ltd., Wuhu Chery Automobile Investment Company Limited, Quantum (2007) LLC and Qoros Automobile Company Limited (Incorporated by reference to Exhibit 4.17 to Kenon’s Annual Report on Form 20-F for the fiscal year ended December 31, 2017, filed on April 9, 2018) | | | | | | | | 4.4 | | |
| | | | | | | | | | | | | | | | | | | | | | | | | | | | | | | | | | | | | | | | | | | | | | | | |
| | | | | 101.INS* | | Inline XBRL Instance Document | 101.SCH* | | Inline XBRL Taxonomy Extension Schema Document | 101.CAL* | | Inline XBRL Taxonomy Extension Calculation Linkbase Document | 101.DEF* | | Inline XBRL Taxonomy Extension Definition Linkbase Document | 101.LAB* | | Inline XBRL Taxonomy Extension Label Linkbase Document | 101.PRE* | | Inline XBRL Taxonomy Extension Presentation Linkbase Document | 104* | | Inline XBRL for the cover page of this Annual Report on Form 20-F, included in the Exhibit 101 Inline XBRL Document Set. |
(1) | Portions of this exhibit have been omitted pursuant to a request for confidential treatment under Rule 24b-2 of the Exchange Act. Omitted information has been filed separately with the SEC. |
|