As filed with the Securities and Exchange Commission on June 24, 200526, 2006
UNITED STATES
SECURITIES AND EXCHANGE COMMISSION
Washington, D.C. 20549
FORM 20-F
Annual Report Pursuant to SectionANNUAL REPORT PURSUANT TO SECTION 13 orOR 15(d)
15(d) ofOF THE SECURITIES EXCHANGE ACT OF 1934
For the Securities Exchange Act of 1934fiscal year ended December 31, 2005
Commission file number 001-15266
For the Fiscal Year Ended December 31, 2004
Commission File Number 001-15266
BANCO DE CHILE
(Exact name of Registrant as specified in its charter)
BANK OF CHILE
(Translation of Registrant’s name into English)
Republic of ChileREPUBLIC OF CHILE
(Jurisdiction of incorporation or organization)
Banco de Chile
Ahumada 251
Santiago, Chile
(562) 653-1111637-1111
(Address of principal executive offices)
Securities registered or to be registered pursuant to Section 12(b) of the Act:
Title of each class | Name of each exchange | |
American Depositary Shares, each representing 600 shares of common stock, without nominal (par) value (“ADSs”) | New York Stock Exchange | |
| Shares of common stock, without nominal (par) value | New York Stock Exchange (for listing purposes only) | |
Securities registered or to be registered pursuant to Section 12(g) of the Act:
None
None(Title of Class)
Securities for which there is a reporting obligation pursuant to Section 15(d) of the Act:
None
(Title of Class)
None
Indicate the number of outstanding shares of each of the Issuer’sissuer’s classes of capital or common stock as of the close of the
period covered by the annual report:
Shares of common stock: 68,079,783,605
Indicate by check mark if the registrant is a well-known seasoned issuer, as defined in Rule 405 of the Securities Act.
Yes ¨ No x
If this report is an annual or transition report, indicate by check mark if the registrant is not required to file reports pursuant to Section 13 or 15(d) of the Securities Exchange Act of 1934.
Yes ¨ No x
Indicate by check mark whether the registrant (1) has filed all reports required to be filed by Section 13 or 15(d) of the Securities Exchange Act of 1934 during the preceding 12 months (or for such shorter period that the registrant was required to file such reports), and (2) has been subject to such filing requirements for the past 90 days.
Yesx No¨
Indicate by check mark whether the registrant is a large accelerated filer, an accelerated filer, or a non-accelerated filer. See definition of “accelerated filer and large accelerated filer” in Rule 12b-2 of the Exchange Act. (Check one):
Large accelerated filer ¨ Accelerated filer x Non-accelerated filer ¨
Indicate by check mark which financial statement item the registrant has elected to follow.
Item 17¨ Item 17 x Item 18
If this is an annual report, indicate by check mark whether the registrant is a shell company (as defined in Rule 12b-2 of the Exchange Act).
Yes ¨ No x
i
THE MERGER
On January 1, 2002, Banco de Chile merged with Banco de A. Edwards in a transaction in which Banco de Chile was the surviving corporate entity. As used in this annual report, unless the context otherwise requires, references to “Banco de Chile” relating to any date or period prior to January 1, 2002 (the effective date of the merger) are to Banco de Chile as it existed prior to the consummation of the merger, and such references relating to any date or period after January 1, 2002 are to Banco de Chile after the consummation of the merger.
PRESENTATION OF FINANCIAL INFORMATION
We prepare our audited consolidated financial statements in Chilean pesos and in accordance with generally accepted accounting principles in Chile, or Chilean GAAP, and the rules of theSuperintendencia de Bancos e Instituciones Financieras, or the Chilean Superintendency of Banks. Together, these requirements differ in certain significant respects from generally accepted accounting principles in the United States, or U.S. GAAP. References to “Chilean GAAP” in this annual report are to Chilean GAAP, as supplemented by the applicable rules of the Chilean Superintendency of Banks. See noteNote 28 to our audited consolidated financial statements contained elsewhere in this annual report for a description of the material differences between Chilean GAAP and U.S. GAAP, as they relate to us and our consolidated subsidiaries, and a reconciliation to U.S. GAAP of net income and shareholders’ equity.
Pursuant to Chilean GAAP, unless otherwise indicated, financial data for all full-year periods through December 31, 20042005 included in our audited consolidated financial statements and in the other financial information contained elsewhere in this annual report have been restated in constant Chilean pesos of December 31, 2004.
2005.
In this annual report, references to “$,” “U.S.$,” “U.S. dollars” and “dollars” are to United States dollars, references to “pesos” or “Ch$” are to Chilean pesos, and references to “UF” are to “Unidades de Fomento.” TheUnidad de Fomento, or UF is aan inflation-indexed Chilean monetary unit of account whichwith a value in Chilean pesos that is linked to and which is adjusted daily to reflect changes in the Consumer Price Index.Index of theInstituto Nacional de Estadísticas, or the Chilean National Institute of Statistics. As of December 31, 2004,2005, one UF equaled U.S.$30.9334.96 and Ch$17,317.05.17,974.81. See note 1(c)Note 1 to our audited consolidated financial statements. Percentages and certain dollar and peso amounts contained in this annual report have been rounded for ease of presentation.
This annual report contains translations of certain Chilean peso amounts into U.S. dollars at specified rates solely for your convenience. These translations should not be construed as representations that the Chilean peso amounts actually represent such U.S. dollar amounts, were converted from U.S. dollars at the rate indicated in preparing our audited consolidated financial statements or could be converted into U.S. dollars at the rate indicated. Unless otherwise indicated, such U.S. dollar amounts have been translated from Chilean pesos based on the observed exchange rate, as described in “Item 3. Key Information—Selected Financial Data—Exchange Rates,” reported by theBanco Central de Chile, or the Central Bank, for December 30, 20042005 (the latest practicable date, as December 31, 20042005 was a banking holiday in Chile). The observed exchange rate on June 21, 200522, 2006 was Ch$582.55545.64 = U.S.$1.00. The rate reported by the Central Bank is based on the rate for the prior business day in Chile and is the exchange rate specified by the Chilean Superintendency of Banks for use by Chilean banks in the preparation of their financial statements. The Federal Reserve Bank of New York does not report a noon buying rate for Chilean pesos.
Unless otherwise specified, all references in this annual report to loans are to loans and financial leases before deduction of allowances for loan losses, and all market share data presented in this annual report are based on information published periodically by the Chilean Superintendency of Banks. Non-performing loans include loans as to which either principal or interest is overdue and loans that do not accrue interest. Restructured loans as to which no payments are overdue are not ordinarily classified as non-performing loans. Past due loans include, with respect to any loan, the portion of principal or interest that is 90 or more days
overdue; the entire outstanding balance of any loan is included in past due loans only after legal collection
proceedings have been commenced. This practice differs from that normally followed in the United States, where the amount classified as past due would include the total principal and interest on all loans which have any portion overdue. See “Item 4. Information on the Company—Selected Statistical Information—Classification of Loan Portfolio Based on the Borrower’s Payment Performance.”
Unless otherwise specified, all references to “shareholders’ equity” as of December 31 of any year are to shareholders’ equity after deducting our respective retained net income for such year, but all references to “average shareholders’ equity” for any year are to average shareholders’ equity including our respective retained net income.
Certain figures included in this annual report and in our audited consolidated financial statements have been rounded for ease of presentation. Percentage figures included in this annual report have not in all cases been calculated on the basis of such rounded figures but on the basis of such amounts prior to rounding. For this reason, percentage amounts in this annual report may vary slightly from those obtained by performing the same calculations using the figures in our audited consolidated financial statements. Certain other amounts that appear in this annual report may similarly not sum due to rounding.
MACRO-ECONOMIC AND MARKET DATA
In this annual report, all macro-economic data relating to the Chilean economy is based on information published by the Central Bank. All market share and other data relating to the Chilean financial system as well as data on average return on shareholders’ equity are based on information published by the Chilean Superintendency of Banks. Information regarding the consolidated risk index of the Chilean financial system as a whole is not available. Prior to January 1, 2004, the Chilean Superintendency of Banks published the unconsolidated risk index for the financial system three times yearly in February, June and October. Since that date, this index is determined on a monthly basis by dividing allowances for loan losses by total loans, based on information provided by the Chilean Superintendency of Banks.
PART I
| Item 1. Identity of Directors, Senior Management and Advisers |
Not Applicable.
| Item 2. Offer Statistics and Expected Timetable |
Not Applicable.
SELECTED FINANCIAL DATA
The following table presents historical financial information about us as of the dates and for each of the periods indicated. The following table should be read in conjunction with, and is qualified in its entirety by reference to, our audited consolidated financial statements appearing elsewhere in this annual report. Our audited consolidated financial statements are prepared in accordance with Chilean GAAP and the rules of the Chilean Superintendency of Banks, which together differ in certain significant respects from U.S. GAAP. Note 28 to our audited consolidated financial statements provides a description of the material differences between Chilean GAAP and U.S. GAAP and a reconciliation to U.S. GAAP of net income for the years ended December 31, 2002, 2003, 2004 and 20042005 and shareholders’ equity at December 31, 20032004 and 2004.
2005.
Under Chilean GAAP, the merger between Banco de Chile and Banco de A. Edwards, which were under the common control of Quiñenco S.A. from March 27, 2001, until the merger January 1, 2002, was accounted for as a “pooling of interest” on a prospective basis. As such, the historical financial statements for periods prior to the merger were not restated under Chilean GAAP. Under U.S. GAAP, we were required to restate our previously issued U.S. GAAP historical financial information to retroactively present the financial results for the merged bank as if Banco de Chile and Banco de A. Edwards had been combined throughout the periods during which common control existed. Under U.S. GAAP, the reported financial information for periods presented prior to March 27, 2001 reflects book values of Banco de A. Edwards, which had been under Quiñenco S.A.’s control since September 2, 1999. See noteNote 28 to our audited consolidated financial statements.
| At or for the year ended December 31, | At or for the year ended December 31, | |||||||||||||||||||||||||||||||||||||||||||||||
| 2000 | 2001 | 2002 | 2003 | 2004 | 2004 | 2001 | 2002 | 2003 | 2004 | 2005 | 2005 | |||||||||||||||||||||||||||||||||||||
| (in millions of constant Ch$ as of December 31, 2004, except share data) | (in thousands of U.S.$) | (in millions of constant Ch$ as of December 31, 2005, except share data) | (in thousands of U.S.$) | |||||||||||||||||||||||||||||||||||||||||||||
CONSOLIDATED INCOME STATEMENT DATA | ||||||||||||||||||||||||||||||||||||||||||||||||
Chilean GAAP: | ||||||||||||||||||||||||||||||||||||||||||||||||
Interest revenue | Ch$ | 604,436 | Ch$ | 549,738 | Ch$ | 714,018 | Ch$ | 439,422 | Ch$ | 543,372 | U.S.$ | 970,602 | Ch$ | 569,529 | Ch$ | 739,723 | Ch$ | 455,241 | Ch$ | 562,933 | Ch$ | 680,149 | U.S.$ | 1,322,707 | ||||||||||||||||||||||||
Interest expense | (378,881 | ) | (320,633 | ) | (333,472 | ) | (209,340 | ) | (214,900 | ) | (383,867 | ) | (332,176 | ) | (345,477 | ) | (216,876 | ) | (222,636 | ) | (310,351 | ) | (603,549 | ) | ||||||||||||||||||||||||
Net interest revenue | 225,555 | 229,105 | 380,546 | 230,082 | 328,472 | 586,735 | 237,353 | 394,246 | 238,365 | 340,297 | 369,798 | 719,158 | ||||||||||||||||||||||||||||||||||||
Provisions for loan losses | (42,101 | ) | (48,930 | ) | (104,192 | ) | (61,612 | ) | (73,512 | ) | (131,311 | ) | (40,035 | ) | (95,165 | ) | (36,867 | ) | (41,208 | ) | (22,028 | ) | (42,838 | ) | ||||||||||||||||||||||||
Total fees and income from services, net | 41,109 | 43,007 | 78,733 | 98,251 | 126,842 | 226,572 | 44,556 | 81,568 | 101,787 | 131,408 | 137,793 | 267,970 | ||||||||||||||||||||||||||||||||||||
Total other operating income (loss), net | 12,771 | 8,894 | (31,621 | ) | 98,801 | 14,509 | 25,916 | 9,214 | (32,760 | ) | 102,357 | 15,031 | 10,860 | 21,120 | ||||||||||||||||||||||||||||||||||
Total other income and expenses, net | 12,344 | 13,125 | (3,456 | ) | 14,239 | 22,434 | 40,074 | 2,939 | (15,673 | ) | (11,533 | ) | (11,037 | ) | (6,394 | ) | (12,434 | ) | ||||||||||||||||||||||||||||||
Total operating expenses | (147,882 | ) | (147,748 | ) | (256,780 | ) | (227,557 | ) | (240,302 | ) | (429,241 | ) | (153,066 | ) | (266,709 | ) | (236,426 | ) | (249,623 | ) | (276,464 | ) | (537,649 | ) | ||||||||||||||||||||||||
Loss from price-level restatement | (10,047 | ) | (6,160 | ) | (9,934 | ) | (4,137 | ) | (7,466 | ) | (13,336 | ) | (6,382 | ) | (10,292 | ) | (4,286 | ) | (7,735 | ) | (11,450 | ) | (22,267 | ) | ||||||||||||||||||||||||
Income before income taxes | 91,749 | 91,293 | 53,296 | 148,067 | 170,977 | 305,409 | 94,579 | 55,215 | 153,397 | 177,133 | 202,115 | 393,060 | ||||||||||||||||||||||||||||||||||||
Income taxes | (1,647 | ) | 1,442 | 1,194 | (14,250 | ) | (18,349 | ) | (32,776 | ) | 1,494 | 1,237 | (14,763 | ) | (19,010 | ) | (21,391 | ) | (41,600 | ) | ||||||||||||||||||||||||||||
Net income | 90,102 | 92,735 | 54,490 | 133,817 | 152,628 | 272,633 | 96,073 | 56,452 | 138,634 | 158,123 | 180,724 | 351,460 | ||||||||||||||||||||||||||||||||||||
Earnings per share(1) | 2.01 | 2.06 | 0.80 | 1.97 | 2.28 | — | ||||||||||||||||||||||||||||||||||||||||||
Dividends per share(2) | 2.07 | 2.00 | 2.07 | 0.80 | 2.03 | — | ||||||||||||||||||||||||||||||||||||||||||
Earnings per share(1) | 2.14 | 0.83 | 2.04 | 2.36 | 2.69 | 0.0052 | ||||||||||||||||||||||||||||||||||||||||||
Dividends per share(2) | 2.07 | 2.15 | 0.83 | 2.05 | 2.40 | 0.0046 | ||||||||||||||||||||||||||||||||||||||||||
Weighted average number of shares (in millions) | 44,932.70 | 44,932.70 | 68,079.78 | 68,079.78 | 66,932.68 | — | 44,932.70 | 68,079.78 | 68,079.78 | 66,932.68 | 67,091.30 | — | ||||||||||||||||||||||||||||||||||||
U.S. GAAP(3): | ||||||||||||||||||||||||||||||||||||||||||||||||
U.S. GAAP(3): | ||||||||||||||||||||||||||||||||||||||||||||||||
Interest revenue | 333,028 | 729,044 | 736,605 | 463,551 | 571,365 | 1,020,603 | 755,290 | 763,123 | 480,239 | 591,934 | 708,079 | 1,377,023 | ||||||||||||||||||||||||||||||||||||
Interest expense | (215,821 | ) | (425,130 | ) | (355,149 | ) | (209,251 | ) | (218,067 | ) | (389,524 | ) | (440,435 | ) | (367,934 | ) | (216,785 | ) | (225,917 | ) | (317,554 | ) | (617,557 | ) | ||||||||||||||||||||||||
Net interest revenue | 117,207 | 303,914 | 381,456 | 254,300 | 353,298 | 631,079 | 314,855 | 395,188 | 263,454 | 366,017 | 390,525 | 759,466 | ||||||||||||||||||||||||||||||||||||
Provisions for loan losses | (37,368 | ) | (55,242 | ) | (110,348 | ) | (28,094 | ) | (31,519 | ) | (56,301 | ) | (57,231 | ) | (114,321 | ) | (29,106 | ) | (32,653 | ) | (23,013 | ) | (44,754 | ) | ||||||||||||||||||||||||
Net income | (97 | ) | 51,517 | 17,552 | 133,658 | 146,912 | 262,422 | 53,372 | 18,184 | 138,471 | 152,202 | 168,830 | 328,327 | |||||||||||||||||||||||||||||||||||
Earnings per share(1) | (0.0 | ) | 1.15 | 0.26 | 1.96 | 2.19 | — | |||||||||||||||||||||||||||||||||||||||||
Weighted average number of total shares(4) | 23,147 | 57,587 | 68,080 | 68,080 | 66,933 | — | ||||||||||||||||||||||||||||||||||||||||||
Earnings per share(1) | 1.19 | 0.27 | 2.03 | 2.27 | 2.52 | 0.0049 | ||||||||||||||||||||||||||||||||||||||||||
Weighted average number of total shares(4) | 57,587 | 68,080 | 68,080 | 66,933 | 67,091 | — | ||||||||||||||||||||||||||||||||||||||||||
| At or for the year ended December 31, | At or for the year ended December 31, | |||||||||||||||||||||||||||||||||||
| 2000 | 2001 | 2002 | 2003 | 2004 | 2004 | 2001 | 2002 | 2003 | 2004 | 2005 | 2005 | |||||||||||||||||||||||||
| (in millions of constant Ch$ as of December 31, 2004, except share data) | (in thousands of U.S.$) | (in millions of constant Ch$ as of December 31, 2005, except share data) | (in thousands of U.S.$) | |||||||||||||||||||||||||||||||||
CONSOLIDATED BALANCE SHEET DATA | ||||||||||||||||||||||||||||||||||||
Chilean GAAP: | ||||||||||||||||||||||||||||||||||||
Cash and due from banks | Ch$ | 528,531 | Ch$ | 562,955 | Ch$ | 700,267 | Ch$ | 878,255 | Ch$ | 890,616 | U.S.$ | 1,590,869 | 583,223 | 725,477 | 909,872 | 922,678 | 659,308 | 1,282,177 | ||||||||||||||||||
Financial investments | 1,478,121 | 1,759,103 | 1,655,261 | 1,964,232 | 1,607,273 | 2,871,001 | 1,822,429 | 1,714,849 | 2,034,944 | 1,665,136 | 1,450,009 | 2,819,877 | ||||||||||||||||||||||||
Loans, net of allowances | 3,984,728 | 3,973,488 | 6,155,049 | 6,227,855 | 6,735,169 | 12,030,740 | 4,116,533 | 6,376,630 | 6,452,059 | 6,977,636 | 8,064,619 | 15,683,512 | ||||||||||||||||||||||||
Other assets | 196,810 | 193,432 | 384,305 | 410,808 | 416,145 | 743,342 | 200,396 | 398,141 | 425,598 | 431,125 | 518,825 | 1,008,975 | ||||||||||||||||||||||||
Total assets | 6,188,190 | 6,488,978 | 8,894,882 | 9,481,150 | 9,649,203 | 17,235,952 | 6,722,581 | 9,215,097 | 9,822,473 | 9,996,575 | 10,692,761 | 20,794,541 | ||||||||||||||||||||||||
Deposits | 3,765,757 | 3,936,881 | 5,319,389 | 5,446,709 | 5,785,727 | 10,334,793 | 4,078,609 | 5,511,755 | 5,643,263 | 5,994,408 | 6,613,988 | 12,862,426 | ||||||||||||||||||||||||
Other interest bearing liabilities | 1,601,147 | 1,699,910 | 2,364,851 | 2,635,120 | 2,362,160 | 4,219,422 | 1,761,106 | 2,449,985 | 2,729,985 | 2,447,197 | 2,244,045 | 4,364,063 | ||||||||||||||||||||||||
Other liabilities | 400,805 | 427,509 | 570,620 | 686,253 | 826,783 | 1,476,848 | 442,900 | 590,294 | 710,487 | 856,153 | 1,059,621 | 2,060,677 | ||||||||||||||||||||||||
Total liabilities | 5,767,709 | 6,064,300 | 8,254,860 | 8,768,082 | 8,974,670 | 16,031,063 | 6,282,615 | 8,552,034 | 9,083,735 | 9,297,758 | 9,917,654 | 19,287,166 | ||||||||||||||||||||||||
Shareholders’ equity | Ch$ | 420,481 | Ch$ | 424,678 | Ch$ | 640,022 | Ch$ | 713,068 | Ch$ | 674,533 | U.S.$ | 1,204,889 | Ch$ | 439,966 | Ch$ | 663,063 | Ch$ | 738,738 | Ch$ | 698,817 | Ch$ | 775,107 | U.S.$ | 1,507,375 | ||||||||||||
U.S. GAAP(3): | ||||||||||||||||||||||||||||||||||||
U.S. GAAP(3): | ||||||||||||||||||||||||||||||||||||
Financial investments | 225,928 | 1,733,770 | 1,484,672 | 1,671,794 | 1,486,140 | 2,654,627 | 1,796,186 | 1,538,120 | 1,731,979 | 1,539,640 | 1,119,452 | 2,177,033 | ||||||||||||||||||||||||
Loans, net | 2,280,774 | 5,915,863 | 5,808,387 | 5,880,857 | 6,291,266 | 11,237,815 | 6,128,834 | 6,017,489 | 6,092,568 | 6,516,434 | 7,442,916 | 14,474,468 | ||||||||||||||||||||||||
Total assets | 2,987,107 | 9,222,042 | 8,900,762 | 9,437,600 | 9,623,775 | 17,190,531 | 9,554,036 | 9,221,189 | 9,777,354 | 9,925,518 | 10,626,463 | 20,665,609 | ||||||||||||||||||||||||
Total liabilities | 2,561,125 | 8,015,312 | 7,575,683 | 8,063,434 | 8,299,500 | 14,825,032 | 8,303,863 | 7,848,405 | 8,353,718 | 8,553,570 | 9,196,716 | 17,885,136 | ||||||||||||||||||||||||
Total shareholders’ equity | 425,982 | 1,206,730 | 1,325,079 | 1,374,166 | 1,324,275 | 2,365,499 | 1,250,172 | 1,372,782 | 1,423,636 | 1,371,948 | 1,429,747 | 2,780,471 | ||||||||||||||||||||||||
| At or for the year ended December 31, | At or for the year ended December 31, | |||||||||||||||||||||||||||||
| 2000 | 2001 | 2002 | 2003 | 2004 | 2001 | 2002 | 2003 | 2004 | 2005 | |||||||||||||||||||||
CONSOLIDATED RATIOS | ||||||||||||||||||||||||||||||
Chilean GAAP: | ||||||||||||||||||||||||||||||
Profitability and Performance | ||||||||||||||||||||||||||||||
Net interest margin(5) | 4.27 | % | 3.87 | % | 4.52 | % | 2.75 | % | 3.84 | % | ||||||||||||||||||||
Return on average total assets(6) | 1.57 | 1.44 | 0.59 | 1.45 | 1.59 | |||||||||||||||||||||||||
Return on average shareholders’ equity(7) | 23.68 | 23.21 | 8.69 | 20.01 | 23.56 | |||||||||||||||||||||||||
Net interest margin(5) | 3.87 | % | 4.52 | % | 2.75 | % | 3.84 | % | 4.06 | % | ||||||||||||||||||||
Return on average total assets(6) | 1.44 | 0.59 | 1.45 | 1.59 | 1.75 | |||||||||||||||||||||||||
Return on average shareholders’ equity(7) | 23.21 | 8.69 | 20.01 | 23.56 | 26.66 | |||||||||||||||||||||||||
Capital | ||||||||||||||||||||||||||||||
Average shareholders’ equity as a percentage of total assets | 6.62 | 6.21 | 6.75 | 7.22 | 6.75 | |||||||||||||||||||||||||
Average shareholders’ equity as a percentage of average total assets | 6.21 | 6.75 | 7.22 | 6.75 | 6.56 | |||||||||||||||||||||||||
Bank regulatory capital as a percentage of minimum regulatory capital | 203.86 | 197.67 | 218.35 | 202.71 | 179.13 | 197.67 | 218.35 | 202.71 | 179.13 | 184.06 | ||||||||||||||||||||
Equity as a percentage of total assets | 6.50 | 6.21 | 6.75 | 7.22 | 6.75 | |||||||||||||||||||||||||
Ratio of liabilities to regulatory capital(8) | 17.46 | 18.27 | 14.10 | 15.14 | 17.20 | |||||||||||||||||||||||||
Ratio of liabilities to regulatory capital(8) | 18.27 | 14.10 | 15.14 | 17.20 | 16.69 | |||||||||||||||||||||||||
Credit Quality | ||||||||||||||||||||||||||||||
Substandard loans as a percentage of total loans(9) | 5.75 | 6.28 | 6.69 | 5.16 | 6.51 | |||||||||||||||||||||||||
Substandard loans as a percentage of total loans(9) | 6.28 | 6.69 | 5.16 | 6.51 | 4.62 | |||||||||||||||||||||||||
Past due loans as a percentage of total loans | 1.36 | 1.23 | 2.35 | 1.69 | 1.23 | 1.23 | 2.35 | 1.69 | 1.23 | 0.87 | ||||||||||||||||||||
Allowances for loan losses as a percentage of substandard loans(9) | 52.52 | 54.60 | 52.44 | 55.56 | 38.41 | |||||||||||||||||||||||||
Allowances for loan losses as a percentage of substandard loans(9) | 54.60 | 52.44 | 55.56 | 34.30 | 37.26 | |||||||||||||||||||||||||
Allowances for loan losses as a percentage of past due loans | 222.46 | 278.72 | 149.07 | 170.09 | 181.55 | 278.72 | 149.07 | 170.09 | 181.59 | 198.05 | ||||||||||||||||||||
Allowances for loan losses as a percentage of total loans | 3.02 | 3.43 | 3.51 | 2.87 | 2.23 | 3.43 | 3.51 | 2.87 | 2.23 | 1.72 | ||||||||||||||||||||
Past due amounts as a percentage of shareholders’ equity | 16.89 | 15.26 | 25.63 | 18.67 | 16.23 | |||||||||||||||||||||||||
Consolidated risk index(10) | 2.01 | 2.42 | 3.00 | 2.36 | 2.23 | |||||||||||||||||||||||||
Past due amounts as a percentage of bank regulatory capital | 15.26 | 25.63 | 18.67 | 16.23 | 12.00 | |||||||||||||||||||||||||
Consolidated risk index(10) | 2.42 | 3.00 | 2.36 | 2.23 | 1.72 | |||||||||||||||||||||||||
Operating Ratios | ||||||||||||||||||||||||||||||
Operating expenses/operating revenue | 52.92 | 52.58 | 60.04 | 53.28 | 51.15 | 52.58 | 60.20 | 53.43 | 51.29 | 53.33 | ||||||||||||||||||||
Operating expenses/average total assets | 2.57 | 2.30 | 2.76 | 2.46 | 2.50 | 2.30 | 2.77 | 2.46 | 2.51 | 2.68 | ||||||||||||||||||||
U.S. GAAP: | ||||||||||||||||||||||||||||||
Profitability and Performance | ||||||||||||||||||||||||||||||
Net interest margin(11) | 2.22 | 5.12 | 4.53 | 3.03 | 4.13 | % | ||||||||||||||||||||||||
Return on average total assets(12) | 00 | % | 0.80 | % | 0.19 | % | 1.44 | % | 1.53 | % | ||||||||||||||||||||
Net interest margin(11) | 5.12 | 4.53 | 3.03 | 4.13 | 4.29 | |||||||||||||||||||||||||
Return on average total assets(12) | 0.80 | 0.19 | 1.44 | 1.53 | 1.64 | |||||||||||||||||||||||||
| (1) | Earnings per share data have been calculated by dividing net income by the weighted average number of common shares outstanding during the year. |
| (2) | Dividends per share data are calculated by dividing the amount of the dividend paid by the |
| (3) | All U.S. GAAP numbers use Article 9 presentation. All U.S. GAAP figures have been calculated taking into account the U.S. GAAP adjustments set forth in |
| (4) |
| (5) | Net interest revenue divided by average interest earning assets. The average balances for interest earning assets, including interest and readjustments, have been calculated on the basis of our daily balances and on the basis of monthly balances for our subsidiaries. |
| (6) | Net income (loss) divided by average total assets. The average balances for total assets have been calculated on the basis of our daily balances and on the basis of monthly balances for our subsidiaries. |
| (7) | Net income (loss) divided by average shareholders’ equity. The average balances for shareholders’ equity have been calculated on the basis of our daily balances. |
| (8) | Total liabilities divided by bank regulatory capital. |
| (9) | See “Item 4. Information on the Company—Selected Statistical Information—Analysis of Substandard Loans and Amounts Past Due.” |
| (10) | The guidelines used to calculate our consolidated risk index were amended in 2004. As a result, our consolidated risk index as of December 31, 2004 |
| (11) | Net interest revenue under U.S. GAAP divided by average interest earning assets. |
| (12) | Net income under U.S. GAAP divided by average total assets. |
Exchange Rates
As a general matter, prior to 1989, Chilean law permitted the purchase and sale of foreign exchange only in those cases explicitly authorized by the Central Bank. TheLey Organica Constitucional del Banco Central de Chile 18.840, or the Central Bank Act, liberalized the rules that govern the purchase and sale of foreign currency. The Central Bank Act empowers the Central Bank to determine that certain purchases and sales of foreign currency specified by law must be carried out in theMercado Cambiario Formal, or the Formal Exchange Market. The Formal Exchange Market is formed by the banks and other entities so authorized by the Central Bank. The observed exchange rate for any given day equals the average exchange rate of the transactions conducted in the Formal Exchange Market on the immediately preceding banking day, as certified by the Central Bank. Even though the Central Bank is authorized to carry out its transactions at the rates it sets, it generally uses the spot rate for its transactions. Authorized transactions by other banks are generally carried out at the spot rate.
Purchases and sales of foreign exchange which may be effected outside the Formal Exchange Market can be carried out in theMercado Cambiario Informal, or the Informal Exchange Market. There are no limits imposed on the extent to which the rate of exchange in the Informal Exchange Market can fluctuate above or below the observed exchange rate. On December 30, 20042005 (the latest practicable date, as December 31, 20042005 was a banking holiday in Chile), the average exchange rate in the Informal Exchange Market was Ch$556.75512.05 per U.S.$1.00, or 0.55%0.42% lower than the published observed exchange rate of Ch$559.83514.21 per U.S.$1.00.
The following table sets forth the annual low, high, average and period-end observed exchange rate for U.S. dollars for each year beginning in 2000,2001, as reported by the Central Bank:
| Daily Observed Exchange Rate Ch$ per U.S.$(1) | Daily Observed Exchange Rate Ch$ per U.S.$(1) | |||||||||||||||||||||||
Year | Low(2) | High(2) | Average(3) | Period End(4) | Low(2) | High(2) | Average(3) | Period End(4) | ||||||||||||||||
2000 | Ch$ | 501.04 | Ch$ | 580.37 | Ch$ | 539.49 | Ch$ | 572.68 | ||||||||||||||||
2001 | 557.13 | 716.62 | 634.94 | 656.20 | Ch$ | 557.13 | Ch$ | 716.62 | Ch$ | 634.94 | Ch$ | 656.20 | ||||||||||||
2002 | 641.75 | 756.56 | 688.94 | 712.38 | 641.75 | 756.56 | 688.94 | 712.38 | ||||||||||||||||
2003 | 593.10 | 758.21 | 691.40 | 599.42 | 593.10 | 758.21 | 691.40 | 599.42 | ||||||||||||||||
2004 | 559.21 | 649.45 | 609.55 | 559.83 | 559.21 | 649.45 | 609.55 | 559.83 | ||||||||||||||||
2005 | 509.70 | 592.75 | 559.77 | 514.21 | ||||||||||||||||||||
December | 559.66 | 597.27 | 576.17 | 559.83 | 509.70 | 518.63 | 514.33 | 514.21 | ||||||||||||||||
2005 | ||||||||||||||||||||||||
2006 | ||||||||||||||||||||||||
January | 557.40 | 586.18 | 574.12 | 586.18 | 512.50 | 535.36 | 524.48 | 524.78 | ||||||||||||||||
February | 563.22 | 585.40 | 573.58 | 577.52 | 516.91 | 532.35 | 525.70 | 517.76 | ||||||||||||||||
March | 573.55 | 591.69 | 586.48 | 586.45 | 516.75 | 536.16 | 528.77 | 527.70 | ||||||||||||||||
April | 572.75 | 588.95 | 580.46 | 582.87 | 511.44 | 526.18 | 517.33 | 518.62 | ||||||||||||||||
May | 570.83 | 583.59 | 578.31 | 580.20 | 512.76 | 532.92 | 520.79 | 531.11 | ||||||||||||||||
June(5) | 580.62 | 592.75 | 587.94 | 582.55 | ||||||||||||||||||||
June(5) | 529.91 | 547.83 | 540.57 | 545.64 | ||||||||||||||||||||
Source: Central Bank.
| Source: | Central Bank. |
| (1) | Nominal amounts. |
| (2) | Exchange rates are the actual low and high, on a day-by-day basis for each period. |
| (3) | The average of monthly average rates during the year. |
| (4) | As reported by the Central Bank the first business day of the following period. |
| (5) | Period from June 1, |
The observed exchange rate on June 21, 200522, 2006 was Ch$582.55545.64 = U.S.$1.00. The Federal Reserve Bank of New York does not report a noon buying rate for Chilean pesos.
RISK FACTORS
The risks and uncertainties described below are not the only ones that we face. Additional risks and uncertainties that we do not know about or that we currently think are immaterial may also impair our business operations. Any of the following risks if they actually occur, could materially and adversely affect our business, results of operations, prospects and financial condition.
We are subject to market risks that are presented both in this subsection and in “Item 11. Quantitative and Qualitative Disclosures About Market Risk.”
Risks Relating to our Operations and the Banking Industry
WeOur U.S. branches are involved in ongoing regulatory proceedings that could result in monetary fines.subject to obligations imposed under consent orders
Beginning in September 2004, the Office of the Comptroller of the Currency, or OCC, and the Board of Governors of the Federal Reserve System by and through the Federal Reserve Bank of Atlanta, collectively,together, the Federal Reserve, conducted targeted examinations of our New York and Miami branches, respectively, to evaluate, among other things, our compliance with the U.S. Bank Secrecy Act and other U.S. anti-money laundering requirements. As a result of thesetheir examinations, the OCC and the Federal Reserve identified certain deficiencies in our internal controls, particularly in the areas of the Bank Secrecy Act and anti-money laundering compliance. As a result, on February 1, 2005, we agreed to the issuance by the OCC of a consent order, withapplicable to our New York branch, and the OCC andissuance by the Federal Reserve of a cease and desist order, with the Federal Reserve.applicable to our Miami branch. Pursuant to these orders, we have instituted an action plan whichthat includes the maintenance of programs geared towards strengthening our compliance with the Bank Secrecy Act and United StatesU.S. anti-money laundering laws. Based on the press statement issued by
On October 12, 2005, we entered into agreements with the OCC, atand separately with the timeFinancial Crimes Enforcement Network, or FinCEN, requiring a U.S.$3 million civil penalty, payable by our New York and Miami branches, to resolve allegations related to the consent order was entered into,Bank Secrecy Act, anti-money laundering compliance and related matters. Failure by us to satisfy the terms of the orders could result in additional supervisory actions against our New York and Miami branches, including the assessment of additional civil money penalties and other sanction are possible, but the likelihood, extent and amount of such actions cannot be determined at this time. We cannot assure you that these examinations will not have an adverse effect on our financial condition and results of operations.monetary penalties. See “Item 8. Financial Information—Legal Proceedings.”
The growth of our loan portfolio may expose us to increased loan losses.
From December 31, 19992001 to December 31, 2004,2005, our aggregate loan portfolio, net of interbank loans (on an unconsolidated basis) grew by 115.4%124.2% in nominal terms and 82.4%102.9% in real terms to Ch$6,659,8398,073,288 million. During the same period, our consumer loan portfolio grew by 303.0%315.0% in nominal terms and 241.3%275.7% in real terms to Ch$691,851864,144 million, each calculated in accordance with the loan classification system of the Chilean Superintendency of Banks. On a combined basis (combining Banco de Chile and Banco de A. Edwards), from December 31, 19992001 to December 31, 2004,2005, the aggregate loan portfolio of both banks, net of interbank loans (on an unconsolidated basis) grew by 32.0%39.0% in nominal terms and 12.4%25.9% in real terms to Ch$6,659,8398,073,288 million. During the same period, on a combined basis, the consumer loan portfolio of both banks grew by 136.9%123.0% in nominal terms and 100.6%101.9% in real terms to Ch$691,851864,144 million, each calculated in accordance with the loan classification system of the Chilean Superintendency of Banks. Further expansionExpansion of our loan portfolio (particularly in the lower-middle to middle income consumer and small- to medium-sized corporate business areas)retail market) may expose us to a higher level of loan losses and require us to establish higher levels of allowances for loan losses.
For the year ended December 31, 2005, total provision for loan losses accounted for Ch$22,028 million, or 0.29%, of total average loans.
Our loan portfolio may not continue to grow at the same or similar rate.
We cannot assure you that in the future our loan portfolio will continue to grow at historical rates. According to the Chilean Superintendency of Banks, from December 31, 19992001 to December 31, 2004,2005, the
aggregate amount of loans outstanding in the Chilean banking system (on an unconsolidated basis) grew by 49.9%48.2% in nominal terms and 26.9%34.2% in real terms to Ch$37,349,29644,243,988 million. A reversal of this rate of growth of the Chilean economy could adversely affect the rate of growth of our loan portfolio and our risk index and, accordingly, increase our required allowances for loan losses. See “Item 4. Information on the Company—Regulation and Supervision” and “Item 4. Information on the Company —Selected Statistical Information.”
Restrictions imposed by banking regulations may restrict our operations and thereby adversely affect our financial condition and results of operations.
We are subject to regulation by the Chilean Superintendency of Banks. In addition, we are subject to regulation by the Central Bank with regard to certain matters, including interest rates and foreign exchange transactions. See “Item 4. Information on the Company—Regulation and Supervision.” During the Chilean financial crisis of 1982 and 1983, the Central Bank and the Chilean Superintendency of Banks strictly controlled the funding, lending and general business matters of the Chilean banking industry.
Pursuant to theLey General de Bancos, or the General Banking Law, all Chilean banks may, subject to the approval of the Chilean Superintendency of Banks, engage in additional businesses depending on the risk of the activity and the strength of the bank. The General Banking Law also applies to the Chilean banking system a modified version of the capital adequacy guidelines issued by the Basel Committee on Banking Regulation and Supervisory Practices, or Basel Committee, and limits the discretion of the Chilean Superintendency of Banks to deny new banking licenses. There can be no assurance that regulators will not in the future impose more restrictive limitations on the activities of banks, including us, than those that are currently in effect. Any such change could have a material adverse effect on our financial condition or results of operations.
We reported a negative cash flow from operating activities for the year ended December 31, 2003, which could have an adverse effect on our ability to operate in the future.
During 2003, we reported a negative cash flow from our operations. During that year, we invested a large amount of cash in Central Bank securities in order to meet our technical reserve requirements as a result of higher current account and other demand deposits levels, resulting in negative operating cash flow. From time to time, we may need to invest large amounts of cash in order to meet regulatory requirements. Given current low interest rates, our customers tend to maintain deposits in checking accounts and in other demand deposits, which are included in the technical reserve requirement, which may also result in a need to invest more cash in highly liquid products such as Central Bank securities. Either or both of these needs may affect our cash flow from operations. We cannot assure you that we will not report a negative cash flow from operating activities in the future.
Increased competition and industry consolidation may adversely affect our operations.
The Chilean market for financial services is highly competitive. We compete with other Chilean private sector domestic and foreign banks, with Banco del Estado de Chile, a public sector bank, and with large department stores that make consumer loans to a large portion of the Chilean population. In 2002, two new private sector banks affiliated with Chile’s largest department stores began their operations, mainly as consumer and medium-sized corporate niche banks. In 2003, a new niche bank oriented at servicing corporations began its operations, and in 2004, two new retail banks commenced operations. The lower-middle to middle income portionsretail market (comprised of the Chilean populationindividuals and the small- and medium-sized companies havecompanies) has become the target marketsmarket of several banks, and competition with respect to these customers is likely to increase. As a result, net interest margins in these subsegmentssub-segments are likely to decline. Although we believe that demand for financial products and services from lower-middle to middle income individuals and from small- and medium-sized companiesthe retail market will continue to grow during the remainder of the decade, we cannot assure you that net interest margins will be maintained at their current levels.
We also face competition from non-bank competitors with respect to some of our credit products, such as credit cards and consumer loans. Non-bank competition from large department stores, private compensation funds and savings and credit associations has become increasingly significant in the consumer lending sector. In addition, we face competition from competitors such as leasing, factoring and automobile finance companies, with respect to credit products, and mutual funds, pension funds and insurance companies, with respect to savings products and mortgage loans. Currently, banks continue to be the main suppliers of leasing, factoring and mutual funds, and the insurance sales business has experienced rapid growth.growth, but we cannot assure you that they will continue to be in the future. See “Item 4. Information on the Company—Business Overview—Competition.”
The increase in competition within the Chilean banking industry in recent years hadhas led to, among other things, consolidation in the industry. For example, on August 1, 2002, Banco Santiago and Banco Santander-Chile, the then-second and third largest banks in Chile, respectively, merged creatingto create Chile’s largest bank. In 2003, Banco del Desarrollo merged with Banco Sudameris and,Sudameris; in 2004, Banco Security merged
with Dresdner Banque Nationale de Paris.Paris; and in 2005 Banco de Creditos e Inversiones merged with Banco Conosur. We expect the trends of increased competition and consolidation to continue and result in the formation of new large financial groups. Consolidation, which can result in the creation of larger and stronger banks, may adversely affect our financial condition and results of operations by decreasing the net interest margins we are able to generate and by increasing our costs of operations.
Our exposure to small businesses and lower-middle income individualscertain segments of the retail market could lead to higher levels of past due loans and subsequent charge-offs.
Although we historically emphasized banking for largethe wholesale market and medium-sized businesses,high income individuals, an increasing numberproportion of our corporate customersretail market consists of middle-sized and small companies (approximately 9.4%7.8% of the value of theour total loan portfolio at December 31, 2004) consist of small2005, including companies (those with annual sales of less thanup to Ch$3001,200 million) and, to a lesser extent, individual customersof lower income individuals (approximately 2.8% of the value of theour total loan portfolio at December 31, 2004) in the lower income2005, including individuals subsegment (annual incomewith monthly incomes between Ch$1.8 million170,000 and Ch$5.4 million)380,000). Our strategy includes increasing lending and providing other services to attract additional lower-middle income individuals and small companies asretail customers. These customers are likely to be more severely affected by adverse developments in the Chilean economy than large corporations and high-income individuals. Consequently, in the future we may experience higher levels of past due loans, which could result in higher allowances for loan losses. The levels of past due loans and subsequent write-offs may be materially higher in the future. See “Item 4. Information on the Company—Business Overview—Principal Business Activities.”
Our affiliate may be obligated to sell shares of our stock in the public market if we do not pay sufficient dividends.
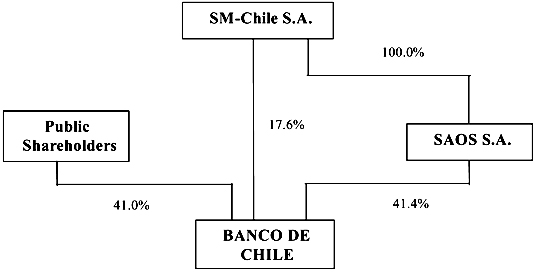
As of December 31, 2004,2005, Sociedad Administradora de la Obligacion Subordinada SAOS S.A., or SAOS, our affiliate, holds 42.0% of our shares as a consequence of our 1996 reorganization. The reorganization was partially due to our 1989 repurchase from the Central Bank of certain non-performing loans that we had previously sold to the Central Bank and later exchanged for subordinated debt without a fixed term. Under the terms of a repayment obligation in favor of the Central Bank that SAOS assumed to replace the Central Bank subordinated debt, SAOS may be required to sell some of our shares to the public. See “Item 4. Information on the Company—History and Development of the Bank—History—The 1982-1983 Economic Crisis and the Central Bank Subordinated Debt.”
In exchange for assuming the Central Bank indebtedness, SAOS received from SM-Chile S.A., a holding company that controls us and SAOS, 63.6% of our shares as collateral for this indebtedness. As a result of our merger with Banco de A. Edwards, the percentage of our shares held by SAOS decreased to 42.0%. As a result of the share dividend paid in May 2006, the percentage further decreased to 41.4%. Dividends received from us are the sole source of SAOS’s revenue, which it must apply to repay this indebtedness. However, under SAOS’s agreement with the Central Bank, we have no obligation to distribute dividends to our shareholders. To the extent distributed dividends are not sufficient to pay the amount due on this indebtedness, SAOS is permitted to maintain a cumulative deficit balance with the Central Bank that
SAOS commits to pay with future dividends. If the cumulative deficit balance exceeds an amount equal to 20% of our capital and reserves, the Central Bank may require SAOS to sell a sufficient number of shares of our stock owned by SAOS to pay the entire accumulated deficit amount. As of May 2, 2005,2006, SAOS maintained a deficit balance with the Central Bank of Ch$27,90510,480 million, equivalent to 5.4%1.67% of our capital and reserves. As of the same date, Ch$104,155125,250 million would have represented 20.0% of our capital and reserves. If from time to time in the future our shareholders decide to retain and capitalize all or part of our annual net income in order to finance our future growth, and to distribute stock dividends among our shareholders, the Central Bank may require us to pay the portion of the net income corresponding to shares owned by SAOS in cash to SAOS. If we distribute stock dividends and the Central Bank does not require us to pay that portion in cash, the shares received by SAOS must be sold by SAOS within the following 12 months. The shareholders of SM-Chile will have a right of first refusal with respect to that sale.
We are unable to determine the likelihood that the Central Bank would require SAOS to sell shares of our common stock or that SAOS will otherwise be required to sell any stock dividends distributed by us, nor can we determine the number of such shares SAOS may be required to sell. If SAOS is required to sell shares of our stock in the public market, that sale could adversely affect the prevailing market price of our stock.
Our results of operations are affected by interest rate volatility.
Our results of operations depend to a great extent on our net interest revenue, which represented 69.9%71.3% of our operating revenue in 2004.2005. Changes in market interest rates could affect the interest rates earned on our interest-earning assets differently from the interest rates paid on our interest-bearing liabilities, leading to a reduction in our net interest revenue. Interest rates are highly sensitive to many factors beyond our control, including the reserve policies of the Central Bank, deregulation of the financial sector in Chile, domestic and international economic and political conditions and other factors. Any volatility in interest rates could have a material adverse effect on our financial condition or results of operations. The average annual short-term interest rate (based on the rate paid by Chilean financial institutions) for 90 to 360 day deposits was 1.94% in 2002, 1.76% in 2003, and 1.07% in 2004.2004 and 1.89% in 2005. The average long-term interest rate based on the Chilean Central Bank’s eight-year duration bonds was 4.54% in 2002, 3.96% in 2003, and 3.52% in 2004.2004 and 2.54% in 2005. See “Item 5. Operating and Financial Review and Prospects—Operating Results—Overview—Inflation” and “Item 5. Operating and Financial Review and Prospects —Overview—— Operating Results—Overview—Interest Rates.”
Operational problems or errors can have a material adverse impact on our business, financial condition and results of operations.
We, like all large financial institutions, are exposed to many operational risks, including the risk of fraud by employees and outsiders, failure to obtain proper internal authorizations, failure to properly document transactions, equipment failures and errors by employees. Although we maintain a system of operational controls, there can be no assurance that operational problems or errors will not occur and that their occurrence will not have a material adverse impact on our business, financial condition and results of operations.
Risks Relating to our ADSs
Our principal shareholders may have interests that differ from those of our other shareholders and their significant share ownership may have an adverse effect on the future market price of our ADSs and shares.
As of December 31, 2004,May 11, 2006, LQ Inversiones Financieras S.A., a holding company beneficially owned by Quiñenco S.A., beneficially owned approximately 51.57%50.29% of our outstanding voting rights. These principal shareholders are in a position to elect a majority of the members of our board of directors, direct our management and control substantially all matters that are to be decided by a vote of the shareholders, including fundamental corporate transactions.
Actions by our principal shareholders with respect to the disposition of the shares or ADSs they beneficially own, or the perception that such actions may occur, may adversely affect the trading price of our shares on the various stock exchanges on which they are listed and, consequently, the market price of the ADSs.
There may be a lack of liquidity and a limited market for our shares and ADSs.
We merged with Banco de A. Edwards, a Chilean Bank, effective as of January 1, 2002. Prior to the merger, there was no public market for our shares outside Chile or for our ADSs. While our ADSs have been listed on the New York Stock Exchange, or NYSE, since the first quarter of 2002, there can be no assurance that an active trading market for our ADSs will be sustained. During 2004,2005, a daily average of 6,2377,696 American Depositary Receipts, or ADRs, were traded on the NYSE. Although our shares are traded on the Santiago
Stock Exchange, the Valparaiso Stock Exchange and the Chilean Electronic Stock Exchange, the market for our shares in Chile is small and illiquid. At December 31, 2004,2005, approximately 12.0%12.87% of our outstanding shares are held by shareholders other than our principal shareholders, including SM-Chile and SAOS.
If an ADS holder withdraws the underlying shares from the ADR facility, the small size of the market and its low liquidity in general, and our concentrated ownership in particular, may impair the ability of the ADS holder to sell the shares in the Chilean market in the amount and at the price and time such holder desires, and could increase the volatility of the price of our ADSs.
You may be unable to exercise preemptive rights.
TheLey Sobre Sociedades Anonimas No. 18,046 and theReglamento de Sociedades Anonimas, or the Chilean Corporations Law and its regulations require that whenever we issue new common stock for cash, we grant preemptive rights to all of our shareholders (including holders of ADSs) to purchase a sufficient number of shares to maintain their existing ownership percentage. Such an offering would not be possible unless a registration statement under the Securities Act of 1933, as amended, or the Securities Act, were effective with respect to such rights and common stock or an exemption from the registration requirements thereunder were available.
We may elect not to make a registration statement available with respect to the preemptive rights and the common stock, in which case you may not be able to exercise your preemptive rights. If a registration statement is not filed, the depositary will sell such holders’ preemptive rights and distribute the proceeds thereof if a premium can be recognized over the cost of any such sale.
Developments in other emerging markets may adversely affect the market price of the ADSs and shares.
The market price of the ADSs may be adversely affected by declines in the international financial markets and adverse world economic conditions. The market for Chilean securities is, to varying degrees, influenced by economic and market conditions in other emerging market countries, especially those in Latin America. Although economic conditions are different in each country, investors’ reactions to developments in one country can affect the securities markets and the securities of issuers in other countries, including Chile. Developments in other countries may adversely affect the market price of the ADSs.
In the past, Chile has imposed controls on foreign investment and repatriation of investments that affected an investment in, and earnings from, our ADSs.
Equity investments in Chile by persons who are not Chilean residents have historically been subject to various exchange control regulations that restrict the repatriation of the investments and earnings therefrom. In April 2001, the Central Bank eliminated most of the regulations that affected foreign investors, although foreign investors still have to provide the Central Bank with information related to equity investments and must conduct such operations within the Formal Exchange Market. Additional Chilean restrictions applicable to holders of our ADSs, the disposition of the shares underlying them or the repatriation of the proceeds from such disposition or the payment of dividends may be imposed in the future, and we cannot advise you as to the duration or impact of such restrictions if imposed.
If for any reason, including changes in Chilean law, the depositary were unable to convert Chilean pesos to U.S. dollars, investors would receive dividends and other distributions, if any, in Chilean pesos.
We are required to withhold for tax purposes 35% of any dividend we pay to you.
Owners of ADSs are entitled to receive dividends on the underlying shares to the same extent as the holders of shares. Dividends received by holders of ADSs will be paid net of foreign currency exchange fees and expenses of the depositary and will be subject to Chilean withholding tax of up to 35% of the dividend,
which we will withhold and pay to the Chilean tax authorities. Any dividend distributions made in property (other than common stock) will be subject to the same Chilean tax rules as cash dividends. See “Item 10. Additional Information—Taxation—Chilean Tax Considerations.”
Risks Relating to Chile
Currency fluctuations could adversely affect the value of our ADSs and any distributions on the ADSs.
The Chilean government’s economic policies and any future changes in the value of the Chilean peso against the U.S. dollar could affect the dollar value of our common stock and our ADSs. The peso has been subject to large devaluations in the past and could be subject to significant fluctuations in the future. In the period from December 31, 1998 to December 31, 2004,2005, the value of the U.S. dollar relative to the Chilean peso increased approximately 0.24%, as compared to an 8.2%11.36% decrease in value in the period from December 31, 19942004 to December 31, 1998.
2005.
Chilean trading in the shares underlying our ADSs is conducted in pesos. Cash distributions with respect to our shares of common stock are received in Chilean pesos by the depositary, which then converts such amounts to U.S. dollars at the then-prevailing exchange rate for the purpose of making payments in respect of our ADSs. If the value of the Chilean peso falls relative to the U.S. dollar, the dollar value of our ADSs and any distributions to be received from the depositary will be reduced. In addition, the depositary will incur customary currency conversion costs (to be borne by the holders of our ADSs) in connection with the conversion and subsequent distribution of dividends or other payments. See “Item 10. Additional Information—Exchange Controls.”
Our results of operations may be affected by fluctuations in the exchange rates between the peso and the U.S. dollar despite our policy and Chilean regulations relating to the general avoidance of material exchange rate mismatches. In order to reduce the effect of exchange rate mismatches we enter into forward exchange transactions. As of December 31, 2005, the net position of our foreign currency denominated assets and Chilean peso-denominated assets, which contain repayment terms linked to changes in foreign currency exchange rates, exceeded our foreign currency denominated liabilities and Chilean peso-denominated liabilities, which contain repayment terms linked to changes in foreign currency exchange rates, by Ch$26,451 million, or 4.5% of our paid-in capital and reserves.
We may decide to change our policy regarding exchange rate mismatches. Regulations that limit such mismatches may also be amended or eliminated. Greater exchange rate mismatches will increase our exposure to the devaluation of the peso, and any such devaluation may impair our capacity to service foreign-currency obligations and may, therefore, materially and adversely affect our financial condition and results of operations. Notwithstanding the existence of general policies and regulations that limit material exchange rate mismatches, the economic policies of the Chilean government and any future fluctuations of the peso against the U.S. dollar could adversely affect our financial condition and results of operations.
Inflation could adversely affect the value of our ADSs and financial condition and results of operations.
Although Chilean inflation has moderated in recent years, Chile has experienced high levels of inflation in the past. High levels of inflation in Chile could adversely affect the Chilean economy and, indirectly, the value of our ADSs. The annual rate of inflation (as measured by changes in the Consumer Price Index and as reported by theInstituto Nacional de Estadisticas, or the Chilean National Institute of Statistics) during the last five years ended December 31, 20042005 and the first five months of 20052006 was:
Year | Inflation (Consumer Price Index) | Inflation (Consumer Price Index) | ||||
2000 | 4.5 | % | ||||
2001 | 2.6 | 2.6 | % | |||
2002 | 2.8 | 2.8 | ||||
2003 | 1.1 | 1.1 | ||||
2004 | 2.4 | 2.4 | ||||
2005 (through May 31) | 1.4 | % | ||||
| Source: Chilean National Institute of Statistics | ||||||
2005 | 3.7 | |||||
2006 (through May 31) | 1.5 | % | ||||
Source: Chilean National Institute of Statistics
Although we currently benefit from inflation in Chile due to the structure of our assets and liabilities (i.e., we have a significant amount of deposits that are not indexed to the inflation rate and do not accrue interest while a significant portion of our loans are indexed to the inflation rate), our operating results and the value of our ADSs in the future may be adversely affected by changing levels of inflation, and Chilean inflation could change significantly from the current level.
Our growth and profitability depend on the level of economic activity in Chile.
A substantial amount of our loans are to borrowers doing business in Chile. Accordingly, the recoverability of these loans, in particular, our ability to increase the amount of loans outstanding and our results of operations and financial condition, in general, are dependent to a significant extent on the level of economic activity in Chile. The Chilean economy has been influenced, to varying degrees, by economic conditions in other emerging market countries. We cannot assure you that the Chilean economy will continue to grow in the future or that future developments in or affecting the Chilean economy will not materially and adversely affect our business, financial condition or results of operations. Furthermore, although our operations (with the exception of our branches in New York and Miami, our trade services subsidiary in Hong Kong and our three representative offices located in Buenos Aires, Sao Paulo and Mexico City) are currently limited to Chile, we may in the future pursue a strategy of expansion into other Latin American countries. The potential success of such strategy will depend in part on political, social and economic developments in such countries.
Chile has corporate disclosure and accounting standards different from those you may be familiar with in the United States.
The accounting, financial reporting and securities disclosure requirements in Chile differ from those in the United States. Accordingly, the information about us available to you will not be the same as the information available to shareholders of a U.S. company.
There are also important differences between Chilean and U.S. accounting and financial reporting standards. As a result, Chilean financial statements and reported earnings generally differ from those that would be reported based on U.S. accounting and reporting standards. See noteNote 28 to our audited consolidated financial statements.
As a regulated financial institution, we are required to submit to the Chilean Superintendency of Banks unaudited unconsolidated balance sheets and income statements, excluding any note disclosure, prepared in accordance with Chilean GAAP on a monthly basis. The Chilean Superintendency of Banks
makes this information public within approximately three months of receipt. The Chilean Superintendency of Banks also makes summary financial information available within three weeks of receipt. Such disclosure differs in a number of significant respects from information generally available in the United States with respect to U.S. financial institutions.
Chilean disclosure requirements for publicly listed companies differ from those in the United States in some significant respects. In addition, although Chilean law imposes restrictions on insider trading and price manipulation, the Chilean securities markets are not as highly regulated and closely supervised as the U.S. securities markets.
Chilean law provides for fewer and less well-defined shareholders’ rights.
Our corporate affairs are governed by ourestatutos, or bylaws, and the laws of Chile. Under such laws, our shareholders may have fewer or less well-defined rights than they might have as shareholders of a corporation incorporated in a U.S. jurisdiction. For example, our shareholders would not be entitled to appraisal rights in the event of a merger or other business combination undertaken by us.
FORWARD-LOOKING STATEMENTS
This annual report contains forward-looking statements. These statements appear throughout this annual report, including, without limitation, under “Item 4. Information on the Company” and “Item 5. Operating and Financial Review and Prospects.” Examples of such forward-looking statements include:
Words such as “believe,” “anticipate,” “plan,” “expect,” “intend,” “target,” “estimate,” “project,” “potential,” “predict,” “forecast,” “guideline,” “could,” “may,” “will,” “should” and similar expressions are intended to identify forward-looking statements but are not the exclusive means of identifying such statements. These statements may relate to (1) our asset growth and financing plans, (2) trends affecting our financial condition or results of operations and (3) the impact of competition and regulations, but are not limited to such topics. Forward-looking statements are not guarantees of future performance and involve risks and uncertainties, and actual results may differ materially from those described in such forward-looking statements included in this annual report as a result of various factors (including, without limitation, the actions of competitors, future global economic conditions, market conditions, foreign exchange rates and operating and financial risks), many of which are beyond our control. The occurrence of any such factors not currently expected by us would significantly alter the results set forth in these statements.
Factors that could cause actual results to differ materially and adversely include, but are not limited to:
You should not place undue reliance on forward-looking statements, which speak only as of the date that they were made. This cautionary statement should be considered in connection with any written or oral forward-looking statements that we may issue in the future. We do not undertake any obligation to release publicly any revisions to such forward-looking statements after the filing of this annual report to reflect later events or circumstances or to reflect the occurrence of unanticipated events.
HISTORY AND DEVELOPMENT OF THE BANK
Overview
Our bank wasWe were founded in 1893, and we believe that we have been, for much of our recent history, among the largest and most profitable Chilean banks in terms of return on assets and shareholders’ equity. We are engaged primarily in commercial banking in Chile, providing general banking services to a diverse customer base that includes large corporations small and mid-sized businesses and individuals.
Our legal name is Banco de Chile, and weChile. We are organized as a banking corporation under the laws of the Republic of Chile and are licensed by the Chilean Superintendency of Banks to operate as a commercial bank. Our principal executive offices are located at Ahumada 251, Santiago, Chile. Our telephone number is +56 (2) 653-1111637-1111 and our website is www.bancochile.cl. Our registered agent in the United States is Banco de Chile, New York Branch. Its office isBranch, located at 535 Madison Avenue, 9th Floor, New York, New York 10022; its10022, telephone number is +1 (212) 758-0909.
We are a full-service financial institution providing, directly and indirectly through our subsidiaries and affiliates, a wide variety of credit and non-credit products and services to all segments of the Chilean financial market. Our operations are organized in sixfive principal business areas:
Our corporate banking services for corporate customers include commercial loans, including working capital facilities and trade finance, foreign exchange, capital market services, cash management and non-credit services such as payroll and payment services. We also provideservices, as well as a wide range of treasury and risk management products to our corporate customers, and weproducts. We provide our individual customers with credit cards, residential mortgage, auto and consumer loans, as well as traditional deposit services such as checking and savings accounts and time deposits.
We offer international banking services through our branches in New York and Miami, our trade services subsidiary in Hong Kong, representative offices in Buenos Aires, Sao Paulo and Mexico City and a worldwide network of correspondent banks. In addition to our commercial banking operations, through our subsidiaries, we offer a variety of non-banking financial services including securities brokerage, mutual fund management, financial advisory services, factoring, insurance brokerage, securitization and collection and sales services.
As of December 31, 2004,2005, we had:
According to information published by the Chilean Superintendency of Banks, as of December 31, 2004,2005, we were the second largest private bank in Chile in terms of total loans (excluding interbank loans) with a market share of 17.8%18.25%.
We are headquartered in Santiago, Chile and, as of December 31, 2004,2005, had 9,36510,157 employees and delivered financial products and services through a nationwide network of 224248 branches and 1,0011,258 ATMs that form part of a network of 3,1814,807 ATMs operated by Redbanc S.A., a company owned by us and 13 other private sector financial institutions.
History
We were established in 1893 as a result of the merger of Banco Nacional de Chile, Banco Agricola and Banco de Valparaiso, which created the largest privately held bank in Chile. We believe that we remained the largest private bank in Chile until mid-2002.1996. Beginning in the early 1970s, the Chilean government assumed control of a majority of Chilean banks and all but one of the foreign banks operating at the time closed their branches and offices in Chile. Throughout this era, we remained privately owned, with the Chilean government owning participating shares which it sold to private investors in 1975. We developed a well-recognized name in Chile and expanded our operations in foreign markets where we developed an extensive network of correspondent banks. In the early twentieth century, we established a representative office in London, which we maintained until 1985, when our European operations were moved to Frankfurt. The Frankfurt office was closed in 2000, when our foreign operations were centralized at the New York branch. In 1987 and 1988, we established four subsidiaries to provide the full range of financial products and services permitted by the General Banking Law and in 1999, we established our insurance brokerage and factoring subsidiaries.
Merger with Banco de A. Edwards
On December 6, 2001, our shareholders approved the merger with Banco de A. Edwards, which became effective on January 1, 2002. Banco de A. Edwards had been listed on the NYSE since 1995, and in January 2002, we were listed on the NYSE under the symbol BCH. During 2002, our shares were also listed on the Latin American Stock Exchange of the Madrid Stock Exchange, or Latibex, and the London Stock Exchange, or LSE.
We concluded the merger process at the end of 2002 with the consolidation of a new corporate structure and the integration of our technological platforms. In 2001 and 2002, we incurred merger related costs of approximately Ch$15,10315,639 million and Ch$31,97333,108 million, respectively. No further costs related to the merger have been incurred since 2002.
Neos Projectand Related Projects
In 2003, we developed the groundwork for “Neos,” our technological innovation platform project which was established to improvethat provides information necessary for designing specific value proposals for every market subsegment and that simultaneously improves the quality of our service and increaseincreases efficiency. During 2004, we concluded the
initial phases of “Neos,” which consisted of implementing a new management control platform
which that will support internal administration, a customer relationship management system, which will initially manage client service requirements and global client information, and a new accounting system.
During 2005, we successfully concluded the implementation of the Enterprise Resource Planning system, which, in its orientation towards self-service applications, provides human resources solutions. We also deployed a Customer Relationship Management, or CRM, service platform in all our retail branches and call centers. It will mainly permit preventive functions, the management of commercial campaigns and the tracking of credit approvals. From 20052006 to 2007, we will launchcontinue replacing credit card and cashier systems and will introduce more sophisticated customer relationship management systemsCRM functions, such as the automation of sales and a core banking system that will manage our main assetspost-sales procedures and liabilities.
the substitution of the checking account and deposit taking systems.
The 1982-1983 Economic Crisis and the Central Bank Subordinated Debt
During the 1982-1983 economic crisis, the Chilean banking system experienced significant instability requiring that the Central Bank and the Chilean government provide assistance to most Chilean private sector banks, including us. During this period, we experienced significant financial difficulties. In 1985 and 1986, we increased our capital and sold shares representing 88% of our capital to more than 30,000 new shareholders. As a result, no single shareholder held a controlling stake in our company. In 1987, the Chilean Superintendency of Banks returned the control and administration of the bank to our shareholders.
Subsequent to the crisis, like most major Chilean banks, we sold certain of our non-performing loans to the Central Bank at face value on terms that included a repurchase obligation. The repurchase obligation was later exchanged for subordinated debt of each participating bank issued in favor of the Central Bank. In 1989, pursuant to Law No. 18,818, banks were permitted to repurchase the portfolio of non-performing loans for a price equal to the economic value of such loans, provided that the bank assume a subordinated obligation equal to the difference between the face value and economic value of such loans. In November 1989, we repurchased our portfolio of non-performing loans from the Central Bank and assumed the Central Bank’s subordinated debt relating to our non-performing loans.
The original repayment terms of our Central Bank subordinated debt, which at December 31, 1989 equaled approximately Ch$1,049,1981,114,606 million, or U.S.$1,7502,168 million, required that a certain percentage of our income before provisions for the subordinated debt be applied to repay this obligation. The Central Bank subordinated debt did not have a fixed maturity, and payments were made only to the extent that we earned income before provisions for the subordinated debt. In 1993 we applied 72.9% of our income before provisions for the Central Bank subordinated debt to the repayment of this debt. In 1994 we applied 67.6% and in 1995 we applied 65.8% of our income before provisions for the Central Bank subordinated debt to the repayment of this debt.
In November 1996, pursuant to Law No. 19,396, our shareholders approved a reorganization by which Banco de Chile was converted to a holding company named SM-Chile. In turn, SM-Chile organized a new wholly owned banking subsidiary named Banco de Chile to which it contributed all of its assets and liabilities other than the Central Bank subordinated debt. SM-Chile then created SAOS, a second wholly owned subsidiary that, pursuant to a prior agreement with the Central Bank, assumed a new repayment obligation in favor of the Central Bank that replaced the Central Bank subordinated debt in its entirety.
This Central Bank indebtedness, for which SAOS is solely responsible and for which there is no recourse to us or SM-Chile, was equal to the unpaid principal of the Central Bank subordinated debt that it replaced but had terms that differed in some respects, the most important of which included a rescheduling of the debt for a term of 40 years providing for equal annual installments and a pledge of our shares as collateral for such debt. The Central Bank indebtedness bears interest at a rate of 5.0% per year and is denominated in UF. See “Item 5. Operating and Financial Review and Prospects—Operating Results—Overview—Inflation—UF-denominated Assets and Liabilities” for a further explanation of UF.
In exchange for assuming the Central Bank indebtedness, SAOS received from SM-Chile, a holding company that beneficially owns usSAOS and SAOS,us, 63.6% of our shares as collateral for this indebtedness. As a result of our merger with Banco de A. Edwards, the percentage of our shares held by SAOS decreased to 42.0%. As a result of the share dividend paid in May 2006, the percentage further decreased to 41.4%. Dividends received from us are the sole source of SAOS’s revenue, which it must apply to repay this indebtedness. However, under SAOS’s agreement with the Central Bank, we have no obligation to distribute dividends to our shareholders. To the extent distributed dividends are not sufficient to pay the amount due on
this indebtedness, SAOS is permitted to maintain a cumulative deficit balance with the Central Bank that SAOS commits to pay with future dividends. If the cumulative deficit balance exceeds an amount equal to 20% of our paid-in capital and reserves, the Central Bank may require SAOS to sell a sufficient number of shares of our stock owned by SAOS to pay the entire accumulated deficit amount. As of May 2, 2005,2006, SAOS maintained a deficit balance with the Central Bank of Ch$27,90510,480 million, equivalent to 5.4%1.67% of our paid-in capital and reserves. As of the same date, Ch$104,155125,250 million would have represented 20.0% of our paid-in capital and reserves. See “Item 3. Key Information—Risk Factors—Risks Relating to our Operations and the Banking Industry—AnIndustry.” Our affiliate of ours may be obligated to sell shares of our stock in the public market if we do not pay sufficient dividends.”
If from time to time in the future our shareholders decide to retain and capitalize all or part of our annual net income in order to finance our future growth, and to distribute stock dividends among our shareholders, the Central Bank may require us to pay the portion of the net income corresponding to shares owned by SAOS in cash to SAOS. If we distribute stock dividends and the Central Bank does not require us to pay that portion in cash, the shares received by SAOS must be sold by SAOS within the following 12 months. The shareholders of SM-Chile will have a right of first refusal with respect to that sale.
Capital Expenditures
The following table reflects our capital expenditures in each of the three years ended December 31, 2002, 2003, 2004 and 2004:2005:
| For the Year Ended December 31, | |||||||||
| 2002 | 2003 | 2004 | |||||||
| (in millions of constant Ch$ as of December 31, 2004) | |||||||||
Computer equipment | Ch$ | 7,844 | Ch$ | 3,503 | Ch$ | 6,849 | |||
Furniture, machinery and installations | 3,585 | 2,560 | 4,635 | ||||||
Real estate | 662 | 608 | 397 | ||||||
Vehicles | 329 | 304 | 429 | ||||||
Subtotal | 12,420 | 6,975 | 12,310 | ||||||
Software | 3,352 | 4,518 | 7,544 | ||||||
Total | Ch$ | 15,772 | Ch$ | 11,493 | Ch$ | 19,854 | |||
| For the Year Ended December 31, | |||||||||
| 2003 | 2004 | 2005 | |||||||
| (in millions of constant Ch$ as of December 31, 2005) | |||||||||
Computer equipment | Ch$ | 3,629 | Ch$ | 7,096 | Ch$ | 8,206 | |||
Furniture, machinery and installations | 2,652 | 4,802 | 7,381 | ||||||
Real estate | 630 | 411 | 2,341 | ||||||
Vehicles | 315 | 444 | 344 | ||||||
Subtotal | 7,226 | 12,753 | 18,272 | ||||||
Software | 4,681 | 7,816 | 7,259 | ||||||
Total | Ch$ | 11,907 | Ch$ | 20,569 | Ch$ | 25,531 | |||
Our budget for capital expenditures in 20052006 is Ch$42,59454,258 million, substantially all of which will be used in Chile. Capital expenditures planned for 20052006 consist mainly of expenditures for information technology, including new treasury and anti-money laundering software and the continued implementation of “Neos,“Neos.” a technological innovation platform project that we believe will improveWe also expect to open new branches, refurbish some existing branches, upgrade our customer servicecommunication systems and increase efficiency, and capital expenditures related to disbursements necessary to maintain and improve our existing branch office infrastructure andperform other maintenance required in the ordinary course of our business.
BUSINESS OVERVIEW
Business Strategy
Our long-term strategy is to maintain and enhance our position as a leading bank in Chile by providing a broad range of financial products and services to large corporations small and mid-sized companies and individuals nationwide. As part of this strategy, we operate underutilize a multi-brand approach in order to target the differentdiverse market segments taking advantage ofand leverage our wellstrongly positioned brand names: “Banco de Chile,” “Banco de A. Edwards,” “Banchile,” “Banco Credichile” and “Leasing Andino.” Our strategy is focused on:
The key components of our strategy are described below.
Deliver Superior Customer Service and Expand ourRetail Customer Base
Our banking strategy is focused on maintaining and developing long-term relationships with our customers and expanding our customer base, especially in the retail business area and in segments with strong growth potential, such as lower-income individuals and micro-businesses by enlarging our distribution network, strengthening our electronic channels, emphasizing customer service and providing a broad range of financial products and services. In order to provide our customers with improved customer service and value-added services, we are developing a new customer relationship management system and providing additional sales and service training to our business account executives. We
As a result of the growth of the Chilean economy, recent trade agreements and decreasing unemployment, we expect that our corporate and individual retail customers will also supportrequire more comprehensive credit and non-credit financial services than in the past. To meet these needs and enlarge our enlargedretail customer base, by expandingwe intend to (1) expand our branch and ATM networks to locations where we have little or no presence.
We expect thatpresence, (2) strengthen our corporatesales force, (3) develop programs to increase quality of service in order to build and individual customers will require more comprehensive credit and non-credit financial services than in the past andenhance customer loyalty, (4) continue to improve our response time for customer service strategy includes the following:
customers.
Expand Fee-Based Services
In recent years, our margins from traditional lending activities have declined significantly and, as a result, we have increasingly shifted our focus to developing other sources of revenue, such as fee-based products and services. Our consolidated income from fees and other services has continued to grow over the last three years and was Ch$126,842131,408 million (U.S.$256 million) and Ch$137,793 million (U.S.$268 million) in 2004 and 2005, respectively, representing an average annual increase of 29.1%16.4% from Ch$98,251101,787 million in 2003. We seek to continue to grow fee revenueour fee-based revenues by developing new services and by strategically cross-selling these services to our base of existing retail and wholesale banking customers. InFor our corporate business,wholesale banking customers, we intend to actively market new and existing fee-based services such as
electronic banking, receivables collection, payroll services, supplier payments, investment advisory services and cash management. InFor our retail banking business area,customers, we seekintend to increase revenues from new and existing fee-based services such as telephone and electronic banking, ATMs, general checking services, credit cards, mutual funds, securities brokerage and insurance brokerage.
Maintain Focus onMaximize Operating Efficiencies
In 2004,2005, our consolidated operating expenses represented approximately 51.15%53.3% of our operating revenue.Asrevenue. As the Chilean banking sector continues to grow, we believe that a low-cost structure will become increasingly important to our ability to compete profitably.
We have invested heavily in technology including software, during recent years (approximately Ch$11,196 million in 2002, Ch$8,0218,310 million in 2003, and Ch$14,39314,912 million in 2004)2004 and Ch$15,465 million (U.S.$30.1 million) in 2005) and plan to continue to focus on technology in the future to achieve further improvements in customer service and operating efficiency. In 2003, we began the first stage of “Neos,” our technological innovation platform that provides us with customer information that includes demographic information, cross-selling opportunities, customer complaints and in 2003credit tracking. In 2004 and 2004,2005, capital expenditures associated with “Neos” amounted to Ch$2,9435,253 million and Ch$5,0708,484 million (U.S.$16.5 million), respectively. We estimate that our “Neos” related capital expenditures will amount to Ch$9,43710,773 million (U.S.$21.0 million) in 2005.
2006.
Provide Competitive International Products and Services
We intend to provide to our primarily Chilean customer base a complete array of international products at competitive prices. Our primary focus in this respect will be on trade financing of customer related operations, which is one of our traditional areas of international activity. In order to strengthen our relationships with Chilean businesses engaged in international trade, we intend to take advantage ofemphasize the integrated services offered by our New York and Miami branches, in addition to our trade services subsidiary in Hong Kong.
Kong and our representative offices in Mexico City, Sao Paulo and Buenos Aires.
We cannot assure you that we will be able to realize our strategic objectives. For a discussion of certain risks applicable to our operations and to Chile that may affect our ability to meet our objectives, see “Item 3. Key Information—Risk Factors.”
Ownership Structure
The following diagram shows ownership structure at December 31, 2004:May 12, 2006:
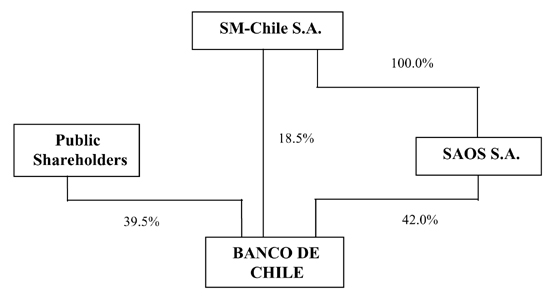
Share Repurchase Program
On March 20, 2003, at an extraordinary shareholders’ meeting, our shareholders approved the establishment of a share repurchase program to be conducted on the various Chilean stock exchanges on which our shares are listed and/or through a tender offer conducted in accordance with the Chilean Corporations Law. The program began on April 26, 2004 and will last for 24 months.
concluded on August 2, 2005.
The Central Bank authorized the program on June 2, 2003, subject to the following conditions: (i) we must requestits prior approval of the offering price from the Central Bank when we decide to resellof any shares resold by us that were acquired under the program, and (ii)the condition that the shares may only be purchased using retained net income from prior years. The Chilean Superintendency of Banks authorized the program on July 2, 2003.
Under the terms of the share repurchase program:
On March 25, 2004, our board of directors resolved to commence a tender offer to repurchase 1,701,994,590 of our shares, representing 2.5% of our total capital, at a purchase price of Ch$31 per share. The tender offer expired on April 26, 2004, and 5,000,844,940 shares were tendered.
On March 24, 2005, our board of directors resolved to resell 1,701,994,590, or 100%, of the shares we acquired through the program. On May 5, 2005, the Central Bank set a sale price of UF0.002031, the equivalent of Ch$35.10, per share. Of the shares to be resold, 968,822,755, or 1.42% of shares outstanding, were offered to our shareholders for a 30-day preemptive rights period whichthat ended June 22, 2005. 1,114,857 shares were sold during this period. The remaining 733,171,835 shares, or 1.08% of shares outstanding, are beingwere offered in a tender offer to SM-Chile’s series A, B and D shareholders which began on June 23, 2005 and will closeclosed on July 22, 2005. Shares which areThe 1,699,220,748 shares that were not resold to our shareholders or SM-Chile’s series A, B or D shareholders in the preemptive offering or tender offer, as applicable, will bewere sold in a public offering at ain the Santiago Stock Exchange from July 26, 2005 to August 1, 2005. The settlement date and price to be determined by our board of directors. This date may not be set after January 22, 2006, otherwise, a new rights offering must be conducted. The new offering may not extend beyond April 26, 2006 and the price may not be set below UF 0.001839 per share, the minimum price set by the Central Bank.was August 2, 2005.
Principal Business Activities
We are a full-service financial institution providing, directly and indirectly through our subsidiaries and affiliates, a wide variety of credit and non-credit products and services to all segments of the Chilean financial market. The following diagram illustrates, in summary form,summarizes our principal business areas, which operate through uswe conduct directly or, in the case of “Operations through subsidiaries,” through our subsidiaries:
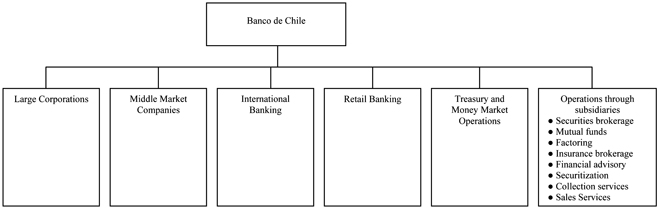
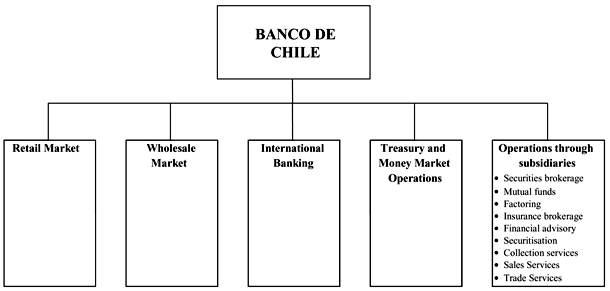
The following table provides information on the composition of our loan portfolio and our consolidated net income before tax for the year ended December 31, 2004,2005, allocated among our principal business areas:
| Loans | Consolidated net income before tax (1) | Loans | Consolidated net before tax(1) | |||||||||||||||||
| (in millions of constant Ch$ as of December 31, 2004, except for percentages) | (in millions of constant Ch$ as of December 31, 2005, except for percentages) | |||||||||||||||||||
Large corporations | Ch$ | 2,684,305 | 39.0 | % | Ch$ | 38,794 | ||||||||||||||
Middle market companies | 1,690,732 | 24.5 | 36,537 | |||||||||||||||||
Retail market | Ch$ | 3,399,892 | 41.4 | % | Ch$ | 114,556 | ||||||||||||||
Wholesale market | 4,429,620 | 54.0 | 64,992 | |||||||||||||||||
International banking | 294,091 | 4.3 | 6,756 | 206,394 | 2.5 | (6,101 | ) | |||||||||||||
Retail banking | 2,071,016 | 30.0 | 49,008 | |||||||||||||||||
Treasury and money market operations | 12,507 | 0.2 | 25,091 | 26,791 | 0.3 | 15,751 | ||||||||||||||
Operations through subsidiaries | 136,260 | 2.0 | 28,181 | 143,227 | 1.8 | 26,522 | ||||||||||||||
Other (adjustments and eliminations) | — | — | (13,390 | ) | — | — | (13,605 | ) | ||||||||||||
Total | Ch$ | 6,888,911 | 100.0 | % | Ch$ | 170,977 | Ch$ | 8,205,924 | 100.0 | % | Ch$ | 202,115 | ||||||||
| (1) | Consolidated net income before tax consists of the sum of operating revenues and other income and expenses, net, and the deduction for operating expenses and provisions for loan losses. The net income before tax breakdown shown is used for internal reporting, planning and marketing purposes and is based on, among other things, our estimated funding cost and direct and indirect cost allocations. This breakdown may differ in some respects from breakdowns of our operating income for financial reporting and regulatory purposes. Separate information on the operations, assets and income of our |
The following table provides our consolidated operating revenues, for the period indicated, allocated among our principal business areas:
| For the Year Ended December 31, | ||||||||||
| 2002 | 2003 | 2004 | ||||||||
| (in millions of constant Ch$ as of December 31, 2004) | ||||||||||
Large corporations | Ch$ | 93,867 | Ch$ | 90,493 | Ch$ | 79,712 | ||||
Middle market companies | 113,797 | 108,647 | 112,267 | |||||||
International banking | 2,680 | 16,786 | 12,217 | |||||||
Retail banking | 147,639 | 140,725 | 166,877 | |||||||
Treasury and money market operations | 26,024 | 23,337 | 29,081 | |||||||
Operations through subsidiaries | 42,832 | 54,223 | 65,693 | |||||||
Other (adjustments and eliminations) | 819 | (7,077 | ) | 3,976 | ||||||
Total | Ch$ | 427,658 | Ch$ | 427,134 | Ch$ | 469,823 | ||||
| For the Year Ended December 31, | |||||||||
| 2003 | 2004 | 2005 | |||||||
| (in millions of constant Ch$ as of December 31, 2005) | |||||||||
Retail market | Ch$ | 231,713 | Ch$ | 259,127 | Ch$ | 285,020 | |||
Wholesale market | 114,621 | 106,933 | 118,486 | ||||||
International banking | 16,565 | 12,177 | 13,833 | ||||||
Treasury and money market operations | 22,535 | 28,175 | 18,831 | ||||||
Operations through subsidiaries | 56,175 | 68,058 | 70,074 | ||||||
Other (adjustments and eliminations) | 900 | 12,266 | 12,207 | ||||||
Total | Ch$ | 442,509 | Ch$ | 486,736 | Ch$ | 518,451 | |||
The following table provides a geographic market breakdown of our operating revenues for the years indicated.
| For the Year Ended December 31, | ||||||||||
| 2002 | 2003 | 2004 | ||||||||
| (in millions of constant Ch$ as of December 31, 2004) | ||||||||||
Chile | Ch$ | 426,509 | Ch$ | 412,104 | Ch$ | 458,796 | ||||
Banking operations | 383,677 | 357,881 | 393,103 | |||||||
Operations through subsidiaries | 42,832 | 54,223 | 65,693 | |||||||
Foreign branch operations | 1,149 | 15,030 | 11,027 | |||||||
New York | (1,510 | ) | 12,130 | 8,673 | ||||||
Miami | 2,659 | 2,900 | 2,354 | |||||||
Total | Ch$ | 427,658 | Ch$ | 427,134 | Ch$ | 469,823 | ||||
| For the Year Ended December 31, | |||||||||
| 2003 | 2004 | 2005 | |||||||
| (in millions of constant Ch$ as of December 31, 2005) | |||||||||
Chile | Ch$ | 426,938 | Ch$ | 475,312 | Ch$ | 504,876 | |||
Banking operations | 370,764 | 407,253 | 434,976 | ||||||
Operations through subsidiaries | 56,174 | 68,059 | 69,900 | ||||||
Foreign operations | 15,571 | 11,424 | 13,575 | ||||||
New York | 12,567 | 8,985 | 10,570 | ||||||
Miami | 3,004 | 2,439 | 2,831 | ||||||
Operations through subsidiaries | — | — | 174 | ||||||
Total | Ch$ | 442,509 | Ch$ | 486,736 | Ch$ | 518,451 | |||
Large CorporationsRetail Market
In general, our large corporationsOur retail market business area services domesticserves the financial needs of individuals and middle market companies with annual sales in excess of Ch$12,000 million, multinational corporations, financial institutions, governmental entities and companies affiliated with Chile’s largest conglomerates (regardless of size). This business area offers these companies a broad range of products and services tailored to their specific needs. These services include deposit-taking and lending in both pesos and foreign currency, trade and project financing and various non-credit services, such as collection, supplier payments and payroll management. In addition, our large corporations business area offers a broad range of banking products and services including working capital financing, lines of credit, commercial loans, leasing, corporate financial services, foreign trade financing, letters of credit in domestic and foreign currencies, mortgage loans, payment and asset management services, checking accounts and time deposits, and, through our subsidiaries, brokerage, mutual funds and investment fund management services. All of our branches (except the Credichile branches) provide services to our large corporations business area customers directly and indirectly.branch network comprised by 248 branches.
Our large corporate customers are engaged in a wide spectrum of industry sectors. As of December 31, 2004, this business area had primarily made2005, loans to customers engaged in:
At December 31, 2004, we had approximately 1,918 large corporate debtors. Loans to large corporations totaled approximately Ch$2,684,305 million at December 31, 2004, representing 39.0%our retail market represented 41.4% of our total loans at that date. Our large corporationsoutstanding and our retail market business area accounted for Ch$38,794approximately Ch $114,556 million of our consolidated net income before tax for the year ended December 31, 2004.2005.
The following table sets forth the composition of our retail market business area’s loan portfolio as of December 31, 2005:
| As of December 31, 2005 | ||||||
(in millions of constant Ch$ as of December 31, 2005, except for percentages) | ||||||
Consumer loans | Ch$ | 860,186 | 25.3 | % | ||
Commercial loans | 738,003 | 21.7 | ||||
Mortgage loans | 585,628 | 17.2 | ||||
Leasing contracts | 107,979 | 3.2 | ||||
Contingent loans | 34,581 | 1.0 | ||||
Foreign trade loans | 22,786 | 0.7 | ||||
Other loans(1) | 1,050,729 | 30.9 | ||||
Total | Ch$ | 3,399,892 | 100.0 | % | ||
| (1) | Other loans include primarily mortgage loans financed by our general borrowings and factoring loans. |
The retail market business area is served by two divisions: (i) the individuals and middle market division and (ii) the Banco CrediChile division.
Individuals and Middle Market Division
The individuals and middle market division is responsible for offering financial services to individuals with incomes of over Ch$380 thousand monthly (or Ch$4.6 million annually) and to small and medium-sized companies with annual sales of up to Ch$1,200 million. The individuals and middle market division manages that portion of our branch network that operates under the brand names Banco Chile and Banco Edwards. We had 177 such branches at December 31, 2005.
The individuals and middle market division has a range of management tools that measure returns, cross-sell products, track performance and track the effectiveness of campaigns. Incentive systems have been gradually incorporated into the commercial targets, differentiated by segment, consequently permitting faster response times and a more efficient use of resources. This division also counts on the support of specialized call centers and internet banking services. The strategy followed in the individual and middle market division is mainly focused on subsegmentation and multi-brand positioning, on cross-selling of products and on quality of service.
At December 31, 2005, the individuals and middle market division served more than 385,000 individual customers and over 42,000 companies, resulting in loans outstanding to approximately 328,000 debtors, including approximately 43,557 residential loans, 32,081 commercial loans, 296,062 approved lines of credit, 164,523 other consumer loans and 315,244 credit card accounts. At the same date, we maintained 407,813 checking accounts, 147,320 savings accounts and 84,686 time deposits related to individuals.
As of December 31, 2005, loans originated by our individuals and middle market division represented 38.6% of our total outstanding loans. The following table sets forth the composition of our portfolio of loans to large corporations as of December 31, 2004
| As of December 31, 2004 | ||||||
| (in millions of constant Ch$ as of December 31, 2004, except for percentages) | ||||||
Commercial loans | Ch$ | 1,734,212 | 64.6 | % | ||
Foreign trade loans | 349,155 | 13.0 | ||||
Contingent loans | 310,470 | 11.6 | ||||
Leasing contracts | 147,509 | 5.5 | ||||
Mortgage loans | 42,006 | 1.6 | ||||
Consumer loans | 326 | — | ||||
Other loans | 100,627 | 3.7 | ||||
Total | Ch$ | 2,684,305 | 100.0 | % | ||
Our large corporations business area’s loan portfolio consists principally of unsecured loans with maturities between oneindividuals and six months and of medium- and long-term loans to finance fixed assets, investment projects and infrastructure projects. In addition, our large corporations business area issues contingent credit obligations in the form of letters of credit, bank guarantees and similar obligations in support of the operations of our large corporate customers. See “—Selected Statistical Information.”
The market for loans to large corporations in Chile in recent years has been characterized by reduced profit margins, due in part to the greater direct access of such customers to domestic and international capital markets and other sources of funds. As a result, we have been increasingly focused on generating fee services, such as payroll processing, dividend payments and billing services as well as computer banking services. This strategy has enabled us to maintain profitable relationships with our large corporate customers while preserving the ability to extend credit when appropriate opportunities arise.
We are party to approximately 3,430 payment service contracts and approximately 1,020 collection service contracts with large corporate customers. Under these payment contracts, we provide large corporate customers with a system to manage their accounts and make payments to suppliers, pension funds and employees, thereby reducing administrative costs. We believe that cash management and payment service contracts provide a source of low-cost deposits and the opportunity to cross-market our products and fees to payees, many of whom maintain accounts with us. Under our collection contracts, we act as a collection agent for our large corporate customers, providing centralized collection services for their accounts receivables and other similar payments.
Middle Market Companies
We serve the financing needs of small and medium-size companies through our middle market companies business area. We generally define middle market companies as those with annual sales of between Ch$300 million and Ch$12,000 million and small or emerging companies as those with annual sales of between Ch$45 million and Ch$300 million. As of December 31, 2004, our middle market companies business area had approximately 68,346 checking account holders, of which approximately 74% are small or emerging companies. In terms of loans amounts, however, approximately 61.6% of the middle market companies business area’s total loan portfolio represents loans to medium-size companies.
Our middle market companies business area offers its customers a broad range of financial products, including project financing, working capital financing, mortgage loans and debt rescheduling, as well as other alternatives such as leasing operations, factoring, mutual funds, insurance and securities brokerage services and collection services (through our Banchile subsidiaries). We also offer our clients full advisory services aimed at facilitating foreign trade, as well as comprehensive financing and service alternatives.
We have developed a set of services designed to facilitate and optimize the operational and financial management of small and medium size companies. These services include payment services (such as employee compensation, taxes and employee benefits), payments to suppliers and automated bill payments. We provide most of these services through remote service channels, such as the internet and, as of December 31, 2004, delivered such services to approximately 27,452 customers. We also provide account receipts and instrument collection services through electronic means. All of these products and services are available through our nationwide branch network.
Through our subsidiaries, our middle market companies business area offers our customers a full range of financial advisory, stock brokerage, mutual fund management and general and life insurance brokerage services.
The following table sets forth the composition of our portfolio of loans to middle market companies as of December 31, 2004:2005:
| As of December 31, 2004 | As of December 31, 2005 | |||||||||||
| (in millions of constant Ch$ as of December 31, 2004, except for percentages) | (in millions of constant Ch$ as of December 31, 2005, except for percentages) | |||||||||||
Consumer loans | Ch$ | 685,637 | 21.6 | % | ||||||||
Commercial loans | Ch$ | 900,628 | 53.3 | % | 737,916 | 23.3 | ||||||
Mortgage loans | 242,837 | 14.4 | 537,018 | 17.0 | ||||||||
Leasing contracts | 191,487 | 11.3 | 107,418 | 3.4 | ||||||||
Contingent loans | 34,575 | 1.1 | ||||||||||
Foreign trade loans | 134,052 | 7.9 | 22,786 | 0.7 | ||||||||
Contingent loans | 129,468 | 7.7 | ||||||||||
Consumer loans | 31,822 | 1.9 | ||||||||||
Other loans | 60,438 | 3.5 | 1,041,573 | 32.9 | ||||||||
Total | Ch$ | 1,690,732 | 100.0 | % | Ch$ | 3,166,923 | 100.0 | % | ||||
| (1) | Other loans include primarily mortgage loans financed by our general borrowings and factoring loans. |
The principal financial services offered to individuals include checking accounts, automatic bill payment, debit cards, credit cards, revolving credit lines, housing loans, consumer loans, life insurance, general insurance (like home and vehicle insurance), savings instruments, mutual funds, stock trading and foreign currency services.
Installment Loans
Our middle market companies business area’s loan portfolio consists primarily of short- and long-term commercial loans and mortgage loans. At December 31, 2004, this business area had primarily madeconsumer installment loans to customers engaged in:
up to 36 months.
At December 31, 2004,2005, we had Ch$1,690,732441,375 million in installment loans, which accounted for 64.4% of the retail market business area consumer loans. A majority of installment loans are denominated in pesos and are payable monthly.
Mortgage Loans
At December 31, 2005, there were outstanding mortgage loans to smallindividuals of Ch$443,375 million, which represented 13.0% of the retail market total loans and medium-size companies, representing 24.5%5.4% of our total loan portfolio. A feature of our mortgage loans to individuals is that mortgaged property typically secures all of a mortgagor’s credit with us, including credit card and other loans.
Our residential mortgage loans generally have maturities between five and 30 years and are denominated in UF. To reduce our exposure to interest rate fluctuations and inflation with respect to our residential loan portfolio, ata portion of these residential loans are currently funded through the issuance of mortgage finance bonds, which are recourse obligations with payment terms that date. Smallare matched to the residential loans and medium-sizewhich bear a real market interest rate plus a fixed spread over the rate of change in the UF. Chilean banking clientsregulations limit the amount of a residential mortgage loan that may be financed with a mortgage finance bond to the lesser of 75% of the purchase price of the property securing the loan or the appraised value of such property. In addition, we generally require that the monthly payments on a residential mortgage loan not exceed 25% of the borrower’s household after-tax monthly income.
We have promoted the expansion ofMutuos Hipotecarios, a mortgage-lending product, as an alternative form to traditional financing of mortgage loans with mortgage bonds. Whereas our traditional mortgage loans are financed by means of mortgage finance bonds,Mutuos Hipotecarios are financed with our general funds, especially long-term subordinated bonds.Mutuos Hipotecarios offer the opportunity to finance 80% of the lower of the purchase price or the appraised value of the property, as opposed to the 75% that a standard mortgage would allow.
At December 31, 2005, we were Chile’s second largest private sector bank in terms of amount of mortgage loans, and, based on information prepared by the Chilean Superintendency of Banks, we accounted for approximately 14.5% of the residential mortgage loans in the Chilean banking system and approximately 19.7% of such loans made by private sector banks.
Credit Cards
We issue both Visa and MasterCard credit cards, and our product portfolio includes both personal and corporate cards. In addition to traditional cards, our credit card portfolio also includes co-branded cards (“Travel Club” and “Global Pass”), and 40 affinity card groups, most of which are associated with our co-branded programs.
As of December 31, 2005, we had 317,571 valid credit card accounts, with 458,896 credit cards to individuals. Total charges on our credit cards during 2005 amounted to Ch$36,537479,490 million, with Ch$418,804 million corresponding to purchases and service payments in Chile and abroad and Ch$60,686 million corresponding to cash advances (both within Chile and abroad). These charge volumes represent a 27.2% market share in terms of volume of use of bank credit cards issued in Chile.
As of December 31, 2005, our credit card loans to individuals amounted to Ch$92,021 million and represented 13.4% of our consolidated net income before tax for the year endedretail market business area’s consumer loans.
Two Chilean companies that are affiliated with us, Transbank S.A. and Nexus S.A., provide us with merchant acquisition and credit card processing services. As of December 31, 2004.2005, Transbank S.A. had 17 shareholders and Nexus S.A. had seven shareholders, all of which are banks. As of December 31, 2005, our equity ownership in Transbank S.A. was 17.4% and our equity interest in Nexus S.A. was 25.8%.
We believe that the Chilean market for credit cards has a high potential for growth, especially among customers in the lower-middle and middle-income bracket, that average merchant fees will continue to decline and that stores that do not currently accept credit cards will generally begin to do so. We also believe that, in addition to the other banks that operate in Chile, our main competitors are department store cards and other non-banking businesses involved in the issuance of credit cards.
Debit Cards
We have different types of debit cards. Depending on their specifications, these cards can be used for banking transactions on the ATMs that operate on the local network, Redbanc, the Visa International PLUS network, the local network of merchants participating in the local Redcompra debit program or the international network of merchants associated with the Electron program. We have given these debit cards different names (Chilecard,Chilecard Plus,Chilecard Electron, Chilecard Empresas, Banjoven,Cheque Electronico, Multiedwards, Cuenta Directa andCuenta Familiar) based on their specific functions and the relevant brand and target market to which they are oriented. As of September 30, 2005, we had a 29.3% market share of debit card transactions, with approximately 11 million transactions performed as of that date.
Lines of Credit
We had approximately 294,600 approved lines of credit to individual customers as of December 31, 2005 and outstanding advances to 197,024 individuals totaling Ch$150,998 million, or 5.8% of the retail market total loans.
Our individual lines of credit are generally available on a revolving basis, up to an approved credit limit, and may be used for any purpose. Advances under lines of credit are denominated in pesos and bear interest at a rate that is set monthly. At the customer’s option, a line of credit loan may be renewed and re-priced for successive monthly periods, in each case subject to minimum monthly payments.
Deposit Products
We seek to increase our deposit-taking activities as a means of diversifying our sources of funding. We believe that the deposits of our individual customers provide us with a relatively low cost, stable funding source, as well as the opportunity to cross-market our other products and services. We offer checking accounts, time deposits and savings accounts to our individual customers. Checking accounts are peso-denominated and mostly non-interest bearing (approximately 0.2% of total checking accounts of the individual and middle market division are interest-bearing) and savings accounts are denominated in UF and bear interest at a fixed rate. Time deposits are denominated in pesos, UF and U.S. dollars. Most time deposits bear interest at a fixed rate with a term of 30 to 360 days.
While historically demand has been mainly for UF-denominated deposits during times of high inflation, demand for deposits denominated in pesos has increased in the current environment of lower and more stable inflation rates in Chile.
At December 31, 2005, we administered 365,443 checking accounts for approximately 350,940 individual customers with an aggregate balance of Ch$462,093 million. At such date, our checking account balances totaled approximately Ch$1,516,219 million and represented 15.3% of our total liabilities.
The principal financial services offered to small and medium size companies with annual sales of up to Ch$1,200 million by the individuals and middle market division include a complete range of products, such as various financing options, support in import and export transactions, collection services, payments and collections, leasing agreements, factoring services, checking account services, investment management, insurance broking, currency trading, transfers and payments to and from abroad. At December 31, 2005 we had approximately 39,460 middle market companies with checking accounts and 21,460 debtors.
Commercial Loans.
Our individuals and middle market companies business area’sdivision’s commercial loans, which mainly consist of project financing and working capital loans, are denominated in pesos, UF or U.S. dollars. Commercial loans may have fixed or variable rates of interest and generally mature between one and three months from the date of the loan. At December 31, 2004,2005, our middle market companies business area had outstanding commercial loans of Ch$900,628382,776 million, representing 53.3%11.3% of the middleretail market companies business area’s total loans and 13.1%4.7% of our total loans at that date.
Leasing Contracts
Leasing contracts are financing leases for capital equipment and property. Leasing contracts may have fixed or variable rates of interest and generally mature between one and five years for equipment and between five and twenty years for property. Most of these contracts are denominated in UF. At December 31, 2005 our middle market companies had outstanding leasing contracts of Ch$73,847 million, representing 2.2% of the retail market and 0.9% of our total loans at that date.
Mortgage Loans. Our
Mortgage loans granted to middle market companies business area’s commercialare non-residential mortgage loans made to finance office, land and other real estate. Mortgage loans are denominated in UF and generally have maturities of between fiveeight and 3012 years. At December 31, 2004, this business area2005, middle market companies had grantedoutstanding mortgage loans outstanding of approximately Ch$242,83793,643 million, representing 14.4%2.8% of the middleretail market companies business area’s total loans and 3.5%1.1% of our total loans at such date.
Banco CrediChile Division, or Banco CrediChile
The Banco CrediChile division offers loans and other financial services to the lower-middle to middle income portions of the Chilean population, which historically have only been partially served by banking institutions. This bracket includes individuals whose monthly incomes fluctuate between Ch$170 thousand and Ch$380 thousand and, recently, to micro-businesses. Banco CrediChile represents a distinct delivery channel for our products and services in this bracket, maintaining a separate brand and network of 71 Banco CrediChile branches. Banco CrediChile was established in 2004 from what was formerly our consumer banking division.
Banco CrediChile offers our customers a range of products, including consumer loans, credit cards, auto loans and residential mortgage loans and a special demand deposit account (see “—Bancuenta” below) targeted at low-income customers. At December 31, 2005, Banco CrediChile had approximately 191,453 customers and total loans outstanding of Ch$232,969 million, representing 2.8% of our total loan portfolio at that date.
The following table sets forth the composition of our portfolio of loans to Banco CrediChile as of December 31, 2005:
| As of December 31, 2005 | ||||||
| (in millions of constant Ch$ as of December 31, 2005, except for percentages) | ||||||
Consumer loans | Ch$ | 174,549 | 74.9 | % | ||
Mortgage loans | 48,610 | 20.9 | ||||
Other loans | 9,810 | 4.2 | ||||
Total | Ch$ | 232,969 | 100.0 | % | ||
Banco CrediChile focuses on developing and marketing innovative, targeted products to satisfy the needs of its customers while introducing them to the banking system. Banco CrediChile complements the services offered in our other business areas, especially our wholesale market, by offering services to employers such as direct deposit capabilities that stimulate the use of our services by employees.
The Chilean Superintendency of Banks requires greater allowances for loan losses for banks with lower credit classifications, such as Banco CrediChile. Banco CrediChile employs a specific credit scoring system, developed by our credit risk division, as well as other criteria to evaluate and monitor credit risk. Banco CrediChile seeks to ensure the quality of our loan portfolio through adherence to our loan origination procedures, particularly the use of our credit scoring system and credit management policies, including the use of credit bureaus and the services of the Chilean Superintendency of Banks. Banco CrediChile uses rigorous procedures for collection of past due loans through Socofin S.A., our specialized collection subsidiary. We believe that we have the necessary procedures and infrastructure in place to manage the risk exposure that Banco CrediChile introduces. These procedures allow us to take advantage of the higher growth and earnings potential of this market while helping to manage the exposure to higher risk. See “Item 3. Key Information—Risk Factors—Risks Relating to our Operations and the Banking Industry—The growth of our loan portfolio may expose us to increased loan losses” and “Item 3. Key Information—Risk Factors—Risks Relating to our Operations and the Banking Industry—Our loan portfolio may not continue to grow at the same or similar rate.”
Consumer Lending
Banco CrediChile provides short- to medium-term consumer loans and credit card services. As of December 31, 2005, Banco CrediChile had approximately 163,790 consumer loans that totaled Ch$160,553 million outstanding. As of the same date, Banco CrediChile customers had 97,840 valid credit card accounts, with outstanding balances of Ch$13,985 million.
Bancuenta
Banco CrediChile introduced Bancuenta as a basic deposit product that provides consumers flexibility and ease of use, which allows us to tap a section of the consumer market that previously was not part of the banking system. The Bancuenta account is a non-interest bearing demand deposit account without checking privileges targeted at customers who want a secure and comfortable means of managing and accessing their money. The customer may use the ATM card linked to the Bancuenta account (which may include a revolving line of credit) to make deposits or automatic payments to other Banco CrediChile accounts through a network of 4,807 ATMs available through the Redbanc network.
At December 31, 2005, Banco CrediChile had approximately 503,070 Bancuenta accounts. Bancuenta account holders pay an annual fee, a fee related to the number of withdrawals on the Bancuenta line of credit and interest on any outstanding balance under the line of credit. All fees and interest due on a Bancuenta account are withdrawn automatically on a monthly basis from funds available in the account. Bancuenta allows us to offer our wholesale customers the ability to pay their employees by direct deposit of funds into the individual employee’s account at Banco CrediChile. We believe this product can lead to stronger long-term relationships with our wholesale customers and with the employees of such customers.
Wholesale Market
Our wholesale market business area serves the needs of corporate customers with annual sales in excess of Ch$1,200 million. At December 31, 2005, loans made by this business area totaled approximately Ch$4,429,620 million and represented 54.0% of our total loan portfolio. Our wholesale banking business area accounted for approximately Ch$64,992 million of our net income before tax for the year ended December 31, 2005.
The following table sets forth the composition of our portfolio of loans to the wholesale market as of December 31, 2005:
| As of December 31, 2005 | ||||||
| (in millions of constant Ch$ as of December 31, 2005, except for percentages) | ||||||
Commercial loans | Ch$ | 2,720,444 | 61.4 | % | ||
Foreign trade loans | 489,543 | 11.1 | ||||
Contingent loans | 571,742 | 12.9 | ||||
Leasing contracts | 346,824 | 7.8 | ||||
Mortgage loans | 84,719 | 1.9 | ||||
Other | 216,348 | 4.9 | ||||
Total | Ch$ | 4,429,620 | 100.0 | % | ||
At December 31, 2005, we had approximately 7,688 wholesale debtors. Our wholesale customers are engaged in a wide spectrum of industry sectors. As of December 31, 2005, this business area’s loans were mainly related to:
In line with our strategy of identifying and differentiating market segments to provide value proposals for the specific needs of our customers, we have defined two divisions within the wholesale market based on companies’ annual sales, grouping them into: (i) large corporations and (ii) large companies.
Large Corporations Division
The large corporations division is oriented towards providing services to corporations that sell more than Ch$32 billion annually. This division’s customers include a large proportion of Chile’s publicly traded companies, subsidiaries of multinationals and conglomerates, including those in the financial, commercial, manufacturing and industrial and infrastructure sectors, as well as projects, concessions and the real estate sectors.
At December 31, 2005, we had 1,858 large corporations debtors. Loans to large corporations totaled approximately Ch$3,361,716 million at December 31, 2005, representing 41.0% of our total loans at that date.
The following table sets forth the composition of our portfolio of loans by the large corporations division as of December 31, 2005:
| As of December 31, 2005 | ||||||
| (in millions of constant Ch$ as of December 31, 2005, except for percentages) | ||||||
Commercial loans | Ch$ | 2,202,202 | 65.5 | % | ||
Foreign trade loans | 329,353 | 9.8 | ||||
Contingent loans | 445,594 | 13.3 | ||||
Leasing contracts | 165,941 | 4.9 | ||||
Mortgage loans | 31,923 | 0.9 | ||||
Other | 186,703 | 5.6 | ||||
Total | Ch$ | 3,361,716 | 100.0 | % | ||
We offer our large corporation customers a wide variety of products that include short and long-term financing, working capital loans, mortgage loans, leasing, long-term syndicated loans and factoring, plus the investment banking services offered by our subsidiary, Banchile Corredores de Bolsa S.A. Our investment banking services include the underwriting of public and private securities offerings. We also offer payment services (payrolls, suppliers, pensions, dividends, etc.), collection services and connection to international funds transfer networks, apart from the traditional deposit products, especially the checking account.
We are party to approximately 3,346 payment service contracts and approximately 1,059 collection service contracts with large corporations. We believe that cash management and payment service contracts provide a source of low-cost deposits and the opportunity to cross-market our products and fees to payees, many of whom maintain accounts with us. Under our collection contracts, we act as a collection agent for our large corporate customers, providing centralized collection services for their accounts receivables and other similar payments.
In order to provide a highly competitive service, our large corporation division has the direct support of our treasury area, which fulfills our corporate customers’ liquidity and short-term loans requirements directly. We have also improved our technological offerings to facilitate connection with customers and permit self-service. Similarly, we offer derivative products, which we believe have become increasingly important, especially peso-dollar and UF-dollar forward contracts and interest rate swaps.
The market for loans to large corporations in Chile in recent years has been characterized by reduced profit margins, due in part to the greater direct access of such customers to domestic and international capital markets and other sources of funds. As a result, we have been increasingly focused on margin growth and cross-selling fee generating services, such as the above mentioned payroll processing, dividend payments and billing services as well as computer banking services. This strategy has enabled us to maintain profitable relationships with our large corporate customers while preserving the ability to extend credit when appropriate opportunities arise.
Large Companies Division
The large companies division provides a broad range of financial products such as electronic banking, leasing, foreign trade and financial consultancy to companies with annual sales of between Ch$1,200 million and Ch$32,000 million.
At December 31, 2005, we had 5,830 large companies debtors. Loans to large companies totaled approximately Ch$1,067,904 million at December 31, 2005, representing 13.0% of our total loans at that date.
The following table sets forth the composition of our portfolio of loans by the large companies division as of December 31, 2005:
| As of December 31, 2005 | ||||||
| (in millions of constant Ch$ as of December 31, 2005, except for percentages) | ||||||
Commercial loans | Ch$ | 518,242 | 48.5 | % | ||
Foreign trade loans | 160,190 | 15.0 | ||||
Contingent loans | 126,148 | 11.8 | ||||
Leasing contracts | 180,883 | 16.9 | ||||
Mortgage loans | 52,796 | 5.0 | ||||
Other | 29,645 | 2.8 | ||||
Total | Ch$ | 1,067,904 | 100.0 | % | ||
The products offered to these customers are mainly commercial loans, lines of credit, foreign trade and foreign currency transactions, factoring services, leasing, mortgage loans, syndicated loans, mergers and acquisitions and debt restructuring assistance, payments and collections services, checking accounts and related services, corporate credit cards, cash and investment management, forward contracts to hedge against currency fluctuations and insurance broking.
Our leasing area is part of the large companies division and operates under the name of Leasing Andino. Our factoring and financial advisory subsidiaries, Banchile Factoring S.A. and Banchile Asesoria Financiera S.A., respectively, provide their services principally through the large companies division. The large companies division has introduced a new service model, centralizing the majority of business relations with its customers, eliminating intermediate reporting levels in order to provide faster response times. Account officers are organized by geographic region, are strongly sales-oriented and have a particular concern for service quality.
International Banking
Through our international banking business area, we offer a range of international services, principally import and export financing, letters of credit, guarantees and other forms of credit support, as well ascross border payments, foreign currency swaps, banking servicesexchange and treasury services for our corporate clients in Chile and abroad.
currency swaps.
Our international banking business area has two main lines of business: foreign currency products and management of our international network. This business area deals with all banking products that involve foreign currency, including those related to foreign trade. Our international banking business area designs foreign currency products, educatesprovides support to our account officerofficers and sales force about ourwith respect to foreign currency products, monitors our market share participation and promotes the use of our foreign currency products. Included in this business area is a group of foreign trade specialists that advises our customers about our services related to insurance, shipping and customs, with the objective of obtaining the most desirable conditions for the non-banking stages of our customers’ foreign trade transactions.
Our international banking business area does not, however, have credit grantingcredit-granting authority for these purposes. Instead, the area participates in a team effort with the account officers who establish credit limits, and our international banking trade specialists interact directly with our customers, ensuring that theestablishing price they pay for our services is adequatestructures and thatensuring the quality of the services provided meets pre-established levels.
provided.
As of December 31, 2004,2005, we had Ch$599,051550,770 million in foreign trade loans, representing 8.7%6.7% of our total loans as of that date, and Ch$143,182150,190 million in letters of credit and other contingent obligations related to foreign trade operations, representing 2.1%1.8% of our total loans as of that date.
Our international banking business area also manages our international network. This network is made up of branches in New York and Miami, our trade services subsidiary in Hong Kong, three representative offices (located in Mexico City, Sao Paulo and Buenos Aires) and approximately 6001,000 correspondent banks. We have established credit relations with approximately 200 correspondent banks and account relationships with approximately 45 correspondent banks. Additionally, we have recently obtained approvals from both the Chilean Superintendency of Banks and China’s Banking Regulatory Commission to open a new representative office based in Beijing.
We use our international network in order to:
The following table sets forth, as of December 31, 2004,2005, the composition of our portfolio of loans originated through our New York and Miami branches:
| As of December 31, 2004 | ||||||
| New York Branch | Miami Branch | |||||
| (in millions of constant Ch$ as of December 31, 2004) | ||||||
Foreign trade loans | Ch$ | 37,862 | Ch$ | 51,316 | ||
Commercial loans | 67,311 | 18,844 | ||||
Interbank loans | 1,541 | 1,153 | ||||
Contingent loans | 4,089 | 6,512 | ||||
Total | Ch$ | 110,803 | Ch$ | 77,825 | ||
| As of December 31, 2005 | ||||||
| New York Branch | Miami Branch | |||||
| (in millions of constant Ch$ as of December 31, 2005) | ||||||
Foreign trade loans | Ch$ | 8,087 | Ch$ | 18,340 | ||
Commercial loans | 35,016 | 11,162 | ||||
Interbank loans | — | 6 | ||||
Contingent loans | 3,253 | 1,036 | ||||
Past due loans | 19 | — | ||||
Total | Ch$ | 46,375 | Ch$ | 30,544 | ||
The following table sets forth, as of December 31, 2004,2005, the sources of funding for our New York and Miami branches:
| As of December 31, 2004 | ||||||||||||
| New York Branch | Miami Branch | |||||||||||
| (in millions of constant Ch$ as of December 31, 2004, except for percentages) | ||||||||||||
Current accounts | Ch$ | 145,696 | 32.0 | % | Ch$ | 25,021 | 14.6 | % | ||||
Certificates of deposits and time deposits | 198,530 | 43.6 | 131,399 | 76.9 | ||||||||
Other demand deposits | 68,057 | 14.9 | 7,787 | 4.6 | ||||||||
Contingent liabilities | 4,089 | 0.9 | 6,512 | 3.8 | ||||||||
Foreign borrowings | 35,627 | 7.8 | 10 | 0.0 | ||||||||
Other liabilities | 3,612 | 0.8 | 164 | 0.1 | ||||||||
Total | Ch$ | 455,611 | 100.0 | % | Ch$ | 170,893 | 100.0 | % | ||||
| As of December 31, 2005 | ||||||||||||
| New York Branch | Miami Branch | |||||||||||
| (in millions of constant Ch$ as of December 31, 2005, except for percentages) | ||||||||||||
Current accounts | Ch$ | 136,247 | 31.6 | % | Ch$ | 19,982 | 14.3 | % | ||||
Certificates of deposits and time deposits | 157,853 | 36.7 | 116,152 | 83.0 | ||||||||
Other demand deposits | 51,998 | 12.1 | 2,202 | 1.6 | ||||||||
Contingent liabilities | 3,253 | 0.8 | 1,036 | 0.7 | ||||||||
Foreign borrowings | 45,695 | 10.6 | 59 | — | ||||||||
Other liabilities | 35,101 | 8.2 | 517 | 0.4 | ||||||||
Total | Ch$ | 430,147 | 100.0 | % | Ch$ | 139,948 | 100.0 | % | ||||
New York Branch.
Our wholly owned New York branch was established in 1982 and provides a range of general banking services, including deposit-taking,deposit taking, mainly to non-residents of the United States. At December 31, 2004,2005, the New York branch had total assets of Ch$477,930444,224 million, including a loan portfolio of Ch$110,80346,375 million, representing 1.6%0.6% of our total loan portfolio. Of the New York branch’s loans, Ch$67,31135,016 million were commercial loans, mostly to large corporations in Chile and, in other Latin American countries.to a lesser extent, to U.S. companies. The remaining Ch$43,49211,359 million werewas principally foreign trade loans, amounting to Ch$37,8628,087 million, and contingent loans (letters of credit and stand-by letters of credit), amounting to Ch$4,0893,253 million. In 2004,2005, our New York branch recognized net incomeloss of Ch$3,3036,342 million.
Investments in bonds and foreign securities were Ch$255,896349,461 million at December 31, 2004,2005, most of which consisted of private sector bonds. As of December 31, 2004,2005, the New York branch did not havehad Ch$19 million in past due loans. The New York branch’s allowances for loan losses totaled Ch$758159 million, which represented 0.7%0.3% of the branch’s loan portfolio at December 31, 2004. In addition, our New York branch had Ch$193 million in country risk allowances.2005. Although the New York branch manages its assets and liabilities locally, it follows the same credit processes as are followed in Santiago, Chile, and all credit decisions are made by our account officers and credit committees in Santiago, Chile. See “Item 8. Financial Information—Consolidated Statements and Other Financial Information—Legal Proceedings” for a description of certain proceedings involving the New York branch.
Funding sources for the New York branch include current account, money market accounts and deposits for less than 30 days of Ch$305,343 million,(Ch$256,331 million), time deposits of Ch$106,939 million(Ch$89,766 million) and foreign borrowings of Ch$35,627 million.
(Ch$45,695 million).
As of December 31, 2004,2005, the New York branch had Ch$14,077 million in capital (including net loss of Ch$22,319 million (including net income of Ch$3,3036,342 million for the year).
Miami Branch.
Our wholly owned Miami branch was opened in 1995 as an agency and in 2004 expanded its banking operations from that of an agency to become a branch. It provides a range of traditional commercial banking services, mainly to non-residents of the United States, including deposit-taking, providing credit to finance foreign trade and making loans to individuals or Chilean companies involved in foreign trade. Additionally, our Miami branch provides correspondent banking services to financial institutions, including working capital loans, letters of credit and bankers’ acceptances. At December 31, 2004,2005, our Miami branch had total assets of Ch$176,516145,907 million, a loan portfolio of Ch$77,82530,544 million representing 1.1%0.4% of our total loan portfolio, and an investment portfolio of Ch$61,24165,057 million. Our Miami branch’s loan portfolio at December 31, 20042005 consisted primarily of Ch$51,31618,340 million of foreign trade loans and Ch$18,84411,162 million of commercial loans primarily to Latin American companies, including Chilean companies. The branch’s funding sources include demand deposits, money market accounts and deposits for less than 30 days (Ch$94,12868,381 million), time deposits (Ch$70,08069,955 million) and contingent liabilities (Ch$6,5121,036 million). In 2004,2005, our Miami branch recognized net income of Ch$491794 million.
At December 31, 2004,2005, the Miami branch did not have past due loans. Allowances for loan losses amounted to Ch$58290 million, not including the Ch$278161 million in country risk allowances. Although the Miami branch manages its assets and liabilities locally, it follows the same credit processes as are followed in Santiago, Chile, and all credit decisions are made by our account officers and credit committees in Santiago, Chile. See “Item 8. Financial Information—LegalConsolidated Statements and Other Financial Information —Legal Proceedings” for a description of certain proceedings involving the Miami branch.
Representative offices.
The principal functionmain activities of our representative offices in Argentina, Brazil and Mexico isare to search for business opportunities in the areas of trade finance and private sector financing and to monitor the development and evolving economies of these countries. These offices serve as points of contact for our customers who have business within or operate directly within these countries.
Retail Banking
Our retail banking business area serves the needs of retail customers from high- to lower-middle income individuals, with service being segmented according to the client’s income. At December 31, 2004, loans made by this business area represented 30.0% of our total loan portfolio. Approximately Ch$49,008 million of our net income before tax for the year ended December 31, 2004 was accounted for by our retail banking business area.
The following table sets forth the composition of our retail banking business area’s loan portfolio as of December 31, 2004:
| As of December 31, 2004 | ||||||
| (in millions of constant Ch$ as of December 31, 2004, except for percentages) | ||||||
Mortgage loans | Ch$ | 535,039 | 25.8 | % | ||
Consumer loans | 659,703 | 31.9 | ||||
Commercial loans | 146,293 | 7.1 | ||||
Leasing contracts | 4,853 | 0.2 | ||||
Contingent loans | 1,482 | 0.1 | ||||
Foreign trade loans | 82 | 0.0 | ||||
Other loans(1) | 723,564 | 34.9 | ||||
Total | Ch$ | 2,071,016 | 100.0 | % | ||
High- and Middle-Income Individuals.We define high- and middle-income individuals as those with annual income in excess of Ch$5.4 million (in 2004, per capita annual income in Chile was approximately Ch$2.6 million).
Our high- and middle-income individuals subsegment offers our customers a broad range of retail banking products, including residential mortgage loans, lines of credit and other consumer loans, credit cards, checking accounts, savings accounts and time deposits. We also offer mutual funds and brokerage services to individuals as described under “—Operations through Subsidiaries” below. At December 31, 2004, we had outstanding extensions of credit to approximately 269,758 high- and middle-income individuals, including approximately 35,087 residential loans, 237,630 lines of credit, 118,365 other consumer loans and 251,195 credit card accounts. At the same date, this area maintained 321,714 checking accounts, 145,712 savings accounts and 65,026 time deposits.
We provide service to high- and middle-income individual customers through a network of 171 branches including four specialized private banking centers, 20 specialized transaction centers and our ATM network. Since 1994, we have offered a nationwide phone-banking service that permits our high- and middle-income individual customers to receive balances and other account-related information, transfer funds between accounts and effect a wide variety of credit transactions. In 1997, we launched a full 24-hour banking service under the brand “TodaHora” and our homepage on the internet to better serve our high- and middle-income individual customers.
Installment Loans. Our consumer installment loans to high- and middle-income individuals are generally incurred, up to a customer’s approved credit limit, to finance the cost of goods or services, such as cars, travel and household furnishings. Consumer loans are denominated in both pesos and UF, bear interest at fixed or variable rates of interest and generally are repayable in installments of up to 36 months.
At December 31, 2004, we had Ch$347,165 million in installment loans, which accounted for 52.6% of the retail banking business area’s consumer loans. A majority of installment loans are denominated in pesos and are payable monthly.
Mortgage Loans. At December 31, 2004, there were outstanding mortgage loans of Ch$484,683 million to high- and middle-income individuals, which represented 23.4% of the retail banking business area’s total loans and 7.0% of our total loan portfolio. A feature of our mortgage loans to individuals is that mortgaged property typically secures all of a mortgagor’s credit with us, including credit card and other loans.
Our residential mortgage loans generally have maturities between five and 30 years and are generally denominated in UF. To reduce our exposure to interest rate fluctuations and inflation with respect to our residential loan portfolio, a majority of these residential loans are currently funded through the issuance of mortgage finance bonds, which are recourse obligations with payment terms that are matched to the residential loans and which bear a real market interest rate plus a fixed spread over the rate of change in the UF. Chilean banking regulations limit the amount of a residential mortgage loan that may be financed with a mortgage finance bond to the lesser of 75% of the purchase price of the property securing the loan or the appraised value of such property. In addition, we generally require that the monthly payments on a residential mortgage loan not exceed 25% of the borrower’s household after-tax monthly income.
We have promoted the expansion ofMutuos Hipotecarios, a mortgage-lending product, as an alternative form to traditional financing of mortgage loans with mortgage bonds. Whereas our traditional mortgage loans are financed by means of mortgage finance bonds,Mutuos Hipotecarios are financed with our general funds, especially long-term subordinated bonds.Mutuos Hipotecarios is a product that is tradable among banks, investment funds and insurance companies.Mutuos Hipotecarios offer the opportunity to finance 80% of the lower of the purchase price or the appraised value of the property, as opposed to the 75% that a standard mortgage would allow.
At December 31, 2004, we were Chile’s second largest private sector bank in terms of amount of mortgage loans and, based on information prepared by the Chilean Superintendency of Banks; we accounted for approximately 14.8% of the residential mortgage loans in the Chilean banking system and approximately 20.1% of such loans made by private sector banks.
Credit Cards. We issue both Visa and MasterCard credit cards, and our product portfolio includes both personal and corporate cards. In addition to traditional cards, our credit card portfolio also includes co-branded cards (“Travel Club” and “Global Pass”), and 41 affinity card groups (of which 30 are associated with our co-branded programs).
As of December 31, 2004, we had 273,256 valid credit card accounts, with 411,260 credit cards in the high-middle income individuals subsegment. Total charges on our credit cards during 2004 amounted to Ch$405,795 million, with Ch$351,117 million corresponding to purchases and service payments in Chile and abroad and Ch$54,678 million corresponding to cash advances (both within Chile and abroad). These charge volumes represent a 28.0% market share in terms of volume of use of bank credit cards issued in Chile.
As of December 31, 2004, our credit card loans in the high- and middle-income individuals subsegment amounted to Ch$71,873 million and represented 10.9% of our retail banking business area’s consumer loans.
Two Chilean companies that are affiliated with us, Transbank S.A. and Nexus S.A., provide us with merchant acquisition and credit card processing services. As of December 31, 2004, Transbank had 18 shareholders and Nexus had seven shareholders, all of which are banks. As of December 31, 2004, our equity ownership in Transbank was 17.4% and our equity interest in Nexus was 25.8%.
We believe that the Chilean market for credit cards has a high potential for growth, especially among consumers in the middle-income subsegment, that average merchant fees will continue to decline and that stores that do not currently accept credit cards will generally begin to do so. We also believe that, in addition to the other banks that operate in Chile, our main competitors are department store cards and other non-banking businesses involved in the issuance of credit cards.
Debit Cards. We have different types of debit cards. Depending on their specifications, these cards can be used for banking transactions on the ATMs that operate on the local network, Redbanc, the Visa International PLUS network, the local network of merchants participating in the local Redcompra debit program or the international network of merchants associated with the Electron program. We have given these
debit cards different names (Chilecard Normal, Chilecard Plus, Chilecard Electron, Chilecard Empresas, Banjoven, Cheque Electronico, Multiedwards, Cuenta Directa and Cuenta Familiar) based on their specific functions and the relevant brand and target market to which they are oriented. As of December 31, 2004, we had a 30.4% market share of debit card transactions, with more than 12 million transactions performed in 2004.
Lines of Credit. We had 237,630 approved lines of credit to customers in our high- and middle-income individuals subsegment as of December 31, 2004 and outstanding advances to 173,139 individuals totaling Ch$112,593 million, or 5.4% of the retail banking business area total loans.
Our individual lines of credit are generally available on a revolving basis, up to an approved credit limit, and may be used for any purpose. Advances under lines of credit are denominated in pesos and bear interest at a rate that is set monthly. At the customer’s option, a line of credit loan may be renewed and re-priced for successive monthly periods, in each case subject to minimum monthly payments.
Deposit Products. We seek to increase our deposit-taking activities as a means of diversifying our sources of funding. We believe that the deposits of our individual customers provide us with a relatively low cost, stable funding source, as well as the opportunity to cross-market our other products and services. We offer checking accounts, time deposits and savings accounts to our individual customers. Checking accounts are peso-denominated and mostly non-interest bearing (approximately 0.2% of total retail checking accounts are interest-bearing) and savings accounts are denominated in UF and bear interest at a fixed rate. Time deposits are denominated in pesos, UF and U.S. dollars. Most time deposits bear interest at a fixed rate with a term of 30 to 360 days.
While historically demand has been mainly for UF-denominated deposits during times of high inflation, demand for deposits denominated in pesos has increased in the current environment of lower and more stable inflation rates in Chile.
At December 31, 2004, the retail banking business area administered 324,537 checking accounts for approximately 316,200 customers with an aggregate balance of Ch$397,315 million. At such date, our checking account balances totaled approximately Ch$1,424,569 million and represented 15.9% of our total liabilities.
Lower Income Individuals - Banco Credichile (“Credichile”). We offer products and services to the lower-middle to middle income portions of the Chilean population through Credichile, which we established specifically to serve the needs of customers in this market subsegment. Credichile represents a distinct delivery channel for our products and services in this market subsegment, maintaining a separate brand and network of 52 Credichile branches and nine other credit centers. Credichile offers our customers a range of products, including consumer loans, credit cards, auto loans and residential mortgage loans and a special demand deposit account (see “—Bancuenta” below) targeted at low-income customers. At December 31, 2004, Credichile had approximately 151,923 customers and total loans outstanding of Ch$189,907 million, representing 2.8% of our total loan portfolio at that date.
Improved economic conditions in Chile over the last decade and the growth of the Chilean middle class has resulted in increased demand for consumer credit by lower-middle income individuals, whom we classify as persons with annual income between Ch$1.8 million and Ch$5.4 million. Many of these individuals have not had prior exposure to banking products or services. Credichile focuses on developing and marketing innovative segment-oriented products to satisfy the needs of individuals in this subsegment while introducing them to the banking system and complements the services offered in our other business areas, especially our large corporations business area, by offering services to employers such as direct deposit capabilities that engender the use of our services by employees.
The Chilean Superintendency of Banks requires greater allowances for loan losses with lower credit classifications, such as those of Credichile. Credichile employs its own credit scoring system and other criteria to evaluate and monitor credit risk. Credichile seeks to ensure the quality of our loan portfolio through adherence to our loan origination procedures, particularly the use of our credit scoring system and credit management policies, including the use of credit bureaus and the services of the Chilean Superintendency of Banks. Credichile uses rigorous procedures for collection of past due loans. Socofin S.A., our specialized collection subsidiary, provides collection services. We believe that we have the necessary procedures and infrastructure in place to manage the exposure to a higher degree of credit risk that Credichile presents. These procedures allow us to take advantage of the higher growth and earnings potential of this subsegment of the banking industry while helping to manage the exposure to higher risk. See “Item 3. Key Information—Risk Factors—Risks Relating to our Operations and the Banking Industry—The growth of our loan portfolio may expose us to increased loan losses” and “Item 3. Key Information—Risk Factors—Risks Relating to our Operations and the Banking Industry—Our loan portfolio may not continue to grow at the same or similar rate.”
Consumer Lending. Credichile provides short- to medium-term consumer loans and credit card services. As of December 31, 2003, Credichile had approximately 131,767 consumer loans that totaled Ch$123,951 million outstanding at December 31, 2004. As of the same date, Credichile customers had 40,070 valid credit card accounts, with loans of Ch$7,448 million and total charges of Ch$7,400 million.
Bancuenta. Credichile introduced Bancuenta as a basic deposit product that provides consumers flexibility and ease of use, and which allows us to tap a section of the consumer market that previously was not part of the banking system. The Bancuenta account is a non-interest bearing demand deposit account without checking privileges targeted at customers who want a secure and comfortable means of managing and accessing their money. The customer may use the ATM card linked to the Bancuenta account (which may include a revolving line of credit) to make deposits or automatic payments to other Credichile accounts through a network of 3,181 ATMs available through the Redbanc system.
At December 31, 2004, Credichile had approximately 454,028 Bancuenta accounts. Bancuenta account holders pay an annual fee, a fee each time the account holder draws on the Bancuenta line of credit and interest on any outstanding balance under the line of credit. All fees and interest due on a Bancuenta account are withdrawn automatically on a monthly basis from funds available in the account. Bancuenta allows us to offer our large corporate customers the ability to pay their employees by direct deposit of funds into the individual employee’s account at Credichile. We believe this product can lead to stronger long-term relationships with our large and middle market corporate customers and with the employees of such customers.
Treasury and Money Market Operations
Our treasury and money market operations business area provides a wide range of financial services to our customers including currency intermediation, forwards contracts, interest rate swaps, transactions under repurchase agreements and investment products based on bonds, mortgage notes and deposits. We also offer investments in mutual funds and stock brokerage services.
In addition to providing services, our treasury and money market operations business area is focused on managing currency, interest rate and maturity gaps, ensuring adequate liquidity levels and managing our investment portfolio. This business area also performs the intermediation of fixed-income instruments, currencies and derivatives. Interest rate gap management is aimed at generating an adequate funding structure, prioritizing our capitalization and asset and liability cost structure and funding source diversification. This areasarea is also responsible for the issuance of short- and long-term bonds denominated in pesos and UF and the issuance of long-term subordinated bonds.
The treasury and money market operations business area is also in charge of monitoring compliance with regulatory deposit limits, technical reserves and maturity and rate matches, and monitors our adherence to the security margins defined by regulatory limits, as well as risk limits for rate, currency and investment gaps. The treasury and money market operations business area continually monitors the funding costs of the local financial system, comparing them with our costs.
Our investment portfolio as of December 31, 20042005 amounted to Ch$1,607,2731,450,009 million, of which 69.1% corresponded to51.6% consisted of securities issued by the Central Bank and the Chilean Government, 10.4% corresponded to24.4% consisted of securities from foreign issuers, 13.4% corresponded to20.4% consisted of securities issued by local financial institutions and 7.1% corresponded to3.6% consisted of securities issued by Chilean corporate issuers. Our investment strategy is designed with a view to supplementing our expected profitability, risks and economic variable projections. Our investment strategy is kept within regulatory limits as well as internal limits defined by our finance and international committee.
Operations through Subsidiaries
We have made several strategic long-term investments in financial services companies, which are engaged in activities complementary to our commercial banking activities. Our principal goal in making these investments is to develop a comprehensive financial services group capable of meeting the diverse financial needs of our current and potential clients.
The following table sets forth information with respect to our financial services subsidiaries at December 31, 2004:2005:
| As of or for the year ended December 31, 2004 | |||||||||||
| Assets | Shareholders’ Equity | Net Income (loss) | |||||||||
| (in millions of constant Ch$ as of December 31, 2004) | |||||||||||
Banchile Corredores de Bolsa S.A. | Ch$ | 307,270 | Ch$ | 34,956 | Ch$ | 9,803 | |||||
Banchile Administradora General de Fondos S.A. | 15,424 | 13,992 | 9,081 | ||||||||
Banchile Factoring S.A. | 123,818 | 9,305 | 2,109 | ||||||||
Banchile Asesoria Financiera S.A. | 2,275 | 1,888 | 1,756 | ||||||||
Banchile Corredores de Seguros Ltda | 2,389 | 1,959 | 671 | ||||||||
Banchile Securitizadora S.A. | 8,746 | 620 | 59 | ||||||||
Promarket S.A. | 681 | 331 | 46 | ||||||||
Socofin S.A. | 4,100 | 931 | 137 | ||||||||
Banchile Trade Services Limited | Ch$ | 7 | Ch$ | (1 | ) | Ch$ | (7 | ) | |||
Total | Ch$ | 464,710 | Ch$ | 63,981 | Ch$ | 23,655 | |||||
| As of or for the year ended December 31, 2005 | |||||||||
| Assets | Shareholders’ Equity | Net Income (loss) | |||||||
| (in millions of constant Ch$ as of December 31, 2005) | |||||||||
Banchile Corredores de Bolsa S.A. | Ch$ | 282,214 | Ch$ | 40,462 | Ch$ | 9,476 | |||
Banchile Administradora General de Fondos S.A. | 23,916 | 22,921 | 8,425 | ||||||
Banchile Factoring S.A. | 133,385 | 11,782 | 2,142 | ||||||
Banchile Corredores de Seguros Ltda | 2,853 | 2,068 | 747 | ||||||
Socofin S.A. | 4,944 | 1,412 | 448 | ||||||
Banchile Asesoria Financiera S.A. | 921 | 697 | 400 | ||||||
Banchile Trade Services Limited | 168 | 131 | 134 | ||||||
Banchile Securitizadora S.A. | 4,859 | 501 | 126 | ||||||
Promarket S.A. | Ch$ | 955 | Ch$ | 451 | Ch$ | 108 | |||
Total | Ch$ | 454,215 | Ch$ | 80,425 | Ch$ | 22,006 | |||
The following table sets out our ownership interest in our financial services subsidiaries at December 31, 2004:2005:
| Ownership | Ownership Interest | |||||||||||
| Direct | Indirect | Direct (%) | Indirect (%) | Total (%) | ||||||||
Banchile Trade Services Limited | 100.00 | — | 100.00 | |||||||||
Banchile Administradora General de Fondos S.A. | 99.98 | % | 0.02 | % | 99.98 | 0.02 | 100.00 | |||||
Banchile Asesoria Financiera S.A. | 99.94 | — | 99.94 | |||||||||
Banchile Corredores de Seguros Limitada | 99.75 | 0.25 | 99.75 | 0.25 | 100.00 | |||||||
Banchile Corredores de Bolsa S.A. | 99.68 | 0.32 | 99.68 | 0.32 | 100.00 | |||||||
Banchile Factoring S.A. | 99.52 | 0.48 | 99.52 | 0.48 | 100.00 | |||||||
Banchile Asesoria Financiera S.A. | 99.94 | — | ||||||||||
Banchile Securitizadora S.A. | 99.00 | 1.00 | 99.00 | 1.00 | 100.00 | |||||||
Socofin S.A. | 99.00 | 1.00 | 100.00 | |||||||||
Promarket S.A. | 99.00 | 1.00 | 99.00 | 1.00 | 100.00 | |||||||
Socofin S.A. | 99.00 | 1.00 | ||||||||||
Banchile Trade Services Limited | 100.00 | — | ||||||||||
Each of these subsidiaries is incorporated in Chile, except for Banchile Trade Services Limited, which is incorporated in Hong Kong, is incorporated in Chile.Kong.
Securities Brokerage Services.
We provide securities brokerage services through Banchile Corredores de Bolsa S.A. Banchile Corredores de Bolsa S.A. is registered as a securities broker with the Chilean Superintendency of Securities and Insurance, the regulator of Chilean open stock corporations, as a securities broker and is a member of the Santiago Stock Exchange and the Chilean Electronic Stock Exchange. Since it was founded in 1989, Banchile Corredores de Bolsa S.A. has provided stock brokerage services, fixed income investments and foreign exchange products to individuals and businesses through our branch network. During the year ended December 31, 2004,2005, Banchile Corredores de Bolsa S.A. had an aggregate trading volume on the Santiago Stock Exchange and the Chilean Electronic Stock Exchange of approximately Ch$4,816,2455,081,441 million. At December 31, 2004,2005, Banchile Corredores de Bolsa S.A. had equity of Ch$34,95640,462 million and, for the year ended December 31, 2004, had2005, net income of Ch$9,8039,476 million, which represented 6.4%5.2% of our consolidated net income for such period.
Mutual and Investment Fund Management.
Since 1980, we have provided mutual fund management services through Banchile Administradora General de Fondos S.A. (formerly Banchile Administradora de Fondos Mutuos S.A.). As of December 31, 2004,2005, according to data prepared by the Chilean Superintendency of Securities and Insurance, Banchile Administradora General de Fondos S.A. was the largest mutual fund manager in Chile, managing approximately 26.7%25.4% of all Chilean mutual funds assets.Atassets. At December 31, 2004,2005, Banchile Administradora General de Fondos S.A. operated 4045 mutual funds and managed Ch$1,766,1161,772,227 million in net assets on behalf of 152,656163,540 corporate and individual participants. Banchile Administradora General de Fondos S.A. also operates an investment fund, Banchile Inmobiliario I, and manages Ch$3,522 million in net assets on behalf of 414 participants.
The following table sets forth information regarding the various mutual funds managed by Banchile Administradora General de Fondos S.A. at December 31, 2004:2005:
| Net Asset Value | |||||||
Name of Fund | Type of Fund | As of December 31, 2005 | |||||
|
| (in millions of | |||||
Utilidades | Fixed income (short/medium term) | Ch$ | |||||
Liquidez 2000 | Fixed income (short term) | ||||||
Deposito XXI | Fixed income (medium/long term) | ||||||
Corporativo | Fixed income (short term) | ||||||
Estrategico | Fixed income (medium/long term) | ||||||
Corporate Dollar | Fixed income (short term) | ||||||
Horizonte | Fixed income (medium/long term) | ||||||
Patrimonial | Fixed income (short term) | ||||||
Performance | Fixed income (short/medium term) | ||||||
Banchile Acciones | Equity | ||||||
Ahorro | Fixed income (medium/long term) | ||||||
Alianza | Debt/Equity (medium/long term) | ||||||
Disponible | Fixed income (short term) | ||||||
Crecimiento | Fixed income | ||||||
Inversion |
| ||||||
Inversion 10 | Debt/Equity | 2,209 | |||||
Inversion 20 | Debt/Equity | 5,742 | |||||
Operacional | Fixed income | ||||||
Capitalisa Accionario | Equity | ||||||
Renta Futura | Fixed income (short/medium term) | ||||||
Euro Money Market Fund | Fixed income (short term) | ||||||
Emerging Fund | Debt/Equity | ||||||
Latin America Fund | Debt/Equity | ||||||
Cobertura | Fixed income (medium/long term) | ||||||
| Fixed income (medium/long term) | ||||||
U.S. Fund | Debt/Equity | ||||||
Global | Debt/Equity | ||||||
U.S. High Technology Fund | Debt/Equity | ||||||
Asia Fund | Debt/Equity | ||||||
Europe Fund | Debt/Equity | ||||||
Technology Fund | Debt/Equity | ||||||
U.S. Stability Fund | Debt/Equity | ||||||
International Bond | Fixed income (medium/long term) | ||||||
Euro Technology Fund | Debt/Equity | ||||||
Medical & Health-Care Fund | Debt/Equity | ||||||
|
| ||||||
Inversionista I | Debt/Equity | 5,737 | |||||
Telecommunication Fund | Debt/Equity | ||||||
Emerging Dollar | Debt/Equity | ||||||
Global Dollar | Debt/Equity | ||||||
| Debt/Equity | ||||||
Bonsai 106 Garantizado | Fixed income (medium/long term) | ||||||
Garantizado Plus | Fixed income (medium/long term) | ||||||
Garantizado 112 | Fixed income (medium/long term) | 8,526 | |||||
Chile Garantizado | Fixed income (medium/long term) | 10,181 | |||||
Total | Ch$ | ||||||
At December 31, 2004,2005, Banchile Administradora General de Fondos S.A. had equity of Ch$13,99222,921 million and, for the year ended December 31, 2004, had2005, net income of Ch$9,0818,425 million, which represented 5.9%4.7% of our consolidated net income for such period.
Factoring Services.Services
We provide factoring services to our customers through Banchile Factoring S.A. Through this service, we purchase our customers’ outstanding debt portfolios, such as bills, notes, promissory notes or contracts, advancing them the cash flows involved and performing the collection of the related instruments. As of December 31, 2004,2005, Banchile Factoring S.A. had net income of Ch$2,1092,142 million, with a 22.7%an 18.2% return on shareholders’ equity and an estimated 17.4%12.6% market share in Chile’s factoring industry.
Financial Advisory Services.Services
We provide financial advisory and other investment banking services to our customers through Banchile Asesoria Financiera S.A. The services offered by Banchile Asesoria Financiera S.A. are directed primarily to our corporate customers and include advisory services regarding mergers and acquisitions, restructuring, project financingfinance and strategic alliances. As of December 31, 2004,2005, Banchile Asesoria Financiera S.A. had shareholders’ equity of Ch$1,888697 million and, for the year ended December 31, 2004, had2005, net income of Ch$1,756400 million.
Insurance Brokerage.
We provide insurance brokerage services to our customers through Banchile Corredores de Seguros Limitada. At the beginning of 2000 we began to offer life insurance policies associated with consumer loans and non-credit related insurance to our individual clients and the general public. As of December 31, 2004,2005, Banchile Corredores de Seguros Limitada had shareholders’ equity of Ch$1,9592,068 million and, for the year ended December 31, 2004, had2005, net income of Ch$671747 million. Banchile Corredores de Seguros Limitada had a 3.1%3.2% market share, measured by amount of policies (in Chilean pesos) sold by insurance brokerage companies during 2003,2004, the latest year for which information is available for insurance brokerage companies.
Securitization Services.We
We offer investment products to meet the demands of institutional investors, such as private pension funds and insurance companies, through Banchile Securitizadora S.A. This subsidiary securitizes financial assets, which involves the issuance of a debt instrument with a credit rating that can be traded in the Chilean marketplace, backed by a bundle of revenue-producing assets of the client company. As of December 31, 2004,2005, Banchile Securitizadora S.A. had shareholders’ equity of Ch$620501 million and, for the year ended December 31, 2004, had2005, net income of Ch$59126 million. Banchile Securitizadora S.A. had a 15.14%10.34% market share measured by volume of assets securitized as of December 31, 2004.
2005.
Sales Services.Promarket
Promarket S.A. manages the direct sales force that sells and promotes our products and services (such as checking accounts, consumer loans and credit cards), together with those of our subsidiaries, and researches information about potential customers. As of December 31, 2004,2005, Promarket S.A. had shareholders’ equity of Ch$331451 million and, for the year ended December 31, 2004, had2005, net income of Ch$46108 million.
Collection Services.We
We provide judicial and extra-judicial loan collection services of loans on our behalf or on behalf of third parties through Socofin S.A. As of December 31, 2004,2005, Socofin S.A. had equity of Ch$9311,412 million and, for the year ended December 31, 2004, had a2005, net income of Ch$137448 million.
Trade Services.
In November 2004, we began offering direct trade services to our customers through Banchile Trade Services Limited, which acts as our trade finance entity in markets such as China, Hong Kong, Taiwan and South Korea. As of December 31, 2004,2005, Banchile Trade Services Limited had equity of Ch$(1)131 million and, afor the year ended December 31, 2005, net lossincome of Ch$(7)134 million.
Distribution Channels and Electronic Banking
Our distribution network provides integrated financial services and products to our customers through a wide range of channels. This network includes ATMs, branches, on-line banking and phone-banking devices. Our 1,0011,258 ATMs (that form part of Redbanc’s 3,181 ATM4,807-ATM system) allow our customers to conduct self-service banking transactions during banking and non-banking hours.
As of December 31, 2004,2005, we had a network of 224248 retail branches throughout Chile. The branch system serves as a distribution network for all of the products and services offered to our customers. Our full-service branches accept deposits, disburse cash, offer the full range of our retail banking products such as consumer loans, automobile financing, credit cards, mortgage loans and checking accounts lend to small- and medium-size companies and provide information to current and potential customers.
We offer electronic banking services to our customers 24 hours a day through our internet website, www.bancochile.cl, which has homepages that are segmented by market. Our retailindividual homepage offers a broad range of services, including the payment of bills, electronic fund transfers, stop payment and non-charge orders, as well as a wide variety of account inquiries. Our middle market companiescorporate homepage offers services including our office banking service,Banconexion Web, which enables our middle market companiescorporate customers to perform all of their banking transactions from their offices. Both homepages offer our customers the sale of third-party products with exclusive benefits. We also have a homepage designed for our investor customers, through which they can perform transactions such as stock trading, time deposit taking and opening savings accounts. Our foreign trade customers can rely on our international business homepage, which enables them to inquire about the status of their foreign trade transactions and perform transactions such as opening letters of credit, recording import collection and hedging on instructions and letters of credit. In 2004,2005, approximately 171,084202,971 individual customers and 29,96835,483 corporate customers performed close to 13.110.2 million transactions monthly on our website, of which 1.62.0 million arewere monetary transactions.
In addition, we provide our customers with access to a 24-hour phone-banking call center that grants them access to account information and allows them to effect fund transfers and certain payments. This service, through which we receive approximately 980,000826,200 calls per month, has enabled us to develop customer loyalty campaigns, sell financial services and products, answer specialized inquiries about our remote services and receive and resolve complaints by customers and non-customers.
In 2001, in association with Banco de Credito e Inversiones, we created a company called Comercio Electronico Artikos Chile S.A. with the purpose of providing Chilean companies with the opportunity to trade their products and services on an electronic basiselectronically through the internet. We supplement this service with a wide range of financial services and electronic payment means. Artikos Chile uses the Commerce One platform, a world leader in business-to-business technological solutions.
Competition
Overview
The Chilean market for banking and other financial services is highly competitive, and we face significant competition in each of our principal areas of operation. The Chilean financial services market consists of a number of distinct sectors. The most important sector, commercial banking, includes 2625 privately owned banks and one public sector bank, Banco del Estado. The privately owned banks have traditionally been divided between those that are principally Chilean-owned, of which there are 14,13, and those that are principally foreign-owned, of which there are 12. At December 31, 2004,2005, three banks Banco Santander-Chile (22.7%), our bank (17.8%) and the public sector bank, Banco del Estado (13.2%) together accounted for 53.7%54.0% of all outstanding loans by Chilean financial institutions, net of interbank loans.loans: Banco Santander-Chile (22.5%), our bank (18.2%) and the public sector bank, Banco del Estado (13.3%). Chilean-owned banks together accounted for 61.0%48.4% of total loans outstanding while foreign-owned banks accounted for 39.0%38.3% of total loans outstanding.
As a commercial bank offering a range of services to all types of businesses and individual customers, we face a variety of competitors, ranging from other large, privately owned commercial banks to more specialized entities like “niche” banks. TheWe consider the principal commercial banks in Chile includeto be our primary competitors, namely, Banco Santander-Chile, Banco de Credito e Inversiones, Banco Bilbao Vizcaya Argentaria Chile, or BBVA, and BBVA Banco BHIF, which we consider to be our primary competitors.Corpbanca. Nevertheless, we face competition to a lesser extent from Banco del Estado, which has a larger distribution network and larger customer base than we do. Banco del Estado, which operates under the same regulatory regime as Chilean private sector banks, was the third largest bank in Chile at December 31, 2004,2005, with outstanding loans, net of interbank loans, of Ch$4,937,3895,864,383 million, representing a 13.2%13.3% market share, according to data published by the Chilean Superintendency of Banks.
In the large corporations business area,wholesale market, we consider our strongest competitors to be Banco Santander-Chile, Banco de Credito e Inversiones, BBVA and BBVA Banco BHIF.Corpbanca. We also consider these banks to be our most significant competitors in the middle market companies business area.
In the retail banking business area,market, we compete with other private sector Chilean banks, as well with Banco del Estado. Among private Chilean banks, we consider our strongest competitors in this business areamarket to be Banco Santander-Chile, and Banco de Credito e Inversiones and BBVA, as each of these banks has developed business strategies that focus on theboth middle market companies and lower-middle to middle income subsegmentsbrackets of the Chilean population. In the individual banking sector, particularlyaddition, with respect to high-income individuals, we compete with both private Chilean and foreign-owned banks and consider our strongest competitors in this market to be Banco Santander-Chile and Citibank.
Citibank, N.A.
The Chilean banking industry has experienced increased levels of competition in recent years, including from foreign banks, which has led to, among other things, consolidation in the industry. Consequently, strategies have, on an overall basis, been aimed at reducing costs and improving efficiency standards. Our income may decrease due to the extent and intensity of competition.
We expect the trend of increased competition and consolidation to continue, particularly in connection with the formation of new large financial groups and the creation of new niche banks. In this regard, in mid-1996 Banco Santander of Spain took control of Banco Osorno and merged it into its Chilean operations, changing its name to Banco Santander-Chile. In addition, Banco O’ Higgins and Banco de Santiago merged in January 1997, forming Banco Santiago. In 1999, Banco Santander of Spain took control of Banco Santiago. In August 2002, Banco Santiago and Banco Santander–Chile, then the second and fourth largest banks in Chile, at that date, respectively, merged and became Chile’s largest bank. In 2003, Banco del Desarrollo merged with Banco Sudameris, and in 2004, Dresdner Banque Nationale de Paris merged with Banco Security. In 2005, Banco de Credito e Inversiones merged with Banco Conosur. Although we believe that we are currently large enough to compete effectively in our target markets, any further consolidation in the Chilean financial systemservices industry may adversely affect our competitive position in the Chilean financial services industry.
position.
Historically, commercial banks in Chile have competed in the retail market against each other, with finance companies and with department stores, the latter two having traditionally been focused on consumer loans to middle- and low-income subsegments. However, finance companies have gradually disappeared as most of them have been merged into the largest banks.
Non-bank competition from large department stores has become increasingly significant in the consumer lendingconsumer-lending sector. Indeed, three new consumer-oriented banks, affiliated with Chile’s largest department stores, have been established during recent years. Although these new banks had a market share of less than 1.1%1.4% as of December 31, 2004,2005, according to the Chilean Superintendency of Banks, the opening of these banks is likely to bring increased competition into themake consumer banking business.
In addition, two new banks were incorporated during 2004,more competitive. Non-bank competition including mainly department stores, private compensation funds and some local investor groups have announced their intention to incorporate new banks in 2005. We expect thatsavings and credit cooperatives accounts for an estimated 34% of the addition of these new banks will lead to greater competition, particularly in banking services directed to middle-income individuals.total consumer market.
The following table provides certain statistical information on the Chilean financial system as of December 31, 2004:2005:
| As of December 31, 2004 | As of December 31, 2005 | |||||||||||||||||||||||||||||||||||||||||||||||
| Assets | Loans(1) | Deposits | Shareholders’ Equity(2) | Assets | Loans(1) | Deposits | Shareholders’ Equity(2) | |||||||||||||||||||||||||||||||||||||||||
| Amount | Share | Amount | Share | Amount | Share | Amount | Share | Amount | Share | Amount | Share | Amount | Share | Amount | Share | |||||||||||||||||||||||||||||||||
| (in millions of constant Ch$ as of December 31, 2004, except percentages) | (in millions of constant Ch$ as of December 31, 2005, except percentages) | |||||||||||||||||||||||||||||||||||||||||||||||
Domestic private sector banks | Ch$ | 23,920,951 | 43.9 | % | Ch$ | 17,842,889 | 47.8 | % | Ch$ | 14,527,724 | 45.6 | % | Ch$ | 2,015,873 | 43.5 | % | Ch$ | 27,463,214 | 44.7 | % | Ch$ | 21,432,885 | 48.4 | % | Ch$ | 16,350,985 | 44.4 | % | Ch$ | 2,286,724 | 44.5 | % | ||||||||||||||||
Foreign-owned banks | 22,041,760 | 40.5 | 14,569,016 | 39.0 | 12,573,928 | 39.4 | 2,207,874 | 47.6 | 23,307,366 | 38.0 | 16,946,789 | 38.3 | 14,065,094 | 38.2 | 2,403,513 | 46.8 | ||||||||||||||||||||||||||||||||
Private sector total | Ch$ | 45,962,711 | 84.4 | Ch$ | 32,411,905 | 86.8 | Ch$ | 27,101,652 | 85.0 | Ch$ | 4,223,747 | 91.1 | Ch$ | 50,770,580 | 82.7 | Ch$ | 38,379,674 | 86.7 | Ch$ | 30,416,079 | 82.6 | Ch$ | 4,690,237 | 91.3 | ||||||||||||||||||||||||
Banco del Estado | 8,522,488 | 15.6 | 4,937,389 | 13.2 | 4,781,267 | 15.0 | 412,493 | 8.9 | 10,587,927 | 17.3 | 5,864,383 | 13.3 | 6,392,517 | 17.4 | 444,676 | 8.7 | ||||||||||||||||||||||||||||||||
Total banking system | Ch$ | 54,485,199 | 100.0 | % | Ch$ | 37,349,294 | 100.0 | % | Ch$ | 31,882,919 | 100.0 | % | Ch$ | 4,636,240 | 100.0 | % | Ch$ | 61,358,507 | 100.0 | % | Ch$ | 44,244,057 | 100.0 | % | Ch$ | 36,808,596 | 100.0 | % | Ch$ | 5,134,913 | 100.0 | % | ||||||||||||||||
Source: Chilean Superintendency of Banks
| (1) | Net of interbank loans. |
| (2) | Shareholders’ equity includes net income for purposes of this table. |
Loans
The following table sets forth our market share in terms of loans (excluding interbank loans), and our principal private sector competitors, as of the dates indicated:
| Bank Loans(1) | Bank Loans(1) | |||||||||||||||||||||||||||||
| As of December 31, | As of December 31, | |||||||||||||||||||||||||||||
| 2000 | 2001 | 2002 | 2003 | 2004 | 2001 | 2002 | 2003 | 2004 | 2005 | |||||||||||||||||||||
Banco Santander-Chile | 11.5 | % | 11.7 | % | 24.7 | % | 22.6 | % | 22.7 | % | 11.7 | % | 24.7 | % | 22.6 | % | 22.7 | % | 22.5 | % | ||||||||||
Banco de Chile | 12.7 | 12.1 | 18.7 | 18.5 | 17.8 | 12.1 | 18.7 | 18.5 | 17.8 | 18.2 | ||||||||||||||||||||
Banco de Credito e Inversiones | 7.9 | 9.0 | 10.4 | 11.2 | 11.8 | 9.0 | 10.4 | 11.2 | 11.8 | 12.5 | ||||||||||||||||||||
BBVA Banco BHIF | 5.8 | 6.0 | 6.7 | 7.3 | 7.8 | |||||||||||||||||||||||||
Banco Santiago(2) | 15.8 | 16.1 | — | — | — | |||||||||||||||||||||||||
Banco de A. Edwards(3) | 8.3 | 7.4 | — | — | — | |||||||||||||||||||||||||
Conosur | 0.6 | 0.5 | 0.5 | 0.4 | — | |||||||||||||||||||||||||
BBVA Bilbao Vizcaya | 6.0 | 6.7 | 7.3 | 7.8 | 8.1 | |||||||||||||||||||||||||
Banco Santiago(2) | 16.1 | — | — | — | — | |||||||||||||||||||||||||
Banco de A. Edwards(3) | 7.4 | — | — | — | — | |||||||||||||||||||||||||
Banco Corpbanca | 4.8 | 5.4 | 6.4 | 6.5 | 6.4 | |||||||||||||||||||||||||
Total market share for six banks | 62.0 | % | 62.3 | % | 60.5 | % | 59.6 | % | 60.1 | % | ||||||||||||||||||||
Total market share | 67.7 | % | 66.4 | % | 66.5 | % | 67.0 | % | 67.7 | % | ||||||||||||||||||||
Source: Chilean Superintendency of Banks
| (1) | For ease of comparison, interbank loans have been eliminated. |
| (2) | Banco Santiago merged with Banco Santander-Chile in August 2002. |
| (3) | Banco de A. Edwards merged with us on January 1, 2002. |
| (4) | Banco de Credito e Inversiones merged with Conosur in 2005. |
Risk Index
Our unconsolidated risk index primarily increased in 2002 and 2003 (relative to prior years)year) as a result of our merger with Banco de A. Edwards.
As Since 2002, our risk index has been decreasing as economic conditions and our collection procedures have improved. During 2005, our risk index continued to drop, and, as of October 31, 2004, our2005, we posted an unconsolidated risk index of 2.39% was higher than1.78%, slightly above 1.67%, the risk index of the financial systemall Chilean banks as a whole (i.e., all banks) of 2.01% (the latest available information for 2004 for the Chilean financial system).whole. For a discussion of risk index, see “—Selected Statistical Information—Classification of Loan Portfolio and Allowances for Loan Losses under the Previous Guidelines—AllowanceAllowances for Loan Losses under the Previous Guidelines—Global Allowances for Loan Losses.” The following graph illustrates the five-year history of our unconsolidated loan portfolio risk index compared to the risk index of total loans in the Chilean financial system as of October 31 for each of the years indicated.
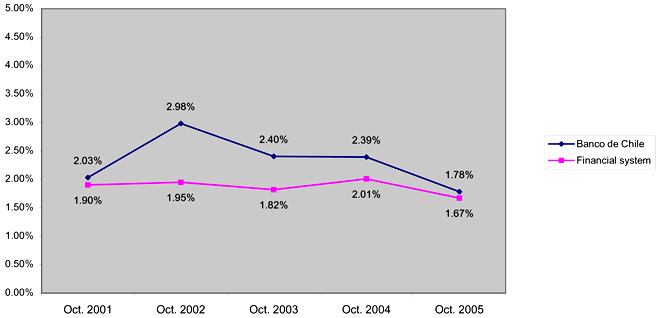
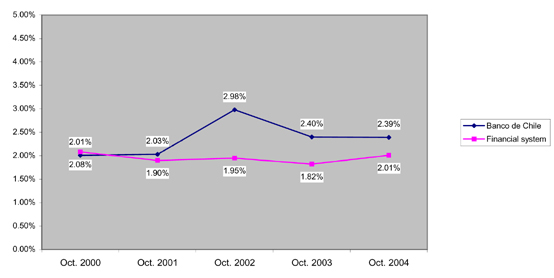
Source: Chilean Superintendency of Banks
The following table sets forth the unconsolidated risk index of the six largest private sector banks and that of the financial system as a whole (including such six banks) at October 31 in each of the last five years:
| Unconsolidated Risk Index As of | Unconsolidated Risk Index As of | |||||||||||||||||||||||||||||
| October 31, | October 31, | |||||||||||||||||||||||||||||
| 2000 | 2001 | 2002 | 2003 | 2004(3) | 2001 | 2002 | 2003 | 2004(3) | 2005(3) | |||||||||||||||||||||
Banco Santiago(1) | 1.34 | % | 1.26 | % | — | — | — | |||||||||||||||||||||||
Banco de A. Edwards(2) | 2.90 | 3.23 | — | — | — | |||||||||||||||||||||||||
Banco de Credito e Inversiones | 1.95 | 1.63 | 1.34 | % | 1.30 | % | 1.88 | % | ||||||||||||||||||||||
BBVA Banco BHIF | 2.18 | 1.81 | 1.68 | 1.42 | 1.57 | |||||||||||||||||||||||||
Banco Santiago(1) | 1.26 | % | — | — | — | — | ||||||||||||||||||||||||
Banco de A. Edwards(2) | 3.23 | — | — | — | — | |||||||||||||||||||||||||
Banco de Chile | 2.03 | 2.98 | % | 2.40 | % | 2.39 | % | 1.78 | % | |||||||||||||||||||||
Banco de Credito e Inversiones(4) | 1.63 | 1.34 | 1.30 | 1.88 | 1.59 | |||||||||||||||||||||||||
Conosur | 10.80 | 8.50 | 5.88 | 7.35 | — | |||||||||||||||||||||||||
BBVA Bilbao Vizcaya | 1.81 | 1.68 | 1.42 | 1.57 | 1.43 | |||||||||||||||||||||||||
Banco Santander–Chile | 1.42 | 1.38 | 1.61 | 1.85 | 1.88 | 1.38 | 1.61 | 1.85 | 1.88 | 1.49 | ||||||||||||||||||||
Banco de Chile | 2.01 | 2.03 | 2.98 | 2.40 | 2.39 | |||||||||||||||||||||||||
Banco Corpbanca | 1.80 | 1.95 | 1.66 | 1.80 | 1.56 | |||||||||||||||||||||||||
Financial system | 2.08 | % | 1.90 | % | 1.95 | % | 1.82 | % | 2.01 | % | 1.90 | % | 1.95 | % | 1.82 | % | 2.01 | % | 1.67 | % | ||||||||||
Source: Chilean Superintendency of Banks
| (1) | Banco Santiago merged with Banco Santander-Chile in August 2002. |
| (2) | Banco de A. Edwards merged with us on January 1, 2002. |
| (3) | The guidelines used by Chilean banks to calculate their consolidated and unconsolidated risk index were amended in 2004. Consequently, our unconsolidated risk index information (and that of the Chilean financial system) for 2004 and 2005 is not comparable to the unconsolidated risk indices presented for preceding periods. See |
| (4) | Banco de Credito e Inversiones merged with Conosur in 2005. |
Credit Quality
At December 31, 2004,2005, according to information published by the Chilean Superintendency of Banks, we had an unconsolidated ratio of past due loans to total loans of 1.27%0.88%. The following table sets forth the ratio of past due loans to total loans for the four largest private sector banks at December 31 in each of the last three years:
| Past Due Loans to Total Loans | |||||||||
| As of December 31, | |||||||||
| 2002 | 2003 | 2004 | |||||||
Banco de Credito e Inversiones | 1.09 | % | 1.11 | % | 0.94 | % | |||
Banco de Chile | 2.43 | 1.74 | 1.27 | ||||||
BBVA Banco BHIF | 1.97 | 1.91 | 1.64 | ||||||
Banco Santander–Chile | 2.15 | 2.24 | 1.52 | ||||||
Total for four banks | 2.03 | % | 1.83 | % | 1.35 | % | |||
| Past Due Loans to Total Loans | |||||||||
| As of December 31, | |||||||||
| 2003 | 2004 | 2005 | |||||||
BBVA Bilbao Vizcaya | 1.91 | % | 1.64 | % | 1.13 | % | |||
Banco Santander–Chile | 2.24 | 1.52 | 1.05 | ||||||
Banco de Credito e Inversiones(1) | 1.11 | 0.94 | 0.72 | ||||||
Banco de Chile | 1.74 | 1.27 | 0.88 | ||||||
Banco Corpbanca | 1.24 | 0.80 | 0.88 | ||||||
Conosur | 0.95 | 0.39 | — | ||||||
Source: Chilean Superintendency of Banks
| (1) | Banco de Credito e Inversiones merged with Conosur in 2005. |
Deposits
We had deposits of Ch$5,267,0666,048,948 million at December 31, 20042005 on an unconsolidated basis. In unconsolidated terms, our 16.5%16.4% of the market share for deposits, including borrowings from domestic financial institutions, placed us in second place among private sector banks. The following table sets forth the market shares in terms of deposits for the four private sector banks with the largest market share as of December 31 in each of the last three years:
| Deposits | |||||||||
| As of December 31, | |||||||||
| 2002 | 2003 | 2004 | |||||||
BBVA Banco BHIF | 6.9 | % | 7.7 | % | 8.3 | % | |||
Banco de Credito e Inversiones | 10.3 | 10.8 | 11.3 | ||||||
Banco de Chile | 16.7 | 17.3 | 16.5 | ||||||
Banco Santander–Chile | 22.1 | 19.9 | 20.8 | ||||||
Total market share for four banks | 56.0 | % | 55.7 | % | 56.9 | % | |||
| Deposits | |||||||||
| As of December 31, | |||||||||
| 2003 | 2004 | 2005 | |||||||
Banco de Chile | 17.3 | % | 16.4 | % | 16.4 | % | |||
Banco Santander–Chile | 19.9 | 20.6 | 21.5 | ||||||
Banco de Credito e Inversiones(1) | 10.7 | 11.3 | 12.0 | ||||||
BBVA Bilbao Vizcaya | 7.7 | 8.3 | 8.0 | ||||||
Banco Corpbanca | 6.0 | 5.9 | 5.2 | ||||||
Conosur | 0.6 | 0.5 | — | ||||||
Total market share | 62.2 | % | 63.0 | % | 63.1 | % | |||
Source: Chilean Superintendency of Banks
| (1) | Banco de Credito e Inversiones merged with Conosur in 2005. |
Shareholders’ Equity
With Ch$521,905594,383 million in shareholders’ equity (not including net income), according to information published by the Chilean Superintendency of Banks, at December 31, 2004,2005, we were the second largest private sector commercial bank in Chile in terms of shareholders’ equity.
The following table sets forth the level of shareholders’ equity for the largest private sector banks in Chile as of December 31 in each of the last three years:
| Shareholders’ Equity | Shareholders’ Equity | |||||||||||||||||
| As of December 31, | As of December 31, | |||||||||||||||||
| 2002 | 2003 | 2004 | 2003 | 2004 | 2005 | |||||||||||||
| (in millions of constant Ch$ as of December 31, 2004) | (in millions of constant Ch$ as of December 31, 2005) | |||||||||||||||||
BBVA Banco BHIF | Ch$ | 245,113 | Ch$ | 243,407 | Ch$ | 252,256 | ||||||||||||
Banco de Credito e Inversiones | 263,641 | 295,050 | 337,190 | |||||||||||||||
Banco Santander–Chile | Ch$ | 860,582 | Ch$ | 862,946 | Ch$ | 842,122 | ||||||||||||
Banco de Chile | 585,532 | 579,251 | 521,905 | 600,104 | 540,694 | 594,383 | ||||||||||||
Banco Santander–Chile | Ch$ | 834,298 | Ch$ | 830,677 | Ch$ | 832,959 | ||||||||||||
Banco de Credito e Inversiones(1) | 305,672 | 349,329 | 395,190 | |||||||||||||||
Banco Corpbanca | 306,779 | 337,351 | 354,893 | |||||||||||||||
BBVA Bilbao Vizcaya | 252,169 | 261,337 | 259,100 | |||||||||||||||
Conosur | 25,253 | 23,488 | — | |||||||||||||||
Source: Chilean Superintendency of Banks
| (1) | Banco de Credito e Inversiones merged with Conosur in 2005. |
Return on Average Shareholders’ Equity
Our return on average shareholders’ equity, (includingincluding net income for the year)year, was 26.7% for the year ended December 31, 2004 was 23.9%,2005, according to information published by the Chilean Superintendency of Banks. The following table sets forth our return on average shareholders’ equity and the returns of our principal competitors and the Chilean financial system, in each case as of December 31 in each of the last five years:
| Return on Average Shareholders’ Equity Year Ended December 31, | Return on Average Shareholders’ Equity Year Ended December 31, | |||||||||||||||||||||||||||||
| 2000 | 2001 | 2002 | 2003 | 2004 | 2001 | 2002 | 2003 | 2004 | 2005 | |||||||||||||||||||||
Banco de A. Edwards (1) | 1.5 | % | 4.3 | % | — | — | — | 4.3 | % | — | — | — | — | |||||||||||||||||
Banco Santiago(2) | 19.8 | 24.0 | — | — | — | |||||||||||||||||||||||||
BBVA Banco BHIF | 7.4 | 6.3 | 8.8 | % | 10.5 | % | 5.3 | % | ||||||||||||||||||||||
Banco Santiago(2) | 24.0 | — | — | — | — | |||||||||||||||||||||||||
Banco de Chile | 23.4 | 23.6 | 8.8 | 20.2 | 23.9 | 23.2 | 8.7 | % | 20.0 | % | 23.6 | % | 26.7 | % | ||||||||||||||||
Banco Santander-Chile | 22.1 | 16.6 | 21.6 | 20.4 | 23.7 | |||||||||||||||||||||||||
Banco de Credito e Inversiones | 19.0 | 21.8 | 20.4 | 22.1 | 22.8 | 21.8 | 20.4 | 22.1 | 22.8 | 23.4 | ||||||||||||||||||||
Banco Santander-Chile | 22.1 | 22.1 | 16.6 | 21.6 | 20.4 | |||||||||||||||||||||||||
Banco Corpbanca | 18.5 | 18.9 | 15.9 | 14.6 | 13.8 | |||||||||||||||||||||||||
BBVA Bilbao Vizcaya | 6.3 | 8.2 | % | 10.5 | % | 5.3 | % | 10.7 | % | |||||||||||||||||||||
Conosur | 7.0 | 17.0 | 25.1 | 35.9 | — | |||||||||||||||||||||||||
Total average financial system | 12.5 | % | 15.7 | % | 13.5 | % | 14.9 | % | 15.3 | % | ||||||||||||||||||||
Financial system average | 15.7 | % | 13.5 | % | 15.0 | % | 15.3 | % | 16.4 | % | ||||||||||||||||||||
Source: Chilean Superintendency of Banks
| (1) | Banco de A. Edwards merged with us on January 1, 2002. |
| (2) | Banco Santiago merged with Banco Santander-Chile in August 2002. |
| (3) | Banco de Credito e Inversiones merged with Conosur in 2005. |
Efficiency
For the year ended December 31, 2004,2005, our operatingefficiency ratio (operating expenses as a percentage of our operating revenues, or efficiency ratio,revenues) was 51.2%.
50.4% on an unconsolidated basis.
The following table sets forth the efficiency ratios of the four largest private sector Chilean banks at December 31 in each of the last three years:
| Efficiency Ratio(1) | Efficiency Ratio(1) | |||||||||||||||||
| As of December 31, | As of December 31, | |||||||||||||||||
| 2002 | 2003 | 2004 | 2003 | 2004 | 2005 | |||||||||||||
Banco Santander-Chile | 50.1 | % | 46.5 | % | 68.1 | % | ||||||||||||
BBVA Bilbao Vizcaya | 59.3 | % | 68.1 | % | 67.9 | % | ||||||||||||
Banco de Credito e Inversiones | 54.8 | 51.3 | 53.1 | 50.9 | 53.1 | 52.7 | ||||||||||||
Banco de Chile | 61.0 | 55.4 | 51.2 | 53.9 | 51.2 | 50.4 | ||||||||||||
BBVA Banco BHIF | 64.6 | 61.0 | 47.7 | |||||||||||||||
Average for four banks | 55.5 | % | 51.4 | % | 51.7 | % | ||||||||||||
Banco Santander-Chile | 45.8 | 47.7 | 44.0 | |||||||||||||||
Banco Corpbanca | 40.1 | 39.8 | 40.9 | |||||||||||||||
Conosur | 62.0 | 62.1 | — | |||||||||||||||
Source: Chilean Superintendency of Banks
| (1) | Calculated by dividing operating expense by operating revenue. |
| (2) | Banco de Credito e Inversiones merged with Conosur in 2005. |
REGULATION AND SUPERVISION
General
In Chile, only banks may maintain checking accounts for their customers, conduct foreign trade operations and, together with non-banking financial institutions, accept time deposits. The principal authorities that regulate financial institutions in Chile are the Chilean Superintendency of Banks and the Central Bank. Chilean banks are primarily subject to the Chilean General Banking Law and secondarily, to the extent not inconsistent with that law, the provisions of the Chilean Corporations Law governing public corporations, except for certain provisions that are expressly excluded.
The modern Chilean banking system dates back to 1925 and has been characterized by periods of substantial regulation and state intervention, as well as periods of deregulation. The most recent period of deregulation commenced in 1975 and culminated in the adoption of a series of amendments to the Chilean General Banking Law. That law, amended most recently in 2004, granted additional powers to banks, including general underwriting powers for new issues of certain debt and equity securities and the power to create subsidiaries to engage in activities related to banking, such as brokerage, investment advisory, mutual fund services, administration of investment funds, factoring, securitization products and financial leasing services.
Following the Chilean banking crisis of 1982 and 1983, the Chilean Superintendency of Banks assumed control of 19 banks representing approximately 51% of the total loans in the banking system. As part of the assistance that the Chilean government provided to Chilean banks, the Central Bank permitted banks to sell to it a certain portion of their problem loan portfolios at the book value of the loan portfolios. Each bank then repurchased such loans at their economic value (which, in most cases, was substantially lower than the book value at which the Central Bank had acquired the loans), with the difference to be repaid to the Central Bank out of future income. Pursuant to Law No. 18,818, which was passed in 1989, this difference was converted into subordinated debt.
The Central Bank
The Central Bank is an autonomous legal entity created by the Chilean Constitution. It is subject to itsley organica constitucional,or organic constitutional law,Organic Constitutional Law, and the Chilean Constitution.ToConstitution. To the extent not inconsistent with its organic constitutional lawOrganic Constitutional Law or the Chilean Constitution, the Central Bank is also subject to private sector laws, but is not subject to the laws applicable to the public sector. It is directed and administered by a board of directors composed of five members designated by the President of Chile, subject to Senate approval.
The legal purpose of the Central Bank is to maintain the stability of the Chilean peso and the orderly functioning of Chile’s internal and external payment system. The Central Bank’s powers include setting reserve requirements, regulating the amount of money and credit in circulation, and establishing regulations and guidelines regarding finance companies, foreign exchange (including the Formal Exchange Market) and banks’ deposit-taking activities.
The Chilean Superintendency of Banks
Banks are supervised and controlled by the Chilean Superintendency of Banks, an independenta Chilean governmental agency. The Chilean Superintendency of Banks authorizes the creation of new banks and has broad powers to interpret and enforce legal and regulatory requirements applicable to banks and financial companies. Furthermore, in case of noncompliance with its legal and regulatory requirements, the Chilean Superintendency of Banks has the ability to impose sanctions. In extreme cases, it can appoint, with the prior approval of the board of directors of the Central Bank, a provisional administrator to manage a bank. It must also approve any amendment to a bank’s bylaws or any increase in its capital.
The Chilean Superintendency of Banks examines all banks from time to time, generally at least once a year. Banks are also required to submit unconsolidated unaudited financial statements to the Chilean Superintendency of Banks on a monthly basis and to publish their unaudited financial statements at least four times a year in a newspaper with countrywide coverage. Financial statements as of December 31 of any given year must be audited. In addition, banks are required to provide extensive information regarding their operations at various periodic intervals to the Chilean Superintendency of Banks. A bank’s annual financial statements and the opinion of its independent auditors must also be submitted to the Chilean Superintendency of Banks.
Any person wishing to acquire, directly or indirectly, 10.0% or more of the share capital of a bank must obtain the prior approval of the Chilean Superintendency of Banks. Without such approval, the holder will not have the right to vote such shares. The Chilean Superintendency of Banks may only refuse to grant its approval based on specific grounds set forth in the Chilean General Banking Law.
According to Article 35 bis of the Chilean General Banking Law, the prior authorization of the Chilean Superintendency of Banks is required for:
Such prior authorization is required only when the acquiring bank or the resulting group of banks would own a market share in loans determined by the Chilean Superintendency of Banks to be more than 15.0% of all loans in the Chilean banking system. The intended purchase, merger or expansion may be denied by the Chilean Superintendency of Banks, or, if the acquiring bank or resulting group would own a market share in loans determined to be more than 20.0% of all loans in the Chilean banking system, the purchase, merger, or expansion may be conditioned on one or more of the following:
If the acquiring bank or resulting group would own a market share in loans determined by the Chilean Superintendency of Banks to be more than 15% but less than 20%, the authorization will be conditioned on the bank or banks maintaining an effective equity not lower than 10% of their risk-weighted assets for a period set by the Chilean Superintendency of Banks, which may not be less than one year. The calculation of risk-weighted assets is based on a five category risk classification system applied to a bank’s assets that is based on the Basel Committee recommendations.
Pursuant to the regulations of the Chilean Superintendency of Banks, the following ownership disclosures are required:
Limitations on Types of Activities
Chilean banks can only conduct those activities allowed by the General Banking Law, including making loans, factoring and leasing activities, accepting deposits and, subject to limitations, making investments and performing financial services. Investments are restricted to real estate for the bank’s own use, gold, foreign exchange and debt securities. Through subsidiaries, banks may also engage in other specific financial service activities such as securities brokerage services, mutual fund management, investment fund management, financial advisory, securitization and leasing activities. Subject to specific limitations and the prior approval of the Chilean Superintendency of Banks and the Central Bank, Chilean banks may own majority or minority interests in foreign banks.
OnIn March 2, 2002, the Central Bank authorized banks to pay interest on checking accounts and the Chilean Superintendency of Banks published guidelines permitting banks to offer and charge fees for the use of a checking account product that pays interest. Under these guidelines, these accounts may be subject to a minimum balance and different interest rates depending on average balances held in the account. The Central Bank has imposed additional caps to the interest rate that can be charged by banks with a solvency score of less than A.
Deposit Insurance
The Chilean government guarantees up to 90.0% of the principal amount of certain time and demand deposits held by individuals in the Chilean banking system. This guarantee covers obligations with a maximum value of UF108UF120 per person (Ch$1,870,2412,156,977 or U.S.$3,3414,195 as of December 31, 2004)2005) per calendar year.
Reserve Requirements
Deposits are subject to a reserve requirement of 9.0% for demand deposits and 3.6% for time deposits. The Central Bank has statutory authority to increase these percentages to up to 40% for demand deposits and up to 20% for time deposits, to implement monetary policy.
In addition, Chilean banks must hold a certain amount of assets in cash or highly liquid instruments. This reserve requirement is equal to the amount by which the daily balance of:
in the aggregate exceeds 2.5 times the amount of the bank’s capital and reserves.
Chilean regulations also require that (i)(1) gaps between assets and liabilities maturing within less than 30 days do not exceed a bank’s basic capital (ii)and (2) gaps between assets and liabilities maturing within less than 90 days do not exceed twice a bank’s equity and (iii) interest rate mismatches of a bank’s foreign currency liabilities do not exceed 8.0% of its effective equity ratio.equity.
Minimum Capital
Under the Chilean General Banking Law, a bank must have a minimum paid-in capital and reserves of UF800,000 (Ch$13,85414,380 million or U.S.$24.728.0 million as of December 31, 2004)2005). However, a bank may begin its operations with 50.0% of such amount, provided that it has an effective equity ratio (defined as effective equity as a percentage of risk-weighted assets) of not less than 12.0%. When such a bank’s paid-in capital reaches UF600,000 (Ch$10,39010,785 million or U.S.$18.621.0 million as of December 31, 2004)2005) the effective equity ratio requirement is reduced to 10.0%.
Capital Adequacy Requirements
According to the General Banking Law, each bank should have an effective equity of at least 8.0% of its risk-weighted assets, net of required allowances. Effective equity is defined as the aggregate of:
Banks should also have a net capital base of at least 3.0% of its total assets, net of required allowances.
Market Risk Regulations
In September 2005, the Chilean Superintendency of Banks introduced new regulations for measuring market risk under a standardized model methodology that determines, using regulatory criteria, the exposure to interest rate, currency and “optionality” risks faced by financial institutions.
In order to implement the standardized model, a bank’s balance sheet is divided into two “books”: the banking book and the trading book. The latter comprises the positions in financial instruments that can be valued at market price, plus the foreign currency mismatch. The banking book is composed of all the asset and liability entries not forming part of the trading book.
The new rules state that the risk of the trading book, the market risk exposure, plus 10% of the weighted assets by credit risk, may not be greater than a bank’s effective equity. As of December 31, 2005, our market risk level amounted to approximately Ch$15 billion.
The following table shows our regulatory excess margin, or the difference between the regulatory limit applicable to us and our effective equity, as of December 31, 2005.
| At December 31, 2005 | |||
| (in millions of constant Ch$ as of December 31, 2005) | |||
10% weighted asset by credit risk | Ch$ | 793,666 | |
Market Risk Exposure | 15,326 | ||
Total | 808,992 | ||
Effective Equity | 891,213 | ||
Regulatory Excess Margin | Ch$ | 82,221 | |
Lending Limits
Under the General Banking Law, Chilean banks are subject to certain lending limits, including the following material limits:
In addition, the General Banking Law limits the aggregate amount of loans that a bank may grant to its employees to 1.5% of its effective equity and provides that no individual employee may receive loans in excess of 10.0% of this 1.5% limit. Notwithstanding these limitations, a bank may grant to each of its employees a single residential mortgage loan for personal use once during such employee’s term of employment.
Allowances for Loan Losses
Chilean banks are required to evaluate their loan portfolio on a continuous basis using models and methods that follow guidelines established by the Chilean Superintendency of Banks. These models and methods, and any revision made to them, must be approved by the bank’s board of directors. This evaluation is conducted in order to determine the necessary allowances to adequately cover loan losses. Each bank is required to calculate and maintain, on a monthly basis, the following types of allowances:
Each year, a bank’s board of directors must examine the sufficiency of the bank’s level of allowances and provide an opinion stating whether the allowances are sufficient to cover all potential loan losses. The board must also obtain a report from the bank’s external auditors as to the bank’s compliance with required allowance levels. The opinion of the board of directors must be submitted in writing to the Chilean Superintendency of Banks and, if necessary, should state that additional allowances have been created as a result of the board’s examination.
The sum of the allowances regarding normal risk portfolios and the additional provisions up to an amount equal to 1.25% of the risk-weighted assets must be accounted as for effective equity in accordance with the Chilean Superintendency of Banks’ guidelines.
The Chilean Superintendency of Banks amended its regulations with respect to allowances effective January 1, 2004. For a discussion of loan allowances under the previous guidelines, see “—Selected Statistical Information— Classification of Loan Portfolio and Allowances for Loan Losses under the Previous Guidelines—Allowance for Loan Losses under the Previous Guidelines.”
Additional Allowances
Under the amended regulations, banks may create allowances in addition to those established pursuant to their model-based evaluation of the loan portfolio. However, a bank may create additional allowances only to cover specific risks that have been authorized by the board of directors. Our board of directors decided to establish additional allowances to cover unexpected deterioration of our portfolio with normal risk.
The concept of voluntary allowances has been eliminated by the amended regulations. See “Item 4. Selected Statistical Information— Classification of Loan Portfolio and Allowances for Loan Losses under the Previous Guidelines—Allowances for Loan Losses under the Previous Guidelines—Voluntary Allowances for Loan Losses.”
Classification of Banks
The Chilean Superintendency of Banks regularly examines and evaluates each bank’s credit management process, including its compliance with loan classification guidelines. On the basis of this evaluation, it classifies banks into various categories.
Classification of Banks: Solvency and Management
In accordance with amended regulations of the Chilean Superintendency of Banks effective as of January 1, 2004, banks are classified into categories I through V based upon their solvency and management ratings. This classification is confidential.
Category I: | This category is reserved for financial institutions that have been rated level A in terms of solvency and management. | |
Category II: | This category is reserved for financial institutions that have been rated | |
Category III: | This category is reserved for financial institutions that have been rated | |
Category IV: | This category is reserved for financial institutions that are rated level A or B in terms of solvency and have been rated level C in terms of management for two or more consecutive review periods. | |
Category V: | This category | |
A bank’s solvency rating is determined by its effective equity (after deducting accumulated losses during the financial year) to risk-weighted assets ratio. This ratio is equal to or greater than 10.0% for level A banks, equal to or greater than 8.0% and less than 10.0% for level B banks and less than 8.0% for level C banks.
With respect to a bank’s management rating, level A banks are those that are not rated as level B or C. Level B banks display some weakness in internal controls, information systems, response to risk, private risk rating or ability to manage contingency scenarios. Level C banks display significant deficiencies in internal controls, information systems, response to risk, private risk rating or ability to manage contingency scenarios.
Classification of Banks: Models and Methods
The Chilean Superintendency of Banks requires banks to follow new guidelines to determine the allowances for loan losses. A bank is also classified into categories 1 through 4 based on how closely its models and methods for determining allowances comply with the models and methods determined by the Chilean Superintendency of Banks.
Category 1: | A category 1 bank has models and methods that are satisfactory to the Chilean Superintendency of Banks and is entitled to continue using those models and methods. | |
Category 2: | A category 2 bank must maintain the minimum levels of allowances established by the Chilean Superintendency of Banks while its board of directors is made aware of the problems detected by the Chilean Superintendency of Banks and takes steps to correct them. | |
Category 3 or 4: | A bank in category 3 or 4 must maintain the minimum levels of allowances established by the Chilean Superintendency of Banks until it is authorized by the Chilean Superintendency of Banks to do otherwise. | |
Allowances for Loan Losses
Chilean banks are required to evaluate their loan portfolio on a continuous basis using models and methods that follow guidelines established by the Chilean Superintendency of Banks that have been approved by our board of directors. This evaluation is conducted in order to determine the necessary allowances to cover loan losses adequately. Each bank is required to calculate and maintain, on a monthly basis, the following types of allowances:
Each year, a bank’s board of directors must examine the sufficiency of its level of allowances and provide an opinion stating whether the allowances are sufficient to cover all potential loan losses. The board must also obtain a report from the external auditors as to compliance with required allowance levels. The opinion of the board of directors must be submitted in writing to the Chilean Superintendency of Banks and, if necessary, should state that additional allowances have been created as a result of the board’s examination.
The sum of the allowances regarding normal risk portfolios and the additional provisions up to an amount equal to 1.25% of the risk-weighted assets must be accounted as for effective equity in accordance with the Chilean Superintendency of Banks’ guidelines.
The Chilean Superintendency of Banks amended its guidelines effective as of January 1, 2004. For a discussion of loan allowances under the previous guidelines, see “—Selected Statistical Information— Classification of Loan Portfolio
and Allowances for Loan Losses under the Previous Guidelines—Allowances for Loan Losses under the Previous Guidelines.” Pursuant to the amended guidelines, Chilean banks are required to classify their loan portfolio on an ongoingon-going basis for the purpose of determining the amount of allowances for loan losses. TheAlthough the Chilean Superintendency of Banks establishes thehas established these guidelines, used by banks for such classifications, although banks are given some latitude in devising more stringent classification systems within such guidelines.
In order to create and maintain allowances, Chilean banks use models and methods to classify their portfolio by borrower and loan type. Loans are divided into: (i)
The Chilean Superintendency of Banks amended its guidelines effective as of January 1, 2004. For a discussion of loan portfolio classification under the previous guidelines, see “—Selected Statistical Information— Classification of Loan Portfolio and Allowances for Loan Losses under the Previous Guidelines—Classification of Loan Portfolio under the Previous Guidelines.”
In accordance with the amended regulations, the models and methods a bank uses to classify its loan portfolio must comply with the following guidelines established by the Chilean Superintendency of Banks.
Classification of Loan Portfolio: Models Based on the Individual Analysis of Borrowers
An individual analysis of the borrower is necessary if the borrower is a large or complex business, or one to which the bank has no previous exposure. Models based on the individual analysis of borrowers require that the bank assign a risk category level to each borrower and its respective loans. In making such a determination, a bank must consider the following risk factors with respect to the borrower: (i) its industry or sector,sector; (ii) its owners or managers,managers; (iii) its financial situation,situation; (iv) its payment capacitycapacity; and (v) its payment behavior. Upon completion of this analysis, each borrower and loan must be classified to the following normal risk or above normal risk category levels:
| Borrowers with Normal Risk | ||
Categories A1, A2 and A3: | Borrowers with payment capacity sufficient to cover their loan obligations. They have no apparent credit risk and their payment capacity is not affected by unfavorable business, economic or financial situations. | |
Category B: | Borrowers with payment capacity sufficient to cover their loan obligations. While they present some risk, their payment capacity is not affected by unfavorable business, economic or financial situations. | |
| Borrowers with Above Normal Risk | ||
| Categories C1, C2, C3, C4, D1 or D2: | These borrowers have insufficient payment capacity to cover their loan obligations under normal circumstances. | |
Required Allowances.For loans in categories A1, A2, A3 or B, the board of directors of a bank is authorized to determine the levels of required allowances. Our board of directors has established the following levels of required allowances for loans classified as A1, A2, A3 and B:
Classification | Estimated range of loss | Allowance | |||
A1 | — | — | |||
A2 | — | — | |||
A3 | — | 0.5 | % | ||
B | — | 1.0 | % |
For loans in categories C1, C2, C3, C4, D1 or D2, we must have the following levels of allowances:
| Estimated range of loss | ||||
C1 | Up to 3% | 2 | % | ||
C2 | More than 3% up to 19% | 10 | % | ||
C3 | More than 19% up to 29% | 25 | % | ||
C4 | More than 29% up to 49% | 40 | % | ||
D1 | More than 49% up to 79% | 65 | % | ||
D2 | More than 79% | 90 | % |
| (1) | Classification into categories is based on a level of expected combined loss from commercial loans and operations of commercial leasing of the borrower. This calculation is made in accordance with our methodology. |
| (2) | Allowance percentages are supported by statistical probabilities. |
For a description of the categories and allowance percentages under the previous guidelines, see “—Statistical Information—Classification of Loan Portfolio and Allowances for Loan Losses under the Previous Guidelines—AllowanceAllowances for Loan Losses under the Previous Guidelines—Global Allowances for Loan Losses.”
Classification of Loan Portfolio: Models Based on the Group Analysis of Borrowers
A model based on the group analysis of borrowers should be used for the evaluation of borrowers whose individual loan amounts are relatively small, primarily loans to individuals and small companies. Each bank determines the level of required allowances depending on the estimated loss that may result from the loans, by classifying the loan portfolio using one or both of the following models:
Additional Allowances
Under the Chilean Superintendency of Bank’s regulations, banks may create allowances in addition to those established pursuant to their model-based evaluation of the loan portfolio. However, a bank may create additional allowances only to cover specific risks that have been authorized by the board of directors. Our board of directors has established additional allowances to cover the unexpected deterioration of our loan portfolio.
The concept of voluntary allowances has been eliminated by the amended regulations that have been in effect since January 1, 2004. See “—Selected Statistical Information— Classification of Loan Portfolio and Allowances for Loan Losses under the Previous Guidelines—Allowances for Loan Losses under the Previous Guidelines—Voluntary Allowances for Loan Losses.”
Obligations Denominated in Foreign Currencies
Foreign currency-denominated obligations of Chilean banks are subject to fourtwo requirements:
Capital Markets
Under the General Banking Law, banks in Chile may purchase, sell, place, underwrite and act as paying agents with respect to certain debt securities. Likewise, banks in Chile may place and underwrite certain equity securities. Bank subsidiaries may also engage in debt placement and dealing, equity issuance advice and securities brokerage, as well as financial leasing, mutual fund and investment fund administration, factoring, investment advisory services and merger and acquisition services. The Superintendency of Banks generally regulates these subsidiaries, however, the Chilean Superintendency of Securities and Insurance regulates some of these subsidiaries. The Chilean Superintendency of Securities and Insurance is the regulator of the Chilean securities market and open stock corporations.
Legal Provisions Regarding Banking Institutions with Economic Difficulties
The General Banking Law provides that if specified adverse circumstances exist at any bank, its board of directors must correct the situation within 30 days from the date of receipt of the relevant financial statements. If the board of directors is unable to do so, it must call a special shareholders’ meeting to increase the capital of the bank by the amount necessary to return the bank to financial stability. If the shareholders reject the capital increase, or if it is not effected within the 30-day period and in the manner agreed to at the meeting, or if the Chilean Superintendency of Banks does not approve the board of directors’ proposal, the bank will be barred from increasing its loan portfolio beyond that stated in the financial statements presented to the board of directors and from making any further investments in any instrument other than instruments issued by the Central Bank. In such a case, or in the event that a bank is unable to make timely payment in respect of its obligations or if a bank is under provisional administration of the Chilean Superintendency of Banks, the General Banking Law provides that the bank may receive a two-year term loan from another bank. The terms and conditions of such a loan must be approved by the directors of both banks, as well as by the Chilean Superintendency of Banks, but need not be submitted to the borrowing bank’s shareholders for their approval. A creditor bank may not grant such interbank loans to an insolvent bank in an amount exceeding 25.0% of the creditor bank’s effective equity. The board of directors of a bank that is unable to make timely payment of its obligations must present a reorganization plan to its creditors in order to capitalize the credits, extend their respective terms, forgive debts or take other measures for the payment of the debts. If the board of directors of a bank submits a reorganization plan to its creditors and such arrangement is approved, all subordinated debt issued by the bank, whether or not matured, will be converted by operation of law into common stock in the amount required for the ratio of effective equity to risk-weighted assets to be no lower than 12.0%. If a bank fails to pay an obligation, it must notify the Chilean Superintendency of Banks, which shall determine if the bank is solvent.
Dissolution and Liquidation of Banks
The Chilean Superintendency of Banks may establish that a bank should be liquidated for the benefit of its depositors or other creditors when the bank does not have the necessary solvency to continue its operations. In such case, the Chilean Superintendency of Banks must revoke the bank’s authorization to exist and order its mandatory liquidation, subject to agreement by the Central Bank. The Superintendency of Banks must also revoke the bank’s authorization if the reorganization plan of the bank has been rejected twice. The resolution by the Chilean Superintendency of Banks must state the reason for ordering the liquidation and must name a liquidator, unless the Superintendent of Banks assumes this responsibility. When a liquidation is declared, all checking accounts, other demand deposits received in the ordinary course of business, other deposits unconditionally payable immediately or that have a maturity of no more than 30 days and any other deposits and receipts payable within 10 days, are required to be paid by using the bank’s existing funds, its deposits with the Central Bank or its investments in instruments that represent its reserves. If these funds are insufficient to pay these obligations, the liquidator may seize the bank’s remaining assets, as needed. If necessary, and in specified circumstances, the Central Bank will lend the bank the funds necessary to pay these obligations. Any such loans are preferential to any claims of other creditors of the liquidated bank.
Investments in Foreign Securities
Under current Chilean banking regulations, banks in Chile may grant loans to foreign individuals and entities and invest in certain foreign currency securities. Chilean banks may only invest in equity securities of foreign banks and certain other foreign companies which may be affiliates of the bank or which would support the bank’s business if such companies were incorporated in Chile. Banks in Chile may also invest in debt securities traded in formal secondary markets. Such debt securities shall qualify as (1) securities issued or guaranteed by foreign sovereign states or their central banks or other foreign or international financial entities, and (2) bonds issued by foreign companies. Such foreign currency securities must have a minimum rating as follows:
Rating Agency | Short Term | Long Term | ||
Moody’s | P2 | Baa3 | ||
Standard and Poor’s | A3 | BBB- | ||
Fitch IBCA | F2 | BBB- |
A Chilean bank may invest in securities having a minimum rating as follows, provided that if the total amount of these investments exceeds 20% (or 30% in certain cases) of the effective equity of the bank, an allowance of 100% of the excess shall be established by the bank:
Rating Agency | Short Term | Long Term | ||
Moody’s | P2 | Ba3 | ||
Standard and Poor’s | A3 | BB- | ||
Fitch IBCA | F2 | BB- |
If investments in these securities and certain loans referred to below exceed 70% of the effective equity of the bank, an allowance for 100% of the excess shall be established, unless the excess, up to 70% of the bank’s effective equity, is invested in securities having a minimum rating as follows:
Rating Agency | Short Term | Long Term | ||
Moody’s | P1 | Aa3 | ||
Standard and Poor’s | A-1+ | AA- | ||
Fitch IBCA | F1+ | AA- |
Subject to specific conditions, a bank may grant loans in dollars to subsidiaries or branches of Chilean companies located abroad, to companies listed on foreign stock exchanges authorized by the Central Bank and, in general, to individuals and entities domiciled abroad, as long as the Central Bank is kept informed of such activities.
In the event that the sum of the investments of a bank in foreign currency and the commercial and foreign trade loans granted to foreign individuals and entities exceeds 70.0% of the effective equity of such bank, the excess is subject to a mandatory reserve of 100.0%.
Prevention of Money Laundering and the Financing of Terrorism
On March 6, 2006, the Chilean Superintendency of Banks issued regulations governing the requirements applicable to banks with respect to prevention of money laundering and terrorism financing. The regulations are aimed at incorporating international anti-money laundering and terrorism financing laws to the Chilean banking industry. Pursuant to the regulations, the Chilean Superintendency of Banks requires that banks implement “know your customer” policies, which must be approved by its board of directors and must take into account the volume and complexity of its operations, as well as the operations of its affiliates and foreign branches and other related parties.
In general, such policies are aimed at:
This information must be updated at least annually and used by the bank to build a transactional profile of expected volume and type of transactions or products the customer will require. This information is used to evaluate the consistency of customer transactions with the defined transactional profile. Additionally, for unexpected transactions, new customers and PEPs, banks must require a statement, supported by adequate documentation, regarding the source of the funds for any such transaction that exceeds the lesser of (i) 450 UF or (ii) the limit defined by the bank’s internal policies.
ORGANIZATIONAL STRUCTURE
The following diagram presents our current corporate structure, including our subsidiaries and foreign branches and their respective ownership interests:
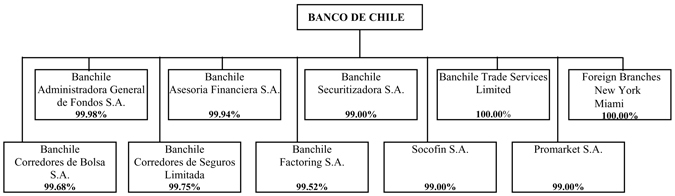
With the exception of Banchile Trade Services Limited, which was incorporated in Hong Kong, all of the subsidiaries presented above have their jurisdiction of incorporation in the Republic of Chile.
PROPERTY, PLANTS AND EQUIPMENT
We are domiciled in Chile and own the building located at Ahumada 251, Santiago, Chile that is approximately 65,000 square meters and serves as our executive offices and as the executive offices for most our subsidiaries. In addition, we own an approximately 15,000 square meter building located at Huerfanos 740, Santiago, Chile where the remainder of our executive offices are located. At December 31, 2004,
2005, we owned the properties on which 129139 of our full-service branches are located (approximately 103,400102,400 square meters of office space). We lease office space for our remaining 95109 full-service branches, the New York and Miami branches, as well as for our representative offices. We also own properties throughout Chile for back office and administrative operations, as well as for storage of documents and other purposes. We believe that our facilities are adequate for our present needs and suitable for their intended purposes.
We also own approximately 140,000 square meters in mainly recreational physical facilities in Chile, which we use to assist our employees in maintaining a healthy work and life balance and which we use for incentive and integration activities.
SELECTED STATISTICAL INFORMATION
The following information is included for analytical purposes and should be read in conjunction with our audited consolidated financial statements as well as “Item 5. Operating and Financial Review and Prospects.”
Average Balance Sheets, Interest Earned on Interest Earning Assets and Interest Paid on Interest Bearing Liabilities
The average balances for interest earning assets and interest bearing liabilities, including interest and readjustments received and paid, have been calculated on the basis of our daily balances and on the basis of monthly balances for our subsidiaries. These average balances are presented in Chilean pesos (Ch$), in UF and in foreign currencies (principally U.S. dollar). The UF is aan inflation-indexed Chilean monetary unit of account with a value in Chilean pesos which is linked to, and which is adjusted daily to reflect changes in, the Consumer Price Index.Index of the Chilean National Institute of Statistics. See noteNote 1(b) to our audited consolidated financial statements.
The nominal interest rate has been calculated by dividing the amount of interest and principal readjustment gain or loss during the period by the related average balance, both amounts expressed in constant pesos. The nominal rates calculated for each period have been converted into real rates using the following formulas:
| Rp | = |
1 + Np | _ | |||||||
| 1 + I |
and
| Rd | = |
(1 + Nd)(1 + D) | _ | 1 | ||||||
| 1 + I | ||||||||||
| ||||||||||
Where:
Rp = real average rate for peso-denominated assets and liabilities (in Ch$ and UF) for the period;
Rd = real average rate for foreign currency-denominated assets and liabilities for the period;
Np = nominal average rate for peso-denominated assets and liabilities for the period;
Nd = nominal average rate for foreign currency-denominated assets and liabilities for the period;
D = devaluation rate of the Chilean peso to the dollar for the period; and
I = inflation rate in Chile for the period (based on the variation of the Consumer Price Index).
The real interest rate can be negative for a portfolio of peso-denominated loans when the inflation rate for the period is higher than the average nominal rate of the loan portfolio for the same period. A similar effect could occur for a portfolio of foreign currency-denominated loans when the inflation rate for the period is higher than the sum of the devaluation rate for the period and the corresponding average nominal rate of the portfolio.
The formula for the average real rate for foreign currency-denominated assets and liabilities (Rd) reflects a gain or loss in purchasing power caused by the difference between the devaluation rate of the Chilean peso and the inflation rate in Chile during the period.
The following example illustrates the calculation of the real interest rate for a U.S. dollar asset bearing a nominal annual interest rate of 10% (Nd = 0.10), assuming a 5% annual devaluation rate (D = 0.05) and a 12% annual inflation rate (I = 0.12):
| ||||
In the example, since the inflation rate was higher than the devaluation rate, the real rate is lower than the nominal rate in dollars. If, for example, the annual devaluation rate were 15%, using the same numbers, the real rate in Chilean pesos would be 12.9%, which is higher than the nominal rate in dollars. Using the same numbers, if the annual inflation rate were greater than 15.5%, the real rate would be negative.
Due to the significant revaluation of the Chilean peso against the U.S. dollar in 20042005 and 20032004 (the published observed exchange rate was Ch$559.83514.21 per U.S. $1.00$1.00 on December 31, 2005 as compared to Ch$559.83 and Ch$599.42 per U.S.$1.00 on December 31, 2004 as compared to Ch$599.42 and Ch$712.38 per U.S. $1.00 on December 31, 2003, and 2002, respectively), and the fact that nominal interest rates and the inflation rate were comparatively low in 20042005 and 2003,2004, most real interest rates on foreign currency assets and liabilities shown in the tables.
tables in “—Selected Statistical Information” are negative for 2005.
Contingent loans (consisting of guarantees and open and unused letters of credit) have been treated as interest bearing assets. Although the nature of the income derived from such assets is similar to a fee, Chilean banking regulations require that such income be accounted for as interest revenue. As a result of this treatment, the comparatively low rates of interest earned on these assets have a distorting effect on the average interest rate earned on total interest earning assets.
The real rate for contingent loans has been stated as the nominal rate, since we do not have an effective funding obligation for these loans. The foreign exchange gains or losses on foreign currency denominated assets and liabilities have not been included in interest revenue or expense. Similarly, interest on financial investments does not include trading gains or losses on these investments.
Nonperforming loans that are not yet 90 days or more overdue have been included in each of the various categories of loans, and therefore affect the various averages. Nonperforming loans consist of loans as to which either principal or interest is overdue (i.e., non accrual loans) and restructured loans earning no interest. Nonperforming loans that are 90 days or more overdue, or past due loans, are shown as a separate category of loans. Interest and/or indexation readjustments received on all non-performing loans during the periods are included as interest revenue.
Included in interbank deposits are current accounts maintained in the Central Bank and overseas banks. Such assets have a distorting effect on the average interest rate earned on total interest earning assets because:
Consequently, the average interest earned on such assets is comparatively low. These deposits are maintained by us in these accounts to comply with statutory requirements and to facilitate international business, rather than to earn income.
The monetary gain or loss on interest earning assets and interest bearing liabilities is not included as a component of interest revenue or interest expense because inflation effects are taken into account in the calculation of real interest rates.
The following tables show, by currency of denomination, average balances and, where applicable, interest amounts, nominal and real rates for our assets and liabilities for the years ended December 31, 2002, 2003, 2004 and 2004:2005:
| Year Ended December 31, | Year Ended December 31, | ||||||||||||||||||||||||||||||||||||||||||||||||||||||||||||||||||||||||||||
| 2002 | 2003 | 2004 | 2003 | 2004 | 2005 | ||||||||||||||||||||||||||||||||||||||||||||||||||||||||||||||||||||||||
| Average balance | Interest earned | Average nominal rate | Average real rate | Average balance | Interest earned | Average nominal rate | Average real rate | Average balance | Interest earned | Average nominal rate | Average real rate | Average balance | Interest earned | Average nominal rate | Average real | Average balance | Interest earned | Average nominal | Average real rate | Average balance | Interest earned | Average nominal | Average real | ||||||||||||||||||||||||||||||||||||||||||||||||||||||
| (in millions of constant Ch$ as of December 31, 2004, except percentages) | (in millions of constant Ch$ as of December 31, 2005, except percentages) | ||||||||||||||||||||||||||||||||||||||||||||||||||||||||||||||||||||||||||||
Assets | |||||||||||||||||||||||||||||||||||||||||||||||||||||||||||||||||||||||||||||
Interest earning assets | |||||||||||||||||||||||||||||||||||||||||||||||||||||||||||||||||||||||||||||
Interbank deposits | |||||||||||||||||||||||||||||||||||||||||||||||||||||||||||||||||||||||||||||
Ch$ | — | — | — | — | — | — | — | — | — | — | — | — | — | — | — | — | — | — | — | — | — | — | — | — | |||||||||||||||||||||||||||||||||||||||||||||||||||||
UF | — | — | — | — | — | — | — | — | — | — | — | — | — | — | — | — | — | — | — | — | — | — | — | — | |||||||||||||||||||||||||||||||||||||||||||||||||||||
Foreign currency | Ch$ | 220,830 | Ch$ | 4,059 | 1.84 | 7.52 | Ch$ | 123,063 | Ch$ | 1,866 | 1.52 | (15.49 | ) | Ch$ | 96,720 | Ch$ | 2,362 | 2.44 | (6.59 | ) | Ch$ | 127,493 | Ch$ | 1,933 | 1.52 | (15.49 | ) | Ch$ | 100,202 | Ch$ | 2,447 | 2.44 | (6.59 | ) | Ch$ | 157,485 | Ch$ | 8,875 | 5.64 | (6.40 | ) | ||||||||||||||||||||||||||||||||||||
Total | 220,830 | 4,059 | 1.84 | 7.52 | 123,063 | 1,866 | 1.52 | (15.49 | ) | 96,720 | 2,362 | 2.44 | (6.59 | ) | 127,493 | 1,933 | 1.52 | (15.49 | ) | 100,202 | 2,447 | 2.44 | (6.59 | ) | 157,485 | 8,875 | 5.64 | (6.40 | ) | ||||||||||||||||||||||||||||||||||||||||||||||||
Financial investments | Financial investments | ||||||||||||||||||||||||||||||||||||||||||||||||||||||||||||||||||||||||||||
Ch$ | 470,666 | 28,043 | 5.96 | 3.05 | 800,071 | 28,387 | 3.55 | 2.45 | 988,338 | 26,278 | 2.66 | 0.22 | 828,873 | 29,407 | 3.55 | 2.45 | 1,023,918 | 27,224 | 2.66 | 0.22 | 712,226 | 24,661 | 3.46 | (0.19 | ) | ||||||||||||||||||||||||||||||||||||||||||||||||||||
UF | 710,289 | 51,606 | 7.27 | 4.32 | 154,201 | 8,064 | 5.23 | 4.12 | 136,411 | 8,332 | 6.11 | 3.59 | 159,752 | 8,354 | 5.23 | 4.12 | 141,322 | 8,632 | 6.11 | 3.59 | 123,044 | 7,623 | 6.20 | 2.45 | |||||||||||||||||||||||||||||||||||||||||||||||||||||
Foreign currency | 703,395 | 54,931 | 7.81 | 13.83 | 869,376 | (56,216 | ) | — | — | 709,463 | 4,833 | 0.68 | (8.19 | ) | 900,674 | (58,240 | ) | — | — | 735,004 | 5,007 | 0.68 | (8.19 | ) | 600,168 | 23,334 | 3.89 | (7.95 | ) | ||||||||||||||||||||||||||||||||||||||||||||||||
Total | 1,884,350 | 134,580 | 7.14 | 7.55 | 1,823,648 | (19,765 | ) | — | — | 1,834,212 | 39,443 | 2.15 | (2.78 | ) | 1,889,299 | (20,479 | ) | — | — | 1,900,244 | 40,863 | 2.15 | (2.78 | ) | 1,435,438 | 55,618 | 3.87 | (3.21 | ) | ||||||||||||||||||||||||||||||||||||||||||||||||
Commercial loans | |||||||||||||||||||||||||||||||||||||||||||||||||||||||||||||||||||||||||||||
Ch$ | 910,467 | 107,101 | 11.76 | 8.70 | 1,154,902 | 107,986 | 9.35 | 8.19 | 1,240,833 | 82,601 | 6.66 | 4.13 | 1,196,480 | 111,876 | 9.35 | 8.19 | 1,285,503 | 85,575 | 6.66 | 4.13 | 1,497,762 | 98,235 | 6.56 | 2.80 | |||||||||||||||||||||||||||||||||||||||||||||||||||||
UF | 1,858,256 | 158,387 | 8.52 | 5.55 | 1,799,963 | 110,067 | 6.11 | 4.99 | 1,924,005 | 139,391 | 7.24 | 4.70 | 1,864,761 | 114,031 | 6.12 | 4.99 | 1,993,269 | 144,409 | 7.24 | 4.70 | 2,483,890 | 205,581 | 8.28 | 4.45 | |||||||||||||||||||||||||||||||||||||||||||||||||||||
Foreign currency | 353,565 | 35,670 | 10.09 | 16.23 | 287,225 | 15,822 | 5.51 | (12.16 | ) | 221,466 | 4,731 | 2.14 | (6.87 | ) | 297,566 | 16,391 | 5.51 | (12.17 | ) | 229,439 | 4,901 | 2.14 | (6.87 | ) | 285,896 | 9,788 | 3.42 | (8.36 | ) | ||||||||||||||||||||||||||||||||||||||||||||||||
Total | 3,122,288 | 301,158 | 9.65 | 7.68 | 3,242,090 | 233,875 | 7.21 | 4.61 | 3,386,304 | 226,723 | 6.70 | 3.73 | 3,358,807 | 242,298 | 7.21 | 4.61 | 3,508,211 | 234,885 | 6.70 | 3.73 | 4,267,548 | 313,604 | 7.35 | 3.01 | |||||||||||||||||||||||||||||||||||||||||||||||||||||
Consumer loans | |||||||||||||||||||||||||||||||||||||||||||||||||||||||||||||||||||||||||||||
Ch$ | 374,660 | 87,719 | 23.41 | 20.03 | 404,652 | 83,100 | 20.54 | 19.26 | 609,856 | 118,557 | 19.44 | 16.61 | 419,219 | 86,091 | 20.54 | 19.26 | 631,811 | 122,825 | 19.44 | 16.61 | 745,754 | 146,254 | 19.61 | 15.39 | |||||||||||||||||||||||||||||||||||||||||||||||||||||
UF | 29,780 | 3,366 | 11.30 | 8.25 | 27,757 | 2,600 | 9.37 | 8.21 | 24,861 | 2,579 | 10.37 | 7.76 | 28,756 | 2,694 | 9.37 | 8.21 | 25,756 | 2,672 | 10.37 | 7.76 | 24,137 | 2,700 | 11.19 | 7.26 | |||||||||||||||||||||||||||||||||||||||||||||||||||||
Foreign currency | — | — | — | — | — | — | — | — | — | — | — | — | — | — | — | — | — | — | — | — | — | — | — | — | |||||||||||||||||||||||||||||||||||||||||||||||||||||
Total | 404,440 | 91,085 | 22.52 | 19.16 | 432,409 | 85,700 | 19.82 | 18.55 | 634,717 | 121,136 | 19.09 | 16.26 | 447,975 | 88,785 | 19.82 | 18.55 | 657,567 | 125,497 | 19.09 | 16.26 | 769,891 | 148,954 | 19.35 | 15.13 | |||||||||||||||||||||||||||||||||||||||||||||||||||||
Interbank loans | |||||||||||||||||||||||||||||||||||||||||||||||||||||||||||||||||||||||||||||
Ch$ | 65,546 | 1,829 | 2.79 | (0.03 | ) | 55,831 | 1,289 | 2.31 | 1.23 | 31,347 | 569 | 1.82 | (0.60 | ) | 57,842 | 1,336 | 2.31 | 1.23 | 32,475 | 589 | 1.81 | (0.60 | ) | 38,272 | 1,347 | 3.52 | (0.14 | ) | |||||||||||||||||||||||||||||||||||||||||||||||||
UF | — | — | — | — | — | — | — | — | — | — | — | — | — | — | — | — | — | — | — | — | — | — | — | — | |||||||||||||||||||||||||||||||||||||||||||||||||||||
Foreign currency | 37,385 | 1,451 | 3.88 | 9.68 | 29,981 | 582 | 1.94 | (15.13 | ) | 13,827 | 251 | 1.82 | (7.16 | ) | 31,060 | 603 | 1.94 | (15.13 | ) | 14,325 | 260 | 1.82 | (7.16 | ) | 1,514 | 76 | 5.02 | (6.95 | ) | ||||||||||||||||||||||||||||||||||||||||||||||||
Total | 102,931 | 3,280 | 3.19 | 3.50 | 85,812 | 1,871 | 2.18 | (4.49 | ) | 45,174 | 820 | 1.82 | (2.61 | ) | 88,902 | 1,939 | 2.18 | (4.49 | ) | 46,800 | 849 | 1.81 | (2.61 | ) | 39,786 | 1,423 | 3.58 | (0.39 | ) | ||||||||||||||||||||||||||||||||||||||||||||||||
Leasing contracts | |||||||||||||||||||||||||||||||||||||||||||||||||||||||||||||||||||||||||||||
Ch$ | 1,273 | 214 | 16.81 | 13.61 | 6,275 | 619 | 9.86 | 8.70 | 15,976 | 1,073 | 6.72 | 4.18 | 6,501 | 641 | 9.86 | 8.70 | 16,551 | 1,112 | 6.72 | 4.19 | 18,132 | 1,607 | 8.86 | 5.02 | |||||||||||||||||||||||||||||||||||||||||||||||||||||
UF | 176,684 | 21,803 | 12.34 | 9.26 | 213,619 | 21,515 | 10.07 | 8.91 | 252,010 | 25,999 | 10.32 | 7.70 | 221,310 | 22,289 | 10.07 | 8.91 | 261,082 | 26,935 | 10.32 | 7.70 | 334,681 | 36,998 | 11.05 | 7.13 | |||||||||||||||||||||||||||||||||||||||||||||||||||||
Foreign currency | 69,715 | 11,190 | 16.05 | 22.53 | 51,977 | (4,793 | ) | — | — | 36,107 | (154 | ) | — | — | 53,848 | (4,965 | ) | — | — | 37,407 | (160 | ) | — | — | 38,407 | (1,344 | ) | — | — | ||||||||||||||||||||||||||||||||||||||||||||||||
Total | 247,672 | 33,207 | 13.41 | 13.02 | 271,871 | 17,341 | 6.38 | 7.20 | 304,093 | 26,918 | 8.85 | 6.60 | 281,659 | 17,965 | 6.38 | 7.20 | 315,040 | 27,887 | 8.85 | 6.60 | 391,220 | 37,261 | 9.52 | 6.34 | |||||||||||||||||||||||||||||||||||||||||||||||||||||
Foreign trade loans | |||||||||||||||||||||||||||||||||||||||||||||||||||||||||||||||||||||||||||||
Ch$ | 6,102 | 288 | 4.72 | 1.85 | 45,733 | 1,979 | 4.33 | 3.22 | 89,130 | 3,090 | 3.47 | 1.01 | 47,380 | 2,051 | 4.33 | 3.22 | 92,339 | 3,201 | 3.47 | 1.01 | 86,638 | 4,027 | 4.65 | 0.95 | |||||||||||||||||||||||||||||||||||||||||||||||||||||
UF | 965 | 48 | 4.97 | 2.10 | 12,975 | 104 | 0.80 | (0.27 | ) | 20,192 | 482 | 2.39 | (0.04 | ) | 13,443 | 107 | 0.80 | (0.27 | ) | 20,919 | 499 | 2.39 | (0.04 | ) | 22,037 | 880 | 3.99 | 0.32 | |||||||||||||||||||||||||||||||||||||||||||||||||
Foreign currency | 626,561 | 4,341 | 0.69 | 6.31 | 611,977 | 2,353 | 0.38 | (16.43 | ) | 573,591 | 16,894 | 2.95 | (6.13 | ) | 634,007 | 2,438 | 0.38 | (16.43 | ) | 594,240 | 17,502 | 2.95 | (6.13 | ) | 524,925 | 20,456 | 3.90 | (7.94 | ) | ||||||||||||||||||||||||||||||||||||||||||||||||
Total | 633,628 | 4,677 | 0.74 | 6.26 | 670,685 | 4,436 | 0.66 | (14.78 | ) | 682,913 | 20,466 | 3.00 | (5.02 | ) | 694,830 | 4,596 | 0.66 | (14.78 | ) | 707,498 | 21,202 | 3.00 | (5.02 | ) | 633,600 | 25,363 | 4.00 | (6.44 | ) | ||||||||||||||||||||||||||||||||||||||||||||||||
Mortgage loans | |||||||||||||||||||||||||||||||||||||||||||||||||||||||||||||||||||||||||||||
Ch$ | — | — | — | — | — | — | — | — | — | — | — | — | — | — | — | — | — | — | — | — | — | — | — | — | |||||||||||||||||||||||||||||||||||||||||||||||||||||
UF | 1,274,401 | 135,497 | 10.63 | 7.60 | 1,186,079 | 109,091 | 9.20 | 8.04 | 1,000,958 | 100,158 | 10.01 | 7.40 | 1,228,778 | 113,018 | 9.20 | 8.04 | 1,036,992 | 103,764 | 10.01 | 7.40 | 721,962 | 82,961 | 11.49 | 7.55 | |||||||||||||||||||||||||||||||||||||||||||||||||||||
Foreign currency | — | — | — | — | — | — | — | — | — | — | — | — | — | — | — | — | — | — | — | — | — | — | — | — | |||||||||||||||||||||||||||||||||||||||||||||||||||||
Total | 1,274,401 | 135,497 | 10.63 | 7.60 | 1,186,079 | 109,091 | 9.20 | 8.04 | 1,000,958 | 100,158 | 10.01 | 7.40 | 1,228,778 | 113,018 | 9.20 | 8.04 | 1,036,992 | 103,764 | 10.01 | 7.40 | 721,962 | 82,961 | 11.49 | 7.55 | |||||||||||||||||||||||||||||||||||||||||||||||||||||
Contingent loans | |||||||||||||||||||||||||||||||||||||||||||||||||||||||||||||||||||||||||||||
Ch$ | 45,627 | 1,590 | 3.48 | 3.48 | 45,663 | 1,587 | 3.48 | 3.48 | 59,726 | 1,744 | 2.92 | 2.92 | 47,307 | 1,644 | 3.48 | 3.48 | 61,876 | 1,807 | 2.92 | 2.92 | 81,586 | 1,683 | 2.06 | 2.06 | |||||||||||||||||||||||||||||||||||||||||||||||||||||
UF | 128,682 | 1,646 | 1.28 | 1.28 | 131,443 | 1,687 | 1.28 | 1.28 | 185,579 | 1,910 | 1.03 | 1.03 | 136,175 | 1,748 | 1.28 | 1.28 | 192,260 | 1,979 | 1.03 | 1.03 | 290,200 | 2,327 | 0.80 | 0.80 | |||||||||||||||||||||||||||||||||||||||||||||||||||||
Foreign currency | 205,214 | 122 | 0.06 | 0.06 | 227,587 | 70 | 0.03 | 0.03 | 231,381 | 76 | 0.03 | 0.03 | 235,780 | 72 | 0.03 | 0.03 | 239,711 | 79 | 0.03 | 0.03 | 242,939 | 339 | 0.14 | 0.14 | |||||||||||||||||||||||||||||||||||||||||||||||||||||
Total | 379,523 | 3,358 | 0.88 | 0.88 | 404,693 | 3,344 | 0.83 | 0.83 | 476,686 | 3,730 | 0.78 | 0.78 | 419,262 | 3,464 | 0.83 | 0.83 | 493,847 | 3,865 | 0.78 | 0.78 | 614,725 | 4,349 | 0.71 | 0.71 | |||||||||||||||||||||||||||||||||||||||||||||||||||||
Past due loans | |||||||||||||||||||||||||||||||||||||||||||||||||||||||||||||||||||||||||||||
Ch$ | 32,450 | 2,576 | 7.94 | 4.98 | 29,086 | 735 | 2.53 | 1.44 | 21,796 | 849 | 3.90 | 1.43 | 30,132 | 761 | 2.53 | 1.44 | 22,581 | 880 | 3.90 | 1.43 | 20,385 | 1,124 | 5.51 | 1.79 | |||||||||||||||||||||||||||||||||||||||||||||||||||||
UF | 105,108 | 402 | 0.38 | (2.37 | ) | 100,137 | 926 | 0.92 | (0.14 | ) | 72,061 | 788 | 1.09 | (1.30 | ) | 103,742 | 959 | 0.92 | (0.14 | ) | 74,655 | 816 | 1.09 | (1.31 | ) | 59,167 | 617 | 1.04 | (2.52 | ) | |||||||||||||||||||||||||||||||||||||||||||||||
Foreign currency | 12,289 | 139 | 1.13 | 6.78 | 9,511 | 2 | 0.02 | (16.73 | ) | 5,105 | (21 | ) | — | — | 9,853 | 2 | 0.02 | (16.73 | ) | 5,289 | (22 | ) | — | — | 2,205 | — | — | — | |||||||||||||||||||||||||||||||||||||||||||||||||
Total | 149,847 | 3,117 | 2.08 | (0.03 | ) | 138,734 | 1,663 | 1.20 | (0.95 | ) | 98,962 | 1,616 | 1.63 | (0.64 | ) | 143,727 | 1,722 | 1.20 | (0.95 | ) | 102,525 | 1,674 | 1.63 | (0.63 | ) | 81,757 | 1,741 | 2.13 | (1.38 | ) | |||||||||||||||||||||||||||||||||||||||||||||||
Total interest earning assets | Total interest earning assets | ||||||||||||||||||||||||||||||||||||||||||||||||||||||||||||||||||||||||||||
Ch$ | 1,906,791 | 229,360 | 12.03 | 8.96 | 2,542,213 | 225,682 | 8.88 | 7.72 | 3,057,002 | 234,761 | 7.68 | 5.12 | 2,633,734 | 233,807 | 8.88 | 7.72 | 3,167,054 | 243,213 | 7.68 | 5.12 | 3,200,755 | 278,938 | 8.71 | 4.88 | |||||||||||||||||||||||||||||||||||||||||||||||||||||
UF | 4,284,165 | 372,755 | 8.70 | 5.72 | 3,626,174 | 254,054 | 7.01 | 5.87 | 3,616,077 | 279,639 | 7.73 | 5.18 | 3,756,717 | 263,200 | 7.01 | 5.87 | 3,746,255 | 289,706 | 7.73 | 5.18 | 4,059,118 | 339,687 | 8.37 | 4.54 | |||||||||||||||||||||||||||||||||||||||||||||||||||||
Foreign currency | 2,228,954 | 111,903 | 5.02 | 10.88 | 2,210,697 | (40,314 | ) | — | — | 1,887,660 | 28,972 | 1.53 | (7.42 | ) | 2,290,281 | (41,766 | ) | — | — | 1,955,617 | 30,014 | 1.53 | (7.42 | ) | 1,853,539 | 61,524 | 3.32 | (8.45 | ) | ||||||||||||||||||||||||||||||||||||||||||||||||
Total | Ch$ | 8,419,910 | Ch$ | 714,018 | 8.48 | % | 7.82 | % | Ch$ | 8,379,084 | Ch$ | 439,422 | 5.24 | % | 4.89 | % | Ch$ | 8,560,739 | Ch$ | 543,372 | 6.35 | % | 2.38 | % | Ch$ | 8,680,732 | Ch$ | 455,241 | 5.24 | % | 4.89 | % | Ch$ | 8,868,926 | Ch$ | 562,933 | 6.35 | % | 2.38 | % | Ch$ | 9,113,412 | Ch$ | 680,149 | 7.46 | % | 2.02 | % | |||||||||||||||||||||||||||||
| Year Ended December 31, | Year Ended December 31, | |||||||||||||||||||||||||||||||||||||||||||||||||||||||||||||||||||
| 2002 | 2003 | 2004 | 2003 | 2004 | 2005 | |||||||||||||||||||||||||||||||||||||||||||||||||||||||||||||||
| Average balance | Interest earned | Average nominal rate | Average real rate | Average balance | Interest earned | Average nominal rate | Average real rate | Average balance | Interest earned | Average nominal rate | Average real rate | Average balance | Interest earned | Average nominal rate | Average real | Average balance | Interest earned | Average nominal rate | Average real rate | Average balance | Interest earned | Average nominal rate | Average real | |||||||||||||||||||||||||||||||||||||||||||||
| (in millions of constant Ch$ as of December 31, 2004, except percentages) | (in millions of constant Ch$ as of December 31, 2005, except percentages) | |||||||||||||||||||||||||||||||||||||||||||||||||||||||||||||||||||
Assets | ||||||||||||||||||||||||||||||||||||||||||||||||||||||||||||||||||||
Non–interest earning assets | ||||||||||||||||||||||||||||||||||||||||||||||||||||||||||||||||||||
Cash and due from banks | ||||||||||||||||||||||||||||||||||||||||||||||||||||||||||||||||||||
Ch$ | Ch$ | 507,116 | — | — | — | Ch$ | 542,256 | — | — | — | Ch$ | 517,795 | — | — | Ch$ | 561,777 | — | — | — | Ch$ | 536,436 | — | — | — | Ch$ | 511,576 | — | — | — | |||||||||||||||||||||||||||||||||||||||
UF | 392 | — | — | — | — | — | — | — | — | — | — | — | — | — | — | — | — | — | — | — | — | — | — | |||||||||||||||||||||||||||||||||||||||||||||
Foreign currency | 69,523 | — | — | — | 115,660 | — | — | — | 147,087 | — | — | — | 119,824 | — | — | — | 152,382 | — | — | — | 259,398 | — | — | — | ||||||||||||||||||||||||||||||||||||||||||||
Total | 577,031 | — | — | — | 657,916 | — | — | — | 664,882 | — | — | — | 681,601 | — | — | — | 688,818 | — | — | — | 770,974 | — | — | — | ||||||||||||||||||||||||||||||||||||||||||||
Allowances for loan losses | ||||||||||||||||||||||||||||||||||||||||||||||||||||||||||||||||||||
Ch$ | (228,158 | ) | — | — | — | (196,630 | ) | — | — | — | (163,835 | ) | — | — | — | (203,710 | ) | — | — | — | (169,733 | ) | — | — | — | (138,976 | ) | — | — | — | ||||||||||||||||||||||||||||||||||||||
UF | — | — | — | — | — | — | — | — | — | — | — | — | — | — | — | — | — | — | — | — | — | — | — | — | ||||||||||||||||||||||||||||||||||||||||||||
Foreign currency | (4,011 | ) | — | — | — | (3,946 | ) | — | — | — | (1,955 | ) | — | — | — | (4,087 | ) | — | — | — | (2,025 | ) | — | — | — | (1,462 | ) | — | — | — | ||||||||||||||||||||||||||||||||||||||
Total | (232,169 | ) | — | — | — | (200,576 | ) | — | — | — | (165,790 | ) | — | — | — | (207,797 | ) | — | — | — | (171,758 | ) | — | — | — | (140,438 | ) | — | — | — | ||||||||||||||||||||||||||||||||||||||
Fixed assets | ||||||||||||||||||||||||||||||||||||||||||||||||||||||||||||||||||||
Ch$ | 147,695 | — | — | — | 135,929 | — | — | — | 128,070 | — | — | — | 140,823 | — | — | — | 132,681 | — | — | — | 135,487 | — | — | — | ||||||||||||||||||||||||||||||||||||||||||||
UF | — | — | — | — | — | — | — | — | — | — | — | — | — | — | — | — | — | — | — | — | — | — | — | — | ||||||||||||||||||||||||||||||||||||||||||||
Foreign currency | 1,754 | — | — | — | 1,436 | — | — | — | 812 | — | — | — | 1,488 | — | — | — | 841 | — | — | — | 1,649 | — | — | — | ||||||||||||||||||||||||||||||||||||||||||||
Total | 149,449 | — | — | — | 137,365 | — | — | — | 128,882 | — | — | — | 142,311 | — | — | — | 133,522 | — | — | — | 137,136 | — | — | — | ||||||||||||||||||||||||||||||||||||||||||||
Other assets | ||||||||||||||||||||||||||||||||||||||||||||||||||||||||||||||||||||
Ch$ | 244,798 | — | — | — | 217,865 | — | — | — | 306,916 | — | — | — | 225,708 | — | — | — | 317,965 | — | — | — | 338,691 | — | — | — | ||||||||||||||||||||||||||||||||||||||||||||
UF | 1,078 | — | — | — | 1,247 | — | — | — | 1,229 | — | — | — | 1,290 | — | — | — | 1,273 | — | — | — | 1,356 | — | — | — | ||||||||||||||||||||||||||||||||||||||||||||
Foreign currency | 132,096 | — | — | — | 66,820 | — | — | — | 104,368 | — | — | — | 69,225 | — | — | — | 108,125 | — | — | — | 104,386 | — | — | — | ||||||||||||||||||||||||||||||||||||||||||||
Total | 377,972 | — | — | — | 285,932 | — | — | — | 412,513 | — | — | — | 296,223 | — | — | — | 427,363 | — | — | — | 444,433 | — | — | — | ||||||||||||||||||||||||||||||||||||||||||||
Total non–interest earning assets | ||||||||||||||||||||||||||||||||||||||||||||||||||||||||||||||||||||
Ch$ | 671,451 | — | — | — | 699,420 | — | — | — | 788,946 | — | — | — | 724,598 | — | — | — | 817,349 | — | — | — | 846,778 | — | — | — | ||||||||||||||||||||||||||||||||||||||||||||
UF | 1,470 | — | — | — | 1,247 | — | — | — | 1,229 | — | — | — | 1,290 | — | — | — | 1,273 | — | — | — | 1,356 | — | — | — | ||||||||||||||||||||||||||||||||||||||||||||
Foreign currency | 199,362 | — | — | — | 179,970 | — | — | — | 250,312 | — | — | — | 186,450 | — | — | — | 259,323 | — | — | — | 363,971 | — | — | — | ||||||||||||||||||||||||||||||||||||||||||||
Total | 872,283 | — | — | — | 880,637 | — | — | — | 1,040,487 | — | — | — | 912,338 | — | — | — | 1,077,945 | — | — | — | 1,212,105 | — | — | — | ||||||||||||||||||||||||||||||||||||||||||||
Total assets | ||||||||||||||||||||||||||||||||||||||||||||||||||||||||||||||||||||
Ch$ | 2,578,242 | Ch$ | 229,360 | — | — | 3,241,633 | Ch$ | 225,682 | — | — | 3,845,948 | Ch$ | 234,761 | — | — | Ch$ | 3,358,332 | Ch$ | 233,807 | — | — | Ch$ | 3,984,403 | Ch$ | 243,213 | — | — | Ch$ | 4,047,533 | Ch$ | 278,938 | — | — | |||||||||||||||||||||||||||||||||||
UF | 4,285,635 | 372,755 | — | — | 3,627,421 | 254,054 | — | — | 3,617,306 | 279,639 | — | — | 3,758,007 | 263,200 | — | — | 3,747,528 | 289,706 | — | — | 4,060,474 | 339,687 | — | — | ||||||||||||||||||||||||||||||||||||||||||||
Foreign currency | 2,428,316 | 111,903 | — | — | 2,390,667 | (40,314 | ) | — | — | 2,137,972 | 28,972 | — | — | 2,476,731 | (41,766 | ) | — | — | 2,214,940 | 30,014 | — | — | 2,217,510 | 61,524 | — | — | ||||||||||||||||||||||||||||||||||||||||||
Total | Ch$ | 9,292,193 | Ch$ | 714,018 | — | — | Ch$ | 9,259,721 | Ch$ | 439,422 | — | — | Ch$ | 9,601,226 | Ch$ | 543,372 | — | — | Ch$ | 9,593,070 | Ch$ | 455,241 | — | — | Ch$ | 9,946,871 | Ch$ | 562,933 | — | — | Ch$ | 10,325,517 | Ch$ | 680,149 | — | — | ||||||||||||||||||||||||||||||||
| Year Ended December 31, | Year Ended December 31, | |||||||||||||||||||||||||||||||||||||||||||||||||||||||||||||||||||||||
| 2002 | 2003 | 2004 | 2003 | 2004 | 2005 | |||||||||||||||||||||||||||||||||||||||||||||||||||||||||||||||||||
| Average balance | Interest paid | Average nominal rate | Average real rate | Average balance | Interest paid | Average nominal rate | Average real rate | Average balance | Interest paid | Average nominal rate | Average real rate | Average balance | Interest paid | Average nominal rate | Average real rate | Average balance | Interest paid | Average nominal rate | Average real rate | Average balance | Interest paid | Average nominal rate | Average real | |||||||||||||||||||||||||||||||||||||||||||||||||
| (in millions of constant Ch$ as of December 31, 2004, except percentages) | (in millions of constant Ch$ as of December 31, 2005, except percentages) | |||||||||||||||||||||||||||||||||||||||||||||||||||||||||||||||||||||||
Liabilities | ||||||||||||||||||||||||||||||||||||||||||||||||||||||||||||||||||||||||
Interest bearing liabilities | ||||||||||||||||||||||||||||||||||||||||||||||||||||||||||||||||||||||||
Interest bearing demand deposits | ||||||||||||||||||||||||||||||||||||||||||||||||||||||||||||||||||||||||
Ch$ | — | — | — | — | — | — | — | — | — | — | — | — | — | — | — | — | — | — | — | — | — | — | — | — | ||||||||||||||||||||||||||||||||||||||||||||||||
UF | — | — | — | — | — | — | — | — | — | — | — | — | — | — | — | — | — | — | — | — | — | — | — | — | ||||||||||||||||||||||||||||||||||||||||||||||||
Foreign currency | — | — | — | — | — | — | — | — | — | — | — | — | — | — | — | — | — | — | — | — | — | — | — | — | ||||||||||||||||||||||||||||||||||||||||||||||||
Total | — | — | — | — | — | — | — | — | — | — | — | — | — | — | — | — | — | — | — | — | — | — | — | — | ||||||||||||||||||||||||||||||||||||||||||||||||
Savings accounts | ||||||||||||||||||||||||||||||||||||||||||||||||||||||||||||||||||||||||
Ch$ | — | — | — | — | — | — | — | — | — | — | — | — | — | — | — | — | — | — | — | — | — | — | — | — | ||||||||||||||||||||||||||||||||||||||||||||||||
UF | Ch$ | 173,446 | Ch$ | 7,412 | 4.27 | 1.41 | Ch$ | 176,967 | Ch$ | 2,987 | 1.69 | 0.61 | Ch$ | 146,778 | Ch$ | 3,256 | 2.22 | (0.21 | ) | Ch$ | 183,338 | Ch$ | 3,094 | 1.69 | 0.61 | Ch$ | 152,062 | Ch$ | 3,373 | 2.22 | (0.21 | ) | Ch$ | 139,267 | Ch$ | 5,350 | 3.84 | 0.18 | ||||||||||||||||||||||||||||||||||
Foreign currency | — | — | — | — | — | — | — | — | — | — | — | — | — | — | — | — | — | — | — | — | — | — | — | — | ||||||||||||||||||||||||||||||||||||||||||||||||
Total | 173,446 | 7,412 | 4.27 | 1.41 | 176,967 | 2,987 | 1.69 | 0.61 | 146,778 | 3,256 | 2.22 | (0.21 | ) | 183,338 | 3,094 | 1.69 | 0.61 | 152,062 | 3,373 | 2.22 | (0.21 | ) | 139,267 | 5,350 | 3.84 | 0.18 | ||||||||||||||||||||||||||||||||||||||||||||||
Time deposits | ||||||||||||||||||||||||||||||||||||||||||||||||||||||||||||||||||||||||
Ch$ | 1,858,926 | 91,168 | 4.90 | 2.03 | 1,792,100 | 63,297 | 3.53 | 2.44 | 1,905,554 | 44,952 | 2.36 | (0.07 | ) | 1,856,616 | 65,576 | 3.53 | 2.44 | 1,974,154 | 46,570 | 2.36 | (0.07 | ) | 2,194,900 | 88,141 | 4.02 | 0.34 | ||||||||||||||||||||||||||||||||||||||||||||||
UF | 966,785 | 50,722 | 5.25 | 2.36 | 798,875 | 19,248 | 2.41 | 1.33 | 710,255 | 26,223 | 3.69 | 1.23 | 827,634 | 19,941 | 2.41 | 1.33 | 735,824 | 27,167 | 3.69 | 1.23 | 1,038,348 | 58,410 | 5.63 | 1.90 | ||||||||||||||||||||||||||||||||||||||||||||||||
Foreign currency | 815,195 | 6,763 | 0.83 | 6.46 | 822,976 | 3,473 | 0.42 | (16.40 | ) | 850,227 | 14,460 | 1.70 | (7.26 | ) | 852,603 | 3,599 | 0.42 | (16.40 | ) | 880,835 | 14,981 | 1.70 | (7.26 | ) | 700,873 | 21,467 | 3.06 | (8.68 | ) | |||||||||||||||||||||||||||||||||||||||||||
Total | 3,640,906 | 148,653 | 4.08 | 3.11 | 3,413,951 | 86,018 | 2.52 | (2.36 | ) | 3,466,036 | 85,635 | 2.47 | (1.57 | ) | 3,536,853 | 89,116 | 2.52 | (2.36 | ) | 3,590,813 | 88,718 | 2.47 | (1.57 | ) | 3,934,121 | 168,018 | 4.27 | (0.85 | ) | |||||||||||||||||||||||||||||||||||||||||||
Central Bank borrowings | ||||||||||||||||||||||||||||||||||||||||||||||||||||||||||||||||||||||||
Ch$ | 58,541 | 1,945 | 3.32 | 0.49 | 65,862 | 1,544 | 2.34 | 1.26 | 78,128 | 1,695 | 2.17 | (0.25 | ) | 8,852 | 229 | 2.59 | 1.50 | 10,427 | 215 | 2.06 | (0.36 | ) | 30,230 | 953 | 3.15 | (0.49 | ) | |||||||||||||||||||||||||||||||||||||||||||||
UF | 4,133 | 368 | 8.90 | 5.92 | 3,393 | 201 | 5.92 | 4.80 | 2,594 | 154 | 5.94 | 3.42 | 3,515 | 208 | 5.92 | 4.80 | 2,405 | 153 | 6.36 | 3.84 | 1,592 | 95 | 5.97 | 2.23 | ||||||||||||||||||||||||||||||||||||||||||||||||
Foreign currency | — | — | — | — | 694 | 18 | 2.59 | (14.59 | ) | 9,537 | 207 | 2.17 | (6.84 | ) | — | — | — | — | — | — | — | — | — | — | — | — | ||||||||||||||||||||||||||||||||||||||||||||||
Total | 62,674 | 2,313 | 3.69 | 0.85 | 69,949 | 1,763 | 2.52 | 1.28 | 90,259 | 2,056 | 2.28 | (0.84 | ) | 12,367 | 437 | 3.53 | 2.44 | 12,832 | 368 | 2.87 | 0.43 | 31,822 | 1,048 | 3.29 | (0.35 | ) | ||||||||||||||||||||||||||||||||||||||||||||||
Repurchase agreements | ||||||||||||||||||||||||||||||||||||||||||||||||||||||||||||||||||||||||
Ch$ | 217,715 | 6,031 | 2.77 | (0.05 | ) | 218,500 | 5,262 | 2.41 | 1.32 | 328,898 | 4,000 | 1.22 | (1.19 | ) | 226,366 | 5,451 | 2.41 | 1.32 | 340,738 | 4,144 | 1.22 | (1.19 | ) | 195,809 | 5,391 | 2.75 | (0.87 | ) | ||||||||||||||||||||||||||||||||||||||||||||
UF | 5,376 | 99 | 1.84 | (0.95 | ) | 25,397 | 4 | 0.02 | (1.04 | ) | 798 | — | — | — | 26,311 | 4 | 0.02 | (1.04 | ) | �� | 827 | — | — | — | 1,261 | 1 | 0.08 | (3.45 | ) | |||||||||||||||||||||||||||||||||||||||||||
Foreign currency | 161,716 | 6,791 | 4.20 | 10.02 | 115,826 | 3,649 | 3.15 | (14.13 | ) | 95,136 | 3,811 | 4.01 | (5.16 | ) | 119,996 | 3,779 | 3.15 | (14.13 | ) | 98,561 | 3,948 | 4.01 | (5.16 | ) | 101,477 | 4,499 | 4.43 | (7.46 | ) | |||||||||||||||||||||||||||||||||||||||||||
Total | 384,807 | 12,921 | 3.36 | 4.17 | 359,723 | 8,915 | 2.48 | (3.82 | ) | 424,832 | 7,811 | 1.84 | (2.07 | ) | 372,673 | 9,234 | 2.48 | (3.82 | ) | 440,126 | 8,092 | 1.84 | (2.07 | ) | 298,547 | 9,891 | 3.31 | (3.13 | ) | |||||||||||||||||||||||||||||||||||||||||||
Mortgage finance bonds | ||||||||||||||||||||||||||||||||||||||||||||||||||||||||||||||||||||||||
Ch$ | — | — | — | — | — | — | — | — | — | — | — | — | — | — | — | — | — | — | — | — | — | — | — | — | ||||||||||||||||||||||||||||||||||||||||||||||||
UF | 1,312,999 | 122,467 | 9.33 | 6.33 | 1,051,414 | 77,613 | 7.38 | 6.24 | 914,065 | 74,721 | 8.17 | 5.61 | 1,089,265 | 80,407 | 7.38 | 6.24 | 946,971 | 77,411 | 8.17 | 5.61 | 616,794 | 50,553 | 8.20 | 4.38 | ||||||||||||||||||||||||||||||||||||||||||||||||
Foreign currency | — | — | — | — | — | — | — | — | — | — | — | — | — | — | — | — | — | — | — | — | — | — | — | — | ||||||||||||||||||||||||||||||||||||||||||||||||
Total | 1,312,999 | 122,467 | 9.33 | 6.33 | 1,051,414 | 77,613 | 7.38 | 6.24 | 914,065 | 74,721 | 8.17 | 5.61 | 1,089,265 | 80,407 | 7.38 | 6.24 | 946,971 | 77,411 | 8.17 | 5.61 | 616,794 | 50,553 | 8.20 | 4.38 | ||||||||||||||||||||||||||||||||||||||||||||||||
Other interest bearing liabilities(1) | ||||||||||||||||||||||||||||||||||||||||||||||||||||||||||||||||||||||||
Other interest bearing liabilities(1) | ||||||||||||||||||||||||||||||||||||||||||||||||||||||||||||||||||||||||
Ch$ | 37,361 | 4,943 | 13.23 | 10.12 | 44,380 | 8,342 | 18.80 | 17.54 | 57,408 | 617 | 1.07 | (1.32 | ) | 105,358 | 10,013 | 9.50 | 8.34 | 129,988 | 2,180 | 1.68 | (0.74 | ) | 166,123 | 2,884 | 1.74 | (1.86 | ) | |||||||||||||||||||||||||||||||||||||||||||||
UF | 327,661 | 30,542 | 9.32 | 6.32 | 300,127 | 22,861 | 7.62 | 6.48 | 325,252 | 30,795 | 9.47 | 6.87 | 310,932 | 23,684 | 7.62 | 6.48 | 337,243 | 31,911 | 9.46 | 6.87 | 535,715 | 53,569 | 10.00 | 6.12 | ||||||||||||||||||||||||||||||||||||||||||||||||
Foreign currency | 410,257 | 4,221 | 1.03 | 6.67 | 696,406 | 841 | 0.12 | (16.65 | ) | 663,297 | 10,009 | 1.51 | (7.44 | ) | 722,195 | 891 | 0.12 | (16.65 | ) | 697,056 | 10,583 | 1.52 | (7.43 | ) | 759,488 | 19,038 | 2.51 | (9.17 | ) | |||||||||||||||||||||||||||||||||||||||||||
Total | 775,279 | 39,706 | 5.12 | 6.69 | 1,040,913 | 32,044 | 3.08 | (8.52 | ) | 1,045,957 | 41,421 | 3.96 | (2.65 | ) | 1,138,485 | 34,588 | 3.04 | (8.02 | ) | 1,164,287 | 44,674 | 3.84 | (2.54 | ) | 1,461,326 | 75,491 | 5.17 | (2.74 | ) | |||||||||||||||||||||||||||||||||||||||||||
Total interest bearing liabilities | ||||||||||||||||||||||||||||||||||||||||||||||||||||||||||||||||||||||||
Ch$ | 2,172,543 | 104,087 | 4.79 | 1.92 | 2,120,842 | 78,445 | 3.70 | 2.60 | 2,369,988 | 51,264 | 2.16 | (0.26 | ) | 2,197,192 | 81,269 | 3.70 | 2.60 | 2,455,307 | 53,109 | 2.16 | (0.26 | ) | 2,587,062 | 97,369 | 3.76 | 0.10 | ||||||||||||||||||||||||||||||||||||||||||||||
UF | 2,790,400 | 211,610 | 7.58 | 4.63 | 2,356,173 | 122,914 | 5.22 | 4.10 | 2,099,742 | 135,149 | 6.44 | 3.91 | 2,440,995 | 127,338 | 5.22 | 4.10 | 2,175,332 | 140,015 | 6.44 | 3.91 | 2,332,977 | 167,978 | 7.20 | 3.42 | ||||||||||||||||||||||||||||||||||||||||||||||||
Foreign currency | 1,387,168 | 17,775 | 1.28 | 6.94 | 1,635,902 | 7,981 | 0.49 | (16.34 | ) | 1,618,197 | 28,487 | 1.76 | (7.21 | ) | 1,694,794 | 8,269 | 0.49 | (16.34 | ) | 1,676,452 | 29,512 | 1.76 | (7.21 | ) | 1,561,838 | 45,004 | 2.88 | (8.84 | ) | |||||||||||||||||||||||||||||||||||||||||||
Total | Ch$ | 6,350,111 | Ch$ | 333,472 | 5.25 | % | 4.21 | % | Ch$ | 6,112,917 | Ch$ | 209,340 | 3.42 | % | (1.89 | )% | Ch$ | 6,087,927 | Ch$ | 214,900 | 3.53 | % | (0.67 | )% | Ch$ | 6,332,981 | Ch$ | 216,876 | 3.42 | % | (1.89 | )% | Ch$ | 6,307,091 | Ch$ | 222,636 | 3.53 | % | (0.67 | )% | Ch$ | 6,481,877 | Ch$ | 310,351 | 4.79 | % | (0.86 | )% | ||||||||||||||||||||||||
| (1) | Other interest bearing liabilities primarily include foreign borrowings, subordinated bonds, bonds and borrowings from domestic financial institutions. |
| Year Ended December 31, | Year Ended December 31, | |||||||||||||||||||||||||||||||||||||||||||||||||||||||||||
| 2002 | 2003 | 2004 | 2003 | 2004 | 2005 | |||||||||||||||||||||||||||||||||||||||||||||||||||||||
| Average balance | Interest paid | Average nominal rate | Average real rate | Average balance | Interest paid | Average nominal rate | Average real rate | Average balance | Interest paid | Average nominal rate | Average real rate | Average balance | Interest paid | Average nominal rate | Average real rate | Average balance | Interest paid | Average nominal rate | Average real | Average balance | Interest paid | Average nominal rate | Average real | |||||||||||||||||||||||||||||||||||||
| (in millions of constant Ch$ as of December 31, 2004, except percentages) | (in millions of constant Ch$ as of December 31, 2005, except percentages) | |||||||||||||||||||||||||||||||||||||||||||||||||||||||||||
Liabilities | ||||||||||||||||||||||||||||||||||||||||||||||||||||||||||||
Non–interest bearing liabilities | ||||||||||||||||||||||||||||||||||||||||||||||||||||||||||||
Non–interest bearing demand deposits | ||||||||||||||||||||||||||||||||||||||||||||||||||||||||||||
Ch$ | Ch$ | 1,237,288 | — | — | — | Ch$ | 1,394,440 | — | — | — | Ch$ | 1,519,407 | — | — | — | Ch$ | 1,444,641 | — | — | — | Ch$ | 1,574,106 | — | — | — | Ch$ | 1,672,191 | — | — | — | ||||||||||||||||||||||||||||||
UF | 13,598 | — | — | — | 11,734 | — | — | — | 35,955 | — | — | — | 12,157 | — | — | — | 37,249 | — | — | — | 13,500 | — | — | — | ||||||||||||||||||||||||||||||||||||
Foreign currency | 382,692 | — | — | — | 467,453 | — | — | — | 533,147 | — | — | — | 484,281 | — | — | — | 552,340 | — | — | — | 500,135 | — | — | — | ||||||||||||||||||||||||||||||||||||
Total | 1,633,578 | — | — | — | 1,873,627 | — | — | — | 2,088,509 | — | — | — | 1,941,079 | — | — | — | 2,163,695 | — | — | — | 2,185,826 | — | — | — | ||||||||||||||||||||||||||||||||||||
Contingent liabilities | ||||||||||||||||||||||||||||||||||||||||||||||||||||||||||||
Ch$ | 45,571 | — | — | — | 45,536 | — | — | — | 59,499 | — | — | — | 47,176 | — | — | — | 61,641 | — | — | — | 81,427 | — | — | — | ||||||||||||||||||||||||||||||||||||
UF | 128,543 | — | — | — | 131,025 | — | — | — | 185,273 | — | — | — | 135,742 | — | — | — | 191,943 | — | — | — | 289,737 | — | — | — | ||||||||||||||||||||||||||||||||||||
Foreign currency | 205,645 | — | — | — | 228,123 | — | — | — | 233,579 | — | — | — | 236,335 | — | — | — | 241,988 | — | — | — | 245,211 | — | — | — | ||||||||||||||||||||||||||||||||||||
Total | 379,759 | — | — | — | 404,684 | — | — | — | 478,351 | — | — | — | 419,253 | — | — | — | 495,572 | — | — | — | 616,375 | — | — | — | ||||||||||||||||||||||||||||||||||||
Other non–interest bearing | — | — | — | — | — | — | ||||||||||||||||||||||||||||||||||||||||||||||||||||||
Ch$ | 114,569 | — | — | — | 110,122 | — | — | — | 193,742 | — | — | — | 114,085 | — | — | — | 200,719 | — | — | — | 237,192 | — | — | — | ||||||||||||||||||||||||||||||||||||
UF | 4,938 | — | — | — | 3,812 | — | — | — | 4,816 | — | — | — | 3,949 | — | — | — | 4,990 | — | — | — | 6,939 | — | — | — | ||||||||||||||||||||||||||||||||||||
Foreign currency | 182,060 | — | — | — | 85,864 | — | — | — | 99,956 | — | — | — | 88,955 | — | — | — | 103,554 | — | — | — | 119,530 | — | — | — | ||||||||||||||||||||||||||||||||||||
Total | 301,567 | — | — | — | 199,798 | — | — | — | 298,514 | — | — | — | 206,989 | — | — | — | 309,263 | — | — | — | 363,661 | — | — | — | ||||||||||||||||||||||||||||||||||||
Shareholders’ equity | ||||||||||||||||||||||||||||||||||||||||||||||||||||||||||||
Ch$ | 627,178 | — | — | — | 668,695 | — | — | — | 647,925 | — | — | — | 692,768 | — | — | — | 671,250 | — | — | — | 677,778 | — | — | — | ||||||||||||||||||||||||||||||||||||
UF | — | — | — | — | — | — | — | — | — | — | — | — | — | — | — | — | — | — | — | — | — | — | — | — | ||||||||||||||||||||||||||||||||||||
Foreign currency | — | — | — | — | — | — | — | — | — | — | — | — | — | — | — | — | — | — | — | — | — | — | — | — | ||||||||||||||||||||||||||||||||||||
Total | 627,178 | — | — | — | 668,695 | — | — | — | 647,925 | — | — | — | 692,768 | — | — | — | 671,250 | — | — | — | 677,778 | — | — | — | ||||||||||||||||||||||||||||||||||||
Total non–interest bearing liabilities and shareholders’ equity | ||||||||||||||||||||||||||||||||||||||||||||||||||||||||||||
Ch$ | 2,024,606 | — | — | — | 2,218,793 | — | — | — | 2,420,573 | — | — | — | 2,298,670 | — | — | — | 2,507,716 | — | — | — | 2,668,588 | — | — | — | ||||||||||||||||||||||||||||||||||||
UF | 147,079 | — | — | — | 146,571 | — | — | — | 226,044 | — | — | — | 151,848 | — | — | — | 234,182 | — | — | — | 310,176 | — | — | — | ||||||||||||||||||||||||||||||||||||
Foreign currency | 770,397 | — | — | — | 781,440 | — | — | — | 866,682 | — | — | — | 809,571 | — | — | — | 897,882 | — | — | — | 864,876 | — | — | — | ||||||||||||||||||||||||||||||||||||
Total | 2,942,082 | — | — | — | 3,146,804 | — | — | — | 3,513,299 | — | — | — | 3,260,089 | — | — | — | 3,639,780 | — | — | — | 3,843,640 | — | — | — | ||||||||||||||||||||||||||||||||||||
Total liabilities and shareholders’ equity | ||||||||||||||||||||||||||||||||||||||||||||||||||||||||||||
Ch$ | 4,197,149 | Ch$ | 104,087 | — | — | 4,339,635 | Ch$ | 78,445 | — | — | 4,790,561 | Ch$ | 51,264 | — | — | 4,495,862 | 81,269 | — | — | 4,963,023 | 53,109 | — | — | 5,255,650 | 97,369 | — | — | |||||||||||||||||||||||||||||||||
UF | 2,937,479 | 211,610 | — | — | 2,502,744 | 122,914 | — | — | 2,325,786 | 135,149 | — | — | 2,592,843 | 127,338 | — | — | 2,409,514 | 140,015 | — | — | 2,643,153 | 167,978 | — | — | ||||||||||||||||||||||||||||||||||||
Foreign currency | 2,157,565 | 17,775 | — | — | 2,417,342 | 7,981 | — | — | 2,484,879 | 28,487 | — | — | 2,504,365 | 8,269 | — | — | 2,574,334 | 29,512 | — | — | 2,426,714 | 45,004 | — | — | ||||||||||||||||||||||||||||||||||||
Total | Ch$ | 9,292,193 | Ch$ | 333,472 | — | — | Ch$ | 9,259,721 | Ch$ | 209,340 | — | — | Ch$ | 9,601,226 | Ch$ | 214,900 | — | — | Ch$ | 9,593,070 | Ch$ | 216,876 | — | — | Ch$ | 9,946,871 | Ch$ | 222,636 | — | — | Ch$ | 10,325,517 | Ch$ | 310,351 | — | — | ||||||||||||||||||||||||
Interest Earning Assets and Net Interest Margin
The following table analyzes, by currency of denomination, the levels of our average interest earning assets and net interest, and illustrates the comparative margins obtained, for each of the periods indicated.
| Year Ended December 31, | Year Ended December 31, | |||||||||||||||||||||||
| 2002 | 2003 | 2004 | 2003 | 2004 | 2005 | |||||||||||||||||||
| (in millions of constant Ch$ as of December 31, 2004, except for percentages) | (in millions of constant Ch$ as of December 31, 2005, except for percentages) | |||||||||||||||||||||||
Total average interest earning assets | ||||||||||||||||||||||||
Ch$ | Ch$ | 1,906,791 | Ch$ | 2,542,213 | Ch$ | 3,057,002 | Ch$ | 2,633,734 | Ch$ | 3,167,054 | Ch$ | 3,200,755 | ||||||||||||
UF | 4,284,165 | 3,626,174 | 3,616,077 | 3,756,717 | 3,746,255 | 4,059,118 | ||||||||||||||||||
Foreign currency | 2,228,954 | 2,210,697 | 1,887,660 | 2,290,281 | 1,955,617 | 1,853,539 | ||||||||||||||||||
Total | 8,419,910 | 8,379,084 | 8,560,739 | 8,680,732 | 8,868,926 | 9,113,412 | ||||||||||||||||||
Net interest earned(1) | ||||||||||||||||||||||||
Net interest earned(1) | ||||||||||||||||||||||||
Ch$ | 125,273 | 147,237 | 183,497 | 152,538 | 190,104 | 181,569 | ||||||||||||||||||
UF | 161,145 | 131,140 | 144,490 | 135,862 | 149,691 | 171,709 | ||||||||||||||||||
Foreign currency | 94,128 | (48,295 | ) | 485 | (50,035 | ) | 502 | 16,520 | ||||||||||||||||
Total | Ch$ | 380,546 | Ch$ | 230,082 | Ch$ | 328,472 | Ch$ | 238,365 | Ch$ | 340,297 | Ch$ | 369,798 | ||||||||||||
Net interest margin, nominal basis(2) | ||||||||||||||||||||||||
Net interest margin, nominal basis(2) | ||||||||||||||||||||||||
Ch$ | 6.57 | % | 5.79 | % | 6.00 | % | 5.79 | % | 6.00 | % | 5.67 | % | ||||||||||||
UF | 3.76 | 3.62 | 4.00 | 3.62 | 4.00 | 4.23 | ||||||||||||||||||
Foreign currency | 4.22 | (2.18 | ) | 0.03 | (2.18 | ) | 0.03 | 0.89 | ||||||||||||||||
Total | 4.52 | % | 2.75 | % | 3.84 | % | 2.75 | % | 3.84 | % | 4.06 | % | ||||||||||||
| (1) | Net interest earned is defined as interest revenue earned less interest expense incurred. |
| (2) | Net interest margin, nominal basis is defined as net interest earned divided by average interest earning assets. |
Changes in Net Interest Revenue—Volume and Rate Analysis
The following tables compare, by currency of denomination, changes in our net interest revenue between 2004 and 2005 and between 2003 and 2004 and between 2002 and 2003 caused by (1)(i) changes in the average volume of interest earning assets and interest bearing liabilities and (2)(ii) changes in their respective nominal interest rates. Volume and rate variances have been calculated based on movements in average balances over the period and changes in nominal interest rate, average interest earning assets and average interest bearing liabilities. The net change attributable to changes in both volume and rate has been allocated proportionately to the change in volume and the change in rate.
Assets Interest earning assets Interbank deposits Ch$ UF Foreign currency Total Financial investments Ch$ UF Foreign currency Total Commercial loans Ch$ UF Foreign currency Total Consumer loans Ch$ UF Foreign currency Total Interbank loans Ch$ UF Foreign currency Total Leasing contracts Ch$ UF Foreign currency Total Foreign trade loans Ch$ UF Foreign currency Total Mortgage loans Ch$ UF Foreign currency Total Contingent loans Ch$ UF Foreign currency Total Past due loans Ch$ UF Foreign currency Total Total interest earning assets Ch$ UF Foreign currency Total Increase (Decrease) from 2002 to
2003 due to changes in Net change
from 2002 to
2003 Increase (Decrease) from 2003
to 2004 due to changes in Net change
from 2003 to
2004 Volume Rate Volume Rate (in millions of constant Ch$ as of December 31, 2004) — — — — — — — — — — — — Ch$ (1,572 ) Ch$ (621 ) Ch$ (2,193 ) Ch$ (463 ) Ch$ 959 Ch$ 496 (1,572 ) (621 ) (2,193 ) (463 ) 959 496 14,595 (14,251 ) 344 5,869 (7,978 ) (2,109 ) (32,065 ) (11,477 ) (43,542 ) (994 ) 1,262 268 10,487 (121,634 ) (111,147 ) — 61,049 61,049 (6,983 ) (147,362 ) (154,345 ) 4,875 54,333 59,208 25,410 (24,525 ) 885 7,560 (32,945 ) (25,385 ) (4,828 ) (43,492 ) (48,320 ) 7,966 21,358 29,324 (5,804 ) (14,044 ) (19,848 ) (3,019 ) (8,072 ) (11,091 ) 14,778 (82,061 ) (67,283 ) 12,507 (19,659 ) (7,152 ) 6,682 (11,301 ) (4,619 ) 40,106 (4,649 ) 35,457 (218 ) (548 ) (766 ) (286 ) 265 (21 ) — — — — — — 6,464 (11,849 ) (5,385 ) 39,820 (4,384 ) 35,436 (249 ) (291 ) (540 ) (484 ) (236 ) (720 ) — — — — — — (247 ) (622 ) (869 ) (295 ) (36 ) (331 ) (496 ) (913 ) (1,409 ) (779 ) (272 ) (1,051 ) 526 (121 ) 405 704 (250 ) 454 4,112 (4,400 ) (288 ) 3,949 535 4,484 (2,270 ) (13,713 ) (15,983 ) — 4,639 4,639 2,368 (18,234 ) (15,866 ) 4,653 4,924 9,577 1,717 (26 ) 1,691 1,569 (458 ) 1,111 128 (72 ) 56 83 295 378 (99 ) (1,889 ) (1,988 ) (157 ) 14,698 14,541 1,746 (1,987 ) (241 ) 1,495 14,535 16,030 — — — — — — (8,961 ) (17,445 ) (26,406 ) (17,984 ) 9,051 (8,933 ) — — — — — — (8,961 ) (17,445 ) (26,406 ) (17,984 ) 9,051 (8,933 ) 1 (4 ) (3 ) 437 (280 ) 157 35 6 41 602 (379 ) 223 12 (64 ) (52 ) 1 5 6 48 (62 ) (14 ) 1,040 (654 ) 386 (243 ) (1,598 ) (1,841 ) (216 ) 330 114 (20 ) 544 524 (288 ) 150 (138 ) (26 ) (111 ) (137 ) (1 ) (22 ) (23 ) (289 ) (1,165 ) (1,454 ) (505 ) 458 (47 ) 48,439 (52,117 ) (3,678 ) 55,545 (46,466 ) 9,079 (41,817 ) (76,884 ) (118,701 ) (6,952 ) 32,537 25,585 481 (152,698 ) (152,217 ) (3,934 ) 73,220 69,286 Ch$ 7,103 Ch$ (281,699 ) Ch$ (274,596 ) Ch$ 44,659 Ch$ 59,291 Ch$ 103,950
Increase (Decrease) from 2003 to 2004 due to changes in | Net change 2003 to 2004 | Increase (Decrease) from 2004 to 2005 due to changes in | Net change from 2004 to 2005 | |||||||||||||||||||||
| Volume | Rate | Volume | Rate | |||||||||||||||||||||
| (in millions of constant Ch$ as of December 31, 2005) | ||||||||||||||||||||||||
Assets | ||||||||||||||||||||||||
Interest earning assets | ||||||||||||||||||||||||
Interbank deposits | ||||||||||||||||||||||||
Ch$ | — | — | — | — | — | — | ||||||||||||||||||
UF | — | — | — | — | — | — | ||||||||||||||||||
Foreign currency | Ch$ | (479 | ) | Ch$ | 993 | Ch$ | 514 | Ch$ | 1,955 | Ch$ | 4,473 | Ch$ | 6,428 | |||||||||||
Total | (479 | ) | 993 | 514 | 1,955 | 4,473 | 6,428 | |||||||||||||||||
Financial investments | ||||||||||||||||||||||||
Ch$ | 6,080 | (8,263 | ) | (2,183 | ) | (9,544 | ) | 6,981 | (2,563 | ) | ||||||||||||||
UF | (1,030 | ) | 1,308 | 278 | (1,131 | ) | 122 | (1,009 | ) | |||||||||||||||
Foreign currency | — | 63,247 | 63,247 | (1,081 | ) | 19,408 | 18,327 | |||||||||||||||||
Total | 5,050 | 56,292 | 61,342 | (11,756 | ) | 26,511 | 14,755 | |||||||||||||||||
Commercial loans | ||||||||||||||||||||||||
Ch$ | 7,832 | (34,133 | ) | (26,301 | ) | 13,939 | (1,279 | ) | 12,660 | |||||||||||||||
UF | 8,253 | 22,125 | 30,378 | 38,751 | 22,421 | 61,172 | ||||||||||||||||||
Foreign currency | (3,127 | ) | (8,363 | ) | (11,490 | ) | 1,417 | 3,470 | 4,887 | |||||||||||||||
Total | 12,958 | (20,371 | ) | (7,413 | ) | 54,107 | 24,612 | 78,719 | ||||||||||||||||
Consumer loans | ||||||||||||||||||||||||
Ch$ | 41,550 | (4,816 | ) | 36,734 | 22,337 | 1,092 | 23,429 | |||||||||||||||||
UF | (296 | ) | 274 | (22 | ) | (174 | ) | 202 | 28 | |||||||||||||||
Foreign currency | — | — | — | — | — | — | ||||||||||||||||||
Total | 41,254 | (4,542 | ) | 36,712 | 22,163 | 1,294 | 23,457 | |||||||||||||||||
Interbank loans | ||||||||||||||||||||||||
Ch$ | (501 | ) | (246 | ) | (747 | ) | 121 | 637 | 758 | |||||||||||||||
UF | — | — | — | — | — | — | ||||||||||||||||||
Foreign currency | (306 | ) | (37 | ) | (343 | ) | (371 | ) | 187 | (184 | ) | |||||||||||||
Total | (807 | ) | (283 | ) | (1,090 | ) | (250 | ) | 824 | 574 | ||||||||||||||
Leasing contracts | ||||||||||||||||||||||||
Ch$ | 729 | (258 | ) | 471 | 114 | 381 | 495 | |||||||||||||||||
UF | 4,092 | 554 | 4,646 | 8,026 | 2,037 | 10,063 | ||||||||||||||||||
Foreign currency | — | 4,805 | 4,805 | — | (1,184 | ) | (1,184 | ) | ||||||||||||||||
Total | 4,821 | 5,101 | 9,922 | 8,140 | 1,234 | 9,374 | ||||||||||||||||||
Foreign trade loans | ||||||||||||||||||||||||
Ch$ | 1,626 | (476 | ) | 1,150 | (208 | ) | 1,034 | 826 | ||||||||||||||||
UF | 85 | 307 | 392 | 28 | 353 | 381 | ||||||||||||||||||
Foreign currency | (162 | ) | 15,226 | 15,064 | (2,216 | ) | 5,170 | 2,954 | ||||||||||||||||
Total | 1,549 | 15,057 | 16,606 | (2,396 | ) | 6,557 | 4,161 | |||||||||||||||||
Mortgage loans | ||||||||||||||||||||||||
Ch$ | — | — | — | — | — | — | ||||||||||||||||||
UF | (18,632 | ) | 9,378 | (9,254 | ) | (34,665 | ) | 13,862 | (20,803 | ) | ||||||||||||||
Foreign currency | — | — | — | — | — | — | ||||||||||||||||||
Total | (18,632 | ) | 9,378 | (9,254 | ) | (34,665 | ) | 13,862 | (20,803 | ) | ||||||||||||||
Contingent loans | ||||||||||||||||||||||||
Ch$ | 453 | (290 | ) | 163 | 488 | (612 | ) | (124 | ) | |||||||||||||||
UF | 624 | (393 | ) | 231 | 853 | (505 | ) | 348 | ||||||||||||||||
Foreign currency | 1 | 6 | 7 | 1 | 259 | 260 | ||||||||||||||||||
Total | 1,078 | (677 | ) | 401 | 1,342 | (858 | ) | 484 | ||||||||||||||||
Past due loans | ||||||||||||||||||||||||
Ch$ | (223 | ) | 342 | 119 | (92 | ) | 336 | 244 | ||||||||||||||||
UF | (299 | ) | 156 | (143 | ) | (163 | ) | (36 | ) | (199 | ) | |||||||||||||
Foreign currency | (1 | ) | (23 | ) | (24 | ) | — | 22 | 22 | |||||||||||||||
Total | (523 | ) | 475 | (48 | ) | (255 | ) | 322 | 67 | |||||||||||||||
Total interest earning assets | ||||||||||||||||||||||||
Ch$ | 57,546 | (48,140 | ) | 9,406 | 27,155 | 8,570 | 35,725 | |||||||||||||||||
UF | (7,203 | ) | 33,709 | 26,506 | 11,525 | 38,456 | 49,981 | |||||||||||||||||
Foreign currency | (4,074 | ) | 75,854 | 71,780 | (295 | ) | 31,805 | 31,510 | ||||||||||||||||
Total | Ch$ | 46,269 | Ch$ | 61,423 | Ch$ | 107,692 | Ch$ | 38,385 | Ch$ | 78,831 | Ch$ | 117,216 | ||||||||||||
| Increase (Decrease) from 2002 to 2003 due to changes in | Net change from 2002 to 2003 | Increase (Decrease) from 2003 to 2004 due to changes in | Net change from 2003 to 2004 | Increase (Decrease) from 2003 to 2004 due to changes in | Net change from 2003 to 2004 | Increase (Decrease) from 2004 to 2005 due to changes in | Net change from 2004 to 2005 | |||||||||||||||||||||||||||||||||||||||||
| Volume | Rate | Volume | Rate | Volume | Rate | Volume | Rate | |||||||||||||||||||||||||||||||||||||||||
| (in millions of constant Ch$ as of December 31, 2004) | (in millions of constant Ch$ as of December 31, 2005) | |||||||||||||||||||||||||||||||||||||||||||||||
Liabilities | ||||||||||||||||||||||||||||||||||||||||||||||||
Interest bearing liabilities | ||||||||||||||||||||||||||||||||||||||||||||||||
Interest bearing demand deposits | ||||||||||||||||||||||||||||||||||||||||||||||||
Ch$ | — | — | — | — | — | — | — | — | — | — | — | — | ||||||||||||||||||||||||||||||||||||
UF | — | — | — | — | — | — | — | — | — | — | — | — | ||||||||||||||||||||||||||||||||||||
Foreign currency | — | — | — | — | — | — | — | — | — | — | — | — | ||||||||||||||||||||||||||||||||||||
Total | — | — | — | — | — | — | — | — | — | — | — | — | ||||||||||||||||||||||||||||||||||||
Savings accounts | ||||||||||||||||||||||||||||||||||||||||||||||||
Ch$ | — | — | — | — | — | — | — | — | — | — | — | — | ||||||||||||||||||||||||||||||||||||
UF | Ch$ | 148 | Ch$ | (4,573 | ) | Ch$ | (4,425 | ) | Ch$ | (566 | ) | Ch$ | 835 | Ch$ | 269 | Ch$ | (586 | ) | Ch$ | 865 | Ch$ | 279 | Ch$ | (305 | ) | Ch$ | 2,282 | Ch$ | 1,977 | |||||||||||||||||||
Foreign currency | — | — | — | — | — | — | — | — | — | — | — | — | ||||||||||||||||||||||||||||||||||||
Total | 148 | (4,573 | ) | (4,425 | ) | (566 | ) | 835 | 269 | (586 | ) | 865 | 279 | (305 | ) | 2,282 | 1,977 | |||||||||||||||||||||||||||||||
Time deposits | ||||||||||||||||||||||||||||||||||||||||||||||||
Ch$ | (3,173 | ) | (24,698 | ) | (27,871 | ) | 3,794 | (22,139 | ) | (18,345 | ) | 3,931 | (22,937 | ) | (19,006 | ) | 5,710 | 35,861 | 41,571 | |||||||||||||||||||||||||||||
UF | (7,651 | ) | (23,823 | ) | (31,474 | ) | (2,331 | ) | 9,306 | 6,975 | (2,415 | ) | 9,641 | 7,226 | 13,742 | 17,501 | 31,243 | |||||||||||||||||||||||||||||||
Foreign currency | 64 | (3,354 | ) | (3,290 | ) | 119 | 10,868 | 10,987 | 123 | 11,259 | 11,382 | (3,559 | ) | 10,045 | 6,486 | |||||||||||||||||||||||||||||||||
Total | (10,760 | ) | (51,875 | ) | (62,635 | ) | 1,582 | (1,965 | ) | (383 | ) | 1,639 | (2,037 | ) | (398 | ) | 15,893 | 63,407 | 79,300 | |||||||||||||||||||||||||||||
Central Bank borrowings | ||||||||||||||||||||||||||||||||||||||||||||||||
Ch$ | 222 | (623 | ) | (401 | ) | 272 | (121 | ) | 151 | 37 | (51 | ) | (14 | ) | 577 | 161 | 738 | |||||||||||||||||||||||||||||||
UF | (58 | ) | (109 | ) | (167 | ) | (47 | ) | — | (47 | ) | (70 | ) | 15 | (55 | ) | (49 | ) | (9 | ) | (58 | ) | ||||||||||||||||||||||||||
Foreign currency | — | 18 | 18 | 192 | (3 | ) | 189 | — | — | — | — | — | — | |||||||||||||||||||||||||||||||||||
Total | 164 | (714 | ) | (550 | ) | 417 | (124 | ) | 293 | (33 | ) | (36 | ) | (69 | ) | 528 | 152 | 680 | ||||||||||||||||||||||||||||||
Repurchase agreements | ||||||||||||||||||||||||||||||||||||||||||||||||
Ch$ | 22 | (791 | ) | (769 | ) | 1,994 | (3,256 | ) | (1,262 | ) | 2,066 | (3,373 | ) | (1,307 | ) | (2,324 | ) | 3,571 | 1,247 | |||||||||||||||||||||||||||||
UF | 80 | (175 | ) | (95 | ) | (2 | ) | (2 | ) | (4 | ) | (2 | ) | (2 | ) | (4 | ) | — | 1 | 1 | ||||||||||||||||||||||||||||
Foreign currency | (1,671 | ) | (1,471 | ) | (3,142 | ) | (722 | ) | 884 | 162 | (748 | ) | 917 | 169 | 120 | 431 | 551 | |||||||||||||||||||||||||||||||
Total | (1,569 | ) | (2,437 | ) | (4,006 | ) | 1,270 | (2,374 | ) | (1,104 | ) | 1,316 | (2,458 | ) | (1,142 | ) | (2,204 | ) | 4,003 | 1,799 | ||||||||||||||||||||||||||||
Mortgage finance bonds | ||||||||||||||||||||||||||||||||||||||||||||||||
Ch$ | — | — | — | — | — | — | — | — | — | — | — | — | ||||||||||||||||||||||||||||||||||||
UF | (21,913 | ) | (22,941 | ) | (44,854 | ) | (10,736 | ) | 7,844 | (2,892 | ) | (11,123 | ) | 8,127 | (2,996 | ) | (27,061 | ) | 203 | (26,858 | ) | |||||||||||||||||||||||||||
Foreign currency | — | — | — | — | — | — | — | — | — | — | — | — | ||||||||||||||||||||||||||||||||||||
Total | (21,913 | ) | (22,941 | ) | (44,854 | ) | (10,736 | ) | 7,844 | (2,892 | ) | (11,123 | ) | 8,127 | (2,996 | ) | (27,061 | ) | 203 | (26,858 | ) | |||||||||||||||||||||||||||
Other interest bearing liabilities | ||||||||||||||||||||||||||||||||||||||||||||||||
Ch$ | 1,049 | 2,350 | 3,399 | 1,901 | (9,626 | ) | (7,725 | ) | 1,915 | (9,748 | ) | (7,833 | ) | 625 | 79 | 704 | ||||||||||||||||||||||||||||||||
UF | (2,419 | ) | (5,262 | ) | (7,681 | ) | 2,033 | 5,901 | 7,934 | 2,130 | 6,097 | 8,227 | 19,752 | 1,906 | 21,658 | |||||||||||||||||||||||||||||||||
Foreign currency | 1,797 | (5,177 | ) | (3,380 | ) | (42 | ) | 9,210 | 9,168 | (32 | ) | 9,724 | 9,692 | 1,022 | 7,433 | 8,455 | ||||||||||||||||||||||||||||||||
Total | 427 | (8,089 | ) | (7,662 | ) | 3,892 | 5,485 | 9,377 | 4,013 | 6,073 | 10,086 | 21,399 | 9,418 | 30,817 | ||||||||||||||||||||||||||||||||||
Total interest bearing liabilities | ||||||||||||||||||||||||||||||||||||||||||||||||
Ch$ | (1,880 | ) | (23,762 | ) | (25,642 | ) | 7,961 | (35,142 | ) | (27,181 | ) | 7,949 | (36,109 | ) | (28,160 | ) | 4,588 | 39,672 | 44,260 | |||||||||||||||||||||||||||||
UF | (31,813 | ) | (56,883 | ) | (88,696 | ) | (11,649 | ) | 23,884 | 12,235 | (12,066 | ) | 24,743 | 12,677 | 6,079 | 21,884 | 27,963 | |||||||||||||||||||||||||||||||
Foreign currency | 190 | (9,984 | ) | (9,794 | ) | (453 | ) | 20,959 | 20,506 | (657 | ) | 21,900 | 21,243 | (2,417 | ) | 17,909 | 15,492 | |||||||||||||||||||||||||||||||
Total | Ch$ | (33,503 | ) | Ch$ | (90,629 | ) | Ch$ | (124,132 | ) | Ch$ | (4,141 | ) | Ch$ | 9,701 | Ch$ | 5,560 | Ch$ | (4,774 | ) | Ch$ | 10,534 | Ch$ | 5,760 | Ch$ | 8,250 | Ch$ | 79,465 | Ch$ | 87,715 | |||||||||||||||||||
Investment Portfolio
The following table sets forth our investment in Chilean government and corporate securities and certain other financial investments as of December 31, 2002, 2003, 2004 and 2004.2005. Financial investments traded on a secondary market are shown adjusted to market value, following specific instructions from the Chilean Superintendency of Banks. These instructions provide for the recognition of such adjustments against income except in the case of a permanent portfolio, where an equity account, “Unrealized gains (losses) on permanent financial investments,” may be directly adjusted, subject to certain restrictions.
Weighted Average Nominal Rate Central Bank and Government Securities Marketable debt securities Marketable debt securities with limited secondary market Chilean government securities Investments purchased under agreements to resell Investments collateral under agreements to repurchase Subtotal Corporate Securities and Other Financial Investments Investments in Chilean financial institutions Foreign government notes Investments in foreign countries Other financial investments Investments collateral under agreements to repurchase Subtotal Total December 31, 2002 2003 2004 at December 31,
2004 (in millions of constant Ch$ as of December 31, 2004, except for rate data) Ch$ 614,044 Ch$ 992,611 Ch$ 903,733 2.83 % 280,282 — — — 5,670 42,894 9,923 4.21 33,311 30,402 26,310 2.47 201,909 332,690 169,982 5.15 1,135,216 1,398,597 1,109,948 3.19 46,631 135,244 43,203 4.66 52,908 34,453 28,298 2.16 286,887 191,223 137,288 3.36 49,326 109,024 111,336 6.85 84,293 95,691 177,200 7.47 520,045 565,635 497,325 5.65 Ch$ 1,655,261 Ch$ 1,964,232 Ch$ 1,607,273 3.95 %
| December 31, | Weighted Average Nominal Rate | |||||||||||
| 2003 | 2004 | 2005 | at December 31, 2005 | |||||||||
| (in millions of constant Ch$ as of December 31, 2005, except for rate data) | ||||||||||||
Central Bank and Government Securities | ||||||||||||
Central Bank debt securities | Ch$ | 1,028,345 | Ch$ | 936,268 | Ch$ | 592,531 | 3.34 | % | ||||
Chilean government securities | 44,438 | 10,280 | 19,007 | 5.66 | ||||||||
Investments purchased under agreements to resell | 31,496 | 27,257 | 46,695 | 4.32 | ||||||||
Investments collateral under agreements to repurchase | 344,667 | 176,101 | 90,011 | 4.34 | ||||||||
Subtotal | 1,448,946 | 1,149,906 | 748,244 | 3.58 | ||||||||
Corporate Securities and Other Financial Investments | ||||||||||||
Investments in Chilean financial institutions | 140,113 | 44,758 | 74,189 | 4.21 | ||||||||
Foreign government notes | 35,693 | 29,317 | 37,357 | 2.97 | ||||||||
Investments in foreign countries | 198,107 | 142,231 | 315,578 | 4.21 | ||||||||
Other financial investments | 112,949 | 115,344 | 120,432 | 6.23 | ||||||||
Investments collateral under agreements to repurchase | 99,136 | 183,580 | 154,209 | 5.55 | ||||||||
Subtotal | 585,998 | 515,230 | 701,765 | 4.79 | ||||||||
Total | Ch$ | 2,034,944 | Ch$ | 1,665,136 | Ch$ | 1,450,009 | 4.16 | % | ||||
At December 31, 2004,2005, financial instruments issued by the Central Bank were the only financial instruments we held whose aggregate book value exceeded 10% of our shareholders’ equity. These financial instruments are accounted for in the audited consolidated financial statements at market value. See noteNote 1(f) to our audited consolidated financial statements. The value of such investments at December 31, 20042005 is as follows:
Issuer | Carrying Value | Market Value | Carrying Value | Market Value | ||||||||
| (in millions of constant Ch$ as of December 31, 2004) | (in millions of constant Ch$ as of December 31, 2005) | |||||||||||
Central Bank | Ch$ | 1,100,025 | Ch$ | 1,100,025 | Ch$ | 729,237 | Ch$ | 729,237 | ||||
The following table sets forth an analysis of our investments at December 31, 2004,2005, by time remaining to maturity and the weighted average nominal rates of such investments:
| Within one year(1) | Rate | After one year but within five years | Rate | After five years | Rate | Total | Rate | Within one year(1) | Rate | After one year but within five years | Rate | After five years | Rate | Total | Rate | |||||||||||||||||||||||||||
| (in millions of constant Ch$ as of December 31, 2004, except for rate data) | (in millions of constant Ch$ as of December 31, 2005, except for rate data) | |||||||||||||||||||||||||||||||||||||||||
Central Bank and Government Securities | ||||||||||||||||||||||||||||||||||||||||||
Marketable debt securities | Ch$ | 903,733 | 2.83 | % | — | — | — | — | Ch$ | 903,733 | 2.83 | % | ||||||||||||||||||||||||||||||
Central Bank debt securities | Ch$ | 592,531 | 3.34 | % | — | — | — | — | Ch$ | 592,531 | 3.34 | % | ||||||||||||||||||||||||||||||
Chilean government securities | 9,923 | 4.21 | — | — | — | — | 9,923 | 4.21 | 19,007 | 5.66 | — | — | — | — | 19,007 | 5.66 | ||||||||||||||||||||||||||
Investments purchased under agreements to resell | 26,310 | 2.47 | — | — | — | — | 26,310 | 2.47 | 46,695 | 4.32 | — | — | — | — | 46,695 | 4.32 | ||||||||||||||||||||||||||
Investments collateral under agreements to repurchase | 169,982 | 5.15 | — | — | — | — | 169,982 | 5.15 | 90,011 | 4.34 | — | — | — | — | 90,011 | 4.34 | ||||||||||||||||||||||||||
Subtotal | 1,109,948 | 3.19 | — | — | — | — | 1,109,948 | 3.19 | 748,244 | 3.58 | — | — | — | — | 748,244 | 3.58 | ||||||||||||||||||||||||||
Corporate Securities and Other Financial Investments | ||||||||||||||||||||||||||||||||||||||||||
Investments in Chilean financial institutions | 43,203 | 4.66 | — | — | — | — | 43,203 | 4.66 | 74,189 | 4.21 | — | — | — | — | 74,189 | 4.21 | ||||||||||||||||||||||||||
Foreign government notes | 28,298 | 2.16 | — | — | — | — | 28,298 | 2.16 | 37,357 | 2.97 | — | — | — | — | 37,357 | 2.97 | ||||||||||||||||||||||||||
Investments in foreign countries | 133,309 | 3.37 | Ch$ | 3,979 | 2.99 | % | — | — | 137,288 | 3.36 | 315,578 | 4.21 | — | — | — | — | 315,578 | 4.21 | ||||||||||||||||||||||||
Other financial investments | 109,520 | 6.84 | 1,816 | 7.70 | — | — | 111,336 | 6.85 | 120,432 | 6.23 | — | — | — | — | 120,432 | 6.23 | ||||||||||||||||||||||||||
Investments collateral under agreements to repurchase | 177,200 | 7.47 | — | — | — | — | 177,200 | 7.47 | 154,209 | 5.55 | — | — | — | — | 154,209 | 5.55 | ||||||||||||||||||||||||||
Subtotal | 491,530 | 5.66 | 5,795 | 4.47 | — | — | 497,325 | 5.65 | 701,765 | 4.79 | — | — | — | — | 701,765 | 4.79 | ||||||||||||||||||||||||||
Total | Ch$ | 1,601,478 | 3.95 | % | Ch$ | 5,795 | 4.47 | % | — | — | Ch$ | 1,607,273 | 3.95 | % | Ch$ | 1,450,009 | 4.16 | % | — | — | — | — | Ch$ | 1,450,009 | 4.16 | % | ||||||||||||||||
| (1) | In accordance with the regulations of the Chilean Superintendency of Banks, trading investments are classified as due within 1 year. |
The following table sets forth an analysis under U.S. GAAP of investments held to maturity by type:
| As of December 31, | ||||||||||||||||||||||||||||
| 2002 | 2003 | 2004 | ||||||||||||||||||||||||||
Instruments | Carrying Value | Unrealized Gains (Losses) | Estimated Fair Value | Carrying Value | Unrealized Gains (Losses) | Estimated Fair Value | Carrying Value | Unrealized Gains (Losses) | Estimated Fair Value | |||||||||||||||||||
| (in millions of constant Ch$ as of December 31, 2004) | ||||||||||||||||||||||||||||
U.S. government debt securities | Ch$ | 40,436 | Ch$ | 5 | Ch$ | 40,441 | Ch$ | 21,542 | Ch$ | 4 | Ch$ | 21,546 | Ch$ | 16,819 | Ch$ | (2 | ) | Ch$ | 16,817 | |||||||||
Chilean government securities | 284,443 | 5 | 284,448 | — | — | — | — | — | — | |||||||||||||||||||
Total | Ch$ | 324,879 | Ch$ | 10 | Ch$ | 324,889 | Ch$ | 21,542 | Ch$ | 4 | Ch$ | 21,546 | Ch$ | 16,819 | Ch$ | (2 | ) | Ch$ | 16,817 | |||||||||
| As of December 31, | |||||||||||||||||||||||||||||
| 2003 | 2004 | 2005 | |||||||||||||||||||||||||||
Instruments | Carrying Value | Unrealized Gains (Losses) | Estimated Fair Value | Carrying Value | Unrealized Gains (Losses) | Estimated Fair Value | Carrying Value | Unrealized Gains (Losses) | Estimated Fair Value | ||||||||||||||||||||
| (in millions of constant Ch$ as of December 31, 2005) | |||||||||||||||||||||||||||||
U.S. government debt securities | Ch$ | 22,318 | Ch$ | 4 | Ch$ | 22,322 | Ch$ | 17,424 | Ch$ | (2 | ) | Ch$ | 17,422 | Ch$ | 15,364 | Ch$ | (1 | ) | Ch$ | 15,363 | |||||||||
Total | Ch$ | 22,318 | Ch$ | 4 | Ch$ | 22,322 | Ch$ | 17,424 | Ch$ | (2 | ) | Ch$ | 17,422 | Ch$ | 15,364 | Ch$ | (1 | ) | Ch$ | 15,363 | |||||||||
Loan Portfolio
The following table analyzes our loans by type of loan and risk classification. All loan amounts stated below are before deduction of allowances for loan losses. Total loans reflect our loan portfolio, including past due principal amounts.
| December 31, | |||||||||||||||
| 2000 | 2001 | 2002 | 2003 | 2004 | |||||||||||
| (in millions of constant Ch$ as of December 31, 2004) | |||||||||||||||
Commercial loans: | |||||||||||||||
General commercial loans | Ch$ | 1,748,903 | Ch$ | 1,726,300 | Ch$ | 2,711,533 | Ch$ | 2,708,178 | Ch$ | 2,867,288 | |||||
Foreign trade loans | 404,558 | 402,131 | 633,232 | 674,737 | 599,051 | ||||||||||
Interbank loans | 29,786 | 25,315 | 56,750 | 13,554 | 15,198 | ||||||||||
Leasing contracts | 184,961 | 178,241 | 257,874 | 275,680 | 343,853 | ||||||||||
Other outstanding loans | 376,907 | 341,395 | 400,932 | 452,018 | 936,202 | ||||||||||
Subtotal commercial loans | 2,745,115 | 2,673,382 | 4,060,321 | 4,124,167 | 4,761,592 | ||||||||||
Mortgage loans: | |||||||||||||||
Residential | 390,006 | 443,739 | 601,239 | 619,202 | 443,835 | ||||||||||
Commercial | 433,613 | 417,777 | 627,883 | 537,029 | 376,047 | ||||||||||
Subtotal mortgage loans | 823,619 | 861,516 | 1,229,122 | 1,156,231 | 819,882 | ||||||||||
Consumer loans | 208,195 | 222,040 | 544,014 | 603,402 | 691,851 | ||||||||||
Past due loans: | |||||||||||||||
Commercial loans | 47,071 | 40,560 | 133,694 | 92,812 | 67,758 | ||||||||||
Residential mortgage loans | 4,818 | 6,720 | 10,606 | 11,460 | 12,605 | ||||||||||
Consumer loans | 3,116 | 2,912 | 4,709 | 3,454 | 3,693 | ||||||||||
Leasing contracts | 806 | 469 | 1,037 | 415 | 629 | ||||||||||
Subtotal past due loans | 55,811 | 50,661 | 150,046 | 108,141 | 84,685 | ||||||||||
Contingent loans | 276,146 | 307,089 | 395,224 | 419,852 | 530,901 | ||||||||||
Total loans | Ch$ | 4,108,886 | Ch$ | 4,114,688 | Ch$ | 6,378,727 | Ch$ | 6,411,793 | Ch$ | 6,888,911 | |||||
| December 31, | |||||||||||||||
| 2001 | 2002 | 2003 | 2004 | 2005 | |||||||||||
| (in millions of constant Ch$ as of December 31, 2005) | |||||||||||||||
Commercial loans: | |||||||||||||||
General commercial loans | Ch$ | 1,788,446 | Ch$ | 2,809,148 | Ch$ | 2,805,673 | Ch$ | 2,970,510 | Ch$ | 3,510,902 | |||||
Foreign trade loans | 416,608 | 656,029 | 699,028 | 620,617 | 550,770 | ||||||||||
Interbank loans | 26,227 | 58,793 | 14,042 | 15,745 | 25,012 | ||||||||||
Leasing contracts | 184,657 | 267,157 | 285,604 | 356,232 | 454,805 | ||||||||||
Other outstanding loans | 353,686 | 415,365 | 468,290 | 969,947 | 1,335,021 | ||||||||||
Subtotal commercial loans | 2,769,624 | 4,206,492 | 4,272,637 | 4,933,051 | 5,876,510 | ||||||||||
Mortgage loans: | |||||||||||||||
Residential | 459,714 | 622,884 | 641,493 | 459,813 | 367,962 | ||||||||||
Commercial | 432,816 | 650,487 | 556,362 | 389,585 | 302,385 | ||||||||||
Subtotal mortgage loans | 892,530 | 1,273,371 | 1,197,855 | 849,398 | 670,347 | ||||||||||
Consumer loans | 230,034 | 563,598 | 625,125 | 716,758 | 864,144 | ||||||||||
Past due loans: | |||||||||||||||
Commercial loans | 42,020 | 138,507 | 96,153 | 70,197 | 53,291 | ||||||||||
Residential mortgage loans | 6,962 | 10,988 | 11,873 | 13,059 | 13,863 | ||||||||||
Consumer loans | 3,017 | 4,879 | 3,578 | 3,826 | 3,870 | ||||||||||
Leasing contracts | 486 | 1,074 | 430 | 652 | 325 | ||||||||||
Subtotal past due loans | 52,485 | 155,448 | 112,034 | 87,734 | 71,349 | ||||||||||
Contingent loans | 318,144 | 409,452 | 434,967 | 550,013 | 723,574 | ||||||||||
Total loans | Ch$ | 4,262,817 | Ch$ | 6,608,361 | Ch$ | 6,642,618 | Ch$ | 7,136,954 | Ch$ | 8,205,924 | |||||
The loan categories are as follows:
Commercial loansare short-term and long-term loans made to companies or businesses, at variable or fixed interest rates in order to finance working capital or investments.
Consumer loansare loans to individuals made principally in Chilean pesos or UF, generally on a fixed rate basis, to finance the purchase of consumer goods or to pay for services. Credit card balances subject to interest charges are also included in this category.
Mortgage loansare inflation indexed, fixed rate, long-term loans with monthly payments of principal and interest securedcollateralized by a real property mortgage. These loans are financed through the issuance of mortgage finance bonds. At the time of its issuance, the amount of a mortgage loan cannot be more than 75% of the value of the mortgaged property.
Foreign trade loansare variable or fixed rate, short-term loans made in foreign currencies (principally U.S. dollars) to finance imports and exports.
Leasing contractsare agreements for financing leases of capital equipment and other property.
Other outstanding loans principally include bills of exchange, other mortgage loans whichthat are financed by our general borrowings and factoring.
Past due loansrepresent loans or portionsshares of loans that are overdue as to any payment of principal or interest by 90 days or more.
Contingent loans consist of open and unused letters of credit together with guarantees granted by us in Chilean pesos, UF and foreign currencies (principally U.S. dollars). Unlike U.S. GAAP, Chilean GAAP requires such loans to be included on a bank’s balance sheet. See noteNote 28 to our consolidated audited financial statements).statements for a description of the significant differences between Chilean GAAP and U.S. GAAP as they relate to our consolidated subsidiaries and us.
Any collateral provided generally consists of a mortgage on real estate, a pledge of marketable securities, a letter of credit or cash. The existence and amount of collateral varies from loan to loan.
Maturity and Interest Rate Sensitivity of Loans as of December 31, 20042005
The following table sets forth an analysis by type and time remaining to maturity of our loans at December 31, 2004:2005:
| Balance as of December 31, 2004 | Due within 1 month | Due after 1 month but within 6 months | Due after 6 months but within 12 months | Due after 1 year but within 3 years | Due after 3 years but within 5 years | Due after 5 years | Balance as of December 31, 2005 | Due within 1 month | Due after 1 month but within 6 months | Due after 6 months but within 12 | Due after 1 year but within 3 years | Due after 3 years but years | Due after 5 years | |||||||||||||||||||||||||||||
| (in millions of constant Ch$ as of December 31, 2004) | (in millions of constant Ch$ as of December 31, 2005) | |||||||||||||||||||||||||||||||||||||||||
Commercial loans | Ch$ | 2,867,288 | Ch$ | 482,211 | Ch$ | 810,011 | Ch$ | 301,144 | Ch$ | 549,327 | Ch$ | 311,146 | Ch$ | 413,449 | Ch$ | 3,510,902 | Ch$ | 497,795 | Ch$ | 839,212 | Ch$ | 327,955 | Ch$ | 643,949 | Ch$ | 434,879 | Ch$ | 767,112 | ||||||||||||||
Consumer loans | 691,851 | 244,720 | 100,054 | 96,776 | 210,198 | 35,060 | 5,043 | 864,144 | 291,260 | 127,168 | 116,442 | 268,920 | 54,496 | 5,858 | ||||||||||||||||||||||||||||
Mortgage loans | 819,882 | 11,035 | 31,928 | 38,548 | 152,131 | 142,722 | 443,518 | 670,347 | 7,453 | 28,621 | 34,296 | 132,748 | 124,000 | 343,229 | ||||||||||||||||||||||||||||
Foreign trade loans | 599,051 | 145,714 | 372,900 | 58,062 | 10,453 | 4,894 | 7,028 | 550,770 | 97,416 | 336,394 | 72,587 | 19,510 | 15,452 | 9,411 | ||||||||||||||||||||||||||||
Interbank loans | 15,198 | 12,503 | 1,674 | 1,021 | — | — | — | 25,012 | 25,012 | — | — | — | — | — | ||||||||||||||||||||||||||||
Leasing contracts | 343,853 | 15,017 | 35,754 | 40,524 | 114,151 | 65,663 | 72,744 | 454,805 | 19,652 | 50,754 | 55,941 | 164,522 | 80,299 | 83,637 | ||||||||||||||||||||||||||||
Other outstanding loans | 936,202 | 141,918 | 68,211 | 26,248 | 99,896 | 97,459 | 502,470 | 1,335,021 | 214,011 | 117,293 | 36,729 | 141,302 | 131,248 | 694,438 | ||||||||||||||||||||||||||||
Past due loans | 84,685 | 84,685 | — | — | — | — | — | 71,349 | 71,349 | — | — | — | — | — | ||||||||||||||||||||||||||||
Subtotal | 6,358,010 | 1,137,803 | 1,420,532 | 562,323 | 1,136,156 | 656,944 | 1,444,252 | 7,482,350 | 1,223,948 | 1,499,442 | 643,950 | 1,370,951 | 840,374 | 1,903,685 | ||||||||||||||||||||||||||||
Contingent loans | 530,901 | 256,487 | 86,802 | 54,778 | 104,079 | 27,220 | 1,535 | 723,574 | 141,533 | 240,461 | 163,433 | 153,073 | 21,957 | 3,117 | ||||||||||||||||||||||||||||
Total loans | Ch$ | 6,888,911 | Ch$ | 1,394,290 | Ch$ | 1,507,334 | Ch$ | 617,101 | Ch$ | 1,240,235 | Ch$ | 684,164 | Ch$ | 1,445,787 | Ch$ | 8,205,924 | Ch$ | 1,365,481 | Ch$ | 1,739,903 | Ch$ | 807,383 | Ch$ | 1,524,024 | Ch$ | 862,331 | Ch$ | 1,906,802 | ||||||||||||||
The following table presents the interest rate sensitivity of our outstanding loans due after one year as of December 31, 2004,2005, not including contingent loans:
| As of December 31, | ||||
| (in millions of constant Ch$ as | ||||
Variable rate | ||||
Ch$ | Ch$ | |||
UF | ||||
Foreign currency | ||||
Total | ||||
Fixed rate | ||||
Ch$ | ||||
UF | ||||
Foreign currency | ||||
Total | ||||
Total | Ch$ | |||
Loans by Economic Activity
The following table sets forth, at the dates indicated, an analysis of our loan portfolio based on the borrower’s principal economic activity. Loans to individuals for business purposes are allocated to their respective economic activity. The table does not reflect outstanding contingent loans.
| As of December 31, | As of December 31, | |||||||||||||||||||||||||||||||||||
| 2002 | 2003 | 2004 | 2003 | 2004 | 2005 | |||||||||||||||||||||||||||||||
| Loan Portfolio | % of loan Portfolio | Loan Portfolio | % of loan Portfolio | Loan Portfolio | % of loan Portfolio | Loan Portfolio | % of loan Portfolio | Loan Portfolio | % of loan Portfolio | Loan Portfolio | % of loan Portfolio | |||||||||||||||||||||||||
| (in millions of constant Ch$ as of December 31, 2004, except for percentages) | (in millions of constant Ch$ as of December 31, 2005, except for percentages) | |||||||||||||||||||||||||||||||||||
Agriculture, Livestock, Forestry, Agribusiness, Fishing: | ||||||||||||||||||||||||||||||||||||
Agriculture and livestock | Ch$ | 203,262 | 3.40 | % | Ch$ | 210,900 | 3.52 | % | Ch$ | 210,324 | 3.31 | % | Ch$ | 218,492 | 3.52 | % | Ch$ | 217,896 | 3.31 | % | Ch$ | 162,983 | 2.18 | % | ||||||||||||
Fruit | 170,474 | 2.85 | 163,222 | 2.72 | 168,238 | 2.65 | 169,098 | 2.72 | 174,295 | 2.65 | 171,904 | 2.30 | ||||||||||||||||||||||||
Forestry and wood extraction | 31,627 | 0.53 | 17,957 | 0.30 | 19,315 | 0.30 | 18,603 | 0.30 | 20,010 | 0.30 | 21,865 | 0.29 | ||||||||||||||||||||||||
Fishing | 98,611 | 1.65 | 93,718 | 1.56 | 101,264 | 1.59 | 97,092 | 1.57 | 104,910 | 1.59 | 53,294 | 0.71 | ||||||||||||||||||||||||
Subtotal | 503,974 | 8.43 | 485,797 | 8.10 | 499,141 | 7.85 | 503,285 | 8.11 | 517,111 | 7.85 | 410,046 | 5.48 | ||||||||||||||||||||||||
Mining and Petroleum: | ||||||||||||||||||||||||||||||||||||
Mining and quarries | 96,416 | 1.61 | 109,093 | 1.82 | 25,042 | 0.39 | 113,020 | 1.82 | 25,944 | 0.39 | 29,698 | 0.40 | ||||||||||||||||||||||||
Natural gas and crude oil extraction | 39,440 | 0.66 | 13,939 | 0.23 | 8,355 | 0.13 | 14,441 | 0.23 | 8,656 | 0.13 | 34,900 | 0.47 | ||||||||||||||||||||||||
Subtotal | 135,856 | 2.27 | 123,032 | 2.05 | 33,397 | 0.52 | 127,461 | 2.05 | 34,600 | 0.52 | 64,598 | 0.87 | ||||||||||||||||||||||||
Manufacturing: | ||||||||||||||||||||||||||||||||||||
Tobacco, food and beverages | 169,453 | 2.83 | 163,205 | 2.72 | 137,690 | 2.17 | 169,080 | 2.72 | 142,647 | 2.16 | 129,360 | 1.73 | ||||||||||||||||||||||||
Textiles, clothing and leather goods | 71,311 | 1.19 | 68,745 | 1.15 | 67,776 | 1.07 | 71,220 | 1.15 | 70,216 | 1.06 | 68,472 | 0.92 | ||||||||||||||||||||||||
Wood and wood products | 53,941 | 0.90 | 62,535 | 1.04 | 47,087 | 0.74 | 64,786 | 1.04 | 48,782 | 0.74 | 54,956 | 0.73 | ||||||||||||||||||||||||
Paper, printing and publishing | 20,673 | 0.35 | 17,781 | 0.30 | 24,224 | 0.38 | 18,421 | 0.30 | 25,096 | 0.38 | 40,064 | 0.54 | ||||||||||||||||||||||||
Oil refining, carbon and rubber | 63,112 | 1.05 | 69,854 | 1.17 | 82,360 | 1.30 | 72,369 | 1.17 | 85,325 | 1.29 | 96,324 | 1.29 | ||||||||||||||||||||||||
Production of basic metal, non-mineral, machine and equipment | 159,303 | 2.66 | 170,225 | 2.84 | 242,003 | 3.81 | 176,353 | 2.84 | 250,715 | 3.81 | 214,950 | 2.87 | ||||||||||||||||||||||||
Other manufacturing industries | 73,885 | 1.23 | 74,455 | 1.24 | 47,473 | 0.75 | 77,135 | 1.24 | 49,182 | 0.75 | 61,204 | 0.82 | ||||||||||||||||||||||||
Subtotal | 611,678 | 10.21 | 626,800 | 10.46 | 648,613 | 10.22 | 649,364 | 10.46 | 671,963 | 10.19 | 665,330 | 8.90 | ||||||||||||||||||||||||
Electricity, Gas and Water: | ||||||||||||||||||||||||||||||||||||
Electricity, gas and water | 79,151 | 1.32 | 73,875 | 1.23 | 58,265 | 0.92 | 76,535 | 1.23 | 60,363 | 0.92 | 66,827 | 0.89 | ||||||||||||||||||||||||
Subtotal | 79,151 | 1.32 | 73,875 | 1.23 | 58,265 | 0.92 | 76,535 | 1.23 | 60,363 | 0.92 | 66,827 | 0.89 | ||||||||||||||||||||||||
Construction: | ||||||||||||||||||||||||||||||||||||
Residential buildings | 154,706 | 2.59 | 142,017 | 2.37 | 164,864 | 2.59 | 147,130 | 2.37 | 170,799 | 2.59 | 212,755 | 2.84 | ||||||||||||||||||||||||
Other constructions | 257,803 | 4.31 | 344,588 | 5.75 | 327,782 | 5.16 | 356,993 | 5.75 | 339,582 | 5.16 | 450,942 | 6.03 | ||||||||||||||||||||||||
Subtotal | 412,509 | 6.90 | 486,605 | 8.12 | 492,646 | 7.75 | 504,123 | 8.12 | 510,381 | 7.75 | 663,697 | 8.87 | ||||||||||||||||||||||||
Commerce: | ||||||||||||||||||||||||||||||||||||
Wholesale | 268,379 | 4.49 | 293,427 | 4.90 | 265,076 | 4.17 | 303,990 | 4.90 | 274,619 | 4.17 | 294,425 | 3.93 | ||||||||||||||||||||||||
Retail, restaurants and hotels | 440,384 | 7.36 | 431,860 | 7.21 | 486,299 | 7.65 | 447,407 | 7.21 | 503,806 | 7.65 | 435,472 | 5.82 | ||||||||||||||||||||||||
Subtotal | 708,763 | 11.85 | 725,287 | 12.11 | 751,375 | 11.82 | 751,397 | 12.11 | 778,425 | 11.82 | 729,897 | 9.75 | ||||||||||||||||||||||||
Transport, Storage and Communications: | ||||||||||||||||||||||||||||||||||||
Transport and storage | 116,180 | 1.94 | 129,240 | 2.16 | 159,426 | 2.50 | 133,893 | 2.16 | 165,165 | 2.51 | 178,529 | 2.39 | ||||||||||||||||||||||||
Communications | 27,585 | 0.46 | 41,424 | 0.69 | 34,810 | 0.55 | 42,915 | 0.69 | 36,063 | 0.55 | 23,806 | 0.32 | ||||||||||||||||||||||||
Subtotal | 143,765 | 2.40 | 170,664 | 2.85 | 194,236 | 3.05 | 176,808 | 2.85 | 201,228 | 3.06 | 202,335 | 2.71 | ||||||||||||||||||||||||
Financial Services: | ||||||||||||||||||||||||||||||||||||
Financial insurance and companies | 630,452 | 10.54 | 540,512 | 9.02 | 601,776 | 9.45 | 559,972 | 9.02 | 623,481 | 9.47 | 757,009 | 10.11 | ||||||||||||||||||||||||
Real estate and other financial services | 545,598 | 9.12 | 587,778 | 9.81 | 664,854 | 10.46 | 608,938 | 9.81 | 688,789 | 10.46 | 681,828 | 9.11 | ||||||||||||||||||||||||
Subtotal | 1,176,050 | 19.66 | 1,128,290 | 18.83 | 1,266,630 | 19.91 | 1,168,910 | 18.83 | 1,312,270 | 19.93 | 1,438,837 | 19.22 | ||||||||||||||||||||||||
Community, Social and Personal Services: | ||||||||||||||||||||||||||||||||||||
Community, social and personal services | 303,296 | 5.06 | 283,342 | 4.73 | 257,975 | 4.05 | 293,542 | 4.72 | 267,262 | 4.06 | 1,024,188 | 13.69 | ||||||||||||||||||||||||
Subtotal | 303,296 | 5.06 | 283,342 | 4.73 | 257,975 | 4.05 | 293,542 | 4.72 | 267,262 | 4.06 | 1,024,188 | 13.69 | ||||||||||||||||||||||||
Consumer Loans | 768,617 | 12.85 | 748,362 | 12.49 | 878,201 | 13.81 | 775,303 | 12.49 | 909,816 | 13.81 | 870,276 | 11.63 | ||||||||||||||||||||||||
Residential Mortgage Loans | 1,139,844 | 19.05 | 1,139,887 | 19.03 | 1,277,531 | 20.10 | 1,180,923 | 19.03 | 1,323,522 | 20.09 | 1,346,319 | 17.99 | ||||||||||||||||||||||||
Total | Ch$ | 5,983,503 | 100.00 | % | Ch$ | 5,991,941 | 100.00 | % | Ch$ | 6,358,010 | 100.00 | % | Ch$ | 6,207,651 | 100.00 | % | Ch$ | 6,586,941 | 100.00 | % | Ch$ | 7,482,350 | 100.00 | % | ||||||||||||
Foreign Country Outstanding Loans
Our cross-border outstanding loans are principally trade-related. These loans include loans to foreign financial institutions and foreign corporations, some of which are guaranteed by their Chilean parent company. The table below lists the total amounts outstanding to borrowers in certain foreign countries at the end of the last three years, and thus does not include foreign trade-related loans to domestic borrowers.
| As of December 31, | As of December 31, | |||||||||||||||||
| 2002 | 2003 | 2004 | 2003 | 2004 | 2005 | |||||||||||||
| (in millions of constant Ch$ as of December 31, 2004) | (in millions of constant Ch$ as of December 31, 2005) | |||||||||||||||||
Albania | Ch$ | 36 | Ch$ | — | Ch$ | — | ||||||||||||
Argentina | 30,832 | 11,637 | 6,192 | Ch$ | 12,056 | Ch$ | 6,415 | Ch$ | 1,308 | |||||||||
Australia | — | — | 9 | — | 9 | 327 | ||||||||||||
Austria | 47 | 319 | 154 | 330 | 160 | 4,396 | ||||||||||||
Belgium | 445 | 392 | 401 | 406 | 415 | 730 | ||||||||||||
Bolivia | 183 | 6 | — | 6 | — | — | ||||||||||||
Brazil | 54,965 | 45,660 | 52,672 | 47,304 | 54,568 | 60,051 | ||||||||||||
British West Indies | 27,717 | 11,118 | 7,250 | 11,518 | 7,511 | 4,452 | ||||||||||||
Canada | 988 | 647 | 425 | 670 | 440 | 1,233 | ||||||||||||
China | 7,819 | 9,181 | 22,774 | 9,512 | 23,594 | 24,204 | ||||||||||||
Colombia | 6,563 | 2,652 | 5,436 | 2,747 | 5,632 | 303 | ||||||||||||
Denmark | 72 | 22 | 6 | 23 | 6 | 15 | ||||||||||||
Ecuador | 88 | 315 | 165 | 326 | 171 | 6 | ||||||||||||
El Salvador | 49 | 36 | 2,400 | 37 | 2,486 | 44 | ||||||||||||
Finland | 264 | 1,147 | 4,025 | 1,188 | 4,170 | 2,414 | ||||||||||||
France | 15,978 | 17,488 | 13,815 | 18,118 | 14,312 | 5,404 | ||||||||||||
Germany | 866 | 3,853 | 4,668 | 3,992 | 4,836 | 710 | ||||||||||||
Holland | 1,236 | 134 | 148 | 139 | 153 | — | ||||||||||||
Hong Kong | 229 | 1,533 | 231 | 1,588 | 239 | 58 | ||||||||||||
India | 559 | 4,768 | 2,545 | 4,940 | 2,637 | 536 | ||||||||||||
Ireland | — | — | 2,929 | |||||||||||||||
Israel | 12 | — | 1 | — | 1 | 69 | ||||||||||||
Italy | 551 | 960 | 3,594 | 995 | 3,723 | 1,892 | ||||||||||||
Japan | 2,231 | 12,950 | 10,924 | |||||||||||||||
Korea | 3,301 | — | — | |||||||||||||||
Kuwait | 18 | — | — | |||||||||||||||
Japan. | 13,416 | 11,317 | 3,450 | |||||||||||||||
Malaysia | — | 18 | — | 19 | — | — | ||||||||||||
Mauricio | — | — | 13 | — | 13 | — | ||||||||||||
Mexico | 49,814 | 38,131 | 28,602 | 39,504 | 29,632 | 11,085 | ||||||||||||
Monaco | — | 31 | — | 32 | — | — | ||||||||||||
Morocco | — | 42 | 32 | 44 | 33 | — | ||||||||||||
Netherlands | — | 4,404 | — | 4,563 | — | — | ||||||||||||
New Zealand | — | 129 | 3 | 134 | 3 | 65 | ||||||||||||
Norway | — | 1,131 | 12 | 1,172 | 12 | 3 | ||||||||||||
Panama | 12,887 | 6,238 | 4,553 | 6,463 | 4,717 | 721 | ||||||||||||
Peru | 20,417 | 7,999 | 16,499 | 8,287 | 17,093 | 5,962 | ||||||||||||
Portugal | — | 111 | 518 | 115 | 537 | 476 | ||||||||||||
Singapore | 4,445 | 40 | 51 | 41 | 53 | 972 | ||||||||||||
Slovenia | — | 57 | — | 59 | — | — | ||||||||||||
South Africa | 264 | 43 | — | 45 | — | 10 | ||||||||||||
South Korea | 562 | 1,195 | 16,492 | 1,238 | 17,086 | 7,112 | ||||||||||||
Spain | 4,924 | 6,349 | 5,453 | 6,578 | 5,649 | 6 | ||||||||||||
Switzerland | 278 | 566 | 96 | 586 | 99 | — | ||||||||||||
Sweden | 1,589 | 1,521 | 1,524 | 1,576 | 1,579 | — | ||||||||||||
Taiwan | 528 | 108 | 2,029 | 112 | 2,102 | 4,059 | ||||||||||||
United Arab Emirates | 217 | 530 | 609 | 549 | 631 | 465 | ||||||||||||
United Kingdom | 6,985 | 2,692 | 39,543 | 2,789 | 40,967 | 31,406 | ||||||||||||
United States | 28,771 | 16,009 | 24,787 | 16,585 | 25,679 | 17,682 | ||||||||||||
Uruguay | 2 | 3,111 | — | 3,223 | — | — | ||||||||||||
Venezuela | — | 6,173 | 5,634 | 6,395 | 5,837 | 5,191 | ||||||||||||
Yugoslavia | 161 | — | — | |||||||||||||||
Total | Ch$ | 286,893 | Ch$ | 221,446 | Ch$ | 284,285 | Ch$ | 229,420 | Ch$ | 294,517 | Ch$ | 199,746 | ||||||
We also maintain deposits abroad, as needed to conduct our foreign trade transactions and manage liquidity. The table below lists the largest amounts of foreign deposits by country at the end of the past three years:
| December 31, | |||||||||
| 2002 | 2003 | 2004 | |||||||
| (in millions of constant Ch$ as of December 31, 2004) | |||||||||
Australia | Ch$ | 41 | Ch$ | 45 | Ch$ | 56 | |||
Austria | 42 | 64 | 2 | ||||||
Belgium | 75 | 208 | 108 | ||||||
Canada | 274 | 376 | 252 | ||||||
China | — | 166 | 169 | ||||||
Denmark | 686 | 517 | 65 | ||||||
Finland | 13 | 8 | 11 | ||||||
France | 73 | 206 | 423 | ||||||
Germany | 2,451 | 4,362 | 4,207 | ||||||
Italy | 894 | 1,500 | 2,094 | ||||||
Japan | 339 | 867 | 1,201 | ||||||
Netherlands | 91 | 242 | 149 | ||||||
Norway | 43 | 31 | 50 | ||||||
Spain | 82 | 182 | 176 | ||||||
Sweden | 123 | 86 | 3 | ||||||
Switzerland | 236 | 201 | 205 | ||||||
United Kingdom | 378 | 445 | 694 | ||||||
United States | 89,789 | 89,112 | 115,575 | ||||||
Total | Ch$ | 95,630 | Ch$ | 98,618 | Ch$ | 125,440 | |||
| December 31, | |||||||||
| 2003 | 2004 | 2005 | |||||||
| (in millions of constant Ch$ as of December 31, 2005) | |||||||||
Australia | Ch$ | 47 | Ch$ | 58 | Ch$ | 23 | |||
Austria | 66 | 2 | 39 | ||||||
Belgium | 215 | 112 | 85 | ||||||
Canada | 390 | 261 | 309 | ||||||
China | 172 | 175 | 62 | ||||||
Denmark | 536 | 67 | 23 | ||||||
Finland | 8 | 11 | 14 | ||||||
France | 213 | 438 | 491 | ||||||
Germany | 4,519 | 4,358 | 3,712 | ||||||
Italy | 1,554 | 2,169 | 11,970 | ||||||
Japan | 898 | 1,244 | 1,445 | ||||||
Netherlands | 251 | 154 | 58 | ||||||
Norway | 32 | 52 | 33 | ||||||
Spain | 189 | 182 | 312 | ||||||
Sweden | 89 | 3 | 31 | ||||||
Switzerland | 208 | 212 | 168 | ||||||
United Kingdom | 461 | 719 | 903 | ||||||
United States | 92,320 | 119,736 | 32,759 | ||||||
Total | Ch$ | 102,168 | Ch$ | 129,953 | Ch$ | 52,437 | |||
Credit Review Process
Our credit review system requires that two or more loan officers approve any loan to our customers, and that at least one of the loan officers has sufficient authority to cover our total risk exposure with respect to that customer.
The evaluation of total customer credit risk takes into account the direct risk outstanding, the added risk involved in the proposed transaction, the indirect risks associated with guarantees or security given by the customer and the risk associated with other entities or individuals who have a direct or indirect affiliation with the customer, including, in each case, outstanding principal (adjusted for inflation), interest and the balance of any unused lines of credit and other credit transactions approved but not completed.
Transactions in which the total customer credit risk is more than UF 150,000 (approximately Ch$2,5982,696 million) require the approval of a credit committee, which includes three directors and our chief executive officer. Transactions in which the total customer credit risk is equal to or less than UF 150,000 may be approved by other executives, depending on the amount involved, as follows:
Approved by | Limit in UF | |
Credit committee including members of the board of directors | up to legal limits | |
Chief executive officer and chairman | up to UF 250,000 | |
Chief executive officer | up to UF 150,000 | |
Senior credit risk officer | up to UF | |
Executive credit risk officers | up to UF | |
Other credit risk officers | up to UF | |
Executive vice president of corporate banking | up to UF 50,000 | |
Other department heads | up to UF | |
Other officers |
In addition to reviewing the credit limit, the business area extending the credit must review the terms of the loan, the interest rate and any security to be obtained.
To evaluate a customer’s credit risk, our commercial executives use various databases that provide information such as the customer’s profile, indebtedness to us, financial statements, monthly sales information, profitability reports, indebtedness to other Chilean financial institutions and payment history with other creditors. For this purpose, the Chilean Superintendency of Banks makes information regarding a customer’s indebtedness within the financial system available to banks. For individual customers, scoring and other automated systems are used to determine the customer’s profile and payment capacity in terms of income, education, family obligations, other financial obligations and other factors.
Our credit process is based on credit policies approved by our board of directors and procedures established by the credit committee. The credit risk management area is responsible for evaluating for us in the aggregate the risk presented by our current or potential customers. We also rely upon the collective efforts of our professional analysts who conduct reviews at the request of any of our commercial divisions and senior management. These reports analyze the amount of a credit, its use, its term, the customer’s financial situation, the customer’s profile and the market in which the customer operates. These reports are prepared in four different formats: in-depth, summary, follow-up and project analysis. The risk control division reviews periodically the quality of our loans, including the related loan classifications. This division has a team of inspectors who audit on an ongoingon-going basis the compliance with the credit review process by the commercial executives who are involved in the credit analysis process, the various categories of risk assigned to customers, the reports on past due loans and our evaluation of debtors.
Classification of Loan Portfolio and Allowances for Loan Losses under the Previous Guidelines
Prior to January 1, 2004, when the Chilean Superintendency of Banks amended its guidelines, banks classified their loan portfolios and determined allowances for loan losses using different guidelines. For a description of the new classifications in effect under the amended guidelines and the categories and allowance percentages under the amended guidelines, see “—Regulation and Supervision.”
Classification of Loan Portfolio under the Previous Guidelines
Under the previous guidelines, loans were divided into consumer loans, residential mortgage loans and commercial loans (which included all loans other than consumer loans and residential mortgage loans). In the case of commercial loans, the classification was based on the estimated losses on all loans outstanding to the borrower, as determined by the bank.us. In the case of consumer and residential mortgage loans, the extent to which payments were overdue determined the classification. Commercial and consumer loans were rated under the previous guidelines as A, B, B-, C or D, while residential mortgage loans were rated only as A, B or B- (due to collateral).
The allowances required for each category of loans under the previous guidelines were as follows:
| Commercial loans range of estimated losses | Consumer loans past due status(1) | Residential mortgage loans past due status(1) | Allowances as a percentage of aggregate exposure | Commercial loans range of estimated losses | Consumer loans past due status(1) | Residential mortgage loans past due status(1) | Allowances as a percentage of aggregate | |||||||||||||||||||||||||||
Category | From | To | From | To | From | To | From | To | From | To | From | To | ||||||||||||||||||||||
| (Days) | (Days) | (Days) | (Days) | |||||||||||||||||||||||||||||||
A | — | — | — | — | — | — | — | — | — | — | — | — | — | — | ||||||||||||||||||||
B | 1 | % | 5 | % | 1 | 30 | 1 | 180 | 1 | % | 1 | % | 5 | % | 1 | 30 | 1 | 180 | 1 | % | ||||||||||||||
B- | 5 | 39 | 31 | 60 | 181 | >81 | 20 | 5 | 39 | 31 | 60 | 181 | >81 | 20 | ||||||||||||||||||||
C | 40 | 79 | 61 | 120 | — | — | 60 | 40 | 79 | 61 | 120 | — | — | 60 | ||||||||||||||||||||
D | 80 | % | 100 | % | >121 | 121 | — | — | 90 | % | 80 | % | 100 | % | >121 | 121 | — | — | 90 | % | ||||||||||||||
| (1) | In addition, we maintained additional allowances for consumer and residential mortgage loans, including renegotiated loans. |
The previous guidelines applicable to commercial loans required that we classify the greater of:
The previous guidelines also required that we classify 100% of our residential mortgage and consumer loans. For these purposes, the loan amount included outstanding principal, whether or not past due, and accrued and unpaid interest.
According to our internal credit policies, we classified our loans through December 31, 2003 using the previous guidelines. The criteria for determining the range of estimated losses for purposes of the classification of commercial loans was as follows:
Category A: | A borrower’s loans were Category “A” if we had no doubt as to the borrower’s ability to repay the loans in a timely manner, except to the extent reflected in the loan’s original terms, including all interest due, and the revenues generated from the business of the borrower are sufficient to service the debt. If the borrower’s business did not generate the revenues needed for debt service, or if repayment depended on revenues generated by another entity, its loans were not included in this category, even if fully secured. | |
Category B: | This category included loans outstanding to borrowers who had shown some degree of non-compliance with their obligations under the original conditions of their loans, but whose past financial records and market history indicated that such non-compliance should be temporary and, in any case, should not significantly affect the terms for repayment. This category also included loans to customers involved in economic activities that represented a higher risk for us. Category “B” was also the highest category for loans outstanding to borrowers whose source of repayment depended on revenues generated by another entity, and loans outstanding to borrowers whose business did not generate the revenues needed for debt service, but only if the loans were fully secured. | |
Category | Loans included in this category were principally loans outstanding to borrowers who were experiencing financial difficulties and whose operational revenues or liquid assets were insufficient to service the loans and where the security for the loan covered 61% to 95% of the outstanding amount. Also included in this category were loans outstanding to borrowers whose financial history was insufficient or difficult to establish. Loans bearing interest rates that, due to our cost of funds, generate a financial loss of between 5% and 39% of the outstanding amount were also included in this category. Our internal guidelines prohibited us from categorizing as better than | |
Category C: | This category included loans outstanding to borrowers who were experiencing serious financial difficulties and whose operational revenues or liquid assets were insufficient to service the loans and where the security for the loan would cover 21% to 60% of the outstanding amount. Loans bearing interest rates that, due to our cost of funds, generate a financial loss of between 40% and 79% of the outstanding amount were also included in this category. We expected to suffer some degree of loss with respect to loans to borrowers in this category. | |
| Category D: | This category included loans outstanding to borrowers for which the estimated recovery amount on all loans is 20% or less. A charge-off of most of these outstanding loans was expected. | |
Allowances for Loan Losses under the Previous Guidelines
The Chilean Superintendency of Banks amended its regulations with respect to allowances effective January 1, 2004. Under the previous guidelines, the minimum required allowances for loan losses was the greater of (1) a bank’s global allowances for loan losses and (2) its aggregate individual allowances for loan losses. Additionally, a bank was permitted to maintain voluntary allowances in excess of the required minimum so as to provide additional coverage for potential loan losses. We historically followed the practice of maintaining voluntary allowances.
Global allowances for loan losses. Under the previous guidelines, the amount of global allowances for loan losses required to be maintained by a bank was equal to the aggregate amount of its outstanding loans multiplied by the greater of (1) the bank’sour risk index, as defined below, and (2) 0.75%.
A bank’s risk index was based on the classification of its loans, determined as described above. Under the previous guidelines, the index was computed as follows. First, the aggregate amount of evaluated loans in each category from A through D was multiplied by the corresponding required percentage determining allowances for loan losses. The percentages under the previous guidelines were as follows:
Category | Provision Percentage | ||
A | 0 | % | |
B | 1 | ||
B- | 20 | ||
C | 60 | ||
D | 90 | % |
The risk index itself was then calculated by dividing (1) the aggregate amount so calculated by (2) the aggregate amount (i.e., the outstanding principal, whether or not past due, and accrued and unpaid interest) of all evaluated loans.
The chart below illustrates the evolution of our consolidated risk index over the last five years under the previous guidelines, with the exception of 2005 and 2004:
Consolidated Risk Index | |||
2000 | 2.01 | % | |
2001 | 2.42 | ||
2002 | 3.00 | ||
2003 | 2.36 | ||
2004(1) | 2.23 | % | |
Consolidated Risk Index At December 31, | |||
2001 | 2.42 | % | |
2002 | 3.00 | ||
2003 | 2.36 | ||
2004(1) | 2.23 | ||
2005(1) | 1.72 | % | |
| (1) | The new guidelines determine the risk index, by dividing allowances for loan losses by total loans. |
The chart below illustrates the evolution of our unconsolidated risk index over the last five years years under the previous guidelines, with the exception of 2005 and 2004:
Unconsolidated Risk Index | |||
2000 | 2.05 | % | |
2001 | 2.48 | ||
2002 | 3.10 | ||
2003 | 2.41 | ||
2004(1) | 2.23 | % | |
Unconsolidated Risk Index At December 31, | |||
2001 | 2.48 | % | |
2002 | 3.10 | ||
2003 | 2.41 | ||
2004(1) | 2.23 | ||
2005(1) | 1.70 | % | |
| (1) | The new guidelines determine the risk index, by dividing allowances for loan losses by total loans. |
According to the Chilean Superintendency of Banks, the average risk index of all financial institutions in Chile, both foreign and domestic, was 2.01%1.61% as of OctoberDecember 31, 2004.2005. At the same date, our average unconsolidated risk index was 2.39%1.70%. Our average unconsolidated risk index has continued to improve since 2002 when it was highest as a result of our merger with Banco de A. Edwards in that year. As of OctoberDecember 31, 2004, our unconsolidated risk index was greater than the average for all financial institutions in Chile primarily as a result of higher additional allowances maintained by us as compared to those maintained by the financial system.
Individual allowances for loan losses. Under the previous guidelines, Chilean banks were required to establish individual loan loss reserves for loans that are more than 90 days past due. The individual allowances for loan losses were required to be equal to 100% of each overdue loan or the portion of such loan that is not secured with collateral acceptable to the Chilean Superintendency of Banks. Individual allowances for loan losses, however, were required only if, and to the extent that, they exceed in the aggregate the global allowances for loan losses.
Voluntary allowances for loan losses. Under the previous guidelines, we followed an allowance policy that included recording voluntary allowances for loan losses beyond what was required by the Chilean Superintendency of Banks, where changes in the portfolio concentrations or economic considerations affecting or reasonably expected to affect the credit payment capacity of borrowers were not adequately addressed through regulatorily mandated allowances. However, under the current guidelines the concept of voluntary allowances for loan losses has been eliminated.
The table below sets forth our allowances for loan losses in accordance with the regulations in effect during each year.
| As of December 31, | As of December 31, | |||||||||||||||||||||||||||||||||||||||
| 2000 | 2001 | 2002 | 2003 | 2004 | 2001 | 2002 | 2003 | 2004 | 2005 | |||||||||||||||||||||||||||||||
| (in millions of constant Ch$ as of December 31, 2004, except for percentages) | (in millions of constant Ch$ as of December 31, 2005, except for percentages) | |||||||||||||||||||||||||||||||||||||||
Allowances based on risk index | Ch$ | 82,589 | Ch$ | 99,575 | Ch$ | 191,362 | Ch$ | 151,318 | Ch$ | 153,742 | Ch$ | 103,160 | Ch$ | 198,251 | Ch$ | 156,766 | Ch$ | 159,318 | Ch$ | 141,305 | ||||||||||||||||||||
Allowances based on 0.75% | 30,817 | 30,860 | 47,840 | 48,088 | n/a | 31,971 | 49,563 | 49,820 | ||||||||||||||||||||||||||||||||
Global allowances for loan losses | 71,913 | 88,829 | 148,113 | 127,111 | n/a | 92,028 | 153,446 | 131,686 | ||||||||||||||||||||||||||||||||
Individual allowances for loan losses | 14,134 | 16,618 | 54,283 | 35,756 | — | 17,216 | 56,237 | 37,043 | — | — | ||||||||||||||||||||||||||||||
Required minimum allowances | 86,047 | 105,447 | 202,396 | 162,867 | 134,030 | 109,244 | 209,683 | 168,729 | 138,896 | 120,309 | ||||||||||||||||||||||||||||||
Voluntary allowances | 38,111 | 35,753 | 21,282 | 21,071 | — | 37,040 | 22,048 | 21,830 | — | — | ||||||||||||||||||||||||||||||
Additional allowances | — | — | — | — | 19,712 | — | — | — | 20,422 | 20,996 | ||||||||||||||||||||||||||||||
Total allowances for loan losses | Ch$ | 124,158 | Ch$ | 141,200 | Ch$ | 223,678 | Ch$ | 183,938 | Ch$ | 153,742 | Ch$ | 146,284 | Ch$ | 231,731 | Ch$ | 190,559 | Ch$ | 159,318 | Ch$ | 141,305 | ||||||||||||||||||||
Total allowances for loan losses as a percentage of total loans | 3.02 | % | 3.43 | % | 3.51 | % | 2.87 | % | 2.23 | % | 3.43 | % | 3.51 | % | 2.87 | % | 2.23 | % | 1.72 | % | ||||||||||||||||||||
Amended Guidelines
The Chilean Superintendency of Banks amended its guidelines for the classification of loan portfolios and the calculation and maintenance of allowances effective as of January 1, 2004. As a result, the information presented in the tables below for periods prior to January 1, 2004 has been prepared in accordance with the previous guidelines and information for periods beginning on or after January 1, 2004 has been prepared in accordance with the amended guidelines. For a description of the new classifications in effect under the amended guidelines and the categories and allowance percentages under the amended guidelines, see “—Regulation and Supervision.”
Analysis of Our Loan Classification
The following tables provide statistical data regarding the classification of our loans at the end of each of the last five years. As discussed above, our risk analysis system requires that loans to all customers be evaluated and classified, including past due and contingent loans:
| As of December 31, 2000 | As of December 31, 2001 | |||||||||||||||||||||||||||||||||||||
Category | Commercial Loans | Consumer Loans | Residential Mortgage Loans | Total Loans | Percentage of Evaluated Loans | Commercial Loans | Consumer Loans | Residential Mortgage Loans | Total Loans | Percentage of Evaluated Loans | ||||||||||||||||||||||||||||
| (in millions of constant Ch$ as of December 31, 2004) | (in millions of constant Ch$ as of December 31, 2005) | |||||||||||||||||||||||||||||||||||||
A | Ch$ | 1,518,120 | Ch$ | 183,426 | Ch$ | 494,301 | Ch$ | 2,195,847 | 53.98 | % | Ch$ | 1,434,940 | Ch$ | 201,745 | Ch$ | 559,487 | Ch$ | 2,196,172 | 52.10 | % | ||||||||||||||||||
B | 1,581,083 | 15,804 | 38,594 | 1,635,481 | 40.21 | 1,688,891 | 18,278 | 43,659 | 1,750,828 | 41.54 | ||||||||||||||||||||||||||||
B– | 186,823 | 5,210 | 6,824 | 198,857 | 4.89 | 183,812 | 6,188 | 7,671 | 197,671 | 4.69 | ||||||||||||||||||||||||||||
C | 23,385 | 4,057 | — | 27,442 | 0.67 | 56,176 | 4,088 | — | 60,264 | 1.43 | ||||||||||||||||||||||||||||
D | 7,273 | 2,815 | — | 10,088 | 0.25 | 7,226 | 2,752 | — | 9,978 | 0.24 | ||||||||||||||||||||||||||||
Total evaluated loans | Ch$ | 3,316,684 | Ch$ | 211,312 | Ch$ | 539,719 | Ch$ | 4,067,715 | 100.00 | % | Ch$ | 3,371,045 | Ch$ | 233,051 | Ch$ | 610,817 | Ch$ | 4,214,913 | 100.00 | % | ||||||||||||||||||
Total loans | Ch$ | 3,357,855 | Ch$ | 211,312 | Ch$ | 539,719 | Ch$ | 4,108,886 | Ch$ | 3,418,949 | Ch$ | 233,051 | Ch$ | 610,817 | Ch$ | 4,262,817 | ||||||||||||||||||||||
Percentage evaluated | 98.77 | % | 100.00 | % | 100.00 | % | 99.00 | % | 98.60 | % | 100.00 | % | 100.00 | % | 98.88 | % | ||||||||||||||||||||||
| As of December 31, 2001 | As of December 31, 2002 | |||||||||||||||||||||||||||||||||||||
Category | Commercial Loans | Consumer Loans | Residential Mortgage Loans | Total Loans | Percentage of Evaluated Loans | Commercial Loans | Consumer Loans | Residential Mortgage Loans | Total Loans | Percentage of Evaluated Loans | ||||||||||||||||||||||||||||
| (in millions of constant Ch$ as of December 31, 2004) | (in millions of constant Ch$ as of December 31, 2005) | |||||||||||||||||||||||||||||||||||||
A | Ch$ | 1,385,077 | Ch$ | 194,735 | Ch$ | 540,045 | Ch$ | 2,119,857 | 52.10 | % | Ch$ | 2,372,243 | Ch$ | 379,829 | Ch$ | 831,932 | Ch$ | 3,584,004 | 54.69 | % | ||||||||||||||||||
B | 1,630,204 | 17,643 | 42,142 | 1,689,989 | 41.54 | 2,419,190 | 41,555 | 67,507 | 2,528,252 | 38.57 | ||||||||||||||||||||||||||||
B– | 177,425 | 5,973 | 7,404 | 190,802 | 4.69 | 232,996 | 10,094 | 20,954 | 264,044 | 4.03 | ||||||||||||||||||||||||||||
C | 54,224 | 3,946 | — | 58,170 | 1.43 | 128,956 | 8,667 | — | 137,623 | 2.10 | ||||||||||||||||||||||||||||
D | 6,975 | 2,656 | — | 9,631 | 0.24 | 32,815 | 7,423 | — | 40,238 | 0.61 | ||||||||||||||||||||||||||||
Total evaluated loans | Ch$ | 3,253,905 | Ch$ | 224,953 | Ch$ | 589,591 | Ch$ | 4,068,449 | 100.00 | % | Ch$ | 5,186,200 | Ch$ | 447,568 | Ch$ | 920,393 | Ch$ | 6,554,161 | 100.00 | % | ||||||||||||||||||
Total loans | Ch$ | 3,300,144 | Ch$ | 224,953 | Ch$ | 589,591 | Ch$ | 4,114,688 | Ch$ | 5,240,400 | Ch$ | 447,568 | Ch$ | 920,393 | Ch$ | 6,608,361 | ||||||||||||||||||||||
Percentage evaluated | 98.60 | % | 100.00 | % | 100.00 | % | 98.88 | % | 98.97 | % | 100.00 | % | 100.00 | % | 99.18 | % | ||||||||||||||||||||||
| As of December 31, 2002 | As of December 31, 2003 | |||||||||||||||||||||||||||||||||||||
Category | Commercial Loans | Consumer Loans | Residential Mortgage Loans | Total Loans | Percentage of Evaluated Loans | Commercial Loans | Consumer Loans | Residential Mortgage Loans | Total Loans | Percentage of Evaluated Loans | ||||||||||||||||||||||||||||
| (in millions of constant Ch$ as of December 31, 2004) | (in millions of constant Ch$ as of December 31, 2005) | |||||||||||||||||||||||||||||||||||||
A | Ch$ | 2,289,810 | Ch$ | 366,630 | Ch$ | 803,023 | Ch$ | 3,459,463 | 54.69 | % | Ch$ | 2,365,028 | Ch$ | 455,331 | Ch$ | 872,991 | Ch$ | 3,693,350 | 55.97 | % | ||||||||||||||||||
B | 2,335,125 | 40,111 | 65,161 | 2,440,397 | 38.57 | 2,451,744 | 34,311 | 74,802 | 2,560,857 | 38.82 | ||||||||||||||||||||||||||||
B– | 224,900 | 9,743 | 20,226 | 254,869 | 4.03 | 190,875 | 8,873 | 22,397 | 222,145 | 3.37 | ||||||||||||||||||||||||||||
C | 124,475 | 8,366 | — | 132,841 | 2.10 | 70,189 | 7,335 | — | 77,524 | 1.18 | ||||||||||||||||||||||||||||
D | 31,675 | 7,165 | — | 38,840 | 0.61 | 37,923 | 5,414 | — | 43,337 | 0.66 | ||||||||||||||||||||||||||||
Total evaluated loans | Ch$ | 5,005,985 | Ch$ | 432,015 | Ch$ | 888,410 | Ch$ | 6,326,410 | 100.00 | % | Ch$ | 5,115,759 | Ch$ | 511,264 | Ch$ | 970,190 | Ch$ | 6,597,213 | 100.00 | % | ||||||||||||||||||
Total loans | Ch$ | 5,058,302 | Ch$ | 432,015 | Ch$ | 888,410 | Ch$ | 6,378,727 | Ch$ | 5,161,164 | Ch$ | 511,264 | Ch$ | 970,190 | Ch$ | 6,642,618 | ||||||||||||||||||||||
Percentage evaluated | 98.97 | % | 100.00 | % | 100.00 | % | 99.18 | % | 99.12 | % | 100.00 | % | 100.00 | % | 99.32 | % | ||||||||||||||||||||||
Category A B B– C D Total evaluated loans Total loans Percentage evaluated As of December 31, 2003 Commercial
Loans Consumer
Loans Residential
Mortgage
Loans Total Loans Percentage
of Evaluated
Loans (in millions of constant Ch$ as of December 31, 2004) Ch$ 2,282,846 Ch$ 439,509 Ch$ 842,655 Ch$ 3,565,010 55.97 % 2,366,548 33,119 72,203 2,471,870 38.82 184,242 8,565 21,619 214,426 3.37 67,750 7,080 — 74,830 1.18 36,605 5,226 — 41,831 0.66 Ch$ 4,937,991 Ch$ 493,499 Ch$ 936,477 Ch$ 6,367,967 100.00 % Ch$ 4,981,817 Ch$ 493,499 Ch$ 936,477 Ch$ 6,411,793 99.12 % 100.00 % 100.00 % 99.32 %
| As of December 31, 2004 (1) | As of December 31, 2004 (1) | |||||||||||||||||||||||||||||
Individual Analysis Category | Commercial Loans | Consumer Loans | Residential Mortgage Loans | Total Loans | Percentage of Evaluated Loans | Commercial Loans | Consumer Loans | Residential Mortgage Loans | Total Loans | Percentage of Evaluated Loans | ||||||||||||||||||||
| (in millions of constant Ch$ as of December 31, 2004) | (in millions of constant Ch$ as of December 31, 2005) | |||||||||||||||||||||||||||||
A1 | Ch$ | 9,023 | — | — | Ch$ | 9,023 | 0.18 | % | Ch$ | 9,348 | — | — | Ch$ | 9,348 | 0.18 | % | ||||||||||||||
A2 | 1,520,641 | Ch$ | 14,985 | Ch$ | 50,452 | 1,586,078 | 31.38 | 1,575,384 | Ch$ | 15,524 | Ch$ | 52,268 | 1,643,176 | 31.38 | ||||||||||||||||
A3 | 1,323,283 | 12,405 | 32,056 | 1,367,744 | 27.06 | 1,370,921 | 12,852 | 33,210 | 1,416,983 | 27.06 | ||||||||||||||||||||
B | 1,606,649 | 27,867 | 60,499 | 1,695,015 | 33.54 | 1,664,488 | 28,870 | 62,677 | 1,756,035 | 33.54 | ||||||||||||||||||||
C1 | 184,460 | 6,097 | 9,415 | 199,972 | 3.96 | 191,101 | 6,316 | 9,754 | 207,171 | 3.96 | ||||||||||||||||||||
C2 | 59,793 | 863 | 4,197 | 64,853 | 1.28 | 61,946 | 894 | 4,348 | 67,188 | 1.28 | ||||||||||||||||||||
C3 | 27,732 | 329 | 1,000 | 29,061 | 0.57 | 28,730 | 341 | 1,036 | 30,107 | 0.57 | ||||||||||||||||||||
C4 | 49,147 | 373 | 947 | 50,467 | 1.00 | 50,916 | 386 | 981 | 52,283 | 1.00 | ||||||||||||||||||||
D1 | 34,807 | 250 | 90 | 35,147 | 0.70 | 36,060 | 259 | 93 | 36,412 | 0.70 | ||||||||||||||||||||
D2 | 16,020 | 490 | 307 | 16,817 | 0.33 | 16,597 | 508 | 318 | 17,423 | 0.33 | ||||||||||||||||||||
Subtotal evaluated loans | Ch$ | 4,831,555 | Ch$ | 63,659 | Ch$ | 158,963 | Ch$ | 5,054,177 | 100.00 | % | Ch$ | 5,005,491 | Ch$ | 65,950 | Ch$ | 164,685 | Ch$ | 5,236,126 | 100.00 | % | ||||||||||
| (1) | This information has been prepared in accordance with the amended guidelines. |
| As of December 31, 2004 (1) | As of December 31, 2004 (1) | |||||||||||||||||||||||||||||||||||||
Group Analysis Category | Commercial Loans | Consumer Loans | Residential Mortgage Loans | Total Loans | Percentage of Evaluated Loans | Commercial Loans | Consumer Loans | Residential Loans | Total Loans | Percentage of Evaluated Loans | ||||||||||||||||||||||||||||
| (in millions of constant Ch$ as of December 31, 2004) | (in millions of constant Ch$ as of December 31, 2005) | |||||||||||||||||||||||||||||||||||||
A | Ch$ | 151,326 | Ch$ | 572,760 | Ch$ | 915,248 | Ch$ | 1,639,334 | 89.94 | % | Ch$ | 156,774 | Ch$ | 593,379 | Ch$ | 948,197 | Ch$ | 1,698,350 | 89.94 | % | ||||||||||||||||||
B | 46,057 | 38,524 | 46,937 | 131,518 | 7.21 | 47,715 | 39,911 | 48,627 | 136,253 | 7.21 | ||||||||||||||||||||||||||||
B- | 11,047 | 8,638 | 17,340 | 37,025 | 2.03 | 11,445 | 8,949 | 17,964 | 38,358 | 2.03 | ||||||||||||||||||||||||||||
C | 1,651 | 6,580 | — | 8,231 | 0.45 | 1,710 | 6,817 | — | 8,527 | 0.45 | ||||||||||||||||||||||||||||
D | 1,410 | 5,384 | — | 6,794 | 0.37 | 1,461 | 5,578 | — | 7,039 | 0.37 | ||||||||||||||||||||||||||||
Subtotal evaluated loans | Ch$ | 211,491 | Ch$ | 631,886 | Ch$ | 979,525 | Ch$ | 1,822,902 | 100.00 | % | Ch$ | 219,105 | Ch$ | 654,634 | Ch$ | 1,014,788 | Ch$ | 1,888,527 | 100.00 | % | ||||||||||||||||||
Total evaluated loans | Ch$ | 5,043,046 | Ch$ | 695,545 | Ch$ | 1,138,488 | Ch$ | 6,877,079 | Ch$ | 5,224,596 | Ch$ | 720,584 | Ch$ | 1,179,473 | Ch$ | 7,124,653 | ||||||||||||||||||||||
Total loans | Ch$ | 5,054,878 | Ch$ | 695,545 | Ch$ | 1,138,488 | Ch$ | 6,888,911 | Ch$ | 5,236,897 | Ch$ | 720,584 | Ch$ | 1,179,473 | Ch$ | 7,136,954 | ||||||||||||||||||||||
Percentage evaluated | 99.77 | % | 100.00 | % | 100.00 | % | 99.83 | % | 99.77 | % | 100.00 | % | 100.00 | % | 99.83 | % | ||||||||||||||||||||||
| (1) | This information has been prepared in accordance with the amended guidelines. |
| As of December 31, 2005 (1) | |||||||||||||||
Individual Analysis Category | Commercial Loans | Consumer Loans | Residential Mortgage Loans | Total Loans | Percentage of Evaluated Loans | ||||||||||
| (in millions of constant Ch$ as of December 31, 2005) | |||||||||||||||
A1 | Ch$ | 12,705 | — | — | Ch$ | 12,705 | 0.21 | % | |||||||
A2 | 1,745,967 | Ch$ | 17,774 | Ch$ | 51,723 | 1,815,464 | 30.12 | ||||||||
A3 | 1,738,621 | 13,231 | 32,138 | 1,783,990 | 29.60 | ||||||||||
B | 1,970,436 | 40,723 | 76,953 | 2,088,112 | 34.64 | ||||||||||
C1 | 178,429 | 7,035 | 8,771 | 194,235 | 3.22 | ||||||||||
C2 | 41,060 | 1,510 | 4,769 | 47,339 | 0.79 | ||||||||||
C3 | 15,741 | 401 | 1,164 | 17,306 | 0.29 | ||||||||||
C4 | 31,828 | 376 | 405 | 32,609 | 0.54 | ||||||||||
D1 | 21,957 | 376 | 413 | 22,746 | 0.38 | ||||||||||
D2 | 12,059 | 793 | 67 | 12,919 | 0.21 | ||||||||||
Subtotal evaluated loans | Ch$ | 5,768,803 | Ch$ | 82,219 | Ch$ | 176,403 | Ch$ | 6,027,425 | 100.00 | % | |||||
| (1) | This information has been prepared in accordance with the amended guidelines. |
Group Analysis Category Residential Loans Total Loans Percentage of Evaluated Loans A B B- C D Subtotal evaluated loans Total evaluated loans Total loans Percentage evaluated As of December 31, 2005 (1) Commercial
Loans Consumer
Loans
Mortgage (in millions of constant Ch$ as of December 31, 2005) Ch$ 150,917 Ch$ 719,631 Ch$ 1,113,052 Ch$ 1,983,600 91.57 % 48,416 39,759 42,563 130,738 6.03 9,054 10,424 14,609 34,087 1.57 1,210 8,477 — 9,687 0.45 807 7,504 — 8,311 0.38 Ch$ 210,404 Ch$ 785,795 Ch$ 1,170,224 Ch$ 2,166,423 100.00 % Ch$ 5,979,207 Ch$ 868,014 Ch$ 1,346,627 Ch$ 8,193,848 Ch$ 5,991,283 Ch$ 868,014 Ch$ 1,346,627 Ch$ 8,205,924 99.80 % 100.00 % 100.00 % 99.85 %
| (1) | This information has been prepared in accordance with the amended guidelines. |
Classification of Loan Portfolio Based on the Borrower’s Payment Performance
Interest and indexation readjustments from overdue loans are only recognized when and to the extent effectively received. Overdue loans are classified in groups of one to 29 days overdue, 30 to 89 days overdue, and 90 or more days overdue, or past due loans.
Under the previous guidelines, past due loans were required to be covered by individual allowances for loan losses equivalent to 100% of any unsecured portion thereof, but only if, and to the extent that, the aggregate of all allowances for loan losses exceeded global allowance for loan losses. The concept of individual allowances has been eliminated by the amended regulations. See “—Classification of Loan Portfolio and Allowances for Loan Losses under the Previous Guidelines—Allowances for Loan Losses under the Previous Guidelines—Individual Allowances for Loan Losses.”
The following table sets forth as of December 31 of each of the last five years the amounts that are current as to payments of principal and interest and the amounts that are overdue:
| Domestic Loans | ||||||||||||||||||||
| As of December 31, | ||||||||||||||||||||
| 2000 | 2001 | 2002 | 2003 | 2004 | ||||||||||||||||
| (in millions of constant Ch$ as of December 31, 2004) | ||||||||||||||||||||
Current | Ch$ | 3,784,090 | Ch$ | 3,820,988 | Ch$ | 5,893,869 | Ch$ | 6,047,161 | Ch$ | 6,480,397 | ||||||||||
Overdue 1-29 days | 13,289 | 17,764 | 27,141 | 21,091 | 27,958 | |||||||||||||||
Overdue 30-89 days | 10,451 | 6,730 | 23,019 | 13,954 | 11,586 | |||||||||||||||
Overdue 90 days or more (“past due”) | 45,285 | 49,707 | 147,805 | 108,141 | 84,685 | |||||||||||||||
Total loans | Ch$ | 3,853,115 | Ch$ | 3,895,189 | Ch$ | 6,091,834 | Ch$ | 6,190,347 | Ch$ | 6,604,626 | ||||||||||
| Foreign Loans | ||||||||||||||||||||
| As of December 31, | ||||||||||||||||||||
| 2000 | 2001 | 2002 | 2003 | 2004 | ||||||||||||||||
| (in millions of constant Ch$ as of December 31, 2004) | ||||||||||||||||||||
Current | Ch$ | 245,245 | Ch$ | 218,135 | Ch$ | 284,652 | Ch$ | 221,446 | Ch$ | 284,285 | ||||||||||
Overdue 1-29 days | — | 363 | — | — | — | |||||||||||||||
Overdue 30-89 days | — | 47 | — | — | — | |||||||||||||||
Overdue 90 days or more (“past due”) | 10,526 | 954 | 2,241 | — | — | |||||||||||||||
Total loans | Ch$ | 255,771 | Ch$ | 219,499 | Ch$ | 286,893 | Ch$ | 221,446 | Ch$ | 284,285 | ||||||||||
| Total Loans | ||||||||||||||||||||
| As of December 31, | ||||||||||||||||||||
| 2000 | 2001 | 2002 | 2003 | 2004 | ||||||||||||||||
| (in millions of constant Ch$ as of December 31, 2004) | ||||||||||||||||||||
Current | Ch$ | 4,029,335 | Ch$ | 4,039,123 | Ch$ | 6,178,521 | Ch$ | 6,268,607 | Ch$ | 6,764,682 | ||||||||||
Overdue 1-29 days | 13,289 | 18,127 | 27,141 | 21,091 | 27,958 | |||||||||||||||
Overdue 30-89 days | 10,451 | 6,777 | 23,019 | 13,954 | 11,586 | |||||||||||||||
Overdue 90 days or more (“past due”) | 55,811 | 50,661 | 150,046 | 108,141 | 84,685 | |||||||||||||||
Total loans | Ch$ | 4,108,886 | Ch$ | 4,114,688 | Ch$ | 6,378,727 | Ch$ | 6,411,793 | Ch$ | 6,888,911 | ||||||||||
Overdue loans expressed as a percentage of total loans | 1.94 | % | 1.84 | % | 3.14 | % | 2.23 | % | 1.80 | % | ||||||||||
Past due loans as a percentage of total loans | 1.36 | % | 1.23 | % | 2.35 | % | 1.69 | % | 1.23 | % | ||||||||||
| Domestic Loans | ||||||||||||||||||||
| As of December 31, | ||||||||||||||||||||
| 2001 | 2002 | 2003 | 2004 | 2005 | ||||||||||||||||
| (in millions of constant Ch$ as of December 31, 2005) | ||||||||||||||||||||
Current | Ch$ | 3,958,543 | Ch$ | 6,106,048 | Ch$ | 6,264,858 | Ch$ | 6,713,736 | Ch$ | 7,883,366 | ||||||||||
Overdue 1-29 days | 18,404 | 28,118 | 21,850 | 28,964 | 45,268 | |||||||||||||||
Overdue 30-89 days | 6,972 | 23,848 | 14,456 | 12,003 | 6,214 | |||||||||||||||
Overdue 90 days or more (“past due”) | 51,497 | 153,126 | 112,034 | 87,734 | 71,330 | |||||||||||||||
Total loans | Ch$ | 4,035,416 | Ch$ | 6,311,140 | Ch$ | 6,413,198 | Ch$ | 6,842,437 | Ch$ | 8,006,178 | ||||||||||
Foreign Loans | ||||||||||||||||||||
| As of December 31, | ||||||||||||||||||||
| 2001 | 2002 | 2003 | 2004 | 2005 | ||||||||||||||||
| (in millions of constant Ch$ as of December 31, 2005) | ||||||||||||||||||||
Current | Ch$ | 225,988 | Ch$ | 294,899 | Ch$ | 229,420 | Ch$ | 294,517 | Ch$ | 199,727 | ||||||||||
Overdue 1-29 days | 376 | — | — | — | — | |||||||||||||||
Overdue 30-89 days | 49 | — | — | — | — | |||||||||||||||
Overdue 90 days or more (“past due”) | 988 | 2,322 | — | — | 19 | |||||||||||||||
Total loans | Ch$ | 227,401 | Ch$ | 297,221 | Ch$ | 229,420 | Ch$ | 294,517 | Ch$ | 199,746 | ||||||||||
| Total Loans | ||||||||||||||||||||
| As of December 31, | ||||||||||||||||||||
| 2001 | 2002 | 2003 | 2004 | 2005 | ||||||||||||||||
| (in millions of constant Ch$ as of December 31, 2005) | ||||||||||||||||||||
Current | Ch$ | 4,184,531 | Ch$ | 6,400,947 | Ch$ | 6,494,278 | Ch$ | 7,008,253 | Ch$ | 8,083,093 | ||||||||||
Overdue 1-29 days | 18,780 | 28,118 | 21,850 | 28,964 | 45,268 | |||||||||||||||
Overdue 30-89 days | 7,021 | 23,848 | 14,456 | 12,003 | 6,214 | |||||||||||||||
Overdue 90 days or more (“past due”) | 52,485 | 155,448 | 112,034 | 87,734 | 71,349 | |||||||||||||||
Total loans | Ch$ | 4,262,817 | Ch$ | 6,608,361 | Ch$ | 6,642,618 | Ch$ | 7,136,954 | Ch$ | 8,205,924 | ||||||||||
Overdue loans expressed as a percentage of total loans | 1.84 | % | 3.14 | % | 2.23 | % | 1.80 | % | 1.50 | % | ||||||||||
Past due loans as a percentage of total loans | 1.23 | % | 2.35 | % | 1.69 | % | 1.23 | % | 0.87 | % | ||||||||||
We suspend the accrual of interest on any loan when there is a high risk of unrecoverability or from the first day when it becomes past due. The amount of interest that would have been recorded on overdue loans if they had been accruing interest was Ch$5,4975,601 million for the year ended December 31, 2004.2005.
Loans included in the previous table, which have been restructured and bear no interest, are as follows:
| As of December 31, | |||||||||||||||
| 2000 | 2001 | 2002 | 2003 | 2004 | |||||||||||
| (in millions of constant Ch$ as of December 31, 2004) | |||||||||||||||
Ch$ | Ch$ | 1,658 | Ch$ | 1,605 | Ch$ | 5,041 | Ch$ | 4,408 | Ch$ | 4,209 | |||||
UF | 264 | 262 | 224 | 253 | 521 | ||||||||||
Total | Ch$ | 1,922 | Ch$ | 1,867 | Ch$ | 5,265 | Ch$ | 4,661 | Ch$ | 4,730 | |||||
| As of December 31, | |||||||||||||||
| 2001 | 2002 | 2003 | 2004 | 2005 | |||||||||||
| (in millions of constant Ch$ as of December 31, 2005) | |||||||||||||||
Ch$ | Ch$ | 1,663 | Ch$ | 5,222 | Ch$ | 4,567 | Ch$ | 4,361 | Ch$ | 4,117 | |||||
UF | 271 | 232 | 262 | 539 | 154 | ||||||||||
Total | Ch$ | 1,934 | Ch$ | 5,454 | Ch$ | 4,829 | Ch$ | 4,900 | Ch$ | 4,271 | |||||
The amount of interest that we would have recorded on these loans for the year ended December 31, 20042005 if these loans had been earning a market interest rate was Ch$241212 million.
In addition, other loans that have been restructured, mainly through the extension of their maturities, and that bear interest are as follows:
| As of December 31, | |||||||||
| 2002 | 2003 | 2004 | |||||||
(in millions of constant Ch$ as of December 31, 2004) | |||||||||
Total other restructured loans | Ch$ | 136,870 | Ch$ | 127,820 | Ch$ | 78,274 | |||
| As of December 31, | |||||||||
| 2003 | 2004 | 2005 | |||||||
(in millions of constant Ch$ as of December 31, 2005) | |||||||||
Total other restructured loans | Ch$ | 132,422 | Ch$ | 81,092 | Ch$ | 72,173 | |||
During the year ended December 31, 2004,2005, interest recorded in income on these loans amounted to Ch$9,35312,751 million.
Analysis of Substandard Loans and Amounts Past Due
The following table analyzes our substandard loans, past due loans and allowances for loan losses existing at the dates indicated. Loans for years prior to 2004 in the table below were analyzed in accordance with the previous guidelines, and loans for year 2005 and 2004 were analyzed in accordance with the amended guidelines. We have no restructured loans (troubled debt restructurings as defined in Statement of Financial Accounting Standards, or SFAS, No. 15 published by the Financial Accounting Standards Board, or FASB) that are not included in the following tables.
| As of December 31, | As of December 31, | |||||||||||||||||||||||||||||||||||||||
| 2000 | 2001 | 2002 | 2003 | 2004 | 2001 | 2002 | 2003 | 2004 | 2005 | |||||||||||||||||||||||||||||||
| (in millions of constant Ch$ as of December 31, 2004, except for percentages) | (in millions of constant Ch$ as of December 31, 2005, except for percentages) | |||||||||||||||||||||||||||||||||||||||
Total loans | Ch$ | 4,108,886 | Ch$ | 4,114,688 | Ch$ | 6,378,727 | Ch$ | 6,411,793 | Ch$ | 6,888,911 | Ch$ | 4,262,817 | Ch$ | 6,608,361 | Ch$ | 6,642,618 | Ch$ | 7,136,954 | Ch$ | 8,205,924 | ||||||||||||||||||||
Substandard loans (1) | Ch$ | 236,387 | Ch$ | 258,603 | Ch$ | 426,550 | Ch$ | 331,087 | Ch$ | 448,367 | Ch$ | 267,913 | Ch$ | 441,905 | Ch$ | 343,006 | Ch$ | 464,508 | Ch$ | 379,239 | ||||||||||||||||||||
Substandard loans as a percentage of total Loans | 5.75 | % | 6.28 | % | 6.69 | % | 5.16 | % | 6.51 | % | 6.28 | % | 6.69 | % | 5.16 | % | 6.51 | % | 4.62 | % | ||||||||||||||||||||
Amounts past due (2) | ||||||||||||||||||||||||||||||||||||||||
To the extent secured (3) | Ch$ | 41,677 | Ch$ | 34,043 | Ch$ | 95,762 | Ch$ | 72,385 | Ch$ | 57,198 | Ch$ | 35,269 | Ch$ | 99,210 | Ch$ | 74,991 | Ch$ | 59,257 | Ch$ | 50,254 | ||||||||||||||||||||
To the extent unsecured | 14,134 | 16,618 | 54,284 | 35,756 | 27,487 | 17,216 | 56,238 | 37,043 | 28,477 | 21,095 | ||||||||||||||||||||||||||||||
Total amount past due | Ch$ | 55,811 | Ch$ | 50,661 | Ch$ | 150,046 | Ch$ | 108,141 | Ch$ | 84,685 | Ch$ | 52,485 | Ch$ | 155,448 | Ch$ | 112,034 | Ch$ | 87,734 | Ch$ | 71,349 | ||||||||||||||||||||
Amounts past due as a percentage of total loans | 1.36 | % | 1.23 | % | 2.35 | % | 1.69 | % | 1.23 | % | 1.23 | % | 2.35 | % | 1.69 | % | 1.23 | % | 0.87 | % | ||||||||||||||||||||
To the extent secured(2) | 1.01 | 0.83 | 1.50 | 1.13 | 0.83 | |||||||||||||||||||||||||||||||||||
To the extent secured(2) | 0.83 | 1.50 | 1.13 | 0.83 | 0.61 | |||||||||||||||||||||||||||||||||||
To the extent unsecured | 0.35 | 0.40 | 0.85 | 0.56 | 0.40 | 0.40 | 0.85 | 0.56 | 0.40 | 0.26 | ||||||||||||||||||||||||||||||
Allowances for loans losses as a percentage of: | ||||||||||||||||||||||||||||||||||||||||
Total loans | 3.02 | 3.43 | 3.51 | 2.87 | 2.23 | 3.43 | 3.51 | 2.87 | 2.23 | 1.72 | ||||||||||||||||||||||||||||||
Total loans excluding contingent loans | 3.24 | 3.71 | 3.74 | 3.07 | 2.42 | 3.71 | 3.74 | 3.07 | 2.42 | 1.89 | ||||||||||||||||||||||||||||||
Total amounts past due | 222.46 | 278.72 | 149.07 | 170.09 | 181.55 | 278.72 | 149.07 | 170.09 | 181.59 | 198.05 | ||||||||||||||||||||||||||||||
Total amounts past due-unsecured | 878.43 | % | 849.68 | % | 412.05 | % | 514.43 | % | 559.33 | % | 849.70 | % | 412.05 | % | 514.43 | % | 559.46 | % | 669.85 | % | ||||||||||||||||||||
| (1) | For periods prior to 2004, substandard loans include loans classified into categories B-, C and D. For periods after 2004, |
| (2) | In accordance with Chilean regulations, past due loans are loans that are 90 days or more overdue on any payments of principal or interest. |
| (3) | Security generally consists of mortgages on real estate, pledges of marketable securities, letters of credit or cash. |
Analysis of Allowances for Loan Losses
The following table analyzes our allowances for loan losses and changes in the allowances attributable to charge-offs, new allowances, allowances released and the effect of price-level restatement on allowances for loan losses:
| December 31, | December 31, | |||||||||||||||||||||||||||||||||||||||
| 2000 | 2001 | 2002 | 2003 | 2004 | 2001 | 2002 | 2003 | 2004 | 2005 | |||||||||||||||||||||||||||||||
| (in millions of constant Ch$ as of December 31, 2004) | (in millions of constant Ch$ as of December 31, 2005) | |||||||||||||||||||||||||||||||||||||||
Allowances for loan losses at beginning of period | Ch$ | 116,368 | Ch$ | 124,158 | Ch$ | 241,002 | Ch$ | 223,678 | Ch$ | 183,938 | Ch$ | 128,628 | Ch$ | 249,678 | Ch$ | 231,731 | Ch$ | 190,559 | Ch$ | 159,318 | ||||||||||||||||||||
Charge-offs | (29,423 | ) | (28,786 | ) | (114,856 | ) | (98,535 | ) | (99,100 | ) | (29,822 | ) | (118,991 | ) | (102,082 | ) | (102,626 | ) | (67,343 | ) | ||||||||||||||||||||
Allowances established | 43,337 | 50,142 | 129,538 | 63,103 | 75,069 | 51,946 | 134,201 | 65,375 | 77,771 | 56,606 | ||||||||||||||||||||||||||||||
Allowances released(1) | (1,236 | ) | (1,212 | ) | (25,346 | ) | (1,491 | ) | (1,557 | ) | ||||||||||||||||||||||||||||||
Price-level restatement(2) | (4,888 | ) | (3,102 | ) | (6,660 | ) | (2,817 | ) | (4,608 | ) | ||||||||||||||||||||||||||||||
Allowances released(1) | (1,256 | ) | (26,258 | ) | (1,545 | ) | (1,613 | ) | (1,592 | ) | ||||||||||||||||||||||||||||||
Price-level restatement(2) | (3,212 | ) | (6,899 | ) | (2,920 | ) | (4,773 | ) | (5,684 | ) | ||||||||||||||||||||||||||||||
Allowances for loan losses at end of period | Ch$ | 124,158 | Ch$ | 141,200 | Ch$ | 223,678 | Ch$ | 183,938 | Ch$ | 153,742 | Ch$ | 146,284 | Ch$ | 231,731 | Ch$ | 190,559 | Ch$ | 159,318 | Ch$ | 141,305 | ||||||||||||||||||||
Ratio of charge-offs to average loans | 0.76 | % | 0.69 | % | 1.82 | % | 1.53 | % | 1.49 | % | 0.69 | % | 1.82 | % | 1.53 | % | 1.49 | % | 0.90 | % | ||||||||||||||||||||
Allowances for loan losses at end of period as a percentage of total loans | 3.02 | % | 3.43 | % | 3.51 | % | 2.87 | % | 2.23 | % | 3.43 | % | 3.51 | % | 2.87 | % | 2.23 | % | 1.72 | % | ||||||||||||||||||||
| (1) | Represents the aggregate amount of allowances for loan losses released during the year as a result of charge-offs, recoveries or a determination by management that the level of risk existing in the loan portfolio has been reduced. |
| (2) | Reflects the effect of inflation on the allowances for loan losses at the beginning of each period, adjusted to constant pesos as of December 31, |
As a result of an improvement in economic conditions in 20032004 and in 2004,2005, and a more effective credit and collection policy, allowances and the risk index decreased in both years. Based on the information we have available about our debtors, we believe that our allowances for loan losses are sufficient to cover known potential losses and losses inherent in a loan portfolio of this size and nature.
Our policy with respect to charge-offs follows the regulations established by the Chilean Superintendency of Banks. Under these regulations, a consumer loan must be written off not more than six months after the loan is overdue and other unsecured loans, or parts thereof, must be written off not more than 24 months after being classified as past due. Secured loans must be written off within 36 months after being classified as past due.
The following table presents detailed information on write-offs and shows the charge-offs breakdown by loan category:
| Year ended December 31, | Year ended December 31, | |||||||||||||||||||||||||||||
| 2000 | 2001 | 2002 | 2003 | 2004 | 2001 | 2002 | 2003 | 2004 | 2005 | |||||||||||||||||||||
| (in millions of constant Ch$ as of December 31, 2004) | (in millions of constant Ch$ as of December 31, 2005) | |||||||||||||||||||||||||||||
Consumer loans | Ch$ | 12,104 | Ch$ | 9,377 | Ch$ | 23,878 | Ch$ | 19,632 | Ch$ | 16,879 | Ch$ | 9,715 | Ch$ | 24,738 | Ch$ | 20,339 | Ch$ | 17,487 | Ch$ | 19,452 | ||||||||||
Residential mortgage loans | 1,532 | 3,249 | 6,529 | 15,410 | 11,934 | 3,366 | 6,764 | 15,965 | 12,364 | 13,272 | ||||||||||||||||||||
Commercial loans | 9,547 | 12,013 | 80,410 | 61,024 | 67,818 | 12,445 | 83,305 | 63,220 | 70,217 | 33,907 | ||||||||||||||||||||
Leasing contracts | 6,234 | 3,838 | 4,039 | 2,469 | 2,469 | 3,976 | 4,184 | 2,558 | 2,558 | 697 | ||||||||||||||||||||
Foreign loans | 6 | 309 | — | — | — | 320 | — | — | — | 15 | ||||||||||||||||||||
Total | Ch$ | 29,423 | Ch$ | 28,786 | Ch$ | 114,856 | Ch$ | 98,535 | Ch$ | 99,100 | Ch$ | 29,822 | Ch$ | 118,991 | Ch$ | 102,082 | Ch$ | 102,626 | Ch$ | 67,343 | ||||||||||
Loan recoveries by type of loan are shown in the table below:
| Year ended December 31, | |||||||||||||||
| 2000 | 2001 | 2002 | 2003 | 2004 | |||||||||||
| (in millions of constant Ch$ as of December 31, 2004) | |||||||||||||||
Consumer loans | Ch$ | 4,488 | Ch$ | 4,868 | Ch$ | 3,302 | Ch$ | 6,596 | Ch$ | 8,516 | |||||
Residential mortgage loans | 60 | 115 | 433 | 3,292 | 4,259 | ||||||||||
Commercial loans | 2,687 | 3,127 | 6,872 | 13,459 | 15,584 | ||||||||||
Leasing contracts | 467 | 1,122 | 984 | 1,061 | — | ||||||||||
Investments | — | — | — | 820 | — | ||||||||||
Subtotal | Ch$ | 7,702 | Ch$ | 9,232 | Ch$ | 11,591 | Ch$ | 25,228 | Ch$ | 28,359 | |||||
Recoveries and sales of loans reacquired from the Central Bank | 1,983 | 1,054 | 743 | 798 | 5,377 | ||||||||||
Total | Ch$ | 9,685 | Ch$ | 10,286 | Ch$ | 12,334 | Ch$ | 26,026 | Ch$ | 33,736 | |||||
| Year ended December 31, | |||||||||||||||
| 2001 | 2002 | 2003 | 2004 | 2005 | |||||||||||
| (in millions of constant Ch$ as of December 31, 2005) | |||||||||||||||
Consumer loans | Ch$ | 5,043 | Ch$ | 3,421 | Ch$ | 6,833 | Ch$ | 8,823 | Ch$ | 11,274 | |||||
Residential mortgage loans | 119 | 449 | 3,411 | 4,412 | 6,388 | ||||||||||
Commercial loans | 3,240 | 7,119 | 13,943 | 16,145 | 14,829 | ||||||||||
Leasing contracts | 1,162 | 1,019 | 1,099 | — | — | ||||||||||
Investments | — | — | 850 | — | — | ||||||||||
Subtotal | Ch$ | 9,564 | Ch$ | 12,008 | Ch$ | 26,136 | Ch$ | 29,380 | Ch$ | 32,491 | |||||
Recoveries and sales of loans reacquired from the Central Bank | 1,092 | 770 | 827 | 5,570 | 495 | ||||||||||
Total | Ch$ | 10,656 | Ch$ | 12,778 | Ch$ | 26,963 | Ch$ | 34,950 | Ch$ | 32,986 | |||||
Allocation of Allowances for Loan Losses
The following tables set forth, as of December 31 of each of the last five years, the proportions of our required minimum allowances for loan losses attributable to our commercial, consumer and residential mortgage loans, and the amount of additional allowances (previously referred to as “voluntary allowances” under the previous guidelines) which are not allocated to any particular category at each such date.
| 2000 | 2001 | 2001 | ||||||||||||||||||||||||||||||||||
| Allowance amount(1) | Allowance amount as a percentage of loans in category | Allowance amount as a percentage of total loans | Loans in category as percentage of total loans(2) | Allowance amount(1) | Allowance amount as a percentage of loans in category | Allowance amount as a percentage of total loans | Loans in category as percentage of total loans(2) | Allowance amount(1) | Allowance amount as a percentage of loans in category | Allowance amount as a percentage of total loans | Loans in category as total loans(2) | |||||||||||||||||||||||||
Commercial loans | Ch$ | 63,713 | 1.90 | % | 1.55 | % | 81.72 | % | Ch$ | 77,874 | 2.36 | % | 1.89 | % | 80.20 | % | Ch$ | 80,678 | 2.36 | % | 1.89 | % | 80.20 | % | ||||||||||||
Consumer loans | 9,162 | 4.34 | 0.22 | 5.14 | 11,050 | 4.91 | 0.27 | 5.47 | 11,448 | 4.91 | 0.27 | 5.47 | ||||||||||||||||||||||||
Residential mortgage loans | 1,728 | 0.32 | 0.04 | 13.14 | 1,886 | 0.32 | 0.05 | 14.33 | 1,954 | 0.32 | 0.05 | 14.33 | ||||||||||||||||||||||||
Total allocated allowances | Ch$ | 74,603 | 1.82 | % | 1.82 | % | 100.00 | % | Ch$ | 90,810 | 2.21 | % | 2.21 | % | 100.00 | % | Ch$ | 94,080 | 2.21 | % | 2.21 | % | 100.00 | % | ||||||||||||
Leasing contracts | 7,578 | 0.18 | 0.18 | 10,213 | 0.24 | 0.24 | 10,581 | 0.24 | 0.24 | |||||||||||||||||||||||||||
Foreign loans | 3,866 | 0.09 | 0.09 | 4,424 | 0.11 | 0.11 | 4,583 | 0.11 | 0.11 | |||||||||||||||||||||||||||
Voluntary allowances | 38,111 | 0.93 | 0.93 | 35,753 | 0.87 | 0.87 | 37,040 | 0.87 | 0.87 | |||||||||||||||||||||||||||
Total allowances | Ch$ | 124,158 | 3.02 | % | 3.02 | % | Ch$ | 141,200 | 3.43 | % | 3.43 | % | Ch$ | 146,284 | 3.43 | % | 3.43 | % | ||||||||||||||||||
| 2002 | 2003 | 2002 | 2003 | |||||||||||||||||||||||||||||||||||||||||||||
| Allowance amount(1) | Allowance amount as a percentage of loans in category | Allowance amount as a percentage of total loans | Loans in category as percentage of total loans(2) | Allowance amount(1) | Allowance amount as a percentage of loans in category | Allowance amount as a percentage of total loans | Loans in category as percentage of total loans(2) | Allowance amount(1) | Allowance amount as a percentage of loans in category | Allowance amount as a percentage of total loans | Loans in category as percentage of total loans(2) | Allowance amount(1) | Allowance amount as a percentage of loans in category | Allowance amount as a percentage of total loans | Loans in category as percentage of total loans(2) | |||||||||||||||||||||||||||||||||
Commercial loans | Ch$ | 152,412 | 3.01 | % | 2.39 | % | 79.30 | % | Ch$ | 123,822 | 2.49 | % | 1.93 | % | 77.70 | % | Ch$ | 157,900 | 3.01 | % | 2.39 | % | 79.30 | % | Ch$ | 128,279 | 2.49 | % | 1.93 | % | 77.70 | % | ||||||||||||||||
Consumer loans | 20,617 | 4.77 | 0.32 | 6.77 | 18,382 | 3.72 | 0.29 | 7.70 | 21,359 | 4.77 | 0.33 | 6.77 | 19,044 | 3.72 | 0.29 | 7.70 | ||||||||||||||||||||||||||||||||
Residential mortgage loans | 5,964 | 0.67 | 0.09 | 13.93 | 6,282 | 0.67 | 0.10 | 14.60 | 6,179 | 0.67 | 0.09 | 13.93 | 6,508 | 0.67 | 0.10 | 14.60 | ||||||||||||||||||||||||||||||||
Total allocated allowances | Ch$ | 178,993 | 2.81 | % | 2.81 | % | 100.00 | % | Ch$ | 148,486 | 2.32 | % | 2.32 | % | 100.00 | % | Ch$ | 185,438 | 2.81 | % | 2.81 | % | 100.00 | % | Ch$ | 153,831 | 2.32 | % | 2.32 | % | 100.00 | % | ||||||||||||||||
Leasing contracts | 10,985 | 0.17 | 0.17 | 8,480 | 0.13 | 0.13 | 11,380 | 0.17 | 0.17 | 8,785 | 0.13 | 0.13 | ||||||||||||||||||||||||||||||||||||
Foreign loans | 12,418 | 0.20 | �� | 0.20 | 5,901 | 0.09 | 0.09 | 12,865 | 0.20 | 0.20 | 6,113 | 0.09 | 0.09 | |||||||||||||||||||||||||||||||||||
Voluntary allowances | 21,282 | 0.33 | 0.33 | 21,071 | 0.33 | 0.33 | 22,048 | 0.33 | 0.33 | 21,830 | 0.33 | 0.33 | ||||||||||||||||||||||||||||||||||||
Total allowances | Ch$ | 223,678 | 3.51 | % | 3.51 | % | Ch$ | 183,938 | 2.87 | % | 2.87 | % | Ch$ | 231,731 | 3.51 | % | 3.51 | % | Ch$ | 190,559 | 2.87 | % | 2.87 | % | ||||||||||||||||||||||||
| 2004 | 2004 | 2005 | ||||||||||||||||||||||||||||||||||
| Allowance amount(1) | Allowance amount as a percentage of loans in category | Allowance amount as a percentage of total loans | Loans in category as percentage of total loans(2) | Allowance amount(1) | Allowance amount as a percentage of loans in category | Allowance amount as a percentage of total loans | Loans in category as | Allowance amount(1) | Allowance amount as a percentage of loans in category | Allowance amount as a percentage of total loans | Loans in category as percentage of total loans(2) | |||||||||||||||||||||||||
Commercial loans | Ch$ | 93,858 | 1.86 | % | 1.36 | % | 73.37 | % | Ch$ | 97,278 | 1.86 | % | 1.36 | % | 73.37 | % | Ch$ | 77,529 | 1.29 | % | 0.94 | % | 73.01 | % | ||||||||||||
Consumer loans | 23,473 | 3.37 | 0.34 | 10.10 | 24,318 | 3.37 | 0.34 | 10.10 | 25,623 | 2.95 | 0.31 | 10.58 | ||||||||||||||||||||||||
Residential mortgage loans | 6,274 | 0.55 | 0.09 | 16.53 | 6,500 | 0.55 | 0.09 | 16.53 | 9,893 | 0.73 | 0.13 | 16.41 | ||||||||||||||||||||||||
Total allocated allowances | Ch$ | 123,605 | 1.79 | % | 1.79 | % | 100.00 | % | Ch$ | 128,096 | 1.79 | % | 1.79 | % | 100.00 | % | Ch$ | 113,045 | 1.38 | % | 1.38 | % | 100.00 | % | ||||||||||||
Leasing contracts | 5,861 | 0.09 | 0.09 | 6,072 | 0.09 | 0.09 | 5,885 | 0.07 | 0.07 | |||||||||||||||||||||||||||
Foreign loans | 4,564 | 0.07 | 0.07 | 4,728 | 0.07 | 0.07 | 1,379 | 0.02 | 0.02 | |||||||||||||||||||||||||||
Additional allowances(3) | 19,712 | 0.28 | 0.28 | 20,422 | 0.28 | 0.28 | 20,996 | 0.25 | 0.25 | |||||||||||||||||||||||||||
Total allowances | Ch$ | 153,742 | 2.23 | % | 2.23 | % | Ch$ | 159,318 | 2.23 | % | 2.23 | % | Ch$ | 141,305 | 1.72 | % | 1.72 | % | ||||||||||||||||||
| (1) | In millions of constant pesos as of December 31, |
| (2) | Based on our loan classification. |
| (3) | Due to regulations on additional allowances included in Circular No. 3,246 of the Superintendency of Banks and Financial Institutions, we have redesignated our voluntary allowances to the additional allowances category in conformity with the new regulation. |
The following table sets forth our charge-offs for 2002, 2003, 2004 and 20042005 by major economic sector and provides further detail of charge-offs that have already been described in the previous discussion of allowances for loan losses:
| Year ended December 31, | Year ended December 31, | |||||||||||||||||
| 2002 | 2003 | 2004 | 2003 | 2004 | 2005 | |||||||||||||
| (in millions of constant Ch$ as of December 31, 2004) | (in millions of constant Ch$ as of December 31, 2005) | |||||||||||||||||
Commercial: | ||||||||||||||||||
Agriculture | Ch$ | 3,672 | Ch$ | 2,880 | Ch$ | 2,857 | Ch$ | 2,984 | Ch$ | 2,960 | Ch$ | 4,660 | ||||||
Mining | 16,401 | 724 | 747 | 750 | 774 | 2,438 | ||||||||||||
Manufacturing | 10,115 | 7,591 | 5,243 | 7,864 | 5,432 | 1,672 | ||||||||||||
Construction | 15,935 | 1,103 | 6,760 | 1,143 | 7,003 | 1,300 | ||||||||||||
Commerce | 14,433 | 9,184 | 12,530 | 9,515 | 12,983 | 10,659 | ||||||||||||
Transport | 1,417 | 1,581 | 2,967 | 1,638 | 3,074 | 387 | ||||||||||||
Financial services | 15,347 | 30,600 | 7,784 | 31,700 | 8,020 | 2,649 | ||||||||||||
Community | 3,090 | 7,361 | 28,930 | 7,626 | 29,971 | 10,142 | ||||||||||||
Subtotal: | Ch$ | 80,410 | Ch$ | 61,024 | Ch$ | 67,818 | Ch$ | 63,220 | Ch$ | 70,217 | Ch$ | 33,907 | ||||||
Consumer loans | 23,878 | 19,632 | 16,879 | 20,339 | 17,487 | 19,452 | ||||||||||||
Residential mortgage loans | 6,529 | 15,410 | 11,934 | 15,965 | 12,364 | 13,272 | ||||||||||||
Leasing contracts | 4,039 | 2,469 | 2,469 | 2,558 | 2,558 | 697 | ||||||||||||
Foreign loans | — | — | 15 | |||||||||||||||
Total | Ch$ | 114,856 | Ch$ | 98,535 | Ch$ | 99,100 | Ch$ | 102,082 | Ch$ | 102,626 | Ch$ | 67,343 | ||||||
Composition of Deposits and Other Commitments
The following table sets forth the composition of our deposits and similar commitments at December 31, 2002, 2003, 2004 and 2004.2005. See “Item 4. Information on the Company—Selected Statistical Information—“––Average Balance Sheets, Interest Earned on Interest Earning Assets and Interest Paid on Interest Bearing Liabilities” for the average rate paid on each of the following deposit categories.
| December 31, | December 31, | |||||||||||||||||
| 2002 | 2003 | 2004 | 2003 | 2004 | 2005 | |||||||||||||
| (in millions of constant Ch$ as of December 31, 2004) | (in millions of constant Ch$ as of December 31, 2005) | |||||||||||||||||
Current accounts | Ch$ | 1,109,977 | Ch$ | 1,258,574 | Ch$ | 1,424,569 | Ch$ | 1,303,883 | Ch$ | 1,475,853 | Ch$ | 1,516,219 | ||||||
Other demand liabilities | 418,820 | 497,779 | 501,629 | 516,170 | 520,083 | 324,532 | ||||||||||||
Savings accounts | 179,876 | 163,760 | 142,334 | 169,655 | 147,458 | 138,326 | ||||||||||||
Time deposits | 3,440,860 | 3,344,338 | 3,521,348 | 3,464,735 | 3,648,117 | 4,474,927 | ||||||||||||
Other commitments(1) | 169,856 | 182,258 | 195,847 | 188,820 | 202,897 | 159,984 | ||||||||||||
Total | Ch$ | 5,319,389 | Ch$ | 5,446,709 | Ch$ | 5,785,727 | Ch$ | 5,643,263 | Ch$ | 5,994,408 | Ch$ | 6,613,988 | ||||||
(1) Includes preliminary leasing accounts payable relating to purchase of equipment.
| (1) | Includes preliminary leasing accounts payable relating to purchase of equipment. |
Maturity of Deposits
The following table sets forth information regarding the currency and maturity of our deposits at December 31, 2004,2005, expressed in percentages. UF-denominated deposits are similar to Chilean peso-denominated deposits in all respects, except that the principal is readjusted periodically based on variations in the Chilean Consumer Price Index.
| Ch$ | UF | Foreign Currency | Total | |||||||||
Demand deposits | 43.38 | % | 5.48 | % | 40.17 | % | 36.68 | % | ||||
Savings accounts | — | 15.42 | — | 2.46 | ||||||||
Time deposits: | ||||||||||||
Maturing within three months | 43.98 | 16.24 | 56.45 | 42.11 | ||||||||
Maturing after three but within six months | 6.88 | 31.03 | 1.76 | 9.68 | ||||||||
Maturing after six but within 12 months | 4.49 | 12.89 | 1.33 | 5.18 | ||||||||
Maturing after 12 months | 1.27 | 18.94 | 0.29 | 3.89 | ||||||||
Total time deposits | 56.62 | 79.10 | 59.83 | 60.86 | ||||||||
Total deposits | 100.00 | % | 100.00 | % | 100.00 | % | 100.00 | % | ||||
| Ch$ | UF | Foreign Currency | Total | |||||||||
Demand deposits | 39.29 | % | 0.53 | % | 34.80 | % | 30.25 | % | ||||
Savings accounts | — | 9.81 | — | 2.09 | ||||||||
Time deposits: | ||||||||||||
Maturing within three months | 48.58 | 19.25 | 59.28 | 44.18 | ||||||||
Maturing after three but within six months | 5.30 | 36.14 | 5.43 | 11.90 | ||||||||
Maturing after six but within 12 months | 5.26 | 25.18 | 0.28 | 8.64 | ||||||||
Maturing after 12 months | 1.57 | 9.09 | 0.21 | 2.94 | ||||||||
Total time deposits | 60.71 | 89.66 | 65.20 | 67.66 | ||||||||
Total deposits | 100.00 | % | 100.00 | % | 100.00 | % | 100.00 | % | ||||
The following table sets forth information regarding the currency and maturity of deposits in excess of U.S.$100,000 at December 31, 2004:2005:
| Ch$ | UF | Foreign Currency | Total | Ch$ | UF | Foreign Currency | Total | |||||||||||||||||
| (in millions of constant Ch$ as of December 31, 2004) | (in millions of constant Ch$ as of December 31, 2005) | |||||||||||||||||||||||
Time deposits: | ||||||||||||||||||||||||
Maturing within three months | Ch$ | 1,259,807 | Ch$ | 212,993 | Ch$ | 415,775 | Ch$ | 1,888,575 | Ch$ | 1,345,044 | Ch$ | 209,524 | Ch$ | 460,926 | Ch$ | 2,015,494 | ||||||||
Maturing after three but within six months | 277,661 | 221,630 | 26,089 | 525,380 | 214,980 | 504,428 | 58,582 | 777,990 | ||||||||||||||||
Maturing after six but within 12 months | 99,537 | 46,148 | 5,645 | 151,330 | 210,276 | 349,879 | 1,887 | 562,042 | ||||||||||||||||
Maturing after 12 months | 43,917 | 167,595 | 3,441 | 214,953 | 60,625 | 125,606 | 2,263 | 188,494 | ||||||||||||||||
Total time deposits | Ch$ | 1,680,922 | Ch$ | 648,366 | Ch$ | 450,950 | Ch$ | 2,780,238 | Ch$ | 1,830,925 | Ch$ | 1,189,437 | Ch$ | 523,658 | Ch$ | 3,544,020 | ||||||||
Minimum Capital Requirements
The following table sets forth our minimum capital requirements set by the Chilean Superintendency of Banks as of the dates indicated:
| As of December 31, | As of December 31, | |||||||||||||||||||||||
| 2002 | 2003 | 2004 | 2003 | 2004 | 2005 | |||||||||||||||||||
| (in millions of constant Ch$ as of December 31, 2004) | (in millions of constant Ch$ as of December 31, 2005) | |||||||||||||||||||||||
Banco de Chile’s regulatory capital | Ch$ | 585,532 | Ch$ | 579,251 | Ch$ | 521,905 | Ch$ | 600,104 | Ch$ | 540,694 | Ch$ | 594,383 | ||||||||||||
Minimum regulatory capital required | (268,162 | ) | (285,754 | ) | (291,354 | ) | (296,041 | ) | (301,843 | ) | (322,928 | ) | ||||||||||||
Excess over minimum regulatory capital required | Ch$ | 317,370 | Ch$ | 293,497 | Ch$ | 230,551 | Ch$ | 304,063 | Ch$ | 238,851 | Ch$ | 271,455 | ||||||||||||
Short-term Borrowings
Our short-term borrowings (other than deposits) totaled Ch$555,433 million as of December 31, 2002, Ch$838,747868,942 million as of December 31, 2003, and Ch$857,622888,495 million as of December 31, 2004.
2004 and Ch$407,298 million as of December 31, 2005.
The principal categories of our short-term borrowings are amounts borrowed under foreign trade lines of credit, domestic interbank loans and repurchase agreements. The table below presents the amounts outstanding at the end of each period indicated and the weighted average nominal interest rate for each period by type of short-term borrowing:
| For the year ended December 31, | ||||||||||||||||||
| 2002 | 2003 | 2004 | ||||||||||||||||
| Year-End Balance | Weighted Average Nominal Interest Rate | Year-End Balance | Weighted Average Nominal Interest Rate | Year-End Balance | Weighted Average Nominal Interest Rate | |||||||||||||
| (in millions of constant Ch$ as of December 31, 2004, except for rate data) | ||||||||||||||||||
Investments sold under agreements to repurchase | Ch$ | 286,428 | 2.26 | % | Ch$ | 437,410 | 2.50 | % | Ch$ | 349,086 | 2.15 | % | ||||||
Central Bank borrowings | — | — | 25,529 | 2.28 | 107,643 | 0.19 | ||||||||||||
Borrowings from domestic financial institutions | 52,138 | 2.96 | 51,023 | 2.54 | 26,399 | 0.93 | ||||||||||||
Foreign borrowings | 184,869 | 1.68 | 273,787 | 1.29 | 340,736 | 1.93 | ||||||||||||
Other obligations | 31,998 | — | 50,998 | — | 33,758 | — | ||||||||||||
Total short-term borrowings | Ch$ | 555,433 | 2.00 | % | Ch$ | 838,747 | 1.95 | % | Ch$ | 857,622 | 1.69 | % | ||||||
| For the year ended December 31, | ||||||||||||||||||
| 2003 | 2004 | 2005 | ||||||||||||||||
| Year-End Balance | Weighted Average Nominal Interest Rate | Year-End Balance | Weighted Average Nominal Interest Rate | Year-End Balance | Weighted Average Nominal Interest Rate | |||||||||||||
| (in millions of constant Ch$ as of December 31, 2005, except for rate data) | ||||||||||||||||||
Investments sold under agreements to repurchase | Ch$ | 453,157 | 2.50 | % | Ch$ | 361,653 | 2.15 | % | Ch$ | 270,750 | 4.36 | % | ||||||
Central Bank borrowings | 26,448 | 2.28 | 111,518 | 0.19 | — | — | ||||||||||||
Borrowings from domestic financial institutions | 52,860 | 2.54 | 27,349 | 0.93 | 90,160 | 4.75 | ||||||||||||
Foreign borrowings | 283,643 | 1.29 | 353,002 | 1.93 | 13,983 | 0.02 | ||||||||||||
Other obligations | 52,834 | — | 34,973 | — | 32,405 | — | ||||||||||||
Total short-term borrowings | Ch$ | 868,942 | 1.95 | % | Ch$ | 888,495 | 1.69 | % | Ch$ | 407,298 | 3.95 | % | ||||||
The following table shows the average balance and the weighted average nominal rate for each short-term borrowing category during the periods indicated:
| For the year ended December 31, | ||||||||||||||||||
| 2002 | 2003 | 2004 | ||||||||||||||||
| Average Balance | Weighted Average Nominal Interest Rate | Average Balance | Weighted Average Nominal Interest Rate | Average Balance | Weighted Average Nominal Interest Rate | |||||||||||||
| (in millions of constant Ch$ as of December 31, 2004, except for rate data) | ||||||||||||||||||
Investments sold under agreements to repurchase | Ch$ | 384,807 | 2.80 | % | Ch$ | 359,723 | 2.58 | % | Ch$ | 424,832 | 1.87 | % | ||||||
Central Bank borrowings | 10,111 | 3.61 | 8,544 | 2.59 | 10,066 | 2.06 | ||||||||||||
Borrowings from domestic financial institutions | 83,226 | 3.07 | 100,520 | 2.47 | 105,543 | 2.48 | ||||||||||||
Sub-total | Ch$ | 478,144 | 2.86 | % | Ch$ | 468,787 | 2.56 | % | Ch$ | 540,441 | 1.99 | % | ||||||
Foreign borrowings | 116,319 | 1.84 | 267,445 | 1.77 | 296,700 | 1.34 | ||||||||||||
Total short-term borrowings | Ch$ | 594,463 | 2.66 | % | Ch$ | 736,232 | 2.27 | % | Ch$ | 837,141 | 1.76 | % | ||||||
| For the year ended December 31, | ||||||||||||||||||
| 2003 | 2004 | 2005 | ||||||||||||||||
Average Balance | Weighted Average Nominal Interest Rate | Average Balance | Weighted Average Nominal Interest Rate | Average Balance | Weighted Average Nominal Interest Rate | |||||||||||||
| (in millions of constant Ch$ as of December 31, 2005, except for rate data) | ||||||||||||||||||
Investments sold under agreements to repurchase | Ch$ | 372,673 | 2.58 | % | Ch$ | 440,126 | 1.87 | % | Ch$ | 298,547 | 3.56 | % | ||||||
Central Bank borrowings | 8,852 | 2.59 | 10,427 | 2.06 | 30,230 | 3.15 | ||||||||||||
Borrowings from domestic financial institutions | 104,139 | 2.47 | 109,343 | 2.48 | 211,453 | 3.84 | ||||||||||||
Sub-total | Ch$ | 485,664 | 2.56 | % | Ch$ | 559,896 | 1.99 | % | Ch$ | 540,230 | 3.65 | % | ||||||
Foreign borrowings | 277,073 | 1.77 | 307,381 | 1.34 | 164,274 | 1.73 | ||||||||||||
Total short-term borrowings | Ch$ | 762,737 | 2.27 | % | Ch$ | 867,277 | 1.76 | % | Ch$ | 704,504 | 3.20 | % | ||||||
The following table presents the maximum month-end balances of our principal sources of short-term borrowings during the periods indicated:
| Maximum 2002 month-end balance | Maximum 2003 month-end balance | Maximum 2004 month-end balance | Maximum 2003 balance | Maximum 2004 balance | Maximum 2005 balance | |||||||||||||
| (in millions of constant Ch$ as of December 31, 2004) | (in millions of constant Ch$ as of December 31, 2005) | |||||||||||||||||
Investments sold under agreements to repurchase | Ch$ | 460,751 | Ch$ | 437,410 | Ch$ | 501,834 | Ch$ | 453,157 | Ch$ | 519,900 | Ch$ | 334,785 | ||||||
Central Bank borrowings | 10,251 | 35,206 | 107,643 | 36,473 | 111,518 | 119,436 | ||||||||||||
Borrowings from domestic financial institutions | 141,427 | 122,797 | 133,093 | 127,218 | 137,884 | 358,471 | ||||||||||||
Foreign borrowings | Ch$ | 216,877 | Ch$ | 337,507 | Ch$ | 418,943 | Ch$ | 349,657 | Ch$ | 434,025 | Ch$ | 312,172 | ||||||
Item 4A. Unresolved Staff Comments None. |
OPERATING RESULTS
Introduction
The following discussion should be read together with our audited consolidated financial statements and the section entitled “Item 4. Information on the Company—Selected Statistical Information.” Certain amounts (including percentage amounts) that appear in this annual report may not total due to rounding.
We prepare our audited consolidated financial statements in accordance with Chilean GAAP (including the rules of the Chilean Superintendency of Banks relating thereto), which differ in certain significant respects from U.S. GAAP. Note 28 to our audited consolidated financial statements provides a description of the material differences between Chilean GAAP and U.S. GAAP as they relate to us. It also includes a reconciliation to U.S. GAAP of net income for the years ended December 31, 2002, 2003, 2004 and 20042005 and shareholders’ equity at December 31, 20032004 and 2004.
2005.
Pursuant to Chilean GAAP, the financial data presented in this section for all full-year periods are restated in constant pesos of December 31, 2004.2005. See “Presentation of Financial Information” and noteNote 1 to our audited consolidated financial statements.
Overview
We believe we are a leading bank in Chile providing a broad range of financial products and services to individual and corporate customers thatwho are primarily located in Chile. Accordingly, and as described below, our financial condition and results of operations are largely dependent upon economic and political factors affecting Chile, as well as changes in interest rates and inflation rates. We also face a number of other risks, such as increased competition and changes in market conditions that could impact our ability to achieve our goals. See “Item 4. Information on the Company—Selected Statistical Information” for a description of risk characteristics associated with each type of loan in our loan portfolio and “Item 3. Key Information—Risk Factors” for a more detailed description of the specific risks whichthat we believe to be material to our business operations.
Despite growth in the 1980s and 1990s, Chile’s economy has remained smaller than the economies of neighboring countries such as Argentina and Brazil. Although Chile’s economy has continued to grow in recent years, the Chilean economy’s growth slowed in each of the years between 2000 and 2003. Since 2003, Chile’s gross domestic product, or GDP, began to recover, showing growth rates of 6.2 % and 6.3% for the years 2004 and 2005, respectively. Unemployment has also remained high, averaging 9.2% in 2001, 9.0% in 2002, and 8.5% in 2003. During2003 and 8.8% in 2004, GDP grew 6.1%, but unemployment remained high, averaging 8.8% for the year.
however during 2005, it dropped to 8.1%.
Future developmentschanges in the Chilean economy may impair our ability to proceed with our strategic plan or our business financial condition or results of operations.plan. Our financial condition and results of operations could also be adversely affected by changes in economic or other policies of the Chilean government, which has exercised and continues to exercise a substantial influence over many aspects of the private sector, or other political orand economic developments in Chile, as well as regulatory changes or administrative practices of Chilean authorities, over which we have no control. See “Item 3. Key Information—Risk Factors—Risks Relating to Chile—Our growth and profitability depend on the level of economic activity in Chile” and “Item 3. Key Information—Risk Factors—Risks Relating to Chile—Inflation could adversely affect the value of our ADSs and financial condition and results of operations.operations” and “Item 3. Key Information—Risk Factors—Risks Relating to Chile—Our growth and profitability depend on the level of economic activity in Chile.”
Inflation
Historically, Chile has experienced high levels of inflation whichthat have significantly affected our financial condition and results of operations. Inflation has remained relatively stablelow in recent years; however, the inflation rate was 3.7% in 2005, 2.4% in 2004 and 1.1% in 20032003. However, a larger increase in inflation rates could adversely affect the Chilean economy and 2.8% in 2002.have an adverse effect on our business, financial condition and results of operations. Our results of operations reflect the effect of inflation in the following ways:
UF-denominated Assets and Liabilities. The UF is revalued in monthly cycles. On every day in the period beginning the tenth day of the current month through the ninth day of the next month, the nominal peso value of the UF is indexed up (or down in the event of deflation) in order to reflect each day a pro rata amount of the prior calendar month’s change in the Consumer Price Index. One UF was equal to Ch$16,744.12 at December 31, 2002, Ch$16,920.00 at December 31, 2003, and Ch$17,317.05 at December 31, 2004.2004 and Ch$17,974.81 (U.S.$34.96) at December 31, 2005. The effect of any changes in the nominal peso value of our UF-denominated assets and liabilities is reflected in our results of operations as an increase (or decrease, in the event of deflation) in interest revenue and expense. Our net interest revenue will be positively affected by inflation (and negatively affected by deflation) to the extent that our average UF-denominated assets exceed our average UF-denominated liabilities, while net interest revenue will be negatively affected by inflation (and positively affected by deflation) when average UF-denominated liabilities exceed average UF-denominated assets. Our average UF-denominated assets exceeded our average UF-denominated liabilities by Ch$1,348,156 million during the year ended December 31, 2002, Ch$1,124,6771,165,164 million during the year ended December 31, 2003, and Ch$1,291,5201,338,014 million during the year ended December 31, 2004.2004 and Ch$1,417,321 million (U.S.$2,756 million) during the year ended December 31, 2005. See “Item 4. Information on the Company—Selected Statistical Information.”
Peso-denominated Assets and Liabilities. Interest rates in Chile tend to reflect the rate of inflation during the relevant period and expectations regarding future inflation. The sensitivity of our peso-denominated interest earning assets and interest bearing liabilities to the inflation rate varies. See “—Interest Rates.” We maintain a substantial amount of non-interest bearing peso-denominated demand deposits. The ratio of such deposits to average interest bearing peso-denominated liabilities was 57% during 2002, 66% during 2003, and 64% during 2004.2004 and 65% during 2005. Because a large part of such deposits are not sensitive to inflation, even a slight decline in the rate of inflation may adversely affect our net interest margin on assets funded with such deposits and even a slight increase in the rate of inflation may increase the net interest margin on such assets. See “Item 4. Information on the Company—Selected Statistical Information—Interest Earning Assets and Net Interest Margin.”
Price-Level Restatements. Chilean GAAP requires that the effect of inflation on a bank’s net monetary asset position (monetary assets less monetary liabilities) be reflected in its results of operations as a gain (or loss) from price-level restatement. A bank’s net monetary asset position is determined by subtracting its net nonmonetary asset position (nonmonetary assets less nonmonetary liabilities) from shareholders’ equity. As such, under Chilean GAAP, the gain (or loss) from price-level restatement in results of operations is determined by subtracting the price-level restatement adjustment of net nonmonetary assets from the price-level restatement adjustment of shareholders’ equity. The inflation rate used for purposes of such adjustments is the change in the Consumer Price Index during the 12 months ended November 30 of the reported year. The change in the Consumer Price Index used for price-level restatement purposes was 3.0% in 2002, 1.0% in 2003 and 2.5% in 2004. See note 1(b) to our audited consolidated financial statements. The actual change in the Consumer Price Index was 2.8% in the year ended December 31, 2002, 1.1% in the year ended December 31, 2003 and 2.4% in the year ended December 31, 2004.
Interest Rates
Interest rates earned and paid on our assets and liabilities reflect, to some degree, reflect inflation and expectations regarding future inflation, as well as shifts in short-term interest rates related to the Central Bank’s monetary policies.policies and movements in long-term real rates. The Central Bank manages short-term interest rates based on its stated objectives of achievingbalancing low inflation and stable exchange rates.economic growth. Because our liabilities generally re-price faster than our assets, changes in the rate of inflation or short-term interest rates are reflected in the rates of interest we pay on our liabilities before they are reflected in the interest rates we earn on our assets. Accordingly, our
net interest margin on assets and liabilities is usually adversely affected in the short-term by increases in inflation or short-term interest rates and benefits in the short-term from decreases in inflation or short-term interest rates, although the existence of non-interest bearing peso-denominated demand deposits tends to mitigate both effects. See “—Inflation—Peso-denominated Assets and Liabilities.” In addition, because our peso-denominated liabilities have relatively short re-pricing periods, those liabilities generally are more responsive to changes in inflation or short-term interest rates than our UF-denominated liabilities.
As a result, during periods when current inflation exceeds the previous month’s inflation, customers often switch funds from peso-denominated deposits to more expensive UF-denominated deposits, thereby adversely affecting our net interest margin.
The average real annual short-term interest rate based on the rate paid by Chilean financial institutions for 9090- to 360 day360-day Chilean peso denominatedpeso-denominated deposits was 1.94% in 2002, 1.76% in 2003, and 1.07% in 2004.2004 and 1.89% in 2005. The average annual real long-term interest rate based on the Chilean Central Bank’s eight-year duration Chilean peso denominatedpeso-denominated bonds was 4.54% in 2002, 3.96% in 2003, and 3.52% in 2004.
2004 and 2.54% in 2005.
Foreign Currency Exchange Rates
A significant portion of our assets and liabilities are denominated in foreign currencies, principally U.S. dollars, and we have historically have maintained and may continue to maintain gaps between the balances of such assets and liabilities. The gap between foreign currency-denominated assets and foreign currency-denominated liabilities was a net asset position of Ch$75,396 million at December 31, 2002, Ch$23,27424,112 million at December 31, 2003, and Ch$36,54137,857 million at December 31, 2004.2004 and Ch$26,451 at December 31, 2005. See noteNote 20 to our audited consolidated financial statements. This gap includes assets and liabilities denominated in foreign currencies and assets and liabilities denominated in Chilean pesos that contain repayment terms linked to changes in foreign currency exchange rates. Because foreign currency-denominated assets and liabilities, as well as interest earned or paid on such assets and liabilities and gains (losses) realized upon the sale of such assets, are translated into pesos in preparing our audited consolidated financial statements, our reported income is affected by changes in the value of the peso with respect to foreign currencies, primarily the U.S. dollar. For their part, adjustments to U.S. dollar-indexed assets are reflected as adjustments in net interest earnings and offset results in the foreign exchange position. The exchange rate variation over capital and reserves of our foreign branches is adjusted against equity and notrather than against net income.
Critical Accounting EstimatesPolicies
We prepare our consolidated financial statements in conformity with Chilean GAAP and the specific accounting rules of the Chilean Superintendency of Banks.Banks, which together differ in certain significant respects from U.S. GAAP. The notes to our audited consolidated financial statements contain a summary of the accounting policies that are significant to us, as well as a description of the significant differences between these policies and U.S. GAAP. The notes include additional disclosures required under U.S. GAAP, a reconciliation between shareholders’ equity and net income to the corresponding amounts that would be reported in accordance with U.S. GAAP and a discussion of recently issued accounting pronouncements.
Both Chilean and U.S. GAAP require management to make certain estimates and assumptions, as some of the amounts reported in the financial statements are related to matters that are inherently uncertain. The following discussion describes those areas that require the most judgment or involve a higher degree of complexity in the application of the accounting policies that currently affect our financial condition and results of operations.
Allowances for loan losses
Chilean banks are required to maintain loan loss allowances in amounts determined in accordance with the regulations issued by the Chilean Superintendency of Banks. Under these regulations, we must classify our portfolio based on factors such as changes in the nature and volume of our loan portfolio, trends in forecasted portfolio credit quality and economic conditions that may affect the borrower’s payment capability.capacity. The minimum amount of required loan loss allowances are determined based on fixed percentages of estimated loan losses assigned to each category.
Under U.S. GAAP, allowances for loan losses are made to account for estimated losses in outstanding loans for which there is doubt about the borrower’s capacity to repay the principal.
The classification of our loan portfolio for Chilean GAAP purposes and for allowances for loan losses under U.S. GAAP is determined through statistical modeling and estimates. Informed judgments must be made when identifying deteriorating loans, the probability of default, the expected loss, the value of collateral and current economic conditions. Even though we consider our allowances for loan losses to be adequate, the use of different estimates and assumptions could produce different allowances for loan losses, and amendments to the allowances may be required in the future due to changes in the value of collateral, the amount of cash to be received or other economic events.
On January 1, 2004, in accordance with Circular No. 3,246 issued by the Chilean Superintendency of Banks, we adopted a new methodology to determine our loan loss allowances. This new regulation did not adversely affect our financial position or results of operations. A detailed description of this accounting policy is discussed in “Item 4. Information on the Company—Regulation and Supervision—Allowances for Loan Losses” and in notesNotes 1 and 28 to our audited consolidated financial statements.
Fair value accounting
A portion of our assets and liabilities are carried at fair value. Under both Chilean GAAP and U.S. GAAP financial instruments are stated at fair value, except for those classified as “held-to-maturity” under U.S. GAAP, which are carried at amortized cost. Under U.S. GAAP, derivative financial instruments are recorded at fair value and assets received in lieu of payment are recorded at fair value less their estimated cost of sale. Fair values are based on quoted market prices or, if not available, on internally developed pricing models informed bybased on independently obtained market information. If market information is limited or in some instances not available, management applies its professional judgment. Other factors that may also affect estimates are incorrect model assumptions, market dislocations and unexpected correlations. Notwithstanding the level of subjectivity inherent in determining fair value, we believe our estimates of fair value are adequate. The use of different models or assumptions could lead to changes in our reported results.
Price-level restatement
Chilean GAAP requires that financial statements be restated to reflect the full effects of loss in the purchasing power of the Chilean peso on the financial position and results of operations of reporting entities. The method prescribes that the historical cost of all non-monetary accounts be restated for general price-level changes between the date of origin of each item and the year-end.
A bank’s net monetary asset position is determined by subtracting its net nonmonetary asset position (nonmonetary assets less nonmonetary liabilities) from shareholders’ equity. As such, under Chilean GAAP, the gain (or loss) from price-level restatement in results of operations is determined by subtracting the price-level restatement adjustment of net nonmonetary assets from the price-level restatement adjustment of shareholders’ equity. The inflation rate used for purposes of such adjustments is the change in the Consumer Price Index during the 12 months ended November 30 of the reported year. The change in the Consumer Price Index used for price-level restatement purposes was 1.0% in 2003, 2.5% in 2004 and 3.6% in 2005. See Note 1(b) to our audited consolidated financial statements. The actual change in the Consumer Price Index was 1.1% in the year ended December 31, 2003, 2.4% in the year ended December 31, 2004 and 3.7% in the year ended December 31, 2005.
Our audited consolidated financial statements have been price-level restated in order to reflect the effects of the changes in the purchasing power of the Chilean peso during each year. All non-monetary assets and liabilities and all equity accounts have been restated to reflect the changes in the Consumer Price Index
from the date they were acquired or incurred to year-end. Consistent with general banking practices in Chile, no specific purchasing power adjustments of income statement amounts are made. The purchasing power gain or loss included in net income reflects the effects of Chilean inflation on the monetary assets and liabilities held by us.
For comparative purposes, the historical December 31, 20022004 and 20032005 audited consolidated financial statements and their accompanying notes have been presented in constant Chilean pesos as of December 31, 2004.2005. As described in noteNote 1(s) of our audited consolidated financial statements, certain balances of previous years’ financial statements have been reclassified to conform with the present year presentation.
The price-level adjusted audited consolidated financial statements do not purport to represent appraised values, replacement cost, or any other current value of assets at which transactions would take place currently. Instead, they are intended to restate all nonmonetary consolidated financial statement components in terms of local currency of a single purchasing power and to include in the net result for each year the gain or loss in purchasing power arising from the holding of monetary assets and liabilities exposed to the effects of inflation. See the discussion of price-level restatement in noteNote 1(b) to our audited consolidated financial statements.
Goodwill
Under U.S. GAAP, we have significant intangible assets related to goodwill. We record all assets and liabilities acquired in purchase acquisitions, including goodwill and other acquired intangibles, at fair value as required by SFAS No. 141, published by FASB. These include amounts pushed down from our parent Quiñenco S.A.
Under SFAS No. 142, goodwill must be allocated to reporting units and tested for impairment. On December 31, 2005, goodwill has been allocated according to the structure of our business areas in 2005.
We test goodwill for impairment annually or more frequently if events or circumstances, such as adverse changes in the business climate, indicate that there may be justification for conducting an interim test. Impairment testing is performed at the reporting-unit level, which is generally one level below the sixfive major business segments identified in note 28 (x) to our audited consolidated financial statements.segments. The first part of the test is a comparison at the reporting unit level of the fair value of each reporting unit to its carrying amount, including goodwill. If the fair value is less than the carrying value, then the second part of the test is conducted to measure the amount of potential goodwill impairment. The implied fair value of the reporting unit goodwill is calculated and compared to the carrying amount of goodwill recorded in our financial records. If the carrying value of the reporting unit goodwill exceeds the implied fair value of that goodwill, then we would recognize an impairment loss in the amount of the difference, which would be recorded as a charge against net income.
The fair values of the reporting units are determined using discounted cash flow models based on each reporting unit’s internal forecasts.
Goodwill was not impaired as of December 31, 2003 or 2004,2005, nor was any goodwill written-off during the years ended December 31, 2002, 20032004 and 2004.2005.
The initial goodwill and intangibles recorded and subsequent impairment analysis requires management to make subjective judgments concerning estimates of how the acquired asset will perform in the future using a discounted cash flow analysis. Additionally, estimated cash flows may extend beyond ten years and, by their nature, are difficult to determine. Events and factors that may significantly affect the estimates include competitive forces, customer behavior and attrition, changes in revenue growth trends, cost structures and technology and changes in interest rates and specific industry or market sector conditions. Impairment is recognized earlier whenever warranted. For a further discussion of accounting practices for goodwill under U.S. GAAP, see noteNote 28 to our audited consolidated financial statements.
Changes in Accounting Principles
On January 1, 2004, in accordance with Circular No 3,246 of the Chilean Superintendency of Banks, the new standardsprinciples for determining loan loss provisions established in Chapter 7-10 of the Superintendency’s accounting rulesallowances became effective. The application of these new criteria for determining provisionsprinciples did not have a significantmaterial effect on theour financial situationcondition or results of our subsidiaries presented in the consolidated financial statements or us.operations. To comply with the amended regulations,new principles, we redesignated there-designated any voluntary provisions recorded as of December 31, 2003 to theas additional provisions category in conformity with the amended regulations.
new principles.
In accordance with Circular No. 3,196, issued by the Chilean Superintendency of Banks, effective October 31, 2002, we modified our accounting treatment of financial investments in mortgage finance bonds issued by us. This change consisted of subtracting the amount recorded for mortgage finance bonds issued by us from assets, and subtracting the respective mortgage finance bonds obligation from liabilities. Similarly, the difference between the amount deducted from related assets and liabilities was recognized under other assets and is amortized using the straight-line method based on the termmaturity of the obligation. As of December 31, 20032004 and 2004,2005, we recorded a net amount of Ch$2,1382,230 million and Ch$2,1521,762 million, respectively, under “Other assets”.
assets.”
Differences between Chilean and United States Generally Accepted Accounting Principles
Chilean GAAP varies in certain important respects from U.S. GAAP, including some of the methods that are used to measure the amounts shown in the audited consolidated financial statements, additional disclosures required by U.S. GAAP and the accounting treatment of the merger. Those differences, as well as other significant differences between Chilean GAAP and U.S. GAAP, are described in greater detail in noteNote 28 to our audited consolidated financial statements.
Results of Operations for the Years Ended December 31, 2002, 2003, 2004 and 20042005
The following section discusses the results of operations for the years ended December 31, 2002, 2003, 2004 and 2004.2005. To the extent that it is available and is useful in analyzing our results, we have included information based onbroken down by the business areas that we use forin internal reporting. We also present our results on a consolidated basis.
We use a business area-based profitability system to manage our business. This system allows us to extract income, balances, interest rate and expense information by client and also allows us to view information by office,account officer, branch or business area. The profitability system uses the accounting balances and the interest rates as agreed upon with the client. In order to assess the income per transaction, the system compares the interest rate agreed upon with the client with our own cost of funds. WeFor various transactions, we use internal cost of funds tables, for various transactions which are updated daily. From these tables we are able to determine operating costs per transaction or per client and these costs are then allocated to our various business areas. TheDeveloped internally, the system has been developed in recent years, and has been subject of continued improvementcontinuously refined resulting in cost allocation changes.re-allocations. Figures for years before 2005 have been restated according to the current manner in which we measure our business areas during 2005.
Our business is organized into the following areas:
TheWe use the same accounting policies used for thewithin business areas areas those used for our consolidated management reports. Corporate and personalindividual customers are assigned to account executives who work exclusively within one business area. Some costs are allocated to theone business areasarea, and others are split between two or more business areas based on a single transaction. Thereafter, any unallocated costs are included as “other” in order to arrive at the consolidated balance sheet and income statement.
The business area information is subject to general internal auditing procedures to ensure the integrity of the information used in the management decision making purposes.decision-making. The business area information presented has also been adjusted in order to tie results to the income statement, as presented in accordance with Chilean GAAP in our audited consolidated financial statements. The most significant differences in classification are as follows:
NetPre-Tax Income Before Tax by Business Area
The following table sets forth netpre-tax income before tax for eachby business area for each of the years ended December 31, 2002, 2003, 2004 and 2004.2005. The line item “Other” includes the effect of conforming internal accounting policies to Chilean GAAP and a number of non-allocated costs, such as human resources related expenses, additional provisions (previously referred to as “voluntary provisions”) and depreciation costs. For internal reporting purposes, we control and monitor these costs separately and do not include them in the determination of business area profitability. Also included within “Other” are specific portions of income such as rental income.
| Year Ended December 31, | % Increase (Decrease) | Year Ended December 31, | % Increase (Decrease) | |||||||||||||||||||||||||||||||||
| 2002 | 2003 | 2004 | 2002/2003 | 2003/2004 | 2003 | 2004 | 2005 | 2003/2004 | 2004/2005 | |||||||||||||||||||||||||||
| (in millions of constant Ch$ as of December 31, 2004, except for percentages) | (in millions of constant Ch$ as of December 31, 2005, except for percentages) | |||||||||||||||||||||||||||||||||||
Large corporations | Ch$ | 10,546 | Ch$ | 51,849 | Ch$ | 38,794 | 391.6 | % | (25.2 | )% | ||||||||||||||||||||||||||
Middle market companies | 24,528 | 39,109 | 36,537 | 59.4 | (6.6 | ) | ||||||||||||||||||||||||||||||
Retail banking | Ch$ | 87,078 | Ch$ | 99,572 | Ch$ | 114,556 | 14.3 | % | 15.0 | % | ||||||||||||||||||||||||||
Wholesale banking | 43,714 | 35,056 | 64,992 | (19.8 | ) | 85.4 | ||||||||||||||||||||||||||||||
International banking | (6,900 | ) | 12,507 | 6,756 | — | (46.0 | ) | 11,167 | 3,716 | (6,101 | ) | (66.7 | ) | — | ||||||||||||||||||||||
Retail banking | 25,773 | 37,475 | 49,008 | 45.4 | 30.8 | |||||||||||||||||||||||||||||||
Treasury and money market operations | 23,869 | 19,620 | 25,091 | (17.8 | ) | 27.9 | 20,145 | 25,571 | 15,751 | 26.9 | (38.4 | ) | ||||||||||||||||||||||||
Subsidiaries | 13,974 | 21,798 | 28,181 | 56.0 | 29.3 | 22,583 | 29,196 | 26,522 | 29.3 | (9.2 | ) | |||||||||||||||||||||||||
Other | (38,494 | ) | (34,291 | ) | (13,390 | ) | (10.9 | ) | (61.0 | ) | (31,290 | ) | (15,978 | ) | (13,605 | ) | (48.9 | ) | (14.9 | ) | ||||||||||||||||
Net income before tax | Ch$ | 53,296 | Ch$ | 148,067 | Ch$ | 170,977 | 177.8 | % | 15.5 | % | ||||||||||||||||||||||||||
Pre-tax income | Ch$ | 153,397 | Ch$ | 177,133 | Ch$ | 202,115 | 15.5 | % | 14.1 | % | ||||||||||||||||||||||||||
2004 and 2005. The 14.1% increase in pre-tax income in 2005 as compared to 2004 was primarily attributable to an 8.7% increase in net interest revenue, a 46.5% decrease in provisions for loan losses and a 4.9% increase in fee income, which was partially offset by a 10.8% increase in operating expenses. These positive results mainly reflected: (i) our many initiatives to expand our customer base, which generated higher operating revenues principally to retail banking, (ii) the improved economic environment, which positively impacted the credit quality of corporate portfolios and (iii) higher earnings from demand deposits as a consequence of higher nominal interest rates.
2003 and 20042004.. The 15.5% increase in netpre-tax income before taxes in 2004 as compared to 2003 was primarily attributable to a 42.8% increase in net interest revenue, a 29.1% increase in fees and a 29.6% increase in recovery of loans that had previously been charged off. These increases were mainly due to the growth of the Chilean economy, an improvement in our asset mix and the further integration of our subsidiaries’ businesses with our core business.
2002Retail Banking. 2004 and 20032005. The 177.8%15.0% increase in netthe retail banking business area’s pre-tax income before taxes in 2003 as compared to 20022005 was primarily attributable to a significant decrease in provisions for loan losses, a significant10.0% increase in fees and income from services, a decrease in operating expenses and an increase in recoveries of loans that had previously been charged-off. These results were primarily attributable to the recovery of the Chilean economy, which positively impacted the financial conditions of our clients and the quality of our overall loan portfolio and the merger, which resulted in costs efficiencies and higher business volumes.
Large Corporations.2003 and 2004. The 25.2% decrease in the large corporations business area’s net income before taxes in 2004 was primarily attributable to an 11.9% decrease in operating revenues which was primarily attributablefrom Ch$259,127 million in 2004 to a decreaseCh$285,020 million in lending spreads and losses from the sale of corporate loans. The decrease in net income before taxes was also explained2005 fueled by a 12.4% increase in operating expenses primarily due to marketing and technological costs and an 11.8% increase in provisions for loan losses.
2002 and 2003. The almost five-fold increase12.6% expansion in the large corporations business area’s net income before taxes in 2003 was primarily attributableloan portfolio, higher earnings from demand deposits and, to a 73.6% decrease in provisions for loan losses. To a lesser extent, higher fee income. We believe that our focus on broadening our distribution channels as well as creating better service and product alternatives has become a key element in increasing our retail customer base, generating higher operating revenues despite the increasesmaller margins that result from growing competition in net income before taxes was also attributable to a decrease in charge-offs on assets received in lieu of payments and an increase in fee income from financial services. These factors more than offset a small decrease in net interest revenue, which was primarily attributable to a decrease in inflation in 2003.this area.
Middle Market Companies.2003 and 2004. The 6.6% decrease14.3% increase in the middle market companiesretail banking business area’s pre-tax income before taxes in 2004 was primarily attributable to a 28.8% increase in provisions for loan losses, from Ch$17,601 million in 2003 to Ch$22,669 million in 2004, which was primarily due to increased growth, an increase in the risk index of the loan portfolio and a 4% increase in operating expenses during 2004.
2002 and 2003. The 59.4% increase in the middle market companies business area’s net income before taxes in 2003 was primarily attributable to a decrease in provisions for loan losses and, to a lesser extent, lower charge offs on assets received in lieu of payment.
International Banking.2003 and 2004. The 46% decrease in the international banking business area’s net income before taxes in 2004 as compared to 2003 was primarily attributable to the non-recurring earnings generated in 2003 from the sale of Latin American investment securities held at our New York branch. This decrease was partially offset by lower operating expenses during 2004.
2002 and 2003. In 2003, the international banking business area recorded net income before taxes of Ch$12,507 million, as compared to a net loss of Ch$6,900 million recorded in 2002. The change from a net loss to net income was primarily attributable to earnings obtained from the sale of Latin American investment securities held at our New York branch that had been previously written-off. The change from a net loss to net income was also attributable to a decrease in operating expenses.
Retail Banking.2003 and 2004.The 30.8% increase in the retail banking business area’s net income before taxes for in 2004 was primarily attributable to an 18.6%11.8% increase in operating revenues from Ch$140,725231,713 million in 2003 to Ch$166,877259,127 million in 2004, which, in turn, was primarily attributabledue to a 16.2%12.2% growth in the retail banking business area’s loan portfolio and, to a lesser extent, higher fee income. These factors were partially offset by higher operating expenses.expenses and higher provisions for loan losses.
2002Wholesale. 2004 and 2003.2005. The 45.4%85.4% increase in the retailwholesale business area’s pre-tax income in 2005 was primarily attributable to a significant improvement in loan portfolio credit quality (in particular, that part of the portfolio related to the construction and commerce sectors) and to an 10.8% increase in operating revenues from Ch$106,933 million in 2004 to Ch$118,486 million in 2005, a consequence of the 21.1% expansion in loans, higher fee income (mainly from commercial loans, collection and payment services) and higher income from demand deposits.
2003 and 2004. The 19.8% decrease in the wholesale business area’s pre-tax income in 2004 was primarily attributable to a 6.7% decrease in operating revenues from Ch$114,621 million in 2003 to Ch$106,933 million in 2004, which, in turn, was due to a decrease in lending spreads and losses from the sale of corporate loans. The decrease in pre-tax income was also explained by a 32.7% decrease in “other” income and expenses and by a 2.1% increase in operating expenses, primarily due to marketing and technology costs.
International Banking. 2004 and 2005. Extraordinary expenses, mainly for legal counsel and other consultation for operational review and process design incurred in 2005 by the U.S. branches as a result of examination by U.S. regulators and of the improvement in internal controls made to comply with orders agreed to with the OCC and the Federal Reserve, accounted for the negative pre-tax income recorded by the international banking business area in 2005 as compared to the positive figure of 2004. In addition, in October, 2005 we entered into agreements with the OCC and separately with FinCEN requiring our U.S. branches to make a U.S.$3 million civil penalty payment to resolve allegations related to the Bank Secrecy Act, anti-money laundering compliance and related matters.
2003 and 2004. The 67% decrease in the international banking business area’s netpre-tax income before taxesof Ch$3,716 million in 2004 from Ch$11,167 million in 2003 was primarily attributable to lowerthe earnings generated in 2003 from the sale of Latin American investment securities held at our New York branch and, to a lesser extent, to provisions for loan losses and an increase in recoveries of loans that had previously been charged-off. Additionally, increased loan volumes and a decrease in operating expenses more than offset a reduction in spreads on our loans and the negative effect of the decrease in the inflation rate.release during 2003.
Treasury and Money Market OperationsOperations. 2004 and 2005. The treasury and money market operations business area’s pre-tax income decreased to Ch$15,751 million in 2005 from Ch$25,571 million in 2004 primarily as a consequence of lower sales and mark to market securities results, as a result of the increase in long-term interest rates during the last quarter of 2005, and due to the lower balance maintained in financial instruments by us during 2005.
2003 and 2004.The 27.9%26.9% increase in the treasury and money market operations business area’s netpre-tax income before taxes in 2004 was primarily attributable to increased income from our investment portfolio, which, in turn, was primarily attributabledue to an increase in the value of our UF-denominated assets as a result offrom increased inflation and a decrease in Chilean-peso denominated costsChilean peso-denominated cost of funds resulting from a decrease in the short term reference rate from 2.73% in 2003 to 1.87% in 2004.
2002Operations through Subsidiaries. 2004 and 2003.2005. The 17.8%9.2% decrease in the treasury and money market operations business area’s netpre-tax income before taxesfrom our subsidiaries in 20032005 compared to 2004 was primarily attributable to higher operating expenses recorded by our securities brokerage subsidiary mainly related to: (i) higher consulting and software expenses from a slight increasenew operational platform, which seeks to improve control systems and efficiency and (ii) higher personnel costs principally attributable to higher variable compensations and indemnities. In addition, the decrease in long-term interest rates and decreased interest rate volatility, which reduced our earningspre-tax income during 2005 was also explained by a decrease in fee income from our Chilean investment portfoliothe financial advisory subsidiary, as compared to 2002.it generated only a small number of transactions.
Operations through Subsidiaries.2003 and 2004.The 29.3% increase in netpre-tax income before taxes from our subsidiaries in 2004 was primarily attributable to the 23.8% increase in fee income from their operations from Ch$37,42838,776 million in 2003 to Ch$46,33548,003 million in 2004, which resulted in a 21%21.2% increase in operating revenues. The increase in our subsidiaries’ fee income was also a result of increased cross-selling of products by our subsidiaries, as well as the growth of the Chilean economy. In particular, fee income from our securities brokerage subsidiary increased 24.7% during 2004. The 80% increase in fee income from services generated by our financial advisory services subsidiary was primarily attributable to fee income from investment banking and advisory services.
2002 and 2003.The 56.0% increase in net income before taxes from our subsidiaries in 2003 was primarily attributable to significant growth in fee income from our subsidiary operations. The increase was primarily attributable to an increase in the trading volume of stocks and U.S. dollars traded by our securities brokerage subsidiary, an increase in the average amount of funds managed by our mutual fund management subsidiary and an increase in the net income of our factoring subsidiary, which was primarily the result of increased volume and a decrease in its provisions for loan losses.
Net Income
The following table sets forth the principal components of our net income, as detailed in our audited consolidated financial statements for the years ended December 31, 2002, 2003, 2004 and 2004:2005:
| Year Ended December 31, | % Increase (Decrease) | Year Ended December 31, | % Increase (Decrease) | |||||||||||||||||||||||||||||||||
| 2002 | 2003 | 2004 | 2002/2003 | 2003/2004 | 2003 | 2004 | 2005 | 2003/2004 | 2004/2005 | |||||||||||||||||||||||||||
| (in millions of constant Ch$ as of December 31, 2004, except for percentages) | (in millions of constant Ch$ as of December 31, 2005, except for percentages) | |||||||||||||||||||||||||||||||||||
Net interest revenue | Ch$ | 380,546 | Ch$ | 230,082 | Ch$ | 328,472 | (39.5 | )% | 42.8 | % | Ch$ | 238,365 | Ch$ | 340,297 | Ch$ | 369,798 | 42.8 | % | 8.7 | % | ||||||||||||||||
Provisions for loan losses | (104,192 | ) | (61,612 | ) | (73,512 | ) | (40.9 | ) | 19.3 | (36,867 | ) | (41,208 | ) | (22,028 | ) | 11.8 | (46.5 | ) | ||||||||||||||||||
Fees and income from services, net | 78,733 | 98,251 | 126,842 | 24.8 | 29.1 | 101,787 | 131,408 | 137,793 | 29.1 | 4.9 | ||||||||||||||||||||||||||
Other operating income (loss), net | (31,621 | ) | 98,801 | 14,509 | — | (85.3 | ) | 102,357 | 15,031 | 10,860 | (85.3 | ) | (27.7 | ) | ||||||||||||||||||||||
Other income and expenses, net: | ||||||||||||||||||||||||||||||||||||
Loan loss recoveries | 12,334 | 26,026 | 33,736 | 111.0 | 29.6 | |||||||||||||||||||||||||||||||
Other income and expenses, net | (15,789 | ) | (11,785 | ) | (11,301 | ) | (25.4 | ) | (4.1 | ) | (11,531 | ) | (11,036 | ) | (6,394 | ) | (4.3 | ) | (42.1 | ) | ||||||||||||||||
Minority interest | (1 | ) | (2 | ) | (1 | ) | 100.0 | (50.0 | ) | (2 | ) | (1 | ) | — | (50.0 | ) | — | |||||||||||||||||||
Operating expenses | (256,780 | ) | (227,557 | ) | (240,302 | ) | (11.4 | ) | 5.6 | (236,426 | ) | (249,623 | ) | (276,464 | ) | 5.6 | 10.8 | |||||||||||||||||||
Net loss from price-level restatement | (9,934 | ) | (4,137 | ) | (7,466 | ) | (58.4 | ) | 80.5 | (4,286 | ) | (7,735 | ) | (11,450 | ) | 80.5 | 48.0 | |||||||||||||||||||
Net income before income taxes | 53,296 | 148,067 | 170,977 | 177.8 | 15.5 | 153,397 | 177,133 | 202,115 | 15.5 | 14.1 | ||||||||||||||||||||||||||
Income taxes | 1,194 | (14,250 | ) | (18,349 | ) | — | 28.8 | (14,763 | ) | (19,010 | ) | (21,391 | ) | 28.8 | 12.5 | |||||||||||||||||||||
Net income | Ch$ | 54,490 | Ch$ | 133,817 | Ch$ | 152,628 | 145.6 | % | 14.1 | % | Ch$ | 138,634 | Ch$ | 158,123 | Ch$ | 180,724 | 14.1 | % | 14.3 | % | ||||||||||||||||
2004 and 2005.Our net income for 2005 was Ch$180,724 million, an increase of 14.3% from Ch$158,123 million in 2004, primarily reflecting the 8.7% increase in net interest revenue, a 46.5% decrease in provisions for loan losses and, to a lesser extent, an increase in fee income and a decrease in other expenses, net. These factors more than offset a 10.8% increase in our operating expenses.
2003 and 2004. Our net income for 2004 was Ch$152,628158,123 million, an increase of 14.1% from Ch$133,817138,634 million in 2003, primarily reflecting a 42.8% increase in net interest revenue and a 29.1% increase in fee income and a 29.6% increase in loan loss recoveries.income. These factors were partially offset by a decrease in other operating income, net, an increase in operating expenses and increased provisions for loan losses.
2002 and 2003. Our net income for 2003 was Ch$133,817 million, an increase of 146% from Ch$54,490 million in 2002, which primarily reflected a 40.9% decrease in provisions for loan losses, a 24.8% increase in fee income, a change from other operating loss, net of Ch$31,621 million in 2002 to other operating income, net of Ch$98,801 million in 2003, an 11.4% decrease in operating expenses and an increase in the recovery of loans that had previously been charged-off. These factors were partially offset by lower net interest revenue and higher income taxes.
Net Interest Revenue
The tables included under the headings “—Interest Revenue” and “—Interest Expense” set forth information regarding our consolidated interest revenue and expenses and average interest earning assets and average interest bearing liabilities for the years ended December 31, 2002, 2003, 2004 and 2004.2005. This information is derived from the tables included elsewhere in this annual report under “Item 4. Information on the Company—Selected Statistical Information” and is qualified in its entirety by reference to such information.
| Year Ended December 31, | % Increase (Decrease) | Year Ended December 31, | % Increase (Decrease) | |||||||||||||||||||||||||||||||||
| 2002 | 2003 | 2004 | 2002/2003 | 2003/2004 | 2003 | 2004 | 2005 | 2003/2004 | 2004/2005 | |||||||||||||||||||||||||||
| (in millions of constant Ch$ as of December 31, 2004, except for percentages) | (in millions of constant Ch$ as of December 31, 2005, except for percentages) | |||||||||||||||||||||||||||||||||||
Interest revenue | Ch$ | 714,018 | Ch$ | 439,422 | Ch$ | 543,372 | (38.5 | )% | 23.7 | % | Ch$ | 455,241 | Ch$ | 562,933 | Ch$ | 680,149 | 23.7 | % | 20.8 | % | ||||||||||||||||
Interest expense | (333,472 | ) | (209,340 | ) | (214,900 | ) | (37.2 | ) | 2.7 | (216,876 | ) | (222,636 | ) | (310,351 | ) | 2.7 | 39.4 | |||||||||||||||||||
Net interest revenue | Ch$ | 380,546 | Ch$ | 230,082 | Ch$ | 328,472 | (39.5 | )% | 42.8 | % | Ch$ | 238,365 | Ch$ | 340,297 | Ch$ | 369,798 | 42.8 | % | 8.7 | % | ||||||||||||||||
Net interest margin(1) | 4.52 | % | 2.75 | % | 3.84 | % | — | — | ||||||||||||||||||||||||||||
Net interest margin(1) | 2.75 | % | 3.84 | % | 4.06 | % | — | — | ||||||||||||||||||||||||||||
| (1) | Net |
2004 and 2005. Net interest revenue increased by 8.7%, from Ch$340,297 million in 2004 to Ch$369,798 million in 2005, primarily as a result of 22 basis point (one basis point equals one one-hundredth (1/100th) of a percent) increase in net interest margin (net interest revenue divided by average interest earning
assets) from 3.84% in 2004 to 4.06% in 2005 and, to a lesser extent, by a 2.8% growth in average interest earning assets. The following table sets forthincrease in net interest margin was largely as a result of the effectfollowing:
These favorable effects were partially offset by:
| Increase (Decrease) | |||||||
| 2002/2003 | 2003/2004 | ||||||
| (in millions of constant Ch$ as of December 31, 2004) | |||||||
Due to changes in average volume of interest earning assets and interest bearing liabilities | Ch$ | 40,606 | Ch$ | 48,800 | |||
Due to changes in average nominal interest rates of interest earning assets and interest bearing liabilities | (191,070 | ) | 49,590 | ||||
Net change | Ch$ | (150,464 | ) | Ch$ | 98,390 | ||
2003 and 2004. Net interest revenue increased by 42.8%, from Ch$230,082238,365 million in 2003 to Ch$328,472340,297 million in 2004, primarily as a result of a 2.2% increase in average interest earning assets and an increase of 109 basis points (one basis point equals one one-hundredth of a percent) in net interest margin (net interest revenue divided by average interest earning assets), from 2.75% in 2003 to 3.84% in 2004. The increase in net interest margin was primarily the result of:of the following:
2002 and 2003. Net interest revenue decreased by 39.5% from Ch$380,546 million in 2002 to Ch$230,082 million in 2003 primarily as a result of a decrease of 177 basis points (one basis point equals one one-hundredth of a percent) in our net interest margin and, to a lesser extent, a 0.5% decrease in the average volume of interest earning assets. Our net interest margin decreased from 4.52% in 2002 to 2.75% in 2003 primarily as a result of:
The 0.5% decrease in average interest earning assets in 2003 was primarily the result of a decrease in the amount of foreign currency denominated regulatory reserves we are required to maintain, and a decrease in average financial investments. We reduced the level of such regulatory reserves and financial investments in response to the Central Bank’s reduction in May 2003 of its foreign currency denominated demand and time deposits requirements.
Interest Revenue
The following table sets forth information regarding our interest revenue and average interest earning assets for the years ended December 31, 2002, 2003, 2004 and 2004:2005:
| Year Ended December 31, | % Increase (Decrease) | Year Ended December 31, | % Increase (Decrease) | |||||||||||||||||||||||||||||||||
| 2002 | 2003 | 2004 | 2002/2003 | 2003/2004 | 2003 | 2004 | 2005 | 2003/2004 | 2004/2005 | |||||||||||||||||||||||||||
| (in millions of constant Ch$ as of December 31, 2004, except for percentages) | (in millions of constant Ch$ as of December 31, 2005, except for percentages) | |||||||||||||||||||||||||||||||||||
Interest revenue(1) | Ch$ | 714,018 | Ch$ | 439,422 | Ch$ | 543,372 | (38.5 | )% | 23.7 | % | ||||||||||||||||||||||||||
Interest revenue(1) | Ch$ | 455,241 | Ch$ | 562,933 | Ch$ | 680,149 | 23.7 | % | 20.8 | % | ||||||||||||||||||||||||||
Average interest earning assets: | ||||||||||||||||||||||||||||||||||||
Commercial loans(2) | Ch$ | 3,122,288 | Ch$ | 3,242,090 | Ch$ | 3,386,304 | 3.8 | 4.4 | ||||||||||||||||||||||||||||
Commercial loans(2) | Ch$ | 3,358,807 | Ch$ | 3,508,211 | Ch$ | 4,267,548 | 4.4 | 21.6 | ||||||||||||||||||||||||||||
Consumer loans | 404,440 | 432,409 | 634,717 | 6.9 | 46.8 | 447,975 | 657,567 | 769,891 | 46.8 | 17.1 | ||||||||||||||||||||||||||
Mortgage loans(3) | 1,274,401 | 1,186,079 | 1,000,958 | (6.9 | ) | (15.6 | ) | |||||||||||||||||||||||||||||
Mortgage loans(3) | 1,228,778 | 1,036,992 | 721,962 | (15.6 | ) | (30.4 | ) | |||||||||||||||||||||||||||||
Foreign trade loans | 633,628 | 670,685 | 682,913 | 5.8 | 1.8 | 694,830 | 707,498 | 633,600 | 1.8 | (10.4 | ) | |||||||||||||||||||||||||
Interbank loans | 102,931 | 85,812 | 45,174 | (16.6 | ) | (47.4 | ) | 88,902 | 46,800 | 39,786 | (47.4 | ) | (15.0 | ) | ||||||||||||||||||||||
Past due loans(4) | 149,847 | 138,734 | 98,962 | (7.4 | ) | (28.7 | ) | |||||||||||||||||||||||||||||
Contingent loans(5) | 379,523 | 404,693 | 476,686 | 6.6 | 17.8 | |||||||||||||||||||||||||||||||
Past due loans(4) | 143,727 | 102,525 | 81,757 | (28.7 | ) | (20.3 | ) | |||||||||||||||||||||||||||||
Contingent loans(5) | 419,262 | 493,847 | 614,725 | 17.8 | 24.5 | |||||||||||||||||||||||||||||||
Leasing contracts | 247,672 | 271,871 | 304,093 | 9.8 | 11.9 | 281,659 | 315,040 | 391,220 | 11.9 | 24.2 | ||||||||||||||||||||||||||
Total loans | Ch$ | 6,314,730 | Ch$ | 6,432,373 | Ch$ | 6,629,807 | 1.9 | % | 3.1 | % | Ch$ | 6,663,940 | Ch$ | 6,868,480 | Ch$ | 7,520,489 | 3.1 | % | 9.5 | % | ||||||||||||||||
Financial investments(6) | 1,884,350 | 1,823,648 | 1,834,212 | (3.2 | ) | 0.6 | ||||||||||||||||||||||||||||||
Financial investments(6) | 1,889,299 | 1,900,244 | 1,435,438 | 0.6 | (24.5 | ) | ||||||||||||||||||||||||||||||
Interbank deposits | 220,830 | 123,063 | 96,720 | (44.3 | ) | (21.4 | ) | 127,493 | 100,202 | 157,485 | (21.4 | ) | 57.2 | |||||||||||||||||||||||
Total | Ch$ | 8,419,910 | Ch$ | 8,379,084 | Ch$ | 8,560,739 | (0.5 | )% | 2.2 | % | Ch$ | 8,680,732 | Ch$ | 8,868,926 | Ch$ | 9,113,412 | 2.2 | % | 2.8 | % | ||||||||||||||||
Average rates earned on total interest earning assets(7): | ||||||||||||||||||||||||||||||||||||
Average rates earned on total interest earning assets(7): | ||||||||||||||||||||||||||||||||||||
Average nominal rates | 8.48 | % | 5.24 | % | 6.35 | % | — | — | 5.24 | % | 6.35 | % | 7.46 | % | — | — | ||||||||||||||||||||
Average real rates | 7.82 | % | 4.89 | % | 2.38 | % | — | — | 4.89 | % | 2.38 | % | 2.02 | % | — | — | ||||||||||||||||||||
| (1) | Interest revenue includes fees we charge in respect of contingent loans. |
| (2) | Excludes leasing contracts. |
| (3) | Includes residential and general purpose mortgage loans. |
| (4) | Includes interest accrued and unpaid on principal until the date on which payment becomes overdue. |
| (5) | Consists of unfunded letters of credit, guarantees, performance bonds and other unfunded commitments. |
| (6) | “Financial investments” includes primarily bonds issued by the Central Bank and foreign governments. |
| (7) | See “Item 4. Information on the Company—Selected Statistical Information—Average Balance Sheets, Interest Earned on Interest Earning Assets and Interest Paid on Interest Bearing Liabilities.” |
The following table sets forth the effect on our interest2004 and 2005. Interest revenue increased by 20.8%, from Ch$562,933 million in 2004 to Ch$680,149 million in 2005, primarily as a result of changesan increase in (1) the average volume of interest earning assets and (2) the average nominal interest rates onearned from 6.35% in 2004 to 7.46% in 2005 and, to a lesser extent, a 2.8% growth in average interest earning assets duringdriven by a 9.5% increase in average loans, which offset the periods presented24.5% decrease in average investments. The increase in average nominal interest rates was mainly the result of an increase in the preceding table:
| Increase (Decrease) | |||||||
| 2002/2003 | 2003/2004 | ||||||
| (in millions of constant Ch$ as of December 31, 2004) | |||||||
Effect due to changes in average volume of interest earning assets | Ch$ | 7,103 | Ch$ | 44,659 | |||
Effect due to changes in average nominal interest rates of interest earning assets | (281,699 | ) | 59,291 | ||||
Net change | Ch$ | (274,596 | ) | Ch$ | 103,950 | ||
inflation rate (from 2.4% in 2004 to 3.7% in 2005) and successive increases of the Central Bank’s nominal reference rates (from 2.25% as of December 2004 to 4.50% at the end of 2005).
2003 and 20042004.. Interest revenue increased by 23.7%, from Ch$439,422455,241 million in 2003 to Ch$543,372562,933 million in 2004, primarily as a result of an increase in average nominal rates earned and a 2.2% increase in average interest earning assets from Ch$8,379,0848,680,732 million in 2003 to Ch$8,560,7398,868,926 million in 2004, primarily as a result of higher loan balances. Average nominal interest rates earned increased from 5.24% in 2003 to 6.35% in 2004, primarily as a result of an increase in the inflation rate from 1.1% in 2003 to 2.4% in 2004 and successive increases of the Chilean Central Bank’s nominal reference rates (from 1.75% as of February 2004 to 2.25% as of December 2004).
2002 and 2003. Interest revenue decreased by 38.5% from Ch$714,018 million in 2002 to Ch$439,422 million in 2003 primarily as a result of a decrease in the average nominal interest rates earned from 8.48% in 2002 to 5.24% in 2003. The decrease in average nominal interest rates earned was primarily as a result of a decrease in the inflation rate (from 2.8% in 2002 to 1.1% in 2003) and in the interest rates on Chilean peso-denominated interest earning assets. Average interest earning assets decreased slightly from Ch$8,419,910 million in 2002 to Ch$8,379,084 million in 2003 as a result of a reduction in the Central Bank’s foreign currency-denominated demand and time deposits requirements.
Interest Expense
The following table sets forth information regarding our interest expense and average interest bearing liabilities for the years ended December 31, 2002, 2003, 2004 and 2004:2005:
| Year ended December 31, | % Increase (Decrease) | Year ended December 31, | % Increase (Decrease) | |||||||||||||||||||||||||||||||||
| 2002 | 2003 | 2004 | 2002/2003 | 2003/2004 | 2003 | 2004 | 2005 | 2003/2004 | 2004/2005 | |||||||||||||||||||||||||||
| (in millions of constant Ch$ as of December 31, 2004, except for percentages) | (in millions of constant Ch$ as of December 31, 2005, except for percentages) | |||||||||||||||||||||||||||||||||||
Interest expense | Ch$ | 333,472 | Ch$ | 209,340 | Ch$ | 214,900 | (37.2 | )% | 2.7 | % | Ch$ | 216,876 | Ch$ | 222,636 | Ch$ | 310,351 | 2.7 | % | 39.4 | % | ||||||||||||||||
Average interest bearing liabilities: | ||||||||||||||||||||||||||||||||||||
Time deposits(1) | Ch$ | 3,640,906 | Ch$ | 3,413,951 | Ch$ | 3,466,036 | (6.2 | ) | 1.5 | |||||||||||||||||||||||||||
Average interest-bearing liabilities: | ||||||||||||||||||||||||||||||||||||
Time deposits(1) | Ch$ | 3,536,853 | Ch$ | 3,590,813 | Ch$ | 3,934,121 | 1.5 | 9.6 | ||||||||||||||||||||||||||||
Savings accounts | 173,446 | 176,967 | 146,778 | 2.0 | (17.1 | ) | 183,338 | 152,062 | 139,267 | (17.1 | ) | (8.4 | ) | |||||||||||||||||||||||
Total Central Bank borrowings | 62,674 | 69,949 | 90,259 | 11.6 | 29.0 | 12,367 | 12,832 | 31,822 | 3.8 | 148.0 | ||||||||||||||||||||||||||
Investments sold under agreements to repurchase | 384,807 | 359,723 | 424,832 | (6.5 | ) | 18.1 | 372,673 | 440,126 | 298,547 | 18.1 | (32.2 | ) | ||||||||||||||||||||||||
Mortgage finance bonds | 1,312,999 | 1,051,414 | 914,065 | (19.9 | ) | (13.1 | ) | 1,089,265 | 946,971 | 616,794 | (13.1 | ) | (34.9 | ) | ||||||||||||||||||||||
Other interest bearing liabilities(2) | 775,279 | 1,040,913 | 1,045,957 | 34.3 | 0.5 | |||||||||||||||||||||||||||||||
Other interest-bearing liabilities(2) | 1,138,485 | 1,164,287 | 1,461,326 | 2.3 | 25.5 | |||||||||||||||||||||||||||||||
Total | Ch$ | 6,350,111 | Ch$ | 6,112,917 | Ch$ | 6,087,927 | (3.7 | )% | (0.4 | )% | Ch$ | 6,332,981 | Ch$ | 6,307,091 | Ch$ | 6,481,877 | (0.4 | )% | 2.8 | % | ||||||||||||||||
Average rates paid on total interest bearing liabilities(3): | ||||||||||||||||||||||||||||||||||||
Average rates paid on total interest bearing liabilities(3): | ||||||||||||||||||||||||||||||||||||
Average nominal rates | 5.25 | % | 3.42 | % | 3.53 | % | — | — | 3.42 | % | 3.53 | % | 4.79 | % | ||||||||||||||||||||||
Average real rates | 4.21 | % | (1.89 | )% | (0.67 | )% | — | — | (1.89 | )% | (0.67 | )% | (0.86 | )% | ||||||||||||||||||||||
Average (Chilean peso-denominated) non-interest bearing demand deposits | Ch$ | 1,633,578 | Ch$ | 1,873,627 | Ch$ | 2,088,509 | 14.7 | % | 11.5 | % | Ch$ | 1,941,079 | Ch$ | 2,163,695 | Ch$ | 2,185,826 | 11.5 | % | 1.0 | % | ||||||||||||||||
| (1) | Includes interest-earning demand deposits. |
| (2) | Combines |
| (3) | See “Item 4. Information on the Company—Selected Statistical Information—Average Balance Sheets, Interest Earned on Interest Earning Assets and Interest Paid on Interest Bearing Liabilities.” |
The following table sets forth the effect on our interest2004 and 2005. Interest expense increased by 39.4%, from changesCh$222,636 million in (1) average volume2004 to Ch$310,351 million in 2005, primarily as a result of interest bearing liabilities and (2)an increase in average nominal interest rates paid, onfrom 3.53% in 2004 to 4.79% in 2005 and, to a lesser extent, the 2.8% increase in average interest-bearing liabilities from Ch$6,307,091 million in 2004 to Ch$6,481,877 million in 2005. The increase in average interest bearing liabilities duringwas primarily a result of a 9.6% increase in time deposits and a 25.5% increase in other interest-bearing liabilities mainly related to bonds and subordinated bonds. The increase in average nominal interest rate paid was primarily attributable to the periods presented:
| Increase (Decrease) | ||||||||
| 2002/2003 | 2003/2004 | |||||||
| (in millions of constant Ch$ as of December 31, 2004) | ||||||||
Effect due to changes in average volume of interest bearing liabilities | Ch$ | (33,503 | ) | Ch$ | (4,141 | ) | ||
Effect due to changes in average nominal interest rates of interest bearing liabilities | (90,629 | ) | 9,701 | |||||
Net change | Ch$ | (124,132 | ) | Ch$ | 5,560 | |||
higher inflation rate and successive increases in the Central Bank’s monetary policy rates.
2003 and 20042004.. Interest expense increased by 2.7%, from Ch$209,340216,876 million in 2003 to Ch$214,900222,636 million in 2004, primarily as a result of an increase in the average nominal interest rates paid from 3.42% in 2003 to 3.53% in 2004. The increase in average nominal interest rates was partially offset by the 0.4 % decrease in average interest bearing liabilities from Ch$6,112,9176,332,981 million in 2003 to Ch$6,087,9276,307,091 million in 2004, primarily as a result of an 11.5% increase in average non-interest bearing demand deposits denominated in Chilean pesos.
2002 and 2003. Interest expense decreased by 37.2% from Ch$333,472 million in 2002 to Ch$209,340 million in 2003. The decrease was primarily attributable to a significant decrease in average nominal interest rates paid, from 5.25% in 2002 to 3.42% in 2003, and, to a lesser extent, by the impact of a 3.7% decrease in the average volume of interest bearing liabilities, from Ch$6,350,111 million in 2002 to Ch$6,112,917 million in 2003, primarily as a result of a decrease in mortgage finance bonds, investments sold under agreements to repurchase and time deposits. The decrease in the average nominal interest rate paid was primarily attributable to lower inflation and lower real interest rates paid on Chilean peso-denominated liabilities.
Provisions for Loan Losses
Chilean banks are required to maintain allowances to cover possible credit losses in accordance with regulations issued by the Chilean Superintendency of Banks. Effective as of January 1, 2004, the Chilean Superintendency of Banks modified the procedure used to calculate a financial institution’sbank’s required allowances. The application of such amended regulations did not result in any material increase in our allowance for loan losses. According to regulations of the Chilean Superintendency of Banks applicable to such periods, the amount of provisions charged to income in any period consists of net provisions for possible loan losses. See “Item 4. Information on the Company—Regulation and Supervision” and noteNote 7 to our audited consolidated financial statements.
The following table sets forth information with respect to our provisions and allowances for loan losses and charge-offs for each of the years ended December 31, 2002, 2003, 2004 and 2004:2005:
| Year Ended December 31, | % Increase (Decrease) | Year Ended December 31, | % Increase (Decrease) | |||||||||||||||||||||||||||||||||
| 2002 | 2003 | 2004 | 2002/2003 | 2003/2004 | 2003 | 2004 | 2005 | 2003/2004 | 2004/2005 | |||||||||||||||||||||||||||
| (in millions of constant Ch$ as of December 31, 2004, except for percentages) | (in millions of constant Ch$ as of December 31, 2005, except for percentages) | |||||||||||||||||||||||||||||||||||
Provisions: | ||||||||||||||||||||||||||||||||||||
Total provisions for loan losses | Ch$ | 104,192 | Ch$ | 61,612 | Ch$ | 73,512 | (40.9 | )% | 19.3 | % | Ch$ | 36,867 | Ch$ | 41,208 | Ch$ | 22,028 | 11.8 | % | (46.5 | )% | ||||||||||||||||
Gross provisions for loan losses | 63,830 | 76,158 | 55,014 | 19.3 | (27.8 | ) | ||||||||||||||||||||||||||||||
Total loan loss recoveries | 26,963 | 34,950 | 32,986 | 29.6 | (5.6 | ) | ||||||||||||||||||||||||||||||
Charge-offs: | ||||||||||||||||||||||||||||||||||||
Total charge-offs | 114,856 | 98,535 | 99,100 | (14.2 | ) | 0.6 | 102,082 | 102,626 | 67,343 | 0.5 | (34.4 | ) | ||||||||||||||||||||||||
Loan loss recoveries: | ||||||||||||||||||||||||||||||||||||
Total loan loss recoveries | 12,334 | 26,026 | 33,736 | 111.0 | 29.6 | |||||||||||||||||||||||||||||||
Net charge-offs | 102,522 | 72,509 | 65,364 | (29.3 | ) | (9.9 | ) | 75,119 | 67,676 | 34,357 | (9.9 | ) | (49.2 | ) | ||||||||||||||||||||||
Other asset quality data: | ||||||||||||||||||||||||||||||||||||
Total loans | Ch$ | 6,378,727 | Ch$ | 6,411,793 | Ch$ | 6,888,911 | 0.5 | 7.4 | Ch$ | 6,642,618 | Ch$ | 7,136,954 | Ch$ | 8,205,924 | 7.4 | 15.0 | ||||||||||||||||||||
Consolidated risk index | 3.00 | % | 2.36 | % | 2.23 | % | — | — | 2.36 | % | 2.23 | % | 1.72 | % | — | — | ||||||||||||||||||||
Unconsolidated risk index | 3.10 | % | 2.41 | % | 2.23 | % | — | — | 2.41 | % | 2.23 | % | 1.72 | % | — | — | ||||||||||||||||||||
Allowances for loan losses(1) | Ch$ | 223,678 | Ch$ | 183,938 | Ch$ | 153,742 | (17.8 | )% | (16.4 | )% | ||||||||||||||||||||||||||
Allowances for loan losses(1) | Ch$ | 190,559 | Ch$ | 159,318 | Ch$ | 141,305 | (16.4 | )% | (11.3 | )% | ||||||||||||||||||||||||||
Allowances for loan losses as a percentage of total loans | 3.51 | % | 2.87 | % | 2.23 | % | — | — | 2.87 | % | 2.23 | % | 1.72 | % | — | — | ||||||||||||||||||||
| (1) | “Allowances for loan losses” includes additional loan loss allowances (previously referred to as “voluntary allowances” under guidelines prior to 2004) greater than those required by the Chilean Superintendency of Banks. See “Item 4. Information on the Company—Regulation and Supervision—Allowances for Loan Losses” and “Item 4. Information on the Company—Regulation and Supervision—Additional Allowances.” |
2004 and 2005. Despite the 15.0% increase in total loans in 2005, our overall provisions for loan losses decreased by 46.5%, from Ch$41,208 million in 2004 to Ch$22,028 million in 2005, primarily as a result of an improvement in the financial condition of our corporate clients and the economic environment. These factors positively impacted our corporate portfolios, in particular those related to the construction and commerce sectors. Provisions related to individuals also improved, registering a modest increase despite an approximately 13.0% increase in the size of the retail market loan portfolio. As a consequence, the ratio of provisions for loan losses to average loans fell to 0.29% in 2005 from 0.60% in 2004. On a consolidated basis, our risk index decreased from 2.23% in 2004 to 1.72% in 2005.
2003 and 20042004.. Our overall provisions for loan losses increased by 19.3%11.8%, from Ch$61,61236,867 million in 2003 to Ch$73,51241,208 million in 2004, primarily as a result of the 7.4% growth in the loan portfolio and the risk classification downgrade of certain corporate clients primarily concentrated in the construction sector. Provisions for loan losses represented approximately 1.11%0.60% of average loans in 2004, a small increase from the 0.96%0.55% in 2003. On a consolidated basis, our risk index decreased from 2.36% in 2003 to 2.23% in 2004.
2002 and 2003.Our overall provisions for loan losses decreased by 40.9% from Ch$104,192 million in 2002 to Ch$61,612 million in 2003, which primarily reflected the establishment of significant provisions in 2003 that were not in effect in 2002 and the growth of the Chilean economy. The decrease in our overall
provisions for loan losses were also attributable to the 15.9% appreciation of the Chilean peso against the U.S. dollar, which resulted in a decrease in the amount of our Chilean peso-denominated provisioning for foreign currency-denominated loans. As a result, the ratio of provisions to average loans decreased to 0.96% in 2003 from 1.65% in 2002. Our consolidated risk index, changed from 3.00% at the end of 2002, to 2.36% as of December 31, 2003.
Fees and Income from Services, Net
The following table sets forth certain components of our fees and income from services (net of fees paid to third parties that provide support for those services, principally fees relating to sales force and receipts and collection services provided to us) for the years ended December 31, 2002, 2003, 2004 and 2004:2005:
| Year Ended December 31, | % Increase (Decrease) | Year Ended December 31, | % Increase (Decrease) | |||||||||||||||||||||||||||||||||
| 2002 | 2003 | 2004 | 2002/2003 | 2003/2004 | 2003 | 2004 | 2005 | 2003/2004 | 2004/2005 | |||||||||||||||||||||||||||
| (in millions of constant Ch$ as of December 31, 2004, except for percentages) | (in millions of constant Ch$ as of December 31, 2005, except for percentages) | |||||||||||||||||||||||||||||||||||
Mutual funds | Ch$ | 14,089 | Ch$ | 19,286 | Ch$ | 23,186 | 36.9 | % | 20.2 | % | ||||||||||||||||||||||||||
Demand deposits and overdrafts | 23,000 | 24,902 | 23,150 | 8.3 | (7.0 | ) | ||||||||||||||||||||||||||||||
Insurance | 9,942 | 14,747 | 19,866 | 48.3 | 34.7 | |||||||||||||||||||||||||||||||
Stock brokerage | 9,876 | 12,518 | 15,099 | 26.8 | 20.6 | |||||||||||||||||||||||||||||||
Credit cards | Ch$ | 6,622 | Ch$ | 8,632 | Ch$ | 11,595 | 30.4 | % | 34.3 | % | 8,943 | 12,011 | 12,626 | 34.3 | 5.1 | |||||||||||||||||||||
Sight accounts and ATMs | 9,616 | 8,374 | 10,432 | (12.9 | ) | 24.6 | ||||||||||||||||||||||||||||||
Demand deposits and overdrafts | 20,893 | 22,200 | 24,037 | 6.3 | 8.3 | |||||||||||||||||||||||||||||||
Credit lines | 5,158 | 5,659 | 6,747 | 9.7 | 19.2 | |||||||||||||||||||||||||||||||
Mutual funds | 12,248 | 13,600 | 18,616 | 11.0 | 36.9 | |||||||||||||||||||||||||||||||
Stock brokerage | 3,716 | 9,533 | 12,083 | 156.5 | 26.7 | |||||||||||||||||||||||||||||||
Collection services | 2,675 | 2,946 | 3,561 | 10.1 | 20.9 | |||||||||||||||||||||||||||||||
Debit accounts and ATMs | 8,676 | 10,808 | 12,445 | 24.6 | 15.1 | |||||||||||||||||||||||||||||||
Receipts and payment of services | 5,891 | 7,351 | 7,960 | 24.8 | 8.3 | 7,616 | 8,248 | 9,150 | 8.3 | 10.9 | ||||||||||||||||||||||||||
Collection of over-due loans | 6,558 | 8,837 | 8,569 | 34.8 | (3.0 | ) | 9,155 | 8,877 | 8,656 | (3.0 | ) | (2.5 | ) | |||||||||||||||||||||||
Income and revenue from goods received in lieu of payment | 1,261 | 2,488 | 3,874 | 97.3 | 55.7 | |||||||||||||||||||||||||||||||
Financial advisory services | 5,681 | 4,799 | 8,134 | (15.5 | ) | 69.5 | ||||||||||||||||||||||||||||||
Credit lines | 5,863 | 6,990 | 7,272 | 19.2 | 4.0 | |||||||||||||||||||||||||||||||
Letters of credit, guarantees, collaterals and other contingent loans | 4,184 | 4,073 | 5,148 | (2.7 | ) | 26.4 | 4,220 | 5,333 | 4,748 | 26.4 | (11.0 | ) | ||||||||||||||||||||||||
Insurance | 6,294 | 9,596 | 14,236 | 52.5 | 48.4 | |||||||||||||||||||||||||||||||
Financial advisory services | 1,977 | 5,484 | 4,632 | 177.4 | (15.5 | ) | ||||||||||||||||||||||||||||||
Income and revenue from assets received in lieu of payment | 2,577 | 4,013 | 3,519 | 55.7 | (12.3 | ) | ||||||||||||||||||||||||||||||
Foreign trade and currency exchange | 2,300 | 3,340 | 3,409 | 45.2 | 2.1 | 3,461 | 3,533 | 3,336 | 2.1 | (5.6 | ) | |||||||||||||||||||||||||
Collection services | 3,052 | 3,689 | 2,527 | 20.9 | (31.5 | ) | ||||||||||||||||||||||||||||||
Prepaid loans | 1,238 | 2,018 | 3,317 | 63.0 | 64.4 | 2,091 | 3,436 | 2,352 | 64.3 | (31.5 | ) | |||||||||||||||||||||||||
Custody and trust services | 967 | 1,449 | 1,762 | 49.8 | 21.6 | |||||||||||||||||||||||||||||||
Leasing | 1,231 | 1,151 | 1,539 | (6.5 | ) | 33.7 | 1,193 | 1,595 | 1,283 | 33.7 | (19.6 | ) | ||||||||||||||||||||||||
Factoring | 301 | 750 | 584 | 149.2 | (22.1 | ) | 777 | 605 | 610 | (22.1 | ) | 0.8 | ||||||||||||||||||||||||
Custody and trust services | 609 | 934 | 1,399 | 53.4 | 49.8 | |||||||||||||||||||||||||||||||
Sales force expenses | (8,767 | ) | (11,135 | ) | (11,193 | ) | 27.0 | 0.5 | (11,536 | ) | (11,596 | ) | (15,015 | ) | 0.5 | 29.5 | ||||||||||||||||||||
Cobranding expenses | (6,314 | ) | (3,764 | ) | (5,817 | ) | (40.4 | ) | 54.5 | |||||||||||||||||||||||||||
Teller services expenses | (2,834 | ) | (3,252 | ) | (3,388 | ) | 14.7 | 4.2 | (3,369 | ) | (3,510 | ) | (3,960 | ) | 4.2 | 12.8 | ||||||||||||||||||||
Cobranding expenses | (3,149 | ) | (6,095 | ) | (3,633 | ) | 93.6 | (40.4 | ) | |||||||||||||||||||||||||||
Other | 711 | 1,767 | 3,318 | 148.5 | 87.8 | 1,827 | 3,439 | 2,864 | 88.2 | (16.7 | ) | |||||||||||||||||||||||||
Total | Ch$ | 78,733 | Ch$ | 98,251 | Ch$ | 126,842 | 24.8 | % | 29.1 | % | Ch$ | 101,787 | Ch$ | 131,408 | Ch$ | 137,793 | 29.1 | % | 4.9 | % | ||||||||||||||||
2004 and 2005. Fees and income from services net increased by 4.9%, from Ch$131,408 million in 2004 to Ch$137,793 million in 2005, primarily as a result of an increase in fees generated by insurance, mutual funds, financial advisories (principally associated to loan restructurings) and stock brokerage businesses, and to a lesser extent, to an increase in fees related to debit accounts and ATMs (primarily due to an increase in the client base with new checking accounts, coupled with the expansion of 257 new ATMs), receipts and payment of services and credit cards. The increase in fees was partially offset by higher sales force and cobranding expenses incurred in 2005, reflecting our aggressive efforts to expand our retail market business area.
2003 and 20042004.. Fees and income from services net increased by 29.1% from Ch$98,251101,787 million in 2003 to Ch$126,842131,408 million in 2004, primarily as a result of an increase in fees generated fromby mutual funds, insurance and stock brokerage related products, credit cards, checking accounts, overdrafts, sightdebit accounts and ATM transactions. Fee income accounted for 27.0% of operating revenues during 2004, a decreasean increase from 23.0% in 2003, primarily as a result of the improved quality and increased quantity of fee generating products through alliances, promotions, product innovations and expanded distribution.
2002 and 2003. Fees and income from services, net increased by 24.8% from Ch$78,733 million in 2002 to Ch$98,251 million in 2003. The increase in 2003 was primarily attributable to the improved performance of our stock brokerage subsidiary, an increase in financial advisory service fees, additional fee income from our insurance business and from Socofin S.A., our collection services subsidiary, increased fee income associated with checking accounts and sight accounts (primarily as a result of an increase in the number of these accounts), a new fee structure for overdrafts and increased credit cards fees.
Other Operating Income (Loss), Net
Other operating income (loss), net, consists of net gains and losses from trading activities and net gains and losses from foreign exchange transactions. Trading results include gains and losses realized on the sale of financial investments as well as gains and losses arising from marking financial investments to market at period-end. Net gains and losses from foreign exchange transactions include gains and losses realized upon the sale of foreign currency and foreign exchange derivatives and gains and losses arising from the period-end
translation of foreign currency-denominated assets and liabilities into pesos. Foreign exchange results do not include net adjustments on U.S. dollar-indexed domestic currency transactions, or the exchange rate variation on foreign branches’ capital and reserves. Foreign exchange results do include existing interest rate differences in currency derivatives.
The following table sets forth certain components of our other operating income (loss), net, in the years ended December 31, 2002, 2003, 2004 and 2004:2005:
| Year Ended December 31, | % Increase (Decrease) | Year Ended December 31, | % Increase (Decrease) | |||||||||||||||||||||||||||||
| 2002 | 2003 | 2004 | 2002/2003 | 2003/2004 | 2003 | 2004 | 2005 | 2003/2004 | 2004/2005 | |||||||||||||||||||||||
| (in millions of constant Ch$ as of December 31, 2004, except for percentages) | (in millions of constant Ch$ as of December 31, 2005, except for percentages) | |||||||||||||||||||||||||||||||
Gains (losses) on trading activities, net | Ch$ | 1,159 | Ch$ | 5,463 | Ch$ | (3,151) | 371.4 | % | — | % | Ch$ | 5,659 | Ch$ | (3,265 | ) | Ch$ | 3,289 | — | — | |||||||||||||
Foreign exchange transactions, net | (32,780 | ) | 93,338 | 17,660 | — | (81.1 | ) | 96,698 | 18,296 | 7,571 | (81.1 | )% | (58.6 | )% | ||||||||||||||||||
Net other operating income (loss) | Ch$ | (31,621 | ) | Ch$ | 98,801 | Ch$ | 14,509 | — | % | (85.3 | )% | |||||||||||||||||||||
Net other operating income | Ch$ | 102,357 | Ch$ | 15,031 | Ch$ | 10,860 | (85.3 | )% | (27.7 | )% | ||||||||||||||||||||||
2004 and 2005. In 2005, other operating income, net decreased by 27.7%, from Ch$15,031 million in 2004 to Ch$10,860 million in 2005, primarily as a result of a decrease in income from foreign exchange transactions in 2005, partially offset by gains on trading activities in 2005 (as compared to net trading losses in 2004).
Foreign exchange transactions, net decreased by 58.6%, from Ch$18,296 million in 2004 to Ch$7,571 million in 2005 as a result of the reduction of our net liability position in U.S. dollars. This position is usually hedged with a net asset position in Chilean peso-denominated assets and liabilities, readjusted in U.S. dollars.
Gains on sales of financial instruments for the year 2005 amounted to Ch$3,289 million as compared to a loss of Ch$3,265 million in 2004. The net gains registered in 2005 were mainly related to earnings obtained from Central Bank securities maintained by our brokerage subsidiary.
2003 and 2004. In 2004, other operating income, (loss), net contributed net income of Ch$14,50915,031 million, a substantial decrease from Ch$98,801102,357 million in 2003, primarily as a result of a significant decrease in income from foreign exchange transactions in 2004 and, to a lesser extent, losses on trading activities in the same year.
Gains on sales of financial instruments in 2004 accounted for a loss of Ch$3,151 million as compared to a gain of Ch$5,463 million in 2003. This loss was primarily a result of losses caused by decreases in the fair value of cross-currency swap transactions recorded during 2004 and losses associated with the sale of two loans in the manufacturing and retail sectors during 2004.
The decrease in foreign exchange transactions during 2004 as compared to 2003 was primarily attributable to a lower appreciation of the Chilean peso in 2004 of 6.6% as compared to 15.9% in 2003, which significantly reduced the income resulting from the net liability U.S. dollar-denominated position in 2004.
2002 and 2003.We recorded other operating incomeGains on sales of Ch$98,801 millionfinancial instruments in 2003, compared to an other operating2004 accounted for a loss of Ch$31,6213,265 million as compared to a gain of Ch$5,659 million in 2002,2003. This loss was primarily as a result of a significant increaselosses caused by decreases in income from foreign exchangethe fair value of cross-currency swap transactions recorded during 2004 and to a lesser extent, increased gains on trading activities. The increase in foreign exchange transactions was primarily attributable to our decision to maintain a higher net liability position in U.S. dollars at a time when the Chilean peso was appreciating against the U.S. dollar in 2003. This effect was partially offset by our net asset position in Chilean peso-denominated assets, which were readjusted in U.S. dollars.
Total gains on trading activities in 2003 totaled Ch$5,463 million, compared to Ch$1,159 million in 2002, primarily as a result of earnings obtained fromlosses associated with the sale of Argentine securities.two loans in the manufacturing and retail sectors during 2004.
Other Income and Expenses, Net
Other income and expenses, net consists of gains arising from the recovery of loans previously charged-off, non-operating income, non-operating expenses and income and gains arising from our affiliates accounted for by the equity method, offset by any minority interest participation in the net income of our subsidiaries. See notesNotes 9 17 and 1917 to our audited consolidated financial statements.
The following table sets forth certain components of our “other income and expenses, net,” infor the years ended December 31, 2002, 2003, 2004 and 2004:2005:
| Year Ended December 31, | % Increase (Decrease) | Year Ended December 31, | % Increase (Decrease) | |||||||||||||||||||||||||||||||||
| 2002 | 2003 | 2004 | 2002/2003 | 2003/2004 | 2003 | 2004 | 2005 | 2003/2004 | 2004/2005 | |||||||||||||||||||||||||||
| (in millions of constant Ch$ as of December 31, 2004, except for percentages) | ||||||||||||||||||||||||||||||||||||
Loan loss recoveries previously charged-off | Ch$ | 11,591 | Ch$ | 25,228 | Ch$ | 28,359 | 117.7 | % | 12.4 | % | ||||||||||||||||||||||||||
Loan loss recoveries reacquired from the Central Bank | 743 | 798 | 5,377 | 7.4 | 573.8 | |||||||||||||||||||||||||||||||
Subtotal | 12,334 | 26,026 | 33,736 | 111.0 | 29.6 | |||||||||||||||||||||||||||||||
| (in millions of constant Ch$ as of December 31, 2005, except for percentages) | ||||||||||||||||||||||||||||||||||||
Non-operating income | 6,135 | 5,429 | 4,821 | (11.5 | ) | (11.2 | ) | Ch$ | 5,626 | Ch$ | 4,995 | Ch$ | 7,859 | (11.2 | )% | 57.3 | % | |||||||||||||||||||
Non-operating expenses | (20,920 | ) | (15,963 | ) | (16,558 | ) | (23.7 | ) | 3.7 | (15,861 | ) | (16,483 | ) | (14,934 | ) | 3.9 | (9.4 | ) | ||||||||||||||||||
Subtotal | (14,785 | ) | (10,534 | ) | (11,737 | ) | (28.8 | ) | 11.4 | (10,235 | ) | (11,488 | ) | (7,075 | ) | 12.2 | (38.4 | ) | ||||||||||||||||||
Income from investments in other companies | (1,004 | ) | (1,251 | ) | 436 | 24.6 | % | — | (1,296 | ) | 452 | 681 | — | 50.7 | ||||||||||||||||||||||
Minority interest | (1 | ) | (2 | ) | (1 | ) | 100.0 | % | (50.0 | )% | (2 | ) | (1 | ) | — | (50.0 | ) | (100.0 | ) | |||||||||||||||||
Total | Ch$ | (3,456) | Ch$ | 14,239 | Ch$ | 22,434 | — | 57.6 | % | Ch$ | (11,533 | ) | Ch$ | (11,037 | ) | Ch$ | (6,394 | ) | (4.3 | )% | (42.1 | )% | ||||||||||||||
2004 and 2005. Other income and expenses, net decreased by 42.1% from an expense of Ch$11,037 million in 2004 to an expense of Ch$6,394 million in 2005. The decrease was primarily a result of lower non-operating expenses, net recorded in 2005, which was primarily a result of higher gains on assets received in lieu of payment in 2005 and due to tax expenses from previous years related to credit cards recorded in 2004.
2003 and 2004. Other income and expenses, net increased to incomedecreased by 4.3% from an expense of Ch$22,43411,533 million in 2004 from2003 to an expense of Ch$14,23911,037 million in 2003,2005, primarily as a result of a 29.6% increase in loan loss recoveries which resulted from improved economic conditions in Chile, increased collection efforts and, to a lesser extent, losses in connection with equity investments related to an affiliate that offers e-commerce services to our corporate customers in 2003.
2002 and 2003.Other income and expenses, net changed to income of Ch$14,239 million in 2003 from an expense of Ch$3,456 million in 2002, primarily as a result of an increase in the recovery of loans that had previously been charged-off, a decrease in non-operating expenses and a decrease in provisions and charge-offs on assets received in lieu of payment. The change was also attributable to the fact that certain non-recurring expenses (such as certain provisions and charge-offs on premises) were recorded in 2002 as a result of the merger. See note 17 to our audited consolidated financial statements.
Operating Expenses
The following table sets forth information regarding our operating expenses in the years ended December 31, 2002, 2003, 2004 and 2004:2005:
| Year Ended December 31, | % Increase (Decrease) | Year Ended December 31, | % Increase (Decrease) | |||||||||||||||||||||||||||
| 2002 | 2003 | 2004 | 2002/2003 | 2003/2004 | 2003 | 2004 | 2005 | 2003/2004 | 2004/2005 | |||||||||||||||||||||
| (in millions of constant Ch$ as of December 31, 2004, except for percentages) | (in millions of constant Ch$ as of December 31, 2005, except for percentages) | |||||||||||||||||||||||||||||
Personnel salaries and expenses | Ch$ | 138,829 | Ch$ | 128,329 | Ch$ | 136,599 | (7.6 | )% | 6.4 | % | Ch$ | 132,433 | Ch$ | 140,918 | Ch$ | 150,616 | 6.4 | % | 6.9 | % | ||||||||||
Administrative and other expenses: | ||||||||||||||||||||||||||||||
Advertising | 8,799 | 7,978 | 10,857 | (9.3 | ) | 36.1 | 8,265 | 11,248 | 11,975 | 36.1 | 6.5 | |||||||||||||||||||
Building maintenance | 8,112 | 5,715 | 6,722 | (29.5 | ) | 17.6 | 5,921 | 6,964 | 5,786 | 17.6 | (16.9 | ) | ||||||||||||||||||
Rentals and insurance | 9,536 | 9,191 | 9,204 | (3.6 | ) | 0.1 | 9,522 | 9,535 | 10,562 | 0.1 | 10.8 | |||||||||||||||||||
Office supplies | 4,783 | 4,359 | 4,554 | (8.9 | ) | 4.5 | 4,516 | 4,718 | 4,836 | 4.5 | 2.5 | |||||||||||||||||||
Other expenses | 64,013 | 54,604 | 56,389 | (14.7 | ) | 3.3 | 57,762 | 59,688 | 75,767 | 3.3 | 26.9 | |||||||||||||||||||
Total administrative and other expenses | Ch$ | 95,243 | Ch$ | 81,847 | Ch$ | 87,726 | (14.1 | )% | 7.2 | % | Ch$ | 85,986 | Ch$ | 92,153 | Ch$ | 108,926 | 7.2 | % | 18.2 | % | ||||||||||
Depreciation and amortization | 22,708 | 17,381 | 15,977 | (23.5 | ) | (8.1 | ) | 18,007 | 16,552 | 16,922 | (8.1 | ) | 2.2 | |||||||||||||||||
Total | Ch$ | 256,780 | Ch$ | 227,557 | Ch$ | 240,302 | (11.4 | )% | 5.6 | % | Ch$ | 236,426 | Ch$ | 249,623 | Ch$ | 276,464 | 5.6 | % | 10.8 | % | ||||||||||
2004 and 2005. Our operating expenses increased by 10.8%, from Ch$249,623 million in 2004 to Ch$276,464 million in 2005, principally reflecting the impact of higher administrative expenses and, to a lesser extent, the growth in personnel costs.
Higher administrative expenses were primarily the result of expenses incurred by our U.S. branches during 2005 in connection with our efforts to comply with orders entered into with the OCC and the Federal Reserve. These expenses, which mainly included legal counsel and consulting expenses, amounted to approximately Ch$12,700 million in 2005, compared to Ch$1,500 million in late 2004. For a description of the orders, see “Item 8. Financial Information—Consolidated Statements and Other Financial Information—Legal Proceedings.” To a lesser extent, administrative expenses during 2005 were impacted by higher advertising costs in order to support commercial activities, increased rental expenses (principally associated with the expansion of our distribution network) and higher consulting and technology expenses incurred by our subsidiaries.
Personnel costs and expenses increased by 6.9% during year 2005, mostly driven by higher indemnities principally related to expenses derived from the commercial reorganization we undertook in the second half of 2005 as part of our decision to adjust our client segmentation. To a lesser extent, salary increases and the incorporation of new employees during the year contributed to the increase in this item.
2003 and 2004. Our operating expenses increased by 5.6%, from Ch$227,557236,426 million in 2003 to Ch$240,302249,623 million in 2004, primarily as a result of increased personnel and administrative expenses. Personnel salaries and expenses increased by 6.4% during 2004, primarily as a result of salary increases, higher performance-related incentive expenses, the addition of 225 employees and a one-time bonus payment of approximately Ch$3,8904,030 million made in the fourth quarter of 2004 in connection with our four-year collective bargaining agreement with our labor unions. We do not expect to be involved in any new collective bargaining agreements in the next four years.
The annual increase in administrative expenses was primarily due to advertising expenses, expenses associated with the expansion of our ATM network and the Banco Credichile branch network, “Neos” related expenses and legal expenses of the New York branch.
Depreciation and amortization expenses declined by 8.1% during 2004, reflecting lower depreciation of computer equipment, which more than offset the higher amortization expenses related to our “Neos” project.
2002 and 2003. Our operating expenses decreased by 11.4% from Ch$256,780 million in 2002 to Ch$227,557 million in 2003, primarily as a result of cost savings associated with the merger. Personnel salaries and expenses decreased 7.6% in 2003 as a result of an employee reduction, which was partially offset by an increase in personnel salaries in 2003. The merger also resulted in a decrease in administrative costs, particularly those associated with the maintenance of fixed asset and rental expenses. Decreased depreciation expenses during 2003 were primarily due to higher charge-offs during 2002 of discontinued software and assets in leased branches that were closed during the first half of 2002.
Loss from Price-Level Restatement
Chilean GAAP requires that adjustments be made to nonmonetary assets (including fixed assets), liabilities and shareholders’ equity at the end of each reported period to reflect the effects of inflation during such period. The net effect of this inflation adjustment is reflected in our results of operations under “gain (loss) from price-level restatement.” See “—Overview—Inflation.”
2004 and 2005. The loss from price-level restatement increased from Ch$7,735 million in 2004 to Ch$11,450 million in 2005, primarily as a result of the increase in the inflation rate used for adjustment purposes from 2.5% in 2004 to 3.6% in 2005.
2003 and 2004. The loss from price-level restatement increased from Ch$4,1374,286 million in 2003 to Ch$7,4667,735 million in 2004, primarily as a result of the increase in the inflation rate used for adjustment purposes from 1.0% in 2003 to 2.5% in 2004.
2002 and 2003.The loss from price-level restatement decreased from Ch$9,934 million in 2002 to Ch$4,137 million in 2003 primarily as a result of a decrease in the inflation rate used for adjustment purposes from 3.0% in 2002 to 1.0% in 2003.
Income Tax
The statutory corporate income tax rate in Chile was 17% in 2005 and 2004 and 16.5% in 2003 and 17% in 2004.2003. We are also permitted under Law No. 19,396 to deduct dividend payments made to SAOS. In addition, any other payments made by SAOS or its shareholders to the Central Bank in connection with the Central Bank indebtedness are tax deductible. Consequently, our effective tax rate is significantly lower than the statutory corporate income tax rate because of the deduction of such dividend payments from our taxable income. Additionally, but to a lesser extent, differences in the tax treatment for provisions on individual loans and for charge-offs for past due loans have an impact on our effective tax rate. Moreover, all real estate taxes paid on properties that are leased to customers are deductible from our taxable income.
2004 and 2005.In 2005, we recorded a tax expense of Ch$21,391 million as compared to a tax expense of Ch$19,010 million in 2004. This increase was primarily attributable to the higher income tax base in 2005 as a result of a 14.1% increase in net income before taxes.
2003 and 2004. In 2004, we recorded a tax expense of Ch$18,34919,010 million as compared to a tax expense of Ch$14,25014,763 million in 2003. This increase was primarily attributable to a higher income tax base in 2004 as a result of a 15.5% increase in net income before taxes, and thean increase in the statutory income tax rate from 16.5% in 2003 to 17% in 2004.
2002 and 2003. We recorded a tax expense of Ch$14,250 million in 2003, as compared to a tax benefit of Ch$1,194 million in 2002. The change was primarily attributable to a higher income tax base in 2003, as a result of the 178% increase in net income before taxes between periods, an increase in the corporate income tax rate from 16.0% in 2002 to 16.5% in 2003, a lower tax benefit in 2003 relating to the amortization of the complementary accounts on accumulated deferred taxes for periods prior to 1999 and non-recurring earnings in 2002 related to the recognition of deferred taxes as a consequence of the increase in the corporate income tax rate in 2002.
Chilean and U.S. GAAP Reconciliation
We prepare our audited consolidated financial statements in accordance with Chilean GAAP, which differs in certain significant respects from U.S. GAAP. See noteNote 28 to our audited consolidated financial statements for a description of the material differences between Chilean GAAP and U.S. GAAP, as they relate to us and our consolidated subsidiaries, reconciliation to U.S. GAAP of net income and shareholders’ equity and a discussion of new accounting rules under U.S. GAAP. The following table sets forth net income and shareholders’ equity for the years ended December 31, 2002, 2003, 2004 and 20042005 under Chilean GAAP and U.S. GAAP:
| Year Ended December 31, | |||||||||
| 2002 | 2003 | 2004 | |||||||
| (in millions of constant Ch$ as of December 31, 2004) | |||||||||
Net income (Chilean GAAP) | Ch$ | 54,490 | Ch$ | 133,817 | Ch$ | 152,628 | |||
Net income (U.S. GAAP) | 17,552 | 133,658 | 146,912 | ||||||
Shareholders’ equity (Chilean GAAP) | 640,022 | 713,068 | 674,533 | ||||||
Shareholders’ equity (U.S. GAAP) | Ch$ | 1,325,079 | Ch$ | 1,374,166 | Ch$ | 1,324,275 | |||
Net income (Chilean GAAP) Net income (U.S. GAAP) Shareholders’ equity (Chilean GAAP) Shareholders’ equity (U.S. GAAP) Year Ended December 31, 2003 2004 2005 (in millions of constant Ch$ as of December 31, 2005) Ch$ 138,634 Ch$ 158,123 Ch$ 180,724 138,471 152,202 168,830 738,738 698,817 775,107 Ch$ 1,423,634 Ch$ 1,371,948 Ch$ 1,429,747
Significant differences exist between our net income and shareholders’ equity under Chilean GAAP as presented in “Item 5. Operating and Financial Review and Prospects,” and our net income and shareholders’ equity under U.S. GAAP as presented in noteNote 28 to our audited consolidated financial statements. The differences are primarily in the context of the accounting treatment used for the merger. The principal differences are as follows:
so we applied purchase accounting. As a result, we must calculate goodwill based on the difference between the purchase price (i.e., the market value of our shares) and the fair value of the proportion of assets and liabilities acquired from minority interest holders at the date of the merger. As part of this process, under U.S. GAAP, we were also required to value previously unrecorded intangible assets, such as the Banco de A. Edwards brand name, and to include these assets in our financial records. Such assets remain unrecorded under Chilean GAAP. The different basis of the assets and liabilities caused by this treatment has an effect on changes in depreciation and amortization in subsequent periods.
These differences are explained in greater detail in note 28(a)Note 28 to our audited consolidated financial statements.
LIQUIDITY AND CAPITAL RESOURCES
Overview
Liquidity risk is the risk that we will be unable to meet our payment obligations and potential payment obligations as and when they become due without incurring unacceptable losses. To manage that risk, we maintain at all times a diversified stockportfolio of highly liquid assets that can be quickly mobilized, in extraordinary circumstances, including cash, financial investments and Central Bank and government securities. Additionally, we have established lines of credit with foreign and domestic banks and have access to Central Bank borrowings to increase liquidity as necessary.
Our general policy is to maintain sufficient liquidity to ensure our ability to honor withdrawals of deposits, make repayments of other liabilities at maturity, extend loans and meet our working capital needs. As a bank, we satisfy our working capital needs through general funding. The majority of our funding is derived from deposits and other borrowings from the public. We believe that our working capital is sufficient to meet our present needs. The minimum amount of liquidity is determined by the reserve requirements set by the Central Bank. These reserves are currently 9.0% of demand deposits and 3.6% of time deposits. We are in compliance with all of these requirements.
In addition, we are subject to a technical requirement applicable to Chilean banks pursuant to which we must hold a certain amount of assets in cash or in highly liquid instruments. This reserve is equal to the amount by which the daily balance of:
in the aggregate exceeds 2.5 times the amount of our capital and reserves.
Chilean regulations also require that gaps between assets and liabilities maturing within less than 30 days not exceed a bank’s basic capital and that gaps among assets and liabilities maturing within less than 90 days not exceed twice a bank’s equity.
The senior members of our financial division evaluate liquidity by projecting daily cash flows over the following 10090 days to verify that adequate liquidity is maintained, in compliance with limits imposed by Chilean banking regulations and those set internally by us.
Cash Flows
The tables below set forth our principal sources of cash. Our subsidiaries are not an important source of cash for us and therefore, have no impact ondo not significantly influence our ability to meet our cash obligations. No legal, contractual or economic restrictions exist on the ability of our subsidiaries to transfer funds to us in the form of loans or cash dividends as long as our subsidiaries abide by the regulations in the Chilean Corporations Law regarding loans to related parties and minimum dividend payments.
| Year Ended December 31, | |||||||||
| 2002 | 2003 | 2004 | |||||||
| (in millions of constant Ch$ as of December 31, 2004) | |||||||||
Net cash provided by (used in) operating activities | Ch$ | 432,859 | Ch$ | (117,085) | Ch$ | 574,804 | |||
| Year Ended December 31, | ||||||||||
| 2003 | 2004 | 2005 | ||||||||
| (in millions of constant Ch$ as of December 31, 2005) | ||||||||||
Net cash provided by (used in) operating activities | Ch$ | (121,300 | ) | Ch$ | 595,496 | Ch$ | 431,020 | |||
2004 and 2005. Cash provided by operating activities decreased to Ch$431,020 million in 2005 from Ch$595,496 million in 2004, primarily as a result of a lower decrease in our financial investments, mainly short-term Central Bank securities as we placed a new series of subordinated bonds and 5-year bonds on the local market during 2005, which improved our liquidity and allowed us to reduce our lower-yielding short-term assets.
2003 and 20042004.. Cash provided by operating activities reached Ch$574,804595,496 million in 2004 compared to cash used in operating activities of Ch$117,085121,300 million in 2003, primarily as a result of a decrease in our financial investments, primarily in short-term Central Bank securities and Chilean financial institutions, due to our issuance of three series of bonds on September 1, 2004, which improved our liquidity and allowed us to reduce our lower-yielding short-term assets. In addition, foreign country-related investments also declined as a result of the decrease in the exchange rate.
| Year Ended December 31, | ||||||||||||
| 2003 | 2004 | 2005 | ||||||||||
| (in millions of constant Ch$ as of December 31, 2005) | ||||||||||||
Net cash used in investing activities | Ch$ | (176,660 | ) | Ch$ | (665,806 | ) | Ch$ | (1,224,735 | ) | |||
20022004 and 2003. We recorded cash used in operating activities of Ch$117,085 million in 2003, primarily as a result of an increase in the amount of Central Bank and government securities required to be held by us in order to comply with higher technical reserve requirements from the significant growth in checking accounts.
| Year Ended December 31, | |||||||||
| 2002 | 2003 | 2004 | |||||||
| (in millions of constant Ch$ as of December 31, 2004) | |||||||||
Net cash used in investing activities | Ch$ | (259,362) | Ch$ | (170,521) | Ch$ | (642,668) | |||
2003 and 20042005. Cash used in investing activities increased to Ch$642,6681,224,735 million in 20042005 from Ch$170,521665,806 million in 20032004 primarily as a result of ana 15.0% increase in the volume of our loan portfolio.
20022003 and 2003.2004. Cash used in investing activities decreasedincreased to Ch$170,521665,806 million in 2004 from Ch$176,660 million in 2003 from Ch$259,362 million in 2002, primarily as a result of a decrease7.4% increase in the funds used in spot foreign exchange transactions.volume of our loan portfolio.
| Year Ended December 31, | |||||||||
| 2002 | 2003 | 2004 | |||||||
| (in millions of constant Ch$ as of December 31, 2004) | |||||||||
Net cash provided by (used in) financing activities | Ch$ | (269,466) | Ch$ | 473,368 | Ch$ | 98,645 | |||
| Year Ended December 31, | |||||||||
| 2003 | 2004 | 2005 | |||||||
| (in millions of constant Ch$ as of December 31, 2005) | |||||||||
Net cash provided by financing activities | Ch$ | 490,410 | Ch$ | 102,196 | Ch$ | 568,446 | |||
2004 and 2005. The increase in cash provided by financing activities from Ch$102,196 million in 2004 to cash provided by financing activities of Ch$568,446 million in 2005 was primarily attributable to an increase in time deposits and, to a lesser extent, related to an increase in long-term foreign borrowings and to the repurchase of 2.5% of our shares.
2003 and 2004. The decrease in cash provided by financing activities offrom Ch$473,368490,410 million in 2003 to cash provided by financing activities of Ch$98,645102,196 million in 2004 was primarily attributable to a
decrease in investments sold under agreements to repurchase, mortgage finance bonds and foreign borrowings. Additionally, the decrease in net cash provided by financing activities resulted from the purchase of 2.5% of our shares and higher dividends distributed to our shareholders Ch$130,550(Ch$135,250 million in 2004 compared to Ch$53,94955,891 million in 2003.2003).
2002 and 2003. The change from cash used in financing activities of Ch$269,466 million in 2002 to cash provided by financing activities of Ch$473,368 million in 2003 was primarily attributable to an increase in savings accounts and time deposits and, to a lesser extent, an increase in short-term foreign borrowings and investments sold under repurchase agreements.
Other Borrowings
Our long-term and short-term borrowings are summarized below. In accordance with the guidelines established by the Chilean Superintendency of Banks, we do not present a classified balance sheet. Borrowings are described as short-term when they have original maturities of less than one year or are due on demand. All other borrowings are described as long-term, including the amounts due within one year on such borrowings.
| Year Ended December 31, 2003 | Year Ended December 31, 2004 | |||||||||||||||||
| Long-term | Short-term | Total | Long-term | Short- term | Total | |||||||||||||
| (in millions of constant Ch$ as of December 31, 2004) | ||||||||||||||||||
Central Bank Credit lines for renegotiation of loans | Ch$ | 3,049 | — | Ch$ | 3,049 | Ch$ | 1,930 | — | Ch$ | 1,930 | ||||||||
Other Central Bank Borrowings | — | Ch$ | 25,529 | 25,529 | — | Ch$ | 107,643 | 107,643 | ||||||||||
Mortgage finance bonds | 1,039,813 | — | 1,039,813 | 788,888 | — | 788,888 | ||||||||||||
Bonds | 3,205 | — | 3,205 | 181,515 | — | 181,515 | ||||||||||||
Subordinated bonds | 277,977 | — | 277,977 | 266,304 | — | 266,304 | ||||||||||||
Borrowings from domestic financial institutions | 106 | 51,023 | 51,129 | — | 26,399 | 26,399 | ||||||||||||
Foreign borrowings | 462,131 | 273,787 | 735,918 | 254,812 | 340,736 | 595,548 | ||||||||||||
Investments sold under agreements to repurchase | — | 437,410 | 437,410 | — | 349,086 | 349,086 | ||||||||||||
Other obligations | 10,092 | 50,998 | 61,090 | 11,089 | 33,758 | 44,847 | ||||||||||||
Total other interest bearing liabilities | Ch$ | 1,796,373 | Ch$ | 838,747 | Ch$ | 2,635,120 | Ch$ | 1,504,538 | Ch$ | 857,622 | Ch$ | 2,362,160 | ||||||
Central Bank Credit lines for renegotiation of loans Other Central Bank Borrowings Mortgage finance bonds Bonds Subordinated bonds Borrowings from domestic financial institutions Foreign borrowings Investments sold under agreements to repurchase Other obligations Total other interest bearing liabilities Year Ended December 31, 2004 Year Ended December 31, 2005 Long-term Short-term Total Long-term Short-term Total (in millions of constant Ch$ as of December 31, 2005) Ch$ 1,999 — Ch$ 1,999 Ch$ 1,407 — Ch$ 1,407 — Ch$ 111,518 111,518 — — — 817,288 — 817,288 556,504 — 556,504 188,050 — 188,050 324,704 — 324,704 275,891 — 275,891 305,284 — 305,284 — 27,349 27,349 — Ch$ 90,160 90,160 263,986 353,002 616,988 647,510 13,983 661,493 — 361,653 361,653 — 270,750 270,750 11,488 34,973 46,461 1,338 32,405 33,743 Ch$ 1,558,702 Ch$ 888,495 Ch$ 2,447,197 Ch$ 1,836,747 Ch$ 407,298 Ch$ 2,244,045
Central Bank borrowings
Central Bank borrowings include credit lines for the renegotiation of loans and other Central Bank borrowings. Credit lines were provided by the Central Bank for the renegotiation of mortgage loans due to the need to refinance debts as a result of the economic recession and crisis of the Chilean banking system from 1982 to 1985. The credit lines for the renegotiations of mortgage loans are linked to the UF index and carry a real annual interest rate of 2.29%3.19% as of December 31, 2004.2005. The maturities of the outstanding amounts are as follows:
| As of December 31, | ||||
(in millions of constant Ch$ as of
| ||||
Due within 1 year | Ch$ | |||
Due after 1 year but within 2 years | — | |||
Due after 2 years but within 3 years | — | |||
Due after 3 years but within 4 years | — | |||
Due after 4 years but within 5 years | — | |||
Due after 5 years | — | |||
Total long-term (Credit lines for renegotiation of loans) | ||||
Total short-term (Other Central Bank borrowings) | ||||
Total Central Bank borrowings | Ch$ | |||
Mortgage finance bonds
Mortgage finance bonds are used to finance the granting of mortgage loans. The outstanding principal amounts of the bonds are amortized on a quarterly basis. The range of maturities of these bonds is between five and twenty years. The bonds are linked to the UF index and carry a weighted average annual interest rate of 5.9%4.07% as of December 31, 2004.
2005.
The maturities of outstanding mortgage finance bond amounts as of December 31, 20042005 are as follows:
| As of December 31, | ||||
| (in millions of constant Ch$ as of | ||||
Due within 1 year | Ch$ | |||
Due after 1 year but within 2 years | ||||
Due after 2 years but within 3 years | ||||
Due after 3 years but within 4 years | ||||
Due after 4 years but within 5 years | ||||
Due after 5 years | ||||
Total mortgage finance bonds | Ch$ | |||
Bonds
Our bonds are linked to the UF Index and carry an average real annual interest rate of 3.6%3.20% as of December 31, 2004,2005, with interest and principal payments due semi-annually. The bonds were originally intended to finance loans that had a maturity of greater than one year.
The maturities of outstanding bond amounts as of December 31, 20042005 are as follows:
| As of December 31, | ||||
| (in millions of constant Ch$ as of | ||||
Due within 1 year | Ch$ | |||
Due after 1 year but within 2 years | ||||
Due after 2 years but within 3 years | ||||
Due after 3 years but within 4 years | ||||
Due after 4 years but within 5 years | ||||
Due after 5 years | ||||
Total bonds | Ch$ | |||
Subordinated bonds
In 2002 we issued bonds totaling UF1,580,000 at a discount of UF98,670. TheOur currently outstanding subordinated bonds are linked to the UF index with interest and principal payments due semi-annually. The discount on the issuance of the currently outstanding subordinated bonds is amortized over the life of the bond. As of December 31, 2004,2005, the effective real interest rate is 7.0%,was 6.60% taking into consideration the discount on issuance.
The bonds are intended to finance loans having a maturity greater than one year. As of December 31, 20042005 the outstanding maturities of the bonds, which are considered long-term, are as follows:
| As of December 31, | |||
| (in millions of constant Ch$ as of December 31, | |||
Due within 1 year | Ch$ | 31,191 | |
Due after 1 year but within 2 years | 24,374 | ||
Due after 2 years but within 3 years | 24,374 | ||
Due after 3 years but within 4 years | 24,374 | ||
Due after 4 years but within 5 years | 24,374 | ||
Due after 5 years | 176,597 | ||
Total subordinated bonds | Ch$ | 305,284 | |
On June 15, 2006, we issued U.S.$200,000,000 of 6.25% subordinated notes due 2016. The notes pay interest semi-annually, and were issued pursuant to an exemption from registration under Regulation S and Rule 144A of the Securities Act.
Subordinated bonds are considered in the calculation of “effective equity” for the purpose of determining our minimum capital requirements.
Borrowings from domestic financial institutions
Borrowings from domestic financial institutions, which are used to fund our general activities, carry a weighted average annual real interest rate of 2.39%4.75% as of December 31, 20042005 and have the following outstanding maturities as of December 31, 2004:2005:
| As of December 31, | ||||
| (in millions of constant Ch$ as of December 31, | ||||
Due within 1 year | Ch$ | — | ||
Due after 1 year but within 2 years | — | |||
Due after 2 years but within 3 years | — | |||
Due after 3 years but within 4 years | — | |||
Due after 4 years but within 5 years | — | |||
Due after 5 years | — | |||
Total long-term | — | |||
Total short-term | Ch$ | 90,160 | (1) | |
Total borrowings from domestic financial institutions | Ch$ | 90,160 | ||
| (1) | Includes borrowings with maturities that were originally greater than one year but which as of December 31, 2005 had remaining maturities of less than one year. |
Foreign borrowings
We have short-term and long-term borrowings from foreign banks. The outstanding maturities of these borrowings as of December 31, 20042005 are as follows:
| ||
| ||
| ||
| ||
| ||
| ||
| ||
| ||
| ||
| As of December 31, 2005 | |||||||||
| Syndicated Loan | Other Foreign Borrowings | Total | |||||||
| (in millions of constant Ch$ as of December 31, 2005) | |||||||||
Due within 1 year | Ch$ | 629 | Ch$ | 450,149 | Ch$ | 450,778 | |||
Due after 1 year but within 2 years | — | 93,243 | 93,243 | ||||||
Due after 2 years but within 3 years | — | — | — | ||||||
Due after 3 years but within 4 years | 77,132 | 26,357 | 103,489 | ||||||
Due after 4 years but within 5 years | — | — | — | ||||||
Due after 5 years | — | — | — | ||||||
Total long-term | 77,761 | 569,749 | 647,510 | ||||||
Total short-term | — | 13,983 | 13,983 | ||||||
Total foreign borrowings | Ch$ | 77,761 | Ch$ | 583,732 | Ch$ | 661,493 | |||
AllEach of these loans areis denominated in U.S. dollars, areforeign currency and is principally used to fund our foreign trade loans and carry an average annual nominal interest rate of 2.33%1.40% as of December 31, 2004.
2005. The syndicated loan’s interest rate is composed of a three month U.S.D. LIBO rate, plus 0.23%.
Other obligations
| As of December 31, | ||||||
| 2003 | 2004 | |||||
| (in millions of constant Ch$ as of December 31, 2004) | ||||||
Other long-term obligations: | ||||||
Obligations with Chilean government | Ch$ | 10,092 | Ch$ | 11,089 | ||
Total other long-term obligations | 10,092 | 11,089 | ||||
Other short-term obligations | 50,998 | 33,758 | ||||
Total other obligations | Ch$ | 61,090 | Ch$ | 44,847 | ||
| As of December 31, | ||||||
| 2004 | 2005 | |||||
| (in millions of constant Ch$ as of December 31, 2005) | ||||||
Other long-term obligations: | ||||||
Obligations with Chilean government | Ch$ | 11,488 | Ch$ | 1,338 | ||
Total other long-term obligations | 11,488 | 1,338 | ||||
Other short-term obligations | 34,973 | 32,405 | ||||
Total other obligations | Ch$ | 46,461 | Ch$ | 33,743 | ||
As of December 31, 2004,2005, other obligations had the following maturities:
| As of December 31, | ||||
| (in millions of constant Ch$ as of | ||||
Due within 1 year | Ch$ | 1,338 | ||
Due after 1 year but within 2 years | — | |||
Due after 2 years but within 3 years | — | |||
Due after 3 years but within 4 years | — | |||
Due after 4 years but within 5 years | — | |||
Due after 5 years | — | |||
Total long-term | 1,338 | (1) | ||
Total short-term | 32,405 | (1) | ||
Total other obligations | Ch$ | 33,743 | ||
| (1) | Includes borrowings with maturities that were originally greater than one year but which as of December 31, 2005 had remaining maturities of less than one year. |
Asset and Liability Management
Our asset and liability management policy is to maximize net interest revenue, and return on assets and shareholders’ equity in light of interest rate, liquidity and foreign exchange risks, and within the limits of Chilean banking regulations and our internal risk management policies. Subject to these constraints, we may from time to time take mismatched positions as to interest rates or, in certain limited circumstances, foreign currencies when justified, in our view, by market conditions and prospects, and subject to our asset and liability management policies. Our board of directors determines our asset and liability policies. See “Item 11. Quantitative and Qualitative Disclosure About Market Risk.”
Funding
The following table sets forth our average daily balance of liabilities for the years ended December 31, 2002, 2003, 2004 and 2004,2005, in each case together with the related average nominal interest rates paid thereon:
| Year Ended December 31, | |||||||||||||||||||||||||||
| 2002 | 2003 | 2004 | |||||||||||||||||||||||||
| Average Balance | % of Total Liabilities | Average Nominal Rate | Average Balance | % of Total Liabilities | Average Nominal Rate | Average Balance | % of Total Liabilities | Average Nominal Rate | |||||||||||||||||||
| (in millions of constant Ch$ as of December 31, 2004, except for percentages) | |||||||||||||||||||||||||||
Non-interest bearing demand deposits | Ch$ | 1,633,578 | 18.9 | % | — | Ch$ | 1,873,627 | 21.8 | % | — | Ch$ | 2,088,509 | 23.3 | % | — | ||||||||||||
Time deposits | 3,640,906 | 42.0 | 4.1 | % | 3,413,951 | 39.8 | 2.5 | % | 3,466,036 | 38.7 | 2.5 | % | |||||||||||||||
Savings accounts | 173,446 | 2.0 | 4.3 | 176,967 | 2.1 | 1.7 | 146,778 | 1.7 | 2.2 | ||||||||||||||||||
Mortgage finance bonds | 1,312,999 | 15.2 | 9.3 | 1,051,414 | 12.2 | 7.4 | 914,065 | 10.2 | 8.2 | ||||||||||||||||||
Central Bank borrowings | 62,674 | 0.7 | 3.7 | 69,949 | 0.8 | 2.5 | 90,259 | 1.0 | 2.3 | ||||||||||||||||||
Contingent liabilities | 379,759 | 4.4 | — | 404,684 | 4.7 | — | 478,351 | 5.4 | — | ||||||||||||||||||
Other non-interest bearing liabilities | 301,567 | 3.5 | — | 199,798 | 2.3 | — | 298,514 | 3.3 | — | ||||||||||||||||||
Other interest bearing liabilities | 1,160,086 | 13.3 | 4.5 | % | 1,400,636 | 16.3 | 2.9 | % | 1,470,789 | 16.4 | 3.3 | % | |||||||||||||||
Total liabilities | Ch$ | 8,665,015 | 100.0 | % | Ch$ | 8,591,026 | 100.0 | % | Ch$ | 8,953,301 | 100.0 | % | |||||||||||||||
| Year Ended December 31, | |||||||||||||||||||||||||||
| 2003 | 2004 | 2005 | |||||||||||||||||||||||||
Average Balance | % of Total Liabilities | Average Nominal Rate | Average Balance | % of Total Liabilities | Average Nominal Rate | Average Balance | % of Total Liabilities | Average Nominal Rate | |||||||||||||||||||
| (in millions of constant Ch$ as of December 31, 2005, except for percentages) | |||||||||||||||||||||||||||
Non-interest bearing demand deposits | Ch$ | 1,941,079 | 21.8 | % | — | Ch$ | 2,163,695 | 23.3 | % | — | Ch$ | 2,185,826 | 22.7 | % | — | ||||||||||||
Time deposits | 3,536,853 | 39.7 | 2.5 | % | 3,590,813 | 38.8 | 2.5 | % | 3,934,121 | 40.8 | 4.3 | % | |||||||||||||||
Savings accounts | 183,338 | 2.1 | 1.7 | 152,062 | 1.6 | 2.2 | 139,267 | 1.4 | 3.8 | ||||||||||||||||||
Mortgage finance bonds | 1,089,265 | 12.2 | 7.4 | 946,971 | 10.2 | 8.2 | 616,794 | 6.4 | 8.2 | ||||||||||||||||||
Central Bank borrowings | 12,367 | 0.1 | 3.5 | 12,832 | 0.1 | 2.9 | 31,822 | 0.3 | 3.3 | ||||||||||||||||||
Contingent liabilities | 419,253 | 4.7 | — | 495,572 | 5.3 | — | 616,375 | 6.4 | — | ||||||||||||||||||
Other non-interest bearing liabilities | 206,989 | 2.3 | — | 309,263 | 3.3 | — | 363,661 | 3.8 | — | ||||||||||||||||||
Other interest bearing liabilities | 1,511,158 | 17.1 | 2.9 | % | 1,604,413 | 17.4 | 3.3 | % | 1,759,873 | 18.2 | 4.9 | % | |||||||||||||||
Total liabilities | Ch$ | 8,900,302 | 100.0 | % | Ch$ | 9,275,621 | 100.0 | % | Ch$ | 9,647,739 | 100.0 | % | |||||||||||||||
Our most important source of funding is our customer deposits, which consist primarily of peso-denominated non-interest bearing demand deposits and peso- and UF-denominated interest bearing time deposits. Non-interest bearing demand deposits represented 23.3%22.7% of our average total liabilities in 2004,2005, and are our least expensive source of funding. Time deposits and mortgage finance bonds represented 48.9%47.2% of our average liabilities in 2005 and 49.0% in 2004, and 52.0% in 2003, respectively.
Our current funding strategy is to continue to utilize all sources of funding in accordance with their cost and availability and with our general asset and liability management strategy. We also intend to continue to broaden our customer deposit base, to emphasize core deposit funding and to fund our mortgage loans with the matched funding available through the issuance of mortgage finance bonds and other long-term bonds in Chile’s capital markets. See “Item 4. Information on the Company—Business Overview—Principal Business Activities—Retail Banking.Market.”
A sound liquidity strategy assures the funding of business opportunities and the meeting of financial obligations when they are due. To accomplish these goals, we manage both the liability side as well as the asset side of our balance sheet and have a contingency funding plan for maintaining liquidity under adverse market conditions.
On the liability side, two kinds of limits control the diversification of our funding sources. The first limit establishes that: (1) the total deposits and repurchase agreements taken from any one institutional investor do not exceed a certain percentage of current liabilities; and (2) the sum of deposits and repurchase agreements
taken from all institutional investors do not exceed a certain percentage of current liabilities. The second limit is a 30-day liquidity ratio, which limits volatile liabilities to a percentage of our liquid assets. Liquid assets are composed of low risk loans that are due within 30 days and short-term financial instruments.
On the asset side, we maintain a short-term financial investment portfolio composed of investments with a high degree of liquidity due to the depth of the market and the low “bid-offer” spreads.
OFF-BALANCE SHEET ARRANGEMENTS
In the normal course of business, we are a party to a number of off-balance sheet activities that contain credit, market and operational risk that are not reflected in our consolidated financial statements. These activities include commitments to extend credit not otherwise accounted for as contingent loans, such as overdrafts and credit card lines of credit, and long-term contractual obligations under operating leases or service contracts.
We provide customers with off-balanceoff balance sheet credit support through loan commitments. Such commitments are agreements to lend to a customer at a future date, subject to compliance with the contractual terms. Since substantial portions of these commitments are expected to expire without our having to make any loans, total commitment amounts do not necessarily represent our actual future cash requirements. The amounts of these loan commitments were Ch$909,217941,949 million (U.S.$1,832 million) and Ch$593,0021,232,493 million (U.S.$2,397 million) as of December 31, 20032004 and 2004,2005, respectively. The amounts of subscribed leasing contracts were Ch$55,53757,536 million (U.S.$112 million) and Ch$41,19561,436 million (U.S.$119 million) as of December 31, 20032004 and 2004,2005, respectively.
Our interest rate swap agreements are treated as off-balanceoff balance sheet financial instruments and the net interest effect, which is the difference between interest income and interest expense arising from such agreements, is recorded in net income in the period in which such differences originate. However, interest rate and cross-currency swaps, which are entered into in order to hedge the foreign investment portfolio, are recorded at their estimated fair market values.
See Note 13 to our audited financial statements.
The credit risk of both on- and off-balanceoff balance sheet financial instruments variesvary based on many factors, including the value of collateral held and other security arrangements. To mitigate credit risk, we generally determine the need for specific covenant, guarantee and collateral requirements on a case-by-case basis, depending on the nature of the financial instrument and the customer’s creditworthiness. We may also receive comfort letters and oral assurances. The amount and type of collateral held to reduce credit risk varies, but may include real estate, machinery, equipment, inventory and accounts receivable, as well as cash on deposit, stocks, bonds and other marketable securities that are generally held in our possession or at another appropriate custodian or depository. This collateral is valued and inspected on a regular basis to ensure both its existence and adequacy. Additional collateral is requested when appropriate.
Financial Guarantees
The following is a summary of instruments that are considered financial guarantees in accordance with FASB Interpretation No. 45:No.45:
| As of December 31, | |||
(in millions of constant Ch$ as of December 31, | |||
Performance bonds | Ch$ | 539,385 | |
Foreign office guarantees | 21,976 | ||
Standby letters of credit | 11,074 | ||
Total | Ch$ | 572,435 | |
Guarantees in the form of performance bonds, standby letters of credit and foreign office guarantees are issued in connection with agreements made by customers to counterparties. If the customer fails to comply with the agreement, the counterparty may enforce the performance bonds, standby letters of credit or foreign office guarantees as a remedy. Credit risk arises from the possibility that the customer may not be able to repay us for these guarantees.
The expiration of guarantees per period is as follows:
| Due within 1 year | Due after 1 year but within 3 years | Due after 3 years but within 5 years | Due after 5 years | Total | |||||||||||
| (in millions of constant Ch$ as of December 31, 2004) | |||||||||||||||
Performance bonds | Ch$ | 221,812 | Ch$ | 96,309 | Ch$ | 28,322 | Ch$ | 1,400 | Ch$ | 347,843 | |||||
Standby letters of credit | 12,521 | 10,956 | 78 | 182 | 23,737 | ||||||||||
Foreign office guarantees | 15,355 | — | — | — | 15,355 | ||||||||||
Total | Ch$ | 249,688 | Ch$ | 107,265 | Ch$ | 28,400 | Ch$ | 1,582 | Ch$ | 386,935 | |||||
| Due within 1 year | Due after 1 years | Due after 3 years | Due after 5 years | Total | |||||||||||
| (in millions of constant Ch$ as of December 31, 2005) | |||||||||||||||
Performance bonds | Ch$ | 354,325 | Ch$ | 158,882 | Ch$ | 22,898 | Ch$ | 3,280 | Ch$ | 539,385 | |||||
Foreign office guarantees | 21,976 | — | — | — | 21,976 | ||||||||||
Standby letters of credit | 8,965 | 1,914 | 195 | — | 11,074 | ||||||||||
Total | Ch$ | 385,266 | Ch$ | 160,796 | Ch$ | 23,093 | Ch$ | 3,280 | Ch$ | 572,435 | |||||
TABULAR DISCLOSURE OF CONTRACTUAL OBLIGATIONS
The following tables set forth our contractual obligations and commercial commitments by time remaining to maturity. As of December 31, 2004,2005, the scheduled maturities of our contractual obligations, including accrued interest, were as follows:
| Due within 1 year | Due after 1 year but within 3 years | Due after 3 years but within 5 years | Due after 5 years | Total | ||||||||||||||||||||||||||
| (in millions of constant Ch$ as of December 31, 2004) | ||||||||||||||||||||||||||||||
Contractual Obligations | Due within 1 year | Due after 1 years | Due after 3 years | Due after 5 years | Total | |||||||||||||||||||||||||
Deposit and other term liabilities(1) | Ch$ | 3,296,296 | Ch$ | 224,033 | Ch$ | 1,020 | — | Ch$ | 3,521,349 | |||||||||||||||||||||
| (in millions of constant Ch$ as of December 31, 2005) | ||||||||||||||||||||||||||||||
Deposit and other term liabilities(1) | Ch$ | 4,276,743 | Ch$ | 198,184 | — | — | Ch$ | 4,474,927 | ||||||||||||||||||||||
Mortgage finance bonds | 79,647 | 142,559 | 137,644 | Ch$ | 429,038 | 788,888 | 72,128 | 108,694 | Ch$ | 103,442 | Ch$ | 272,240 | 556,504 | |||||||||||||||||
Bonds issued | 56,013 | 97,076 | 95,707 | 199,023 | 447,819 | 98,182 | 181,312 | 132,874 | 217,620 | 629,988 | ||||||||||||||||||||
Central Bank credit lines from renegotiations of loans | 1,930 | — | — | — | 1,930 | 1,407 | — | — | — | 1,407 | ||||||||||||||||||||
Other Central Bank borrowings | 107,643 | — | — | — | 107,643 | |||||||||||||||||||||||||
Borrowings from domestic financial institutions | 26,399 | — | — | — | 26,399 | 90,160 | — | — | — | 90,160 | ||||||||||||||||||||
Foreign borrowings | 556,312 | 39,236 | — | — | 595,548 | 464,761 | 93,243 | 103,489 | — | 661,493 | ||||||||||||||||||||
Other obligations | 35,154 | 3,382 | 3,317 | 2,994 | 44,847 | 33,743 | — | — | — | 33,743 | ||||||||||||||||||||
Lease contracts | 5,711 | 8,133 | 4,972 | 3,341 | 22,157 | 5,720 | 9,328 | 5,760 | 3,077 | 23,885 | ||||||||||||||||||||
Services contracts | 143,090 | 145,732 | 123,359 | 2,463,271 | 2,875,452 | 98,410 | 95,178 | 81,694 | 1,538,145 | 1,813,427 | ||||||||||||||||||||
Investments sold under agreements to repurchase | 349,086 | — | — | — | 349,086 | 270,750 | — | — | — | 270,750 | ||||||||||||||||||||
Total | Ch$ | 4,657,281 | Ch$ | 660,151 | Ch$ | 366,019 | Ch$ | 3,097,667 | Ch$ | 8,781,118 | Ch$ | 5,412,004 | Ch$ | 685,939 | Ch$ | 427,259 | Ch$ | 2,031,082 | Ch$ | 8,556,284 | ||||||||||
| (1) | Excludes demand accounts and savings accounts. |
As of December 31, 2004,2005, the scheduled maturities of other commercial commitments, including accrued interest, were as follows:
| Due within 1 year | Due after 1 year but within 3 years | Due after 3 years but within 5 years | Due after 5 years | Total | Due within 1 year | Due after 1 year but within 3 years | Due after 3 years but within 5 years | Due after 5 years | Total | |||||||||||||||||||||
| (in millions of constant Ch$ as of December 31, 2004) | (in millions of constant Ch$ as of December 31, 2005) | |||||||||||||||||||||||||||||
Commercial Commitments | ||||||||||||||||||||||||||||||
Letters of Credit | Ch$ | 145,237 | — | — | — | Ch$ | 145,237 | Ch$ | 151,472 | — | — | — | Ch$ | 151,472 | ||||||||||||||||
Guarantees | 249,688 | Ch$ | 107,265 | Ch$ | 28,400 | Ch$ | 1,582 | 386,935 | 385,266 | Ch$ | 160,796 | Ch$ | 23,093 | Ch$ | 3,280 | 572,435 | ||||||||||||||
Total other commercial commitments | Ch$ | 394,925 | Ch$ | 107,265 | Ch$ | 28,400 | Ch$ | 1,582 | Ch$ | 532,172 | Ch$ | 536,738 | Ch$ | 160,796 | Ch$ | 23,093 | Ch$ | 3,280 | Ch$ | 723,907 | ||||||||||
DIRECTORS AND SENIOR MANAGEMENT
Directors
Our administration is conducted by our board of directors, which, in accordance with ourestatutos, or bylaws, consists of eleven directors and two alternate directors. The entire board of directors is elected every three years. Our current board of directors was elected in March 2005 and their term expires in March 2008. Our alternate directors were appointed in March 2006.
Cumulative voting is permitted for the election of directors. Our chairman and our chief executive officer are appointed by theour board of directors and holdshold their officeoffices at the board of directors’its discretion. Scheduled meetings of theour board of directors are held at least twice a month. Extraordinary board of directors meetings may be called by the chairman, when requested by a majority of the directors, or, in limited circumstances, when requested by one director.
Our current directors are as follows:
| Position | Age | ||
Fernando Cañas B. | Chairman | |||
Andronico Luksic C. | Vice chairman | |||
Jorge Awad M. | Director | 59 | ||
Jacob Ergas E. | Director | |||
Thomas Fürst F. | Director | |||
Guillermo Luksic C. | Director | |||
Rodrigo Manubens M. | Director | |||
Gonzalo Menendez D. | Director | |||
Maximo Pacheco M. | Director | |||
Francisco Perez M. | Director | |||
Segismundo Schulin-Zeuthen S. | Director | |||
| Alternate director | |||
Jorge Ergas H. | Alternate director |
Fernando Cañas B. was elected as the chairman of our board of directors in 2005. Beginning his financial services career in 1977, Mr. Cañas joined Banco Santiago in 1977, beginning his financial services career, and participated in its formation and management until 1983. Mr. Cañas returned to Banco Santiago in 1997 as vice chairman of theits board of directors and became chief executive officer in 1998. Mr. Cañas was chief executive officer at Banco O’Higgins prior to its merger with Banco Santiago. He served as chairman of the board of directors at Banco Tornquist in Argentina, a director on the board of directors of Banco del Sur in Peru, and in 2001, became chairman of the board of directors for Latin America and the Caribbean of MasterCard International. In 2002, he was chief executive officer of Banco Santander Chile, and in 2003, he became the general director and head of payment methods for Latin America Banco Santander Central Hispano based in Spain. Presently, he is chairman of the board of directors of Banchile Factoring S.A., Banchile Asesoria Financiera S.A., Banchile Securitizadora S.A. and Socofin S.A., and he is also a member of the board of directors of Banchile Corredores de Bolsa S.A. and the executive committee of Banchile Corredores Seguros Limitada. Mr. Cañas has a degree in Business Administration from the University of Chile at Valparaiso.Universidad de Chile.
Andronico Luksic C.C. was elected as a directorDirector and vice chairmanVice Chairman of our board of directors in 2005, and was previously a directorDirector and vice chairmanVice Chairman of our board of directors from 2002 to 2004. He is a member of the NYSE, the advisory committeeAdvisory Committee to the David Rockefeller Center for Latin American Studies at Harvard University, the Latin American Advisory Committee at Harvard Business School, the boardBoard of trusteesTrustees to Babson College, the advisory boardAdvisory Board of the Panama Canal Authority and the Asia-Pacific Economic Cooperation Business Advisory Council. Mr. Luksic is vice chairmanVice Chairman of Quiñenco S.A. and a member of the board of directors at Compañia Cervecerias Unidas S.A., Manufacturas de Cobre Madeco S.A., Empresas LucchettiIndustria Nacional de Alimentos S.A., SOFOFA and the Sociedad de Fomento Fabril and he is a trusteeTrustee of the Chile-Pacific Foundation. He was chairmanChairman of the board of directors of Banco O’Higgins and subsequently chairmanChairman of the board of directors of Banco Santiago until May 1999. Mr. Luksic was directorDirector and chairmanChairman of the board of directors of Banco de A. Edwards from September 1999 to December 2001. Mr. Luksic is a brother of Mr. Guillermo Luksic.
Jorge Awad M.has been a member of our board of directors since 1996. From 1989 to 1996, he was a member of the board of directors of Banco de Santiago. Mr. Awad has been the chairman of the board of directors of Lan Airlines S.A. since 1994 and is a member of the board of directors of several other companies, including Envases del Pacifico S.A., Universidad de Talca, and Universidad Miguel de Cervantes.Cervantes and Icare. Previously, Mr. Awad was a director of Codelco Chile, Television Nacional de Chile, Laboratorio Chile S.A and other companies. He is also a professor of business entrepreneurship at the Universidad de Chile, from which he holds a degree in commercial engineering.
Jacob Ergas E.has been a member of our board of directors since 2002. Mr. Ergas is also director of Banchile Administradora General de Fondos S.A. He is chairman of the board of directors of J. Ergas Inversiones y Rentas Limitada, Ever I BAE S.A., Ever II HNS S.A., Inmobiliaria Paidahue S.A. and INERSA S.A. He was chairman of the board of directors of Banedwards S.A., Administradora de Fondos Mutuos, Banedwards S.A. Fondos de Inversion and Banedwards Corredora de Seguros Limitada. He was director of Promarket S.A., Banedwards Compañia de Seguros de Vida S.A. and Banedwards Asesoria Financiera S.A. He was director and vice chairman of Banco de A. Edwards from 1986 to 2001 and also director of the Chilean Association of Banks and Financial Institutions. Presently, he is a member of the board of directors of Banchile Administradora General de Fondos S.A. Mr. Ergas is the father of Mr. Jorge Ergas H.
Thomas G. Fürst has been a member of our board of directors since 2004. He is also member of the board of directors of Banchile Administradora General de Fondos S.A. Previously, Mr. Fürst was vice chairman of the board of directors at Compañia Cervecerias Unidas S.A. and a member of the board of directors of several other companies, including Embotelladoras Chilenas Unidas S.A., Viña Dassault-San Pedro S.A, Southern Breweries Establishment, CCU Argentina S.A. and Compañia Industrial CerveceraCerveceria S.A. (CICSA). Mr. Fürst was a founder and member of the board of directors of Parque Arauco and he is partner and member of the board of directors of Grupo Plaza. Presently, he is a member of Aseger S.A. and is a directorthe board of directors of Plaza Vespucio S.A., Plaza Oeste S.A., Plaza del Trebol S.A. (Concepcion), Plaza La Serena S.A. (La Serena), Puente Alto S.A.Plaza Tobalaba, Plaza Los Angeles (Los Angeles), Plaza Antofagasta (Antofagasta), and Banchile Administradora General de Fondos S.A. Mr. Fürst studied civil construction at Pontificia Universidad Catolica de Chile.
Guillermo Luksic C. has been a member of our board of directors since 2001 and was previously the vice chairmanVice Chairman of our board of directors frombetween March 2001 toand March 2002. Mr. Luksic is chairmanChairman of the board of directors of Quiñenco S.A., Compañia Cervecerias Unidas S.A., Viña San Pedro S.A., CNT Telefonica del Sur S.A. and Madeco S.A. He isSince 2005, he also serves as a member of the advisory councilboard of directors of Antofagasta plc. Mr. Luksic is an active member of the Advisory Council of Fundacion Paz Ciudadana and the Center of Public Studies and a member of the board of directors of Universidad Finis Terrae. Mr. Luksic is a brother of Mr. Andronico Luksic.
Rodrigo Manubens M. has been a member of our board of directors since 2001. Mr. Manubens was a member of the board of directors of Banco de A. Edwards from 1999 until 2001. From 1985 to 1999,
Mr. Manubens was a member of the board of directors of Banco O’Higgins and continued in that role when it merged into Banco Santiago. From 1995 to 1999 he was chairman of Banco Tornquist in Argentina and a member of the board of directors of Banco Sur in Peru and Banco Asuncion in Paraguay. Mr. Manubens also
served as a director and chairman of Endesa Chile S.A. He is also chairman of Banchile Compañia de Seguros de Vida S.A. and Banchile Corredores de Bolsa S.A., a member of the board of directors of Banchile Factoring S.A. and a member of the executive committee of Banchile Corredores de Seguros Limitada. Mr. Manubens holds a degree in business from Universidad Adolfo Ibañez and a MastersMaster’s of Science from the London School of Economics and Political Science.
Gonzalo Menendez D. has been a member of our board of directors since 2001. He is also the chairman of the board of directors of Inversiones Vita S.A. and Banchile Administradora General de Fondos S.A., and a member of the boards of directors of several other companies, including Banchile Compañia de Seguros de Vida S.A., Compañia Nacional de Telefonos, Telefonica del Sur S.A., Compañia de Telefonos de Coyhaique S.A., Quiñenco S.A., Antofagasta PLC,plc., Minera Michilla S.A., Mining Group Antofagasta Minerals S.A., Antofagasta Railway, Minera Los Pelambres, and Aguas de Antofagasta S.A. and Banchile Asesoria Financiera S.A. Previously, Mr. Menendez served as chief executive officer of Antofagasta Railway, Banco O’Higgins and Empresas Lucchetti. Since 1990, he has been a director and is now the chairman of the board of directors of the Latin American Export Bank. Mr. Menendez was a member of the board of directors and the executive committee of Banco Santiago and a member of the board of directors of Banco de A. Edwards. Mr. Menendez was a professor of finance and chileanChilean economic and business policy at the Universidad de Chile. He holds a degree in business administration and accounting from the Universidad de Chile.
Maximo Pacheco M. has been a member of our board of directors since 2001. Mr. Pacheco is presidentSenior Vice President of International Paper Co. and managing directorExecutive President of International Paper in Brazil and a member of the board of directors of Carter Holt Harvey in New Zealand and Corporacion Cultural de la I. Municipalidad de Santiago.Brazil. Mr. Pacheco holds a degree in commercial engineering from the Universidad de Chile.
Francisco Perez M.has been a member of our board of directors since 2001. Since 1998, Mr. Perez has been the chief executive officer of Quiñenco S.A. He was formerly the chief executive officer of Compañia Cervecerias Unidas S.A., of which he is still a director. He is also a member of the board of directors of Entel Chile S.A. and Banchile Corredores de Bolsa S.A. Prior to 1991, Mr. Perez was chief executive officer of Citicorp-Chile and also was chairman of Bankers Trust. Mr. Perez holds a degree in business administration from the Pontificia Universidad Catolica de Chile and a mastersmaster’s degree in business administration from the University of Chicago.
Segismundo Schulin-Zeuthen S. has been a member of our board of directors since 1999, and was previously the chairman of our board of directors from 1999 to 2004. He was also our president and chief executive officer from 1987 to 1999. He joined us in 1985 and served as assistant general manager until 1986. Prior to joining us, Mr. Schulin-Zeuthen held positions at Banco Morgan Finansa and at Nacional Financiera. Mr. Schulin-Zeuthen is also vice chairman of the board of directors of theInstituto de Capacitacion RacionalNacional de Empresas, a member of the board of directors of Visa International, and chairman of Visa Latin American and Caribbean Region. Mr. Schulin-Zeuthen holds a degree in commercial engineering from the Universidad de Chile.
Edmundo Eluchans U.Jorge Diaz V. has been an alternate director of our board of directors since 2002. Mr. Eluchans was a director of Banco del Trabajo, Banco O’Higgins and Banco Santiago. Mr. Eluchans is also the principal partner at the Chilean law firm of Edmundo Eluchans y Cia. Heon February 23, 2006 was elected as an alternate directorAlternate Director, after having been appointed Advisor to the board of directors on March 17, 2005. Mr. Diaz is the Chairman of the board of directors of Redbanc S.A, Sociedad Operadora de Tarjetas de Credito Nexus S.A. and Servipag Limitada, and Director of Transbank S.A. and AFT. Mr. Diaz was the Superintendent at the Chilean Superintendency of Banks from 1976 to 1980, Director of Banco del Pacifico from 1980 to 1981, the administrator (appointed by the Chilean Superintendency of Banks) at Banco Unido de Fomento from 1982 to 1985, Chief Executive Officer of Banco Concepcion (now Corpbanca) from 1986 to 1991 and advisor of O’Higgins Central Hispano S.A. until 1999. He was a Director at Banco de A. Edwards from March 2001 to December 2001, after having been elected as an Alternate Director in 2000 and then as a director in 2001. Mr. EluchansMarch 2000. He holds a law degree in economics from the Pontificia Universidad Catolica de Chile.
Jorge Ergas H. was elected as an alternate director of our board of directors in 2005, and has been an adviseradvisor to our board of directors since 2002. Mr. Ergas is vice chairman of Banchile Compañia de Seguros de Vida S.A., chairman of Movicenter and a director of Inersa S.A., Ever I BAE and Ever II HNS. Mr. Ergas was previously a director of Hotel Plaza San Francisco, Casa Piedra, HNS and Inmobiliaria Paidahue. Mr. Ergas is the son of Mr. Jacob Ergas E.
Senior Management
Our current executive officers are as follows:
Executive Officers | Position | Age | ||
Pablo Granifo L. . | Chief executive officer | |||
Arturo Concha U. | Manager — Financial division | 52 | ||
| Nelson Rojas P. | General legal counsel | |||
Julio Guzman H. | Manager — Corporate and international division | |||
| Manager — Credit risk division | |||
Alejandro Herrera A. | Manager — Individual banking and branches | |||
Marcelo Caracci L. | Manager — Operations and technology division | |||
| ||||
Jennie E. Coleman A. | Manager — Human resources division | |||
Arturo Tagle Q. | Manager — Planning and research division | |||
| Manager — Marketing division | |||
Pedro Bolados M. | Manager — Risk control division | |||
Eduardo Ebensperger O. | Manager — Middle market division | |||
| Manager — | |||
| ||||
Vivianne Sarniguet K. | Manager — Global compliance division |
Pablo Granifo L.L. was appointed our chief executive officer in 2001. He was the chief executive officer of Banco de A. Edwards from 2000 to 2001, a commercial manager at Banco Santiago from 1995 to 1999 and a corporate manager at Banco Santiago from 1999 to 2000. Mr. Granifo is a member of the board of directors of Banchile Administradora General de Fondos S.A., Banchile Asesoria Financiera S.A., Socofin S.A., Banchile Securitizadora S.A. and Banchile Factoring S.A. He is also a director of Banchile Trade Services Limited and a member of the executive committee of Banchile Corredores de Seguros Limitada. He holds a degree in business from the Pontificia Universidad Catolica de Chile.
Nelson Rojas P. has been our general legal counsel and the secretary of our board of directors since 2004. In 2002, he joined us as in-house legal counsel. Mr. Rojas joined Banco de A. Edwards in 1987 and was the general legal counsel and secretary of the board from 1997 until 2002. He is also vice president of the legal affairs committee of the Chilean Bank Association. Mr. Rojas holds a degree in law from the Universidad de Chile.
Julio Guzman H. has been the manager of the corporate and international division since 2002. He joined Banco de A. Edwards in 1992 and was the general manager from September 2001 to December 2001. Mr. Guzman is a member of the board of directors of Banchile Securitizadora S.A. and he is an alternate director of Banchile Trade Services Limited. He holds a degree in business from the Pontificia Universidad Catolica de Chile.
Luis Felipe Bravo F. has been the manager of the credit risk division since 2002. Mr. Bravo joined us in 1986 and has served various positions, including manager of corporate and international credit, manager of corporate banking and manager of credit risk. Previously, he was a director of Carvalho Hosken and credit manager at Citibank N.A. He is a member of the board of directors of Socofin S.A. and holds degrees in commercial engineering and accounting from the Pontificia Universidad Catolica de Chile.
Alejandro Herrera A. has been the manager of the individual banking and branches division since 2002. He has served as the manager of the individual banking and branches division at Banco de A. Edwards from 2000 to 2001 and at Banco Sudamericano from 1996 to 1999, as the chief executive officer of Administradora de Fondos Mutuos Santiago S.A. from 1994 to 1995 and as branches manager at Banco Santiago for the Santiago region. Mr. Herrera is the chairman of the board of directors of Promarket S.A. He is also a member of the board of directors of Banchile Administradora General de Fondos S.A., Banchile Asesoria Financiera S.A., Banchile Securitizadora S.A. and Socofin S.A. and a member of the executive committee of Banchile Corredores de Seguros Limitada. He holds a degree in business from the Pontificia Universidad Catolica de Valparaiso.
Marcelo Caracci L. has been the manager of the operations and technology division since 2001. Prior to that time, Mr. Caracci was founder and director of two technology companies, Sonda Bancos and Sonda Peru. He participated actively in the development and startup of Redbanc, Transbank, Servipag and Deposito Central de Valores S.A. He holds a degree in civil engineering from the Pontificia Universidad Catolica de Chile.
Arturo Concha U. has been the manager of the financial division since 1986. He was chief financial officer at Banco Bice from 1985 to 1986 and worked in several positions, including chief financial officer at Banco Colocadora Nacional de Valores from 1976 to 1985. Presently, Mr. Concha is chairman of the board of directors at Sociedad Interbancaria de Depositos de Valores S.A. and a member of the board of directors of Deposito Central de Valores S.A. and Banchile Securitizadora S.A. Mr. Concha holds degrees in commercial engineering and accounting from the Pontificia Universidad Catolica de Chile and participated in the International Senior Management Program at Harvard Business School.
Nelson Rojas P. has been our general legal counsel and the secretary of our board of directors since 2004. In 2002, he joined us as in-house legal counsel. Mr. Rojas joined Banco de A. Edwards in 1987 and was the general legal counsel and secretary of the board of directors from 1997 until 2002. He is also vice president of the legal affairs committee of the Chilean Bank Association. Mr. Rojas holds a degree in law from the Universidad de Chile.
Julio Guzman H. has managed our corporate and international division since 2002. He joined Banco de A. Edwards in 1992 and was the general manager from September 2001 to December 2001. Mr. Guzman is a member of the board of directors of Banchile Securitizadora S.A. and he is an alternate director of Banchile Trade Services Limited. He holds a degree in business from the Pontificia Universidad Catolica de Chile.
Mauricio Baeza L. has been the manager of the credit risk division since December 2005. Mr. Baeza joined us in 1997 and was manager of the risk division during 2001 in Banco de A. Edwards. He was Risk manager at Banco Santiago from 1993 to 1997 and member of the board of directors of Santiago Administradora de Fondos de Inversion. He is also a member of the investment committee of Banchile Fondo Inmobiliario. He holds a degree in civil engineering from the Pontificia Universidad Catolica de Chile.
Alejandro Herrera A. has been the manager of the individual banking and branches division since 2002. He has served as the manager of the individual banking and branches division at Banco de A. Edwards from 2000 to 2001 and at Banco Sudamericano from 1996 to 1999, as the chief executive officer of
Administradora de Fondos Mutuos Santiago S.A. from 1994 to 1995 and as branches manager at Banco Santiago for the Santiago region. Mr. Herrera is the chairman of the board of directors of Promarket S.A. He is also a member of the board of directors of Banchile Administradora General de Fondos S.A., Banchile Asesoria Financiera S.A., Banchile Securitizadora S.A. and Socofin S.A. and a member of the executive committee of Banchile Corredores de Seguros Limitada. He holds a degree in business from the Pontificia Universidad Catolica de Valparaiso.
Marcelo Caracci L. has been the manager of the operations and technology division since 2001. Prior to that time, Mr. Caracci was founder and director of two technology companies, Sonda Bancos and Sonda Peru. He participated actively in the development and startup of Redbanc S.A., Transbank S.A., Servipag Limitada and Deposito Central de Valores S.A. He holds a degree in civil engineering from the Pontificia Universidad Catolica de Chile.
Jennie E. Coleman A. joined us as the manager of the human resources division in March 2003. Previously, Mrs. Colemanshe was the manager of the human resources division, manager of organizational development and training chief executive at Banco Santiago.Santiago, where she worked for more than 23 years. Mrs. Coleman holds a degree in public administration from the Universidad de Chile.
Arturo Tagle Q. has been the manager of the planning and research division since 2002. Mr. Tagle joined us in 1995.He was general manager of the Chilean Bankers Association from 1990 to 1994 and Director of researchResearch at the Chilean Superintendency of Banks from 1984 to 1989. Mr. Tagle is the chief executive officer of Sociedad Matriz del Banco de Chile S.A. and SAOS. He holds a degree in commercial engineering from the Pontificia Universidad Catolica de Chile and a mastersmaster’s degree in business administration from the University of Chicago.
Alvaro Cambara L.Gonzalo Rios D. has been the manager of the marketing division since 2002, andNovember 2005. He was previously the manager and marketing manager of Falabella´s financial retail division from 2002 to 2005 and manager of non-store retail operations of Falabella Argentina from 2000 to 2002. He was a business consultant at McKinsey & Company from 1997 to 2000 and previously worked for IBM Argentina as a sales manager. Mr. Rios is a member of the individual banking division. Mr. Cambara has held several positions in our corporateboard of directors of Promarket S.A. and marketing divisions and was marketing manager at AFP Provida S.A. Mr. Cambaramember of the executive committee of Banchile Corredores de Seguros Limitada. He holds a degree in businesselectrical engineering from Pontificia Universidad CatolicaInstituto Tecnologico de Chile.Buenos Aires and a MBA from the Massachusetts Institute of Technology.
Pedro Bolados M. has been the manager of the risk control division since January 2002 and was previously comptroller of Banco de A. Edwards. He joined Banco de A. Edwards in 1992 after holding the position of corporate audit vice president at Citibank, N.A. in Latin America. Mr. Bolados holds an executive mastersmaster’s degree in business administration from the Pontificia Universidad Catolica de Chile.
Eduardo Ebensperger O. has been the manager of the middle market division since June 2005 and was previously the chief executive officer of Banchile Factoring S.A. from 2002 to 2005. He joined Banco de A. Edwards in 1989. Mr. Ebensperger was manager of the medium size companies division and manager of the regional branches of Banco de A. Edwards from 1997 to 2001. Presently, he is a member of the board of directors of Banchile Asesoria FinanceraFinanciera S.A. and Banchile Factoring S.A. Mr. Ebensperger holds a degree in business from the Universidad de Chile.
Alicia Sandoval Q. has been the manager of the special business division since 2002 and previously served as the manager of specialized credits in the corporate division. Mrs. Sandoval was assistant manager and an advisor to the chief executive officer of Industria Azucarera Nacional S.A. and an analyst at Corporacion de Fomento. Mrs. Sandoval holds degrees in commercial engineering and accounting from the Universidad de Chile.
Juan Cooper A. has been the manager of the Banco Credichile division since 2003. He was the chief executive officer of Altavida Santander Compañia de Seguros de Vida S.A. from 2001 to 2002 and the manager of the Santiago expressExpress division of Banco Santiago from 1993 to 2000. He is also a current member of the board of directors of Promarket S.A. and Socofin S.A., and a member of the executive committee of Banchile Corredores Seguros Limitada. Mr. Cooper has a degree in business from the Universidad de Chile and a mastersmaster’s degree in business administration from the Pontificia Universidad Catolica de Chile.
Vivianne Sarniguet K. has been the manager of the global compliance division manager since 2005. She was country compliance officer and internal audit head in Chile at Citibank, N.A. Ms. Sarniguet is a memberthe president of the executive committee for anti-money laundering of the Chilean Banks Association and has participated on behalf of the Chilean Banks Association with the Chilean government and Chilean Congress on the development of anti-money laundering legislation. Ms. Sarniguet holds a law degree from Universidad Diego Portales.
Our directors do not have any service contracts with the company that provide for benefits upon termination of employment.
COMPENSATION
The table below presents the amount of compensation, as established at the general shareholders’ meetings,by our shareholders, to the members of our board of directors for the year ended December 31, 2004.2005. These amounts include remuneration for services, fees for attendance at board meetings, committee meetings and subsidiary board meetings and consulting and travel expenses.
Name of Director | Remuneration | Fees for attendance at board meetings | Fees for attendance at committee meetings and subsidiary board meetings | Consulting and travel expenses | Total | Remuneration | Fees for attendance at board meetings | Fees for attendance at committee meetings and subsidiary board meetings | Consulting | Total | |||||||||||||||||||||
| (in millions of constant Ch$ as of December 31, 2004) | (in millions of constant Ch$ as of December 31, 2005) | ||||||||||||||||||||||||||||||
Fernando Cañas B. (1) | — | — | — | — | — | Ch$ | 288.6 | Ch$ | 38.8 | Ch$ | 169.0 | — | Ch$ | 496.4 | |||||||||||||||||
Jorge Ergas H. (2) | — | — | — | — | — | ||||||||||||||||||||||||||
Segismundo Schulin-Zeuthen S. | Ch$ | 115.9 | Ch$ | 40.1 | Ch$ | 153.0 | Ch$ | 5.0 | Ch$ | 314.0 | |||||||||||||||||||||
Andronico Luksic C. | 115.9 | 13.7 | — | 36.2 | 165.8 | 126.3 | 15.8 | — | — | 142.1 | |||||||||||||||||||||
Jorge Awad M. | 40.9 | 18.8 | 111.1 | — | 170.8 | 42.1 | 25.4 | 91.8 | — | 159.3 | |||||||||||||||||||||
Jorge Diaz V. (3) | 40.9 | 21.3 | 39.2 | 5.0 | 106.4 | ||||||||||||||||||||||||||
Edmundo Eluchans U. | 40.9 | 19.6 | 46.0 | — | 106.5 | ||||||||||||||||||||||||||
Jacob Ergas E. | 40.9 | 14.5 | 65.7 | — | 121.1 | 42.1 | 23.6 | 66.6 | — | 132.3 | |||||||||||||||||||||
Thomas Fürst F. | 42.1 | 25.4 | 57.1 | — | 124.6 | ||||||||||||||||||||||||||
Guillermo Luksic C. | 40.9 | 11.9 | 12.8 | — | 65.6 | 42.1 | 14.9 | 5.2 | — | 62.2 | |||||||||||||||||||||
Rodrigo Manubens M. | 40.9 | 19.6 | 131.7 | 146.1 | (4) | 338.3 | 42.1 | 22.0 | 89.0 | Ch$ | 407.0 | 560.1 | |||||||||||||||||||
Gonzalo Menendez D. | 40.9 | 20.4 | 165.4 | 44.7 | 271.4 | 42.1 | 28.9 | 128.8 | — | 199.8 | |||||||||||||||||||||
Maximo Pacheco M. | 40.9 | 18.7 | 6.0 | — | 65.6 | 42.1 | 27.2 | 2.6 | — | 71.9 | |||||||||||||||||||||
Francisco Perez M. | 40.9 | 19.6 | 60.6 | — | 121.1 | 42.1 | 24.5 | 55.5 | — | 122.1 | |||||||||||||||||||||
Maximo Silva B. (5) | 40.9 | 21.3 | 66.5 | — | 128.7 | ||||||||||||||||||||||||||
Manuel Sobral F. (6) | 37.4 | 18.7 | 69.1 | — | 125.2 | ||||||||||||||||||||||||||
Thomas Fürst F. | 3.5 | 2.6 | 3.5 | — | 9.6 | ||||||||||||||||||||||||||
Segismundo Schulin-Zeuthen S. | 59.7 | 33.1 | 88.0 | — | 180.8 | ||||||||||||||||||||||||||
Edmundo Eluchans U. | 42.1 | 22.7 | 33.1 | — | 97.9 | ||||||||||||||||||||||||||
Jorge Ergas H. (2) | 42.1 | 21.0 | 38.7 | — | 101.8 | ||||||||||||||||||||||||||
Jorge Diaz V. (3) | 3.5 | 1.7 | 1.7 | — | 6.9 | ||||||||||||||||||||||||||
Maximo Silva B. (4) | 3.8 | 6.0 | 17.3 | — | 27.1 | ||||||||||||||||||||||||||
Total | Ch$ | 681.7 | Ch$ | 260.8 | Ch$ | 930.6 | Ch$ | 237.0 | Ch$ | 2,110.1 | Ch$ | 902.9 | Ch$ | 331.0 | Ch$ | 844.4 | Ch$ | 407.0 | Ch$ | 2,485.3 | |||||||||||
| (1) | Mr. Cañas was elected as a director in 2005. |
| (2) | Mr. Ergas was elected as an alternate director in |
| (3) | Mr. Diaz |
| (4) |
| Mr. Silva is no longer a member of our board of directors. |
Consistent with Chilean law, we do not disclose to our shareholders, or otherwise make public, information regarding the compensation of our senior management. For the year ended December 31, 2004,2005, the aggregate amount of compensation paid to our senior management, including the senior management of our subsidiaries, was Ch$4,5215,049 million. Pursuant to the Chilean Corporations Law, our directors/audit committee must approve compensation plans, but we are not required to have a compensation committee. For the year ended December 31, 2004,2005, no amounts were set aside or accrued by us to provide pension, retirement or similar benefits for our directors and officers.
Indebtedness of Directors and Executive Officers
The Chilean Corporations Law provides that the board of directors must previously approve any transaction in which a director has a personal interest or is acting on behalf of a third party must be previously approved by the board of directors.party. The transaction may be approved only when the board of directors has been informed of such director’s interest and the terms
of such transaction are similar to those prevailing in the market. If the proposed transaction involves amounts considered material, the board of directors must previously determine that such transaction is consistent with conditions prevailing in the market. If it is not possible for the board of directors to reach such a judgment, the board may appoint two independent evaluators. The evaluators’ final conclusions must be made available to shareholders and directors for a period of 20 business days, during which shareholders representing 5% or more of the issued voting shares may request the board of directors to summon a shareholders’ meeting to resolve the matter, with the agreement of two-thirds of the issued voting shares.
shares required for approval.
For purposes of this regulation, the law provides that the amount of a proposed transaction is material if (1) it exceeds 1% of the company’s paid-in capital and reserves (provided that it also exceeds 2,000 UF), or (2) it exceeds 20,000 UF. All resolutions approving such transactions must be reported to the company’s shareholders at the next annual shareholders’ meeting. Violations of this provision may result in administrative or criminal sanctions and civil liability to shareholders or third parties who suffer losses as a result of such violation.
Chilean law contains additional provisions restricting transactions with affiliates not involving directors or executive officers. The Chilean Corporations Law requires that our transactions with related parties be on market terms or on similar terms to those customarily prevailing in the market.terms. We are required to compare the terms of any such transaction to those prevailing in the market at the date the transaction is to be entered into. Directors of companies that violate this provision are liable for losses resulting from such violation. As disclosed in noteNote 16 to our audited consolidated financial statements, we incurred an aggregate of Ch$8,94311,458 million in expenses and Ch$108112 million in income from transactions other than loans with related parties in 2004.
2005.
As authorized by the General Banking Law, and within applicable regulatory limits, we also hold several outstanding loans owed by different affiliated corporations. All such loansloans:
We held an aggregate of Ch$130,759122,924 million in loans to, including Ch$49,98651,598 million in collateral pledged by, related parties as of December 31, 2004.2005. See noteNote 16 to our audited consolidated financial statements for details concerning these transactions.
BOARD PRACTICES
Governance Practices
The board of directors delegates certain functions and activities to our committees to research, evaluate and report to the board of directors regarding specific matters which may affect our businesses.
The Directors/Audit Committee
Prior to March 24, 2005, the directors’directors committee and audit committee were separate committees performing independent functions for the board of directors. On March 24, 2005, the board of directors resolved to merge the directors’directors committee with the audit committee forming the directors/audit committee. This new committee will haveThe committee’s objectives are to seek the same characteristics, performefficiency, maintenance, application and functioning of our internal control systems and compliance with the same dutiesapplicable rules and requireprocedures governing our business; to identify our business risks; to supervise the same conditions for membership asfunctions of the prior directors’ and audit committees. In addition,risk control division, ensuring its independence from management; to supervise the directors/audit committee will oversee and receive reports fromfunctions of the global compliance division, which is in chargedivision; to serve as link and coordinator of implementing an anti-money laundering programtasks between the internal audit work and ensuring that all applicable U.S. regulations are implemented inthe independent auditors and to act as a link with our Miami and New York branches.board of directors.
Our directors/audit committee is composed of three members as appointed by the board of directors. The following directors were appointed as members of the directors/audit committee by the board of directors at the meeting held on March 24, 2005:
For purposes of matters required to be addressed by our audit committee, we have a two voting members and one non-voting member. For purposes of matters required to be addressed by our directors committee, we have three voting members. Members serve on the committee for the same term that they serve as directors and may be re-elected. Under Chilean law, the majority of the members of a company’s directors committee must be independent. Additionally, under applicable resolutions from the Chilean Superintendency of Banks, the board of directors must set standards, based on international independence criteria, for determining audit committee member independence. Under U.S. federal securities laws, all members of our directors/audit committee are required to meet the independence criteria of Rule 10A-3 of the Securities Exchange Act of 1934, as amended, or the Exchange Act, beginning July 31, 2005.
The following directors were appointed as members of the directors/audit committee by the board of directors at the meeting held on March 24, 2005:
Mr. Jorge Awad M. and Mr. Thomas Fürst F. satisfy the independence requirements under both Chilean law and Rule 10A-3 under the Exchange Act and are full voting members of our directors/audit committee. Mr. Gonzalo Menendez D. is exempt from the independence requirements of Rule 10A-3 pursuant to an exemption in Rule 10A-3(b)(1)(iv)(D). Under that exemption, he is a non-voting member of our directors/audit committee with respect to all matters required to be addressed by our audit committee under U.S. federal securities laws. We do not believe that reliance on the exemption in Rule 10A-3(b)(1)(iv)(D) would materially adversely affect the ability of our directors/audit committee to act independently and perform its duties.
The directors/audit committee meets monthly and no less frequently than eight times a year, and its budget is approved annually at the ordinary shareholders’ meeting. The directors/audit committee satisfies the applicable requirements of the Chilean Superintendency of Banks and operates pursuant to a charter document. The Chilean Superintendency of Banks recommends that at least one of the members of the committee be experienced with respect to the accounting procedures and financial aspects of banking operations. The committee submits a report regarding its activities to our board of directors after each directors/audit committee meeting, and presents an annual report at our annual shareholder’s meeting.
As established in the committee’s bylaws, the chief executive officer, the general legal counsel and the manager of the risk control division also attend meetings. A partner of the independent auditors firm and other persons that the committee may invite for one or more meetings may also attend meetings.Directors/Audit Committee Duties..
The committee may appoint independent personnel to carry out specific duties. The duties of the directors/audit committee include:
Portfolio Committee
The main function of the portfolio committee is to inform the board of directors of changes in the composition and risk of our loan portfolio.portfolio from a global perspective and from a sector point of view, and also segmented by lines of business. The committee closely reviews the performance of our principal debtors, overdue loan ratios, past-due loan indicators, write-offs and allowances for loan losses.
The loan portfolio committee prepares proposals for discussion with, and approval by, the board of directors with respect to credit policies, portfolio evaluation methods and the calculation of allowances for expected loan losses. The committee also performs analyses of the adequacy of allowances, authorizes extraordinary loan write-offs once recovery attempts have been exhausted and controls the disposal of assets acquired in lieu of payment.
The portfolioThis committee meets on a monthly basis and is comprised of five directors, in addition to our chief executive officer and the managersmanager of our credit risk and special business divisions.division.
Directors’ Credit Committee
The directors’ credit committee provides the highest level of approval of credit proposals presented by our credit risk area and commercial officers. The committee evaluates proposals with respect to loans that would expose us to credit risks in excess of UF 250,000. The directors’ credit committeeIt also evaluates proposals based upon certain qualitative aspects, irrespective of approval amounts, such as the approval of customers whose eventual collections might adversely affect our corporate image or the approval of transactions with related parties. The committee meets on a weekly basis and is comprised of our chief executive officer and the entire board of directors, with quorum requiring three directors.
directors required for a quorum.
Finance and International Committee
The finance and international committee provides a forum for members to discuss and analyze the implementation of financial management policies. The committee meets monthly and is comprised of five directors, our chief executive officer, the financial division manager, the corporate and international division manager, the planning and research division manager and the financial risk manager. Committee members conduct analyses and make presentations to the committee regarding certain matters, including:
The Disclosure Committee
In May 2003, we established the disclosure committee, a management entity that formalizes the tasks necessary to ensure that information we provide to the market is detailed, accurate and complete. The members of the disclosure committee include the investor relations manager, the principal accounting officer, deputy general counsel, the managers of the risk control division, research area, planning and research division and global compliance division, and, as necessary, persons from our other divisions. The members of the disclosure committee have been involved in the drafting of this annual report and are involved in the preparation and revision of all financial information published by us.
Corporate Risk Management Committee
During December 2005, we established the corporate risk management committee, which reports to the directors/audit committee. The corporate risk management committee has the following functions:
Global Compliance Division
During 2005, we implemented initiatives to reinforce and ensure regulatory compliance, especially concerning internationally applicable rules preventing money laundering.
In July 2005, our board of directors approved a global policy on prevention of money laundering and financing of terrorism, applicable to all our affiliates, foreign branches and subsidiaries. The global policy is intended to meet the regulatory requirements of all the jurisdictions in which we operate.
In order to ensure compliance with these regulatory requirements, we created the global compliance division in April 2005. The division is independent and reports directly to the directors/audit committee. It has authority over all our affiliates, including our foreign branches and subsidiaries.
Anti-Money Laundering and Terrorism Financing Committee
Banks must have an Anti-Money Laundering and Terrorism Financing Committee. The Chilean Superintendency of Banks recommends that at least one director, the chief executive officer, at least one area head, the legal counsel and the compliance officer form such committee. Responsibilities of this committee include:
In compliance with this requirement, our Anti-Money Laundering and Terrorism Financing Committee was formed April 21, 2006.
NYSE Corporate Governance Comparison
Pursuant to Section 303A.11 of the Listed Company Manual of the NYSE, we are required to provide a summary of the significant ways in which our corporate governance practices differ from those required for U.S. companies under the NYSE listing standards. We are a Chilean bank with shares listed on the Santiago Stock Exchange, the LSE and the Latibex. Our corporate governance practices are governed by our bylaws, the General Banking Law, the Chilean Corporations Law, theLey de Mercado de Valores No. 18,045, or the Securities Market Law, and the regulations issued by the Chilean Superintendency of Banks.
The table below discloses the significant differences between our corporate governance practices and the NYSE standards.
NYSE Standards | Our Corporate Governance Practice | |
| Director Independence. Majority of board of directors must be independent. “Controlled companies,” which would include our company if it were a U.S. issuer, are exempt from this requirement. §303A.01 | Pursuant to the General Banking Law; we are not required to make a determination as to the independence of our directors. | |
Pursuant to the Chilean Corporations Law, we must determine whether the members of our directors/audit committee (all of whom are members of our board of directors) are independent. | ||
| The definition of independence applicable to us pursuant to the Chilean Corporations Law differs in certain respects from the definition applicable to U.S. issuers under the NYSE rules. | ||
| Under the Chilean Corporations Law, a director is deemed to be an independent member of the directors/audit committee if such member would have been elected as a director at the shareholders meeting after excluding the votes of any controller or party related to it. Under the regulations of the Chilean Superintendency of Banks, members of the audit committee must satisfy international independence criteria. | ||
| Executive Sessions. Non-management directors must meet regularly in executive sessions without management. Independent directors should meet alone in an executive session at least once a year. §303A.03 | There is no similar requirement under our bylaws or under applicable Chilean law. | |
| Audit committee. Audit committee satisfying the independence and other requirements of Rule 10A-3 under the Exchange Act, and the more stringent requirements under the NYSE standards is required. §§303A.06, 303A.07 | We | |
|
| ||
| For a description of the duties of our audit committee under applicable Chilean law, see “— | |||
NYSE Standards | Our Corporate Governance Practice | |
| Nominating/corporate governance | We are not required to have, and do not have, a nominating/corporate governance committee. | |
| Compensation committee. Compensation committee of independent directors is required, which must approve executive officer compensation. The committee must have a charter specifying the purpose, duties and evaluation procedures of the committee. “Controlled companies,” which would include our company if it were a U.S. issuer, are exempt from this requirement. §303A.05 | We are not required to have a compensation committee. Pursuant to the Chilean Corporations Law, our directors/audit committee must approve compensation plans. | |
| Equity compensation plans. Equity compensation plans require shareholder approval, subject to limited exemptions. | Equity compensation plans require shareholder approval, subject to limited exemptions. | |
| Code of Ethics.Corporate governance guidelines and a code of business conduct and ethics is required, with disclosure of any waiver for directors or executive officers. §303A.10 | We have adopted a code of ethics applicable to all of our directors and executive officers, which | |
EMPLOYEES
The following table shows the breakdown of our full-time, permanent employees at the dates indicated:
| As of December 31, | ||||||
| 2002 | 2003 | 2004 | ||||
Banco de Chile | 5,671 | 6,093 | 6,361 | |||
Overseas branches and representative offices | 48 | 47 | 52 | |||
Subsidiaries | 2,936 | 2,993 | 2,952 | |||
Total | 8,655 | 9,133 | 9,365 | |||
| As of December 31, | ||||||
| 2003 | 2004 | 2005 | ||||
Banco de Chile | 6,093 | 6,361 | 6,745 | |||
Overseas branches and representative offices | 47 | 52 | 84 | |||
Subsidiaries | 2,993 | 2,952 | 3,328 | |||
Total | 9,133 | 9,365 | 10,157 | |||
At December 31, 2004,2005, we had 9,36510,157 employees (on a consolidated basis) of which approximately 1,892,2,058, or 20.2%20.3%, were unionized. All management positions are held by non-unionized employees. We are party to four collective bargaining agreements (one of which we assumed as part of the merger with Banco de A. Edwards) covering our unionized employees. These collective bargaining agreements were signed in December 2004 and expire in December 2008. We have not experienced a strike in the last 10 years and consider relations with our employees to be satisfactory.
We have a comprehensive personnel training and development program that includes internal courses on operational, technical and commercial subjects as well as participation in external seminars. In 2004,2005, the total cost of training programs was approximately 1.1%0.84% of total personnel salaries and expense. We do not maintain any pension or retirement programs for the vast majority of our employees. We do, however, pay certain long-serving key employees a severance payment upon retirement. Although we have, in the past, provided productivity bonuses to individual employees on a discretionary basis, we do not maintain a formal profit-sharing plan.
SHARE OWNERSHIP
Mr. Andronico Luksic and Mr. Guillermo Luksic, members of our board of directors since March 2002 and March 2001, respectively, together with members of their family, control Quiñenco S.A. As of May 31, 2005,11, 2006, Quiñenco S.A. owns 20.23%20.72% of our outstanding shares (directly and indirectly through LQ Inversiones Financieras S.A.). Additionally, Quiñenco S.A. holds 53.50%52.15% of the voting rights in Banco de Chile (directly and indirectly through shares of SM-Chile S.A. that are owned by LQ Inversiones Financieras S.A. and Inversiones LQ-SM S.A.).
Mr. Jacob Ergas, a member of our board of directors since January 1, 2002, controls Ever I Bae S.A., Inversiones Aspen Limitada, Inversiones e Inmobiliaria el Rosal S.A., Inversiones InteroverEver Chile S.A. and Inversiones el Norte y el Rosal S.A. TheseAspen Limitada. As of May 11, 2006, these holding companies own 5.05%2.65%, 1.65%, 0.37%, 0.04%2.30% and 0.00%1.62% of our outstanding shares, respectively. Mr. Ergas holds 7.10%6.58% of the voting rights in Banco de Chile through these holding companies.
None of our directors or senior management (other than Mr. Andronico Luksic, Mr. Guillermo Luksic and Mr. Jacob Ergas) owns 1% or more of our outstanding common stock. Further, none of our directors (including Mr. Andronico Luksic, Mr. Guillermo Luksic and Mr. Jacob Ergas) or senior management havehas different or preferential voting rights with respect to the shares they own.
We do not have any arrangements for involving employees in our capital, including any arrangements that involve the issue or grant of options of our shares or securities.
MAJOR SHAREHOLDERS
The following table sets forth certain information concerningregarding the ownership of our outstanding shares as of May 31, 2005. None of our shares are subject11, 2006 for the following:
The calculation of percentages in the “Percentage of Outstanding Shares” column in the table below is based upon the number
Name | Shares Beneficially Owned | Percentage of Shares | Shares Owned of Record | Percentage of Outstanding Shares | Number of Votes (7) | Percentage of Votes | |||||||||
| LQ Inversiones Financieras S.A.(1) | — | — | 13,762,345,978 | 20.22 | % | 34,228,775,667 | 51.57 | % | |||||||
| Inversiones LQ-SM S.A.(2) | — | — | — | — | 1,277,323,323 | 1.92 | % | ||||||||
Quiñenco S.A. | 8,958,886 | 0.01 | % | 8,958,886 | 0.01 | % | |||||||||
Ever I Bae S.A.(3) | — | — | 3,352,452,374 | 4.92 | % | 3,352,452,374 | 5.05 | % | |||||||
Inversiones Aspen Limitada (3) | — | — | 1,093,065,478 | 1.61 | % | 1,093,065,478 | 1.65 | % | |||||||
Inversiones e Inmobiliaria el Rosal S.A.(3) | — | — | 244,572,358 | 0.36 | % | 244,572,358 | 0.37 | % | |||||||
Inversiones Interover S.A. (3) | — | — | 24,770,287 | 0.04 | % | 24,770,287 | 0.04 | % | |||||||
Inversiones el Norte y el Rosal S.A. (3) | — | — | 472,336 | 0.00 | % | 472,336 | 0.00 | % | |||||||
JP Morgan Chase Bank (4) | — | — | 364,289,400 | 0.54 | % | 364,289,400 | 0.55 | % | |||||||
SM-Chile S.A.(5) | 41,152,288,834 | 60.45 | % | 12,558,587,045 | 18.45 | % | — | — | |||||||
SAOS (5) | — | — | 28,593,701,789 | 42.00 | % | — | — | ||||||||
Directors and executive officers as a group (27 persons) | — | — | 21,419,337 | 0.03 | % | 84,849,712 | 0.13 | % | |||||||
Banco de Chile (6) | — | — | 1,701,696,936 | 2.50 | % | — | — | ||||||||
Other shareholders | 26,927,494,771 | 39.55 | % | 6,353,451,401 | 9.33 | % | 25,698,556,848 | 38.72 | % | ||||||
| Total | 68,079,783,605 | 100.00 | % | 68,079,783,605 | 100.00 | % | 66,378,086,669 | 100.00 | % | ||||||
Name | Amount Owned | Percentage(1) | |||
Quiñenco S.A. (2) | 14,307,782,107 | 20.72 | % | ||
Jacob Ergas (3) | 4,544,909,033 | 6.58 | % | ||
SM-Chile S.A. | 40,732,213,763 | 59.00 | % | ||
Directors and executive officers as a group (27 persons) | 18,737,067 | 0.03 | % |
| (1) |
| (2) | As of December 31, 2005, members of the Luksic family or their affiliates beneficially owned |
| (3) | Mr. Jacob Ergas, a member of our board of directors, holds his shares through Ever I Bae S.A., |
RELATED PARTY TRANSACTIONS
In the ordinary course of our business, we engage in a variety of transactions with certain of our affiliates and related parties. Financial information concerning these transactions is set forth in noteNote 16 to our audited consolidated financial statements. The Chilean Corporations Law requires that our transactions with related parties be on market terms or on similar terms to those customarily prevailing in the market. We are required to compare the terms of any such transaction to those prevailing in the market on the date the transaction is entered into. Directors of companies that violate this provision are liable for losses resulting from such violations.
In addition, the Chilean Corporations Law provides that any transaction in which a director has a personal interest or is acting on behalf of a third party must be previously approved by a majority of the disinterested directors on the company’s board of directors. The terms of such transaction must be similar to those prevailing in the market. If the proposed transaction involves amounts considered to be material, the disinterested directors must previously determine that the terms and conditions of the transaction are consistent with those prevailing in the market. If it is not possible for the board of directors to reach such a judgment on its own, the board may appoint two independent evaluators. The evaluators’ final conclusions must be made available to shareholders and directors for a period of 20 business days, during which shareholders representing 5% or more of the issued voting shares may request the board of directors to summon a shareholders’ meeting to resolve the matter, with the agreement of two-thirds of the issued voting shares required for approval. For purposes of this requirement, the Chilean Corporations Law considers that the amount of a proposed transaction is material if (1) it exceeds 1% of the company’s paid-in capital and reserves, (provided that it also exceeds UF2,000) or (2) it exceeds UF20,000.
All resolutions approving such transactions must be reported to the company’s shareholders at the next annual shareholders’ meeting. Violations of this provision may result in administrative or criminal sanctions and civil liability to shareholders or third parties who suffer losses as a result of such violation. We believe that we have complied with the applicable requirements of the Chilean Corporations Law in all transactions with related parties and affirm that we will continue to comply with such requirements. See noteNote 16 to our audited consolidated financial statements for a more detailed accounting of transactions with related parties.
On December 24, 2004, we amended a master agreement that we entered into with Banchile Corredores de Seguros Limitada, our subsidiary, and Banchile Seguros de Vida S.A., an affiliate of Quiñenco S.A., as well as related agreements. The master agreement sets forth the general structure by which the Banchile Seguros de Vida S.A. provides mortgage loan insurance and non-mortgage loan insurance to our clients. The terms and prices set forth in the master agreement were based upon the market price for similar insurance products. The related agreements provide for:
On December 27, 2004, we entered into a service contract with Entel Chile S.A. to modernize our telecommunication systems. Quiñenco S.A beneficially owns Entel Chile S.A. is beneficially owned by Quiñenco S.A.S.A.. The contract was awarded to the best offer in a competitive bidding process in which other telecommunications companies participated and is worth more than 20,000 U.F.UF20,000 annually.
On December 28, 2005 we entered into an agreement with Banchile Seguros de Vida S.A., an affiliated insurance brokerage company, setting forth the specific terms of the life insurance policies associated with customer loans contracted by us for its borrower portfolio on behalf of the borrowers. The conditions of this agreement are an integral part of all the life insurance policies that we offer our borrowers. The agreement is effective until December 31, 2006, and is automatically renewable for successive one-year periods through December 31, 2008. All the conditions contained in the agreement were previously reviewed and approved by our board of directors.
Loans to Related Parties
As authorized by the Chilean General Banking Law, and within the regulatory limits, we hold several outstanding loans owed by different corporations related to us. All such loans (a) were made in the ordinary course of business, (b) were made on terms, including interest rates and collateral, substantially the same as those prevailing at the time for comparable transactions with other persons, and (c) did not involve more than the normal risk of collectibility or present other unfavorable features. See noteNote 16 to our audited consolidated financial statements.
| Item 8. Financial Information |
CONSOLIDATED STATEMENTS AND OTHER FINANCIAL INFORMATION
Audited Consolidated Financial Statements
Please refer to “Item 18. Financial Statements.”
Legal Proceedings
We and our subsidiaries are subject to claims and are parties to legal proceedings in the normal course of business.
On November 30, 2005, we were served with a civil claim filed by Fundacion Presidente Allende, an entity organized in Spain, claiming compensatory damages in excess of U.S.$7 million and punitive damages of U.S.$100 million for harm allegedly suffered as a result of our alleged assistance to former Chilean President Augusto Pinochet in concealing his assets. Although we intend to contest these claims, no assurances can be given about the outcome or timing of these claims.
Beginning in September 2004, the OCC and the Federal Reserve conducted targeted examinations of our New York and Miami branches, respectively, to evaluate, among other things, our compliance with the U.S. Bank Secrecy Act and other U.S. anti-money laundering requirements. As a result of thesetheir examinations, on February 1, 2005, we agreed to the issuance by the OCC of a consent order withand the OCC andissuance by the Federal Reserve of a cease and desist order with the Federal Reserve.order. Pursuant to these orders, we have instituted an action plan whichthat includes the maintenance of programs geared towards strengthening our compliance with the Bank Secrecy Act and United StatesU.S. anti-money laundering laws.
We have createdOn October 12, 2005, we entered into agreements with the OCC, and separately with the Financial Crimes Enforcement Network, requiring a global compliance divisionU.S.$3 million civil penalty to oversee our compliance with applicable banking regulations and to implementresolve allegations related policies and procedures. We have established a new senior executive position, the global compliance officer, to manage the division in Chile and our New York and Miami branches. Additionally, we have created the U.S. chief compliance officer position to manage compliance in the U.S. and report to the globalBank Secrecy Act, anti-money laundering compliance officer.
Based on the press statement issued by the OCC at the time the consent order was entered into, civil money penalties and other sanction are possible, but the likelihood, extent and amount of such actions cannot be determined at this time.related matters. See notes 22(c) and 27(a)Note 29 to our audited consolidated financial statements.
Dividends
TheWe currently have one class of common shares, and the dividends on our shares are proposed by our board of directors and are approved by our shareholders at the annual ordinary shareholders’ meeting following the year with respect to which the dividends are proposed. Our annual ordinary shareholders’ meeting is held in the first three months of each year. Following shareholder approval, the dividends are declared and paid. Dividends are paid to shareholders of record on the fifth business day preceding the date set for payment of the dividend. The applicable record dates for the payment of dividends to holders of our ADSs are, to the extent practicable, the same. Under the Chilean Corporations Law and regulations issued thereunder, Chilean public corporations are generally required to distribute at least 30% of their earnings as dividends, but a bank is permitted to distribute less than such minimum amount in any given year if the holders of at least two-thirds of our outstanding stock so determine. Under the General Banking Law, a Chilean bank may only pay a single dividend per year (i.e.(i.e., interim dividends are not permitted). It is our current policy to pay 100% of our earnings as dividends.
Our dividend policy is affected to some extent by the rights of SAOS, our affiliate, pursuant to its assumption of the Central Bank indebtedness discussed in “Item 5. Operating and Financial Review and Prospects—Overview—The 1982-1983 Economic Crisis and the Central Bank Subordinated Debt.”
We currently have one class of capital shares. In March, 2005,2006, we paid a nominal dividend of Ch$2.2993 1.8582 per share.
During an extraordinary shareholders meeting held on March 23, 2006, our shareholders resolved to pay a portion of our 2005 dividend in shares. In order to do so, our shareholders resolved to issue 957,781,060 new fully paid-in shares. On April 27, 2006, our board of directors agreed to distribute such new fully paid-in shares on May 11, 2006. On May 11, 2006, our shareholders that were shareholders of record on May 5, 2006, received new fully paid-in shares at a ratio of 0.02461 new shares for each share held on May 5, 2006. As a consequence of the issuance of the new fully paid-in shares, as of May 11, 2006, we had 69,037,564,665 shares outstanding.
Dividends payable to holders of our ADSs are net of conversion expenses of the depositary and are subject to Chilean withholding tax currently at the rate of 35%, subject to certain credits. Owners of our ADSs are not charged any fees with respect to cash or stock dividends.
Pursuant to current Chilean foreign exchange regulations, a shareholder who is not a resident of Chile need not register as a foreign investor in order to receive dividends, sale proceeds or other amounts with respect to its shares remitted outside Chile, but the investor must inform the Central Bank about any such transactions and must remit foreign currency through the Formal Exchange Market. Under the foreign investment contract, the depositary, on behalf of our ADS holders, will be granted access to the Formal Exchange Market to convert cash dividends from Chilean pesos to U.S. dollars and to pay such U.S. dollars to ADS holders outside Chile.
The following table sets forth the cash dividends declared on eachper common share of our common stock and per ADS during the periods indicated:
| As of and for the Year Ended December 31, | As of and for the Year Ended December 31, | |||||||||||||||||||||||||||||||||||
| 2000 | 2001 | 2002 | 2003 | 2004 | 2004 | 2001 | 2002 | 2003 | 2004 | 2005 | 2005 | |||||||||||||||||||||||||
| (in constant Ch$ as of December 31, 2004, except for percentages) | (in U.S.$) | (in constant Ch$ as of December 31, 2005, except for percentages) | (in U.S.$) | |||||||||||||||||||||||||||||||||
Dividend payout ratio(1) | 127.2 | % | 100.0 | % | 100.0 | % | 100.0 | % | 100.0 | % | 100.0 | % | ||||||||||||||||||||||||
Dividend per common share(2) | 2.07 | 2.00 | 2.07 | 0.80 | 2.03 | 0.0036 | ||||||||||||||||||||||||||||||
Dividend payout ratio(1) | 100.0 | % | 100.0 | % | 100.0 | % | 100.0 | % | 100.0 | % | 100.0 | % | ||||||||||||||||||||||||
Dividend per common share(2) | 2.07 | 2.15 | 0.83 | 2.05 | 2.40 | 0.0047 | ||||||||||||||||||||||||||||||
Dividend per F shares | n.a. | n.a. | 0.47 | n.a. | n.a. | n.a. | 0.48 | |||||||||||||||||||||||||||||
Dividends per ADS of F shares(2)(3) | n.a. | n.a. | 282.00 | n.a. | n.a. | n.a. | ||||||||||||||||||||||||||||||
Dividend per Banco de A. Edwards shares(2) | — | 0.24 | n.a. | n.a. | n.a. | n.a. | ||||||||||||||||||||||||||||||
Dividends per ADS of Banco de A. Edwards(2)(4) | — | 38.71 | n.a. | n.a. | n.a. | n.a. | ||||||||||||||||||||||||||||||
Dividend per Banco de A. Edwards shares(2) | 0.24 | |||||||||||||||||||||||||||||||||||
Note: n.a. = not applicable.
| (1) | Dividend payout ratio is calculated by dividing the amount of dividends paid by the earnings per share of the prior year. |
| (2) | Dividends per share |
| (3) |
In 2002, as a consequence of the merger, we paid a dividend to holders of our common shares and to holders of F shares. Once the dividends were paid, the F shares were converted into common shares. See “Item 10. Additional Information—Memorandum and Articles of Association—Capitalization.”
Whether future dividends will be paid will depend upon our earnings, financial condition, capital requirements, governmental regulations and policies and other factors. Accordingly, there can be no assurance that dividends in future years will be paid at a rate similar to dividends paid in past years.
SIGNIFICANT CHANGES
No significant changes in our financial condition have occurred since the date of the most recent audited consolidated financial statements included in this annual report.
| Item 9. The Offer and Listing |
Nature of Trading Market
Shares of our common stock are traded on the Chilean stock exchanges. They have been listed on the Santiago Stock Exchange since 1894, on the Electronic Stock Exchange since 1989 and on the Valparaiso Stock Exchange since 1894. The Santiago Stock Exchange is the principal trading market for our shares.
The Chilean securities markets are substantially smaller, less liquid and more volatile than major securities markets in the United States. The Santiago Stock Exchange, which is Chile’s principal exchange, had a market capitalization of approximately U.S.$116.2135.9 billion as of December 31, 20042005 and an average monthly trading volume of approximately U.S.$1,090 1,722 million for 2004.2005. The Santiago Stock Exchange was established in 1893 and is a private company whose equity consists of 48 shares held by 4645 shareholders. As of December 31, 2004, 2792005, 298 series of shares were listed on the Santiago Stock Exchange.
The Santiago Stock Exchange accounts for approximately 81.8%81.9% of all amounts traded in Chile. The ten largest companies in terms of market capitalization represented, as of December 31, 2004,2005, approximately 44.5%45.6% of the Santiago Stock Exchange’s aggregate market capitalization and during 20042005 accounted for approximately 28.9%31.1% of its total volume. During 2004, 19.7%2005, 22.1% of the companies listed on the Santiago Stock Exchange had their shares traded on an average of 70% or more of the exchange’s trading days. Approximately 17.0%16.6% of equity trading in Chile is conducted on the Chilean Electronic Stock Exchange, an
electronic trading market that was created by banks and non-member brokerage houses. The remaining 1.2%1.5% of equity is traded on the Valparaiso Stock Exchange.
ADSs, each representing 600 shares of common stock, without nominal (par) value, have been listed on the NYSE since January 2, 2002 under the symbol “BCH.” JPMorgan Chase Bank is our depositary for purposes of issuing the ADRs evidencing our ADSs. As of December 31, 2004,2005, a maximum of 551,111875,762 ADSs were outstanding (equivalent to 330,666,600525,457,200 shares of common stock or 0.49%0.77% of the total number of issued shares of common stock). It is not practicable for us to determine the proportion of ADSs beneficially owned by U.S. persons. 100% of record holders’ addresses are in the United States. Since certain of our ADSs are held by brokers or other nominees, the number of direct record holders in the United States may not be fully indicative of the number of direct beneficial owners in the United States or of where the direct beneficial owners of such shares are resident.
We listed our shares on Latibex, and trading of our shares started on that exchange on October 8, 2002 under the code XBCH, grouped in trading units of 600 shares. In addition, since December 20, 2002, our shares are listed on the LSE.
The table below shows, for the periods indicated, the annual, quarterly and monthly high and low closing prices (in nominal Chilean pesos) of the shares of our securities on the Santiago Stock Exchange, the Electronic Stock Exchange, and the Valparaiso Stock Exchange:
| Santiago Stock Exchange | Electronic Stock Exchange | Valparaiso Stock Exchange | Santiago Stock Exchange | Electronic Stock Exchange | Valparaiso Stock Exchange | |||||||||||||||||||||||||||||||
| Common Stock | Common Stock | Common Stock | Common Stock | Common Stock | Common Stock | |||||||||||||||||||||||||||||||
| High | Low | High | Low | High | Low | High | Low | High | Low | High | Low | |||||||||||||||||||||||||
| (Ch$ per share )(1) | (Ch$ per share )(1) | (Ch$ per share )(1) | (Ch$ per share )(1) | (Ch$ per share )(1) | (Ch$ per share )(1) | |||||||||||||||||||||||||||||||
Annual Price History | ||||||||||||||||||||||||||||||||||||
2000 | Ch$ | 27.0 | Ch$ | 21.0 | Ch$ | 26.0 | Ch$ | 21.0 | Ch$ | 26.0 | Ch$ | 21.0 | ||||||||||||||||||||||||
2001 | 28.0 | 21.7 | 28.0 | 21.6 | 28.0 | 21.6 | Ch$ | 28.0 | Ch$ | 21.7 | Ch$ | 28.0 | Ch$ | 21.6 | Ch$ | 28.0 | Ch$ | 21.6 | ||||||||||||||||||
2002 | 26.0 | 16.8 | 25.2 | 16.5 | 25.0 | 17.0 | 26.0 | 16.8 | 25.2 | 16.5 | 25.0 | 17.0 | ||||||||||||||||||||||||
2003 | 32.0 | 19.2 | 32.0 | 19.2 | 32.0 | 20.3 | 32.0 | 19.2 | 32.0 | 19.2 | 32.0 | 20.3 | ||||||||||||||||||||||||
2004 | 36.8 | 26.5 | 36.8 | 26.0 | 36.8 | 26.5 | 36.8 | 26.5 | 36.8 | 26.0 | 36.8 | 26.5 | ||||||||||||||||||||||||
2005 | 37.7 | 32.0 | 38.0 | 32.0 | 38.8 | 30.0 | ||||||||||||||||||||||||||||||
Quarterly Price History | ||||||||||||||||||||||||||||||||||||
2003 | ||||||||||||||||||||||||||||||||||||
1st Quarter | 22.5 | 19.2 | 22.5 | 19.2 | 22.1 | 20.3 | ||||||||||||||||||||||||||||||
2nd Quarter | 24.6 | 20.7 | 25.0 | 20.8 | 23.5 | 20.8 | ||||||||||||||||||||||||||||||
3rd Quarter | 25.6 | 22.5 | 25.6 | 22.5 | 25.6 | 23.0 | ||||||||||||||||||||||||||||||
4th Quarter | 32.0 | 25.7 | 32.0 | 25.3 | 32.0 | 26.3 | ||||||||||||||||||||||||||||||
2004 | ||||||||||||||||||||||||||||||||||||
1st Quarter | 32.0 | 26.5 | 32.0 | 26.0 | 31.9 | 26.5 | 32.0 | 26.5 | 32.0 | 26.0 | 31.9 | 26.5 | ||||||||||||||||||||||||
2nd Quarter | 31.8 | 28.6 | 31.9 | 28.5 | 31.9 | 26.5 | 31.8 | 28.6 | 31.9 | 28.5 | 31.9 | 26.5 | ||||||||||||||||||||||||
3rd Quarter | 35.8 | 31.7 | 35.8 | 31.7 | 36.0 | 31.8 | 35.8 | 31.7 | 35.8 | 31.7 | 36.0 | 31.8 | ||||||||||||||||||||||||
4th Quarter | 36.8 | 34.0 | 36.8 | 34.0 | 36.8 | 34.3 | 36.8 | 34.0 | 36.8 | 34.0 | 36.8 | 34.3 | ||||||||||||||||||||||||
2005 | ||||||||||||||||||||||||||||||||||||
1st Quarter | 37.7 | 32.6 | 38.0 | 32.3 | 38.0 | 32.5 | 37.7 | 32.6 | 38.0 | 32.3 | 38.0 | 32.5 | ||||||||||||||||||||||||
2nd Quarter | 34.0 | 32.0 | 34.2 | 32.0 | 34.0 | 30.0 | ||||||||||||||||||||||||||||||
3rd Quarter | 36.3 | 34.0 | 36.4 | 33.8 | 36.0 | 33.9 | ||||||||||||||||||||||||||||||
4th Quarter | 36.8 | 34.0 | 37.0 | 33.5 | 38.8 | 34.3 | ||||||||||||||||||||||||||||||
2006 | ||||||||||||||||||||||||||||||||||||
1st Quarter | 37.9 | 34.6 | 38.1 | 34.6 | 37.9 | 34.6 | ||||||||||||||||||||||||||||||
Monthly Price History | ||||||||||||||||||||||||||||||||||||
December 2004 | 36.4 | 35.3 | 36.4 | 35.3 | 36.5 | 35.3 | ||||||||||||||||||||||||||||||
January 2005 | 35.8 | 33.7 | 36.0 | 33.7 | 35.9 | 33.7 | ||||||||||||||||||||||||||||||
February 2005 | 37.5 | 34.5 | 37.5 | 34.5 | 37.5 | 34.5 | ||||||||||||||||||||||||||||||
March 2005 | 37.7 | 32.6 | 38.0 | 32.3 | 38.0 | 32.5 | ||||||||||||||||||||||||||||||
April 2005 | 33.4 | 32.4 | 33.6 | 32.4 | 33.5 | 32.5 | ||||||||||||||||||||||||||||||
May 2005 | 33.5 | 32.0 | 33.5 | 32.0 | 33.3 | 32.5 | ||||||||||||||||||||||||||||||
December 2005 | 36.0 | 34.0 | 36.5 | 34.2 | 35.9 | 34.5 | ||||||||||||||||||||||||||||||
January 2006 | 37.5 | 34.6 | 38.0 | 34.6 | 37.8 | 34.6 | ||||||||||||||||||||||||||||||
February 2006 | 37.9 | 37.0 | 37.9 | 36.4 | 37.9 | 37.0 | ||||||||||||||||||||||||||||||
March 2006 | 37.8 | 35.0 | 38.1 | 35.0 | 37.8 | 35.1 | ||||||||||||||||||||||||||||||
April 2006 | 35.0 | 33.8 | 35.7 | 33.6 | 35.0 | 33.8 | ||||||||||||||||||||||||||||||
May 2006 | 34.9 | 32.2 | 34.8 | 31.4 | 34.6 | 32.0 | ||||||||||||||||||||||||||||||
Sources: Santiago Stock Exchange, Electronic Stock Exchange, Valparaiso Stock Exchange—Official Quotation Bulletin.
| (1) | Pesos per share reflect nominal price at trade date. |
The table below shows the annual, quarterly and monthly high and low closing prices in U.S. dollars and in Euros, respectively, as reported by the NYSE and Latibex:
| NYSE | Latibex | NYSE | Latibex | |||||||||||||||||||||
| ADS(1) | Trading Units(2) | ADS(1) | Trading Units(2) | |||||||||||||||||||||
| High | Low | High | Low | High | Low | High | Low | |||||||||||||||||
| (U.S.$ per ADS) | (Euros per Trading Unit) | (U.S.$ per ADS) | (Euros per Trading Unit) | |||||||||||||||||||||
Annual Price History | ||||||||||||||||||||||||
2004 | U.S.$ | 39.05 | U.S.$ | 25.30 | € | 29.85 | € | 21.15 | ||||||||||||||||
2005 | U.S.$ | 42.75 | U.S.$ | 32.97 | € | 36.00 | € | 25.60 | ||||||||||||||||
Quarterly Price History | ||||||||||||||||||||||||
2004 | ||||||||||||||||||||||||
2005 | ||||||||||||||||||||||||
1st Quarter | 33.65 | 25.30 | 26.40 | 21.15 | 39.40 | 32.97 | 29.88 | 25.60 | ||||||||||||||||
2nd Quarter | 30.01 | 27.95 | 24.74 | 23.15 | 35.85 | 33.25 | 29.25 | 25.80 | ||||||||||||||||
3rd Quarter | 35.30 | 29.84 | 29.10 | 24.32 | 42.75 | 34.85 | 34.20 | 28.80 | ||||||||||||||||
4th Quarter | 39.05 | 33.70 | 29.85 | 26.32 | 42.40 | 38.30 | 36.00 | 32.26 | ||||||||||||||||
2005 | ||||||||||||||||||||||||
2006 | ||||||||||||||||||||||||
1st Quarter | 39.40 | 32.97 | 29.88 | 25.6 | 44.40 | 38.95 | 37.20 | 32.40 | ||||||||||||||||
Monthly Price History | ||||||||||||||||||||||||
December 2004 | 39.05 | 36.59 | 28.45 | 27.50 | ||||||||||||||||||||
January 2005 | 38.45 | 34.55 | 28.85 | 26.49 | ||||||||||||||||||||
February 2005 | 39.40 | 34.60 | 29.88 | 26.82 | ||||||||||||||||||||
March 2005 | 39.30 | 32.97 | 29.70 | 25.60 | ||||||||||||||||||||
April 2005 | 35.30 | 33.34 | 27.50 | 25.80 | ||||||||||||||||||||
May 2005 | 34.80 | 33.25 | 27.82 | 26.04 | ||||||||||||||||||||
December 2005 | 42.40 | 40.00 | 36.00 | 33.00 | ||||||||||||||||||||
January 2006 | 43.50 | 38.95 | 35.40 | 32.40 | ||||||||||||||||||||
February 2006 | 44.40 | 41.59 | 37.20 | 34.50 | ||||||||||||||||||||
March 2006 | 44.00 | 39.00 | 36.74 | 32.70 | ||||||||||||||||||||
April 2006 | 41.25 | 39.05 | 33.35 | 32.10 | ||||||||||||||||||||
May 2006 | 41.30 | 35.70 | 32.10 | 28.20 | ||||||||||||||||||||
Sources: NYSE and Latibex—Official Quotation Bulletin.
| (1) | One ADS represents 600 shares of common stock. |
| (2) | One Trading Unit represents 600 shares of common stock. |
| Item 10. Additional Information |
MEMORANDUM AND ARTICLES OF ASSOCIATION
Set forth below is a brief summary of the significant provisions of our bylaws, orestatutos and Chilean law. This description contains all material information concerning our shares, but does not purport to be complete and is qualified in its entirety by reference to ourestatutos (a copy of which has been incorporated by reference into this annual report), the General Banking Law, the Chilean Corporations Law and the Securities Market Law. For a description of the provisions of ourestatutos related to our board of directors and our audit committee, see “Item 6. Directors, Senior Management and Employees” and for those related to our dividends, see “Item 8. Financial Information—Consolidated Statements and Other Financial Information—Dividends.”
We are an open stock (public) corporation. Open stock (public) corporations are those with 500 or more shareholders, or companies in which 100 or more shareholders own at least 10% of the subscribed capital (excluding those whose individual holdings exceed 10%), and all other companies that are registered in the Securities Registry of the Chilean Superintendency of Securities and Insurance. The Chilean Corporations Law sets forth the rules and requirements for establishing open stock corporations. Shareholder rights in a Chilean bank that is also an open stock corporation are governed by the bank’sestatutos, which effectively serve as both the articles of incorporation and the bylaws of a company incorporated in the United States. Article 137 of the Chilean Corporations Law provides that all provisions of the Chilean Corporations Law take precedence over any contrary provision in a corporation’sestatutos. Both the Chilean Corporations Law and ourestatutos provide that legal actions by shareholders against us (or our officers or directors) to enforce their rights as shareholders or by one shareholder against another in their capacity as such are to be brought in Chile in arbitration proceedings.
The Chilean securities markets are principally regulated by the Chilean Superintendency of Securities and Insurance under the Securities Market Law and the Chilean Corporations Law. In the case of banks, compliance with these laws is supervised by the Chilean Superintendency of Banks. These two laws provide for disclosure requirements, restrictions on insider trading and price manipulation and protection of minority investors. The Securities Market Law sets forth requirements relating to public offerings, stock exchanges and brokers, and outlines disclosure requirements for companies that issue publicly offered securities.
Capitalization
There is currently one outstanding series of our capital stock. WeAs of May 11, 2006, we have a total of 68,079,783,60569,037,564,665 outstanding shares. All of our shares are fully subscribed and paid and there are no legal restrictions on the payment of dividends from our net income, except that we may only pay a single dividend per year (i.e., interim dividends are not permitted). Chilean public corporations are generally required to distribute at least 30% of their earnings as dividends, but a bank is permitted to distribute less than such minimum amount in any given year if the holders of at least two-thirds of the bank’s outstanding stock so determine. All of our shares have full voting rights.As part of our merger with Banco de A. Edwards, Banco de A. Edwards shareholders received F shares of Banco de Chile. The F shares had all of the same rights as our common stock, except that they entitled holders to receive dividends in 2002 with respect to Banco de A. Edwards’ 2001 income. Once these dividends were declared and paid, the F shares automatically converted on a one-for-one basis into shares of our common stock. Accordingly, the F shares no longer exist.
Under Chilean law, the shareholders of a company, acting at an extraordinary shareholders’ meeting, have the power to authorize an increase in the company’s capital. When an investor subscribes for issued shares, the shares are registered in such investor’s name, even if not paid for, and the investor is treated as a shareholder for all purposes except with regard to receipt of dividends and the return of capital. The investor becomes eligible to receive dividends or the return of capital once it has paid for the shares; if it has paid for only a portion of such shares, it is entitled to reserve a corresponding pro-rata portion of the dividends declared with respect to such shares unless the company’s bylaws provide otherwise. If an investor does not pay for shares for which it has subscribed on or prior to the date agreed upon for payment, the company is entitled under Chilean law to auction the shares on the stock exchange and collect the difference, if any, between the subscription price and the auction proceeds. However, until such shares are sold at auction, the subscriber continues to exercise all the rights of a shareholder (except the right to receive dividends or the return of capital). In the case of banks, authorized shares and issued shares that have not been paid for within the period fixed for their payment by the Chilean Superintendency of Banks are cancelled and are no longer available for issuance by the company.
The Chilean Corporations Law provides that the purchaser of shares of a company implicitly accepts its bylaws and any agreements adopted at shareholders’ meetings.
Ownership Restrictions
Under the Securities Market Law and the regulations of the Chilean Superintendency of Banks, shareholders of open stock corporations are required to report the following to the Chilean Superintendency of Securities and Insurance and the Chilean stock exchanges:
In addition, any person who acquires 10% or more of our shares must include in the report whether the purpose of the acquisition is to acquire control of us or if he or she is making a financial investment. A beneficial owner of ADSs representing 10% or more of our share capital will be subject to these reporting requirements under Chilean law.
According to the regulations of the Chilean Superintendency of Banks, Chilean banks that issue ADSs are required to inform the Chilean Superintendency of Banks if any person, directly or beneficially, acquires ADSs representing 5% or more of the total amount of shares of capital stock issued by such bank.
Under the Securities Market Law and the regulations of the Chilean Superintendency of Banks, persons or entities intending to acquire control, directly or indirectly, of an open stock corporation are also required to inform the public of such intention at least 10 business days in advance but in any case, as soon as negotiations regarding the change of control begin (i.e.,when information and documents concerning the target are delivered to the potential acquiror) through a filing with the Chilean Superintendency of Securities and Insurance, the stock exchanges and the companies controlled by and that control the target and through a notice published in two Chilean newspapers, which notice must disclose, among other information, the person or entity purchasing or selling and the price and conditions of any negotiations.
Prior to such publication, a written communication to such effect must be sent to the target corporation, to the controlling corporation, to the corporations controlled by the target corporation, to the Chilean Superintendency of Securities and Insurance and to the Chilean stock exchanges. Title XV of the Securities Market Law provides the definition of a controlling power, direct holding and related party.
The General Banking Law provides that, as a matter of public policy, no person or company may acquire, directly or indirectly, more than 10% of the shares of a bank without the prior authorization of the Chilean Superintendency of Banks, which may not be unreasonably withheld. The prohibition also applies to beneficial owners of ADSs. In the absence of such authorization, any person or group of persons acting in concert would not be permitted to exercise voting rights with respect to the shares or ADSs acquired. In determining whether to issue such an authorization, the Chilean Superintendency of Banks considers a number of factors enumerated in the General Banking Law, including the financial stability of the purchasing party.
The General Banking Law also requires the prior authorization of the Chilean Superintendency of Banks for:
The prior authorization is required solely when the acquiring bank or the resulting group of banks would own a significant market share in loans, defined by the Chilean Superintendency of Banks to be more than 15.0%20.0% of all loans in the Chilean banking system. The intended purchase may be denied by the Chilean Superintendency of Banks, or may be conditioned on one or more of the following:
The General Banking Law and the regulations issued by the Chilean Superintendency of Banks create the presumption that individuals that are holders of shares and who beneficially own more than 1% of the shares are related to the bank and imposes certain restrictions on the amounts and terms of loans to them made by the related bank. This presumption also applies to beneficial owners of ADSs representing more than 1% of the shares.
Preemptive Rights and Increases of Share Capital
The Chilean Corporations Law provides that whenever a Chilean company issues new shares for cash, it must offer its existing shareholders the right to purchase a sufficient number of shares to maintain their existing ownership percentages in the company. Pursuant to this requirement, we will offer preemptive rights in connection with any future issue of shares to the depositary as the registered owner of the shares underlying the ADSs. However, the depositary will not be able to make the preemptive rights available to U.S. holders of ADSs unless a registration statement under the Securities Act, is effective with respect to the underlying shares or an exemption from the registration requirements thereunder is available.
We intend to evaluate, at the time of any preemptive rights offering, the practicality under Chilean law and Central Bank regulations in effect at the time of making such rights available to our ADS holders, as well as the costs and potential liabilities associated with the registration of such rights and the related shares of common stock under the Securities Act, and the indirect benefits to us of thereby enabling the exercise by all or certain U.S. holders of ADSs of their preemptive rights and any other factors we consider appropriate at the time. There can be no assurance that any registration statement would be filed. If we do not file a registration statement and no exemption from the registration requirements under the Securities Act is available, the depositary will sell such holders’ preemptive rights and distribute the proceeds if a premium can be recognized over the cost of such sale.
In the event that the depositary is not able, or determines that it is not feasible, to sell such rights at a premium over the cost of any such sale, all or certain U.S. holders of ADSs may receive no value for such rights. Non-U.S. holders of ADSs may be able to exercise their preemptive rights regardless of whether a registration statement is filed. The inability of all or certain U.S. holders of ADSs to exercise preemptive rights in respect of shares of common stock underlying such ADSs could result in such holders not maintaining their percentage ownership of the common stock following a preemptive rights offering unless the holder made additional market purchases of ADSs or shares of common stock.
Under Chilean law, preemptive rights are exercisable or freely transferable by shareholders during a period that cannot be less than 30 days following the grant of such rights. During such period, and for an additional 30-day period thereafter, a Chilean company is not permitted to offer any unsubscribed shares for sale to third parties on more favorable terms than those offered to its shareholders. At the end of such additional 30-day period, a Chilean open stock corporation is authorized to sell unsubscribed shares to third
parties on any terms, provided that they are sold on a Chilean stock exchange. Unsubscribed shares that are not sold on a Chilean stock exchange can be sold to third parties only on terms no more favorable to the purchaser than those offered to shareholders.
Shareholders’ Meetings and Voting Rights
An ordinary annual meeting of shareholders is held within the first three months of each year, generally in March. The ordinary annual meeting of shareholders is the corporate body that approves the annual financial statements, all dividends in accordance with the dividend policy determined by our board of directors and any other matter that does not require an extraordinary shareholders’ meeting and elects our board of directors. On March 17, 2005, the last23, 2006, an ordinary annual meeting of our shareholders was held and a new board of directors was elected for the next three years.Extraordinaryheld.Extraordinary meetings may be called by our board of directors when deemed appropriate, and ordinary or extraordinary meetings must be called by our board of directors when requested by shareholders representing at least 10% of the issued voting shares or by the Chilean Superintendency of Banks.
Notice to convene the ordinary annual meeting or an extraordinary meeting is given by means of three notices that must be published in a newspaper of our corporate domicile (currently Santiago, Chile) or in theOfficial Gazette in a prescribed manner, and the first notice must be published not less than 15 calendar days nor more than 20 calendar days in advance of the scheduled meeting. Notice must also be given to the Chilean Superintendency of Banks and the Santiago, Valparaiso and Electronic Stock Exchanges. Currently, we publish our official notices in theDiario El Mercurio.
The notice of a shareholders’ meeting must be mailed not fewer than 15 calendar days prior to the date of such meeting and, in the case of an ordinary annual shareholders’ meeting, shareholders holding a prescribed minimum investment must be sent an annual report of our activities which includes audited consolidated financial statements. Shareholders who do not fall into this category but who request it must also be sent a copy of our annual report. In addition to these requirements, we regularly provide, and management currently intends to continue to provide, together with the notice of shareholders’ meeting, a proposal for the final annual dividend.
The quorum for a shareholders’ meeting is established by the presence, in person or by proxy, of shareholders representing at least an absolute majority of the issued shares; if a quorum is not present at the first meeting on first call, the meeting can be reconvened (in accordance with the procedures described in the previous paragraph) and, upon the meeting being reconvened, shareholders present at the reconvened meeting are deemed to constitute a quorum regardless of the percentage of the shares represented.
The shareholders’ meetings pass resolutions by the affirmative vote of an absolute majority of those voting shares present or represented at the meeting. A vote by a two-thirds majority of the issued shares, however, required at any shareholders’ meeting to approve any of the following actions:
Shareholders may cumulate their votes for the election of directors and cast the same in favor of one person.
In general, Chilean law does not require a Chilean open stock corporation to provide the level and type of information that U.S. securities laws require a reporting company to provide to its shareholders in connection with a solicitation of proxies. Shareholders are entitled to examine the books of a company within the 15-day period before its ordinary annual meeting.
The Chilean Corporations Law provides that whenever shareholders representing 10% or more of the issued voting shares so request, a Chilean company’s annual report must include, in addition to the materials provided by the board of directors to shareholders, any shareholders’ comments and proposals in relation to the company’s affairs. Similarly, the Chilean Corporations Law provides that whenever the board of directors of an open stock corporation convenes an ordinary meeting of the shareholders and solicits proxies for that meeting, or distributes information supporting its decisions or other similar material, it is obligated to include as an annex to its annual report any pertinent comments and proposals that may have been made by shareholders owning 10% or more of the company’s voting shares who have requested that such comments and proposals be included.
Only shareholders registered as such with us on the fifth business day prior to the date of a meeting are entitled to attend and vote their shares. A shareholder may appoint another individual (who need not be a shareholder) as his proxy to attend and vote on his behalf. Every shareholder entitled to attend and vote at a shareholders’ meeting has one vote for every share subscribed.
Dividend, Liquidation and Appraisal Rights
Under the Chilean Corporations Law, Chilean companies are generally required to distribute at least 30% of their earnings as dividends. However, under the General Banking Law, banks are permitted to distribute less than such minimum amount in any given year if holders of at least two-thirds of the bank’s common stock so determine. In the event of any loss of capital or decrease in the legal reserve, no dividends can be distributed until the loss is recovered. Also, a bank cannot distribute dividends above the legal minimum if doing so would result in the bank exceeding its maximum indebtedness ratio or its lending limits. See “Item 8. Financial Information—Consolidated Statements and Other Financial Information—Dividends.”
Dividends that are declared but not paid by the date set for payment at the time of declaration are adjusted from the date set for payment to the date they are actually paid, and interest is accrued thereon. The right to receive a dividend lapses if it is not claimed within five years from the date the dividend is payable.
We may declare a dividend in cash or in shares. When a share dividend is declared above the legal minimum (which minimum must be paid in cash), our shareholders must be given the option to elect to receive cash. A U.S. holder of our ADSs may, in the absence of an effective registration statement under the Securities Act or an available exemption from the registration requirement thereunder, effectively be required to receive a dividend in cash. See “—Preemptive Rights and Increases of Share Capital.”
In the event of our liquidation, the holders of our fully paid shares would participate equally and ratably, in proportion to the number of paid-in shares held by them, in our assets available after payment of all our creditors.
In accordance with the General Banking Law, our shareholders would have no appraisal rights in the event of a business combination or otherwise.
Approval of Financial Statements
Our board of directors is required to submit our audited consolidated financial statements to the shareholders annually for their approval. The approval or rejection of the financial statements is entirely within our shareholders’ discretion. If our shareholders reject our financial statements, our board of directors must submit new financial statements not later than 60 calendar days from the date of the rejection. If our shareholders reject our new financial statements, our entire board of directors is deemed removed from office and a new board of directors is elected at the same meeting. Directors who individually approved our financial statements are disqualified from running for re-election for the ensuing period.
Registrations and Transfers
We act as our own registrar and transfer agent, as is customary among Chilean companies. In the case of jointly owned shares, an attorney-in-fact must be appointed to represent the joint owners in dealings with us.
Amendments to the Chilean Securities Laws and Chilean Corporations Law
On December 20, 2000, the Chilean Congress enacted Law No. 19,705, which amended the Securities Market Law and the Chilean Corporations Law. Among the amendments introduced, Law No. 19,705 established that certain transactions may only be performed via a tender offer. In particular, the acquisition of shares with the intention of obtaining control of an open stock corporation, an offer to buy shares representative of 3% or more of the outstanding shares after obtaining control of an open stock corporation and the sale of shares by controlling shareholders when the price paid is substantially higher than the market price must all be performed by means of a tender offer. According to the Chilean Superintendency of Securities and Insurance, a price should be deemed substantially higher than the market price when it is 10% higher than the average market price for a period starting 90 calendar days and ending 30 calendar days before the proposed transaction.
The amendments introduced to the Chilean Corporations Law by the enactment of Law No. 19,705 also established that:
EXCHANGE CONTROLS
The Central Bank is responsible for, among other things, monetary policies and exchange controls in Chile. Appropriate registration of a foreign investment in Chile grants the investor access to the Formal Exchange Market. Foreign investments can be registered with the Foreign Investment Committee under Decree Law No. 600 or can be registered with the Central Bank under the Central Bank Act.
On April 16, 2001, the Central Bank agreed that, effective April 19, 2001:
| • | a newCompendio de Normas de Cambios Internacionales, or Compendium of Foreign Exchange Regulations, would be applied. |
The main objective of this change, as declared by the Central Bank, is to facilitate capital movements from and into Chile and encourage foreign investment.
The following specific restrictions were eliminated:
Under the amended regulations, only the following limitations are applicable to these operations:
The Central Bank also eliminated Chapter XXVI of the “Compendium of Foreign Exchange Regulations,” which regulated the establishment of an ADR facility by a Chilean company. According to the new rules, it is not necessary to seek the Central Bank’s prior approval in order to establish an ADR facility. The establishment of an ADR facility is now regarded as an ordinary foreign investment. The establishment of an ADR facility now simply requires that the Central Bank be informed of the transaction, and that the transaction be conducted exclusively through the Formal Exchange Market.
Foreign Investment Contract
We are a party, as legal successor of Banco de A. Edwards, to the currently existing foreign investment contract with the Central Bank and the depositary (a copy of which was filed as an exhibit to our Registration Statement on Form F-4 (File No. 333-14020) filed with the Securities and Exchange Commission on October 18, 2001). Absent the foreign investment contract, under applicable Chilean exchange controls, investors would not be granted access to the Formal Exchange Market for the purpose of converting pesos to U.S. dollars and repatriating from Chile amounts received with respect to deposited shares or shares withdrawn from deposit on surrender of ADSs (including amounts received as cash dividends and proceeds from the sale in Chile of the underlying shares and any rights arising therefrom).
The following is a summary of the material provisions of the foreign investment contract. This summary does not purport to be complete and is qualified in its entirety by reference to the foreign investment contract. Under the foreign investment contract, the Central Bank agrees to grant to the depositary, on behalf of ADR holders, and to any investor not residing or domiciled in Chile who withdraws shares upon delivery of ADRs (we refer to such shares as withdrawn shares), access to the Formal Exchange Market to convert pesos to U.S. dollars (and remit such U.S. dollars outside of Chile) in respect of shares represented by ADSs or withdrawn shares, including amounts received as:
Transferees of withdrawn shares will not be entitled to any of the foregoing rights unless the withdrawn shares are redeposited with the depositary. Investors receiving withdrawn shares in exchange for ADRs will have the right to redeposit such shares in exchange for ADRs, provided that the conditions to redeposit are satisfied.
The foreign investment contract provides that a person who brings foreign currency into Chile to purchase shares with the benefit of the foreign investment contract must convert the foreign currency into pesos on the same date as the foreign currency is brought into Chile and then has five banking business days within which to invest the currency in shares in order to receive the benefits of the foreign investment contract. If the person decides within that period not to acquire shares, he or she can access the formal exchange market to reacquire dollars, provided that the applicable request is presented to the Central Bank within seven banking business days of the initial conversion into pesos. Shares acquired as described above may be deposited for ADSs and receive the benefits of the foreign investment contract, subject to:
Access to the Formal Exchange Market under any of the circumstances described above is not automatic. Such access requires approval of the Central Bank based on a request presented through a banking institution established in Chile. The foreign investment contract provides that if the Central Bank has not acted on the request within seven banking days, the request will be deemed approved.
Under current Chilean law, the foreign investment contract cannot be changed unilaterally by the Central Bank, and there are judicial precedents (which are not binding with respect to future judicial decisions) indicating that the foreign investment contract may not be abrogated by future legislative changes. There can be no assurance, however, that additional Chilean restrictions applicable to the holders of ADRs, the disposition of underlying shares or the repatriation of the proceeds from such disposition could not be imposed in the future, nor can we assess the duration or impact of such restrictions if imposed.
TAXATION
Chilean Tax Considerations
The following discussion is based on certain Chilean income tax laws presently in force, including Ruling No. 324 of January 29, 1990 of theServicio de Impuestos Internos, or the Chilean Internal Revenue Service, and other applicable regulations and rulings. The discussion summarizes the principal Chilean income tax consequences of an investment in ADSs or shares of common stock by an individual who is not domiciled in, or a resident of, Chile or a legal entity that is not organized under the laws of Chile and does not have a permanent establishment located in Chile, which we refer to as a foreign holder. For purposes of Chilean tax law, an individual holder is a resident of Chile if he or she has resided in Chile for more than six consecutive months in one calendar year or for a total of more than six months, whether consecutive or not, in two consecutive tax years. An individual holder is domiciled in Chile if he or she resides in Chile with the purpose of staying in Chile (such purpose to be evidenced by circumstances such as the acceptance of employment within Chile or the relocation of his or her family to Chile). This discussion is not intended as tax advice to any particular investor, which can be rendered only in light of that investor’s particular tax situation.
Under Chilean law, provisions contained in statutes such as tax rates applicable to foreign holders, the computation of taxable income for Chilean purposes and the manner in which Chilean taxes are imposed and collected may be amended only by another statute. In addition, the Chilean tax authorities issue rulings and regulations of either general or specific application and interpret the provisions of Chilean tax law. Chilean taxes may not be assessed retroactively against taxpayers who act in good faith relying on such rulings and regulations, but Chilean tax authorities may change rulings and regulations prospectively. There is no general income tax treaty in force between Chile and the United States.
Cash Dividends and Other Distributions
Cash dividends paid by us with respect to ADSs or shares of common stock held by a foreign holder will be subject to a 35.0% Chilean withholding tax, which is withheld and paid over by us, which we refer to as the Chilean withholding tax. A credit against the Chilean withholding tax is available based on the level of corporate income tax, or first category tax, actually paid on the taxable income to which the dividend is imputed; however, this credit does not reduce the Chilean withholding tax on a one-for-one basis because it also increases the base on which the Chilean withholding tax is imposed. In addition, distribution of book income in excess of retained taxable income is subject to the Chilean withholding tax, but such distribution is not eligible for the credit. Under Chilean income tax law, for purposes of determining the level of the first category tax paid, dividends generally are assumed to have been paid out of oldest retained taxable profits. The effective rate of withholding tax to be imposed on dividends paid by us will vary depending upon the amount of first category tax paid by us on the earnings to which the dividends are attributed. In our case, the amount paid as first category tax is lower than it would be based on our income because the dividends paid to SAOS are accounted for as a cost to us. Presently, the first category tax rate is 17%. Whether the first category tax is imposed or not, the effective overall combined rate of Chilean taxes imposed with respect to our distributed profits is 35.0%.
The foregoing tax consequences apply to cash dividends paid and dividend distributions made in property, other than shares of common stock. Share dividends are not subject to Chilean taxation.
Capital Gains
Gain realized on the sale, exchange or other disposition by a foreign holder of ADSs (or ADRs evidencing ADSs) will not be subject to Chilean taxation, provided that such disposition occurs outside Chile or that it is performed under the rules of Title XXIV of the Chilean Securities Market Law, as amended by Law No. 19,601. The deposit and withdrawal of shares of common stock in exchange for ADRs will not be subject to any Chilean taxes.
Gain recognized on the sale or exchange of shares of common stock (as distinguished from sales or exchanges of ADSs representing such shares of common stock) by a foreign holder will be subject to both the first category tax and the Chilean withholding tax (the former being creditable against the latter) if (1) the foreign holder has held such shares of common stock for less than one year since exchanging ADSs for the shares of common stock, (2) the foreign holder acquired and disposed of the shares of common stock in the ordinary course of its business or as a regular trader of stock or (3) the sale is made to a company in which the foreign holder holds an interest (10.0% or more of the shares in the case of open stock corporations). In all other cases, gain on the disposition of shares of common stock will be subject only to the first category tax levied as a sole tax. However, if it is impossible to determine the taxable capital gain, a 5.0% withholding will be imposed on the total amount to be remitted abroad, without any deductions, as a provisional payment of the total tax due.
The tax basis of shares of common stock received in exchange for ADSs will be the acquisition value of such shares on the date of the exchange. The valuation procedure set forth in the deposit agreement, which values shares of common stock that are being exchanged at the highest price at which they trade on the Santiago Stock Exchange on the date of the exchange, generally will determine the acquisition value for this purpose. Consequently, the conversion of ADSs into shares of common stock and sale of such shares of common stock for the value established under the deposit agreement will not generate a capital gain subject to taxation in Chile.
The distribution and exercise of preemptive rights relating to the shares of common stock will not be subject to Chilean taxation. Amounts received in exchange for the shares or assignment of preemptive rights relating to the shares will be subject to both the first category tax and the Chilean withholding tax (the former being creditable against the latter to the extent described above).
Law No. 19,738 of June 19, 2001, an amendment to the Chilean Income Tax Law, establishedThere is an exemption for the payment of income tax by foreign institutional investors such as mutual funds, pension funds and others, that obtain capital gains in the sales through a Chilean stock exchange, a tender offer or any other system authorized by the Chilean Superintendency of Securities and Insurance, of shares of publicly traded corporations that are significantly traded in stock exchanges. The Chilean Internal Revenue Service has not enacted any rule nor issued any ruling about the applicability of this regulation to foreign holders of ADSs.
A foreign institutional investor is an entity that is either:
In order to be entitled to the exemption, foreign institutional investors, during the time in which they operate in Chile, must:
Pursuant to an amendment to the Chilean Income Tax Law published on November 7, 2001, Law No. 19,768,Also, the sale or disposition of shares of Chilean public corporations that are significantly traded on stock exchanges is exempted from Chilean taxes on capital gains if the sale or disposition was made:
Capital gains subject to taxation in Chile may be generated in the case where the sale of the shares is made on a day other than the date in which the exchange is recorded. On October 1, 1999, the Chilean Internal Revenue Service issued Ruling No. 3708, allowing Chilean issuers of ADSs to amend the deposit agreements to which they are parties in order to include a clause that states that, in the case that the exchanged shares are sold by the ADSs’ holders in a Chilean stock exchange, either on the same day in which the exchange is recorded in the shareholders’ registry of the issuer or within the two prior business days to such date, the acquisition price of such exchanged shares shall be the price registered in the invoice issued by the stock broker that participated in the sale transaction. Consequently, should we include this clause in the deposit agreement, the capital gain that may be generated if the exchange date is different than the date in which the shares received in exchange for ADSs were sold, will not be subject to taxation.
Other Chilean Taxes
No Chilean inheritance, gift or succession taxes apply to the transfer or disposition of the ADSs by a foreign holder but such taxes generally will apply to the transfer at death or by a gift of shares of common stock by a foreign holder. No Chilean stamp, issue, registration or similar taxes or duties apply to foreign holders of ADSs or shares of common stock.
United States Federal Income Tax Considerations
The following discussion summarizes the principal U.S. federal income tax considerations relevant to an investment in the ADSs or shares of common stock by a holder that is a citizen or resident of the United States or a U.S. domestic corporation or that otherwise will be subject to U.S. federal income tax on a net income basis in respect of the ADSs or shares of common stock, who is referred to as a U.S. holder, but it does not purport to be a comprehensive description of all of the tax considerations that may be relevant to a decision to purchase ADSs or shares of common stock. In particular, this discussion is directed only to U.S. holders that will hold ADSs or shares of common stock as capital assets and that have the U.S. dollar as their functional currency, and does not address the tax treatment of U.S. holders that are subject to special tax rules, such as banks, dealers in securities or currencies, regulated investment companies, real estate investment trusts, traders in securities electing to mark to market, financial institutions, insurance companies, tax-exempt entities, holders of 10% or more of our voting shares, certain short-term holders of ADSs or shares of common stock, persons holding ADSs or shares of common stock as a position in a “straddle” or conversion transaction, or as part of a “synthetic security” or other integrated financial transaction. Prospective purchasers who are U.S. holders are advised to consult their own tax advisors as to the overall United States federal, state and local tax consequences of their ownership of ADSs and the underlying shares of common stock.
The statements of United States tax laws set out below are based on the laws in force as of the date of this annual report and may be subject to any changes in United States law occurring after such date, including changes that may have retroactive effect.
ADRs
In general, U.S. holders of ADRs evidencing ADSs will be treated, for United States federal income tax purposes, as the beneficial owners of the underlying shares of common stock that are represented by those ADSs and evidenced by those ADRs.
Cash Dividends and Other Distributions
The gross amount of cash dividends paid out of our current or accumulated earnings and profits (as determined for U.S. federal income tax purposes) with respect to the shares of common stock or ADSs, including the net amount of the Chilean withholding tax withheld on the distribution (after taking into account the credit for the first category tax), will be includable in the gross income of a U.S. holder as foreign source dividend income on the day the dividends are received by the U.S. holder, in the case of shares of common stock, or by the depositary, in the case of shares of common stock represented by ADSs, and will not be eligible for the dividends-received deduction allowed to corporations under the Internal Revenue Code of 1986, as currently in force. Dividends paid in Chilean pesos will be includable in the income of a U.S. holder in a U.S. dollar amount calculated by reference to the exchange rate in effect on the day they are received by the U.S. holder, in the case of shares of common stock, or the depositary, in the case of shares of common stock represented by ADSs. U.S. holders should consult their own tax advisors regarding the treatment of foreign currency gain or loss, if any, on any Chilean pesos received that are converted into U.S. dollars on a date subsequent to receipt.
Subject to certain exceptions for short-term and hedged positions, the U.S. dollar amount of dividends received by an individual prior to January 1, 20092011 with respect to the ADSs will be subject to taxation at a maximum rate of 15% if the dividends are “qualified dividends.” Dividends paid on the ADSs will be treated as qualified dividends if (i) the ADSs are readily tradable on an established securities market in the United States and (ii) we were not, in the year prior to the year in which the dividend was paid, and isare not, in the year in which the dividend is paid (a) a passive foreign investment company, or PFIC, or (b) for dividends paid prior to the 2005 tax year, a foreign personal holding company, or FPHC, or a foreign investment company, or FIC.PFIC. The ADSs are listed on the NYSE and will qualify as readily tradable on an established securities market in the United States so long as they are so listed. Based on our audited financial statements and relevant market and shareholder data, we believe that we were not treated as a PFIC FPHC or FIC for U.S. federal income tax purposes with respect to our 20042005 taxable year. In addition, based on our audited financial statements and our current expectations regarding the value and nature of our assets, the sources and nature of our income, and relevant market and shareholder data, we do not anticipate becoming a PFIC FPHC or FIC for our 20052006 taxable year.
Based on existing guidance, it is not entirely clear whether dividends received with respect to the common stock will be treated as qualified dividends, because the common stock is not itself listed on a U.S. exchange. In addition, the U.S. Treasury has announced its intention to promulgate rules pursuant to which holders of ADSs or common stock and intermediaries through whom such securities are held will be permitted to rely on certifications from issuers to establish that dividends are treated as qualified dividends. Because such procedures have not yet been issued, it is not clear whether we will be able to comply with them. Holders of ADSs and common stock should consult their own tax advisers regarding the availability of the reduced dividend tax rate in the light of their own particular circumstances.
The Chilean withholding tax (after taking into account the credit for the first category tax) will be treated as a foreign income tax that a U.S. holder may elect to deduct in computing its income tax or, subject to generally applicable limitations and conditions under the Internal Revenue Code, to credit against its U.S.
federal income tax liability. For purposes of calculating the foreign tax credits, dividends paid on the common stock or ADSs will generally constitute foreign source passive income for U.S. tax purposes. Foreign tax
credits will not be allowed for withholding taxes imposed in respect of certain short-term or hedged positions in securities and may not be allowed in respect of arrangements in which a U.S. holder’s expected economic profit is insubstantial. U.S. holders should consult their own advisors concerning the implications of these rules in light of their particular circumstances.
Distributions of additional shares of common stock (or rights to subscribe for shares of common stock) to U.S. holders with respect to the ADSs or shares of common stock that are made as part of a pro rata distribution to all of our shareholders generally will not be subject to U.S. federal income tax.
A non-U.S. holder,i.e., a holder of shares of common stock or ADSs that is a nonresident alien individual or a foreign corporation generally will not be subject to U.S. federal income or withholding tax on dividends received on shares of common stock or ADSs, unless that income is effectively connected with the conduct by the non-U.S. holder of a trade or business in the United States.
Capital Gains
Gain or loss realized by a U.S. holder on the sale, exchange or other disposition of ADSs or shares of common stock will be subject to U.S. federal income taxation as a capital gain or loss in an amount equal to the difference between the holder’s adjusted basis in the ADSs or the shares of common stock and the amount realized on the disposition. The gain or loss generally will be a capital gain or loss. Capital gains realized by an individual U.S. holder are generally subject to a maximum tax rate of 15% with respect to property held for more than one year.
Gains realized by a U.S. holder on a sale or other disposition of ADSs or shares of common stock generally will be treated as U.S. source income. Because a U.S. holder generally may not use a foreign tax credit to reduce its U.S. federal income tax liability in respect of its U.S. source income, in the case of a disposition of shares of common stock (which, unlike a disposition of ADSs, would be taxable in Chile), the U.S. holder generally would not be able to utilize foreign tax credits in respect of any Chilean tax imposed on such a disposition unless such holder has other income from foreign sources, in the appropriate category, for purposes of the foreign tax credit limitation rules. U.S. holders should consult their tax advisors regarding the application of the foreign tax credit limitation rules to their investment in, and disposition of, the ADSs and shares of common stock.
Deposits and withdrawals of shares of common stock by U.S. holders in exchange for ADSs will not result in the realization of gain or loss for U.S. federal income tax purposes.
A non-U.S. holder of shares of common stock or ADSs will not be subject to U.S. federal income or withholding tax on gain realized on the sale of shares of common stock or ADSs, unless (1) such gain is effectively connected with the conduct by the non-U.S. holder of a trade or business in the United States or (2) in the case of gain realized by an individual non-U.S. holder, the non-U.S. holder is present in the United States for 183 days or more in the taxable year of the sale and certain other conditions are met.
Backup Withholding and Information Reporting
In general, dividends paid to a U.S. holder and proceeds from a disposition of the ADSs or shares of common stock will be subject to information reporting requirements and the payments may be subject to U.S. backup withholding tax if the U.S. holder does not provide a taxpayer identification number or otherwise establish an exemption. Under certain circumstances, such payments made to a non-U.S. holder also may be subject to U.S. information reporting requirements and U.S. backup withholding tax, unless the holder certifies its non-U.S. status or otherwise establishes an exemption.
The foregoing discussion of Chilean and United States tax considerations is intended only to provide a general description of the principal relevant factors. The discussion is not intended as tax advice to any
particular investor, which advice can be rendered only in light of that investor’s particular tax situation. Investors should consult their tax advisors about the federal, state, local and foreign tax consequences to them of the purchase, ownership and disposition of ADSs or shares of common stock.
DOCUMENTS ON DISPLAY
The materials included in this annual report on Form 20-F, and exhibits thereto, may be inspected and copied at the Securities and Exchange Commission’s public reference room in Washington, D.C. Please call the Securities and Exchange Commission at 1-800-SEC-0330 for further information on the public reference rooms. The Securities and Exchange Commission maintains a World Wide Web site on the Internet at http://www.sec.gov that contains reports and information statements and other information regarding us. The reports and information statements and other information about us can be downloaded from the Securities and Exchange Commission’s website.
| Item 11. Quantitative and Qualitative Disclosures About Market Risk |
Introduction
We are exposed to market risks in our asset liability management portfolio and in our trading portfolio. Our asset liability management portfolio is comprised of our nontrading activities and includes retail and corporate deposits; mortgage bonds; foreign borrowings, consumer, commercial and mortgage loans; and foreign trade transactions. Our trading portfolio is comprised of our trading activities and includes government securities, corporate bonds, foreign exchange positions, forwards on foreign exchange and currency and interest rate swaps.
The Risk Process
We control financial risk primarily through a series of limits, which are approved by the finance and international committee. See “—Market Risk: Models and Measurement—Asset Liability Portfolio” and “—Market Risk: Models and Measurement—The Trading Portfolio” for an explanation of these limits. The finance and international committee’s membership is comprised of the chairman of our board of directors, our chief executive officer and the managers of the planning and research division, the financial division and the corporate and international division. The finance and international committee sets limits based on an analysis of our business strategy, market volatility, liquidity of the products involved, management experience and our overall risk tolerance.
The frequency with which we monitor our exposure to market risk depends on the nature of the portfolio. Market risk for the trading portfolio is monitored on a daily basis. A risk report, highlighting the level of market risk, with its evolution and risk concentrations by asset class and business unit is distributed to several business area managers of the planning and research division, the financial division and the corporate and international division and to the other finance and international committee members.
Market risk for the asset liability portfolio is monitored on a monthly basis. The risk report for the asset liability portfolio focuses on interest rate risk for local and foreign currency and on the evolution of our assets and liabilities positions is monitored in local and foreign currency. The report is distributed to several business area managers and to the finance and international committee members.
The management of risk is accomplished through a centralized structure. It is conducted by the financial risk department which is fullymanages market risks. Fully independent of the trading groups, andit reports directly to the manager of the planning and research division. The financial risk department oversees our local financial activities as well as those of our international operations. Its responsibilities include:
The financial risk department is responsible for warning our business areas when they are about to exceed our risk limits. The finance and international committee is also notified whenever any of our business areas is about to exceed our risk limits. If the risk limit is exceeded, the responsible business area must explain why the risk limit was exceeded, and the finance and international committee must meet to decide whether to eliminate the excess risk or grant a provisional limit increase. The finance and international committee updates risk limits once a year, unless market conditions change, in which case risk limits are updated more frequently, as needed.
Market Risk Exposures
Market risk refers to potential losses arising from unfavorable market movements in interest rates or foreign exchange rates, as well as the correlation among these factors and their volatility. We are exposed to the material market risks described below because of the financial positions we maintain. The following section quantifies the potential impact of these risks.
Interest rate risk
We are exposed to interest rate risk in both our asset liability portfolio and in our trading portfolio. For the asset liability portfolio, interest rate risk arises from differences in the maturity or timing of our assets and liabilities. Changes in interest rates also affect the underlying economic value of our assets and liabilities, as the present value of future cash flows changes when interest rates change. For the trading portfolio, interest rate risk is the change in the value arising from changes in interest rates.
Currency risk
We are exposed to currency risk because of differences between the asset and liability positions that we maintain in each currency, or currency mismatches. We maintain mismatches in local currency against the U.S. dollar and, to a lesser extent, against the euroBrazilian real and the Japanese yen.euro. Other mismatches are not significant.
At December 31, 2004,2005, our consolidated foreign currency-denominated assets and liabilities were denominated principally in U.S. dollars:
| At December 31, 2004 | At December 31, 2005 | |||||||||||||||||||
| Assets | Liabilities | Net | Assets | Liabilities | Net | |||||||||||||||
| (in millions of constant Ch$ as of December 31, 2004) | (in millions of constant en Ch$ as of December 31, 2005) | |||||||||||||||||||
U.S. dollar(1) | Ch$ | 2,206,156 | Ch$ | (2,171,886 | ) | Ch$ | 34,270 | |||||||||||||
U.S. dollar(1) | Ch$ | 1,914,770 | Ch$ | (1,897,898 | ) | Ch$ | 16,872 | |||||||||||||
Brazilian real. | 7,412 | — | 7,412 | |||||||||||||||||
Euro | 28,368 | (27,218 | ) | 1,150 | 34,367 | (33,478 | ) | 889 | ||||||||||||
Pound sterling | 1,621 | (1,233 | ) | 388 | 1,496 | (1,105 | ) | 391 | ||||||||||||
Swiss franc | 395 | (154 | ) | 241 | ||||||||||||||||
Canadian dollar | 310 | (103 | ) | 207 | 407 | (121 | ) | 286 | ||||||||||||
Japanese yen | 5,639 | (5,537 | ) | 102 | 429,178 | (428,927 | ) | 251 | ||||||||||||
Swiss franc | 458 | (268 | ) | 190 | ||||||||||||||||
Other | 420 | (237 | ) | 183 | 257 | (97 | ) | 160 | ||||||||||||
Total | Ch$ | 2,242,909 | Ch$ | (2,206,368 | ) | Ch$ | 36,541 | Ch$ | 2,388,345 | Ch$ | (2,361,894 | ) | Ch$ | 26,451 | ||||||
| (1) | Includes Ch$ |
As is explained below, we use two models to measure our asset liability management’s portfolio’s exposure to interest rate risk: an interest rate gap modelInterest Rate Gap Model and a duration gap model.
Duration Gap Model.
Inflation risk
We are exposed to inflation risk because of differences between the asset and liability positions that we maintain in UF (inflation indexed) and in peso (non inflation indexed).local currency. We have generally maintained more peso-denominated liabilities than peso-denominated assets and more UF-denominated assets than UF-denominated liabilities. The net asset position in UF is inflation-indexed whereas the net position in peso is not inflation-indexed. In 2005 the inflation rate was 3.7%. We believe that inflation risk is not significant asfor inflation has steadily declined from 18.7% in 1991 to 2.4% in 2004.fluctuated only within a range of 1.1% and 4.4% since 2000.
Balance Sheet Structure
The composition of our assets, liabilities and shareholders’ equity at December 31, 20042005 by currency and term was as follows:
| At December 31, 2004 | At December 31, 2005 | |||||||||||||||||||||||||||||||||||||
| Ch$ | UF | Foreign Currency(1) | Total | Percentage | Ch$ | UF | Foreign Currency(1) | Total | Percentage | |||||||||||||||||||||||||||||
| (in millions of constant Ch$ as of December 31, 2004, except for percentages) | (in millions of constant Ch$ as of December 31, 2005, except for percentages) | |||||||||||||||||||||||||||||||||||||
Assets(2): | ||||||||||||||||||||||||||||||||||||||
Assets(2): | ||||||||||||||||||||||||||||||||||||||
Cash and due from banks | Ch$ | 705,558 | — | Ch$ | 185,058 | Ch$ | 890,616 | 9.0 | % | Ch$ | 305,731 | — | Ch$ | 353,577 | Ch$ | 659,308 | 6.0 | % | ||||||||||||||||||||
Other assets(1) | ||||||||||||||||||||||||||||||||||||||
Other assets(1) | ||||||||||||||||||||||||||||||||||||||
Less than one year | 2,070,939 | Ch$ | 1,461,401 | 1,549,233 | 5,081,573 | 51.3 | 2,599,566 | Ch$ | 1,300,358 | 1,458,599 | 5,358,523 | 48.3 | ||||||||||||||||||||||||||
From one to three years | 409,220 | 729,365 | 146,057 | 1,284,642 | 13.0 | 523,313 | 932,791 | 69,913 | 1,526,017 | 13.8 | ||||||||||||||||||||||||||||
More than three years | 128,526 | 1,941,477 | 59,966 | 2,129,969 | 21.5 | 226,518 | 2,451,351 | 93,524 | 2,771,393 | 25.0 | ||||||||||||||||||||||||||||
Total financial assets | Ch$ | 3,314,243 | Ch$ | 4,132,243 | Ch$ | 1,940,314 | Ch$ | 9,386,800 | 94.8 | % | Ch$ | 3,655,128 | Ch$ | 4,684,500 | Ch$ | 1,975,613 | Ch$ | 10,315,241 | 93.1 | % | ||||||||||||||||||
Other | 229,170 | 1,120 | 303,714 | 534,004 | 5.4 | 349,628 | 1,268 | 410,919 | 761,815 | 6.8 | ||||||||||||||||||||||||||||
Bank premises and equipment | 131,978 | — | 692 | 132,670 | 1.3 | 140,227 | — | 2,223 | 142,450 | 1.3 | ||||||||||||||||||||||||||||
Investment in other companies | 5,412 | — | — | 5,412 | 0.1 | 7,160 | — | — | 7,160 | 0.1 | ||||||||||||||||||||||||||||
Allowances for loan losses | (151,931 | ) | — | (1,811 | ) | (153,742 | ) | (1.6 | ) | |||||||||||||||||||||||||||||
Allowance for loan losses | (140,895 | ) | — | (410 | ) | (141,305 | ) | (1.3 | ) | |||||||||||||||||||||||||||||
Total assets | Ch$ | 3,528,872 | Ch$ | 4,133,363 | Ch$ | 2,242,909 | Ch$ | 9,905,144 | 100.0 | % | Ch$ | 4,011,248 | Ch$ | 4,685,768 | Ch$ | 2,388,345 | Ch$ | 11,085,361 | 100.0 | % | ||||||||||||||||||
Percentage of total financial assets by currency | 35.31 | % | 44.02 | % | 20.67 | % | 100.00 | % | 35.43 | % | 45.41 | % | 19.16 | % | 100.00 | % | ||||||||||||||||||||||
Liabilities and shareholders’ equity(2): | ||||||||||||||||||||||||||||||||||||||
Liabilities and shareholders’ equity(2): | ||||||||||||||||||||||||||||||||||||||
Non-interest bearing demand deposits | Ch$ | 1,603,663 | Ch$ | 50,609 | Ch$ | 467,773 | Ch$ | 2,122,045 | 21.4 | % | Ch$ | 1,600,093 | Ch$ | 7,486 | Ch$ | 393,156 | Ch$ | 2,000,735 | 18.1 | % | ||||||||||||||||||
Other liabilities(1) | ||||||||||||||||||||||||||||||||||||||
Other liabilities(1) | ||||||||||||||||||||||||||||||||||||||
Less than one year | 2,488,694 | 966,461 | 1,580,948 | 5,036,103 | 50.8 | 2,708,016 | 1,481,810 | 1,745,881 | 5,935,707 | 53.6 | ||||||||||||||||||||||||||||
From one to three years | 71,810 | 485,614 | 58,043 | 615,467 | 6.2 | 79,454 | 661,682 | 104,296 | 845,432 | 7.6 | ||||||||||||||||||||||||||||
More than three years | 17,201 | 888,317 | 926 | 906,444 | 9.2 | 20,512 | 749,400 | 30,154 | 800,066 | 7.2 | ||||||||||||||||||||||||||||
Total financial liabilities | Ch$ | 4,181,368 | Ch$ | 2,391,001 | Ch$ | 2,107,690 | Ch$ | 8,680,059 | 87.6 | % | Ch$ | 4,408,075 | Ch$ | 2,900,378 | Ch$ | 2,273,487 | Ch$ | 9,581,940 | 86.5 | % | ||||||||||||||||||
Other | 446,401 | 5,473 | 98,678 | 550,552 | 5.5 | 494,365 | 145,542 | 88,407 | 728,314 | 6.5 | ||||||||||||||||||||||||||||
Shareholders’ equity | 521,905 | — | — | 521,905 | 5.3 | 594,383 | — | — | 594,383 | 5.4 | ||||||||||||||||||||||||||||
2004 net income | 152,628 | — | — | 152,628 | 1.6 | |||||||||||||||||||||||||||||||||
2005 net income | 180,724 | — | — | 180,724 | 1.6 | |||||||||||||||||||||||||||||||||
Total liabilities and shareholders’ equity | Ch$ | 5,302,302 | Ch$ | 2,396,474 | Ch$ | 2,206,368 | Ch$ | 9,905,144 | 100.0 | % | Ch$ | 5,677,547 | Ch$ | 3,045,920 | Ch$ | 2,361,894 | Ch$ | 11,085,361 | 100.0 | % | ||||||||||||||||||
Percentage of total financial liabilities and shareholders’ equity by currency | 48.17 | % | 27.55 | % | 24.28 | % | 100.00 | % | 46.00 | % | 30.27 | % | 23.73 | % | 100.00 | % | ||||||||||||||||||||||
Asset/liability gap | Ch$ | (1,773,430 | ) | Ch$ | 1,736,889 | Ch$ | 36,541 | Ch$ | (1,666,299 | ) | Ch$ | 1,639,848 | Ch$ | 26,451 | ||||||||||||||||||||||||
| (1) | Includes assets and liabilities payable in Chilean pesos that are indexed according to the U.S. dollar exchange rate. |
| (2) | Includes forward contracts. |
Market Risk: Models and Measurement
The data needed for our market risk models are obtained from brokers or government agencies with access to information provided by Reuters or Bloomberg or from information on prices located at issuers’ Internet sites. We maintain a daily risk factor database for currency parities, bond prices and interest rates for different maturities and currencies.
Asset Liability Portfolio
The finance and international committee’s policies with respect to the asset liability portfolio protect net interest revenue on a pre-tax basis and the value of equity from unexpected changes in interest rates, while complying with the limits that have been imposed by Chilean banking regulators and those internally set by us. We use the Interest Rate Gap Model to measure the interest rate risk of our net interest revenue. The Duration
Gap Model is used to measure the interest rate risk of our equity. Currency risk associated with our asset
liability portfolio is managed using the Value at Risk, or VaR, methodology. See “––“—Market Risk: Value at Risk (VaR).”
12-Month Interest Rate Risk: The Interest Rate Gap Model
Fluctuations in interest rates affect our reported earnings through changes in our net interest income and lead to repricing risk. Repricing risk results from differences in the timing of interest rate changes and the timing of cash flows that occur in the pricing and maturity of a bank’s interest earning assets and liabilities. Any mismatch of interest earning assets and interest earning liabilities exists whenever an unequal amount of interest earning assets or interest earning liabilities mature or reprice in any given period, and is known as an interest gap position. A positive gap denotes assets sensitivity and normally means that an increase in interest rates would have a positive effect on net interest revenue, while a decrease in interest rates would have a negative effect on net interest revenue.
WeIn general we maintain a positive one-year gap in UF and a negative one-year gap in pesos and foreign currency. Our financial division is responsible for managing our interest rate gap for local and foreign currency and for defining internal financial transfer prices, especially minimum and maximum fund raising rates and the cost of funds for each of our active transactions. For this purpose, the finance division buys and sells all matched funds so that the business areas do not have to assume the transaction’s financial risk. We only take mismatched interest rate positions in accordance with the policies and procedures established by the finance and international committee.
To compute our exposure to repricing risk for the next 12 months, we prepare, on a monthly basis, gap profiles for inflation indexedinflation-indexed portfolios, non-inflation indexed portfolios and for dollar portfolios. To compute the different gap profiles we use the following tenor buckets:
Next, we calculate the potential impact on net interest revenue over the next twelve months based onassuming a parallelnon-parallel shift in yield curves for non-inflation indexed, (parallel shift of 120 basis points), inflation (parallel shift of 170 basis points for one and two months, and 150 basis points for three months up to a year) and dollar positions (parallel shift of 50 basis points).positions. To limit repricing risk, the finance and international committee has established that total potential losses resulting from the parallel shiftthese shifts cannot exceed a certain amount of net interest revenue. The following tables show, in nominal amounts, the average, low and high repricing risk for the years 20032004 and 2004:2005:
| Repricing Risk 2003 | ||||||||||||
| Low | High | Average | December 31, 2003 | |||||||||
| (in millions of nominal Ch$) | ||||||||||||
Pesos position | Ch$ | 1,263 | Ch$ | 8,008 | Ch$ | 4,117 | Ch$ | 7,515 | ||||
UF position | 5,345 | 13,970 | 8,705 | 6,306 | ||||||||
Foreign currency position | Ch$ | 96 | Ch$ | 3,148 | Ch$ | 1,466 | Ch$ | 342 | ||||
| Repricing Risk 2004 | ||||||||||||
| Low | High | Average | December 31, 2004 | |||||||||
| (in millions of nominal Ch$) | ||||||||||||
Pesos position | Ch$ | 438 | Ch$ | 6,997 | Ch$ | 3,841 | Ch$ | 2,470 | ||||
UF position | 4,308 | 8,132 | 6,715 | 5,710 | ||||||||
Foreign currency position | Ch$ | 52 | Ch$ | 1,058 | Ch$ | 616 | Ch$ | 1,058 | ||||
| Repricing Risk 2004 | ||||||||||||
| Low | High | Average | December 31, 2004 | |||||||||
| (in millions of nominal Ch$) | ||||||||||||
Pesos position | Ch$ | 438 | Ch$ | 6,997 | Ch$ | 3,841 | Ch$ | 2,470 | ||||
UF position | 4,308 | 8,132 | 6,715 | 5,710 | ||||||||
Foreign currency position | 52 | 1,058 | 616 | 1,058 | ||||||||
| Repricing Risk 2005 | ||||||||||||
| Low | High | Average | December 31, 2005 | |||||||||
| (in millions of nominal Ch$) | ||||||||||||
Pesos position | Ch$ | 519 | Ch$ | 5,816 | Ch$ | 3,350 | Ch$ | 5,816 | ||||
UF position | 1,967 | 8,970 | 5,366 | 1,967 | ||||||||
Foreign currency position | 59 | 733 | 400 | 59 | ||||||||
WeIn general, we finance our positive one-year UF gap with our negative one-year gap in pesos and, to a lesser extent, the negative one-year gap in foreign currency. The risk of this strategy, which we refer to as net repricing risk, is calculated by subtracting repricing risks for the peso and foreign currency positions from the UF repricing risk. Since
In each of 2004 and 2005, we expected further increases in short term interest rates were expected to increase during 2004,in pesos and a flattening of the yield curve in UF, specially in the medium and long term sector of the curve. As a result, we increased marginally the average maturity of itsthe peso liabilities.liabilities within the one-year gap period and we changed the composition of the UF gap, decreasing the size of the one-year UF gap and increasing the size of the medium and long-term gap. The increase in the average maturity of the peso position decreased the average repricing risk from Ch$3,841 million to Ch$3,350 million. The drop from Ch$6,715 million to Ch$5,366 million in the average risk for the UF position is due to the smaller one-year UF gap. As a result, net average repricing risk decreased from Ch$3,122 million in 2003 to Ch$2,258 million in 2004.
2004 to Ch$1,616 million in 2005.
Economic Interest Rate Risk: The Duration Gap Model
Changes in interest rates also affect a bank’s underlying economic value. This is called economic risk. The duration gap seeks to protect the economic value of our equity from unexpected changes in interest rates. To do so, potential losses for existing gaps for inflation indexedinflation-indexed and non-inflation position, and for dollar positions, are calculated assuming interest rate shifts based on different volatility scenarios. The finance and international committee has established limits that regulate potential losses resulting from these scenario analyses as a percentage of capital.
The following tables show the average low and high economic risk exposure as a percentage of capital for the years 20032004 and 2004.2005. The last columns show our interest rate sensitivity as of December 31, 20032004 and 2004.2005.
| Economic Risks as a Percentage of Capital 2003 | |||||||||||
| Low | High | Average | December 2003 | ||||||||
Pesos position | 0.27 | % | 0.97 | % | 0.48 | % | 0.70% | ||||
UF position | 0.94 | 2.46 | 1.74 | 2.03 | |||||||
Foreign currency position | 0.02 | % | 0.50 | % | 0.22 | % | 0.02% | ||||
| Economic Risks as a Percentage of Capital 2004 | |||||||||||
| Low | High | Average | December 2004 | ||||||||
Pesos position | 0.21 | % | 2.95 | % | 1.06 | % | 1.62% | ||||
UF position | 0.63 | 2.99 | 1.72 | 2.99 | |||||||
Foreign currency position | 0.01 | % | 0.32 | % | 0.13 | % | 0.19% | ||||
| Economic Risks as a Percentage of Capital 2004 | ||||||||||||
| Low | High | Average | December 2004 | |||||||||
Pesos position | 0.21 | % | 2.95 | % | 1.06 | % | 1.62 | % | ||||
UF position | 0.63 | % | 2.99 | % | 1.72 | % | 2.99 | % | ||||
Foreign currency position | 0.01 | % | 0.32 | % | 0.13 | % | 0.19 | % | ||||
| Economic Risks as a Percentage of Capital 2005 | ||||||||||||
| Low | High | Average | December 2005 | |||||||||
Pesos position | 0.41 | % | 1.51 | % | 0.82 | % | 0.95 | % | ||||
UF position | 1.10 | % | 5.32 | % | 2.66 | % | 5.32 | % | ||||
Foreign currency position | 0.05 | % | 0.15 | % | 0.10 | % | 0.05 | % | ||||
The average economic risk for the peso position increaseddecreased from 0.48% in 2003 to 1.06% in 2004 to 0.82% in 2005 due to a greaterlower volatility for the yield curve in peso, which was anticipating an increase in interestpesos after the expected rate byincreases for the Central Bank.year 2005 came into effect. Average economic risk for the UF position remained basically constant,increased from 1.72% in 2004 to 2.66% in 2005 due to an increase in the medium and long term UF gap since we expected no further increases for the interest rates in UF, and average economic risk for the foreign currency position decreasedremaining basically unchanged, decreasing from 0.22% in 2003 to 0.13% in 2004 because we have maintained our policy to hedge our exposure to interest rates denominated0.10% in foreign currencies.2005. Overall, total average economic risk increased from 2.44% in 2003 to 2.91% in 2004 to 3.58% in 2005 as a result of the larger economic risk for the pesoUF position.
Central Bank Gap Requirement. The Central Bank mandates that an interest rate risk limit not exceed 8% of a bank’s total capital for commercial banks. The calculation is based on a table per time period compounded by fixed changes in interest rates (100 basis points, or 1%, for the short term and 75 basis points, or 0.75%, for the longer terms) and fixed sensitivity factors for the different time buckets (from 30 days to 20 years). During 2004, this indicator ranged from 4.06% to 6.32%.
The Trading Portfolio
Because no single measure can reflect all aspects of market risk, we use several risk measures, both statistical and non-statistical, to control the market risk of our investment portfolio. The statistical measure is VaR. The non-statistical measures are stress testing, Present Value Basis Point, or PVBP, basis risk and volume limit for fixed income portfolio and currency mismatch.
New Regulations on Market Risks
In September 2005, the Central Bank instituted new regulations aimed at measuring and controlling market risk. For a discussion of the new regulations, see “Item 4. Information on the Company—Regulation and Supervision—Market Risk Regulations.”
Market Risk: Value at Risk (VaR)
Market risk is defined as the sensitivity of the value of the trading portfolio to changes in market parameters such as interest rates and exchange rates. We measure and control our market risk through VaR. VaR provides an estimate of potential market losses over a specified time horizon at a defined level of confidence.
The trading portfolio is comprised by our positions in fixed income and in foreign exchange. Fixed income positions refer to instruments that are tradable on the market and that are sufficiently liquid so that daily market valuations and daily risk measurements are necessary to manage actual and potential losses on a timely basis. There is no portfolio classification for “held to maturity” in Chile. Consequently, all instruments that are tradable on the market must be classified as trading or available for sale instruments. Instruments included in the fixed income portfolio are Central Bank bonds, mortgage bonds, corporate bonds issued by local or foreign issuers and sovereign bonds. The foreign exchange position includes both the currency risk of the fixed income positions and the currency risk associated with our asset liability portfolio.
The VaR estimates are based on the Riskmetrics™ methodology to measure market risk. Riskmetrics™ uses a 95% confidence interval, a one-day holding period and an exponential moving average model with 74 historical observations to forecast variances and covariances. The calculated VaR is adjusted by market liquidity, modeling bid-ask spreads.
In addition to the total VaR, VaRs estimated by market parameters and asset class are also computed.
VaR estimated by market parameters shows the amount of risk due to:
The VaR estimated by asset class shows the amount of risk due to:
Our financial Risk Department rechecks the VaR model on an ongoingon-going basis to assess its accuracy. The results of these backteststests have supported the reliability of our VaR model.
During 2004, we changed our VaR methodology in order to take into consideration correlations effects. The following tables show the median, low and high daily VaR for the years 20032004 and 2004,2005, along with VaR at December 31, 20032004 and 2004.2005.
| Period Ended December 31, 2003 | At December 31, 2003 | |||||||||||||
| Median VaR | Minimum VaR | Maximum VaR | VaR | |||||||||||
| (in millions of nominal Ch$) | ||||||||||||||
Foreign exchange | Ch$ | 56 | — | Ch$ | 281 | Ch$157 | ||||||||
Interest rate risk | 971 | Ch$ | 278 | 1,617 | 486 | |||||||||
Less: portfolio diversification | (43 | ) | 79 | (281 | ) | (218) | ||||||||
Total VaR | Ch$ | 984 | Ch$ | 357 | Ch$ | 1,617 | Ch$425 | |||||||
| Period Ended December 31, 2004 | At December 31, 2004 | |||||||||||||
| Median VaR | Minimum VaR | Maximum VaR | VaR | |||||||||||
| (in millions of nominal Ch$) | ||||||||||||||
Foreign exchange | Ch$ | 141 | Ch$ | 0 | Ch$ | 539 | Ch$100 | |||||||
Interest rate risk | 314 | 154 | 374 | 323 | ||||||||||
Less: portfolio diversification | (90 | ) | (3 | ) | (263 | ) | (172) | |||||||
Total VaR | Ch$ | 365 | Ch$ | 151 | Ch$ | 650 | Ch$251 | |||||||
| Period Ended December 31, 2004 | At December 31, 2004 | |||||||||||||||
| Median VaR | Minimum VaR | Maximum VaR | VaR | |||||||||||||
| (in millions of nominal Ch$) | ||||||||||||||||
Foreign exchange | Ch$ | 141 | — | Ch$ | 539 | Ch$ | 100 | |||||||||
Interest rate risk | 314 | Ch$ | 154 | 374 | 323 | |||||||||||
Less: portfolio diversification | (90 | ) | (3 | ) | (263 | ) | (172 | ) | ||||||||
Total VaR | Ch$ | 365 | Ch$ | 151 | Ch$ | 650 | Ch$ | 251 | ||||||||
| Period Ended December 31, 2005 | At December 31, 2005 | |||||||||||||||
| Median VaR | Minimum VaR | Maximum VaR | VaR | |||||||||||||
| (in millions of nominal Ch$) | ||||||||||||||||
Foreign exchange | Ch$ | 90 | Ch$ | 24 | Ch$ | 122 | Ch$ | 25 | ||||||||
Interest rate risk | 367 | 146 | 1,107 | 805 | ||||||||||||
Less: portfolio diversification | (54 | ) | (13 | ) | (93 | ) | (24 | ) | ||||||||
Total VaR | Ch$ | 403 | Ch$ | 157 | Ch$ | 1,136 | Ch$ | 806 | ||||||||
The chart below compares the VaR estimates with no-action-profit and loss, or NAPL, over the last 12 months ended on December 2004.2005. NAPL describes the hypothetical profit and loss on the position that would have been incurred if the previous day’s closing position had been kept for the next 24 hours and then revalued.
In the chart below, the bars represent the daily NAPL whereas the line below the bars represents the daily VaR. We check the VaR model on an ongoingon-going basis to assess its accuracy. During 2004,2005, the NAPL exceeded the calculated VaR on five occasions, which is within the model expectations.
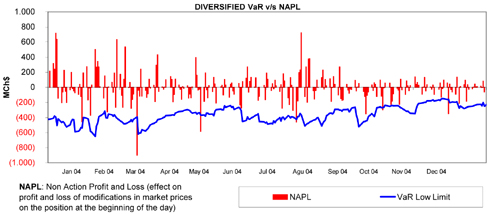
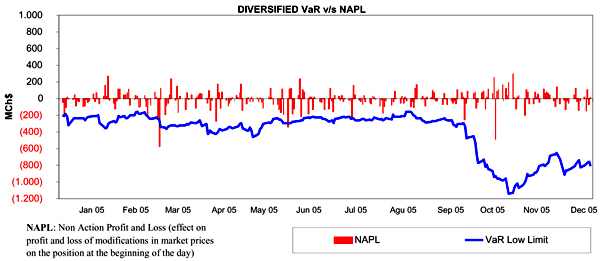
Assumptions and Limitations of the VaR Model.Our VaR model assumes that changes in market risk factors have a normal distribution and that the parameters of this joint distribution have been estimated correctly. The normal distribution assumption, however, may result in our underestimating the probability of extreme market moves. For this reason, we also assess stress risk, or the potential loss due to extreme changes in risk factors. Stress testing is explained more thoroughly below. Another limitation to VaR testing is that while we compute VaR at the close of business, trading positions may change substantially during the course of the trading day and, thus, go unnoticed.
Non-statistical Risk Measures
Stress Risk.Stress risk is our exposure to unlikely but plausible changes, or outlier events, in risk factors resulting from maintaining prevailing positions after the close of a business/trading day. An extreme event is defined as a price variation that is beyond the 95% confidence level defined for normal analysis. Once the market movements for specific risk factors have been determined, they are applied to the portfolio. Then the portfolio is revalued to see the effect of the market move on the value of the portfolio. On a daily basis, the financial risk department performs a stress analysis. The stress analysis is done under two different methods. Amethods: a standard VaR approach (parametric) and a historical simulation approach, since we believe that VaR may be subject to model risk. The standard VaR approach assumes that each risk factor experiences a decline in value greater than 3.5 standard deviations of the mean return and assumes zero correlation among asset classes. The financial risk department also computes a VaR figure using the historical simulation method. This amount is obtained from historical data that goes back 381 days from the date of the calculation.
Present Value Basis Point (PVBP)or PVBP. The PVBP is the change in an instrument’s value associated with the change in the reference yield of 1 basis point, or 0.01%. The PVBP risk limit has been approved by the finance and international committee.committee has approved the PVBP risk limit. As of December 2005, the PVBP for the peso portfolio was Ch$12 million, for the UF portfolio Ch$177 million, and for the USD portfolio Ch$23 million. As of December 2004, the PVBP for the peso portfolio was $3Ch$3 million, for the UF portfolio $162 million, and the USD portfolio $14 million. As of December 2003, the PVBP for the peso portfolio was Ch$73 million, Ch$200162 million for the UF portfolio and Ch$20 million for the USD portfolio.portfolio Ch$14 million.
Basis Risk. Basis risk is the possibility of loss from imperfectly matched risk, offsetting positions in two related but not identical markets. We control our exposure to the basis risk between our foreign bonds portfolio and the interest rate swaps used to hedge them. As of December 2005, one basis point of basis risk was worth Ch$35 million. As of December 2004, one basis point of basis risk was worth $20Ch$20 million. As of December 2003, one basis point of basis risk was worth Ch$12 million.
Position Limit for Fixed Income Portfolio and Currency Mismatch.To limit our exposure to interest rate risk, especially in periods of low volatility, we limit the size of our fixed income portfolio.
Currency Risk. The finance and international committee has determined that our net foreign currency mismatches cannot exceed a certain percentage of our capital. This percentage is lower thanAs of December 31, 2005, the net position of our foreign currency mismatches limit established by the Central Bank, as described below.
Central Bank regulations do not permit the difference between a bank’sdenominated assets and liabilities denominatedChilean peso-denominated assets that contain repayment terms linked to changes in foreign currencies to exceed 20% of a bank’s paid-in capital and reserves (on an unconsolidated basis). At December 31, 2004,currency exchange rates exceeded our foreign currency denominated liabilities and Chilean peso-denominated liabilities that contain repayment terms linked to changes in foreign currency exchange gap wasrates by Ch$36,54126,451 million, equivalent to 7.0%4.5% of our paid-in capital and reserves. This gap includes assets and liabilities denominated in U.S. dollars as well as those denominated in pesos and adjusted by the variation of the U.S. dollar/Chilean peso exchange rate, and off balance sheet items such as interest rate swaps and currency swaps. At December 2003, the foreign exchange gap represented 3.13% of our paid-in capital and reserves.
The rate of devaluation or appreciation of the peso against the U.S. dollar is expected to have the following material effects:
The bulk of foreign exchange trading that we undertake is intended to hedge the exposure of our customers to the prevailing rate of exchange.
It is our policy to make foreign currency-denominated loans only to customers whose activities generate foreign currency-denominated cash flow or that are indexed to a foreign currency, or if the market value of a customer’s assets is indexed to the rate of exchange. At December 31, 2004,2005, approximately 15.1%13.3% of our consolidated total loan portfolio was denominated in foreign currencies.
We enter into forward exchange contracts that are essentially of two types:
The following table presents notional amounts of our derivatives contracts at December 31, 2004:2005:
At December 31, 2005 | |||
| (in millions of constant Ch$ as of December 31, | |||
Exchange rate forwards denominated in foreign currency | Ch$ | 574,880 | |
Foreign currency futures (purchased) | 1,482,161 | ||
Foreign currency futures (sold) | 1,137,495 | ||
Chilean currency futures (purchased) | 413,205 | ||
Chilean currency futures (sold) | 309,261 | ||
Interest rate swaps | |||
864,572 | |||
Purchase option | 2,263 | ||
Total | Ch$ | 4,783,837 | |
The following table presents foreign currency exchange rate risk instruments as of December 31, 2004,2005, in notional amounts, and weighted average exchange rates by expected (contractual) maturity dates, for the next five years:
| As of December 31, 2004 | As of December 31, 2005 | |||||||||||||||||||||||||||||||||
| 2005 | 2006 | 2007 | 2008 | 2009 | Total | 2006 | 2007 | 2008 | 2009 | 2010 | Total | |||||||||||||||||||||||
| (in millions of constant Ch$ as of December 31, 2004) | (in millions of constant Ch$ as of December 31, 2005) | |||||||||||||||||||||||||||||||||
| Exchange rate forwards denominated in foreign currency | ||||||||||||||||||||||||||||||||||
Purchased: | ||||||||||||||||||||||||||||||||||
Pay U.S. dollars/receive euros | Ch$ | 10,033 | Ch$ | 3,163 | Ch$ | — | Ch$ | — | Ch$ | — | Ch$ | 13,196 | ||||||||||||||||||||||
Average contractual exchange rate(1) | 618.83 | 629.48 | ||||||||||||||||||||||||||||||||
Pay U.S. dollars/receive Japanese yen | Ch$ | 2,441 | — | — | — | — | Ch$ | 2,441 | 274,931 | 84,152 | — | — | — | 359,083 | ||||||||||||||||||||
Average contractual exchange rate(1) | 5.27 | |||||||||||||||||||||||||||||||||
Pay U.S. dollars/receive Euros | 14,485 | — | — | — | — | 14,485 | ||||||||||||||||||||||||||||
Average contractual exchange rate(1) | 729.87 | |||||||||||||||||||||||||||||||||
Average contractual exchange rate(1) | 4.77 | 4.60 | ||||||||||||||||||||||||||||||||
Pay U.S. dollars/receive Pound sterling | 162 | — | — | — | — | 162 | 3,584 | 730 | — | — | — | 4,314 | ||||||||||||||||||||||
Average contractual exchange rate(1) | 1,040.28 | |||||||||||||||||||||||||||||||||
Pay U.S. dollars/receive Switzerland franc | 475 | — | — | — | — | 475 | ||||||||||||||||||||||||||||
Average contractual exchange rate(1) | 485.99 | |||||||||||||||||||||||||||||||||
Average contractual exchange rate(1) | 926.02 | 912.11 | ||||||||||||||||||||||||||||||||
Pay U.S. dollars/receive Canadian dollars | 128 | — | — | — | — | 128 | 1,031 | 1,320 | — | — | — | 2,351 | ||||||||||||||||||||||
Average contractual exchange rate(1) | 460.80 | |||||||||||||||||||||||||||||||||
Average contractual exchange rate(1) | 415.83 | 418.96 | — | |||||||||||||||||||||||||||||||
Total | Ch$ | 289,579 | Ch$ | 89,365 | Ch$ | — | Ch$ | — | Ch$ | — | Ch$ | 378,944 | ||||||||||||||||||||||
Sold: | ||||||||||||||||||||||||||||||||||
Pay euros/receive U.S. dollars | 16,365 | 3,240 | — | — | — | 19,605 | ||||||||||||||||||||||||||||
Average contractual exchange rate(1) | 628.15 | 644.81 | ||||||||||||||||||||||||||||||||
Pay Japanese yen/receive U.S. dollars | 15,321 | — | — | — | — | 15,321 | 169,057 | — | — | — | — | 169,057 | ||||||||||||||||||||||
Average contractual exchange rate(1) | 5.33 | |||||||||||||||||||||||||||||||||
Average contractual rate(1) | 4.39 | |||||||||||||||||||||||||||||||||
Pay Pound sterling/receive U.S. dollars | 4,071 | 740 | — | — | — | 4,811 | ||||||||||||||||||||||||||||
Average contractual exchange rate(1) | 931.41 | 925.58 | ||||||||||||||||||||||||||||||||
Pay Canadian dollars/receive U.S. dollars | 1,288 | — | — | — | — | 1,288 | 1,142 | 1,321 | — | — | — | 2,463 | ||||||||||||||||||||||
Average contractual exchange rate(1) | 457.11 | |||||||||||||||||||||||||||||||||
Pay Euros/receive U.S. dollars | 22,998 | Ch$ | 80 | — | — | — | 23,078 | |||||||||||||||||||||||||||
Average contractual exchange rate(1) | 732.35 | 757.10 | ||||||||||||||||||||||||||||||||
Pay Pound sterling/receive U.S. dollars | 2,674 | — | — | — | — | 2,674 | ||||||||||||||||||||||||||||
Average contractual exchange rate(1) | 1,019.42 | |||||||||||||||||||||||||||||||||
Average contractual exchange rate(1) | 421.20 | 419.22 | ||||||||||||||||||||||||||||||||
Total | Ch$ | 59,972 | Ch$ | 80 | — | — | — | Ch$ | 60,052 | Ch$ | 190,635 | Ch$ | 5,301 | Ch$ | — | Ch$ | — | Ch$ | — | Ch$ | 195,936 | |||||||||||||
Foreign currency futures | ||||||||||||||||||||||||||||||||||
Purchased: | ||||||||||||||||||||||||||||||||||
Pay Chilean pesos/receive U.S. dollars | 943,703 | 5,598 | Ch$ | 5,598 | — | — | 954,899 | |||||||||||||||||||||||||||
Average contractual exchange rate(1) | 596.72 | 638.59 | 622.15 | |||||||||||||||||||||||||||||||
Pay UF/receive U.S. dollars | 451,029 | 4,647 | 5,598 | — | — | 461,274 | ||||||||||||||||||||||||||||
Average contractual exchange rate(1) | 613.20 | 592.87 | 616.28 | |||||||||||||||||||||||||||||||
Pay Chilean pesos/receive Euros | 2,742 | 80 | — | — | — | 2,822 | ||||||||||||||||||||||||||||
Average contractual exchange rate(1) | 759.97 | 757.10 | ||||||||||||||||||||||||||||||||
Pay Chilean pesos/receive Pound sterling | 2,547 | — | — | — | — | 2,547 | ||||||||||||||||||||||||||||
Average contractual exchange rate(1) | 1,073.27 | |||||||||||||||||||||||||||||||||
Pay Chilean pesos/receive Canadian dollars | 1,173 | — | — | — | — | 1,173 | ||||||||||||||||||||||||||||
Average contractual exchange rate(1) | 461.18 | |||||||||||||||||||||||||||||||||
Pay Chilean pesos/ receive U.S. dollars | 1,303,595 | 5,247 | — | — | — | 1,308,842 | ||||||||||||||||||||||||||||
Average contractual exchange rate(1) | 533.91 | 566.22 | ||||||||||||||||||||||||||||||||
Pay UF/ receive U.S. dollars | 167,560 | 5,142 | — | — | — | 172,702 | ||||||||||||||||||||||||||||
Average contractual exchange rate(1) | 558.65 | 616.28 | ||||||||||||||||||||||||||||||||
Pay Chilean pesos/ receive euros | 64 | — | — | — | — | 64 | ||||||||||||||||||||||||||||
Average contractual exchange rate(1) | 786.59 | |||||||||||||||||||||||||||||||||
Pay Chilean pesos/ receive Pound sterling | 443 | — | — | — | — | 443 | ||||||||||||||||||||||||||||
Average contractual exchange rate(1) | 904.97 | |||||||||||||||||||||||||||||||||
Pay Chilean pesos/ receive Canadian dollars | 110 | — | — | — | — | 110 | ||||||||||||||||||||||||||||
Average contractual exchange rate(1) | 442.16 | |||||||||||||||||||||||||||||||||
Total | Ch$ | 1,401,194 | Ch$ | 10,325 | Ch$ | 11,196 | — | — | Ch$ | 1,422,715 | Ch$ | 1,471,772 | Ch$ | 10,389 | Ch$ | — | Ch$ | — | Ch$ | — | Ch$ | 1,482,161 | ||||||||||||
Sold: | ||||||||||||||||||||||||||||||||||
Pay U.S. dollars/receive Chilean pesos | 960,096 | 5,598 | 11,197 | — | — | 976,891 | 1,084,122 | 13,729 | 170 | — | — | 1,098,021 | ||||||||||||||||||||||
Average contractual exchange rate(1) | 589.48 | 640.00 | 617.50 | |||||||||||||||||||||||||||||||
Average contractual exchange rate(1) | 529.46 | 518.28 | 536.70 | |||||||||||||||||||||||||||||||
Pay U.S. dollars/receive UF | 220,166 | — | — | — | — | 220,166 | 35,388 | — | — | — | — | 35,388 | ||||||||||||||||||||||
Average contractual exchange rate(1) | 609.85 | |||||||||||||||||||||||||||||||||
Pay Euros/receive Chilean pesos | 2,352 | — | — | — | — | 2,352 | ||||||||||||||||||||||||||||
Average contractual exchange rate(1) | 760.48 | |||||||||||||||||||||||||||||||||
Pay Switzerland franc/receive Chilean pesos | 481 | — | — | — | — | 481 | ||||||||||||||||||||||||||||
Average contractual exchange rate(1) | 492.36 | |||||||||||||||||||||||||||||||||
Average contractual exchange rate(1) | 542.57 | |||||||||||||||||||||||||||||||||
Pay euros/receive Chilean pesos | 3,970 | — | — | — | — | 3,970 | ||||||||||||||||||||||||||||
Average contractual exchange rate(1) | 609.86 | |||||||||||||||||||||||||||||||||
Pay Pound sterling/receive Chilean pesos | 14 | — | — | — | — | 14 | ||||||||||||||||||||||||||||
Average contractual rate(1) | 895.72 | |||||||||||||||||||||||||||||||||
Pay Japanese yen/receive Chilean pesos | 102 | — | — | — | — | 102 | ||||||||||||||||||||||||||||
Average contractual exchange rate(1) | 4.37 | |||||||||||||||||||||||||||||||||
Total | Ch$ | 1,183,095 | Ch$ | 5,598 | Ch$ | 11,197 | — | — | Ch$ | 1,199,890 | Ch$ | 1,123,596 | Ch$ | 13,729 | Ch$ | 170 | Ch$ | — | Ch$ | — | Ch$ | 1,137,495 | ||||||||||||
Chilean currency futures | ||||||||||||||||||||||||||||||||||
Purchased: | ||||||||||||||||||||||||||||||||||
Pay UF/receive Chilean pesos | 157,585 | 83,122 | — | — | — | 240,707 | 405,853 | 7,352 | — | — | — | 413,205 | ||||||||||||||||||||||
Average contractual exchange rate(1) | 16,948.13 | 17,317.05 | ||||||||||||||||||||||||||||||||
Average contractual exchange rate(1) | 18,039.67 | 18,380.00 | ||||||||||||||||||||||||||||||||
Total | Ch$ | 157,585 | Ch$ | 83,122 | — | — | — | Ch$ | 240,707 | Ch$ | 405,853 | Ch$ | 7,352 | Ch$ | — | Ch$ | — | Ch$ | — | Ch$ | 413,205 | |||||||||||||
Sold: | ||||||||||||||||||||||||||||||||||
Pay Chilean pesos/receive UF | 88,843 | 17,472 | — | — | — | 106,315 | 309,261 | — | — | — | — | 309,261 | ||||||||||||||||||||||
Average contractual exchange rate(1) | 17,422.88 | 17,472.00 | ||||||||||||||||||||||||||||||||
Average contractual exchange rate(1) | 17,971.33 | |||||||||||||||||||||||||||||||||
Total | Ch$ | 88,843 | Ch$ | 17,472 | — | — | — | Ch$ | 106,315 | Ch$ | 309,261 | Ch$ | — | Ch$ | — | Ch$ | — | Ch$ | — | Ch$ | 309,261 | |||||||||||||
| (1) | The average contractual exchange rate represents the amount of specified currency equal to U.S.$1.00. |
Foreign Operations
We apply the same policies and procedures described above with respect to the New York branch and the Miami branch. The only difference is the participation of their respective general managers on the proposal of limits and flow distribution standards. The manager of the corporate and international division is a permanent member of the finance and international committee. We place particular emphasis on monitoring interest rate risk over the total financial position and market risk of the portfolio of sovereign and corporate bonds maintained by the branches. The New York branch and the Miami branch do not maintain any other positions significant enough to warrant risk calculation. We perform control over the New York branch and the Miami branch individually and on a consolidated basis with the head office in Chile.
Credit Risk for Derivatives
We make use of derivative transactions in the course of business to meet the financial needs of our customers, to generate revenues through our trading activities, and to manage our exposure to fluctuations in interest and currency rates. We use the same credit risk management procedures when entering into derivative transactions as we do for traditional lending products. Our primary counter-parties in derivative transactions are investment-grade financial institutions.
In terms of outstanding exposure to credit risk, the true measure of risk from derivative transactions is the mark-to-market value of the contracts at a point in time (i.e., the cost to replace the contract at the current market rates should the counter-party default prior to the settlement). For most derivative transactions, the notional principal amount does not change hands; it is simply an amount that is used as a reference upon which to calculate payments. While notional principal is the most commonly used volume measure in the derivative and foreign exchange markets, it is not a measure of credit risk. As of December 31, 2004,2005, the credit exposure of our foreign exchange forwards was Ch$71,58934,333 million.
| Item 12. Description of Securities Other than Equity Securities |
Not Applicable.
PART II
| Item 13. Defaults, Dividend Arrearages and Delinquencies |
None
| Item 14. Material Modifications to the Rights of Security Holders and Use of Proceeds |
None.
| Item 15. Controls and Procedures |
We carried out an evaluation under the supervision andhave evaluated, with the participation of our management, including our chief executive officer and chief financial officer, of the effectiveness of the design and operation of our disclosure controls and procedures as of December 31, 2004.2005. There are inherent limitations to the effectiveness of any system of disclosure controls and procedures, including the possibility of human error and the circumvention or overriding of the controls and procedures. Accordingly, even effective disclosure controls and procedures can only provide reasonable assurance of achieving their control objectives. Based upon our evaluation, our chief executive officer and chief financial officer concluded that theour disclosure controls and procedures as of December 31, 2004 were effective to provide reasonable assurance that information required to be disclosed by us in the reports that we file andor submit under the Exchange Act as amended, is recorded, processed, summarized and reported, within the time periods specified in the applicable rules and forms, and that it is accumulated and communicated to our management, including our chief executive officer and chief financial officer, as and when required.appropriate to allow timely decisions regarding required disclosure.
There has been no change in our internal control over financial reporting during 20042005 that has materially affected, or is reasonably likely to materially affect, our internal control over financial reporting.
| Item 16. [Reserved] |
Our board of directors has determined that Mr. Jorge Awad M., a member of our audit committee, qualifies as an “audit committee financial expert” and as independent within the meaning of this Item 16A.
| Item 16B. Code of Ethics |
We have adopted a code of ethics, as defined in Item 16B of Form 20-F under the Exchange Act. Our code of ethics applies to our chief executive officer, chief financial officer, principal accounting officer and persons performing similar functions, as well as to our directors and other employees without exception. Our code of ethics iswas filed as an exhibit to thisour Form 20-F.20-F filed in June 2005.
| Item 16C. Principal Accountant Fees and Services |
Audit and Non-Audit Fees
The following table sets forth the fees billed to us by our independent auditors, Ernst & Young Limitada, during the fiscal years ended December 31, 20032004 and 2004:2005:
| Year ended December 31, | ||||||
| 2003 | 2004 | |||||
| (in millions of constant Ch$ as of December 31, 2004) | ||||||
Audit fees | Ch$ | 401 | Ch$ | 381 | ||
Audit-related fees | 105 | — | ||||
Tax fees | 6 | — | ||||
Other fees | 23 | 10 | ||||
Total fees | Ch$ | 535 | Ch$ | 391 | ||
| Year ended December 31, | ||||||
| 2004 | 2005 | |||||
| (in millions of constant Ch$ as of December 31, 2005) | ||||||
Audit fees | Ch$ | 381 | Ch$ | 447 | ||
Audit-related fees | — | — | ||||
Tax fees | — | 8 | ||||
Other fees | 10 | 5 | ||||
Total fees | Ch$ | 391 | Ch$ | 460 | ||
Audit fees in the above table are the aggregate fees billed by Ernst & Young Limitada in connection with the audit of our annual financial statements. This includes: (i) reviews and advisory services related to filings with the LSE and the Securities and Exchange Commission, (ii) the statutory audit required by local regulations, (iii) the audit of the New York and Miami branches and (iv) the audit of the consolidated financial statements required by Item 18 of formForm 20-F.
Audit-related fees for 2003 in the above table are the aggregate fees billed by Ernst & Young Limitada for: (i) control and attestation reports related to a limited review of internal controls for ten of our branches and (ii) support related to financial accounting and reporting standards and certification pursuant to Section 404 of the Sarbanes-Oxley Act.
Tax fees in the above table are fees billed by Ernst & Young Limitada for tax compliance services, tax consultations and tax planning services.
Other fees in the above table are fees billed by Ernst & Young Limitada primarily related to training services, advisory services in the form of agreed-upon procedures related to computer access controls and compensation research studies for year 2003 and 2004.2005.
Pre-Approval Policies and Procedures
Our audit committee approves all audit, audit-related services, tax services and other services provided by Ernst & Young Limitada. Any services provided by Ernst & Young Limitada that are not specifically included within the scope of the audit must be pre-approved by the audit committee prior to any engagement. These policies and procedures have been in place since May 2003.
| Item 16D. Exemptions from the Listing Standards for Audit Committees |
Not Applicable.
| Item 16E. Purchases of Equity Securities by the Issuer and Affiliated Purchasers |
The following table sets forth certain information concerningWe did not make any purchases by us of our previously issued shares during the fiscal year ended December 31, 2004:
Period | (a) Total Number of Shares Purchased | (b) Average Price Paid (in millions of constant | (c) Total Number of Shares Purchased as Part of Publicly Announced Plans or Programs(1) | (d) Maximum Number (or Approximate Dollar Value) of Shares that May Yet be Purchased under the Plans or Programs | |||||
January (1/1/04 – 1/31/04) | — | — | — | — | |||||
February (2/1/04 – 2/29/04) | — | — | — | — | |||||
March (3/1/04 – 3/31/04) | — | — | — | — | |||||
April (4/1/04 – 4/30/04) | 1,701,994,590 | Ch$ | 31 | 1,701,994,590 | — | ||||
May (5/1/04 – 5/31/04) | — | — | — | — | |||||
June (6/1/04 – 6/30/04) | — | — | — | — | |||||
July (7/1/04 – 7/31/04) | — | — | — | — | |||||
August (8/1/04 – 8/31/04) | — | — | — | — | |||||
September (9/1/04 – 9/30/04) | — | — | — | — | |||||
October (10/1/04 – 10/31/04) | — | — | — | — | |||||
November (11/1/04 – 11/30/04) | — | — | — | — | |||||
December (12/1/04 – 12/31/04) | — | — | — | — | |||||
Total | 1,701,994,590 | Ch$ | 52,761,832,290 | 1,701,994,590 | — | ||||
For more information, see “Item 4. Information on the Company—Business Overview—Share Repurchase Program.”
2005.
| Item 17. Financial Statements |
Our financial statements have been prepared in accordance with Item 18 hereof.
| Item 18. Financial Statements |
Our audited consolidated financial statements are included in this annual report beginning at page F-1.
LIST OF EXHIBITS
| Exhibit No. | Exhibit | |
| 1.1 | Estatutosof Banco de Chile, which serve as our articles of incorporation and bylaws, together with an English | |
| 2.1 | Form of Deposit agreement among Banco de Chile, JPMorgan Chase Bank as depositary, and the holders from time to time of ADSs (incorporated by reference to our registration statement on Form F-4 (File No. 333-14020) filed on October 18, 2001). | |
| 2.2 | Form of Foreign Investment Contract among Banco de A. Edwards, Citibank, N.A. and the Central Bank of Chile relating to the foreign exchange treatment of an investment in ADSs, together with an English translation thereof (incorporated by reference to Banco de A. Edwards’ registration statement on Form F-1 (Registration No. 33-97594) filed on September 29, 1995). | |
| 2.3 | Amendment to Foreign Investment Contract among Banco de Chile (as successor to Banco de A. Edwards), Morgan Guaranty Trust Company of New York and the Central Bank of Chile, dated January 2, 2002, together with an English translation thereof (filed as an exhibit to our annual report on Form 20-F (File No. 001-15266) for the year ended December 31, 2001, and incorporated herein by reference). | |
| 8.1 | List of subsidiaries. | |
| 11.1 | Code of ethics (English translation)(filed as an exhibit to our annual report on Form 20-F (File No. 001-15266) for the year ended December 31, 2004, and incorporated herein by reference). | |
| 12.1 | Certification under Section 302 of the Sarbanes-Oxley Act of 2002. | |
| 12.2 | Certification under Section 302 of the Sarbanes-Oxley Act of 2002. | |
| 13.1 | Certification under Section 906 of the Sarbanes-Oxley Act of 2002. | |
Omitted from the exhibits filed with this annual report are certain instruments and agreements with respect to our long-term debt, none of which authorizes securities in a total amount that exceeds 10% of our total assets. We hereby agree to furnish to the SECSecurities and Exchange Commission copies of any such omitted instruments or agreements as the SECSecurities and Exchange Commission requests.
SIGNATURE
The registrant, Banco de Chile, hereby certifies that it meets all of the requirements for filing on Form 20-F and has duly caused and authorized the undersigned to sign this annual report on its behalf.
BANCO DE CHILE | ||||
| By | /s/ | |||
| Pablo Granifo | |||
| Name: | Pablo Granifo | |||
| Title: | Chief Executive Officer | |||
Date: June 24, 200526, 2006
INDEX TO THE CONSOLIDATED FINANCIAL STATEMENTS
| Page | ||
| F-2 | ||
Consolidated Balance Sheets as of December 31, | F-3 | |
| F-5 | ||
| F-6 | ||
| F-7 | ||
| F-8 | ||
Ch$ | = | Chilean pesos | ||
MCh$ | = | Millions of Chilean pesos | ||
US$ | = | United States dollars | ||
ThUS$ | = | Thousands of United States dollars | ||
UF | = |
Application of Constant Chilean Pesos
The December 31, 20022003 and 20032004 consolidated financial statements have been restated for general price-level changes and expressed in constant Chilean pesos of December 31, 20042005 purchasing power.

 |  |
Report of Independent Registered Public Accounting Firm
To the Board of Directors and Shareholders of
Banco de Chile and Subsidiaries.:
Chile:
We have audited the accompanying consolidated balance sheets of Banco de Chile and subsidiaries (the “Bank”) as of December 31, 20032004 and 20042005 and the related consolidated statements of income, shareholders’equity, and cash flows for each of the three years in the period ended December 31, 2004.2005. These financial statements are the responsibility of the Bank’s management. Our responsibility is to express an opinion on these financial statements based on our audits.
We conducted our audits in accordance with the standards of the Public Company Accounting Oversight Board (United States). Those standards require that we plan and perform the audit to obtain reasonable assurance about whether the financial statements are free of material misstatement. We were not engaged to perform an audit of the Bank’s internal control over financial reporting. Our audits included consideration of internal control over financial reporting as a basis for designing audit procedures that are appropriate in the circumstances, but not for the purpose of expressing an opinion on the effectiveness of the Bank’s internal control over financial reporting. Accordingly, we express no such opinion. An audit also includes examining, on a test basis, evidence supporting the amounts and disclosures in the financial statements. An audit also includes assessing the accounting principles used and significant estimates made by management, and evaluating the overall financial statement presentation. We believe that our audits provide a reasonable basis for our opinion.
In our opinion, the financial statements referred to above present fairly, in all material respects, the consolidated financial position of Banco de Chile and subsidiaries atas of December 31, 20032004 and 20042005 and the consolidated results of their operations and their cash flows for each of the three years in the period ended December 31, 2004,2005, in conformity with accounting principles generally accepted in Chile and regulations issued by the Chilean Superintendency of Banks and Financial Institutions, which differ in certain respect from U.S. generally accepted accounting principles (see Note 28 to the consolidated financial statements).
ERNST & YOUNG LIMITADA
| ERNST & YOUNG LIMITADA |  |

Santiago, Chile, January 31, 2005
| Santiago, | Chile, January 27, 2006 |
(except for Note 28 for which the date is June 3, 2005)1, 2006)
BANCO DE CHILE AND SUBSIDIARIES
CONSOLIDATED BALANCE SHEETS
(Restated for general price-level changes and expressed in millions of constant
Chilean pesos as of December 31, 20042005 and thousands of U.S. dollars)
| As of December 31, | |||||||||||
| NOTE | 2003 | 2004 | 2004 | ||||||||
| MCh$ | MCh$ | ThUS$ (Note 1 (q)) | |||||||||
ASSETS | |||||||||||
CASH AND DUE FROM BANKS | 3 | ||||||||||
Non-interest bearing | 660,180 | 539,637 | 963,930 | ||||||||
Interbank deposits-interest bearing | 218,075 | 350,979 | 626,939 | ||||||||
Total cash and due from banks | 878,255 | 890,616 | 1,590,869 | ||||||||
FINANCIAL INVESTMENTS | 4 | ||||||||||
Government securities | 1,035,505 | 913,656 | 1,632,024 | ||||||||
Investments purchased under agreements to resell | 30,402 | 26,310 | 46,996 | ||||||||
Other financial investments | 469,944 | 320,125 | 571,825 | ||||||||
Investment collateral under agreements to repurchase | 428,381 | 347,182 | 620,156 | ||||||||
Total financial investments | 1,964,232 | 1,607,273 | 2,871,001 | ||||||||
LOANS, NET | 5 | ||||||||||
Commercial loans | 2,708,178 | 2,867,288 | 5,121,712 | ||||||||
Consumer loans | 603,402 | 691,851 | 1,235,823 | ||||||||
Mortgage loans | 1,156,231 | 819,882 | 1,464,520 | ||||||||
Foreign trade loans | 674,737 | 599,051 | 1,070,059 | ||||||||
Interbank loans | 13,554 | 15,198 | 27,148 | ||||||||
Leasing contracts | 6 | 275,680 | 343,853 | 614,210 | |||||||
Other outstanding loans | 452,018 | 936,202 | 1,672,297 | ||||||||
Past due loans | 108,141 | 84,685 | 151,269 | ||||||||
Contingent loans | 419,852 | 530,901 | 948,325 | ||||||||
Allowance for loan losses | 7 | (183,938 | ) | (153,742 | ) | (274,623 | ) | ||||
Total loans, net | 6,227,855 | 6,735,169 | 12,030,740 | ||||||||
OTHER ASSETS | |||||||||||
Bank premises and equipment, net | 8 | 130,949 | 132,670 | 236,983 | |||||||
Investments in other companies | 9 | 5,428 | 5,412 | 9,667 | |||||||
Assets received in lieu of payment, net | 16,018 | 16,130 | 28,812 | ||||||||
Other | 10 (a) | 258,413 | 261,933 | 467,880 | |||||||
Total other assets | 410,808 | 416,145 | 743,342 | ||||||||
TOTAL ASSETS | 9,481,150 | 9,649,203 | 17,235,952 | ||||||||
| As of December 31, | |||||||||||
| NOTE | 2004 | 2005 | 2005 | ||||||||
| MCh$ | MCh$ | ThUS$ (Note 1 (q)) | |||||||||
ASSETS | |||||||||||
| CASH AND DUE FROM BANKS | 3 | ||||||||||
Non-interest bearing | 559,064 | 638,604 | 1,241,913 | ||||||||
Interbank deposits-interest bearing | 363,614 | 20,704 | 40,264 | ||||||||
Total cash and due from banks | 922,678 | 659,308 | 1,282,177 | ||||||||
| FINANCIAL INVESTMENTS | 4 | ||||||||||
Government securities | 946,548 | 611,538 | 1,189,277 | ||||||||
Investments purchased under agreements to resell | 27,257 | 46,695 | 90,809 | ||||||||
Other financial investments | 331,650 | 547,556 | 1,064,849 | ||||||||
Investment collateral under agreements to repurchase | 359,681 | 244,220 | 474,942 | ||||||||
Total financial investments | 1,665,136 | 1,450,009 | 2,819,877 | ||||||||
| LOANS, NET | 5 | ||||||||||
Commercial loans | 2,970,510 | 3,510,902 | 6,827,759 | ||||||||
Consumer loans | 716,758 | 864,144 | 1,680,527 | ||||||||
Mortgage loans | 849,398 | 670,347 | 1,303,644 | ||||||||
Foreign trade loans | 620,617 | 550,770 | 1,071,099 | ||||||||
Interbank loans | 15,745 | 25,012 | 48,642 | ||||||||
Leasing contracts | 6 | 356,232 | 454,805 | 884,473 | |||||||
Other outstanding loans | 969,947 | 1,335,021 | 2,596,256 | ||||||||
Past due loans | 87,734 | 71,349 | 138,755 | ||||||||
Contingent loans | 550,013 | 723,574 | 1,407,157 | ||||||||
Allowance for loan losses | 7 | (159,318 | ) | (141,305 | ) | (274,800 | ) | ||||
Total loans, net | 6,977,636 | 8,064,619 | 15,683,512 | ||||||||
| OTHER ASSETS | |||||||||||
Bank premises and equipment, net | 8 | 137,446 | 142,450 | 277,027 | |||||||
Investments in other companies | 9 | 5,607 | 7,160 | 13,924 | |||||||
Assets received in lieu of payment, net | 16,711 | 10,450 | 20,322 | ||||||||
Other | 10 (a) | 271,361 | 358,765 | 697,702 | |||||||
Total other assets | 431,125 | 518,825 | 1,008,975 | ||||||||
TOTAL ASSETS | 9,996,575 | 10,692,761 | 20,794,541 | ||||||||
The accompanying notes 1 to 30 are an integral part of these consolidated financial statements
BANCO DE CHILE AND SUBSIDIARIES
CONSOLIDATED BALANCE SHEETS
(Restated for general price-level changes and expressed in millions of constant
Chilean pesos as of December 31, 20042005 and thousands of U.S. dollars)
| As of December 31, | ||||||||
| NOTE | 2003 | 2004 | 2004 | |||||
| MCh$ | MCh$ | ThUS$ | ||||||
| (Note 1 (q)) | ||||||||
LIABILITIES AND SHAREHOLDERS’ EQUITY | ||||||||
DEPOSITS | ||||||||
Non-interest bearing | ||||||||
Current accounts | 1,258,574 | 1,424,569 | 2,544,646 | |||||
Bankers’ drafts and other deposits | 680,037 | 697,476 | 1,245,871 | |||||
Total non-interest bearing | 1,938,611 | 2,122,045 | 3,790,517 | |||||
Interest bearing | ||||||||
Savings accounts and time deposits | 3,508,098 | 3,663,682 | 6,544,276 | |||||
Total deposits | 5,446,709 | 5,785,727 | 10,334,793 | |||||
OTHER INTEREST BEARING LIABILITIES | 11 | |||||||
Central Bank credit lines for renegotiations of loans | 3,049 | 1,930 | 3,447 | |||||
Other Central Bank borrowings | 25,529 | 107,643 | 192,278 | |||||
Total Central Bank borrowings | 28,578 | 109,573 | 195,725 | |||||
Investments sold under agreements to repurchase | 437,410 | 349,086 | 623,557 | |||||
Mortgage finance bonds | 1,039,813 | 788,888 | 1,409,156 | |||||
Bonds | 3,205 | 181,515 | 324,232 | |||||
Subordinated bonds | 277,977 | 266,304 | 475,687 | |||||
Borrowings from domestic financial institutions | 51,129 | 26,399 | 47,155 | |||||
Foreign borrowings | 735,918 | 595,548 | 1,063,802 | |||||
Other obligations | 61,090 | 44,847 | 80,108 | |||||
Total other interest bearing liabilities | 2,635,120 | 2,362,160 | 4,219,422 | |||||
OTHER LIABILITIES | ||||||||
Contingent liabilities | 10 (c) | 419,879 | 532,172 | 950,596 | ||||
Other | 10 (b) | 266,369 | 294,610 | 526,250 | ||||
Minority interest | 5 | 1 | 2 | |||||
Total other liabilities | 686,253 | 826,783 | 1,476,848 | |||||
Commitments and contingencies | 22 | |||||||
SHAREHOLDERS’ EQUITY | 15 | |||||||
Capital and reserves | 579,251 | 521,905 | 932,256 | |||||
Net Income for the year | 133,817 | 152,628 | 272,633 | |||||
Total Shareholders’ equity | 713,068 | 674,533 | 1,204,889 | |||||
TOTAL LIABILITIES AND SHAREHOLDERS’ EQUITY | 9,481,150 | 9,649,203 | 17,235,952 | |||||
| As of December 31, | ||||||||
| NOTE | 2004 | 2005 | 2005 | |||||
| MCh$ | MCh$ | ThUS$ (Note 1 (q)) | ||||||
LIABILITIES AND SHAREHOLDERS’ EQUITY | ||||||||
DEPOSITS | ||||||||
Non-interest bearing | ||||||||
Current accounts | 1,475,853 | 1,516,219 | 2,948,638 | |||||
Bankers’ drafts and other deposits | 722,980 | 484,516 | 942,253 | |||||
Total non-interest bearing | 2,198,833 | 2,000,735 | 3,890,891 | |||||
Interest bearing | ||||||||
Savings accounts and time deposits | 3,795,575 | 4,613,253 | 8,971,535 | |||||
Total deposits | 5,994,408 | 6,613,988 | 12,862,426 | |||||
OTHER INTEREST BEARING LIABILITIES | 11 | |||||||
Central Bank credit lines for renegotiations of loans | 1,999 | 1,407 | 2,736 | |||||
Other Central Bank borrowings | 111,518 | — | — | |||||
Total Central Bank borrowings | 113,517 | 1,407 | 2,736 | |||||
Investments sold under agreements to repurchase | 361,653 | 270,750 | 526,536 | |||||
Mortgage finance bonds | 817,288 | 556,504 | 1,082,250 | |||||
Bonds | 188,050 | 324,704 | 631,462 | |||||
Subordinated bonds | 275,891 | 305,284 | 593,695 | |||||
Borrowings from domestic financial institutions | 27,349 | 90,160 | 175,337 | |||||
Foreign borrowings | 616,988 | 661,493 | 1,286,426 | |||||
Other obligations | 46,461 | 33,743 | 65,621 | |||||
Total other interest bearing liabilities | 2,447,197 | 2,244,045 | 4,364,063 | |||||
| OTHER LIABILITIES | ||||||||
Contingent liabilities | 10 (c) | 551,330 | 723,907 | 1,407,804 | ||||
Other | 10 (b) | 304,822 | 335,713 | 652,871 | ||||
Minority interest | 1 | 1 | 2 | |||||
Total other liabilities | 856,153 | 1,059,621 | 2,060,677 | |||||
Commitments and contingencies | 22 | |||||||
| SHAREHOLDERS’ EQUITY | 15 | |||||||
Capital and reserves | 540,694 | 594,383 | 1,155,915 | |||||
Net Income for the year | 158,123 | 180,724 | 351,460 | |||||
Total Shareholders’ equity | 698,817 | 775,107 | 1,507,375 | |||||
TOTAL LIABILITIES AND SHAREHOLDERS’ EQUITY | 9,996,575 | 10,692,761 | 20,794,541 | |||||
The accompanying notes 1 to 30 are an integral part of these consolidated financial statements
BANCO DE CHILE AND SUBSIDIARIES
CONSOLIDATED STATEMENTS OF INCOME
(Restated for general price-level changes and expressed in millions of constant
Chilean pesos as of December 31, 20042005 and thousands of U.S. dollars)
| Years ended December 31, | ||||||||||||||
| NOTE | 2002 | 2003 | 2004 | 2004 | ||||||||||
| MCh$ | MCh$ | MCh$ | ThUS$ (Note 1 (q)) | |||||||||||
INTEREST REVENUE AND EXPENSE | ||||||||||||||
Interest revenue | 714,018 | 439,422 | 543,372 | 970,602 | ||||||||||
Interest expense | (333,472 | ) | (209,340 | ) | (214,900 | ) | (383,867 | ) | ||||||
Net interest revenue | 380,546 | 230,082 | 328,472 | 586,735 | ||||||||||
PROVISION FOR LOAN LOSSES | 7 | (104,192 | ) | (61,612 | ) | (73,512 | ) | (131,311 | ) | |||||
FEES AND INCOME FROM SERVICES | 17 | |||||||||||||
Income from fees and other services | 108,247 | 140,518 | 166,704 | 297,776 | ||||||||||
Other services expenses | (29,514 | ) | (42,267 | ) | (39,862 | ) | (71,204 | ) | ||||||
Total fees and income from services, net | 78,733 | 98,251 | 126,842 | 226,572 | ||||||||||
OTHER OPERATING INCOME (LOSS) | ||||||||||||||
Gains from trading activities | 24,071 | 25,688 | 20,280 | 36,225 | ||||||||||
Losses from trading activities | (22,912 | ) | (20,225 | ) | (23,431 | ) | (41,854 | ) | ||||||
Foreign exchange transactions, net | (32,780 | ) | 93,338 | 17,660 | 31,545 | |||||||||
Total other operating income (loss), net | (31,621 | ) | 98,801 | 14,509 | 25,916 | |||||||||
OTHER INCOME AND EXPENSES | ||||||||||||||
Loan loss recoveries | 19 | 12,334 | 26,026 | 33,736 | 60,261 | |||||||||
Non-operating income | 17 | 6,135 | 5,429 | 4,821 | 8,612 | |||||||||
Non-operating expenses | 17 | (20,920 | ) | (15,963 | ) | (16,558 | ) | (29,576 | ) | |||||
Equity participation in net income (loss) in investments in other companies | 9 | (1,004 | ) | (1,251 | ) | 436 | 779 | |||||||
Minority interest | (1 | ) | (2 | ) | (1 | ) | (2 | ) | ||||||
Total other income and expenses | (3,456 | ) | 14,239 | 22,434 | 40,074 | |||||||||
OPERATING EXPENSES | ||||||||||||||
Personnel salaries and expenses | (138,829 | ) | (128,329 | ) | (136,599 | ) | (244,001 | ) | ||||||
Administrative and other expenses | (95,243 | ) | (81,847 | ) | (87,726 | ) | (156,701 | ) | ||||||
Depreciation and amortization | (22,708 | ) | (17,381 | ) | (15,977 | ) | (28,539 | ) | ||||||
Total operating expenses | (256,780 | ) | (227,557 | ) | (240,302 | ) | (429,241 | ) | ||||||
NET LOSS FROM PRICE-LEVEL RESTATEMENT | 1 (b) | (9,934 | ) | (4,137 | ) | (7,466 | ) | (13,336 | ) | |||||
INCOME BEFORE INCOME TAXES | 53,296 | 148,067 | 170,977 | 305,409 | ||||||||||
INCOME TAXES | 21 | 1,194 | (14,250 | ) | (18,349 | ) | (32,776 | ) | ||||||
NET INCOME | 54,490 | 133,817 | 152,628 | 272,633 | ||||||||||
| Years ended December 31, | ||||||||||||||
| NOTE | 2003 | 2004 | 2005 | 2005 | ||||||||||
| MCh$ | MCh$ | MCh$ | ThUS$ (Note 1 (q)) | |||||||||||
| INTEREST REVENUE AND EXPENSE | ||||||||||||||
Interest revenue | 455,241 | 562,933 | 680,149 | 1,322,707 | ||||||||||
Interest expense | (216,876 | ) | (222,636 | ) | (310,351 | ) | (603,549 | ) | ||||||
Net interest revenue | 238,365 | 340,297 | 369,798 | 719,158 | ||||||||||
PROVISION FOR LOAN LOSSES | 7-19 | (36,867 | ) | (41,208 | ) | (22,028 | ) | (42,838 | ) | |||||
FEES AND INCOME FROM SERVICES | 17 | |||||||||||||
Income from fees and other services | 145,576 | 172,705 | 187,607 | 364,845 | ||||||||||
Other services expenses | (43,789 | ) | (41,297 | ) | (49,814 | ) | (96,875 | ) | ||||||
Total fees and income from services, net | 101,787 | 131,408 | 137,793 | 267,970 | ||||||||||
OTHER OPERATING INCOME (LOSS) | ||||||||||||||
Gains from trading activities | 26,612 | 21,010 | 14,213 | 27,640 | ||||||||||
Losses from trading activities | (20,953 | ) | (24,275 | ) | (10,924 | ) | (21,244 | ) | ||||||
Foreign exchange transactions, net | 96,698 | 18,296 | 7,571 | 14,724 | ||||||||||
Total other operating income (loss), net | 102,357 | 15,031 | 10,860 | 21,120 | ||||||||||
OTHER INCOME AND EXPENSES | ||||||||||||||
Non-operating income | 17 | 5,626 | 4,995 | 7,859 | 15,285 | |||||||||
Non-operating expenses | 17 | (15,861 | ) | (16,483 | ) | (14,934 | ) | (29,043 | ) | |||||
Equity participation in net income (loss) in investments in other companies | 9 | (1,296 | ) | 452 | 681 | 1,324 | ||||||||
Minority interest | (2 | ) | (1 | ) | — | — | ||||||||
Total other income and expenses | (11,533 | ) | (11,037 | ) | (6,394 | ) | (12,434 | ) | ||||||
OPERATING EXPENSES | ||||||||||||||
Personnel salaries and expenses | (132,433 | ) | (140,918 | ) | (150,616 | ) | (292,908 | ) | ||||||
Administrative and other expenses | (85,986 | ) | (92,153 | ) | (108,926 | ) | (211,832 | ) | ||||||
Depreciation and amortization | (18,007 | ) | (16,552 | ) | (16,922 | ) | (32,909 | ) | ||||||
Total operating expenses | (236,426 | ) | (249,623 | ) | (276,464 | ) | (537,649 | ) | ||||||
NET LOSS FROM PRICE-LEVEL RESTATEMENT | 1 (b) | (4,286 | ) | (7,735 | ) | (11,450 | ) | (22,267 | ) | |||||
INCOME BEFORE INCOME TAXES | 153,397 | 177,133 | 202,115 | 393,060 | ||||||||||
INCOME TAXES | 21 | (14,763 | ) | (19,010 | ) | (21,391 | ) | (41,600 | ) | |||||
NET INCOME | 138,634 | 158,123 | 180,724 | 351,460 | ||||||||||
The accompanying notes 1 to 30 are an integral part of these consolidated financial statements
BANCO DE CHILE AND SUBSIDIARIES
CONSOLIDATED STATEMENTS OF CASH FLOWS
(Restated for general price-levelprice - level changes and expressed in millions of constant
Chilean pesos as of December 31, 20042005 and thousands of U.S. dollars)
| Years ended December 31, | ||||||||||||
| 2002 | 2003 | 2004 | 2004 | |||||||||
| MCh$ | MCh$ | MCh$ | ThUS$ | |||||||||
| (Note 1 (n)) | (Note 1 (q)) | |||||||||||
CASH FLOWS FROM OPERATING ACTIVITIES | ||||||||||||
Net income | 54,490 | 133,817 | 152,628 | 272,633 | ||||||||
Items that do not represent cash flows: | ||||||||||||
Depreciation and amortization | 22,708 | 17,381 | 15,977 | 28,539 | ||||||||
Provisions for loan losses | 104,192 | 61,612 | 73,512 | 131,311 | ||||||||
Provisions for assets received in lieu of payment | 2,322 | 1,505 | 889 | 1,588 | ||||||||
Net change in trading investments | 202,000 | (422,642 | ) | 317,956 | 567,951 | |||||||
Equity participation in net (income) loss in investments in other companies | 1,005 | 1,250 | (436 | ) | (779 | ) | ||||||
Net (gain) loss on sales of assets received in lieu of payment | (3,035 | ) | (4,284 | ) | (5,491 | ) | (9,808 | ) | ||||
Net gain on sales of bank premises and equipment | (363 | ) | (451 | ) | (217 | ) | (388 | ) | ||||
Net loss from price-level restatement | 9,934 | 4,137 | 7,466 | 13,336 | ||||||||
Minority interest | 1 | 2 | 1 | 2 | ||||||||
Other charges not representing cash flows | 39,443 | 1,317 | 9,247 | 16,518 | ||||||||
Net change in interest accruals | 162 | 89,271 | 3,272 | 5,845 | ||||||||
NET CASH (USED IN) PROVIDED BY OPERATING ACTIVITIES | 432,859 | (117,085 | ) | 574,804 | 1,026,748 | |||||||
CASH FLOWS FROM INVESTING ACTIVITIES | ||||||||||||
Net (increase) decrease in loans | (152,143 | ) | (122,823 | ) | (501,515 | ) | (895,833 | ) | ||||
Net decrease in investments purchased under agreements to resell | 18,384 | 2,591 | 3,356 | 5,995 | ||||||||
Purchases of bank premises and equipment | (12,420 | ) | (6,975 | ) | (12,310 | ) | (21,989 | ) | ||||
Proceeds from sale of bank premises and equipment | 1,338 | 3,553 | 1,346 | 2,404 | ||||||||
Investments in other companies | (670 | ) | (2,339 | ) | (292 | ) | (522 | ) | ||||
Sale of investments in other companies | — | — | 12 | 21 | ||||||||
Dividends received from investments in other companies | 270 | 559 | 733 | 1,309 | ||||||||
Proceeds from sale of assets received in lieu of payment | 25,727 | 20,649 | 16,712 | 29,852 | ||||||||
Net changes in other assets and liabilities | (139,848 | ) | (65,736 | ) | (150,710 | ) | (269,207 | ) | ||||
NET CASH USED IN INVESTING ACTIVITIES | (259,362 | ) | (170,521 | ) | (642,668 | ) | (1,147,970 | ) | ||||
CASH FLOWS FROM FINANCING ACTIVITIES | ||||||||||||
Net increase in current accounts | 166,841 | 159,586 | 196,694 | 351,346 | ||||||||
Net increase (decrease) in savings accounts and time deposits | (485,228 | ) | (72,060 | ) | 228,955 | 408,972 | ||||||
Net increase in bankers drafts and other deposits | 65,040 | 97,295 | 33,679 | 60,159 | ||||||||
Net increase (decrease) in investments sold under agreements to repurchase | 29,803 | 153,851 | (77,542 | ) | (138,510 | ) | ||||||
Increase in mortgage finance bonds | 127,161 | 312,450 | 134,049 | 239,446 | ||||||||
Repayment of mortgage finance bonds | (195,791 | ) | (338,547 | ) | (318,632 | ) | (569,159 | ) | ||||
Proceeds from bond issues | 11,034 | — | 174,321 | 311,382 | ||||||||
Repayments of bond issues | (11,031 | ) | (9,334 | ) | (9,963 | ) | (17,796 | ) | ||||
Net increase (decrease) in short-tem borrowings | 72,012 | 135,268 | 116,249 | 207,651 | ||||||||
Proceeds from issuance of long-term borrowings | 632,283 | 411,186 | 234,657 | 419,158 | ||||||||
Repayment of long-term borrowings | (581,100 | ) | (322,378 | ) | (430,510 | ) | (769,001 | ) | ||||
Repurchase of shares | — | — | (52,762 | ) | (94,247 | ) | ||||||
Dividends paid | (100,490 | ) | (53,949 | ) | (130,550 | ) | (233,196 | ) | ||||
NET CASH PROVIDED BY (USED IN) FINANCING ACTIVITIES | (269,466 | ) | 473,368 | 98,645 | 176,205 | |||||||
EFFECT OF PRICE-LEVEL RESTATEMENT ON CASH AND DUE FROM BANKS | (26,755 | ) | (7,774 | ) | (18,420 | ) | (32,903 | ) | ||||
NET INCREASE (DECREASE) IN CASH AND DUE FROM BANKS | (122,724 | ) | 177,988 | 12,361 | 22,080 | |||||||
CASH AND DUE FROM BANKS AT BEGINNING OF YEAR | 562,956 | 700,267 | 878,255 | 1,568,789 | ||||||||
CASH ACQUIRED IN MERGER WITH BANCO EDWARDS | 260,035 | — | — | — | ||||||||
CASH AND DUE FROM BANKS AT END OF YEAR | 700,267 | 878,255 | 890,616 | 1,590,869 | ||||||||
SUPPLEMENTAL DISCLOSURE OF CASH FLOW INFORMATION: | ||||||||||||
Cash paid during the year for: | ||||||||||||
Interest paid | 290,829 | 260,823 | 238,769 | 426,502 | ||||||||
Income taxes paid | 29,601 | 28,290 | 32,445 | 57,954 | ||||||||
Non - cash investing transaction during the year for: | ||||||||||||
Issuance of stock for net assets of Banco de A. Edwards, as follows: | ||||||||||||
Cash acquired | 260,035 | — | — | — | ||||||||
Financial investments and loans, net | 2,649,190 | — | — | — | ||||||||
Bank premises and equipment | 63,372 | — | — | — | ||||||||
Other assets | 106,507 | — | — | — | ||||||||
Liabilities | (2,823,861 | ) | — | — | — | |||||||
Sub-Total | 255,243 | — | — | — | ||||||||
Stock issued | (255,243 | ) | — | — | — | |||||||
Total | — | — | — | — | ||||||||
| Years ended December 31, | ||||||||||||
| 2003 | 2004 | 2005 | 2005 | |||||||||
| MCh$ | MCh$ | MCh$ | ThUS$ | |||||||||
| (Note 1 (n)) | (Note 1 (q)) | |||||||||||
CASH FLOWS FROM OPERATING ACTIVITIES | ||||||||||||
Net income | 138,634 | 158,123 | 180,724 | 351,460 | ||||||||
Items that do not represent cash flows: | ||||||||||||
Depreciation and amortization | 18,007 | 16,552 | 16,922 | 32,909 | ||||||||
Provisions for loan losses | 63,830 | 76,158 | 55,014 | 106,987 | ||||||||
Provisions for assets received in lieu of payment | 1,559 | 921 | 574 | 1,116 | ||||||||
Net change in trading investments | (437,857 | ) | 329,402 | 223,380 | 434,414 | |||||||
Equity participation in net (income) loss in investments in other companies | 1,296 | (452 | ) | (681 | ) | (1,324 | ) | |||||
Net gain on sales of assets received in lieu of payment | (4,438 | ) | (5,688 | ) | (5,072 | ) | (9,864 | ) | ||||
Net gain on sales of bank premises and equipment | (467 | ) | (225 | ) | (98 | ) | (191 | ) | ||||
Net loss from price-level restatement | 4,286 | 7,735 | 11,450 | 22,267 | ||||||||
Minority interest | 2 | 1 | — | — | ||||||||
Other charges not representing cash flows | 1,364 | 9,580 | 10,553 | 20,523 | ||||||||
Net change in interest accruals | 92,484 | 3,389 | (61,746 | ) | (120,079 | ) | ||||||
NET CASH (USED IN) PROVIDED BY OPERATING ACTIVITIES | (121,300 | ) | 595,496 | 431,020 | 838,218 | |||||||
CASH FLOWS FROM INVESTING ACTIVITIES | ||||||||||||
| Net increase in loans | (127,245 | ) | (519,570 | ) | (924,220 | ) | (1,797,359 | ) | ||||
Net (increase) decrease in investments purchased under agreements to resell | 2,684 | 3,477 | (20,385 | ) | (39,643 | ) | ||||||
Purchases of bank premises and equipment | (7,226 | ) | (12,753 | ) | (18,272 | ) | (35,534 | ) | ||||
Proceeds from sale of bank premises and equipment | 3,681 | 1,394 | 292 | 568 | ||||||||
Investments in other companies | (2,423 | ) | (303 | ) | (1,665 | ) | (3,238 | ) | ||||
Sale of investments in other companies | — | 12 | 20 | 39 | ||||||||
Dividends received from investments in other companies | 579 | 759 | 560 | 1,089 | ||||||||
Proceeds from sale of assets received in lieu of payment | 21,392 | 17,314 | 14,863 | 28,904 | ||||||||
Net changes in other assets and liabilities | (68,102 | ) | (156,136 | ) | (275,928 | ) | (536,606 | ) | ||||
NET CASH USED IN INVESTING ACTIVITIES | (176,660 | ) | (665,806 | ) | (1,224,735 | ) | (2,381,780 | ) | ||||
CASH FLOWS FROM FINANCING ACTIVITIES | ||||||||||||
Net increase in current accounts | 165,331 | 203,775 | 91,650 | 178,235 | ||||||||
Net increase (decrease) in savings accounts and time deposits | (74,654 | ) | 237,197 | 904,489 | 1,758,988 | |||||||
Net increase (decrease) in bankers drafts and other deposits | 100,798 | 34,891 | (212,819 | ) | (413,876 | ) | ||||||
Net increase (decrease) in investments sold under agreements to repurchase | 159,390 | (80,334 | ) | (78,399 | ) | (152,465 | ) | |||||
Increase in mortgage finance bonds | 323,698 | 138,875 | 510,989 | 993,736 | ||||||||
Repayment of mortgage finance bonds | (350,735 | ) | (330,103 | ) | (716,635 | ) | (1,393,662 | ) | ||||
Proceeds from bond issues | — | 180,597 | 169,286 | 329,216 | ||||||||
Repayments of bond issues | (9,670 | ) | (10,322 | ) | (14,234 | ) | (27,681 | ) | ||||
Net increase (decrease) in short-tem borrowings | 140,138 | 120,434 | (370,978 | ) | (721,452 | ) | ||||||
Proceeds from issuance of long-term borrowings | 425,989 | 243,105 | 708,653 | 1,378,139 | ||||||||
Repayment of long-term borrowings | (333,984 | ) | (446,008 | ) | (328,570 | ) | (638,980 | ) | ||||
Sale of repayment of shares | — | — | 57,637 | 112,088 | ||||||||
Repurchase of shares | — | (54,661 | ) | — | — | |||||||
Dividends paid | (55,891 | ) | (135,250 | ) | (152,623 | ) | (296,811 | ) | ||||
NET CASH PROVIDED BY FINANCING ACTIVITIES | 490,410 | 102,196 | 568,446 | 1,105,475 | ||||||||
EFFECT OF PRICE-LEVEL RESTATEMENT ON CASH AND DUE FROM BANKS | (8,055 | ) | (19,080 | ) | (38,101 | ) | (74,096 | ) | ||||
NET INCREASE (DECREASE) IN CASH AND DUE FROM BANKS | 184,395 | 12,806 | (263,370 | ) | (512,183 | ) | ||||||
CASH AND DUE FROM BANKS AT BEGINNING OF YEAR | 725,477 | 909,872 | 922,678 | 1,794,360 | ||||||||
CASH AND DUE FROM BANKS AT END OF YEAR | 909,872 | 922,678 | 659,308 | 1,282,177 | ||||||||
SUPPLEMENTAL DISCLOSURE OF CASH FLOW INFORMATION: | ||||||||||||
Cash paid during the year for: | ||||||||||||
Interest paid | 270,213 | 247,365 | 284,724 | 553,712 | ||||||||
Income taxes paid | 29,308 | 33,613 | 32,132 | 62,488 | ||||||||
The accompanying notes 1 to 30 are an integral part of these consolidated financial statements
BANCO DE CHILE AND SUBSIDIARIES
CONSOLIDATED STATEMENTS OF CHANGES IN SHAREHOLDERS’ EQUITY
(Restated for general price-levelprice - level changes and expressed in millions of constant
Chilean pesos as of December 31, 20042005 and thousands of U.S. dollars)
| Number of shares | Paid in share capital | Reserves | Other Accounts | Net Income | Total | ||||||||||||
| Millions | MCh$ | MCh$ | MCh$ | MCh$ | MCh$ | ||||||||||||
Balance as of January 1, 2002 | 68,079.8 | 463,813 | 75,929 | 826 | 97,071 | 637,639 | |||||||||||
Transfer to retained earnings | — | — | 3 | — | (3 | ) | — | ||||||||||
Dividends paid (1) | — | — | — | — | (97,068 | ) | (97,068 | ) | |||||||||
Price-level restatement | — | 13,914 | 1,873 | — | — | 15,787 | |||||||||||
Absorption of subsidiaries companies | — | — | (108 | ) | — | — | (108 | ) | |||||||||
Net change in unrealized gains (losses) on permanent financial investments (*) | — | — | — | 7,620 | — | 7,620 | |||||||||||
Net adjustment for translation differences | — | — | — | 1,725 | — | 1,725 | |||||||||||
Net Income for the year | — | — | — | — | 52,635 | 52,635 | |||||||||||
Balance as of December 31, 2002 | 68,079.8 | 477,727 | 77,697 | 10,171 | 52,635 | 618,230 | |||||||||||
Balance as of December 31, 2002 restated in constant Chilean pesos as of December 31, 2004 | — | 494,566 | 80,436 | 10,530 | 54,490 | 640,022 | |||||||||||
Balance as of January 1, 2003 | 68,079.8 | 477,727 | 77,697 | 10,171 | 52,635 | 618,230 | |||||||||||
Transfer to retained earnings | — | — | 3 | — | (3 | ) | — | ||||||||||
Dividends paid (2) | — | — | — | — | (52,632 | ) | (52,632 | ) | |||||||||
Price-level restatement | — | 4,777 | 1,041 | — | — | 5,818 | |||||||||||
Net change in unrealized gains (losses) on permanent financial investments (*) | — | — | — | (2,617 | ) | — | (2,617 | ) | |||||||||
Net adjustment for translation differences | — | — | — | (3,676 | ) | — | (3,676 | ) | |||||||||
Net Income for the year | — | — | — | — | 130,553 | 130,553 | |||||||||||
Balance as of December 31, 2003 | 68,079.8 | 482,504 | 78,741 | 3,878 | 130,553 | 695,676 | |||||||||||
Balance as of December 31, 2003 restated in constant Chilean pesos as of December 31, 2004 | — | 494,566 | 80,710 | 3,975 | 133,817 | 713,068 | |||||||||||
Balance as of January 1, 2004 | 68,079.8 | 482,504 | 78,741 | 3,878 | 130,553 | 695,676 | |||||||||||
Transfer to retained earnings | — | — | 3 | — | (3 | ) | — | ||||||||||
Dividends paid (3) | — | — | — | — | (130,550 | ) | (130,550 | ) | |||||||||
Common stock repurchased (4) | (1,702.0 | ) | — | (52,762 | ) | — | — | (52,762 | ) | ||||||||
Price-level restatement | — | 12,062 | (75 | ) | — | — | 11,987 | ||||||||||
Net change in unrealized gains (losses) on permanent financial investments (*) | — | — | — | (195 | ) | — | (195 | ) | |||||||||
Net adjustment for translation differences | — | — | — | (2,251 | ) | — | (2,251 | ) | |||||||||
Net Income for the year | — | — | — | — | 152,628 | 152,628 | |||||||||||
Balance as of December 31, 2004 | 66,377.8 | 494,566 | 25,907 | 1,432 | 152,628 | 674,533 | |||||||||||
Number of shares | Paid in share capital | Reserves | Other Accounts | Net Income | Total | ||||||||||||
| Millions | MCh$ | MCh$ | MCh$ | MCh$ | MCh$ | ||||||||||||
Balance as of January 1, 2003 | 68,079.8 | 477,727 | 77,697 | 10,171 | 52,635 | 618,230 | |||||||||||
Transfer to retained earnings | — | — | 3 | — | (3 | ) | — | ||||||||||
Dividends paid (1) | — | — | — | — | (52,632 | ) | (52,632 | ) | |||||||||
Price-level restatement | — | 4,777 | 1,041 | — | — | 5,818 | |||||||||||
Net change in unrealized gains (losses) on permanent financial investments (*) | — | — | — | (2,617 | ) | — | (2,617 | ) | |||||||||
Net adjustment for translation differences | — | — | — | (3,676 | ) | — | (3,676 | ) | |||||||||
Net Income for the year | — | — | — | — | 130,553 | 130,553 | |||||||||||
Balance as of December 31, 2003 | 68,079.8 | 482,504 | 78,741 | 3,878 | 130,553 | 695,676 | |||||||||||
Balance as of December 31, 2003 restated in constant Chilean pesos as of December 31, 2005 | 512,370 | 83,615 | 4,119 | 138,634 | 738,738 | ||||||||||||
Balance as of January 1, 2004 | 68,079.8 | 482,504 | 78,741 | 3,878 | 130,553 | 695,676 | |||||||||||
Transfer to retained earnings | — | — | 3 | — | (3 | ) | — | ||||||||||
Dividends paid (2) | — | — | — | — | (130,550 | ) | (130,550 | ) | |||||||||
Common stock repurchased (3) | (1,702.0 | ) | — | (52,762 | ) | — | — | (52,762 | ) | ||||||||
Price-level restatement | — | 12,062 | (75 | ) | — | — | 11,987 | ||||||||||
Net change in unrealized gains (losses) on permanent financial investments (*) | — | — | — | (195 | ) | — | (195 | ) | |||||||||
Net adjustment for translation differences | — | — | — | (2,251 | ) | — | (2,251 | ) | |||||||||
Net Income for the year | — | — | — | — | 152,628 | 152,628 | |||||||||||
Balance as of December 31, 2004 | 66,377.8 | 494,566 | 25,907 | 1,432 | 152,628 | 674,533 | |||||||||||
Balance as of December 31, 2004 restated in constant Chilean pesos as of December 31, 2005 | 512,370 | 26,840 | 1,484 | 158,123 | 698,817 | ||||||||||||
Balance as of January 1, 2005 | 66,377.8 | 494,566 | 25,907 | 1,432 | 152,628 | 674,533 | |||||||||||
Transfer to retained earnings | — | — | 5 | — | (5 | ) | — | ||||||||||
Dividends paid (4) | — | — | — | — | (152,623 | ) | (152,623 | ) | |||||||||
Placement of shares (5) | 1,702.0 | — | 57,637 | — | — | 57,637 | |||||||||||
Accumulated deficit development period (6) | — | — | (188 | ) | — | — | (188 | ) | |||||||||
Price-level restatement | — | 17,804 | 523 | — | — | 18,327 | |||||||||||
Net change in unrealized gains (losses) on permanent financial investments (*) | — | — | — | (74 | ) | — | (74 | ) | |||||||||
Net adjustment for translation differences | — | — | — | (3,229 | ) | — | (3,229 | ) | |||||||||
Net Income for the year | — | — | — | — | 180,724 | 180,724 | |||||||||||
Balance as of December 31, 2005 | 68,079.8 | 512,370 | 83,884 | (1,871 | ) | 180,724 | 775,107 | ||||||||||
| (1) |
| On March 20, 2003, the Ordinary General Shareholders’ Meeting agreed to distribute a dividend for a total of MCh$ 52,632 (in historical pesos). |
| On March 18, 2004, the Ordinary General Shareholders’ Meeting agreed to distribute a dividend for a total of MCh$ 130,550 (in historical pesos). |
| (4) | On March 18, 2005, the Ordinary General Shareholders’ Meeting agreed to distribute a dividend for a total of MCh$ 152,623 (in historical pesos). |
| (5) | During the period from May to August 2005, Banco de Chile sold 1,701,994,590 shares issued by Banco de Chile that had been repurchased as part of its Share Repurchase Program in April 2004, for a total amount of MCh$57,637 (in historical pesos). |
| (6) | Relates to the recognition of the variation in the shareholders’ equity of “Administrador Financiero de Transantiago S.A.”, a banking support company, during its development period. |
| (*) | These balances are presented net of the deferred taxes originated from adjustments to the market value of the permanent investment portfolio. |
The accompanying notes 1 to 30 are an integral part of these consolidated financial statements
BANCO DE CHILE AND SUBSIDIARIES
NOTES TO THE CONSOLIDATED FINANCIAL STATEMENTS
(Restated for general price - level changes and expressed in millions of constant
Chilean pesos as of December 31, 2004)2005)
1. Summary of Significant Accounting Policies
(a) Basis of presentation
Banco de Chile (“Banco de ChileChile” or the “Bank”) is a corporation organized under the laws of the Republic of Chile, which is regulated by the Chilean Superintendencia de Bancos e Instituciones Financieras (the “Superintendency of Banks and Financial Institutions”). Starting inSince 2001, Banco de Chile ishas been regulated by the United States Securities and Exchange Commission (“SEC”), as the BankBanco de Chile is listed on the New York Stock Exchange (“NYSE”) through its American Depository Receipt (ADR)(“ADR”) program, which is also registered withlisted on the London Stock Exchange. Banco de Chile’s shares are also listed on the Latinamerican securities market of the Madrid Stock Exchange to be traded on the Latinamerican securities market (“LATIBEX”).
Banco de Chile offers a broad range of banking services to customers ranging from individuals to large corporations. The services are managed in the following segment areassegments for internal reporting purposes: large corporate banking, middlewholesale, retail market, corporate banking, retail and personal banking services, international banking services and treasury banking services. The Bank’streasury. Banco de Chile’s subsidiaries provide other services including securities brokerage, mutual fund management, factoring, securitization activities, insurance brokerage and financial advisory services.
The accompanying consolidated financial statements have been prepared in accordance with generally accepted accounting principles in Chile and regulations of the Superintendency of Banks. For the convenience of the reader, the consolidated financial statements have been translated into English, certain reclassifications have been made and certain subtotals and clarifying account descriptions have been added.
The preparation of financial statements in conformity with generally accepted accounting principles requires management to make estimates and assumptions that affect the reported amounts of assets and liabilities, disclosure of contingent assets and liabilities at the date of the financial statements and the reported amounts of revenues and expenses during the reporting period.periods. Actual results could differ from those estimates. In certain cases generally accepted accounting principles require that assets or liabilities be recorded or disclosed at their fair values. The fair value is the amount at which an asset could be bought or sold or in the case of a liability could be incurred or settled in a current transaction between willing parties, other than in a forced or liquidation sale. Where quoted markets are not available, the BankBanco de Chile has estimated such values based on the best information available, including using modeling and other valuation techniques.
The consolidated financial statements include the financial position and results of operations of Banco de Chile and its majority-owned subsidiaries. All significant intercompany transactions and balances have been eliminated in the consolidation. The majority-owned subsidiaries of Banco de Chile as of December 31, 20032004 and 20042005 are as follows:
Subsidiary | Interest Owned % | |||||||||||||||||||||||
| 2003 | 2004 | |||||||||||||||||||||||
| Interest Owned % | ||||||||||||||||||||||||
Subsidiary | Direct | Indirect | Total | Direct | Indirect | Total | Direct | 2004 Indirect | Total | Direct | 2005 Indirect | Total | ||||||||||||
| — | — | — | 100.00 | — | 100.00 | 100.00 | — | 100.00 | 100.00 | — | 100.00 | |||||||||||||
| 99.98 | 0.02 | 100.00 | 99.98 | 0.02 | 100.00 | 99.98 | 0.02 | 100.00 | 99.98 | 0.02 | 100.00 | |||||||||||||
Banchile Asesoría Financiera S.A. | 99.94 | — | 99.94 | 99.94 | — | 99.94 | 99.94 | — | 99.94 | 99.94 | — | 99.94 | ||||||||||||
Banchile Corredores de Seguros Ltda. | 99.75 | 0.25 | 100.00 | 99.75 | 0.25 | 100.00 | 99.75 | 0.25 | 100.00 | 99.75 | 0.25 | 100.00 | ||||||||||||
Banchile Corredores de Bolsa S.A. | 99.68 | 0.31 | 99.99 | 99.68 | 0.32 | 100.00 | 99.68 | 0.32 | 100.00 | 99.68 | 0.32 | 100.00 | ||||||||||||
Banchile Factoring S.A. | 99.52 | 0.48 | 100.00 | 99.52 | 0.48 | 100.00 | 99.52 | 0.48 | 100.00 | 99.52 | 0.48 | 100.00 | ||||||||||||
Banchile Securitizadora S.A. | 99.00 | 1.00 | 100.00 | 99.00 | 1.00 | 100.00 | 99.00 | 1.00 | 100.00 | 99.00 | 1.00 | 100.00 | ||||||||||||
Socofin S.A. | 99.00 | 1.00 | 100.00 | 99.00 | 1.00 | 100.00 | 99.00 | 1.00 | 100.00 | 99.00 | 1.00 | 100.00 | ||||||||||||
Promarket S.A. | 99.00 | 1.00 | 100.00 | 99.00 | 1.00 | 100.00 | 99.00 | 1.00 | 100.00 | 99.00 | 1.00 | 100.00 | ||||||||||||
BANCO DE CHILE AND SUBSIDIARIES
NOTES TO THE CONSOLIDATED FINANCIAL STATEMENTS (Continued)
(Restated for general price - level changes and expressed in millions of constant
Chilean pesos as of December 31, 2004)2005)
1. Summary of Significant Accounting Policies (continued)
(b) Price-level restatement
The consolidated financial statements are prepared on the basis of general price-level accounting in order to reflect the effect of changes in the purchasing power of the Chilean peso for the BankBanco de Chile and its Chilean subsidiaries during each year. At the end of each reporting period, the consolidated financial statements are stated in terms of the general purchasing power of the Chilean peso using changes in the Chilean consumer price index (“CPI”) as determined by the Chilean National Institute of Statistics as follows:
Year | Change in Index | |
2002 | 3.5% | |
2003 | 2.5% |
Year | Change in Index | ||
2003 | 2.5 | % | |
2004 | 3.6 | % |
The general price-level restatements are calculated using the CPI, and are based on the “prior month rule”, in which the inflation adjustments are based on the CPI at the close of the month preceding the close of the respective period or transaction. The CPI is considered by the business community, the accounting profession, and the Chilean government to be the index that most closely complies with the technical requirement to reflect the variation in the general level of prices in the country and, consequently, is widely used for financial reporting purposes in Chile.
The values of the CPI used for price-level restatement purposes are as follows:
Year | Index (*) | Change in Index | Index (*) | Change in Index | ||||
2002 | 113.36 | 3.0% | ||||||
2003 | 114.44 | 1.0% | 114.44 | 1.0 | ||||
2004 | 117.28 | 2.5% | 117.28 | 2.5 | ||||
2005 | 121.53 | 3.6 | ||||||
| * | Index as of November 30, of each year under prior month rule described above. |
BANCO DE CHILE AND SUBSIDIARIES
NOTES TO THE CONSOLIDATED FINANCIAL STATEMENTS (Continued)
(Restated for general price - level changes and expressed in millions of constant
Chilean pesos as of December 31, 2004)2005)
1. Summary of Significant Accounting Policies (continued)
(b) Price-level restatement (continued)
The price-level adjusted consolidated financial statements do not purport to represent appraised values, replacement cost, or any other current value of assets at which transactions would take place currently and are only intended to restate all non-monetary financial statement components in terms of local currency of a single purchasing power and to include in the net result for each year the gain or loss in purchasing power arising from the holding of monetary assets and liabilities exposed to the effects of inflation.
The net charge to income for price-level restatement is comprised of the following restatements of non-monetary assets and liabilities. These figures are expressed in constant Chilean pesos of December 31, 2004.2005.
| Year ended December 31, | |||||||||
| 2002 | 2003 | 2004 | |||||||
| MCh$ | MCh$ | MCh$ | |||||||
Shareholders’ equity | (16,344 | ) | (5,964 | ) | (11,987 | ) | |||
Bank premises and equipment | 4,688 | 1,264 | 3,019 | ||||||
Investment in other companies | 1,037 | 381 | 1,036 | ||||||
Other, net | 685 | 182 | 466 | ||||||
Net loss from price-level restatement | (9,934 | ) | (4,137 | ) | (7,466 | ) | |||
| Year ended December 31, | |||||||||
| 2003 | 2004 | 2005 | |||||||
| MCh$ | MCh$ | MCh$ | |||||||
Shareholders’ equity | (6,179 | ) | (12,419 | ) | (18,327 | ) | |||
Bank premises and equipment | 1,310 | 3,128 | 4,673 | ||||||
Investment in other companies | 395 | 1,073 | 2,188 | ||||||
Other, net | 188 | 483 | 16 | ||||||
Net loss from price-level restatement | (4,286 | ) | (7,735 | ) | (11,450 | ) | |||
(c) Index-linked assets and liabilities
Certain of the Bank’sBanco de Chile’s interest-bearing assets and liabilities are denominated in index-linked units of account.
The principal index-linked unit used in Chile is the Unidad de Fomento (“UF”), a unit of account, which changes daily to reflect changes in the CPI. The carrying amounts of such assets and liabilities change with the respective changes in the UF and serve to offset the monetary gains or losses from holding such assets and liabilities. As the Bank’sBanco de Chile’s UF-denominated assets exceed its UF-denominated liabilities, any increase in the Chilean CPI results in a net gain on indexation. Values for the UF are as follows (historical Chilean pesos per UF).
December 31, | Ch$ | |
2002 | 16,744.12 | |
2003 | 16,920.00 | |
2004 | 17,317.05 |
December 31, | Ch$ | |
2003 | 16,920.00 | |
2004 | 17,317.05 | |
2005 | 17,974.81 |
The UF daily indexation adjustments from the 10th day of the month in question to the 9th day of the subsequent month are determined based on the previous month’s changes in the Chilean CPI. The effect of changes in the UF index on interest earning assets and interest bearing liabilities is reflected in the income statement as an increase or decrease in interest income or expense.
(d) Interest revenue and expense recognition
Interest revenue and expense are recognized on an accrual basis using the effective interest method. Loans, investments and liabilities are stated at their cost, adjusted for accrued interest and the indexation adjustment applicable to such balances that are index-linked.
The BankBanco de Chile suspends the accrual of interest and readjustments on loans when there is a high risk of unrecoverability or from the first day in which they become overdue. Accrued interest up to the suspension date remains on the Bank’sBanco de Chile’s assets and is considered a part of the loan balance when determining the allowance for loan losses. Payments received on past due loans are recognized as income, after reducing the balance of accrued interest, if applicable.
BANCO DE CHILE AND SUBSIDIARIES
NOTES TO THE CONSOLIDATED FINANCIAL STATEMENTS (Continued)
(Restated for general price - level changes and expressed in millions of constant
Chilean pesos as of December 31, 2004)2005)
1. Summary of Significant Accounting Policies (continued)
(e) Foreign currency and derivative activities
The BankBanco de Chile and its subsidiaries protect themselves against variations in the foreign exchange market by using forward contracts, currency forwardfutures contracts, currency swaps and interest rates swaps. These activities include hedging and treasury operations and help the BankBanco de Chile and its subsidiaries provide capital marketsfinancial products to their clients.
Forward contracts are valued at the exchange rate prevailing as of the close of each month and, in accordance with regulations of the Superintendency of Banks and Financial Institutions, the initial differences produced by this type of operation are recognized as deferred assets or liabilities and are amortized over the durationterm of the respective contract. In addition to the aforementioned forward contracts, the BankBanco de Chile and its subsidiaries have currency futures contracts. TheseAbove mentioned contracts are valued at the daily observed exchange rate and resulting gains or losses are charged to income on an accrual basis.basis in the line item “Foreign exchange transactions, net”.
Banco de Chile’s interest rate swap agreements are treated as off-balance-sheet financial instruments . The interest rate and currency swap contracts are valued at the close of each month in accordance with the agreed-upon interest and currency exchange rates, recording the differences as a credit or charge to income.income in the line item “Foreign exchange transactions, net”. Additionally, the BankBanco de Chile and its subsidiaries charge to incomerecords, in the line item “Gains or Loss from trading activities”, the adjustment to market value of the swap contract portfolio whichthat is used to hedge interest rate and foreign currency risks.
The amount of net gains and losses on foreign exchange includes the recognition of the effects that variations in the exchange rates have on assets and liabilities denominated in foreign currencies and their gains or losses on foreign exchange spot and forward transactionsderivative instruments undertaken by the Bank.Banco de Chile. The results of such foreign exchange transactions undertaken by the BankBanco de Chile and its subsidiaries are included as other non-operating income (for gross gains) and other non-operating expenses (for gross losses).
The Bank’s interest rate swap agreements are treated as off-balance-sheet financial instruments and the net interest effect, which corresponds to the difference between interest income and interest expense arising from such agreements, is recorded in net income in the period that such differences originate, except for interest rate and cross currency swaps designated as a hedge of the foreign investment portfolio, which are recorded at their estimated fair market values.
line item “Foreign exchange transactions, net”.
(f) Financial investments
Financial investments traded on a secondary market are shown adjusted to market value, following specific instructions from the Superintendency of Banks and Financial Institutions. These instructions require that such adjustments be recognized against income, except in the case of the investment portfolio classified as permanent which mayshould be recorded directly in the equity account, “Change in unrealized gains (losses) on permanent financial investments”.
The application of this adjustment generated net unrealized gains in income of MCh$ 16,121 and a net unrealized loss in incomelosses of MCh$ 10,48310,860, MCh$ 743 and MCh$ 717,3,251, in 2002, 2003, 2004 and 20042005 respectively, which was included in operating income under “Gains (losses) from trading activities”. The adjustment of the permanent investment portfolio was a net credit of MCh$ 9,403, a net debit of MCh$ 3,1903,305, MCh$ 244 and MCh$ 235,89, in 2002, 2003, 2004 and 2004,2005, respectively, which is presenteddisclosed in equity net of taxes.
The BankBanco de Chile and its subsidiaries enter into security repurchase agreements as a form of borrowing. The Bank’sBanco de Chile’s investments that are sold subject to a repurchase obligation and that serve as collateral for borrowings are reclassified as “Investment collateral under agreements to repurchase”. The liability to repurchase the investment is classified as “Investments sold under agreements to repurchase”, which is valued in accordance with the agreed-upon interest rate.
The BankBanco de Chile and its subsidiaries also enter into resale agreements as a form of investment. Under these agreements the BankBanco de Chile and its subsidiaries purchases securities, which are included as assets under the caption “Investments purchased under agreements to resell”, which are valued in accordance with the agreed-upon interest rate.
BANCO DE CHILE AND SUBSIDIARIES
NOTES TO THE CONSOLIDATED FINANCIAL STATEMENTS (Continued)
(Restated for general price - level changes and expressed in millions of constant
Chilean pesos as of December 31, 2004)2005)
1. Summary of Significant Accounting Policies (continued)
(g) Bank premises and equipment
Bank premises and equipment are stated at acquisition cost net of accumulated depreciation and have been restated for price-level changes. Depreciation is calculated using the straight-line method over the estimated useful lives of the underlying assets. Maintenance and repair costs are charged to income. The cost of significant renovations and improvements is capitalized.
Property, plant and equipment | Estimated Useful Life | |
Land and buildings | 5-80 | |
Furniture and fixtures | 3-10 | |
Machinery and equipment | 2-10 | |
Vehicles | 5 | |
Other equipment | 6-8 |
(h) Leasing contracts
The BankBanco de Chile leases certain property that meets the criteria for direct financing leases. At the time of entering into a direct financing lease transaction, Banco de Chile records the Bank recordsaggregate of the minimum lease paymentspayment receivable asless unearned income. Generally, the lessee acquires the leased asset by remitting all lease payments due. There are no significant residual values assumed by the Bank.Banco de Chile. Unearned income represents the excess of the minimum lease payments receivable plus any estimated residual value over the cost of the property acquired.
Unearned income is recognized in such a manner as to produce a constant periodic rate of return on the net investment in the direct financing lease. The net investment in financing leases is classified as “leasing contracts” in the accompanying consolidated balance sheets.
(i) Factoring transactions
The BankBanco de Chile and its subsidiary Banchile Factoring S.A. carry out factoring transactions, with their customers, by means of which they receive invoices and other commercial instruments representative of credit, with or without recourse, and they advance to the assignerassignor a percentage of the total amounts to be collected from the original debtor.
The caption “Other outstanding loans” includes MCh$197,365 310,479 (MCh$101,683 204,470 in 2003)2004), corresponding to the amount advanced to the assigner plus accrued interest net of payments received.
(j) Investments in other companies
Shares or rights in other companies whichthat are integral to the operations of the BankBanco de Chile and where the BankBanco de Chile holds a less than majority interest but has significant influence over the operating activities of the invested are accounted for under the equity method. Other minority investments are carried at cost restated for price-level changes.
BANCO DE CHILE AND SUBSIDIARIES
NOTES TO THE CONSOLIDATED FINANCIAL STATEMENTS (Continued)
(Restated for general price - level changes and expressed in millions of constant
Chilean pesos as of December 31, 2004)2005)
1. Summary of Significant Accounting Policies (continued)
(k) Intangibles
In accordance with instructions from the Superintendency of Banks and Financial Institutions, intangible assets are classified in “Other Assets”. Both investments in software and licenses to use trademarks are valued at price-level restated cost and amortized using the straight-line method over their useful lives. The amortization period of the investments in software cannot exceed six years.
As of December 31, 2004,2005, intangible assets amount to MCh$11,08514,292 (MCh$5,45911,485 in 2003)2004), corresponding to investments in software and MCh$5 (MCh$ 2 (MCh$5 in 2003)2004) corresponding to payments for licenses to use trademarks.
(l) Allowance for loan losses
The loans granted and acquired by the BankBanco de Chile and its subsidiaries are initially recorded at cost (i.e. the original amount loaned). After this initial recording, the loans are valued at their amortized cost and presenteddisclosed net of allowances for loan losses.
Beginning on January 1, 2004, inIn accordance with Circular No. 3,246regulations of the Superintendency of Banks and Financial Institutions, the Bank,Banco de Chile, its subsidiaries and foreign branches are required to apply newutilize models and methods, based on an individual and group analysis of the debtors, to constitute the allowances for loan losses.
An individual analysis of debtors is applied to individuals or companies with whom, due to size, complexity or level of exposure with the entity, the Bank is required to have an in-depth understanding of their financial condition.Banco de Chile must be completely familiar. Likewise, it requires assigning a risk category to each debtor and its respective loans. This risk category should contemplateconsider the following factors: industry or sector, partners, management and administration, financial situation, conductbehavior and payment capacity.
One of the following categories must be assigned to each debtor and its loans after the analysis has been finalized:
| i. | Categories A1, A2 and A3 correspond to debtors without significant risks, whose payment capacity will continue to be positive even if unfavorable business, economic or financial situations should arise. |
| ii. | Category B corresponds to debtors that present some risk, but that do not show any sign of impairment. However, these debtors might stop paying some of |
| iii. | Categories C1, C2, C3, C4, D1 and D2 correspond to debtors with insufficient payment capacity. |
In order to determine allowances for loan losses classified as A1, A2, A3 and B, the BankBanco de Chile uses percentages approved by its Board of Directors. Allowance for debtors classified as C1, C2, C3, C4, D1 and D2 were determined, in conformity with new regulations, as follows:
Category | Range of estimated loss | Allowance | |||
C1 | Up to 3% | % | |||
C2 | More than 3% up to 19% | % | |||
C3 | More than 19% up to 29% | % | |||
C4 | More than 29% up to 49% | % | |||
D1 | More than 49% up to 79% | % | |||
D2 | More than 79% | % |
BANCO DE CHILE AND SUBSIDIARIES
NOTES TO THE CONSOLIDATED FINANCIAL STATEMENTS (Continued)
(Restated for general price - level changes and expressed in millions of constant
Chilean pesos as of December 31, 2004)2005)
1. Summary of Significant Accounting Policies (continued)
(l) Allowance for loan losses (continued)
The group analysis is used to analyze a large number of operations whose individual amounts are not significant.significant and present similar risk characteristics. For this analysis, the BankBanco de Chile uses models based on attributes of the debtors and their loans, and on the behavior of a group of loans. In the group evaluations, the allowances are always constituted in accordance with the estimated loss using the aforementioned models.
In conformity with regulations of the Superintendency of Banks and Financial Institutions, the BankBanco de Chile has constituted additional allowances for its individually evaluated loan portfolio, taking into consideration the estimated credit lossexpected impairment of this portfolio. The calculation of this allowance is performed based on the Bank’sBanco de Chile’s historical experience and considering possible future adverse macroeconomic conditions or circumstances that could affect a certain sector, industry, or groups of debtors or projects.
Loans are written-off when the collection efforts have been exhausted but not later than the maximum periods prescribed by the Superintendency of Banks, which are as follows:
- 24 months past due (3(6 months past due for consumer loans) for loans without collateral.
- 36 months past due for loans with collateral.
Cash recoveries on written-off loans including loans whichthat were reacquired from the Central Bank of Chile, recorded in memorandum accounts (see Note 19), are recorded directly to income.income, as a reduction of the “Provision for loan losses” item.
Previous Guidelines
Prior to 2004, the global loan loss allowance was calculated by multiplying the Bank’sBanco de Chile’s outstanding loans by the greater of its “risk index” or 0.75%. The Bank’sBanco de Chile’s risk index calculation was based upon a classification of a portion of its customers’ outstanding loans into five categories based upon risk of loss for commercial loans and overdue status for consumer and residential mortgage loans. The classifications for risk index calculation purposes must have included the largest commercial loans and represent at least 75% of the commercial loan portfolio, and 100% of consumer and residential mortgage loans. Commercial and consumer loans are classified based on risk in categories denominated A, B, B -, C or D, while residential mortgage loans are classified only as A, B or B-. The total exposure of the BankBanco de Chile to each of its customers and the classification of such customer’s loans are continuously reviewed by the commercial officers of the bankBanco de Chile and by the risk control risk division. The provisionsallowances required for each category of loans, which were established by the Chilean Superintendency of Banks, were as follows:
BANCO DE CHILE AND SUBSIDIARIES
NOTES TO THE CONSOLIDATED FINANCIAL STATEMENTS (Continued)
(Restated for general price - level changes and expressed in millions of constant
Chilean pesos as of December 31, 2004)2005)
1. Summary of Significant Accounting Policies (continued)
(l) Allowance for loan losses (continued)
Category | Provisions as a percentage of aggregate exposure | ||||
A | 0 | ||||
B | 1 | ||||
B- | 20 | ||||
C | 60 | ||||
D | 90 |
The resulting weighted average allowance rate was the risk index utilized in the calculation of the global loan loss reserve.
Once a loan became overdue for more than 90 days, a specific allowance was calculated for 100% of the uncollateralized portion of the loan. Individual loan loss reserves are required only to the extent that, in the aggregate, they exceed the global loan loss reserve.
Prior to 2004, the BankBanco de Chile made a provision for voluntary allowances in addition to those required by the rules of the Superintendency of Banks. Such voluntary reserves were established to cover additional risks inherent in the portfolio.
(m) Income taxes
Effects of deferred income taxes are recorded in conformity with Technical Bulletin No. 60 and its related amendments, issued by the Chilean Association of Accountants (see Note 21).
The income tax provision is determined based on current Chilean tax legislation.
(n) Consolidated statements of cash flows
For purposes of reporting cash flows, cash and cash equivalents include cash and due from banks. For the years ended December 31, 2002, 2003, 2004 and 20042005 the consolidated statement of cash flows has been prepared in accordance with Technical Bulletin No.65 of the Chilean Association of Accountants.
(o) Staff severance indemnities
The BankBanco de Chile has recorded a liability for long-term severance indemnities in accordance with employment contracts it has with certain employees. The liability, which is payable to specified retiring employees with more than 30 years of service, is recorded at the present value of the accrued benefits, which are calculated by applying a real discount rate to the benefit accrued as of year-end over the estimated average remaining service period. For the years ended December 31, 2002, 2003, 2004 and 2004,2005, the obligation has been discounted using the real interest rate of 7%, 7% and 6% per annum.
BANCO DE CHILE AND SUBSIDIARIES
NOTES TO THE CONSOLIDATED FINANCIAL STATEMENTS (Continued)
(Restated for general price - level changes and expressed in millions of constant
Chilean pesos as of December 31, 2004)2005)
1. Summary of Significant Accounting Policies (continued)
(p) Fees and expenses related to loans and services
FeesLoan origination fees and expenses relatedare considered to loansbe adjustments to loan yield and services are deferred and recognized inamortized as interest income over the term of the loan. Fees and expenses related to other financial products, including contingent loans, are generally deferred and recognized as income over the term of the products to which they relate,relate. Fees related to financial advisory and to the period that theother services are performed.
recognized on an accrual basis at the time services are provided.
(q) Convenience translation to U.S. dollars
The BankBanco de Chile maintains its accounting records and prepares its consolidated financial statements in Chilean pesos. The U.S. dollar amounts disclosed in the accompanying financial statements are presented solely for the convenience of the reader at the observed exchange rate for December 31, 20042005 of Ch$ 559.83514.21 per US$1.00. This translation should not be construed as representing that the Chilean peso amounts actually represent or have been, or could be, converted into U.S. dollars at such a rate or, any other rate.
(r) Translation of financial statements of the Bank’sBanco de Chile’s foreign branches and subsidiaries
The BankBanco de Chile translates the accounting records of its branches in New York and Miami, USA and its subsidiary Banchile Trade Services Limited, Hong Kong to Chilean pesos from US dollars in accordance with guidelines established by the Superintendency of Banks and Financial Institutions whichthat are consistent with Technical Bulletin No. 64, “Accounting for investments abroad”, issued by the Chilean Association of Accountants. All income statement and balance sheet amounts are translated into Chilean pesos as of the exchange rate in effect as of the applicable balance sheet date. Under this standard the foreign investment recorded in the parent company’s books is price-level restated, the effects of which are reflected in income, while any foreign exchange gains or losses between the Chilean peso and the US dollar, net of the effects of Chilean inflation, is recorded in shareholders’ equity in the account “Other equity accounts”.
(s) Reclassifications
Certain minor reclassifications have been made to balances in the 20022003 and 20032004 financial statements in order to conform withto the 20042005 presentation.
(t) Assets received in lieu of payment
Assets received in lieu of payment are recorded at restated cost less regulatory charge-offs and presented net of a globalportfolio valuation allowance. Regulatory charge-offs are required by theThe Superintendency of Banks and Financial Institutions requires regulatory charge-offs if the asset is not sold within one year of foreclosure. As instructed by the Superintendency of Banks and Financial Institutions, charge-offs are recorded on a straight-line basis over the following 12 month period.
2. Changes in Accounting Principles
During 2005, there have not been accounting changes that may significantly affect these consolidated financial statements.
BANCO DE CHILE AND SUBSIDIARIES
NOTES TO THE CONSOLIDATED FINANCIAL STATEMENTS (Continued)
(Restated for general price - level changes and expressed in millions of constant
Chilean pesos as of December 31, 2004)2005)
2. Changes in Accounting Principles
On January 1, 2004, in accordance with Circular No. 3,246 of the Superintendency of Banks and Financial Institutions, the new standards on determination of Loan Loss Provisions established in Chapter 7-10 of this Superintendency’s accounting rules became effective. Application of this new criterion for determining provisions did not have a significant effect on the financial situation of the Bank and its subsidiaries presented in these consolidated financial statements. In addition, the Bank redesignated the voluntary provisions recorded as of December 31, 2003 to the additional provisions category in conformity with the new regulations.
3. Cash and Due from Banks
Included in cash and due from banks are amounts maintained by the BankBanco de Chile with various foreign and local banks, including the Chilean Central Bank (“Central Bank”).
In accordance with guidelines established by the Superintendency of Banks, the BankBanco de Chile must maintain certain non-interest bearing balances in its account with the Central Bank. The required balances are based upon specified financial criteria, including the level of the Bank’sBanco de Chile’s deposits, the amounts of its foreign borrowings and its average liabilities. These restricted cash amounts totaled MCh$ 167,839189,258 and MCh$ 164,500203,456 as of December 31, 20032004 and 2004,2005, respectively.
4. Financial Investments
A summary of financial investments is as follows:
| As of December 31, | Weighted Average December 31, 2005 % | |||||
| 2004 | 2005 | |||||
| MCh$ | MCh$ | |||||
Central Bank and Government Securities | ||||||
Central Bank debt securities | 936,268 | 592,531 | 3.34 | |||
Chilean government securities | 10,280 | 19,007 | 5.66 | |||
Investments purchased under agreements to resell | 27,257 | 46,695 | 4.32 | |||
Investment collateral under agreements to repurchase | 176,101 | 90,011 | 4.34 | |||
Subtotal | 1,149,906 | 748,244 | 3.58 | |||
Corporate Securities and Other Financial Investments | ||||||
Investments in Chilean financial institutions | 44,758 | 74,189 | 4.21 | |||
Foreign government notes | 29,317 | 37,357 | 2.97 | |||
Investments in foreign countries | 142,231 | 315,578 | 4.21 | |||
Other financial investments | 115,344 | 120,432 | 6.23 | |||
Investments collateral under agreements to repurchase | 183,580 | 154,209 | 5.55 | |||
Subtotal | 515,230 | 701,765 | 4.79 | |||
Total | 1,665,136 | 1,450,009 | 4.16 | |||
Financial investments are classified at the time of the purchase, based on management’s intentions, as either trading or permanent. The related amounts are as follows:
| As of December 31, | ||||
| 2004 | 2005 | |||
| MCh$ | MCh$ | |||
Permanent(*) | 45,723 | 38,952 | ||
Trading | 1,619,413 | 1,411,057 | ||
Total | 1,665,136 | 1,450,009 | ||
| (*) | Includes non-transferable financial instruments of MCh$17,365 and MCh$15,363 as of December 31, 2004 and 2005, respectively. |
BANCO DE CHILE AND SUBSIDIARIES
NOTES TO THE CONSOLIDATED FINANCIAL STATEMENTS (Continued)
(Restated for general price - level changes and expressed in millions of constant
Chilean pesos as of December 31, 2004)2005)
4. Financial Investments
A summary of financial investments is as follows:
| As of December 31, | Weighted Average Nominal Rate as of December 31, 2004 | |||||
| 2003 | 2004 | |||||
| MCh$ | MCh$ | % | ||||
Central Bank and Government Securities | ||||||
Marketable debt securities | 992,611 | 903,733 | 2.83 | |||
Chilean government securities | 42,894 | 9,923 | 4.21 | |||
Investments purchased under agreements to resell | 30,402 | 26,310 | 2.47 | |||
Investment collateral under agreements to repurchase | 332,690 | 169,982 | 5.15 | |||
Subtotal | 1,398,597 | 1,109,948 | 3.19 | |||
Corporate Securities and Other Financial Investments | ||||||
Investments in Chilean financial institutions | 135,244 | 43,203 | 4.66 | |||
Foreign government notes | 34,453 | 28,298 | 2.16 | |||
Investments in foreign countries | 191,223 | 137,288 | 3.36 | |||
Other financial investments | 109,024 | 111,336 | 6.85 | |||
Investments collateral under agreements to repurchase | 95,691 | 177,200 | 7.47 | |||
Subtotal | 565,635 | 497,325 | 5.65 | |||
Total | 1,964,232 | 1,607,273 | 3.95 | |||
Financial investments are classified at the time of the purchase, based on management’s intentions, as either trading or permanent. The related amounts are as follows:
| As of December 31, | ||||
| 2003 | 2004 | |||
| MCh$ | MCh$ | |||
Permanent | 42,981 | 44,134 | ||
Trading | 1,921,251 | 1,563,139 | ||
Total | 1,964,232 | 1,607,273 | ||
BANCO DE CHILE AND SUBSIDIARIES
NOTES TO THE CONSOLIDATED FINANCIAL STATEMENTS (Continued)
(Restated for general price - level changes and expressed in millions of constant
Chilean pesos as of December 31, 2004)
5. Loans
The loans included in the accompanying consolidated balance sheets are segregated into subcategories as described below:
Commercial loans are short-term and long-term loans granted to companies or businesses, at variable or fixed interest rates in order to finance working capital or investments.
Consumer loans are loans to individuals granted principally in Chilean pesos or UF, generally on a fixed rate basis, to finance the purchase of consumer goods or to pay for services. Credit card balances subject to interest charges are also included in this category.
Mortgage loans are inflation indexed, fixed rate, long-term loans with monthly payments of principal and interest collateralized by a real propertystate mortgage. These loans are financed through the issuance of mortgage finance bonds. At the time of its issuance the amount of a mortgage loan cannot be more than 75% of the value of the property.
Foreign trade loans are variable or fixed rate, short-term loans granted in foreign currencies (principally(mainly U.S. dollars) to finance imports and exports.
Interbank loans are fixed rate, short-term loans to financial institutions that operate in Chile.
Leasing contracts are agreements for financing leases of capital equipment and other property.
Other outstanding loans principally include bills of exchange, other mortgage loans, which are financed by the Bank’sBanco de Chile’s general borrowings and factoring.
Past due loans represent loans or shares of loans that are overdue as to any payment of principal or interest by 90 days or more.
Contingent loansconsist of open and unused letters of credit together with guarantees granted by the BankBanco de Chile in Ch$, UF and foreign currencies (principally(mainly U.S. dollars).
The following table summarizes the most significant loan concentrations expressed as a percentage of total loans, excluding contingent loans and before allowance for loan losses:
| As of December 31, | ||||
| 2003 | 2004 | |||
| % | % | |||
Financial Services | 18.83 | 19.91 | ||
Residential mortgage loans | 19.03 | 20.10 | ||
Manufacturing | 10.46 | 10.22 | ||
Commerce | 12.11 | 11.82 | ||
Agriculture, livestock, forestry, agribusiness, fishing | 8.10 | 7.85 | ||
Consumer loans | 12.49 | 13.81 | ||
| As of December 31, | ||||
| 2004 | 2005 | |||
| % | % | |||
Financial Services | 19.93 | 19.22 | ||
Residential mortgage loans | 20.09 | 17.99 | ||
Manufacturing | 10.19 | 8.90 | ||
Commerce | 11.82 | 9.75 | ||
Agriculture, livestock, forestry, agribusiness, fishing | 7.85 | 5.48 | ||
Consumer loans | 13.81 | 11.63 | ||
Substantial portions of the Bank’sBanco de Chile’s loans are to borrowers doing business in Chile.
BANCO DE CHILE AND SUBSIDIARIES
NOTES TO THE CONSOLIDATED FINANCIAL STATEMENTS (Continued)
(Restated for general price - level changes and expressed in millions of constant
Chilean pesos as of December 31, 2004)2005)
6. Leasing Contracts
The Bank’sBanco de Chile’s scheduled cash flows to be received from leasing contracts have the following maturities as of December 31, 2004:2005:
| As of December 31, 2004 | |||||||
Maturity | Total Receivable | Unearned Income | Net lease Receivable | ||||
| MCh$ | MCh$ | MCh$ | |||||
Due within one year | 108,447 | (17,152 | ) | 91,295 | |||
Due after 1 year but within 2 years | 77,945 | (13,035 | ) | 64,910 | |||
Due after 2 years but within 3 years | 58,970 | (9,730 | ) | 49,240 | |||
Due after 3 years but within 4 years | 42,880 | (7,336 | ) | 35,544 | |||
Due after 4 years but within 5 years | 35,533 | (5,413 | ) | 30,120 | |||
Due after 5 years | 85,489 | (12,745 | ) | 72,744 | |||
Total leasing contracts | 409,264 | (65,411 | ) | 343,853 | |||
| As of December 31, 2005 | |||||||
Maturity | Total Receivable | Unearned Income | Net lease Receivable | ||||
| MCh$ | MCh$ | MCh$ | |||||
Due within one year | 147,793 | (21,446 | ) | 126,347 | |||
Due after 1 year but within 2 years | 111,951 | (15,844 | ) | 96,107 | |||
Due after 2 years but within 3 years | 79,854 | (11,439 | ) | 68,415 | |||
Due after 3 years but within 4 years | 58,085 | (8,293 | ) | 49,792 | |||
Due after 4 years but within 5 years | 36,540 | (6,033 | ) | 30,507 | |||
Due after 5 years | 97,245 | (13,608 | ) | 83,637 | |||
Total leasing contracts | 531,468 | (76,663 | ) | 454,805 | |||
Leased assets consist principally of real estate, industrial machinery, vehicle, and computer equipment. The allowance for uncollectible lease receivable was MCh$ 5,8615,856 as of December 31, 20042005 (MCh$ 8,4806,072 as of December 31, 2003)2004), which forms part of the allowance for loan losses.
7. Allowance for Loan Losses
The changes in the allowance for loan losses for the periods indicated are as follows:
| 2002 | 2003 | 2004 | 2003 | 2004 | 2005 | |||||||||||||
| MCh$ | MCh$ | MCh$ | MCh$ | MCh$ | MCh$ | |||||||||||||
Balance as of January 1, | 241,002 | 223,678 | 183,938 | 231,731 | 190,559 | 159,318 | ||||||||||||
Price-level restatement (1) | (6,660 | ) | (2,817 | ) | (4,608 | ) | (2,920 | ) | (4,773 | ) | (5,684 | ) | ||||||
Charge-offs | (114,856 | ) | (98,535 | ) | (99,100 | ) | (102,082 | ) | (102,626 | ) | (67,343 | ) | ||||||
Provisions established | 129,538 | 63,103 | 75,069 | 65,375 | 77,771 | 56,606 | ||||||||||||
Provisions released | (25,346 | ) | (1,491 | ) | (1,557 | ) | (1,545 | ) | (1,613 | ) | (1,592 | ) | ||||||
Balance as of December 31, | 223,678 | 183,938 | 153,742 | 190,559 | 159,318 | 141,305 | ||||||||||||
| (1) | Reflects the effect of both inflation and exchange rate changes of foreign branches and |
The provisions for loan losses included in the results of operations for the periods indicated is as follows:
| Years ended December 31, | Years ended December 31, | |||||||||||||||||
| 2002 | 2003 | 2004 | 2003 | 2004 | 2005 | |||||||||||||
| MCh$ | MCh$ | MCh$ | MCh$ | MCh$ | MCh$ | |||||||||||||
Provisions established | 129,538 | 63,103 | 75,069 | 65,375 | 77,771 | 56,606 | ||||||||||||
Provisions released | (25,346 | ) | (1,491 | ) | (1,557 | ) | (1,545 | ) | (1,613 | ) | (1,592 | ) | ||||||
Loan loss recoveries | (26,963 | ) | (34,950 | ) | (32,986 | ) | ||||||||||||
Net charges to income | 104,192 | 61,612 | 73,512 | 36,867 | 41,208 | 22,028 | ||||||||||||
BANCO DE CHILE AND SUBSIDIARIES
NOTES TO THE CONSOLIDATED FINANCIAL STATEMENTS (Continued)
(Restated for general price - level changes and expressed in millions of constant
Chilean pesos as of December 31, 2004)2005)
8. Bank Premises and Equipment, net
The major categories of Bank premises and equipment net of accumulated depreciation are as follows:
| As of December 31, | ||||
| 2003 | 2004 | |||
| MCh$ | MCh$ | |||
Land and buildings | 95,013 | 92,141 | ||
Machinery and equipment | 27,400 | 31,945 | ||
Furniture and fixtures | 5,676 | 5,347 | ||
Vehicles | 641 | 812 | ||
Others | 2,219 | 2,425 | ||
Bank premises and equipment, net | 130,949 | 132,670 | ||
| As of December 31, | ||||
| 2004 | 2005 | |||
| MCh$ | MCh$ | |||
Land and buildings | 95,458 | 95,611 | ||
Machinery and equipment | 33,095 | 38,559 | ||
Furniture and fixtures | 5,539 | 5,186 | ||
Vehicles | 841 | 835 | ||
Others | 2,513 | 2,259 | ||
Bank premises and equipment, net | 137,446 | 142,450 | ||
In accordance with rules of the Superintendency of Banks, Bank premises and equipment are presented net of accumulated depreciation.
9. Investments in other companies
As of December 31, 2002, 2003, 2004 and 2004,2005, investments in other companies and the Bank’sBanco de Chile’s participation in suchthose companies’ results of operations for each of the periods indicated, consist of the following:
| As of and for the years ended December 31, | ||||||||||||||||||
| 2002 | 2003 | 2004 | Ownership | |||||||||||||||
| Investment | Income (Loss) | Investment | Income (Loss) | Investment | Income (Loss) | Interest 2004 | ||||||||||||
| MCh$ | MCh$ | MCh$ | MCh$ | MCh$ | MCh$ | % | ||||||||||||
Soc. Operadora de Tarjetas de Crédito Nexus S.A. | 905 | 49 | 1,011 | 146 | 1,066 | 172 | 25.81 | |||||||||||
Servipag Ltda. | 741 | 52 | 831 | 90 | 984 | 152 | 50.00 | |||||||||||
Redbanc S.A. | 903 | 157 | 1,046 | 298 | 884 | 138 | 25.42 | |||||||||||
Transbank S.A. | 864 | 132 | 867 | 132 | 865 | 132 | 17.44 | |||||||||||
Bolsa de Comercio de Santiago (Stock Exchange) | 659 | 96 | 559 | 90 | 558 | 90 | 4.17 | |||||||||||
Soc. Operadora Cámara Compensación de Pagos Alto Valor S.A. (1) | — | — | — | — | 276 | (17 | ) | 18.16 | ||||||||||
Sociedad Interbancaria de Depósito de Valores S.A. | 251 | 44 | 244 | 37 | 217 | 34 | 17.60 | |||||||||||
Centro de Compensación Automatizado S.A. (CCA S.A.) | 158 | 12 | 204 | 45 | 189 | 31 | 33.33 | |||||||||||
Bolsa de Valores de Chile (Stock Exchange) | 126 | 1 | 127 | 1 | 130 | 3 | 5.00 | |||||||||||
Artikos Chile S.A (2). | (71 | ) | (1,287 | ) | 208 | (2,046 | ) | 43 | (165 | ) | 50.00 | |||||||
Empresa de Tarjetas Inteligentes S.A. | 161 | (150 | ) | 117 | (44 | ) | — | (134 | ) | 26.67 | ||||||||
Total investments in other companies accounted for under the equity method | 4,697 | (894 | ) | 5,214 | (1,251 | ) | 5,212 | 436 | ||||||||||
Other investments carried at cost | 248 | (110 | ) | 214 | — | 200 | — | |||||||||||
Total investments in other companies | 4,945 | (1,004 | ) | 5,428 | (1,251 | ) | 5,412 | 436 | ||||||||||
| As of and for the years ended December 31, | |||||||||||||||||
| 2003 | 2004 | 2005 | Ownership Interest 2005 | ||||||||||||||
| Investment | Income (Loss) | Investment | Income (Loss) | Investment | Income (Loss) | ||||||||||||
| MCh$ | MCh$ | MCh$ | MCh$ | MCh$ | MCh$ | % | |||||||||||
Administrador Financiero de Transantiago S.A.(1) | — | — | — | — | 1,270 | 70 | 20.00 | ||||||||||
Servipag Ltda. | 861 | 93 | 1,019 | 158 | 1,231 | 211 | 50.00 | ||||||||||
Soc. Operadora de Tarjetas de Crédito Nexus S.A. | 1,047 | 151 | 1,104 | 178 | 1,144 | 182 | 25.81 | ||||||||||
Redbanc S.A. | 1,084 | 309 | 916 | 143 | 912 | 139 | 25.42 | ||||||||||
Transbank S.A. | 898 | 137 | 896 | 137 | 896 | 138 | 17.44 | ||||||||||
Bolsa de Comercio de Santiago (Stock Exchange) | 579 | 93 | 578 | 94 | 585 | 103 | 4.17 | ||||||||||
Soc. Operadora Cámara Compensación de Pagos de Alto Valor S.A. (2) | — | — | 286 | (18 | ) | 281 | (6 | ) | 11.66 | ||||||||
Centro de Compensación Automatizado S.A. (CCA S.A.) | 211 | 47 | 196 | 32 | 213 | 34 | 33.33 | ||||||||||
Sociedad Interbancaria de Depósito de Valores S.A. | 253 | 38 | 225 | 35 | 182 | 34 | 17.60 | ||||||||||
Bolsa de Valores de Chile (Stock Exchange) | 132 | 1 | 135 | 3 | 141 | 7 | 5.00 | ||||||||||
Artikos Chile S.A (3). | 215 | (2,120 | ) | 45 | (171 | ) | 118 | (183 | ) | 50.00 | |||||||
Empresa de Tarjetas Inteligentes S.A.(4) | 121 | (46 | ) | — | (139 | ) | — | (48 | ) | — | |||||||
Total investments in other companies accounted for under the equity method | 5,401 | (1,297 | ) | 5,400 | 452 | 6,973 | 681 | ||||||||||
Other investments carried at cost | 223 | 1 | 207 | — | 187 | — | |||||||||||
Total investments in other companies | 5,624 | (1,296 | ) | 5,607 | 452 | 7,160 | 681 | ||||||||||
| (1) | On June 8, 2005, as agreed by the Board of Directors of Banco de Chile at meeting No. 2,599, held on May 12, 2005, Banco de Chile subscribed and paid 200,000 shares, for a value of MCh$1,352 (in historical pesos), for this company’s capital, for the formation of an Banking Support Company to the line of business called “Administrador Financiero de Transantiago S.A.”. |
| (2) | On September 23, 2004, a banking support company, |
| (3) | On June 2, 2005, as agreed by the Board of Directors of Banco de Chile at meeting No. 2,599, held on May 12, 2005, Banco de Chile subscribed and paid MCh$250 (in historical pesos) for a capital increase at “Artikos Chile S.A.”. |
On May 19, 2003, the Extraordinary General Shareholders’ meeting of Artikos S.A. agreed to increase Artikos S.A.’s capital issuing 10,000 shares. On June 2, 2003, Banco de Chile subscribed and paid for 5,000 shares for a value of MCh$ 2,339 (in historical pesos).
BANCO DE CHILE AND SUBSIDIARIES NOTES TO THE CONSOLIDATED FINANCIAL STATEMENTS (Continued) (Restated for general price - level changes and expressed in millions of constant Chilean pesos as of December 31, 10. Other Assets and Other Liabilities (a) Other assets
(b) Other liabilities
BANCO DE CHILE AND SUBSIDIARIES NOTES TO THE CONSOLIDATED FINANCIAL STATEMENTS (Continued) (Restated for general price - level changes and expressed in millions of constant Chilean pesos as of December 31, 10. Other Assets and Other Liabilities (continued) (c) Contingent Liabilities Contingent liabilities consist of open and unused letters of credit, together with guarantees granted by 11. Other Interest Bearing Liabilities
(a) Central Bank borrowings Central Bank borrowings include credit lines for the renegotiation of loans and other Central Bank borrowings. Credit lines were provided by the Central Bank for the renegotiation of mortgage loans due to the need to refinance debts as a result of the economic recession and crisis of the Chilean banking system from 1982 to 1985. The credit lines for the renegotiations of mortgage loans are linked to the UF index and carry a real annual interest rate of
BANCO DE CHILE AND SUBSIDIARIES NOTES TO THE CONSOLIDATED FINANCIAL STATEMENTS (Continued) (Restated for general price - level changes and expressed in millions of constant Chilean pesos as of December 31, 11. Other Interest Bearing Liabilities (continued) (b) Mortgage finance bonds These bonds are used to finance the granting of mortgage loans. The outstanding principal amounts of the bonds are amortized on a quarterly basis. The range of maturities of these bonds is between five and twenty years. The bonds are linked to the UF index and carry a weighted average annual rate of interest of 2005. The maturities of outstanding mortgage bond amounts as of December 31,
(c) Bonds The maturities of outstanding
Bonds are linked to the UF Index and carried an average real annual interest rate of (d) Subordinated bonds In 2002 BANCO DE CHILE AND SUBSIDIARIES NOTES TO THE CONSOLIDATED FINANCIAL STATEMENTS (Continued) (Restated for general price - level changes and expressed in millions of constant Chilean pesos as of December 31, 11. Other Interest Bearing Liabilities (continued) (d) Subordinated bonds (continued) The 6.5% Bonds are intended for the financing of loans having a maturity of greater than one year. As of December 31,
Subordinated bonds are considered in the calculation of “effective equity” for the purpose of determining (e) Borrowings from domestic financial institutions Borrowings from domestic financial institutions are used to fund
BANCO DE CHILE AND SUBSIDIARIES NOTES TO THE CONSOLIDATED FINANCIAL STATEMENTS (Continued) (Restated for general price - level changes and expressed in millions of constant Chilean pesos as of December 31, 11. Other Interest Bearing Liabilities (continued) (f) Foreign borrowings
Each of these loans is denominated in foreign currency and is principally used to fund our foreign trade loans and carry an average annual nominal interest rate of 1.40% as of December 31, 2005. The syndicated loan’s interest rate is composed of a three month U.S.D. LIBO rate, plus 0.23%. (g) Other obligations
As of December 31, 2005, other obligations had the following maturities:
BANCO DE CHILE AND SUBSIDIARIES NOTES TO THE CONSOLIDATED FINANCIAL STATEMENTS (Continued) (Restated for general price - level changes and expressed in millions of constant Chilean pesos as of December 31, 12. Obligations Arising From Lease Commitments
The rental expense on the premises was MCh$ 13. Derivative Financial Instruments (a) Derivative activities
(b) Market risk and risk management activities All derivative instruments are subject to market risk. This is defined as the risk that future changes in market conditions may make an investment more or less valuable.
The Central Bank requires that foreign exchange forward contracts be made only in U.S. dollars and other major foreign currencies. In the case of BANCO DE CHILE AND SUBSIDIARIES NOTES TO THE CONSOLIDATED FINANCIAL STATEMENTS (Continued) (Restated for general price - level changes and expressed in millions of constant Chilean pesos as of December 31, 13. Derivative Financial Instruments (continued) (b) Market risk and risk management activities (continued) The notional amounts of these contracts as of December 31,
The amounts refer to United States dollar amounts purchased or sold, or the equivalent in United States dollars of the foreign currency purchased or sold or the future amount, or the amount on which interest rate contracts are agreed. The period refers to the contract maturity from the date of the transaction. (c) Contracts on the value of authorized readjustment systems and on interest rates in Chilean currency
(d) Options As of December 31 of each year, the balances for this type of transaction are as follows:
BANCO DE CHILE AND SUBSIDIARIES NOTES TO THE CONSOLIDATED FINANCIAL STATEMENTS (Continued) (Restated for general price - level changes and expressed in millions of constant Chilean pesos as of December 31, 13. Derivative Financial Instruments (continued) (e) Fair value of traded instruments The table below sets forth the estimated fair value of derivative financial instruments held or issued by the Bank for trading purposes as of December 31, 2004 and 2005.
For those instruments held by the Bank where no quoted market prices are available, fair values have been estimated using modeling and other valuation techniques. 14. Minimum Regulatory Capital Requirements In accordance with the Chilean Banking Law, Chilean Banks are required to maintain a minimum equity level of UF800,000, equivalent to MCh$
BANCO DE CHILE AND SUBSIDIARIES NOTES TO THE CONSOLIDATED FINANCIAL STATEMENTS (Continued) (Restated for general price - level changes and expressed in millions of constant Chilean pesos as of December 31, 15. Shareholders’ Equity Dividends Dividends are declared and paid during the year subsequent to that in which the related net income was earned. Dividends declared and paid in 2003, 2004 and 2005 in constant Chilean pesos of December 31, 2005 are as follows:
16.Transactions with Related Parties In accordance with the rules of the Superintendency of Banks, related parties are defined as individuals or companies who are directors, officers, or shareholders who own more than 1% of Entities in which a director, officer or shareholder of (a) Loans granted to related parties Loans to related parties, all of which are current, are as follows:
The activity in the balances of loans to related parties are as follows:
BANCO DE CHILE AND SUBSIDIARIES NOTES TO THE CONSOLIDATED FINANCIAL STATEMENTS (Continued) (Restated for general price - level changes and expressed in millions of constant Chilean pesos as of December 31, 16. Transactions with Related Parties (continued) (b) Other transactions with related During the years ended December 31,
These expense and revenue items are for services received and rendered by BANCO DE CHILE AND SUBSIDIARIES NOTES TO THE CONSOLIDATED FINANCIAL STATEMENTS (Continued) (Restated for general price - level changes and expressed in millions of constant Chilean pesos as of December 31, 17. Fees and income from services and non-operating income and expenses
NOTES TO THE CONSOLIDATED FINANCIAL STATEMENTS (Continued) (Restated for general price - level changes and expressed in millions of constant Chilean pesos as of December 31, 18. Board of Directors Compensation As agreed at the Shareholders Meeting, during
19. Loan Loss Recoveries
Recovery of loans BANCO DE CHILE AND SUBSIDIARIES NOTES TO THE CONSOLIDATED FINANCIAL STATEMENTS (Continued) (Restated for general price - level changes and expressed in millions of constant Chilean pesos as of December 31, 20. Foreign Currency Position The consolidated balance sheets include assets and liabilities denominated in foreign currencies, which have been translated to Chilean pesos at the Observed Exchange Rates as of December 31,
BANCO DE CHILE AND SUBSIDIARIES NOTES TO THE CONSOLIDATED FINANCIAL STATEMENTS (Continued) (Restated for general price - level changes and expressed in millions of constant Chilean pesos as of December 31, 21. Income Taxes
As described in these accounting standards, beginning January 1, 1999,
BANCO DE CHILE AND SUBSIDIARIES NOTES TO THE CONSOLIDATED FINANCIAL STATEMENTS (Continued) (Restated for general price - level changes and expressed in millions of constant Chilean pesos as of December 31, 21. Income Taxes (continued) “Income taxes” as presented in the Consolidated Statements of Income for the years ended December 31,
22. Commitments and contingencies (a) Legal contingencies In the ordinary course of business, (b) Commitments
(c) Other contingencies
Banco de Chile rejects the BANCO DE CHILE AND SUBSIDIARIES NOTES TO THE CONSOLIDATED FINANCIAL STATEMENTS (Continued) (Restated for general price - level changes and expressed in millions of constant Chilean pesos as of December 31, 23. Fiduciary Activities The following items are recorded in memorandum accounts by
24. Concentrations of Credit Risk Concentrations of credit risk (whether on or off-balance sheet) arising from financial instruments exist in relation to certain groups of customers. A group concentration arises when a number of parties have similar economic characteristics that would cause their ability to meet contractual obligations to be similarly affected by changes in economic or other conditions. Counterparty risk
BANCO DE CHILE AND SUBSIDIARIES NOTES TO THE CONSOLIDATED FINANCIAL STATEMENTS (Continued) (Restated for general price - level changes and expressed in millions of constant Chilean pesos as of December 31, 25. Sales and Purchases of Loans From time to time, The aggregate gains on sales of loans were MCh$ 26. Maturity of Assets and Liabilities The maturity dates of assets and liabilities are shown in the following table including accrued interest as of December 31,
BANCO DE CHILE AND SUBSIDIARIES NOTES TO THE CONSOLIDATED FINANCIAL STATEMENTS (Continued) (Restated for general price - level changes and expressed in millions of constant Chilean pesos as of December 31, 27. Subsequent Events
In the opinion of Bank’s Management, as of the date in which these consolidated financial statements were issued there are no other significant subsequent events that affect or that could affect the consolidated financial statements of 2005. 28. Differences between Chilean and United States Generally Accepted Accounting Principles The following is a description of the significant quantitative differences between accounting principles as prescribed by the Superintendency of Banks and accounting principles generally accepted in Chile (collectively “Chilean GAAP”), and accounting principles generally accepted in the United States of America (“U.S. GAAP”). References below to “SFAS” are to United States Statements of Financial Accounting Standards. Pursuant to Chilean GAAP, the Bank’s financial statements recognize certain effects of inflation. In addition, the Bank translates the accounting records of its branch in New York, USA, its agency in Miami, USA and its subsidiary Banchile Trade Services Limited in Hong Kong to Chilean pesos from US dollars in accordance with guidelines established by the Superintendency of Banks, which are consistent with Technical Bulletin Nº64, “Accounting for investments Abroad”, issued by the Chilean Association of Accountants. In the opinion of the Bank, this foreign currency translation methodology forms part of the comprehensive basis of preparation of price-level adjusted financial statements required by Chilean GAAP. Inclusion of inflation and the effects of translation in the accompanying consolidated financial statements under the Chilean accounting standards in the financial statements is considered appropriate under the inflationary conditions that have historically affected the Chilean economy even though the cumulative inflation rate for the last three years does not exceed 100% and, accordingly have not been eliminated in the reconciliation to U.S. GAAP included under paragraph (s) below.
(a) Push Down Accounting and Purchase Accounting Under Chilean GAAP, the merger on January 1, 2002 between Banco de Chile and Banco de A. Edwards (the “Predecessor Banks”) was accounted for as a “pooling of interests” on a prospective basis. As such, the historical financial statements for periods prior to the merger were not restated and Banco de Chile was considered to be the continuing entity for legal and accounting purposes. Under U.S. GAAP, the merger of the two banks was accounted for as a merger of entities under common control, as LQ Inversiones Financieras, a holding company beneficially owned by Quiñenco, controlled both Banco de Chile and Banco de A. Edwards since March 27, 2001. BANCO DE CHILE AND SUBSIDIARIES NOTES TO THE CONSOLIDATED FINANCIAL STATEMENTS (Continued) (Restated for general price - level changes and expressed in millions of constant Chilean pesos as of December 31, 2005) 28. Differences between Chilean and United States Generally Accepted Accounting Principles (continued) (a) Push Down Accounting and Purchase Accounting (continued) Under U.S. GAAP, when accounting for a merger of entities under common control, the book values of the merging entities that are held in the books of the common parent must be pushed down to the merged entity. This means that goodwill previously created in the books of Quiñenco, the transferring entity, at the time that it acquired each bank and also any fair value differences created from those purchases must be included in the U.S. GAAP accounting records of the Bank. In practice this means that the goodwill and fair value adjustments created from Quiñenco’s purchases of Banco de A. Edwards during September and October, 1999 and from Quiñenco’s purchases of Banco de Chile made during 1999, 2000 and March 2001 are pushed down to the merged entity. As this treatment does not apply in Chilean GAAP, there is a significant difference in the asset and liability bases under each body of accounting principles. Quiñenco acquired Banco de A. Edwards, through step acquisitions between September 2, 1999 and October 26, 1999. There were no additional share transactions between 1999 and the date of the merger. Similarly, Quiñenco acquired Banco de Chile through step acquisitions between October 1999 and March 27, 2001. Under U.S. GAAP, acquisitions that are accounted for using the purchase method of accounting result in the identifiable assets and liabilities of the acquired bank being adjusted to their fair values in the consolidated financial statements of the acquirer. Adjustments to assets acquired and liabilities assumed to fair value and recording the fair values of unrecognized intangible assets are generically referred to as purchase accounting adjustments. As a result of its acquisitions of Banco de Chile and Banco de A. Edwards, Quiñenco recorded purchase accounting adjustments to reflect differences related to:
the fair value of intangible assets, including brand names and long-term customer-relationship intangible (core deposit intangibles);
the fair values of loans, excluding any adjustments in the acquiree’s historical allowance for loan losses or other contingent liabilities;
the accounting for staff severance liabilities;
the fair value of bank premises and equipment and other In addition to the above mentioned adjustments, Under US GAAP Quiñenco has considered the fair value of the subordinated debt arising from the economic crisis in 1982-1983. At that time the former Banco de Chile sold certain of its non-performing loans to the Chilean Central Bank at face value on terms that included a repurchase obligation. The repurchase obligation was later exchanged for subordinated debt of each participating bank issued in favor of the Central Bank. In 1996, a reorganization took place by which the former Banco de Chile was converted to a holding company named SM Chile that in turn organized a new wholly-owned banking subsidiary named Banco de Chile to which it contributed all of its assets and liabilities other than the Central Bank subordinated debt. SM Chile then created a second wholly owned subsidiary, SAOS, that pursuant to a prior agreement with the Central Bank, assumed a new repayment obligation in favor of the Central Bank which replaced the Central Bank subordinated debt in its entirety. SAOS is variable interest entities (VIEs) as defined in FASB Interpretation No. 46(R) “Consolidation of Variable Interest Entities, an interpretation of ARB No. 51” (FIN 46R). In accordance with FIN 46R, the primary beneficiary is the party that consolidates a VIE based on its assessment that it will absorb a majority of the expected losses or expected residual returns of the entity, or both. Banco de Chile has determined that it is not the primary beneficiary of SAOS and, therefore, it has not consolidated SAOS in the Consolidated Financial Statements of Banco de Chile. BANCO DE CHILE AND SUBSIDIARIES NOTES TO THE CONSOLIDATED FINANCIAL STATEMENTS (Continued) (Restated for general price - level changes and expressed in millions of constant Chilean pesos as of December 31, 28. Differences between Chilean and United States Generally Accepted Accounting Principles (continued) (a) Push Down Accounting and Purchase Accounting (continued) Such purchase accounting adjustments and goodwill and any equity method investments or equity participation in the results of operations of the acquired banks recorded by the common parent, must be recorded in the U.S. GAAP accounting records of the Bank. The effects of accounting for the push down of these purchase accounting adjustments, goodwill and any equity participation in the results of operations of the acquired banks into the accounting records of the Bank and their subsequent effects on net income is included in (b) Acquisition of Banco de A. Edwards Under U.S. GAAP, to the extent that the Predecessor Banks were under common control, the assets and liabilities of Banco de A. Edwards were transferred into Banco de Chile using the U.S. GAAP carrying values of such assets and liabilities included in the records of the common parent. However, as Quiñenco only owned 51.18% of Banco de A. Edwards at the time of the merger, to the extent that the minority interest of Banco de A. Edwards was acquired through the issuance of Banco de Chile shares, Banco de Chile was considered the acquirer. Therefore, Banco de Chile calculated goodwill based on the difference between the purchase price (i.e. the market value of the shares issued by Banco de Chile) and the fair value of the proportion of assets and liabilities acquired at the date of the merger. As part of this process, under U.S. GAAP, Banco de Chile was also required to value the interest acquired of previously unrecorded intangible assets, such as the Banco de Edwards brand name and core deposit intangibles, and to include these assets in the financial records of the Bank. Such assets were not required to be recorded under existing Chilean GAAP at that time. As a consequence of the merger between Banco de Chile and Banco de A. Edwards, Banco de Chile issued 23,147,126,425 shares in exchange for all the outstanding common shares of Banco de A. Edwards using an exchange ratio of 3.135826295 Banco de Chile shares for each Banco de A. Edwards share. Under U.S. GAAP Banco de Chile was considered to have acquired 48.82% of the outstanding shares in Banco de A. Edwards, which corresponded to those shares that Quiñenco did not own as of that date. The acquisition of these shares has been accounted for using purchase accounting as described in the preceding paragraph. The consideration paid has been determined using an average of the market value of the publicly traded Banco de Chile shares, which at January 1, 2002 was Ch$ Under U.S. GAAP, purchase allocation of the 48.82% participation acquired from shareholders other than Quiñenco and its subsidiaries as of January 1, 2002 was as follows:
BANCO DE CHILE AND SUBSIDIARIES NOTES TO THE CONSOLIDATED FINANCIAL STATEMENTS (Continued) (Restated for general price - level changes and expressed in millions of constant Chilean pesos as of December 31, 28. Differences between Chilean and United States Generally Accepted Accounting Principles (continued) (b) Acquisition of Banco de A. Edwards (continued) The following table summarizes the estimated fair values of the assets acquired and liabilities assumed at the date of acquisition.
Of the MCh$ The Bank does not amortize goodwill related to the acquisition of Banco de A. Edwards, following the provisions of SFAS No. 142, as described in paragraph (c) below. (c) Amortization of Goodwill and Intangible Assets The Bank adopted Statement of Financial Accounting Standard No. 142, “Goodwill and Other Intangible Assets”, (“SFAS 142”) as of January 1, 2002. SFAS 142 applies to all goodwill and identified intangible assets acquired in a business combination. Under this standard, beginning January 1, 2002, all goodwill, including that acquired before initial application of the standard, and indefinite-lived intangible assets are not amortized, but must be tested for impairment at least annually. The Bank has performed the annual impairment test of goodwill required by the standard, which did not result in any impairment. Under Chilean GAAP, the Bank does not present any goodwill as of December 31, The table below presents the allocation of the total carrying value of goodwill by segments of the Bank:
BANCO DE CHILE AND SUBSIDIARIES NOTES TO THE CONSOLIDATED FINANCIAL STATEMENTS (Continued) (Restated for general price - level changes and expressed in millions of constant Chilean pesos as of December 31, 28. Differences between Chilean and United States Generally Accepted Accounting Principles (continued) (d) Loan Origination Commissions and Fees Under Chilean GAAP, as from January 1, 2000, Banco de A. Edwards began recognizing loan origination and service fees and costs over the term of loans to which they relate, and the period that the services are performed. Banco de Chile began applying this accounting treatment during 2001 for loan origination and service fees and certain costs, and from January 1, 2002 for those related costs previously not considered. Prior to this accounting change, loan origination and service fees were recognized when collected and related direct costs when incurred. Under Statement of Financial Accounting Standard No. 91, “Accounting for Nonrefundable Fees and Costs Associated with Origination of Acquiring Loans and Initial Direct Costs of Leases”, loan origination fees and certain direct loan origination costs should be recognized over the term of the related loan as an adjustment to yield. As of December 31, 2002, the accounting treatment applied under Chilean GAAP is considered similar to U.S. GAAP. The effect of accounting for net loan origination fees in accordance with U.S. GAAP is included in the reconciliation of consolidated net income and shareholders’ equity in (e) Deferred Income taxes Under Chilean GAAP, prior to 1999, the Bank did not record the effects of deferred income taxes. Effective January 1, 1999, and in accordance with the new accounting standard under Chilean GAAP, the Bank was required to record the effects of deferred tax assets and liabilities based on the liability method, with deferred tax assets and liabilities established for temporary differences between the financial reporting basis and the tax basis of the Bank’s assets and liabilities at enacted tax rates expected to be in effect when such amounts are realized. As a transitional provision to reduce the impact of adoption of this standard, the banks were permitted to record a contra (“complementary”) asset or liability as of the date of implementation of the new accounting standard, January 1, 1999, related to the effects of deferred income taxes from prior years. These complementary assets and liabilities are to be amortized over the estimated period of reversal of the temporary differences that generate the future income tax asset or liability. Such period ended as of December 31, 2004. Under Statement of Financial Accounting Standard No. 109, “Accounting for Income Taxes”, income taxes are recognized using the liability method in a manner similar to Chilean transitional provisions allowed by Chilean GAAP as described above. Additional disclosures required under SFAS No. 109 are further described in paragraph (v) below. (f) Investments in other companies As shown in Note 9, certain long-term investments of less than 20% of the outstanding shares in other companies have been recorded using the equity method of accounting. Under U.S. GAAP these investments would generally be accounted for at cost less any non-temporary impairment in value. The effect of recording these assets in accordance with U.S. GAAP is included in the reconciliation of consolidated net income and shareholders’ equity in paragraph (s) below. BANCO DE CHILE AND SUBSIDIARIES NOTES TO THE CONSOLIDATED FINANCIAL STATEMENTS (Continued) (Restated for general price - level changes and expressed in millions of constant Chilean pesos as of December 31, 28. Differences between Chilean and United States Generally Accepted Accounting Principles (continued) (g) Repurchase agreements The Bank enters into repurchase agreements as a source of financing. In this regard, under Chilean GAAP the Bank’s investments that have been sold subject to repurchase agreements are reclassified from their investment category to investment collateral under agreements to repurchase. Under U.S. GAAP, no such reclassification is made since, in substance, the investment securities serve only as collateral on the borrowing. For purposes of the Article 9 consolidated balance sheets included in paragraph (u) below, investments that collateralize such borrowings are shown as trading investments. (h) Interest income recognition on non-accrual loans The Bank suspends the accrual of interest on loans when it is determined to be a loss or when it becomes past due. Previously accrued but uncollected interest is not reversed at the time the loan ceases to accrue interest. Under U.S. GAAP, recognition of interest on loans is generally discontinued when, in the opinion of management, there is an assessment that the borrower will likely be unable to meet all contractual payments as they become due. As a general practice, this occurs when loans are 90 days or more overdue. Any accrued but uncollected interest is reversed against interest income at that time. In addition, under Chilean GAAP, any payment received on past due loans is treated as income to the extent that accrued interest is due, but has not been recorded because the status of the loan, after reducing any recorded accrued interest receivable. Any remaining amount is then applied to reduce the outstanding principal balance. Under U.S. GAAP, any payment received on loans when the collectibility of the principal is in doubt is treated as a reduction of the outstanding principal balance of the loan until such doubt is removed. The effect of the difference in interest recognition on non-accrual loans is not material to the Bank’s financial position and results of its operations. (i) Contingent assets and liabilities Under Chilean GAAP the Bank recognizes rights and obligations with respect to contingent loans as contingent assets and liabilities. Under U.S. GAAP, such contingent amounts are not recognized on the balance sheet. If U.S. GAAP had been followed, the total assets and liabilities of the Bank would have been lower by MCh$ Within contingent assets and liabilities the Bank includes financial guarantees. For guarantees, in accordance to FASB Interpretation No. 45, “Guarantor’s Accounting and Disclosure Requirements for Guarantees, Including Indirect Guarantees of Indebtedness of Others” (“FIN 45”), a guarantor is required to recognize, at the inception of a guarantee, a liability for the fair value of the obligation undertaken in issuing the guarantee. Under Chilean GAAP, the Bank recognizes a liability which approximates fair value of the obligation related to guarantees. The required FIN 45 disclosures have been incorporated into paragraph (ab), below. (j) Allowance for loan losses The determination of the allowance for loan losses and disclosure requirements under U.S. GAAP differs from that under Chilean GAAP in the following respects: 1) Allowance for loan losses Under Chilean GAAP, the allowance for loan losses is calculated according to specific guidelines set out by the rules of the Superintendency of Banks, as described in Note 1 (l).
NOTES TO THE CONSOLIDATED FINANCIAL STATEMENTS (Continued) (Restated for general price - level changes and expressed in millions of constant Chilean pesos as of December 31, 28. Differences between Chilean and United States Generally Accepted Accounting Principles (continued) (j) Allowance for loan losses (continued) Under U.S. GAAP allowances for loan losses should be in amounts adequate to cover inherent losses in the loan portfolio at the respective balance sheet dates. The Bank has estimated its required reserve under U.S. GAAP in the following manner:
Allowances for commercial loans and leasing operations classified in loan risk category A1, A2, A3 and B (A and B under regulations in effect until January 1, 2004), which were not considered impaired under Statement of Financial Accounting Standard No. 114, “Accounting by Creditors for Impairment of a Loan” (“SFAS No. 114”), were analyzed and adjusted, if necessary, to reflect the estimated losses not identified based on individual credit analysis. The estimations were performed using historical loan data, in order to estimate the inherent losses in the Bank’s loan portfolio, using patterns and trends based upon historical changes in loan classifications (“migration analysis”).
In addition, specific allowances were determined for loans on the following basis:
Based on the preceding estimation process the Bank computed its allowance for loan losses under U.S. GAAP, and compared this estimate with the reported allowance determined in accordance with the guidelines established by the Superintendency of Banks. The additional loan loss allowance (voluntary allowances under previous regulations)
The effects of adopting SFAS No. 114 are included in the reconciliation included in BANCO DE CHILE AND SUBSIDIARIES NOTES TO THE CONSOLIDATED FINANCIAL STATEMENTS (Continued) (Restated for general price - level changes and expressed in millions of constant Chilean pesos as of December 31, 28. Differences between Chilean and United States Generally Accepted Accounting Principles (continued) (j) Allowance for loan losses (continued) 2) Recognition of income As of December 31, 3) Loan loss recoveries Under U.S. GAAP recoveries of loans previously charged-off are a reduction of the provision for loan losses. The following presents an analysis under U.S. GAAP of the changes in the allowance for loan losses during the periods presented.
4) Charge-offs As discussed in Note 1 (l) of these financial statements, under Chilean GAAP the Bank charges-off loans when collection efforts have been exhausted. Under the rules and regulations established by the Superintendency of Banks, charge-offs must be made within the following maximum prescribed limits: - 24 months after a loan is past due (3 months after past due for consumer loans) for loans without collateral; - 36 months after a loan is past due for loans with collateral. Under U.S. GAAP, loans should be written-off in the period that they are deemed uncollectible. The Bank believes that the charge-off policies it applies in accordance with Chilean GAAP are BANCO DE CHILE AND SUBSIDIARIES NOTES TO THE CONSOLIDATED FINANCIAL STATEMENTS (Continued) (Restated for general price - level changes and expressed in millions of constant Chilean pesos as of December 31, 28. Differences between Chilean and United States Generally Accepted Accounting Principles (continued) (k) Mortgage Finance Bonds Issued by the Bank Effective October 31, 2002 the Bank modified its accounting treatment of financial investments in mortgage finance bonds issued by the Bank in accordance with the instructions of the Superintendency of Banks, reducing from assets the amount recorded for mortgage finance bonds issued by The effects of this difference between Chilean and U.S. GAAP have been included in the reconciliation to U.S. GAAP in paragraph (s) below. (l) Investment securities Under Chilean GAAP the Bank classifies certain investments as permanent. These investments are stated at fair market value with unrealized gains and losses included in a separate component of shareholders’ equity, net of taxes, and with realized gains and losses included in other operating results. Under U.S. GAAP, Statement of Financial Accounting Standard No. 115, “Accounting for Certain Investments in Debt and Equity Securities” (“SFAS No. 115”), requires that debt and equity securities be classified in accordance with the Bank’s intent and ability to hold the security, as follows:
Debt securities that the Bank has the positive intent and ability to hold to maturity are classified as held-to-maturity securities and are reported at amortized cost.
Debt and equity securities that are bought and held by the Bank, principally for the purpose of selling them in the near term, are classified as trading securities and reported at fair value, with unrealized gains and losses included in earnings.
Debt and equity securities not classified as either held-to-maturity securities or trading securities are classified as available-for-sale securities and reported at fair value, with unrealized gains and losses excluded from earnings and reported in a separate component of shareholders’ Consequently, investments classified as permanent under Chilean GAAP are considered to be “available-for-sale” and all other investments are considered to be “trading”, with the exception of certain investments, maintained by the Bank’s branches in the United States of America, which are classified as “held-to-maturity”. Under Chilean GAAP, securities maintained by the Bank’s branches abroad classified as “held-to-maturity” are stated at fair market value. Under U.S. GAAP, held-to-maturity investments are stated at amortized impairment on a periodic basis. Investment securities maintained by the Bank’s subsidiaries are carried at the lower of price-level restated cost or market value and are classified as “trading” for U.S. GAAP purposes. BANCO DE CHILE AND SUBSIDIARIES NOTES TO THE CONSOLIDATED FINANCIAL STATEMENTS (Continued) (Restated for general price - level changes and expressed in millions of constant Chilean pesos as of December 31, 28. Differences between Chilean and United States Generally Accepted Accounting Principles (continued) (l) Investment securities (continued) (1) Under Chilean GAAP, the unrealized holdings gains (losses) related to investments classified as permanent have been included in Shareholders’ equity, which does not differ from the treatment of “available-for-sale” investments under U.S. GAAP. The following are required disclosures for investments classified as available-for-sale in accordance with SFAS Nº115 and the presentation requirements of Article 9 (see paragraph (u) below), and have been prepared using amounts determined in accordance with U.S. GAAP. Realized gains and losses are determined using the proceeds from sales less the cost of the investment identified to be sold. Gross gains and losses realized on the sale of available-for-sale securities for the year ended December 31,
The carrying value and market value of securities available-for-sale as of December 31,
The contractual maturities of securities, classified by the Bank as available-for-sale, are as follows:
BANCO DE CHILE AND SUBSIDIARIES NOTES TO THE CONSOLIDATED FINANCIAL STATEMENTS (Continued) (Restated for general price - level changes and expressed in millions of constant Chilean pesos as of December 31, 28. Differences between Chilean and United States Generally Accepted Accounting Principles (continued) (l) Investment securities (continued) (2) The following disclosures are required for investments classified as held-to-maturity in accordance with SFAS No. 115:
The contractual maturities of securities classified by the Bank as held-to-maturity are as follows:
(3) Under U.S. GAAP, the Bank is required to disclose the amounts of unrealized holding gains and losses included in income on securities classified as trading. For the years ended December 31, The Bank evaluates all securities for declines in value that are considered other than temporary (“permanent impairment”). The Bank (m) Derivatives The Bank enters into derivative transactions for its own account and to meet customers’ risk management needs. These transactions are mainly foreign exchange forward contracts, which are made in the most cases in US dollars against the Chilean peso or the UF and, from time to time, in other currencies but only when the Bank acts as an intermediary, in accordance with the requirements of the Central Bank that requires that foreign exchange forward contracts be made only in US dollars and other major foreign currencies. Other derivative transactions include primarily interest rate swaps (paid fixed-received floating) and rate lock. These are used for hedging purposes in order to manage, among other risks, U.S. interest rate risk related to the Yankee bonds of Chilean companies bought by the Bank. In order to manage any credit risk associated with its derivative products, the Bank grants lines of credit to transaction counterparties, in accordance with its credit policies, for each derivative transaction. The counterparty risk exposure is a function of the type of derivative, the term to maturity of the transaction and the volatility of the risk factors that affect the derivative’s market value, which are managed by the Bank on an on-going basis as market conditions warrant. BANCO DE CHILE AND SUBSIDIARIES NOTES TO THE CONSOLIDATED FINANCIAL STATEMENTS (Continued) (Restated for general price - level changes and expressed in millions of constant Chilean pesos as of December 31, 28. Differences between Chilean and United States Generally Accepted Accounting Principles (continued) (m) Derivatives (continued) As explained in Note 1 (e), under Chilean GAAP the Bank accounts for forward contracts between foreign currencies and U.S. dollars and forwards contracts between the U.S. dollar and the Chilean peso or the U.F. are valued at the closing spot exchange rate of each balance sheet date, with the initial discount or premium being amortized over the life of the contract in accordance with Chilean hedge accounting criteria. The losses recognized in income associated with these contracts for the years ended December 31, Under U.S. GAAP, the Bank applies SFAS No. 133, “Accounting for Derivative Instruments and Hedging Activities”, as amended by SFAS No.138, “Accounting for Certain Derivative Instruments and Certain Hedging Activities” and SFAS No. 149, “Amendment of Statement 133 on Derivative Instruments and Hedging Activities” (collectively “SFAS 133”), which established comprehensive accounting and reporting standards for derivative instruments, including certain derivative instruments embedded in other contracts, and hedging activities. The Standard required that all derivative instruments be recorded in the balance sheet at fair value. However, the accounting for changes in fair value of the derivative instrument depends on whether the derivative instrument qualifies as a hedge. The standards also require formal documentation procedures for hedging relationships and effectiveness testing when hedge accounting is to be applied. If the derivative instrument does not qualify as a hedge, changes in fair value are reported in earnings when they occur. If the derivative instrument qualifies as a hedge, the accounting treatment varies based on the type of risk being hedged. Under U.S. GAAP, the Bank records its entire portfolio of swap agreements at their estimated fair value and forward contracts between the U.S. dollar and the Chilean peso or UF at the fair value based on the forward exchange rate. While the Bank enters into derivatives for the purpose of mitigating its global interest and foreign currency risks, these operations do not meet the strict documentation requirements to qualify for hedge accounting under U.S. GAAP, except for certain Current Chilean accounting rules do not consider the existence of derivative instruments embedded in other contracts and therefore they are not reflected in the financial statements. For U.S. GAAP purposes, certain implicit or explicit terms included in host contracts that affect some or all of the cash flows or the value of other exchanges required by the contract in a manner similar to a derivative instrument, must be separated from the host contract and accounted for at fair value. The Bank separately measures embedded derivatives as freestanding derivative instruments at their estimated fair values recognizing changes in earnings when they occur. Currently the only host contracts and instruments that the Bank has, which have implicit or explicit terms that must be separately accounted for at fair value, are The effects of the differences in accounting for derivative instruments between Chilean and U.S. GAAP on the consolidated net income and shareholders’ equity of the Bank are included in paragraph (s) below. BANCO DE CHILE AND SUBSIDIARIES NOTES TO THE CONSOLIDATED FINANCIAL STATEMENTS (Continued) (Restated for general price - level changes and expressed in millions of constant Chilean pesos as of December 31, 28. Differences between Chilean and United States Generally Accepted Accounting Principles (continued) (n) Mandatory dividend As required by the Chilean General Banking Law, unless otherwise decided by a two-thirds vote of its issued and subscribed shares, the Bank must distribute a cash dividend in an amount equal to at least 30% of its net income for each year as determined in accordance with Chilean GAAP, unless and except to the extent the Bank has unabsorbed prior year losses. Since the payment of these dividends is a legal requirement in Chile, an accrual for U.S. GAAP purposes is made to recognize the corresponding decrease in equity at each balance sheet date. The Bank’s liabilities would have been greater by MCh$ (o) Assets received in lieu of payment Under Chilean GAAP, assets received in lieu of payment are carried at cost and have been restated for price-level changes, less a Under U.S. GAAP, assets received in lieu of payment are initially recorded at fair value less any estimated costs to sell at the date of foreclosure, on an individual asset basis. The effect of recording these assets in accordance with U.S. GAAP is included in the reconciliation of consolidated net income and shareholders’ equity in (p) Acquisition of Leasing Andino On April 23, 1999, the Bank and its subsidiary Banchile Asesorías Financieras S.A. acquired the remaining 35% of shares of Leasing Andino that it did not already own from Orix Corporation for MCh$ Under U.S. GAAP, the difference between the cost of an investment and the amount of underlying equity in net assets is allocated to the underlying assets and liabilities based on their respective fair values at the time of the acquisition. Any excess of the cost of the investment over such fair value is treated as goodwill. The effect of the differences in purchase accounting and the amortization of goodwill is included in the reconciliation of consolidated net income and shareholders’ equity in BANCO DE CHILE AND SUBSIDIARIES NOTES TO THE CONSOLIDATED FINANCIAL STATEMENTS (Continued) (Restated for general price - level changes and expressed in millions of constant Chilean pesos as of December 31, 28. Differences between Chilean and United States Generally Accepted Accounting Principles (continued) (q) Staff severance indemnities The provision for staff severance indemnities The effects of accounting for termination indemnity benefits under U.S. GAAP have been presented in paragraph (s), below. (r)
BANCO DE CHILE AND SUBSIDIARIES NOTES TO THE CONSOLIDATED FINANCIAL STATEMENTS (Continued) (Restated for general price - level changes and expressed in millions of constant Chilean pesos as of December 31, 28. Differences between Chilean and United States Generally Accepted Accounting Principles (continued) (s) Summary of Income Statement and Shareholders’ Equity differences The following is a reconciliation of consolidated net income under Chilean GAAP to the corresponding U.S. GAAP amounts:
BANCO DE CHILE AND SUBSIDIARIES NOTES TO THE CONSOLIDATED FINANCIAL STATEMENTS (Continued) (Restated for general price - level changes and expressed in millions of constant Chilean pesos as of December 31, 28. Differences between Chilean and United States Generally Accepted Accounting Principles (continued) (s) Summary of Income Statement and Shareholders’ Equity differences (continued) The following is a reconciliation of consolidated shareholders’ equity differences under Chilean GAAP to the corresponding amounts under U.S. GAAP:
BANCO DE CHILE AND SUBSIDIARIES NOTES TO THE CONSOLIDATED FINANCIAL STATEMENTS (Continued) (Restated for general price - level changes and expressed in millions of constant Chilean pesos as of December 31, 28. Differences between Chilean and United States Generally Accepted Accounting Principles (continued) (s) Summary of Income Statement and Shareholders’ Equity differences (continued) The following summarizes the changes in shareholders’ equity under U.S. GAAP during the years ended December 31,
(t) Net income per share The following disclosure of net income per share information is not generally required for presentation in the financial statements under Chilean GAAP but is required under U.S. GAAP. Earnings per share is determined by dividing combined net income by the weighted average number of total shares outstanding.
BANCO DE CHILE AND SUBSIDIARIES NOTES TO THE CONSOLIDATED FINANCIAL STATEMENTS (Continued) (Restated for general price - level changes and expressed in millions of constant Chilean pesos as of December 31, 28. Differences between Chilean and United States Generally Accepted Accounting Principles (continued) (u) Article 9 Presentation of Income Statements and Balance Sheets The presentation of the consolidated financial statements differs significantly from the format required by the Securities and Exchange Commission under Rules 210.9 to 210.9-07 of Regulation S-X (“Article 9”). The following financial statements are presented in constant Chilean pesos of December 31, The principal reclassifications and adjustments which were made to the basic Chilean GAAP consolidated financial statements in order to present them in the Article 9 format are as follows:
BANCO DE CHILE AND SUBSIDIARIES NOTES TO THE CONSOLIDATED FINANCIAL STATEMENTS (Continued) (Restated for general price - level changes and expressed in millions of constant Chilean pesos as of December 31, 28. Differences between Chilean and United States Generally Accepted Accounting Principles (continued) (u) Article 9 Presentation of Income Statements and Balance Sheets (continued) The following income statements presented for the years ended December 31, Income Statements
In connection with the preparation of the Article 9 income statement:
BANCO DE CHILE AND SUBSIDIARIES NOTES TO THE CONSOLIDATED FINANCIAL STATEMENTS (Continued) (Restated for general price - level changes and expressed in millions of constant Chilean pesos as of December 31, 28. Differences between Chilean and United States Generally Accepted Accounting Principles (continued) (u) Article 9 Presentation of Income Statements and Balance Sheets (continued) The following balance sheets presented as of December 31, Balance Sheets
BANCO DE CHILE AND SUBSIDIARIES NOTES TO THE CONSOLIDATED FINANCIAL STATEMENTS (Continued) (Restated for general price - level changes and expressed in millions of constant Chilean pesos as of December 31, 28. Differences between Chilean and United States Generally Accepted Accounting Principles (continued) (u) Article 9 Presentation of Income Statements and Balance Sheets (continued) The following is a reconciliation of total assets presented in accordance with guidelines established by the Superintendency of Banks and the presentation prescribed by Article 9:
(v) Income taxes The reconciliation of the provision for income taxes charged to income under Chilean GAAP to the corresponding amounts under U.S. GAAP is as follows:
BANCO DE CHILE AND SUBSIDIARIES NOTES TO THE CONSOLIDATED FINANCIAL STATEMENTS (Continued) (Restated for general price - level changes and expressed in millions of constant Chilean pesos as of December 31, 28. Differences between Chilean and United States Generally Accepted Accounting Principles (continued) (v) Income taxes (continued) Deferred tax assets (liabilities) are summarized as follows:
BANCO DE CHILE AND SUBSIDIARIES NOTES TO THE CONSOLIDATED FINANCIAL STATEMENTS (Continued) (Restated for general price - level changes and expressed in millions of constant Chilean pesos as of December 31, 28. Differences between Chilean and United States Generally Accepted Accounting Principles (continued) (v) Income taxes (continued) The provision (benefit) for income taxes under U.S. GAAP differs from the amount of income tax determined by applying the applicable Chilean statutory income tax rate to pretax income as a result of the following differences:
(w) Comprehensive Income The Bank presents comprehensive income and its components with the objective to report a measure of all changes in shareholders’ equity that result from transactions and other economic events of the period other than transactions with owners (“comprehensive income”). Comprehensive income is the total net income and other non-owner equity transactions that result in changes in net equity. The following represents accumulated other comprehensive income balance, net of tax, for the years ended December 31,
BANCO DE CHILE AND SUBSIDIARIES NOTES TO THE CONSOLIDATED FINANCIAL STATEMENTS (Continued) (Restated for general price - level changes and expressed in millions of constant Chilean pesos as of December 31, 28. Differences between Chilean and United States Generally Accepted Accounting Principles (continued) (w) Comprehensive Income (continued)
(x) Segment information The Bank presents information in accordance with Statement of Financial Accounting Standard No.131 “Disclosure about Segments of an Enterprise and Related The Bank has strategically aligned its operations into Wholesale Market, The Wholesale market business area serves the needs of corporate customers with annual sales in excess of Ch$1,200 million that are engaged in a wide spectrum of industry sectors. Services provided include depositing and lending in both Chilean pesos and foreign currency, trade and project financing, working capital financing, leasing, factoring, foreign trade financing, lines of credit, commercial mortgage loans and various non-credit services, such as financial consultancy, collections, supplier payments, payroll management and a wide array of treasury and risk management products, as well as electronic banking services. BANCO DE CHILE AND SUBSIDIARIES NOTES TO THE CONSOLIDATED FINANCIAL STATEMENTS (Continued) (Restated for general price - level changes and expressed in millions of constant Chilean pesos as of December 31, 28. Differences between Chilean and United States Generally Accepted Accounting Principles (continued) (x) Segment information (continued)
The
International Banking, The International Banking segment includes services offered principally through the Bank’s New York Treasury, The Treasury segment is responsible for the management of the Bank’s assets and liabilities and also offers financial services to other segments and external customers such as currency intermediation, instruments developed for currency and interest rate risk hedging, transactions under repurchase agreements and investment products based on bonds, mortgage notes and deposits. The Treasury segment is also responsible for monitoring compliance with regulatory deposit limits, technical reserves and maturity and rate matches. Subsidiaries, The Subsidiaries segment includes non-banking financial services that are offered through separate legal The financial information used to measures the performance of the Bank’s business segments is not necessarily comparable with similar information from other financial institutions
The net interest margin of loans and deposits is measured on an individual transaction and individual client basis,
The The performance of the business areas, measured by an internal profitability system considers results that are directly related to performance and not to overhead expenses of corporate and support departments, additional allowances (previously referred to as “voluntary allowances” under guidelines prior to 2004), taxes and other non-operating income and expenses.
The internal performance profitability system considers capital allocation in each segment in accordance to Basle guidelines.
Provisions for loan losses in each segment are measured on a client basis. In addition to direct costs (consisting mainly of labor and administrative expenses), the Bank allocates the majority of its indirect operating costs to each business area based on the type and amount of the relevant transactions. These costs are mainly related to the use of technology and other computer equipment. Other indirect costs are allocated using activity-base costing methodology. BANCO DE CHILE AND SUBSIDIARIES NOTES TO THE CONSOLIDATED FINANCIAL STATEMENTS (Continued) (Restated for general price - level changes and expressed in millions of constant Chilean pesos as of December 31, 28. Differences between Chilean and United States Generally Accepted Accounting Principles (continued) (x) Segment information (continued) The following tables show the results of the Bank by operating segments for the three years ended December 31,
BANCO DE CHILE AND SUBSIDIARIES NOTES TO THE CONSOLIDATED FINANCIAL STATEMENTS (Continued) (Restated for general price - level changes and expressed in millions of constant Chilean pesos as of December 31, 28. Differences between Chilean and United States Generally Accepted Accounting Principles (continued) (x) Segment information (continued) Information about geographic areas. The financial information presented below has been classified considering the country in which the related transactions were originated. Those transactions which originated in the United States of America, through Banco de Chile’s operations in New York and Miami, U.S.A., are primarily completed with Chilean and Argentine citizens and enterprises, and are principally denominated in U.S. dollars. A summary of activities by geographic area is as follows:
BANCO DE CHILE AND SUBSIDIARIES NOTES TO THE CONSOLIDATED FINANCIAL STATEMENTS (Continued) (Restated for general price - level changes and expressed in millions of constant Chilean pesos as of December 31, 28. Differences between Chilean and United States Generally Accepted Accounting Principles (continued) (y) Estimated Fair Value of Financial Instruments and Derivative Financial Instruments The accompanying tables provide disclosure of the estimated fair value of financial instruments owned by the Bank. Various limitations are inherent in the presentation, including the following:
The data excludes non-financial assets and liabilities, such as bank premises and equipment and excludes values attributable to deposit and credit card relationships.
While the data represents management’s best estimates, the data is subjective, involving significant estimates regarding current economic and market conditions and risk characteristics. The methodologies and assumptions used depend upon the terms and risk characteristics of the various instruments and include the following:
Cash and due from banks represents cash and short-term deposits which approximate fair value because of the short-term maturity of these instruments.
Most of the Bank’s securities are considered as trading and therefore are generally carried at quoted market prices. Interest earning assets and liabilities with an original maturity of less than one year are considered to have a fair value, which is not materially different from their book value.
For interest earning assets and interest bearing liabilities which are contracted at variable interest rates, their book value is considered to be equivalent to their fair value.
For performing loans with fixed-rates and an original maturity of greater than one year, the fair values were calculated by discounting contractual cash flows, using the Bank’s current origination rates for loans with similar terms and similar risk characteristics.
For loans where the Bank’s management believes that the amounts outstanding will not be paid in accordance with contractual terms, the estimated cash flows arising from the liquidation of collateralized assets and other expected flows have been discounted at an estimated discount rate commensurate with the risk in the collection of these amounts.
For interest-bearing liabilities with fixed rates and an original contractual maturity of greater than one year, the fair values are calculated by discounting contractual cash flows at current market origination rates with similar terms.
The estimated fair value of foreign exchange forward contracts was determined using quoted market prices of financial instruments with similar characteristics.
The fair value of interest rate swaps represents the estimated amount the Bank would expect to receive or pay to terminate the contracts or agreements, taking into account current interest rates. As no quoted market prices are available for the interest rate swap and forward rate instruments held by the Bank, such estimates have been estimated using modeling and other valuation techniques. BANCO DE CHILE AND SUBSIDIARIES NOTES TO THE CONSOLIDATED FINANCIAL STATEMENTS (Continued) (Restated for general price - level changes and expressed in millions of constant Chilean pesos as of December 31, 28. Differences between Chilean and United States Generally Accepted Accounting Principles (continued) (y) Estimated Fair Value of Financial Instruments and Derivative Financial Instruments (continued) The estimated fair values of financial instruments and derivatives financial instruments are as follows:
(z) Investments in other companies As of December 31,
BANCO DE CHILE AND SUBSIDIARIES NOTES TO THE CONSOLIDATED FINANCIAL STATEMENTS (Continued) (Restated for general price - level changes and expressed in millions of constant Chilean pesos as of December 31, 28. Differences between Chilean and United States Generally Accepted Accounting Principles (continued) (aa) Bank premises and equipment, net The major categories of Bank premises and equipment net of accumulated depreciation are as follows:
In accordance with rules of the Superintendency of Banks, bank premises and equipment are presented net of accumulated depreciation. As a result no information is available for either accumulated depreciation or total bank premises and equipment. (ab) Other assets and other liabilities (1) Other assets
BANCO DE CHILE AND SUBSIDIARIES NOTES TO THE CONSOLIDATED FINANCIAL STATEMENTS (Continued) (Restated for general price - level changes and expressed in millions of constant Chilean pesos as of December 31, 28. Differences between Chilean and United States Generally Accepted Accounting Principles (continued) (ab) Other assets and other liabilities (continued) (2) Other liabilities
(3) Contingent Liabilities Contingent liabilities consist of open and unused letters of credit, together with guarantees granted by the Bank in Chilean pesos, UF and foreign currencies (principally U.S. dollars). The liability represents the Bank’s obligations under such agreements. The Bank’s rights under these agreements are recognized as assets on the Bank’s balance sheets under the caption “Contingent loans”. See Note 5.
Guarantees in the form of performance bonds, stand by letters of credit and foreign office guarantees are issued in connection with agreements made by customers to counterparties. If the customer fails to comply with the agreement, the counterparty may enforce the performance bond as a remedy. Credit risk arises from the possibility that the customer may not be able to repay the Bank for performance bonds. To mitigate credit risk, the Bank generally determines the need for specific covenant, guarantee and collateral requirements on a case-by-case basis, depending on the nature of the financial instrument and the customer’s creditworthiness. BANCO DE CHILE AND SUBSIDIARIES NOTES TO THE CONSOLIDATED FINANCIAL STATEMENTS (Continued) (Restated for general price - level changes and expressed in millions of constant Chilean pesos as of December 31, 28. Differences between Chilean and United States Generally Accepted Accounting Principles (continued) (ab) Other assets and other liabilities (continued) The expiration of guarantees, per period is as follows:
(ac) Other Interest Bearing Liabilities The Bank’s long-term and short-term borrowings are summarized below. In accordance with the guidelines established by the Superintendency of Banks, the Bank does not present a classified balance sheet. Borrowings are described as short-term when they have original maturities of less than one year or are due on demand. All other borrowings are described as long-term, including the amounts due within one year on such borrowings.
BANCO DE CHILE AND SUBSIDIARIES NOTES TO THE CONSOLIDATED FINANCIAL STATEMENTS (Continued) (Restated for general price - level changes and expressed in millions of constant Chilean pesos as of December 31, 28. Differences between Chilean and United States Generally Accepted Accounting Principles (continued) (ac) Other Interest Bearing Liabilities (continued) Mortgage finance bonds These bonds are used to finance the granting of mortgage loans. The outstanding principal amounts of the bonds are amortized on a quarterly basis. The range of maturities of these bonds is between five and twenty years. The bonds are linked to the UF index and carry a weighted average annual rate of interest of 2005. The maturities of outstanding mortgage bond amounts as of December 31,
(ad) Shareholders’ Equity The Bank’s paid-in capital consists of 68,079,783,605 authorized shares of no fixed nominal value, issued and outstanding as of December 31, Dividends are declared and paid during the year subsequent to that in which the related net income was earned. Dividends were declared and paid to the respective shareholders of each of the merging banks based on prior year net income determined under Chilean GAAP for the years ended December 31,
BANCO DE CHILE AND SUBSIDIARIES NOTES TO THE CONSOLIDATED FINANCIAL STATEMENTS (Continued) (Restated for general price - level changes and expressed in millions of constant Chilean pesos as of December 31, 28. Differences between Chilean and United States Generally Accepted Accounting Principles (continued) (ae) Fees and income from services The Bank’s fees and income from services and non-operating income and expenses for the years ended December 31,
BANCO DE CHILE AND SUBSIDIARIES NOTES TO THE CONSOLIDATED FINANCIAL STATEMENTS (Continued) (Restated for general price - level changes and expressed in millions of constant Chilean pesos as of December 31, 28. Differences between Chilean and United States Generally Accepted Accounting Principles (continued) (af) Non-operating income and expense
(ag) Recent accounting pronouncements Financial Assets, an amendment of FASB Statement No. 140” (SFAS 156), which permits, but does not require, an entity to account for one or more classes of servicing rights (i.e., mortgage servicing rights, or MSRs) at fair value, with the changes in fair value recorded in the Consolidated Statement of Income. Management is currently evaluating the effect of the statement on the Bank’s results of operations and financial condition. On On November 3, 2005, the FASB
BANCO DE CHILE AND SUBSIDIARIES NOTES TO THE CONSOLIDATED FINANCIAL STATEMENTS (Continued) (Restated for general price - level changes and expressed in millions of constant Chilean pesos as of December 31, 28. Differences between Chilean and United States Generally Accepted Accounting Principles (continued) (ag) Recent accounting pronouncements (continued) In May 2005, the FASB issued SFAS No. 154, “Accounting Changes and Error Corrections – A replacement of APB Opinion No. 20 and FASB Statement No. 3” (“SFAS 154”). SFAS 154 replaces APB Opinion No. 20, “Accounting Changes” (“APB 20”) and FASB Statement No. 3, “Reporting Accounting Changes in Interim Financial Statements,” and changes the requirements for
29. New Accounting Policies
Those standards must be applied by Banco de Chile, its subsidiaries and branches abroad beginning 2006. Likewise, the valuation differences that arise due to
The effects in the consolidated financial statements as of December 31, 2005, corresponding to the implementation of this new standard have not been quantified. 30. Relevant Events (a) Agreement between Banco de Chile and U.S. regulators regarding the New York and Miami branches. Banco de Chile agreed with the Office of the Comptroller of the Currency (“OCC”), and separately with the Board of Governors of the Federal Reserve System through the Federal Reserve Bank of Atlanta (together the “Federal Reserve”), as part of their targeted examinations of the New York and Miami Branches respectively, to the issuance by the OCC of a consent order, applicable to the New York branch, and the issuance by the Federal Reserve of a cease and desist order, applicable to the Miami branch. Pursuant to these February 1, 2005 orders, Banco de Chile has instituted an action plan that In the opinion of the Banco de Chile’s management, as of December 31, 2005, the New York and Miami branches are in compliance with the OCC and Federal Reserve consent orders. (b) The Ordinary Shareholders Meeting of Banco de Chile held on March 17, 2005, renewed the whole Board of Directors due to
BANCO DE CHILE AND SUBSIDIARIES NOTES TO THE CONSOLIDATED FINANCIAL STATEMENTS (Continued) (Restated for general price - level changes and expressed in millions of constant Chilean pesos as of December 31, 30. Relevant Events (continued) After the corresponding vote held at the above mentioned Meeting, the following persons were elected as Bank Directors for a new three-year term:
| |||||||||||||||||||||||||||||||||||||||||||||||||||||||||||||||||||||||||||||||||||||||||||||||||||||||||||||||||||||||||||||||||||||||||||||||||||||||||||||||||||||||||||||||||||||||||||||||||||||||||||||||||||||||||||||||||||||||||||||||||||||||||||||||||||||||||||||||||||||||||||||||||||||||||||||||||||||||||||||||||||||||||||||||||||||||||||||||||||||||||||||||||||||||||||||||||||||||||||||||||||||||||||||||||||||||||||||||||||||||||||||||||||||||||||||||||||||||||||||||||||||||||||||||||||||||||||||||||||||||||||||||||||||||||||||||||||||||||||||||||||||||||||||||||||||||||||||||||||||||||||||||||||||||||||||||||||||||||||||||||||||||||||||||||||||||||||||||||||||||||||||||||||||||||||||||||||||||||||||||||||||||||||||||||||||||||||||||||||||||||||||||||||||||||||||||||||||||||||||||||||||||||||||||||||||||||||||||||||||||||||||||||||||||||||||||||||||||||||||||||||||||||||||||||||||||||||||||||||||||||||||||||||||||||||||||||||||||||||||||||||||||||||||||||||||||||||||||||||||||
| Jacob Ergas Ergas | |||||||||||||||||||||||||||||||||||||||||||||||||||||||||||||||||||||||||||||||||||||||||||||||||||||||||||||||||||||||||||||||||||||||||||||||||||||||||||||||||||||||||||||||||||||||||||||||||||||||||||||||||||||||||||||||||||||||||||||||||||||||||||||||||||||||||||||||||||||||||||||||||||||||||||||||||||||||||||||||||||||||||||||||||||||||||||||||||||||||||||||||||||||||||||||||||||||||||||||||||||||||||||||||||||||||||||||||||||||||||||||||||||||||||||||||||||||||||||||||||||||||||||||||||||||||||||||||||||||||||||||||||||||||||||||||||||||||||||||||||||||||||||||||||||||||||||||||||||||||||||||||||||||||||||||||||||||||||||||||||||||||||||||||||||||||||||||||||||||||||||||||||||||||||||||||||||||||||||||||||||||||||||||||||||||||||||||||||||||||||||||||||||||||||||||||||||||||||||||||||||||||||||||||||||||||||||||||||||||||||||||||||||||||||||||||||||||||||||||||||||||||||||||||||||||||||||||||||||||||||||||||||||||||||||||||||||||||||||||||||||||||||||||||||||||||||||||||||||||||
| Thomas Fürst Freiwirth | |||||||||||||||||||||||||||||||||||||||||||||||||||||||||||||||||||||||||||||||||||||||||||||||||||||||||||||||||||||||||||||||||||||||||||||||||||||||||||||||||||||||||||||||||||||||||||||||||||||||||||||||||||||||||||||||||||||||||||||||||||||||||||||||||||||||||||||||||||||||||||||||||||||||||||||||||||||||||||||||||||||||||||||||||||||||||||||||||||||||||||||||||||||||||||||||||||||||||||||||||||||||||||||||||||||||||||||||||||||||||||||||||||||||||||||||||||||||||||||||||||||||||||||||||||||||||||||||||||||||||||||||||||||||||||||||||||||||||||||||||||||||||||||||||||||||||||||||||||||||||||||||||||||||||||||||||||||||||||||||||||||||||||||||||||||||||||||||||||||||||||||||||||||||||||||||||||||||||||||||||||||||||||||||||||||||||||||||||||||||||||||||||||||||||||||||||||||||||||||||||||||||||||||||||||||||||||||||||||||||||||||||||||||||||||||||||||||||||||||||||||||||||||||||||||||||||||||||||||||||||||||||||||||||||||||||||||||||||||||||||||||||||||||||||||||||||||||||||||||||
| Andrónico Luksic Craig | |||||||||||||||||||||||||||||||||||||||||||||||||||||||||||||||||||||||||||||||||||||||||||||||||||||||||||||||||||||||||||||||||||||||||||||||||||||||||||||||||||||||||||||||||||||||||||||||||||||||||||||||||||||||||||||||||||||||||||||||||||||||||||||||||||||||||||||||||||||||||||||||||||||||||||||||||||||||||||||||||||||||||||||||||||||||||||||||||||||||||||||||||||||||||||||||||||||||||||||||||||||||||||||||||||||||||||||||||||||||||||||||||||||||||||||||||||||||||||||||||||||||||||||||||||||||||||||||||||||||||||||||||||||||||||||||||||||||||||||||||||||||||||||||||||||||||||||||||||||||||||||||||||||||||||||||||||||||||||||||||||||||||||||||||||||||||||||||||||||||||||||||||||||||||||||||||||||||||||||||||||||||||||||||||||||||||||||||||||||||||||||||||||||||||||||||||||||||||||||||||||||||||||||||||||||||||||||||||||||||||||||||||||||||||||||||||||||||||||||||||||||||||||||||||||||||||||||||||||||||||||||||||||||||||||||||||||||||||||||||||||||||||||||||||||||||||||||||||||||||
| Guillermo Luksic Craig | |||||||||||||||||||||||||||||||||||||||||||||||||||||||||||||||||||||||||||||||||||||||||||||||||||||||||||||||||||||||||||||||||||||||||||||||||||||||||||||||||||||||||||||||||||||||||||||||||||||||||||||||||||||||||||||||||||||||||||||||||||||||||||||||||||||||||||||||||||||||||||||||||||||||||||||||||||||||||||||||||||||||||||||||||||||||||||||||||||||||||||||||||||||||||||||||||||||||||||||||||||||||||||||||||||||||||||||||||||||||||||||||||||||||||||||||||||||||||||||||||||||||||||||||||||||||||||||||||||||||||||||||||||||||||||||||||||||||||||||||||||||||||||||||||||||||||||||||||||||||||||||||||||||||||||||||||||||||||||||||||||||||||||||||||||||||||||||||||||||||||||||||||||||||||||||||||||||||||||||||||||||||||||||||||||||||||||||||||||||||||||||||||||||||||||||||||||||||||||||||||||||||||||||||||||||||||||||||||||||||||||||||||||||||||||||||||||||||||||||||||||||||||||||||||||||||||||||||||||||||||||||||||||||||||||||||||||||||||||||||||||||||||||||||||||||||||||||||||||||||
| Rodrigo Manubens Moltedo | |||||||||||||||||||||||||||||||||||||||||||||||||||||||||||||||||||||||||||||||||||||||||||||||||||||||||||||||||||||||||||||||||||||||||||||||||||||||||||||||||||||||||||||||||||||||||||||||||||||||||||||||||||||||||||||||||||||||||||||||||||||||||||||||||||||||||||||||||||||||||||||||||||||||||||||||||||||||||||||||||||||||||||||||||||||||||||||||||||||||||||||||||||||||||||||||||||||||||||||||||||||||||||||||||||||||||||||||||||||||||||||||||||||||||||||||||||||||||||||||||||||||||||||||||||||||||||||||||||||||||||||||||||||||||||||||||||||||||||||||||||||||||||||||||||||||||||||||||||||||||||||||||||||||||||||||||||||||||||||||||||||||||||||||||||||||||||||||||||||||||||||||||||||||||||||||||||||||||||||||||||||||||||||||||||||||||||||||||||||||||||||||||||||||||||||||||||||||||||||||||||||||||||||||||||||||||||||||||||||||||||||||||||||||||||||||||||||||||||||||||||||||||||||||||||||||||||||||||||||||||||||||||||||||||||||||||||||||||||||||||||||||||||||||||||||||||||||||||||||||
| Gonzalo Menéndez Duque | |||||||||||||||||||||||||||||||||||||||||||||||||||||||||||||||||||||||||||||||||||||||||||||||||||||||||||||||||||||||||||||||||||||||||||||||||||||||||||||||||||||||||||||||||||||||||||||||||||||||||||||||||||||||||||||||||||||||||||||||||||||||||||||||||||||||||||||||||||||||||||||||||||||||||||||||||||||||||||||||||||||||||||||||||||||||||||||||||||||||||||||||||||||||||||||||||||||||||||||||||||||||||||||||||||||||||||||||||||||||||||||||||||||||||||||||||||||||||||||||||||||||||||||||||||||||||||||||||||||||||||||||||||||||||||||||||||||||||||||||||||||||||||||||||||||||||||||||||||||||||||||||||||||||||||||||||||||||||||||||||||||||||||||||||||||||||||||||||||||||||||||||||||||||||||||||||||||||||||||||||||||||||||||||||||||||||||||||||||||||||||||||||||||||||||||||||||||||||||||||||||||||||||||||||||||||||||||||||||||||||||||||||||||||||||||||||||||||||||||||||||||||||||||||||||||||||||||||||||||||||||||||||||||||||||||||||||||||||||||||||||||||||||||||||||||||||||||||||||||||
| Máximo Pacheco Matte | |||||||||||||||||||||||||||||||||||||||||||||||||||||||||||||||||||||||||||||||||||||||||||||||||||||||||||||||||||||||||||||||||||||||||||||||||||||||||||||||||||||||||||||||||||||||||||||||||||||||||||||||||||||||||||||||||||||||||||||||||||||||||||||||||||||||||||||||||||||||||||||||||||||||||||||||||||||||||||||||||||||||||||||||||||||||||||||||||||||||||||||||||||||||||||||||||||||||||||||||||||||||||||||||||||||||||||||||||||||||||||||||||||||||||||||||||||||||||||||||||||||||||||||||||||||||||||||||||||||||||||||||||||||||||||||||||||||||||||||||||||||||||||||||||||||||||||||||||||||||||||||||||||||||||||||||||||||||||||||||||||||||||||||||||||||||||||||||||||||||||||||||||||||||||||||||||||||||||||||||||||||||||||||||||||||||||||||||||||||||||||||||||||||||||||||||||||||||||||||||||||||||||||||||||||||||||||||||||||||||||||||||||||||||||||||||||||||||||||||||||||||||||||||||||||||||||||||||||||||||||||||||||||||||||||||||||||||||||||||||||||||||||||||||||||||||||||||||||||||||
| Francisco Pérez Mackenna | |||||||||||||||||||||||||||||||||||||||||||||||||||||||||||||||||||||||||||||||||||||||||||||||||||||||||||||||||||||||||||||||||||||||||||||||||||||||||||||||||||||||||||||||||||||||||||||||||||||||||||||||||||||||||||||||||||||||||||||||||||||||||||||||||||||||||||||||||||||||||||||||||||||||||||||||||||||||||||||||||||||||||||||||||||||||||||||||||||||||||||||||||||||||||||||||||||||||||||||||||||||||||||||||||||||||||||||||||||||||||||||||||||||||||||||||||||||||||||||||||||||||||||||||||||||||||||||||||||||||||||||||||||||||||||||||||||||||||||||||||||||||||||||||||||||||||||||||||||||||||||||||||||||||||||||||||||||||||||||||||||||||||||||||||||||||||||||||||||||||||||||||||||||||||||||||||||||||||||||||||||||||||||||||||||||||||||||||||||||||||||||||||||||||||||||||||||||||||||||||||||||||||||||||||||||||||||||||||||||||||||||||||||||||||||||||||||||||||||||||||||||||||||||||||||||||||||||||||||||||||||||||||||||||||||||||||||||||||||||||||||||||||||||||||||||||||||||||||||||||
| Segismundo Schulin-Zeuthen Serrano | |||||||||||||||||||||||||||||||||||||||||||||||||||||||||||||||||||||||||||||||||||||||||||||||||||||||||||||||||||||||||||||||||||||||||||||||||||||||||||||||||||||||||||||||||||||||||||||||||||||||||||||||||||||||||||||||||||||||||||||||||||||||||||||||||||||||||||||||||||||||||||||||||||||||||||||||||||||||||||||||||||||||||||||||||||||||||||||||||||||||||||||||||||||||||||||||||||||||||||||||||||||||||||||||||||||||||||||||||||||||||||||||||||||||||||||||||||||||||||||||||||||||||||||||||||||||||||||||||||||||||||||||||||||||||||||||||||||||||||||||||||||||||||||||||||||||||||||||||||||||||||||||||||||||||||||||||||||||||||||||||||||||||||||||||||||||||||||||||||||||||||||||||||||||||||||||||||||||||||||||||||||||||||||||||||||||||||||||||||||||||||||||||||||||||||||||||||||||||||||||||||||||||||||||||||||||||||||||||||||||||||||||||||||||||||||||||||||||||||||||||||||||||||||||||||||||||||||||||||||||||||||||||||||||||||||||||||||||||||||||||||||||||||||||||||||||||||||||||||||||
| Deputy Directors: | Edmundo Eluchans Urenda | ||||||||||||||||||||||||||||||||||||||||||||||||||||||||||||||||||||||||||||||||||||||||||||||||||||||||||||||||||||||||||||||||||||||||||||||||||||||||||||||||||||||||||||||||||||||||||||||||||||||||||||||||||||||||||||||||||||||||||||||||||||||||||||||||||||||||||||||||||||||||||||||||||||||||||||||||||||||||||||||||||||||||||||||||||||||||||||||||||||||||||||||||||||||||||||||||||||||||||||||||||||||||||||||||||||||||||||||||||||||||||||||||||||||||||||||||||||||||||||||||||||||||||||||||||||||||||||||||||||||||||||||||||||||||||||||||||||||||||||||||||||||||||||||||||||||||||||||||||||||||||||||||||||||||||||||||||||||||||||||||||||||||||||||||||||||||||||||||||||||||||||||||||||||||||||||||||||||||||||||||||||||||||||||||||||||||||||||||||||||||||||||||||||||||||||||||||||||||||||||||||||||||||||||||||||||||||||||||||||||||||||||||||||||||||||||||||||||||||||||||||||||||||||||||||||||||||||||||||||||||||||||||||||||||||||||||||||||||||||||||||||||||||||||||||||||||||||||||||||||
| Jorge Ergas Heymann | |||||||||||||||||||||||||||||||||||||||||||||||||||||||||||||||||||||||||||||||||||||||||||||||||||||||||||||||||||||||||||||||||||||||||||||||||||||||||||||||||||||||||||||||||||||||||||||||||||||||||||||||||||||||||||||||||||||||||||||||||||||||||||||||||||||||||||||||||||||||||||||||||||||||||||||||||||||||||||||||||||||||||||||||||||||||||||||||||||||||||||||||||||||||||||||||||||||||||||||||||||||||||||||||||||||||||||||||||||||||||||||||||||||||||||||||||||||||||||||||||||||||||||||||||||||||||||||||||||||||||||||||||||||||||||||||||||||||||||||||||||||||||||||||||||||||||||||||||||||||||||||||||||||||||||||||||||||||||||||||||||||||||||||||||||||||||||||||||||||||||||||||||||||||||||||||||||||||||||||||||||||||||||||||||||||||||||||||||||||||||||||||||||||||||||||||||||||||||||||||||||||||||||||||||||||||||||||||||||||||||||||||||||||||||||||||||||||||||||||||||||||||||||||||||||||||||||||||||||||||||||||||||||||||||||||||||||||||||||||||||||||||||||||||||||||||||||||||||||||||
(c) Board of Directors Meeting No. 2,596 held on March 24, 2005, agreed to begin the process of selling 1,701,994,590 shares of Banco de Chile acquired through the Share Repurchase Program issued by Banco de Chile during April 2004, as stated in articles 27 to 27 D of Law 18,046 on Corporations, in accordance with what was agreed upon at the Extraordinary Shareholders’ Meeting held on March 20, 2003 and the approval of the Superintendency of Banks and Financial Institutions in letter No. 6,650 dated June 5, 2003.
Likewise, in accordance with Article 27 C of the Corporations Law, Article 25 of Law No. 19,396 and Agreement No. 1194-01-050505 issued by the Chilean Central Bank, the remaining shares equivalent to 2.4959% of shares issued by Banco de Chile were registered for sale to third parties in the Santiago Stock Exchange (“Bolsa de Comercio de Santiago”), Securities Exchange (“Bolsa de Valores”). That process began on July 25 and ended on August 2, 2005 with the total liquidation of the 1,699,220,748 shares at a price of Ch$34.5 per share. The complete transaction involving the sale of shares issued by Banco de Chile, implied a credit to shareholders’ equity “Reserves” in the amount of MCh$57,636.9 (in historical pesos). BANCO DE CHILE AND SUBSIDIARIES NOTES TO THE CONSOLIDATED FINANCIAL STATEMENTS (Continued) (Restated for general price - level changes and expressed in millions of constant Chilean pesos as of December 31, 2005) 30. Relevant Events (continued) (d) On October 12, 2005, Banco de Chile entered into agreements with the Office of the Comptroller of the Currency (OCC), and separately with the Financial Crimes Enforcement Network (FinCEN) requiring its New York and Miami branches (“the U.S. Branches”) a total payment of a three million dollars civil money penalty to resolve allegations related to Bank Secrecy Act, in particular its U.S. anti – money laundering compliance program and suspicious activity reporting obligations. Likewise and with the same date, the Financial Crimes Enforcement Network issued an Assessment of Civil Money Penalty, and the Office of the Comptroller of the Currency issued a Consent Order for Civil Money Penalty. (e) On December 29, 2005, Banco de Chile informed that on December 28, it had signed a Mortgage life Insurance Agreement with Banchile Seguros de Vida S.A., a company related to Banco de Chile, which states the particular terms of the mortgage insurance purchased by Banco de Chile for its portfolio of debtors with the mentioned entity, in accordance with Article 44 of the Corporations Law. Banco de Chile’s Board deemed that the price and other terms of the transactions are in accordance with the conditions normally prevailing in the market. F-75 | |||||||||||||||||||||||||||||||||||||||||||||||||||||||||||||||||||||||||||||||||||||||||||||||||||||||||||||||||||||||||||||||||||||||||||||||||||||||||||||||||||||||||||||||||||||||||||||||||||||||||||||||||||||||||||||||||||||||||||||||||||||||||||||||||||||||||||||||||||||||||||||||||||||||||||||||||||||||||||||||||||||||||||||||||||||||||||||||||||||||||||||||||||||||||||||||||||||||||||||||||||||||||||||||||||||||||||||||||||||||||||||||||||||||||||||||||||||||||||||||||||||||||||||||||||||||||||||||||||||||||||||||||||||||||||||||||||||||||||||||||||||||||||||||||||||||||||||||||||||||||||||||||||||||||||||||||||||||||||||||||||||||||||||||||||||||||||||||||||||||||||||||||||||||||||||||||||||||||||||||||||||||||||||||||||||||||||||||||||||||||||||||||||||||||||||||||||||||||||||||||||||||||||||||||||||||||||||||||||||||||||||||||||||||||||||||||||||||||||||||||||||||||||||||||||||||||||||||||||||||||||||||||||||||||||||||||||||||||||||||||||||||||||||||||||||||||||||||||||||||