
12 (g) OF THE SECURITIES EXCHANGE ACT OF 1934
OR
SECURITIES AND EXCHANGE COMMISSION
Washington, D.C. 20549
FORM 20-F
| | REGISTRATION STATEMENT PURSUANT TO SECTION 12(b) OR 12 (g) OF THE SECURITIES EXCHANGE ACT OF 1934 OR |
OR
 | ANNUAL REPORT PURSUANT TO SECTION 13 OR 15(d) OF THE SECURITIES EXCHANGE ACT OF 1934 FOR THE FISCAL YEAR ENDED DECEMBER 31, 2007 OR |
For the fiscal year ended December 31, 2004
OR
| | TRANSITION REPORT PURSUANT TO SECTION 13 OR 15(d) OR |
Commission file number: 001-14862
| | SHELL COMPANY REPORT PURSUANT TO SECTION 13 OR 15(d) |
(Exact Name of Registrant as Specified in its Charter)
N/A
(Translation of Registrant’sRegistrant's name into English)
Federative Republic of Brazil
(Jurisdiction of Incorporation or Organization)
Av. das Nações Unidas, 4777
São Paulo, SP—CEP 05477-000 Brazil
(Address of principal executive offices) (Zip code)
Carlos Fadigas
Braskem S.A.
Av. das Nações Unidas, 4777
São Paulo, SP—CEP 05477-000 Brazil
Telephone: + (55 11) 3576-9531
Fax: + (55 11) 3576-9532
(Name, Telephone, E-mail and/or Facsimile Number and Address of Company Contact Person
Title of each class | Name of Each Exchange on which Registered | |
Preferred Shares, Class A, no par value per share, each | New York Stock Exchange | |
| represented by American Depositary Receipts |
Securities registered pursuant to Section 12(g) of the Act:
None
Securities for which there is a reporting obligation pursuant to Section 15(d) of the Act:
None
The total number of issued shares of each class of stock of BRASKEMBraskem S.A. as of December 31, 20042007 was: 149,810,870 Common Shares, no par value per share, 298,818,675 Preferred Shares, Class A, no par value per share, and 803,066 Preferred Shares, Class B, no par value per share.
Indicate by check mark if the registrant is a well-known seasoned issuer, as defined in Rule 405 of the Securities Act.
Yes No If this report is an annual or transition report, indicate by check mark if the registrant is not required to file reports pursuant to Section 13 or 15(d) of the Securities Exchange Act of 1934. Yes No
| ||
| ||
|
Indicate by check mark whether the Registrantregistrant (1) has filed all reports required to be filed by Section 13 or 15(d) of the Securities Exchange Act of 1934 during the preceding 12 months (or for such shorter period that the Registrantregistrant was required to file such reports), and (2) has been subject to such filing requirements for the past 90 days.
No Indicate by check mark whether the registrant is a large accelerated filer, an accelerated filer, or a non-accelerated filer. See definition of “accelerated filer and large accelerated filer” in Rule 12b-2 of the Exchange Act. (Check one):
Accelerated Filer Non-accelerated Filer Indicate by check mark which basis of accounting the registrant has used to prepare the financial statements included in this filing:
U.S. GAAP | International Financial Reporting Standards as issued by the International Accounting Standards Board | Other |
Indicate by check mark which financial statement item the Registrantregistrant has elected to follow follow.
Item 18 If this is an annual report, indicate by check mark whether the registrant is a shell company (as defined in Rule 12b-2 of the Exchange Act).
No INTRODUCTION
ReferencesAll references herein to the “real,” “reais” or “R$” are to Brazilianreais(plural) and to the Brazilianreal(singular), the official currency of Brazil; andBrazil. All references to “U.S. dollars,” “dollars” or “US$” are to United StatesU.S. dollars.
All references herein (i)(1) to “we,” “us” or “our company” are references to Braskem S.A. and, its consolidated subsidiaries and (ii)jointly controlled entities, and (2) to “Braskem” are references solely to Braskem S.A.
On December 31, 2004,June 27, 2008, the exchange rate forreaisinto U.S. dollars was R$2.6541.6077 to US$1.00, based on the commercial selling rate as reported by the Central Bank of Brazil (Banco Central do Brasil), or the Central Bank. The commercial selling rate was R$2.8891.7713 to US$1.00 at December 31, 2003.2007, R$2.138 to US$1.00 at December 31, 2006 and the commercial selling rate was R$2.341 to US$1.00 at December 31, 2005, in each case, as reported by the Central Bank. Thereal/U.S. dollar exchange rate fluctuates widely, and the commercial selling rate at December 31, 2003June 27, 2008 may not be indicative of future exchange rates. See “Item 3. Key Information—Exchange Rates” for information regarding exchange rates for the Brazilian currency since January 1, 2000.2003.
Solely for the convenience of the reader, we have translated some amounts included in “Item 3. Key Information—Selected Financial Information” and elsewhere in this annual report fromreaisinto U.S. dollars using the commercial selling rate as reported by the Central Bank at December 31, 20042007 of R$2.6541.7713 to US$1.00. These translations should not be considered representations that any such amounts have been, could have been or could be converted into U.S. dollars at that or at any other exchange rate. Such translations should not be construed as representations that therealamounts represent or have been or could be converted into U.S. dollars as of that or any other date.
Financial Statements
Braskem Financial Statements
We maintain our books and records inreaisreais..
Our consolidated and combined financial statements at December 31, 20042007 and 20032006 and for each of the three years ended December 31, 2004, 2003 and 20022007 have been audited, as stated in the report appearing herein, and are included in this annual report.
We prepare our consolidated financial statements in accordance with accounting practices adopted in Brazil, or Brazilian GAAP, which are based on:
Brazilian GAAP differs in significantcertain respects from accounting principles generally accepted in the United States, or U.S. GAAP. For more information about thea discussion of certain differences between Brazilian GAAP and U.S. GAAP and a reconciliation of our net income (loss) and shareholders’ equity from Brazilian GAAPrelating to U.S. GAAP,these financial statements, see note 2931 to our audited consolidated and combined financial statements included elsewhere in this annual report.
Consistent with Brazilian GAAP, our audited consolidated and combined financial statements at December 31, 20042007 and 20032006 and for the three years ended December 31, 2004, 2003 and 20022007 have been prepared in accordance with Brazilian Securities CommissionCVM Instruction No. 247/96, as amended, by Brazilian Securities Commission Instruction Nos. 269/97, 285/98 and 319/99, which we refer to collectively asor Instruction 247. Instruction 247
requires our company to proportionally consolidate proportionally jointly controlled companies that are not our subsidiaries but which we jointly control with one or more other shareholders. The U.S. GAAP reconciliation eliminates
Our consolidated financial statements reflect reclassifications in 2005 of the following items to provide a better comparison among 2006 and 2005:
Copesul Financial Statements
We have included separatePrior to March 31, 2006, we proportionally consolidated the results of Politeno Indústria e Comércio S.A., or Politeno, in our consolidated financial statements. As a result of the Politeno Acquisition described under “Item 4. Information On The Company—History and Development of Our Company—Developments Since January 1, 2005,” we have fully consolidated Politeno’s results in our consolidated financial statements and included Politeno’s results in our Polyolefins segment as from April 1, 2006. Politeno merged with and into Braskem on April 2, 2007.
Prior to March 31, 2007, we proportionally consolidated the results of Copesul—Companhia Petroquímica do Sul, or Copesul, in our consolidated financial statements. As a result of the Ipiranga Transaction described under “Item 4. Information on the Company—Ipiranga Transaction,” we have fully consolidated Copesul’s results in our consolidated financial statements and included Copesul’s results as a separate segment as from April 1, 2007.
Copesul and Ipiranga Química S.A., or Ipiranga Química, maintain their books and records inreais and prepare their consolidated financial statements in accordance with Brazilian GAAP.
Copesul Financial Statements
Prior to April 1, 2007, Copesul’s consolidated financial statements were proportionally consolidated into the Braskem’s consolidated financial statements under Brazilian GAAP, as described above under “—Braskem Financial Statements.” As a result of the Ipiranga Transaction and our obtaining effective management control over the 29.5% of the share capital of Copesul then owned by Ipiranga Petroquímica, we have fully consolidated the results of Copesul and its subsidiaries into our financial statements as from April 1, 2007. As a result of the completion of the first phase of the Petrobras Transaction, the minority interest in Copesul represents only 0.8% of the total share capital of Copesul.
We have included separate consolidated financial statements of Copesul in this annual report because Copesul constitutesconstituted a “significant” jointly controlled company, accounting for 38.8%85.0% of our income from continuing operations before income taxes in 2004.the three months ended March 31, 2007 and 96.6% in 2006. Copesul maintains its books and records inreais and prepares its financial statements in accordance with Brazilian GAAP.
Copesul’s consolidated financial statements at December 31, 20042007 and 20032006 and for each of the years ended December 31, 2004, 20032007, 2006 and 20022005 included in this annual report have been audited, as stated in the report appearing herein. Copesul’s consolidated financial statements are proportionally consolidated intoat March 31, 2008 and for each of the Braskem’s consolidated financial statements under Brazilian GAAP, as described above under “—Braskem Financial Statements.”three month periods ended March 31, 2008 and 2007 included in this annual report have not been audited.
2
Share Splits
Share Splits
On October 20, 2003, we authorized the split of all of our issued common shares, class A preferred shares and class B preferred shares into 20 shares for each issued share. This 20-for-one share split was effective on October 21, 2003. As a result of this share split, the ratio of our class A preferred shares to American DepositaryDepository Shares, or ADSs, changed from 50 class A preferred shares per ADS to 1,000 class A preferred shares per ADS.
On March 31, 2005, we authorized the reverse split of all of our issued common shares, class A preferred shares and class B preferred shares into one share for each 250 issued shares. This reverse share split became effective on May 16, 2005. In connection with this reverse share split, we authorized a change in the ratio of our ADSs uponADSs. Upon the effectiveness of our reverse share split and the ratio change, the ratio of our class A preferred shares to ADSs changed from 1,000 class A preferred shares per ADS to two class A preferred shares per ADS.
All references to numbers of shares and dividend amounts in this annual report have been adjusted to give effect to the 20-for-one share split and the one-for-250 reverse share split and the change in the ratio of our class A preferred shares to ADSs.split.
Market Share and Other Information
We make statements in this annual report about our market share in the petrochemical industry in Brazil and our production capacity relative to that of other petrochemical producers in Brazil and Latin America. We have made these statements on the basis of information obtained from third partythird-party sources that we believe are reliable. We have calculated our Brazilian market shares with respect to specific products by dividing our domestic net sales volumes of these products by the total Brazilian domestic consumption of these products estimated by the Brazilian Association of Chemical Industry and Derivative Products (Associação Brasileira de Indústrias Químicas e de Produtos Derivados). We derive information regarding the production capacity of other companies in the Brazilian petrochemical industry and the estimated total Brazilian domestic consumption of petrochemical products principally from reports published by the Brazilian Association of Chemical Industry and Derivative Products. Although we have no reason to believe that any of this information is inaccurate in any material respect, neither we nor the initial purchasers have not independently verified the production capacity, market share, market size or similar data provided by third parties or derived from industry or general publications.
Production Capacity and Sales Volume
As used in this annual report:
Rounding
We have made rounding adjustments to reach some of the figures included in this annual report. As a result, numerical figures shown as totals in some tables may not be an arithmetic aggregationaggregations of the figures that precededprecede them.
3
CAUTIONARY STATEMENT WITH RESPECT TO FORWARD-LOOKING STATEMENTS
This annual report contains forward-looking statements. Some of the matters discussed concerning our business operations and financial performance include forward-looking statements within the meaning of the Securities Act or the U.S. Securities Exchange Act of 1934, as amended, or the Exchange Act.
Statements that are predictive in nature, that depend upon or refer to future events or conditions or that include words such as “expects,” “anticipates,” “intends,” “plans,” “believes,” “estimates” and similar expressions are forward-looking statements. Although we believe that these forward-looking statements are based upon reasonable assumptions, these statements are subject to several risks and uncertainties and are made in light of information currently available to us.
Our forward-looking statements may be influenced by factors, including the following:
Our forward-looking statements are not guarantees of future performance, and theour actual results or other developments may differ materially from the expectations expressed in the forward-looking statements. As for the forward-looking statements that relate to future financial results and other projections, actual results will be different due to the inherent uncertainty of estimates, forecasts and projections. Because of these uncertainties, potential investors should not rely on these forward-looking statements.
We undertake no obligation to publicly update any forward-looking statement, whether as a result of new information, future events or otherwise.
4
ITEM 1. IDENTITY OF DIRECTOR, SENIOR MANAGEMENT AND ADVISER
Not applicable.
ITEM 2. OFFER STATISTICS AND EXPECTED TIMETABLE
Not applicable.
Selected Financial Information
The following selected financial data hashave been derived from our consolidated and combined financial statements.
The selected financial data at December 31, 20042007 and 20032006 and for the three years ended December 31, 20042007 have been derived from our consolidated and combined financial statements included in this annual report. The selected financial data at December 31, 20022005, 2004 and 20012003 and for the yearyears ended December 31, 2001 has2004 and 2003 have been derived from our audited consolidated and combined financial statements that are not included in this annual report. The selected financial data at December 31, 2000
Prior to the Ipiranga Transaction, we owned 29.5% of the voting and total share capital of Copesul, and we were required, under Brazilian GAAP, to account for the year ended December 31, 2000 have been derived from auditedour interests in Copesul in our consolidated financial statements using the proportional consolidation method, including for the first three months of 2007. As a result of the Ipiranga Transaction and our company that are not includedobtaining effective management control over the 29.5% of the share capital of Copesul then owned by Ipiranga Petroquímica, we have fully consolidated the results of Copesul and its subsidiaries into our financial statements as from April 1, 2007. In addition, as a result of the Ipiranga Transaction, we have consolidated the results of Ipiranga Química and Ipiranga Petroquímica in this annual report.our consolidated financial statements as from April 1, 2007.
Our consolidated financial statements are prepared in accordance with Brazilian GAAP, which differs in significantcertain respects from U.S. GAAP. For a discussion of thecertain differences relating to these financial statements, and a reconciliation of our net income (loss) and shareholders’ equity from Brazilian GAAP to U.S. GAAP, see note 2931 to our audited consolidated and combined financial statements included in this annual report.
| At and for the Year Ended December 31, | ||||||||||||
| 2007(1) | 2007 | 2006 | 2005 | 2004 | 2003(2) | |||||||
| (in millions of | (in millions ofreais, except financial ratios) | |||||||||||
| US$, except | ||||||||||||
| financial | ||||||||||||
| ratios) | ||||||||||||
| Statement of Operations Data | ||||||||||||
| Brazilian GAAP: | ||||||||||||
| Net sales revenue | US$9,981.0 | R$17,679.4 | R$12,992.7 | R$13,075.1 | R$12,389.5 | R$10,300.2 | ||||||
| Cost of sales and services rendered | (8,152.8) | (14,441.0) | (10,792.1) | (10,361.7) | (9,223.0) | (8,224.6) | ||||||
| Gross profit | 1,828.2 | 3,238.4 | 2,200.6 | 2,713.4 | 3,166.5 | 2,075.6 | ||||||
| Selling, general and administrative expenses | (699.2) | (1,238.5) | (951.5) | (787.1) | (677.0) | (488.4) | ||||||
| Depreciation and amortization | (270.5) | (479.1) | (385.0) | (355.6) | (359.7) | (193.5) | ||||||
| Other operating income, net | 74.2 | 131.5 | 186.1 | 22.8 | 43.0 | 55.5 | ||||||
| Operating income before equity accounting and financial income (expense) | 932.7 | 1,652.3 | 1,050.2 | 1,593.5 | 2,172.8 | 1,449.2 | ||||||
| Results from equity accounting(3) | (60.6) | (107.3) | (28.8) | (109.8) | (107.6) | (170.5) | ||||||
| Financial expenses | (101.7) | (180.1) | (1,097.9) | (675.8) | (1,307.2) | (720.8) | ||||||
| Financial income | (64.1) | (113.5) | 159.5 | (33.6) | 68.6 | 9.2 | ||||||
| Operating income | 706.3 | 1,251.4 | 83.0 | 774.3 | 826.6 | 567.1 | ||||||
| Non-operating expenses, net | (37.9) | (67.2) | 7.1 | (25.2) | (29.8) | (4.5) | ||||||
| Income before income tax and | 668.4 | 1,184.2 | 90.1 | 749.1 | 796.8 | 562.6 | ||||||
5
This financial information should be read in conjunction with “Item 5. Operating and Financial Review and Prospects” and our audited consolidated and combined financial statements included elsewhere in this annual report.Table of Contents
| At and for the Year Ended December 31, | ||||||||||||
| 2007(1) | 2007 | 2006 | 2005 | 2004 | 2003(2) | |||||||
| (in millions of | (in millions ofreais, except financial ratios) | |||||||||||
| US$, except | ||||||||||||
| financial | ||||||||||||
| ratios) | ||||||||||||
| social contribution (current and deferred) and minority interest | ||||||||||||
| Income tax and social contribution (current and deferred) | (212.8) | (377.0) | 12.8 | (177.3) | (85.1) | (121.3) | ||||||
| Income before profit sharing and minority interest | 455.6 | 807.2 | 102.9 | 571.8 | 711.7 | 441.3 | ||||||
| Profit sharing | (10.6) | (18.7) | — | — | — | — | ||||||
| Income before minority interest | 445.0 | 788.5 | 102.9 | 571.8 | 711.7 | 441.3 | ||||||
| Minority interest | (136.0) | (240.9) | (1.6) | 54.0 | (24.6) | (226.2) | ||||||
| Net income | US$309.0 | R$547.6 | R$101.3 | R$625.8 | R$687.1 | R$215.1 | ||||||
| Number of shares outstanding at year end, excluding treasury shares (in thousands): | ||||||||||||
| Common shares | 149,810 | 123,492 | 120,860 | 120,860 | 102,432 | |||||||
| Class A preferred shares | 282,223 | 231,744 | 240,393 | 240,373 | 170,379 | |||||||
| Class B preferred shares | 803 | 803 | 803 | 842 | 916 | |||||||
| Net income (loss) per share at year end | 0.71 | 1.27 | 0.28 | 1.73 | 1.90 | 0.79 | ||||||
| Net income (loss) per ADS at year end | 1.42 | 2.53 | 0.57 | 3.46 | 3.80 | 1.57 | ||||||
| Dividends declared per share: | ||||||||||||
| Common shares | 0.36 | 0.64 | — | 0.90 | 0.56 | — | ||||||
| Class A preferred shares | 0.36 | 0.64 | 0.16 | 0.90 | 0.56 | — | ||||||
| Class B preferred shares | 0.36 | 0.64 | 0.16 | 0.56 | 0.56 | — | ||||||
| Dividends declared per ADS | 0.73 | 1.29 | 0.32 | 1.80 | 1.12 | — | ||||||
| U.S. GAAP: | ||||||||||||
| Net income (loss) for the year | US$ 82.2 | R$ 145.6 | R$161.6 | R$741.2 | R$843.1 | R$378.1 | ||||||
| Basic earnings (loss) per share (weighted average): | ||||||||||||
| Common shares | 1.51 | 2.68 | 0.13 | 2.05 | 2.63 | 1.41 | ||||||
| Class A preferred shares | 1.58 | 2.79 | 0.59 | 2.05 | 2.69 | 1.37 | ||||||
| Class B preferred shares | 1.55 | 2.75 | 0.63 | 0.63 | 0.56 | 0.44 | ||||||
| Basic earnings (loss) per ADS | ||||||||||||
| (weighted average) | 3.15 | 5.58 | 1.18 | 4.10 | 5.38 | 2.74 | ||||||
| Diluted earnings (loss) per share | ||||||||||||
| (weighted average): | ||||||||||||
| Common shares | 1.56 | 2.76 | 0.13 | 1.95 | 2.40 | 1.41 | ||||||
| Class A preferred shares | 1.58 | 2.79 | 0.59 | 1.95 | 2.40 | 1.37 | ||||||
| Class B preferred shares | 1.55 | 2.75 | 0.63 | 0.63 | 0.56 | 0.44 | ||||||
| Diluted earnings (loss) per ADS (weighted average) | 3.03 | 5.36 | 1.18 | 3.90 | 4.80 | 2.40 | ||||||
| Balance Sheet Data | ||||||||||||
| Brazilian GAAP: | ||||||||||||
| Cash, cash equivalents and other investments | US$1,207.5 | R$2,138.8 | R$1,961.0 | R$2,281.5 | R$1,815.6 | R$1,221.2 | ||||||
| Short-term trade accounts receivable | 845.1 | 1,497.0 | 1,594.9 | 1,493.3 | 1,630.6 | 1,241.0 | ||||||
| Short-term inventories | 1,278.3 | 2,264.3 | 1,767.3 | 1,567.4 | 1,562.4 | 1,092.3 | ||||||
| Property, plant and equipment, net | 4,744.6 | 8,404.1 | 6,688.7 | 6,364.4 | 5,830.4 | 5,090.9 | ||||||
| Total assets | 11,794.7 | 20,892.0 | 16,304.3 | 15,590.8 | 15,050.4 | 14,005.6 | ||||||
6
All per share data presented below for periods before October 21, 2003 have been adjusted to give effect to the 20-for-one share split that was effective on that date, and all per share data presented below have been further adjusted to give effect to the one-for-250 reverse share split that was effective on May 16, 2005.Table of Contents
| At and for the Year Ended December 31, | ||||||||||||||||||||||||
| 2004(1) | 2004 | 2003 | 2002 | 2001(2) | 2000 | |||||||||||||||||||
(in millions of per share and per ADS amounts and financial ratios) | (in millions ofreais, except per share , number of shares and per ADS amounts and financial ratios) | |||||||||||||||||||||||
Statement of Operations Data | ||||||||||||||||||||||||
Brazilian GAAP: | ||||||||||||||||||||||||
Net sales revenue | US$ | 4,593.1 | R$ | 12,192.0 | R$ | 10,135.8 | R$ | 7,576.6 | R$ | 4,459.5 | R$ | 2,897.5 | ||||||||||||
Cost of sales and services rendered | (3,420.1 | ) | (9,078.3 | ) | (8,089.3 | ) | (6,175.5 | ) | (3,637.6 | ) | (2,357.1 | ) | ||||||||||||
Gross profit | 1,173.0 | 3,113.7 | 2,046.5 | 1,401.1 | 821.9 | 540.4 | ||||||||||||||||||
Selling and general and administrative expenses | (244.9 | ) | (650.0 | ) | (471.9 | ) | (577.7 | ) | (210.3 | ) | (116.2 | ) | ||||||||||||
Investment in associated companies, net(3) | (34.2 | ) | (90.9 | ) | (158.2 | ) | (251.7 | ) | (214.3 | ) | (3.6 | ) | ||||||||||||
Depreciation and amortization | (135.4 | ) | (359.4 | ) | (193.5 | ) | (222.4 | ) | (111.3 | ) | (36.5 | ) | ||||||||||||
Financial expenses | (486.4 | ) | (1,291.0 | ) | (712.6 | ) | (3,481.5 | ) | (801.2 | ) | (250.0 | ) | ||||||||||||
Financial income | 22.7 | 60.3 | 9.0 | 619.6 | 294.7 | 178.6 | ||||||||||||||||||
(in millions of per share and per ADS amounts and financial ratios) (in millions ofreais, except per share, number of shares and per ADS amounts and financial ratios) Zero-rated IPI credit Other operating income (expenses) Operating income (loss) Non-operating expenses, net Income (loss) before income tax and social contribution (current and deferred) and minority interest Income tax and social contribution (current and deferred) Income (loss) before minority interest Minority interest Net income (loss) for the year or period Number of shares outstanding at year end, excluding treasury shares (in thousands): Common shares Class A preferred shares Class B preferred shares Net income (loss) per share at year end Net income (loss) per ADS at year end (4) Dividends declared per share: Common shares Class A preferred shares Class B preferred shares Dividends declared per ADS U.S. GAAP: Net income (loss) for the year Basic earnings (loss) per share (weighted average): Common shares Class A preferred shares Class B preferred shares Basic earnings (loss) per ADS (weighted average) Diluted earnings (loss) per share (weighted average)(4): Common shares Class A preferred shares Class B preferred shares Diluted earnings (loss) per ADS (weighted average)(4) Balance Sheet Data Brazilian GAAP: Cash, cash equivalents and other investments Trade accounts receivable Inventories Property, plant and equipment, net Total assets Short-term loans and financing (including current portion of long-term debt) Short-term debentures Short-term related company debt Long-term loans and financing Long-term debentures Long-term related company debt Minority interest Share capital Shareholders’ equity At and for the Year Ended December 31, 2004(1) 2004 2003 2002 2001(2) 2000
US$, except — — — 1,030.1 — — 15.7 41.6 49.7 102.6 103.3 (12.5 ) 310.5 824.3 569.0 (1,379.9 ) (117.2 ) 300.2 (11.2 ) (29.9 ) (4.8 ) (98.0 ) (120.8 ) (0.6 ) 299.3 794.4 564.2 (1,477.9 ) (238.0 ) 299.6 (29.7 ) (78.9 ) (122.9 ) (89.8 ) (77.6 ) (73.3 ) 269.6 715.5 441.3 (1,567.7 ) (315.6 ) 226.3 (9.3 ) (24.6 ) (226.2 ) 189.0 (108.9 ) 1.3 US$ 260.3 R$ 690.9 R$ 215.1 R$ (1,378.7 ) R$ (424.5 ) R$ 227.6 120,860 102,432 98,087 51,735 51,735 240,373 170,379 168,491 86,371 86,371 842 916 916 916 916 0.72 1.91 0.79 (5.15 ) (3.05 ) 1.64 1.44 3.82 1.57 (10.31 ) (6.11 ) 3.27 0.21 0.56 — — 0.43 0.86 0.21 0.56 — 0.13 0.52 0.86 0.21 0.56 — 0.13 0.52 0.52 0.42 1.12 — — 1.04 1.72 US$ 334.5 R$ 887.8 R$ 378.1 R$ (1,144.0 ) R$ (471.0 ) 1.04 2.77 1.41 (11.93 ) (6.68 ) 1.07 2.83 1.37 — — 0.19 0.51 0.44 — — 2.13 5.66 2.74 — — R$ 1.04 R$ 2.77 R$ 1.40 R$ (11.93 ) R$ (6.68 ) 1.07 2.83 1.37 — — 0.19 0.51 0.44 — — 2.13 5.66 2.74 — — US$ 668.2 R$ 1,773.8 R$ 1,184.3 R$ 821.0 R$ 513.2 R$ 708.9 515.0 1,366.9 1,216.2 959.0 484.1 231.6 578.7 1,536.1 1,071.6 889.1 667.8 163.4 2,033.3 5,397.2 5,352.9 5,296.7 4,429.7 1,969.0 5,610.6 14,892.9 13,943.5 13,898.2 9,555.3 3,748.7 668.9 1,775.6 2,759.2 2,746.1 1,966.4 331.5 1.9 5.0 349.0 32.1 26.2 — — — 0.2 8.2 88.7 — 1,149.5 3,051.2 3,615.3 3,891.6 3,101.7 861.8 440.0 1,167.9 1,143.0 1,190.2 473.6 — 43.6 115.7 177.6 189.3 626.7 0.9 76.5 203.1 554.4 433.1 738.0 27.4 1,282.0 3,403.0 1,887.4 1,845.4 1,201.6 1,203.9 1,577.6 4,187.5 2,112.6 1,821.8 1,729.0 2,267.8
(in millions of per share and per ADS amounts and financial ratios) (in millions ofreais, except per share, number of shares and per ADS amounts and financial ratios) U.S. GAAP: Total assets Shareholders’ equity Other Financial Information Brazilian GAAP: Net cash provided by (used in): Operating activities Investing activities Financing activities Capital expenditures: Property, plant and equipment Interest in other companies At and for the Year Ended December 31, 2004(1) 2004 2003 2002 2001(2) 2000
US$, except US$ 4,830.1 R$ 12,821.0 R$ 11,058.2 R$ 10,531.7 R$ 7,803.0 975.3 2,588.9 7.8 (415.2 ) 291.4 US$ 734.3 R$ 1,949.0 R$ 580.5 R$ 790.0 R$ 1,453.9 R$ 550.3 (378.5 ) (1,004.8 ) (460.4 ) (646.7 ) (862.2 ) (115.6 ) 45.0 119.5 367.8 (237.2 ) (404.9 ) (287.2 ) 162.9 432.3 214.7 419.9 318.0 18.4 8.9 23.6 71.7 13.1 1,172.3 82.6
| At and for the Year Ended December 31, | ||||||||||
| 2004 | 2003 | 2002 | 2001(2) | 2000 | ||||||
Operating Data(5): | ||||||||||
Ethylene: | ||||||||||
Domestic sales volume (in thousands of tons) | 1,098.9 | 1,047.3 | 994.8 | 1,064.8 | 1,103.8 | |||||
Average domestic price per ton (in R$) | 2,095 | 1,655 | 1,292 | 1,135 | 1,090 | |||||
Propylene: | ||||||||||
Domestic sales volume (in thousands of tons) | 446.8 | 403.4 | 415.2 | 421.1 | 487.7 | |||||
Average domestic price per ton (in R$) | 1,833 | 1,477 | 1,106 | 829 | 875 | |||||
Polyethylene(6): | ||||||||||
Domestic sales volume (in thousands of tons) | 498.7 | 446.1 | 491.7 | 199.3 | ||||||
Average domestic price per ton (in R$) | 2,987 | 2,567 | 2,007 | 2,114 | ||||||
Polypropylene(6): | ||||||||||
Domestic sales volume (in thousands of tons) | 418.5 | 374.9 | 395.1 | 140.4 | ||||||
Average domestic price per ton (in R$) | 3,155 | 2,689 | 1,931 | 1,969 | ||||||
PVC(7): | ||||||||||
Domestic sales volume (in thousands of tons) | 394.4 | 342.4 | 350.1 | 125.9 | ||||||
Average domestic price per ton (in R$) | 3,042 | 2,390 | 2,034 | 1,612 | ||||||
Number of employees (at period end) | 2,996 | 2,868 | 2,817 | 1,424 | 1,161 | |||||
| At and for the Year Ended December 31, | ||||||||||||
| 2007(1) | 2007 | 2006 | 2005 | 2004 | 2003(2) | |||||||
| (in millions of | (in millions ofreais, except financial ratios) | |||||||||||
| US$, except | ||||||||||||
| financial | ||||||||||||
| ratios) | ||||||||||||
| Short-term loans and financing (including current portion of long-term debt)(4) | 603.2 | 1,068.4 | 653.9 | 1,120.4 | 1,808.3 | 2,764.1 | ||||||
| Short-term debentures | 63.0 | 111.6 | 1,157.7 | 9.3 | 5.0 | 353.4 | ||||||
| Short-term related party debt | — | — | — | 3.1 | — | 5.5 | ||||||
| Long-term loans and financing(4) | 3,614.2 | 6,401.9 | 3,935.8 | 3,261.6 | 3,261.4 | 3,628.0 | ||||||
| Long-term debentures | 451.6 | 800.0 | 982.2 | 1,599.3 | 1,167.9 | 1,143.0 | ||||||
| Long-term related party debt | — | — | 4.8 | 3.0 | 115.8 | 177.6 | ||||||
| Minority interest | 337.6 | 598.0 | 21.8 | 121.2 | 203.1 | 554.4 | ||||||
| Share capital | 2,620.1 | 4,641.0 | 3,508.3 | 3,403.0 | 3,403.0 | 1,887.4 | ||||||
| Shareholders’ equity | 3,250.2 | 5,757.0 | 4,311.9 | 4,535.8 | 4,183.7 | 2,112.6 | ||||||
| U.S. GAAP | ||||||||||||
| Total assets | US$ 13,195.45 | R$ 23,373.1 | R$14,890.7 | R$13,634.0 | R$12,671.7 | R$11,058.2 | ||||||
| Shareholders’ equity | 2,840.79 | 5,031.9 | 2,966.8 | 2,918.4 | 2,439.6 | 7.8 | ||||||
| Other Financial Information | ||||||||||||
| Brazilian GAAP: | ||||||||||||
| Cash Flow Data: | ||||||||||||
| Net cash provided by (used in): | ||||||||||||
| Operating activities | US$1,351.5 | R$2,393.8 | R$405.3 | R$1,719.4 | R$1,916.0 | R$596.9 | ||||||
| Investing activities | (2,019.5) | (3,577.1) | (1,213.1) | (1,048.0) | (1,014.4) | (469.4) | ||||||
| Financing activities | 861.7 | 1,526.3 | 219.2 | (329.7) | 166.0 | 379.1 | ||||||
| Other Information: | ||||||||||||
| Capital expenditures: | ||||||||||||
| Property, plant and equipment | US$775.9 | R$1,374.4 | R$953.0 | R$930.2 | R$704.4 | R$223.7 | ||||||
| Investments in other companies | 650.2 | 1,151.7 | 222.7 | 34.0 | 23.6 | 71.7 | ||||||
| At and for the Year Ended December 31, | ||||||||||
| 2007 | 2006 | 2005 | 2004 | 2003 | ||||||
| Operating Data(5): | ||||||||||
| Ethylene: | ||||||||||
| Domestic sales volume (in thousands of tons) | 2,068.4 | 1,108.5 | 1,169.8 | 1,098.9 | 1,047.3 | |||||
| Average domestic price per ton (in R$) | 2,333 | 2,282 | 2,204 | 2,095 | 1,655 | |||||
| Propylene: | ||||||||||
| Domestic sales volume (in thousands of tons) | 945.1 | 413.0 | 497.5 | 446.8 | 403.4 | |||||
| Average domestic price per ton (in R$) | 2,164 | 2,110 | 2,132 | 1,833 | 1,477 | |||||
| Polyethylene: | ||||||||||
| Domestic sales volume (in thousands of tons) | 952.5 | 672.0 | 502.3 | 498.7 | 446.1 | |||||
| Average domestic price per ton (in R$) | 3,552 | 3,276 | 3,072 | 2,987 | 2,567 | |||||
| Polypropylene: | ||||||||||
| Domestic sales volume (in thousands of tons) | 573.3 | 453.2 | 419.9 | 418.5 | 374.9 | |||||
| Average domestic price per ton (in R$) | 3,458 | 3,344 | 3,344 | 3,155 | 2,689 | |||||
| PVC: | ||||||||||
| Domestic sales volume (in thousands of tons) | 464.9 | 400.4 | 378.9 | 394.4 | 342.4 | |||||
| Average domestic price per ton (in R$) | 2,616 | 2,518 | 2,747 | 3,042 | 2,390 | |||||
| Number of employees (at period end) | 4,783 | 3,494 | 3,262 | 2,996 | 2,868 | |||||
| (1) | Translated for convenience only using the |
7
| (2) |
| (3) | |
| (4) | |
| (5) | Including intra-company sales within |
EXCHANGE RATESExchange Rates
Prior to March 14, 2005, there were two principal foreign exchange markets in Brazil:
Most trade and financial foreign-exchange transactions were carried out on the commercial rate exchange market. The floating rate exchange market generally applied to transactions to which the commercial market rate did not apply.
On March 4, 2005, the National Monetary Council (Conselho Monetário Nacional) enacted Resolution No. 3,265, as well as additional regulations, that consolidated the two foreign exchange markets into a single foreign exchange market, effective as of March 14, 2005, in order to make foreign exchange transactions more straight-forwardstraightforward and efficient. Consequently, all foreign exchange transactions in Brazil are now carried out in this single foreign exchange market through authorized financial institutions. We cannot predict the impact of the enactment of any new regulations on the foreign exchange market.
Foreign exchange rates continue to be freely negotiated, but may be influenced from time to time by Central Bank intervention. From March 1995 through January 1999, the Central Bank allowed the gradual devaluationdepreciation of therealagainst the U.S. dollar. In January 1999, the Central Bank allowed thereal/U.S. dollar exchange rate to float freely. Since then, thereal/U.S. dollar exchange rate has been established mainly by the Brazilian interbank market and has fluctuated considerably. From December 31, 19992000 through December 31, 2004,2002, thereal devalueddepreciated by 32.6%80.6% against the U.S. dollar, and atdollar. From December 31, 2002 through December 31, 2007, therealappreciated by 49.9% against the U.S. dollar. At June 24, 2005,27, 2008, the selling rate for U.S. dollars was R$2.3871.6077 per US$1.00. In the past, the Central Bank has intervened occasionally to control unstable movements in foreign exchange rates. We cannot predict whether the Central Bank or the Brazilian government will continue to allow therealto float freely or will intervene in the exchange rate market through a currency band system or otherwise, or that the exchange market will not be volatile as a result of political or economic instability or other factors. We also cannot predict whether therealwill depreciate or appreciate in value in relation to the U.S. dollar in the future.
8
The following table shows the commercial selling rate or selling rate, as applicable, for U.S. dollars for the periods and dates indicated. The information in the “Average” column represents the average of the exchange rates on the last day of each month during the periods presented.
| Reaisper U.S. Dollar | ||||||||
| Year | High | Low | Average | Period End | ||||
| 2003 | R$3.662 | R$2.822 | R$3.071 | R$2.889 | ||||
| 2004 | 3.205 | 2.654 | 2.909 | 2.654 | ||||
| 2005 | 2.762 | 2.163 | 2.413 | 2.341 | ||||
| 2006 | 2.371 | 2.059 | 2.176 | 2.138 | ||||
| 2007 | 2.156 | 1.733 | 1.948 | 1.771 | ||||
| Reaisper U.S. Dollar | ||||
| Month | High | Low | ||
| December 2007 | R$1.823 | R$1.762 | ||
| January 2008 | 1.830 | 1.741 | ||
| February 2008 | 1.768 | 1.672 | ||
| March 2008 | 1.749 | 1.670 | ||
| April 2008 | 1.753 | 1.657 | ||
| May 2008 | 1.629 | 1.695 | ||
| June 2008 (through June 27) | 1.643 | 1.595 | ||
| Reais per U.S. Dollar | ||||||||||||
Year | High | Low | Average | Period End | ||||||||
2000 | R$ | 1.985 | R$ | 1.723 | R$ | 1.835 | R$ | 1.956 | ||||
2001 | 2.801 | 1.936 | 2.353 | 2.320 | ||||||||
2002 | 3.995 | 2.271 | 2.998 | 3.533 | ||||||||
2003 | 3.662 | 2.822 | 3.071 | 2.889 | ||||||||
2004 | 3.205 | 2.654 | 2.909 | 2.654 | ||||||||
2005 (through June 24, 2005) | 2.662 | 2.387 | 2.526 | 2.387 | ||||||||
| Reais per U.S. Dollar | ||||||||||||
Month | High | Low | ||||||||||
December 2004 | R$ | 2.787 | R$ | 2.654 | ||||||||
January 2005 | 2.722 | 2.625 | ||||||||||
February 2005 | 2.632 | 2.562 | ||||||||||
March 2005 | 2.762 | 2.601 | ||||||||||
April 2005 | 2.660 | 2.520 | ||||||||||
May 2005 | 2.515 | 2.378 | ||||||||||
June 2005 (through June 24, 2005) | 2.475 | 2.370 | ||||||||||
Source:Central Bank
RISK FACTORSRisk Factors
Risks Relating to Brazil
Brazilian political and economic conditions, and the Brazilian government’s economic and other policies, may negatively affect demand for our products as well as our net sales revenue and overall financial performance.
The Brazilian economy has been characterized by frequent and occasionally extensive intervention by the Brazilian government and unstable economic cycles. The Brazilian government has often changed monetary, taxation, credit, tariff and other policies to influence the course of Brazil’s economy. The Brazilian government’s actions to control inflation and implement other policies have at times involved wage and price controls, blocking access to bank accounts, imposing capital controls and limiting imports into Brazil.
Our results of operations and financial condition may be adversely affected by factors such as:
Luiz Inácio Lula da Silva of the Workers’ Party took office as President of Brazil on January 1, 2003. The Brazilian government has adopted economic measures that are more conservative than initially expected by some observers. However, the Brazilian government may change these policies in a manner that slows the growth of the Brazilian economy, reducing demand for our products and, consequently, impairing our net sales revenue and overall financial performance. Any negative effect on our overall financial performance would also likely lead to a decrease in the market price of our class A preferred shares and the ADSs.
The Brazilian government’s actions to combat inflation may contribute significantly to economic uncertainty in Brazil and reduce demand for our products.
Historically, Brazil has experienced high rates of inflation. Inflation, as well as government efforts to combat inflation, had significant negative effects on the Brazilian economy, particularly prior to 1995. The inflation rate, as measured by the General Price Index—Internal Availability (Índice Geral de Preços—Disponibilidade Interna), reached 2,708% in 1993. Although inflation rates have been substantially lower since 1994 than in previous periods, inflationary pressures persist. Inflation rates were 10.4% in 2001, 26.4% in 2002, 7.7% in 2003 and 12.1% in 2004, as measured by the General Price Index—Internal Availability. The Brazilian government’s measures to control inflation have often included maintaining a tight monetary policy with high interest rates, thereby restricting availability of credit and reducing economic growth. Inflation, actions to combat inflation and public speculation about possible additional actions also contributed materially to economic uncertainty in Brazil and to heightened volatility in the Brazilian securities markets.
Brazil may experience high levels of inflation in future periods. Increasing prices for petroleum, the depreciation of thereal and future governmental measures seeking to maintain the value of thereal in relation to the U.S. dollar, may trigger increases in inflation in Brazil. Periods of higher inflation may slow the rate of growth of the Brazilian economy, which would lead to reduced demand for our products in Brazil and decreased
net sales revenue. Inflation also is likely to increase some of our costs and expenses, which we may not be able to pass on to our customers and, as a result, may reduce our profit margins and net income. In addition, high inflation generally leads to higher domestic interest rates, and, as a result, the costs of servicing ourreal-denominated debt may increase, causing our net income to be reduced. Inflation and its effect on domestic interest rates can, in addition, lead to reduced liquidity in the domestic capital and lending markets, which could adversely affect our ability to refinance our indebtedness in those markets. Any decline in our net sales revenue or net income and any deterioration in our financial condition would also likely lead to a decline in the market price of our class A preferred shares and the ADSs.
Fluctuations in interest rates could raise the cost of servicing our debt and negatively affect our overall financial performance.
Our financial expenses are affected by changes in the interest rates that apply to our floating rate debt. At December 31, 2004, we had R$1,175.1 million of loans and financing and debentures that were subject to the Long-Term Interest Rate, R$305.0 million of loans and financing and debentures that were subject to the CDI (Certificado Depositário Interbancário), an interbank rate, and R$1,357.6 million of loans and financing that were subject to LIBOR. The Long-Term Interest Rate (Taxa de Longo Prazo) is a Brazilian long-term interest rate that includes an inflation factor and is determined quarterly by the Central Bank. In particular, the Long-Term Interest Rate and the CDI rate have fluctuated significantly in the past in response to the expansion or contraction of the Brazilian economy, inflation, Brazilian government policies and other factors. For example, in 2004 the CDI rate increased from 16.3% per annum at December 31, 2003 to 17.8% per annum at December 31, 2004. See “Item 11. Quantitative and Qualitative Disclosures About Market Risk.” A significant increase in any of these interest rates could adversely affect our financial expenses and negatively affect our overall financial performance.
Fluctuations in the real/U.S. dollar exchange rate could increase inflation in Brazil, raise the cost of servicing our foreign currency-denominated debt and negatively affect our overall financial performance.
The exchange rate between thereal and the U.S. dollar and the relative rates of depreciation and appreciation of thereal have affected our results of operations and may continue to do so.
The Brazilian currency has devalued often during the last four decades. Throughout this period, the Brazilian government has implemented various economic plans and various exchange rate policies, including sudden devaluations, periodic mini-devaluations (during which the frequency of adjustments has ranged from daily to monthly), exchange controls, dual exchange rate markets and a floating exchange rate system. From time to time, there have been significant fluctuations in the exchange rate between the Brazilian currency and the U.S. dollar and other currencies. For example, thereal depreciated in value against the U.S. dollar by 34.3% in 2002 as compared with appreciation of 22.3% in 2003 and 8.9% in 2004.
Devaluation of thereal relative to the U.S. dollar also could result in additional inflationary pressures in Brazil by generally increasing the price of imported products and services and requiring recessionary government policies to curb demand. In addition, a devaluation of thereal could weaken investor confidence in Brazil and reduce the market price of our class A preferred shares and the ADSs. On the other hand, appreciation of thereal against the U.S. dollar may lead to a deterioration of the country’s current account and the balance of payments and may dampen export-driven growth.
We had total foreign currency-denominated debt obligations in an aggregate amount of R$4,177.8 million (US$1,573.9 million) at December 31, 2004, representing 69.6% of our indebtedness, excluding related party debt, on a consolidated basis. At December 31, 2004, we had US$461.5 million in U.S. dollar-denominated cash equivalents and other investments. At December 31, 2004, we did not have any foreign currency derivative instruments. A significant devaluation of thereal in relation to the U.S. dollar or other currencies could reduce our ability to meet debt service requirements of our foreign currency-denominated obligations, particularly as our net sales revenue is primarily denominated inreais.
In addition, any significant devaluation of thereal will increase our financial expenses as a result of foreign exchange losses that we must record. For example, the 34.3% devaluation of thereal in 2002 substantially increased our financial expenses and was a significant factor in our net loss for that year.
The prices of naphtha, our most important raw material, and of some of our other raw materials are denominated in or linked to the U.S. dollar. In 2004, 67.7% of our direct and indirect cost of sales and services were represented by the cost of naphtha. When thereal depreciates against the U.S. dollar, the cost inreais of our U.S. dollar-linked raw materials increases, and our operating income inreais decreases.
Brazilian government exchange control policies could increase the cost of servicing our foreign currency-denominated debt and impair our liquidity
The purchase and sale of foreign currency in Brazil is subject to governmental control. In the past, the Central Bank has centralized certain payments of principal on external obligations. Many factors could cause the Brazilian government to institute more restrictive exchange control policies, including the extent of Brazil’s foreign currency reserves, the availability of sufficient foreign exchange on the date a payment is due, the size of Brazil’s debt service burden relative to the economy as a whole, Brazil’s policy towards the International Monetary Fund and political constraints to which Brazil may be subject. A more restrictive policy could increase the cost of servicing (and thereby reduce our ability to pay) our foreign currency-denominated debt obligations and other liabilities. Our foreign-currency denominated debt represented 69.6% of our indebtedness on a consolidated basis at December 31, 2004. If we fail to make payments under any of these obligations, we will be in default under those obligations, which could reduce our liquidity as well as the market price of our class A preferred shares and the ADSs.
Changes in tax laws may result in increases in certain direct and indirect taxes, which could reduce our gross margin and negatively affect our overall financial performance.
The Brazilian government regularly implements changes to tax regimes that may increase our and our customers’ tax burdens. These changes include modifications in the rate of assessments and, on occasion, enactment of temporary taxes, the proceeds of which are earmarked for designated governmental purposes. In April 2003, the Brazilian government presented a tax reform proposal, which was mainly designed to simplify tax assessments, to avoid internal disputes within and between the Brazilian states and municipalities, and to redistribute tax revenues. The tax reform proposal provided for changes in the rules governing the federal Social Integration Program (Programa de Integração Social), or PIS, the federal Contribution for Social Security Financing (Contribuição para Financiamento da Seguridade Social — COFINS), or COFINS, the Tax on the Circulation of Merchandise and Services (Imposto Sobre a Circulação de Mercadorias e Serviços), or ICMS, the Tax on Bank Account Transactions (Contribuição Provisória sobre Movimentação ou Transmissão de Valores e de Créditos e Direitos de Natureza Financeira), or CPMF, and some other taxes.
In December 2003, the Brazilian Federal Senate approved part of this tax reform proposal following its approval by the Brazilian Federal House of Representatives. Other parts of the tax reform proposal were amended by the Senate and returned to the House of Representatives for further examination. The amendments to the tax reform proposal and other items pending before the Brazilian legislature were consolidated in a Project for Constitutional Amendment (Projeto de Emenda Constitucional). We expect that the Project for Constitutional Amendment will be reviewed and submitted to a vote of the House of Representatives in the near future. Upon approval by both houses of the Brazilian legislature, the Project for Constitutional Amendment will be submitted to the President for his review and execution. If enacted, these tax reform measures will be gradually adopted beginning in 2005 and continuing through 2007. The effects of these proposed tax reform measures and any other changes that result from enactment of additional tax reforms have not been, and cannot be, quantified. However, some of these measures, if enacted, may result in increases in our overall tax burden, which could reduce our gross margin and negatively affect our overall financial performance.
Risks Relating to Our Company and the Petrochemical Industry
The cyclical nature of the petrochemical industry may reduce our net sales revenue and gross margin.
The Brazilian petrochemical industry, including the markets in which we compete, is cyclical and sensitive to changes in supply and demand that are, in turn, affected by political and economic conditions in Brazil and elsewhere. This cyclicality may reduce our net sales revenue and gross margin. In particular:
The global petrochemical industry is also cyclical. Historically, the international petrochemical markets have experienced alternating periods of limited supply, which have caused prices and profit margins to increase, followed by expansion of production capacity, which has resulted in oversupply and reduced prices and profit margins. The Brazilian petrochemical industry has become increasingly integrated with the global petrochemical industry for a number of reasons, including increased demand for, and consumption of, petrochemical products in Brazil and the ongoing integration of regional and world markets for commodity products. Pricescommodities. We establish the prices for ourthe products soldwe sell in Brazil are established with reference to international market prices. Our net sales revenue and gross margin are increasingly linked to global industry conditions that we cannot control.
We face competition from producers of polyolefins, vinyls and other petrochemical products.
We face competition in Brazil from Brazilian and international producers of polyethylene, polypropylene, vinyls and other petrochemical products. In addition, ourwe generally set the prices for our second generation products are generally set with reference to the prices charged for these products by foreign producers in international markets. We anticipate that we may experience increasingly intense competition from internationalother producers of polyolefins and vinyls products, both in Brazil and in selected foreign markets in which we sell these products. Many of our foreign competitors are substantially larger and have substantially greater financial, manufacturing, technological and marketing resources than our company.
9
We face significant competition in the polyethylene market. Rio Polímeros S.A., or Rio Polímeros, a Brazilian petrochemical company, commenced operations on June 23,of a major petrochemical plant in Brazil in 2005. The announcedmaximum annual capacity of this plant is 520,000 tons of ethylene, 75,000 tons of propylene and 540,000 tons of polyethylene (representing an increase of approximately 35% of the current total Brazilianpolyethylene. In addition, Suzano Petroquímica S.A., or Suzano, expanded its annual polypropylene production capacity of polyethylene). In addition,by 60,000 tons in July 2006, and Solvay Indupa do Brasil S.A., or Solvay, has announced that it will expandexpanded its annual polyvinylchloride, or PVC, production capacity in Brazil by 35,000 tons commencing in the second half ofDecember 2005. Actions by our competitors, including any future increases in their capacity, may make it increasingly difficult for us to maintain our domestic market share in ourthe thermoplastic products we produce (polyethylene, polypropylene and PVC).
Higher naphtha costs would increase our cost of sales and services rendered and may reduce our gross margin and negatively affect our overall financial performance.
Naphtha, a crude oil derivative, is the principal raw material of our Basic Petrochemicals Unit and Copesul and, indirectly, of our other business units. In 2004, naphthaNaphtha accounted, directly and indirectly, for approximately two-thirds76.3% of our consolidated cost of sales and services rendered.rendered in 2007. The price of naphtha supplied by Petrobras—Petróleo Brasileiro S.A.,—Petrobras, or Petrobras, is linked to the Amsterdam-Rotterdam-Antwerp market price of naphtha and to thereal/U.S. dollar exchange rate. The price of naphtha that we purchase from other international suppliers is also linked to the Amsterdam-Rotterdam-Antwerp market price. The Amsterdam-Rotterdam-Antwerp market price of naphtha fluctuates primarily based on changes in the U.S. dollar-based price of crude oil in the international markets.
During 2004,2007, the average price of naphtha in U.S. dollars increased by 22.9%, from19.7% to US$313.00676.05 per ton in December 2003 to2007 from US$387.05564.74 per ton in December 2004.2006. The U.S. dollar price of naphtha was volatile during 2004, increasing substantially between February and October before declining2007, ranging from a low of US$509.66 per ton in November andJanuary 2007 to a high of US$837.53 per ton in December of 2004. The2007. Since December 31, 2007, the price of naphtha in U.S. dollars continuedhas increased to increase after December 31, 2004, reaching US$394.861,092.85 per ton at January 31, 2005, US$416.23 per ton at February 28, 2005, US$477.43 per ton at March 31, 2005, and US$521.00 per ton at April 4, 2005. Following April 4, 2005, the price of naptha in U.S. dollars has declined to US$438.50 per ton at April 30, 2005 and US$406.00 per ton at MayJune 27, 2005.2008. The price of naphtha may increase significantlycontinue its upward trend or thereal may devaluedepreciate significantly in the future. AnAny increase in naphtha costs would reduce our gross margin and negatively affect our overall financial performance to the extent that we are unable to pass on these increased costs to our customers and could result in reduced sales volumes of our products.
We do not hedge against changes in naphtha prices, so that we are exposed to fluctuations in the price of our primary raw material.
We currently do not hedge our exposure to fluctuations in naphtha prices, which are linked to thereal/U.S. dollar exchange rate. Although we attempt to pass on increases in naphtha prices through thehigher prices offor our products, in periods of high volatility in the U.S. dollar price of naphtha or thereal/U.S. dollar exchange rate, there is usually a lag between the time that the U.S. dollar price of naphtha increases or the U.S. dollar appreciates and the time that we may effectively pass on those increased costs inreaisto our customers in Brazil. As a result, if the U.S. dollar price of naphtha increases precipitously or therealdepreciates precipitously against the U.S. dollar in the future, we may not immediately be able to pass on all of the corresponding increases in our naphtha costs to our customers in Brazil, which would likely reduce our gross margin and net income.
We depend on Petrobras to supply us with the substantial portion of our naphtha requirements.
Petrobras currently is the only Brazilian supplier of naphtha and supplied 62.3%61.1% of the naphtha consumed by our company in 2004.2007. Petrobras produces somemost of the naphtha it sells to us and imports the balance. Our production volume and net sales revenue would likely decrease and our overall financial performance would likely be negatively affected in the event of:
10
In addition, although regulatory changes have ended Petrobras’ monopoly in the Brazilian naphtha market and have allowed us to import naphtha, any reversal in the continuing deregulation of the oil and gas industry in Brazil could increase our production costs.
Our Polyolefins, Ipiranga Petroquímica and Vinyls Units depend on our Basic Petrochemicals Unit and Copesul to supply them with their ethylene and propylene requirements.
Our Basic Petrochemicals Unit is the only supplier of ethylene to our Vinyls Unit, andUnit; our Basic Petrochemicals Unit and Copesul are the only suppliers of ethylene and propylene to our Polyolefins Unit.Unit; and Copesul is the only supplier of ethylene and propylene to Ipiranga Petroquímica. Because the cost of storing ethylene and propylene is substantial and there is inadequate infrastructure in Brazil to permit the importation of large quantities of these products, our production volumes of, and net sales revenue from, vinyls and polyolefins products would decrease, and our overall financial performance would be negatively affected, in the event of:
In addition, any significant expansion of the production capacity of our Polyolefins Unit in the Southern Complex will depend on our ability to obtain additional ethylene and propylene from Copesul.
Any downgrade in the ratings of our company or our debt securities would likely result in increased interest and other financial expenses related to our borrowings and debt securities and could reduce our liquidity.
Standard & Poor’s Ratings Services, a division of The McGraw-Hill Companies, Inc., or Standard and& Poor’s, Moody’s Investors Service, or Moody’s and Fitch, Inc., or Fitch, maintain ratings of our company and our debt securities. Currently, Standard and& Poor’s, Moody’s and Fitch maintain ratings of our company on a local basis and Standard & Poor’s also maintains ratings of our company on a global basis. Standard and& Poor’s maintains a rating of our company on a local basis of “Br AA-“br AA+/Stable Outlook,” Moody’s maintains a rating of our company on a local basis of “Aa2.br/Stable Outlook” and Fitch maintains a nationallocal rating for our company of “AA-“AA (bra)./Positive Outlook.” On a global basis, Standard and& Poor’s maintains a local currency rating for our company of “BB”“BB+ (stable)” and a foreign currency rating for our company of “BB-“BB+ (stable),” whileMoody’s maintains a local currency rating for our company of “Ba1” and a foreign currency rating for our company of “Ba1” and Fitch maintains a local currency rating for our company of “BB+”/Positive Outlook” and a foreign currency rating for our company of “BB-.“BB+/Positive Outlook.” Any decision by these or other rating agencies to downgrade the ratings of our company or of our debt securities in the future would likely result in increased interest and other financial expenses relating to our borrowings and debt securities and could significantly reduce our ability to obtain such financing on satisfactory terms or in amounts required by us and our liquidity.
11
Some of our shareholders may have the ability to determine the outcome of corporate actions or decisions, which could affect the holders of our class A preferred shares and the ADSs.ADS.
TheOdebrecht S.A., or Odebrecht, a member of a group of companies controlled by the Odebrecht family, which we refer to as the Odebrecht Group, holds, directly holds 47.5%and indirectly, 60.3% of our voting share capital and its designees currentlyPetrobras holds, directly and indirectly, 30.0% of our voting share capital. Designees of Odebrecht constitute a majority of the members of our board of directors. In addition, the Odebrecht Group owns 62.5% of the voting share capital of Nordeste Química S.A.—Norquisa, or Norquisa, which owns 25.4% of our voting share capitaldirectors, and 9.1% of our total share capital. Some of our other shareholders, consisting of PetrobrásPetrobras and Petrobras Química S.A., or Petroquisa, a subsidiary of Petrobras, and two Brazilian pension funds, have veto and other rights under shareholders agreementsthe Petrobras Shareholders’ Agreement as described under “Item 7. Major Shareholders and Related Party Transactions—Major Shareholders—Shareholders Agreements.” In addition, Petroquisa has an option to purchase up to 30% of our voting share capital, which, if exercised, would give Petroquisa substantial voting and other rights in respect of our company. As a result, the Odebrecht, Group,Petrobras and Petroquisa and these other shareholders maywill have the ability to determine the outcome of major corporate actions or decisions requiring the approval of our shareholders or our board of directors, which could affect the holders of the our class A preferred shares and the ADSs.ADS.
We may face conflicts of interest in transactions with related parties.
We maintain trade accounts receivable and current and long-term payables with some of our affiliates and other related parties, including Petrobras (which is our sole domestic supplier of naphtha), Copesul in the Southern Complex (which supplies us with ethylene and propylene), and Politeno Indústria e Comércio S.A., or Politeno (which purchases ethylene from our company). ThroughCurrently, Petrobras, through Petroquisa, Petrobras is the indirect holder of 10.0%30.0% of our voting share capital and 8.4%23.1% of our total share capital. These accounts receivable and accounts payable balances result mainly from purchases and sales of goods, which are at prices and on terms equivalent to the average terms and prices of transactions that we enter into with third parties. We also engage in financial and other transactions with some of our shareholders, such as the grant of the Petroquisa option discussed above.shareholders. These and other commercial and financial transactions between us and our affiliates could result in conflicting interests.
We may make significant acquisitions which, if not successfully integrated with our company, may adversely affect our operating results.
We may make significant acquisitions in the future, in addition to the Ipiranga Transaction, to continue our growth. Acquisitions involve risks, including the following:
If we are unable to integrate or manage acquired businesses successfully, we may not realize anticipated cost savings, revenue growth and levels of integration, which may result in reduced profitability or operating losses.
For a discussion of risks specifically pertaining to the Ipiranga Transaction, see “—Risks Relating to the Ipiranga Transaction.”
Future adjustments in tariffs on imports that compete with our products could cause us to lower our prices.
We take into account, when setting the domestic prices for our products, tariff ratescurrently benefit from tariffs imposed by the Brazilian government on imports of similar products and the products of our customers. We currently benefit
from tariffs that allow us to charge lower prices for our polyolefins and vinyls products thanin the domestic market that include a factor based on the tariffs levied on comparable imports of those products. Our margins from sales in the Brazilian market are therefore significantly higher than our margins from exports. However, the Brazilian government has in the past used import and export tariffs to effect economic policies, with the consequence that tariffs can vary considerably, especially tariffs on petrochemical products. For example, in 2004 the Brazilian government lowered the tariffs applicable to most of the thermoplastic products that we produce by 1.5%. Future adjustments of tariffs could cause us to lower our domestic prices, which would likely result in lower net sales revenue and could negatively affect our overall financial performance.
12
Our business is subject to stringent environmental regulations, and imposition of new regulations could require significant capital expenditures and increase our operating costs.
Our company, like other Brazilian petrochemical producers, is subject to stringent Brazilian federal, state and local environmental laws and regulations concerning human health, the handling and disposal of solid and hazardous wastes and discharges of pollutants into the air and water. Petrochemical producers are sometimes subject to unfavorable market perceptions as a result of the environmental impact of their business, which can have an adverse effect on their results of operations. As environmental laws become more stringent in Brazil and worldwide, the amount and timing of future expenditures required for us to remain compliant could increase substantially and could decrease the availability of funds for other capital expenditures and other purposes.
We manufacture products that are subject to the risk of fire, explosions and other hazards.
Our operations are subject to hazards, such as fires, explosions and other accidents, associated with the manufacture of petrochemicals and the storage and transportation of feedstocks and petrochemical products. These hazards can cause personal injury and loss of life, severe damage to or destruction of property and equipment and environmental damage. A sufficiently large accident at one of our plants or storage facilities could force us to suspend our operations temporarily and result in significant remediation costs and lost net sales revenue. Although we maintain insurance coverage for losses due to fire damage and for losses of income resulting from shutdowns due to fire, explosion or electrical damage, those insurance proceeds may not be available on a timely basis and may be insufficient to cover all losses.
The Brazilian antitrust authorities could impose costly or restrictive conditions on the approval of the formation of our company.
As part of our corporate reorganization process that began in 2001, we merged with each of OPP Química, Trikem, Proppet S.A., or Proppet, and Nitrocarbono S.A., or Nitrocarbono, and we acquired Polialden. We closed these transactions, as permitted by Brazilian law, subject to the final approval of the Brazilian antitrust authorities. We have submitted the terms and conditions of these transactions to the Brazilian antitrust authorities. These antitrust authorities will determine whether these transactions negatively impact competitive conditions in the markets in which we compete or whether they would negatively affect consumers in these markets. Although two of the three Brazilian antitrust authorities have issued non-binding opinions recommending the unconditional approval of these corporate reorganization transactions, the third and governing antitrust authority continues to review this matter and may disagree with these opinions and impose conditions or performance commitments on our company. Any adverse decision by the Brazilian antitrust authorities could materially adversely affect our business and negatively affect our overall financial performance.
Unfavorable outcomes in pending litigation may reduce our liquidity and negatively affect our financial performance and financial condition.
We are involved in numerous tax, civil and labor disputes involving significant monetary claims. If unfavorable decisions are rendered in one or more of these lawsuits, we could be required to pay substantial amounts, which could materially adversely affect our financial condition and results of operations. For some of these lawsuits, we have not established any provision on our balance sheet or have established provisions only for part of the amounts in question, based on our judgments aboutor opinions of our legal counsel as to the likelihood of winning these lawsuits.
The principal lawsuits for which we have not established provisions or have established only partial provisions include the following:
13
In addition, we and some of our subsidiaries believe that our chances of success are remote in a series of lawsuits in which we challenged the constitutionality of an increase in the federal Contribution for Social Security Financing (Contribuição para Financiamento da Seguridade Social—COFINS), or COFINS, tax rate. For a description of the legal bases of these suits, see “Item 8. Financial Information—Legal Proceedings—Tax Proceedings.” We had established total provisions of R$320.650.6 million at December 31, 20042007 for all of our lawsuits relating to the Social Integration Program (Programa de Integração Social), or PIS, and COFINS, including separate lawsuits challenging the basis of calculation of PIS and COFINS. Because we have deposited only R$62.523.8 million of this amount with the courts, we would be required, in the event we and our subsidiaries receive final, unfavorable decisions, to pay the remaining amounts for which we have not made deposits.
We are also parties to a number of lawsuits seeking tax credits that we believe the Brazilian tax authorities have disallowed or limited in violation of the Brazilian Constitution and/or applicable law. In some cases wherein which we have received favorable lower court decisions, we have used these credits to offset other tax obligations and have established provisions in an equivalent amount until a final decision is rendered (adjusting theserendered. These provisions totaled R$1,145.8 million at December 31, 2007, as adjusted based on the SELIC (Sistema Especial de Liquidação e de Custódia—SELIC), or SELIC interest rate). These provisions totaled R$904.5 million at December 31, 2004.rate. If we ultimately lose any of these lawsuits, we would be required to pay the tax obligations we had previously offset with those credits, which could materially reduce our liquidity. We believe that losses related to some of these lawsuits are reasonably possible.
For more information about our legal proceedings, see “Item 8. Financial Information—Legal Proceedings.”
Risks Relating to the Ipiranga Transaction
We may experience difficulties in integrating Copesul, Ipiranga Química and Ipiranga Petroquímica and, therefore, may fail to achieve the anticipated benefits from the Ipiranga Transaction.
On March 18, 2007, we entered into agreements with Ultrapar Participações S.A., or Ultrapar, and Petrobras under which, among other things, we acquired control of Ipiranga Química and Ipiranga Petroquímica, and indirect control of the 29.5% of Copesul’s share capital owned by Ipiranga Petroquímica. To complete the transfer of these shares, we entered into a series of transactions comprising the Ipiranga Transaction. For a discussion of these transactions, see “Item 4. Information on the Company—Ipiranga Transaction.” As a result of the substantial completion of the Ipiranga Transaction:
14
Upon the final completion of the fourth phase of the Ipiranga Transaction, we will own shares of Refinaria de Petróleo Ipiranga S.A., or RPI, representing 33.3% of total share capital and voting share capital of RPI.
Integration of Copesul, Ipiranga Química and Ipiranga Petroquímica with our operations will be a complex, costly and time-consuming process. Risks and challenges that may impair our ability to achieve the anticipated benefits of the Ipiranga Transaction include:
If we are unable to successfully respond to these risks and challenges, we may experience higher than expected operating costs or fail to achieve the anticipated benefits of the Ipiranga Transaction.
We have incurred a substantial amount of indebtedness in connection with the Ipiranga Transaction, which could limit our operating flexibility.
The total purchase price to our company of the shares of Ipiranga Química that we have acquired and the shares of RPI that we will acquire from Ultrapar in the Ipiranga Transaction was R$1,489.1 million. In addition, as part of the Ipiranga Transaction:
To finance the Ipiranga Transaction, we incurred: (1) US$1,200.0 million under an unsecured credit agreement, which we refer to as the Acquisition Credit Agreement, with three financial institutions; (2) US$312.5 million under an export prepayment credit facility; and (3) US$61.0 million under two short-term financing transactions. In addition, as a result of the Ipiranga Transaction, we consolidate the indebtedness of Ipiranga Química and Copesul into our financial statements. As of December 31, 2007, we had R$8,381.9 million of outstanding indebtedness, excluding related party debt.
The substantial increase in our outstanding debt could limit our operating flexibility, including among others, in the following respects:
15
In addition, the principal amount of each disbursement under the Acquisition Credit Agreement is payable on or prior to the second anniversary of such disbursement. Any inability to refinance amounts borrowed under this agreement on satisfactory terms, if at all, would have a material adverse effect on our results of operations and financial condition.
The Brazilian antitrust authorities could impose costly or restrictive conditions on the approval of the Ipiranga Transaction.
The Ipiranga Transaction is subject to the final approval of the Brazilian antitrust authorities. However, Brazilian law permits us to consummate these transactions prior to receiving this final approval, unless the Administrative Council for Economic Defense(Conselho Administrativo de Defesa Econômica), or CADE, issues a writ of prevention blocking a transaction or requires the parties to enter into an agreement permitting the effects of the transaction to be reversed which, by its terms, delays the consummation of the transaction. Our company, together with Ultrapar and Petrobras, submitted the terms and conditions of the Ipiranga Transaction for review by the antitrust authorities in April 2007. The antitrust authorities will determine whether these transactions negatively impact competitive conditions in the markets in which we compete or adversely affect consumers in these markets.
In April 2007, CADE issued a writ of prevention relating to the Ipiranga Transaction, which, among other things, prevented our exercise of strategic management control over Ipiranga Química and Ipiranga Petroquímica. In issuing the writ of prevention, CADE stated that the purpose of the writ of prevention was to guarantee that the Ipiranga Transaction could be reversed in the event that CADE so determined following its review of the Ipiranga Transaction. In April 2007, CADE revoked this writ of prevention upon the agreement of our company to execute an agreement designed to preserve the reversibility of the Ipiranga Transaction, which we refer to as the Reversibility Agreement. Under the Reversibility Agreement, we agreed to preserve all of the assets acquired in the Ipiranga Transaction until CADE makes a final determination with respect to the Ipiranga Transaction, and we are permitted to effectively own and manage these assets pending this final determination.
Any action by the Brazilian antitrust authorities to fail to approve the Ipiranga Transaction or to impose conditions or performance commitments on our company as part of the approval process for the Ipiranga Transaction could materially and adversely affect our business, negatively affect our financial performance and prevent our company from achieving the anticipated benefits of the Ipiranga Transaction.
In November 2007, we entered into the Petrobras Investment Agreement relating to the Petrobras Transaction described in “Item 4. Information on the Company—Petrobras Transaction.” Although we believe that the Petrobras Transaction is not subject to the final approval of the Brazilian antitrust authorities, because the Petrobras Transaction is a follow-on transaction to the Ipiranga Transaction and does not involve any change of control of our company or Petrobras, we and Petrobras submitted the terms and conditions of the Petrobras Transaction to the Brazilian antitrust authorities in December 2007. If the Brazilian antitrust authorities do not agree with our analysis, the failure to approve the Petrobras Transaction or any action taken by these authorities to impose conditions or performance commitments on our company as part of the approval process for the Petrobras Transaction prevent our company from achieving the anticipated benefits of the Petrobras Transaction.
We cannot predict when CADE will take final action with respect to the Ipiranga Transaction and the Petrobras Transaction.
Risks Relating to Brazil
Brazilian political and economic conditions, and the Brazilian government’s economic and other policies, may negatively affect demand for our products as well as our net sales revenue and overall financial performance.
The Brazilian economy has been characterized by frequent and occasionally extensive intervention by the Brazilian government and unstable economic cycles. The Brazilian government has often changed monetary, taxation, credit, tariff and other policies to influence the course of Brazil’s economy. The Brazilian government’s actions to control inflation and implement other policies have at times involved wage and price controls, blocking access to bank accounts, imposing capital controls and limiting imports into Brazil.
16
Our results of operations and financial condition may be adversely affected by factors such as:
The President of Brazil has considerable power to determine governmental policies and actions that relate to the Brazilian economy and, consequently, affect the operations and financial performance of businesses, such as our company. Mr. Luiz Inácio Lula da Silva was reelected in October 2006 for a four-year presidential term commencing on January 1, 2007. We cannot predict what policies will be adopted by the Brazilian government and whether these policies will negatively affect the economy or our business or financial performance.
The Brazilian government’s actions to combat inflation may contribute significantly to economic uncertainty in Brazil and reduce demand for our products.
Historically, Brazil has experienced high rates of inflation. Inflation, as well as government efforts to combat inflation, had significant negative effects on the Brazilian economy, particularly prior to 1995. The inflation rate, as measured by the General Price Index—Internal Availability (Índice Geral de Preços—Disponibilidade Interna), reached 2,708% in 1993. Although inflation rates have been substantially lower since 1994 than in previous periods, inflationary pressures persist. Inflation rates were 7.7% in 2003, 12.1% in 2004, 1.2% in 2005, 3.8% in 2006, 7.9% in 2007 and 2.1% in the three months ended March 31, 2008, as measured by the General Price Index—Internal Availability. The Brazilian government’s measures to control inflation have often included maintaining a tight monetary policy with high interest rates, thereby restricting availability of credit and reducing economic growth. Inflation, actions to combat inflation and public speculation about possible additional actions also contributed materially to economic uncertainty in Brazil and to heightened volatility in the Brazilian securities markets.
Brazil may experience high levels of inflation in future periods. Increasing prices for petroleum, the depreciation of therealand future governmental measures seeking to maintain the value of therealin relation to the U.S. dollar may trigger increases in inflation in Brazil. Periods of higher inflation may slow the rate of growth of the Brazilian economy, which would lead to reduced demand for our products in Brazil and decreased net sales revenue. Inflation is also likely to increase some of our costs and expenses, which we may not be able to pass on to our customers and, as a result, may reduce our profit margins and net income. In addition, high inflation generally leads to higher domestic interest rates, and, as a result, the costs of servicing ourrealdenominated debt may increase, causing our net income to be reduced. Inflation and its effect on domestic interest rates can, in addition, lead to reduced liquidity in the domestic capital and lending markets, which could adversely affect our ability to refinance our indebtedness in those markets. Any decline in our net sales revenue or net income and any deterioration in our financial condition would also likely lead to a decline in the market price of our class A preferred shares and the ADS.
17
Fluctuations in interest rates could raise the cost of servicing our debt and negatively affect our overall financial performance.
Our financial expenses are affected by changes in the interest rates that apply to our floating rate debt. At December 31, 2007, we had, among other debt obligations, R$467.8 million of loans and financing and debentures that were subject to the TJLP (Taxa de Juros de Longo Prazo), or TJLP, a long-term interest rate, R$1,271.7 million of loans and financing and debentures that were subject to theCertificado Depositário Interbancário, or CDI, rate, an interbank rate, and R$3,070.7 million of loans and financing that were subject to LIBOR. The TJLP includes an inflation factor and is determined quarterly by the Central Bank. In particular, the TJLP and the CDI rate have fluctuated significantly in the past in response to the expansion or contraction of the Brazilian economy, inflation, Brazilian government policies and other factors. For example, in 2007 the CDI rate declined from 13.17% per annum at December 31, 2006 to 11.18% per annum at December 31, 2007. See “Item 11. Quantitative and Qualitative Disclosures about Market Risk.” A significant increase in any of these interest rates could adversely affect our financial expenses and negatively affect our overall financial performance.
Fluctuations in the real/U.S. dollar exchange rate could increase inflation in Brazil, raise the cost of servicing our foreign currency-denominated debt and negatively affect our overall financial performance.
The exchange rate between therealand the U.S. dollar and the relative rates of depreciation and appreciation of therealhave affected our results of operations and may continue to do so.
The Brazilian currency has been devalued often during the last four decades. Throughout this period, the Brazilian government has implemented various economic plans and various exchange rate policies, including sudden devaluations, periodic mini-devaluations (during which the frequency of adjustments has ranged from daily to monthly), exchange controls, dual exchange rate markets and a floating exchange rate system. From time to time, there have been significant fluctuations in the exchange rate between the Brazilian currency and the U.S. dollar and other currencies. For example, therealappreciated in value against the U.S. dollar by 18.2% in 2003, 8.1% in 2004, 11.8% in 2005, 8.7% in 2006 and 17.2% in 2007.
Depreciation of therealrelative to the U.S. dollar also could result in additional inflationary pressures in Brazil by generally increasing the price of imported products and services and requiring recessionary government policies to curb demand. In addition, depreciation of therealcould weaken investor confidence in Brazil and reduce the market price of our class A preferred shares and the ADSs. On the other hand, further appreciation of therealagainst the U.S. dollar may lead to a deterioration of the country’s current account and the balance of payments and may dampen export-driven growth.
We had total foreign currency-denominated debt obligations in an aggregate principal amount of R$5,878.4 million (US$3,318.7 million) at December 31, 2007, representing 70.1% of our indebtedness, excluding related party debt, on a consolidated basis. At December 31, 2007, we had US$551.8 million in U.S. dollar-denominated cash equivalents and other investments. A significant depreciation of therealin relation to the U.S. dollar or other currencies could reduce our ability to meet debt service requirements of our foreign currency-denominated obligations, particularly as our net sales revenue is primarily denominated inreais.
In addition, any significant depreciation of therealwill increase our financial expenses as a result of foreign exchange losses that we must record. For example, the 34.3% depreciation of therealin 2002 substantially increased our financial expenses and was a significant factor in our net loss for that year.
The prices of naphtha, our most important raw material, and of some of our other raw materials are denominated in or linked to the U.S. dollar. Naphtha accounted, directly and indirectly, for 76.3% of our consolidated cost of sales and services rendered in 2007. When therealdepreciates against the U.S. dollar, the cost inreaisof our U.S. dollar-linked raw materials increases, and our operating income inreaisdecreases to the extent that we are unable to pass on these cost increases to our customers.
18
Brazilian government exchange control policies could increase the cost of servicing our foreign currency-denominated debt and impair our liquidity.
The purchase and sale of foreign currency in Brazil is subject to governmental control. In 1990, the Central Bank centralized certain payments of principal on external obligations. Many factors could cause the Brazilian government to institute more restrictive exchange control policies, including the extent of Brazil’s foreign currency reserves, the availability of sufficient foreign exchange on the date a payment is due, the size of Brazil’s debt service burden relative to the economy as a whole, Brazil’s policy towards the International Monetary Fund and political constraints to which Brazil may be subject. A more restrictive policy could increase the cost of servicing, and thereby reduce our ability to pay, our foreign currency-denominated debt obligations and other liabilities. Our foreign-currency denominated debt represented 70.1% of our indebtedness on a consolidated basis at December 31, 2007. If we fail to make payments under any of these obligations, we will be in default under those obligations, which could reduce our liquidity as well as the market price of our class A preferred shares and the ADSs.
Changes in tax laws may result in increases in certain direct and indirect taxes, which could reduce our gross margin and negatively affect our overall financial performance.
The Brazilian government implements from time to time changes to tax regimes that may increase our and our customers’ tax burdens. These changes include modifications in the rate of assessments and, on occasion, enactment of temporary taxes, the proceeds of which are earmarked for designated governmental purposes. We cannot predict the changes to Brazilian tax law that may be proposed and enacted in the future. However, future changes in Brazilian tax law may result in increases in our overall tax burden, which could reduce our gross margin and negatively affect our overall financial performance.
Risks Relating to Our Class A Preferred Shares and the ADSs
Our class A preferred shares and the ADSs have limited voting rights.
Under the Brazilian Corporation Law and our by-laws, holders of our class A preferred shares and, consequently, the ADSs are not entitled to vote at meetings of our shareholders, except in very limited circumstances. These limited circumstances directly relate to key rights of the holders of class A preferred shares, such as modifying basic terms of our class A preferred shares or creating a new class of preferred shares with superior rights. Holders of preferred shares without voting rights are entitled to elect one member and his or her respective alternate to our board of directors and our fiscal council. However, until our general shareholders meeting in 2006, any member elected to our board of directors by these preferred shareholders must be selected from a list of three nominees chosen by our controlling shareholder. Holders of our class A preferred shares and the ADSs are not entitled to vote to approve corporate transactions, including mergers or consolidations of our company with other companies.
Holders of the ADSs may find it difficult to exercise even their limited voting rights at our shareholders’ meetings.
Holders may exercise the limited voting rights with respect to our class A preferred shares represented by the ADSs only in accordance with the deposit agreement relating to the ADSs. There are practical limitations upon the ability of ADS holders to exercise their voting rights due to the additional steps involved in communicating with ADS holders. For example, we are required to publish a notice of our shareholders’ meetings in certain newspapers in Brazil. To the extent that holders of our class A preferred shares are entitled to vote at a shareholders’ meeting, they will be able to exercise their voting rights by attending the meeting in person or voting by proxy. By contrast, holders of the ADSs will receive notice of a shareholders’ meeting by mail from the depositary following our notice to the ADR depository requesting the ADR depository to do so. To exercise their voting rights, ADS holders must instruct the depositary on a timely basis. This noticed voting process will take longer for ADS holders than for holders of class A preferred shares. If it fails to receive timely voting instructions for all or part of the ADSs, the depositary will assume that the holders of those ADSs are instructing it to give a discretionary proxy to a person designated by us to vote their ADSs, except in limited circumstances.
In the limited circumstances in which holders of the ADSs have voting rights, they may not receive the voting materials in time to instruct the depositary to vote our class A preferred shares underlying their ADSs. In addition, the depositary and its agents are not responsible for failing to carry out voting instructions of the holders of the ADSs or for the manner of carrying out those voting instructions. Accordingly, holders of the ADSs may not be able to exercise voting rights, and they will have no recourse if the class A preferred shares underlying their ADSs are not voted as requested.
19
Exchange controls and restrictions on remittances abroad may adversely affect holders of the ADSs and the underlying class A preferred shares.
Brazilian law provides that whenever there is a significant imbalance in Brazil’s balance of payments or a significant possibility that such imbalance will exist, theThe Brazilian government may impose temporary restrictions on the remittance to foreign investors of the proceeds of their investment in Brazil (as it did for approximately six months in 1989 and early 1990) and on the conversion of Brazilian currency into foreign currencies.currencies and on the remittance to foreign investors of proceeds of their investments in Brazil. Brazilian law permits the government to impose these restrictions whenever there is a serious imbalance in Brazil’s balance of payments or there are reasons to foresee a serious imbalance. The Brazilian government imposed remittance restrictions for approximately six months in 1990.
These restrictions could hinder or prevent the Brazilian custodian of the class A preferred shares underlying the ADSs or holders who have exchanged the ADSs for the underlying class A preferred shares from converting dividends, distributions or the proceeds from any sale of such shares into U.S. dollars and remitting such U.S. dollars abroad. In such an event, the Brazilian custodian for our class A preferred shares will hold thereaisthat it cannot convert for the account of holders of the ADSs who have not been paid. Neither the custodian nor the depositary will be required to invest thereaisor be liable for any interest.
Holders of the ADSs may face difficulties in protecting their interests because we are subject to different corporate rules and regulations as a Brazilian company and our shareholders may have fewer and less well-defined rights.
Holders of the ADSs are not direct shareholders of our company and are unable to enforce the rights of shareholders under our by-laws and the Brazilian Corporation Law.
Our corporate affairs are governed by our by-laws and the Brazilian Corporation Law, which differ from the legal principles that would apply if we were incorporated in a jurisdiction in the United States, such as the State of Delaware or New York, or elsewhere outside Brazil. Even if a holder of ADSs surrenders its ADSs and becomes a direct shareholder, its rights as a holder of our class A preferred shares underlying the ADSs under the Brazilian Corporation Law to protect its interests relative to actions by our board of directors may be fewer and less well-defined than under the laws of those other jurisdictions.
Although insider trading and price manipulation are crimes under Brazilian law, the Brazilian securities markets are not as highly regulated and supervised as the U.S. securities markets or the markets in some other jurisdictions. In addition, rules and policies against self-dealing or for preserving shareholder interests may be less well-defined and enforced in Brazil than in the United States and certain other countries, which may put holders of our class A preferred shares and the ADSs at a potential disadvantage. Corporate disclosures also may be less complete or informative than for a public company in the United States or in certain other countries.
Holders of the ADSs may face difficulties in serving process on or enforcing judgments against us and other persons.
We are a corporation (sociedade(sociedade anônima)nima) organized under the laws of Brazil, and all of our directors and executive officers and our independent public accountants reside or are based in Brazil. Most of our assets and those of these other persons are located in Brazil. As a result, it may not be possible for holders of the ADSs to effect service of process upon us or these other persons within the United States or other jurisdictions outside Brazil or to enforce against us or these other persons judgments obtained in the United States or other jurisdictions outside Brazil. Because judgments of U.S. courts for civil liabilities based upon the U.S. federal securities laws may only be enforced in Brazil if certain conditions are met, holders may face greater difficulties in protecting their interests in the case of actions by us or our directors or executive officers than would shareholders of a U.S. corporation.
20
Actual or anticipated sales of a substantial number of class A preferred shares could decrease the market prices of our class A preferred shares and the ADSs.
Sales of a substantial number of our class A preferred shares could negatively affect the market prices of our class A preferred shares and the ADSs. On or prior to December 31, 2005, Petroquisa is entitled to exercise an option to acquire a substantial number of new common shares from our company and, if necessary, preferred shares from the Odebrecht Group. If, in the future, substantial sales of shares are made by the Odebrecht Group,ODBPAR Investimentos S.A., or ODBPAR Investments, Petroquisa or other existing or future holders of class A preferred shares, the market price of our class A preferred shares and, by extension, the ADSs may decrease significantly. As a result, holders of the ADSs may not be able to sell the ADSs at or above the price they paid for them.
Holders of the ADSs may be unable to exercise preemptive rights with respect to our class A preferred shares underlying the ADSs.
Holders of the ADSs will be unable to exercise the preemptive rights relating to our class A preferred shares underlying ADSs unless a registration statement under the Securities Act is effective with respect to those rights or an exemption from the registration requirements of the Securities Act is available. We are not obligated to file a registration statement with respect to the shares relating to these preemptive rights or to take any other action to make preemptive rights available to holders of the ADSs, and we may not file any such registration statement. If
we do not file a registration statement or if we and the depositary decide not to make preemptive rights available to holders of the ADSs, those holders may receive only the net proceeds from the sale of their preemptive rights by the depositary, or if they are not sold, their preemptive rights will be allowed to lapse.
Holders of the ADSs could be subject to Brazilian income tax on capital gains from sales of ADSs.
Historically, any capital gain realized on a sale or other disposition of ADSs between non-Brazilian holders outside Brazil was not subject to Brazilian income tax. However, a new Brazilian law provides that, commencing on February 1, 2004, “the acquiror, individual or legal entity resident or domiciled in Brazil, or the acquiror’s attorney-in-fact, when such acquirer is resident or domiciled abroad, shall be responsible for the retention and payment of the income tax applicable to capital gains . . . earned by the individual or legal entity resident or domiciled abroad who disposes of property located in Brazil.” The Brazilian tax authorities have recently issued a normative instruction confirming that they intend to assess income tax on capital gains earned by non-Brazilian residents whose assets are located in Brazil. In our view, ADSs representing class A preferred shares, which are issued by the depositary outside Brazil, will not be deemed to be “property located in Brazil” for purposes of this law. However, we cannot assure holders of our ADSs whether Brazilian tax authorities will attempt to tax any capital gains arising from the sale or other disposition of ADSs, even when the transaction is consummated outside Brazil between non-Brazilian residents.
The relative volatility and liquidity of the Brazilian securities markets may decrease the liquidity and market price of our class A preferred shares and the ADSs.
The Brazilian securities markets are substantially smaller, less liquid and more volatile than major securities markets in the United States. The São Paulo Stock Exchange (Bolsa de Valores de São Paulo), which is the principal Brazilian stock exchange, had a market capitalization of US$340.9 billion1.4 trillion (or R$904.9 billion)2.5 trillion) at December 31, 20042007 and an average daily trading volume of US$419.7 million2.5 billion for 2004.2007. In comparison, The New York Stock Exchange had a market capitalization of US$19.827.1 trillion at December 31, 20042007 and an average daily trading volume of US$46.1119.2 billion for 2004.2007. There is also significantly greater concentration in the Brazilian securities markets. The ten largest companies in terms of market capitalization represented approximately 47%56% of the aggregate market capitalization of the São Paulo Stock Exchange at December 31, 2004.2007. The ten most widely traded stocks in terms of trading volume accounted for approximately 48% of all shares traded on The São Paulo Stock Exchange in 2004.2007. These market characteristics may substantially limit the ability of holders of the ADSs to sell class A preferred shares underlying ADSs at a price and at a time when they wish to do so and, as a result, could negatively impact the market price of the ADSs themselves.
21
Developments in other emerging markets may decrease the market price of our class A preferred shares and the ADSs.
The market price of our class A preferred shares and the ADSs may decrease due to declines in the international financial markets and world economic conditions. Although economic conditions are different in each country, investors’ reaction to developments in one country can affect the securities markets and the securities of issuers in other countries, including Brazil. Brazilian securities markets are, to varying degrees, influenced by economic and market conditions in other emerging market countries, especially those in Latin America. Any return to economic turmoil in Argentina or adverse economic developments in other emerging markets may adversely affect investor confidence in securities issued by Brazilian companies, causing their market price and liquidity to suffer. Any such developments could immediately affect our ability to raise capital when needed and the market price of our class A preferred shares and the ADSs.
22
ITEM 4. INFORMATION ON OURTHE COMPANY
We are the leading petrochemical company in Latin America, based on average annual production capacity.capacity in 2007. We are also one of the threethird largest Brazilian-owned private sector industrial companies,company, based on net sales revenue.revenue in 2006 (the most recent year for which comparative information is currently available). We recorded net income of R$690.9547.6 million in 20042007 on net sales revenue of R$12,192.017,679.4 million, in each case under Brazilian GAAP. We produce a diversified portfolio of petrochemical products and have a strategic focus on polyethylene, polypropylene and PVC. We have integrated first and second generation petrochemical production facilities, with 1319 plants in Brazil.Brazil, including plants that we have acquired in the Ipiranga Transaction.
Our registered office is at Rua Eteno, 1561, CEP 42810-000, Camaçari, Bahia, Brazil, and our telephone number at this address is 55-71-632-5102. Our principal executive office is at Avenida das Nações Unidas, 4777, São Paulo, SP, CEP 05477-000, Brazil, and our telephone number at this address is 55-11-3576-9999.
HISTORY AND DEVELOPMENT OF OUR COMPANYHistory and Development of Our Company
We were founded in 1972 as Petroquímica do Nordeste Copene Ltda. to plan, execute and coordinate the activities of the Northeastern Complex. The construction of the Northeastern Complex formed part of a development policy of the Brazilian government implemented in the early 1970’s to diversify the geographical distribution of industrial assets and to promote economic growth across different regions of Brazil. On June 18, 1974, we were incorporated as a corporation ((sociedade anônima)nima) under the laws of Brazil (with Brazilian company registry No. 29300006939) and were renamed Copene—Copene Petroquímica do Nordeste S.A.
Acquisition of Control by Norquisa
Prior to August 1995, Petroquisa, the petrochemical subsidiary of Petrobras, owned 36.2% of our total share capital, representing 48.2% of our voting share capital. Petrobras historically provided all of our requirements of naphtha, our principal raw material. At that time, Nordeste Química S.A.—Norquisa, or Norquisa, owned 17.3% of our total share capital, representing 47.6% of our voting share capital, and the remainder of our share capital was owned by various Brazilian private sector groups, pension funds, banks and our employees. Norquisa is a holding company that was formed in 1980 for the purpose
Privatization of holding shares of the petrochemical companies in the Northeastern Complex.Our Company
In August 1995, as part of the Brazilian government’s privatization program, Petroquisa sold 14.8% of our total share capital, representing 32.8% of our voting share capital, through an auction. Norquisa acquired 5.5% of our total share capital, representing 10.8% of our voting share capital, in this auction, for R$79.2 million, and the remaining shares were acquired by various Brazilian pension funds.
At the time of this auction, Norquisa was controlled by several second generation producers in the Northeastern Complex. TheseAs a result of this auction, Norquisa became our controlling shareholder.
Consolidation of Petrochemical Assets
In 2001, the Odebrecht Group and a group of companies in turn, were controlled by several groups involved in the petrochemical business in Brazil. The ownersMariani family, or the Mariani Group, acquired control of Norquisa’s voting share capital immediately before and after this auction were as follows:
| |||||
| |||||
| |||||
| |||||
| |||||
| |||||
| |||||
| |||||
| |||||
| |||||
| |||||
Following this auction, our corporate structure was as set forth in the following chart. The percentages in bold italics represent the percentage of the voting share capital owned directly and indirectly by the parent company of each entity, and the percentages not in bold italics represent the percentage of the total share capital owned directly and indirectly by the parentcontribution to our company of each entity. All of these companies are or were organized under Brazilian law.of:
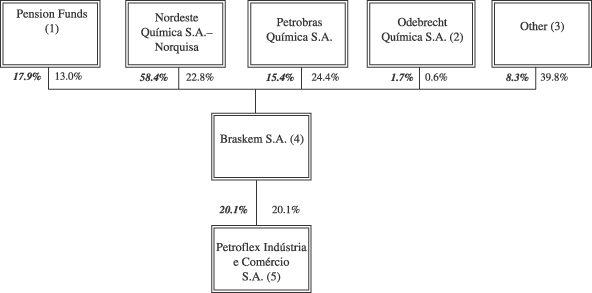
Econômico S.A. Empreendimentos Auction and Related Transactions
Late in 1995, a Brazilian financial institution, Banco Econômico S.A., or Banco Econômico, collapsed, at which time the Central Bank intervened. Banco Econômico then held a 63.8% of the voting share capital of
Conepar—Companhia Nordeste de Participações, or Conepar, which, in turn, held
The Brazilian government decided to liquidate the petrochemical assets of Banco Econômico as part of a broader initiative to restructure the Brazilian petrochemical sector. The Central Bank, as liquidator of Banco Econômico, formed Econômico S.A. Empreendimentos to hold the share capital of Conepar owned by Banco EconômicoPoliteno; and then conducted an auction of Econômico S.A. Empreendimentos on July 25, 2001.
Immediately prior to this auction, the corporate structure of Econômico S.A. Empreendimentos and Conepar was as set forth in the following chart. The percentages in bold italics represent the percentage of the voting share capital owned directly and indirectly by the parent company of each entity, and the percentages not in bold italics represent the percentage of the total share capital owned directly and indirectly by the parent company of each entity. All of these companies are or were organized under Brazilian law.
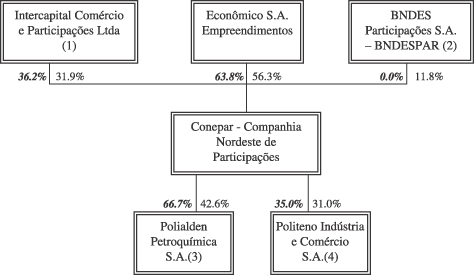
In order to increase its investment in the Brazilian petrochemical industry, the Odebrecht Group formed Nova Camaçari Participações
Camaçari placed the winning bid in the auction and acquired Econômico S.A. Empreendimentos for R$785.0 million. On the same date, Nova Camaçari and the Odebrecht Group entered into the following transactions:
Nova Camaçari was obligated to purchase the shares of Intercapital and Proppet, and the shares of Conepar owned by BNDESPAR, under the terms of various shareholders’ agreements entered into by the direct and indirect shareholders of Conepar. The Odebrecht Group purchased the Norquisa shares held by Petronor in order to increase its percentage ownership of Norquisa. We acquired Nova Camaçari in order to expand the scope of our operations and become a vertically integrated producer of petrochemical products.
As a result of these transactions, we acquired ownership, directly and indirectly, of 100% of the share capital of Conepar and of Proppet, and, through Conepar, we acquired a controlling interest in Polialden and a minority interest in Politeno. We remained controlled by Norquisa. The Odebrecht Group owned 39.7% of the voting share capital of Norquisa and, together with the Mariani Group, held a combined 55.8% of the voting share capital of Norquisa.
On July 27, 2001, Odebrecht Química S.A., or Odebrecht Química, and Petroquímica da Bahia S.A., or Petroquímica da Bahia, a member of the Mariani Group, entered into a shareholders agreement covering their direct and indirect equity interests in Norquisa and our company. In addition, on July 3, 2001 and July 20, 2001, Odebrecht Química and Petroquímica da Bahia entered into memoranda of understanding with respect to the terms of shareholders agreements to be entered into with Petroquisa, PREVI—Caixa de Previdência dos Funcionários do Banco de Brasil, or Previ, and Fundação de Sequridade Social—Petros, or Petros. These agreements are described in “Item 7. Major Shareholders and Related Party Transactions—Major Shareholders—Shareholders Agreements.”
Immediately after these transactions, our corporate structure was as set forth in the following chart. The percentages in bold italics represent the percentage of the voting share capital owned directly and indirectly by the parent company of each entity, and the percentages not in bold italics represent the percentage of the total share capital owned directly and indirectly by the parent company of each entity. All of these companies are or were organized under Brazilian law.
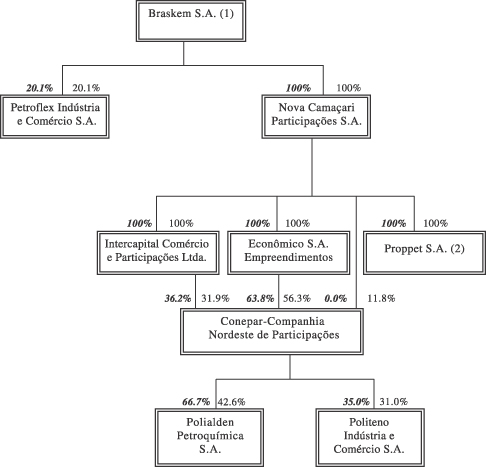
In order to streamline our corporate structure, in September 2001, we merged our wholly owned subsidiaries Nova Camaçari, Intercapital and Proppet into our company.
The following chart presents the corporate structure of our principal subsidiaries and equity investments following this merger. The percentages in bold italics represent the percentage of the voting share capital owned directly and indirectly by the parent company of each entity, and the percentages not in bold italics represent the percentage of the total share capital owned directly and indirectly by the parent company of each entity. All of these companies are or were organized under Brazilian law.
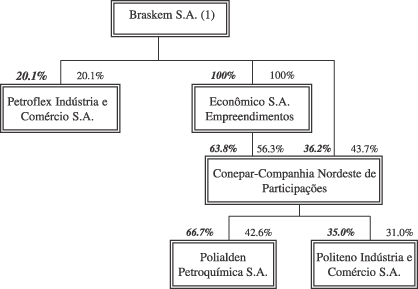
Mergers with OPP Produtos and 52114 Participações
In order to continue to implement our strategy of vertically integrating our operations and to further expand the scope of our operations, we completed the following transactions on August 16, 2002:
capital:
Upon completing these mergers, we changed our corporate name to Braskem S.A.
The principal assets of OPP Produtos were:
23
The principal asset of 52114 Participações was Copesul; and
The following chart presents the corporate structure of our principal subsidiaries and equity investments following the Upon completing these transactions, described above. The percentages in bold italics represent the percentage of the voting share capital owned directly and indirectly by the parent company of each entity, and the percentages not in bold italics represent the percentage of the total share capital owned directly and indirectly by the parent company of each entity. All of these companies are or were organized under Brazilian law.
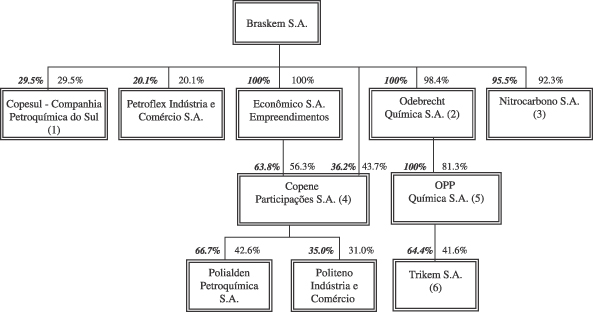
Transactions in 2003 and 2004
Since August 2002, we have completed additional transactions to consolidate our ownership of some of our subsidiaries and further streamline our corporate structure.name to Braskem S.A.
Acquisition of Remaining Shares of OPP Química
In October 2002, Odebrecht Química acquired 2.5% of OPP Química’s total share capital from Braskem International Limited for US$16.3 million. In December 2002, in connection with the repayment of a financing transaction, a lender returned 16.2% of OPP Química’s share capital to Odebrecht Química. Consequently, Odebrecht Química then owned all of OPP Química’s total share capital.2003:
Exchange Offer for Remaining Shares of Nitrocarbono and Subsidiary Mergers
In February 2003, as a result of our merger with 52114 Participações and as required by the Brazilian Corporation Law,
On March 31, 2003, we consummated the following transactions:
Immediately after these transactions, our corporate structure was as set forth in the following chart. The percentages in bold italics represent the percentage of the voting share capital owned directly and indirectly by the parent company of each entity, and the percentages not in bold italics represent the percentage of the total share capital owned directly and indirectly by the parent company of each entity. All of these companies are or were organized under Brazilian law.
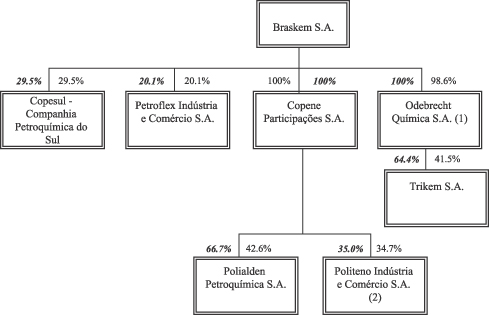
Transfer of Polialden and Politeno Shares to Our Company
To further streamline our corporate structure, on June 30, 2003, we entered into an agreement under which we assumed debt of Copene Participações S.A. owed to Polialden in the amount of R$30.2 million as well as debt of Copene Participações S.A. owed to the BNDES in the amount of R$38.9 million. In return, we received the shares of Polialden and Politeno owned by Copene Participações S.A. As a result, all of our equity interests in Polialden and Politeno were, and continue to be, held directly by our company, and Copene Participações S.A. no longer owns material assets or conducts any material operations.
Acquisition of Common Shares of Trikem and Polialden Held by Mitsubishi and Sojitz
In order to acquire the remaining outstanding common shares of PolialdenPolialden; and
ratios. In addition, we are required to pay interest to Mitsubishi on the outstanding balance of the aggregate purchase price at an annual rate of LIBOR plus 3.0% in January and July of each year until the remaining balance is paid in full.
Under this agreement, we are required to make an additional payment to Mitsubishi in an amount that is contingent upon the outcome of pending litigation filed against Polialden by certain of its preferred shareholders.
The amount of the additional payment that we are obligated to pay to Mitsubishi is (1) R$21.6 million if Polialden prevails in this litigation or if a definitive settlement is reached, or (2) R$5.4 million if Polialden loses this litigation. In either event, we will convert the amount of this additional payment (as adjusted for inflation at the IGP-M rate from July 31, 2003 until the date that this litigation is finally adjudicated or settled) into U.S. dollars on the final adjudication or settlement date. We are required to make this additional payment either together with the remaining balance under the share purchase and sale agreement or, if the remaining balance is due prior to the date on which this litigation is finally adjudicated or settled, within 60 days from the later date. We will pay interest on this payment on the same terms as we are required to pay interest on the remaining balance under the share purchase and sale agreement.
Odebrecht has agreed to guarantee our obligation to pay Mitsubishi the remaining balance of the aggregate purchase price, together with the additional payment in connection with the Polialden shareholders’ rights litigation.
Under the memorandum of understanding with Odebrecht and Sojitz, we agreed to purchase all of the share capital of Trikem and Polialden that Sojitz owned, consisting of 16.7% of Polialden’s voting share capital and 10.1% of Trikem’s voting share capital, in exchange for 4,345,162 of our common shares. As a result of this transaction, which closed on July 31, 2003, and after giving effect to the purchase from Mitsubishi described above, we increased our direct and indirect ownership of Trikem’s voting share capital to 87.9% and increased our ownership of Polialden’s voting share capital to 100%.
Immediately after these transactions, our corporate structure was as set forth in the following chart. The percentages in bold italics represent the percentage of the voting share capital owned directly and indirectly by the parent company of each entity, and the percentages not in bold italics represent the percentage of the total share capital owned directly and indirectly by the parent company of each entity. All of these companies are or were organized under Brazilian law.
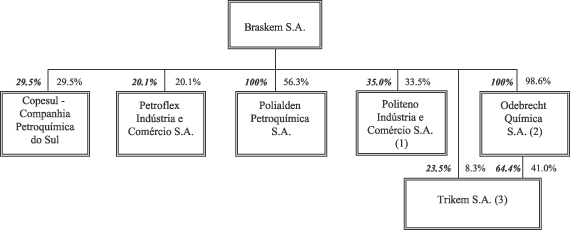
Merger of Trikem into Braskem
On November 3, 2003, as a result of the increase of our holdings of Trikem and as required by the Brazilian Corporation Law, we commencedconducted a public exchange offer for the remaining voting share capital of Trikem not owned by our company. On December 4, 2003, immediately following
In 2004:
Developments Since January 1, 2005
Formation of Paulínia
In order to facilitatePetroquímica Paulínia S.A., or Paulínia, was incorporated on September 16, 2005. On that date, we acquired 60.0% of the merger of Trikem into our company, on January 12, 2004, Odebrecht Química spun off thetotal and voting share capital of Trikem held by it to our company. Following this spin-off, Odebrecht Química no longer owned material assets or conducts any material operations. Odebrecht Química merged intoPaulínia. Paulínia is a joint venture between our company on March 31, 2005.and Petroquisa for the construction and operation of a polypropylene plant located in Paulínia, in the State of São Paulo.
Politeno Acquisition
On January 15, 2004, Trikem merged withApril 6, 2006, we purchased all of the common and into our company. In connection with this merger, we issued 592 of our class A preferred shares in exchange for 514,366 of Trikem’s common sharesPoliteno that were owned by SPQ Investimentos e Participações Ltda., or SPQ, a subsidiary of Suzano, Sumitomo Chemical Company Limited, or Sumitomo, and 32,544,069Itochu Corporation, or Itochu. We refer to this transaction as the Politeno Acquistion. Following the Politeno Acquisition, we owned 100% of our class A preferred shares in exchange for 28,260,456,441the voting share capital and 96.2% of Trikem’s preferred shares.the total share capital of Politeno.
Merger of Polialden into Braskem
At an extraordinary shareholdersshareholders’ meeting on January 15, 2004,in May 2006, our shareholders approved our merger with Trikem, an amendment to our by-laws to permitPolialden and the conversion of 2,632,043 of our class A preferred shares into common shares upon the approval of the majority of our voting share capital, and the conversion of 487,793 of our class A preferred shares into 487,7932,632,043 of our common shares in order to maintain the required minimum ratio of our common shares to preferred shares in accordance with the Brazilian Corporation Law after the completion of theour merger with Trikem.
Exchange of Polialden Shares for Our Class A Preferred Shares
On December 15, 2004,Polialden. In connection with this merger, we exchanged 2,020,201issued 7,878,825 of our class A preferred shares in exchange for 264,886,083 of Polialden’s preferred shares.
Ipiranga Transaction
On March 18, 2007, we entered into an investment agreement with Ultrapar and Petrobras, which were heldwe refer to as the Ipiranga Investment Agreement. On the same date, Ultrapar and the controlling shareholders of RPI, Companhia Brasileira de Petróleo Ipiranga, or CBPI, and Distribuidora de Produtos de Petróleo Ipiranga S.A., or DPPI, entered into a share purchase and sale agreement, which refer to as the Purchase Agreement, with our company and Petrobras as intervening parties. We refer to the Ipiranga Investment Agreement and the Purchase Agreement together as the Ipiranga Transaction Agreement, and we refer to the transactions contemplated by the Ipiranga Transaction Agreement and the related transactions described below as, collectively, the Ipiranga Transaction.
24
Under the Ipiranga Investment Agreement, Ultrapar, as a commission agent acting on behalf of Braskem and Petrobras, acquired 100% of the share capital of Ipiranga Química. As of March 18, 2007, Ipiranga Química owned 86.9% of the voting share capital and 92.4% of the total share capital of Ipiranga Petroquímica. Ipiranga Petroquímica, in turn, owned 29.5% of the share capital of Copesul. In February 2008, Ultrapar transferred 60.0% of the share capital of Ipiranga Química to our treasurycompany and 40.0% of the share capital of Ipiranga Química to Petrobras, as required by the Ipiranga Investment Agreement. In addition, under the Ipiranga Investment Agreement, Ultrapar is obligated to transfer 33.3% of the share capital of RPI to our company and 33.3% of the share capital of RPI to Petrobras. Following this transfer, we will jointly and equally control RPI with Petrobras and Ultrapar. The total purchase price to our company of the shares of Ipiranga Química that we have acquired and the shares of RPI that we will acquire from Ultrapar in the Ipiranga Transaction was R$1,489.1 million.
Under the Ipiranga Investment Agreement, Braskem paid Ultrapar R$651.9 million in April 2007, R$156.7 million in October 2007, R$47.0 million in November 2007 and R$633.5 million in February 2008 for 47,846,610the shares of Ipiranga Química that we have acquired and the shares of RPI that we will acquire from Ultrapar in the Ipiranga Transaction. For additional information regarding the Ipiranga Transaction, see “—Ipiranga Transaction.”
Merger of Politeno into Braskem
At an extraordinary shareholders’ meeting in April 2007, our shareholders approved our merger with Politeno and the conversion of 486,530 of our class A preferred shares issued by Polialden held by certaininto 486,530 of our common shares in order to maintain the shareholdersrequired minimum ratio of Polialden. The shareholdersour common shares to preferred shares in accordance with the Brazilian Corporation Law after the completion of Polialden participating in this exchange were parties to suits brought against Polialden claiming, among other things, that certain dividends were owed to these shareholders.our merger with Politeno. In connection with this merger, we issued 1,533,670 of our class A preferred shares in exchange for 412,901,157 of Politeno’s class A preferred shares and 2,126,856,433 of Politeno’s class B preferred shares.
Acquisition of Minority Interests in Ipiranga Petroquímica
In June 2007, EDSP67 acquired the exchange7.6% of the total share capital of Ipiranga Petroquímica not owned by Ipiranga Química for a purchase price of R$117.9 million. In July 2007, Ipiranga Petroquímica was delisted from the São Paulo Stock Exchange, and in August 2007, EDSP67 merged with and into Ipiranga Petroquímica. As a result of these transactions, Ipiranga Petroquímica is now a wholly-owned subsidiary of Ipiranga Química.
Acquisition of Minority Interests in Copesul
In October 2007, our subsidiary EDSP58 acquired 22.7% of the total and voting share capital of Copesul through a public tender offer for the Copesul shares not then owned by our company, Ipiranga Petroquímica, Petroquisa or Triunfo. The purchase price for these claims were relinquished byshares was R$1,294.2 million. We owned 60% of the Polialden shareholders participatingtotal and voting share capital of EDSP58, and Petrobras owned the remaining share capital of EDSP58. As a result of the Copesul Tender Offer, Copesul was delisted from the São Paulo Stock Exchange in October 2007. In October 2007 and November 2007, EDSP58 purchased additional shares of Copesul at the price per share paid in the exchange.Copesul Tender Offer. In November 2007, Copesul redeemed all of its outstanding shares, other than shares held by our company, EDSP58, Ipiranga Petroquímica, Petroquisa and Triunfo at the price per share paid in the Copesul Tender Offer. The aggregate purchase price for the shares purchased and redeemed after the completion of the Copesul Tender Offer was R$124.3 million. In December 2007, EDSP58 merged with and into Copesul. Following this merger, Braskem owns 39.2% of the total and voting share capital of Copesul, Ipiranga Petroquímica owns 39.2% of the total and voting share capital of Copesul and Petroquisa and Triunfo own 21.6% of the total and voting share capital of Copesul.
25
Acquisition of Additional Interest in Petroflex and Sale of Interest in Petroflex
In October 2007, we acquired shares of Petroflex Indústria e Comércio S.A., or Petroflex, representing 13.4% of its total and voting share capital from Suzano for an aggregate purchase price of R$61.0 million as a result of our exercise of our preemptive rights in August 2007 following the announcement of the acquisition of control of Suzano by Petrobras. As a result of this exchange,acquisition, we increased our interest inowned 33.5% of the total share capital of PolialdenPetroflex including 33.6% of its voting share capital. In April 2008, we sold all of our share capital in Petroflex to Lanxess Participações Ltda., or Lanxess, for an aggregate price of R$252.1 million. As a result of this transaction, Petroflex registered a non-operational gain of R$115.6 million.
Ipiranga Transaction
On March 18, 2007, we entered into the Ipiranga Investment Agreement with Ultrapar and Petrobras. On the same date, Ultrapar and the controlling shareholders of RPI, CBPI and DPPI entered into the Purchase Agreement, with our company and Petrobras as intervening parties.
Under the Ipiranga Investment Agreement, Ultrapar, as a commission agent acting on behalf of Braskem and Petrobras, acquired 100% of the share capital of Ipiranga Química. As of March 18, 2007, Ipiranga Química owned 86.9% of the voting share capital and 92.4% of the total share capital of Ipiranga Petroquímica. Ipiranga Petroquímica, in turn, owned 29.5% of the share capital of Copesul. In February 2008, Ultrapar transferred 60% of the share capital of Ipiranga Química to our company and 40% of the share capital of Ipiranga Química to Petrobras, as required by the Ipiranga Investment Agreement. In addition, under the Ipiranga Investment Agreement, Ultrapar is obligated to transfer 33.3% of the share capital of RPI to our company and 33.3% of the share capital of RPI to Petrobras. Following this transfer, we will jointly and equally control RPI with Petrobras and Ultrapar. The total purchase price to our company of the shares of Ipiranga Química that we have acquired and the shares of RPI that we will acquire from 56.3%Ultrapar in the Ipiranga Transaction was R$1,489.1 million.
As part of the Ipiranga Transaction:
Structure of the Transaction
As of the date of the Ipiranga Transaction Agreement, RPI owned:
26
In addition, as of the date of the Ipiranga Transaction Agreement, DPPI owned 21.0% of the total share capital of CBPI, including 62.9% of its voting share capital, and CBPI owned 41.5% of the total share capital and voting share capital of Ipiranga Química. Under the Ipiranga Transaction Agreement and applicable law, Ultrapar was obligated to 63.7%.
Current Corporate Structure First Phase of Ipiranga Transaction
In April 2007, Ultrapar acquired from the controlling shareholders of RPI, DPPI and CBPI for a purchase price of R$2,113.1 million:
Second Phase of Ipiranga Transaction
In the second phase of the Ipiranga Transaction:
Third Phase of Ipiranga Transaction
In the third phase of the Ipiranga Transaction, in December 2007 the shareholders of Ultrapar, RPI, DPPI and CBPI approved the issuance of preferred shares of Ultrapar in exchange for the outstanding shares of RPI, DPPI and CBPI that Ultrapar did not own through an exchange of shares (incorporação de ações). This exchange was completed in January 2008 and, as a result of the completion of this exchange, Ultrapar became the sole owner of the share capital of RPI, DPPI and CBPI.
Fourth Phase of Ipiranga Transaction
In the fourth phase of the Ipiranga Transaction, in February 2008 Ultrapar delivered:
27
The fourth phase of the Ipiranga Transaction will be completed when Ultrapar delivers 33.3% of the total share capital and voting share capital of RPI to our company; and 33.3% of the total share capital and voting share capital of RPI to Petrobras. We expect that Ultrapar will deliver these shares in the third quarter of 2008.
Accounting and Financial Impact of Ipiranga Transaction
As a result of the Ipiranga Transaction, we have fully consolidated the results of Copesul and its subsidiaries and consolidated the results of Ipiranga Química and its subsidiaries, including Ipiranga Petroquímica, into our financial statements as from April 1, 2007. We have accounted for each of Copesul, Ipiranga Química and Ipiranga Petroquímica as separate segments in our financial statements as from April 1, 2007. In addition, we have accounted for our interest in the results of RPI under the equity method in our financial statements as from April 1, 2007.
CADE Review of Ipiranga Transaction
The Ipiranga Transaction is subject to the final approval of the Brazilian antitrust authorities. However, Brazilian law permits us to consummate these transactions prior to receiving this final approval, unless CADE issues a writ of prevention blocking a transaction or requires the parties to enter into an agreement permitting the effects of the transaction to be reversed which, by its terms, delays the consummation of the transaction. Our company, together with Ultrapar and Petrobras, submitted the terms and conditions of the Ipiranga Transaction for review by the Brazilian antitrust authorities in April 2007.
In April 2007, CADE issued a writ of prevention relating to the Ipiranga Transaction, which, among other things, prevented our exercise of strategic management control over Ipiranga Química and Ipiranga Petroquímica. In issuing the writ of prevention, CADE stated that the purpose of the writ of prevention was to guarantee that the Ipiranga Transaction could be reversed in the event that CADE so determined following its review of the Ipiranga Transaction. In April 2007, CADE revoked this writ of prevention upon the agreement of our company to execute the Reversibility Agreement designed to preserve the reversibility of the Ipiranga Transaction. Under the Reversibility Agreement, we agreed to preserve all of the assets acquired in the Ipiranga Transaction until CADE makes a final determination with respect to the Ipiranga Transaction, and we are permitted to effectively own and manage these assets pending this final determination.
Although the terms and conditions of the Ipiranga Transaction were submitted to the Brazilian antitrust authorities in four separate filings reflecting the separate markets affected by the Ipiranga Transaction, on September 19, 2007, CADE decided that the four fillings should be analyzed and submitted for approval together.
The Economic Monitoring Office of the Ministry of Finance(Secretaria de Acompanhamento Econômico), or SEAE, issued a favorable opinion with respect to the Ipiranga Transaction in February 2008. Approval of this transaction by CADE remains pending. There can be no assurance that the Brazilian antitrust authorities will approve the Ipiranga Transaction as currently structured or that these authorities will not impose additional conditions on the Ipiranga Transaction. We cannot predict when CADE will take final action with respect to the Ipiranga Transaction.
Strategic Rationale
Through our participation in the Ipiranga Transaction, we are taking an important step in the consolidation and development of the Brazilian petrochemical industry. We believe the acquisition of control of Copesul and Ipiranga Petroquímica will provide the following strategic and financial benefits to our company:
28
Financing of Purchase Price
Under the Ipiranga Investment Agreement, Braskem paid Ultrapar R$651.9 million in April 2007, R$156.7 million in October 2007, R$47.0 million in November 2007 and R$633.5 million in February 2008 for the shares of Ipiranga Química that we have acquired and the shares of RPI that we will acquire from Ultrapar in the Ipiranga Transaction.
In April 2007, we entered into the Acquisition Credit Agreement with three financial institutions in the aggregate amount of US$1.2 billion to finance the Ipiranga Transaction. In April 2007, we received the first disbursement under the Acquisition Credit Agreement in the aggregate amount of US$330.0 million to fund the first payment due under the Ipiranga Investment Agreement. In October 2007, we received the second and third disbursements under the Acquisition Credit Agreement in the aggregate amount of US$468.8 million to fund a portion of the purchase price under the Copesul Tender Offer. In October 2007, we received the fourth and fifth disbursements under the Acquisition Credit Agreement in the aggregate amount of US$150.0 million to fund a portion of the purchase price paid by Ultrapar in tender offers for the common shares of RPI, DPPI or CBPI. In February 2008, we received the sixth and final disbursement under the Acquisition Credit Agreement in the aggregate amount of US$251.2 million to fund the final payment due as part of the Ipiranga Transaction. Each disbursement under the Acquisition Credit Agreement bears interest at the rate of LIBOR plus 0.35% per annum until the first anniversary of such disbursement and thereafter at the rate of LIBOR plus 0.55% per annum, payable in arrears. The principal amount of each disbursement under the Acquisition Credit Agreement is payable on or prior to the second anniversary of such disbursement. The Acquisition Credit Agreement includes limitations on our ability to incur liens, enter into related party transactions or merge with certain other entities.
In June 2007, EDSP67 entered into two short-term financing transactions with Brazilian financial institutions in the aggregate amount of US$61.0 million to finance the acquisition of the 7.6% of the total share capital of Ipiranga Petroquímica not owned by Ipiranga Química.
In September 2007, EDSP58 entered into an export prepayment credit facility with Petrobras International Finance Company – PIFCo, or PIFCo, under which EDSP58 is permitted to borrow an aggregate principal amount of up to US$323.0 million. In October 2007, EDSP58 borrowed an aggregate of US$312.5 million under this facility to fund a portion of the purchase price of the shares tendered in the Copesul Tender Offer.
In order to lengthen the average maturity of our outstanding indebtedness and to reduce our refinancing risks, we are exploring refinancing of the Acquisition Credit Agreement in the near term. In May 2008. we used the proceeds of our offering of US$500.0 million 7.250% Notes due 2018 to repay a portion of the indebtedness outstanding under the Acquisition Credit Agreement. We are analyzing opportunities to refinance the remainder of this indebtedness through bank credit agreements, pre-export financing agreements, offerings of securities in the domestic or international markets or a combination of these instruments. The form, manner and timing of the refinancing of amounts borrowed under the Acquisition Credit Agreement will depend on market conditions.
29
Shareholders Agreements
We have entered into the shareholders agreements and memorandum of understanding described below that govern our rights with respect to Copesul, Ipiranga Química, Ipiranga Petroquímica and RPI.
Interim Shareholders Agreement
On April 18, 2007, we entered into a shareholders agreement with Ultrapar and Petrobras, which we refer to as the Interim Shareholders Agreement, under which we obtained effective management control over Ipiranga Química and, consequently, Ipiranga Petroquímica and the interest of Ipiranga Petroquímica in Copesul. Under the Interim Shareholders Agreement, we were granted the right to nominate a majority of the board of directors of Ipiranga Química and Ipiranga Petroquímica, and the right to nominate a majority of the nominees of Ipiranga Petroquímica to the board of directors of Copesul. The Interim Shareholders Agreement terminated in February 2008 upon the transfer of the shares of Ipiranga Química to our company and Petrobras as part of the fourth phase of the Ipiranga Transaction as described above under “—Structure of the Transaction—Fourth Phase of Ipiranga Transaction.”
Ipiranga Memorandum of Understanding
On March 18, 2007, we entered into a memorandum of understanding with Petrobras regarding the interests of Ipiranga Petroquímica in Copesul and the control of Ipiranga Química and Ipiranga Petroquímica, which we refer to as the Ipiranga Memorandum of Understanding. The Ipiranga Memorandum of Understanding granted Petrobras veto rights with respect to certain matters that are subject to the approval of the shareholders and boards of directors of Ipiranga Química, Ipiranga Petroquímica and Copesul. Upon the completion of the first phase of the Petrobras Transaction, Petrobras, Petroquisa, Odebrecht and Norquisa, with Braskem as intervening party, entered into a shareholders’ agreement with a term of 25 years, which we refer to as the Petrobras Shareholders’ Agreement. The Petrobras Shareholders’ Agreement superseded the Ipiranga Memorandum of Understanding.
RPI Shareholders Agreement
As part of the Ipiranga Transaction, we entered into a shareholders agreement with Ultrapar and Petrobras, which we refer to as the RPI Shareholders Agreement, which gives each of Ultrapar, Petrobras and our company the right to nominate one-third of the directors of RPI and establishes that all decisions need to be taken by the unanimous vote of the shareholders.
Petrobras Transaction
On November 30, 2007, Braskem entered into an investment agreement with Odebrecht, Petrobras, Petroquisa and Norquisa. On May 14, 2008, Braskem, Odebrecht, Norquisa, Petrobras and Petroquisa entered into an amendment to this agreement. We refer to this agreement, as amended, as the Petrobras Investment Agreement. We refer to the transactions under the Petrobras Investment Agreement as the Petrobras Transaction. Under the Petrobras Investment Agreement, the Petrobras Transaction will be completed in two phases. In the first phase, Petroquisa through its wholly-owned subsidiary Grust Holdings S.A., or Grust, contributed the following assets to Braskem:
In exchange for these assets, Braskem issued an aggregate of 46,903,320 common shares and 43,144,662 class A preferred shares to Petroquisa.
30
As a result of the completion of the first phase of the Petrobras Transaction, Petrobras owns, directly and indirectly, 23.1% of our total share capital, including 30.0% of our voting share capital, and Braskem owns, directly and indirectly:
The first phase of the Petrobras Transaction was implemented on May 30, 2008 through an exchange of shares (incorporação de ações) in which shares of Braskem were issued to Petroquisa in exchange for shares of Grust that, directly and indirectly, owns the interests in Copesul, Ipiranga Química, Ipiranga Petroquímica and Paulínia contributed to Braskem.
Under the Petrobras Investment Agreement, Petrobras has the option in the second phase of the Petrobras Transaction to contribute up to 100% of the share capital of Triunfo to Brasken in exchange for approximately 13,387,197 of our class “A” preferred shares. We refer to this option as the Triunfo Option. Triunfo owns 0.8% of the voting and outstanding share capital of Copesul. If Petrobras exercises this option and contributes 100% of the share capital of Triunfo to Braskem, Copesul will become a wholly-owned subsidiary of Braskem.
The following chart presents the corporate structure of our principal subsidiaries and equity investments following the transactions described above.completion of the first phase of the Petrobras Transaction. The percentages in bold italics represent the percentage of the voting share capital owned directly and indirectly by the parent company of each entity, and the percentages not in bold italics represent the percentage of the total share capital owned directly and indirectly by the parent company of each entity. All of these companies are organized under Brazilian law.
31
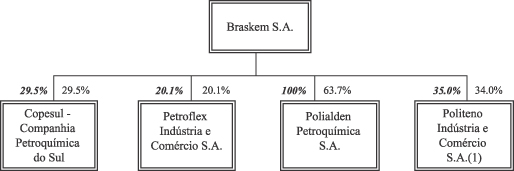
Our Principal Subsidiary and Jointly Controlled CompaniesStrategic Rationale
Through our participation in the Petrobras Transaction, we are taking an important step in the consolidation and development of the Brazilian petrochemical industry. We believe the consolidation of Copesul, Ipiranga Química, Ipiranga Petroquímica, Paulínia and Triunfo into our company will provide the following strategic and financial benefits to our company:
Our principal subsidiary is Polialden.
32
Accounting and Financial Impact of Petrobras Transaction
As a summaryresult of our equity investments in these companies and the shareholders agreementscompletion of the first phase of the Petrobras Transaction, we have signedwill no longer record minority interests with respect to Ipiranga Química and the minority interest in Copesul and Politeno.
Polialden
Polialden is a corporation (sociedade anônima) organized under the laws of Brazil. At December 31, 2004, we indirectly owned all of the voting share capital and 63.7%represents only 0.8% of the total share capital of Polialden. Polialden is engagedCopesul. In addition, we will fully consolidate the results of Paulínia into our financial statements as from April 1, 2008. In the event that Petrobras and Petroquisa exercise the Triunfo Option in full, we will fully consolidate the manufacturing, processing, selling, importing and exportingresults of high-density polyethylene, ultra high molecular weight polyethylene and other chemical and petrochemical products. Polialden operates its industrial unit inTriunfo into our financial statements as from the Northeastern Complex. For information concerning these operations, see “—Polyolefins Unit.”date of the completion of the Petrobras Transaction.
Copesul
Copesul isAs a corporation (sociedade anônima) organized underresult of our full consolidation of the lawsresults of Brazil.Paulínia into our financial statements, we will fully consolidate the assets and liabilities of Paulínia in our balance sheet, including the indebtedness of Paulínia. At December 31, 2004, we owned, directly and indirectly, 29.5%2007, Paulínia’s total outstanding debt was R$451.7 million, of which R$271.0 million was reflected in our balance sheet due to the proportional consolidation of the voting and total share capitalresults of Copesul. CopesulPaulínia in our financial statements.
CADE Review of Petrobras Transaction
Although we believe that the Petrobras Transaction is not subject to the second largest petrochemical cracker in Brazil based on production capacity, with approximately 39% of Brazilian production capacity of ethylene. We provide more information about Copesul’s business in “—Jointly Controlled Companies—Copesul.”
We have entered into a shareholders agreement with Ipiranga Petroquímica S.A., or Ipiranga, relating to our shares of Copesul. Ipiranga owns 29.5%final approval of the voting and total share capital of Copesul. UnderBrazilian antitrust authorities, because the Copesul shareholders agreement, we and Ipiranga jointly control Copesul. We have agreed to consult with Ipiranga prior to any meeting of Copesul’s board of directors or shareholders and to vote our shares together with Ipiranga on specified matters, including policies relatingPetrobras Transaction is a follow-on transaction to the allocationIpiranga Transaction and does not involve any change of excess amountscontrol of raw materials, policies relating to the distribution of profits, the election of members to Copesul’s board of directors, amendments to
Copesul’s by-laws, approval of indebtedness of Copesul in excess of certain limits, sales of assets in excess of specified limits, investments in excess of certain limits and the merger of Copesul with another company. We have also agreed that neither we nor Ipiranga will vote to approve any of the above matters unless we and Ipiranga vote 75% of the shares collectively held by us in favor of that action at a meeting between Ipiranga and our company or if no quorum is obtained at such a meeting, of 75%Petrobras, we and Petrobras submitted the terms and conditions of the shares present at a second meeting called for this purpose.
Petrobras Transaction to the Brazilian antitrust authorities in December 2007. The Copesul shareholders agreement also provides a right of first refusal for transfers or salesSEAE and the Economic Law Office of the voting share capitalMinistry of Copesul to third parties, except for transfers and sales of Copesul voting share capital to companies directly or indirectly controlled by the selling shareholder. Third-party purchasers of common shares of Copesul from our company or Ipiranga also must agree to comply with the Copesul shareholders agreement. The shareholders agreement also includes provisions designed to ensure that each of our company and Ipiranga will continue to own the same proportion of shares of Copesul if it so elects.
The Copesul shareholders agreement provides that we will vote with Ipiranga in a manner designed to ensure that both we and Ipiranga are able to elect the maximum possible number of members of Copesul’s board of directors. The shareholders agreement is effective until August 2022. We have agreed with Ipiranga not to enter into another shareholders agreement regarding Copesul with any other shareholders of Copesul.
JusticePoliteno(Secretaria de Direito Econômico)
Politeno is a corporation (sociedade anônima) organized under the laws of Brazil. At December 31, 2004, we owned 34.0% of Politeno’s total share capital, including 35.0% of its voting share capital. Politeno produces polyethylenes, which are widely used in the flexible and rigid packaging industries. Politeno produces low density polyethylene, or LDPE, medium density polyethylene, high density polyethylene, or HDPE, linear low density polyethylene, or LLDPE, linear medium density polyethylene, ethyl vinyl acetate copolymer and other special resins. We provide more information about Politeno’s business in “—Jointly Controlled Companies—Politeno.”
Through Conepar, we have entered into a shareholders agreement with Suzano Petroquímica S.A., or Suzano, Sumitomo Chemical Company Limited and Itochu CorporationSDE, issued favorable opinions with respect to our shares of Politeno. Suzano owns 33.9% of Politeno’s total share capital, including 35.0% of its voting share capital; Sumitomo Chemical Company Limited owns 18.9% of Politeno’s total share capital, including 20.0% of its voting share capital; and Itochu Corporation owns 9.4% of Politeno’s total share capital, including 10.0% of its voting share capital. The Politeno shareholders agreement contains provisions governing voting, transfer and preemptive rights. We have the right to elect twoPetrobras Transaction in April 2008. Approval of the seven members of Politeno’s board of directors andfiling by CADE remains pending.
There can be no assurance that the right to elect anBrazilian antitrust authorities will agree with our analysis or that these authorities will not impose additional member of Politeno’s board of directors in alternating years.conditions on the Petrobras Transaction. We also have the right to elect one of the six executive officers.
We have agreed in the Politeno shareholders agreement to attempt to reach unanimous decisions with the other partiescannot predict when CADE will take final action with respect to certain actions to be taken by Politeno’s board of directors or shareholders, including: changes to Politeno’s by-laws, subject to certain exceptions; Politeno’s dissolution or liquidation; the merger of Politeno with another company; certain transactions with holders of Politeno’s common shares; transactions involving the purchase, sale, assignment or encumbrance of fixed assets of Politeno in excess of specified amounts; and Politeno’s incurrence of secured indebtedness in excess of certain specified levels. The parties to the shareholders agreement also granted each other certain rights of first refusal and agreed not to encumber their shares of Politeno without the consent of parties representing at least 50% of Politeno’s issued and outstanding common shares, subject to certain exceptions. Third-party purchasers of common shares of Politeno from any of the parties to the shareholders agreement also must agree to comply with its terms.Petrobras Transaction.
We also have equity interests in other companies, including Petroflex Indústria e Comércio S.A., or Petroflex, and Borealis Brasil S.A., or Borealis, for which we have entered into shareholders agreements that include provisions governing voting, transfer and preemptive rights.
Capital Expenditures
Our capital expenditures on property, plant and equipment were R$432.3 million in 2004, R$214.7 million in 2003 and R$419.9 million in 2002. Additionally, our investments in interests in other companies were R$23.6 million in 2004, R$71.7 million in 2003 and R$13.1 million (excluding cash acquired of R$4.1 million) in 2002. Our principal capital expenditures projects during 2002 through 2004 were:
In 2004, we began implementation of our Braskem + program. This program identifies 218 specific initiatives, each with its own performance goals and implementation schedule. At December 31, 2004, we had made capital expenditures of R$23.5 million related to the implementation of this program and anticipate that this program will require us to make additional capital expenditures of approximately R$241.7 million through 2007, including R$124.2 million in 2005.
On June 22, 2005, our board of directors and the board of directors of Petroquisa approved the creation of a joint venture between our companies for the construction and operation of a polypropylene plant to be located in Paulínia, in the State of São Paulo, with an annual production capacity of approximately 300,000 tons. Our board of directors also approved (1) the results of a detailed feasibility study of the project and (2) the creation of a new company together with Petroquisa, which company will execute the project. The principal terms of this joint venture provide that:
Our ability to compete in the Brazilian and foreign markets that we serve depends on our ability to integrate new production processes developed by our company and third parties in order to lower our costs and offer new thermoplastic products. In addition, our relationships with our customers are enhanced by our ability to develop new products and customize existing products to meet their needs. To meet these challenges, we maintain a research and development program that is primarily implemented at the Braskem Center for Innovation and Technology in the Southern Complex. We invested R$59.2 million, R$35.5 million and R$20.1 million in research and development during 2004, 2003 and 2002, respectively.
We currently are budgeting total capital expenditures of approximately R$842.2 million for 2005. Our principal capital expenditures for 2005 consist of, in addition to the projects referred to in the preceding paragraphs, approximately R$166.3 million for health, environmental and quality improvement projects, approximately R$110.1 million for the replacement of depreciated equipment, approximately R$114.9 million for productivity improvements and approximately R$153.1 million for plant modernization and information systems.
We are currently evaluating projects that could entail significant capital expenditures in the future.
Maintenance
Most of our maintenance is performed by third-party service providers. For example, we have contracts with Construtora Norberto Odebrecht S.A., a company in the Odebrecht Group, Asea Brown Boveri Ltd. and other service providers to perform maintenance for our Basic Petrochemicals Unit and our Business Development Unit. We also perform some of our ordinary course maintenance with our small team of maintenance technicians, which also coordinate the planning and execution of maintenance services performed by third parties.
Because we have two independent Olefins units and two independent Aromatics units, we may continue production of basic petrochemicals without interruption, even while we perform certain maintenance services. We occasionally undertake other brief shutdowns of our operations that do not materially affect our production output, primarily for maintenance purposes, catalyst regeneration and equipment cleaning.
Regular basic petrochemicals plant maintenance requires complete plant shutdowns from time to time, and these shutdowns usually take approximately 30 days to complete. Since commencing operations in July 1978, our largest basic petrochemicals plant (Olefins 1) has undergone seven scheduled major maintenance services as part of our regular maintenance activities. The last general maintenance shutdown of our Olefins 1 unit was carried out in July and August 2001 and lasted for 25 days. This shutdown permitted inspection and maintenance of this unit, which had been operational for almost five years without a shutdown. This shutdown was intended to
improve the plant’s efficiency and production capacity. The cost of servicing the unit was approximately US$15 million (not including the value of lost production during this shutdown). The next general shutdown of our Olefins 1 unit has been scheduled for 2007 with an estimated duration of approximately 30 days.
In 2002, we shut down our Olefins 1 unit for 92 days in order to increase its production capacity and to modernize and upgrade its technology. This shutdown reduced our Basic Petrochemical Unit’s ethylene and propylene production in 2002. The cost of these improvements to this Unit was approximately US$61 million (not including lost production).
The last general maintenance shutdown of our Aromatics 2 and Olefins 2 units (which form part of the same basic petrochemicals facility) was carried out in January and February 2004 and lasted 36 days. This shutdown permitted inspection and maintenance of this unit, which had been operational for almost seven years without a shutdown. This shutdown was intended to improve the plants efficiency and production capacity. In addition, we implemented various improvements to ensure the reliability and continuous operation of these units and to minimize the environmental impact of our operations. The cost of servicing this unit was approximately R$89 million (not including the value of lost production during this shutdown). The next general shutdown of our Aromatics 2 and Olefins 2 units has been scheduled for 2009 with an estimated duration of approximately 35 days.
The last general maintenance shutdown of our Aromatics 1 unit was carried out in May 2004 and lasted 40 days. This shutdown permitted inspection and maintenance of this unit, which had been operational for three years without a shutdown. This shutdown was also intended to improve the efficiency and production capacity of the plants in this unit and resulted in the development of new solvents and substantial growth in our production of aromatics, including an increase of our para-xylene production capacity by 50,000 tons. The cost of servicing this unit was approximately R$21 million (not including the value of lost production during this shutdown). The next general shutdown of our Aromatics 1 unit has been scheduled for 2008 with an estimated duration of approximately 30 days.
We have a regular maintenance program for each of our polyolefins plants. Production at each of our polyolefins plants generally is shut down for 15 to 20 days every two years to allow for regular inspection and maintenance. In addition, we undertake other brief shutdowns for maintenance purposes that do not materially affect our production of polyolefins. We coordinate the maintenance cycles of our polyolefins plants with those of our basic petrochemicals plants. While our basic petrochemicals facilities must be shut down for up to 30 days for maintenance, our polyolefins facilities may be shut down for shorter periods because these facilities are less complex to operate and maintain than our basic petrochemicals facilities.
We have a regular maintenance program for each of our vinyls plants. Our Camaçari and Alagoas PVC plants are generally shut down for 20 days every two years to allow for regular inspection and maintenance. The last general maintenance shutdown of our PVC plant in Camaçari was carried out in January 2004 and lasted for 14 days. The next general maintenance shutdown of this plant is scheduled for August 2005. The last general maintenance shutdown of our PVC plant in Alagoas was carried out in December 2004 and lasted for 16 days. The next general maintenance shutdown of this plant is scheduled for 2006. Our São Paulo PVC plant generally shuts down for five days of maintenance each year. Our caustic soda and chlorine plant in Alagoas generally shuts down for 15 days of maintenance every two years. The last general maintenance shutdown of this plant was carried out in March 2004 and lasted for 12 days. The next general maintenance shutdown of this plant is scheduled for 2006. Our caustic soda and chlorine plant in Camaçari does not require prolonged maintenance shutdowns and is shut down for two or three days each year.
Regular maintenance of our Business Development Unit plants usually requires plant shutdowns every two years that take approximately 20 days to complete. The last general maintenance shutdown of our caprolactam plant was carried out in March 2003 and lasted 20 days. During this maintenance shutdown, we also changed certain production equipment caprolactam, which (together with other measures that we have adopted) we
anticipate will extend the periods between general maintenance shut downs of this plant from two to three years. The cost of the last maintenance shutdown was approximately US$2.5 million (not including lost production value). The next general maintenance shutdown of this plant is scheduled for August 2005. The last general maintenance shutdown of our Business Development Unit’s DMT and PET plant was carried out in April 2005 and lasted for 27 days. The cost of this shutdown was R$10.9 million (not including lost production value). Prior to this general maintenance shutdown, the last general maintenance shutdown of our DMT and PET plants in June 2003, during which we successfully upgraded the PET plant’s reactor, resulting in resin quality improvements as well as increasing the plant’s annual production capacity from 60,000 tons to 70,000 tons. We also implemented operational improvements in our PET plant in 2004, which further increased the plant’s annual production capacity from 70,000 tons to 78,000 tons. The next general maintenance shutdown of our PET and DMT plants is scheduled for April 2007.
Petrochemical Industry Overview
Structure
The petrochemical industry transforms crude oil by-products, principally naphtha, or natural gas into widely used industrial and consumer goods. The Brazilian petrochemical industry is generally organized into first, second and third generation producers based on the stage of transformation of various petrochemical raw materials, or feedstocks.
First Generation Producers
Brazil’s first generation producers, which are referred to as “crackers,” break down or “crack” naphtha or natural gas, their principal feedstock, into basic petrochemicals. TheThere are four crackers in Brazil. Three of these crackers purchase their naphtha, which is a by-product of the oil refining process, primarily from Petrobras, as well as from other suppliers located outside of Brazil. The fourth, Rio Polímeros, purchases natural gas from Petrobras. The basic petrochemicals produced by the crackers include:
We, Copesul and Petroquímica União S.A.and Rio Polímeros operate Brazil’s threefour crackers and sell basic petrochemicals to second generation producers, including, in our case, second generation producers that are part of our company. A fourth petrochemical cracker commenced operation on June 23, 2005. The basic petrochemicals, which are in gaseous or liquid form, are transported primarily via pipelines to the second generation producers’ plants, generally located near the crackers, for further processing.
33
Second Generation Producers
Second generation producers process the basic petrochemicals obtained from the crackers to produce intermediate petrochemicals. These intermediate petrochemicals include:
There are 4536 second generation producers operating in Brazil. Intermediate petrochemicals are produced in solid form as plastic pellets or powders and are transported primarily by truck to third generation producers, which generally are located far from the second generation producers.
Third Generation Producers
Third generation producers, known as transformers, purchase the intermediate petrochemicals from second generation producers and transform them into final products including:
Third generation producers manufacture a variety of consumer and industrial goods, including containers and packaging materials, such as bags, film and bottles, textiles, detergents, paints, automobile parts, toys and consumer electronic goods. There are over 6,000more than 11,200 third generation producers operating in Brazil.
Petrochemical Complexes
The production of first and second generation petrochemicals in Brazil centers around threefour major complexes. These complexes include:
34
Each complex has a single first generation producer, also known as the “raw materials center,” and several second generation producers that purchase feedstock from the raw materials center.
The Northeastern Complex began operations in 1978. The Northeastern Complex consists of 2813 second generation producers situated around the raw materials center operated by our company. At December 31, 2004,2007, our raw materials center had an annual ethylene production capacity of 1,280,000 tons, which we estimate accounted for approximately 44%36.6% of Brazil’s ethylene production capacity.
The Southern Complex began operations in 1982. Copesul in which we have a 29.5% equity interest, is the raw materials center at the Southern Complex and supplies first generation petrochemicals to sixseven second generation producers, including our Polyolefins Unit.Unit and Ipiranga Petroquímica. At December 31, 2004,2007, Copesul had an annual ethylene production capacity of 1,135,000 tons.1,200,000 tons, which we estimate accounted for approximately 34.3% of Brazil’s ethylene production capacity.
The São Paulo Complex, which is the oldest petrochemical complex in Brazil, began operations in 1972. Petroquímica União is the raw materials center at the São Paulo Complex and supplies first generation petrochemicals to 1120 second generation producers located at the São Paulo Complex and elsewhere, including our company. At December 31, 2004,2007, Petroquímica União had an annual ethylene production capacity of 500,000 tons.
A fourth petrochemical complex has been constructed at Duque de Caxias in the State ofThe Rio de Janeiro.Janeiro Complex commenced operations in 2005. Rio Polímeros, a Brazilian petrochemical company, will serve asis the cracker forraw materials center at the new complexRio de Janeiro Complex and has announced that the new petrochemical complex will be an integratedsupplies first andgeneration petrochemicals to two second generation producer with anproducers. At December 31, 2007, Rio Polímeros had a maximum annual ethylene production capacity of 520,000 tons of ethylene, 75,000 tons of propylene and 540,000 tons of polyethylene (LLDPE and HDPE). This plant will use natural gas as a feedstock, and Rio Polímeros commenced operation on June 23, 2005.
Role of the Brazilian Government
The current structure of the Brazilian petrochemical industry reflects the Brazilian government’s plan, developed during the 1970’s, to establish a domestic petrochemical industry to serve Brazilian markets. First and second generation producers, including our company, are located within close proximity of each other to allow the common use of facilities, such as utilities, and to facilitate the delivery of feedstocks. Prior to their privatization by the Brazilian government, the expansion of production capacity at the crackers and the second generation producers was coordinated to ensure that the supply of petrochemicals met expected demand. The infrastructure developed around the complexes fostered the interdependence of first and second generation producers, as limited facilities were constructed for purposes of transportation and storage of feedstocks for import or export. Following their privatization, this interdependence has increased as second generation producers, which continue to rely upon the crackers for feedstocks and utilities, have increased their ownership of, and participation in the management of, the crackers.
The Brazilian government developed the Brazilian petrochemical industry generally by promoting the formation of three-way joint ventures among the Brazilian government, foreign petrochemical companies and private Brazilian investors. In these joint ventures, Petrobras’ subsidiary, Petroquisa, participated as the representative of the Brazilian government, with Petrobras as the supplier of naphtha; a foreign petrochemical company provided technology; and a Brazilian private sector company provided management.
In 1992, the Brazilian government began a privatization program to reduce significantly its ownership of the petrochemical industry. This program was designed to increase private investment in the petrochemical industry and to improve its efficiency. As a result of the privatization program, the Brazilian government’s ownership of our common shares, and of the common shares of Copesul and Petroquímica União, was significantly reduced, replaced by private sector entities. As a result of a similar privatization process, private ownership of the second generation producers increased.
The following table sets forth the percentage of the indirect ownership interests held in the crackers’ voting shares by Petroquisa, private sector entities and other investors before the privatization of the crackers and at December 31, 2004.2007.
35
| Before Privatization | At December 31, 2004 | |||||||||||||||||||
| Date of Privatization | Petroquisa | Private Sector Groups | Other Investors(1) | Petroquisa | Private Sector Groups | Other Investors(1) | ||||||||||||||
Copesul | May 15, 1992 | 67.2 | % | 2.1 | % | 30.7 | % | 15.6 | % | 58.9 | % | 25.4 | % | |||||||
Petroquímica União | Jan. 24, 1994 | 67.8 | 31.9 | 0.3 | 17.4 | 60.8 | 21.8 | |||||||||||||
Braskem | Aug. 15, 1995 | 48.2 | 50.4 | 1.4 | 10.0 | 73.0 | 17.0 | |||||||||||||
| Before Privatization | At December 31, 2007 | |||||||||||||
| Private | Private | |||||||||||||
| Date of | Sector | Other | Sector | Other | ||||||||||
| Privatization | Petroquisa | Groups | Investors(1) | Petroquisa | Groups | Investors(1) | ||||||||
| Copesul | May 15, 1992 | 67.2% | 2.1% | 30.7% | 20.8% | 79.2% | —% | |||||||
| Petroquímica União | January 24, 1994 | 67.8 | 31.9 | 0.3 | 17.4 | 60.8 | 21.8 | |||||||
| Braskem | August 15, 1995 | 48.2 | 50.4 | 1.4 | 8.1 | 84.5 | 7.4 | |||||||
| Rio Polímeros | — | — | — | — | 16.7 | 66.6 | 16.7 | |||||||
(1) Pension funds, banks and individual investors.
Role of Petrobras
Prior to 1995, Brazil’s Constitution granted a monopoly to the Brazilian government, exercised through Petrobras, over the research, exploration, production, refining, importing and transporting of crude oil and refined petroleum products (excluding petrochemical products) in Brazil. The Brazilian Constitution also provided that by-productsbyproducts of the refining process, such as naphtha, could only be supplied in Brazil by or through Petrobras. Naphtha is the principal feedstock used in Brazil for the production of basic petrochemicals such as ethylene and propylene. In 1995, the Brazilian Constitution was amended to allow petroleum and petroleum related activities to be carried out by private companies, by concession or authorization from the Brazilian government. Since 1995, the Brazilian government has taken several measures to liberalize the petrochemical industry in Brazil.
In 1997, Law No. 9,478/97 implemented the 1995 constitutional amendment by creating the Brazilian Energy Policy Council (Conselho Nacional de Política Energética)tica) and the National Petroleum Agency (Agência
Nacional de Petróleo), which were charged with regulating and monitoring of the oil industry and the Brazilian energy sector. Following the creation of the National Petroleum Agency, new rules and regulations have been implemented, aimed at gradually ending Petrobras’ monopoly. Since 1997, ourOur company and Copesul havehas imported naphtha from trading companies and oil and gas producers located abroad.
abroad since 1997 and Copesul has done so since 2000. During 2004,2007, Petrobras produced and sold approximately 56%61.1% of the naphtha consumed by our company and Copesul, and the remaining naphtha consumed by our company and Copesul was imported.
Tariffs
We set prices for ethylene, the principal first generation petrochemical product, that we sell to third-party second generation producers using a margin sharing system.by reference to international market prices. See “Item 4. Information on OurOn The Company—Basic Petrochemicals Unit—Unit and Copesul—Sales and Marketing of Ourour Basic Petrochemicals Unit.” Prices paid by second generation producers for imported first generation petrochemical products partly reflect transportation and tariff costs. We establish the prices of ethylene by-products, such as butadiene, by reference to several market factors, including the prices paid by second generation producers for imported products, which also take into account transportation and tariff costs.
Second generation producers, including our company, generally set prices for their petrochemical products by reference to several market factors, including the prices paid by third generation producers for imported products. Prices paid for such imports also reflect transportation and tariff costs.
The Brazilian government has frequently used import tariffs to implement economic policies. As a result, import tariffs generally vary significantly, especially those imposed on petrochemical products. In November 1997, for example, the import tariffs for polyethylene, polypropylene and PVC were increased from 14.0% to 17.0% but were subsequently reduced to 16.5% in 2001 and then to 15.5% on January 1, 2002. On January 1, 2002, the import tariff for caustic soda was reduced from 10.5% to 9.5%. At December 31, 2003, the import tariffs for basic petrochemical products ranged between 3.5% and 5.5% (except for caustic soda) and the import tariffs for second generation petrochemical products ranged between 13.5% and 15.5%. Imports and exports within the free trade area composed of Argentina, Brazil, Paraguay and Uruguay in South America or Mercosul (Mercado Comum do Sul), or Mercosul, have not been subject to tariffs since December 2001. On December 31, 2004, the Brazilian government reduced all import tariffs for basic and second generation petrochemical products by 1.5%.
The following table shows the fluctuation of the tariffs on certain basic petrochemicals and second generation petrochemicals from 19951998 through 2004.2007. The tariff rates shown are those applicable at the end of the respective years, except where indicated.
36
| 2004 | 2003 | 2002(1) | 2001(2) | 2000 | 1999 | 1998 | 1997(3) | 1996 | 1995 | |||||||||||
| (%) | ||||||||||||||||||||
First generation petrochemicals: | ||||||||||||||||||||
Ethylene | 2.0 | 3.5 | 3.5 | 4.5 | 5 | 5 | 5 | 5 | 2 | 2 | ||||||||||
Propylene | 2.0 | 3.5 | 3.5 | 4.5 | 5 | 5 | 5 | 5 | 2 | 2 | ||||||||||
Caustic soda | 8.0 | 9.5 | 9.5 | 10.5 | 11 | 11 | 11 | 11 | 8 | 1 | ||||||||||
Second generation petrochemicals: | ||||||||||||||||||||
Polyethylene | 14.0 | 15.5 | 15.5 | 16.5 | 17 | 17 | 17 | 17 | 14 | 2 | ||||||||||
Polypropylene | 14.0 | 15.5 | 15.5 | 16.5 | 17 | 17 | 17 | 17 | 14 | 2 | ||||||||||
PVC | 14.0 | 15.5 | 15.5 | 16.5 | 17 | 17 | 17 | 17 | 14 | 2 | ||||||||||
Caprolactam | 12.0 | 13.5 | 13.5 | 14.5 | 15 | 15 | 15 | 15 | 12 | 8 | ||||||||||
| 2007 | 2006 | 2005 | 2004 | 2003 | 2002(1) | 2001(2) | 2000 | 1999 | 1998 | |||||||||||
| (%) | ||||||||||||||||||||
| First generation petrochemicals: | ||||||||||||||||||||
| Ethylene | 2.0 | 2.0 | 2.0 | 2.0 | 3.5 | 3.5 | 4.5 | 5.0 | 5.0 | 5.0 | ||||||||||
| Propylene | 2.0 | 2.0 | 2.0 | 2.0 | 3.5 | 3.5 | 4.5 | 5.0 | 5.0 | 5.0 | ||||||||||
| Caustic soda | 8.0 | 8.0 | 8.0 | 8.0 | 9.5 | 9.5 | 10.5 | 11.0 | 11.0 | 11.0 | ||||||||||
| Second generationpetrochemicals: | ||||||||||||||||||||
| Polyethylene | 14.0 | 14.0 | 14.0 | 14.0 | 15.5 | 15.5 | 16.5 | 17.0 | 17.0 | 17.0 | ||||||||||
| Polypropylene | 14.0 | 14.0 | 14.0 | 14.0 | 15.5 | 15.5 | 16.5 | 17.0 | 17.0 | 17.0 | ||||||||||
| PVC (3) | 14.0 | 14.0 | 14.0 | 14.0 | 15.5 | 15.5 | 16.5 | 17.0 | 17.0 | 17.0 | ||||||||||
| Caprolactam | 12.0 | 12.0 | 12.0 | 12.0 | 13.5 | 13.5 | 14.5 | 15.0 | 15.0 | 15.0 |
| (1) | In 2002, the official tariff was 1.5% less than the rate shown. An additional surcharge of 1.5% assessed on imported products is included in the rate shown. |
| (2) | In 2001, the official tariff was 2.5% less than the rate shown. An additional surcharge of 2.5% assessed on imported products is included in the rate shown. |
| (3) | Imports of |
| Source:Brazilian Association of Chemical Industry and Derivative Products. |
Operating Environment
The Brazilian markets in which we compete are cyclical and are sensitive to relative changes in supply and demand. Demand for petrochemical products is significantly affected by general economic conditions in Brazil and other countries in Mercosul, particularly Argentina. The Brazilian markets are also impacted by the cyclical nature of international markets as prices for petrochemical products in Brazil are determined in part with reference to international market prices for these products and by the prices, including tariff and transportation costs, paid by importers of petrochemical products into Brazil. Reductions in tariffs and other trade barriers have increasingly exposed the Brazilian petrochemical industry to price competition in the international markets.
Traditionally, the second and third calendar quarters have been the periods of the year with the highest sales for the petrochemical industry in the Brazilian market. The increase during this six-month period is tied in part to the production of consumer goods for sale during the year-end holiday season.
Brazilian GDP increased by 5.2%5.4% in 2004, the highest2007. This moderate growth rate in Brazil since 1994. The growth of Brazilian GDP in 2004 contributed to an estimated 11.6%a 8.1% increase in domestic polyolefins consumption (excluding consumption of ethyl vinyl acetate copolymer, or EVA) and a 16.0% increase in domestic PVC consumption. The strong growth in civil construction sector positively affected domestic PVC consumption and the significant growth in other industrial sectors, such as durable goods, automotive and beverage, positively affected domestic consumption of thermoplastic resins (polyethylene, polypropylene and PVC), reflecting the high elasticitygenerally. Although imports represent a small percentage of demand for these products. The increase intotal Brazilian domestic consumption, in 2007, imports of thermoplastic resins was particularly influencedpolyolefins increased by growth in certain industrial sectors19.9% and imports of the Brazilian economy, such as automotive, civil construction, home appliances, shoes, packaging and disposable goods.PVC increased by 39.6% . In 2007, Brazil’s exports of polyolefins increased by 1.2%, while exports of PVC increased by 21.3% . As a result of this increase in domestic demand for thermoplastic resins, coupled with the increase in theincreased production capacity of Brazilian producers, including our company, increasedhigher rates of capacity utilization, and the continuing appreciation of therealagainst the U.S. dollar in 2004,2007, Brazilian petrochemical producers significantly increasedimproved their domestic sales of these products in 2004. In addition, although imports represented a small percentage of total Brazilian domestic consumption, imports of polyolefins, PVC and PET increased by 9.3%, 9.4% and 0.7%, respectively, in 2004.2007.
We anticipate that demand for our products in Brazil may grow due to increasing consumption of plastic-based products, as well as population growth and expected general economic growth in Brazil. In addition, Brazilian per capita consumption of second generation petrochemicals has been modest compared to per capita consumption in many other more developed countries, which we believe suggests a potential for future growth in demand in Brazil. However, that growth could be hindered by the factors described in “Risk“Item 3. Key Information—Risk Factors—Risks Relating to Brazil” and “—“Item 3. Key Information—Risk Factors—Risks Relating to Our Company and the Petrochemical Industry.”
37
The following table sets forth information relating to our production, the estimated production of other Brazilian companies and exports and imports of the products included therein for the years indicated.
| Total | Estimated | |||||||||||
| Total | Production of | Total Brazilian | ||||||||||
| Brazilian | Our Total | Other Brazilian | Total | Total | Domestic | |||||||
| Production | Production | Companies | Imports | Exports | Consumption | |||||||
| (thousands of tons) | ||||||||||||
| Olefins(1) | ||||||||||||
| 2007(2) | 5,417.8 | 3,799.0 | 1,618.7 | 9.1 | 155.5 | 5,271.5 | ||||||
| 2006 | 5,288.1 | 1,778.6 | 3,509.5 | 3.2 | 166.1 | 5,125.2 | ||||||
| 2005 | 4,775.2 | 1,889.9 | 2,885.2 | 18.5 | 120.0 | 4,672.7 | ||||||
| Aromatics(3) | ||||||||||||
| 2007(2) | 1,486.2 | 1,172.9 | 313.3 | 55.3 | 621.1 | 920.4 | ||||||
| 2006 | 1,433.3 | 704.9 | 728.4 | 87.5 | 388.1 | 1,132.8 | ||||||
| 2005 | 1,518.0 | 733.7 | 784.3 | 47.6 | 453.8 | 1,111.8 | ||||||
| Polyolefins(4) | ||||||||||||
| 2007(2) | 3,760.3 | 2,358.2 | 1,402.0 | 498.8 | 1,036.9 | 3,222.2 | ||||||
| 2006 | 3,669.9 | 1,629.6 | 1,940.1 | 415.2 | 1,031.3 | 3,025.4 | ||||||
| 2005 | 3,204.5 | 1,289.2 | 1,859.1 | 392.0 | 806.5 | 2,789.9 | ||||||
| PVC | ||||||||||||
| 2007(2) | 686.5 | 465.4 | 221.0 | 176.7 | 43.2 | 820.0 | ||||||
| 2006 | 676.3 | 447.4 | 228.9 | 126.6 | 35.6 | 767.3 | ||||||
| 2005 | 640.3 | 449.3 | 191.0 | 119.5 | 65.6 | 694.2 | ||||||
| PET(5) | ||||||||||||
| 2007(2) | 484.5 | 25.6 | 458.9 | 112.0 | 52.4 | 544.1 | ||||||
| 2006 | 307.4 | 65.1 | 242.3 | 172.5 | 30.6 | 449.2 | ||||||
| 2005 | 352.6 | 69.7 | 282.9 | 178.4 | 32.6 | 498.3 | ||||||
| Caprolactam | ||||||||||||
| 2007(2) | 46.1 | 46.1 | — | 9.3 | 26.6 | 28.8 | ||||||
| 2006 | 44.9 | 44.9 | — | 6.7 | 17.8 | 33.8 | ||||||
| 2005 | 49.7 | 49.7 | — | 4.1 | 16.2 | 37.5 | ||||||
| Total Brazilian Production | Our Total Production | Total Production of Other Brazilian Companies | Total Imports | Total Exports | Estimated Total Brazilian Domestic Consumption | |||||||
| (thousands of tons) | ||||||||||||
Olefins(1) | ||||||||||||
2004 | 4,779.0 | 1,809.6 | 2,969.4 | 19.9 | 121.5 | 4,677.3 | ||||||
2003 | 4,444.0 | 1,678.6 | 2,765.4 | 24.0 | 127.8 | 4,340.2 | ||||||
2002 | 4,085.4 | 1,591.8 | 2,493.6 | 11.8 | 95.6 | 4,001.6 | ||||||
Aromatics(2) | ||||||||||||
2004 | 1,562.4 | 714.8 | 847.6 | 100.4 | 317.8 | 1,345.0 | ||||||
2003 | 1,475.4 | 638.3 | 837.1 | 105.2 | 345.5 | 1,235.1 | ||||||
2002 | 1,465.0 | 659.8 | 805.2 | 126.9 | 295.2 | 1,296.3 | ||||||
Polyolefins(3) | ||||||||||||
2004 | 3,042.6 | 1,175.1 | 1,867.5 | 354.4 | 651.4 | 2,745.7 | ||||||
2003 | 2,854.4 | 1,101.7 | 1,752.7 | 324.4 | 717.6 | 2,461.1 | ||||||
2002 | 2,623.0 | 1,043.4 | 1,579.6 | 335.6 | 501.6 | 2,457.0 | ||||||
PVC | ||||||||||||
2004 | 629.7 | 420.7 | 209.1 | 94.5 | 44.1 | 680.1 | ||||||
2003 | 604.1 | 392.1 | 212.0 | 86.4 | 75.7 | 614.8 | ||||||
2002 | 602.4 | 397.0 | 205.4 | 141.8 | 58.6 | 685.7 | ||||||
PET | ||||||||||||
2004 | 357.6 | 72.6 | 285.0 | 137.1 | 62.0 | 432.7 | ||||||
2003 | 339.0 | 55.3 | 283.6 | 136.2 | 44.5 | 430.6 | ||||||
2002 | 323.0 | 59.0 | 264.0 | 147.2 | 55.8 | 414.5 | ||||||
Caprolactam | ||||||||||||
2004 | 50.5 | 50.5 | — | 6.4 | 7.6 | 49.3 | ||||||
2003 | 48.8 | 37.6 | 11.3 | 4.9 | 8.1 | 45.6 | ||||||
2002 | 57.5 | 57.5 | — | 4.4 | 9.3 | 52.7 | ||||||
| (1) | Includes ethylene, propylene and butadiene. |
| (2) | Preliminary data. |
| (3) | Includes benzene, toluene |
| Includes polyethylene, | |
| (5) | On May 16, 2007, we temporarily closed our PET plant. |
Sources:Brazilian Association of Chemical Industry and Derivative Products and Braskem.
The above estimates of total domestic consumption assume that all domestic production is immediately sold in the market and that there has been no change in total domestic inventory.
Overview of Our Company’s Operations
We are the leading petrochemical company in Latin America, based on average annual production capacity.capacity in 2007. We are also one of the threethird largest Brazilian-owned private sector industrial companies,company, based on net sales revenue.revenue in 2006 (the most recent year for which comparative information is currently available). We recorded net income of R$690.9 million in 2004 on net sales revenue of R$12,192.017,679.4 million and net income of R$547.6 million in each case under Brazilian GAAP.2007. We produce a diversified portfolio of petrochemical products in our 19 plants in Brazil and have a strategic focus on polyethylene, polypropylene and PVC. We havewere the first Brazilian company with integrated first and second generation petrochemical production facilities, with 13 plants in Brazil.facilities.
38
We have grown over the past fourfive years primarily as the result of the integration of the operations of sixnine Brazilian petrochemical companies: our company;company, which was formerly named Copene Petroquímica do Nordeste S.A.; OPP Química; Polialden; Politeno; Trikem; Proppet; Nitrocarbono; Copesul and Nitrocarbono.Ipiranga Petroquímica. We have merged with all of these companies other than Polialden.Copesul and Ipiranga Petroquímica.
Our business operations are organized into fourseven business units, which correspond to our principal production processes and products:products. Three of these business units (Copesul, Ipiranga Petroquímica and Ipiranga Química) were created in April 2007 as a result of the Ipiranga Transaction described above under “—Ipiranga Transaction.” Our business units are as follows:
We believe the integration of the operations of the companies that formed our company has produced, and will continue to provide,produce, significant synergies and cost savings from reductions in tax,taxes, procurement and logistics expenses, production expenses, general and administrative expenses and other operating expenses.
Strategy
Our vision is to strengthen our position as a world-class petrochemical company. We seek to reinforce our leading position in the Latin American petrochemical market, with a focus on polyethylene, polypropylene and PVC and integration with our production of ethylene and propylene. Our business model focuses on enhancing shareholder value, with strategic drivers consisting of market leadership, cost competitiveness and technological autonomy.
We arewere the first Brazilian company to integrate first and second generation petrochemical production facilities. Our competitive advantages are derived from our leadership position in the Latin American market and on our favorable cost structure, resulting from our production scale and synergies realized from integration of the companies that formed our company.
39
We are committed to providing technological support to our customers through the Braskem Center for Technology and Innovation and Ipiranga Petroquímica’s Technology and Innovation Center, which developsdevelop processes, products and applications for the sector.
The formation of our company marked a milestone in the restructuring of an industrial sector that is vital to Brazil’s economic development. We supply petrochemical products with application in a wide variety of industries, such as food packaging, automotive parts, paints, construction, agriculture, fabrics and personal care products.
The key elements of our strategy include:
|
|
On June 22, 2005, our board of directors and the board of directors of Petroquisa approved the creation ofthird parties.
We have entered into a joint venture between our companieswith Petroquisa for the construction and operation of a polypropylene plant to be located in Paulínia, in the State of São Paulo, with an initial annual production capacity of 350,000 tons. In addition, we have entered into a shareholders agreements with Petroquímica de Venezuela, S.A., or Pequiven, with respect to (1) the formation of Polipropileno del Sur, S.A., or Propilsur, a joint venture with Pequiven for the development, construction and operation of a polypropylene plant with an integrated propane dehydrogenation unit to be located in the Jose Petrochemical Complex in the State of Anzoategui, Venezuela, with an annual production capacity of approximately 300,000 tons. We are also evaluating450,000 tons, and (2) the feasibilityformation of entering intoPolietilenos de America, S.A., or Polimerica, a joint venture with other companiesPequiven for the development, construction and operation of a new integrated polyethylene production centerthe Jose Olefins Project, an olefins complex in Brazil close to be located in the Brazilian-Bolivian borderJose Petrochemical Complex that wouldwill include an ethylene cracker that will use Bolivianethane extracted from natural gas as a feedstock and haveits raw material, with an annual production capacity of 600,0001.3 million tons, and three polyethylene plants with a combined annual production capacity of 1.1 million tons of polyethylene. high density polyethylene, or HDPE, LDPE and LLDPE.
40
In addition, we have entered into a memorandum of understanding with Petroquímica de Venezuela, S.A., the petrochemical subsidiary of PetróPertóleos de Venezuela,Perú—Petroperú S.A., and Petrobras to evaluate joint business opportunities in Venezuela, includingthe technical and economic feasibility of the construction of a polypropylene plant in the El Tablazonew petrochemical complex in Venezuela, with an annual production capacity of approximately 400,000 tons.Peru that would use ethane as feedstock to produce polyethylene. We believe that additional capacity developed by our company, together with joint venture partners, will enable us to maintain and expand our leadership position in Latin America and support our expansion into strategic export markets.
Braskem + Program
We are also committed to sustainable development and to improving the quality of life in the process of implementing an operational excellence program named “Braskem +.” This program is designed to build upon the experience that Braskem has accumulated through the process of capturing operational synergies during its integration process. The Braskem + program seeks to:
In connection with the development of the Braskem + program, we engaged a leading consulting firm to analyze our industrial practices and compare them to benchmarking practices in the global petrochemical sector. Through this analysis, we have identified 218 initiatives designed to further improve, among other things, our capacity utilization, maintenance scheduling and completion, and feedstock procurement and usage.
The implementation of the Braskem + program is being performed by several teams, including:
Wefacilities are developing an electronic database to record the ongoing results of our implementation of the Braskem + program, including information regarding our success in meeting scheduled milestones. We intend to update this database regularly and monitor our progress in meeting the objectives of this program.
Basic Petrochemicals Unit and Copesul
At December 31, 2004,2007, our Basic Petrochemicals facilities had one of the largest average annual production capacities of all first generation producers in Latin America. Our Basic Petrochemicals Unit accounted for R$6,480.07,220.7 million, or 52.1%31.9%, of the net sales revenue of all segments in 2004,2007, including net sales to our other business units, and Copesul accounted for R$5,516.1 million, or 24.4%, of the net sales revenue of all segments in 2007, including net sales to our other business units.
On April 18, 2007, the first phase of the Ipiranga Transaction was completed. As a result of our obtaining effective management control over Copesul, we have fully consolidated the assets, liabilities and results of operations of Copesul as from April 1, 2007. We account for Copesul as a segment separate from our Basic Petrochemicals segment.
Our Basic Petrochemicals Unit produces:and Copesul produce:
41
WeThe products of our Basic Petrochemicals Unit and Copesul are used primarily in the manufacture of intermediate second generation petrochemical products, including those manufactured by our other business units. Our Basic Petrochemicals Unit and Copesul also supply utilities to other plants located in the Northeastern Complex and the Southern Complex and render services to the operators of those plants.
In 2004,2007, 88.5% of our Basic Petrochemicals Unit’s sales (including intra-company sales) were derived from the sale of basic petrochemicals, 6.4%7.3% from the sale of utilities and 5.0%services, and 4.2% from the sale of fuels, and 93.8% of Copesul’s sales (including intra-company sales) were derived from the sale of basic petrochemicals, 1.7% from the sale of utilities and services, and 4.5% from the sale of fuels.
The productsIn 2007, 40.3% of our Basic Petrochemicals Unit are used primarily in the manufactureUnit’s net sales revenue from sales of intermediate petrochemical products, including those manufactured bybasic petrochemicals were derived from sales made to our other business units and 48.4% of Copesul’s net sales revenue from sales of basic petrochemicals were derived from sales made to our other business units.
We believe that our Basic Petrochemicals Unit isand Copesul are well positioned to take advantage of increasing demand for basic petrochemicals products in Brazil, both by our other business units and by third parties. We anticipate that long-term growth for these products in Brazil will continue due to increasing consumption of plastic-baseddemand for consumer products, the trend towards substitution of plastics for more traditional packaging materials, such as glass and paper, as well as general economic growth in Brazil.
Products of Our Basic Petrochemicals Unit and Copesul
The following chart shows some of the majorprimary products produced by our Basic Petrochemicals Unit their derivative intermediateand Copesul and some of the second generation products and their most common end uses.
that use these products as raw materials.
Products of Our Basic
|
|
| ||
| ||||
| ||||
| Olefins: | ||||
| Ethylene | LDPE /LLDPE (1) | |||
| EDC | ||||
Propylene (polymer and chemical grade) |
|
| ||
Butadiene | Synthetic rubber, elastomers, resins | |||
| ||||
| Aromatics: | |||
Benzene | Cyclohexane and cyclohexanone (3) | |||
| Caprolactam (3) | ||||
| Ammonium sulfate (3) | ||||
| Ethylbenzene (used to make styrene monomer/ | ||||
| Cumene | ||||
| Linear alkyle benzene | ||||
| ||||
| ||||
Para-xylene | Purified terephthalic acid and | |||
Ortho-xylene | Phthalic anhydride and plasticizers | |||
| Mixed xylenes | ||||
| ||||
| ||||
| ||||
| ||||
| ||||
| ||||
| ||||
| (1) | Produced by our Polyolefins |
| (2) | Produced by our Vinyls Unit. |
| (3) | Produced by our Business Development Unit. | |
42
The following table sets forth a breakdown of the sales volume and net sales revenue of our Basic Petrochemicals Unit and Copesul (including our intra-company sales) by product line and by market for the yearsperiods indicated.
| Years Ended December 31, | ||||||||||||||||||
| 2007(1) | 2006 | 2005 | ||||||||||||||||
| Quantities | Quantities | Quantities | ||||||||||||||||
| Sold (2) | Net Sales Revenue | Sold (2) | Net Sales Revenue | Sold (2) | Net Sales Revenue | |||||||||||||
| (thousands | (millions of | (thousands | (millions of | (thousands | (millions of | |||||||||||||
| of tons) | reais) | (%) | of tons) | reais) | (%) | of tons) | reais) | (%) | ||||||||||
| Domestic net sales: | ||||||||||||||||||
| Ethylene | 2,068.4 | R$4,826.5 | 41.8% | 1,108.5 | R$2,530.6 | 42.2% | 1,169.8 | R$2,578.2 | 40.8% | |||||||||
| Propylene | 945.1 | 2,045.3 | 17.7 | 413.0 | 871.6 | 14.5 | 497.5 | 1,060.9 | 16.8 | |||||||||
| Benzene | 341.3 | 723.0 | 6.3 | 203.0 | 398.0 | 6.6 | 199.9 | 439.8 | 7.0 | |||||||||
| Butadiene | 195.6 | 449.3 | 3.9 | 140.9 | 341.9 | 5.7 | 150.2 | 331.3 | 5.2 | |||||||||
| Para-xylene | 18.4 | 40.9 | 0.4 | 82.8 | 201.7 | 3.4 | 171.0 | 385.0 | 6.1 | |||||||||
| Ortho-xylene | 65.8 | 142.8 | 1.2 | 61.7 | 136.0 | 2.3 | 41.3 | 87.0 | 1.4 | |||||||||
| Mixed xylenes | 56.2 | 126.2 | 1.1 | 34.1 | 78.0 | 1.3 | 35.4 | 61.7 | 1.0 | |||||||||
| Toluene | 63.0 | 122.2 | 1.1 | 34.8 | 62.5 | 1.0 | 29.5 | 48.0 | 0.7 | |||||||||
| Others | 521.0 | 458.2 | 9.7 | 178.6 | 379.9 | 6.3 | 203.8 | 380.1 | 6.0 | |||||||||
| Total domestic net sales of basic petrochemicals | 4,274.8 | 8,934.4 | 83.0 | 2,257.4 | 5,000.1 | 83.4 | 2,498.4 | 5,372.0 | 85.0 | |||||||||
| Total export net sales of basic petrochemicals | 866.2 | 839.9 | 17.0 | 544.4 | 953.4 | 16.6 | 535.0 | 950.0 | 15.0 | |||||||||
| Total net sales of basic petrochemicals | 5,141.0 | 10,774.3 | 100% | 2,801.8 | 5,953.4 | 100% | 3,033.4 | 6,322.0 | 100% | |||||||||
| Condensate | 788.7 | — | — | — | — | |||||||||||||
| Automotive gasoline and utilities (3) | 1,173.8 | 930.2 | 904.7 | |||||||||||||||
| Total Basic Petrochemicals Unit net sales revenue (4) | R$12,736.8 | R$6,883.6 | R$7,226.7 | |||||||||||||||
| Years Ended December 31, | ||||||||||||||||||||||||
| 2004 | 2003 | 2002 | ||||||||||||||||||||||
| Quantities Sold(1) | Net Sales Revenue | Quantities Sold(1) | Net Sales Revenue | Quantities Sold(1) | Net Sales Revenue | |||||||||||||||||||
| (thousands of tons) | (millions ofreais) | (%) | (thousands of tons) | (millions ofreais) | (%) | (thousands of tons) | (millions ofreais) | (%) | ||||||||||||||||
Domestic net sales: | ||||||||||||||||||||||||
Ethylene | 1,098.9 | R$ | 2,302.2 | 40.1 | % | 1,047.3 | R$ | 1,733.1 | 41.9 | % | 994.8 | R$ | 1,285.3 | 42.5 | % | |||||||||
Propylene | 446.8 | 819.1 | 14.3 | 403.4 | 595.9 | 14.4 | 415.2 | 459.3 | 15.2 | |||||||||||||||
Para-xylene | 148.7 | 319.6 | 5.6 | 117.3 | 195.5 | 4.7 | 99.4 | 121.9 | 4.0 | |||||||||||||||
Benzene | 216.7 | 522.6 | 9.1 | 217.9 | 298.3 | 7.2 | 223.5 | 214.2 | 7.1 | |||||||||||||||
Butadiene | 160.0 | 296.0 | 5.2 | 150.3 | 278.7 | 6.7 | 147.3 | 177.0 | 5.9 | |||||||||||||||
Mixed xylenes | 74.5 | 126.4 | 2.2 | 53.7 | 83.4 | 2.0 | 52.9 | 52.9 | 1.7 | |||||||||||||||
Ortho-xylene | 52.7 | 109.9 | 1.9 | 49.9 | 80.0 | 1.9 | 48.9 | 65.2 | 2.2 | |||||||||||||||
Toluene | 33.2 | 57.4 | 1.0 | 38.9 | 51.4 | 1.2 | 78.7 | 74.6 | 2.5 | |||||||||||||||
Others | 255.3 | 404.9 | 7.1 | 195.8 | 324.6 | 7.9 | 184.5 | 262.6 | 8.7 | |||||||||||||||
Total domestic net sales of basic petrochemicals | 2,486.9 | 4,958.2 | 86.4 | 2,274.5 | 3,640.9 | 88.1 | 2,245.2 | 2,713.0 | 89.8 | |||||||||||||||
Total export net sales of basic petrochemicals | 436.6 | 778.9 | 13.6 | 405.9 | 490.7 | 11.9 | 353.0 | 309.7 | 10.2 | |||||||||||||||
Total net sales of basic petrochemicals | 2,923.5 | 5,737.1 | 100 | % | 2,680.4 | 4,131.6 | 100 | % | 2,598.2 | 3,022.7 | 100 | % | ||||||||||||
Automotive gasoline and utilities(2) | 742.9 | 633.7 | 476.4 | |||||||||||||||||||||
Total Basic Petrochemicals Unit net sales revenue(3) | R$ | 6,480.0 | R$ | 4,765.3 | R$ | 3,499.1 | ||||||||||||||||||
% of the total net sales revenue of all segments | 52.1 | % | 47.8 | % | 47.3 | % | ||||||||||||||||||
| (1) | Includes Copesul as from April 1, 2007. |
| (2) | Includes the following intra-company sales: |
| • approximately 1,644,000 tons of ethylene in 2007, 800,600 tons in 2006 and 588,700 tons in 2005; • approximately 567,800 tons of propylene in 2007, 86,500 tons in 2006 and 89,300 tons in 2005; • approximately 18,400 tons of para-xylene in 2007, 42,300 tons in 2006 and 45,600 tons in 2005; and • approximately 62,800 tons of benzene in 2007, 53,400 tons in 2006 and 60,800 tons in 2005. |
| Utilities include electric power, steam, treated water and compressed air. |
| Includes basic petrochemicals, fuels and utilities. | |
Olefins
Olefins are relatively unstable hydrocarbons characterized by a structure that is chemically active and permits other chemically reactive elements, such as oxygen, to be added. Ethylene and propylene, which are types of olefins, are the chemical “backbone” for many plastic resins used to manufacture consumer plastic products. Our primary olefins products include polymer grade ethylene and propylene, also known as monomers. Different combinations of monomers are polymerized, or linked together, to form polymers or plastic resins with different properties and characteristics.
Aromatics
Aromatics are hydrocarbons identified by one or more benzene rings or by chemical behavior similar to benzene. Aromatics readily react to add other active molecular groups, such as nitrates and sulfonates.
Fuels
Our company has been authorized by the National Petroleum Agency to produce and sell automotive gasoline since August 15, 2000 and LPG since October 2, 2001, both domestically and for export. We have been producing and selling both automotive gasoline and LPG since these dates.
43
Utilities
We also produce electric power, steam, compressed air and clarified drinking and demineralized water, some of which are by-products of our production of basic petrochemicals. We use these utilities in our own production processes, including those of our Polyolefins Unit, Ipiranga Petroquímica and our Vinyls Unit, and sell these utilities to approximately 40 companies includingin the Northeastern Complex and eight companies located outside ofin the NortheasternSouthern Complex. Our utilities facilities include units for thermoelectric power generation, water treatment and the production of steam and compressed air.
We self-generate approximately 70%85% of the Northeastern Complex’s energy consumption requirements, and the remainder is furnished by Companhia Hidro Elétrica do São Francisco—CHESF, or CHESF, a Brazilian government-owned electric power generation company located in the State of Bahia, furnishesand by Companhia de Eletricidade do Estado da Bahia—COELBA.
We self-generate approximately 35% of the remainder.Southern Complex’s energy consumption requirements, and the remainder is acquired primarily under auction contracts in the free market for energy (Mercado Livre de Energia) from several companies.
Production Facilities of Our Basic Petrochemicals Unit and Copesul
We believe that the technological processes we use at our basic petrochemicals plants are among the most advanced in the world. We currently own and operate five major Basic Petrochemicalsbasic petrochemicals units (Olefins 1, Olefins 2, Aromatics 1, Aromatics 2 and Energy and Services), each of which is located at in the Northeastern Complex and four major basic petrochemicals units (two olefin units, one aromatics units and a utilities unit) located in the Southern Complex. Our Basic Petrochemicals Unit definesWe define the term “unit” to mean several plants that are linked together to produce olefins, aromatics or utilities. As a result, the production capacity of Aromatics units 1 and 2 is the sum of the production capacities of the various plants that form these units. At December 31, 2004,2007, our basic petrochemicals plants had total annual production capacity of 1,280,0002,480,000 tons of ethylene and 550,0001,180,000 tons of propylene.
The table below sets forth the name, primary products, annual production capacity at December 31, 20042007 and annual production for the years presented for each of our principal Basic Petrochemicals units and plants.
| Annual | Production | |||||||||
| Production | For the Year Ended December 31, | |||||||||
| Name | Primary Products | Capacity | 2007 | 2006 | 2005 | |||||
| (in tons, except automotive gasoline) | ||||||||||
| Olefins units 1 and 2 | Ethylene | 1,280,000 | 1,170,000 | 1,103,969 | 1,165,319 | |||||
| Propylene | 550,000 | 561,648 | 520,413 | 562,048 | ||||||
| Plants of aromatics units 1 and 2: | ||||||||||
| Butadiene plants 1 and 2 | Butadiene | 175,000 | 145,616 | 154,227 | 162,586 | |||||
| MTBE plants 1 and 2 | MTBE | 140,000 | 114,979 | 118,691 | 129,345 | |||||
| Butene-1 plant | Butene-1 | 35,000 | 27,750 | 24,701 | 25,515 | |||||
| Isoprene plant | Isoprene | 26,800 | 13,024 | 12,500 | 16,140 | |||||
| Dicyclopentadiene | 24,000 | 25,011 | 16,517 | 25,245 | ||||||
| Sulfolane plants 1, 2 and 3 | Coperaf – 1 (1) | 120,000 | 49,933 | 86,773 | 86,066 | |||||
| BTX fractionation plants 1 and 2 | Benzene | 427,000 | 409,733 | 400,793 | 428,796 | |||||
| Toluene (2) | 42,000 | 47,954 | 44,778 | 38,505 | ||||||
| C8+ fractionation plant | Mixed xylenes (2) | 40,000 | 56,197 | 55,853 | 50,487 | |||||
| Ortho-xylene | 62,000 | 70,207 | 76,450 | 57,441 | ||||||
| Solvent C9 (1) | 30,000 | 36,565 | 23,426 | 20,011 | ||||||
| Parex plant | Para-xylene | 203,000 | 141,664 | 128,672 | 158,461 | |||||
| Blending plant | Automotive gasoline (3) | 600,000 | 322,266 | 374,504 | 457,334 | |||||
| LPG | 25,000 | 8,135 | 15,476 | 15,822 | ||||||
| Primary Products | Annual Production Capacity | Production Year Ended December 31, | ||||||||
Name | 2004 | 2003 | 2002 | |||||||
| (in tons, except automotive gasoline) | (in tons, except automotive gasoline) | |||||||||
Olefins units 1 and 2 | Ethylene | 1,280,000 | 1,105,610 | 1,040,858 | 989,276 | |||||
| Propylene | 550,000 | 542,359 | 486,959 | 464,521 | ||||||
Plants of aromatics units 1 and 2: | ||||||||||
Butadiene plants 1 and 2 | Butadiene | 175,000 | 161,616 | 150,719 | 137,976 | |||||
MTBE plants 1 and 2 | MTBE | 140,000 | 130,079 | 113,996 | 106,449 | |||||
Butene-1 plant | Butene-1 | 35,000 | 29,093 | 27,022 | 20,530 | |||||
Isoprene plant | Isoprene | 19,000 | 16,396 | 16,396 | 16,380 | |||||
| Dicyclopentadiene | 24,000 | 21,306 | 20,459 | 19,799 | ||||||
Sulfolane plants 1, 2 and 3 | Coperaf-1(1) | 120,000 | 112,249 | 110,769 | 116,575 | |||||
BTX fractionation plants 1 and 2 | Benzene | 427,000 | 393,737 | 364,762 | 318,373 | |||||
| Toluene(2) | 42,000 | 58,502 | 41,757 | 129,200 | ||||||
C8+ fractionation plant | Mixed xylenes(2) | 40,000 | 87,208 | 65,932 | 62,679 | |||||
| Ortho-xylene | 62,000 | 53,966 | 54,475 | 48,135 | ||||||
| Solvent C9(1) | 30,000 | 20,405 | 25,650 | 6,803 | ||||||
Parex plant | Para-xylene | 203,000 | 124,455 | 116,203 | 101,426 | |||||
Blending plant | Automotive gasoline(3) | 600,000 | 394,591 | 365,256 | 326,493 | |||||
| LPG | 25,000 | 18,767 | 17,403 | 30,780 | ||||||
44
| (1) | Solvents. |
| (2) | Actual production may exceed production capacity based on the quantity of toluene and mixed xylenes consumed in the production of para-xylene. |
| (3) | Automotive gasoline in cubic meters per year. |
The table below sets forth the name, primary products, annual production capacity at December 31, 2007 and annual production for 2007 for each of Copesul’s units and plants.
| Production | ||||||
| For theYear | ||||||
| Annual | Ended | |||||
| Production | December 31, | |||||
| Name | Primary Products | Capacity | 2007 | |||
| (in tons, except automotive | ||||||
| gasoline) | ||||||
| Olefins units 1 and 2 | Ethylene | 1,200,000 | 1,196,063 | |||
| Propylene | 630,000 | 621,584 | ||||
| Propane | 16,000 | 4,007 | ||||
| Low Sulphur Fuel Oil | 169,000 | 176,444 | ||||
| Aromatics unit: | ||||||
| Butadiene plant | Butadiene | 105,000 | 103,917 | |||
| MTBE plant | MTBE | 132,000 | 75,010 | |||
| ETBE | 155,000 | 47,358 | ||||
| Butene-1 plant | Butene-1 | 40,000 | 40,736 | |||
| Heavy C4 | 44,000 | 36,153 | ||||
| BTX fractionation plant | Benzene | 275,000 | 311,148 | |||
| Toluene (1) | 91,000 | 87,326 | ||||
| Mixed xylenes (1) | 77,000 | 49,484 | ||||
| Aromatic C7C8 | 95,000 | 22,599 | ||||
| Aromatic C9 | 12,000 | 5,031 | ||||
| C6C8 Rafinate | 87,000 | 9,553 | ||||
| PGH plant | Pyrolysis C9 | 76,000 | 14,834 | |||
| Solvent plant | C6 Solvent | 27,000 | 6,599 | |||
| Blending plant | Automotive gasoline (2) | 500,000 | 321,668 | |||
| LPG | 45,000 | 2,704 | ||||
| Actual production may exceed production capacity of certain plants when excess capacity of other plants in the Aromatics units is utilized. |
| Automotive gasoline in cubic meters per year. | |
Raw Materials of ourOur Basic Petrochemicals Unit and Copesul
Naphtha
Naphtha
Naphtha, a crude oil derivative, is the principal raw material that we use to produce our basic petrochemical products and represents the principal production and operating cost of our Basic Petrochemicals Unit.Unit and Copesul. The price of naphtha that we purchase varies primarily based on changes in the U.S. dollar-based international price of crude oil.
BothAll of our olefins plants are capable of using naphtha as a feedstock, and our Olefins 1 unit also uses petroleum condensate.feedstock. Until the early 1980’s, gas oil represented approximately 60%60.0% of the feedstock used by first generation producers in Brazil and naphtha represented the remainder, but the increased use of diesel fuel by trucks and buses in Brazil in the 1980’s reduced the supply of gas oil available to petrochemical producers. Currently, we use naphtha as our primary feedstock, and in 2004,2007, naphtha accounted for (1) 82.4%83.1% of the total cost of sales of our Basic Petrochemicals Unit, (2) 88.9% of the total cost of sales of Copesul, and (2) 67.7%(3) 76.3% of our overall direct and indirect consolidated cost of sales. However, due to the high pricesales and services rendered.
45
The following table shows the average Amsterdam-Rotterdam-Antwerp market price of naphtha for the periods indicated.
| Amsterdam-Rotterdam-Antwerp | ||||||||
| Market Price of Naphtha | ||||||||
| 2008 | 2007 | 2006 | 2005 | |||||
| (in U.S. dollars per ton) | ||||||||
| Average(1) | US$841.26 | US$675.48 | US$564.74 | US$476.04 | ||||
| Month ended: | ||||||||
| January | 827.65 | 509.23 | 561.81 | 394.86 | ||||
| February | 832.95 | 550.85 | 529.67 | 416.23 | ||||
| March | 863.19 | 603.95 | 528.65 | 477.43 | ||||
| April | 902.68 | 655.37 | 588.84 | 471.62 | ||||
| May | 989.05 | 685.22 | 601.91 | 421.26 | ||||
| June | 1,092.85 (2) | 663.05 | 613.14 | 439.32 | ||||
| July | 683.82 | 644.24 | 468.43 | |||||
| August | 645.09 | 620.04 | 528.00 | |||||
| September | 692.60 | 524.71 | 572.77 | |||||
| October | 745.87 | 509.91 | 545.43 | |||||
| November | 828.41 | 514.96 | 478.82 | |||||
| December | 834.14 | 545.11 | 498.35 | |||||
Amsterdam-Rotterdam-Antwerp Market Price of Naphtha | ||||||||||||
| 2005 | 2004 | 2003 | 2002 | |||||||||
| (in U.S. dollars per ton) | ||||||||||||
Average(1) | US$ | 436.28 | US$ | 377.40 | US$ | 274.63 | US$ | 228.00 | ||||
Month ended: | ||||||||||||
January | 394.86 | 329.74 | 319.00 | 173.00 | ||||||||
February | 416.23 | 309.52 | 359.00 | 205.00 | ||||||||
March | 477.43 | 327.26 | 267.00 | 225.00 | ||||||||
April | 471.62 | 333.31 | 203.00 | 225.00 | ||||||||
May | 421.26 | 373.71 | 231.00 | 210.00 | ||||||||
June | 350.16 | 254.00 | 218.50 | |||||||||
July | 373.95 | 253.50 | 232.00 | |||||||||
August | 420.40 | 269.00 | 247.50 | |||||||||
September | 421.39 | 258.00 | 255.00 | |||||||||
October | 469.14 | 275.00 | 230.00 | |||||||||
November | 433.16 | 294.00 | 228.00 | |||||||||
December | 387.05 | 313.00 | 287.00 | |||||||||
| (1) | The information in the “Average” row represents (i) during 2007, 2006 and 2005, the mean average of average monthly naphtha prices during the |
| (2) | Through June 27, 2008. |
Source: Bloomberg L.P.
Our Basic Petrochemicals Unit is located:
We use the Madre de Deus Port Terminal to unload naphtha imported by Petrobras or imported from La Société Nationale pour la Recherche, la Production, le Transport, la Transformation et la Commercialisation des Hydrocarbures—SONATRACH (the Algerian national petroleum company), or SONATRACH, or that is shipped from other Petrobras refineries located outside the State of Bahia. A pipeline owned and operated by Petrobras transports naphtha from the Madre de Deus Terminal to Refinaria Landulfo Alves where it interconnects with the refinery’s naphtha pipeline system. Refinaria Landulfo Alves’ naphtha pipeline system interconnects with the pipeline system of the port terminal of Aratú, through which naphtha and petroleum condensate areis transported to our basic petrochemicals plants.plants in the Northeastern Complex.
At the port terminal of Aratú, we use (1) the Terminal Químico de Aratú (which is owned by Terminal Químico de Aratú S.A.—TEQUIMAR, a subsidiary of Ultrapar, Participações S.A, a Brazilian LPG distribution company) to distribute our products in liquid form, (2) the Terminal de Gases (which is owned by Tegal—Terminal de Gases Ltda., one of our subsidiaries)we own) to distribute our products in gaseous form, and (3) the Raw Materials Terminal (which is owned by our company)we own) to import naphtha and condensate.
46
Following Copesul is located:
Copesul uses the supplyAlmirante Soares Dutra Terminal to unload naphtha and petroleum condensate imported by Petrobras or imported from SONATRACH or and Repsol YPF Trading y Transporte S.A., or Ryttsa, or shipped from other Petrobras refineries located outside the State of Rio Grande do Sul. Copesul also uses the Almirante Soares Dutra Terminal to distribute products in liquid and gaseous form. A pipeline owned and operated by Transpetro transports naphtha we invested approximately US$37 million in our transportation infrastructurefrom the Almirante Soares Dutra Terminal to enable our port facilities at AratúRefinaria Alberto Pasqualini where it interconnects with the refinery’s naphtha pipeline system. Naphtha and petroleum condensate are transported to receive shipments of imported naphtha.
Supply Contracts and Pricing of the Basic Petrochemicals Unit
Our Basic Petrochemicals Unit purchased:
On June 22, 1978, we and Petrobras entered into a Naphtha and Gas Oil Purchase and Sale Contract (which was amended in February 1993, February 2003 and in February 2003)May 2005). This contract has a term of 10 years, expiring in June 2008, and is automatically renewable for further 10-year periods, unless either party notifies the other party in writing at least one year prior to the expiration of the contract that it does not intend to renew the contract. In December 2007, Petrobras notified us that it did not intend to renew this contract under its existing terms. We are negotiating a new contract with Petrobras with different terms and expect to continue to receive naphtha from Petrobras and to conclude these negotiations prior to the expiration of the existing contract.
Under the current terms of this contract:
47
Petrobras has provided us with a R$570.0 million credit line to purchase naphtha and gas oil that it produces. This credit line is secured by first mortgages on two parcels of our property used by our Polyolefins Unit in the Southern Complex.
On August 9, 2000, regulations issued by the National Petroleum Agency ended Petrobras’ monopoly over the supply of naphtha in Brazil. These regulations also established a policy of free negotiation of naphtha prices. After a series of negotiations, the Brazilian basic petrochemicals producers and Petrobras entered into a pricing agreement for naphtha sales. According to this agreement, the price of naphtha supplied by Petrobras is linked to the Amsterdam-Rotterdam-Antwerp market price for naphtha and to thereal/U.S. dollar exchange rate.
La Société Nationale pour la Recherche, la Production, le Transport, la Transformation et la Commercialisation des Hydrocarbures—SONATRACH (the Algerian national petroleum company), or SONATRACH is our most important supplier of imported naphtha. We and SONATRACH entered into a Contract for the Sale and Purchase of Naphtha, which became effective on January 1, 2002. This contract hashad a one-year term and is renewable based on the mutual agreement of the parties for further one-year periods. We have renewed this contract threefour times and the currentthis contract expires on December 31, 2005.is under negotiation for 2008. Under this contract:
If thisour contract werewith SONATRACH is not renewed or wereis otherwise terminated, we believe that we could purchase sufficient quantities of naphtha from other suppliers, including Petrobras, to meet the supply needs of our naphtha supply needs.Basic Petrochemicals Unit.
On July 26, 2004,December 15, 2005, our company entered into ana revolving import note assignment agreementprogram with certain financial institutions. Under this agreement, weprogram, our company and, subject to our guarantee of its obligations and certain other conditions, Copesul are permitted for three years to issue short-term non-interest bearing promissory notes, or import notes, in an aggregate principal amount of up to US$400 million outstanding at any time prior to the expiration of this program to designated trading companies outside Brazil (including our subsidiary Braskem Incorporated Limited, formerly known as CPN Incorporated Ltd.) to evidence our and Copesul’s respective obligation to pay for purchases of naphtha and petroleum condensate from these trading companies. These designated trading companies hadhave the right through October 31, 2004 to assign up to an aggregate principal amount of US$100.0 million of these import notes to the specified financial institutions.institutions during the term of the program. These assignments wereare made at a discount based on a rate of LIBOR plus 2.75%0.75% per annum during the first year of this program, and theseLIBOR plus 0.85% per annum to 1.25% per annum, based on fluctuations in the Emerging Markets Bond Index—Brazil, thereafter. These companies couldmay use the proceeds of these assignments to purchase imported naphtha or petroleum condensate or refinance existing obligationscondensate. In the event that the aggregate amount of import notes issued during the first year of the program is less than US$30 million multiplied by the number of months elapsed under the program, we are required to pay a commitment fee on the unused amount. In addition, we are required to pay a commitment fee upon the termination of this program in respectthe event that the aggregate amount of importedimport notes outstanding at any time following the first anniversary of the commencement of this program is less than US$350 million.
Supply Contracts and Pricing of Copesul
Copesul purchased:
48
On February 23, 1996, Copesul and Petrobras entered into a Naphtha, LPG and Condensate Purchase and Sale Contract. This contract has a term of 16 years, expiring in 2012 and is automatically renewable for further five-year periods, unless either party notifies the other party in writing at least one year prior to the dateexpiration of the assignment. The designated trading companies werecontract that it does not intend to renew the contract. Under this contract:
Petrobras has provided Copesul with a R$350.0 million credit line to purchase naphtha and gas oil that it produces.
On March 30, 2005, Copesul and SONATRACH entered into a Condensate Purchase and Sale Contract, which was amended in January 2006, January 2007 and January 2008. This contract, as amended, has a one-year term, expiring in January 2009. The parties meet and negotiate the conditions of renewal of this contract every year. Under this contract:
If Copesul’s contract with SONATRACH is not renewed or is otherwise terminated, we believe that we could purchase sufficient quantities of naphtha from other suppliers, including Petrobras, to meet Copesul’s supply needs.
49
On May 1, 2002, Copesul and Ryttsa entered into a Naphtha Purchase and Sale Contract, which was amended in September 2004, April 2005, April 2006 and April 2007. This contract expired in April 2008 and was extended for 30 days. Copesul is currently negotiating an extension of this contract through April 2009. Under this contract:
If Copesul’s contract with Ryttsa is not renewed or is otherwise terminated, we believe that we could purchase sufficient quantities of naphtha from other suppliers, including Petrobras, to meet Copesul’s supply needs.
In addition, Copesul purchases naphtha on the spot market from foreign suppliers located in North Africa and South America.
Technology of ourOur Basic Petrochemicals Unit and Copesul
We use engineering process technology from a variety of sources that we implemented in constructing or upgrading the manufacturing facilities of our Basic Petrochemicals Unit, including the following technology:
These non-exclusive contracts generally provided for payment to those companies at stages specified in the contracts, but we do not pay ongoing royalties under these contracts.
We also use technology under non-exclusive arrangements from a variety of sources for specific production processes, including the following:
Our Basic Petrochemicals Unit also uses technology developed by our company.processes. We do not pay any continuing royalties under any of these arrangements, except for thearrangements. Our Basic Petrochemicals Unit and Copesul also use technology licensing agreement with Mobil. We paid an initial royalty under these arrangements (excludingdeveloped by our agreement with Mobil).company. If any of these arrangements were terminated or no longer available to us, we believe that we would be able to replace this technology with comparable or better technology from other sources.
Sales and Marketing of Our Basic Petrochemicals Unit and Copesul
We sell our basic petrochemical products principally in Brazil, mainly to second generation petrochemical producers located in the Northeastern Complex and the Southern Complex, including our other business units, as well as to customers in the UnitedtheUnited States, Europe, South America and Europe.Asia. Our Basic Petrochemicals Unit and Copesul also producesproduce utilities for itstheir own use and for sale to approximately 4048 companies, including companies located outside of the Northeastern Complex and the Southern Complex.
As is common with other first generation petrochemical producers, our Basic Petrochemicals Unit hasand Copesul have a high concentration of sales to a limited number of customers. Net sales to our Basic Petrochemicals Unit’s 10 largest customers (excluding intra-company sales) accounted for approximately 69%62.1% of our Basic Petrochemicals Unit’s total net sales revenue (excluding intra-company sales) during the year ended December 31, 2004.2007. Net sales to Copesul’s 10 largest customers (excluding intra-company sales) accounted for approximately 63.3% of Copesul’s total net sales revenue (excluding intra-company sales) during the year ended December 31, 2007.
As part of our commercial strategy, our Basic Petrochemicals Unit has focusedand Copesul focus on developing longer-term relationships with our customers. We have entered into long-term supply contracts with several second generation producers located in the Northeastern Complex and the Southern Complex, including Politeno, Oxiteno do Nordeste S.A., and Polibrasil Resinas S.A., or Polibrasil, and Petroflex. These supply contracts generally have an initial 10-year term and are automatically renewable for five-year periods unless one party notifies the other of its intention not to renew. These contracts also provide for minimum and maximum quantities to be purchased and monthly deliveries. We also sell automotive gasoline and LPG to Petrobras and other fuel distribution companies.
We determine the prices for our olefins and aromatics products with reference to several market factors. The price of ethylene that we charge our two largest customers, which represented 89.0% of our ethylene sales to third parties in 2004, is based on a margin sharing system. Under this system, the benefit or burden of higher or lower prices for naphtha and for ethylene derivatives, such as polyethylene, is shared between us and our customers. The margin shared by first and second generation producers is calculated for second generation products based on the market price charged by the second generation producer for its products and its production costs. The market price for ethylene is based on benchmark costs imputed to, and actual costs incurred by, both first and second generation producers for the production of second generation products. The variable-cost portion of these production costs reflects costs effectively incurred, while the fixed-cost portion of these production costs and depreciation expenses is determined based on benchmark costs. The benchmark costs are determined based on costs incurred by leading first and second generation producers located in the United States. This margin is then divided between the relevant first and second generation producerspro ratabased on a return on capital invested by each such producer. Accordingly, the price of ethylene for these customers is calculated based on the weighted average price for ethylene obtained in the process of dividing the margin of each of these customers, taking into consideration the amount of ethylene consumed by each customer. The actual margins received by the first and second generation producers vary depending on the degree to which their actual costs compare with the benchmark costs used in the pricing formula to calculate the margin.
Prior to 2005, we used a formula similar to the formula still in use for our two largest ethylene customers for all of our ethylene customers, including our other business units. Currently, weindicators. We determine the prices that we charge our otherfor ethylene customers, including our other business units, by reference to international market prices. In addition, we are negotiating with our two largest ethylene customers to terminate the margin sharing system of ethylene pricing and to institute a market pricing system.
We calculate the monthly price of propylene by multiplying our monthly ethylene price (including Brazilian taxes) by the ratio of the European contract price for propylene to the European contract price for ethylene. We determine the price of butadiene and para-xylene by using thebyreference tothe U.S. contract price for these products, in the United States, and our prices for butadiene and para-xylene, unlike our prices for our other basic petrochemical products, include freight costs. We set the prices of benzene and ortho-xylene monthly by determining the mean average of European contract prices and U.S. contract prices for those products as set forth in specialized trade publications. We set the prices of solvents by reference to international market prices and the prices for fuels withby reference to Brazilian market prices for these products.prices. We set the prices of utilities based on our production costs.
50
We are focused on maintaining our leading position in the Brazilian market, while continuing to use our exportexports to hedge our operations to manageand adjust the relationshipimbalances between our production capacitydemand and domestic demand. Accordingly, we believe that our continued presence inproduction. In 2007, export markets is essential to manage overcapacity in the Brazilian market. Our volume of export sales has generally varied based on the level of domestic demand for our products. Export net sales of basic petrochemicals (which exclude utilities and automotive gasoline) represented 13.6%16.0% of our Basic Petrochemicals Unit’s net sales revenue fromand 14.6% of Copesul’s net sales of basic petrochemicals in 2004, 11.9% in 2003 and 10.2% in 2002.revenue. We exported basic petrochemicals mainly to customers in Europe and the United States.
The following table sets forth our export sales and export volumes of basic petrochemicals for the years indicated:
| For the Year Ended December 31, | ||||||
| 2007 | 2006 | 2005 | ||||
| Basic Petrochemicals Unit: | ||||||
| Export sales (in millions ofreais) | R$1,157.4 | R$995.0 | R$950.0 | |||
| As % of total net sales revenue of Basic Petrochemicals Unit | 16.0% | 14.5% | 15.0% | |||
| Export volumes (thousands of tons) | 591.9 | 575.1 | 535.2 | |||
| As % of total sales volume of Basic Petrochemicals Unit (excluding automotive gasoline) | 18.4% | 20.3% | 17.6% | |||
| Copesul(1): | ||||||
| Export sales (in millions ofreais) | R$804.2 | R$— | R$— | |||
| As % of total net sales revenue of Copesul | 14.6% | —% | —% | |||
| Export volumes (thousands of tons) | 274.3 | — | — | |||
| As % of total sales volume of Copesul (excluding automotive gasoline) | 14.2% | —% | —% | |||
(1) Includes Copesul as from April 1, 2007.
Our Basic Petrochemicals Unit has been authorized by the National Petroleum Agency to produce and sell automotive gasoline since August 15, 2000, and Copesul has been so authorized since October 11, 2000. We sold approximately 567,800 cubic meters of type “A” automotive gasoline in 2007. Net domestic sales revenue of our Basic Petrochemicals Unit from automotive gasoline was R$269.1 million in 2007, and net export sales revenue of our Basic Petrochemicals Unit from automotive gasoline was R$32.3 million in 2007. Net domestic sales revenue of Copesul from automotive gasoline was R$189.8 million in 2007, and net export sales revenue of Copesul from automotive gasoline was R$61.2 million in 2007.
| Year Ended December 31, | ||||||
| 2004 | 2003 | 2002 | ||||
Net export sales (in millions of reais) | 778.9 | 490.7 | 309.7 | |||
As % of total net sales revenue of Basic Petrochemicals Unit (excluding utilities and automotive gasoline) | 13.6 | 11.9 | 10.2 | |||
Export volumes (thousands of tons) | 436.6 | 405.9 | 258.1 | |||
As % of total sales volume of Basic Petrochemicals Unit (excluding utilities and automotive gasoline) | 14.9 | 15.1 | 13.6 | |||
We set export prices for:
Since August 15, 2000, we have been authorized by the National Petroleum Agency to produce and sell automotive gasoline. Our net sales revenue from automotive gasoline was R$325.4 million in 2004 as compared to R$249.2 million in 2003 and R$156.2 million in 2002. Our net export sales revenue from automotive gasoline was R$167.2 million in 2004 as compared to R$128.1 million in 2003 and R$82.6 million in 2002. Our sales of type ”A” automotive gasoline reached 403,760 cubic meters in 2004 as compared to 360,458 cubic meters in 2003 and 324,567 cubic meters in 2002.
In addition to basic petrochemicals and fuels, we produce electric power, steam, treated water and compressed air for our own use and for sale to other second generation producers in the Northeastern Complex and the Southern Complex. OurIn 2007, our net sales revenue from sales of utilities (including sales to our other business units) was R$417.5 million in 2004, R$384.5 million in 2003 and R$320.2 million in 2002. We also provide storage services to companies located in the Northeastern Complex through our subsidiary Tegal—Terminal de Gases Ltda., providing storage for gaseous petrochemical products. Tegal—Terminal de Gases Ltda. operates in the port terminal of Aratú in the State of Bahia.621.3 million.
Competition
Although there are currently threefour major petrochemical complexes in Brazil, our basic petrochemical customers, which are mostly second generation petrochemical producers with plants located in the Northeastern Complex and the Southern Complex, would have difficulty obtaining their feedstocks from other sources at lower prices due to the high cost of transportation of these products, as well as other logistical difficulties. In addition, because Brazil produces sufficient quantities of olefins to meet domestic demand, imports of these products are generally sporadic and usually related to scheduled plant maintenance shutdowns or to meet unsatisfied domestic demand, as is the case with importsdemand.
51
Polyolefins Unit and Ipiranga Petroquímica
Polyolefins Unit
At December 31, 2004,2007, our polyolefins production facilities had the largest average annual production capacity of all second generation producers of polyolefins products in Brazil and elsewhere in Latin America. Our Polyolefins Unit accounted for R$3,489.45,669.1 million, or 28.0%25.1%, of the net sales revenue of all segments in 2004.2007 and Ipiranga Petroquímica accounted for R$1,551.4 million, or 6.9%, of the net sales revenue of all segments in 2007.
Our Polyolefins Unit ishas historically been comprised of the operations conducted by our company and Polialden. On May 31, 2006, Polialden merged with and into our company. Prior to the Politeno Acquisition on April 6, 2006, we owned 35.0% of Politeno’s voting share capital and 34.0% of its total share capital. As a result, at dates and for periods prior to March 31, 2006, we proportionally consolidated Politeno’s results in our consolidated financial statements and did not include Politeno’s results in our Polyolefins segment. Following the Politeno Acquisition on April 6, 2006, we owned 100% of the voting share capital and 96.2% of the total share capital of Politeno, and have fully consolidated Politeno’s results in our consolidated financial statements and included Politeno’s results in our Polyolefins segment as from April 1, 2006. On April 2, 2007, Politeno merged with and into our company.
On April 18, 2007, the first phase of the Ipiranga Transaction was completed. As a result of our obtaining effective management control over Ipiranga Petroquímica, we have fully consolidated the assets, liabilities and results of operations of Ipiranga Química as from April 1, 2007. We account for Ipiranga Petroquímica as a segment separate from our Polyolefins segment.
Our Polyolefins Unit produces:and Ipiranga Petroquímica produce:
In addition, Ipiranga Petroquímica produces medium density polyethylene, or MDPE.
Approximately three-fifthstwo-thirds of the sales volume of our Polyolefins Unit’sUnit and three-quarters of the sales volume of Ipiranga Petroquímica in 20042007 was derived from the sale of polyethylene products, and most of the remainder was derived from the sale of polypropylene products.
We manufacture a broad range of polyolefins products for use in consumer and industrial applications, including:
In 2004,2007, we had an approximate 27%52.0% share of the Brazilian polyethylene market and an approximate 40%49.1% share of the Brazilian polypropylene market, based on sales volumes.volumes of our Polyolefins Unit and Ipiranga Petroquímica. We anticipate that domestic growth in demand for these products will continue to increase due to:
52
Products of Our Polyolefins Unit and Ipiranga Petroquímica
The following table sets forth a breakdown of the sales volume and net sales revenue of our Polyolefins Unit for 2004, 2003 and 2002Ipiranga Petroquímica by product line and by market.market for the years indicated.
| For the Year Ended December 31, | ||||||||||||||||||
| 2007(1) | 2006 | 2005 | ||||||||||||||||
| Quantities | Quantities | Quantities | ||||||||||||||||
| sold | Net Sales Revenue | sold | Net Sales Revenue | sold | Net Sales Revenue | |||||||||||||
| (thousands | (millions of | (thousands | (millions of | (thousands | (millions of | |||||||||||||
| of tons) | reais) | (%) | of tons) | reais) | (%) | of tons) | reais) | (%) | ||||||||||
| Domestic net sales: | ||||||||||||||||||
| Polypropylene | 573.3 | R$1,982.5 | 27.5% | 453.2 | R$1,515.5 | 31.7% | 419.9 | R$1,404.2 | 35.8% | |||||||||
| LDPE | 249.3 | 863.1 | 12.0 | 196.9 | 635.8 | 13.3 | 143.1 | 443.7 | 11.3 | |||||||||
| LLDPE | 272.3 | 976.5 | 13.5 | 211.0 | 703.2 | 14.7 | 156.2 | 476.4 | 12.2 | |||||||||
| HDPE | 413.7 | 1,475.2 | 20.4 | 186.6 | 603.2 | 12.6 | 201.9 | 618.1 | 15.8 | |||||||||
| Other | 17.2 | 121.1 | 1.6 | 10.3 | 45.4 | 0.9 | 1.0 | 5.1 | 0.1 | |||||||||
| Total domestic net sales | 1,525.8 | 5,418.4 | 75.0 | 1,057.9 | 3,503.0 | 73.3 | 922.1 | 2,947.5 | 75.2 | |||||||||
| Total export net sales | 660.6 | 1,802.1 | 25.0 | 467.2 | 1,272.8 | 26.7 | 363.6 | 971.5 | 24.8 | |||||||||
| Total polyolefins net sales | 2,186.4 | R$7,220.5 | 100% | 1,525.1 | R$4,775.8 | 100% | 1,285.7 | R$3,919.0 | 100% | |||||||||
(1) Includes Ipiranga Petroquímica as from April 1, 2007.
| Year Ended December 31, | |||||||||||||||||||||||||
| 2004 | 2003 | 2002 | |||||||||||||||||||||||
Quantities sold | Net Sales Revenue | Quantities sold | Net Sales Revenue | Quantities sold | Net Sales Revenue | ||||||||||||||||||||
| (thousands of tons) | (millions ofreais) | (%) | (thousands of tons) | (millions ofreais) | (%) | (thousands of tons) | (millions ofreais) | (%) | |||||||||||||||||
Domestic net sales: | |||||||||||||||||||||||||
Polypropylene | 418.5 | R$ | 1,320.3 | 37.8 | % | 374.9 | R$ | 1,008.0 | 29.8 | % | 395.1 | R$ | 763.2 | 30.7 | % | ||||||||||
LDPE | 134.7 | 404.2 | 11.6 | 120.4 | 314.9 | 9.3 | 133.0 | 269.0 | 10.8 | ||||||||||||||||
LLDPE | 148.6 | 444.4 | 12.7 | 119.8 | 311.0 | 9.2 | 130.0 | 264.6 | 10.7 | ||||||||||||||||
HDPE | 214.1 | 635.5 | 18.2 | 204.6 | 515.0 | 15.2 | 227.7 | 449.8 | 18.1 | ||||||||||||||||
UHMWP | 1.4 | 5.7 | 0.2 | 1.2 | 4.2 | 0.1 | 1.0 | 3.5 | 0.1 | ||||||||||||||||
Total domestic net sales | 917.2 | 2,810.8 | 80.6 | 820.9 | 2,153.1 | 63.6 | 886.8 | 1,750.1 | 70.5 | ||||||||||||||||
Total export net sales | 248.5 | 678.6 | 19.4 | 288.1 | 1,233.7 | 36.4 | 184.6 | 732.2 | 29.5 | ||||||||||||||||
Total polyolefins net sales | 1,165.6 | R$ | 3,489.4 | 100 | % | 1,109.0 | R$ | 3,386.8 | 100 | % | 1,071.4 | R$ | 2,482.3 | 100 | % | ||||||||||
% of the total net sales revenue of all segments | 28.0 | % | 33.9 | % | 33.6 | % | |||||||||||||||||||
We provide technical assistance to our customers to meet their specific needs by adapting and modifying our polyethylene and polypropylene products. In particular, we develop customized value-added polypropylene compounds for use by our customers in their specialized applications. We believe that the variety of technological processes at our polyolefins plants provides us with a competitive advantage in meeting our customers’ needs.
Polyethylene Products
Polyethylene has the simplest chemical structure of all commercial polymers and is a very versatile material. WorldGlobal production volume of polyethylene is the highest among all commercial plastics. Polyethylene is used to manufacture a wide variety of products.
Our customers purchase different polyethylene resins depending on the manufacturing process that they employ and the desired physical characteristics of the end products that they manufacture. LDPE is the most flexible of polyethylene products and is used in a variety of plastic or film applications and in food packaging trash bags and shopping bags.extrusion coating. LLDPE is used in applications that require greater sealing capacity and better mechanical resistance, including plastic films and flexible food packaging. MDPE is used in applications that require impact resistance and stiffness, such as diapers and hygienic articles, water storage tanks, technical parts and industrial containers. HDPE is used for applications that require higher mechanical resistance.resistance, such as high strength films, food packaging, merchandise bags, telecommunications and sewage pipes, pails, lids, trash containers, bottles, flasks, safety helmets, sporting goods, pallets and toys.
While each form of polyethylene is used for different applications, there is some overlap in the uses of these resins, and with certain modifications, polyethylene resins may be substituted for each other in certain end product manufacturing processes. For example, demand for LLDPE has grown since it was first introduced in 1989 and has resulted in reduced demand for LDPE, as manufacturers of certain containers and plastic film applications have switched their production processes and technology to use LLDPE in a blend with LDPE. We expect that production
53
In January 2002, we acquired the UHMWP business of Basell USA Inc. in the United States and in Brazil, and, as a result, became the world’s second largest producer of UHMWP, a high-performance engineering plastic.
In 2004, we launched Braskem Flexus®, a high-performance LLDPE product used for specialized packaging. Based on our commercial success with this product, our management has decided to alter our product mix to double our annual production of this resin to 60,000 tons by mid-2005.
Polypropylene Products
Polypropylene is a versatile polymer with a high strength-to-weight ratio. This thermoplastic resin may be manufactured with a variety of properties that permit its use in different processes, such as injection, extrusion, blow molding and thermoforming. Through these processes, polypropylene may be used as a primary raw material for many applications, including the manufacture of carpet fibers, non-woven fabrics for diapers, injection molded parts for durable packaging and automobiles, medical instruments, flexible packaging for candy, pasta and cookies, as well as bottles for beverages. The balance between the mechanical properties and the high thermal resistance of polypropylene is a primary reason why this thermoplastic resin has begun to replace engineering materials such as acrylonitrile-butadiene-styrene (known as ABS), polycarbonate and nylon in domestic appliances and machinery. The lack of toxicity and high chemical resistance of polypropylene permits it to be used in applications with strict sanitary specifications, including in the food and pharmaceutical industries.
In 2004, we launched Braskem Symbios®, a high-performance flexible packaging sealant. We introduced advances in the use of polypropylene containers as a substitute for glass containers for spreadable cream cheese and launched a polypropylene fiber used to manufacture tiles and fiber-cement water cisterns. We also developed a new resin and patent-protected equipment for the production of disposable polypropylene cups, which have a significant competitive advantage over the same product made from polystyrene. We have licensed this technology to one of our customers. Finally, we introduced a new polypropylene resin for use as a substitute for glass and paper in packaging non-carbonated beverages.
Production Facilities of Our Polyolefins Unit and Ipiranga Petroquímica
We believe thatAt December 31, 2007, our Polyolefins Unit and Ipiranga Petroquímica owned 14 polyolefins production facilities. Our Polyolefins Unit operates five plants located in the variety of technological processes at our polyolefins plants provide us with a competitive advantage in meeting the needs of our customers. We currently ownSouthern Complex and operate sevenfour plants located in the Northeastern Complex andComplex. Ipiranga Petroquímica operates five plants in the Southern Complex. During 2004,2005, we expanded the annual production capacity of one of our polyethylene plants in the Northeastern Complex by 30,000 tons. During 2006, we expanded the annual production capacity of our polypropyleneother polyethylene plants in the SouthernNortheastern Complex by an aggregate of 100,00030,000 tons. Accordingly, at December 31, 2004, our plants had a total annual production capacity of 650,000 tons of polypropylene and 840,000 tons of polyethylene.
The table below sets forth the location, the primary products, annual production capacity at December 31, 2004,2007, and annual production for the years presented of each of our polyolefins plants.
| Production | ||||||||||
| Annual | For the Year Ended | |||||||||
| Production | December 31, | |||||||||
| Location (Complex) | Primary Products | Capacity | 2007 | 2006 | 2005 | |||||
| (in tons) | (in tons) | |||||||||
| Polyolefins Unit: | ||||||||||
| Triunfo (Southern) | LDPE | 215,000 | 207,286 | 209,209 | 207,174 | |||||
| Polypropylene(1) | 560,000 | 562,399 | 542,781 | 528,980 | ||||||
| HDPE/LLDPE(2) | 300,000 | 274,221 | 268,762 | 237,262 | ||||||
| Camaçari (Northeastern) | HDPE/LLDPE(2) | 230,000 | 218,671 | 216,822 | 211,625 | |||||
| HDPE/LLDPE(2)(3) | 210,000 | 218,622 | 133,088 | — | ||||||
| LDPE(4) | 150,000 | 140,971 | 102,684 | — | ||||||
| HDPE/UHMWP(2) | 160,000 | 106,741 | 103,034 | 124,382 | ||||||
| Ipiranga Petroquímica: | ||||||||||
| Triunfo (Southern) | HDPE/LLDPE(2) | 150,000 | 108,419 | — | — | |||||
| HDPE(4) | 400,000 | 374,616 | — | — | ||||||
| Polypropylene | 180,000 | 146,288 | — | — | ||||||
Location (Complex) | Primary Products | Annual Production Capacity | Production Year Ended December 31, | |||||||
| 2004 | 2003 | 2002 | ||||||||
| (in tons) | (in tons) | |||||||||
Triunfo (Southern) | LDPE | 210,000 | 209,140 | 195,637 | 184,861 | |||||
| Polypropylene(1) | 100,000 | — | — | — | ||||||
| Polypropylene(2) | 550,000 | 463,077 | 438,746 | 412,243 | ||||||
| HDPE/LLDPE(3) | 300,000 | 235,028 | 229,237 | 212,184 | ||||||
Camaçari (Northeastern) | HDPE/LLDPE(3) | 200,000 | 175,436 | 152,087 | 151,506 | |||||
| HDPE/UHMWP | 130,000 | 128,312 | 99,720 | 103,892 | ||||||
| (1) |
| Reflects the combined production capacity and annual production of two polypropylene |
| Plant with swing line capable of producing | |
| (3) | Reflects the production of Politeno since April 6, 2006, the date of the Politeno Acquisition. |
| (4) | Reflects the combined production capacity and annual production of three polyethylene plants. |
54
In the first half of 2004, we completed an efficiency enhancement project at one of our polypropylene plants in the Southern Complex, which increased our annual polypropylene production capacity by 100,000 tons.
Raw Materials of Our Polyolefins Unit and Ipiranga Petroquímica
Ethylene and Propylene
The most significant direct costs associated with our production of polyethylene and polypropylene are the costs of purchasing ethylene and propylene, which together accounted for approximately 81%91.7% of our Polyolefins Unit’s total variable cost of sales for 2004 compared to 78% for 2003production in 2007 and 74% for 2002.approximately 91.6% of Ipiranga Petroquímica’s total variable cost of production in 2007. In 2004,2007, approximately 45%41.9% of these raw materials were supplied by our Basic Petrochemicals Unit and 55%approximately 58.1% were supplied by Copesul. Our Polyolefins Unit ispurchases ethylene from our Basic Petrochemicals Unit and ethylene and propylene from Copesul at prices determined by reference to international market prices for ethylene. Ipiranga Petroquímica purchases ethylene and propylene from Copesul at prices determined by reference to international market prices for ethylene. Our Polyolefins Unit and Ipiranga Petroquímica are highly dependent on ethylene and propylene supplied by our Basic Petrochemicals Unit and by Copesul because the costs of storing and transporting ethylene and propylene are substantial and there is inadequate infrastructure in Brazil to import large quantities of ethylene and propylene.
At December 31, 2004, Copesul had an annual ethylene production capacity of 1,135,000 tons and an annual propylene production capacity of 581,000 tons. Copesul is our principal supplier of propylene.
Supply Contracts and Pricing
We have entered into a long-term ethylene and propylene supply contract with Copesul that extends through 2007 and is automatically renewable for additional five-year terms. We own 29.5% of the total share capital of Copesul. Under this contract, we are required to purchase an annual minimum of 268,200 tons of ethylene and an annual maximum of 451,000 tons, as well as an annual minimum of 262,200 tons of propylene and an annual maximum of 439,500 tons, in each case subject to daily and monthly limits. In 2004, we purchased 427,000 tons of ethylene and all of our requirements of propylene (approximately 450,000 tons) from Copesul for our polyolefins operations in the Southern Complex.
We negotiate the prices for the feedstocks for our polyolefins products with Copesul, based upon a pricing formula developed by the Brazilian petrochemical industry. The pricing formula provides for full cost margin sharing between the first generation and second petrochemical producers located at the respective petrochemical complexes. The prices Copesul charges for ethylene that it supplies to our Polyolefins Unit are calculated based on a formula similar to the formula that our Basic Petrochemicals Unit uses to determine prices for its two largest
ethylene customers. See “Item 4. Information on Our Company—Basic Petrochemicals Unit—Sales and Marketing of Our Basic Petrochemicals Unit.” Our Polyolefins Unit purchases ethylene from our Basic Petrochemicals Unit at prices determined by reference to international market prices for ethylene.
The following table sets forth the average prices per ton inreaispaid by our company in 2004, 2003Polyolefins Unit and 2002Ipiranga Petroquímica to our Basic Petrochemicals Unit and Copesul for ethylene and propylene:propylene for the years indicated:
| For the Year Ended December 31, | ||||||
| 2007(1) | 2006 | 2005 | ||||
| (R$ per ton) | ||||||
| Ethylene supplied by our Basic Petrochemicals Unit | R$2,425 | R$2,323 | R$2,206 | |||
| Ethylene supplied by Copesul | 2,508 | 2,677 | 2,527 | |||
| Propylene supplied by Copesul | 2,480 | 2,570 | 2,405 | |||
(1) Includes Ipiranga Petroquímica as from April 1, 2007.
In March 2007, we entered into a five-year propylene supply contract with Refinaria Alberto Pasqualini—Refap S. A., or Refap, a subsidiary of Petrobras, located in Canoas, Rio Grande do Sul. Under this contract, we will purchase an initial annual supply of 70,000 tons of propylene, representing 70% of Refap’s current annual propylene production capacity of 100,000 tons. As Refap expands its propylene production capacity, we will be obligated to purchase 70% of Refap’s propylene production until Refap’s annual production capacity reaches 162,000 tons. We will have the right to purchase 100% of Refap’s production in excess of 162,000 tons. If we exercise this right, our minimum purchase obligation under this contract will be increased correspondingly. Under this contract:
| Year Ended December 31, | |||||||||
| 2004 | 2003 | 2002 | |||||||
| (R$ per ton) | |||||||||
Ethylene supplied by our Basic Petrochemicals Unit | R$ | 2,350 | R$ | 1,786 | R$ | 1,360 | |||
Ethylene supplied by Copesul | 2,313 | 1,769 | 1,313 | ||||||
Propylene supplied by Copesul | 2,017 | 1,608 | 1,111 | ||||||
This volume will be used to supply the existing plants of our Polyolefins Unit in the Southern Complex and will be available to meet additional demand that arises through expansion of these plants and acquisition of additional plants. Propylene will be delivered to our plants through a pipeline.
We In March 2007, Ipiranga Petroquímica entered into a five-year propylene supply contract with Refap. Under this contract, Ipiranga Petroquímica has agreed to purchase, and Refap has agreed to sell, a minimum of 22,500 and a maximum of 30,000 tons of propylene annually. Under this contract:
55
Under this contract, Ipiranga Petroquímica is obligated to purchase a minimum of 1,875 and a maximum of 2,500 tons of propylene per month.
Our Polyolefins Unit and Ipiranga Petroquímica also use butene and hexene as raw materials in the production of HDPE and LLDPE. Butene is supplied by Copesul and by our Basic Petrochemicals Unit, and we import hexene from suppliers located in South Africa.
Other Materials
In addition to overhead costs such as labor and maintenance, our other costs associated with the production of polyethylene and polypropylene include our purchase of chemical catalysts, solvents and utilities, such as electric power, water, steam and nitrogen.
Our Unipol® PlantUnipol® plant in the Northeastern Complex uses catalysts supplied to us by Univation Technologies under a license that expires in 2007.Technologies. Our HDPE slurry plant in the Northeastern Complex produces its own catalysts, and we purchase the inputs that we need to produce our own catalysts from various suppliers at market prices. We purchase most of the catalysts that we use in our Polyolefins Unit’s polypropylene plants from Basell Polyolefins Company N.V, or Basell, and we also import some catalysts from suppliers in the United States and Europe.
We purchase the catalysts that Ipiranga Petroquímica uses in its swing line LLDPE/HDPE plant and its polypropylene plant from Basell. Ipiranga Petroquímica produces its own catalysts for its HDPE plants using Hoechst technology, and we purchase the inputs that we need to produce these catalysts from various suppliers at market prices.
Our Basic Petrochemicals Unit supplies our Polyolefins Unit’s facilities in the Northeastern Complex with steam and water, and Copesul supplies these utilities to the facilities of our Polyolefins Unit’s facilitiesUnit and Ipiranga Petroquímica in the Southern Complex. In addition, we purchase electric power at both complexes from third parties pursuant to long-term power purchase agreements and, in the Northeastern Complex, from our Basic Petrochemicals Unit. Our polyolefins plants in the Northeastern Complex are able to purchase electric power from alternative sources if our Basic Petrochemicals Unit is unable to meet our total demand for electric power. In general, we believe that there are sufficient alternative sources available at reasonable prices for each of these other inputs used in our polyolefins production process such that the loss of any single supplier would not have a material adverse effect on our operations.
Technology of Our Polyolefins Unit and Ipiranga Petroquímica
Rights to Use Technology
We have entered into several non-exclusive agreements with a number of leading petrochemical companies to use certain technology and catalysts for our Polyolefins Unit.
|
|
If any of these licenses were terminated, we believe that we would be able to replace the relevant technology with comparable technology from other sources.
Research and Development
Our Polyolefins Unit coordinates and maintains a research and development program, which includes (1) the Braskem Center for Technology and Innovation, (2) pilot plants, (3) catalysis, polymerization and polymer sciences laboratories, and (4) process engineering and automation centers.
The Braskem Center for Technology and Innovation at the Southern Complex includes a staff of approximately 150 employees, which seeksseek to:
56
We have developed mostIn 2006, we opened a new development center dedicated to UHMWP, a high value-added resin of our new polyolefins products and applications atwhich we are one of the largest world producers. This center works in coordination with the Braskem Center for Technology and Innovation, including Braskem Flexus® and Braskem Symbios® in 2004. Prior to the development of these products at the Braskem Center for Technology and Innovation, these products were only available in Brazil through imports.Innovation.
Our Polyolefins Unit maintains seven pilot plants located in the Southern Complex and the Northeastern Complex that use Spheripol®Spheripol®, Spherilene®Spherilene®, Unipol® and Unipol®Mitsubishi slurry technology. Two of our Polyolefins Unit pilot plants operate at approximately 1/150 of the scale of our full-scale plants, and our other pilot plants operate at approximately 1/400 of the scale of our full-scale plants. Our Polyolefins Unit uses these pilot plants to (1) produce small quantities of new products to test them in our laboratories and with our customers, (2) develop new conditions and formulations for the creation of new products, and (3) increase the efficiency of our production processes. We believe that these pilot plants give us a competitive advantage over our competitors in Latin America, which do not have similar resources.
Our Polyolefins Unit maintains catalysis, polymerization and polymer sciences laboratories in the Southern Complex and the Northeastern Complex. These laboratories enable us to identify new and to improve existing licensed catalysts. We have developed or improved upon a majority of the polyethylene and polypropylene grades that we sell based on technology that we have created or improved.
Our Polyolefins Unit maintains process engineering and automation centers in the Southern Complex and the Northeastern Complex. These centers assist us in developing advanced process control technology, reducing our variable costs, achieving operational stability and increasing our production of polyolefins.
Our Polyolefins Unit is in regular contact with international process technology licensors to acquire new technologies and improvements. We test new processes on a regular basis, and we follow advances and trends in the petrochemical industry through our relationships with Brazilian and international research universities and consortia. In addition, we maintain ongoing contracts with licensors that permit us to upgrade our technology in order to receive and install improvements developed for our existing processes.
Ipiranga Petroquímica operates a Technology and Innovation Center located in the Southern Complex which is similar to the Braskem Center for Technology and Innovation. Ipiranga Petroquímica’s center includes laboratories and a slurry Hostalen® pilot plant used to develop new high density polyethylene grades, as well as to evaluate and develop catalysts and to test new raw materials. This pilot plant operates at approximately 1/200 of the scale of the industrial plants and complements the pilot plants of our Polyolefins Unit. Ipiranga Petroquímica also operates a process development department and a product development department with a combined staff of approximately 35 employees to coordinate its research and development activities.
Sales and Marketing of Our Polyolefins Unit and Ipiranga Petroquímica
We sell ourOur Polyolefins Unit sells polyethylene and polypropylene products to approximately 1,1001,450 customers and sales by our Polyolefins Unit accounted for 28.0% of our net sales revenue of all segments in 2004.Ipiranga Petroquímica sells its polyethylene and polypropylene products to approximately 300 customers. We have a diversified product mix that allows us to serve a broad range of end users in several industries. OurThe customers of our Polyolefins Unit and Ipiranga Petroquímica generally are third generation petrochemical producers that manufacture a wide variety of plastic-based consumer and industrial goods.
57
Net sales revenue to ourthe 10 largest customers of our Polyolefins Unit accounted for 28.8%20.4% of our Polyolefins Unit’s total net sales revenue during the year ended December 31, 2004.2007. Net sales revenue to the 10 largest customers of Ipiranga Petroquímica accounted for 14.0% of Ipiranga Petroquímica total net sales revenue during the year ended December 31, 2007. No customer of our Polyolefins Unit or Ipiranga Petroquímica accounted for more than 6.0%4.0% of our total net sales revenue during 2004, 2003in 2007, 2006 or 2002.2005.
Domestic Sales
We are focused on developing longer-term relationships with our customers. Given the cyclical nature of the markets for our petrochemical products, we believe that we can strengthen customer loyalty during periods of reduced demand for polyethylene or polypropylene by providing a reliable source of supply to these customers during periods of high demand. We work closely with our customers to determine their needs, to provide technical assistance and to coordinate the production and delivery of our products. Customers submit annual proposals giving their estimated monthly requirements for the upcoming year for each of our polyolefins products,polyolefinsproducts, including technical specifications, delivery terms and proposed payment conditions. We evaluate these proposals on a monthly basis to make any required adjustments and to monitor and attempt to ensure adequate supply for each customer.
In addition to direct sales to our customers, our Polyolefins Unit sells ourand Ipiranga Petroquímica sell products in Brazil through exclusive independent distributors. Our Polyolefins Unit has five distributors (three of which belong to a group of related companies) and have entered into agreements with terms expiring in 2010 with three of these distributors. Ipiranga Petroquímica has two distributors. Ipiranga Petroquímica has entered into an agreement with one of these distributors with a term that expires in 2009 and which is automatically renewable for 18-month periods. Ipiranga Petroquímica’s agreement with the other distributor has an indefinite terms, subject to termination on one year’s notice by either party.
We have selected our distributors based on their ability to provide full service to their customers, including the ability to prepare our products on a customized basis. These distributors sell our polyethylene and polypropylene products to manufacturers with lower production requirements and are able to aggregate multiple orders for production and delivery to customers that would otherwise be uneconomical for us to service.serve. Furthermore, by serving smaller customers through a network of distributors, our account managers in our Polyolefins Unit focus their efforts on delivering high quality service to a smaller number of large, direct customers. We have selected our distributors based on their ability to provide full service to their customers, including the ability to prepare our products on a customized basis.
In 2004, our Polyolefins Unit conducted an analysis of its policy with respect to distributors and of its network of distributors. As a result, one of our distribution agreements was terminated and we are in the process of renegotiating our distribution agreements with the remaining eight distributors (three of whom form part of a related group of companies) with the goal of establishing uniform terms. We expect to have new distribution agreements in place by the end of the first half of 2005.
Export Sales
Our volume of export sales has generally varied based upon the level of domestic demand for our products. Export sales represented 19.4%24.5% of our Polyolefins Unit’s net sales revenue in 2004, 36.4%2007. In 2006, our Polyolefins Unit opened sales offices in 2003Argentina and 29.5%The Netherlands. We are using our Argentine office to consolidate our marketing efforts in 2002. Our principal exportArgentina. We are using our office in The Netherlands to support our European customers, improve our knowledge of the European market, optimize our logistics process in this market and develop regional partners. In addition to our offices in Argentina and The Netherlands, our Polyolefins Unit maintains an office in the United States that is focused on further developing the market for polyolefins is other countriesengineering plastics under the UTEC™ brand. Ipiranga Petroquímica maintains sales offices in South America, particularly the Mercosul countries,Chile and we intend to increase our export sales in the Mercosul countries as well as in Chile.Argentina.
We have established a strategic position in the Southern Cone countriespolyolefins business in South America and Europe through regular direct sales, to local distributors and agents who understand their respective markets. Our strategy to increase our presence in the Southern Conethese foreign markets is intended, among other things, to reduce our exposure to the cyclicality of the international spot market for polyolefins through the development of long-term relationships with customers in neighboring countries.
The following table sets forth export sales and export volumes of our Polyolefins Unit and Ipiranga Petroquímica for the yearsperiods indicated.
58
| Year Ended December 31, | ||||||
| 2004 | 2003 | 2002 | ||||
Net export sales revenue (in millions ofreais) | 678.6 | 1,233.7 | 732.2 | |||
As % of total net sales revenue of Polyolefins Unit | 19.4 | 36.4 | 29.5 | |||
Export volumes (thousands of tons) | 248.5 | 288.1 | 184.6 | |||
As % of total sales volume of Polyolefins Unit | 21.3 | 26.0 | 17.2 | |||
| For the Year Ended December 31, | ||||||
| 2007 | 2006 | 2005 | ||||
| Polyolefins Unit: | ||||||
| Net export sales revenue (in millions ofreais) | R$1,391.3 | R$1,272.8 | R$971.5 | |||
| As % of total net sales revenue of Polyolefins Unit | 24.5% | 26.7% | 24.8% | |||
| Export volumes (thousands of tons) | R$503.9 | R$467.2 | R$363.6 | |||
| As % of total production of Polyolefins Unit | 29.2% | 30.6% | 28.3% | |||
| Ipiranga Petroquímica(1): | ||||||
| Net export sales revenue (in millions ofreais) | R$410.8 | R$— | R$— | |||
| As % of total net sales revenue of Ipiranga Petroquímica | 26.5% | —% | —% | |||
| Export volumes (thousands of tons) | R$156.7 | R$— | R$— | |||
| As % of total production of Ipiranga Petroquímica | 33.9% | —% | —% | |||
(1) Includes Ipiranga Petroquímica as from April 1, 2007.
The main focus of our Polyolefins Unit and Ipiranga Petroquímica is to maintain our leading position in the Brazilian market while continuing to export in order to manage the relationship between our production capacity and domestic demand for our products. Currently, we target an annual average production that is approximately 20% in excess of anticipated Brazilian market demand in order to meet variations in local demand and to respond to production fluctuations, seasonality and export product sales. As a result, we believe that our continued presence in export markets is essential to help manage any overcapacity in the Brazilian market and to maintain our position as leader in the supply of polyolefins in South America.
Prices and Sales Terms
We determine the domestic prices for ourthe polyethylene and polypropylene products of our Polyolefins Unit and Ipiranga Petroquímica with reference to international market prices.prices and the prevailing balance of supply and demand for these products in Brazil. Our customers in Brazil may pay in full on delivery or elect credit terms that require payment in full within 14seven to 6356 days following delivery. We charge interest based on prevailing market rates to our Brazilian customers that elect to pay on credit.
WeOur Polyolefins Unit and Ipiranga Petroquímica generally conduct our export sales to buyers in countries outside the Southern Cone through the international spot market. Our customer base in these markets consists primarily of trading houses and distributors, most of which have operations in Europe, the United States or in Asia, principally Hong Kong. Pricing is based on international spot market prices. We make all sales in these markets with letters of credit. Export prices for polyolefins sales in the Southern Cone countries by our Polyolefins Unit are based on regional prices and sales are generally made either with letters of credit or through direct bank collections. Export prices for polyolefins sales in the Southern Cone countries by Ipiranga Petroquímica are made through the international spot market, and pricing is based on international spot market prices. Ipiranga Petroquímica makes export sales in Latin America on the same payment terms as sales made in Brazil.
Competition
We compete with regional polyolefins producers located in Brazil and Argentina and, to a lesser extent, with other importers of these products. In the Brazilian polyethylene market, we compete with a number of companies that produce one or two of the products in our production line. LDPE is produced in Brazil by Polietilenos União S.A. with an annual production capacity in 2004 of 130,000270,000 tons Dow Brasil S.A. with 144,000 tons, Petroquímicaand Triunfo S.A. with 160,000 tons and Politeno with 150,000 tons, compared to our annual production capacity of 210,000365,000 tons. Politeno, in which we own 34.0% of the total share capital (including 35.0% of the voting share capital), produces the same range of polyolefins products that we produce.
In the HDPE and LLDPE markets, we compete with the following producers in Brazil: Politeno, with an annual production capacity of 210,000 tons at a plant
59
We have (1) a combined annual production capacity of 890,000 tons at four swing-line plants capable of producing LLDPE and HDPE, two of which commenced operations on June 23, 2005.are located in the Southern Complex and two of which are located in the Northeastern Complex, and (2) combined annual HDPE and UHMWP production capacity of 560,000 tons at one plant in the Northeastern Complex and three plants in the Southern Complex.
In the Brazilian polypropylene market, we compete with Ipiranga and Polibrasil, which is controlled by Basell Polyolefins Company N.V. and Suzano. In 2004, Ipiranga hadSuzano has annual production capacity of 150,000 tons and Polibrasil had 625,000685,000 tons, compared to our annual production capacity of 650,000 tons.840,000 tons at three plants in the Southern Complex.
We do not have any domestic competitors in the Brazilian UHMWP market. Internationally, our primary competitor in this market is Ticona, which is a member of the Celanese AG,Group, a German chemical company that has approximately 52% of the worldwide production capacity of UHMWP.
Traditionally, we have not faced substantial competition from imports of polyethylene and polypropylene due to tariff rates, transportation costs for imported products and other factors relating primarily to the logistics involved in importing these products. In 2004,2007, imports of polyethylene into Brazil represented 17.0% (15.8% in 2003)16.3% of Brazil’s total consumption of polyethylene, and imports of polypropylene into Brazil represented 6.2% (8.9% in 2003)13.5% of Brazil’s total consumption of polypropylene. We expect competition from international producers to increase substantially in selected foreign markets in which we intend to attempt to increase our sales of polyolefins products.
Vinyls Unit
Vinyls Unit
We are the leading producer of PVC in Brazil, based on sales volumes in 2004.2007. At December 31, 2004,2007, our PVC production facilities had the largest average annual production capacity in Latin America. Our Vinyls Unit accounted for R$1,858.81,789.4 million, or 14.9%7.9%, of our net sales revenue of all segments in 2004.2007.
Our Vinyls Unit is the only vertically integrated producer of PVC in Brazil. Our PVC production is integrated through our production of chlorine and other raw materials. Our Vinyls Unit also manufactures caustic soda, which is used by producers of aluminum and paper; ethylene dichloride, or EDC; and chlorine, which is used internallywe use to manufacture EDC. In 2004, 68.8%2007, 72.3% of our Vinyls Unit’s net sales revenue was derived from the sale of PVC products, 18.4%21.1% was derived from the sale of caustic soda and 9.5%3.9% from the sale of EDC and the remainder from the sale of other products.
In 2004,2007, we had an approximate 57%54.3% share of the Brazilian PVC market, based on sales volumes.
Products of Our Vinyls Unit
The following table sets forth a breakdown of the sales volume and net sales revenue of our Vinyls Unit for 2004, 2003 and 2002, by product line and by market:market for the years indicated.
| For the Year Ended December 31, | ||||||||||||||||||
| 2007 | 2006 | 2005 | ||||||||||||||||
| Quantities | Quantities | Net Sales | Quantities | |||||||||||||||
| Sold | Net Sales Revenue | Sold | Revenue | Sold | Net Sales Revenue | |||||||||||||
| (thousands | (millions | (thousands | (millions | (thousands | (millions | |||||||||||||
| of tons) | ofreais) | (%) | of tons) | ofreais) | (%) | of tons) | ofreais) | (%) | ||||||||||
| Domestic sales: | ||||||||||||||||||
| PVC suspension | 445.5 | R$1,139.0 | 63.7% | 380.6 | R$926.9 | 60.1% | 360.4 | R$959.9 | 53.5% | |||||||||
| PVC emulsion | 19.4 | 77.4 | 4.3 | 19.7 | 81.1 | 5.3 | 18.5 | 81.0 | 4.5 | |||||||||
| Caustic soda | 450.5 | 373.8 | 20.9 | 423.9 | 357.8 | 23.2 | 455.6 | 449.4 | 25.1 | |||||||||
| Others (1) | 129.6 | 47.9 | 2.7 | 121.0 | 55.8 | 3.6 | 125.3 | 82.9 | 4.6 | |||||||||
| Total domestic sales | 1,045.0 | 1,638.1 | 91.5 | 945.2 | 1,421.5 | 92.2 | 959.8 | 1,573.2 | 87.7 | |||||||||
| Total exports | 148.0 | 151.3 | 8.5 | 142.7 | 120.2 | 7.8 | 194.3 | 220.9 | 12.3 | |||||||||
| Total vinyl net sales | 1,193.1 | R$1,789.4 | 100% | 1,087.9 | R$1,541.7 | 100% | 1,154.1 | R$1,794.1 | 100% | |||||||||
(1) Includes chlorine, hydrogen, caustic soda flake and sodium hypochlorite.
60
PVC and EDC
| Years Ended December 31, | |||||||||||||||||||||||||
| 2004 | 2003 | 2002 | |||||||||||||||||||||||
| Quantities Sold | Net Sales Revenue | Quantities Sold | Net Sales Revenue | Quantities Sold | Net Sales Revenue | ||||||||||||||||||||
| (thousands of tons) | (millions of reais) | (%) | (thousands of tons) | (millions of reais) | (%) | (thousands of tons) | (millions of reais) | (%) | |||||||||||||||||
Domestic sales: | |||||||||||||||||||||||||
PVC suspension | 372.4 | R$ | 1,116.8 | 60.1 | % | 323.6 | R$ | 756.5 | 55.1 | % | 332.5 | R$ | 663.3 | 59.3 | % | ||||||||||
PVC emulsion | 22.0 | 82.8 | 4.4 | 18.8 | 61.7 | 4.5 | 17.6 | 49.0 | 4.4 | ||||||||||||||||
Caustic soda | 444.0 | 342.1 | 18.4 | 426.6 | 290.4 | 21.2 | 400.9 | 227.3 | 20.3 | ||||||||||||||||
Other(1) | 134.0 | 61.0 | 3.3 | 126.0 | 59.5 | 4.3 | 122.4 | 47.2 | 4.2 | ||||||||||||||||
Total domestic sales | 972.4 | 1,602.6 | 86.2 | 895.0 | 1,168.1 | 85.2 | 873.4 | 986.8 | 88.2 | ||||||||||||||||
Total exports | 191.0 | 256.2 | 13.8 | 215.6 | 203.7 | 14.8 | 168.9 | 131.0 | 11.8 | ||||||||||||||||
Total vinyl net sales | 1,163.3 | R$ | 1,858.8 | 100 | % | 1,110.6 | R$ | 1,371.8 | 100 | % | 1,042.3 | R$ | 1,117.8 | 100 | % | ||||||||||
% of the total net sales revenue of all segments | 14.9 | % | 13.7 | % | 15.1 | % | |||||||||||||||||||
PVC
PVC is a versatile polymer, and global production volume of PVC is the second highest among all commercial plastics. We produce suspension and dispersionpaste PVC in various grades, which are sold in various sized bags or in bulk to third generation producers and transported by truck, rail or, in some cases, ship.
Approximately 94%95.5% of our PVC production is in the form of suspension PVC. The grades of PVC produced by the suspension production process are the most widely used, including for use in the manufacture of pipes and fittings, laminated products, shoes, sheeting, flooring, cable insulation, electrical conduit, packaging and medical applications. The grades of dispersionpaste PVC are more specialized products and are used in the manufacture of toys, synthetic leather, flooring materials, bottle caps and seals, automobile corrosion prevention treatments and wallpaper coatings.
Our Vinyls Unit also produces EDC, the principal feedstock used in the production of PVC. We used approximately 67.3%74.6% of our EDC production in 20042007 for further processing into PVC and exported the remainder to Asia.
In 2004, we launched Plastwood, a product made of PVC and wood for finishing ceilings and special patio decks, in partnership with one of our customers in Brazil. We also developed new PVC applications for the Brazilian construction sector, such as prefabricated house and window frame solutions.
Caustic Soda and Chlorine
Our Vinyls Unit also produces caustic soda and chlorine.soda. Caustic soda is a basic commodity chemical that is sold to producers of aluminum, pulp and paper, petrochemicals and other chemicals, soaps and detergents and to waste treatment plants. Caustic soda is also used in the textile industry to make fabrics more absorbent and to improve the strength of dyes, as well as in food processing and electroplating. We sell to third parties almost all of the caustic soda that our Vinyls Unit produces and consume only approximately 6%2.1% of our caustic soda production.
Chlorine is a basic chemical commodity that is used in a large variety of industries, including applications in water treatment and chemical and pharmaceutical production. We consume approximately 85% of our chlorine production in our production of EDC and sell most of our remaining chlorine to a company located in the Northeastern Complex that is connected to one of our plants via a specialized pipeline.
Production Facilities of Our Vinyls Unit
We own five vinyls production facilities. Two of our facilities are located in the Northeastern Complex, and two others are located in the State of Alagoas. Our fifth facility is located in the City of São Paulo.
The following table sets forth the name and location, primary products, annual production capacity at December 31, 2004,2007, and annual production for the years presented for each of our vinyls plants.
| Production | ||||||||||
| Annual | For the Year Ended | |||||||||
| Primary | Production | December 31, | ||||||||
| Location (Complex) | Products | Capacity | 2007 | 2006 | 2005 | |||||
| (in tons) | (in tons) | |||||||||
| Camaçari (Northeastern) | PVC | 250,000 | 209,312 | 193,089 | 225,563 | |||||
| Camaçari (Northeastern) | Caustic Soda | 79,000 | 67,393 | 73,316 | 76,219 | |||||
| Chlorine | 64,000 | 65,505 | 59,820 | 66,587 | ||||||
| Maceió (Alagoas) | Caustic Soda | 460,000 | 391,164 | 395,572 | 419,673 | |||||
| Chlorine | 400,000 | 381,133 | 370,588 | 387,510 | ||||||
| EDC | 520,000 | 478,941 | 477,472 | 499,256 | ||||||
| Marechal Deodoro (Alagoas) | PVC | 240,000 | 235,154 | 229,079 | 198,125 | |||||
| Vila Prudente (São Paulo) | PVC | 26,000 | 20,955 | 21,888 | 23,689 | |||||
Location (Complex) | Primary Products | Annual Production Capacity | Production Year Ended December 31, | |||||||
| 2004 | 2003 | 2002 | ||||||||
| (in tons) | (in tons) | |||||||||
Camaçari (Northeastern) | PVC | 246,000 | 206,978 | 181,780 | 200,056 | |||||
Camaçari (Northeastern) | Caustic Soda | 73,000 | 76,517 | 72,458 | 68,964 | |||||
| Chlorine | 64,000 | 66,644 | 63,857 | 61,206 | ||||||
Maceió (Alagoas) | Caustic Soda | 460,000 | 416,100 | 386,967 | 370,629 | |||||
| Chlorine | 400,000 | 381,464 | 360,677 | 342,747 | ||||||
| EDC | 520,000 | 495,827 | 475,024 | 443,955 | ||||||
Marechal Deodoro (Alagoas) | PVC | 204,000 | 189,810 | 193,150 | 180,870 | |||||
Vila Prudente (São Paulo) | PVC | 25,000 | 24,830 | 21,897 | 20,654 | |||||
Raw Materials of Our Vinyls Unit
Ethylene
Ethylene
The most significant direct cost associated with the production of PVC and EDC is the cost of ethylene, which accounted for 67.9%51.6% of our variable cost of PVC sales in 2004, as compared to 61.3% in 20032007 and 59.5% in 2002, and 81.5%91.4% of our EDC sales in 2004, as compared to 75.4% in 2003 and 77.1% in 2002.2007. Our Basic Petrochemical Unit supplies all of the ethylene required by our Vinyls Unit. Ethylene is delivered to our Alagoas plant via a 477 kilometer477-kilometer pipeline that we own, and to our PVC plant in the Northeastern Complex via a separate pipeline. Because the cost of storing and transporting ethylene is substantial and there is inadequate infrastructure in Brazil to permit the importation of large quantities of ethylene, our Vinyls Unit is highly dependent on ethylene that is supplied by our Basic Petrochemicals Unit. For a description of the pricing of ethylene purchased by our Vinyls Unit from our Basic Petrochemicals Unit, see “—Basic Petrochemicals Unit—Sales and Marketing of Our Basic Petrochemicals Unit.” Our São Paulo plant receives vinylchloride monomer (a raw material used in manufacturing PVC) by ship from our plant in the Northeastern Complex.
61
Electric Power
Electric power is a significant cost component in our production of chlorine and caustic soda. In 2004, electricElectric power accounted for 70.9%40.8% of our Vinyls Unit’s cost of caustic soda sales as compared to 69.0% in 20032007 and 45.0% in 2002, and 18.6%11.0% of our Vinyls Unit’s total cost of sales as compared to 22.4% in 2003 and 18.8% in 2002.
2007. Our Vinyls Unit obtains its electric power requirements from various generators under long-term power purchase agreements. Our caustic soda plants and PVC plants at Camaçari and Alagoas and our PVC plant at Camaçari purchase their electric power requirements from CPFL Comercializacão Brasil S.A. and CHESF. The CHESF contracts areunder a long-term requirements contractscontract that expireexpires in 2010. Companhia Energética de Alagoas S.A., or CEAL, distributes electric power to our PVC plant in Alagoas. Our São Paulo PVC plant obtains its electric power from Eletropaulo Metropolitana-Eletricidade de São Paulo S.A., or Eletropaulo. The power purchase agreementagreements with CEAL and Eletropaulo is aare renewable contractcontracts with
automatic rolling one-yearthree-year extensions. These agreements provide us with the option to purchase our total electric power requirements based on an annual estimate. The price terms of these contracts are based upon tariffs regulated by the Brazilian National Electrical Energy Agency (Agê(Agência Nacional de Energia Elétrica).
Salt
Salt
We used approximately 747,000856,100 tons of salt during 20042007 in our production of chlorine and caustic soda. Salt accounted for 4.4%7.5% of our variable costs of caustic soda sales in 2004, compared to 3.4% in 20032007 and 2002, and 1.0%1.1% of our Vinyls Unit’s total cost of sales compared to 1.1% in 2003 and 2002.2007. We have exclusive salt exploration rights at a salt mine located near our Alagoas plant. We estimate that the salt reserves of this mine are sufficient to allow us to produce chlorine at expected rates of production for approximately 40 to 50 years. We enjoy significant cost advantages when compared to certain of our competitors due to low extraction costs of rock salt (particularly compared to sea salt), low transportation costs due to the proximity of the salt mine to our production facility and the higher purity of rock salt as compared to sea salt.
Other Utilities
All of our Vinyls Unit’s facilities in the Northeastern Complex are supplied with other required basic utilities, including steam, purified and demineralized water, compressed air and nitrogen, by our Basic Petrochemicals Unit. Most basic utilities are supplied to our Alagoas PVC plant by our subsidiary, Companhia Alagoas Industrial, which is owned by the companies operating in the Alagoas complex, including our company.Industrial. Our chlorine and caustic soda plants in Alagoas and our PVC plant in São Paulo supply their own utilities requirements.
Technology of Our Vinyls Unit
We have entered into several non-exclusive agreements with a number of leading petrochemical companies to use technology for our Vinyls Unit. We have been granted the right to use vinylchloride monomer manufacturing technology from Oxyvinyls Company and PVC technology from Mitsubishi Chemical Corporation. We also have chlorine manufacturing technology agreements with Denora (used in Bahia), Eltech (used in Alagoas) and EVC (used to produce ethylene dichloride in Alagoas). In addition, we own 25 patents and six trademarks in Brazil related to our PVC business.
We do not pay any continuing royalties under any of these license agreements, but we paid an initial fee under these agreements. If any of these arrangements were terminated or no longer available to us, we believe that we would be able to replace the relevant technology with comparable or better technology from other sources.
Our plant in the Northeastern Complex uses mercury cell technology to produce chlorine and caustic soda, which technology can no longer be used in new petrochemical production facilities under Brazilian legislation due in part to environmental concerns regarding mercury emissions resulting from this manufacturing process. The Brazilian government may require us to shift to newer diaphragm technology, which we use in our Alagoas plant, or membrane technology. We have not shifted to these newer technologies yet, in part because the return from the capital expenditures associated with this shift would not be as high as those from other potential investments that we may undertake.
62
Pilot Plant and Research Center
Our Vinyls Unit maintains a pilot plant for PVC research and development in the State of Bahia and a research center in the State of São Paulo. This center currently employs six application engineers, four chemicalfive engineers and sevenfour technicians specialized in plastics. At this center and in our pilot plant, we produce new
PVC resins, develop and improve PVC production technology, render support services to our customers, train our customers’ personnel and develop new applications for PVC in Brazil, including vertical blinds, coatings for industrial PVC pipes and resins used in automotive parts and in the manufacture of doors, windows and other building components.
In 2004, our research2005, we launched Vinisol, a paste PVC product for the export market with applications for special paints and development centervarnishes. In 2007, we launched Norvic S80SA, a suspension PVC resin for special applications such as wire and cable, flexible profiles, hoses and films. We have developed Plastwood and new PVC applications for construction systems for houses and industrial facilities that are based on PVC panels, as well as for carpets for automobiles. We launched new resins in 2005, 2006 and 2007, and sales of these resins represented approximately 39% of the Brazilian construction sector.net sales revenue of our Vinyls Unit in 2007.
Sales and Marketing of Our Vinyls Unit
Net sales to our 10 largest Vinyls Unit customers accounted for approximately 50.4%47.4% of our Vinyls Unit’s total net sales revenue during 2004.2007. One customer accounted for approximately 14.6%11.6% of our Vinyls Unit’s total sales revenue during 2004. No customer accounted for more than 12% of the total net sales revenue of our Vinyls Unit during 2003 or 2002.in 2007, 11.3% in 2006 and 10.7% in 2005. One customer accounted for 69.2%22.8% of our total external EDC sales in 2004, compared to 73.0%2007, 58.1% in 20032006 and 89.6%95.4% in 2002,2005, and our largest caustic soda customer accounted for 11.6%7.7% of total caustic soda sales in 2004, compared to 13.4%2007, 8.6% in 20032006 and 5.2%14.9% in 2002.2005.
There is a structural link between the PVC and caustic soda markets that exists because caustic soda is a by-productbyproduct of the production of chlorine required to produce PVC. When demand for PVC is high, then greater amounts of caustic soda are produced, leading to an increase in supply and generally lower prices for caustic soda. Conversely, when demand for PVC is low, prices for caustic soda tend to rise.
Domestic Sales
In 2004,2007, our Vinyls Unit had domestic net sales revenue of R$1,602.61,638.1 million, which accounted for 86.2%91.5% of our Vinyls Unit net sales revenue. In 2004, 74.8%2007, 74.3% of domestic net sales revenue was attributable to sales of PVC, 21.3%22.8% was attributable to sales of caustic soda and 3.8%2.9% was attributable to sales of other products.
We make most of our domestic sales of PVC and caustic soda directly to customers without the use of third party distributors. However, our Vinyls Unit maintains contractual relationships with three distribution centers located in Paulínia and Itapevi,Barueri, both in the State of São Paulo, and Joinville in the State of Santa Catarina that provide logistical support. In addition, we operate three warehouse facilities for PVC and six terminal tank facilities for caustic soda strategically located along the Brazilian coast to enable us to deliver our products to our customers on a “just-in-time” basis. Our Vinyls Unit develops its business through close collaboration with its customers, working together to improve existing products as well as to develop new applications for PVC. Our marketing and technical assistance groups also advise customers and potential customers that are considering the installation of manufacturing equipment for PVC end products.
Export Sales
In 2004,2007, our Vinyls Unit had export net sales revenue of R$256.2151.3 million, which accounted for 13.8%8.5% of our Vinyls Unit’s total net sales revenue. Our export sales of PVC and EDC vary from year to year, influenced principally by domestic market demand and product availability.
The following table sets forth export sales and export volumes of our Vinyls Unit for the years indicated.
63
| Year Ended December 31, | ||||||
| 2004 | 2003 | 2002 | ||||
Net export sales revenue (in millions ofreais) | 256.2 | 203.7 | 131.0 | |||
As % of total net sales revenue of Vinyls Unit | 13.8 | 14.8 | 11.7 | |||
Export volumes (thousands of tons) | 191.0 | 215.6 | 168.9 | |||
As % of total sales volume of Vinyls Unit | 16.4 | 19.4 | 16.2 | |||
We have an ongoing obligation to export PVC and EDC under a supply agreement with Sojitz , which exports accounted for 52.2%Table of our total export sales PVC and EDC during 2004, compared to 64.9% during 2003 and 78.5% during 2002. Under this supply agreement, we have agreed to supply, and Sojitz has agreed to purchase, minimum annual volumes of 6,000 tons of PVC during this agreement’s term, and minimum annual volumes of EDC, which decline over time from 100,000 to 80,000 tons. The export receivables generated under this supply agreement are collateral for an export prepayment facility that we have entered into. Any PVC, EDC or caustic soda that is made available by our Vinyls Unit for export is sold in the spot market at the best available prices.Contents
| For the Year Ended December 31, | ||||||
| 2007 | 2006 | 2005 | ||||
| Net export sales revenue (in millions ofreais) | R$151.3 | R$120.2 | R$220.9 | |||
| As % of total net sales revenue of Vinyls Unit | 8.5% | 7.8% | 12.3% | |||
| Export volumes (thousands of tons) | R$148.0 | R$142.7 | R$194.3 | |||
| As % of total production of Vinyls Unit | 12.4% | 13.1% | 16.8% | |||
We use a variety of methods to distribute our exports, depending generally on the total size of the export market, including direct sales, independent distributors, negotiations conducted through trading companies and sales on the spot market.
We exported 7.8% of our PVC sales volume in 2004. Our export sales of PVC are focused principallyprimarily on the MercosulSouth American, Southeast Asian and Southeast AsianUnited States markets and to a lesser extent on Africa.Europe.
Prices and Sales Terms
We determine the domestic prices for our PVC resins with reference principally to the prices paid by third generation producers in Brazil for imports of PVC plus additional service charges. Our export price for PVC is generally equal to the international market price but also takes transportation costs into account. Delivery time, quality and technical service also affect the levels of sales of PVC resins. We establish our domestic price for caustic soda based on international market prices and prices charged by our three domestic competitors, taking into account any import duties and freight costs. Approximately 70%74.5% of our caustic soda sales are effected pursuant to agreements that are generally for one- to three-year terms and may include floor and ceiling prices. As with PVC, our export prices for EDC are generally determined according to international market prices but also take import duties and freight costs into account.
Prices that we charge for our vinyls products in the Brazilian market are traditionally higher than the prices that we obtain for our exports of these products. The difference in prices between the Brazilian and export markets results generally from:
Our customers in Brazil may pay in full on delivery or elect credit terms that require payment in full within seven to 90 days following delivery. We charge interest based on prevailing market rates to our customers in Brazil that elect longer payment options. Sales terms for exports generally require payment between 90 and 120 days following delivery. We usually require irrevocable letters of credit for export sales made on the spot market.
Competition
PVC
PVC
We and Solvay are the only two producers of PVC in Brazil. Solvay’s total Brazilian installed annual production capacity is 251,000270,000 tons, compared to our annual production capacity of 475,000516,000 tons. In December 2005, we expanded our annual PVC production capacity by 50,000 tons, and Solvay has announced that it will expandexpanded its annual PVC production capacity by 35,000 tons commencing in the second half of 2005.30,000 tons. Solvay’s two production facilities are located in São Paulo and, therefore, are closer than our facilities to the primary PVC market in Brazil. However, we believe that our vertical production capabilities, our modern PVC suspension plants, our strong relationship with our customers and our technical assistance programs enable us to compete effectively with Solvay.
We also compete with importers of PVC. Approximately 14%Imports accounted for approximately 21.5% of Brazil’s total PVC consumption in 2004 was imported, compared to approximately 13% in 2003 and approximately 20% in 2002.2007. Domestically produced PVC is currently competitively priced with imported PVC after taking into account transportation costs and import duties. Solvay, which has an additional plant in Argentina, is also our principal competitor in the PVC market both in Brazil and elsewhere in South America.
64
In addition, we compete with other producers of thermoplastics that manufacture the same line of vinyls products or products that are substitutes for our vinyls product line. Thermoplastics principally consist of polyethylene and polypropylene and are used in certain applications as substitutes for PVC. Wood, glass and metals also are used in some cases as substitutes for PVC.
Other Products
The four largest Brazilian producers of caustic soda accountaccounted for approximately 92%90.9% of Brazilian production.production in 2007. Our company and Dow Chemical operate in this market throughout Brazil, while the other domestic producers of caustic soda generally operate on a local or regional basis. In 2004,Imports accounted for approximately 31%39.6% of Brazil’s total caustic soda consumption was imported, compared to approximately 34% in 2003 and approximately 30% in 2002.2007. We do not believe that imports of caustic soda will increase substantially because of the high cost of transporting caustic soda, which is usually sold in suspension form. In the caustic soda market, we compete mainly on the basis of price and timeliness of delivery.
Our principal competitors in the caustic soda market elsewhere in South America are Dow Chemical, Solvay and producers located on the U.S. Gulf Coast.
Business Development Unit
Our Business Development Unit accounted for R$620.8489.7 million, or 5.0%2.2%, of the net sales revenue of all segments in 2004.2007. Our Business Development Unit produces PET resin, DMT, caprolactam, cyclohexane, cyclohexanone and ammonium sulfate. OurPrior to May 2007, our Business Development Unit also manages certain of our minority equity investments, principally our investments in Petroflexproduced polyethylene terephthalate, or PET, resin and CETREL S.A.—Empresa de Proteção Ambiental,dimethyl terephthalate, or Cetrel, and manages certain of our ventures in the energy and environmental areas.DMT. In 2004, 42.6%2007, 36.6% of our Business Development Unit’s net sales revenue was derived from the sale of PET products and 42.0%44.1% was derived from the sale of caprolactam.
In May 2007, we permanently closed the DMT unit in our PET plant as a result of this plant’s high maintenance and operational costs due to its aging technology. DMT is the primary raw material used by our PET plant. As a result, our PET plant was also temporarily closed down in May 2007 in order for us to review the technology used to produce PET. We are reviewing options for resuming PET production, including using purified terephthalic acid, which is widely used by international producers of PET, as a raw material. Pending completion of this review, we are continuing to serve our PET customers with PET purchased from M&G Polimeros Brasil S.A., a subsidiary of M&G Finanziaria Industriale S.p.A., the largest PET producer in Brazil.
In 2004,2007, we estimate that we had an approximate 20%12.6% share of the Brazilian PET market, based on sales volumes. PET is used in manufacturing packaging for soft drinks, medications, cleaning products, mineral water and food products, and caprolactam is used in manufacturing Nylon-6 textile thread. We also produce DMT for use in PET production, ammonium sulfate for use as a fertilizer, and cyclohexane and cyclohexanone, both for use in paint solvents, pesticides, natural resins, oils and rubber. Our Business Development Unit conducts its manufacturing operations in two plants located in the Northeastern Complex.
Products of Our Business Development Unit
The following table sets forth a breakdown of the sales volume and net sales revenue of our Business Development Unit by product and by market for the years indicated.
65
| Year Ended December 31, | |||||||||||||||||||||||||
| 2004 | 2003 | 2002 | |||||||||||||||||||||||
Quantities sold | Net Sales Revenue | Quantities sold | Net Sales Revenue | Quantities Sold | Net Sales Revenue | ||||||||||||||||||||
(thousands of tons) | (millions ofreais) | (%) | (thousands of tons) | (millions ofreais) | (%) | (thousands of tons) | (millions ofreais) | (%) | |||||||||||||||||
Domestic sales: | |||||||||||||||||||||||||
PET | 66.2 | R$ | 238.5 | 38.4 | % | 55.1 | R$ | 168.3 | 37.0 | % | 59.8 | R$ | 152.5 | 52.4 | % | ||||||||||
Caprolactam | 42.9 | 229.9 | 37.0 | 42.5 | 180.1 | 39.6 | 15.1 | 56.0 | 19.3 | ||||||||||||||||
Ammonium sulfate | 92.4 | 41.4 | 6.7 | 96.9 | 29.7 | 6.5 | 41.0 | 8.7 | 3.0 | ||||||||||||||||
Others | 15.6 | 54.2 | 8.7 | 15.0 | 42.9 | 9.4 | 16.8 | 53.5 | 18.4 | ||||||||||||||||
Total domestic sales | 217.1 | 564.1 | 90.8 | 209.5 | 421.0 | 92.5 | 132.7 | 270.7 | 93.1 | ||||||||||||||||
Total exports | 14.3 | 56.8 | 9.2 | 9.1 | 34.3 | 7.5 | 5.2 | 20.1 | 6.9 | ||||||||||||||||
Total net sales | 231.4 | R$ | 620.8 | 100 | % | 218.6 | R$ | 455.3 | 100 | % | 137.9 | R$ | 290.8 | 100 | % | ||||||||||
% of total net sales revenue of all segments | 5.0 | % | 4.6 | % | 3.9 | % | |||||||||||||||||||
| For the Year Ended December 31, | ||||||||||||||||||
| 2007 | 2006 | 2005 | ||||||||||||||||
| Quantities | Quantities | Quantities | ||||||||||||||||
| sold | Net Sales Revenue | sold | Net Sales Revenue | Sold | Net Sales Revenue | |||||||||||||
| (thousands | (millions | (thousands | (millions | (thousands | (millions | |||||||||||||
| of tons) | ofreais) | (%) | of tons) | ofreais) | (%) | of tons) | ofreais) | (%) | ||||||||||
| Domestic Sales: | ||||||||||||||||||
| PET(1) | 60.3 | R$175.9 | 35.9% | 50.6 | R$152.7 | 31.6% | 56.6 | R$200.7 | 35.3% | |||||||||
| Caprolactam | 18.2 | 96.2 | 19.6 | 25.7 | 127.5 | 26.4 | 33.0 | 197.2 | 34.7 | |||||||||
| Ammonium sulfate | 84.2 | 39.4 | 8.0 | 77.8 | 25.5 | 5.3 | 94.2 | 33.5 | 5.9 | |||||||||
| Others | 16.3 | 49.5 | 10.1 | 19.5 | 56.5 | 11.7 | 16.7 | 49.7 | 8.7 | |||||||||
| Total domestic sales | 179.0 | 361.0 | 73.7 | 173.6 | 362.2 | 75.0 | 200.5 | 481.2 | 84.6 | |||||||||
| Total exports | 30.7 | 128.7 | 26.3 | 34.3 | 120.9 | 25.0 | 19.1 | 87.8 | 15.4 | |||||||||
| Total net sales | 209.7 | R$489.7 | 100% | 207.9 | R$483.1 | 100% | 219.6 | R$569.0 | 100% | |||||||||
Caprolactam is a raw material that forms the basis for the production of Nylon-6 fibers, engineering resins and film, and is a structural material in the motor and electronics industry.(1) In May 2007, we temporarily closed our PET plant.
PET is one of the most widely used polymers in industry today and is used in manufacturing packaging for soft drinks, medications, cleaning products, mineral water and food products. Caprolactam is a raw material that forms the basis for the production of Nylon-6 textile thread, engineering resins and film, and is a structural material in the motor and electronics industries. We also produce ammonium sulfate for use as a fertilizer, and cyclohexane and cyclohexanone, both for use in paint solvents, pesticides, natural resins, oils and rubber. Prior to make most plastic bottles, containers and textile fibers.May 2007, we also produced DMT for use in PET production.
Production Facilities of Our Business Development Unit
Our Business Development Unit operates two plants at the Northeastern Complex. At December 31, 2004,2007, our Business Development Unit plants had a total annual production capacity of 78,000 tons of PET and 62,000 tons of caprolactam.
The table below sets forth the location, primary products, annual production capacity at December 31, 2004,2007, and annual production for the years presented for each of our Business Development Unit plants.
| Annual | Production | |||||||||
| Primary | Production | For the Year Ended December 31, | ||||||||
| Location (Complex) | Products | Capacity | 2007 | 2006 | 2005 | |||||
| (in tons) | (in tons) | |||||||||
| Camaçari (Northeastern) | PET (1) | 78,000 | 25,569 | 57,155 | 66,233 | |||||
| DMT (2) | — | 34,653 | 76,070 | 70,954 | ||||||
| Camaçari (Northeastern) | Caprolactam | 62,000 | 46,087 | 41,615 | 49,981 | |||||
| Cyclohexane | 72,000 | 66,793 | 57,764 | 65,057 | ||||||
| Cyclohexanone | 55,000 | 44,574 | 40,964 | 46,590 | ||||||
| Ammonium sulfate | 114,000 | 89,740 | 78,296 | 94,855 | ||||||
| (1) | In May 2007, we temporarily closed our PET plant. |
| (2) | In May 2007, we permanently closed the DMT unit in our PET plant. |
Location (Complex) | Primary Products | Annual Production Capacity | Production Year Ended December 31, | |||||||
| 2004 | 2003 | 2002 | ||||||||
| (in tons) | (in tons) | |||||||||
Camaçari (Northeastern) | PET | 78,000 | 72,194 | 56,288 | 59,031 | |||||
| DMT | 80,000 | 76,985 | 63,369 | 76,899 | ||||||
Camaçari (Northeastern) | Caprolactam | 62,000 | 50,483 | 48,850 | 19,699 | |||||
| Cyclohexane | 72,000 | 66,292 | 63,712 | 24,403 | ||||||
| Cyclehexanone | 55,000 | 48,282 | 47,813 | 18,637 | ||||||
| Ammonium sulfate | 114,000 | 92,617 | 97,157 | 37,723 | ||||||
Raw Materials of Our Business Development Unit
The most significant direct cost associated with the production of caprolactam is the cost of benzene, which accounted for approximately 33%47.8% of our Business Development Unit’s variable caprolactam production costscost of sales in 2004.2007. All of the benzene that we use in producing caprolactam is supplied by our Basic Petrochemicals Unit.
66
The most significant direct cost associated with our production of PET is the cost of para-xylene, which accounted for approximately 42% of our Business Development Unit’s variable PET production costs in 2004, as compared to 46% in 2003 and 47% in 2002. All of the para-xylene that we use in producing PET is supplied by our Basic Petrochemicals Unit.
Technology of Our Business Development Unit
We have entered into several non-exclusive agreements with a number of leading petrochemical companies to use technology for our Business Development Unit. The technology of our Business Development Unit includes:
We do not pay any continuing royalties under any of these license agreements, but we paid an initial fee under these license agreements. If any of these arrangementsagreements were terminated, or no longer available to us, we believe that we would be able to replace the relevant technology covered by these agreements with comparable or better technology from other sources.
Sales and Marketing of Our Business Development Unit
Our Business Development Unit sells its products primarily in northeastern Brazil, mainly to third generation petrochemical producers located in the Northeastern Complex. We determine the prices for the products of our Business Development Unit with reference to several market factors that include the prices paid by third generation producers for imports of these products and prevailing market prices in Brazil.
Our Business Development Unit sells its products to a highly concentrated customer base. SevenFour customers accounted for approximately 68%56.0% of our total PET sales during the year ended December 31, 2004. Our Business Development Unit’s2007. As a result of the shutdown of the plant of one of our domestic customers in June 2006, no caprolactam customer base is even more concentrated, as one customerhas accounted for approximately 65%more than 10% of our total caprolactam sales duringsince the year ended December 31, 2004.date of this plant shutdown.
In order to continue serving our PET customers following the temporary closure of our PET plant, we entered into a contract with M&G Polimeros Brasil S.A., a subsidiary of M&G Finanziaria Industriale S.p.A., the largest PET producer in Brazil and one of the two largest producers worldwide, for the supply of not less than 60,000 tons of the resin per year. Our relationships with our PET customers, including the provision of technical assistance, will continue to be conducted under our commercial policy.
Competition
Monomeros Colombo Venezolanos S.A., or Monomeros, is the only manufacturer, other than our company, of caprolactam in South America, with an annual production capacity of 30,000 tons. Monomeros supplied approximately 4,00027,600 tons of caprolactam in 2004,2007, or approximately 8%26.2% of the caprolactam sold in Brazil (approximately 49,000 tons in 2004).Brazil.
The textile industry consumed the most caprolactam in Brazil during 20042007 (approximately 23,0009,600 tons). However, consumption of caprolactam in Brazil in 2004 grew fastest in, and the engineering plastics and plastic films segments of the petrochemical industry which consumed an aggregate amount of approximately 16,00014,200 tons of caprolactam in 2004. The industrial wire industry consumed the remaining caprolactam in Brazil in 2004.2007.
There are three other producers of PET in Brazil: M&G Finanziaria Industriale S.p.A.; Rhodia-ster S.A., or Rhodia-ster (a subsidiary of Mossi & Ghisolfi Group); and Vicunha Têxtil S.A., or Vicunha Têxtil; and Ledervin Indústria e Comércio Ltda., or Ledervin. In 2004, Rhodia-ster, Vicunha Têxtil and Ledervin had annual production capacities of 290,000 tons, 24,000 tons and 9,000 tons, respectively, as compared to our annual production capacity of 70,000 tons. In addition,xtil. At December 31, 2007, M&G Finanziaria Industriale S.p.A. has announced that it will build a PET plant in Ipojuca, Pernambuco, withhad an annual production capacity of 450,000 tons of PET, which is expected to commence operations in late 2006.Rhodia-ster had an annual production capacity of 250,000 tons of PET, and Vicunha Têxtil had an annual production capacity of 12,000 tons of PET. In June 2006, Vicunha Têxtil closed its PET plant temporarily and has not announced when this plant will recommence operations.
We
also compete with importers of PET. Approximately 32%Imports accounted for approximately 29.2% of Brazil’s total PET consumption in 2004 was imported as compared to approximately 37% in 2003 and 35% in 2002.2007. Although international producers of PET have greater economies of scale than our company, we are able to compete with these producers due to the high transportation costs and import duties applicable to PET imports. Our PET production issales have been aimed principally at the bottled water segment of the PET market, and we believe that ourthe quality products that we sell will continue to remain competitive in the Brazilian PET market.
PetroflexIpiranga Química
Our Business Development Unit also manages certainIpiranga Química accounted for R$392.6 million, or 1.7% of our minority equity investments, including our investmentthe net sales revenue of all segments in Petroflex.
At December 31, 2004, we owned 20.1%2007. Ipiranga Química owns 100% of the total and voting share capital of Petroflex,Ipiranga Petroquímica. Ipiranga Química is also the largest Brazilian distributor of chemical and petrochemical products with a market share of approximately 10%. As a result of the Ipiranga Transaction, we have consolidated the results of Ipiranga Química and its subsidiaries into our financial statements as from April 1, 2007.
67
Ipiranga Química distributes products manufactured by Ipiranga Petroquímica, as well as products from more than 50 domestic and international companies. Ipiranga Química distributes products in a broad range of market segments, including agrochemicals, rubber and general purpose chemicals; cosmetics and pharmaceuticals; household and other industrial segments; plastic transformation; and paints, resins, adhesives and civil construction.
Products Distributed by Ipiranga Química
Ipiranga Química distributes a large and diverse portfolio of products consisting of more than 1,000 products. We classify the products distributed by Ipiranga Química as:
The following table sets forth a breakdown of the sales volume and net sales revenue of Ipiranga Química by product for the nine months ended December 31, 2007.
| Nine Months Ended December 31, | ||||||
| 2007 | ||||||
| Quantities | ||||||
| sold | Net Sales Revenue | |||||
| (thousands | (millions | |||||
| of tons) | ofreais) | (%) | ||||
| Solvents: | ||||||
| Aliphatic solvents | 28.9 | R$57.5 | 14.6% | |||
| Aromatic solvents | 20.2 | 42.6 | 10.8 | |||
| Synthetic solvents | 12.9 | 36.4 | 9.3 | |||
| Ecological solvents | 0.2 | 0.6 | 0.2 | |||
| Polymers | 25.7 | 96.6 | 24.6 | |||
| General purpose chemicals: | ||||||
| Process oils | 27.3 | 40.9 | 10.4 | |||
| Chemical intermediates | 10.1 | 32.4 | 8.3 | |||
| Blends | 15.5 | 30.9 | 7.9 | |||
| Specialty chemicals | 2.7 | 26.5 | 6.8 | |||
| Santoprene | 1.2 | 9.6 | 2.4 | |||
| Pharmaceuticals | 0.9 | 13.4 | 3.4 | |||
| Services | 0.1 | 5.2 | 1.3 | |||
| Total net sales | 145.6 | R$392.6 | 100% | |||
Distribution Agreements
Ipiranga Química has commercial relationships with more than 50 domestic and international companies, under which Ipiranga Química distributes specified products, including:
68
Ipiranga Química also has entered into distribution agreements that provide it with exclusive rights to distribute specified products in Brazil, including distribution agreements with:
Generally, Ipiranga Química initiates distribution activities for a producer with a letter of synthetic rubber.intent with a term of one-year and, following this period, extends these commercial relationships or distribution agreements for an indefinite period. Generally, Ipiranga Química’s distribution agreements may be terminated by either party on 30 to 180 days notice.
Ipiranga Química’s distribution agreements are generally local stock agreements, indent sales agreements or agreements that combine the features of both. Under Ipiranga Química’s local stock agreements, Ipiranga Química purchases chemicals for resale to its customers. These agreements do not contain minimum volume or maximum margin requirements. Sales to Ipiranga Química under these agreements are at prices negotiated between Ipiranga Química and the producer. Ipiranga Química’s distribution agreement with Petrobras provides that Ipiranga Química is eligible to receive a discount on purchases based on the volume of products purchased. Under Ipiranga Química’s indent sales agreements, Ipiranga Química acts as a sales agent and receives a commission on the total sales revenue (FOB price) generated for the producer by these sales.
Sales and Marketing by Ipiranga Química
Ipiranga Química distributes products to chemical retailers, third generation petrochemical producers and other manufacturers. We accountdetermine the prices for the products distributed by Ipiranga Química by reference to several market factors, including the prices paid by third generation producers for imports of these products and prevailing market prices in Brazil. Ipiranga Química serves 5,000 active clients in more than 50 market segments, through nine business units supported by seven sales offices throughout Brazil. Ipiranga Química operates four distribution centers that include warehouses and tank farms. Ipiranga Química owns its distribution centers in Guarulhos in the State of São Paulo, Canoas in the State of Rio Grande do Sul and Duque de Caxias in the State of Rio de Janeiro, and leases its distribution center in Camaçari in the State of Bahia.
Ipiranga Química distributes products in a broad range of market segments. No customer represented more than 10% of the net sales revenue of Ipiranga Química during 2005, 2006 or 2007. The following table sets forth a breakdown of the net sales revenue of Ipiranga Química by market segment served by its customer for the nine months ended December 31, 2007.
69
| Nine Months Ended | ||||
| December 31, | ||||
| 2007 | ||||
| Net Sales Revenue | ||||
| (millions | ||||
| ofreais) | (%) | |||
| Plastics | R$81.3 | 20.7% | ||
| Paints and Coats | 61.6 | 15.7 | ||
| Rubber | 47.5 | 12.1 | ||
| Pharmaceutical | 34.2 | 8.7 | ||
| Agribusiness | 24.3 | 6.2 | ||
| Adhesives | 18.1 | 4.6 | ||
| Chemicals | 17.7 | 4.5 | ||
| Household products | 14.1 | 3.6 | ||
| Lubricants | 13.0 | 3.3 | ||
| Automobile | 12.2 | 3.1 | ||
| Petrochemical | 10.2 | 2.6 | ||
| Cosmetics/ Personal Care | 9.4 | 2.4 | ||
| Chemical and petrochemical resale | 8.6 | 2.2 | ||
| Other | 40.4 | 10.3 | ||
| Total net sales | R$392.6 | 100% | ||
Competition
The chemical distribution industry in Brazil had revenues of US$3.4 billion in 2007, representing growth of 15% compared to 2006, according to preliminary data published by the Brazilian Chemical and Petrochemical Distributors Association. The chemical distribution industry in Brazil is highly fragmented, with a small number of large distributors, such as M Cassab, Unipar, Coremal, Makeni Química and Brenntag, and a large number of small distributors. The Brazilian Chemical and Petrochemical Distributors Association estimates that 8% of the companies in this industry have annual sales of more than US$150 million while 74% have annual sales of less than US$50 million. The customer base for chemical distributors is primarily composed of customers that consume small volumes of any distributed product.
Jointly Controlled Companies and Subsidiaries
Petroquímica Paulínia
At December 31, 2007, we owned 60.0% of the total and voting share capital of Paulínia. As a result of the completion of the first phase of the Petrobras Transaction on May, 30, 2008, Paulínia is our wholly owned subsidiary. Paulínia, which is a corporation (sociedade anônima) organized under the laws of Brazil, was incorporated on September 16, 2005 and is a joint venture between our company and Petroquisa for the construction and operation of a polypropylene plant located in Paulínia, in the State of São Paulo. Prior to April 1, 2008, we accounted for our interest in PetroflexPaulínia in our Brazilian GAAP financial statements using the equity method. proportional consolidation method as required under Brazilian GAAP. We will fully consolidate the results of Paulínia into our financial statements as from April 1, 2008 as a result of the completion of the first phase of the Petrobras Transaction.
The Paulínia plant commenced operations in April 2008 with an initial annual production capacity of 350,000 tons of polypropylene. We contributed the process technology that is being used by this plant under an agreement with a 20-year term. Petrobras is supplying Paulínia with polymer-grade propylene, the primary feed stock used in Paulínia’s production processes, through its refineries in Paulínia and Henrique Lage under an agreement with an initial 20-year term. The agreement with Petrobras is automatically renewable for consecutive two-year terms following the initial term, unless terminated by one of the parties.
70
Petroflex
At December 31, 2007, we owned 33.5% of the total share capital of Petroflex, including 33.6% of its voting share capital. In April 2008, we sold all of our share capital in Petroflex to Lanxess Participações Ltda. for an aggregate price of R$252.1 million. As a result of this transaction, Petroflex registered a non-operational gain of R$115.6 million.
Petroflex, which is a corporation (sociedade anônima) organized under the laws of Brazil, is the leadinglargest producer of synthetic rubber in Latin America and produces approximately 360,000has an annual production capacity of 442,000 tons of more than 70 types of elastomers per year. Petroflex operates three plants in Brazil located in Duque de Caxias, Rio de Janeiro; Cabo, Pernambuco; and Triunfo, Rio Grande do Sul. Petroflex sells its products to customers in approximately 70 countries throughout the world. Petroflex purchases butadiene from us from which it produces styrene-butadiene, polybutadiene, liquid hidroxylated polybutadiene and other elastomers.
Petroflex was formed in 1976 with Petroquisa as its majority shareholder. In 1992, as part of the Brazilian government’s efforts to privatize the Brazilian petrochemical industry, Petroquisa auctioned a portion of its equity interest in Petroflex to private investors. At December 31, 2004,In October 2007, we and Suzano Química Ltda. each owned 20.1% of the voting and total share capitalacquired shares of Petroflex Resitec Indústria Química Ltda. owned 13.0%representing 13.4% of Petroflex’sits total and voting share capital and Unipar—União de Indústrias Petroquímicas S.A. owned 10.1% of Petroflex’s voting share capital.
The main customers of Petroflex are manufacturers of tires, shoes, adhesives and sealants. The major raw materials used in Petroflex’s production process are butadiene and styrene. Petroflex purchases part of its raw materials requirements from our company. Due to high naphtha prices in 2004, theSuzano for an aggregate purchase price of butadiene increasedR$61.0 million as a result of our exercise of our preemptive rights in August 2007 following the announcement of the acquisition of control of Suzano by 8.4% in the international market and the price of styrene increased by 8.0%. However, the recovery of synthetic rubber prices inreais, due to increases in international market prices, allowed Petroflex to pass on these increased costs to its customers.Petrobras.
In 2004, Petroflex’s net incomesales revenue was R$98.3 million, compared to net income of R$60.51,417.4 million in 20032007, R$1,361.5 million in 2006 and R$29.71,373.2 million in 2002,2005, as adjusted to conform to our accounting policies.
Jointly Controlled Companies
Copesul
At December 31, 2004, we owned 29.5% of the voting and total share capital of Copesul, the cracker based in the Southern Complex. We account for our interest in Copesul in our Brazilian GAAP financial statements using the proportional consolidation method.
Copesul is the second largest petrochemical cracker in Brazil based on production capacity, with approximately 39% of Brazilian production capacity of ethylene. It provides petrochemical feedstocks to second generation petrochemical producers located in the Southern Complex, including our Polyolefins Unit’s plants located there. Copesul’s manufacturing operations in the Southern Complex and the products that it produces are similar to the products of our Basic Petrochemicals Unit.
Copesul’s annual ethylene production capacity is 1,135,000 tons, the equivalent of approximately 39% of Brazilian total production capacity for this raw material, and its annual propylene production capacity is
581,000 tons. In 2004, Copesul produced 1,119.0 thousand tons of ethylene and 590.0 thousand tons of propylene. Actual production of Copesul’s plants, like the plants in our Basic Petrochemicals Unit, may exceed their stated annual production capacity.
Copesul was formed in 1976 with Petroquisa as its majority shareholder and commenced operations in 1982. In May 1992, as part of the Brazilian government’s efforts to privatize the Brazilian petrochemical industry, Petroquisa auctioned a portion of its interest in Copesul to private investors. At December 31, 2004, a consortium, including the Odebrecht Group and Ipiranga and its affiliates, owned 58.9% of the total share capital of Copesul. Petroquisa continued to own 15.6% of the total share capital of Copesul.
The main customers of Copesul are the second generation petrochemical producers located in the Southern Complex, including our company. Copesul has long-term supply contracts with its major customers, including our Polyolefins Unit.
In 2004, Copesul’s net income on a consolidated basis was R$558.4 million, compared to net income of R$149.9 million in 2003 and a net loss of R$32.1 million in 2002, as adjusted for the effects of unrealized tax incentives to conform to our accounting policies. Copesul’s net sales revenue on a consolidated basis was R$5,374.1 million in 2004, R$4,177.9 million in 2003 and R$2,932.8 million in 2002, as adjusted to conform to our accounting policies.
Politeno
At December 31, 2004, we owned 34.0% of the Politeno’s total share capital, including 35.0% of its voting share capital. Politeno is a second generation petrochemical producer operating in the Northeastern Complex. We account for our interest in Politeno in our Brazilian GAAP financial statements using the proportional consolidation method.
Politeno produces polyethylene grades that are widely used in the flexible and rigid packaging industries. Politeno produces LDPE, medium density polyethylene, HDPE, LLDPE, linear medium density polyethylene, ethyl vinyl acetate copolymer and other special resins.
The production facility of Politeno is comprised of two industrial plants, a LDPE facility and an linear polyethylene facility. The LDPE facility produces LDPE and ethyl vinyl acetate copolymer, with an annual production capacity of 150,000 tons. The linear polyethylene facility produces LLDPE and HDPE and has an annual production capacity of 210,000 tons.
The principal raw materials used in Politeno’s production processes are ethylene and propylene, which are primarily supplied by our Basic Petrochemicals Unit. Politeno also uses butadiene, benzene and toluene.
Politeno’s principal customers are third generation petrochemical producers.
In 2004, Politeno’s Petroflex’s net income was R$96.5 million, compared to net income of R$67.269.6 million in 20032007, R$23.0 million in 2006 and R$45.688.0 million in 2002,2005, as adjusted for the effects of revaluation of property, plant and equipment to conform to our accounting policies. Politeno’s net sales revenuePrior to November 30, 2007, we accounted for our interest in Petroflex in our Brazilian GAAP financial statements using the proportional consolidation method. As a result of our entering into an agreement in December 2007 to sell our interests in Petroflex, we accounted for our interest in Petroflex in our Brazilian GAAP financial statements using the equity method as from December 1, 2007.
Petroflex operates three plants in Brazil located in Duque de Caxias in the State of Rio de Janeiro; Cabo de Santo Agostinho in the State of Pernambuco; and Triunfo in the State of Rio Grande do Sul. Petroflex sells its products to customers in approximately 70 countries. The main customers of Petroflex are manufacturers of tires, shoes, adhesives and sealants.
The major raw materials used in Petroflex’s production process are butadiene and styrene. Petroflex purchases butadiene from us from which it produces styrene-butadiene, polybutadiene, liquid hidroxylated polybutadiene and other elastomers. Due to high naphtha prices in 2007, the price of butadiene increased by 3.0% in the Brazilian market and the price of styrene increased by 1.4% . However, the recovery of synthetic rubber prices in reais, due to increases in international market prices, allowed Petroflex to pass on most of these increased costs to its customers.
Capital Expenditures
Our capital expenditures on property, plant and equipment and intangible assets were R$1,374.4 million in 2007, R$953.0 million in 2006 and R$930.2 million in 2005. Additionally, our investments in interests in other companies were R$1,151.7 million in 2007, R$222.7 million in 2006 and R$34.0 million in 2005. Our capital expenditures projects during 2005 through 2007 included the following:
71
Braskem+ Program
In 2004, we began implementation of an operational excellence program named “Braskem+.” This program was designed to build upon the experience that Braskem has accumulated through the process of capturing operational synergies during its integration process. This program identified 210 specific initiatives, each with its own performance goals and implementation schedule. We made capital expenditures of R$943.9330.2 million between 2004 and 2007 related to the implementation of this program.
Formula Braskem
In 2005, we commenced our Formula Braskem program to implement a new integrated management system intended to incorporate the best practices in the international petrochemical industry in our management systems and the most recent technological developments available in the marketplace. We made capital expenditures of R$130.0 million between 2005 and 2007 related to the implementation of the first phase of Formula Braskem. We made capital expenditures of R$39.9 million in 20032007 related to the implementation of the second phase of Formula Braskem.
Petroquímica Paulínia
In September 2005, we and Petroquisa incorporated Paulínia as a joint venture company for the construction and operation of a polypropylene plant to be located in Paulínia, in the State of São Paulo, with an initial annual production capacity of 350,000 tons. This plant commenced operations in April 2008. We own 60% of the total and voting share capital of Paulínia, and Petroquisa owns the remaining total and voting share capital. The total cost of this plant was approximately R$733.6704.0 million. In December 2006, Paulínia entered into a credit agreement with Brazilian National Bank for Economic and Social Development (Banco Nacional de Desenvolvimento Econômico e Social), or BNDES, in the aggregate amount of R$566.2 million to finance the construction of this plant. The remaining cost of this plant was financed through equity contributions by the shareholders of Paulínia. We have invested R$145.1 million in 2002,Paulínia, which corresponds to Braskem’s share in the investments made in the construction of Paulínia’ polypropylene plant.
Politeno Acquisition
In April 2006, we purchased all of the common and preferred shares of Politeno that were owned by SPQ, Sumitomo and Itochu. We paid a portion of the purchase price for these shares in an aggregate amount of thereal-equivalent of US$111.3 million in April 2006. The remainder of the purchase price for these shares was calculated based on an “earn-out” formula taking into account Politeno’s operating performance, measured by fluctuations in polyethylene and ethylene margins in the Brazilian petrochemical market during the 18 months following the execution date of the agreement under which we acquired these shares. Following the Politeno Acquisition, we owned 100% of the voting share capital and 96.2% of the total share capital of Politeno. Politeno merged with and into Braskem on April 2, 2007. In January 2008, we paid the remaining portion of the purchase price of R$247.5 million.
72
Ipiranga Transaction
On March 18, 2007, we entered into the Ipiranga Investment Agreement with Ultrapar and Petrobras. On the same date, Ultrapar and the controlling shareholders of RPI, CBPI and DPPI entered into the Purchase Agreement, with our company and Petrobras as adjusted to conformintervening parties.
Under the Ipiranga Investment Agreement, Ultrapar, as a commission agent acting on behalf of Braskem and Petrobras, acquired 100% of the share capital of Ipiranga Química. As of March 18, 2007, Ipiranga Química owned 86.9% of the voting share capital and 92.4% of the total share capital of Ipiranga Petroquímica. Ipiranga Petroquímica, in turn, owned 29.5% of the share capital of Copesul. In February 2008, Ultrapar transferred 60% of the share capital of Ipiranga Química to our accounting policies.company and 40% of the share capital of Ipiranga Química to Petrobras, as required by the Ipiranga Investment Agreement. In addition, under the Ipiranga Investment Agreement, Ultrapar is obligated to transfer 33.3% of the share capital of RPI to our company and 33.3% of the share capital of RPI to Petrobras. Following this transfer, we will jointly and equally control RPI with Petrobras and Ultrapar. The total purchase price to our company of the shares of Ipiranga Química that we have acquired and the shares of RPI that we will acquire from Ultrapar in the Ipiranga Transaction was R$1,489.1 million.
As part of the Ipiranga Transaction:
Under the Ipiranga Investment Agreement, Braskem paid Ultrapar R$651.9 million in April 2007, R$156.7 million in October 2007, R$47.0 million in November 2007 and R$633.5 million in February 2008 for the shares of Ipiranga Química that we have acquired and the shares of RPI that we will acquire from Ultrapar in the Ipiranga Transaction. For additional information regarding the Ipiranga Transaction, see “Item 4. Information on the Company—Ipiranga Transaction.”
Venezuelan Initiatives
Polypropylene Project
In December 2007, we, through our wholly owned Netherlands subsidiary, Braskem Europe B.V., entered into a shareholders agreement, which we refer to as the Propilsur Shareholders Agreement, with Petroquímica de Venezuela, S.A., or Pequiven, the government-owned petrochemical company of the Bolivarian Republic of Venezuela, which supersedes the Project Development Agreement Framework and the Project Development Agreement that we entered into with Pequiven in April 2006 and April 2007, respectively. Under the Propilsur Shareholders Agreement, we plan to form Propilsur, a joint venture with Pequiven for the development, construction and operation of a polypropylene plant with an integrated propane dehydrogenation unit to be located in the Jose Petrochemical Complex in the State of Anzoategui, Venezuela, with an annual production capacity of approximately 450,000 tons. The Propilsur Shareholders Agreement sets forth the understanding of the parties regarding the implementation of this project and the relationship of Braskem and Pequiven as shareholders of Propilsur. Under the Propilsur Shareholders Agreement:
73
The Propilsur Shareholders Agreement includes provisions for mediation and arbitration in the event of disputes and a deadlock between our company and Pequiven in matters to be determined by Propilsur’s board of directors and grants rights of first offer and first refusal to our company and Pequiven in the event that we or Pequiven determine to sell our equity interests in Propilsur.
The estimated total cost of this project to Propilsur is approximately US$843 million of which we anticipate that our company and Pequiven will each contribute approximately 15% as equity. We have announced that our board of directors has approved an initial investment of US$11 million for the next phase of this project. We expect that construction of this project will commence in the beginning of 2009 and that this project will begin production by the beginning of 2011.
We expect to form Propilsur during the third quarter of 2008. The Propilsur Shareholders Agreement provides that implementation of this project is contingent upon a final investment decision of each of the parties on or prior to May 13, 2009. We are continuing to negotiate with Pequiven regarding details of the implementation of this project. We can provide no assurances that these negotiations will be successful or that if we reach a final agreement with respect to the implementation of this project, such agreement will be upon the terms currently anticipated by our management.
Jose Olefins Project
In December 2007, we, through our wholly owned Netherland subsidiary, Braskem Europe B.V., entered into a shareholders agreement with Pequiven, which we refer to as the Polimerica Shareholders Agreement, which supersedes the memorandum of understanding and the Project Development Agreement that we entered into with Pequiven in April 2006 and April 2007, respectively. Under the Polimerica Shareholders Agreement, we plan to form Polimerica, a joint venture with Pequiven for the development, construction and operation of the Jose Olefins Project, an olefins complex to be located in the Jose Petrochemical Complex. The proposed complex would include an ethylene cracker that would use ethane extracted from natural gas as its raw material, with an annual production capacity of 1.3 million tons, and three polyethylene plants with a combined annual production capacity of 1.1 million tons of HDPE, LDPE and LLDPE. The Polimerica Shareholders Agreement sets forth the understanding of the parties regarding the implementation of this project and the relationship of Braskem and Pequiven as shareholders of Polimerica. Under the Polimerica Shareholders Agreement:
74
The Polimerica Shareholders Agreement includes provisions for mediation and arbitration in the event of disputes and a deadlock between our company and Pequiven in matters to be determined by Polimerica’s board of directors and grants rights of first offer and first refusal to our company and Pequiven in the event that we or Pequiven determine to sell our equity interests in Polimerica.
The estimated total cost of this project to Polimerica would be approximately US$2,662 million of which we anticipate that our company and Pequiven will each contribute approximately 15% as equity. We have announced that our board of directors has approved an initial investment of US$80 million for the next phase of this project. We expect that construction of this project will commence in 2010 and this project will begin production by the beginning of 2013.
We expect to form Polimerica during the third quarter of 2008. The Polimerica Shareholders Agreement provides that implementation of this project is contingent upon a final investment decision of each of the parties on or prior to the third anniversary of the Polimerica Shareholders Agreement. We are continuing to negotiate with Pequiven regarding details of the implementation of this project. We can provide no assurances that these negotiations will be successful or that if we reach a final agreement with respect to the implementation of this project, such agreement will be upon the terms currently anticipated by our management.
Research and Development
Our ability to compete in the Brazilian and foreign markets that we serve depends on our ability to integrate new production processes developed by our company and third parties in order to lower our costs and offer new thermoplastic products. In addition, our relationships with our customers are enhanced by our ability to develop new products and customize existing products to meet their needs. To meet these challenges, we maintain a research and development program that is primarily implemented at the Braskem Center for Innovation and Technology in the Southern Complex. We invested R$76.5 million, R$44.3 million and R$47.2 million in research and development in 2007, 2006 and 2005, respectively.
2008 Capital Expenditure Budget
We currently are budgeting total capital expenditures of approximately R$1.3 billion for 2008. Our principal capital expenditures for 2008 consist of, in addition to the projects referred to in the preceding paragraphs, approximately R$435.2 million for productivity improvements, approximately R$354.7 million for maintenance stoppages and other maintenance of our plants, approximately R$226.8 million for the replacement of depreciated equipment, approximately R$175.4 million for plant modernization and information systems and approximately R$161.9 million for health, environmental and quality improvement projects.
75
Other Projects
We are currently evaluating projects that could entail significant capital expenditures in the future, including:
Maintenance
Most of our maintenance is performed by third-party service providers. For example, we have contracts with Construtora Norberto Odebrecht S.A., or CNO, a company in the Odebrecht Group, Asea Brown Boveri Ltd., Cegelec Ltda., Rip Serviços Industriais S/A, Cl Engenharia Ltda. and other service providers to perform maintenance for our Basic Petrochemicals Unit, Copesul and our Business Development Unit. We also perform some of our ordinary course maintenance with our small team of maintenance technicians, which also coordinate the planning and execution of maintenance services performed by third parties.
Prior to January 1, 2006, we recorded expenditures for programmed maintenance shutdowns of our plants as “Deferred charges.” Such expenses occur at scheduled intervals from one to six years and are depreciated to production cost until the beginning of the next maintenance shutdown. Beginning January 1, 2006, in accordance with IBRACON Technical Interpretation 01/2006, we recorded all programmed maintenance shutdown expenses in property, plant and equipment as “Machinery, equipment and facilities.” In addition, the retrospective effects of depreciation with the adoption of this interpretation was recognized as shareholders’ equity. Accordingly, for periods ending after January 1, 2006, we have reclassified the amount of R$400.2 million from deferred charges to property, plant and equipment, and recognized the amount of R$164.9 million in shareholders’ equity.
Basic Petrochemicals Unit
Because we have two independent Olefins units and two independent Aromatics units, we may continue production of basic petrochemicals without interruption, even while we perform certain maintenance services. We occasionally undertake other brief shutdowns of the operations of our Basic Petrochemicals Unit that do not materially affect our production output, primarily for maintenance purposes, catalyst regeneration and equipment cleaning. Regular basic petrochemicals plant maintenance requires complete plant shutdowns from time to time, and these shutdowns usually take approximately 30 days to complete.
The last general maintenance shutdown of our Olefins 1 unit was carried out in 2001 and lasted for 25 days. The cost of servicing the unit was approximately R$39.8 million (not including the value of lost production during this shutdown). In 2002, we shut down our Olefins 1 unit for 92 days in order to increase its production capacity and to modernize and upgrade its technology. The cost of these improvements to this unit was approximately R$142.8 million (not including lost production). We performed a non-programmed maintenance shutdown of our Olefins 1 unit in December 2006 for 13 days. This shutdown permitted inspection and maintenance of this unit, in order to ensure the production of ethylene until May 2008. The cost of servicing the unit was approximately R$7.0 million (not including the value of lost production during this shutdown). A general maintenance shutdown of our Olefins 1 commenced on May 23, 2008 with an estimated duration of approximately 35 days at an expected cost of R$95 million (not including the value of lost production during this shutdown or investments in productivity enhancements).
76
The last general maintenance shutdown of our Aromatics 1 unit was carried out in 2005 and lasted 30 days. The cost of servicing this unit was approximately R$21 million (not including the value of lost production during this shutdown or investments in productivity enhancements). We no longer perform general maintenance shutdowns of our Aromatics 1 unit and instead perform general maintenance shutdowns of specific plants or groups of plants in this unit. We performed maintenance of the parex plant of the Aromatics 1 unit during a shutdown of this plant during 2007 that lasted 52 days. The cost of servicing this plant was approximately R$19 million (not including the value of lost production during this shutdown or investments in productivity enhancements). A general maintenance shutdown of the butadiene plant and the commons systems associated with Olefins 1 commenced on May 23, 2008 with an estimated duration of approximately 30 days at an expected cost of R$16 million (not including the value of lost production during this shutdown or investments in productivity enhancements). The next general maintenance shutdown of the Catalyst Reform plant and the plants comprising the C8 loop has been scheduled for September 2009 with an estimated duration of approximately 30 days at an expected cost of R$35 million (not including the value of lost production during this shutdown or investments in productivity enhancements).
The last general maintenance shutdown of our Aromatics 2 and Olefins 2 units (which form part of the same basic petrochemicals facility) was carried out in 2004 and lasted 36 days. The cost of servicing these units was approximately R$89 million (not including the value of lost production during this shutdown). The next general shutdown of our Aromatics 2 and Olefins 2 units has been scheduled for 2010 with an estimated duration of approximately 25 days.
Copesul
Because Copesul has two independent Olefins units, we may continue production of basic petrochemicals without interruption, even while we perform certain maintenance services. We occasionally undertake other brief shutdowns of Copesul’s operations that do not materially affect our production output, primarily for maintenance purposes, catalyst regeneration and equipment cleaning. Regular maintenance of Copesul’s plants requires complete plant shutdowns from time to time, and these shutdowns usually take approximately 30 days to complete.
The last general maintenance shutdown of Copesul��s Olefins 1 unit and Aromatics unit was carried out beginning in April 2008 and lasted for 38 days. The cost of servicing the unit was approximately R$55.0 million (not including the value of lost production during this shutdown). The next general shutdown of Copesul’s Olefins 1 unit and Aromatics unit has been scheduled for 2014.
The last general maintenance shutdown of Copesul Olefins 2 unit was carried out in 2005 and lasted for 32 days. The cost of servicing the unit was approximately R$44.1 million (not including the value of lost production during this shutdown). The next general shutdown of this unit has been scheduled for April 2011 with an estimated duration of approximately 30 days.
Polyolefins and Ipiranga Petroquímica
We have a regular maintenance program for each of our polyolefins plants. Production at each of our Polyolefins Unit’s polyolefins plants generally is shut down for seven to 20 days every two years to allow for regular inspection and maintenance. Production at each of Ipiranga Petroquímica’s polyolefins plants generally is shut down for seven to 20 days every three years to allow for regular inspection and maintenance. In addition, we undertake other brief shutdowns for maintenance purposes that do not materially affect our production of polyolefins. We coordinate the maintenance cycles of our polyolefins plants with those of our basic petrochemicals plants. While our basic petrochemicals facilities must be shut down for up to 30 days for maintenance, our polyolefins facilities may be shut down for shorter periods because these facilities are less complex to operate and maintain than our basic petrochemicals facilities.
77
Vinyls Unit
We have a regular maintenance program for each of our vinyls plants. Our Camaçari and Alagoas PVC plants are generally shut down for 15 to 20 days every two years to allow for regular inspection and maintenance. The last general maintenance shutdown of our PVC plant in Camaçari was carried out in May 2006 and lasted for 14 days. The next general maintenance shutdown of this plant is scheduled for November 2009. The last general maintenance shutdown of our PVC plant in Alagoas was carried out in April 2007 and lasted for seven days. The next general maintenance shutdown of this plant is scheduled for October 2008. Our São Paulo PVC plant does not require prolonged maintenance shutdowns, resulting in shutdowns of two or three days each year for regular maintenance. Prior to 2007, our caustic soda and chlorine plant in Alagoas was generally shut down for 15 days of maintenance every two years. Beginning in 2007, our maintenance schedule at this plant has been altered so that we will now shut down this plant once a year for three days of maintenance in different parts of the plant. The last general maintenance shutdown of this plant was carried out in October 2006 and lasted for five days. Our caustic soda and chlorine plant in Camaçari does not require prolonged maintenance shutdowns and is shut down for two or three days each year.
Environmental Regulation
We are subject to Brazilian federal, state and local laws and regulations governing the discharge of effluents and emissions into the environment and the handling and disposal of industrial waste and otherwise relating to the protection of the environment.
Under federal and state environmental laws and regulations, we are required to obtain operating permits for our manufacturing facilities. State authorities in the State of Bahia issued operating permits for our plants in the
Northeastern Complex in 2000, which permits must bewere renewed in 2005 and every five years thereafter.for a six-year term. Our environmental operating permit obligates us to engage in systematic measures for the treatment of wastewater and hazardous solid waste. State authorities in the State of Rio Grande do Sul, where our Southern Complex plants are located, including Copesul’s plants and some of Ipiranga Petroquímica’s plants, regulate our operations by prescribing specific environmental standards in our operating permits, which must be renewed annually.every four years. Copesul’s operating permit was renewed in 2008 and the operating permits for our polyethelene and polypropylene plants were renewed on various dates in 2006 and 2007. State authorities in the States of Alagoas and São Paulo have issued permits for our plants in those respective complexes, which also must be renewed every four years. If any of our environmental licenses and permits lapse or are not renewed or if we fail to obtain any required environmental licenses and permits, we may be subject to fines ranging from R$50.0500 to R$50.0 million, and the Brazilian government may partially or totally suspend our activities and impose civil and criminal sanctions on our company or both. All our environmental licenses and permits are in full force and effect.
All projects for the installation and operation of industrial facilities in the Northeastern Complex are subject to approval by the Council for Environmental Protection of the State of Bahia. TheBahia or by the Environmental Resources Center, the State’s Environmental Protection Council’s technical office, depending on the Environmental Resources Center, conducts an analysiscomplexity of each project and enforces the State of Bahia’s laws on environmental protection.facility. The State’s Research and Development Center and other outside consultants act as technical advisors to the Environmental Resources Center. The State’s Environmental Protection Council must approve installed projects prior to their commencement of operations and must renew such approval every five years thereafter. In 2000,
All projects for the State’sinstallation, modification and operation of industrial facilities in the Southern Complex are subject to approval by the Rio Grande do Sul State Environmental Protection Council issued an authorizationFoundation. The Rio Grande do Sul State Environmental Protection Foundation must approve installed projects prior to their commencement of operations and must renew such approval every four years thereafter.
CETREL S.A.—Empresa de Proteção Ambiental, or Cetrel, treats wastewater generated by our company and the other petrochemical producers at the Northeastern Complex at a liquid effluents treatment station located in the Northeastern Complex. This treatment station also includes a system for the constructioncollection and disposal of new pipelines betweencontaminated wastewater. Cetrel also stores and incinerates, treats and disposes of hazardous solid waste. For other kinds of solid waste, Cetrel maintains a landfill. Cetrel has installed two hazardous solid waste incinerators with a total annual incineration capacity of 16,600 tons. One of these incinerators has an annual incineration capacity of 4,400 tons and is used to dispose of chlorinated residue, and the Portother incinerator has an annual incineration capacity of Aratú12,000 tons and is used to dispose of non-chlorinated residue. Another Brazilian company co-processes hazardous solid waste in a cement kiln located in the city of Pedro Leopoldo, State of Minas Gerais.
78
In January 1996, Cetrel obtained its BS 7750 environmental certification (British Standard) and in September 1996 became one of the first companies in the world to receive the ISO 14001 certification, an international standard for environmental control. In 1998, Cetrel obtained certification of its laboratory by the ISO Guide 25 standards system from the Brazilian Institute of Metrology and Industrial Quality.
Companhia Riograndense de Saneamento, or Corsan, a state-owned environmental company, operates an integrated system for liquid effluents treatment, or Sitel, in the Southern Complex. Sitel treats wastewater generated by our plantcompany and the other petrochemical producers at the Southern Complex at a liquid effluents treatment station located in the Southern Complex. This treatment station also includes a system for the transportationcollection and disposal of raw materials. This authorization required us to adopt measures to preventcontaminated wastewater. Corsan also operates a centralized system for solid waste control, or Sicecors, in the Souther Complex. Sicecors centralizes the collection, treatment and detect leaksfinal disposal of solid waste that is generated in the Southern Compex. Sicecors stores, treats and spillages.disposes of hazardous solid waste. For other kinds of solid waste, Sicecors maintains a landfill. Sitel and Sicecors received ISO 14001 certifications in 2001.
The Brazilian government enacted an Environmental Crimes Law in 1998 that imposes criminal penalties on corporations and individuals causing environmental damage. Corporations found to be polluting can be fined up to R$50.0 million, have their operations suspended, be prohibited from government contracting, be required to repair damage that they cause and lose certain tax benefits and incentives. Executive officers, directors and other individuals may be imprisoned for up to five years for environmental violations.
Cetrel treats wastewater generated by our company and the other petrochemical producers at the Northeastern Complex at a liquid effluents treatment station located in the Northeastern Complex. This treatment station also includes a system for the collection and disposal of wastewater contaminated with inorganic waste. Cetrel also stores and incinerates, treats and disposes of hazardous solid waste. For other kinds of solid waste, Cetrel maintains a landfill. In 1998, Cetrel installed a hazardous solid waste incinerator with an annual incineration capacity of 4,400 tons. Another Brazilian company co-processes hazardous solid waste in a cement kiln located in the city of Pedro Leopoldo, State of Minas Gerais.
In January 1996, Cetrel obtained its BS 7750 environmental certification (British Standard) and in September 1996 became one of the first companies in the world to receive the ISO 14001 certification, an international standard for environmental control. In 1998, Cetrel obtained certification of its laboratory by the ISO Guide 25 standards system from the Brazilian Institute of Metrology and Industrial Quality.
We believe our operations are in compliance in all material respects with applicable environmental laws and regulations currently in effect. From time to time,Some environmental studies that we have commissioned have indicated instances of environmental contamination and atmospheric emissions at certain of our plants. In addition, we and certain of our subsidiaries and executive officers of our company and of our subsidiaries have received notices from time to time of minor environmental violations and are or have been subject to investigations or legal proceedings with respect to certain alleged environmental violations. These environmental issues, and any future environmental issues that may arise, could subject us to fines or other civil or criminal penalties imposed by Brazilian authorities. We are addressing all environmental issues of which we are aware, and we believe that none of these issues will have a material adverse effect on our business, financial condition or operations.
Our consolidated annual expenditures on environmental control were R$58.192.7 million during 2004,in 2007, R$51.773.8 million during 2003in 2006 and R$40.171.7 million during 2002. We contract our jointly controlled company Cetrel, our
subsidiary Companhia Alagoas Industrial—Cinal and third parties toin 2005. To dispose of our industrial wastewater and solid hazardous waste.waste, we contract our jointly controlled company Cetrel at the Northeastern Complex, Corsan at the Southern Complex, our subsidiary Companhia Alagoas Industrial—Cinal at Alagoas, and other third parties. These companies treat our industrial waste immediately after this waste is generated and dispose of our solid waste in landfills.waste. Our consolidated environmental expenses relate to our continuous control and monitoring policies, and we do not have any material future environmental liabilities related to our ongoing operations. Accordingly, we
We have not established a provision for environmental contingencies.contingencies in the amount of R$18.4 million at December 31, 2007. However, our environmental compliance costs are likely to increase as a result of the projected increase in our production capacity and projected increases in unit costs for treatment and disposal of industrial waste as well as due to the cost of compliance with future environmental regulations.
Our environmental compliance in 20042007 included the following results:
In September 2002, we created a Health, Safety and Environment Committee, composed of leaders of each of our business units and other members of our management. This committee supports and monitors our environmental, health and safety efforts. In February 2003, our board of directors approved a comprehensive health, safety and environment policy, as we recognize that sustainable development and ethical practices are essential to our continued growth and performance. As part of this policy, we are committed to:
79
Safety and Quality Control
Safety
We have adopted a policy that makes all of our officers, directors and employees responsible for the safety of our workers and for preserving the environment.
We participate in the “Responsible Care” program, which establishes international standards for environmental, occupational health and safety practices for chemical manufacturers. Through our participation in this program, we adopted policies and procedures that require us to follow detailed instructions in matters of health, safety and the environment. We seek to maintain these environmental standards and have qualified each of our plants for NBR-ISO 9001 and 14001 certification, which includes internationally prescribed environmental management practices.
We are currently seeking OHSAS 18000 certification forimplementing health, safety and environmental healthstandards based on OSHAS 18001 and safety compliance for all of our plants.standards issued by the U.S. Occupational Safety and Health Administration.
Our safety record ranks above the average of companies in the Brazilian chemical industry. The following table illustrates our progress in terms of our safety record and compares our safety record to the average for the Brazilian chemical industry:
| Year Ended December 31, | ||||||||
| 2007 | 2006 | 2005 | 2006 (1) | |||||
| Braskem | Brazilian Chemical | |||||||
| Industry Average | ||||||||
| Safety Indicator | ||||||||
| Braskem: | ||||||||
| Index of Accident Frequency (accidents/200,000 man-hours) | 0.2 | 0.3 | 0.2 | 2.8 | ||||
| Index of Severity (lost and deducted days/200,000 man-hours) | 5 | 3 | 4 | 32 | ||||
| Copesul: | ||||||||
| Index of Accident Frequency (accidents/200,000 man-hours) | 2.0 | 2.46 | 2.28 | 2.8 | ||||
| Index of Severity (lost and deducted days/200,000 man-hours) | 23 | 41 | 27 | 32 | ||||
| Ipiranga Petroquímica: | ||||||||
| Index of Accident Frequency (accidents/200,000 man-hours) | 0.6 | 1.4 | — | 2.8 | ||||
| Index of Severity (lost and deducted days/200,000 man-hours) | 36 | 67 | — | 32 | ||||
| Year Ended December 31, | ||||||||
Safety Indicator | 2004 | 2003 | 2002 | 2003(1) | ||||
| Braskem | Brazilian Chemical Industry Average | |||||||
Index of Accident Frequency (accidents/200,000 man-hours) | 0.4 | 0.6 | 1.1 | 2.6 | ||||
Index of Severity (lost and deducted days/200,000 man-hours) | 11.0 | 5.0 | 17.0 | 39.4 | ||||
| (1) | Brazilian petrochemical industry average of the members of Brazilian Association of Chemical Industry and Derivative Products for |
80
Our safety record in 20042007 included the following results:
The Northeastern ComplexEach of our industrial plants is equipped with a comprehensive firefighting safety system. WaterAt the Northeastern Complex, water is available from a 200,000 cubic meter artificial lake, connected to the companies in the Northeastern Complexindustrial plants by a pumping station and a distribution network and built according to international safety standards. We and the other companies in the Northeastern Complex maintain emergency equipment and trained safety crews. The safety plan for the Northeastern Complex provides for firefighting brigades of all companies in the complex to jointly assist in the event of any major accidents. The Northeastern Complex has safety standards for construction density and the design of pipelines and highways.
Similar systems are employed at the Southern Complex, our plant in the State of Alagoas and our plant in the State of São Paulo (except with respect to safety standards for construction density and design of pipelines and highways, as we do not have such facilities in São Paulo).
Each of the nine companies that operate in the Southern Complex relies on its own supply of water from nearby lakes and water tanks for firefighting capabilities. Copesul relies on a 7,400 cubic meter artificial pond, with an additional 12,600 cubic meter pond available in case of emergencies. Both water sources are connected to Copesul’s facilities by a pumping station and a distribution network, which currently employs seven water pumps, built according to international safety standards. Copesul also maintains emergency equipment and trained safety crews. In addition, Copesul’s safety plan provides for firefighting brigades consisting of six technicians and 14 operational and maintenance technicians per shift. Copesul and the other companies located in the Southern Complex are supported by the Southern Complex’s Mutual Plan of Emergency (Plano de Auxílio Mútuo do Pólo). Copesul’s commitment to safety includes the operation of a training center for its safety crews that simulates emergencies typical to the petrochemical industry. Similar systems are employed at the facilities of Ipiranga Petroquímica and our Polyolefins Unit in the Southern Complex.
We have obtained OSHAS 18001 certification of our Basic Petrochemical Unit and Copesul. This certification relates to our employee health and safety management system.
Quality Control
Our quality control management uses the following international norms and regulations as its base:
as its base. We have instituted systematic improvement processes in our operational areas, focusing on integrating production, maintenance, inventory management, customer satisfaction and profitability.
ISO Certifications
We have obtained ISO 9001 certifications for all of our products. We have also has obtained ISO 14001 certifications for all of our products.
industrial plants. These certifications take into account both the quality of our products and the quality of our operating procedures. We have obtained ISO 14001 certifications for all 13
81
Table of our plants in respect of our environmental management systems.Contents
Property, Plant and Equipment
Our properties consist primarily of petrochemical production facilities in Camaçari in the State of Bahia, in Maceió in the State of Alagoas, in Triunfo in the State of Rio Grande do Sul, in Maceió in the State of Alagoas and in São Paulo in the State of São Paulo. Our principal executive offices are located in São Paulo in the State of São Paulo, and we have an administrative support office in the City of Rio de Janeiro. We also have equity interests in investments located in other parts of the country. We own all our production facilities, but we generally rent our administrative offices.
The following table sets forth our properties and the properties of our principal subsidiaryat December 31, 2007 by location of facilities, products produced and size of plant.
Product or Service |
Facilities |
Plant | ||||
| (in | ||||||
| ||||||
| Basic petrochemicals | Camaçari | |||||
| Triunfo | |||||
| ||||||
| ||||||
| ||||||
| ||||||
| Marechal Deodoro | |||||
| Camaçari | 24.5 | ||||
| Caustic soda/EDC/chlorine | Maceió | 15.0 | ||||
| PVC/caustic soda/chlorine | Camaçari | 12.6 | ||||
| Polyethylene | Triunfo | 30.5 | ||||
| Polypropylene | Triunfo | 10.0 | ||||
| Caprolactam | Camaçari | 8.1 | ||||
| PVC | Marechal Deodoro | 7.0 | ||||
| PET(2) | Camaçari | 6.2 | ||||
| PVC | Vila Prudente/Capuava | |||||
| ||||||
| ||||||
| (1) | One hectare equals 10,000 square meters. |
| (2) | On May 16, 2007, we temporarily closed our PET plant. |
The descriptions of each of our business units above contain detailed charts showing the location, primary products, annual production capacity and historical annual production for each of our company’s production facilities.
We believe that all of our production facilities are in good operating condition. At December 31, 2004,2007, the consolidated net book value of our property, plant and equipment was R$5,397.28,404.1 million. Without giving effect to the proportional consolidation of our jointly controlled companies, the net book value of our property, plant and equipment was R$4,967.98,002.8 million.
Certain of our properties located in the Northeastern Complex (including our DMT and PET plantsplant and all of the equipment located in these plants)this plant) and two of our polyolefins plants in the Southern Complex are mortgaged or pledged to secure certain of our financial transactions.
Insurance
We carryBraskem carries insurance for ourits plants against material damagesdamage and consequent business interruption through “all risks” policies with a total replacement value of US$4.26.1 billion. Our insurance coverage is underwritten in the Brazilian insurance market by large Brazilian insurance companies. Approximately 89%83% of our insurance coverage is reinsured in the Londoninternational insurance market. Our existing “all risks” policies are in force until November 30, 20052008 and are renewed annually.
The material damagesdamage insurance provides insurance coverage for losses due to material damages likeaccidents resulting from fire, explosion and machinery breakdown.breakdown, among others. This coverage has a maximum indemnification limit of US$1.9 billion per event (combined material damagesdamage and business interruption coverage) and has deductibles of up to US$5.05 million depending on the plant. The business interruption coverage provides insurance for interruptionslosses resulting from shutdownsinterruptions due to any material damage covered by the policy. This coverage is calculated to insure against losses up to US$681.0956.9 million due to shutdowns extending beyond 60 days. The losses are covered until the plant and production are fully re-established, with maximum indemnity periods ranging from 12 to 24 months.
82
Copesul carries insurance with the same terms and conditions as Braskem with a total replacement value of US$2.3 billion, a maximum indemnification limit of US$1.6 billion per event (combined material damage and business interruption coverage) and a deductible of up to US$10 million. The business interruption coverage contracted by Copesul insures against losses of up to US$ 490.7 million for an indemnity period of 24 months.
Ipiranga Petroquímica carries property damage insurance to cover its plants and business interruptions with a total replacement value of US$509.2 million, a maximum indemnification limit of US$500 million per event (combined material damage and business interruption coverage), and a deductible of US$750,000. The business interruption coverage contracted by Ipiranga Petroquímica insures against losses of up to US$204 million for an indemnity period of 18 months.
We also have a third partythird-party liability policy, which covers losses for damages caused to third parties from our operations, including sudden environmental pollution, up to a limit of US$60.060 million per loss or occurrence.occurrence in the case of Braskem, US$35 million in the case of Copesul and R$50 million in the case of Ipiranga Petroquímica.
In addition to these policies, we maintain other insurance policies for specific risks, including directors and officers liability coverage, marine and transporttransportation insurance, vehiclesautomotive insurance and other kinds of coverages that are not covered by our “all risks” policies.
We do not anticipate having any difficulties in renewing any of our insurance policies and believe that our insurance coverage is reasonable in amount and consistent with industry standards applicable to chemical companies operating in Brazil.
Antitrust Matters
Under Brazilian Law No. 8,884/94, any transaction that results in a concentration of market share equal to or greater than 20.0% of any relevant market or that involves any company or group of companies with annual gross sales of R$400.0 million or more must be submitted to and approved by the Brazilian antitrust authorities, which consist of three entities:
CADE is the antitrust authority responsible for reviewing and authorizing transactions that may lead to economic concentration. SEAE and SDE analyze the economic and legal implications of mergers and acquisitions under Brazilian antitrust law. As part of the antitrust review process, SDE, SEAE, the attorney general of CADE and the Brazilian federal public prosecutor each render preliminary opinions, which are delivered to the members of CADE. The members of CADE then render a final decision.
As part of our corporate reorganization process that began in 2001, we merged with each of OPP Química, Trikem, Proppet and Nitrocarbono and we acquired Polialden as described in “—History and Development of Our Company.” We closed these transactions, as permitted by Brazilian law,The Ipiranga Transaction is subject to the final approval of the Brazilian antitrust authorities. We submittedHowever, Brazilian law permits us to consummate these transactions prior to receiving this final approval, unless CADE issues a writ of prevention blocking a transaction or requires the acquisitionparties to enter into an agreement permitting the effects of the petrochemical assetstransaction to be reversed which, by its terms, delays the consummation of Banco Econômicothe transaction. Our company, together with Ultrapar and Petrobras, submitted the terms and conditions of the Ipiranga Transaction for review by the Brazilian antitrust authorities in April 2007.
In April 2007, CADE issued a writ of prevention relating to the Ipiranga Transaction, which, among other things, prevented our corporate reorganization transactionsexercise of strategic management control over Ipiranga Química and Ipiranga Petroquímica. In issuing the writ of prevention, CADE stated that the purpose of the writ of prevention was to guarantee that the Ipiranga Transaction could be reversed in the event that CADE so determined following its review of the Ipiranga Transaction. In April 2007, CADE revoked this writ of prevention upon the agreement of our company to execute the Reversibility Agreement designed to preserve the reversibility of the Ipiranga Transaction. Under the Reversibility Agreement, we agreed to preserve all of the assets acquired in the Ipiranga Transaction until CADE makes a final determination with respect to the Ipiranga Transaction, and we are permitted to effectively own and manage these assets pending this final determination.
83
Although the terms and conditions of the Ipiranga Transaction were submitted to the Brazilian antitrust authorities in four separate filings reflecting the separate markets affected by the Ipiranga Transaction, on September 18, 2001. We supplemented our submission to19, 2007, CADE decided that the antitrust authorities after September 2001 in order to update these authoritiesfour fillings should be analyzed and submitted for approval together.
SEAE issued a favorable opinion with respect to among other transactions,the Ipiranga Transaction in February 2008. Approval of this transaction by CADE remains pending.
Although we believe that the Petrobras Transaction is not subject to the final approval of the Brazilian antitrust authorities, because the Petrobras Transaction is a follow-on transaction to the Ipiranga Transaction and does not involve any change of control of our mergerscompany or Petrobras, we and Petrobras submitted the terms and conditions of the Petrobras Transaction to the Brazilian antitrust authorities in December 2007.
The SEAE and the SDE issued favorable opinions with OPP Produtos and 52114 Participações, Nitrocarbono and Trikem. Theserespect to the Petrobras Transaction in April 2008. Approval of this transaction by CADE remains pending.
There can be no assurances that the Brazilian antitrust authorities will determine whether any ofapprove the transactions inIpiranga Transaction as currently structured, agree with our corporate reorganization process adversely impact competitive conditions in the Brazilian markets in which we compete or whether they would negatively affect consumers in these markets.
Favorable non-binding opinions recommending the unconditional approval of our acquisition of Nova Camaçari and the subsequent steps in our reorganization, including our mergers with OPP Produtos, 52114 Participações, Nitrocarbono and Trikem, were issued by the SEAE in July 2002 and the SDE in May 2003. In November 2003, the attorney general of CADE issued an opinion recommending further analysis of the impact of the transactions in the polyethylene and polypropylene markets in Mercosul, even though the SDE conducted its analysis of the impact of the transactionsPetrobras Transaction, or that these authorities will not impose additional conditions on these two products in the narrower Brazilian market and issued a favorable opinion. In February and June 2004, the Brazilian federal prosecutor issued opinions recommending approval of these transactions without restrictions. CADE is still reviewing these transactions and may disagree with those opinions and may impose conditions on our company. However, due to conflicts of interest that disqualify two of the seven members of CADE from participating in the consideration of our corporate reorganization process and a vacancy at CADE in respect of which President Lula has not yet made an appointment, CADE does not currently have the necessary quorum (five members) to approve our corporate reorganization. In addition, we filed a petition with CADE in September 2004 requesting the automatic approval of our corporate reorganization as the 60-day period within which CADE is legally required to render a final decision had expired. The attorney general of CADE filed a response in opposition to our petition. CADE will adjudicate the merits of our petition, which remains pending. If CADE rejects our petition and renders a final decision in respect of our corporate reorganization, any adverse decision by CADE in respect of our corporate reorganization could result in a material adverse effect on our results of operations, financial condition and prospects.
ITEM 4A. UNRESOLVED STAFF COMMENTS.
ITEM 5. OPERATING AND FINANCIAL REVIEW AND PROSPECTS
The following discussion of our financial condition and results of operations should be read in conjunction with our audited consolidated and combined financial statements at December 31, 20042007 and 20032006 and for the three years ended December 31, 20042007 included in this annual report, as well as with the information presented under “Introduction” and “Item 3. Key Information—Selected Financial Information.”
The following discussion contains forward-looking statements that involve risks and uncertainties. Our actual results may differ materially from those discussed in the forward-looking statements as a result of various factors, including those set forth in “Cautionary Statement with respectRespect to Forward-Looking Statements,” those set forth inStatements” and “Item 3. Key Information—Risk Factors” and the matters set forth in this annual report generally.Factors.”
The discussion and analysis of our financial condition and results of operations has been organized to present the following:
84
Overview
We are the leading petrochemical company in Latin America, based on average annual production capacity.capacity in 2007. We are also one of the threethird largest Brazilian-owned private sector industrial companies,company, based on net sales revenue.revenue in 2006 (the most recent year for which comparative information is currently available). We recorded net income of R$690.9 million in 2004 on net sales revenue of R$12,192.0 million.17,679.4 million and net income of R$547.6 million in 2007. We produce a diversified portfolio of petrochemical products in our 19 plants in Brazil and have a strategic focus on polyethylene, polypropylene and PVC. We havewere the first Brazilian company with integrated first and second generation petrochemical production facilities, with 13 plants in Brazil.facilities.
Our results of operations have been significantly influenced by (1) beginning in the second quarter of 2007, the effects of the Ipiranga Transaction and our consolidation of the assets, liabilities and results of operations of Ipiranga Química, Ipiranga Petroquímica and Copesul as from April 1, 2007, and (2) to a lesser extent, beginning in the second quarter of 2006, the effect of the Politeno Acquisition on April 6, 2006 and our full consolidation of the assets, liabilities and results of operations of Politeno and the inclusion of Politeno’s results in our Polyolefins segment as from April 1, 2006. In addition, our results of operations for the years ended December 31, 2007, 2006 and 2005 have been influenced, and our results of operations will continue to be influenced, by a variety of factors, including:
85
Our financial condition and liquidity is influenced by a variety of factors, including:
Financial Presentation and Accounting Policies
Presentation of Financial Statements
We have prepared our consolidated and combined financial statements at December 31, 20042007 and 20032006 and for the three years ended December 31, 20042007 in accordance with Brazilian GAAP, which differs in significantcertain respects from U.S. GAAP. See note 29 to our audited consolidated and combined financial statements included elsewhere in this annual report for an explanation of these differences. The financial information contained in this annual report is in accordance with Brazilian GAAP, except as otherwise noted.
Since July 25, 2001, our company has grown substantially through acquisitions and mergers, principally the acquisition of Nova Camaçari Participações S.A., or Nova Camaçari, and our mergers with OPP Produtos and 52114 Participações. See “Item 4. Information on Our Company—History and Development of Our Company.” Prior to our mergers with OPP Produtos and 52114 Participações, Odebrecht, a member of the Odebrecht Group, owned all of the voting share capital of OPP Produtos, and Pronor, a member of the Mariani Group, owned all of the voting share capital of 52114 Participações.
We accounted for our merger with 52114 Participações at the date of the merger. However, as a result of the common control exercised by the Odebrecht Group over our company and OPP Produtos prior to the merger of OPP Produtos, we accounted for the merger of OPP Produtos as if this acquisition had occurred on July 25, 2001, the date we acquired Nova Camaçari and the date on which such common control commenced. As a result our consolidated statement of operations and cash flow accounts for the year ended December 31, 2002 reflect the operations and cash flows of Nova Camaçari and OPP Produtos and their subsidiaries for that year and the operations and cash flows of 52114 Participações and its subsidiaries for the period beginning on August 16, 2002.
Our consolidated and combined financial statements have been prepared in accordance with Brazilian Securities Commission Instruction No. 247/96, as amended by Brazilian Securities Commission Instruction Nos. 269/97, 285/98 and 319/99, which we refer to collectively as Instruction 247. Instruction 247 requires our company to proportionally consolidate jointly controlled companies that are not our subsidiaries, principally Copesul and Politeno.subsidiaries.
Our results of operations for 2002 and 2003 are not fully comparable because our results of operations for 2002 includePrior to March 31, 2006, we proportionally consolidated the results of Nitrocarbono onlyPoliteno in our consolidated financial statements. As a result of the Politeno Acquisition described under “Item 4. Information On The Company—History and Development of our Company,” we have fully consolidated Politeno’s results in our consolidated financial statements and included Politeno’s results in our Polyolefins segment as from April 1, 2006.
Prior to March 31, 2007, including for the period after August 16, 2002, and our resultsfirst three months of operations for 2003 include2007, we proportionally consolidated the results of Nitrocarbono for the full year. However, becauseCopesul in our consolidated financial statements. As a result of the sizeIpiranga Transaction, we have fully consolidated Copesul’s results in our consolidated financial statements and included Copesul’s results as a separate segment as from April 1, 2007.
Prior to November 30, 2007, we proportionally consolidated the results of Petroflex in our consolidated financial statements. As a result of our Business Development Unit relativeentering into an agreement in December 2007 to sell our company,interests in Petroflex, we do not believe that this lackaccounted for our interest in Petroflex in our Brazilian GAAP financial statements using the equity method as from December 1, 2007.
86
Table of full comparability is material.Contents
Reclassifications
Our consolidated financial statements included in this annual report reflect reclassifications in 2005 of some items to provide for a better comparison among 2006 and 2005. For more information about these reclassifications, see “Introduction—Financial Statements.”
Business Segments and Presentation of Segment Financial Data
In 2002, weWe have implemented an organizational structure that we believe reflects our business activities and corresponds to our principal products and production processes. We now have seven business units and report our results by four marketseven corresponding segments to reflect this organizational structure:
|
In 2004, sales by our Basic Petrochemicals Unit, our Polyolefins Unit, our Vinyls Unitcompany.
We report businesscompany. This segment data in our audited consolidated and combined financial statements included elsewhere in this annual report in accordance with Statement of Financial Accounting Standards (SFAS) No. 131, “Disclosures about Segments of an Enterprise and Related Information.” SFAS No. 131 requires that business segment data be presented on the basisbegan reporting as from April 1, 2007 as a result of the internal information that is usedIpiranga Transaction.
We evaluate and manage business segment performance based on information generated from our statutory accounting records, which are maintained in accordance with Brazilian GAAP, and, accordingly, the segment data included in our consolidated and combined financial statementsthis annual report is presented under Brazilian GAAP. We have included a reconciliation of the operating results of our segments to our consolidated results under “—Results of Operations” below.
In June 2008, we began the implementation of a new organizational structure under which we will have four business units and report our results by four corresponding segments to reflect this organizational structure:
87
Critical Accounting Policies
The presentation of our financial condition and results of operations in conformity with Brazilian GAAP requires us to make certain judgments and estimates regarding the effects of matters that are inherently uncertain and that impact the carrying value of our assets and liabilities. Actual results could differ from thosethese estimates. In order to provide an understanding about how we form our judgments and estimates about certain future events, including the variables and assumptions underlying the estimates, and the sensitivity of those judgments to different variables and conditions, we have included comments related to the following critical accounting policies under Brazilian GAAP:
88
|
|
|
Principal Factors Affecting Our Results of Operations
Nova Camaçari Acquisition and Mergers with OPP Produtos and 52114 Participações
Before July 25, 2001 (the date of our acquisition of Nova Camaçari), our operations consisted principallyEffects of the operationsIpiranga Transaction
On March 18, 2007, we entered into the Ipiranga Investment Agreement with Ultrapar and Petrobras. On the same date, Ultrapar and the controlling shareholders of RPI, CBPI and DPPI entered into the Purchase Agreement, with our Basic Petrochemicals Unit.
company and Petrobras as intervening parties. As a result of our acquisitionthe Ipiranga Transaction:
Upon the final completion of the fourth phase of the Ipiranga Transaction, we will own shares of RPI representing 33.3% of total share capital and voting share capital of RPI.
On August 16, 2002, we merged with OPP Produtos and 52114 Participações. As a result of these mergers:
As a result of these mergers, our net sales revenue, gross profit and operating income have increased significantly. Because we and OPP Produtos have been under common control since July 25, 2001 (the date of our acquisition of Nova Camaçari), the results of OPP Química and Trikem have been included in our results of operations andfully consolidated the results of Copesul and its subsidiaries and consolidated the results of Ipiranga Química and its subsidiaries, including Ipiranga Petroquímica, into our financial statements as from April 1, 2007. We have been proportionally consolidatedaccounted for each of Copesul, Ipiranga Química and Ipiranga Petroquímica as separate segments in our financial statements as from the same date. In addition, we have accounted for our interest in the results since that date.of RPI under the equity method in our financial statements as from April 1, 2007.
In 2004, we successfully concluded the integrationThe total purchase price to our company of the companies acquired on and after July 25, 2001, achieving cost reductions in excessshares of R$300 million on an annual recurring basis as compared to costs that would have been incurred by our company and the companiesIpiranga Química that we have acquired as estimated by our management. These cost reductions have been achieved primarily inand the areasshares of tax, logistics, operations and information technology, and personnel. We cannot assure youRPI that we will continue to realizeacquire from Ultrapar in the full benefitIpiranga Transaction was R$1,489.1 million. In addition, we paid R$1,418.5 million for the Copesul shares not owned by our company, Ipiranga Petroquímica, Petroquisa or Triunfo and R$117.9 million for the shares of any identified annual cost savings in upcoming years. ToIpiranga Petroquímica not owned by Ipiranga Química.
89
We financed the extent that we fail to do so, for any reason, in any year,Ipiranga Transaction through borrowings of US$1,200.0 million under our results of operations for that year may be adversely affected.Acquisition Credit Agreement, US$312.5 million under an export prepayment agreement with PIFCo and US$61.0 million under two short-term financing transactions.
For additional information regarding the Ipiranga Transaction, see “Item 4. Information on the Company—Ipiranga Transaction.”
Growth of Brazil’s Gross Domestic Product and Domestic Demand for Our Products
Sales in Brazil represented 80.9%76.2% of our net sales revenue in 2004.2007. As a Brazilian company with substantially all of our operations in Brazil, we are significantly affected by economic conditions in Brazil. Our results of operations and financial condition have been, and will continue to be, affected by the growth rate of GDP in Brazil because our products are used in the manufacture of a wide range of consumer and industrial products.
Because of our significant market share in many of the Brazilian markets in which our petrochemical products are sold, fluctuations in Brazilian demand for polyethylene, polypropylene and PVC affect our production levels and net sales revenue. GDP in Brazil grew at aan estimated compound average annual rate of 5.2%2.8% from 19941998 through 2004.2007. From 19951998 through 2004,2007, the consumption volumes in Brazil of polyethylene, polypropylene and PVC increased at compound average annual rates of 7.8%4.4%, 9.5%7.9% and 4.0%3.3%, respectively.
In 2002,2005, GDP in Brazil increased by 1.9%2.3% . In 2002, Brazilian consumption volumes of polyethylene, polypropylene and PVC increased by 0.2%, 11.3% and 11.0%, respectively, compared to depressed 2001 levels, principally as a result of increased production of third generation products following the termination of the Brazilian government’s electric power rationing program in February 2002.
In 2003, GDP in Brazil declined by 0.2%. In 2003,2005, Brazilian consumption volumes of polyethylene decreased by 2.1%1.7%, polypropylene increased by 2.9% and PVC decreasedincreased by 12.4%2.4%, respectively, compared to 2002. The decreased consumption volumes of polyethylene and PVC were primarily a result of reduced economic activity.2004.
In 2004,2006, GDP in Brazil increased by 5.2%, the highest annual growth rate since 1994.3.7% . In 2004,2006, Brazilian consumption volumes of polyethylene increased by 13.9%11.4%, polypropylene increased by 11%4.6% and PVC increased by 11.7%10.5% compared to 2005.
In 2007, GDP in Brazil increased by 5.4% . In 2007, Brazilian consumption volumes of polyethylene increased by 7.1%, polypropylene increased by 10.3% and PVC increased by 14.5%, respectively, compared to 2003. The increased consumption volumes of these thermoplastics resulted primarily from the recovery of economic activity in Brazil.2006.
Brazilian GDP growth has fluctuated significantly, and we anticipate that it will likely continue to do so. Our management believes that economic growth in Brazil should positively affect our future net sales revenue and results of operations. However, continued low growth or a recession in Brazil would likely reduce our future net sales revenue and have a negative impactseffect on our results of operations.
Our management believes that there has been a trend in Brazil during the last several years toward the substitutionuse of plastics as substitutes for more traditional materials, such as steel, aluminum, glass and paper. Our management anticipates that this trend will continue to stimulate the domestic demand for petrochemical products suitable for use in a variety of applications, including construction, industrial processes, agriculture and packaging. However, trends in the substitution of materials depend on many factors beyond our control, and the current beliefs of our management may prove to be incorrect.
Cyclicality Affecting the Petrochemical Industry
Global consumption of petrochemical products has increased significantly over the past 30 years. Due to this growth in consumption, producers have experienced periods of insufficient capacity for these products. Periods of insufficient capacity, including some due to raw material shortages, have usually resulted in increased capacity utilization rates and international market prices for our products, leading to increased operating margins. These periods have often been followed by periods of capacity additions, which have resulted in declining capacity utilization rates and international selling prices, leading to declining operating margins.
We expect that these cyclical trends in international selling prices and operating margins relating to global capacity shortfalls and additions will likely persist in the future, principally due to the continuing impact of four general factors:
90
Rio Polímeros, a Brazilian petrochemical company, commenced operations of a major petrochemical plant in Brazil in 2005. The maximum annual capacity of this plant is 520,000 tons of ethylene, 75,000 tons of propylene and 540,000 tons of polyethylene. In addition:
Based on historical growth of Brazilian domestic demand for polyethylene, polypropylene and PVC, we believe that this additional capacity, other than the capacity of the Paulínia plant, had been absorbed by the domestic market by the end of 2007. We cannot assure you, however, that the propylene production capacity of the Paulínia plant will be fully absorbed by the domestic market or that satisfactory export opportunities will be available for products not sold domestically. In the event that this additional production is not absorbed domestically or sold in export markets, there may be resulting pressure on prices for the affected products, which could adversely affect our net sales revenues, gross margins and overall results of operations.
Effects of Fluctuations in Naphtha Prices
Fluctuations in the international market price of naphtha have significant effects on our costs of goods sold and the prices that we are able to charge our customers for our first and second generation products.
Effects on Cost of Sales
Naphtha is the principal raw material used by our Basic Petrochemicals Unit and Copesul and, indirectly, in our other business units. Purchases of naphtha represented 82.4%83.1% of the total cost of sales and services rendered of our Basic Petrochemicals Unit and 88.9% of the total cost of sales and services rendered of Copesul in 2004.2007. Naphtha represented 67.7%76.3% of our direct and indirect consolidated cost of sales and services rendered in 2004,2007, both directly and indirectly through the cost of basic petrochemicals that we purchased from Copesul.Copesul during the first quarter of 2007.
The cost of naphtha varies in accordance with international market prices, which fluctuate depending upon the supply and demand for oil and other refined petroleum products. We purchase naphtha under a long-term supply contractcontracts with Petrobras, and we import naphtha through our terminal at Aratú. in the State of Bahia and Petrobras’ terminal at Osório in the State of Rio Grande do Sul. The prices that we pay for naphtha under all of these arrangements are based on the Amsterdam-Rotterdam-Antwerp market price. As a result, fluctuations in the Amsterdam-Rotterdam-Antwerp market price for naphtha have a direct impact on the cost of our first generation products.
91
Because the primary raw materials of our Polyolefins, Ipiranga Petroquímica and Vinyls Units, principally ethylene and propylene, are first generation products produced by our Basic Petrochemicals Unit and Copesul, fluctuations in the Amsterdam-Rotterdam-Antwerp market price for naphtha result in similar fluctuations in the cost of the primary raw materials of these units.
The international price of naphtha has fluctuated significantly in the past, and we expect that it will continue to do so in the future. Significant increases in the price of naphtha and, consequently, the cost of producing our products, would likely reduce our gross margins and our results of operations to the extent that we are unable to pass all of these increased costs on to our customers and could result in reduced sales volumes of our products. Conversely, significant decreases in the price of naphtha and, consequently, the cost of producing our products, would likely increase our gross margins and our results of operations and could result in increased sales volumes if this lower cost leads us to lower our prices. In periods of high volatility in the U.S. dollar price of naphtha, there is usually a lag between the time that the U.S. dollar price increases or decreases and the time that we are able to pass on increased or reduced costs to our customers in Brazil. These pricing mismatches decrease when the U.S. dollar price of naphtha is less volatile.
We do not currently hedge our exposure to changes in the prices of naphtha because a portion of our sales are exports payable in foreign currencies and linked to the international market prices of naphtha and also because the prices of our polyethylene, polypropylene and PVC products sold in Brazil generally reflect changes in the international market prices of these products.
Effects on Prices of Our Products
The price of ethylene that we chargePrior to 2005, our two largest customers, which represented 89.0% of our ethylene sales to third parties in 2004, is based onBasic Petrochemicals Unit used a margin sharing system described in “Item 4. Information on Our Company—Basic Petrochemicals Unit—Sales and Marketing of Our Basic Petrochemicals Unit.” These prices reflect both the international market prices for naphtha and the international and domestic prices for second generation products. Prior to 2005, we used a formula similar to the formula still in use for our two largest ethylene customers for all of our ethylene customers, including our other business units. Currently,In 2005, we determinedetermined the prices that we chargecharged our other ethylene customers, includingother than our other business units,two largest ethylene customers, by reference to international market prices. In addition,2006, we are negotiatingnegotiated with our two largestremaining ethylene customers that used the margin sharing system to terminate the margin sharing system of ethylene pricing and to institute a market pricing system.
The prices that we charge some of our customers for propylene are based on our ethylene prices and the ratio of the European contract price for propylene to the European contract price for ethylene. Over the past several years, this ratio has increased. For the remainder of our customers, our prices for propylene are based on the European contract price and prevailing prices set by U.S. Gulf producers. We are applying this market pricing methodology to a growing number of our customers. The prices that we charge for butadiene and para-xylene are based on the United States contract price for these products. The prices that we charge for benzene and ortho-xylene are based on the contract prices for these products in the United States and Europe. Because European producers of basic petrochemical products primarily use naphtha as a raw material, changes in the European contract prices are strongly influenced by fluctuations in international market prices for naphtha. As our cost structures are similar to the cost structures of European producers, to the extent that our prices are based on the European contract prices for our products, the prices that we charge for these products are significantly influenced by international market prices for naphtha.
We negotiate therealprices for certain of our products, principally polyethylene, polypropylene and PVC, on a monthly basis with our domestic customers. We attempt to revise our prices to reflect changes in the international market prices of these products and the appreciation or depreciation of therealagainst the U.S. dollar. However, during periods of high volatility in international market prices or exchange rates, we are sometimes unable to reflect these changes fully in our prices quickly.
The international market prices of our petrochemical products have fluctuated significantly, and we believe that they will continue to do so. Significant increases in the international market prices of our petrochemical products and, consequently, the prices that we are able to charge, would likely increase our net sales revenue and our results of operations to the extent that we are able to maintain our operating margins and increased prices do not reduce sales volumes of our products. Conversely, significant decreases in the international prices of our petrochemical products, and, consequently, the prices that we are able to charge, would likely reduce our net sales revenue and our results of operations if we are unable to increase our operating margins or these reduced prices do not result in increased sales volumes of our products.
92
Cyclicality Affecting the Petrochemical Industry and Capacity Utilization
Capacity Expansions
Global consumption of petrochemical products has increased significantly over the past 30 years. Due to this growth in consumption, producers have experienced periods of insufficient capacity for these products. Periods of insufficient capacity, including some due to raw material shortages, have usually resulted in increased capacity utilization rates and international market prices for our products, leading to increased operating margins. These periods have often been followed by periods of capacity additions, which have resulted in declining capacity utilization rates and international selling prices, leading to declining operating margins.
We expect that these cyclical trends in international selling prices and operating margins relating to global capacity shortfalls and additions will likely persist in the future, principally due to the continuing impact of four general factors:
Rio Polímeros, a Brazilian petrochemical company, has constructed a petrochemical plant in Brazil that commenced operations on June 23, 2005. The announced annual capacity of this plant is 520,000 tons of ethylene, 75,000 tons of propylene and 540,000 tons of polyethylene, representing an increase of approximately 35% of the current total Brazilian production capacity of polyethylene. In addition, Solvay has announced that it will expand its annual PVC production capacity by 35,000 tons commencing in the second half of 2005. In 2004, Polibrasil commenced operation of polypropylene facility in Mauá, São Paulo with an annual capacity of 300,000 tons. In 2004, we increased our annual production capacity of polypropylene by 100,000 tons and our annual production capacity of para-xylene by 50,000 tons. We are currently undertaking an efficiency enhancement project that we expect will increase our annual production capacity of PVC by 50,000 tons by the end of 2005.
Based on historical growth of Brazilian domestic demand for polyethylene, polypropylene and PVC, we believe that this additional capacity will be absorbed by the domestic market over the next several years. Although there may be a short period of overcapacity in the domestic market for several of our petrochemical products following Rio Polímeros’ commencement of operations, we believe that export opportunities will be available for the sale of these products not sold domestically. We cannot assure you, however, that the additional capacity will be so absorbed by the domestic market or that satisfactory export opportunities will be available for products not sold domestically. In the latter event, the additional capacity may result in pressure on prices for the affected products, which could adversely affect our net sales revenues, gross margins and overall results of operations.
Capacity Utilization
Our operations are capital intensive. Accordingly, to obtain lower unit production costs and maintain adequate operating margins, we seek to maintain a high capacity utilization rate at all of our production facilities.
The table below sets forth capacity utilization rates with respect to the production facilities for some of our principal products for the years ended December 31, 2004, 20032007, 2006 and 2002.2005.
| Year Ended December 31, | ||||||
| 2007 | 2006 | 2005 | ||||
| Ethylene | 94%(1) | 87% | 91% | |||
| Polyethylene | 91(2) | 89(3) | 94(4) | |||
| Polypropylene | 97(2) | 97 | 94 | |||
| PVC | 91 | 86 | 95(5) | |||
| Year Ended December 31, | |||||||||
| 2004 | 2003 | 2002(1) | |||||||
Ethylene(2) | 87 | % | 84 | % | 83 | % | |||
Polyethylene | 91 | 83 | 80 | ||||||
Polypropylene(3) | 96 | 95 | 90 | ||||||
PVC | 90 | 85 | 86 | ||||||
| (1) |
| (2) |
| (3) | Without giving effect to |
| (4) | Without giving effect to a 30,000 ton increase of |
| (5) | Without giving effect to a 50,000 ton increase of our annual production capacity in December 2005. |
The utilization rate of our ethylene production capacity was adversely affected:
13 days.
Effect of Export Levels on ourOur Financial Performance
We generally obtain higher prices in Brazil for our products than the prevailing international prices. The difference in prices between the Brazilian and export markets results from:
In addition, we are generally able to charge higher prices for our products than therealprice of imports because we are able to provide better product customization services to our customers than sellers of imported products.
During periods in which the domestic demand for our products is reduced, we actively pursue export opportunities for our products in order to maintain capacity utilization rates. During periods of increased domestic demand for our products, our export sales volumes may decline as we increase domestic sales of our products.
In 2004, 19.1%2007, 23.8% of our net sales revenue was derived from export sales of our products as compared with 25.8%25.6% of our net sales revenue in 2003.2006. Net sales revenues derived from export sales decreasedincreased by 9.3%26.6% in 2004, despite increases2007 as a result of the implementation of our strategy to increase our presence in exportforeign markets, which has led to the establishment of sales volumeoffices in Argentina and The Netherlands, enabling us to provide our Basic Petrochemicals Unitinternational costumers with better service through our staff and our Vinyls Unit.local distribution centers.
93
In 2004,2007, exports to other countries in the Americas accounted for 65.0%68.4% of our export sales, with the remainder of our exports sold in Europe, which accounted for 22.0%26.7% of our export sales, and the Far East, which accounted for 13.0%4.9% of our export sales. Aggregate exports of polyethylene, polypropylene and PVC to Argentina increased by 28%22.8% in 2004,2007, reflecting improvements in the Argentine economy.
Our ability to export to other South American countries is a function of the level of economic growth in these countries and other economic conditions, including prevailing inflation rates. We believe that significant growth in the global economy would likely lead to increased global demand and international market prices for our products, and consequently increased domestic prices for our products. In addition, increased global demand for our products would enhance our ability to export our products in the event that the Brazilian economy does not similarly expand. Conversely, slow or negative growth of the global economy would have the opposite effects on our company.
Effects of Fluctuations in Exchange Rates between the Real and the U.S. Dollar
Our results of operations and financial condition have been, and will continue to be, affected by the rate of depreciation or appreciation of therealagainst the U.S. dollar because:
Virtually all of our sales are of petrochemical products for which generally trade freely in thethere are international markets atmarket prices expressed in U.S. dollars. We generally attempt to set prices that take into account the international market prices for our petrochemical products and variations in thereal/U.S. dollar exchange rate. As a result, although a significant portion of our net sales revenue is inreais,substantially all of our products are sold at prices that are based on international market prices that are quoted in the U.S. dollars.
The price of naphtha, our principal raw material, is linked to the U.S. dollar. Our naphtha purchase contractcontracts with Petrobras providesprovide that the prices that we pay to Petrobras for naphtha in any month are established based on the average Amsterdam-Rotterdam-Antwerp market price for naphtha in U.S. dollars during the previous month, converted intoreaisat thereal/U.S. dollar exchange rate in effect on the last day of the previous month. Fluctuations in therealaffect the cost of naphtha and other U.S. dollar-linked or imported raw materials.
When therealdepreciates against the U.S. dollar, assuming naphtha costs and international market prices of our products remain constant in U.S. dollars, the production cost for our products increases and we generally attempt to increase the prices for our products inreais(to (to the extent possible in light of then-prevailing market conditions in Brazil), which may result in reduced sales volumes of our products. To the extent that our price increases are not sufficient to cover the increased costs for raw materials, our operating incomemargin decreases. Conversely, when therealappreciates against the U.S. dollar, assuming naphtha costs and international market prices of our products remain constant in U.S. dollars, the production cost for our products decreases and we generally decrease the prices for our products inreais, which may result in increased sales volumes of our products. In periods of high volatility in thereal/U.S. dollar exchange rate, there is usually a lag between the time that the U.S. dollar appreciates or depreciates and the time that we are able to pass on increased or reduced costs inreaisto our customers in Brazil. These pricing mismatches decrease when fluctuations in thereal/U.S. dollar exchange rate areis less volatile.
Our consolidated U.S. dollar-denominated indebtedness represented 69.6%70.1% of our outstanding indebtedness at December 31, 2004,2007, excluding related party debt. As a result, when therealdepreciates against the U.S. dollar:
For example, the 34.3% devaluation of therealin 2002 substantially increased our financial expenses and was a significant factor in our net loss for that year.
Conversely, when therealappreciates against the U.S. dollar:
94
Any major devaluationA depreciation of therealagainst the U.S. dollar wouldhas the converse effects.
Any significant appreciation of therealagainst the U.S. dollar significantly increasedecreases our financial expenses and our short-term and long-term indebtedness, as expressed inreais. Conversely, any major appreciationsignificant depreciation of therealagainst the U.S. dollar would significantly decreaseincreases our financial expenses and our short-term and long-term indebtedness, as expressed inreais.
Export sales, which enable us to generate receivables payable in foreign currencies, tend to provide a hedge against a portion of our U.S. dollar-denominated debt service obligations, but they do not fully match them. Accordingly, we often enter into hedges to mitigate exchange rate fluctuations in our U.S. dollar-denominated indebtedness. To further mitigate our exposure to exchange rate risk, we try, where possible, to enter into trade finance loans for our working capital needs, which funding is generally available at a lower cost because it is linked to U.S. dollar exports. However, future U.S. dollars generated by usthat we generate from exports may not be in an amount sufficient to cover all of our U.S. dollar trade finance liabilities.
Inflation affects our financial performance by increasing some of our operating expenses denominated inreais(and not linked to the U.S. dollar). A significant portion of our costs of sales and services rendered, however, are linked to the U.S. dollar and are not substantially affected by the Brazilian inflation rate. In addition, some of ourreal-denominated debt is indexed to take into account the effects of inflation. Under this debt, the principal amount generally is adjusted with reference to the General Price Index—Market (Índice Geral de Preços—Mercado), or IGP-M, an inflation index, so that inflation results in increases in our financial expenses and debt service obligations. In addition, a significant portion of ourreal-denominated debt bears interest at the Long-Term Interest Rate or the CDI rate, which are partially adjusted for inflation.
Effect of Level of Indebtedness and Interest Rates
At December 31, 2004,2007, our total outstanding consolidated indebtedness on a consolidated basis, excluding related party debt, was R$5,999.78,381.9 million. The level of our indebtedness results in significant financial expenses that are reflected in our statement of operations. Financial expenses consist of interest expense, exchange variations of U.S. dollar- and other foreign currency-denominated debt, foreign exchange losses or gains, and other items as set forth in notes 15 andnote 23 to our consolidated and combined financial statements. In 2004,2007, we recorded total financial expenses of R$1,291.0180.1 million, of which R$590.1341.9 million consisted of interest expense and R$426.0203.8 million consisted of foreign exchange gains. By contrast, in 2003, we recorded total financial expenses ofmonetary variation on financing and related parties, that was more than offset by R$712.61,073.1 million of which R$543.6 million consisted of interest expense and R$969.4 million consisted of foreign exchange gains. The interest rates that we pay depend on a variety of factors, including prevailing Brazilian and international interest rates and risk assessments of our company, our industry and the Brazilian economy made by potential lenders to our company, potential purchasers of our debt securities and the rating agencies that assess our company and its debt securities.
Standard & Poor’s, Moody’s and Fitch maintain ratings of our company and our debt securities. On November 12, 2004, Fitch upgraded the nationalStandard & Poor’s maintains a rating of our company from “A (bra)on a local basis of “br AA+/Stable Outlook,” to “A+ (bra),” and on April 28, 2005, Fitch upgraded the nationalMoody’s maintains a rating of our company to “AA- (bra).” On March 17, 2005, Standard & Poor’s upgraded theon a local basis of “Aa2.br/Stable Outlook” and Fitch maintains a local rating for our company from “Br A+” to “Br AA-.of “AA (bra)/Positive Outlook.” On a global basis, Standard & Poor’s maintains a local currency rating offor our company of “BB”“BB+ (stable)” and a foreign currency rating for our company of “BB-“BB+ (stable),” whileMoody’s maintains a local currency rating for our company of “Ba1” and a foreign currency rating for our company of “Ba1” and Fitch maintains a local currency rating for our company of “BB+”/Positive Outlook” and a foreign currency rating for our company of “BB-.“BB+/Positive Outlook.” We believe that these upgrades of our local basisAny ratings reflect a significant improvement of the capital structure and liquidity of our company, in addition to our reduced levels of short-term indebtedness, refinancing exposure and net financial expenses. We have not been informed of any proposed actions by either of these rating agencies to further modify their ratings on our company or its indebtedness. Any rating downgradingsdowngrades in the future would likely result in increased interest and other financial expenses relating to borrowings and debt securities and could adversely affect our ability to obtain such financing on satisfactory terms or in amounts required by us.
Effects of Brazilian Inflation
Our Inflation affects our financial performance by increasing some of our operating expenses denominated inreais (and not linked to the U.S. dollar). A significant portion of our costs of sales and services rendered, however, are linked to the U.S. dollar and are not substantially affected by the Brazilian inflation rate. Some of ourreal-denominated debt obligationsis indexed to take into account the effects of inflation. Under this debt, the principal amount generally is adjusted with variablereference to the General Price Index—Market, or the IGP-M, an inflation index, so that inflation results in increases in our financial expenses and debt service obligations. In addition, a significant portion of our real-denominated debt bears interest rates expose our company to market risks from changes inat the Long-Term Interest Rate,TJLP or the CDI rate, IGP-M and LIBOR. To mitigate our exposure to interest rate risk, we have sought from time to time to enter into hedges to mitigate fluctuations in LIBOR.which are partially adjusted for inflation.
95
Results of Operations of Jointly Controlled Companies
We own 29.5% of the voting and total share capital of Copesul. We also own 34.0% of Politeno’s total share capital, including 35.0% of its voting share capital. The operations of Copesul are similar to the operations of our Basic Petrochemicals Unit and the operations of Politeno are similar to the operations of our Polyolefins Unit. Accordingly, the results of operations of these companies are influenced by factors similar to the factors that influence our results of operations. However, these companies have management that is independent from ours and capital structures, including levels of indebtedness and corresponding levels of financing costs, that are different from ours. As a result of the application of Instruction 247 to our consolidated and combined financial statements, we are required to proportionally consolidate the results of jointly controlled companies that are not our subsidiaries, such as Copesul and Politeno.subsidiaries. Consequently, our results of operations are subject to fluctuations that depend on the results of these jointly controlled companies.
However, in evaluating our results of operations, cash flows and liquidity, our management relies on financial information that does not include the effects of proportional consolidation, principally because we have limited, if any, control over the operations and policies of the companies whose results we are required to proportionally consolidate with our own. In our discussion of our results of operations and our discussion of our liquidity and capital resources, we have provided supplemental information drawn from our accounting records with respect to our results of operations, working capital, cash flows and indebtedness without giving effect to this proportional consolidation to provide holders of our class A preferred shares and the ADSs with information that our management believes more accurately reflects the results of operations and financial position of our company.
We own 60% of the voting and total share capital of Paulínia. Paulínia has management that is independent from ours and a capital structure, including a level of indebtedness and corresponding level of financing costs, that is different from ours. As a result of the completion of the first phase of the Petrobras Transaction, we will fully consolidate the results of Paulínia into our financial statements as from April 1, 2008. See “Item 4. Information on the Company—Petrobras Transaction.”
Prior to the Politeno Acquisition on April 6, 2006, we owned 35.0% of Politeno’s voting share capital and 34.0% of its total share capital. As a result, at dates and for periods prior to April 6, 2006, we proportionally consolidated Politeno’s results in our consolidated financial statements and did not include Politeno’s results in our Polyolefins segment. Following the Politeno Acquisition on April 6, 2006, we owned 100% of the voting share capital and 96.2% of the total share capital of Politeno, and we have fully consolidated Politeno’s results in our consolidated financial statements and included Politeno’s results in our Polyolefins segment as from April 1, 2006. Politeno merged with and into Braskem on April 2, 2007.
Prior to March 31, 2007, we owned 29.5% of the voting share capital and total share capital of Copesul, and we proportionally consolidated the results of Copesul in our consolidated financial statements. As a result of the Ipiranga Transaction and our obtaining effective management control over the 29.5% of the share capital of Copesul then owned by Ipiranga Petroquímica, we have fully consolidated the results of Copesul and its subsidiaries into our financial statements and included Copesul’s results as a separate segment in our financial statements as from April 1, 2007.
At December 31, 2007, we owned 33.5% of the total share capital of Petroflex, including 33.6% of its voting share capital. In April 2008, we sold all of our share capital in Petroflex to Lanxess Participações Ltda. for an aggregate price of R$252.1 million. See “Item 4. Information On The Company—History and Development of Our Company—Developments Since January 1, 2005—Acquisition of Additional Interest in Petroflex and Sale of Interest in Petroflex.” Prior to November 30, 2007, we accounted for our interest in Petroflex in our Brazilian GAAP financial statements using the proportional consolidation method. As a result of our entering into an agreement in December 2007 to sell our interests in Petroflex, we accounted for our interest in Petroflex in our Brazilian GAAP financial statements using the equity method as from December 1, 2007. As a result of this transaction, Petroflex registered a non-operational gain of R$115.6 million.
Effect of Taxes on Our Income
We are subject to a variety of generally applicable Brazilian federal and state taxes on our operations and results.
96
Tax Exemptions
We are generally subject to Brazilian federal income tax at an effective rate of 25%, which is the standard corporate tax rate in Brazil. We have available certain federal tax exemptions based upon federal law that offers tax incentives to companies that locate their manufacturing operations in the Brazilian states of Bahia and Alagoas. These exemptions have been granted for varying lengths of time to each of our manufacturing plantplants located in these states.
We are exempt from corporate income tax on the profits arising from the sale of PVC manufactured at our PVCAlagoas plant in Alagoas and PET manufactured at our plant in the Northeastern Complex until December 31, 2008. We expect that these tax exemptions will be renewed in 2009 for an additional 10-year period. In addition, we are entitled to pay only 25% of the statutory income tax rate on the profits arising from the sale of:
Each of our exemptions entitles us to pay only 87.5% of the statutory income tax rate on the profits arising from products manufactured at these plants for a period of one or more years after the dates set forth above.
AtLaw No. 11,638/07 has recently changed the end of each year,accounting rules applicable to tax exemptions. As from January 1, 2008, if we or any of our affected subsidiaries has taxable profit resulting from the operations described above,at our Alagoas plant and in our plants in the amount ofNortheastern Complex, income tax expense is calculated without giving effect to the income tax exemption or reduction is(i.e., the income tax benefit of the exemption or reduction will be deducted from ourincome tax expense for that year and creditedexpense). The net income arising from the recording of such tax credit will be allocated to a capitaltax incentive reserve which can onlyestablished under Brazilian law. This reserve may be used only to increase capital or absorb losses which exceed retained earnings and profits reserves as defined in the Brazilian Corporation Lawlaw. As a result, the eventual expiration of the income tax exemptions will adversely affect our net income in periods after the expiration. Prior to January 1, 2008, the net results arising from tax exemptions or redeem or repurchase share capital or participation certificates. We used R$463.2 million of this capitalreductions were directly recorded as a tax incentive reserve to absorb all ofunder our retained losses in December 2004.shareholders’ equity.
Due to operating losses sustained by us in the past, we had R$205.8146.4 million of deferred tax assets arising from R$823.4585.8 million of tax loss carryforwards available at December 31, 2004.2007. Income tax loss carryforwards available for offset in Brazil do not expire. However, the annual offset is limited to 30% of our adjusted net income. This limit also affects the Social Contribution on Net Income.CSLL.
Our export sales are currently exempt from PIS (a federal value-added tax), COFINS (a federal value-added tax), IPI (a federal value-added tax on industrial products) and the Tax on the Circulation of Merchandise and Services (Imposto Sobre a Circulação de Mercadorias e Serviços), or ICMS (a state value-added tax on sales and services), under generally available exemptions, subject to our compliance with the requirements of these exemptions.
The eventual expiration of the income tax exemptions will not affect our net income because we record the full amount of the income tax in our income statement and credit the amount of the income tax exemptions to a reserve account in shareholders’ equity to increase our capital or absorb our losses.
Tax Disputes
We pay IPI tax on industrial products that we manufacture. The regulations governing the IPI tax assess this tax on a non-cumulative basis, which means that companies may offset their IPI tax obligations with the amount of IPI taxes paid by suppliers earlier in the production chain. The Brazilian federal tax authorities have asserted that purchases of raw materials that are tax-exempt, non-taxable or taxed at a zero percent rate do not generate IPI tax credits, because they maintain that there is no legal provision that expressly authorizes these credits. We believe that this interpretation is contrary to Article 153, paragraph 3 of the Brazilian Constitution, which sets forth the principle of non-cumulative taxation in a broad manner and does not exclude purchases of raw materials that are tax-exempt, non-taxable or taxed at a zero percent rate. OPP Química brought a suit against the Brazilian government claiming that it had the right to IPI tax credits on its purchases of raw materials that are in a zero percent tax bracket. In December 2002, the Brazilian Federal Supreme Court ruled in favor of OPP Química in this suit.
The Brazilian government has appealed this decision, requesting clarification of the calculation of these tax credits but not challenging their validity. As the appeal does not challenge the validity of IPI tax credits, but only
the method of calculating monetary adjustments on those credits and the time period for appealing the decision of the Brazilian Federal Supreme Court has expired, we believe that (1) the decision acknowledging the validity of the IPI tax credits is no longer subject to appeal, and (2) the probability of losing this appeal is remote. Accordingly, we recognized IPI tax credits in an aggregate amount of R$1,030.1 million in December 2002. Of this total tax credit, we used R$265.6 million during the year ended December 31, 2002, R$364.9 million during the year ended December 31, 2003 and the remainder during the year ended December 31, 2004 to offset IPI and other federal tax obligations.
Although the ruling of the Brazilian Federal Supreme Court only applies to our operations in the State of Rio Grande do Sul, we have also brought litigation against the Brazilian government in respect of our purchases of raw materials in the States of São Paulo, Bahia and Alagoas seeking to obtain a similar tax credit. We have not recognized any assets or gains in relation to our claims in these states.
We are currently involved in numerous tax proceedings. We have established reservesprovisions based on our obligations under current legislation, utilization of the contingent IPI tax credits, and our estimated costs of resolving other claims in which we believe we have a probable tax loss. The tax contingencies relate primarily to the Social Contribution on Net Income (a tax similar to the corporate income tax),CSLL, PIS, COFINS and IPI. If any of these legal proceedings is decided adversely to us, our results of operations or financial condition could be materially adversely affected. For more information on our tax proceedings, the amounts claimed by governmental authorities and the amounts we have reserved against some of these claims, see “Item 8. Financial Information—Legal Proceedings—Tax Proceedings.”
97
Recent Developments
Tax ReformCredit Export Note Facility
In April 2003, the Brazilian Government presented a tax reform proposal, mainly designed to simplify tax assessments, to avoid internal disputes within and between the Brazilian states and municipalities, and to redistribute tax revenues. The tax reform proposal provided for changes in the rules governing PIS, COFINS, ICMS, CPMF and other taxes. The implementation of such changes depended on the approval of an amendment to the Brazilian Constitution.
In December 2003, the Brazilian Federal Senate approved part of this tax reform proposal following its approval by the Brazilian Federal House of Representatives. These tax reforms were consolidated in Constitutional Amendment No. 42, which became effective on December 31, 2003.
Constitutional Amendment No. 42 provides for the assessment of PIS and COFINS on import transactions. Law No. 10,865/04, which implemented this provision, requires PIS and COFINS to be assessed on the import of goods, as well as on the remuneration paid to non-residents for the rendering of services. These changes became effective on May 1, 2004. Constitutional Amendment No. 42 also provides for an extension of the CPMF assessment until December 31, 2007. Prior to the adoption of Amendment No. 42, CPMF was scheduled to expire on December 31, 2004.
Other parts of the tax reform proposal were amended by the Senate and returned to the House of Representatives for further examination. These parts of the tax reform proposal relate to:
The amendments to the tax reform proposal and other items pending before the Brazilian legislature were consolidated in a Project for Constitutional Amendment. We expect that the Project for Constitutional Amendment will be reviewed and submitted to a vote of the House of Representatives in the near future. Upon
approval by both houses of the Brazilian legislature, the Project for Constitutional Amendment will be submitted to the President for his review and execution. If enacted, these tax reform measures will be gradually adopted beginning in 2005 and continuing through 2007.
We are unable to predict the effect of these proposed tax reform measures, if approved, on our results of operations. Although some of these measures may result in increases in our tax payments, others are likely to reduce our tax obligations. In addition, as discussed above, we have significant income tax loss carryforwards, tax exemptions and tax credits that should, to a degree, mitigate the effects of the tax reform measures on us. We currently do not anticipate that the tax reform measures will have a material adverse effect on our results of operations in future periods, although we cannot provide holders of our class A preferred shares and the ADSs with any assurances in this regard.
Braskem + Program
We commenced implementation of a corporate and operational excellence program called Braskem + in 2004. The Braskem + program seeks to:
We anticipate that this program will allow us to create value in all stages of the petrochemical cycle.
In connection with the development of the Braskem + program, we engaged a leading consulting firm to analyze our industrial practices and compare them to benchmarking practices in the global petrochemical sector. Through this analysis, we have identified 218 initiatives designed to further improve, among other things, our capacity utilization, maintenance scheduling and completion, and feedstock procurement and usage. In 2004, we implemented 59 of these initiatives at a total cost of R$23.5 million, resulting in R$90 million in cost savings on a recurring annual basis, as estimated by our management. These cost reductions have been achieved primarily as a result of productivity gains in our Basic Petrochemicals Unit and our Alagoas PVC plant. We cannot assure holders of our class A preferred shares and the ADSs that we will realize the full benefit of the identified annual cost savings in upcoming years. To the extent that we fail to do so, for any reason, in any year, our results of operations for that year may be adversely affected.
Recent Developments
On January 19, 2005,2008, we entered into a pre-export financecredit export note facility in an aggregate principalthe amount of US$45.0 million. The loans under this150 million with a Brazilian financial institution. This facility are secured by certain of our exports and bearbears interest at a rate of three-month LIBOR plus 1.00%7.3% per annum, payable quarterlysemiannually in arrears commencing on April 30, 2005.in August 2008. The principal amount of this facility is payablematures in 11 equal quarterly installments beginning on July 31, 2005, with aFebruary 2020.
Fourth Phase of Ipiranga Transaction
As part of the Ipiranga Transaction, in February 2008 Ultrapar delivered:
In February 2008, we paid to Ultrapar the final maturity dateinstallment of January 31, 2008.
On February 2, 2005,the purchase price for the Ipiranga Transaction in the amount of R$633.5 million, and we received athe sixth and final disbursement under the Acquisition Credit Agreement in the aggregate amount of US$251.2 million to fund this payment.
Sale of Interest in Petroflex
In April 2008, we sold all of our share capital in Petroflex to Lanxess for an aggregate price of R$17.3252.1 million under a secured credit agreement that we entered into on June
Petrobras Transaction
On May 30, 2004. For a discussion2008, Braskem completed the first phase of the termsPetrobras Transaction. In the first phase of the secured credit agreement, see “—LiquidityPetrobras Transaction, Petrobras and Capital Resources—Indebtedness and Financing Strategy—Long-Term Indebtedness.”Petroquisa contributed the following assets to Braskem:
In exchange for these assets, Braskem issued an aggregate As a result of the On March 8, 2005, we entered into a credit facility withFinanciadora de Estudos e Projetos, or FINEP, a technology funding institutionMinisteryvoting and outstanding share capital of ScienceCopesul;Technologyoutstanding share capital of Brazil, inIpiranga Química; andprincipal amount of R$84.9 million,46,903,320 common shares and 43,144,662 class A preferred shares to be disbursed in eight quarterly installments, beginning on March 15, 2005, withPetroquisa.final disbursement on March 15, 2007. We borrowed R$9.9 million under this credit facility on April 6, 2005. We are required to usecompletion of the proceeds disbursed under this credit facility for capital expenditures atfirst phase of the Braskem Center for InnovationPetrobras Transaction, Petrobras owns, directly and Technology operated by our Polyolefins Unit, the research and development pilot plantindirectly, 23.1% of our Vinyls Unit, and the research center of our Vinyls Unit. Under this credit facility, we are required to invest
at least R$9.4 million of our own funds in these projects. The loans bear interest at a rate of Long-Term Interest Rate plus 5% per annum, payable quarterly in arrears commencing on June 15, 2005. However, we are entitled to pay interest at only the Long-Term Interest Rate for so long as we are in compliance with the policies of certain affiliates of FINEP. The principal amount under this credit facility will be payable in 61 equal monthly installments beginning on March 15, 2007, with a final maturity date of March 15, 2012. Our obligation to make payments under this credit facility is guaranteed by a surety bond.
On March 24, 2005, we borrowed the Japanese yen equivalent of US$50 million under a syndicated credit agreement dated March 8, 2005. The proceeds of this loan are required to be used fortotal share capital, expenditures related to the Braskem + program. This loan bears interest at the rate of six-month Tokyo Inter-Bank Offered Rate plus 0.95% per annum, payable semi-annually in arrears. Principal on this loan is payable in 11 equal installments beginning in March 2007 with a final maturity date in March 2012. In connection with this loan, we entered into a swap contract in the total amount of this debt, which effectively changes the interest rate to 101.59% of CDI. The maturities, currency, rates and amounts of the swap contract correspond to the terms of the loan. Ninety-five percent of the commercial risk of this loan and 97.5% of the political risk of this loan are supported by insurance from Nippon Export and Investment Insurance, for which we paid a lump-sum premium in yen.
On April 29, 2005, Odebrecht, Petroquisa, ODBPAR Investimentos S.A., or ODBPAR, and Norquisa entered into an amendment of the Memorandum of Understanding regarding Shareholders Agreement. Under this amendment, Odebrecht, ODBPAR and Norquisa granted to Petroquisa an option to purchase such number of our common shares as may be necessary for Petroquisa to own up to 30%including 30.0% of our voting share capital. Petroquisa may exercise this optioncapital, and Braskem owns, directly and indirectly:
98
The first phase of the Petrobras Transaction was implemented through an exchange of shares (incorporação de ações) in which shares of Braskem were issued to Petroquisa in exchange for the shares of some petrochemical companies, including sharesGrust Holdings S.A., a wholly-owned subsidiary of some petrochemical companies locatedPetroquisa that, directly and indirectly, owns the interests in the Southern Complex, that Petroquisa holdsCopesul, Ipiranga Química, Ipiranga Petroquímica and that Odebrecht may consider essentialPaulínia contributed to the grantBraskem.
As a result of the Petroquisa option. For additional information regarding this option, see “Item 7. Major Shareholderscompletion of the first phase of the Petrobras Transaction, we will no longer record minority interests with respect to Copesul and Related Party Transactions—Major Shareholders—Shareholders Agreement.”Ipiranga Química. In addition, we will fully consolidate the results of Paulínia into our financial statements as from April 1, 2008.
Fixed Rate Notes
On June 1, 2005, our subsidiary, Braskem International Limited,5, 2008, we issued and sold US$150500.0 million in aggregate principal amount of its 9.375%our 7.250% Notes due 2015.2018. Interest on these notes is payable semi-annualy in arrears in June and December of each year commencing on December 1, 2005, and thethese notes mature on June 1, 2015. These notes are guaranteed by our company.5, 2018. We intend to use the net proceeds of these notes, together with other funds of Braskem International Limited, to repurchase US$150 million aggregate principal amount of our outstanding 10.625% Notes Due 2007 on July 24, 2005. The principal covenants under these notes are limitations on liens, related party transactions and consolidations, mergers and sales of all or substantially all of our assets. These notes will be mandatorily exchanged on or about August 24, 2005 for notes that are direct senior unsecured obligations of our company and have the same terms as the notes initially issued and sold by Braskem International Limited.
On June 1, 2005, we issued our 13th issue of unsecured non-convertible debentures in a single series of 30,000 debentures, each with a par value of R$10,000. The Brazilian Securities Commission approved the registration of these debentures on June 28, 2005, and we anticipate that we will consummate the sale of these debentures to the public on or about June 30, 2005. We plan to use the proceeds from these debentures to repay our outstanding 9.25% notes due 2005 on October 28, 2005. The principal amount of these debentures is payable in full on June 1, 2010, and these debentures will bear interest at 104.1% of the CDI rate per annum beginning June 1, 2005, payable semi-annually. The principal covenants under these debentures include financial ratios and limitations on indebtedness and dividends.
We are finalizing the negotiation of the terms and conditions of a credit facility with the Brazilian National Bank for Economic and Social Development (Banco Nacional de Desenvolvimento Econômico e Social, or
BNDES). If we enter into this credit facility, BNDES would be committed to disburse loans over a three-year period in an aggregate principal amount of approximately R$384 million. We intend to useused the proceeds of this credit facilityoffering to finance capital expenditures, and they will be secured byrepay a letter of credit from a financial institution pre-approved by BNDES, which letter of credit we may replace with a first priority mortgage on one of our polyolefins plants located in the Southern Complex, a first priority security interest in the machinery and equipment located in the mortgaged plant and an unconditional guarantee by Odebrecht. On June 22, 2005, our board of directors approved this credit facility. Accordingly, we expect to execute credit agreements with respect to loans in the aggregate principal amount of R$336 million in July 2005. We anticipate that:
Acquisition Credit Agreement.
We cannot assure you, however, whether we will complete the negotiation of this credit facility or that the actual provisions of the credit agreements will be similar to those of our other credit facilities with BNDES.
On June 17, 2005, we issued and sold US$150 million in aggregate principal amount of 9.75% Perpetual Bonds. Interest on these bonds is payable quarterly in March, June, September and December of each year, commencing on September 17, 2005. The bonds do not have a fixed final maturity date and do not include sinking fund provisions. We may, however, redeem these bonds in whole at 100% of their principal amount plus accrued interest and additional amounts, if any, on any interest payment date on or after June 17, 2010. We intend to use the net proceeds of these bonds for general corporate purposes, including working capital and the repayment of long-term indebtedness. The principal covenants under these bonds are limitations on liens, related party transactions and consolidations, mergers and sales of all or substantially all of our assets.
Results of Operations
The following discussion of our results of operations is based on our consolidated and combined financial statements prepared in accordance with Brazilian GAAP.
Our results of operations for the year ended December 31, 2007 are not comparable to our results of operations for the year ended December 31, 2006 as a result of the Ipiranga Transaction. As a result of the Ipiranga Transaction, we have fully consolidated the results of Ipiranga Química, Ipiranga Petroquímica and Copesul and included these companies as separate segments as from April 1, 2007. Prior to April 1, 2007, we did not include the results of our Ipiranga Química and Ipiranga Petroquímica segments in our consolidated financial statements, we proportionally consolidated the results of Copesul in our consolidated financial statements to reflect our 29.5% interest in Copesul’s voting and total share capital and we did not reflect any of the results of Copesul in any of our then-existing segments.
Prior to March 31, 2006, we proportionally consolidated the results of Politeno in our consolidated financial statements. As a result of the Politeno Acquisition described under “Item 4. Information On The Company—History and Development of Our Company,” we have fully consolidated Politeno’s results in our consolidated financial statements and included Politeno’s results in our Polyolefins segment as from April 1, 2006. Politeno merged with and into Braskem on April 2, 2007.
Prior to March 31, 2007, we proportionally consolidated the results of Copesul in our consolidated financial statements. As a result of the Ipiranga Transaction, three of our segments (Copesul, Ipiranga Petroquímica and Ipiranga Química) were created, and we have fully consolidated the results of Copesul and have consolidated the results of Ipiranga Química and Ipiranga Petroquímica in our consolidated financial statements as from April 1, 2007.
During 2007, we proportionally consolidated the results of three jointly controlled companies: Paulínia; Petroflex (through November 30, 2007); and Cetrel. During 2006 and 2005, we proportionally consolidated the results of four jointly controlled companies: Copesul, Paulínia, Petroflex, and Cetrel.
The discussion of the results of our business segments is based upon financial information reported for each of the four segments of our business, as detailedpresented in note 29 to our consolidated and combined financial statements included elsewhere in this annual report.the table below. There are certain differences between the concepts used by our company in preparing information about segments and the requirements of Brazilian GAAP as applied in the statutory financial statements. The principal differences are:
99
The following tables set forth the operating results of operationseach of our Business Development segment, which consistssegments and the reconciliation of the operations historically conducted by Proppet and Nitrocarbono, only include thethese results of our segments to our consolidated results of operations. This segment information was prepared on the operations of Nitrocarbono forsame basis as the period after August 16, 2002,information that our senior management uses to allocate resources among segments and evaluate their performance. We evaluate and manage the dateperformance of our mergersegments based on information generated from our statutory accounting records maintained in accordance with 52114 Participações. Therefore,Brazilian GAAP and reflected in our consolidated financial statements. However, the operating income presented in the following tables does not include financial expenses, financial income and results from equity accounting.
| Year Ended December 31, 2007 | ||||||||||||||
| Selling, general | ||||||||||||||
| Cost of sales | and | Depreciation | ||||||||||||
| Net sales | and services | administrative | and | Other expense | Operating | |||||||||
| revenue | rendered | Gross profit | expenses | amortization | (income), net | income | ||||||||
| (in millions ofreais) | ||||||||||||||
| Basic Petrochemicals | R$7,220.7 | R$6,341.2 | R$879.5 | R$324.6 | R$1.4 | R$(15.9) | R$569.4 | |||||||
| Polyolefins | 5,669.1 | 4,636.1 | 1,033.0 | 427.1 | 13.9 | (14.4) | 577.6 | |||||||
| Vinyls | 1,789.4 | 1,438.1 | 351.3 | 201.7 | 2.1 | (25.9) | 173.4 | |||||||
| Business Development | 489.7 | 510.3 | (20.6) | 16.5 | 0.0 | 22.8 | (59.9) | |||||||
| Copesul | 5,516.1 | 4,924.7 | 591.4 | 74.6 | 17.6 | (10.1) | 509.3 | |||||||
| Ipiranga Petroquímica | 1,551.4 | 1,232.5 | 318.9 | 85.1 | 5.7 | 26.0 | 202.1 | |||||||
| Ipiranga Química | 392.6 | 338.9 | 53.7 | 39.1 | 4.3 | 0.7 | 9.6 | |||||||
| Total segments | 22,629.0 | 19,421.8 | 3,207.2 | 1,168.7 | 45.0 | 12.0 | 1,981.5 | |||||||
| Eliminations | (5,617.4) | (5,488.4) | (129.0) | 32.8 | 432.0 | (142.3) | (451.5) | |||||||
| Total prior to CVM 247 | 17,011.6 | 13,933.4 | 3,078.2 | 1,201.5 | 477.0 | (130.3) | 1,530.0 | |||||||
| Effects of CVM 247 | 667.8 | 507.6 | 160.2 | 37.0 | 2.1 | (1.2) | 122.3 | |||||||
| Consolidated | R$17,679.4 | R$14,441.0 | R$3,238.4 | R$1,238.5 | R$479.1 | R$(131.5) | R$1,652.3 | |||||||
| Year Ended December 31, 2006 | ||||||||||||||
| Selling, general | ||||||||||||||
| Cost of sales | and | Depreciation | ||||||||||||
| Net sales | and services | administrative | and | Other expense | Operating | |||||||||
| revenue | rendered | Gross profit | expenses | amortization | (income), net | income | ||||||||
| (in millions ofreais) | ||||||||||||||
| Basic Petrochemicals | R$6,883.6 | R$5,994.8 | R$888.8 | R$339.0 | R$0.4 | R$10.4 | R$539.0 | |||||||
| Polyolefins | 4,775.8 | 3,985.4 | 790.4 | 344.5 | 10.4 | (22.5) | 458.0 | |||||||
| Vinyls | 1,541.7 | 1,245.3 | 296.4 | 123.0 | 0.4 | (35.1) | 208.1 | |||||||
| Business Development | 483.1 | 545.7 | (62.6) | 26.0 | 0.1 | (1.9) | (86.8) | |||||||
| Copesul | — | — | — | — | — | — | — | |||||||
| Ipiranga Petroquímica | — | — | — | — | — | — | — | |||||||
| Ipiranga Química | — | — | — | — | — | — | — | |||||||
| Total segments | 13,684.2 | 11,771.2 | 1,913.0 | 832.5 | 11.3 | (49.1) | 1.118.3 | |||||||
| Eliminations | (1,965.2) | (1,889.6) | (75.6) | 41.9 | 368.3 | (107.8) | (378.0) | |||||||
| Total prior to CVM 247 | 11,719.0 | 9,881.6 | 1,837.4 | 874.4 | 379.6 | (156.9) | 740.3 | |||||||
| Effects of CVM 247 | 1,273.7 | 910.5 | 363.2 | 77.1 | 5.4 | (29.2) | 309.9 | |||||||
| Consolidated | R$12,992.7 | R$10,792.1 | R$2,200.6 | R$951.5 | R$385.0 | R$(186.1) | R$1,050.2 | |||||||
100
| Year Ended December 31, 2005 | ||||||||||||||
| Selling, general | ||||||||||||||
| Cost of sales | and | Depreciation | ||||||||||||
| Net sales | and services | administrative | and | Other expense | Operating | |||||||||
| revenue | rendered | Gross profit | expenses | amortization | (income), net | income | ||||||||
| (in millions ofreais) | ||||||||||||||
| Basic Petrochemicals | R$7,226.7 | R$6,138.5 | R$1,088.2 | R$250.3 | R$0.0 | R$(57.1) | R$895.0 | |||||||
| Polyolefins | 3,919.0 | 3,182.8 | 736.2 | 229.0 | 6.9 | (53.0) | 553.3 | |||||||
| Vinyls | 1,794.1 | 1,271.9 | 522.2 | 89.2 | 0.8 | (6.6) | 438.8 | |||||||
| Business Development | 569.0 | 552.9 | 16.1 | 18.2 | 0.3 | (9.2) | 6.8 | |||||||
| Copesul | — | — | — | — | — | — | — | |||||||
| Ipiranga Petroquímica | — | — | — | — | — | — | — | |||||||
| Ipiranga Química | — | — | — | — | — | — | — | |||||||
| Total segments | 13,508.8 | 11,146.1 | 2,362.7 | 586.7 | 8.0 | (125.9) | 1,893.9 | |||||||
| Eliminations | (1,894.2) | (1,827.6) | (66.6) | 89.7 | 342.2 | 56.1 | (554.6) | |||||||
| Total prior to CVM 247 | 11,614.6 | 9,318.5 | 2,296.1 | 676.4 | 350.2 | (69.8) | 1,339.3 | |||||||
| Effects of CVM 247 | 1,460.5 | 1,043.2 | 417.3 | 110.7 | 5.4 | 47.0 | 254.2 | |||||||
| Consolidated | R$13,075.1 | R$10,361.7 | R$2,713.4 | R$787.1 | R$355.6 | R$(22.8) | R$1,593.5 | |||||||
In the following discussion, references to increases or decreases in any year or period are made by comparison with the corresponding prior year or period, except as the context otherwise indicates.
Year Ended December 31, 20042007 Compared with Year Ended December 31, 20032006
Consolidated Results
The following table sets forth consolidated financial information for the years ended December 31, 2007 and 2006.
| Year Ended December 31, | ||||
| 2007(1) | 2006(2) | |||
| (in millions ofreais) | ||||
| Net sales revenue | R$17,679.4 | R$12,992.7 | ||
| Cost of sales and services rendered | (14,441.0) | (10,792.1) | ||
| Gross profit | 3,238.4 | 2,200.6 | ||
| Selling, general and administrative expenses | (1,238.5) | (951.5) | ||
| Depreciation and amortization | (479.1) | (385.0) | ||
| Other operating income, net | 131.5 | 186.1 | ||
| Results from equity accounting(3) | (107.3) | (28.8) | ||
| Financial expenses, net | (293.6) | (938.4) | ||
| Operating income | 1,251.4 | 83.0 | ||
| Non-operating expenses, net | (67.2) | 7.1 | ||
| Income before income tax and social contribution and minority interest | 1,184.2 | 90.1 | ||
| Income tax and social contribution | (377.0) | 12.8 | ||
| Income before profit sharing and minority interest | 807.2 | 102.9 | ||
| Profit sharing | (18.7) | — | ||
| Minority interest | (240.9) | (1.6) | ||
| Net income | R$ 547.6 | R$ 101.3 | ||
| (1) | As a result of the Ipiranga Transaction, includes fully consolidated results of Copesul and consolidated results of Ipiranga Química and Ipiranga Petroquímica as from April 1, 2007. |
101
| (2) | As a result of the Politeno Acquisition described under “Item 4. Information On The Company—History and Development of Our Company,” includes fully consolidated results of Politeno for periods as from April 1, 2006. Politeno merged with and into Braskem on April 2, 2007. |
| (3) | Results from equity accounting comprises the following line items in our consolidated statement of operations: equity in the results, amortization of goodwill (negative goodwill), net, foreign exchange variation, and tax incentives and other. |
Net Sales Revenue
Net sales revenue increased by 36.1% in 2007 primarily as a result of the following factors:
Without giving effect to the proportional consolidation of our jointly controlled entities and the effects of intercompany eliminations, the aggregate increase of net sales revenues of our consolidated subsidiaries in 2007 compared to 2006 that was related to the consolidation Ipiranga Química, Ipiranga Petroquímica and Copesul as from April 1, 2007 was R$7,460.1 million.
Without giving effect to the proportional consolidation of our jointly controlled companies (Paulínia, Petroflex and Cetrel during 2007, and Copesul, Paulínia, Petroflex and Cetrel during 2006), our net sales revenue increased by 45.2% in 2007.
Cost of Sales and Services Rendered and Gross Profit
Cost of sales and services rendered increased by 33.8% in 2007, primarily as a result of the following factors:
Without giving effect to the proportional consolidation of our jointly controlled entities and the effects of intercompany eliminations, the aggregate increase of cost of sales and services rendered of our consolidated subsidiaries in 2007 compared to 2006 that was related to the consolidation Ipiranga Química, Ipiranga Petroquímica and Copesul as from April 1, 2007 was R$6,496.1 million.
Without giving effect to the proportional consolidation of our jointly controlled companies, our cost of sales and services rendered increased by 41.0% in 2007.
Gross profit increased by 47.2% in 2007. Without giving effect to the proportional consolidation of our jointly controlled companies, gross profit increased by 67.5% in 2007.
102
Gross profit as a percentage of net sales revenue, or gross margin, was 18.3% in 2007 compared to 16.9% in 2006. Without giving effect to the proportional consolidation of our jointly controlled companies, gross margin increased to 18.1% in 2007 compared to 15.7% in 2006.
Selling, General and Administrative Expenses
Selling, general and administrative expenses increased by 30.2% in 2007, primarily as a result of the following factors:
Selling, general and administrative expenses represented 7.0% of net sales revenue in 2007 compared to 7.3% of net sales revenue in 2006.
Without giving effect to the proportional consolidation of our jointly controlled entities and the effects of intercompany eliminations, the aggregate increase of selling, general and administrative expense of our consolidated subsidiaries in 2007 compared to 2006 that was related to the consolidation Ipiranga Química, Ipiranga Petroquímica and Copesul as from April 1, 2007 was R$198.8 million.
Without giving effect to the proportional consolidation of our jointly controlled companies, selling, general and administrative expenses increased by 37.4% in 2007, and selling, general and administrative expenses represented 7.1% of net sales revenue in 2007 compared to 7.5% of net sales revenue in 2006.
Depreciation and Amortization
Depreciation and amortization increased by 24.4% in 2007. Depreciation and amortization expenses were higher in 2007, primarily as a result of the following factors:
Without giving effect to the proportional consolidation of our jointly controlled companies, depreciation and amortization increased by 25.6% in 2007.
103
Other Operating Income, Net
Other operating income, net declined by 29.3% in 2007. Without giving effect to the proportional consolidation of our jointly controlled companies, other operating income, net increased by 16.8% in 2007.
Results from Equity Accounting
Results from equity accounting were an expense of R$107.3 million in 2007 compared to an expense of R$28.8 million in 2006, primarily as a result of the following factors:
Without giving effect to the proportional consolidation of our jointly controlled companies, results from equity accounting were an expense of R$27.9 million in 2007 compared to an expense of R$166.7 million in 2006.
Financial Expenses, Net
Financial expenses, net, declined by 68.7% in 2007, primarily as a result of (1) the effects of thereal/U.S. dollar exchange rate on our U.S. dollar-denominated and U.S. dollar-indexed assets and liabilities, and (2) to a lesser extent, our recording of a R$2.5 million net gain on derivative transactions in 2007 compared to a R$47.8 million net loss on derivative transactions in 2006.
As a result of the 17.2% appreciation of therealagainst the U.S. dollar in 2007, we recorded:
As a result of the 8.7% appreciation of therealagainst the U.S. dollar in 2006, we recorded:
Without giving effect to the proportional consolidation of our jointly controlled companies, financial expenses, net declined by 68.6% in 2007.
Operating Income
Operating income was R$1,251.4 million in 2007 compared to R$83.0 million in 2006, primarily as a result of the 47.2% increase in gross profit and a 68.7% decrease in financial expenses, net as a result of the significant appreciation of thereal against the U.S. dollar. Operating income represented 7.1% of net sales revenue in 2007 compared to 0.6% of net sales revenue in 2006.
Without giving effect to the proportional consolidation of our jointly controlled entities and the effects of intercompany eliminations, the aggregate increase of operating income of our consolidated subsidiaries in 2007 compared to 2006 that was related to the consolidation Ipiranga Química, Ipiranga Petroquímica and Copesul as from April 1, 2007 was R$1,007.7 million.
104
Without giving effect to the proportional consolidation of our jointly controlled companies, operating income increased to R$1,210.9 million in 2007 compared to operating loss of R$21.7 million in 2006 and represented 7.1% of net sales revenue in 2007 compared to (0.2)% of net sales revenue in 2006.
Non-Operating Income (Expense), Net
Non-operating expense, net was R$67.2 million in 2007 compared to non-operating income, net of R$7.1 million in 2006. This change was primarily as a result of a R$35.5 million investment loss as a result of the merger of EDSP58 with and into Copesul and a R$19.7 million provision for losses recorded in 2007 related to the permanent closure of the DMT unit in our PET plant. Without giving effect to the proportional consolidation of our jointly controlled companies, non-operating expense, net was an expense of R$56.6 million in 2007 compared to non-operating income, net of R$8.1 million in 2006.
Income Tax and Social Contribution
Income tax and social contribution was an expense of R$377.0 million in 2007 compared to a benefit of R$12.8 million in 2006, primarily as a result of the full consolidation of the results of Copesul and the consolidation of the results of Ipiranga Química in our financial statements as from April 1, 2007. Without giving effect to the proportional consolidation of our jointly controlled companies, income tax and social contribution was an expense of R$338.3 million in 2007 compared to a benefit of R$97.0 million in 2006.
Profit Sharing and Minority Interest
Minority interest increased to R$240.9 million in 2007 compared to R$1.6 million in 2006, primarily as a result of the full consolidation of the results of Copesul and the consolidation of the results of Ipiranga Química in our financial statements as from April 1, 2007 and the significant minority interests in each of these companies. In addition, we recorded Copesul’s profit sharing expense of R$18.7 million in 2007 as a result of the full consolidation of the results of Copesul in our financial statements. Without giving effect to the proportional consolidation of our jointly controlled companies, minority interest and profit sharing was an expense of R$240.9 million in 2007 compared to an expense of R$1.6 million in 2006.
Net Income
We recorded net income of R$547.6 million, or 3.1% of net sales revenue, in 2007 compared to net income of R$101.3 million, or 0.8% of net sales revenue, in 2006.
Business Segment Results
The following table sets forth consolidated financial information for our business segments for the years ended December 31, 2007 and 2006. We have not included a comparative discussion of the results of the Copesul, Ipiranga Química and Ipiranga Petroquímica business segments as the operations of these business segments had not been acquired prior to December 31, 2006.
| Year Ended December 31, | ||||
| 2007 | 2006 | |||
| (in millions ofreais,except | ||||
| percentages) | ||||
| Basic Petrochemicals | ||||
| Net sales revenue | R$7,220.7 | R$6,883.6 | ||
| Cost of sales and services rendered | (6,341.2) | (5,994.8) | ||
| Gross profit | 879.5 | 888.8 | ||
105
| Year Ended December 31, | ||||
| 2007 | 2006 | |||
| (in millions ofreais,except | ||||
| percentages) | ||||
| Operating income (1) | 569.4 | 539.0 | ||
| Gross margin (%) | 12.2% | 12.9% | ||
| Operating margin (%) | 7.9% | 7.8% | ||
| Polyolefins(2) | ||||
| Net sales revenue | R$5,669.1 | R$4,775.8 | ||
| Cost of sales | (4,636.1) | (3,985.4) | ||
| Gross profit | 1,033.0 | 790.4 | ||
| Operating income (1) | 577.6 | 458.0 | ||
| Gross margin (%) | 18.2% | 16.6% | ||
| Operating margin (%) | 10.2% | 9.6% | ||
| Vinyls | ||||
| Net sales revenue | R$1,789.4 | R$1,541.7 | ||
| Cost of sales | (1,438.1) | (1,245.3) | ||
| Gross profit | 351.3 | 296.4 | ||
| Operating income (1) | 173.4 | 208.1 | ||
| Gross margin (%) | 19.6% | 19.2% | ||
| Operating margin (%) | 9.7% | 13.5% | ||
| Business Development | ||||
| Net sales revenue | R$489.7 | R$483.1 | ||
| Cost of sales | (510.3) | (545.7) | ||
| Gross loss | (20.6) | (62.6) | ||
| Operating loss (1) | (59.9) | (86.8) | ||
| Gross margin (%) | (4.2)% | (13.0)% | ||
| Operating margin (%) | (12.2)% | (18.0)% | ||
| Copesul(3) | ||||
| Net sales revenue | R$5,516.1 | — | ||
| Cost of sales and services rendered | (4,924.7) | — | ||
| Gross profit | 591.4 | — | ||
| Operating income (1) | 509.3 | — | ||
| Gross margin (%) | 10.7% | — | ||
| Operating margin (%) | 9.2% | — | ||
| Ipiranga Petroquímica(3) | ||||
| Net sales revenue | R$1,551.4 | — | ||
| Cost of sales | (1,232.5) | — | ||
| Gross profit | 318.9 | — | ||
| Operating income (1) | 202.1 | — | ||
| Gross margin (%) | 20.6% | — | ||
| Operating margin (%) | 13.0% | — | ||
| Ipiranga Química(3) | ||||
| Net sales revenue | R$392.6 | — | ||
| Cost of sales | (338.9) | — | ||
| Gross profit | 53.7 | — | ||
| Operating income (1) | 9.6 | — | ||
| Gross margin (%) | 13.7% | — | ||
| Operating margin (%) | 2.4% | — | ||
106
| _______________ | |
| (1) | Operating income does not include financial income, financial expense and results from equity accounting. |
| (2) | As a result of the Politeno Acquisition described under “Item 4. Information On The Company— History and Development of Our Company,” includes fully consolidated results of Politeno for periods as from April 1, 2006. Politeno merged with and into Braskem on April 2, 2007. |
| (3) | As a result of the Ipiranga Transaction, includes fully consolidated results of Copesul and consolidated results of Ipiranga Química and Ipiranga Petroquímica as from April 1, 2007. |
Basic Petrochemicals
Net Sales Revenue.Net sales revenue of the Basic Petrochemicals segment increased by 4.9% in 2007. Net sales revenue generated by sales of basic petrochemicals by our Basic Petrochemicals Unit to our other business units increased by 20.0% in 2007 to R$2,727.0 million from R$2,272.1 million in 2006, primarily as a result of our increased production of polyethylene, polypropylene and PVC due to the increased demand for these products. Net sales revenue generated by sales of basic petrochemicals to third parties declined by 0.5% in 2007 to R$3,663.8 million from R$3,681.3 million in 2006.
Net sales revenue generated by sales of utilities by the Basic Petrochemicals segment to our other segments increased by 10.5% in 2007 to R$177.1 million from R$160.3 million in 2006. Net sales revenue generated by sales of utilities to third parties declined by 6.2% in 2007 to R$351.3 million from R$374.5 million in 2006. Net sales revenue generated by sales of automotive gasoline declined by 23.8% in 2007 to R$301.5 million from R$395.4 million in 2006. Net sales revenue generated by export sales of the Basic Petrochemicals segment increased by 19.6% in 2007 to R$1,189.8 million from R$995.0 million in 2006, primarily as a result of our increased exports of para-xylene due to the availability of this product for export as a result of our temporary closure of our PET plant in May 2007.
Sales volume of automotive gasoline to third parties declined by 18.9% to approximately 310,800 cubic meters in 2007 from approximately 383,100 cubic meters in 2006, primarily as a result of our reallocation of the intermediate products used to produce automotive gasoline to the production of para-xylene and aromatic solvents which yield higher margins. Domestic sales volume of automotive gasoline to third parties declined by 19.3% in 2007, while export sales volume of automotive gasoline declined by 13.7% . The average domestic price for automotive gasoline declined by 5.7% to R$947 per cubic meter in 2007 from R$1,004 per cubic meter in 2006 and the average export price for automotive gasoline declined by 10.1% to R$1,218 per cubic meter in 2007 from R$1,354 per cubic meter in 2006.
The most significant factors contributing to the decline of net sales revenue generated by sales of basic petrochemicals to third parties were a R$150.4 million, or 21.6%, decline in net sales revenue generated by sales of ethylene to third parties, and a R$61.2 million, or 43.7%, decline in net sales revenue generated by sales of coperaf-1 to third parties. The effects of these declines were partially offset by a R$62.1 million, or 34.0%, increase in net sales revenue generated by sales of para-xylene to third parties, as well as a R$55.5 million, or 6.3%, increase in net sales revenue generated by sales of propylene to third parties.
Sales volume of ethylene to third parties declined by 20.6% to approximately 244,300 tons in 2007 from approximately 307,900 tons in 2006, primarily as a result of our consolidation of the results of Politeno for 12 months in 2007 as compared to nine months in 2006 as a result of the Politeno Acquisition on April 6, 2006. Sales of approximately 82,000 tons of ethylene to Politeno in the first quarter of 2006 were accounted for as sales to third parties. Our average price for ethylene declined by 2.5% to R$2,209 per ton in 2007 from R$2,266 per ton in 2006.
Sales volume of coperaf-1 to third parties declined by 41.0% to approximately 50,000 tons in 2007 from approximately 84,800 tons in 2006, primarily as a result of our increased internal use of coperaf-1 as a raw material in our production of other basic petrochemicals during a portion of 2007 when sales of these basic petrochemicals generated greater margins than sales of coperaf-1. Domestic sales volume of coperaf-1 to third parties declined by 25.2% in 2007, while export sales volume of coperaf-1 declined by 82.2% . The average domestic price for coperaf-1 declined by 7.8% to R$1,605 per ton in 2007 from R$1,740 per ton in 2006 and the average export price for coperaf-1 declined by 13.2% to R$1,229 per ton in 2007 from R$1,416 per ton in 2006.
107
Sales volume of para-xylene to third parties increased by 53.5% to approximately 121,400 tons in 2007 from approximately 79,100 tons in 2006, primarily as a result of the increased availability of para-xylene for sale to third parties following the temporary closure of our PET plant in May 2007 and an increase in our production of para-xylene. We made no sales of para-xylene to third parties in the domestic market in 2007, primarily due to the declining demand by PET producers in Brazil for this product as a result of the substitution of lower cost imported polyesther fiber for PET as well as the increased demand for this product by our Mexican customers. Export sales volume of para-xylene to third parties increased by 214.8% in 2007. The average export price for para-xylene declined by 8.6% to were R$2,014 per ton in 2007 from R$2,204 per ton in 2006.
Sales volume of propylene to third parties increased by 5.3% to approximately 459,100 tons in 2007 from approximately 436,000 tons in 2006, primarily as a result of increased domestic demand for propylene and a competitive opportunity available to our company due to delays in deliveries of propylene from some of Petrobras’ refineries to their customers. Domestic sales volume of propylene to third parties increased by 12.1% in 2007, principally due to increased domestic demand for propylene and our reallocation of some of our production from the export market to the domestic market, in which we receive higher margins, while export sales volume of propylene declined by 15.1% . The average domestic price for propylene declined by 0.6% to R$2,094 per ton in 2007 from R$2,106 per ton in 2006, while the average export price for propylene increased by 3.8% to R$1,895 per ton in 2007 from R$1,825 per ton in 2006.
Cost of Sales and Services Rendered and Gross Profit.Cost of sales and services rendered of the Basic Petrochemicals segment increased by 5.8% in 2007. This increase was primarily attributable to the increase in sales volume in 2007. The effect of the increase in sales volume was partially offset by the decline in the average cost of naphtha to R$1,303 per ton in 2007 from R$1,252 per ton in 2006, which resulted principally from the appreciation of thereal against the dollar. Naphtha accounted for 83.1% of the Basic Petrochemicals segment’s cost of sales in 2007 and 86.6% in 2006.
Gross profit of the Basic Petrochemicals segment declined by 1.0% in 2007 and gross margin declined to 12.2% in 2007 compared to 12.9% in 2006.
Operating Income.Operating income of the Basic Petrochemicals segment (which excludes financial income, financial expense and results from equity accounting) increased by 5.6% in 2007, principally as a result of (1) R$15.9 million in other operating income, net, in 2007, primarily as a result of the reclassification of certain revenue, primarily sales of scrap and non-operational products in December 2007, compared to R$10.4 million in other operating expense, net in 2006, and (2) a R$14.4 million decrease in selling general and administrative expenses, primarily as a result of the non-recurrence of losses incurred under certain commodities hedging contracts that we entered into in 2006. These effects were partially offset by a R$9.4 million decline in gross profit. Operating margin of the Basic Petrochemicals segment in 2007 was 7.9% compared to 7.8% in 2006.
Polyolefins
Net Sales Revenue. Net sales revenue of the Polyolefins segment increased by 18.7% in 2007. This increase was primarily attributable to a 23.1% increase in net sales revenue generated by sales of polyethylene, as well as an 11.3% increase in net sales revenue generated by sales of polypropylene. Net sales revenue generated by export sales of the Polyolefins segment increased by 9.3% to R$1,391.3 million in 2007 from R$1,272.8 million in 2006.
Sales volume of polyethylene increased by 9.3% to approximately 426,900 tons in 2007 from approximately 390,500 tons in 2006, primarily as a result of our consolidation of the results of Politeno for 12 months in 2007 as compared to nine months in 2006 as a result of the Politeno Acquisition on April 6, 2006. Domestic sales volume of polyethylene increased by 20.1% in 2007, principally as a result of increased domestic demand, and export sales volume of polyethylene increased by 9.3% . The average domestic price for polyethylene increased by 8.1% to R$3,546 per ton in 2007 from R$3,279 per ton in 2006, while the average export price for polyethylene increased by 1.2% to R$2,774 per ton in 2007 from R$2,741 per ton in 2006.
Sales volume of polypropylene increased by 7.9% to approximately 571,600 tons in 2007 from approximately 529,900 tons in 2006, principally due to increased capacity utilization rates at our propylene plants. Domestic sales volume of polypropylene increased by 9.1% in 2007, principally due to increased domestic demand, while export sales volume of polypropylene increased by 0.4% . The average domestic price for polypropylene increased by 3.0% to R$3,444 per ton in 2007 from R$3,344 per ton in 2006, while the average export price for polypropylene increased by 2.5% to R$2,681 per ton in 2007 from R$2,614 per ton in 2006.
108
Cost of Sales and Gross Profit. Cost of sales of the Polyolefins segment increased by 16.3% in 2007, primarily as a result of a 13.1% increase in the total sales volume of our Polyolefins Unit as a result of our consolidation of the results of Politeno for 12 months in 2007 as compared to nine months in 2006. Our Polyolefins Unit’s average cost for ethylene increased by 9.6% in 2007, and our Polyolefins Unit’s average cost for propylene increased by 1.9% in 2007.
Gross profit of the Polyolefins segment increased by 30.7% in 2007, and gross margin increased to 18.2% in 2007 compared to 16.6% in 2006.
Operating income.Operating income of the Polyolefins segment (which excludes financial income, financial expense and results from equity accounting) increased by 26.1% in 2007, principally as a result of a R$242.6 million increase in gross profit, the effects of which were partially offset by (1) a 24.0% increase in selling, general and administrative expenses, primarily due to our consolidation of the results of Politeno for 12 months in 2007 as compared to nine months in 2006 as a result of the Politeno Acquisition on April 6, 2006, and an increase in logistics expenses principally due to the increase in export sales, and (2) R$14.4 million in other operating expense, net, in 2007, principally composed of selling expenses that were reclassified as other operating expenses, primarily in December 2007, compared to R$22.5 million in other operating income, net in 2006, principally composed of non-recurring revenue recovery of R$13.1 million in connection with the reversal of a PIS tax provision in 2006. Operating margin of the Polyolefins segment in 2007 was 10.2% compared to 9.6% in 2006.
Vinyls
Net Sales Revenue. Net sales revenue of the Vinyls segment increased by 16.1% in 2007. This increase was primarily attributable to a 20.7% increase in net sales revenue generated by domestic sales of PVC. Net sales revenue generated by export sales of this segment increased by 25.8% to R$151.3 million in 2007 from R$120.2 million in 2006.
Sales volume of PVC increased by 16.5% to approximately 504,000 tons in 2007 from approximately 432,800 tons in 2006, principally as a result of an increase in opportunities to sell PVC due to a global imbalance in the supply and demand for PVC. Domestic sales volume of PVC increased by 16.1% in 2007, principally due to an increase in domestic demand, while export sales volume of PVC increased by 20.5%, principally due to increased global demand for PVC that outpaced increased production. The average domestic price for PVC increased by 3.9% to R$2,616 per ton in 2007 from R$2,518 per ton in 2006, while the average export price for PVC increased by 0.9% to R$2,000 per ton in 2007 from R$1,982 per ton in 2006.
Cost of Sales and Gross Profit. Cost of sales of the Vinyls segment increased by 15.5% in 2007, primarily as a result of the increased volume of sales of this segment and a 4.4% increase in the average price of ethylene.
Gross profit of the Vinyls segment increased by 18.5% in 2007, while gross margin increased to 19.6% in 2007 from 19.2% in 2006.
Operating Income. Operating income of the Vinyls segment (which excludes financial income, financial expense and results from equity accounting) declined by 16.7% in 2007, primarily as a result of a 64.0% increase in selling, general and administrative expenses as a result of increased accruals for profit sharing and increased storage and distribution expenses, which was partially offset by a R$54.9 million increase in gross profit. The operating margin of the Vinyls segment declined to 9.7% in 2007 from 13.5% in 2006.
Business Development
Net Sales Revenue. Net sales revenue of our Business Development segment increased by 1.4% in 2007. This increase was primarily attributable to the 5.2% increase in net sales revenue generated by sales of caprolactam in 2007, the effects of which were partially offset by a 4.6% decline in net sales revenue generated by sales of PET in 2007. Net sales revenue generated by export sales of this segment increased to R$128.7 million in 2007 from R$120.9 million in 2006.
109
Sales volume of caprolactam increased by 3.4% to approximately 45,000 tons in 2007 from approximately 43,500 tons in 2006. Domestic sales volume of caprolactam decreased by 29.0% primarily as a result of the shutdown of the plant of one of our domestic customers in June 2006, while export sales volume of caprolactam increased by 50.4% in 2007, primarily as a result of our reallocation of our production to the export market following this plant closure. The average export price for caprolactam increased by 2.4% to R$4,478 per ton in 2007 from R$4,374 per ton in 2006, and the average domestic price for caprolactam increased by 6.3% to R$5,266 per ton in 2007 from R$4,954 per ton in 2006.
Sales volume of PET declined by 3.7% to approximately 61,600 tons in 2007 from approximately 64,000 tons in 2006. Domestic sales volume of PET increased by 19.3% in 2007 primarily as a result of our successful efforts to persuade our domestic PET customers to substitute our products for imported products that they had been consuming, while exports sales volume of PET declined to approximately 1,300 tons in 2007 from approximately 13,400 tons in 2006, primarily as a result of the reduced volume of PET available to export as a result of the recovery of our domestic sales. The average domestic price for PET declined by 3.4% to R$2,915 per ton in 2007 from R$3,019 per ton in 2006, while the average export price for PET increased by 4.9% to R$2,774 per ton in 2007 from R$2,644 per ton in 2006.
Cost of Sales and Gross Loss. Cost of sales of the Business Development segment declined by 6.5% in 2007. Gross loss of the Business Development segment decreased to a gross loss of R$20.6 million in 2007 from a gross loss of R$62.6 million in 2006, resulting in a negative gross margin of 4.2% in 2007 compared to a negative gross margin of 13.0% in 2006.
Operating Loss. Operating loss of the Business Development segment (which excludes financial income, financial expense and results from equity accounting) declined by 31.0%, principally as a result of the R$42.0 million decline in gross loss described above, the effects of which were partially offset by R$22.8 million in other operating expenses, net, in 2007, primarily as a result of the reclassification of some of our selling expenses as other operating expenses, particularly in June 2007, compared to R$1.9 million in other operating income, net in 2006. Operating margin of the Business Development segment was (12.2)% in 2007 compared to an operating margin of (18.0)% in 2006.
Copesul
Net Sales Revenue.Net sales revenue of the Copesul segment was R$5,516.1 million in the nine months ended December 31, 2007 (the period in 2007 in which we have fully consolidated the results of Copesul in our financial statements). Net sales revenue generated by sales of basic petrochemicals by the Copesul segment to our other segments was R$2,670.3 million, representing 48.4% of the net sales revenue of this segment. Net sales revenue generated by sales of basic petrochemicals to third parties was R$1,713.2 million, representing 31.1% of the net sales revenue of this segment.
Net sales revenue generated by sales of condensate was R$788.7 million, representing 14.3% of the net sales revenue of this segment. Net sales revenue generated by sales of utilities to third parties was R$92.9 million, representing 1.7% of the net sales revenue of this segment. Net sales revenue generated by sales of automotive gasoline was R$251.0 million, representing 4.6% of the net sales revenue of this segment. Net sales revenue generated by export sales of the Copesul segment was R$865.4 million, representing 15.7% of the net sales revenue of this segment.
Sales to third parties of the Copesul segment primarily consisted of:
110
Sales volume of condensate to third parties was approximately 746,400 tons in the nine months ended December 31, 2007. Our average price for condensate was R$1,057 per ton in the nine months ended December 31, 2007. Sales volume of benzene to third parties was approximately 236,100 tons in the nine months ended December 31, 2007. Our average price for benzene was R$2,064 per ton in the nine months ended December 31, 2007. Sales volume of ethylene to third parties was approximately 191,900 tons in the nine months ended December 31, 2007. Our average price for ethylene was R$2,297 per ton in the nine months ended December 31, 2007.
Cost of Sales and Services Rendered and Gross Profit.Cost of sales and services rendered of the Copesul segment was R$4,924.7 million in the nine months ended December 31, 2007. The average cost of naphtha, which represented 88.9% of the cost of sales and services rendered of the Copesul segment, was R$1,314 per ton in the nine months ended December 31, 2007.
Gross profit of the Copesul segment was R$591.4 million in the nine months ended December 31, 2007 and gross margin was 10.7% in the nine months ended December 31, 2007.
Operating Income.Operating income of the Copesul segment (which excludes financial income, financial expense and results from equity accounting) was R$509.3 million in the nine months ended December 31, 2007. Operating margin of the Copesul segment in the nine months ended December 31, 2007 was 9.2% .
Ipiranga Petroquímica
Net Sales Revenue. Net sales revenue of the Ipiranga Petroquímica segment was R$1,551.4 million in the nine months ended December 31, 2007 (the period in 2007 in which we have consolidated the results of Ipiranga Petroquímica in our financial statements). Net sales revenue from sales of polyethylene were R$1,179.2 million, representing 76.0% of the net sales revenue of this segment in the nine months ended December 31, 2007, and net sales revenue from sales of polypropylene were R$372.2 million, representing 24.0% of the net sales revenue of this segment. Net sales revenue generated by export sales of the Ipiranga Petroquímica segment was R$410.8 million in the nine months ended December 31, 2007.
Sales volume of polyethylene was approximately 350,700 tons in the nine months ended December 31, 2007. Domestic sales volume of polyethylene was approximately 226,300 tons, and export sales volume of polyethylene was approximately 124,400 tons. The average domestic price for polyethylene was R$3,749 per ton in the nine months ended December 31, 2007, while the average export price for polyethylene was R$2,658 per ton in the nine months ended December 31, 2007.
Sales volume of polypropylene was approximately 111,000 tons in the nine months ended December 31, 2007. Domestic sales volume of polypropylene was approximately 78,700 tons in the nine months ended December 31, 2007, while export sales volume of polypropylene was approximately 32,300 tons. The average domestic price for polypropylene was R$3,713 per ton in the nine months ended December 31, 2007, while the average export price for polypropylene was R$2,479 per ton in the nine months ended December 31, 2007.
Cost of Sales and Gross Profit. Cost of sales of the Ipiranga Petroquímica segment was R$1,232.5 million in the nine months ended December 31, 2007. The Ipiranga Petroquímica segment’s average cost for ethylene was R$2,303 per ton during the nine months ended December 31, 2007, and the Ipiranga Petroquímica segment’s average cost for propylene was R$2,230 per ton during the nine months ended December 31, 2007.
Gross profit of the Ipiranga Petroquímica segment was R$318.9 million in the nine months ended December 31, 2007, and gross margin was 20.6% in the nine months ended December 31, 2007.
Operating Income.Operating income of the Ipiranga Petroquímica segment (which excludes financial income, financial expense and results from equity accounting) was R$202.1 million in the nine months ended December 31, 2007. Operating margin of the Ipiranga Petroquímica segment in the nine months ended December 31, 2007 was 13.0% .
111
Ipiranga Química
Net Sales Revenue. Net sales revenue of the Ipiranga Química segment was R$392.6 million in the nine months ended December 31, 2007 (the period in 2007 in which we have consolidated the results of Ipiranga Química in our financial statements). Net sales revenue from sales of solvents was R$136.4 million, representing 34.7% of the net sales revenue of this segment in the nine months ended December 31, 2007, net sales revenue from sales of polymers was R$106.3 million, representing 27.1% of the net sales revenue of this segment, and net sales revenue from sales of general purpose chemicals was R$41.1 million, representing 38.2% of the net sales revenue of this segment. Sales volume of solvents was approximately 62,000 tons in the nine months ended December 31, 2007, sales volume of polymers was approximately 26,900 tons, and sales volume of general purpose chemicals was approximately 56,800 tons.
Cost of Sales and Gross Profit. Cost of sales of the Ipiranga Química segment was R$338.9 million in the nine months ended December 31, 2007. Gross profit of the Ipiranga Química segment was R$53.7 million in the nine months ended December 31, 2007, and gross margin was 13.7% in the nine months ended December 31, 2007.
Operating Income.Operating income of the Ipiranga Química segment (which excludes financial income, financial expense and results from equity accounting) was R$9.6 million in the nine months ended December 31, 2007. Operating margin of the Ipiranga Química segment in the nine months ended December 31, 2007 was 2.4% .
Year Ended December 31, 2006 Compared with Year Ended December 31, 2005
Consolidated Results
The following table sets forth consolidated financial information for the years ended December 31, 20042006 and 2003.2005.
| Year Ended December 31, | ||||||||
| 2004 | 2003 | |||||||
| (In millions ofreais) | ||||||||
Net sales revenue | R$ | 12,192.0 | R$ | 10,135.8 | ||||
Cost of sales and services rendered | (9,078.3 | ) | (8,089.3 | ) | ||||
Gross profit | 3,113.7 | 2,046.5 | ||||||
Selling, general and administrative expenses | (650.0 | ) | (471.9 | ) | ||||
Investment in associated companies, net(1) | (90.9 | ) | (158.2 | ) | ||||
Depreciation and amortization | (359.4 | ) | (193.5 | ) | ||||
Financial expenses, net | (1,230.7 | ) | (703.6 | ) | ||||
Other operating income | 41.6 | 49.7 | ||||||
Operating income | 824.3 | 569.0 | ||||||
Non-operating expenses, net | (29.9 | ) | (4.8 | ) | ||||
Income before income tax and social contribution and minority interest | 794.4 | 564.2 | ||||||
Income tax and social contribution | (78.9 | ) | (122.9 | ) | ||||
Income before minority interest | 715.5 | 441.3 | ||||||
Minority interest | (24.6 | ) | (226.2 | ) | ||||
Net income for the year | R$ | 690.9 | R$ | 215.1 | ||||
| Year Ended December 31, | ||||
| 2006(1) | 2005 | |||
| (in millions ofreais) | ||||
| Net sales revenue | R$ 12,992.7 | R$ 13,075.1 | ||
| Cost of sales and services rendered | (10,792.1) | (10,361.7) | ||
| Gross profit | 2,200.6 | 2,713.4 | ||
| Selling, general and administrative expenses | (951.5) | (787.1) | ||
| Depreciation and amortization | (385.0) | (355.6) | ||
| Other operating income, net | 186.1 | 22.8 | ||
| Results from equity accounting(2) | (28.8) | (109.8) | ||
| Financial expenses, net | (938.4) | (709.4) | ||
| Operating income | 83.0 | 774.3 | ||
| Non-operating expenses, net | 7.1 | (25.2) | ||
| Income before income tax and social contribution and minority interest | 90.1 | 749.1 | ||
| Income tax and social contribution | 12.8 | (177.3) | ||
| Income before minority interest | 102.9 | 571.8 | ||
| Minority interest | (1.6) | 54.0 | ||
| Net income | R$ 101.3 | R$ 625.8 | ||
| ______________ | |
| (1) | |
| (2) | Results from equity accounting comprises the following line items in |
Net Sales Revenue
Net sales revenue increased by 20.3% in 2004, primarily as a result of the growth in net sales revenue in each of our segments (as discussed below)(negative goodwill), particularly the 36.0% growth in net sales revenue of our Basic Petrochemicals segment and the 35.5% growth in net sales revenue of our Vinyls segment. Without giving effect to the proportional consolidation of our jointly controlled companies, our net sales revenue increased by 20.2% in 2004.
Cost of Sales and Services Rendered and Gross Profit
Cost of sales and services rendered increased by 12.2% in 2004, primarily as a result of the 29.6% growth in cost of sales and services rendered of our Basic Petrochemicals segment, as well as the 14.9% growth in cost of sales of our Vinyls segment and the 35.5% growth in the cost of sales of our Business Development segment. The increases in cost of sales and services rendered of each of these segments was primarily related to the higher overall direct and indirect cost of naphtha as a result of higher international market prices of naptha. Without giving effect to the proportional consolidation of our jointly controlled companies, our cost of sales and services rendered increased by 13.1% in 2004.
As a result, gross profit increased by 52.1% in 2004. Without giving effect to the proportional consolidation of our jointly controlled companies, gross profit increased by 48.1% in 2004.
Gross profit as a percentage of net sales revenue, or gross margin, for 2004 was 25.5% compared to 20.2% in 2003. Without giving effect to the proportional consolidation of our jointly controlled companies, gross margin increased to 24.8% for 2004 compared to 20.1% in 2003.
Selling, General and Administrative Expenses
Selling, general and administrative expenses increased by 37.7% in 2004, primarily as a result of:
Selling, general and administrative expenses represented 5.3% of net sales revenue in 2004 compared to 4.7% of net sales revenue in 2003. Without giving effect to the proportional consolidation of our jointly controlled companies, selling, general and administrative expenses increased by 44.6% in 2004, and selling, general and administrative expenses represented 5.3% of net sales revenue in 2004 compared to 4.4% of net sales revenue in 2003.
Investment in Associated Companies, Net
Investment in associated companies, net, decreased by 42.5% in 2004, primarily as a result of a decrease in amortization of goodwill, principally related to Copesul and Politeno, partially offset by reduced tax incentive benefits and by the R$9.6 million foreign exchange loss recorded in 2004 compared to the R$22.4 million foreign exchange gain recorded in 2003. Without giving effect to the proportional consolidation of our jointly controlled companies, investment in associated companies, net, was a gain of R$73.7 million in 2004 compared to an expense of R$119.4 million in 2003.
Depreciation and Amortization
Depreciation and amortization increased by 85.7% in 2004, primarily as a result of:
Without giving effect to the proportional consolidation of our jointly controlled companies depreciation and amortization increased by 88.0% in 2004.
Financial Expenses, Net
Financial expenses, net, increased by 74.9% in 2004, primarily as a result of the effects of thereal/U.S. dollar exchange rate on our U.S. dollar-denominated and U.S. dollar-indexed assets and liabilities and the increased principal amount of foreign-currency denominated debt in 2004. The 8.9% appreciation of therealagainst the U.S. dollar in 2004 resulted in:
As a result of the 22.3% appreciation of therealagainst the U.S. dollar in 2003, we recorded:
Without giving effect to the proportional consolidation of our jointly controlled companies, financial expenses, net increased by 79.8% in 2004.
Other Operating Income, Net
Other operating income, net decreased by 16.3% in 2004, primarily as a result of:
These effects were partially offset by the positive effect of our no longer recording taxes on intercompany sales to OPP Química and Nitrocarbono following the mergers of these companies with us in 2004, which taxes amounted to R$24.2 million in 2003. Without giving effect to the proportional consolidation of our jointly controlled companies, other operating income, net decreased by 31.3%.
Operating Income
Operating income increased by 44.9% in 2004. Operating income represented 6.8% of net sales revenue in 2004 compared to 5.6% of net sales revenue in 2003. Without giving effect to the proportional consolidation of our jointly controlled companies, operating income increased by 37.0% in 2004 and represented 6.6% of net sales revenue in 2004 compared to 5.8% of net sales revenue in 2003.
Non-Operating Expenses, Net
Non-operating expenses, net increased to R$29.9 million in 2004 compared to R$4.8 million in 2003. This increase resulted primarily from a reversal of a loss on investment of R$26.9 million in 2003. Without giving effect to the proportional consolidation of our jointly controlled companies, non-operating expenses increased to R$29.2 million in 2004 compared to R$4.6 million in 2003.
Income Tax and Social Contribution
Income tax and social contribution decreased by 35.8% in 2004. This decrease resulted primarily from the increase in deferred income tax of R$20.4 million in 2003 to R$138.4 million in 2004. Without giving effect to the proportional consolidation of our jointly controlled companies, income tax and social contribution was a benefit of R$10.5 million compared to an expense of R$91.8 million.
Minority Interest
Minority interest decreased by 89.1% in 2004, primarily as a result of elimination of the minority interest in Trikem as a result of our merger with Trikem in January 2004. Without giving effect to the proportional consolidation of our jointly controlled companies, minority interest also decreased by 89.1% in 2004.
Net Income
We recorded net income of R$690.9 million, or 5.7% of net sales revenue, in 2004 compared to net income of R$215.1 million, or 2.1% of net sales revenue, in 2003.
Business Segment Results
The following table sets forth consolidated financial information for our business segments for the years ended December 31, 2004 and 2003.
| Year Ended December 31, | ||||||||
| 2004 | 2003 | |||||||
Consolidated (in millions ofreais, except percentages) | ||||||||
Basic Petrochemicals | ||||||||
Net sales revenue | R$ | 6,480.0 | R$ | 4,765.3 | ||||
Cost of sales | (5,330.1 | ) | (4,111.5 | ) | ||||
Gross profit | 1,149.9 | 653.8 | ||||||
Operating income(1) | 955.7 | 499.9 | ||||||
Gross margin (%) | 17.7 | % | 13.7 | % | ||||
Operating margin (%) | 14.7 | % | 10.5 | % | ||||
Polyolefins | ||||||||
Net sales revenue | R$ | 3,489.4 | R$ | 3,386.8 | ||||
Cost of sales | (2,523.0 | ) | (2,719.7 | ) | ||||
Gross profit | 966.4 | 667.1 | ||||||
Operating income(1) | 767.7 | 529.5 | ||||||
Gross margin (%) | 27.7 | % | 19.7 | % | ||||
Operating margin (%) | 22.0 | % | 15.6 | % | ||||
Vinyls | ||||||||
Net sales revenue | R$ | 1,858.8 | R$ | 1,371.8 | ||||
Cost of sales | (1,157.1 | ) | (1,007.0 | ) | ||||
Gross profit | 701.7 | 364.8 | ||||||
Operating income(1) | 635.9 | 313.7 | ||||||
Gross margin (%) | 37.8 | % | 26.6 | % | ||||
Operating margin (%) | 34.2 | % | 22.9 | % | ||||
Business Development | ||||||||
Net sales revenue | R$ | 620.8 | R$ | 455.3 | ||||
Cost of sales | (564.9 | ) | (416.8 | ) | ||||
Gross profit | 55.9 | 38.5 | ||||||
Operating income(1) | 32.9 | 28.8 | ||||||
Gross margin (%) | 9.0 | % | 8.5 | % | ||||
Operating margin (%) | 5.3 | % | 6.3 | % | ||||
Basic Petrochemicals
Net Sales Revenue. Net sales revenue of the Basic Petrochemicals segment increased by 36.0% in 2004. Significant factors contributing to this increase were:
Sales of basic petrochemicals by our Basic Petrochemicals segment to our other segments increased by 65.6% in 2004 to R$1,508.1 million from R$910.7 million in 2003, and sales of utilities by our Basic Petrochemicals segment to our other segments increased by 19.4% in 2004 to R$123.9 million from R$103.8 million in 2003. Sales of utilities to third parties increased by 4.6% in 2004 to R$293.6 million from R$280.7 million in 2003. Net export sales of the Basic Petrochemicals segment increased by 52.9% in 2004 to R$946.1 million from R$618.8 million in 2003.
Export sales volume of benzene increased by 20.3% to 169.5 thousand tons in 2004 from 140.9 thousand tons in 2003, principally due to our strategic decision to increase our exports of benzene to take advantage of the high prices available in the international market. As a result, domestic sales volume of benzene to third parties declined by 2.2% to 154.4 thousand tons in 2004 from 157.9 thousand tons in 2003. Average export prices for benzene increased by 82.2% to R$2,359 per ton in 2004 from R$1,295 per ton in 2003, while average domestic prices for benzene increased by 58.9% to R$2,395 per ton in 2004 from R$1,507 per ton in 2003.
Domestic sales volume of ethylene to third parties increased by 0.5% to 561.8 thousand tons in 2004 from 559.1 thousand tons in 2003. Average domestic prices for ethylene increased by 21.4% to R$2,057 per ton in 2004 from R$1,694 per ton in 2003.
Domestic sales volume of propylene to third parties increased by 4.1% to 415.6 thousand tons in 2004 from 399.2 thousand tons in 2003, principally due to increased demand by other second generation producers of petrochemicals derived from propylene as a result of the economic recovery in Brazil. Average domestic prices for propylene increased by 18.9% to R$1,777 per ton in 2004 from R$1,495 per ton in 2003.
Cost of Sales and Services and Gross Profit. Cost of sales and services of the Basic Petrochemicals segment increased by 29.6% in 2004. This increase was primarily attributable to the increase in the average cost of naphtha to R$1,077.2 per ton in 2004 from R$886.1 per ton in 2003 as well as the increase in sales volume in 2004. Naphtha accounted for 82.4% of the Basic Petrochemicals segment’s cost of sales in 2004 and 84.6% in 2003.
Gross profit of the Basic Petrochemicals segment increased by 75.9% in 2004 and gross margin increased to 17.7% in 2004 compared to 13.7% in 2003.
Operating Income. Operating income of the Basic Petrochemicals segment (which excludes financial income and expense and results from investment in associated companies) increased by 91.2% in 2004, principally as a result of a R$496.1 million increase in gross profit. Operating margin of the Basic Petrochemicals segment in 2004 was 14.7% compared to 10.5% in 2003.
Polyolefins
Net Sales Revenue. Net sales revenue of the Polyolefins segment increased by 3.0% in 2004. This increase was primarily attributable to:
The effects of these increases were substantially offset by the elimination of certain export transactions that were undertaken in 2003 to support export finance transactions and that were included in export sales of this segment. Net export sales of the Polyolefins segment decreased by 45.0% to R$678.6 million 2004 from R$1,233.7 million in 2003.
Domestic sales volume of polyethylene increased by 11.8% to 498.7 thousand tons in 2004 from 446.1 thousand tons in 2003, principally due to increased sales of flexible packaging for food, particularly frozen meat for export, snacks and cookies, as well as long shelf-life beverages. Average domestic prices for polyethylene increased by 16.2% to R$2,984 per ton in 2004 from R$2,567 per ton in 2003.
Domestic sales volume of polypropylene increased by 11.6% to 418.5 thousand tons in 2004 from 374.9 thousand tons in 2003, principally due to the performance of the automotive and the electrical/electronic industries and agricultural sectors. Average domestic prices for polypropylene increased by 17.3% to R$3,155 per ton in 2004 from R$2,689 per ton in 2003.
Export sales volume of polyethylene decreased by 7.2% to 205.9 thousand tons in 2004 from 221.9 thousand tons in 2003, principally due to our decision to sell a greater volume of polyethylene products domestically in light of increased demand in the domestic market. Average export prices for polyethylene increased by 31.9% to R$2,733 per ton in 2004 from R$2,072 per ton in 2003.
Cost of Sales and Gross Profit. Cost of sales of the Polyolefins segment decreased by 7.2% in 2004 compared to 2003 despite the 5.1% increase in sales volume, primarily as a result of the cessation of purchases related to certain export transactions that were undertaken in 2003 to support export finance transactions. This effect was partially offset by a 22.5% increase in the cost of ethylene and a 13.7% increase in the cost of propylene.
Gross profit of the Polyolefins segment increased by 44.9% in 2004, while gross margin increased to 27.7% in 2004 compared to 19.7% in 2003.
Operating Income. Operating income of the Polyolefins segment (which excludes financial income and expenses and results from investment in associated companies) increased by 45.0% in 2004, primarily as a result of a R$299.3 million increase in gross profit. This effect was partially offset by a R$59.8 million increase in selling, general and administrative expenses as a result of higher sales volumes of polyolefins in the domestic market and an increase in the provision for doubtful accounts of this segment. Operating margin of the Polyolefins segment increased to 22.0% in 2004 compared to 15.6% in 2003.
Vinyls
Net Sales Revenue. Net sales revenue of the Vinyls segment increased by 35.5% in 2004. This increase was primarily attributable to a 46.6% increase in domestic sales of PVC, supplemented by a 61.9% increase in export sales of EDC and a 17.8% increase in domestic sales of caustic soda. Net export sales of this segment increased by 25.8% to R$256.2 million in 2004 from R$203.7 million in 2003.
Domestic sales volume of PVC increased by 15.2% to 394.4 thousand tons in 2004 from 342.4 thousand tons in 2003, principally due to increased sales by the footwear, laminate and wire and cable industries, as well as by the commencement of a recovery of the construction sector. Average domestic prices for PVC increased by 27.3% to R$3,042 per ton in 2004 from R$2,390 per ton in 2003.
Export sales volume of EDC decreased by 1.6% to 157.6 thousand tons in 2004 from 160.1 thousand tons in 2003. Average export prices for EDC increased by 64.4% to R$1,118 per ton in 2004 from R$680 per ton in 2003.
Domestic sales volume of caustic soda increased by 4.1% to 444.0 thousand tons in 2004 from 426.6 thousand tons in 2003, principally due to the increased demand of our clients in the aluminum, paper and cellulose industries. Average domestic prices for caustic soda increased by 13.1% to R$770 per ton in 2004 from R$681 per ton in 2003.
Cost of Sales and Gross Profit. Cost of sales of the Vinyls segment increased by 14.9% in 2004 compared to 2003. This increase was primarily attributable to increases in some of our production costs, principally due to a 17.1% increase in the cost of ethylene, and an increase of 4.7% in the total sales volume of this segment.
Gross profit of the Vinyls segment increased by 92.4% in 2004, while gross margin increased to 37.8% in 2004 from 26.6% in 2003.
Operating Income. Operating income of the Vinyls segment (which excludes financial income and expenses and results from investment in associated companies) increased by 102.7% in 2004, primarily as a result of a R$336.9 million increase in gross profit. This effect was partially offset by a R$25.3 million increase in selling, general and administrative expenses, primarily as a result of the increase of our domestic sales volume of vinyls and an increase in the provision for doubtful accounts of this segment. The operating margin of the Vinyls segment increased to 34.2% in 2004 from 22.9% in 2003.
Business Development
Our Business Development Unit is responsible for managing certain of our minority investments, principally our investments in Petroflex and Cetrel. However, as the results of our investments managed by our Business Development Unit are reported as investments in associated companies, the results of these companies are not included in the following segment discussion.
Net Sales Revenue. Net sales revenue of our Business Development segment increased by 36.3% in 2004. This increase was primarily attributable to a 41.7% increase in domestic sales of PET during 2004, a 27.6% increase in domestic sales of caprolactam during 2004 and an increase in exports of PET to R$26.2 million in 2004 compared to R$3.5 million in 2003. Net export sales of this segment increased to R$56.8 million in 2004 from R$34.4 million in 2003.
Domestic sales volume of PET increased by 20.1% to 66.2 thousand tons in 2004 from 55.1 thousand tons in 2003, primarily as a result of the increase in our PET plant’s annual production capacity from 70,000 tons to 78,000 tons during 2004. Average domestic sales prices of PET increased by 18.0% to R$3,605 per ton in 2004 from R$3,056 per ton in 2003.
Domestic sales volume of caprolactam increased by 1.2% to 43.0 thousand tons in 2004 from 42.5 thousand tons in 2003. Average domestic sales prices of caprolactam increased by 26.2% to R$5,349 per ton in 2004 from R$4,237 per ton in 2003.
Export sales volume of PET was 8.1 thousand tons in the 2004 compared to 1.2 thousand tons in 2003. Average export sales prices of PET increased by 12.0% to R$3,235 per ton in 2004 from R$2,888 per ton in 2003.
Cost of Sales and Gross Profit. Cost of sales of the Business Development segment increased by 35.5% in 2004, primarily reflecting increases in some of our production costs, primarily a 65.7% increase in the cost of benzene, and the effects of a 5.9% increase in sales volume of this segment. Gross profit of the Business Development segment increased by 45.2% in 2004, resulting in a gross margin of 9.0% compared to 8.5% in 2003.
Operating Income. Operating income of the Business Development segment (which excludes financial income and expenses and results from investment in associated companies) increased by 14.2% in 2004, principally as a result of a R$17.4 million increase in gross profit. Operating margin of the Business Development segment decreased to 5.3% in 2004 from 6.3% in 2003.
Year Ended December 31, 2003 Compared with Year Ended December 31, 2002
Consolidated and Combined Results
The following table sets forth consolidated and combined financial information for the two years ended December 31, 2003 and 2002.
| Year Ended December 31, | ||||||||
| 2003 | 2002 | |||||||
| Consolidated | Combined | |||||||
| (In millions ofreais) | ||||||||
Net sales revenue | R$ | 10,135.8 | R$ | 7,576.6 | ||||
Cost of sales and services rendered | (8,089.3 | ) | (6,175.5 | ) | ||||
Gross profit | 2,046.5 | 1,401.1 | ||||||
Selling, general and administrative expenses | (471.9 | ) | (577.7 | ) | ||||
Investment in associated companies, net(1) | (158.2 | ) | (251.7 | ) | ||||
Depreciation and amortization | (193.5 | ) | (222.4 | ) | ||||
Financial expenses, net | (703.6 | ) | (2,861.9 | ) | ||||
Other operating income | 49.7 | 1,132.7 | ||||||
Operating income (loss) | 569.0 | (1,379.9 | ) | |||||
Non-operating expenses, net | (4.8 | ) | (98.0 | ) | ||||
Income (loss) before income tax and social contribution and minority interest | 564.2 | (1,477.9 | ) | |||||
Income tax and social contribution | (122.9 | ) | (89.8 | ) | ||||
Income (loss) before minority interest | 441.3 | (1,567.7 | ) | |||||
Minority interest | (226.2 | ) | 189.0 | |||||
Net income (loss) for the year | R$ | 215.1 | R$ | (1,378.7 | ) | |||
112
Net Sales Revenue
Net sales revenue increaseddeclined by 33.8%0.6% in 2003,2006, primarily as a result of the growtha 4.7% decline in net sales revenue in each of our segments (as discussed below), particularly the 36.2% growth in net sales revenue of our Basic Petrochemicals segment, and the 36.4% growtha 14.1% decline in net sales of our Vinyls segment, a 12.8% decline in the contribution to our net sales revenue by our jointly controlled companies, and a 15.1% decline in net sales of our Business Development segment. The effects of these declines were partially offset by a 21.9% increase in net sales of our Polyolefins segment. Without giving effect to the proportional consolidation of our jointly controlled companies, our net sales revenue increased by 33.8%0.9% in 2003.2006.
Cost of Sales and Services Rendered and Gross Profit
Cost of sales and services rendered increased by 31.0%4.2% in 2003, primarily as2006, principally due to a result of25.2% increase in the growth in cost of sales in each of our segments, particularly the 36.8% growth in cost of sales and services rendered of our Basic Petrochemicals segment and the 31.9% growth in cost of sales of our Polyolefins segment bothprimarily related to the greater direct and indirect cost of naphtha.Politeno Acquisition. Without giving effect to the proportional consolidation of our jointly controlled companies, our cost of sales and services rendered increased by 30.4%6.0% in 2003.2006.
As a result, gross profit increaseddeclined by 46.1%18.9% in 2003.2006. Without giving effect to the proportional consolidation of our jointly controlled companies, gross profit increaseddeclined by 49.3%20.0% in 2003.2006.
Gross profit as a percentage of net sales revenue, or gross margin, for 20032006 was 20.2%16.9% compared to 18.5%20.8% in 2002.2005. Without giving effect to the proportional consolidation of our jointly controlled companies, gross margin increaseddecreased to 20.1%15.7% for 20032006 compared to 18.0%19.8% in 2002.
Selling, General and Administrative Expenses
Selling, general and administrative expenses decreasedincreased by 18.3%20.9% in 2003,2006, primarily as a result of (1) a R$30 million increase in distribution logistics and storage expenses, primarily as a result of increased geographic diversity of our customers, (2) a R$25 million increase in export expenses and a R$5 million increase in fixed costs, primarily as a result of our increased export sales and our establishment of sales offices in Argentina and The Netherlands, (3) a R$16 million increase in the incurrence ofprovision for doubtful accounts, primarily due to an adjustment to the provision for doubtful accounts at Politeno to align Politeno’s provision with our criteria for this provision, and (4) R$15 million in non-recurring expenses in 2002 in an aggregate amount of R$136.0 million arising from our mergers with OPP Produtos and 52114 Participações andrelating to the integration into our companyof Politeno and restructuring of the companies that we acquiredPolyolefins, PET and with whom we merged. Our ongoing integration process generated efficiencies that reduced our selling, general and administrative expenses in both periods, particularly in 2003.caprolactam businesses.
Selling, general and administrative expenses represented 4.7%7.3% of net sales revenue in 20032006 compared to 7.6%6.0% of net sales revenue in 2002.2005. Without giving effect to the proportional consolidation of our jointly controlled companies, selling, general and administrative expenses decreasedincreased by 23.3%29.3% in 2003,2006, and selling, general and administrative expenses represented 4.4%7.5% of net sales revenue in 20032006 compared to 7.6%5.8% of net sales revenue in 2002.2005.
Depreciation and Amortization
InvestmentDepreciation and amortization increased by 8.3% in Associated Companies, Net
Investment in associated companies, net, decreased by 37.1% in 2003,2006, primarily as a result of the effect of tax benefits from our associated companiesincreases in property, plant and a decrease of the amortization of goodwill. Without giving effect to the proportional consolidation of our jointly controlled companies, investment in associated companies, net, decreased by 61.9% in 2003.
Depreciation and Amortization
Depreciation and amortization decreased by 13.0% in 2003, primarilyequipment as a result of decrease(1) the merger of depreciationPolialden with our company on May 31, 2006, (2) the reclassification of programmed maintenance shutdown expenses as property, plant and amortization from proportional consolidationequipment on January 1, 2006, and (3) our capital expenditures in connection with the implementation of our jointly controlled companies.Formula Braskem. Without giving effect to the proportional consolidation of our jointly controlled companies, depreciation and amortization increased by 9.1%8.4% in 2003.2006.
113
Other Operating Income, Net
Financial Expenses, Net
Financial expenses,Other operating income, net decreased by 75.4%increased to R$186.1 million in 2003,2006 compared to R$22.8 million in 2005, primarily as a result of the effects of thereal/U.S. dollar exchange rate on our U.S. dollar-denominated and U.S. dollar-indexed assets and liabilities. The 34.3% devaluation of therealagainst the U.S. dollar in 2002 resulted in(1) a financial expensenon-recurring revenue recovery of R$2,076.1112.0 million related toin connection with the exchange rate effect on our U.S. dollar-denominated and U.S. dollar-indexed liabilities and financial incomereversal of R$137.5 million related to the exchange rate effect on our U.S. dollar-denominated assets. By contrast,a tax provision for PIS/COFINS as a result of the 22.3% appreciationa favorable decision of therealagainst Brazilian Federal Supreme Court in certain suits that we had brought challenging the U.S. dollarconstitutionality of Law No. 9,718/98, and (2) a R$41.5 million increase in 2003, we recorded financial incomerental of R$969.4 million related to the exchange rate effect on our monetary liabilitiesfacilities and financial expenseassignment of R$211.1 million related to the exchange rate effect on our monetary assets. Without giving effect to the proportional consolidationright of our jointly controlled companies, financial expenses, net decreased by 76.5% in 2003.
Other Operating Income, Net
Other operating income, net decreased by 95.6% in 2003,use, primarily as a result of our recognitioncontribution of the IPI tax credit of R$1,030.1 million that was recorded in the fourth quarter of 2002 as a result of a final judgment by the Brazilian Federal Supreme Court. See “—Principal Factors Affecting Our Results of Operations—Effect of Taxes on Our Income—Tax Disputes.”our polypropylene production process technology to Paulínia. Without giving effect to the proportional consolidation of our jointly controlled companies, other operating income, net increased by 124.8% in 2006.
Results from Equity Accounting
Results from equity accounting declined by 73.8% in 2006, primarily as a result of a decline of 62.1% in amortization of (goodwill) negative goodwill, net, principally as a result of the elimination of the amortization of goodwill relating to Polialden as a result of the merger of Polialden with our company on May 31, 2006, as well as the realization of negative goodwill in the amount of R$53.0 million in 2006. The effects of this decline were partially offset by a 47.7% decline in tax incentives, primarily as a result of the expiration of certain tax incentives relating to technology utilized by Copesul. Without giving effect to the proportional consolidation of our jointly controlled companies, results from equity accounting increased by 164.6% in 2006.
Financial Expenses, Net
Financial expenses, net, increased by 32.3% in 2006, primarily as a result of (1) a R$117.8 million increase in taxes and charges on financial transactions, primarily as a result of the increase in debt in foreign currency in 2006, and (2) a R$100.4 million increase in losses on operational and financial derivatives transactions, primarily as a result of losses incurred under certain commodity hedging contracts and exchange rate hedges that we entered into in 2006. The effects of these increases were partially offset by the effect of the real/U.S. dollar exchange rate on our U.S. dollar-denominated and U.S. dollar-indexed assets and liabilities. As a result of the 8.7% appreciation of therealagainst the U.S. dollar in 2006, we recorded:
As a result of the 11.8% appreciation of therealagainst the U.S. dollar in 2005, we recorded:
Without giving effect to the proportional consolidation of our jointly controlled companies, financial expenses, net increased by 39.2% in 2006.
Operating Income
Operating income decreased by 95.4% to R$51.2 million89.3% in 2003 from R$1,113.8 million in 2002.
Operating Income (Loss)
Operating income was R$569.0 million in 2003 as compared to an operating loss of R$1,379.9 million in 2002.2006. Operating income represented 5.6%0.6% of net sales revenue in 2003, while operating loss represented 18.2%2006 compared to 5.9% of net sales revenue in 2002.2005. Without giving effect to the proportional consolidation of our jointly controlled companies, operating incomeloss was R$535.921.7 million in 2003 as2006 compared to an operating lossincome of R$1,445.9735.1 million in 2002,2005, and operating income was 5.8%represented (0.2)% of net sales revenue in 2003, while operating loss represented 21.1%2006 compared to 6.3% of net sales revenue in 2002.
114
Non-Operating Expenses,Income (Expense), Net
Non-operating expenses decreased by 95.1%income, net was R$7.1 million in 2003. This decrease was2006 compared to non-operating expense, net of R$25.2 million in 2005, primarily as a result of the effectsnon-recurring expenses of a reversalR$22.4 million incurred in 2002 of the provision for losses in investments in Norcel S.A. and Codeverde—Companhia de Desenvolvimento Rio Verde in the amount of R$37.8 million because2005 principally related to environmental remediation that we no longer expect to incur losses on these investments, and a reversal of the provision for losses onperformed at our Eletrobras compulsory loan in the amount of R$32.9 million.Alagoas plant. Without giving effect to the proportional consolidation of our jointly controlled companies, non-operating expenses decreased by 93.8%income, net was R$8.1 million in 2003.2006 compared to non-operating expense, net of R$24.7 million in 2005.
Income Tax and Social Contribution
Income tax and social contribution increased by 36.9%was a benefit of R$12.8 million in 2003. This increase was2006 compared to an expense of R$177.3 million in 2005, primarily as a result of our recordingreduced taxable income in 20032006 and a R$75.9 million increase in our deferred income tax asset as a result of our merger with Polialden. Furthermore, our aggregate tax loss carryforwards increased by R$51.9 million in 2006 compared to a decrease in our aggregate tax loss carryforwards of R$24.7 million in 2002, the effect of which was partially offset by the net changes in the valuation of our deferred tax assets.2005. Without giving effect to the proportional consolidation of our jointly controlled companies, income tax and social contribution increased by 59.1%was a benefit of R$97.0 million in 2003.
Minority Interest
Minority interest was2006 compared to an expense of R$226.287.7 million in 20032005.
Minority Interest
Minority interest resulted in a loss of R$1.6 million in 2006 compared to a gain of R$189.054.0 million in 2002. This change was2005, primarily as a result of the improved net results recordedelimination of the minority interest in 2003 by Trikem, compared to the losses recorded by Trikem in 2002.Polialden as a result of our merger with Polialden on May 31, 2006. Without giving effect to the proportional consolidation of our jointly controlled companies, minority interest was an expensea loss of R$224.41.6 million in 20032006 compared to a gain of R$199.154.0 million in 2002.2005.
Net Income
Net Income (Loss)
We recorded net income of R$215.1101.3 million, or 2.1%0.8% of net sales revenue, in 20032006 compared to a net lossincome of R$1,378.7625.8 million, or 18.2%4.8% of net sales revenue, in 2002.
Business Segment Results
The following table sets forth consolidated and combined financial information for our business segments for the two years ended December 31, 20032006 and 2002.2005.
| Year Ended December 31, | ||||
| 2006 | 2005 | |||
| (in millions ofreais,except | ||||
| percentages) | ||||
| Basic Petrochemicals | ||||
| Net sales revenue | R$6,883.6 | R$7,226.7 | ||
| Cost of sales and services rendered | (5,994.8) | (6,138.5) | ||
| Gross profit | 888.8 | 1,088.2 | ||
| Operating income (1) | 539.0 | 895.0 | ||
| Gross margin (%) | 12.9% | 15.1% | ||
| Operating margin (%) | 7.8% | 12.4% | ||
| Polyolefins(2) | ||||
| Net sales revenue | R$4,775.8 | R$3,919.0 | ||
| Cost of sales | (3,985.4) | (3,182.8) | ||
| Gross profit | 790.4 | 736.2 | ||
| Operating income (1) | 458.0 | 553.3 | ||
| Gross margin (%) | 16.6% | 18.8% | ||
| Operating margin (%) | 9.6% | 14.1% | ||
115
| Year Ended December 31, | ||||||||
| 2003 | 2002 | |||||||
| Consolidated | Combined | |||||||
(in millions ofreais, except percentages) | ||||||||
Basic Petrochemicals | ||||||||
Net sales revenue | R$ | 4,765.3 | R$ | 3,499.1 | ||||
Cost of sales | (4,111.5 | ) | (3,006.3 | ) | ||||
Gross profit | 653.8 | 492.8 | ||||||
Operating income(1) | 499.9 | 409.1 | ||||||
Gross margin (%) | 13.7 | % | 14.1 | % | ||||
Operating margin (%) | 10.5 | % | 11.7 | % | ||||
Polyolefins | ||||||||
Net sales revenue | R$ | 3,386.8 | R$ | 2,482.3 | ||||
Cost of sales | (2,719.7 | ) | (2,062.4 | ) | ||||
Gross profit | 667.1 | 419.9 | ||||||
Operating income(1) | 529.5 | 284.7 | ||||||
Gross margin (%) | 19.7 | % | 16.9 | % | ||||
Operating margin (%) | 15.6 | % | 11.5 | % | ||||
Vinyls | ||||||||
Net sales revenue | R$ | 1,371.8 | R$ | 1,117.8 | ||||
Cost of sales | (1,007.0 | ) | (804.7 | ) | ||||
Gross profit | 364.8 | 313.1 | ||||||
Operating income(1) | 313.7 | 265.8 | ||||||
Gross margin (%) | 26.6 | % | 28.0 | % | ||||
Operating margin (%) | 22.9 | % | 23.8 | % | ||||
Business Development | ||||||||
Net sales revenue | R$ | 455.3 | R$ | 290.8 | ||||
Cost of sales | (416.8 | ) | (246.1 | ) | ||||
Gross profit | 38.5 | 44.7 | ||||||
Operating income(1) | 28.8 | 35.3 | ||||||
Gross margin (%) | 8.5 | % | 15.4 | % | ||||
Operating margin (%) | 6.3 | % | 12.1 | % | ||||
| Year Ended December 31, | ||||
| 2006 | 2005 | |||
| (in millions ofreais,except | ||||
| percentages) | ||||
| Vinyls | ||||
| Net sales revenue | R$1,541.7 | R$1,794.1 | ||
| Cost of sales | (1,245.3) | (1,271.9) | ||
| Gross profit | 296.4 | 522.2 | ||
| Operating income (1) | 208.1 | 438.8 | ||
| Gross margin (%) | 19.2% | 29.1% | ||
| Operating margin (%) | 13.5% | 24.5% | ||
| Business Development | ||||
| Net sales revenue | R$483.1 | R$569.0 | ||
| Cost of sales | (545.7) | (552.9) | ||
| Gross profit (loss) | (62.6) | 16.1 | ||
| Operating income (loss)(1) | (86.8) | 6.8 | ||
| Gross margin (%) | (13.0)% | 2.8% | ||
| Operating margin (%) | (18.0)% | 1.2% | ||
| _______________ | |
| (1) | Operating income does not include financial income, financial expense and |
| (2) | As a result of the Politeno Acquisition described under “Item 4. Information On The Company— History and Development of Our Company,” includes fully consolidated results of Politeno for periods as from April 1, 2006. |
Basic Petrochemicals
Net Sales Revenue. Net sales revenue of the Basic Petrochemicals segment increaseddeclined by 36.2%4.7% in 2003.2006. Significant factors contributing to this growthdecline were:
For more information about the sales volumes andparties;
Net sales revenue generated by product lines and markets, see “Item 4. Information on Our Company—Basic Petrochemicals Unit—Products of Our Basic Petrochemicals Unit.”
Salessales of basic petrochemicals by our Basic Petrochemicals segment to our other segments increased by 23.2%28.9% in 2006 to R$910.72,272.1 million from R$1,763.0 million in 2003 from R$739.0 million in 20022005, principally due to the reclassification of ethylene sales to Politeno as internal sales for the period after April 6, 2006, the date of the Politeno Acquisition, and net sales revenue generated by sales of utilities by our Basic Petrochemicals segment to our other segments increased by 36.1%16.0% in 2006 to R$103.8160.3 million from R$138.2 million in 2003 from R$76.3 million in 2002. Sales2005. Net sales revenue generated by sales of utilities to third parties increased by 15.1%5.9% in 2006 to R$280.7374.5 million from R$353.6 million in 2003 from R$244.0 million in 2002.2005. Net sales revenue generated by export sales of the Basic Petrochemicals segment increaseddeclined by 57.8%6.1% in 2006 to R$618.8995.0 million from R$1,059.9 million in 2003 from R$392.2 million in 2002, primarily as a result of the recovery of our production levels following the scheduled shutdown of one of our pyrolysis plants that is part of our Olefins 1 unit for 92 days in 2002.2005.
Domestic sales volume of ethylene to third parties increaseddeclined by 6.9%47.0% to 559.1 thousandapproximately 307,900 tons in 20032006 from 522.8 thousand tonsapproximately 581,100 in 2002,2005 principally due to (1) the recoveryreclassification of ethylene sales to Politeno as internal sales for the period after April 6, 2006, the date of the Politeno Acquisition, (2) reduced demand by second generation producers in the Northeastern Complex as a result of operational problems experienced by several of our production of ethylene following thecustomers, and (3) a non-programmed maintenance shutdown of oneour Olefins 1 unit during December 2006 for 13 days, as a result of our pyrolysis plants in 2002 and our increased production capacity forwhich we were able to postpone the next scheduled maintenance shutdown of this product. Averageunit by 12 months. The average domestic pricesprice for ethylene increased by 30.1%3.8% to R$1,6942,270 per ton in 20032006 from R$1,3022,187 per ton in 2002.2005.
116
Sales volume of propylene to third parties declined by 9.1% to approximately 436,000 tons in 2006 from approximately 479,500 tons in 2005. Domestic sales volume of propylene to third parties increased by 2.9% to 399.2 thousand tons in 2003 from 388.1 thousand tons in 2002,declined 20.0% principally due to (1) reduced demand by second generation producers in the recoveryNortheastern Complex as a result of operational problems experienced by several of our production of propylene following the maintenance shutdown of one of our pyrolysis plants in 2002. Average domestic prices for propylene increased by 34.7% to R$1,495 per ton in 2003 from R$1,110 per ton in 2002.
Domestic sales volume of butadiene to third parties increased by 2.0% to 150.3 thousand tons in 2003 from 147.3 thousand tons in 2002, principally due to the recovery of our production of butadiene following thecustomers, and (2) a non-programmed maintenance shutdown of our Olefins 1 unit in 2002. Average domestic pricesduring December 2006 for butadiene increased by 55.4% to R$1,870 per ton in 2003 from R$1,203 per ton in 2002.
Cost of Sales and Services and Gross Profit. Cost of sales and services of the Basic Petrochemicals segment increased by 36.8% in 2003. This increase was primarily attributable to an increase of 34.1% in the average price of naphtha purchased in 2003, as well as the increased sales volume recorded in 2003. Naphtha accounted for 84.6% of the Basic Petrochemicals segment’s cost of sales in 2003 and 83.2% in 2002.
Gross profit of the Basic Petrochemicals segment increased by 32.7% in 2003, and gross margin decreased to 13.7% for 2003 compared to 14.1% for 2002.
Operating Income. Operating income of the Basic Petrochemicals segment (which excludes financial income and expense and results from investment in associated companies) increased by 22.2% in 2003, principally as a result of a R$161.0 million increase in gross profit. The increase in gross profit was partially offset by a R$37.9 million increase in selling, general and administrative expenses, primarily as a result of the allocation of overhead expenses in 2003, and a R$33.1 million decrease in other income, net, primarily as a result of the decline in amounts of PIS recovered in 2003 as compared to 2002. Operating margin of the Basic Petrochemical segment for 2003 was 10.5% compared with 11.7% in 2002.
Polyolefins
Net Sales Revenue. Net sales revenue of the Polyolefins segment increased by 36.4% in 2003. This increase was primarily attributable to a 32.1% increase in domestic sales of polypropylene, a 60.1% increase in13 days, while export sales of polyethylene, a 16.0% increase in domestic sales of polyethylene and a 359.8% increase in export sales of polypropylene. Net export sales of the Polyolefins segment increased by 68.5% to R$1,233.7 million in 2003 from R$732.2 million in 2002. For more information about the sales volumes and net sales revenue of our polyolefins products by product line and markets, see “Item 4. Information on Our Company—Polyolefins Unit—Products of Our Polyolefins Unit.”
Domestic sales volume of polyethylene decreased by 9.4% to 446.1 thousand tons in 2003 from 491.7 thousand tons in 2002, principally due to our strategic decision to maintain our margins on polyethylene despite decreased demand for polyethylene as a result of the recession in Brazil. Average domestic prices for polyethylenepropylene increased by 27.9% to R$2,567 per ton in 2003 from R$2,007 per ton in 2002.
Domestic sales volume of polypropylene decreased by 5.1% to 374.9 thousand tons in 2003 from 395.1 thousand tons in 2002, primarily as a result of reduced demand for polypropylene in 2003 and increased competition in this market as a result of the commencement of operations of Polibrasil’s polypropylene plant in 2003. Average domestic prices for polypropylene increased by 39.2% to R$2,689 per ton in 2003 from R$1,931 per ton in 2002.
Export sales volume of polyethylene increased by 31.8% to 221.9 thousand tons in 2003 from 168.3 thousand tons in 2002,53.6%, principally due to our strategic decision to increase our exports of polyethylenepropylene despite the lower margins available in the international market rather than lower our capacity utilization rate in response to the reduced domestic demand for polyethylene. Average export pricespropylene. The average domestic price for polyethylene increasedpropylene declined by 20.0%0.9% to R$2,0722,106 per ton in 20032006 from R$1,7272,124 per ton in 2002.2005, and the average export price for propylene declined 11.4% to R$1,825 per ton in 2006 from R$2,059 per ton in 2005.
Sales volume of para-xylene to third parties declined by 36.9% to approximately 79,100 tons in 2006 from approximately 125,400 tons in 2005. Domestic sales volume of para-xylene to third parties declined 67.7% principally due to the reduced production of polyester fiber in Brazil as end users substituted less expensive polyester fiber for domestically produced polyester fiber. In response to this decline we exported approximately 38,600 tons of para-xylene, a significant portion of which was sold to Mexican customers. The average domestic price for para-xylene increased by 6.6% to R$2,406 per ton in 2006 from R$2,256 per ton in 2005, and the average export price for para-xylene was R$2,307 per ton in 2006.
Export Sales volume of benzene to third parties declined by 11.1% to approximately 340,100 tons in 2006 from approximately 382,500 tons in 2005, primarily due to (1) a non-programmed maintenance shutdown of our Olefins 1 unit during December 2006 for 13 days, and (2) a change in the mix of products produced in 2006 that effectively reduced our benzene production capacity during 2006. Domestic sales volume of benzene to third parties increased 7.5%, principally due to the increased demand by domestic producers of nylon fiber, while export sales volume of benzene declined by 21.7%, principally due to the reduced availability of benzene available for export as a result of increased domestic demand. The average domestic price for benzene declined by 10.0% to R$1,971 per ton in 2006 from R$2,190 per ton in 2005 and the average export price for benzene increased 6.5% to R$2,010 per ton in 2006 from R$1,887 per ton in 2005.
Cost of Sales and Services and Gross Profit. Cost of sales and services rendered of the Basic Petrochemicals segment declined by 2.3% in 2006. This decline was primarily attributable to the lower volume of production of our Basic Petrochemicals segment, the effects of which were partially offset by the increase in the average cost of naphtha during 2006. Naphtha accounted for 86.6% of the Basic Petrochemicals segment’s cost of sales in 2006 and 86.6% in 2005.
Gross profit of the Basic Petrochemicals segment decreased by 18.3% in 2006 and gross margin decreased to 12.9% in 2006 compared to 15.1% in 2005.
Operating Income. Operating income of the Basic Petrochemicals segment (which excludes financial income, financial expense and results from equity accounting) decreased by 39.8% in 2006, principally as a result of (1) the decline in gross profit of this segment, (2) a 35.4% increase in selling, general and administrative expenses, principally as a result of losses incurred under certain commodity hedging contracts that we entered into in 2006, and (3) our incurrence of other operating expenses, net of R$10.4 million in 2006 compared to other operating income, net of R$57.1 million in 2005, primarily due to non-recurring sales of iron scrap in 2005 and our recovery of an account receivable in 2005 in the amount of R$18.6 million that we had previously written off. Operating margin of the Basic Petrochemicals segment was 7.8% in 2006 compared to 12.4% in 2005.
Polyolefins
Net Sales Revenue. Net sales revenue of the Polyolefins segment increased by 21.9% in 2006. This increase was primarily attributable to:
117
Net sales revenue generated by export sales of the Polyolefins segment increased by 31.0% to R$1,272.8 million in 2006 from R$971.5 million in 2005.
Sales volume of polypropylene increased by 2.4% to approximately 529,900 tons in 2006 from approximately 517,500 tons in 2005. Domestic sales volume of polypropylene increased by 306.2%7.9% in 2006, principally due to 66.2 thousandthe expansion of production by some of our customers, while export sales volume of polypropylene declined by 21.4%, principally due to the reduced availability of polypropylene available for export as a result of increased domestic demand. The average domestic price for polypropylene in 2006 remained stable at R$3,344 per ton, while the average export price for polypropylene stated inreaisincreased by 5.1% to R$2,614 per ton in 2006 from R$2,487 per ton in 2005.
Sales volume of polyethylene increased by 29.6% to approximately 995,200 tons in 20032006 from 16.3 thousandapproximately 768,200 tons in 2002,2005. Domestic sales volume of polyethylene increased by 20.4% in 2006 and export sales volume of polyethylene increased by 46.9% in 2006, principally due to the effects of the Politeno Acquisition. The average domestic price for polyethylene increased by 6.7% to R$3,279 per ton in 2006 from R$3,072 per ton in 2005, while the average export price for polyethylene stated inreais increased by 0.6% to R$2,741 per ton in 2006 from R$2,725 per ton in 2005.
Cost of Sales and Gross Profit. Cost of sales of the Polyolefins segment increased by 25.2% in 2006 compared to 2005, primarily as a result of (1) the increased volume of sales of polyolefins products driven by the Politeno Acquisition, and (2) the increased cost of the feedstocks used by this segment. Our average cost for ethylene increased by 5.9% during 2006, and our average cost for propylene increased by 6.9% during 2006.
Gross profit of the Polyolefins segment increased by 7.4% in 2006, while gross margin declined to 16.6% in 2006 compared to 18.8% in 2005.
Operating Income. Operating income of the Polyolefins segment (which excludes financial income, financial expense and results from equity accounting) decreased by 17.2% in 2006, primarily as a result of (1) a 50.4% increase in selling, general and administrative expenses, principally due to higher expenses as a result of the Politeno Acquisition, and (2) a 57.6% decrease in other operating income, net. These effects were partially offset by the increase in this segment’s gross profit. Other operating income, net, in 2005 included a gain of R$58.2 million related to the contribution of our polypropylene production process technology to Paulínia and other operating income, net included our recovery of additional corporate income tax in the amount of R$13.1 million in 2006. Operating margin of the Polyolefins segment decreased to 9.6% in 2006 compared to 14.1% in 2005.
Vinyls
Net Sales Revenue. Net sales revenue of the Vinyls segment declined by 14.1% in 2006. This decline was primarily attributable to a 7.4% decline in net sales revenue generated by sales of PVC, a 22.7% decline in net sales revenue generated by sales of caustic soda and a 45.1% decline in net sales revenue generated by export sales of EDC. Net sales revenue generated by export sales of this segment declined by 45.6% to R$120.2 million in 2006 from R$220.9 million in 2005.
Sales volume of PVC declined by 2.1% to approximately 432,800 tons in 2006 from approximately 441,900 tons in 2005, principally due to the effects of a general maintenance shutdown of our PVC plant in Camaçari that was carried in May 2006 and lasted 14 days. Domestic sales volume of PVC increased by 5.7% in 2006, mainly to the growth of domestic demand, while export sales volume of PVC declined by 48.6%, principally due to the reduced availability of PVC available for export as a result of increased domestic demand. The average domestic price for PVC decreased by 8.3% to R$2,518 per ton in 2006 from R$2,747 per ton in 2005, while the average export price for PVC increased by 7.0% to R$1,982 per ton in 2006 from R$1,852 per ton in 2005.
118
Export sales volume of EDC declined by 14.8% to approximately 104,100 tons in 2006 from approximately 122,200 tons in 2005, primarily as a result of the expiration of a long-term supply agreement with Sojitz Corporation (formerly known as Nissho Iwai Corporation), or Sojitz, during 2006 the effects of which were partially offset by our increase in spot market sales of EDC. The average export price for EDC declined by 35.5% to R$507 per ton in 2006 from R$786 per ton in 2005.
Domestic sales volume of caustic soda declined by 7.0% to approximately 423,900 tons in 2006 from approximately 455,600 tons in 2005, principally due to our reduced production volume of caustic soda in 2006 as a result of temporary operational problems experienced by our Alagoas caustic soda plant. The average domestic price for caustic soda declined by 14.4% to R$844 per ton in 2006 from R$986 per ton in 2005.
Cost of Sales and Gross Profit. Cost of sales of the Vinyls segment declined by 2.1% in 2006 compared to 2005, primarily as a result of our reduced volume of sales, the effects of which were partially offset by increases in the prices of ethylene and electric power.
Gross profit of the Vinyls segment declined by 43.2% in 2006, while gross margin decreased to 19.2% in 2006 from 29.1% in 2005.
Operating Income. Operating income of the Vinyls segment (which excludes financial income, financial expense and results from equity accounting) declined by 52.6% in 2005, primarily as a result of the decline in gross profit of this segment and, to a lesser extent, a 37.9% increase in selling, general and administrative expenses, principally as a result of some additional delivery expenses and an increase on our allowance for doubtful accounts. The operating margin of the Vinyls segment declined to 13.5% in 2006 from 24.5% in 2005.
Business Development
Net Sales Revenue. Net sales revenue of our Business Development segment declined by 15.1% in 2006. This decline was primarily attributable to a 5.5% decline in net sales revenue generated by sales of PET during 2006 and a 21.1% decline in net sales revenue generated by sales of caprolactam during 2006. Net sales revenue generated by export sales of this segment increased to R$120.9 million in 2006 from R$87.8 million in 2005.
Sales volume of PET increased by 5.9% to approximately 64,000 tons in 2006 from approximately 60,400 tons in 2005, primarily as a result of an increase in export sales to the European market. Domestic sales volume of PET decreased by 10.6% in 2006 primarily as a result of the increase in imports of PET into Brazil from Asia, while export sales volume of PET increased by approximately 250% as a result of our development of customers in foreign markets. The average domestic price for PET declined by 14.9% to R$3,019 per ton in 2006 from R$3,547 per ton in 2005, while the average export price for PET declined by 2.9% to R$2,644 per ton in 2006 from R$2,723 per ton in 2005.
Sales volume of caprolactam declined by 9.9% to approximately 43,500 tons in 2006 from approximately 48,300 tons in 2005. Domestic sales volume of caprolactam decreased by 22.0% in 2006 primarily as a result of the permanent closure of a plant by one of our customers, while export sales volume of caprolactam increased by 16.5% due to our strategic decision to increase our exports of polypropylenecaprolactam despite the lower margins available in the international market rather than lower our capacity utilization rate in response to the reduced domestic demand for and increasedcaprolactam. The average domestic supply of, polypropylene. Average export pricesprice for polypropylene increasedcaprolactam declined by 13.2%17.1% to R$1,7814,954 per ton in 20032006 from R$1,5735,975 per ton in 2002.2005, and the average export price for caprolactam declined by 13.5% to R$4,374 per ton in 2006 from R$5,059 per ton in 2005.
Cost of Sales and Gross Profit. Cost of sales of the Polyolefins segment increased by 31.9% in 2003. This increase was primarily attributable to increases in the prices of ethylene and propylene, the principal raw materials of this segment, as well as our increased sales volume in 2003.
Gross profit of the Polyolefins segment increased by 58.9% in 2003, and gross margin increased to 19.7% in 2003 compared to 16.9% in 2002.
Operating Income. Operating income of the Polyolefins segment (which excludes financial income and expenses and results from investment in associated companies) increased by 86.0% in 2003, primarily as a result of the R$247.2 million increase in the gross profit of this segment. Our Polyolefins segment reduced its selling, general and administrative expenses to 4.1% of net sales revenue in 2003 from 5.5% of net sales revenue in 2002, primarily as a result of cost cutting initiatives introduced and efficiencies achieved in this segment following our merger with OPP Produtos. Operating margin of the Polyolefins segment increased to 15.6% in 2003 compared to 11.5% in 2002.
VinylsLoss
Net Sales Revenue. Net sales revenue of the Vinyls segment increased by 22.7% in 2003. This increase was primarily attributable to an 18.4% increase in this segment’s domestic sales, principally as a result of the increase in the average domestic prices of our vinyls products. Net export sales of this segment increased by 55.5% to R$203.7 million in 2003 from R$131.0 million in 2002. This increase in net export sales was primarily attributable to our increased export sales of PVC and EDC. For more information about the sales volumes and net sales revenue of our vinyls products by product line and markets, see “Item 4. Information on Our Company—Vinyls Unit—Products of Our Vinyls Unit.”
Domestic sales volume of PVC decreased by 2.2% to 342.4 thousand tons in 2003 from 350.1 thousand tons in 2002, principally due to reduced demand for applications in the infrastructure, sanitation and construction sectors. This reduced demand was partially offset by increased exports of PVC and increased demand for PVC for applications in footwear, plastic films and laminates. Average domestic prices for PVC increased by 17.4% to R$2,390 per ton in 2003 from R$2,035 per ton in 2002.
Export sales volume of PVC increased by 12.0% to 55.4 thousand tons in 2003 from 49.5 thousand tons in 2002, principally due to our strategic decision to increase our exports of PVC despite the lower margins available in the international market rather than lower our capacity utilization rate in response to the reduced domestic demand for PVC. Average export prices for PVC increased by 27.3% to R$1,710 per ton in 2003 from R$1,343 per ton in 2002.
Domestic sales of caustic soda increased by 6.4% to 426.6 thousand tons in 2003 from 400.9 thousand tons in 2002, principally due to increased demand by our customers in the domestic aluminum and pulp and paper industries. Average domestic prices for caustic soda increased by 20.1% to R$681 per ton in 2003 from R$567 per ton in 2002.
Export sales of EDC increased by 34.1% to 160.1 thousand tons in 2003 from 119.4 thousand tons in 2002, principally due to increased sales to our distributor in the Asian market as a result of increased demand by producers of PVC products in that market. Average export prices for EDC increased by 25.9% to R$680 per ton in 2003 from R$540 per ton in 2002, primarily due to the upward trend in international market prices for EDC in 2003 caused by, among other factors, the limited global production capacity for this product.
Cost of Sales and Gross Profit. Cost of sales of the Vinyls segment increased by 25.1% in 2003. This increase was primarily attributable to (1) the increased cost of ethylene, (2) the increased cost of electric power in 2003 resulting from the institution of a surcharge by the Brazilian federal energy regulator to compensate electric power distribution companies for losses attributable to the Brazilian government’s electric power rationing program in 2001 and 2002, and (3) our increased sales volume for most of our vinyls products in 2003.
Gross profit of the Vinyls segment increased by 16.5% to R$364.8 million in 2003 from R$313.1 million in 2002, while gross margin declined to 26.6% in 2003 from 28.0% in 2002.
Operating Income. Operating income of the Vinyls segment (which excludes financial income and expenses and results from investment in associated companies) increased by 18.0% in 2003, primarily as a result of the increase in gross profits of this segment. Operating margin of the Vinyls segment declined to 22.9% in 2002 from 23.8% in 2002.
Business Development
Our Business Development Unit is responsible for managing certain of our minority investments, principally our investments in Petroflex and Cetrel. However, as the results of our investments managed by our Business Development Unit are reported as investments in associated companies, the results of these companies are not included in the following segment discussion.
Net Sales Revenue. Net sales revenue of our Business Development segment increased by 56.6% in 2003. This increase was primarily attributable to the effects of our merger with 52114 Participações, through which we acquired the caprolactam and other operations of Nitrocarbono in August 2002. Net export sales of this segment, consisting primarily of caprolactam, increased to R$34.3 million in 2003 from R$20.1 million in 2002 due to the effects of our merger with 52114 Participações. For more information about the sales volumes and net sales revenue of our business development products by product line and markets, see “Item 4. Information on Our Company—Business Development Unit—Products of Our Business Development Unit.”
Domestic sales volume of PET decreased by 7.9% to 55.1 thousand tons in 2003 from 59.8 thousand tons in 2002, principally due to reduced demand for PET for soft drink packaging applications. This reduced demand was partially offset by increased demand for PET for packaging applications in the cleaning products, cosmetics and pharmaceuticals industries. Average domestic prices for PET increased by 19.9% to R$3,056 per ton in 2003 from R$2,548 per ton in 2002.
Domestic sales volume of caprolactam increased by 181.7% to 42.5 thousand tons in 2003 from 15.1 thousand tons in 2002, principally due to the effect of our merger with 52114 Participações. Average domestic prices for caprolactam increased by 14.2% to R$4,237 per ton in 2003 from R$3,711 per ton in 2002, primarily as a result of a 42.8% increase in the average domestic price of benzene, the principal raw material used to manufacture caprolactam.
Cost of Sales and Gross Profit. Cost of sales of the Business Development segment increaseddecreased by 69.4%1.3% in 2003, reflecting the effects2006.
119
Gross profitloss of the Business Development segment decreased by 13.9%was R$62.6 million in 2003,2006 compared to gross profit of R$16.1 million in 2005, resulting in a gross margin for 2003 of 8.5% from 15.4%(13.0)% in 2002.2006 compared to 2.8% in 2005.
Operating Income (Loss). Operating incomeloss of the Business Development segment (which excludes financial income, and expensesfinancial expense and results from investmentequity accounting) was R$86.8 million in associated companies) declined by 18.4%2006 compared to operating income of R$6.8 million in 2003,2005, principally as a result of the incurrence of a R$9.6 million increase in the selling, general and administrative expenses ofgross loss by this segment due to the effects of our merger with 52114 Participações and the R$6.2 million decline in this segment’s gross profit. These factors were partially offset by a R$9.6 million increase in other income, net, primarily as a result of our receipt of insurance proceeds related to the interruption of our caprolactam plant’s operations.2006. Operating margin of the Business Development segment declinedwas (18.0)% in 2006 compared to 6.3%1.2% in 2003 from 12.1% in 2002.2005.
Liquidity and Capital Resources
Our principal cash requirements consist of the following:
Our principal sources of liquidity have traditionally consisted of the following:
During 2004,2007, cash flow generated by operations was used primarily for investing activities, for working capital requirements and to service our outstanding debt obligations. At December 31, 2004,2007, our consolidated cash and cash equivalents and other investments amounted to R$1,773.82,258.6 million, including R$77.091.9 million that has been included in our consolidated and combined financial statements due to the effects of proportional consolidation and to which we do not generally have access because we jointly control our proportionally consolidated companies with third parties. At December 31, 2004,2007, we had working capital of R$797.4673.4 million. Without giving effect to the proportional consolidation of our jointly controlled companies, we had working capital of R$725.8636.5 million at December 31, 2004.2007.
Projected Sources and Uses of Cash
We anticipate that we will be required to spend approximately R$4,816.79,726.7 million to meet our short-term contractual obligations and commitments and budgeted capital expenditures in 2005,2008, without giving effect to proportional consolidation. We expect that we will meet these cash requirements through a combination of cash
generated from operating activities and cash generated by financing activities, including new debt financings and the refinancing of our existing short-term indebtedness as it becomes due.
We anticipate that we will be required to spend approximately R$7,508.216,369.8 million to meet our long-term contractual obligations and commitments and budgeted capital expenditures through 2007,2010, without giving effect to proportional consolidation. We anticipate that we will meet these cash requirements through a combination of: (1) cash generated from operating activities; (2) cash generated by financing activities, including new debt financings and the refinancing of our indebtedness as it becomes due; and (3) dividends received from our subsidiaries and jointly controlled companies.
120
We have commitments from several financial institutions to provide us with financing in the future, including:
These commitments are subject to conditions precedent which we believe that we will be able to satisfy in connection with any amounts drawn under these facilities. We pay commitment fees to these financial institutions in connection with their commitments.
Cash Flows
Cash Flows from Operating Activities
Net cash provided by operating activities was R$1,949.02,393.8 million in 2004,2007, R$580.5405.3 million in 2003,2006 and R$790.01,719.4 million in 2002.2005. Without giving effect to the proportional consolidation of our jointly controlled companies, net cash providedused by operating activities was R$1,662.02,343.2 million in 2004,2007, R$431.9115.7 million in 2003,2006 and R$708.62,109.1 million in 2002.2005.
The most significant factors in the generation of our consolidated cash flows from operating activities in 2004 were:2007 consisted of the following:
ThisThese positive effect onfactors contributing to our cash flows from operations waswere partially offset by the effects of:
The most significant factors that led toin the generation of our consolidated cash flows from operating activities in 2003 included 2006 were:
121
These positive effects onfactors contributing to our cash flows from operations were partially offset by the effects of among other factors:
The most significant factors that led toin the generation of our consolidated cash flows from operating activities in 2002 included2005 were:
on financing of purchases of our primary raw materials in 2002. This These positive effect onfactors contributing to our cash flows from operations waswere partially offset by the effects of:
2005.
Cash Flows Used in Investing Activities
Investing activities used net cash of R$1,004.8 million during 2004, R$460.43,577.1 million in 2003,2007, R$1,213.1 million in 2006 and R$646.71,048.0 million in 2002.2005. Without giving effect to the proportional consolidation of our jointly controlled companies, investing activities used net cash of R$815.9 million during 2004, R$494.83,282.6 million in 2003,2007, R$992.7 million in 2006 and R$611.0973.5 million in 2002.2005.
During 2007, investing activities for which we used cash on a consolidated basis primarily consisted of (1) additions to property, plant and equipment, including our proportional share of the cost of the property, plant and equipment of Paulínia, investments in equipment replacement and additions to equipment related to the implementation of our Formula Braskem program, (2) payments to Ultrapar under the Ipiranga Investment Agreement and payments made for the 7.6% of the total share capital of Ipiranga Petroquímica not owned by Ipiranga Química, and (3) payments in connection with the merger of EDSP58 into Copesul and the merger of EDSP67 into Ipiranga Petroquímica. In addition, we used R$263.0. million to perform maintenance on our plants during scheduled shutdowns during 2007 and R$129.4 million in our safety, health and environmental programs.
During 2004,2006, investing activities for which we used cash on a consolidated basis primarily consisted of (1) the payment of R$237.5 million, representing the portion of the purchase price that was due upon the closing of the Politeno Acquisition, (2) additions to equipment related to the increase of our annual polyethylene production capacity in the Northeastern Complex by 30,000 tons and the increase of our annual isoprene production capacity by 8,800 tons, and (3) additions to equipment related to the implementation of our Braskem+ and Formula Braskem programs. In addition, we used R$150.0 million to perform maintenance on our plants during scheduled shutdowns during 2006 and R$152.0 million in our safety, health and environmental programs.
During 2005, investing activities for which we used cash investments on a consolidated basis primarily consisted of additions to equipment related to the increase of our annual polypropylene production capacity in the Southern Complex by 100,000 tons, the increase of our annual paraxylene production capacity in the Northeastern Complex by 50,000 tons and capital expenditures that are expected to increase our annual PVC production capacity at our Alagoas PVC plant by 50,000 tons, the increase of our annual polyethylene production capacity in the Northeastern Complex by 30,000 tons and capital expenditures that increased our annual polyethylene production capacity in the Northeastern Complex by 30,000 tons when completed in 2005.2006. In addition, we used R$210.1150.0 million to perform maintenance ofon our plants during scheduled shutdowns during 2004.2005 and R$150.0 million in our safety, health and environmental programs.
In 2003, our cash investments on a consolidated basis primarily consisted of additions to property, plant and equipment related to upgrading, maintaining and modernizing the Olefins 1 unit of our Basic Petrochemicals Unit during a scheduled shutdown. In 2002, our cash investments on a consolidated basis primarily consisted of additions to property, plant and equipment related to maintaining one of our pyrolysis plants and expanding the production capacity of the Olefins 1 unit of our Basic Petrochemicals Unit during a scheduled shutdown.
Cash Flows from Financing Activities
Financing activities provided net cash of R$119.5 million during 2004 and R$367.81,526.3 million in 2003,2007 and R$219.2 million in 2006, and used net cash of R$237.2329.7 million in 2002.2005. Without giving effect to the proportional consolidation of our jointly controlled companies, financing activities provided net cash of R$309.5 million during 2004 and R$481.91,283.6 million in 2003,2007 and R$375.9 million in 2006, and used net cash of R$185.0754.4 million in 2002.2005.
122
During 2007, our principal sources of long-term borrowed funds consisted of (1) US$953.2 million aggregate principal amount borrowed under the Acquisition Credit Agreement, (2) US$150.0 million aggregate principal amount borrowed under our prepayment credit export facility, and (3) US$125.0 million aggregate principal amount borrowed under two credit export note facilities.
During 2004,2007, we recorded a capital increaseused cash to prepay (1) US$125.0 million under our syndicated secured export prepayment facility due 2009, and (2) R$155.1 million under our 12th issue of R$1,211.0 million as a resultdebentures.
During 2006, our principal sources of long-term borrowed funds consisted of issuances of our sale9.00% Perpetual Bonds in an aggregate principal amount of 53,820,000US$200.0 million, our 8.00% Notes due 2017 in an aggregate principal amount of US$275.0 million, our 14th issue of debentures in an aggregate principal amount of R$500.0 million, and borrowings under a credit export note facility in an aggregate amount of US$78.0 million.
During 2006, we used cash:
During 2004,2005, our principal sources of long-term borrowed funds consisted of:
During 2004,2005, we used cash to repay:
We also borrowedrepaid R$40.2124.7 million on market terms from related parties, principally fromof borrowings under four loan agreements with Copesul Trading International Inc., to finance our working capital requirementsa related party, during 2004 and repaid R$109.2 million of borrowings from Copesul Trading International Inc.
In 2003, our principal source of long-term borrowed funds consisted of issuances in an aggregate amount of US$461.0 million under our medium-term note program and US$30.0 million of proceeds of a syndicated, secured pre-export finance facility. We used cash in 2003 to repay R$389.3 million of our outstanding long-term debt and to repay R$854.7 million of our outstanding short-term debt as part of our strategy to increase the average maturity of our indebtedness. We borrowed R$833.6 million on market terms from related parties, principally from Copesul Trading International Inc. and Petroflex, to finance our working capital requirements during 2003 and repaid R$843.2 million to these related parties.2005.
In 2002, our principal sources of long-term borrowed funds consisted of an issuance of unsecured convertible debentures in an aggregate amount of R$591.9 million, and an export prepayment financing in an aggregate amount of US$97.2 million. We used cash in 2002 to reduce our outstanding short-term debt by R$566.8 million as part of our strategy to increase the average maturity of our indebtedness. We borrowed R$1,140.6 million on market terms from related parties, including members of the Odebrecht Group, Copesul Trading International Inc. and Petroflex, to finance our working capital requirements during 2002 and repaid R$1,920.9 million to these related parties. All of these transactions to which members of the Odebrecht Group were parties were conducted by OPP Produtos prior to the legal date of its merger with our company.
We paid cash dividends and interest attributable to shareholders’ equity (including withholding taxes paid by our company on behalf of our shareholders in respect thereof) of R$19.1 million for 2002. Between May 20, 2002 and March 31,On April 12, 2005, we suspended payment of the mandatory dividend distribution because we did not have retained earnings (but rather had an accumulated deficit). As a result, we did not pay cash dividends or interest attributable to shareholders’ equity in 2003 or 2004. In December, 2004, we offset our accumulated deficit against our tax incentive reserve. On March 31, 2005, we declaredpaid a distribution of R$204.2 million, including R$170.0 million to bethat was paid in the form of interest attributable to shareholders’ equity and R$34.2 million to bethat was paid in the form of dividends. PaymentOn April 18, 2006, we paid a distribution of R$325.7 million, including R$270.0 million that was paid in the form of interest attributable to shareholders’ equity and R$55.7 million that was paid in the form of dividends. On April 9, 2007, we paid dividends in the aggregate amount of R$36.9 million. On April 17, 2008, we paid dividends in the aggregate amount of R$278.5 million.
123
Unless our board of directors deems it inconsistent with our financial position, payment of dividends is mandatory under our by-laws and also is required under agreements with two of our shareholders and, consequently, may give rise to a significant cash requirementrequirements in future periods. AfterWithout giving effect to the effects of the proportional consolidation of our jointly controlled companies, we recorded dividend payments and interest attributable to shareholders’ equity of R$4.243.8 million in 2004,2007, R$72.3344.1 million in 20032006 and R$32.4209.3 million in 20022005 in our combined and consolidated financial statements.
On May 3, 2006, we announced that our board of directors had authorized a share repurchase program under which we were authorized to repurchase up to 13,896,133 class A preferred shares and up to 1,400,495 common shares at market prices over the São Paulo Stock Exchange at any time and from time to time prior to October 31, 2006. We repurchased 13,131,054 of our class A preferred shares under our share repurchase program for a total purchase price of R$182.0 million. On March 6, 2008, we announced that our shareholders had authorized the cancellation of 16,595,000 of our class A preferred shares that were held in treasury with a book value of R$244.5 million.
On February 19, 2008, we announced that our board of directors had authorized a share repurchase program under which we are authorized to repurchase up to 19,862,411 class A preferred shares at market prices over the São Paulo Stock Exchange at any time and from time to time between March 7, 2008 and March 6, 2009 for a total purchase price of up to R$252.3 million. As of June 27, 2008, we have repurchased 1,669,000 of our class A preferred shares under our share repurchase program for an aggregate purchase price of R$22.0 million.
Indebtedness and Financing Strategy
At December 31, 2004,2007, our total outstanding indebtedness on a consolidated basis excluding related party debt, was R$5,999.78,381.9 million, consisting of R$1,780.61,180.0 million of short-term indebtedness, including current portion of long-term indebtedness (or 29.7%14.1% of our total indebtedness), and R$4,219.17,201.9 million of long-term indebtedness (or 70.3%85.9% of our total indebtedness). At December 31, 2007, we had no outstanding indebtedness to related parties on a consolidated basis. Without giving effect to the proportional consolidation of our jointly controlled companies, at December 31, 2004,2007, our total outstanding indebtedness was R$5,651.58,101.0 million, consisting of R$1,522.11,176.0 million of short-term indebtedness, including current portion of long-term indebtedness, and R$4,129.46,925.0 million of long-term indebtedness.
On a consolidated basis, ourreal-denominated indebtedness at December 31, 20042007 was R$1,821.92,503.5 million (29.9%), and our foreign currency-denominated indebtedness was R$4,177.8 million.5,878.4 million (70.1%) . Without giving effect to the proportional consolidation of our jointly controlled companies, ourrealreal--denominateddenominated indebtedness at December 31, 20042007 was R$1,552.22,260.3 million, and our foreign currency-denominated indebtedness was R$4,099.45,840.5 million. At December 31, 2004, our total outstanding indebtedness to related parties on a consolidated basis was R$115.7 million.
Our financing strategy has been to continue to extend the average maturity of our outstanding indebtedness, including by repaying short-term debt through longer-term borrowings and with a portion of the proceeds of our global offering of class A preferred shares, and issuing longer-term debt securities, including the notes offered hereby, in order to increase our liquidity levels and improve our strategic, financial and operational flexibility. Our financing strategy over the next several years involves usingmaintaining adequate liquidity and a substantial portion ofdebt maturity profile that is compatible with our consolidatedanticipated cash flow generation and anticipated capital expenditures. In addition, we do not expect our capital expenditures to pay principal and interest
with respect to our outstanding indebtedness thereby further reducing our debt-to-equity ratio and net debt to EBITDA ratio, and reducingaffect adversely the proportionquality of our debt that is denominated in foreign currencies.leverage ratios or our disciplined approach to capital allocation.
Short-Term Indebtedness
Our consolidated short-term debt, including debentures and current portion of long-term debt, but excluding related party debt, decreased towas R$1,780.61,180.0 million at December 31, 2004 from R$3,075.5 million at December 31, 2003 primarily as a result of our repayment of a portion of our short-term debt with a portion of the proceeds of our global offering of class A preferred shares.2007. Without giving effect to the proportional consolidation of our jointly controlled companies, our short-term debt decreased towas R$1,522.11,176.0 million at December 31, 2004, compared to R$2,858.0 million at December 31, 2003.2007.
124
We maintain short-term finance lines denominated inreaiswith a number of financial institutions in Brazil. Although we have no committed lines of credit with these financial institutions, we believe that we will continue to be able to obtain sufficient credit to finance our working capital needs based on current market conditions. At December 31, 2004,2007, the consolidated outstanding balance under our working capital lines denominated inreaiswas R$45.1128.8 million. Without giving effect to the proportional consolidation of our jointly controlled companies, the outstanding balance under our working capital lines denominated inreaiswas R$28.1128.8 million.
We also obtain advances on certain export contracts from a variety of Brazilian financial institutions. These advances generally have a maturity of less than one year and relatively low interest rates. These advances on export contracts are generally secured by receivables to be generated from future export sales under those contracts. At December 31, 2004, our consolidated outstanding advances on export contracts totaled R$351.9 million (US$132.6 million). See note 15 to our consolidated and combined financial statements included in this annual report. Without giving effect to the proportional consolidation of our jointly controlled companies, at December 31, 2004, our outstanding advances on export contracts totaled R$300.6 million (US$113.2 million).
In addition, we have incurred import financing for raw materials from various domestic and international institutions. These advances have a maturity of less than one year and bear interest at LIBOR plus a spread which varied between 0.53% and 7.65% during the year.5.65% in 2007. These financings are generally evidenced by promissory notes. At December 31, 2004,2007, our consolidated outstanding advances under our import financing arrangements totaled R$471.520.4 million (US$177.611.5 million). Without giving effect to the proportional consolidation of our jointly controlled companies, our outstanding advances under our import financing arrangements at December 31, 2004 were2007 totaled R$421.220.4 million (US$158.711.5 million).
Long-Term Indebtedness
The following table sets forth selected information with respect to certain of our principal outstanding long-term debt instruments at December 31, 2004.
2007.
| Outstanding Principal |
| |||||||||||
| Amount at | |||||||||||||
| Instrument | December 31, 2007 | Final Maturity | Principal Covenants | ||||||||||
| Debentures: | |||||||||||||
| 14thIssue of Debentures | R$517.8 million | September 2011 | Financial ratios | ||||||||||
| 13thIssue of Debentures | R$302.6 million | June 2010 | Financial ratios | ||||||||||
| Medium-Term Notes: | |||||||||||||
| 12.50% Notes due 2008 | US$92.4 million | November 2008 | Financial ratios, limitations on liens, dividends, indebtedness, related party transactions, investments and mergers | ||||||||||
| Financial ratios, limitations on liens, dividends, indebtedness, | ||||||||||||
|
| ||||||||||||
| 8.250% Notes due 2024 | US$150.0 million | June 2024 | Limitations on liens | ||||||||||
| 9.375% Notes due 2015 | US$250.0 million | June 2015 | Limitations on liens, related party transactions and mergers | ||||||||||
| US$150.0 million | — | Limitations on liens, related party transactions and mergers | ||||||||||
| 9.00% Perpetual Bonds | US$200.0 million | — | Limitations on liens, related party transactions and mergers | ||||||||||
| 8.00% Notes due 2017 | US$275.0 million | January 2017 | Limitations on liens, related party transactions and mergers | ||||||||||
| |||||||||||||
| Acquisition Credit Agreement: | Limitations on liens, | ||||||||||||
| US$ | ||||||||||||
| US$ | ||||||||||||
| US$311.2 million | October 2009 | |||||||||||
| 4th tranche | US$50.5 million | October 2009 | |||||||||||
| 5th tranche | US$101.0 million | October 2009 | |||||||||||
| June | ||||||||||||
| Limitations on liens | ||||||||||||
| Syndicated Credit Agreement | US$54.5 million | March 2012 | Financial ratios, limitations on liens, related party transactions, mergers and asset sales | ||||||||||
| Syndicated Credit Agreement | US$57.2 million | June 2012 | Financial ratios, limitations on liens, related party transactions, mergers and asset sales | ||||||||||
| |||||||||||||
| Export Finance Facilities: | |||||||||||||
|
| ||||||||||||
|
| ||||||||||||
| Limitations on liens, related party transactions and mergers | ||||||||||||
| 1st tranche | US$107.5 million | October 2009 | |||||||||||
125
|
| ||||||
| Outstanding Principal | ||||||
| Amount at | |||||||
| Instrument | December 31, 2007 | Final Maturity | Principal Covenants | ||||
| |||||||
| 2nd tranche | US$205.0 million | October 2009 | |||||
| Export Credit Facility | US$48.3 million | May 2010 | |||||
| Export Prepayment Agreement | US$95.0 million | June | Limitations on liens, related party transactions and mergers | ||||
| Export Prepayment Agreement | US$150.0 million | November 2013 | Limitations on liens | ||||
| Export Prepayment Agreement | US$150.0 million | April 2014 | Limitations on liens | ||||
| Export Prepayment Agreement | US$75.0 million | July 2014 | Limitations on liens | ||||
| Credit Export Note Facility | US$50.0 million | March 2018 | Limitations on liens | ||||
| Credit Export Note Facility | US$78.0 million | May 2018 | Financial ratios | ||||
| US$ |
| |||||
| |||||||
Many Some of our debt instruments require that we comply with financial covenants, that we must maintain, the most restrictive of which are as follows:
We also are required to maintain a maximum ratio of short-term net debt to EBITDA for a particular fiscal quarter ifUnder our net debt to EBITDA ratio is greater than a specified level or our EBITDA to net financial expenses ratio is less than a specified level.
The definitions of EBITDA contained in these instruments vary, and in the instruments containing the most restrictive financial ratios described above,debentures, EBITDA is generallycalculated differently than under our medium-term note program and is defined for purposes of the net debt to EBITDA ratio and the EBITDA to net financial expenses ratio, as operating income less financial expenses, taxes, depreciation and amortization, plus dividends and interest attributable to shareholders’ equity paid to us by our unconsolidated associated companies. These instruments defineIn contrast to EBITDA in a similar manneras calculated under the medium-term note program covenant, the calculation of EBITDA under our debentures for purposes of the short-term net debt to EBITDA ratio but excludethese ratios does not eliminate the effect of proportional consolidation for purposes of calculating that ratio.under Instruction 247. For more detailed information, see footnote 6 to the table presented under “Item 3. Key Information–Selected Financial Information.”
For the fiscal year ended December 31, 2004,2007, we reported the following financial ratios to certain of our creditors:
Accordingly, we were in compliance with these financial covenants at December 31, 2004,2007, and we believe that we will be able to comply with these financial covenants for the foreseeable future. In addition, we believe that our compliance with these financial covenants will not adversely affect our ability to implement our financing plans.
Many of these instruments also contain other covenants that restrict, among other things, the ability of our company and most of our subsidiaries to:
126
In addition, the instruments governing a substantial portion of our indebtedness contain cross-default or cross-acceleration clauses, such that the occurrence of an event of default under one of these instruments could trigger an event of default under other indebtedness or enable the creditors under other indebtedness to accelerate that indebtedness.
At December 31, 2004,2007, R$423.7523.9 million of ourreal-denominated debt and R$198.177.9 million of our foreign currency-denominated debt (in each case, excluding related party debt) was secured. In order to secure this debt,
we have pledged (1) a substantial number of shares owned by our company in subsidiaries and affiliates, including Copesul and Polialden, (2) certain of our property and equipment and (3) certain of our accounts receivable. The security arrangements for our secured debt vary depending on the transaction.
The following discussion briefly describes certain of our significant financing transactions. We have assumed the obligations of predecessor companies, including, among others, OPP Química (and its predecessor OPP Petroquímica) and Trikem, under these financing transactions as a result of the mergers referred to under “— Principal Factors Affecting Our Results of Operations—Nova Camaçari Acquisitionthese companies with and Mergers with OPP Produtos and 52114 Participações.”into our company.
1214th Issue of Debentures. On JuneSeptember 1, 2004,2006, we issued our 1214th issue of securedunsecured non-convertible debentures in a single series of 3,00050,000 debentures, each with a par value of R$100,000. These10,000. The principal amount of these debentures are secured byis payable in full on September 1, 2011, and these debentures bear interest at a pledgerate of one103.5% of the CDI rate per annum payable semi-annually in arrears in March and September of each year.
13th Issue of Debentures. On June 1, 2005, we issued our long-term customer contracts and13th issue of unsecured non-convertible debentures in a related collection account, which pledge may be replaced or supplemented bysingle series of 30,000 debentures, each with a pledge of some of our current and future customer receivables, as well as by certain of our cash and cash equivalents if thepar value of the original pledge falls below a certain specified minimum level.R$10,000. The principal amount of these debentures is payable in full on June 1, 2009,2010, and these debentures bear interest at thea rate of 117%104.1% of the CDI rate per annum beginningpayable semi-annually in arrears in June 1, 2004, payable semi-annually. We have the right to redeem these debentures at any time on or after June 1, 2007.and December of each year.
Subordinated Convertible Debentures. On May 31, 2002, OPP Produtos issued subordinated convertible debentures. As a result of our merger with OPP Produtos, these debentures became our obligations. The original principal amount of these debentures was R$591.9 million. At December 31, 2004, the outstanding amount of these debentures was R$659.9 million (including interest). Interest and monetary adjustment on these debentures accrues at the Long-Term Interest Rate plus 5.0% per annum and will be accreted until their maturity on July 31, 2007. ODBPAR Investments, as the holder of these debentures, has the option to convert the debentures into shares of our share capital at any time. The initial conversion price of these debentures was R$12.19 per class A preferred share, plus accrued interest. The conversion price increases at a rate equal to the Long-Term Interest Rate less 6.0% per annum from the date of the issuance of these debentures. At May 31, 2005, the conversion price of these debentures was R$13.79 per class A preferred share. Upon conversion, we will issue class A preferred shares up to the legal limit for preferred shares of two-thirds of our total share capital. After this two-thirds limit is reached, we will issue any remaining shares to be converted in the following proportions: one-third in common shares; and two-thirds in class A preferred shares. If ODBPAR Investments had exercised its option to convert these debentures in full on May 31, 2005, ODBPAR Investments would have received 22,236,910 of our common shares and 44,473,820 of our class A preferred shares in exchange for these debentures.
Medium-Term Note Program.Program. On July 16, 2003, we established a medium-term note program permitting us to issue up to US$500.0 million aggregate principal amount of notes with maturities of up to five years from date of issuance. On December 16, 2003, we amended our medium-term note program to increase the maximum aggregate principal amount that we are permitted to issue to US$1,000.0 million1.0 billion and to extend the maximum maturity of the notes issued under the program to ten10 years from the date of issuance. We have threetwo series of outstanding notes under the program.
On October 28, 2003, we issued and sold US$65.0 million in aggregate principal amount of our 9.25% Notes due 2005 under the medium-term note program. Interest on these notes is payable in April and October of each year, commencing on April 28, 2004, and the notes mature on October 28, 2005.
Between November 5, 2003 and November 26, 2003, we issued and sold US$275.0 million aggregate principal amount of our 12.50% Notes due 2008. Interest on these notes is payable semi-annually in arrears in May and November of each year commencing on May 5, 2004, and thethese notes mature on November 5, 2008. On October 2, 2006, we repurchased US$184.6 million aggregate principal amount of these notes that were tendered to us in a tender offer we made for these notes.
On January 22, 2004, we issued and sold US$250.0 million in aggregate principal amount of our 11.75% Notes due 2014 under the medium-term note program. Interest on these notes is payable onsemi-annually in arrears in January 22 and July 22 of each year commencing on July 22, 2004, and thethese notes mature on January 22, 2014.
Fixed Rate Notes.Notes. On June 25, 1997, we issued and sold US$150.0 million aggregate principal amount of our 9.0% Notes due 2007. Interest on these notes is payable semi-annually in arrears in June and December inof each year, andyear. In June 2007, we entered into a supplemental trust deed amending the trust deed governing our 9% notes due 2007 to permit us to redeem these notes maturein whole, but not in part, at any time prior to their maturity at a purchase price
127
equal to 100% of their principal amount plus accrued and unpaid interest to the redemption date. In June 2007, we entered into a second supplemental trust deed amending the trust deed governing our 9% notes due 2007 that reduced the interest rate on these notes to 8.250% and extended their maturity date until June 25, 2007. At December 31, 2004, the outstanding principal balance of these notes was US$15.7 million.2024.
On July 24, 1997, Trikem issued and sold US$250.0 million aggregate principal amount of its 10.625% Notes due 2007. Interest on these notes is payable semi-annually in arrears in January and July in each year, and these notes mature on July 24, 2007. We assumed the obligations of Trikem under these notes as a result of the merger of Trikem with and into our company on January 15, 2004. We have the right to repurchaseOn July 24, 2005, we repurchased these notes on July 24 of each year. In addition, the holders ofand amended and restated their terms. As amended and restated, these notes have the option (exercisable up to 60 days after a change of control of our company) to require us to purchase all or part of these notes if the Odebrecht Group ceases to own, directly or indirectly, at least 50.1% of our total voting share capital, unless the Odebrecht Group guarantees our obligations under these notes. We intend to repurchase these notes on July 24, 2005.
Bank Credit Facilities. In January 1998, several financial institutions granted a loan in the amount of US$30.0 million to Proppet to finance construction of its PET plant in Camaçari, Bahia. This loan has since been amended to, among other provisions, reflect the merger of Proppet with and into our company. ODBPAR Investments, Norquisa and Mitsubishi have guaranteed this loan. ODBPAR Investments and Norquisa have also agreed to reimburse Mitsubishi for any payments that it makes in respect of this guarantee if we default on our payment obligations under the loan. To guarantee their reimbursement obligations, Norquisa and ODBPAR Investments have caused our company to grant Mitsubishi a second mortgage on its DMT and PET plants and to pledge the equipment related to its DMT and PET production. The loan amortizes in equal semi-annual installments until its final maturity in December 2007. At December 31, 2004, the outstanding principal balance of this loan was US$11.3 million. The loan bearsbear interest at the rate of LIBOR plus 3.875%9.375% per annum, payable semi-annually in arrears in June and December of each year and mature on June 1, 2015. On August 24, 2005, we exchanged US$150.0 million aggregate principal amount of these notes for US$150.0 million aggregate principal amount of outstanding notes issued by one of subsidiaries on June 1, 2005 and guaranteed by our company.
On June 17, 2005, we issued and sold US$150.0 million aggregate principal amount of our 9.75% Perpetual Bonds. Interest on these bonds is payable quarterly in arrears in March, June, September and December of each year. Ninety-five percentWe may, at our option, redeem these bonds, in whole but not in part, at 100% of their principal amount plus accrued interest and additional amounts, if any, on any interest payment date on or after June 17, 2010.
On April 28, 2006, we issued and sold US$200.0 million aggregate principal amount of our 9.00% Perpetual Bonds. Interest on these bonds is payable quarterly in arrears in January, April, July and October of each year. We may, at our option, redeem these bonds, in whole or in part, at 100% of their principal amount plus accrued interest and additional amounts, if any, on any interest payment date on or after April 28, 2011, provided that, if we redeem these bonds in part, at least US$100 million aggregate principal amount of these bonds must remain outstanding following any partial redemption.
On September 26, 2006, we issued and sold US$275.0 million aggregate principal amount of our 8.00% Notes due 2017. Interest on these notes is payable semi-annually in arrears in January and July of each year and these notes mature on January 26, 2017.
Bank Credit Facilities. In April 2007, we entered into the Acquisition Credit Agreement with three financial institutions in the aggregate amount of US$1.2 billion to finance the Ipiranga Transaction. In April 2007, we received the first disbursement under the Acquisition Credit Agreement in the aggregate amount of US$330.0 million to fund the first payment due under the Ipiranga Investment Agreement. In October 2007, we received the second and third disbursements under the Acquisition Credit Agreement in the aggregate amount of US$468.8 million to fund a portion of the purchase price under the Copesul Tender Offer. In October 2007, we received the fourth and fifth disbursements under the Acquisition Credit Agreement in the aggregate amount of US$150.0 million to fund a portion of the purchase price paid by Ultrapar in tender offers for the common shares of RPI, DPPI or CBPI. In February 2008, we received the sixth and final disbursement under the Acquisition Credit Agreement in the aggregate amount of US$251.2 million to fund the final payment due as part of the Ipiranga Transaction. Each disbursement under the Acquisition Credit Agreement bears interest at the rate of LIBOR plus 0.35% per annum until the first anniversary of such disbursement and thereafter at the rate of LIBOR plus 0.55% per annum, payable in arrears. The principal and interestamount of each disbursement under the Acquisition Credit Agreement is payable on or prior to the second anniversary of such disbursement. The Acquisition Credit Agreement includes limitations on our ability to incur liens, enter into related party transactions or merge with certain other entities. At December 31, 2007, the outstanding principal amount under this loan is supported by insurance from Nippon Export and Investment Insurance, and we pay annual premiums in yen for this insurance.credit agreement was US$960.0 million.
On June 30, 2004, we entered into a secured credit agreement in the aggregate amount of R$152.7 million to finance capital expenditures in certain of our plants located in the Northeastern Complex and in Alagoas that we made in the second half of 2004 and plan to make in 2005. The loans under this credit agreement are secured by a first mortgage on our PVC plant located in São Paulo and our chloro-soda plant located in the Northeastern Complex, as well as by a purchase-money security interest in machinery and equipment that we have and will purchase with the proceeds of this loan. Under this credit agreement, we arewere required to invest up to R$65.4 million of our own funds in accordance with an investment schedule as a condition precedent to disbursements of the loans. As of December 31, 2004, we have invested R$58.6 million on capital expenditures included on this investment schedule, including loans to our company in the aggregate principal amount of R$31.5 million disbursed by the lender. The loans under this credit agreement bear interest at the rate of 14.0%9.78% per annum, payable quarterly in arrears from July 30, 2004 through June 30, 2008 and thereafter monthly in arrears through June 30, 2016. The lender under this credit agreement may modify the interest rate annually based on fluctuations in the Long-Term Interest Rate during the preceding year and upon written notice to our company. The principal amount of these loans is payable in 96 equal monthly installments, commencing on July 30, 2008. At December 31, 2004,2007, the outstanding principal amount under this credit agreement was R$31.5152.7 million.
128
Acquisition Financing. In September 2001, BNDESPAR sold 1,000,000,000 class B preferred shares On March 24, 2005, we borrowed the Japanese yen equivalent of Conepar to Nova Camaçari forUS$50.0 million under a purchase price of R$163.9 million and, as part of this transaction, BNDESPAR extended a loan to Nova Camaçari in a principal amount equal to the purchase price. This loan bears interest at the Long-Term Interest Rate plus 4.0% per annum, payable annually each August 15, and matures on August 15, 2006. At December 31, 2004, the outstanding principal balancesyndicated credit agreement dated March 8, 2005. The proceeds of this loan was R$167.7 million.
Subject to the preemptive rights of existing shareholders, BNDESPAR has the option to convert the principal amount of and accrued interest on this loan into our class A preferred shares at any time prior to the maturity of this loan. If this loan is converted in connection with a public offering, the conversion price will be
the offering price. If this loan is converted other than in connection with a public offering, the conversion price will be the greater of the offering price in our last public offering occurring within the nine months prior to the conversion, monetarily restated by the IGP-M, and the weighted average of the average daily prices for our class A preferred shares on the São Paulo Stock Exchange during the 60 days prior to the conversion. Upon conversion, we will issue class A preferred shares up to the legal limit for preferred shares of two-thirds of our total share capital. After this two-thirds limit is reached, we will issue any remaining shareswere required to be converted in the following proportions: one-third in common shares; and two-thirds in class A preferred shares.
Export Prepayment Facilities. In December 2002, OPP Química entered into a prepayment advanceused for productscapital expenditures related to be exported to a foreign customer in the amount of US$97.2 million.our Braskem+ program. This prepayment advanceloan bears interest at the rate of six-month LIBORTokyo Inter-Bank Offered Rate plus 3.75% per annum. This prepayment advance will be paid through partial semi-annual shipments from December 2003 to June 2006. At December 31, 2004, the outstanding principal amount of this prepayment advance was US$47.0 million. Our obligation to deliver export products is guaranteed by a surety bond.
On June 7, 2004, Overseas III Export Ltd., a special purpose company created by QSPV Limited, entered into a US$200.0 million syndicated credit agreement. During June 2004, US$70.0 million was disbursed to Overseas III Export Ltd. and lent by Overseas III Export Ltd. to our company on identical terms and conditions as those contained in the syndicated credit agreement. During August 2004, the remaining US$130.0 million was disbursed to Overseas III Export Ltd. and lent by Overseas III Export Ltd. to our company on the identical terms and conditions as those contained in the syndicated credit agreement. The loan to Overseas III Export Ltd. has been guaranteed by our company and is secured by certain of our exports. The first tranche of this loan in the principal amount of US$145.0 million bears interest at the rate of six-month LIBOR plus 3.5%0.95% per annum, payable semi-annually in arrears. Principal on the first tranchethis loan is payable in five semi-annual11 equal installments beginning in December 2005.March 2007 with a final maturity date in March 2012. In connection with this loan, we entered into a swap contract in the total amount of this debt, which effectively modifies the interest rate to 101.59% of the CDI rate. The second tranchematurities, currency, rates and amounts of the swap contract correspond to the terms of the loan. Ninety-five percent of the commercial risk of this loan and 97.5% of the political risk of this loan are supported by insurance from Nippon Export and Investment Insurance, for which we paid a lump-sum premium in yen. At December 31, 2007, the outstanding principal amount under this credit agreement was US$54.5 million.
On September 20, 2005, we borrowed the Japanese yen equivalent of US$55.060.0 million under a syndicated credit agreement dated June 30, 2005. The proceeds of this loan were required to be used for capital expenditures related to the Braskem+ program. This loan bears interest at the rate of six-month LIBORTokyo Inter-Bank Offered Rate plus 4.5%0.95% per annum, payable semi-annually in arrears. Principal on the second tranchethis loan is payable in eight semi-annual11 equal installments beginning in June 2007 with a final maturity date in June 2012. In connection with this loan, we entered into a swap contract in the total amount of this debt, which effectively modifies the interest rate to 104.4% of the CDI rate. The maturities, currency, rates and amounts of the swap contract correspond to the terms of the loan. Ninety-five percent of the commercial risk of this loan and 97.5% of the political risk of this loan are supported by insurance from Nippon Export and Investment Insurance, for which we paid a lump-sum premium in yen. At December 2005.31, 2007, the outstanding principal amount under this credit agreement was US$57.3 million.
On July 21, 2004, weExport Prepayment Facilities. In September 2007, EDSP58 entered into an export prepayment credit facility with PIFCo under which EDSP58 is permitted to borrow an aggregate principal amount of up to US$323.0 million. As a result of the merger of EDSP58 with and into Copesul in December 2007, the PIFCo export prepayment credit facility became a direct obligation of Copesul. The loans under this facility may be disbursed in up to 10 disbursements. Each disbursement under this facility bears interest, payable in arrears, at the rate of LIBOR plus 0.35% per annum until the first anniversary of such disbursement and thereafter at the rate of LIBOR plus 0.55% per annum. The principal amount of each disbursement under the PIFCo export prepayment facility is payable on or prior to the second anniversary of such disbursement. In October 2007, EDSP58 borrowed an aggregate of US$312.5 million under this facility to fund a portion of the purchase price of the shares tendered in the Copesul Tender Offer that was part of the Ipiranga Transaction. At December 31, 2007, the outstanding principal amount under this export prepayment credit facility was US$312.5 million.
In May 2005, Ipiranga Petroquímica entered into an export credit facility in an aggregatethe amount of US$50.0 million. The loan under60.0 million with a Brazilian financial institution. As a result of the consolidation of the results of Ipiranga Petroquímica in our financial statements as from April 1, 2007, this facilityindebtedness is secured by certain ofincluded in our exports andconsolidated indebtedness. This facility bears interest at a rate of three-month LIBOR plus 3.0%1.65% per annum, payable quarterly in arrears commencing on January 21, 2005.arrears. The principal amount of this facility is payable in eight equal quarterly installments beginningmonthly payments commencing in January 2005.June 2007 through maturity in May 2010. At December 31, 2004,2007, the outstanding principal amount under this export credit facility was US$48.3 million.
In July 2006, Ipiranga Petroquímica entered into an export prepayment agreement in the amount of US$95.0 million with a Brazilian financial institution. As a result of the consolidation of the results of Ipiranga Petroquímica in our financial statements as from April 1, 2007, this indebtedness is included in our consolidated indebtedness. This facility is secured by certain of export receivables of Ipiranga Petroquímica and certain shares of Coepsul, and bears interest at a rate of LIBOR plus 1.00% per annum, payable in arrears. The principal amount of this facility is payable in monthly payments commencing in August 2009 through maturity in June 2013. At December 31, 2007, the outstanding principal amount under this export prepayment agreement was US$95.0 million.
In November 2007, Ipiranga Petroquímica entered into an export prepayment agreement in the amount of US$150.0 million with a Brazilian financial institution. This facility bears interest at a rate of LIBOR plus 1.40% per annum, payable in arrears. The principal amount of this facility is payable in monthly payments commencing in December 2011 through maturity in November 2013. At December 31, 2007, the outstanding principal amount under this export prepayment agreement was US$150.0 million.
129
In April 2007, we entered into an export prepayment agreement in the amount of US$150.0 million with a Brazilian financial institution. The loan under this agreement bears interest at a rate of LIBOR plus 0.77% per annum, payable semiannually in arrears commencing in October 2007. The principal amount of this loan is payable in three semiannual payments commencing in April 2013. At December 31, 2007, the outstanding principal amount under this export prepayment agreement was US$150.0 million.
In July 2006, Ipiranga Petroquímica entered into an export prepayment agreement in the amount of US$75.0 million with a Brazilian financial institution. As a result of the consolidation of the results of Ipiranga Petroquímica in our financial statements as from April 1, 2007, this indebtedness is included in our consolidated indebtedness. This facility bears interest at a rate of LIBOR plus 0.78% per annum, payable in arrears. The principal amount of this facility is payable in monthly payments commencing in August 2009 through maturity in July 2014. At December 31, 2007, the outstanding principal amount under this export prepayment agreement was US$75.0 million.
Export Credit Note Facilities. In April 2007, we entered into a credit export note facility in the amount of US$50.0 million with a Brazilian financial institution. This facility bears interest at a rate of 7.87% per annum, payable semiannually in arrears commencing in October 2007. The principal amount of this facility matures in March 2018. At December 31, 2007, the outstanding principal amount under this credit export note facility was US$50.0 million.
BNDES Development Loans. We maintain credit facilities that are granted directly or indirectly by BNDES to fund general capital expenditures associated principally with the expansion of our production capacity, environmental projects and the development of operation control centers, laboratories and waste treatment station, of which R$171.2 million principal amount was outstanding at December 31, 2004. Amounts borrowed from BNDES are secured by a pledge of certain equipment and machinery owned by us. The interest rate on most of the amountsIn November 2006, we borrowed from BNDES is based on the Long-Term Interest Rate plus a margin of 2% to 5% per annum. Other amounts borrowed from BNDES bear interest at a government reference rate (theTaxa Referencial), plus a margin of 6.5%, or at a rate based on the UM, a BNDES rate based on a basket of currencies (which rate reflects the daily exchange rate fluctuations in the currencies in which BNDES borrows), plus a margin. The principal and interest on these credit facilities is payable monthly through July 2007.
Related Party Debt. During the second and third quarters of 2003, we, through our subsidiary Lantana Trading Co. Inc., entered into several loan agreements with Copesul International Trading Inc., an affiliate of Copesul, which loans have an aggregate outstanding amount of R$102.9 million at December 31, 2004.
Off-Balance Sheet Arrangements
We have retained an interest in subordinated quotas (shares) of an investment fund in a securitization of receivables described below. The securitization of receivables is accounted for as a sale under Brazilian GAAP to the extent that the receivables are sold to a securitization fund without recourse. We have entered into this off-balance sheet arrangement in order to increase our liquidity, as it enables us to receive immediate payment for purchases of petrochemical products by clients to whom we provide short-term trade financing in the ordinary course of our business.
On November 6, 2003, our company, Trikem and Polialden entered into a receivables purchase and sale agreement with a special purpose receivables investment fund under which our company, Trikem and Polialden agreed to sell to the fund from time to time, without recourse, certain trade receivables represented by negotiable invoices(duplicatas). Under this agreement, this fund may purchase these receivables using (1) the net proceeds that it obtains from the sale of interests, or senior quotas, in the fund to certain qualified investors in Brazil and (2) past due receivables that our company, Trikem or Polialden have previously sold to the fund and, although not obligated to do so, agree to repurchase. The fund also may invest a portion of such net proceeds in cash and certain cash equivalents. The aggregate amount of the quotas of all series outstanding at any time may not exceed R$500.0 million. Each series of quotas will have a maturity of not less than 12 months from the date of issuance and will amortize on June 15 and December 15 of each year. The amortization payments will include amounts in respect of interest calculated as a multiple of the CDI rate.
The fund may cause the early amortization of quotas to the extent necessary to meet specified coverage ratios or to ensure that receivables constitute at least a specified percentage of the fund’s net worth. We, Trikem and Polialden also agreed to purchase subordinated quotas from the fund to the extent necessary to enable the fund to meet specified coverage ratios, whether measured on periodic calculation dates or measured on a pro forma basis before the issuance of quotas to investors. In addition, we, Trikem and Polialden are required to maintain an insurance policy covering an aggregate amount of 20% of the value of any series of quotas issued by the fund, and the fund may demand payment under the insurance policyexport credit note facility in the amount of the receivables under any negotiable invoice for which documents necessary to pursue a collection action against the applicable obligor are unavailable. We assumed the retained interests of Trikem under the sale of receivables as a result of its merger into our company on January 15, 2004.
On November 13, 2003, the fund commenced the offering of an initial series of quotas to be issued by the fund. On December 15, 2003, the fund issued R$100.0US$78.0 million in aggregate amount of quotas, and on January 9, 2004, the fund issued another R$100.0 million in aggregate amount of quotas. These quotas will mature on December 15, 2006. The first series of quotas consists of 8,000 quotas, each with a unit valueBrazilian financial institution. This facility is secured by certain of R$25,000. The quotas began amortizing on June 15, 2004,our export receivables and the amortization payments include a targeted (but not guaranteed) amount ofbears interest at a rate of 113.5%8.1% per annum, payable semiannually in arrears commencing on May 10, 2007. The principal amount of the CDI rate basedthis facility matures on market conditions.May 10, 2018. At December 31, 2004,2007, the outstanding principal amount under this facility was US$78.0 million.
In May 2007, we held R$27.9entered into a credit export note facility in the amount of US$75.0 million with a Brazilian financial institution. This facility bears interest at a rate of subordinated quotas.7.85% per annum, payable semiannually in arrears commencing in November 2007. The principal amount of this facility matures in May 2019. At December 31, 2007, the outstanding principal amount under this credit export note facility was US$75.0 million.
Under U.S. GAAP, the fund is consolidated on our balance sheet, becauseBNDES Development Loans. On June 24, 2005, we are considered the primary beneficiaryentered into two credit facilities with BNDES under which BNDES disbursed loans in an aggregate principal amount of approximately R$336.2 million. The proceeds of the fund. See note 29(p)first credit facility were R$84.2 million, which we used to finance capital expenditures related to (1) the 50,000 ton increase in the annual production capacity of our consolidatedAlagoas PVC plant, and combined financial statements included elsewhere(2) a project to use polypropylene in the disposable plastics market. The proceeds of the second credit facility were R$252.0 million, which we used to finance capital expenditures related to (1) the 100,000 ton increase in the annual production capacity of one of our polypropylene plants located in the Southern Complex, and (2) quality, productivity, environmental, health and safety projects at our plants.
On December 13, 2006, we entered into a third credit facility with BNDES under which BNDES disbursed loans in an aggregate principal amount of approximately R$48.4 million. The proceeds of the third credit facility were used to finance capital expenditures related to (1) the construction of a new salt well in Maceió, Alagoas to supply our Vinyls unit, and (2) the replacement of some equipment at our PVC plant in the Northeastern Complex.
These credit facilities are secured by a mortgage on one of our plants located in the Southern Complex (including the land on which this plant is located, as well as certain of the equipment, machinery and improvements in this annual report. Asplant). Amounts under the first credit facility were disbursed in two tranches, and amounts under the second and third credit facility were disbursed in three tranches. The first tranches of the first and second credit facilities in an aggregate principal amount of R$12.6 million and R$37.8 million, respectively, bear interest at the UMBNDES rate, which is set by BNDES for its loans in foreign currency, plus a margin of 4% per annum. The other tranches of these credit facilities bear interest at the TJLP rate plus a margin of 4% per annum. Interest is payable on the first credit facility quarterly from July 15, 2005 through July 15, 2007 and monthly thereafter through maturity. The outstanding principal amount of the first credit facility is payable in 48 equal, successive monthly installments beginning on August 15, 2007. Interest is payable on the first and second tranches of the second credit facility quarterly from July 15, 2005 through January 1,15, 2007 and monthly thereafter through maturity. The outstanding principal amount of the first and second tranches of the second credit facility is payable in 48 equal, successive monthly installments beginning on February 15, 2007. Interest is payable on the third tranche of the second credit facility quarterly from July 15, 2005 through July 15, 2008 and monthly thereafter through maturity. The outstanding principal amount of the third tranche of the second credit facility is payable in accordance42 equal, successive monthly installments beginning on August 15, 2008.
130
At December 31, 2007, the outstanding principal amount under the first of these credit facilities was R$74.1 million, the outstanding principal amount under the second of these credit facilities was R$210.1 million, and the outstanding principal amount under the third of these credit facilities was R$46.2 million.
FINEP Credit Facility. On March 8, 2005, we entered into a credit facility with Brazilian Securities Commission Instruction 408/04,Financiadora de Estudos e Projetos, or FINEP, a technology funding institution of the Ministry of Science and Technology of Brazil, in an aggregate principal amount of R$84.9 million, that was disbursed in installments, beginning on March 15, 2005, with the final disbursement expected in the end of April 2008. We were required to use the proceeds disbursed under this credit facility for capital expenditures at the Braskem Center for Innovation and Technology operated by our Polyolefins Unit, the research and development pilot plant of our Vinyls Unit, and the research center of our Vinyls Unit. Under this credit facility, we are required to consolidate certain investmentsinvest at least R$9.4 million of our own funds in these projects. The loans bear interest at the TJLP rate plus 5% per annum, payable quarterly in arrears commencing on June 15, 2005. However, we may be required to pay interest at only the TJLP, depending on the financial condition and securitization funds. Asliquidity of the National Scientific and Technological Development Fund (Fundo Nacional de Desenvolvimento Científico e Tecnológico) at any given time. The principal amount under this credit facility is payable in 61 equal monthly installments beginning on March 15, 2007, with a result, in financial statements for periods ending afterfinal maturity date of March 15, 2012. At December 31, 2004, we are required2007, the outstanding principal amount under this credit facility was R$64.1 million. Our obligation to consolidate all assets and liabilities related to the transaction described above on our balancemake payments under this credit facility is guaranteed by a surety bond.
Off-Balance Sheet Arrangements
We do not currently have any transactions involving off-balance sheet and the related effects on our income statement.
Contractual Commitments
Contractual Commitments
The following table summarizes significant contractual obligations and commitments at December 31, 20042007 that have an impact on our liquidity:
131
| Payments Due by Period | |||||||||||||||||||
| Less than One Year | One to Three Years | Three to Five Years | More than Five Years | Total | |||||||||||||||
| (In millions ofreais) | |||||||||||||||||||
Loans and financings | R$ | 1,775.6 | (1) | R$ | 1,566.6 | R$ | 795.4 | R$ | 689.2 | R$ | 4,826.8 | ||||||||
Debentures | 5.0 | (1) | 867.9 | 300.0 | — | 1,172.9 | |||||||||||||
Interest on loans, financings and debentures(2) | 369.0 | 491.9 | 85.1 | 148.4 | 1,094.4 | ||||||||||||||
Purchase obligations(3) | 6,606.5 | 12,723.2 | 4,906.0 | 2,190.4 | 26,426.1 | ||||||||||||||
Pension plan contributions(4) | 7.8 | — | — | — | 7.8 | ||||||||||||||
Other long-term liabilities | — | 195.3 | — | — | 195.3 | ||||||||||||||
Total contractual obligations | 8,763.9 | 15,844.9 | 6,086.5 | 3,028.0 | 33,723.3 | ||||||||||||||
Exclusion of proportional consolidation: | |||||||||||||||||||
Loans and financings | (258.5 | )(1) | (87.4 | ) | (2.1 | ) | — | (348.0 | ) | ||||||||||
Interest on loans and financings(2) | (5.5 | ) | (3.4 | ) | (0.1 | ) | — | (9.0 | ) | ||||||||||
Other long-term liabilities | — | (18.5 | ) | — | — | (18.5 | ) | ||||||||||||
Total contractual obligations, excluding the effects of proportional consolidation | R$ | 8,499.9 | R$ | 15,735.6 | R$ | 6,084.3 | R$ | 3,028.0 | R$ | 33,347.8 | |||||||||
| Payments Due by Period | ||||||||||
| One to | ||||||||||
| Less than | Three | Three to | More than | |||||||
| One Year | Years | Five Years | Five Years | Total | ||||||
| (in millions of reais) | ||||||||||
| Loans and financings | R$1,068.4(1) | R$2,972.4 | R$633.7 | R$2,795.8 | R$7,470.3 | |||||
| Debentures | 111.6(1) | 300.0 | 500.0 | — | 911.6 | |||||
| Interest on loans, financings and debentures (2) | 481.6 | 538.7 | 273.9 | 292.5 | 1,586.7 | |||||
| Purchase obligations (3) | 5,910.8 | 9,526.3 | 9,122.5 | 9,122.5 | 33,682.1 | |||||
| Ipiranga Investment Agreement | 633.5 | — | — | — | 633.5 | |||||
| Pension plan contributions (4) | — | 35.7 | — | — | 35.7 | |||||
| Other long-term liabilities | — | 139.1 | — | — | 139.1 | |||||
| Total contractual obligations | 8,205.9 | 13,512.2 | 10,530.1 | 12,210.8 | 44,459.0 | |||||
| Exclusion of proportional consolidation: | ||||||||||
| Loans, financings and debentures | 3.9(1) | 83.3 | 193.7 | — | 280.9 | |||||
| Interest on loans, financings and | ||||||||||
| debentures(2) | 2.0 | 3.7 | 2.5 | 1.1 | 9.3 | |||||
| Total contractual obligations, excluding the effects of proportional consolidation | R$8,200.0 | R$13,425.2 | R$10,333.9 | R$12,209.7 | R$44,168.8 | |||||
| (1) | Includes interest accrued at December 31, |
| (2) | Consists of estimated future payments of interest on our loans, financings and debentures, calculated based on interest rates and foreign exchange rates applicable at December 31, |
| (3) | Consists of purchase commitments for raw material and electric power pursuant to binding obligations which include all significant terms, including fixed or minimum quantities to be purchased; fixed, minimum or variable price provisions; and the approximate timing of the transaction. Based upon the applicable purchase prices at December 31, |
| (4) | Consists of |
We are also subject to contingencies with respect to tax, labor, distributors and other claims and have made provisions for accrued liability for legal proceedings related to certain tax claims of R$1,332.11,039.7 million at December 31, 2004.2007. The tax contingencies relate primarily to the COFINS, PIS, IPI, federal income tax and the Social Contribution on Net Income.CSLL. See “Item 8. Financial Information—Legal Proceedings” and notes 9, 16, 17 and 1821 to our consolidated and combined financial statements.
U.S. GAAP Reconciliation
Our net income (loss) in accordance with Brazilian GAAP was R$690.9547.6 million in 2004,2007, R$215.1101.3 million in 20032006, and R$(1,378.7)625.8 million in 2002.2005. Under U.S. GAAP, we would have reported net income (loss) of R$887.8 million, R$378.11,089.1 million in 20032007, R$161.6 million in 2006 and R$(1,144.0)741.2 million in 2002.2005.
Our shareholders’ equity in accordance with Brazilian GAAP was R$4,187.55,757.0 million at December 31, 2004 and2007, R$2,112.64,311.9 million at December 31, 2003.2006 and R$4,535.8 million at December 31, 2005. Under U.S. GAAP, we would have reported shareholders’ equity of R$2,588.95,031.9 million at December 31, 2004 and2007, R$7.82,966.8 million at December 31, 2003.2006 and R$2,918.4 million at December 31, 2005.
The principal differences between Brazilian GAAP and U.S. GAAP that affected our net income in 2004, 20032007, 2006 and 2002,2005, as well as shareholders’ equity at December 31, 20042007 and 2003,2006, are described in note 2931 to our audited consolidated and combined financial statements included elsewhere in this annual report. The major differences relate to the accounting treatment of the following items:
132
For a discussion of the principal differences between Brazilian GAAP and U.S. GAAP as they relate to our financial statements and a reconciliation of net income and shareholders’ equity, see note 2931 to our audited consolidated and combined financial statements included elsewhere in this annual report.
133
ITEM 6. DIRECTORS, SENIOR MANAGEMENT AND EMPLOYEES
Directors and Senior Management
Our board of directors (conselho de administração) and our board of executive officers (diretoria) are responsible for operating our business.
Board of Directors of Braskem
Our by-laws provide for a board of directors of eleven members and eleven alternate members. During periods of absence or temporary unavailability of a regular member of our board of directors, the corresponding
alternate member substitutes for the absent or unavailable regular member. Our board of directors is a decision-making body responsible for, among other things, determining policies and guidelines for our business and our wholly-owned subsidiaries and controlled companies. Our board of directors also supervises our board of executive officers and monitors its implementation of the policies and guidelines that are established from time to time by the board of directors. Under the Brazilian Corporation Law, our board of directors is also responsible for hiring an external independent registered public accounting firm.accountants.
The members of our board of directors are elected at general meetings of shareholders for two-year terms and are eligible for reelection. The terms of all current members expire at our annual shareholdersshareholders’ meeting in 2006.2010. Members of our board of directors are subject to removal at any time with or without cause at a general meeting of shareholders. Although our by-laws do not contain any citizenship or residency requirements for members of our board of directors, the members of our board of directors must be shareholders of our company. Our board of directors is presided over by the president of the board of directors, and, in his absence, the vice president of the board of directors. The president and the vice president of our board of directors are elected at a general meeting of shareholders from among the members of our board of directors, serve for one-year terms and are eligible for reelection.
Our board of directors ordinarily meets four times a year and extraordinarily when a meeting is called by the president, the vice president or any two other members of our board of directors. Decisions of our board of directors require a quorum of a majority of the directors and are taken by majority vote, subject to the veto rights of PetroquisaPetrobras and of Petros and PreviPetroquisa over resolutions of our board of directors relating to certain matters under the Petroquisa memorandum of understanding and the Pension Funds memorandum of understanding, respectively.Petrobras Shareholders’ Agreement. See “Item 7. Major Shareholders and Related Party Transactions—Major Shareholders—Shareholders Agreements.”
The following table sets forth certain information with respect to the current members of our board of directors and their alternates:
| Name | Member Since | Position Held | Age | |||
| Pedro Augusto Ribeiro Novis | August 15, 2001 | President of the Board | 61 | |||
| Ruy Lemos Sampaio | July 20, 2006 | Alternate | 58 | |||
| Alvaro Fernandes da Cunha Filho | November 6, 1997 | Vice President of the Board | 59 | |||
| Marcos Luiz Abreu de Lima | March 31, 2005 | Alternate | 68 | |||
| José de Freitas Mascarenhas | August 15, 2001 | Board Member | 66 | |||
| Guilherme Simões de Abreu | March 4, 2002 | Alternate | 56 | |||
| Arão Dias Tisser | March 26, 2008 | Board Member | 32 | |||
| Paulo Pinheiro de Castelo Branco | May 30, 2008 | Alternate | 60 | |||
| Newton Sergio de Souza | August 15, 2001 | Board Member | 55 | |||
| Cláudio Melo Filho | October 3, 2005 | Alternate | 40 | |||
| Alvaro Pereira Novis | August 15, 2001 | Board Member | 64 | |||
| Marcos Wilson Spyer Rezende | September 29, 2002 | Alternate | 60 | |||
| Francisco Teixeira de Sá | May 24, 2001 | Board Member | 59 | |||
| Lúcio José Santos Júnior | August 15, 2001 | Alternate | 42 | |||
| Francisco Pais | May 30, 2008 | Board Member | 52 | |||
| Rogério Gonçalves Mattos | September 29, 2002 | Alternate | 52 | |||
134
Name | Member Since | Position Held | Age | |||
| ||||||
| April 29, 2003 | |||||
| ||||||
| ||||||
| Board Member | |||||
| Alternate | |||||
| Board Member | |||||
| April | Alternate | ||||
| Board Member | |||||
| Alternate | |||||
| ||||||
| ||||||
| ||||||
| ||||||
| ||||||
| ||||||
| ||||||
| ||||||
| ||||||
| ||||||
| ||||||
| ||||||
The following is a summary of the business experience, areas of expertise and principal outside business interests of our current directors and their alternates. Except as otherwise set forth below, the business address of (1) each of our current directors is Avenida das Nações Unidas, 4777, São Paulo, SP – SP—CEP 05477-000, Brazil and (2) each of our alternate directors is the same as the business address of the director for which he or she is an alternate.
Directors
Pedro Augusto Ribeiro Novis.Novis. Mr. Novis was elected to our board of directors as a nominee of Odebrecht. He has been a member of our board of directors since August 2001 and was elected president of our board of directors in March 2002. He has served as a member of the board of directorsofdirectors of Odebrecht since October 1997 and as the chief executive officer of Odebrecht since January 2002. In addition, Mr. Novis serves in various capacities with other companies in the Odebrecht Group. He has been with the Odebrecht Group since 1968. He holds a law degree from the Universidade Federal da Bahia. Mr. Novis is a cousin of Mr. Alvaro Pereira Novis.
Alvaro Fernandes da Cunha Filho.Filho. Mr. Cunha Filho was elected to our board of directors as a nominee of Odebrecht and has been a member of our board of directors since 1997. He is currently the vice president of our board of directors and the president of Valora Participações Ltda. Mr. Cunha Filho served as vice president of the board of directors of Norquisa from 1997 through 1999, and from 2001 through 2003 as a member of the board of directors of Norquisa. He has also occupied several executive positions in subsidiaries and affiliates of Odebrecht. Mr. Cunha Filho holds a bachelor’s degree in civil engineering and a master’s degree in economics from the Universidade Federal da Bahia.
José de Freitas Mascarenhas.Mascarenhas. Mr. Mascarenhas has been a member of our board of directors as a nominee of Odebrecht since 2001. He has been an executive officer of Odebrecht since September 2001 and serves in various capacities with other companies in the Odebrecht Group. He also has served as vice president of CNI—Confederação Nacional das Indústrias since October 1985, andas president of the Brazilian Association of Chemical Industry and Derivative Products since May 1993.1993, and as president of Federação das Indústrias do Estado da Bahia—FIEB from 1992 until 2002. He is also a member of the Board of the MBC—Movimento Brasil Competitivo (Brazilian Competitiveness Council). Mr. Mascarenhas holds a bachelor’s degree in civil engineering from Universidade Federal da Bahia. Mr. Mascarenhas’ business address is Avenida Luiz Viana Filho, 2841, Salvador, BA—CEP 41730-900, Brazil.
Luiz Fernando Cirne Lima.Arão Dias Tisser. Mr. Lima has been aTisser was elected as alternate member of our board of directors on March 26, 2008 as a nominee of OdebrechtPetroquisa, and became a member of our our board of directors on May 30, 2008 after the resignation of Mr. Luis Fernando Cirne Lima. He has been the management coordinator of holdings in petrochemical centers for Petrobras since 2001.2004, and has worked in commercial management of naphtha and industrial raw materials for Petrobras from February 2001 to October 2004. He is currently the superintendent executive officer of Copesul and aan alternate member of the board of directors of Banco Icatu S.A., a Brazilian bank.Triunfo. Mr. Lima has also served as the Brazilian Minister of Agriculture from 1969 through 1973. Mr. LimaTisser holds a bachelor’sbachelors degree in agronomical engineeringCivil Engineering from the Universidade Federal do Rio Grande do Sul.de Janeiro—UFRJ and has a master degree in engineering from COPPE/UFRJ. Mr. Lima’sTisser’s business address is Rua Dolores Alcaraz Caldas, 90, Porto Alegre, RS –Av. República do Chile, 65, Rio de Janeiro, RJ, CEP 90110-180,20031-912, Brazil.
Newton Sergio de Souza.Souza. Mr. Souza has been a member of our board of directors as a nominee of Odebrecht since 2001. He has been the general counsel and an executive officer of Odebrecht since May 1997 and the vice president of the board of directors and an executive officer of Norquisa since April 2003. He also serves in several executive positions in subsidiaries and affiliates of Odebrecht. Mr. Souza served as the president of the board of directors of Companhia de Concessões Rodoviárias—CCR. He was also a visiting lawyer at the law firm Dechert, Price & Rhoads (Philadelphia), a senior lawyer at the law firm Pinheiro Neto Advogados from 1976 through 1982 and a senior counsel of Latin America and Caribbean Division of the World Bank (Washington D.C.) from 1982 through 1987. Mr. Souza holds a law degree from Pontifícia Universidade Católica do Rio de Janeiro and an LL.M. from the University of Pennsylvania.
135
Alvaro Pereira Novis.Novis. Mr. Novis has been a member of our board of directors as a nominee of Odebrecht since 2001. He has been the administrator of the board of directors of Odebrecht since December 2003, the chief financial officer and an executive officer of Odebrecht since July 1998 and a board member of AMCHAM Brasil since 2003. He also serves in various capacities with other companies in the Odebrecht Group. In 1980, he was elected managing director of Banco Iochpe de
Investimentos, where he became president in 1995 upon its association with Bankers Trust Company. Mr. Novis holds a bachelor’s degree in economics from the Universidade do Rio de Janeiro and a master’s degree in Public Administration from Fundação Getúlio Vargas. Mr. Novis is a cousin of Pedro Augusto Ribeiro Novis.
Francisco Teixeira de Sá. Mr. Sá has been a member of our board of directors as a nominee of the Mariani Group since 2001. He has beenserved as a member of the board of directors of Norquisa sincefrom April 2001 through April 2005 and served as president of the board of directors of Norquisa from April 2001 through April 2003. He is also president of Pronor Petroquímica S.A., or Pronor. Mr. Sá served as engineering and production manager of Dow Química S.A. from 1973 through 1984. He holds a bachelor’s degree in chemical engineering from the Universidade Federal da Bahia. Mr. Sá’s business address is Quadra 3 do SESFI, Cia Sul, Simões Filho, BA – BA—CEP 43780-000, Brazil.
Maria Roma de Freitas.Francisco Pais Ms. Freitas. Mr. Pais was elected as a member of our board of directors on May 30, 2008 as a nominee of Petroquisa. From 1981 to 1986 he managed a hydroelectric structure recovery project in the Geotechnical area at Light S.A., and since 1987, he has served in a variety of capcities, including as assistant to the executive services officer, at Petrobras. From 1998 to 2002, he served as member of the fiscal council of the Ricardo Franco Foundation at the Military Engineering Institute, or IME. Currenlty. he is a member of the board of directors of Procurement Negócios Eletrônicos, and since 2006, he has served as chairman of the board of directors of Copenor S.A., both of which are affiliates of Petrobras. Mr. Pais holds a bachelor’s degree in civil engineering from the IME and an MBA degree specializing in economic and corporate law from the Fundação Getúlio Vargas.
Edmundo Jose Correia Aires. Mr. Aires has been an alternate member of our board of directors as a nominee of Petros on June 21, 2005. ShePetroquisa since August 15, 2001. He has been the business developmentpartnership manager of Petroquisa since 2001. Previously, Mr. Aires occupied several executive positions with Petroquisa and Petrobras since 2001 and also served as assistant managing director of new business and finance at Petrobras. Ms. Freitasbeginning in 1980. Mr. Aires holds a bachelor’s degree in chemical engineering from the Universidade Federal de Uberlândia, a post-graduate degree in marketing from Escola Superior de Propaganda e Marketing—ESPM and an MBA in finance from IBMEC,do Rio de Janeiro. Ms. Freitas’s business address is Avenida República do Chile, 65, Rio de Janeiro, RJ – CEP 20031-912, Brasil.
Kuniyuki Terabe.Antonio Britto Filho.Mr. Terabe was elected to our board of directors as a nominee of Petroquisa andBritto Filho has been a member of our board of directors since November 30, 2004.July 2006. He was the chief executive officer of Calçados Azaléia S.A. from 2003 to 2006. He also served as governor of the State of Rio Grande do Sul from 1995 to 1998, Minister of Social Security from 1992 to 1993 and as a congressman of the State of Rio Grande do Sul from 1987 to 1995. Mr. TerabeBritto Filho has been president of Petroquisa since August 2004 and has over 40 years of experience in the petrochemical industry, including in the areas of industrial operations, health, safety and environmental, and research and development. Mr. Terabe holds a bachelor’s degree in mechanical engineering from the Universidade Federal do Paraná. Mr. Terabe’s business address is Av. República do Chile, 65, Rio de Janeiro, RJ – CEP 20031-912, Brazil.
Patrick Horbach Fairon. Mr. Fairon was elected to our board of directors as a nominee of Petroquisa and has been a member of our board of directors since November 30, 2004. Mr. Fairon has been the chief financial officer of Downstream Participações S.A. since October 2000. Mr. Fairon also served as general manager of business development for Petrobras. Mr. Fairon holds a bachelor’s degree in electrical engineeringjournalism from the Universidade Federal do Rio de Janeiro—UFRJGrande do Sul and an MBAa bachelor’s degree in Law from the Universidade CatólicaLuterana do Rio de Janeiro.Brasil. Mr. Fairon’sBritto Filho’s business address is Av. República do Chile, 500, 20 andar, Rio de Janeiro, RJisRua Florida 1970 – Brooklin, São Paulo – SP, CEP 20031-170,04565-907, Brazil.
André Tapajós Cunha.José Mauro Mettrau Carneiro da Cunha. Mr. Cunha has been a member of our board of directors as a nominee of PreviBNDES Participações S.A.—BNDESPAR, or BNDESPAR, since MarchJuly 31, 2004.2007. Mr. Cunha is currently the president of the board of directors of Tele Norte Leste (Telemar) and member of the boards of directors of Lupatech and Log-In. Mr. Cunha served as vice president executive officer of strategic planning of Braskem from 2003 to 2005. Mr. Cunha has been the managerheld a variety of real estate investments of Previ since April 2003, an alternate member of the Board of Directors of Valepar S.A. since April 2003 and a professor of economics of the Centro Universitário Unicarioca since July 2003. Mr. Cunha alsopositions at BNDES, having served as a senior analyst in the managementvice president and investment policy area of Previresponsible for industrial operations, legal department and fiscal subjects from February 1999 through April 2003.1998 to 2002. Mr. Cunha holds a bachelor’s degree in economicsmechanical engineering from the Faculdade de Engenharia da Universidade Gama FilhoCatólica de Petrópolis and a master’s degree in Corporate Economy (Economia Empresarial)Industrial Projects and Transportation from the Universidade Cândido Mendes, an MBA in finance from the COPPE/UFRJ—Universidade Federal do Rio de Janeiro, and a post-graduate degree in economics from Fundação Getúlio Vargas.Janeiro. Mr. Cunha’s business address is Praia do Botafogo, 901,General Garzon, 22/508, Jardim Botânico – Rio de Janeiro, RJ – CEP 22250-040,22470-010, Brazil.
Alternate Directors
Ruy Lemos Sampaio.Sampaio. Mr. Sampaio has been an alternate member of our board of directors as a nominee of Odebrecht since September 27, 2002.July 20, 2006. He has been the investment officer of Odebrecht since August 2002. Previously, Mr. Sampaio occupied several executive positions within the Odebrecht Group beginning in 1985. Mr. Sampaio holds a bachelor’s degree of business administration from the Universidade Federal da Bahia and aan MBA degree from Michigan State University.
136
Marcos Luiz Abreu de Lima.Lima. Mr. Lima has been an alternate member of our board of directors as a nominee of Odebrecht since March 31, 2005. Mr. Lima has been an executive officer of Construtora Norberto Odebrecht
CNO since 1999, chief executive officer of Odebrecht Administradora e Corretora de Seguros Ltda. since 1980 and is a member of the fiscal council of Fundação Odebrecht. Mr. Lima holds bachelor’s degrees in accounting, management and economics from the Universidade Católica de Belo Horizonte and a post-graduate degree in auditing and organization development, in addition to insurance and surety bonds. Mr. Lima’s business address is Av. Luiz Viana Pinto, 2841, 1º andar—1st Floor—Salvador, Bahia, Brazil.
Guilherme Simões de Abreu.Abreu. Mr. Abreu has been an alternate member of our board of directors as a nominee of Odebrecht since March 4, 2002. He has been the assistant to the president of Odebrecht since 2002 and an officer of Odeprev—Odebrecht Previdência since 1998. Previously, Mr. Abreu occupied several executive positions with Odebrecht beginning in 1986. Mr. Abreu holds a bachelor’s degree in business administration from the Universidade Federal da Bahia.
Paulo Pinheiro de Castelo Branco. Mr. Castelo Branco was elected as an alternate member of our board of directors on May 30, 2008 as a nominee of Petroquisa. He is a senior equipment engineer from Petrobras’ supply business area and currently serves as assistant to the executive supply officer at Petrobras. Since 1972, he has served in several executive positions at Petrobras. He holds a bachelor’s degree in mechanical engineering and an MBA degree in marketing from the Federal University of Rio de Janeiro (UFJR), and an MBA in controllership from the University of São Paulo (USP).
Hilberto Mascarenhas Alves da Silva Filho.Cláudio Melo Filho. Mr. SilvaMelo has been an alternate member of our board of directors as a nominee of Odebrecht since April 29, 2003.October 3, 2005. He has been the assistant to the chief financial officernew business, development and representation director of Odebrecht since 1998. Previously,2004. Mr. Silva occupiedMelo served as financial manager and contract manager in several executive positions with the Odebrecht Group beginningprojects in 1978. He is also an officer of the Commercial Association of Bahia(Associação Comercial da Bahia)Brazil and a member of the Financial Committee of the Brazilian Infrastructure and Basic Industry Association(ABDIB—Associação Brasileira de Infra-Estrutura e Indústria de Base).Angola for CNO from 1990 to 2004. Mr. SilvaMelo holds a bachelor’s degree in business administration from the Universidade Federal da Bahia and attended a senior executive program at Columbia Business Schoolde Brasilia and a post-graduate degree in financial planning and management course atadministration from Fundação Getúlio Vargas.
José Augusto Cardoso Mendes. Mr. Mendes has been an alternate member of our board of directors as a nominee of Odebrecht since November 18, 2002. He has been the planning, organization and personnel officer of Odebrecht since November 2002. Previously, Mr. Mendes served in several capacities at McKinsey & Company from 1994 to 2000 and as an officer with Diamond Cluster International Inc. from 2000 to 2002. Mr. Mendes holds a bachelor’s degree in metallurgy engineering from the Escola Politécnica de São Paulo and a master’s degree in metallurgical engineering from the Escola Politécnica de São Paulo.
Marcos Wilson Spyer Rezende.Rezende. Mr. Rezende has been an alternate member of our board of directors as a nominee of Odebrecht since September 29, 2002. He has been the vice president of institutional relations of the Odebrecht Group since 2002. Mr. Rezende served as a journalist in various capacities for newspapers and television stations from 1972 through 2002. Mr. Rezende holds a bachelor’s degree in sociology and politics from the Universidade Federal de Minas Gerais and in social communication from the Faculdade Casper Líbero/PUC São Paulo.
Lucio JoseLúcio José Santos Junior.Júnior. Mr. Santos has been an alternate member of our board of directors as a nominee of the Mariani Group since August 15, 2001. He has been the chief financial officer of Engepack Embalagens S.A., or Engepack, since 2002. He has been superintendent officer of Pronor since 2001 and a member of the board of directors of Pronor since 2002. Mr. Santos served as chief financial officer of Nitrocarbono from 1996 through 2002. Mr. Santos holds a bachelor’s degree in economics from the Pontifícia Universidade Católica do Rio de Janeiro and a post graduate degree in finance from Ibemec—Instituto Brasileiro de Mercado de Capitais.
Fernando de Castro Sá. Mr. Sá has been an alternate member of our board of directors as a nominee of Petros since June 21, 2005 and prior to that served as a director of our company since April 2003. He is currently the legal manager in the supply division of Petrobras and a partner of the law office De Castro Sá e Pagnano Advogados Associados. Mr. Sá has served as a lawyer with the law firm of Teixeira & Advogados Associados. Mr. Sá holds a bachelor’s degree in sociology from the Universidade Federal do Rio de Janeiro and a post-graduate degree in business law from Fundação Getúlio Vargas. Mr. Sá’s business address is Avenida República do Chile, 65, Rio de Janeiro, RJ – CEP 20031-912, Brazil.
Edmundo Jose Correia Aires. Mr. Aires has been an alternate member of our board of directors as a nominee of Petroquisa since August 15, 2001. He has been the partnership manager of Petroquisa since 2001. Previously, Mr. Aires occupied several executive positions with Petroquisa and Petrobras beginning in 1980. Mr. Aires holds a bachelor’s degree in chemical engineering from the Universidade Federal do Rio de Janeiro.
Rogério Gonçalvez Mattos.alves Mattos. Mr. Mattos has been an alternate member of our board of directors as a nominee of Petroquisa since September 29, 2002. Mr. Mattos has occupied several executive positions with Petrobras since 1979. He has been the manager of business development forof Petrobras since 1998 and a member of the fiscal council of the pension fund of Petrobras (Fundação Petrobras de Seguridade Social Petros), or Petros, since 2003. He holds a bachelor’s degree in chemical engineering from the Universidade Federal do Rio de Janeiro and a bachelor’s degree in economics from the Universidade Estadual do Rio de Janeiro. Mr. Mattos also attended a senior executive program at the Harvard Business School.
Márcio Domingues de Andrade. Mr. Andrade was elected as an alternate member of our board of directors on May 30, 2008 as a nominee of Petroquisa. Since 2006, he has served on Petrobras’ management team and from 2001 to 2006 was manager of the planning area and forest fund of Brascan’s Group. From 2000 to 2001, he was an associate at Santander Private Equity F.I.A, and from 1998 to 1999, he served as assistant to the vice-president of controllership at Banco Bozano. He was an associate at Fundo Bozano, Simonsen-Advent from 1996 through 1998 and served as a production manager at Banco Real from 1990 through 1994. Since 2003, he has served as member of the board of directors of Tafisa Brasil S.A., and from 1996 to 1998, he sat on the board of directors of several companies of Fundo Bozano, Simonsen-Advent’s portfolio. Mr. Andrade holds a bachelor’s degree in economics and an MBA from the Federal University of Rio de Janeiro (UFJR).
137
Deusdedite Fagundes de Brito Filho.Rubio Fernal Ferreira e Sousa. Mr. de BritoFerreira e Sousa has been an alternate member of our board of directors as a nominee of PreviOdebrecht since March 4, 2002.April 7, 2006. He ishas been a retired employeebusiness development manager of Banco do Brasil S.A. andOdebrecht since 1989. Mr. Ferreira e Sousa holds a bachelor’s degree of engineering from Universidade Federal de Minas Gerais.
Yukihiro Funamoto. Mr. Funamoto has served asbeen an independent consultant to Bancoalternate member of our board of directors since April 7, 2006. He has been an executive officer of Sojitz do Brasil S.A. since 1999.June 2004. From September 2000 until June 2004, he worked in the energy and chemical project department of the investment group of Nissho Iwai Corporation. Mr. de BritoFunamoto began working for Nissho Iwai Corporation in April 1997. Mr. Funamoto holds a bachelor’s degree in business administrationof social sciences from the Universidade Católica de Salvador and MBA degrees from the Pontifícia Universidade Católica do Rio de Janeiro and the Fundação Getúlio Vargas do Rio de Janeiro.Rikkyo University, Tokyo.
Board of Executive Officers of Braskem
Our board of executive officers is our executive management body. Our executive officers are our legal representatives and are responsible for our internal organization and day-to-day operations and the implementation of the general policies and guidelines established from time to time by our board of directors.
Our by-laws require that the board of executive officers consist of a chief executive officer and between three and nine additional members, each responsible for business areas that our board of directors assigns to them. The members of our board of executive officers, other than our chief executive officer, have no formal titles (other than the title of executive officer or ““director”Diretor”)but have the informal titles set forth in the table below.
The members of our board of executive officers are elected by our board of directors for two-year terms, corresponding to the terms of the members of our board of directors, and are eligible for reelection. The current term of all of our executive officers ends at our annual shareholdersshareholders’ meeting in 2006.2010. Our board of directors may remove any executive officer from office at any time with or without cause. According to the Brazilian Corporation Law, executive officers must be residents of Brazil but need not be shareholders of our company. Our board of executive officers holds meetings when called by our chief executive officer.
The following table lists the current members of our board of executive officers:
| Year of | ||||||
| Name | Appointment | Position Held | Age | |||
| José Carlos Grubisich Filho | 2002 | Chief Executive Officer | 51 | |||
| Carlos José Fadigas de Souza Filho | 2007 | Vice President Executive Officer, | 38 | |||
| Chief Financial Officer and | ||||||
| Director of Investor Relations | ||||||
| Luiz de Mendonça | 2002 | Vice President Executive Officer | 45 | |||
| Mauricio Roberto de Carvalho Ferro | 2002 | Vice President Executive Officer | 42 | |||
| and General Counsel | ||||||
| Roberto Prisco Paraíso Ramos | 2002 | Vice President Executive Officer | 61 | |||
| Luis Fernando Sartini Felli | 2006 | Vice President Executive Officer | 42 | |||
Name | Year of Appointment | Position Held | Age | |||
José Carlos Grubisich Filho | 2002 | Chief Executive Officer | 48 | |||
Paul Elie Altit | 2002 | Vice President Executive Officer, Chief Financial Officer and Director of Investor Relations | 47 | |||
Bernardo Afonso de Almeida Gradin | 2002 | Vice President Executive Officer | 39 | |||
Luiz de Mendonça | 2002 | Vice President Executive Officer | 42 | |||
Mauricio Roberto de Carvalho Ferro | 2002 | Vice President Executive Officer and General Counsel | 39 | |||
Roberto Prisco Paraíso Ramos | 2002 | Vice President Executive Officer | 58 | |||
Roberto Lopes Pontes Simões | 2004 | Vice President Executive Officer | 48 | |||
Summarized below is information regarding the business experience, areas of expertise and principal outside business interests of our current executive officers. The business address of each of our current executive officers is Avenida das Nações Unidas, 4777, São Paulo, SP – SP—CEP 05477-000, Brazil.
José Carlos Grubisich Filho.Mr. Grubisich is currently our chief executive officer. He is also currently the president of the board of directors of Copesul. He was the chief executive officer of OPP Química and the
president of the board of directors of OPP Química. From 2000 to 2001, Mr. Grubisich served as vice president of Rhodia Fine Organics worldwide and was a member of the executive committee of the Rhône Poulenc Group. Prior to 2000, he served as vice president of Rhodia S.A. (currently known as Rhodia Brasil Ltda., a member of the Rhône Poulenc Group) for Brazil and Latin America. Mr. Grubisich holds a bachelor’s degree in chemical engineering from Escola Superior de Química Oswaldo Cruz and completed an Advanced Management Program at INSEAD—France.
138
Paul Elie Altit.Carlos José Fadigas de Souza Filho.Mr. AltitFadigas is currently one of our vice president executive officers, our chief financial officer and director of investor relations. He is also a member of the board of directors of Copesul, Ipiranga Química and Ipiranga Petroquímica. He was also a member of the board of directors of Politeno prior to its merger into Braskem and a member of the board of directors of Polialden and the investor relations officer of Polialden.Companhia Petroquímica Paulista—CPP prior to its merger into Paulínia. Prior to joining our company, Mr. Altit has also served in several executive positions at Construtora Norberto Odebrecht S.A., most recently asFadigas was the chief financial officer of CNO since 2002. Mr. Fadigas held a variety of positions at OPP and investor relations officer of Construtora Norberto Odebrecht S.A.Trikem from 1993 through 2002. He also served as assistant vice presidentto 2002, and held a variety of Odebrecht S.A.positions at Citibank from 19891990 to 1992. Mr. AltitFadigas holds a bachelor’s degree in engineeringbusiness administration from the Universidade Federal do Rio de Janeiro and a post-graduate degree in finance from the Pontifícia Universidade Católica do Rio de Janeiro.
Bernardo Afonso de Almeida Gradin. Mr. Gradin is currently one of our vice president executive officers and head of our Basic Petrochemicals Unit. He is also a member of the board of directors of Cetrel. Mr. Gradin was a member of the board of directors of OPP Química and Trikem and an executive officer of Trikem. Mr. Gradin holds a bachelor’s degree in civil engineering from the Universidade Federal da Bahia, a master’s degree in international politics from the University of PennsylvaniaSalvador—UNIFACS and an MBA degree from The Wharton School of Business.the Institute for Management Development in Switzerland.
Luiz de Mendonça.Mr. Mendonça is currently one of our vice president executive officers and head of our Polyolefins Unit. He is also a member of the board of directors of Copesul, Ipiranga Química and Paulínia. He was also a member of the board of directors of Politeno prior to its merger into Braskem and a member of the board of directors of Companhia Petroquímica Paulista—CPP prior to its merger into Paulínia. Mr. Mendonça was an executive officer (Superintendent) of Polialden, and a member of the board of directors of Polialden and an alternate member of the board of directors of Politeno.until our merger with Polialden on May 31, 2006. Mr. Mendonça also worked for 15 years at Rhodia S.A., where he served as general manager of production, supply, and finance and marketing, as an officer in the chemical division (Latin America) and as vice president of Rhodia U.S.A. Mr. Mendonça holds a bachelor’s degree in production engineering from Escola Politécnica da Universidade de São Paulo and an MBA degree from INSEAD—France.
Mauricio Roberto de Carvalho Ferro.Mr. Ferro is currently our vice president executive officer and general counsel and a member of the board of directors of Ipiranga Petroquímica and Copesul. He was also the vice president of the board of directors of Politeno prior to our merger with Politeno, an alternate member of the board of directors of Petroflex until the sale of our interest in Petroflex in April 2008, and a member of the board of directors of Polialden and an alternate member of the board of directors of Petroflex.until our merger with Polialden. He served as a lawyer at the law firm of Carlos Eduardo Paladini Cardoso in 1989 and as a lawyer at the law firm of Bulhões Pedreira, Bulhões Carvalho e Advogados Associados from 1991 until 1995. Mr. Ferro holds a law degree from the Pontifícia Universidade Católica do Rio de Janeiro and an LL. M. degree from the University of London and from the London School of Economics.
Roberto Prisco Paraíso Ramos.Mr. Ramos is currently one of our vice president executive officers and head of our Business Development Unit.business competitiveness. He is also a member of the board of directors of Cetrel and Companhia Alagoas Industrial-Cinal, and the vice presidentPaulínia. He was a member of the board of directors of Petroflex.Politeno prior to our merger with Politeno and a member of the board of directors of Petroflex until the sale of our interest in Petroflex in April 2008. Mr. Ramos was a member of the board of directors of Trikem and served on the board of directors of several companies in the Odebrecht Group. Mr. Ramos holds a bachelor’s degree in mechanical engineering from the Universidade Federal do Rio de Janeiro, a post-graduate degree in the Program for Management Development from Harvard Business School and a master’s degree in finance from the University of Leicester, England.
Roberto Lopes Pontes Simões.Luis Fernando Sartini Felli.Mr. SimõesFelli is currently one of our vice president executive officers and head of ourthe Vinyls Unit.Unit and a member of the board of directors of Cetrel. He was an alternate member of the presidentboard of IG—Internet Groupdirectors of Petroflex until the sale of our interest in Petroflex. In April 2008 he served as commercial director of the Polyolefins Unit from 2002 to 2004, where he had served as the chief operational officer since 2000. He also was the president of Opportrans Concessão Metroviária—Metrô Rio from 1999 to 2000 and an executive officer of Odebrecht Engenharia e Construções from 1994 to 1999.2006. Mr. SimõesFelli holds a bachelor’sgraduate degree in mechanicalagronomy engineering from the Universidade Federal da Bahiade São Paulo – ESALQ and an MBA from Columbia University in maintenance engineering from CEMANT (a program developed by the Universidade Federal da Bahia and Petrobras/Petroquisa).
Fiscal Council
The Brazilian Corporation Law requires us to establish a permanent or non-permanent fiscal council(conselho fiscal).Our by-laws provide for a permanent fiscal council composed of five members and their respective alternate members. The fiscal council is a separate corporate body independent of our management and our external independent registered public accounting firm. Our fiscal council meets at least four times per year and is responsible for reviewingaccountants. The primary responsibility of the accuracy and integrity of quarterly and annual financial statements in accordance with accounting, internal control and auditing requirements. Our fiscal council also (1) makes recommendations to our board of directors regarding the appointment, retention and oversight of our independent auditors, which report directly to our fiscal council, and (2) intermediates disagreements between our management and our independent auditors regarding financial reporting. Our fiscal council is implementing procedures for receiving, retainingto review our management’s activities and addressing complaints regarding accounting, internal controlour financial statements and auditing matters, including the submissionto report their findings to our shareholders.
139
The members of our fiscal council are elected by our shareholders at the annual general shareholders’ meeting for one-year terms and are eligible for reelection. The terms of the members of our fiscal council expire at the next annual general shareholders’ meeting. Under the Brazilian Corporation Law, the fiscal council may not contain members who are members of our board of directors or our board of executive officers or are employees or spouses or relatives of any member ofmemberof our management. To be eligible to serve on our fiscal council, a person must be a resident of Brazil and either be a university graduate or have been a company officer or fiscal council member of another Brazilian company for at least three years prior to election to our fiscal council. At least one member of our fiscal council must be a financial expert with experience in finance and knowledge of Brazilian GAAP.
Holders of preferred shares without voting rights and non-controlling common shareholders that together hold at least 10.0% of our voting share capital are each entitled to elect one member and his or her respective alternate to the fiscal council.
The following table lists the current members of our fiscal council and their alternates:
| First Year
| |
| of | ||
| Name | Appointment | |
| Ismael Campos de Abreu | 2003 | |
| ||
Manoel Mota Fonseca | 2002 | |
Maria | 2002 | |
| ||
| ||
| ||
| ||
Marcos Antonio Silva Menezes | 2005 | |
Sergio José de Barros (alternate) | 2005 |
The following is a summary of the business experience, areas of expertise and principal outside business interests of the current members of our fiscal council and their alternates.
Members of Fiscal Council
Ismael Campos de Abreu.Mr. Abreu has been a member of our fiscal council as a nominee of Norquisa and OdebrechtODBPAR Investments since 2003.2003 and has served as president of our fiscal council since 2006. Mr. Abreu has been the controller of Odebrecht since 1995, and previously served as
manager of the tax consulting division of PricewaterhouseCoopers Auditores Independentes from 1978 to 1985, controller of Corrêa Ribeiro S.A. Comércio e Indústria from 1986 to 1988, manager of the consulting area of Arthur Andersen from 1989 to 1991, and a partner of Performance Auditoria e Consultoria from 1992 to 1995. He is currentlywas a member of the fiscal council of Petroflex until the sale of our interest in Petroflex in April 2008 and was a member of the fiscal council of Polialden and Petroflex.until our merger with Polialden. Mr. Abreu holds a bachelor’s degree in accounting from Fundação Visconde de Cairú, and a post-graduate degree in economic engineering from Centro Interamericano de Desenvolvimento. Mr. Abreu’s business address is Av. Luis Viana Filho, 2841, Salvador, BA – BA—CEP 41730-900, Brazil.
Manoel Mota Fonseca.Mr. Fonseca has been a member of our fiscal council as a nominee of Norquisa and OdebrechtODBPAR Investments since 2002 and has served as president of our fiscal council since 2003.in 2003 and 2004. Mr. Fonseca has been a partner of the law firm Mota Fonseca e Advogados since 1990 and previously served as legal and tax counsel of Coopers & Lybrand, KPMG and PricewaterhouseCoopers Auditores Independentes. Mr. Fonseca holds a law degree from the Universidade de São Paulo, and a post-graduate degree in tax law from Fundação Getúlio Vargas. Mr. Fonseca’s business address is Rua Frederico Simões, 85—Edifício Empresarial Simonsen, Sala 304 – 3° andar,304—3rd Floor, Salvador, BA – BA—CEP 41820-020, Brazil.
Walter Murilo Melo de Andrade.Jorge José Nahas Neto. Mr. AndradeNeto was elected as a member of our fiscal council on May 30, 2008 as a nominee of Petroquisa. Mr. Neto currently serves as executive manager of financial planning and risk management at Petrobras, and since 1993, he has served as financial manager at companies in the Petrobras Group. Previously, he served as control planning manager at Montreal Engenharia S.A. from 1987 to 1993, as treasury assistant at Thomas De La Rue from 1985 to 1987, as consultant at Instituto do Açúcar e Álcool (IAA) from 1982 to 1984 and as administrative supervisor at Companhia Industrial Farmacêutica (COTY) from 1981 to 1982. Mr. Neto holds a bachelor’s degree in economic sciences and a graduate degree in economic engineering from Candido Mendes University (UCAM).
140
Jayme Gomes da Fonseca Junior.Mr. Fonseca has been a member of our fiscal council since 2008 as a nominee of Norquisa and Odebrecht since 2002. Mr. Andrade has been a legal counsel of Engepack Embalagens S.A. since 2002. Previously, heODBPAR, and served as legal counsel of Nitrocarbono, Pronor and Proppet from 1998 to 2002. Mr. Andrade holds a law degree from the Universidade Católica de Salvador, with a specialization in civil law from Fundação Faculdade de Direito da Bahia and in corporate law from Escola de Magistratura do Estado do Rio de Janeiro. Mr. Andrade’s business address is Quadra 03 do Sesfi, Cia. Sul, Simões Filho, BA – CEP 42780-000, Brazil.
Tarcísco Luiz Silva Fontenele. Mr. Fontenele has been an alternate member of our fiscal council in 2007. Mr. Fonseca is currently an executive officer of Ipiranga Química and Ipiranga Petroquímica. He was our controller from 2004 to 2007 and previously served as a nomineefiscal manager of NorquisaOPP Química from 1999 to 2004, fiscal manager of Odebrecht S.A. from 1996 to 1999, fiscal manager of CNO from 1993 to 1996, supervisor of Performance Auditoria e Consultoria S/C from 1991 to 1993 and Odebrecht since 2005.an assistant of Arthur Andersen S/C from 1989 to 1991. Mr. Fontenele has been general counsel of Fundação Sistel de Seguridade Social since 1986, a member of the fiscal council of Santos Brasil S.A. since 2000 and coordinator of the Center-North Regional Law Commission (Comissão Regional Jurídica Centro-Norte) and of the Brazilian Social Security Association for Privately-Held Companies (ABRAPP—Associação Brasileira das Entidades Fechadas de Previdência Privada) since 1997. Mr. FonteneleFonseca holds a bachelor’s degree in lawbusiness administration from the AssociaçãoUNIFACS—Universidade de Ensino UnificadoSalvador, an IAG Master in finances from PUC—Pontifícia Universidade Católica do Distrito Federal, withRio de Janeiro, and a specializationMSc in civil procedureAccounting and Finance from ICAT-DF.UMIST—University of Manchester Institute of Science. Mr. Fontenele’sFonseca’s business address is SHIN, QL 14, Conjunto 01, Casa 11, Lago Norte—Brasília, Distrito Federal,Av. das Nações Unidas, 4777, 6th Floor, São Paulo, SP, CEP 05477-000, Brazil.
Marcos Antonio Silva Menezes. Mr. Menezes was elected a member of our fiscal council in 2005, as a nominee of Petros, Previ and Petroquisa. Mr. Menezes has been the executive accounting managerdirector of Petrobras International Finance Company—PIFCo since 2003 and chief accountant officer of Petrobras since 19981998. He joined Petrobras in 1976 and has also beenserved as Deputy Superintendent of the former Financial Services—SEFIN from 1995 through 1998. He served as a member of the fiscal council of: Petrosof Companhia de Gás de Minas Gerais—GASMIG, of Companhia de Gás da Bahia—BAHIAGAS and as chairman of the fiscal council of Petros. Mr. Menezes has been chairman of the fiscal council of Instituto Brasileiro de Petróleo e Gás since 1995;1998, and a member of the Brazilian Organizationfiscal council of Oil Industry (ONIP—Organização Nacional das Indústras de Petróleo)leo—ONIP since 1999; the Brazilian Institute of Oil and Gas (IBP—Instituto Brasileiro de Petróleo e Gás ) since 1998; and the Gas Company of Bahia (BAHIAGÁS—Companhia de Gás da Bahia) since 2003.1999. He hasis also served as a director of the American Chamber of Commerce (AMCHAM—Câmara Americana de Comércio)Commerce—AMCHAM/RJ since March 20052004 and a partnermember of the Brazilian Institute of Finance Executives (IBEF—Instituto Brasileiro deAssociação Nacional dos Executivos de Finanças,) since 2003. Administração e Contabilidade – ANEFAC and Associação Brasileira das Companhias Abertas— ABRASCA and its Auditing and Accounting Rules Commission—CANC. Mr. Menezes holds a bachelor’ s degreebachelor’s degrees in accounting and in business management fromFaculdade Moraes Júnior in Rio de Janeiro, and a post-graduate degree in financial administrationmanagement from FGV/RJ.Fundação Getúlio Vargas, and completed an advanced management program—PGA at Fundação Dom Cabral/INSEAD— França. Mr. Menezes’ business address is Av. República do Chile, 65, Rio de Janeiro, RJ, Brazil.
Alternate Members of Fiscal Council
Anna Cecília M.C. Dutra da Silva.José Renato Andrade Mendonça. Ms. Silva has been an alternate member of our fiscal council as Mr. Mendonça nominee of Norquisa and Odebrecht since 2003. Ms. Silva has been an associate at the law firm of Barbosa, Müssnich & Aragão Advogados since 2001 and anwas elected as alternate member of the fiscal council in 2008 as a nominee of PronorOdebrecht. Mr. Mendonça has been the managing partner of Performance Auditoria e Consultoria Empresarial S/S since 20021992, and worked for 17 years at Arthur Andersen S/C. Mr. Mendonça is the Director of Polialdenthe American Chamber of Commerce Brazil and Cimento Tupi S.A. since 2003. SheDirector of the Bahia Section of IBRACON. Mr. Mendonça holds a lawbachelor’s degree in business management from the Pontifícia Universidade Católica do RioFederal da Bahia, in accounting sciences from Fundação Visconde de Janeiro. Mr. Silva’sCairú and has a specialization degree in Controllership from UNIFACS—Salvador. His business address is Av. Pres. Juscelino Kubitschek, 50 – 4th Floor, São Paulo, SP –Tancredo Neves, 1632, salas 1301 to 1309, Salvador, Bahia, CEP 04543-000,41520-020, Brazil.
Maria Cláudia Freitas Sampaio. Ms.Mrs. Sampaio has been an alternate member of our fiscal council as a nominee of Norquisa and Odebrecht since 2002. Mrs. Sampaio has been a lawyer at the law firm Mota Fonseca e Advogados since 2001 and2001. Mrs. Sampaio served as a member of the fiscal council of Norquisa since 1991.from 2003 to 2005. Previously, she served as an auditor of PricewaterhouseCoopers Auditores Independentes from 19861990 to 1991. Ms.1993 and she served as fiscal manager in Performance Consultoria Tributária e Empresarial Ltda. from 1994 to 1998. Mrs. Sampaio holds a law degree and a bachelor’s degree in business administration from the Universidade Católica de Salvador. Ms.Mrs. Sampaio’s business address is Rua Frederico Simões, 85 -Edifício Empresarial, Simonsen Sala 304 – 30 andar,304—30th Floor, Salvador, BA – BA—CEP 41820-020, Brazil.
Marcílio José Ribeiro Júnior.Mr. Júnior was elected as an alternate member of our fiscal council on May 30, 2008 as a nominee of Petroquisa. Since 2006, he has worked in Petrobras’ financial management on the executive team of the financial analysis area of FINCORP. Previously, he served as as accountant at Terminal Garagem Menezes Côrtes S.A. from 1998 through 2001, as accounting manager at ALTM S.A. Tecnologia e Serviços de Manutenção from 2001 to 2002, as accountant at Gás e Participações Ltda. (GASPART) from 2002 to 2004, as accounting manager at Starfish Oil and Gas S.A. from 2004 to 2005 and as controller at Queiroz, Galvão, Óleo e Gás S.A. from 2005 to 2006.
141
Marcelo André Lajchter.Sergio Garrido de Barros.Mr. Lajchter has beenBarros was elected an alternate member of our fiscal council as a nominee of Norquisa and Odebrecht since 2002.ODBPAR in 2007. Mr. LajchterBarros has been a partneran accounting and fiscal manager of the law firm Barbosa, Müssnich & Aragão AdvogadosCNO since 2000 and a professor at Fundação Getúlio Vargas since 2003.2005. Previously, he served as a lawyer in the tax litigation areasenior auditor manager of PricewaterhouseCoopers Auditores Independentes from 1993 to 1995.2004. Mr. Lajchter holds a law degree from the Universidade do Estado do Rio de Janeiro. Mr. Lajchter’s business address is Av. Pres. Juscelino Kubitschek, 50 – 4th Floor, 04543-000, São Paulo, SP – CEP 04543-000, Brazil.
João Bosco de Oliveira Santos. Mr. Santos has been an alternate member of our fiscal council as a nominee of Norquisa and Odebrecht since 2005. Mr. Santos has been the budget and costs manager of Fundação Sistel de Seguridade Social since 2002 and previously served as a member of the fiscal council of (1) Embraer S.A. in 1997, (2) Tele Sudeste Celular from 1998 until 2000 and (3) Eluma S.A. Indústria e Comércio in 2003. Mr. SantosBarros holds a bachelor’s degree in accounting from the AssociaçãoUniversidade Católica de Ensino Unificado do Distrito Federal and a post-graduate degree in financial management from ICAT-DF.Salvador. Mr. Santos’sBarros’s business address is SEPS/EQ. 702/902, Conjunto B, Bloco A, Brasília, Distrito Federal,Av. das Nações Unidas, 4777, 6th Floor, São Paulo, SP—CEP 05477-000, Brazil.
Sergio José de Barros. Mr. Barros has been an alternate member of our fiscal council as a nominee of Petros, Previ and Petroquisa since 2005. Mr. Barros has been the accounting manager of international businesses of Petrobras since 2005, and served as the financial businesses manager of Petrobrás sincePetrobras from 2002 wherethrough 2005. Prior to 2002, he also served in various capacities in the finance and accounting areas of Petrobras since 1993. He has been a member of the fiscal council of Petrobras Gás S.A.—GASPETRO. He also served as member of the Fiscal Council of Companhia de Gás do Ceará—CEGÁS in 2003 and 2004, Gás de Alagoas—ALGÁS in 2005, and Sergipe Gás—SERGÁS in 2005. He also served as a supervisor at KPMG—Peat Marwick—Auditores Independentes and at Boucinhas, Campos e Claro Auditores Independentes. Mr. Barros holds bachelor’s degrees in accounting and law, a post- graduatepost-graduate degree in business management from the Universidade Federal do Rio de Janeiro (UFRJ), and an MBA from IBMEC. Mr. Barros’s business address is Av. República do Chile, 65, Rio de Janeiro.Janeiro, RJ, Brazil.
Compensation
Compensation
Our personnel and organization committee (Comitê de Pessoas e Organizações), which is a subcommittee of our board of directors, analyzes proposals regarding aggregate compensation paid to (1) our board of directors, (2) our board of executive officers and (3) our fiscal council, and makes recommendations to our board of directors with respect to the aggregate amount of such compensation. According to our by-laws, our shareholders are responsible for establishing the aggregate compensation we pay to the members of our board of directors, our board of executive officers and our fiscal council. Our shareholders determine this aggregate compensation at the general shareholders’ meeting each year based onyear. Once the recommendation of our board of directors. Once aggregate compensation is established, the members of the board of directors are responsible for distributing such aggregate compensation individually to the members of our board of directors and our board of executive officers and our fiscal council in compliance with our bylaws.
Compensation Committee
The Compensation Committee is composed of three members of our board of directors: Mr. Newton Sergio de Souza, Mr. Guilherme Simões de Abreu, and Mr. Lucio José Santos Junior. The compensation committee assists the board in reviewing and approving the compensation structure, including all forms of compensation, relating to members of our board of directors and our board of executive officers. Our chief executive officer may not be present at any committee meeting during which his compensation is deliberated. The compensation committee is responsible for, among other things:
Compensation and Benefits
The aggregate compensation paid by us to all members of our board of directors, board of executive officers and our fiscal council for services in all capacities was R$11.016.8 million in 2004.2007. On March 31, 2005,26, 2008, our shareholders (acting in the annual general meeting) established the following compensation for the year 2005:2008:
.
We compensate our alternate directors for each meeting of our board of directors that they attend. We compensate alternate members of our fiscal council for each meeting of our fiscal council that they attend.
Our executive officers receive the same benefits generally provided to our employees, such as medical (including dental) assistance, private pension plan and meal vouchers. Like our employees, our executive officers also receive a yearly bonus equal to one-month’s salary (known as(knownas the “thirteenth” (monthly) salary in Brazil), an additional one-third of one-month’s salary for vacation, and contributions of 8.0% of their salary into a defined contribution pension fund known as the Guarantee Fund for Time of Service(Fundo de Garantia por Tempo de Serviço).Members of our board of directors and fiscal council are not entitled to these benefits. We made contributions into the Guarantee Fund for Time of Service for our executive officers in an aggregate amount of R$0.4 million during the year ended December 31, 2004.2007.
Members of our board of directors, board of executive officers and fiscal council are not parties to contracts providing for benefits upon the termination of employment other than, in the case of executive officers, the benefits described above.
142
Long-Term Incentive Plan
On September 26, 2005, we adopted a long-term incentive plan. Under the terms of this plan, we may issue investment units, each of which has an economic value equivalent to the economic value of one class A preferred share of our company, to our executive officers, senior management and other employees involved in our strategic programs, which the plan refers to as our business partners. These investment units do not carry any voting rights and may not be transferred. Each year, our Chief Executive Officer will submit an annual program to our board of directors stating:
Upon the purchase by a business partner of his allocation of investment units, the business partner will receive additional investment units as an incentive for the purchase of the purchased investment units. We refer to the purchased investment units as alpha units and the additional investment units as beta units. Each beta unit will automatically convert into an alpha unit 10 years after the date of issue of the beta unit. Upon the payment by our company of dividends or interest attributable to shareholders’ equity to holders of our class A preferred shares, we will issue additional units, which we refer to as gamma units, with an aggregate value equivalent to the value of the dividends or interest attributable to shareholders’ equity attributed and paid to the holders of a class A preferred share.
Each year we will determine the unit value of the investment units applicable from April 1 of that year until March 31 of the following year calculated as the average closing price inreaisof our class A preferred shares on the São Paulo Stock Exchange from October 1 of the preceding year through March 31 of the year in which the unit price is established. Following the fifth anniversary of the date on which any business partner first acquires investment units, we will redeem up to 20% of the investment units held by that business partner at the then-established unit price upon the request of that business partner made within 120 days following the delivery of an annual statement from us with respect to the investment units held by that business partner. After the first redemption, we will redeem up to 10% per year of the investment unitsheld by that business partner at the then-established unit price upon the request of that business partner made in subsequent years. We will redeem any gamma unit at the then-established unit price upon the request of the holder made within 60 days following the issuance of that gamma unit. Any gamma unit not so redeemed will automatically convert into an alpha unit.
In the event that a business partner is dismissed without just cause or retires, we will redeem all of the investment units held by that business partner at the then-established unit price upon the request of that business partner. In the event that a business partner is dismissed for just cause or resigns, all of the beta units held by that business partner will be immediately extinguished, and we will redeem all of the alpha units held by that business partner at the then-established unit price upon the request of that business partner. Upon the death of a business partner, we will automatically redeem all of the investment units held by that business partner (for the benefit of the business partner’s estate) at the then-established unit price.
Our board of directors adopted an annual program for the 2006 fiscal year. Under this annual plan, certain executive officers were entitled to purchase up to an aggregate of 135,500 investment units and to receive up to an additional 135,500 investment units. Our board of directors adopted an annual program for the 2007 fiscal year. Under this annual plan, certain executive officers were entitled to purchase up to an aggregate of 430,180 investment units and to receive up to an additional 430,180 investment units. Our board of directors also adopted an annual program for the 2008 fiscal year. Under this annual plan, certain executive officers are entitled to purchase up to an aggregate of 360,384 investment units and to receive up to an additional 360,384 investment units.
143
Corporate Governance Practices
The significant differences between our corporate governance practices and the New York Stock Exchange standards can be found on our website,www.braskem.com.br. The information found at this website is not incorporated by reference into this annual report.
Employees
Employees
The following table sets forth the number of our employees by main category of activity and location.
| At December 31, | ||||||
Main Category of Activity | 2004(1) | 2003(2) | 2002(3) | |||
Coordinators and operators | 1,563 | 1,494 | 1,474 | |||
Engineers and other professionals | 521 | 491 | 440 | |||
Administrative and support | 272 | 273 | 332 | |||
Technicians | 226 | 223 | 211 | |||
Maintenance | 224 | 206 | 212 | |||
Managers and directors | 190 | 181 | 149 | |||
Total | 2,996 | 2,868 | 2,818 | |||
| At December 31, | ||||||
| Main Category of Activity | 2007(1) | 2006(2) | 2005(3) | |||
| Coordinators and operators | 1,970 | 1,653 | 1,589 | |||
| Engineers and other professionals | 947 | 768 | 695 | |||
| Administrative and support | 488 | 281 | 254 | |||
| Technicians | 610 | 289 | 283 | |||
| Maintenance | 556 | 284 | 243 | |||
| Managers and directors | 212 | 219 | 198 | |||
| Total | 4,783 | 3,494 | 3,262 | |||
| (1) | At December 31, |
| (2) | At December 31, |
| (3) | At December 31, |
We do not employ a material number of temporary employees.
In Brazil, both employees and employers have the right to organize unions. Employees belonging to a specific “professional category” and employers constituting a specific “economic category” may each be represented by a single union in a particular geographic area. Individual unions generallyunionsgenerally belong to state-wide union federations, which in turn belong to nationwide union confederations. We are a member of the Petrochemicals and Synthetic Resins Industries Union of the States of Bahia, Alagoas and Rio Grande do Sul, and our employees belong to the Petrochemicals Industries Workers’ Unions in each of these states.
Approximately 34.5%1,492 of our non-management employees were union members at December 31, 2004.2007. We believe that we have good ongoing relations with our employees and their unions. We have not experienced a strike since OPP Química was privatized in 1992 and Trikem was privatized in 1995. Copesul has not experienced a strike since 1991. The current collective bargaining agreements with our unions have one-year to two year terms and are subject to annual renegotiation. We have traditionally applied the terms of bargaining agreements entered into with the unions equally to unionized and non-unionized employees.
Since coming under the control of the Odebrecht Group, we have adopted and applied the personnel management philosophy of the Odebrecht Group, which emphasizes a performance-relatedperformance related pay structure and a decentralized management structure. Employees in each of our business units participate in setting and achieving their business unit’s annual objectives. As a result, employees in those business units that meet or exceed their goals share in our financial performance through performance-based employee compensation plans. During 2004,2007, we recorded an expense of R$43.4116.1 million related to this program with respect to 2,820 employees. We paid an additional R$3.3 million to3,274 employees, including our executive officers under this program during 2004.officers. The members of our board of directors do not participate in this program.
144
We seek to recruit top graduates from Brazilian technical schools and universities to work at each of our plants and offer career development training to employees to develop skills necessary to operate an internationally competitive, vertically integrated petrochemical company. We have invested in a series of training courses for our operating, laboratory and maintenance personnel through agreements with technical training organizations. During 2004,2007, our total investment in education and training amounted to R$6.014.6 million for 250,000approximately 397,700 hours of training, representing an average of 8383.1 hours per employee.
We tailor career development programs to each employee’s individual needs and abilities. We established this program with our own resources and technology, and it has become a Brazilian benchmark in human resources practices. In 2004, 52.0%2007, 42.8% of our employees received salary increases as a result of their participation in our career development programs.
Our employees and their dependents receive medical and dental assistance through a network of accredited doctors. We pay most of the costs for these services, with a small portion being paid by our employees. A small monthly fee is also charged to our employees to pay for more costly medical services. In 2004,2007, we spent R$17.424.6 million on this assistance.
The majority of our employees participate in the Odebrecht Pension Plan(ODEPREV—Odebrecht Previdência). We pay part of the monthly payments made by our employees to threethe Odebrecht Pension Plan. This pension fund is a defined contribution plan that pays supplementary pension and retirement amounts in amount to those paid by the Brazilian government’s pension system and is intended to provide its members with income on retirement. In 2007, we paid R$5.9 million into this fund.
Copesul makes contributions to Petros under retirement and defined benefit pension plans that was closed to new participants on January 1, 1995. In 2006, the rate of the contribution was 12.93% of the total pay of employees who participate in the plan. In 2007, Copesul made contributions of R$5.7 million to these plans.
In May 2003, Copesul approved and implemented a supplementary private pension funds: Odebrechtplan named COPESULPREV. COPESULPREV is a closed defined-contribution plan intended to cover those employees not included in the Petros plan. COPESULPREV is independently managed by Petros, with no links to any other pension plan managed by Petros, pursuant to the provisions of Complementary Law 109/2001. In 2007, Copesul made contributions of R$1.4 million to COPESULPREV.
Ipiranga Petroquímica and Ipiranga Química sponsors Fundação Francisco Martins Bastos (FFMB) Pension Plan,(ODEPREV—Odebrecht Previdência); a defined benefit closed supplementary private pension entity, designed to manage and execute pension benefit plans for the benefit of the employees of Ipiranga Petroquímica and Ipiranga Química. In 2007, Ipiranga Petroquímica and Ipiranga Química made contributions of R$2.3 million to this fund.
Prior to July 2005, we paid part of the monthly payments made by our employees to two additional private pension funds: Petros and Previnor Pension Plan(PREVINOR—Associação de Previdência Privada). The majority of our employees participate in these pension funds. These pension funds pay supplementary pensionPetros plan was a defined benefit plan and retirement amounts similar in amount to those paid by the Brazilian government’s pension system and arePrevinor Pension Plan was a defined contribution plan. In June 2005, we announced that we intended to provide their members with income on retirement. In 2004, we paid R$11.9 million into these funds. The Odebrechtwithdraw as a sponsor of the Previnor Pension Plan and the Previnor Pension Plan are defined contribution plans. The Petros plan is a defined benefit plan.effective June 30, 2005. The present value of our obligations under the Petros plan exceeded the value of the assets of that fund by R$64.619.6 million at December 31, 2004.2007. See note 2628 to our consolidated and combined financial statements. The calculation of mathematical reserves of participants in the Petros plan was completed in November 2006 and submitted in that month to the Secretariat for Complementary Pensions, a Social Security Ministry department in charge of regulating and inspecting private pension plans. The reserve computations with respect to the Previnor Pension Plan have been completed and the entity has a surplus; as a result, no contributions by our company are required. The sponsorship withdrawal was approved by the Secretariat for Complementary Pensions and the commitments to the plan participants was settled in 2007.
Prior to January 2007, Politeno was the sponsor of a defined contribution plan managed by PREVINOR. In December 2006, Politeno advised PREVINOR of its intention to withdraw from the plan effective at the end of December 2006. The calculation of mathematical reserves of participants to be refunded to plan was completed and submitted to the Supplementary Pension Plan Secretary for approval in February 2008. This plan is fully funded and no additional disbursements by Braskem will be required.
145
Share Ownership of Directors and Officers
The total number of shares owned by members of Braskem’s Boardboard of Directorsdirectors and Executive Officersexecutive officers as of June 16, 200427, 2008 represents 0.01%less than 0.1% of Braskem’s capital stock.share capital. Under our by-laws, each of our directors must also be a shareholder of our company. Accordingly, if a person is appointed to our board of directors and is not one of our shareholders at the time, the shareholder that designated such person to be one of our directors (in accordance with the terms of the relevant shareholders agreement) generally transfers one share to the newly appointed director at no cost. All other shares owned by our directors were purchased at market prices through the São Paulo Stock Exchange. As of the date hereof, none of our executive officers owns any of our shares.
ITEM 7. MAJOR SHAREHOLDERS AND RELATED PARTY TRANSACTIONS
Major Shareholders
Major Shareholders
At June 24, 2005, we had an authorized share27, 2008, our issued and outstanding capital consisted of 488,000,000 shares, consisting of 175,680,000196,714,190 common shares, 307,440,000325,368,337 class A preferred shares and 4,880,000803,066 class B preferred shares. At June 24, 2005, we had 120,860,099 outstanding common shares, 240,860,206 outstanding class A preferred shares and 803,366 outstanding class B preferred shares, all without par value. Under the Brazilian Corporation Law, the aggregate number of our non-voting shares may not exceed two-thirds of the total number of our outstanding shares.
We have registered one class of ADSs, or ADSs, with the United States Securities and Exchange Commission, or the Commission, pursuant to the Securities Act. Each ADS is evidenced by American Depositary Receipts, or ADRs, representing two of our class A preferred shares. At June 24, 2005,27, 2008, we had approximately 13,90019,213 shareholders, including onefour U.S. resident holderholders of our common shares, approximately 102108 U.S. resident holders of our class A preferred shares (including The Bank of New York, as depositary) and no U.S. resident holders of our class B preferred shares.
The following table sets forth information concerning the ownership of our common shares and class A preferred shares at June 24, 2005,27, 2008, by each person whom we know to be the owner of more than 5.0% of anyour common shares and our class of our outstanding share capital,A preferred shares, and by all of our directors and executive officers as a group. Our principal shareholders have the same voting rights with respect to each class of our shares that they own as other holders of shares of that class.
| Common Shares | Class A Preferred Shares | Class B Preferred Shares(1) | Total | |||||||||||||
Number of Shares | % | Number of shares | % | Number of Shares | % | Number of shares | % | |||||||||
Odebrecht Group(2) | 88,754,713 | 73.4 | 59,084,262 | 24.5 | — | — | 147,838,975 | 40.8 | ||||||||
Norquisa(3) | 30,739,133 | 25.4 | 2,320,312 | 1.0 | — | — | 33,059,445 | 9.1 | ||||||||
Petroquisa(4) | 12,110,941 | 10.0 | 18,522,258 | 7.7 | — | — | 30,633,199 | 8.4 | ||||||||
BNDESPAR | — | — | 14,660,081 | 6.1 | — | — | 14,660,081 | 4.0 | ||||||||
Alliance Capital Management L.P.(5) | — | — | 12,191,991 | 5.1 | — | — | 12,191,991 | 3.4 | ||||||||
All directors, fiscal council members, their alternates and executive officers as a group (38 persons) | 1 | * | 75,056 | * | — | — | 75,057 | * | ||||||||
| Class A Preferred | ||||||||||||
| Common Shares | Shares | Total | ||||||||||
| Number of | Number of | Number of | ||||||||||
| Shares | % | shares | % | shares | % | |||||||
| Odebrecht (1) | 118,691,669 | 60.3 | 80,697,919 | 24.8 | 199,389,588 | 38.1 | ||||||
| Petroquisa | 59,014,256 | 30.0 | 61,666,920 | 19.0 | 120,681,176 | 23.1 | ||||||
| BNDESPAR | - | - | 28,319,525 | 8.7 | 28,319,525 | 5.0 | ||||||
| All directors, fiscal council members, | ||||||||||||
| their alternates and executive officers as | ||||||||||||
| a group (38 persons) | 7 | * | 75,058 | * | 75,065 | * | ||||||
| * | less than 1% |
| (1) | |
| Represents |
|
|
We currently have no management or employee option plans or management or employee options outstanding. See “Item 6. Directors, Senior Management, and Employees—Compensation—Long-Term Incentive Plan.”
Changes in Ownership
AtOn January 1, 2002:
On August 16, 2002, we issued (1) 42,861,046 of ourtransferred 1,235,000 common shares and 75,935,390 of our class A preferred shares, which then represented 43.7% of our total share capital and 43.7% of our voting share capital, to Odebrecht in exchange for the share capital of OPP Produtos. Following the issuance of these shares:
Following our merger with OPP Produtos, Odebrecht transferred common shares and class A preferred shares, of our company which then represented 12.5% of our total share capital and 34.6% of our voting share capital,Braskem to ODBPAR Investments.
146
On January 15, 2003, Odebrecht transferred 45,868 class A preferred sharesTable of our company to Oxiteno do Nordeste S.A. in exchange for 59,750,617 common shares and 675,460 preferred shares of Norquisa. Following this transaction, the Odebrecht Group owned 42.9% of Norquisa’s total share capital, including 50.1% of its voting share capital, and the Odebrecht Group, including Norquisa, owned 56.2% of our total share capital, including 76.4% of our voting share capital.Contents
On July 31, 2003,In April 2007, we issued 4,345,162 of our common shares to Sojitz in exchange for the share capital of NI Participações Ltda. in connection with its merger into our company. Following the issuance of these shares:
On January 15, 2004, we issued 32,552,6611,533,670 of our class A preferred shares to the shareholders of Trikem,Politeno, other than our company, in exchange for their share capital of Trikem.Politeno. In addition, at an extraordinary general shareholders’ meeting held on January 15, 2004, Norquisa,in April 2007, Odebrecht and PetroquisaNorquisa converted 13,778, 364,027464,685 and 109,98721,845 of their class A preferred shares, respectively, into the same number of common shares.
As a result of these transactions, at January 15, 2004:
On September 28, 2004, we issued and sold 53,820,000 class A preferred shares owned by Politeno became treasury shares.
In July 2007, Odebrecht transferred our subordinated convertible debentures to its subsidiary, CNO, and CNO assumed all of the obligations of Odebrecht under its non-convertible debentures of the second series.
In July 2007, CNO, as the holder of our subordinated convertible debentures, converted all of these debentures in a public equity offering conducted in Brazilthe outstanding amount of R$1,113.5 million (including accrued and the United States. In connection with this offering, certain holdersunpaid interest) into 25,832,198 of our common shares and 51,664,397 of our class A preferred shares, agreedreflecting a conversion price of R$14.37 per share. On the same date, BNDESPAR exercised its option to convertexchange all of the non-convertible debentures of the second series of CNO held by BNDESPAR for 18,344,872 of our class A preferred shares.
In October 2007, CNO transferred 25,832,198 common shares and 31,994,603 class A preferred shares to its subsidiary Belgravia.
In October 2007, Belgravia transferred 25,832,198 common shares to Odebrecht in exchange for 25,832,198 class A preferred shares. On the same date, Odebrecht transferred 20,685,872 class A preferred shares to OII.
On May 30, 2008, we issued an aggregate of 46,903,320 common shares and 43,144,662 class A preferred shares to Petroquisa in the first phase of the Petrobras Transaction. As a sufficient numberresult, the direct and indirect ownership of Odebrecht in our company was reduced to 60.3% of our common shares, 24.7% of our class A preferred shares into common shares on a one-for-one basis to enable us to comply with Brazilian legal requirements regarding the ratio of preferred shares to common shares following the global offering. As a result, on September 22 and September 27, 2004, Odebrecht converted an aggregate of 13,350,419 class A preferred shares into common shares, Norquisa converted an aggregate of 505,307 class A preferred shares into common shares, Petroquisa converted an aggregate of 4,033,694 class A preferred shares into common shares and other shareholders unaffiliated with our company converted an aggregate of 50,430 class A preferred shares into common shares.
During the fourth quarter of 2004 and the first quarter of 2005, some of the shareholders of our class B preferred shares exercised their rights to convert their class B preferred shares into class A preferred shares. As a result of these conversions, we issued 56,626 class A preferred shares in exchange for 113,254 class B preferred shares.
On March 22, 2005, Odebrecht transferred 2,784,799 class A preferred shares to BNDESPAR in exchange for non-voting shares of Norquisa representing 10.06% of the total share capital of Norquisa.
On April 28, 2005, Odebrecht transferred 2,044,990 class A preferred shares to EDN—Distribuidora do Nordeste S.A. in exchange for shares of Norquisa representing 11.1% of the total share capital, including 12.5% of the voting share capital, of Norquisa.
As a result of these transactions, at June 24, 2005:
On May 30, 2008, our subsidiary Braskem Participações S.A. authorized the transfer of the shares of Braskem’s share capital that it owns to Braskem. This transfer will become effective not more than 60 days after the transfer was authorized.
Shareholders Agreements
Petrobras Shareholders’ Agreement
On May 30, 2008, Petrobras, Petroquisa, Odebrecht and Norquisa, with Braskem as intervening party, entered into the Petrobras Shareholders’ Agreement, which has a term of 25 years. The Petrobras Shareholders’ Agreement superseded the Ipiranga Memorandum of Understanding and the Petroquisa Memorandum of Understanding.
Under the Petrobras Shareholders’ Agreement, Petrobras and Petroquisa:
147
Table of our total share capital, including 73.4%Contents
Shareholders Agreements
Petroquisa Memorandum of Understanding
On July 3, 2001, Odebrecht, Odebrecht Química, Petroquisa and Petroquímica da Bahia entered into a Memorandum of Understanding regarding Shareholders Agreement, which was amended with respect to Odebrecht and Petroquisa, with Petroquímica da Bahia and Norquisa as consenting parties, on July 26, 2002. On April 29, 2005, Odebrecht, Petroquisa, ODBPAR and Norquisa entered into a further amendment to the Memorandum of Understanding regarding Shareholders Agreement, which revoked the initial amendment, and which,capital, together with the Memorandum of Understanding regarding Shareholders Agreement, we refer to as the Petroquisa memorandum of understanding. The Petroquisa memorandum of understanding grants Petroquisa (1) an option to purchase additional shares from our company and from Odebrecht, ODBPAR and Norquisa, (2)have the right to designate one member of our fiscal council and his or her alternate; and
Under the Petrobras Shareholders’ Agreement, Petrobras and Petroquisa together have the right to designate:
Under the Petroquisa memorandum of understanding, Odebrecht, ODBPAR and Norquisa granted to Petroquisa an option to purchase such number of our common shares as may be necessary for Petroquisa to own
up to 30%more of our voting share capital.
For so long as Petrobras and Petroquisa may exercise this option in full on a single occasion on or prior to December 31, 2005. If Petroquisa exercises this option, Odebrecht, ODBPAR and Norquisa will cause our company to issue shares to Petroquisa in exchange for the shares of some petrochemical companies, including shares of some petrochemical companies located in the Southern Complex, that Petroquisa holds and that Odebrecht may consider essential to the grant of the Petroquisa option, or the Petroquisa assets.
The identity of the Petroquisa assets to be exchanged for our common shares will be determined as follows:
Under the Petroquisa memorandum of understanding, Odebrecht, ODBPAR, Norquisa and Petroquisa agreed that in the event that Petroquisa exercises the Petroquisa option, Odebrecht, ODBPAR, Norquisa and Petroquisa will enter into a shareholders’ agreement which will include the terms included in the Petroquisa memorandum of understanding.
Under the Petroquisa memorandum of understanding, Petroquisa has veto rights over the following matters at any general meeting of our shareholders:
Under the Petroquisa memorandum of understanding, Petroquisa has veto rights over resolutionsthese designees will serve as vice president of our board of directors relating todirectors.
Under the following matters:
Although the Petroquisa memorandum of understanding does not provide a definition of EBITDA, we calculate EBITDA for purposes of this agreement on the same basis as set forth in the most restrictive financial covenants in our debt instruments. See “Item 5. Operating and Financial Review and Prospects—Liquidity and Capital Resources.” PetroquisaPetrobras Shareholders’ Agreement, Petrobras has the right to sellsell:
Mariani Group Shareholders Agreement
On July 27, 2001, Odebrecht Química and Petroquímica da Bahia entered into a shareholders agreement with respect to their shares of Norquisa and our company, which was amended on July 29, 2002 pursuant to the First Amendment to Shareholders Agreement among Odebrecht Química, Odebrecht, ODBPAR and Petroquímica da Bahia. We refer to this agreement, as amended, as the Mariani Group Shareholders Agreement.
The Mariani Group Shareholders Agreement provides that:
Under the Mariani Group Shareholders Agreement, Odebrecht, ODBPAR and Petroquímica da Bahia will vote their shares as a block in each general shareholders meeting of Norquisa. Odebrecht, ODBPAR Investments and Petroquímica da Bahia will meet prior to each meeting to determine how to vote these shares with respect to matters to be submitted to the meeting. These determinations will be made by majority vote among these shareholders based on the number of Norquisa shares held by each of them. As a result, the Odebrecht Group may effectively determine the vote for all of these shareholders.
Under the Mariani Group Shareholders Agreement, Odebrecht and ODBPAR, on the one hand, and Petroquímica da Bahia, on the other hand, granted to the other a right of first refusal in respect of sales transfers or encumbrances of common shares of Norquisa owned directly or indirectly by either of them. If the Odebrecht Group intends to sell any of its shares of Norquisa, Petroquímica da Bahia has the right to sell apro rataportion of its shares of Norquisa on the terms and conditions under which the Odebrecht Group intends to sell its shares. If the Odebrecht Group intends to sell a sufficient number of its shares of Norquisa to result in a change of joint control of Norquisa, Petroquímica da Bahia has the right to sell all of its shares of Norquisa on the same terms and conditions under which the Odebrecht Group intends to sell its shares. If the Odebrecht Group sells or transfers direct or indirect control of our company to a third party, Petroquímica da Bahia also has the right to sell all of its shares of our company on the same terms offered by the third party acquiring control of our company from the Odebrecht Group.
On September 9, 2003, Odebrecht granted to Pronor, a company in the Mariani Group, an option to exchange all its shares of Norquisa, representing 13.8% of Norquisa’s total share capital, including 16.1% of its voting share capital, for 1,454,424 of our class A preferred shares, representing 0.4% of our total share capital, owned directly or indirectly by Odebrecht. On December 26, 2003, Pronor exercised its option and is required to complete the exchange of shares between January 30, 2005 and January 30, 2009. As of June 24, 2005, Pronor owned 1.8% of our total share capital, including 2.9% of our voting share capital.
Pension Funds Memorandum of Understanding
On July 20, 2001, Odebrecht Química, Petroquímica da Bahia S.A., Petros and PreviCaixa de Previdência dos Funcionários do Banco do Brazil—PREVI, or PREVI, entered into a Memorandum of Understanding Regarding Shareholders Agreement, which we refer to as the Pension Funds memorandumMemorandum of understanding.Understanding. The Pension Funds memorandumMemorandum of understandingUnderstanding grants certain preemptive and share transfer and voting rights to Petros and Previ, including veto rights to Petros and Previ over certain actions by our shareholders and our boardthe pension fund of directors.Banco do Brasil (Caixa de Previdência dos Funcionários do Banco do Brasil), or Previ. The Pension Funds memorandumMemorandum of understandingUnderstanding has a term of 20 years, unless a shareholders agreement containing the terms set out below is entered into prior to that date. Under the Pension Funds memorandumMemorandum of understanding, the parties agreed to adopt the following basic principles for our management:
Under the Pension Funds memorandumMemorandum of understanding, Petros and Previ have veto rights (to be exercised jointly) over the matters for which Petroquisa would have veto rights at meetings of our shareholders or our board of directors under the Petroquisa memorandum of understanding (except that Petros and Previ have no veto right over investments in other companies, unless they are in the same business as our company).
The veto rights of Petros and Previ are valid so long as on a combined basis they own, together with other private pension funds, at least 15.0% of our voting capital. If the percentage of voting capital owned by Petros and Previ together is diluted below 15.0% at any time due to the integration of the second generation petrochemical producers, those veto rights will remain in effect for three years after that time, during which Petros and Previ may purchase more of our shares in order to maintain their veto rights beyond such three-year period. Accordingly, although as a result of our mergers with OPP Produtos and 52114 Participações, the participation of Petros and Previ in our voting capital was diluted to 6.1%, their veto rights remain in effect until August 16, 2005.
The Pension Funds memorandum of understanding contains the following liquidity provisions with respect to our shares owned by Petros and Previ:
control.
BNDESPAR Shareholders Agreement
148
We, Odebrecht and BNDESPAR have entered into a shareholders agreement. This shareholders agreement provides that if BNDESPAR’s ownership of our total share capital exceeds 5.0% on or prior to July 31, 2007, BNDESPAR will havehas the right to appoint one member of our board of directors. Until the earlier of the date on which BNDESPAR appoints a member of our board of directors and July 31, 2007, a representative of BNDESPAR may attend meetings of our board of directors, but is not allowed to participate or to vote in such meetings. If BNDESPAR’s ownership of our total share capital exceeds 5.0% on or prior to July 31, 2007, thisThis shareholders agreement will expire on the earlier of anythe first date thereafter on which BNDESPAR ceases to own more than 5.0% of our total share capital and August 24, 2011. This shareholders agreement also provides that BNDESPAR has the right to (1) require our company and Odebrecht to purchase the shares that it owns in our company if we do not comply with the terms of thethis shareholders agreement and do not cure any such non- compliancenon-compliance within a specified period, and (2) sell its shares in the event that Odebrecht sells its voting control of our company to a third party.
Related Party Transactions
The following summarizes the material transactions that we have engaged in with our principal shareholders and their affiliates since January 1, 2004.2007.
We and our subsidiaries have engaged in extensive transactions with our principal shareholders and their affiliates and expect to do so in the future. The Odebrecht Group was a party to several of the mergers,
acquisitions and other transactions described in “Item 4. Information on Our Company—History and Development of Our Company.” We also have commercial relationships with some of our affiliates and, as a result, record trade accounts receivable and current and long-term liabilities mainly from purchases and sales of goods and services at prices and on terms equivalent to the average terms and prices of transactions that we enter into with third parties. In addition, we have entered into financial and other transactions with our principal shareholders and their affiliates, including, among others, as obligor on R$659.9 million, at December 31, 2004, of convertible subordinated debentures held by the Odebrecht Group and as a party to three shareholder’s agreements or memoranda of understandings.understandings with shareholders of our company. See “—Principal Shareholders—Shareholders Agreements.”
In connection with the Ipiranga Transaction, we entered into the Purchase Agreement, the Ipiranga Investment Agreement, the Interim Shareholders Agreement, the Ipiranga Memorandum of Understanding and the RPI Shareholders Agreement with Petrobras and the other parties thereto. The Ipiranga Memorandum of Understanding has been superseded by the Petrobras Shareholders’ Agreement. See “Item 4. Information on the Company—Ipiranga Transaction.”
In connection with the Petrobras Transaction, we have entered into the Petrobras Investment Agreement with Odebrecht, Petrobras, Petroquisa and Norquisa. See “Item 4. Information on the Company—Petrobras Transaction.”
Under the Brazilian Corporation Law, each of our directors, their alternates and our executive officers cannot vote on any matter in which they have a conflict of interest and such transactions can only be approved on reasonable and fair terms and conditions that are no more favorable than the terms and conditions prevailing in the market or offered by third parties. However, if one of our directors is absent from a meeting of our board of directors, that director’s alternate may vote even if that director has a conflict of interest, unless the alternate director shares that conflict of interest or has another conflict of interest. See “Item 10. Additional Information—Board of Directors—Fiduciary Duties and Conflicts of Interest.”
The Odebrecht Group
In early 2004, Construtora Norberto OdebrechtMay 2002, OPP Produtos Petroquímicos S.A., or OPP Produtos, issued subordinated convertible debentures to Odebrecht S.A. These debentures became our obligations as a result of the merger of OPP Produtos into our company in August 2002. In July 2007, Odebrecht transferred our subordinated convertible debentures to its subsidiary, CNO, servedand CNO assumed all of the obligations of Odebrecht under its non-convertible debentures of the second series. In July 2007, CNO, as the general contractor for maintenance services related to the shutdownholder of our Olefins 2 unit. We paid approximatelysubordinated convertible debentures, converted all of these debentures in the outstanding amount of R$32.51,113.5 million to CNO for these services in 2004.(including accrued and unpaid interest) into 25,832,198 of our common shares and 51,664,397 of our class A preferred shares, reflecting a conversion price of R$14.37 per share.
OnIn December 4, 2004, we entered into an Alliance Agreement with CNO under which we have appointed CNO as a non-exclusive preferred provider with respect to maintenance services and efficiency enhancement projects at each of our plants. This agreement was unanimously approved by our board of directors. Under this agreement, we are required to request bids from CNO for these services and projects. If CNO is retained for any specific service or project, we will pay CNO its costs related to the service or project plus 15%. In addition, weWe are also required to pay any applicable taxes with respect to such fees. This agreement expires in December 2008. We paid approximately R$16.0 million to CNO forpurchased services provided under this agreement from CNO of R$120.3 million in 2004.2007. We had accounts payable to CNO of R$17.5 million at December 31, 2007.
149
Petrobras
Financial Transactions with Petrobras
Trikem
Trikem mergedIn September 2007, EDSP58 entered into our company on January 15, 2004. From August 16, 2002 until January 15, 2004, Trikem was our subsidiary. From July 25, 2001 until August 16, 2002, Trikem was our affiliate asan export prepayment credit facility with PIFCo, a resultwholly-owned subsidiary of Petrobras, under which EDSP58 is permitted to borrow an aggregate principal amount of up to US$323.0 million. In October 2007, EDSP58 borrowed an aggregate of US$312.5 million under this facility to fund a portion of the common control exercised bypurchase price of the Odebrecht Group over Trikemshares tendered in the Copesul Tender Offer. These loans bear interest at the rate of LIBOR plus 0.35% per annum until the first anniversary of their disbursement and our company. Trikem has been fully consolidated in our financial statements since July 25, 2001. Priorthereafter at the rate of LIBOR plus 0.55% per annum. The principal amount of these loans is payable on or prior to our mergerthe second anniversary of each disbursement.
We maintain a rotating naphtha supply line of credit with Trikem, Trikem purchased all its ethylene, its primary raw material,Petrobras that permits us to finance purchases of naphtha from our Basic Petrochemicals Unit. Trikem also purchased electric power, steam, water, compressed air and nitrogenPetrobras. We are permitted to maintain balances up to an aggregate of R$570.0 million under this line of credit. We pay interest on markets terms from our Basic Petrochemicals Unit.the outstanding balance under this line of credit at the monthly rate of 1.78% .
Commercial Transactions with Petrobras
Petrobras
Petrobras is the controlling shareholder of Petroquisa, which owns 8.4% of our total share capital, including 10.0% of our voting share capital. We purchase naphtha from Petrobras, and we sell automotive gasoline and LPG to Petrobras Distribuidora S.A., a wholly-owned subsidiary of Petrobras.
OnIn June 22, 1978, we entered into a 10-year renewable contract with Petrobras under which the prices paid by us to Petrobras for naphtha are established based on the Amsterdam-Rotterdam-Antwerp market price and are linked to fluctuations in thereal/U.S. dollar exchange rate. This contract was amended and renewed in February 1993 and in February 2003.
We maintainIn February 1996, Copesul and Petrobras entered into a rotating naphtha supply line of credit16-year renewable contract with Petrobras that permits usunder which the prices paid by Copesul to finance purchasesPetrobras for petroleum condensate are established based on the Amsterdam-Rotterdam-Antwerp market price and are linked to fluctuations in thereal/U.S. dollar exchange rate.
In April 2007, we entered into a three-year caustic soda supply contract with Petrobras under which we will supply approximately 61,300 tons of naphtha from Petrobras. We are permitted to maintain balances up to an aggregatecaustic soda annually for use by Petrobras’ Brazilian refineries. Petrobras uses caustic soda for the treatment of R$570.0 million under this line of credit. This line of credit is guaranteed by the mortgage of two of our plants locatedeffluents in the Southern Complex.
We purchased raw materials and utilities from Petrobras and Petrobras Distribuidora S.A. of R$4,354.75,713.1 million in 2004. We2007 and sold automotive gasoline and LPGproducts to Petrobras and Petrobras Distribuidora S.A. of R$4.0286.1 million during this period. We had accounts payable to Petrobras in an aggregate amount of R$579.2 million and accounts receivable from Petrobras in an aggregate amount of R$96.8 million at December 31, 2007.
In March 2007, we entered into a five-year propylene supply contract with Refap, a subsidiary of Petrobras, under which we will purchase an initial annual supply of 70,000 tons of propylene, representing 70% of Refap’s current annual propylene production capacity of 100,000 tons. In addition, we sell condensate and purchase naphtha from Refap. We purchased raw materials from Refap of R$1,654.2 million and had sales to Refap of R$543.2 million in 2004.2007. We had accounts receivable from Refap in an aggregate amount of R$26.2 million at December 31, 2007.
On February 21, 2005, we purchased (1) 15,390,139 common shares, 379,955 class B preferred shares and 7,695,071 class C preferred shares, representing 13.74% of the total share capital of Cinal, including 16.6% of the voting share capital of Cinal, and (2) 1,669,518,451 quotas, representing 25% of the total capital of Alclor—Química de Alagoas Ltda., from Petroquisa for R$7.7 million.
Petrobras’ subsidiary, Petroquisa, is a party to the Petroquisa memorandum of understanding with Odebrecht and Petroquímica da Bahia. This agreement grants certain voting and other rights in respect of our company to Petroquisa, together with an option to purchase a number of our common shares that would provide it with up to 30% of our voting share capital. See “—Major Shareholders—Shareholders Agreements—Petroquisa Memorandum of Understanding.”
Petros and Previ
Petros and Previ are party to the Pension Funds memorandum of understanding with Odebrecht and Petroquímica da Bahia. This agreement grants certain voting and other rights in respect of our company to Petros and Previ. See “—Major Shareholders—Shareholders Agreements—Pension Funds Memorandum of Understanding.”
Our Subsidiaries, Jointly Controlled Companies and Associated Companies
Paulínia
Copesul
Our Polyolefins Unit purchases ethyleneIn December 2006, Paulínia entered into a credit agreement with BNDES in the aggregate amount of R$566.2 million to finance the construction of a polypropylene plant to be located in Paulínia, in the State of São Paulo. In December 2006, we entered into an agreement with Petrobras and propylene from Copesul, inBNDES under which we have a 29.5% interest. We have a long-term supply contractand Petrobras severally guarantee the obligations of Paulínia with Copesul that is described in “Item 4. Information on Our Company—Polyolefins Unit—Raw Materials of Our Polyolefins Unit—Supply Contracts and Pricing.” Our Polyolefins Unit also buys nitrogen on market terms from Copesul. We recorded purchases from Copesul of R$1,659.7 million in 2004.
COPESUL—International Trading Inc.
COPESUL—International Trading Inc. is a subsidiary of Copesul, in which we have a 29.5% interest. At December 31, 2004, one ofrespect to our subsidiaries, Lantana Trading Company Inc., had four outstanding loans from COPESUL—International Trading Inc. with an outstanding balance of R$145.8 million (R$102.9 million giving effect to proportional consolidation) at interest rates equivalent to the market rates.
Polialden
Polialden has been our subsidiary since July 25, 2001. Polialden has been fully consolidated in our financial statements since July 25, 2001. Prior to July 25, 2001, Polialden indirectly owned 23.7% of our voting share capital through Petronor—Participações Petroquímicas do Nordeste Ltda. In connection with the Auction of Econômico S.A. Empreendimentos, on July 25, 2001 Polialden sold all of ourproportionate shares that it owned to Odebrecht Química. We sell ethylene, utilities and hydrogen to Polialden under long-term contracts that are renewable automatically for five-year periods.
Politeno
We own 34.0% of the total share capitalobligations that Paulínia incurs under this credit agreement. The first tranche under this credit agreement in the principal amount of Politeno, including 35.0%R$56.0 million bears interest at a rate of its voting share capital. Our Basic Petrochemicals Unit supplies ethylene to Politeno. Politeno recorded purchases from our company9.5% per annum. The second tranche under this credit agreement in the aggregate principal amount of R$623.1424.6 million bear interest at the TJLP rate plus 3.4% per annum. The third tranche under this credit agreement in 2004. We had accounts receivable from Politenothe aggregate principal amount of R$13.276.9 million bears interest at the TJLP rate plus 2.9% per annum. The fourth tranche under this credit agreement in the aggregate principal amount of R$8.1 million bear interest at the TJLP rate plus 2.4% per annum. The first tranche under this credit agreement matures in January 2015 and the other three tranches mature in December 31, 2004.
150
Cetrel
We own, directly and indirectly, 41.0%52% of the voting and total share capital of Cetrel. We purchase treatment services on market terms from Cetrel for the wastewater and organic residues generated by us in the Northeastern Complex. We recorded purchases from Cetrel of R$12.510.0 million in 2004.2007. We had accounts payable to Cetrel of R$0.1 million at December 31, 2007.
Petroflex
Petroflex
We own 20.1%Prior to April 1, 2008, we owned 33.5% of the voting and total share capital of Petroflex.Petroflex, including 33.6% of its voting share capital. We sell butadiene-l to Petroflex on market terms under a long-term contract that is renewable automatically for five-year10-year periods. We recorded net sales to Petroflex of R$390.8336.3 million in 2004.2007. We had accounts receivable from Petroflex of R$457.1 million at December 31, 2007.
OnIn June 11, 2004, Petroflex entered into a R$34.3 million secured credit agreement with BNDES to finance capital expenditures. In accordance with the terms of a shareholders agreement among our company and the other controlling shareholders of Petroflex that terminated upon our sale of our interest in Petroflex, we have guaranteed severally, but not jointly, 40% of this loan, or approximately R$13.7 million of its aggregate principal amount. The first tranche of this loan in the principal amount of R$10.3 million bears interest at a rate based on the UM,UMBNDES rate plus a BNDES rate based on a basketmargin of currencies (which rate reflects the daily exchange rate fluctuations in the currencies in which BNDES borrows), plus 5.125% per annum. The second and third tranches of this loan in the aggregate principal amount of R$24.0 million bear interest at the Long-Term Interest Rate,TJLP plus 5.125% per annum. As set forth in thethis shareholders agreement, we charge Petroflex a fee of 1.25% of the outstanding principal amount of this loan that we guarantee. Under the terms of the agreement under which we sold our interest in Petroflex, this guarantee is required to be replaced and we are to be released from this guarantee prior to or on June 29, 2008.
Borealis Brasil S.A.
We sell polypropylene and polyethylene to Borealis Brasil S.A., or Borealis, in which we have a 20.0% interest. We recorded net sales to Borealis of R$141.3143.0 million in 2004.
Pronor
2007. We had long-term liabilities to Pronoraccounts receivable from Borealis of R$3.210.7 million at December 31, 2004.2007.
Other
Engepack
Other
We sell PET from time to time to Engepack Embalagens S.A., or Engepack, a packaging manufacturer. Francisco Teixeira de Sá, the chairman of the board of directors of Engepack, is a member of our board of directors. In addition, one of the alternate members of our board of directors, LucioLúcio José Santos Junior,Júnior, is an executive officer of Engepack, and one of the members of our fiscal council, Walter Murilo Melo de Andrade, is the internal counsel of Engepack. We recorded net sales to Engepack of R$37.049.3 million in 2004.2007. Engepack purchases PET from a variety of second generation producers, including our company.
Sojitz
We sell PVC and EDC to, and we purchase raw materials, principally naphtha, from Sojitz, a chemical trader. Yukihiro Funamoto, an executive officer of Sojitz do Brasil S.A., a subsidiary of Sojitz, is an alternate member of our board of directors. At December 31, 2007, Sojitz owned 1.0% of our total share capital, including 2.9% of our voting share capital. We recorded net sales to Sojitz of R$17.0 million in 2007. In addition, we recorded purchases from Sojitz of R$742.1 million in 2007.
151
ITEM 8. FINANCIAL INFORMATION
Consolidated Statements and Other Financial Information
Reference is made to Item 19 for a list of all financial statements filed as part of this annual report.
Legal Proceedings
Tax Proceedings
We are engaged in several legal proceedings with Brazilian tax authorities for which we have established provisions in an aggregate amount of R$1,332.11,145.8 million at December 31, 2004.2007. In addition, there are currently certain legal proceedings pending in which we are involved for which we have not established provisions. If any of these legal proceedings is decided adversely to us, our results of operations or financial condition could be materially and adversely affected.
IPI
IPI Credits on Raw Materials Purchases.We pay IPI tax on industrial products that we manufacture. The regulations governing the IPI tax assess this tax on a non-cumulative basis, meaning that companies may offset their IPI tax obligations with the amount of IPI taxes paid by suppliers earlier in the production chain. The Brazilian federal tax authorities have asserted that the purchase of raw materials that are tax-exempt, non-taxable or taxed at a zero percent rate does not generate IPI tax credits, on the basis that there is no law or regulation that expressly authorizes these credits. We believe that this interpretation is contrary to Article 153, paragraph 3 of the Brazilian Constitution, which sets forth the principle of non-cumulative taxation and does not exclude purchases of raw materials that are tax-exempt, non-taxable or taxed at a zero percent rate.
In July 2000, OPP Química (which has merged into our company) filed suit in the State of Rio Grande do Sul requesting the acknowledgement of IPI tax credits for its purchases of raw materials from our company and Copesul. The amount of credits claimed by OPP Química comprised the book value of those raw materials plus monetary adjustments. In December 2002, the Brazilian Federal Supreme Court held that OPP Química was entitled to IPI tax credits in an aggregate amount of R$1,030.1 million, including R$367.9 million attributable to monetary adjustments, for the ten-year10-year period ended in 2002, calculated based on the price of the raw materials purchased during the ten-year10-year period preceding the filing of the suit, plus monetary adjustments based on official indices.
The Brazilian government appealed the decision of the Brazilian Federal Supreme Court. AsIn this special appeal, the appeal does not challengeBrazilian federal tax authorities are no longer challenging the validity of IPI tax credits, but onlyare alleging some inaccuracies in the method of calculating monetary adjustments on those credits andcredits. According to the time period for appealing the decisionopinion of our legal advisors, these issues have already been resolved by decisions of the Brazilian Federal Supreme Court has expired, we believe that (1)and the Regional Federal Court favorable to OPP Química. However, there may be a risk of changes in the previous decision acknowledging the validityas a result of the IPI tax credits is no longer subject tospecial appeal, and (2)because, among other factors, the probability of losingBrazilian Federal Supreme Court has revisited this appeal is remote. Accordingly, wematter on the merits in a similar lawsuit lodged by another taxpayer. We recognized IPI tax credits in an aggregate amount of R$1,030.1 million in December 2002. At December 31, 2004,2007, we have used the full amount of the R$1,030.1 million IPI tax credit to offset our IPI and other federal tax obligations.
On September 28, 2006, the Brazilian federal tax authorities issued four tax deficiency notices to us, claiming that we owe approximately R$1,100.0 million in taxes that we offset with OPP Química’s IPI tax credits. We are contesting the government’s claims in administrative tax proceedings. We believe that the government issued two of the deficiency notices, in an aggregate amount of R$308.6 million solely to avoid forfeiting their claims due to the expiration of the statute of limitations. However, we believe that we will prevail in these administrative tax proceedings, as our decision to offset IPI tax credits against our IPI and other federal tax obligations is supported by a final decision of the Brazilian Federal Supreme Court. The other two tax deficiency notices, in an aggregate amount of R$791.4 million, allege that we are not allowed to recognize IPI tax credits from future raw material purchases. Nevertheless, the existing court decisions have given our company full and ongoing entitlement to offsetting rights. We believe that we will prevail in these administrative proceedings.
152
During 2007, the Federal Revenue Office rejected approximately 200 applications for offsetting of these credits with federal taxes payable by our company. We disputed these rejections at administrative and judicial levels. We believe that we will prevail in all these administrative and judicial tax proceedings.
The tax credits used up by us (as adjusted by applying the SELIC rate through December 2007) amount to R$2,506.9 million. The various collection proceedings referred to above have claimed R$2,263.5 million as of December 31, 2007, plus fines in the aggregate amount of R$731.0 million. We believe that such fines are not payable because we relied upon a judicial decision in the recognition of the tax credits.
In a procedural decision on December 11, 2007 that has not yet been published, the Brazilian Federal Supreme Court held that a new judgment should be rendered and, in view of the importance of the matters raised by our lawsuit, the parties were granted an opportunity to make new oral arguments concerning the procedural matter.
Upon publication of this decision, we intend to determine whether to appeal this decision. However, despite the possibility of the Brazilian Federal Supreme Court’s review of the merits of its former decision and its ruling against us, we and our counsel believe that the December 2002 decision should nonetheless be givenres judicata(i.e., final and binding) effect.
We have three othera similar suitssuit pending on behalf of OPP Química (which has merged into our company) in federal court in the State of São Paulo, and two similar suits on behalf of Trikem (which havehas merged into our company) in federal courts in the States of Bahia, São Paulo and Alagoas. In two of these cases, we obtained preliminary injunctions that allowed these companies to use these credits to offset other IPI tax obligations. In the third case, we obtained a favorable decision in federal trial court that recognized our right to these credits for the ten-year period preceding the filing of this suit, which decision the Brazilian government appealed to the Superior Court of Justice and the Brazilian Federal Supreme Court in 2002. All three of theseThese suits remain pending. Based on (1) these favorable lower court decisions, (2) the favorable decision of the Brazilian Federal Supreme Court relating to the validity of the IPI tax credits in OPP Química’s suit in Rio Grande do Sul described above and (3) our assessment of the arguments made in a similar case involving a third party that is currently pending before the Brazilian Federal Supreme Court, we believe that it is reasonably possible that we will prevail in these suits. Accordingly, weWe have used R$204.5120.5 million at December 31, 20042007 of Trikem’s and OPP Químicas’ IPI tax credits to offset our IPI and other federal tax obligations and have recorded a provision in the amount of R$272.1227.4 million at December 31, 2004.2007. We have not recognized any assets or gains in relation to these claims.
We note that the Brazilian Federal Supreme Court issued an unfavorable ruling in another case in February 2007 involving a taxpayer unrelated to our company, holding by a six-to-five vote that IPI tax credits arising from the purchase of raw materials that are taxed at a zero percent rate may not be used to offset IPI and other federal taxes. In June 2007, the full bench of the Brazilian Federal Supreme Court contemplated whether this decision would have retroactive or prospective effect and, by majority opinion, ruled that a decision of the Brazilian Federal Supreme Court that reversed an earlier determination made by the full bench of the Brazilian Federal Supreme Court in favor of a taxpayer would apply retroactively.
Our subsidiary, Polialden, has In a third suit on behalf of OPP Química and Trikem in the federal court in the State of Bahia, we obtained a favorable decision in federal trial court that recognized our right to these credits for the 10-year period preceding the filing of this suit. The Brazilian government appealed this ruling to the Superior Court of Justice in the First Circuit. In August 2007, the Superior Court of Justice in the First Circuit overturned the ruling of the federal trial court. As a result, we paid R$127.3 million to the tax authorities in accordance with this judgment. We had established a provision with respect to this action in excess of the amount of this judgment.
We also have a similar suit pending in federal court in the State of Bahia.Bahia that was commenced by Polialden prior to our merger with Polialden. Polialden won this suit in federal trial court, which ruled that Polialden was entitled to IPI tax credits for the ten-year10-year period preceding the filing of this suit. However, theThe Brazilian government appealed this decision to the Federal Superior Court of Justice which appeal remains pending. Based on (1) this favorable lower court decision, (2)in the favorable decisionFirst Circuit. In September 2007, the Superior Court of Justice in the First Circuit overturned the ruling of the Brazilian Federal Supreme Court relatingfederal trial court. As a result, we paid R$99.6 million to the validity of the IPI tax creditsauthorities in OPP Química’s suit in Rio Grande do Sul described above, and (3) our assessment of the arguments made in a similar case involving a third party that is currently pending before the Brazilian Federal Supreme Court, we believe that it is reasonably possible that Polialden will prevail inaccordance with this suit. Accordingly, Polialden has used R$92.2 million at December 31, 2004 in IPI tax credits to offset its IPI and other federal tax obligations and recordedjudgment. We had established a provision with respect to this action in excess of the amount of R$134.7 million at December 31, 2004. Polialden has not recognized any assets or gains in relation to these claims.
For further information on our accounting treatment of these IPI credits, see note 17notes 9 and 16(ii) to our consolidated and combined financial statements.
153
IPI Export Credits.Brazilian Decree Law No. 491/69 provides a tax credit to exporters of manufactured products to compensate them for taxes paid in Brazil prior to exporting their products. The regulations governing the IPI tax permit exporters to offset IPI taxes with IPI export credits and/or to transfer their IPI export credits to third parties. However, the Brazilian tax authorities issued a series of administrative rules that reduced, restricted and ultimately suspended the use of these credits based on Decree Law No. 1,724/79, which expressly delegated these powers to the Brazilian Ministry of Finance. We believe that this delegation of powers to the Ministry of Finance violated the distribution of functions among the executive branch, and that secondary administrative rules may not restrict or suspend a benefit created by a constitutionally superior norm. Accordingly, we believe that the administrative rules promulgated under the authority of Decree Law No. 1,724/79 have no legal effect. On these grounds, we and some of our subsidiaries filed suits against the Brazilian government challenging Decree Law No. 1,742/79 and these administrative rules and seeking to offset and transfer IPI export credits as provided under Decree Law No. 491/96.
We and our subsidiaries are claiming more than R$1,020.6 million in IPI export credits. In one of these suits, the Regional Federal Court ruled against OPP Química (which has merged into our company), holding that it does not have the right to IPI export credits. OPP Química’s appeals before the Superior Court of Justice and the Brazilian Federal Supreme Court remain pending. Although our other suits also are pending, the Brazilian tax authorities have issued deficiency notices against us (1) attempting to collect amounts offset using these IPI export credits and (2) asserting their right to do so before the expiration of the applicable statute of limitations. We filed administrative appeals in respect of these deficiency notices, but we received unfavorable decisions in each of these appeals. We have appealed each of these unfavorable decisions to the taxpayers’ council (an administrative appeal board). However, based on recent Brazilian Federal Supreme Court and otherandother jurisprudence holding that the sub-delegation by the Ministry of Finance of the authority to regulate IPI export credits under Decree Law No. 1,742/79 was unconstitutional and recognizingthat recognized the right to offset IPI export credits as provided under Decree Law No. 491/96, we believe that it is reasonably possible that we will prevail in all of these judicial and administrative proceedings. We note, however,Despite the issuance of Resolution No. 71 by the Federal Senate on December 27, 2005, which confirmed the unconstitutionality of this sub-delegation and ratified the validity of IPI export credits, the Superior Court of Justice, in an appeal made by another taxpayer seeking recognition of that taxpayers’ entitlement to use such tax benefit, upheld its rejection to such prospective use and affirmed that the tax benefit expired in 1990. When the Superior Court of Justice completes its judgment, the Brazilian Federal Supreme Court recently rendered a decision in an unrelated proceeding involving a third party holding that this sub-delegation was constitutional.will revisit the right to use those tax credits after 1990, based on application of Temporary Constitutional Provisions Act (ADCT) 41. We have used a portion of these credits to offset IPI and other federal taxes in the amount of R$381.9381.8 million at December 31, 20042007 and recorded a provision in the amount of R$462.8687.8 million at December 31, 20042007 because these suits remain pending. For further information on our accounting treatment of these IPI credits, see note 1716(i) to our consolidated and combined financial statements.
IPI Credits Arising from the Acquisition of Fixed Assets and Materials Not Used in Production.We are involved in four suits against the Brazilian government seeking the acknowledgment of IPI credits arising from the acquisition of fixed assets and materials not used by us in the production of our products. The regulations governing the IPI tax permit companies to offset against their IPI tax liability IPI credits arising from the acquisition of raw materials and other unfinished products only to the extent that they are used in production. We believe that this limitation imposed by the IPI regulations is unconstitutional. Article 153, paragraph 3 of the Brazilian Constitution sets forth a broad principle of non-cumulative taxation and does not limit the grant or use of IPI credits arising from the acquisition of fixed assets or in respect of materials not used in production.
We lost one of these suits in federal trial court and appealed this decision, which appeal remains pending. Although our three other suits also remain pending in federal court, the Brazilian tax authorities have issued deficiency notices against us attempting to collect amounts offset using these credits, asserting their right to do so before the expiration of the applicable statute of limitations. We appealed the issuance of these deficiency notices to the taxpayers’ council. We believe that it is reasonably possible for us to prevail in all of these judicial and administrative proceedings. We have used R$21.931.9 million at December 31, 20042007 of these credits to offset IPI taxes and recorded a provision in the amount of R$34.842.5 million at December 31, 20042007 because these suits remain pending. For further information on our accounting treatment of these IPI credits, see note 1716 to our consolidated and combined financial statements.
154
Social Contribution on Net Income
Law No. 7,689/88 created the Social Contribution on Net Income (CSLL),CSLL, a tax similar to the corporate income tax. Under Article 146, item III of the Brazilian Constitution, the Social Contribution on Net IncomeCSLL should have been enacted as a supplementary law and not as an ordinary law. Under Brazilian law, supplementary laws must be approved by at least a majority of the members of each house of the Brazilian Congress, while an ordinary law may be approved by a simple majority of the members of Congress present at the relevant voting session. In addition, we believe that Social Contribution on Net IncomeCSLL violates Article 154, item II of the Brazilian Constitution, which provides that new taxes may not be assessed and calculated on the same basis as existing taxes. We believe the Social Contribution on Net IncomeCSLL is assessed and calculated on the same basis as the corporate income tax.
On these grounds, we and some of our subsidiaries filed suit challenging the constitutionality of the Social Contribution on Net Income.CSLL. We received a final decision in our favor in 1992. However, in 1993, Brazilian tax authorities filed a rescission action (ação rescisória) against us in relation to all but one of these cases seeking to overrule this decision on the basis of a ruling by the Brazilian Federal Supreme Court in an unrelated case that recognized the constitutionality of the Social Contribution on Net Income.CSLL. The Brazilian tax authorities prevailed in their rescission action both in the first instance and on appeal. We filed further appeals in respect of this decision with the Superior Court of Justice and the Brazilian Federal Supreme Court, which appeals remain pending. The Brazilian Superior Court of Justice (Superior Tribunal de Justiça) issued a ruling in a case of another unrelated taxpayer dismissing one of the arguments thas has been used by the Brazilian tax authorities in the rescission action. This decision should strenghen the arguments that we have used in our cases. In the remaining case, we believe that it is probablereasonably possible that the final decision in our favor will remain in effect.
Brazilian tax authorities issued several deficiency notices against us and our subsidiaries attempting to collect Social Contribution on Net Income.CSLL. We obtained suspensions of all deficiency notices that we have received to date based on a Brazilian civil procedure provision that states that a rescission action may take effect only after the court publishes a final decision.
We believe it is reasonably possible that we will lose our appeals. However, if we lose these suits, we believe that we would be required to pay Social Contribution on Net IncomeCSLL only from the date that a final decision is published. We note, however, that Brazilian law allows rescission actions to relate back to, and to take effect from, the date of the initial decision. Although this legislation does not involve tax proceedings and the Brazilian Federal Supreme Court has not ruled on this issue, the same line of reasoning has been adopted by the Brazilian tax authorities and may be adopted by the courts in our suit. Accordingly, we believe that it is reasonably possible that we will be required to pay these taxes retroactively.
If Social Contribution on Net IncomeCSLL is charged retroactively, then our total estimated exposure at December 31, 20042007 would be R$562.0809.0 million, including interest. This amount does not include approximately R$163.8242.4 million in penalties at December 31, 2004,2007, which we believe are not payable because we relied upon a judicial decision in not paying Social Contribution on Net Income. However, weCSLL. We believe that there is a possibility that we will be required to pay related interest and a remote possibility that we will be required to pay fines and related interest as a result of this tax litigation.
As we believe that Social Contribution on Net IncomeCSLL may not be payable for periods before the date the final decision is published in the rescission action, we have not made any provision in our consolidated and combined financial statements for these contingencies. For further information on our accounting treatment of CSLL, see note 18(c)17(c) to our consolidated and combined financial statements.
PIS and COFINS
The PIS and COFINS taxes are Brazilian federal taxes created to fund the government’s unemployment payments, social security and other social programs. Prior to February 1999, PIS and COFINS were assessed on “gross billings,” that is, billings or invoices for sales of goods and services. Effective February 1999, Law No. 9,718/98 introduced significant changes in the assessment of PIS and COFINS, which changes have materially increased the tax burden of our company on a consolidated basis. Law No. 9,718/98 substantially broadened the
concept of “gross billings” to include revenue generated from sources other than sales of goods and services, increasing the tax base upon which PIS and COFINS are assessed. At the same time, the rate of COFINS increased from 2% to 3%.
155
We believe that these changes were unconstitutional. The provisions of Law No. 9,718/98 that broadened the concept of “gross billings” in our view violated the original terms of Article 195 of the Brazilian Constitution, as well as Article 110 of the Brazilian tax code, which prohibits tax laws from changing the definition, content and reach of private law doctrines and concepts. In addition, although the Brazilian Congress enacted Constitutional Amendment No. 20 on December 15, 1998 to modify Article 195 of the Brazilian Constitution in order to validate the expanded calculation basis of PIS and COFINS as set forth in Law No. 9,718/98, we believe that this law cannot be validated by constitutional amendment for periods before the effectiveness of the constitutional amendment. On these grounds, we and our subsidiaries have filed suit against the Brazilian government seeking to pay PIS and COFINS in accordance with the rules prevailing prior to February 1999.
We and some of our subsidiaries lost our suits challenging the change in the definition of “gross billings” and have appealed these decisions to the Brazilian Federal Supreme Court. In lightOn November 9, 2005, the full bench of thesethe Brazilian Federal Supreme Court ruled that the increase in PIS and COFINS tax basis under Law No. 9,718/98 was unconstitutional. Following this decision, the previous unfavorable decisions it is reasonably possible thatagainst us and these subsidiaries were vacated, and we will lose inand these proceedings.
We and somesubsidiaries won most of our subsidiaries alsosuits challenging the change in the definition of “gross billings.”
We lost suits challenging the increase in the COFINS tax rate and have appealed these decisions to the Brazilian Federal Supreme Court. Based on recent Brazilian Federal Supreme Court and Superior Court of Justice jurisprudence, we believe that our chances of success in these suits are remote. Two of our subsidiaries have voluntarily settled their COFINS liabilities under a special program created by Law No. 10,684/03, for which we have recorded a long-term liability in an aggregate amount of R$49.736.6 million at December 31, 2004.2007. As of February 2004, we and our subsidiaries have been paying COFINS in accordance with Law 10,833/03, which introduced new criteria for calculating COFINS.
We recorded a provision in accordance with Law No. 9,718/98 in respect of the proceedings that were not settled in an aggregate amount of R$320.650.6 million at December 31, 2004 and have deposited R$62.5 million of this amount in court.2007. For further information on our accounting treatment of these contingencies, see notes 9 and 17(iii)note 16(iii) to our consolidated and combined financial statements.
Offset of Tax on Net ProfitsCredits
From May through October 2000, OPP Química and Trikem offset their own federal tax obligations with IPI tax credits assigned by a third-party export trading company. In June 1999, the export trading company filed a motion for a writ of mandamus requiring the federal tax authority of the State of São Paulo to recognize these offsets, and in October 1999, the federal tax authority of the State of São Paulo issued offset support certificates in response to an injunction obtained by the export trading company. In September 1999, the export trading company filed a motion for a writ of mandamus requiring the federal tax authority of the State of Rio de Janeiro to recognize the recovery of IPI tax credits by the export trading company and the validity of their use in offsetting third-party tax obligations. In March 2001, the motion for a writ of mandamus filed by the export trading company in the State of São Paulo was dismissed without prejudice, confirming the administrative and jurisdictional authority of the State of Rio de Janeiro to rule on the export trading company’s tax credits.
Law No. 7713/88 imposed an 8.0% income In June 2005, the federal tax authority of the State of São Paulo issued regulations canceling the offset support certificates. Based on equity holders,these regulations, the Federal Revenue Office unit in Camaçari, Bahia sent collection letters to our company in June 2005. We presented notices of dispute against these collection letters, but the administrative authorities declined to process these notices.
On October 3, 2005, the Federal Supreme Court granted a non-appealable writ of mandamus to the export trading company, confirming the export trading company’s right to use its IPI tax on net profits, which was calculated on net profits recorded by companies in which such holders own equitycredits from all its exports and was assessed even when the net profits have not been distributed to those equity holders. Weavailability of these IPI tax credits for offsetting third-party obligations. As a result, we believe that Law No. 7713/88 violates Article 43our use of the Brazilian tax code, which provides that income tax may be assessed only at the moment when the equity holder effectively receives or is entitled to receive income.
On these grounds, we filed a lawsuit in 1997 against the Brazilian government seeking a refund of, or the rightexport trading company’s IPI credits to offset otherour federal taxes with,has been confirmed and that the tax on net profitsassessment made by the Federal Revenue Office unit in Camaçari, Bahia is not due. In addition and notwithstanding the writ of mandamus granted to the export trading company, we believe that we overpaidthe statue of limitations has expired with respect to the 1990 and 1991federal taxes offset against the IPI tax years, which at December 31, 2004 totaled approximately R$68.0 million. We deposited a portion of this amount with the court and have used this amount to offset our PIS and COFINS liabilities. In March 2002, the Regional Federal Court recognized our right to use these overpaid amounts to offset other taxes, as adjusted for inflation and including interest accrued on these amounts at the SELIC rate. The Brazilian government filed a special appeal before the Superior Court of Justice, which decided the case in favor of our company. Based on the decisioncredits of the Superior Court of Justice, we have petitioned the Regional Federal Court, requesting the refund of our judicial depositsexport trading company and the nullification of the deficiency notices issuedcan no longer be claimed by the tax authorities with respectauthorities.
156
In December 2005, the Federal Revenue Office unit in Camaçari, Bahia assessed past-due federal tax liabilities of R$276.6 million against our company related to such amounts.our alleged undue offset of federal taxes. In January 2006, we were ordered to post bond in aid of execution of the tax claim made by the Federal Revenue Office unit in Camaçari, Bahia, and we posted this bond in the form of an insurance policy.
We and the export trading company subsequently commenced judicial and administrative proceedings to defend the lawfulness and validity of those offsetting procedures. We believe that it is probable that we will prevail in these judicial and administrative proceedings in light of our view of the validity and liquidity of those credits as confirmed in a special audit conducted by the federal tax authority of the State of Rio de Janeiro. In the event that we are unsuccessful in all of these judicial and administrative proceedings, pursuant to the agreement under which the export trading company assigned the IPI tax credits to OPP Química and Trikem, we will be entitled to full recourse against the export trading company concerning all amounts we are required to pay to the National Treasury.
Other Tax Proceedings
We our subsidiaries and our affiliates are involved in several other judicial and administrative proceedings regarding withholding taxes, corporate income taxes(Imposto de Renda da Pessoa Jurídica),the ICMS, the tax
on financial transactions (Imposto Sobre Operações Financeiras), monetary adjustments, the Social Investment FundIntegration Program (FundoPrograma de InvestimentoIntegração Social), compulsory loans to Eletrobrás and other issues related to tax matters. Some of these disputes involve substantial amounts, such as the action filed by Copesul seeking the right to deduct monetary adjustment losses incurred in 1990 from the calculation basis of the corporate income tax and the Social Contribution on Net Income.amounts.
Labor Proceedings
Clause Four—“Cláusula Quarta”
Our company and other companies in the Northeastern Complex enter into annual collective bargaining agreements with the petrochemical workers’ union. The collective bargaining agreement that was valid between September 1989 and August 1990 required employers to pay workers monthly cost of living adjustments equal to 84.3% of the consumer price index (Índice de Preços ao Consumidor), or IPC, and prohibited the substitution of the IPC by another index with lower values.
In March 1990, the Brazilian government introduced an economic plan known as the “Collor Plan,” named after the then-President of Brazil. The Collor Plan provided that cost of living adjustments in wages could be based on other indices but not on the IPC. Based on judicial precedent, we interpreted the Collor Plan as prohibiting wage increases based on the IPC, which interpretation was contrary to the terms of the collective bargaining agreements in effect at the time. The petrochemical employers’ union filed a lawsuit against the petrochemical workers’ union, seeking to confirm that the cost of living adjustment indices provided in the Collor Plan preempted the conflicting provisions in the collective bargaining agreements. The Regional Labor Court ruled in favor of the workers’ union, and the decision was later modified in part on appeal to the Superior Labor Court. In 1998, the employers’ union filed an extraordinary appeal to the Brazilian Federal Supreme Court.
The Brazilian Federal Supreme Court initially held in favor of the workers’ union, but reversed its decision in December 2002 and held that a private collective bargaining agreement cannot preempt federal law, particularly a law that related to Brazilian public policy. In 2003, the workers’ union requested reconsideration of this decision. The Brazilian Federal Supreme Court grantedaccepted the workers’ union’s request for reconsideration, but on May 31, 2005, the Brazilian Federal Supreme Court unanimously reaffirmed its December 2002 decision and dismissed the workers’ union’s appeal.
On October 24, 2005, the workers’ union filed a divergence appeal to the Brazilian Federal Supreme Court, requesting the resolution of conflict between the decisions given by the Brazilian Federal Supreme Court under this proceeding and prior decisions given by the another panel of the Brazilian Federal Supreme Court. The Brazilian Federal Supreme Court has agreed to consider this appeal, but has not yet issued a decision. However, the Brazilian attorney general has filed a brief in this matter in November 2006 supporting the position of the employers’ union.
157
OtherEmployment and Occupational Health and Safety Proceedings
In addition,At December 31, 2007, we and our subsidiaries arewere involved in approximately 1,000 labor lawsuits that involve claims totaling1,400 employment and occupational health and safety proceedings as to which the total amount claimed was approximately R$54.0 million at December 31, 2004.344.8 million. We have deposited R$11.34.3 million of this amount in court and have established a provision for labor contingenciesthese claims in an aggregate amount of R$10.925.0 million at December 31, 2004.
Occupational Health and Safety Proceedings
2007. We are party to 122 occupational health and safety proceedings as to which the total amount claimed is approximately R$89 million. As we believe that the risk of losing these proceedings is possible and not probable, we have not established a provision in respect of these proceedings and do not believe that these proceedings will have a material adverse effect on our business, financial condition or operations.
Other Proceedings
We (through Trikem prior to its merger into our company) are involvedAt December 31, 2007, we were a defendant in threetwo civil suits filed by one of oura former distributors,caustic soda distributor, its controlling shareholder and a former transporter for breach of a caustic soda distribution agreement. The plaintiffsdamages claimed in these suits are seeking damages in an aggregate amount oftotaled R$168.327.5 million at December 31, 20042007 (monetarily adjusted). We prevailed in one of these cases in trial court, which the plaintiff appealed. This appeal and the remainingThese suits are pending. We believe that we will possibly prevail in these suits.
We have also filed a claim in the amount of R$1.2 million against this distributor in its pending bankruptcy proceeding. The bankruptcy court has initially accepted our claim.
We and our subsidiary Polialden are parties to certain proceedings brought by some preferred shareholders of Braskem, Polialden and Politeno which we do not believe will have a material adverse effect on our business, financial condition or results of operations.
Dividends And Dividend Policy
Payment of Dividends
Our dividend distribution policy has historically included the distribution of periodic dividends, based on quarterlyannual balance sheets approved by our board of directors. When we pay dividends on an annual basis, they are declared at our annual shareholders’ meeting, which we are required by the Brazilian Corporation Law and our by-laws to hold by April 30 of each year. When we declare dividends, we are generally required to pay them within 60 days of declaring them unless the shareholders’ resolution establishes another payment date. In any event, if we declare dividends, we must pay them by the end of the fiscal year for which they are declared. Under Article 9 of Law 9,249/95 and our bylaws, we also may pay interest attributable to shareholders’ equity as an alternative form of dividends upon approval of our board of directors. For a more detailed description of interest attributable to shareholders’ equity, see “—Payment of Dividends and Interest Attributable to Shareholders’ Equity—Interest Attributable to Shareholders’ Equity.”
The following table sets forth the dividends and/or interest attributable to shareholders’ equity paid to holders of our common shares, class A preferred shares and class B preferred shares since 20002001 inreaisand in U.S. dollars translated fromreaisat the commercial market selling rate in effect as of the payment date.
| Nominal Brazilian Currency per | US$ equivalent per | |||||||||||||
Year | Payment Date | Common shares | Class A Preferred Shares | Class B Preferred Shares | Common shares | Class A Preferred Shares | Class B Preferred Shares | |||||||
2000 | February 22, 2000 | 0.21 | 0.13 | 0.21 | 0.12 | 0.12 | 0.07 | |||||||
| May 23, 2000 | 0.21 | 0.21 | 0.21 | 0.11 | 0.11 | 0.11 | ||||||||
| August 22, 2000 | 0.21 | 0.21 | 0.21 | 0.12 | 0.12 | 0.12 | ||||||||
| November 21, 2000 | 0.21 | 0.21 | 0.09 | 0.11 | 0.11 | 0.05 | ||||||||
2001 | February 20, 2001 | 0.21 | 0.21 | — | 0.11 | 0.11 | — | |||||||
| May 20, 2001 | 0.14 | 0.14 | 0.14 | 0.06 | 0.06 | 0.06 | ||||||||
| August 20, 2001 | 0.14 | 0.14 | 0.14 | 0.06 | 0.06 | 0.06 | ||||||||
| November 20, 2001 | 0.14 | 0.14 | 0.14 | 0.06 | 0.06 | 0.06 | ||||||||
2002 | February 25, 2002 | — | 0.08 | 0.08 | — | 0.04 | 0.04 | |||||||
| May 20, 2002 | — | 0.13 | 0.13 | — | 0.05 | 0.05 | ||||||||
2005 | April 12, 2005(1) | 0.28 | — | — | 0.11 | — | — | |||||||
| Nominal Brazilian Currency per | US$ equivalent per | |||||||||||||
| Class A | Class B | Class A | Class B | |||||||||||
| Common | Preferred | Preferred | Common | Preferred | Preferred | |||||||||
| Year | Payment Date | shares | Shares | Shares | shares | Shares | Shares | |||||||
| 2005 | April 12, 2005(1) | R$0.56 | R$0.56 | R$0.56 | US$0.22 | US$0.22 | US$0.22 | |||||||
| 2006 | April 18, 2006(2) | 0.90 | 0.90 | 0.56 | 0.42 | 0.42 | 0.26 | |||||||
| 2007 | April 9, 2007(3) | — | 0.16 | 0.16 | — | 0.07 | 0.07 | |||||||
| 2008 | April 7, 2008(4) | 0.64 | 0.64 | 0.64 | 0.38 | 0.38 | 0.38 | |||||||
| (1) | |
| (2) | Represents interest attributable to shareholders’ equity of R$0.75 (US$0.35) per common share, R$0.75 (US$0.35) per class A preferred share and R$0.56 (US$0.26) per class B preferred share, plus dividends of R$0.15 (US$0.07) per common share and R$0.15 (US$0.07) per class A preferred share. |
158
| (3) | Represents dividends of R$0.16 (US$0.07) per class A preferred share and R$0.16 (US$0.07) per class B preferred share. |
| (4) | Represents dividends of R$0.64 (US$0.38) per common share, R$0.64 (US$0.38) per class A preferred share and R$0.64 (US$0.38) per class B preferred share. |
Amounts Available for Distribution
The following discussion summarizes the principal provisions of the Brazilian Corporation Law and our by-lawsbylaws relating to the distribution of dividends, including interest attributable to shareholders’ equity.
Calculation of Adjusted Net Profits
At each annual shareholders’ meeting, our board of directors is required to recommend how to allocate our net profits for the preceding fiscal year, which recommendation our board of executive officers initially submits to our board of directors for approval. This allocation is subject to approval by our common shareholders. The Brazilian Corporation Law defines “net profits” for any fiscal year as our net income after income taxes for that fiscal year, net of any accumulated losses from prior fiscal years and any amounts allocated to employees’ participation in our net profits in that fiscal year. Under the Brazilian Corporation Law, our adjusted net profits available for distribution are equal to our net profits in any fiscal year, reduced by amounts allocated to our legal reserve and other applicable reserves, and increased by any reversals of reserves that we constituted in prior years.
Our calculation of net profits and allocations to reserves for any fiscal year are determined on the basis of financial statements prepared in accordance with Brazilian GAAP.
Reserve Accounts
Under the Brazilian Corporation Law and our by-laws, we are required to maintain a legal reserve. In addition, we are permitted by the Brazilian Corporation Law to establish the following discretionary reserves:
Allocations to each of these reserves (other than the legal reserve) are subject to approval by our common shareholders voting at our annual shareholders’ meeting.
The Brazilian Corporation Law provides that the legal reserve and the tax incentive investment reserve may be credited to shareholders’ equity or used to absorb losses, but these reserves are unavailable for the payment of distributions in subsequent years. The amounts allocated to the other reserves may be credited to shareholders’ equity and used for the payment of distributions in subsequent years.
Legal Reserve Account
Under the Brazilian Corporation Law and our by-laws, we must allocate 5% of our net profits for each fiscal year to our legal reserve until the aggregate amount of our legal reserve equals 20% of our paid-in capital. However, we are not required to make any allocations to our legal reserve in a fiscal year in which our legal reserve, when added to our other reserves, exceeds 30% of our shareholders’ equity. At December 31, 2004,2007, we had a zero balance of R$100.0 million in our legal reserve account.
159
Capital Reserve Accounts
Under the Brazilian Corporation Law, we are also permitted to record a capital reserve that may be used only (1) to absorb losses which exceed retained earning and profit reserves as defined in the Brazilian Corporation Law, and (2) to redeem or repurchase share capital and/or participation certificates, (3) to increase our capital, or (4) if specified in our by-laws (which currently do not so specify), to pay preferred share dividends. Amounts allocated to our capital reserves are unavailable for the payment of distributions and are not
taken into consideration for purposes of determining the mandatory distributable amount. At December 31, 2004,2007, we had a balance of R$344.8458.1 million in our capital reserve accounts.
Mandatory Distributions
As permitted by the Brazilian Corporation Law, our by-laws specify that 25% of our adjusted net profits for each fiscal year must be distributed to shareholders as dividends or interest attributable to shareholders’ equity. We refer to this amount as the mandatory distributable amount.
Under the Brazilian Corporation Law, the amount by which the mandatory distributable amount exceeds the “realized” portion of net income for any particular year may be allocated to the unrealized income reserve, and the mandatory distribution may be limited to the “realized” portion of net income. The “realized” portion of net income is the amount by which our net income exceeds the sum of (1) our net positive results, if any, from the equity method of accounting for earnings and losses of our subsidiaries and certain associated companies, and (2) the profits, gains or income obtained on transactions maturing after the end of the following fiscal year. As amounts allocated to the unrealized income reserve are realized in subsequent years, such amounts must be added to the dividend payment relating to the year of realization.
In addition to the mandatory distributable amount, our board of directors may recommend that holders of our common shares approve the payment of additional distributions from other funds legally available for distribution.distributions. Distributions made to holders of our class A preferred shares and our class B preferred shares are computed in determining whether we have paid the required mandatory distribution. We net any payment of interim distributions against the required mandatory distribution for that fiscal year.
As described under “Item 7. Major Shareholders and Related Party Transactions—Major Shareholders—Shareholders Agreements—Pension Funds Memorandum of Understanding,Agreements,” we have entered into an agreement with two of our shareholders that establishes as our dividend policy the distribution of at least 50% of our adjusted net profits during any relevant period, provided that we have established and maintained all necessary reserves for the efficient operation and development of our business.
Under our 9.25%12.50% Notes due 2005, our 10.625% Notes due 20072008 and our 11.75% Notes due 2014, we may not pay dividends in excess of two times the minimum dividends or interest attributable to shareholders’ equity payable under our by-laws or under applicable Brazilian law.
The Brazilian Corporation Law permits us to suspend the mandatory distribution if our board of directors reports to our annual shareholders’ meeting that the distribution would be incompatible with our financial condition at that time. Our fiscal council must approve any suspension of the mandatory distribution. In addition, our management must report the reasons of any suspension of the mandatory distribution to the Brazilian Securities Commission. We must allocate net profits not distributed by our company as a result of a suspension to a special reserve and, if not absorbed by subsequent losses, we must distribute these amounts as soon as our financial condition permits. In case our profits reserves, as defined in the Brazilian Corporation Law, exceed our share capital, the excess must be credited to shareholders’ equity or used for the payment of distributions.
Payment of Dividends and Interest Attributable to Shareholders’ Equity
We may pay the mandatory distributable amount as dividends or as interest attributable to shareholders’ equity, which is similar to a dividend but is deductible in calculating our income tax obligations. There are no restrictions on our ability to distribute dividends that have been lawfully declared under Brazilian law. However, as with other types of remittances from Brazil, the Brazilian government may impose temporary restrictions on remittances to foreign investors of the proceeds of their investments in Brazil, as it did for approximately six months in 1989 and early 1999, and on the conversion of Brazilian currency into foreign currencies, which could hinder or prevent the depositary from converting dividends into U.S. dollars and remitting these U.S. dollars abroad. See “Item 3. Key Information—Risk Factors—Exchange controls and restrictions on remittances abroad may adversely affect holders of the ADSsRisks Relating to Our Class A Preferred Shares and the underlying class A preferred shares”
160
Dividends
We are required by the Brazilian Corporation Law and by our by-laws to hold an annual shareholders’ meeting by April 30 of each year. At our annual shareholders’ meeting, our common shareholders may vote to declare an annual dividend. Our payment of annual dividends is based on our audited financial statements prepared for our preceding fiscal year.
Any holder of record of shares at the time that a dividend is declared is entitled to receive dividends. Under the Brazilian Corporation Law, we are generally required to pay dividends within 60 days after declaring them, unless the shareholders’ resolution establishes another payment date, which, in any case, must occur prior to the end of the fiscal year in which the dividend is declared.
Our board of directors may declare interim dividends based on the accrued profits recorded or the realized profits in our annual or semi-annual financial statements approved by our common shareholders. In addition, we may pay dividends from net income based on our unaudited quarterly financial statements. These quarterly interim dividends may not exceed the amounts included in our capital reserve accounts. We may set off any payment of interim dividends against the amount of the mandatory distributable amount for the year in which the interim dividends were paid.
Interest Attributable to Shareholders’ Equity
Brazilian companies, including our company, are permitted to pay interest attributable to shareholders’ equity as an alternative form of payment of dividends to our shareholders. These payments may be deducted when calculating Brazilian income tax and social contribution tax. The interest rate applied to these distributions generally cannot exceed the Long-Term Interest Rate for the applicable period. The amount of interest paid that we can deduct for tax purposes cannot exceed the greater of:
Any payment of interest attributable to shareholders’ equity to holders of common shares, preferred shares or ADSs, whether or not they are Brazilian residents, is subject to Brazilian withholding tax at the rate of 15%, except that a 25% withholding tax rate applies if the recipient is a resident of a tax haven jurisdiction. A tax haven jurisdiction is a country (i)(1) that does not impose income tax or whose income tax rate is lower than 20% or (ii)(2) which does not permit disclosure of the identity of shareholders of entities organized under its jurisdiction. See “Item 10. Additional Information—Taxation—Brazilian Tax Considerations—Taxation of Dividends.Considerations.” Under our by-laws, we may include the amount distributed as interest attributable to shareholders’ equity, net of any withholding tax, as part of the mandatory distributable amount.
Prescription of Payments
Our shareholders have three years to claim dividend distributions made with respect to their shares, as from the date that we distribute the dividends to our shareholders, after which any unclaimed dividend distributions legally revert to us. We are not required to adjust the amount of any distributions for inflation that occurs during the period from the date of declaration to the payment date.
161
Dividend Preference of Preferred Shares
Under our by-laws, our preferred shareholders are entitled to a minimum annual non-cumulative preferential dividend equal to 6% of theirpro ratashare of our capital before dividends may be paid to our common shareholders. If we declare a dividend in an amount that exceeds the preferential dividends due to our preferred
shareholders, our common shareholders are then entitled to receive distributions equivalent, on a per share basis, to the preferential dividend payable to our preferred shareholders. If any additional dividend amounts remain, our common shareholders and our class A preferred shareholders are entitled to receive the same amount per share. Our class B preferred shareholders, however, are not entitled to receive any additional dividend amounts after they have received the preferential dividend.
Significant Changes
Other than as otherwise disclosed in this annual report, no significant change has occurred since the date of the audited consolidated financial statements included in the annual report.
ITEM 9. THE OFFER AND LISTING
Markets for Our Equity Securities
The principal trading market for our common shares, class A preferred shares and class B preferred shares is the São Paulo Stock Exchange. Our common shares and class A preferred shares began trading on the São Paulo Stock Exchange on November 11, 1980, and our class B preferred shares began trading on the São Paulo Stock Exchange on August 19, 1983.
On December 21, 1998, ADSs representing our class A preferred shares began trading on The New York Stock Exchange. On December 31, 2004,2007, there were 15,115,6848,292,864 ADSs outstanding, representing 30,231,36816,585,728 class A preferred shares, or 12.6%9.08% of our outstanding class A preferred shares.
On October 8, 2003, we listed our class A preferred shares on the LATIBEX, a stock market for Latin American issuers that is quoted in euros on the Madrid Stock Exchange, under the symbol “XBRK.” Our class A preferred shares are traded on the LATIBEX in lots of one share.
At June 24, 2005,27, 2008, we had approximately 13,90019,213 shareholders, including onefour U.S. resident holderholders of our common shares, approximately 102108 U.S. resident holders of our class A preferred shares (including The Bank of New York, as depositary) and no U.S. resident holders of our class B preferred shares. At June 24, 2005,27, 2008, there were 72,000290,961 common shares, 46,374,68941,682,008 class A preferred shares (including class A preferred shares represented by ADSs), and no class B preferred shares held by U.S. resident holders.
Price History of Our Class A Preferred Shares and the ADSs
The tables below set forth the high and low closing sales prices for our class A preferred shares on the São Paulo Stock Exchange and the high and low closing sales prices for the ADSs on The New York Stock Exchange for the periods indicated.
| São Paulo Stock Exchange | New York Stock Exchange | |||||||
| Reaisper | ||||||||
| Class A Preferred Share | U.S. dollars per ADS | |||||||
| High | Low | High | Low | |||||
| 2003 | 15.63 | 1.85 | 11.70 | 1.10 | ||||
| 2004 | 31.68 | 9.36 | 25.48 | 6.18 | ||||
| 2005 | 31.84 | 16.16 | 25.82 | 14.57 | ||||
| 2006 | 18.95 | 9.97 | 18.24 | 9.15 | ||||
| 2007 | 18.19 | 12.34 | 19.27 | 11.56 | ||||
162
| São Paulo Stock Exchange | New York Stock Exchange | |||||||
| Reais per | ||||||||
| Class A Preferred Share | U.S. dollars per ADS | |||||||
| High | Low | High | Low | |||||
| 2006 | ||||||||
| First Quarter | 18.95 | 15.84 | 18.24 | 14.37 | ||||
| Second Quarter | 15.74 | 12.26 | 15.05 | 10.93 | ||||
| Third Quarter | 14.94 | 9.97 | 13.63 | 9.15 | ||||
| Fourth Quarter | 16.69 | 13.95 | 15.42 | 12.86 | ||||
| 2007 | ||||||||
| First Quarter | 15.55 | 12.34 | 15.04 | 11.56 | ||||
| Second Quarter | 17.22 | 14.44 | 17.59 | 14.14 | ||||
| Third Quarter | 18.19 | 15.15 | 19.27 | 15.10 | ||||
| Fourth Quarter | 17.24 | 13.42 | 19.11 | 14.55 | ||||
| 2008 | ||||||||
| Most Recent Six Months | ||||||||
| November 2007 | 18.19 | 13.42 | 19.27 | 14.55 | ||||
| December 2007 | 18.19 | 13.42 | 19.27 | 14.55 | ||||
| January 2008 | 18.19 | 12.01 | 19.27 | 13.77 | ||||
| February 2008 | 17.24 | 11.76 | 19.11 | 13.47 | ||||
| March 2008 | 17.24 | 11.76 | 19.11 | 13.47 | ||||
| April 2008 | 15.48 | 11.76 | 17.72 | 13.47 | ||||
| May 2008 | 15.48 | 11.76 | 18.03 | 13.47 | ||||
| June 2008 (1) | 15.19 | 11.76 | 18.03 | 13.47 | ||||
(1) Through June 27, 2008.
Source: Economática Ltda./ Bloomberg
| São Paulo Stock Exchange | New York Stock Exchange | |||||||
| Reais per | ||||||||
| Class A Preferred Share | U.S. dollars per ADS | |||||||
| High | Low | High | Low | |||||
2000 | 8.67 | 5.06 | 11.40 | 7.10 | ||||
2001 | 7.75 | 3.86 | 8.94 | 3.07 | ||||
2002 | 7.31 | 2.40 | 6.38 | 1.29 | ||||
2003 | 16.71 | 1.97 | 11.70 | 1.10 | ||||
2004 | 33.75 | 10.04 | 25.48 | 6.18 | ||||
| São Paulo Stock Exchange | New York Stock Exchange | |||||||
| Reais per | ||||||||
| Class A Preferred Share | U.S. dollars per ADS | |||||||
| High | Low | High | Low | |||||
2003 | ||||||||
First Quarter | 3.31 | 1.98 | 2.05 | 1.10 | ||||
Second Quarter | 5.19 | 2.85 | 3.60 | 1.67 | ||||
Third Quarter | 9.08 | 4.80 | 6.25 | 3.30 | ||||
Fourth Quarter | 16.71 | 8.95 | 11.70 | 6.20 | ||||
2004 | ||||||||
First Quarter | 20.13 | 15.75 | 14.63 | 10.75 | ||||
Second Quarter | 18.12 | 10.01 | 12.76 | 6.32 | ||||
Third Quarter | 23.79 | 14.23 | 16.54 | 9.12 | ||||
Fourth Quarter | 33.75 | 22.75 | 25.48 | 15.89 | ||||
2005 | ||||||||
First Quarter | 33.47 | 16.50 | 25.82 | 19.42 | ||||
Most Recent Six Months | ||||||||
December 2004 | 33.75 | 30.22 | 25.48 | 22.23 | ||||
January 2005 | 32.88 | 28.03 | 24.40 | 20.85 | ||||
February 2005 | 33.48 | 29.60 | 25.82 | 22.87 | ||||
March 2005 | 32.85 | 26.33 | 25.05 | 19.42 | ||||
April 2005 | 27.69 | 24.37 | 20.86 | 18.73 | ||||
May 2005 | 25.65 | 21.37 | 20.65 | 17.68 | ||||
On June 24, 2004,27, 2008, the closing sales price of:
The following table sets forth the average daily trading volume for our class A preferred shares on the São Paulo Stock Exchange and for the ADSs on The New York Stock Exchange for the periods indicated.
163
| Average Daily Trading Volume | ||||
| São Paulo Stock Exchange | New York Stock Exchange | |||
| Class A Preferred Shares | ADSs | |||
2003 | ||||
First Quarter | 296,956 | 13,344 | ||
Second Quarter | 326,164 | 22,870 | ||
Third Quarter | 424,960 | 36,828 | ||
Fourth Quarter | 422,528 | 29,322 | ||
2004 | ||||
First Quarter | 569,440 | 59,736 | ||
Second Quarter | 613,548 | 50,120 | ||
Third Quarter | 802,780 | 94,642 | ||
Fourth Quarter | 777,788 | 178,366 | ||
2005 | ||||
First Quarter | 970,760 | 224,456 | ||
| Average Daily Trading Volume | ||||
| São Paulo Stock Exchange | New York Stock Exchange | |||
| Class A Preferred Shares | ADSs | |||
| 2006 | ||||
| First Quarter | 1,521,282 | 302,466 | ||
| Second Quarter | 1,682,577 | 231,495 | ||
| Third Quarter | 1,712,119 | 191,306 | ||
| Fourth Quarter | 1,513,327 | 151,090 | ||
| 2007 | ||||
| First Quarter | 1,739,291 | 228,726 | ||
| Second Quarter | 1,706,671 | 257,047 | ||
| Third Quarter | 1,465,457 | 241,476 | ||
| Fourth Quarter | 1,499,592 | 200,838 | ||
| 2008 | ||||
| First Quarter | 1,406,760 | 235,978 | ||
Trading on the São Paulo Stock Exchange
Settlement of transactions conducted on the São Paulo Stock Exchange is effected three business days after the trade date without any adjustment for inflation. Delivery of and payment for shares is made through the facilities of the the Brazilian Clearing System (Companhia Brasileira de Liquidação e Custódia). The seller is ordinarily required to deliver the shares to the exchange on the second business day following the trade date.
The São Paulo Stock Exchange is significantly less liquid than The New York Stock Exchange and many other of the world’s major stock exchanges. While all of the outstanding shares of a listed company may trade on the São Paulo Stock Exchange, in most cases fewer than half of the listed shares are actually available for trading by the public. The remaining shares are often held by a single or small group of controlling persons or by governmental entities.
Trading on the São Paulo Stock Exchange by a holder not deemed to be domiciled in Brazil for Brazilian tax and regulatory purposes, or a non-Brazilian holder, is subject to certain limitations under Brazilian foreign investment regulations. With limited exceptions, non-Brazilians holders may trade on the São Paulo Stock Exchange only in accordance with the requirements of Resolution No. 2,689 of January 26, 2000 of the National Monetary Council. Resolution No. 2,689 requires securities held by non-Brazilian holders to be maintained in the custody of, or in deposit accounts with, financial institutions that are authorized by the Central Bank and the Brazilian Securities Commission. In addition, Resolution No. 2,689 requires non-Brazilian holders to restrict their securities trading to transactions on the São Paulo Stock Exchange or organized over-the-counter markets. With limited exceptions, non-Brazilian holders may not transfer the ownership of investments made under Resolution No. 2,689 to other non-Brazilian holders through private transactions. See “Item 10. Additional Information—Regulation of Foreign Investment.”
Regulation of Brazilian Securities Markets
The Brazilian securities markets are regulated by the Brazilian Securities Commission, which has authority over stock exchanges and the securities markets generally, by the National Monetary Council and by the Central Bank, which has, among other powers, licensing authority over brokerage firms and which regulates foreign investment and foreign exchange transactions. The Brazilian securities market is governed by Brazilian Law No. 6,385/76, as amended, and by the Brazilian Corporation Law and other Brazilian Securities Commission rulings and regulations.
Under the Brazilian Corporation Law, a company may be either public (companhia aberta), as we are, or closely held (companhia fechada). All public companies are registered with the Brazilian Securities Commission and are subject to periodic reporting requirements. A company registered with the Brazilian Securities Commission may have its securities traded on the Brazilian stock exchanges or in the Brazilian over-the-counter market. The shares of a listed company, like those of our company, also may be traded privately subject to certain limitations.
164
The Brazilian over-the-counter market consists of direct trades between persons in which a financial institution registered with the Brazilian Securities Commission serves as intermediary. No special application, other than registration with the Brazilian Securities Commission, is necessary for securities of a public company to be traded in this market. The Brazilian Securities Commission must receive notice of all trades carried out in the Brazilian over-the counter market by the respective intermediaries.
Trading of a company’s securities on the São Paulo Stock Exchange may be suspended in anticipation of a material announcement. A company must also suspend trading of its securities on international stock exchanges on which its securities are traded. Trading may also be suspended by a Brazilian stock exchange or the Brazilian Securities Commission, among other reasons, based on or due to a belief that a company has provided inadequate information regarding a material event or has provided inadequate responses to an inquiry by the Brazilian Securities Commission or the relevant stock exchange.
Brazilian Law No. 6,385/76, as amended, the Brazilian Corporation Law and regulations issued by the Brazilian Securities Commission provide for, among other things, disclosure obligations, restrictions on insider trading and price manipulation and protections for minority shareholders. However, the Brazilian securities markets are not as highly regulated and supervised as securities markets in the United States and some other jurisdictions. In addition, rules and policies against self-dealing or for preserving shareholder interests may be less well-defined and enforced in Brazil than in the United States, which may put holders of our class A preferred shares and the ADSs at a disadvantage. Corporate disclosures also may be less complete than for public companies in the United States and certain other jurisdictions.
São Paulo Stock Exchange Corporate Governance Standards
On December 11, 2000, the São Paulo Stock Exchange launched three new listing segments:
These new listing segments have been designed for the trading of shares issued by companies that voluntarily undertake to abide by corporate governance practices and disclosure requirements in addition to those already required under the Brazilian Corporation Law. The inclusion of a company in any of the new segments requires adherence to a series of corporate governance rules. These rules are designed to increase shareholders’ rights and enhance the quality of information provided by Brazilian corporations.
On February 13, 2003, we agreed to comply with Level 1. In becoming a Level 1 company, we agreed to:
To become a Level 2 company, a company must agree to the following additional provisions:
165
To be a company listed on the New Market, a company must have its share capital composed exclusively of common shares in addition to meeting the Level 1 and the Level 2 requirements. We have no current plans to propose to amend our share capital structure to provide solely for the issuance of common shares.
ITEM 10. ADDITIONAL INFORMATION
Description of Our Company’s Bylaws
The following is a summary of the material provisions of our by-laws and of the Brazilian Corporation Law. In Brazil, a company’s by-laws (estatuto social) is the principal governing document of a corporation (sociedade anônima).
General
General
Our registered name is Braskem S.A., and our registered office is located in the Municipality of Camaçari, State of Bahia, Brazil. Our registration number with the Brazilian Commercial Registry is No. 29300006939. We have been duly registered with the Brazilian Securities Commission under No. 4820 since December 18, 1978. Our principal place of business is in the Municipality of Camaçari, State of Bahia, Brazil. Our company has a perpetual existence.
At June 24, 2005,27, 2008, we have an authorizedhad outstanding share capital of 488,000,000R$5,361,655,888.67, equal to 522,885,593 total outstanding shares consisting of 175,680,000196,714,190 outstanding common shares, 307,440,000325,368,337 outstanding class A preferred shares and 4,880,000803,066 outstanding class B preferred shares.shares, including 1,669,000 class A preferred shares held in treasury. All of our outstanding share capital is fully paid. All of our shares are without par value. Under the Brazilian Corporation Law, the aggregate number of our non-voting and limited voting class A and class B preferred shares may not exceed two-thirds of our total outstanding share capital.
166
At June 24, 2005, we have outstanding share capital of R$3,402,968,293.84, equal to 362,523,671 total outstanding shares consisting of 120,860,099 outstanding common shares, 240,860,206 outstanding class A preferred shares and 803,366 outstanding class B preferred shares. All of our outstanding share capital is fully paid. All of our shares are without par value.
Corporate Purposes
Article 2 of our by-laws establishes our corporate purposes to include:
Board of Directors
Under the Brazilian Corporation Law, any matters subject to the approval of our board of directors can be approved by a simple majority of votes of the members present at a duly convened meeting, unless our by-laws otherwise specify. Under our by-laws, our board of directors may only deliberate if a majority of its members are present at a duly convened meeting. Any resolutions of our board of directors may be approved by the affirmative vote of a majority of the members present at the meeting, subject to veto rights of Petroquisa, Petros and Previ over resolutions of our board of directors relating to certain matters under the Petroquisa memorandum of understanding and the Pension Funds memorandum of understanding.Petrobras Shareholders’ Agreement. See “Item 7. Major Shareholders and Related Party Transactions—Major Shareholders—Shareholders Agreements—Petroquisa Memorandum of Understanding” and “—Pension Funds Memorandum of Understanding.Petrobras Shareholders’ Agreement.”
Election of Directors
The majority of the members of our board of directors are elected by the Odebrecht Group. In addition, any director appointed by a shareholder pursuant to a shareholders agreement is bound by the terms of such agreement. See “Item 7. Major Shareholders and Related Party Transactions—Major Shareholders— Shareholders Agreements.”
The members of our board of directors are elected at general meetings of shareholders for concurrent two-year terms.
Qualification of Directors
The Brazilian Corporation Law requires members of our board of directors to own shares of our company. However, there is no minimum share ownership or residency requirement to qualify for membership on our board of directors. Our by-laws do not require the members of our board of directors to be resident in Brazil. The Brazilian Corporation Law requires each of our executive officers to be residents of Brazil.
Fiduciary Duties and Conflicts of Interest
All members of our board of directors and their alternates owe fiduciary duties towards us and all of our shareholders.
Under the Brazilian Corporation Law, if one of our directors, their alternates or our executive officers has a conflict of interest with our company in connection with any proposed transaction, such director, alternate director or executive officer may not vote in any decision of our board of directors or of our board of executive officers, as the case may be, regarding such transaction and must disclose the nature and extent of his conflicting interest for inclusion in the minutes of the applicable meeting. However, if one of our directors is absent from a meeting of our board of directors, that director’s alternate may vote even if that director has a conflict of interest, unless the alternate director shares that conflict of interest or has another conflict of interest.
167
Any transaction in which one of our directors (including the alternate members) or executive officers may have an interest, including any financings, can only be approved on reasonable and fair terms and conditions that are no more favorable than the terms and conditions prevailing in the market or offered by third parties. If any such transaction does not meet this requirement, then the Brazilian Corporation Law provides that the transaction may be nullified and the interested director or executive officer must return to us any benefits or other advantages that he obtained from, or as result of, such transaction. Under the Brazilian Corporation Law and upon the request of a shareholder who owns at least 5.0% of our total share capital, our directors and executive officers must reveal to our shareholders at an ordinary meeting of our shareholders certain transactions and circumstances that may give rise to a conflict of interest. In addition, our company or shareholders who own 5.0% or more of our share capital may bring an action for civil liability against directors and executive officers for any losses caused to us as a result of a conflict of interest.
Compensation
Under our by-laws, our common shareholders approve the aggregate compensation payable to our directors, executive officers and members of our fiscal council. Subject to this approval, our board of directors establishes the compensation of its members and of our executive officers. See “Item 6. Directors, Senior Management and Employees—Compensation.”
Mandatory Retirement
Neither the Brazilian Corporation Law nor our by-laws establish any mandatory retirement age for our directors or executive officers.
Share Capital
Under the Brazilian Corporation Law, the number of our issued and outstanding non-voting shares or shares with limited voting rights, such as our class A preferred shares and class B preferred shares, may not exceed two-thirds of our total outstanding share capital.
Each of our common shares entitles its holder to one vote at our annual and extraordinary shareholders’ meetings. Holders of our common shares are not entitled to any preference in respect of our dividends or other distributions or otherwise in case of our liquidation.
Our class A preferred shares and class B preferred shares are non-voting, except in limited circumstances, and have priority over our common shares in the case of our liquidation. See “—Voting Rights” for information regarding the voting rights of our preferred shares, “—Liquidation” for information regarding the liquidation preferences of our preferred shares, and “Item 8. Financial Information—Dividends and Dividend Policy—Amounts Available for Distribution”Calculation of Adjusted Net Profits” and “—Dividend Preference of Preferred Shares” for information regarding the distribution preferences of our preferred shares.
Shareholders’ Meetings
Under the Brazilian Corporation Law, we must hold an annual shareholders’ meeting by April 30 of each year in order to:
168
In addition to the annual shareholders’ meetings, holders of our common shares have the power to determine any matters related to changes in our corporate purposes and to pass any resolutions they deem necessary to protect and enhance our development whenever our interests so require, by means of extraordinary shareholders’ meetings.
Under the Brazilian Corporation Law, the holders of our common shares have the power, among other powers, to vote at shareholders’ meetings to:
We convene our shareholders’ meetings, including our annual shareholders’ meeting, by publishing a notice in theDiário Oficial do Estado da Bahia,in at least one additional newspaper designated by our shareholders with general circulation in Bahia, where we maintain our registered office, and in at least one newspaper with general circulation in the City of São Paulo, where the São Paulo Stock Exchange, the principal securities market for our shares, is located. On the first call of any meeting, the notice must be published no fewer than three times, beginning at least 15 calendar days prior to the scheduled meeting date. The notice must contain the meeting’s place, date, time, agenda and, in the case of a proposed amendment to our by-laws, a description of the subject matter of the proposed amendment.
Our board of directors may convene a shareholders’ meeting. Under the Brazilian Corporation Law, shareholders’ meetings also may be convened by our shareholders as follows:
169
Each shareholders’ meeting is presided over by a president and secretary elected by the shareholders present at the meeting. A shareholder may be represented at a shareholders’ meeting by an attorney-in-fact appointed by the shareholder not more than one year before the meeting. The attorney-in-fact must be a shareholder, a member of our board of directors, a lawyer or a financial institution, and the power of attorney appointing the attorney-in-fact must comply with certain formalities set forth under Brazilian law. To be admitted to a shareholders’ meeting, a person must produce proof of his or her shareholder status or a valid power of attorney.
In order for a valid action to be taken at a shareholders’ meeting, shareholders representing at least one quarter of our issued and outstanding voting share capital must be present on first call. However, shareholders representing at least two-thirds of our issued and outstanding voting share capital must be present at a shareholders’ meeting to amend our by-laws. If a quorum is not present, our board of directors may issue a second call by publishing a notice as described above at least eight calendar days prior to the scheduled meeting. The quorum requirements do not apply to the second call, when the shareholders’ meetings shall be convened with the presence of shareholders representing any number of shares (subject to the voting requirements for certain matters described below). A shareholder without a right to vote may attend a shareholders’ meeting and take part in the discussion of matters submitted for consideration.
Voting Rights
Under the Brazilian Corporation Law and our by-laws, each of our common shares carries the right to vote at a shareholders’ meeting. Our preferred shares generally do not confer voting rights, except in limited circumstances described below. We may not restrain or deny any voting rights without the consent of the majority of the shares affected. Whenever the shares of any class of share capital are entitled to vote, each share is entitled to one vote.
Except as otherwise provided by law, resolutions of a shareholders’ meeting are passed by a simple majority vote of the holders of our common shares present or represented at the meeting, without taking abstentions into account. Under the Brazilian Corporation Law, the approval of shareholders representing at least a majority of our voting shares is required for the types of action described below, as well as, in the case of the first and second bullet points below, ratification by the majority of issued and outstanding shares of the affected class within one year from the shareholders’ meeting:
170
Decisions on the transformation of our company into another form of company require the unanimous approval of our shareholders, including the holders of our class A and class B preferred shares.
Our company is required to give effect to shareholders agreements that contain provisions regarding the purchase or sale of our shares, preemptive rights to acquire our shares, the exercise of the right to vote our shares or the power to control our company, if these agreements are filed with our headquarters in Camaçari. Brazilian Corporation Law obligates the president of any shareholder or board of directors meeting to disregard any vote taken by any of the parties to any shareholders agreement that has been duly filed with our company that violates the provisions of any such agreement. In the event that a shareholder that is party to a shareholders agreement (or a director appointed by such shareholder) is absent from any shareholders’ or board of directors’ meeting or abstains from voting, the other party or parties to that shareholders agreement have the right to vote the shares of the absent or abstaining shareholder (or on behalf of the absent director) in compliance with that shareholders agreement.
Under the Brazilian Corporation Law, neither our by-laws nor actions taken at a shareholders’ meeting may deprive any of our shareholders of certain specific rights, including:
Voting Rights of Minority Shareholders
Shareholders holding shares representing not less than 5.0% of our shares entitled to vote at our shareholders’ meeting have the right to request that we adopt a cumulative voting procedure. Under a cumulative voting procedure, each voting share shall have as many votes as there are positions of directors to be filled, and each shareholder may cast all of its votes for a single candidate or distribute them among various candidates. If the cumulative voting procedure is adopted, our controlling shareholders always retain the right to elect at least one member more than the number of members elected by the other shareholders, regardless of the total number of members of our board of directors. This procedure must be requested by the required number of shareholders at least 48 hours prior to a shareholders’ meeting.
Under the Brazilian Corporation Law, shareholders that are not controlling shareholders, but that together hold either:
171
have the right to appoint one member and an alternate to our board of directors at our shareholders’ meeting. If no group of our common or preferred shareholders meets the thresholds described above, shareholders holding preferred shares or common shares representing at least 10% of our total share capital are entitled to combine their holdings to appoint one member and an alternate to our board of directors. The shareholders seeking to exercise these minority rights must prove that they have held their shares for not less than three months preceding the shareholders’ meeting at which the director will be appointed. Until the annual shareholders meeting to be held in 2005, the director or directors appointed by our preferred shareholders as a group, or collectively with our common shareholders, will be chosen from a list of three names prepared by the Odebrecht Group, our controlling shareholder. Any directors appointed by the non-controlling shareholders have the right to veto for cause the selection of our independent registered public accounting firm.
In accordance with the Brazilian Corporation Law, the holders of preferred shares without voting rights or with restricted voting rights are entitled to elect one member and an alternate to our fiscal council in a separate election. Minority shareholders have the same right as long as they jointly represent 10% or more of the voting shares. The other shareholders with the right to vote may elect the remaining members and alternates, who, in any event, must number more than the directors and alternates elected by the holders of the non-voting preferred shares and the minority shareholders.
Voting Rights of Preferred Shares
Holders of our preferred shares are not entitled to vote on any matter, except with respect to the election of a member of our board of directors by preferred shareholders holding at least 10% of our total share capital, the election of a member of the fiscal council and in the limited circumstances described above and as provided below.
The Brazilian Corporation Law and our by-laws provide our preferred shares will acquire unrestricted voting rights after the third consecutive fiscal year that we fail to pay the minimum dividends to which our preferred shares are entitled. This voting right shall continue until the past due minimum dividend for any year in that three consecutive-year period is paid in full. Our preferred shareholders will also obtain unrestricted voting rights if we enter into a liquidation process.
Liquidation
We may be liquidated in accordance with the provisions of Brazilian law. In the event of our extrajudicial liquidation, a shareholders’ meeting will determine the manner of our liquidation, appoint our liquidator and our fiscal council that will function during the liquidation period.
Upon our liquidation, our preferred shares have a liquidation preference over our common shares in respect of the distribution of our net assets. In the event of our liquidation, the assets available for distribution to our shareholders would be distributed first to our preferred shareholders in an amount equal to theirpro ratashare of our legal capital, prior to making any distributions to our common shareholders. If the assets to be so distributed are insufficient to fully compensate our preferred shareholders for their legal capital, each of our preferred shareholders would receive apro rataamount (based on theirpro ratashare of our legal capital, excluding our common shares in such calculation) of any assets available for distribution.
Conversion Rights
Conversion Rights
Under our by-laws, the general shareholders’ meeting may authorize the conversion of our preferred class A shares into common shares by means of the affirmative vote of shareholders representing the majority of our common shares, which will establish:
172
Holders of our class B preferred shares are not permitted to convert their shares into common shares, but any such holder is permitted by our by-laws to convert its shares into our class A preferred shares. The ratio for any such conversion is two class B preferred shares for each class A preferred share.
Preemptive Rights
Under the Brazilian Corporation Law, each of our shareholders has a general preemptive right to subscribe for our shares or securities convertible into our shares in any capital increase, in proportion to the number of our
shares held by such shareholder. However, under our by-laws, the holders of our class B preferred shares do not have preemptive rights. In the event of a capital increase that would maintain or increase the proportion of our capital represented by our class A preferred shares, holders of our class A preferred shares would have preemptive rights to subscribe to newly issued class A preferred shares only. In the event of a capital increase that would reduce the proportion of our capital represented by our class A preferred shares, holders of our preferred shares would have preemptive rights to subscribe to any new class A preferred shares in proportion to the number of our shares that they hold, and to our common shares only to the extent necessary to prevent dilution of their interests in our total capital.
Under our by-laws, except when issuing voting shares or securities convertible into voting shares, our board of directors or our shareholders, as the case may be, may decide to reduce the term of preemptive rights or not to extend preemptive rights to our shareholders with respect to any issuance of our non-voting shares, debentures convertible into our shares or warrants made in connection with a public exchange made to acquire control of another company or in connection with a public offering or through a stock exchange. The preemptive rights are transferable and must be exercised within a period of at least 30 days following the publication of notice of the issuance of shares or securities convertible into our shares. Holders of the ADSs may not be able to exercise the preemptive rights relating to our class A preferred shares underlying their ADSs unless a registration statement under the Securities Act is effective with respect to those rights or an exemption from the registration requirements of the Securities Act is available. We are not obligated to file a registration statement with respect to the shares relating to these preemptive rights or to take any other action to make preemptive rights available to holders of the ADSs, and we may not file any such registration statement.
Redemption, Amortization, Tender Offers and Rights of Withdrawal
Our by-laws or our shareholders at a shareholders’ meeting may authorize us to use our profits or reserves to redeem or amortize our shares in accordance with conditions and procedures established for such redemption or amortization. The Brazilian Corporation Law defines “redemption” (resgate de ações) as the payment of the value of the shares in order to permanently remove such shares from circulation, with or without a corresponding reduction of our share capital. The Brazilian Corporation Law defines “amortization” (amortização) as the distribution to the shareholders, without a corresponding capital reduction, of amounts that they would otherwise receive if we were liquidated. If an amortization distribution has been paid prior to our liquidation, then upon our liquidation, the shareholders who did not receive an amortization distribution will have a preference equal to the amount of the amortization distribution in the distribution of our capital.
The Brazilian Corporation Law authorizes us to redeem shares not held by our controlling shareholders, if, after a tender offer effected as a consequence of delisting or a substantial reduction in the liquidity of our shares, our controlling shareholders increase their participation in our total share capital to more than 95%. The redemption price in such case would be the same price paid for our shares in any such tender offer.
The Brazilian Corporation Law and our by-laws also require the acquiror of control (in case of a change of control) or the controller (in case of delisting or a substantial reduction in liquidity of our shares) to make a tender offer for the acquisition of the shares held by minority shareholders under certain circumstances described below under “—Mandatory Tender Offers.” The shareholder can also withdraw its capital from our company under certain circumstances described below under “—Rights of Withdrawal.”
173
Mandatory Tender Offers
The Brazilian Corporation Law requires that if we are delisted or there is a substantial reduction in liquidity of our shares, as defined by the Brazilian Securities Commission, in each case as a result of purchases by our controlling shareholders, our controlling shareholders must effect a tender offer for acquisition of our remaining shares at a purchase price equal to the fair value of our shares taking into account the total number of our outstanding shares.
Our by-laws provide that all of our shares, including our class A preferred shares, would be entitled to such tag-along rights in the event that the control of our company is transferred, with all shares receiving the same price per share paid to the controlling shareholders. If our controlling shareholders enter into a transaction which results in a change of control of our company, the controlling shareholders must include in the documentation of the transaction an obligation to effect a public offer for the purchase of all our common shares and preferred shares for the same price per share paid to the controlling shareholders. The tender offer must be submitted to the Brazilian Securities Commission within 30 days from the date of execution of the documents that provide for the change of control.
Our by-laws provide that no change of control will be deemed to occur if the party acquiring control is an existing member of the block of controlling shareholders and/or a signatory to an agreement among our shareholders governing the exercise of rights over the shares held by the controlling shareholders. Our by-laws also provide that the tag-along right will not apply in the event that the change of control occurs as a result of:
Rights of Withdrawal
The Brazilian Corporation Law provides that, in certain limited circumstances, a dissenting shareholder may withdraw its equity interest from our company and be reimbursed by us for the value of our common or preferred shares that it then holds.
This right of withdrawal may be exercised by the holders of the adversely affected common or preferred shares if we decide:
In addition, holders of our common and preferred shares may exercise their right of withdrawal if we decide to undertake any of the following actions:
174
Only shareholders who own shares on the date of publication of the first notice convening the relevant shareholders’ meeting or the press release concerning the relevant shareholders’ meeting is published, whichever is earlier, will be entitled to withdrawal rights.
Shareholders will not be entitled to this right of withdrawal if the shares of the entity resulting from a merger, incorporation, consolidation of our company or participation of our company in a group of companies
have minimal market liquidity and are dispersed among a sufficient number of shareholders. For this purpose, shares that are part of general indices representative of portfolios of securities traded in Brazil or abroad are considered liquid, and sufficient dispersion will exist if the controlling shareholder holds less than half of the class and type of the outstanding shares. In case of a spin-off, the right of withdrawal will only exist if there is a significant change in the corporate purpose or a reduction in the mandatory dividend.
The redemption of shares arising out of the exercise of any withdrawal rights would be made at book value per share, determined on the basis of their most recent audited balance sheet approved by our dissenting shareholders. However, if the shareholders’ meeting approving the action that gave rise to withdrawal rights occurred more than 60 days after the date of the most recent approved audited balance sheet, a shareholder may demand that its shares be valued on the basis of a balance sheet prepared specifically for this purpose. The right of withdrawal lapses 30 days after the date of publication of the minutes of the shareholders’ meeting that approved one of the matters described above. Our shareholders may reconsider any resolution giving rise to withdrawal rights within 10 days following the expiration date for such rights if we believe that the withdrawal of shares of dissenting shareholders would jeopardize our financial stability.
Liability of Our Shareholders for Further Capital Calls
Neither Brazilian law nor our by-laws require any capital calls. Our shareholders’ liability for capital calls is limited to the payment of the issue price of any shares subscribed or acquired.
Inspection of Corporate Records
Shareholders that own 5.0% or more of our outstanding share capital have the right to inspect our corporate records, including shareholders’ lists, corporate minutes, financial records and other documents of our company, if (1) we or any of our officers or directors have committed any act contrary to Brazilian law or our by-laws or (2) there are grounds to suspect that there are material irregularities in our company. However, in either case, the shareholder that desires to inspect our corporate records must obtain a court order authorizing the inspection.
Disclosures of Share Ownership
Brazilian regulations require that (1) each of our controlling shareholders, directly or indirectly, (2) shareholders who have elected members of our board of directors, and (3) any person or group of persons representing a person that has directly or indirectly acquired or sold an interest corresponding to at least 5% of the total number of our shares of any type or class to disclose its or their share ownership or divestment to the Brazilian Securities Commission and to the São Paulo Stock Exchange. In addition, a statement (fato relevante) containing certain required information must be published in theDiário Oficial do Estado da Bahia,at least one additional newspaper designated by our shareholders with wide circulation in Bahia, and in at least one newspaper with general circulation in the City of São Paulo, where the São Paulo Stock Exchange, the principal securities market for our shares, is located.
Our controlling shareholders, shareholders that appoint members of our board of directors or fiscal council and members of our board of directors, board of executive officers or fiscal council must file a statement of any change in their holdings of our shares with the Brazilian Securities Commission and the Brazilian stock exchanges on which our securities are traded.
175
Regulation of Foreign Investment
There are no restrictions on ownership or voting of our class A preferred shares by individuals or legal entities domiciled outside Brazil. However, the right to convert dividend payments and proceeds from the sale of class A preferred shares into foreign currency and to remit such amounts outside Brazil is subject to restrictions under foreign investment regulations, which generally require, among other things, the electronic registration of the relevant investment with the Central Bank.
Foreign investors may register their investment as foreign direct investments under Law No. 4,131/62 or as foreign portfolio investments under Resolution No. 2,689/00 of the National Monetary Council.
Under Resolution No. 2,689/00, foreign investors may invest in almost all financial assets and engage in almost all transactions available in the Brazilian financial and capital markets, provided that certain requirements are met. Resolution No. 2,689/00 affords favorable tax treatment to foreign portfolio investors who are not residents of a tax haven jurisdiction as defined by Brazilian tax laws (meaning a country that does not impose taxes, a country where the maximum income tax rate is lower than 20% or a country that restricts the disclosure of shareholder composition or the ownership of investments). Nevertheless, securities trading is restricted to transactions carried out on the stock exchanges or organized over-the-counter markets licensed by the Brazilian Securities Commission.
Foreign direct investors under Law No. 4,131/62 may sell their shares in both private or open market transactions, but these investors will generally be subject to less favorable tax treatment on gains with respect to our class A preferred shares or the ADSs.
A foreign portfolio investor under Resolution No. 2,689/00 must:
Securities and other financial assets held by foreign investors pursuant to Resolution No. 2,689/00 must be registered or maintained in deposit accounts or under the custody of an entity duly licensed by the Central Bank or the Brazilian Securities Commission.
A foreign direct investor under Law No. 4,131/62 must:
176
Resolution No. 1,927 of the National Monetary Council, which restated and amended Annex V to Resolution No. 1,289 of the National Monetary Council, provides for the issuance of depositary receipts in foreign markets in respect of shares of Brazilian issuers. We filed an application to have the ADSs approved under Resolution 1,927 by the Central Bank and the Brazilian Securities Commission, and we received final approval in January 1993.
At the time that ADSs representing our class A preferred shares were first listed on The New York Stock Exchange, the custodian obtained an electronic registration in the name of the depositary. In addition, after the global offering of our class “A” preferred shares and our ADSs in September 2004, the custodian and the
depositary amended this electronic registration to include the newly issued class “A” preferred shares and ADSs. Pursuant to this electronic registration, the custodian and the depositary are authorized to convert dividends and other distributions with respect to the class A preferred shares underlying by the ADSs into foreign currency and remit the proceeds outside Brazil.
If a holder of ADSs decides to exchange ADSs for the underlying class A preferred shares, the holder will be entitled to: (1) sell the class A preferred shares on the São Paulo Stock Exchange and rely on the depositary’s electronic registration for five business days from the date of exchange to obtain and remit U.S. dollars abroad upon the holder’s sale of our class A preferred shares; (2) convert its investment into a foreign portfolio investment under Resolution No. 2,689/00; or (3) convert its investment into a foreign direct investment under Law No. 4,131/62.
If a holder of ADSs wishes to convert its investment into either a foreign portfolio investment under Resolution No. 2,689/00 or a foreign direct investment under Law No. 4,131/62, it should begin the process of obtaining hisits own foreign investor registration with the Central Bank or with the Brazilian Securities Commission, as the case may be, in advance of exchanging the ADSs for class A preferred shares. If the holder of ADSs does not timely complete this process, the custodian will neither effect the conversion nor deliver the underlying class A shares, and will instruct the depositary to cancel the exchange and return the ADSs to the holder.
The custodian is authorized to update the depositary’s electronic registration to reflect conversions of ADSs into foreign portfolio investments under Resolution No. 2,689/00. If a holder of ADSs elects to convert its ADSs into a foreign direct investment under Law 4,131/62, the conversion will be effected by the Central Bank after receipt of an electronic request from the custodian with details of the transaction.
See “Item 10. Additional Information—“—Taxation—Brazilian Tax Considerations—Registered Capital”Considerations” for details on the determination of the registered capital that will be reflected in the electronic registration resulting from conversions.
If a foreign direct investor under Law No. 4,131/62 wishes to deposit its shares into the ADR program in exchange for ADSs, such holder will be required to present to the custodian evidence of payment of capital gains taxes. The conversion will be effected by the Central Bank after receipt of an electronic request from the custodian with details of the transaction. See “Item 10. Additional Information—“—Taxation—Brazilian Tax Considerations—Taxation of Gains in Brazil” and “—Registered Capital.”
Form and Transfer
Our preferred shares and common shares are in book-entry form, registered in the name of each shareholder or its nominee. The transfer of our shares is governed by Article 35 of the Brazilian Corporation Law, which provides that a transfer of shares is effected by our transfer agent, Banco Itaú S.A., by an entry made by the transfer agent in its books, upon presentation of valid written share transfer instructions to us by a transferor or its representative. When preferred shares or common shares are acquired or sold on a Brazilian stock exchange, the transfer is effected on the records of our transfer agent by a representative of a brokerage firm or the stock exchange’s clearing system. The transfer agent also performs all the services of safe-keeping of our shares. Transfers of our shares by a non-Brazilian investor are made in the same manner and are executed on the investor’s behalf by the investor’s local agent. If the original investment was registered with the Central Bank pursuant to foreign investment regulations, the non-Brazilian investor is also required to amend, if necessary, through its local agent, the electronic certificate of registration to reflect the new ownership.
177
The São Paulo Stock Exchange operates a central clearing system. A holder of our shares may choose, at its discretion, to participate in this system, and all shares that such shareholder elects to be put into the clearing system are deposited in custody with the Brazilian Clearing System (Companhia(Companhia Brasileira de Liquidação e
Custódia)dia) (through a Brazilian institution that is duly authorized to operate by the Central Bank and maintains a clearing account with the Brazilian Clearing System). Shares subject to the custody of the Brazilian Clearing System are noted as such in our registry of shareholders. Each participating shareholder will, in turn, be registered in the register of the Brazilian Clearing System and will be treated in the same manner as shareholders registered in our books.
Material Contracts
Material Contracts
We have not entered into any other material contracts, other than those described elsewhere in this annual report or entered into in the ordinary course of business.
Exchange Controls
There are no restrictions on ownership or voting of Braskem’s share capital stock by individuals or legal entities domiciled outside Brazil.
The right to convert dividend payments and proceeds from the sale of the Company’sour share capital stock into foreign currency and to remit such amounts outside Brazil is subject to restrictions under foreign investment legislation which generally requires, among other things, that the relevant investment have been registered with the Central Bank. Restrictions on the remittance of foreign capital abroad could hinder or prevent Banco Itaú S.A., or the Custodian, as custodian for the class A preferred shares represented by ADSs or holders who have exchanged ADSs for class A preferred shares from converting dividends, distributions or the proceeds from any sale of Preferred Shares into U.S. dollars and remitting such U.S. dollars abroad. Holders of the ADSs could be adversely affected by delays in, or refusal to grant any required government approval for conversions of Brazilian currency payments and remittances abroad of the class A preferred shares underlying the ADSs.
Resolution No. 1,927 of the National Monetary Council, which is the Amended and Restated Annex V to Resolution No. 1,289, or the Annex V Regulations, provides for the issuance of depositary receipts in foreign markets in respect of shares of Brazilian issuers. The Central Bank and the Brazilian Securities Commission have approved the ADSs under the Annex V Regulations. Accordingly, the proceeds from the sale of the ADSs by ADR holders outside Brazil are free of Brazilian foreign investment controls and holders of the ADSs will be entitled to favorable tax treatment. See “—Taxation—Brazilian Tax Considerations.”
A certificate of capital registration has been issued in the name of The Bank of New York, as depositary, or the Depositary, and is maintained by the Custodian on behalf of the Depositary. Pursuant to the certificate, the Custodian and the Depositary are able to convert dividends and other distributions with respect to the class A preferred shares represented by ADRs into foreign currency and remit the proceeds outside Brazil. In the event that a holder of ADRs exchanges ADRs for class A preferred shares, such holder will be entitled to continue to rely on the Depositary’s certificate of capital registration for only five business days after such exchange, following which such holder must seek to obtain its own certificateregistration of capital registrationforeign investment with the Central Bank.Bank (Electronic Registration Statement –Registro Declaratório Eletrônico – RDE). Thereafter, unless the class A preferred shares are held pursuant to the “Annex IV Regulations” of the National Monetary CouncilResolution nº 2.689/00 (portfolio investment) or Law nº 4.131/62 (direct investments) by a duly qualified investor, such holder may not be able to convert into foreign currency and remit outside Brazil the proceeds from the disposition of, or distributions with respect to, such class A preferred shares, and such holder generally will be subject to less favorable Brazilian tax treatment than a holder of ADRs. See “—Taxation—Brazilian Tax Considerations.”
We make cash distributions with respect to the class A preferred shares in Brazilian currency. Accordingly, exchange rate fluctuations may affect the U.S. dollar amounts received by the holders of the ADSs on conversion by the Depositary of such distributions into U.S. dollars for payment to holders of the ADSs. Fluctuations in the exchange rate betweenreaisand the U.S. dollar may also affect the U.S. dollar equivalent of thereaisprice of the class A preferred shares on the Brazilian stock exchanges.
178
Brazilian law provides that, whenever there is a serious imbalance in Brazil’s balance of payments or serious reasons to foresee such imbalance, temporary restrictions may be imposed on remittances of foreign capital abroad. For approximately six months in 1989 and early 1990, for example, to conserve Brazil’s foreign currency reserves, the Brazilian government froze all dividend and capital repatriations that were owed to foreign equity investors. These amounts were subsequently released in accordance with Brazilian Government directives. There can be no assurance that similar measures will not be taken by the Brazilian Government in the future.
For a description of the foreign exchange markets in Brazil, see “Item 3. Key Information—Selected Financial Information—Exchange Rates.”
Taxation
The following summary contains a description of the material Brazilian and U.S. federal income tax consequences of the purchase, ownership and disposition of class A preferred shares and ADSs, but it does not purport to be a comprehensive description of all of the tax considerations that may be relevant to a decision to purchase any such securities. In particular, for U.S. federal income tax purposes, this summary is applicable only to holders that hold class A preferred shares or ADSs as “capital assets” within the meaning of Section 1221 of the Internal Revenue Code of 1986, as amended, (the “Code”), and does not address the tax treatment of a holder that may be subject to special tax rules, such as financial institutions, insurance companies, real estate investment trusts, regulated investment companies, grantor trusts, tax-exempt entities, traders or dealers in securities or currencies, persons that will hold class A preferred shares or ADSs in a hedging transaction or as a position in a “straddle” or “conversion transaction” for U.S. federal income tax purposes, persons that have a “functional currency” other than the U.S. dollar, persons that will hold class A preferred shares or ADSs as compensation for the performance of services, persons liable for alternative minimum tax or estate and gift tax or persons that own or are treated as owning 10% or more of the voting shares or value of our company.
The summary is based upon the tax laws of Brazil and the United States and regulations thereunder and administrative and judicial interpretations thereof, in each case as in effect and available on the date of this annual report, which are subject to change (possibly with retroactive effect in the case of changes to U.S. tax laws and regulations thereunder and administrative and judicial interpretations thereof), and to differing interpretations. There is at present no income tax treaty between Brazil and the United States. This summary is also based upon the representations of the depositary and on the assumption that each obligation in the deposit agreement relating to the ADSs and any related documents will be performed in accordance with its terms.
The description below is not intended to constitute a complete analysis of all tax consequences relating to the acquisition, ownership and disposition of class A preferred shares or ADSs. Prospective purchasers of our class A preferred shares or ADSs are advised to consult their own tax advisors in respect of the consequences that the purchase, ownership or disposition of our class A preferred shares or ADS might trigger under the laws of Brazil, the United States or any other jurisdiction in light of their particular investment circumstances.
Brazilian Tax Considerations
The following discussion summarizes the material Brazilian tax consequences of the acquisition, ownership and disposition of class A preferred shares or ADSs by a holder that is not domiciled or resident in Brazil for purposes of Brazilian taxation and, in the case of a holder of class A preferred shares, which has registered its investment with the Central Bank, or in each case a non-Brazilian holder. The following discussion does not specifically address all of the Brazilian tax considerations applicable to any particular non-Brazilian holder, and each non-Brazilian holder should consult his or her own tax advisor concerning the Brazilian tax consequences of an investment in any of such securities.
Acquisition of ADSs or Class A Preferred Shares
The acquisition of ADSs or class A preferred shares by non-Brazilian holders is not a taxable event in Brazil. See “—Taxation of Gains Outside Brazil” for further information on the tax implications arising from the exchange of existing class A preferred shares for ADSs, as well as those arising from the exchange of ADSs for class A preferred shares.
Taxation of Dividends
Dividends paid with respect to income earned since January 1, 1996, including dividends paid in kind to the depositary in respect of our class A preferred shares underlying the ADSs or to a non-Brazilian holder in respect of class A preferred shares, are not subject to any withholding tax in Brazil.
Dividends paid from profits generated before January 1, 1996 may be subject to Brazilian withholding income tax at variable rates, according to the tax legislation applicable to each corresponding year.
179
Interest Attributable to Shareholders’ Equity
Distributions of interest attributable to our shareholders’ equity in respect of our class A preferred shares or the ADSs as an alternative form of dividends are subject to Brazilian withholding tax at the rate of 15% (or 25% in the case of a non-Brazilian holder located in a tax haven jurisdiction (as defined below)). Since 1997 and in accordance with Laws Nos. 9,249/95 and 9,430/96, we may deduct these distributions in calculating the amount of the Social Contribution on Net Income and the income taxes that we owe, provided that each such distribution is approved by our shareholders in a general meeting and complies with the limits established by Brazilian tax legislation.
Taxation of Gains Outside Brazil
Until December 31, 2003, the sale or other disposition of ADSs or class A preferred shares entered into by and between non-Brazilian holders outside Brazil was not subject to Brazilian income tax, as such a transaction did not involve payments by a person located in Brazil. Brazilian Law No. 10,833/03 provides that, commencing on February 1, 2004, “the acquiror, individual or legal entity resident or domiciled in Brazil, or the acquiror’s attorney-in-fact, when such acquiror is resident or domiciled abroad, shall be responsible for the retention and payment of the income tax applicable to capital gains under Article 18 of Law 9,249 of December 26, 1995 earned by the individual or legal entity resident or domiciled abroad who disposes of property located in Brazil.”
The Brazilian tax authorities have recently issued a normative instruction confirming that, pursuant to Law No. 10,833/03, these tax authorities intend to assess income tax on capital gains earned by non-Brazilian residents whose assets are located in Brazil. Holders of the ADSs outside of Brazil may have grounds to assert that Brazilian Law No. 10,833/03 does not apply to sales or other dispositions of ADSs as ADSs are not assets located in Brazil. However, the sale or other disposition of class A preferred shares abroad may be subject to the provisions of Brazilian Law No. 10,833/03. Any capital gains arising from sales or other dispositions outside Brazil would be subject to Brazilian income tax at the rate fromof 15% toor 25% if the investor is located in a tax haven jurisdiction. Brazilian Law No. 10,833/03 requires the purchaser of our class A preferred shares outside Brazil or its attorney-in-fact in Brazil to withhold the tax. A disposition of class A preferred shares can only occur abroad if any investor decides to cancel its investment in ADSs and register the underlying class A preferred shares as a direct foreign investment under Law No. 4,131/62.
Taxation of Gains in Brazil
The exchange of ADSs for class A preferred shares is not subject to Brazilian tax. A holder of the ADSs may exchange its ADSs for the underlying class A preferred shares, sell the class A preferred shares on a Brazilian stock exchange and remit abroad the proceeds of the sale within five business days from the date of exchange (in reliance on the depositary’s electronic registration), with no tax consequences.
Upon receipt of the underlying class A preferred shares in exchange of ADSs, a non-Brazilian investor will be entitled to register with the Central Bank the U.S. dollar value of such shares as a foreign portfolio investment
under Resolution No. 2,689/00. See “—Regulation of Foreign Investments” and “—Registered Capital.” The sale or disposition of class A preferred shares on a Brazilian stock exchange is exempt from capital gains tax, provided that such shares are held by a non- Brazilian holder as a foreign portfolio investment under Resolution No. 2,689/00. The preferential treatment afforded under Resolution 2,689 is not available to investors resident or domiciled in tax haven jurisdictions.
Upon receipt of the underlying class A preferred shares, a non-Brazilian holder is also entitled to register with the Central Bank the U.S. dollar value of such shares as a foreign direct investment under Law 4,131/62. See “—Regulation“Regulation of Foreign Investment” and “—Registered Capital.” A 15% capital gains tax is applicable to the sale or other disposition of preferred class A shares in Brazil where such shares are held by a non-Brazilian holder as a foreign direct investment and the transaction is performed outside a Brazilian stock exchange. If the non-Brazilian holder is domiciled in a tax haven jurisdiction, the income tax rate will be 25%.
If the sale or other disposition of such shares is carried out on a Brazilian stock exchange, the capital gains on the sale or disposition will be taxed at a rate of 15%. This rate applies to all transactions carried out on a Brazilian stock exchange by non-Brazilian holders regardless of whether or not they are domiciled in tax haven jurisdictions. In these transactions, the gain realized is calculated based on the amount registered with the Central Bank. As from January 1, 2005, a withholding tax of 0.005% will also be assessed on the sales price or other disposition value of shares sold or disposed of in transactions carried out on a Brazilian stock exchange. The withholding tax, to be offset against tax due on eventual capital gain, must be withheld by one of the following entities: (i)(1) the agent receiving the sale or disposition order from the client; (ii)(2) the stock exchange responsible for registering the transactions; or (iii)(3) the entity responsible for the settlement and payment of the transactions.
180
The deposit of class A preferred shares in exchange for ADSs is not subject to Brazilian tax, provided that these shares are held by the non-Brazilian holder as a foreign portfolio investment under Resolution No. 2,689/00. In the event our class A preferred shares are held by the non-Brazilian holder as a foreign direct investment under Law No. 4,131/62, the deposit of these shares in exchange for ADSs is subject to payment of Brazilian capital gains tax at the rate of 15% (25% in the case of a non-Brazilian holder located in a tax haven jurisdiction).
The current preferential treatment for non-Brazilian holders of ADSs and non-Brazilian holders of class A preferred shares under Resolution No. 2,689/00 may not continue in the future.
Any exercise of preemptive rights relating to our class A preferred shares will not be subject to Brazilian taxation. Gains on the sale or assignment of preemptive rights relating to our class A preferred shares by the depositary may be subject to Brazilian taxation. Tax authorities may attempt to tax such gains even when the sale or assignment of such rights takes place outside Brazil, based on the provisions of Law No. 10,833/03. These authorities may allege that the preemptive rights relate to assets located in Brazil (the class A preferred shares) and demand payment of capital gains tax at the rate of 15% or 25% (if the beneficiary of the payments is resident of a tax haven jurisdiction). If the preemptive rights are assigned or sold in Brazil, capital gains tax will apply at a rate of 15% (25% in the case of a non-Brazilian holder located in a tax haven jurisdiction). Sales or assignments of preemptive rights effected on Brazilian stock exchanges are exempt from income tax, provided that such preemptive rights relate to shares registered as a foreign portfolio investment under Resolution No. 2,689/00.
Other Brazilian Taxes
There are no Brazilian inheritance, gift or succession taxes applicable to the ownership, transfer or disposition of class A preferred shares or ADSs by a non-Brazilian holder except for gift and inheritance taxes which are levied by some states of Brazil on gifts made or inheritances bestowed by individuals or entities not resident or domiciled in Brazil or domiciled within the state to individuals or entities resident or domiciled within such state in Brazil. There are no Brazilian stamp, issue, registration or similar taxes or duties payable by holders of class A preferred shares or ADSs.
Under Decree 4,4946,306 of December 3, 2002,14, 2007, the amount inreais resulting from the conversion of the proceeds received by a Brazilian entity from a foreign investment in the Brazilian securities market (including those in connection with the investment in our class A preferred shares or ADSs and those made under the provisions of Resolution No. 2,689/00 of the National Monetary Council) is subject to the IOF transaction tax. The IOF tax rate for most of these transactions is currently 0%, but0.38% . Foreign exchange transactions in connection with the investment in our class A preferred shares made under the provisions of Resolution No. 2,689/00 of the National Monetary Council, within a stock, securities or futures exchange environment are currently not subject to the IOF tax. Transactions of same nature performed outside stock, securities or futures exchange environment may be subject to the IOF tax at a 1.5% rate. Remittances of dividends and interest on net equity made by companies whose shares are traded on the BOVESPA to non-Brazilian holders are not subject to the IOF tax. The Minister of Finance has the legal power to increase the rate to a maximum of 25%. Any such increase will be applicable only prospectively.
IOF is also assessed on transactions executed on a stock exchange. As of the date hereof, Article 33, Paragraph 2, of Decree No. 4,4946,306 imposes an IOF tax on such transactions at a 0% rate. The Minister of Finance is empowered to establish the applicable IOF tax rate. Under Law 8,894 of June 21, 1994, such IOF tax rate may be increased at any time to a maximum of 1.5% per day, but any such increase will only be applicable to transactions occurring after such increase becomes effective.
181
Until December 31, 2007, CPMF tax iswas levied at a rate of 0.38% on all fund transfers in connection with financial transactions in Brazil. Payments of dividends on our class A preferred shares and the ADSs arewere subject to the CPMF tax. However, only our company is liable forat the CPMF tax on its dividends, which are payable without reduction for this tax. The CPMF tax was scheduled to expire in December 2004, but Amendment No. 42 toend of 2007, the Brazilian Constitution extendedCongress rejected the CPMF tax through December 31, 2007. Since July 12, 2002, stock exchange transactions have been exempted from the CPMF tax. On July 13, 2004, the Brazilian government enacted Law No. 10,892, which establishes that, as from October 1, 2004, debits ofreais from deposit bank accounts exclusively opened for investments in fixed and variable income financial assets (“conta corrente de depósito para investimento”) will not be subject to the CPMF assessment. There can be no assurance that the Brazilian government will not extend the paymentextension of the CPMF tax, beyond 2007, or will convert it intoand, as of January 1, 2008, the CPMF was extinguished. The Federal Government is considering establishing a new permanent tax.tax with the same characteristics of CPMF, but no bill has yet been presented to Congress
Residents of Tax Haven Jurisdictions
The general rules establish that any income, capital gains or earnings received by a beneficiary resident in a tax haven jurisdiction is subject to income tax at the rate of 25%. A tax haven is a location where no income tax is imposed or where its maximum applicable rate is lower than 20%. A country will also be deemed a tax haven if its internal laws require that the identity of shareholders or members of corporate entities organized and existing under the jurisdiction of such country be kept secret or otherwise not be disclosed. Tax benefits granted through the provisions of Resolution No. 2,689/00 and Annex V to Resolution No. 1,289/87 are not applicable to residents in a so-called tax haven jurisdiction. In this case, such investors shall be taxed according to the same rules that are applicable to Brazilian residents. Dividends are not affected by tax haven jurisdiction rules.
Registered Capital
The amount of an investment in class A preferred shares held by a non-Brazilian holder as a foreign direct investment under Law No. 4,131/02 or a foreign portfolio investment under Resolution No. 2,689/00 or in ADSs held by the depositary representing such holder, as the case may be, is eligible for registration with the Central Bank; such registration (the amount so registered is referred to as “registered capital”) allows the remittance outside Brazil of foreign currency, converted at the commercial market rate, acquired with the proceeds of distributions on, and amounts realized with respect to disposition of, such class A preferred shares. The registered capital for class A preferred shares purchased in the form of ADSs, or purchased in Brazil and deposited with the depositary in exchange for an ADS, is equal to their purchase price in U.S. dollars paid by the purchaser. The registered capital for class A preferred shares that are withdrawn upon surrender of ADSs is the U.S. dollar equivalent of (1) the average price of our class A preferred shares on the Brazilian stock exchange on which the greatest number of such class A preferred shares was sold on the day of withdrawal, or (2) if no class A preferred shares were sold on such day, the average price of class A preferred shares that were sold in the fifteen trading sessions immediately preceding such withdrawal. The U.S. dollar value of our class A preferred shares is determined on the basis of the average commercial market rates quoted by the Central Bank on such date (or, if the average price of class A
preferred shares is determined under clause (2) of the preceding sentence, the average of such average quoted rates on the same fifteen dates used to determine the average price of our class A preferred shares).
A non-Brazilian holder of class A preferred shares may experience delays in effecting the registration of registered capital, which may delay remittances abroad. Such a delay may adversely affect the amount, in U.S. dollars, received by the non-Brazilian holder. See “—Regulation of Foreign Investment” and “Item 3. Key Information—Risk Factors—Exchange controls and restrictions on remittances abroad may adversely affect holders of the ADSsRisks Relating to Our Class A Preferred Shares and the underlying class A preferred shares” and “—Regulation of Foreign Investment.ADSs.”
U.S. Federal Income Tax Considerations
The following is a discussion of the material U.S. federal income tax consequences ofthat may be relevant with respect to the acquisition, ownership and disposition of our class A preferred shares or ADSs, which are evidenced by American Depositary Receipts. This description addresses only the U.S. federal income tax considerations of U.S. holders (as defined below) that will hold class A preferred shares or ADSs as capital assets. This description does not address tax considerations applicable to holders that may be subject to special tax rules, such as banks, financial institutions, insurance companies, real estate investment trusts, grantor trusts, regulated investment companies, dealers or traders in securities or currencies, tax-exempt entities, pension funds, persons that received our class A preferred shares or ADSs pursuant to an exercise of employee stock options or rights or otherwise as compensation for the performance of services, persons that will hold our class A preferred shares or ADSs as a position in a “straddle” or as a part of a “hedging”, “conversion” or other risk reduction transaction for U.S. federal income tax purposes, persons that have a “functional currency” other than the U.S. dollar, persons that will own our class A preferred shares or ADSs through partnerships or other pass through entities, holders subject to the alternative minimum tax, certain former citizens or long-term residents of the United States or holders that own (or are deemed to own) 10% or more (by voting power ) of our shares.
182
This description does not address any state, local or non-U.S. tax consequences of the acquisition, ownership and disposition of our class A preferred shares or ADSs. Moreover, this description does not address the consequences of any U.S. federal tax other than income tax, including but not limited to the U.S. federal estate and gift taxes. This description is based on (i) the Internal Revenue Code of 1986, as amended (the “Code”), existing, proposed and temporary United States Treasury Regulations and judicial and administrative interpretations thereof, in each case as in effect and available on the date of this annual report and (ii), in part, on the representations of the depositary and the assumption that each obligation in the deposit agreement and any related agreement will be performed in accordance with its terms. All of the foregoing are subject to change, which change could apply retroactively and could affect the tax consequences described below.
As used below, a “U.S. holder” is a beneficial owner of a class A preferred share or ADS that is, for U.S. federal income tax purposes, (1)(i) an individual citizen or resident of the United States, (2)(ii) a partnership or corporation organized under the laws of the United States, any state thereof or the District of Columbia, (3)(iii) an estate the income of which is subject to U.S. federal income taxation regardless of its source, or (4)(iv) a trust if (a) a court within the United States is able to exercise primary supervision over its administration and (b) one or more United States persons have the authority to control all of the substantial decisions of such trust. As used below, a “Non-U.S. holder” is a beneficial owner of a class A preferred share or ADS that is notneither a U.S. holder.holder nor a partnership (or other entity treated as a partnership for U.S. federal income tax purposes).
If a partnership (or any other entity treated as a partnership for U.S. federal income tax purposes) holds class A preferred shares or ADSs, the tax treatment of a partner in such partnership will generally depend on the status of the partner and the activities of the partnership. A partnership or its partners should consult their tax advisor as to its tax consequences.
The class A preferred shares will be treated as equity for U.S. federal income tax purposes. In general, for U.S. federal income tax purposes, a holder of an ADR evidencing an ADS will be treated as the beneficial owner of our class A preferred shares represented by the applicable ADS. The U.S. Treasury Department has expressed concern that depositaries for ADSs, or other intermediaries between the holders of shares of an issuer and the issuer, may be taking actions that are inconsistent with the claiming of U.S. foreign tax credits by U.S. holders of such receipts or shares. Accordingly, the analysis regarding the availability of a United States foreign tax credit for Brazilian taxes and sourcing rules described below could be affected by future actions that may be taken by the U.S. Treasury Department.
Taxation of Dividends
Subject to the discussion under “—Passive Foreign Investment Company Rules,” in general, the gross amount of a distribution made with respect to a class A preferred share or ADS (which for this purpose willshall include distributions of interest attributable to shareholders’ equity before any reduction for any Brazilian taxes withheld therefrom) will, to the extent made from the current or accumulated earnings and profits of our company, as determined under U.S. federal income tax principles, constitute a dividend to a U.S. holder for U.S. federal income tax purposes. For taxable years beginning on or before December 31, 2008,2010, non-corporate U.S. holders may be taxed on dividends from a qualified foreign corporation at the lower rates applicable to long-term capital gains (i.e.,gains with respect to capital assets held for more than one year). A foreign corporation is treated as a qualified foreign corporation with respect to dividends received from that corporation on shares or ADSs that are readily tradable on an established securities market in the United States. United States Treasury Department guidance indicates that the ADSs (which are listed on the New York Stock Exchange), but not our class A preferred shares, are readily tradable on an established securities market in the United States. Thus, subject to the discussion below under “—Passive Foreign Investment Company Rules,” dividends that we pay on the ADS, but not on our class A preferred shares, currently meet the conditions required for these reduced tax rates. There, however, can be no assurance that the ADSs will be considered readily tradable on an established
securities market in later years. Furthermore, non-corporate holders that do not meet a minimumU.S. holder’s eligibility for such preferential rate is subject to certain holding period requirement during which they are not protected fromrequirements and the non-existence of certain risk of loss, that elect to treat the dividend income as “investment income” pursuant to Section 163(d)(4) of the Code or that receive dividendsreduction transactions with respect to which they are obligated to make related payments, will not be eligible for the reduced rates of taxation.ADSs. Such dividends will not be eligible for the dividends received deduction generally allowed to corporate U.S. corporations.holders. Subject to the discussion below under “—Passive Foreign Investment Company Rules,” if a distribution exceeds the amount of our company’s current and accumulated earnings and profits, it will be treated as a non-taxable return of capital to the extent of the U.S. holder’s tax basis in our class A preferred share or ADS on which it is paid and thereafter as capital gain. Our company does not maintain calculations of our earnings and profits under U.S. federal income tax principles. Therefore, U.S. holders should expect that distributions by our Company generally will be treated as dividends for U.S. federal income tax purposes.
183
A dividend paid in Brazilian currencyreais will be includible in the income of a U.S. holder at its value in U.S. dollars calculated by reference to the prevailing spot market exchange rate in effect on the day it is received by the U.S. holder in the case of our class A preferred shares or, in the case of a dividend received in respect of ADSs, on the date the dividend is received by the depositary, whether or not the dividend is converted into U.S. dollars. Assuming the payment is not converted at that time, the U.S. holder will have a tax basis in reais equal to that U.S. dollar amount, which will be used to measure gain or loss from subsequent changes in exchange rates. Any gain or loss realized by a U.S. holder that subsequently sells or otherwise disposes of reais, which gain or loss is attributable to currency fluctuations after the date of receipt of the dividend, will be ordinary gain or loss. The amount of any distribution of property other than cash will be the fair market value of such property on the date of distribution.
The gross amount of any dividend paid (which will include any amounts withheld in respect of Brazilian taxes) with respect to a class A preferred share or ADS will be subject to U.S. federal income taxation as foreign source dividend income, which may be relevant in calculating a U.S. holder’s foreign tax credit limitation. Subject to generally applicable limitations under U.S. federal income tax law concerning credits or deductions for foreign taxes and certain exceptions for short-term and hedged positions, any Brazilian withholding tax will be treated as a foreign income tax eligible for credit against a U.S. holder’s U.S. federal income tax liability. For purposes ofliability (or at a U.S. holder’s election, may be deducted in computing taxable income if the computation ofU.S. holder has elected to deduct all foreign income taxes for the taxable year). The limitation on foreign taxes eligible for the U.S. foreign tax credit limitationis calculated separately forwith respect to specific categories“baskets” of income, anyincome. For this purpose, the dividends should generally will constitute foreign source “passive category income”, or in the case of certain U.S. holders, “financial services“general category income.” U.S. Holders should note that recently enacted legislation eliminates the “financial services income” categoryThe rules with respect to taxable years beginning after December 31, 2006. Underforeign tax credits are complex, and U.S. holders are urged to consult their own tax advisors regarding the new legislation,availability of the foreign tax credit limitation categories would be limited to “passive category income” and “general category income.” Alternatively, a U.S. holder may elect not to claim a credit for any of its foreign taxes and deduct all of those taxes in computing taxable income.under their particular circumstances.
Subject to the discussion under “—Information Reporting and Backup Withholding,” a Non-U.S. holder of class A preferred shares or ADSs generally will not be subject to U.S. federal income or withholding tax on dividends received on such shares or ADSs, unless such income is effectively connected with the conduct by such Non-U.S. holder of a trade or business in the United States.
Sale, Exchange or Other Disposition of Class A Preferred Shares or ADSs
A deposit or withdrawal of class A preferred shares by a holder in exchange for an ADS that represent such shares will not result in the realization of gain or loss for U.S. federal income tax purposes. A U.S. holder generally will recognize capital gain or loss upon a sale, exchange or other disposition of a class A preferred share or ADS held by the U.S. holder or the depositary, as the case may be, in an amount equal to the difference between the U.S. holder’s adjusted basis in our class A preferred share or ADS (determined in U.S. dollars) and the U.S. dollar amount realized on the sale, exchange or other disposition. If a Brazilian tax is withheld on the sale, exchange or other disposition of a share, the amount realized by a U.S. holder will include the gross amount of the proceeds of that sale, exchange or other disposition before deduction of the Brazilian tax. In the case of a non-corporate U.S. holder, the maximum marginal U.S. federal income tax rate applicable to capital gain will generally be lower than the maximum marginal U.S. federal income tax rate applicable to ordinary income (other than, as discussed above, certain dividends) if such holder’s holding period for such class A preferred share or ADS exceeds one year.year (i.e., such gain is a long-term capital gain). Capital gain, if any, realized by a U.S. holder on the sale or exchange of a class A preferred share or ADS generally will be treated as U.S. source income for U.S. foreign tax credit purposes. Consequently, in the case of a disposition or deposit of a class A preferred share or ADS that is subject to Brazilian tax, the U.S. holder may not be able to use the foreign tax credit for that Brazilian tax unless it can
apply the credit against U.S. tax payable on other income from foreign sources in the appropriate income category, or, alternatively, it may take a deduction for the Brazilian tax if it elects to deduct all of its foreign income taxes. In general, any loss will be U.S. source, subject to certain exceptions that can treat a loss recognized by a U.S. resident in whole or in part as a foreign source loss. The deductibility of capital losses is subject to limitations.limitations under the Code.
184
The initial tax basis of class A preferred shares or ADSs to a U.S. holder is the U.S. dollar value of thereal-reais-denominated purchase price determined on the date of purchase. If our class A preferred shares or ADSs are treated as traded on an “established securities market,” a cash basis U.S. holder, or, if it elects, an accrual basis U.S. holder, will determine the dollar value of the cost of such class A preferred shares or ADSs by translating the amount paid at the spot rate of exchange on the settlement date of the purchase. The conversion of U.S. dollars toreaisand the immediate use of that currency to purchase class A preferred shares or ADSs generally will not result in taxable gain or loss for a U.S. holder.
With respect to the sale or exchange of class A preferred shares or ADSs, the amount realized generally will be the U.S. dollar value of the payment received determined on (1)(i) the date of receipt of payment in the case of a cash basis U.S. holder and (2)(ii) the date of disposition in the case of an accrual basis U.S. holder. If our class A preferred shares or ADSs are treated as traded on an “established securities market,” a cash basis taxpayer, or, if it elects, an accrual basis taxpayer, will determine the U.S. dollar value of the amount realized by translating the amount received at the spot rate of exchange on the settlement date of the sale.
Subject to the discussion below under “—Information Reporting and Backup Withholding,” a Non-U.S. holder of class A preferred shares or ADSs generally will not be subject to U.S. federal income or withholding tax on any gain realized on the sale or exchange of such shares or ADSs unless (1)(i) such gain is effectively connected with the conduct by such Non-U.S. holder of a trade or business in the United States or (2)(ii) in the case of any gain realized by an individual Non-U.S. holder, such holder is present in the United States for 183 days or more in the taxable year of such sale or exchange and certain other conditions are met.
Passive Foreign Investment Company Rules
Based upon the nature of its current and projected income, assets and activities, our company does not believe that our class A preferred shares or the ADSsNon-U.S. corporation will be considered shares ofclassified as a passive“passive foreign investment company,company”, or a PFIC, for U.S. federal income tax purposes for thein any taxable year ended December 31, 2004. In general, a foreign corporation is a PFIC if,in which, after applying certain look-through rules, with respect to certain subsidiaries,either (1) at least 75%75 percent of its gross income for the taxable year (or, in general, a preceding taxable year in which the taxpayer owned shares in the corporation) is passive income“passive income” or if(2) at least 50%50 percent of the average value of its gross assets for the taxable year (or, in general, a preceding year in which the taxpayer owned shares in the corporation)is attributable to assets that produce passive income“passive income” or areis held for the production of passive income. In general, passivePassive income for this purpose generally includes dividends, interest, royalties, rents royalties, and gains from commodities and securities transactions. The determination
Based on certain estimates of whetherits gross income and gross assets and the nature of its business, our class A preferred shares or the ADSs constitute shares ofcompany believes that it will not be classified as a PFIC is a factual determination made annually,for its taxable year ended December 31, 2007. The company's status in future years will depend on its assets and therefore our company’s failure to constitute a PFIC at one time is subject to change. Ouractivities in those years. The company has no reason to believe that ourits assets or activities will change in a manner that would cause usit to be classified as a PFIC for the taxable year ended December 31, 2008 or any future year, but there can be no assurance that ourthe company will not be considered a PFIC for any taxable year.
If we are treated aswere a PFIC, notwithstanding the discussion in “—Taxation of Dividends” and “—Sale, Exchange or Other Disposition of Class A Preferred Shares or ADSs” above, a U.S. holder of class A preferred shares or ADSs generally would be subject to imputed interest charges and other disadvantageous tax treatment (including the denial of the taxation of dividends received in respect of class A preferred shares or the ADSs at the lower rates applicable to long-term capital gains, as discussed above under “—Taxation of Dividends”) with respect to any gain from the sale or exchange of, and certain distributions with respect to, our class A preferredthe shares or ADSs (including the ADSs.
If we are treated aswere a PFIC, a U.S. holder of class A preferred shares or ADSs could make a variety of elections that may alleviate certain of the tax consequences referred to above, and one of these elections may be made retroactively. However, it is expected that the conditions necessary for making certain of such elections will not apply in the case of ourthe class A preferred shares or the ADSs. U.S. holders should consult their own tax advisorsadvisers regarding the tax consequences that would arise if we arethe company were treated as a PFIC and the availability of any of the elections described above.PFIC.
Information Reporting and Backup Withholding
U.S. backup withholding tax and information reporting requirements generally apply to certain payments to certain non-corporate holders of shares. Information reporting generally will apply to payments of dividends on, and to proceeds from the sale or redemption of, our class A preferred shares or the ADSs made within the United States or by a U.S. payor or U.S. middleman to a holder of our class A preferred shares or the ADSs, other than an exempt recipient, including a corporation, a payee that is not a United States person that provides an appropriate certification and certain other persons. Backup withholding tax will apply to any payments of dividends on, or the proceeds from the sale or redemption of, class A preferred shares or the ADSs within the United States or by a U.S. payor or U.S.
185
middleman to a holder, other than an exempt recipient, if such holder fails to furnish its correct taxpayer identification number or otherwise fails to comply with, or establish an exemption from, such backup withholding tax requirements. The backup withholding tax rate is 28% for taxable years through 2010.
Backup withholding is not an additional tax. You generally will be entitled to credit any amounts withheld under the backup withholding rules against your U.S. federal income tax liability or a refund of the amounts withheld provided the required information is furnished to the Internal Revenue Service in a timely manner.
The above description is not intended to constitute a complete analysis of all tax consequences relating to ownership and disposition of Preferred Classclass A Sharespreferred shares or Preferred Class A ADSs. Prospective purchasers should consult their own tax advisors concerning the tax consequences of their particular situations.
Documents on displayDisplay
Statements contained in this annual report regarding the contents of any contract or other document are not necessarily complete, and, where the contract or other document is an exhibit to the annual report, each of these statements is qualified in all respects by the provisions of the actual contract or other documents.
We are subject to the information requirements of the Exchange Act applicable to a foreign private issuer, and accordingly we file or furnish reports, information statements and other information with the Commission. These reports and other information may be inspected and copied at the public reference room maintained by the Commission at 450 Fifth Street, N.W., Room 1024, Washington, D.C. 20549. Copies of this material may be obtained by mail from the Public Reference Section of the Commission, 450 Fifth Street, N.W., Washington, D.C. 20549, at prescribed rates. Please call the SEC at 1-800-SEC-0330 for further information on the public reference room. Electronic filings made through the Electronic Data Gathering, Analysis and Retrieval System are also publicly available through the Commission’s web site on the Internet at http:\\www.sec.gov.
As a foreign private issuer, we are exempt from the proxy requirements of Section 14 of the Exchange Act and from the reporting and “short swing” profit recovery provisions of Section 16 of the Exchange Act, although the rules of the New York Stock Exchange may require us to solicit proxies from our shareholders under some circumstances.
We also file financial statements and other periodic reports with the Brazilian Securities Commission.
Copies of documents referred to in this annual report and our bylaws are available for inspection upon request at our headquarters at: Av. Nações Unidas, 4777, São Paulo, SP – CEP 05477-000 Brazil.
ITEM 11. QUANTITATIVE AND QUALITATIVE DISCLOSURES ABOUT MARKET RISK
We are exposed to market risks arising from our normal business activities. These market risks, which are beyond our control, principally involve the possibility that changes in interest rates, exchange rates or commodity prices will adversely affect the value of our financial assets and liabilities or future cash flows and earnings. Market risk is the potential loss arising from adverse changes in market rates and prices.
In order to mitigate the market risks to which we are exposed, we used and we may use foreign-currencyforeign currency, interest rate, commodity derivative instruments, cash and receivables. At December 31, 2004,2007, we had no outstanding derivative instruments.cross-currency interest rate swaps with an aggregate notional amount of R$731.8 million maturing between March 10, 2008 and June 28, 2012. These cross-currency interest rate swaps match certain of our foreign currency-denominated debt obligations.
It is our policy to assess the potential and consolidated impact of market risks and to mitigate assessed risks in accordance with our risk management policy. Our risk management policy, in effect since December 31, 2001,April 28, 2004, seeks to mitigate our exposure to exchange rate risks with the objective of maintaining coverage of principal and interest settlements maturing within the following 12 months for, at a minimum:
186
Compliance with this policy varies based upon applicable market conditions, credit availability and our cash balances.
At December 31, 2004,2007, we had US$459.5551.8 million in U.S. dollar-denominated cash equivalents and other investments, which may partially offset the effects of any devaluationdepreciation of therealagainst the U.S. dollar on our ability to service our U.S. dollar-denominated debt to the extent of these U.S. dollar-denominated cash equivalents and other investments. This amount is reserved to reduce the impact of an eventual devaluation of thereal against the U.S. dollar.
Interest Rate Risk
Our variable interest rate exposure is primarily subject to the variations of (1) LIBOR for U.S. dollar-denominated borrowings, and (2) the Long-Term Interest RateTJLP rate and the CDI rate forreal-denominated borrowings. In addition,borrowings and short-term cash investments.
As a result of strong worldwide GDP growth and favorable price levels of commodities, Brazil registered a commercial surplus of US$40.0 billion, the principal amountslargest in Brazil’s history, despite the substantial appreciation of certaintherealin relation to the U.S. dollar during 2007. This surplus, together with strong primary surpluses in the federal budget, contributed to a substantial improvement in investors’ perception of ourreal-denominatedBrazil country risk. Moreover, Brazil reduced its level of indebtedness, prepaid its obligations are periodically restated bywith the IGP-M.IMF and increased its international reserves from US$85.8 billion at December 31, 2006 to US$180.3 billion at December 31, 2007.
The Central Bank succeeded in controlling inflation within its targets and co-coordinating the expectations of economic agents. This strategy resulted in a decline in interest rates during 2007. Brazil’s GDP growth in 2007 was slightly ahead of worldwide growth levels, growing at an estimated 5.2% during 2007. With respect to Brazilian interest rates:
The table below provides information about our significant interest-rate sensitive instruments:
| Payment Schedule – Breakdown by Type of Interest Rate | ||||||||||||||||
| At December 31, 2007 | ||||||||||||||||
| Expected Maturity Date | ||||||||||||||||
| Fair | ||||||||||||||||
| 2008 | 2009 | 2010 | 2011 | 2012 | Thereafter | Total | Value (1) | |||||||||
| (in millions ofreais,unless otherwise indicated) | ||||||||||||||||
| LIABILITIES: | ||||||||||||||||
| Loans and financings (excluding | ||||||||||||||||
| debentures): | ||||||||||||||||
| Fixed rate, denominated in U.S. | ||||||||||||||||
| dollars | 295.2 | 19.6 | 19.7 | 12.7 | 10.4 | 2,449.3 | 2,807.0 | 2,307.2 | ||||||||
| Average interest rate | 9.5% | 9.2% | 9.2% | 9.2% | 9.2% | 9.3% | 9.3% | |||||||||
| Variable rate, denominated in | ||||||||||||||||
| U.S. dollars | 123.5 | 2,335.5 | 127.3 | 93.0 | 206.4 | 184.9 | 3,070.5 | 2,724.1 | ||||||||
| Average interest rate (over LIBOR) | 0.9% | 0.9% | 1.3% | 1.2% | 1.2% | 1.3% | 1.1% | |||||||||
187
| Payment Schedule – Breakdown by Type of Interest Rate | ||||||||||||||||
| At December 31, 2007 | ||||||||||||||||
| Expected Maturity Date | ||||||||||||||||
| Fair | ||||||||||||||||
| 2008 | 2009 | 2010 | 2011 | 2012 | Thereafter | Total | Value (1) | |||||||||
| Fixed rate, denominated in | ||||||||||||||||
| Japanese yen | 0.4 | — | — | — | — | — | 0.4 | 0.5 | ||||||||
| Average interest rate | 4.2% | 4.2% | ||||||||||||||
| Fixed rate, denominated inreais | 340.4 | 19.1 | 19.1 | 19.1 | 19.1 | 66.8 | 483.6 | 479.6 | ||||||||
| Average interest rate | 11.9% | 11.9% | 11.9% | 11.9% | 11.9% | 11.9% | 11.9% | |||||||||
| Variable rate, denominated in | ||||||||||||||||
| reais(excluding debentures) | 104.7 | 124.6 | 122.9 | 88.8 | 26.8 | — | 467.9 | 476.6 | ||||||||
| Average interest rate (over | ||||||||||||||||
| TJLP) | 3.4% | 3.3% | 3.2% | 2.9% | 2.4% | 3.3% | ||||||||||
| Variable rate, denominated in | ||||||||||||||||
| reais(excluding debentures) | 196.6 | 59.2 | 48.1 | 39.2 | 17.0 | — | 360.0 | 360.3 | ||||||||
| Average interest rate (% of | ||||||||||||||||
| CDI) | 102.8% | 102.9% | 102.8% | 102.8% | 102.9% | 102.8% | ||||||||||
| Loans and financings (excluding | ||||||||||||||||
| debentures) before proportional | ||||||||||||||||
| consolidation | 1,060.8 | 2,558.0 | 337.1 | 252.8 | 279.7 | 2,701.0 | 7,189.4 | 6,348.3 | ||||||||
| Loans and financings, of | ||||||||||||||||
| proportionally consolidated | ||||||||||||||||
| companies | 3.9 | 41.7 | 41.6 | 50.8 | 142.9 | — | 280.9 | 280.9 | ||||||||
| Total loans and financings | ||||||||||||||||
| (excluding debentures) | 1,064.4 | 2,600.0 | 379.0 | 304.0 | 423.0 | 2,701.0 | 7,470.4 | 6,629.2 | ||||||||
| Debentures: | ||||||||||||||||
| Variable rate, denominated in | ||||||||||||||||
| reais | 111.6 | — | 300.0 | 500.0 | — | — | 911.6 | 917.4 | ||||||||
| Average interest rate (% of | ||||||||||||||||
| CDI) | 63.3% | 103.7% | 103.6% | 103.5% | 90.7% | |||||||||||
| Debentures before proportional | ||||||||||||||||
| consolidation | 111.6 | — | 300.0 | 500.0 | — | — | 911.6 | 917.4 | ||||||||
| Debentures of proportionally | ||||||||||||||||
| consolidated companies | — | — | — | — | — | — | — | — | ||||||||
| Total debentures | 111.6 | — | 300.0 | 500.0 | — | — | 911.6 | 917.4 | ||||||||
| ASSETS: | ||||||||||||||||
| Cash and cash equivalents and other | ||||||||||||||||
| instruments: | ||||||||||||||||
| Variable rate, denominated in | ||||||||||||||||
| U.S. dollars | 977.4 | — | — | — | — | — | 977.4 | 977.4 | ||||||||
| Variable rate, denominated in | ||||||||||||||||
| reais | 1,281.6 | — | — | — | — | — | 1,281.6 | 1,281.6 | ||||||||
| Cash and cash equivalents and other | ||||||||||||||||
| investments, before proportional | ||||||||||||||||
| consolidation | 2,259.0 | — | — | — | — | — | 2,259.0 | 2,259.0 | ||||||||
| Cash and cash equivalents and other | ||||||||||||||||
| investments of proportionally | ||||||||||||||||
| consolidated companies | 91.9 | — | — | — | — | — | 91.9 | 91.9 | ||||||||
| Total cash and cash equivalents and | ||||||||||||||||
| other investments | 2,350.9 | — | — | — | — | — | 2,350.9 | 2,350.9 | ||||||||
| (1) | Represents the net present value of the future cash flows from the obligations converted intoreaisat fair market value at December 31, 2007. |
Interest Rate Sensitivity—Principal (Notional) Amount by Expected Maturity— Average Interest Rate | |||||||||||||||||||||||
At December 31, 2004 Expected Maturity Date | |||||||||||||||||||||||
| 2005 | 2006 | 2007 | 2008 | 2009 | Thereafter | Total | Fair Value | ||||||||||||||||
| (in millions ofreais) | |||||||||||||||||||||||
LIABILITIES: | |||||||||||||||||||||||
Loans and financings (excluding debentures): | |||||||||||||||||||||||
Fixed rate, denominated in U.S. dollars | 628.0 | 14.1 | 701.7 | 730.0 | — | 663.6 | 2,737.4 | 1,933.1 | |||||||||||||||
Average interest rate | 6.3 | % | 6.8 | % | 10.5 | % | 12.5 | % | — | 11.8 | % | 10.4 | % | — | |||||||||
Variable rate, denominated in U.S. dollars | 750.7 | 342.8 | 207.4 | 38.5 | 18.2 | — | 1,357.6 | 1,221.7 | |||||||||||||||
Average interest rate (over LIBOR) | 2.2 | % | 3.1 | % | 3.7 | % | 4.3 | % | 4.5 | % | — | 2.8 | % | — | |||||||||
Fixed rate, denominated in Japanese yen | 1.3 | 1.3 | 1.2 | 0.6 | — | — | 4.4 | 3.8 | |||||||||||||||
Average interest rate | 6.9 | % | 6.9 | % | 6.9 | % | 6.9 | % | — | — | 6.9 | % | — | ||||||||||
Fixed rate, denominated inreais | — | — | — | 2.0 | 3.9 | 25.6 | 31.5 | 14.1 | |||||||||||||||
Average interest rate | — | — | 11.9 | % | 11.9 | % | 11.9 | % | 11.9 | % | — | ||||||||||||
Variable rate, denominated inreais | 108.0 | 195.6 | 3.7 | — | — | — | 307.3 | 277.1 | |||||||||||||||
Average interest rate (over Long-Term Interest Rate) | 4.8 | % | 3.9 | % | 3.5 | % | — | — | — | 4.2 | % | — | |||||||||||
Variable rate, denominated inreais | 17.2 | — | — | — | — | — | 17.2 | 16.2 | |||||||||||||||
Average interest rate (over IGP-M) | 11.0 | % | — | — | — | — | — | 11.0 | % | — | |||||||||||||
Other variable rate, denominated inreais | 11.9 | 11.4 | — | — | — | — | 23.3 | 21.3 | |||||||||||||||
Loans and financings (excluding debentures) before proportional consolidation | 1,517.1 | 565.2 | 914.0 | 771.1 | 22.1 | 689.2 | 4,478.7 | 3,487.3 | |||||||||||||||
Loans and financings, of proportionally consolidated companies | 258.5 | 54.8 | 32.6 | 1.4 | 0.8 | — | 348.1 | 320.2 | |||||||||||||||
Total loans and financings (excluding debentures) | 1,775.6 | 620.0 | 946.6 | 772.5 | 22.9 | 689.2 | 4,826.8 | 3,807.5 | |||||||||||||||
Debentures: | |||||||||||||||||||||||
Variable rate, denominated inreais | 5.0 | — | — | — | 300.0 | — | 305.0 | 211.9 | |||||||||||||||
Average interest rate (of CDI) | 117.0 | % | — | — | — | 117.0 | % | — | 117.0 | % | — | ||||||||||||
Variable rate, denominated inreais | — | — | 867.9 | — | — | — | 867.9 | 710.3 | |||||||||||||||
Average interest rate (over Long-Term Interest Rate) | — | — | 5.0 | % | — | — | — | 5.0 | % | — | |||||||||||||
Total debentures | 5.0 | — | 867.9 | — | 300.0 | — | 1,172.9 | 922.2 | |||||||||||||||
ASSETS: | |||||||||||||||||||||||
Cash and cash equivalents and other investments: | |||||||||||||||||||||||
Fixed rate, denominated in U.S. dollars | 1,114.8 | 25.0 | — | — | — | — | 1,139.8 | 1,072.4 | |||||||||||||||
Average interest rate | 6.3 | % | 1.6 | % | — | — | — | — | 6.2 | % | — | ||||||||||||
Cash and cash equivalents | 149.4 | — | — | — | — | — | 149.4 | 149.4 | |||||||||||||||
Other investments | 432.5 | 61.6 | — | — | — | — | 494.1 | 461.8 | |||||||||||||||
Average interest rate (of CDI) | 101.8 | % | — | — | — | — | — | 89.1 | % | — | |||||||||||||
Cash and cash equivalents and other investments, before proportional consolidation | 1,696.7 | 86.6 | — | — | — | — | 1,783.3 | 1,683.6 | |||||||||||||||
Cash and cash equivalents and other investments of proportionally consolidated companies | 77.1 | 3.2 | — | — | — | — | 80.3 | 75.6 | |||||||||||||||
Total cash and cash equivalents and other investments | 1,773.8 | 89.8 | — | — | — | — | 1,863.6 | 1,759.2 | |||||||||||||||
In the event that the average interest rate applicable to our financial assets and debt in 2005 is2008 were 1% higher than the average interest rate in 2004,2007, our financial revenuesincome would increase by approximately R$9.713.3 million and our financial expenses would increase by approximately R$51.97.9 million.
Foreign Currency Exchange Rate Risk
Our liabilities that are exposed to foreign currency exchange rate risk are primarily denominated in U.S. dollars. To partially offset our risk of any devaluation of therealagainst the U.S. dollar, we currently maintain available liquid resources denominated in U.S. dollars and may enter into derivative contracts. Because we borrow in the international markets to support our operations and investments, we are exposed to market risks from changes in foreign exchange rates and interest rates. Export sales, which generate receivables payable in U.S. dollars, do not cover all
188
Table of our U.S. dollar-denominated liabilities.Contents
The table below provides information about our significant foreign currency exposure:
| Payment Schedule – Breakdown by Currency | ||||||||||||||||
| As of December 31, 2007 | ||||||||||||||||
| Expected Maturity Date | ||||||||||||||||
| Fair | ||||||||||||||||
| 2007 | 2008 | 2009 | 2010 | 2011 | Thereafter | Total | Value (1) | |||||||||
| (in millions ofreais) | ||||||||||||||||
| LIABILITIES: | ||||||||||||||||
| Loans and financings: | ||||||||||||||||
| Loans and financings (excluding | ||||||||||||||||
| debentures): | ||||||||||||||||
| Denominated in U.S. dollars | 418.7 | 2,355.1 | 147.0 | 105.7 | 216.8 | 2,634.2 | 5,877.5 | 5,031.3 | ||||||||
| Denominated in Japanese Yen | 0.4 | — | — | — | — | — | 0.4 | 0.5 | ||||||||
| Denominated inreais | 641.7 | 202.9 | 190.1 | 147.1 | 62.9 | 66.8 | 1,311.5 | 1,316.5 | ||||||||
| Loans and financings (excluding | ||||||||||||||||
| debentures) before proportional | 1,060.8 | 2,558.0 | 337.1 | 252.8 | 279.7 | 2,701.0 | 7,189.4 | 6,348.3 | ||||||||
| consolidation | ||||||||||||||||
| Loans and financings, of | ||||||||||||||||
| proportionally consolidated | 3.9 | 41.7 | 41.6 | 50.8 | 142.9 | — | 280.9 | 280.9 | ||||||||
| companies | ||||||||||||||||
| Total loans and financings (excluding | ||||||||||||||||
| debentures) | 1,064.4 | 2,600.0 | 379.0 | 304.0 | 423.0 | 2,701.0 | 7,470.4 | 6,629.6 | ||||||||
| Debentures: | ||||||||||||||||
| Denominated inreais | 111.6 | — | 300.0 | 500.0 | — | — | 911.6 | 917.4 | ||||||||
| Total debentures, including current | ||||||||||||||||
| portion | 111.6 | — | 300.0 | 500.0 | — | — | 911.6 | 917.4 | ||||||||
| ASSETS: | ||||||||||||||||
| Cash and cash equivalents and other | ||||||||||||||||
| investments: | ||||||||||||||||
| Denominated in U.S. dollars | 977.4 | — | — | — | — | — | 977.4 | 977.4 | ||||||||
| Denominated inreais | 1,281.6 | — | — | — | — | — | 1,281.6 | 1,281.6 | ||||||||
| Cash and cash equivalents and other | ||||||||||||||||
| investments, before proportional | ||||||||||||||||
| consolidation | 2,259.0 | — | — | — | — | — | 2,259.0 | 2,259.0 | ||||||||
| Cash and cash equivalents and other | ||||||||||||||||
| investments of proportionally | ||||||||||||||||
| consolidated companies | 91.9 | — | — | — | — | — | 91.9 | 91.9 | ||||||||
| Total cash and cash equivalents and other | ||||||||||||||||
| investments | 2,350.9 | — | — | — | — | — | 2,350.9 | 2,350.9 | ||||||||
| (1) | Represents the net present value of the future cash flows from the obligations converted intoreaisat fair market value at December 31, 2007. |
Foreign Currency Exchange Rate Sensitivity—Principal (Notional) Amount by Expected Maturity | ||||||||||||||||
As of December 31, 2004 Expected Maturity Date | ||||||||||||||||
| 2005 | 2006 | 2007 | 2008 | 2009 | Thereafter | Total | Fair Value | |||||||||
| (in millions ofreais) | ||||||||||||||||
LIABILITIES: | ||||||||||||||||
Loans and financings: | ||||||||||||||||
Loans and financings (excluding debentures): | ||||||||||||||||
Denominated in U.S. dollars | 1,378.7 | 356.9 | 909.1 | 768.5 | 18.2 | 663.6 | 4,095.0 | 3,154.8 | ||||||||
Denominated in Japanese Yen | 1.3 | 1.3 | 1.2 | 0.6 | — | — | 4.4 | 3.8 | ||||||||
Denominated inreais | 137.1 | 207.0 | 3.7 | 2.0 | 3.9 | 25.6 | 379.3 | 328.7 | ||||||||
Loans and financings (excluding debentures) before proportional consolidation | 1,517.1 | 565.2 | 914.0 | 771.1 | 22.1 | 689.2 | 4,478.7 | 3,487.3 | ||||||||
Loans and financings, of proportionally consolidated companies | 258.5 | 54.8 | 32.6 | 1.4 | 0.8 | — | 348.1 | 320.2 | ||||||||
Total loans and financings (excluding debentures) | 1,775.6 | 620.0 | 946.6 | 772.5 | 22.9 | 689.2 | 4,826.8 | 3,807.5 | ||||||||
Debentures: | ||||||||||||||||
Denominated inreais | 5.0 | — | 867.9 | — | 300.0 | — | 1,172.9 | 922.2 | ||||||||
Total debentures, including current portion | 5.0 | — | 867.9 | — | 300.0 | — | 1,172.9 | 922.2 | ||||||||
ASSETS: | ||||||||||||||||
Cash and cash equivalents and other investments: | ||||||||||||||||
Denominated in U.S. dollars | 1,199.9 | 25.0 | — | — | — | — | 1,224.9 | 1,072.4 | ||||||||
Denominated inreais | 496.8 | 61.6 | — | �� | — | — | — | 558.4 | 611.2 | |||||||
Cash and cash equivalents and other investments, before proportional consolidation | 1,696.7 | 86.6 | — | — | — | — | 1,783.3 | 1,683.6 | ||||||||
Cash and cash equivalents and other investments of proportionally consolidated companies | 77.1 | 3.2 | — | — | — | — | 80.3 | 75.6 | ||||||||
Total cash and cash equivalents and other investments | 1,773.8 | 89.8 | — | — | — | — | 1,863.6 | 1,759.2 | ||||||||
Our foreign currency exposure gives rise to market risks associated with exchange rate movements of therealagainst the U.S. dollar. Foreign currency-denominated liabilities at December 31, 20042007 consisted primarily of U.S. dollar-denominated debt. Our foreign currency-denominated debt, including short-term debt and current portion of long-term debt, was R$4,177.85,915.4 million (US$1,573.93,339.6 million) at December 31, 20042007 and R$5,220.03,117.4 million (US$1,966.51,458.1 million) at December 31, 2003.2006. Our foreign currency exposure includes indebtedness of proportionally consolidated companies of R$102.637.9 million (US$38.721.4 million) at December 31, 20042007 and R$416.880.8 million (US$157.037.8 million) at December 31, 2003.2006. Our foreign currency exposure without the indebtedness of proportionally consolidated companies was R$4,075.25,877.5 million (US$1,535.33,318.2 million) at December 31, 20042007 and R$4,803.23,036.6 million (US$1,809.51,420.3 million) at December 31, 2003.2006. This foreign currency exposure is represented by debt in the form of notes, bonds, pre-export finance facilities and working capital loans. Our cash and funds available in U.SU.S. dollars partially protect us against exposure arising from the U.S. dollar-denominated debt.
189
In the event that thereal depreciateswere to devalue by 10% against the U.S. dollar during 20052008 as compared to thereal/U.S. dollar exchange rate at December 31, 2004,2007, our financial expenses indexed to the dollar in 20042008 would increase by approximately R$356.6592 million, and our financial revenuesincome would increase by approximately R$69.998 million.
Commodity Prices
Commodity Prices
Although the majority of our revenues are inreais, we do not currently hedge our exposure to changes in prices of naphtha, our principal raw material, which are linked to the Amsterdam-Rotterdam-Antwerp market price denominated in U.S. dollars. We do not hedge this exposure in part because a portion of our sales in 20032007 were exports payable in foreign currencies and linked to the international market prices of these commodities, and in part because the prices of our polyethylene, polypropylene and PVC products sold in domestic markets generally reflect changes in the international market prices of these products. In periods of high volatility in the U.S. dollar price of naphtha or thereal/U.S. dollar exchange rate, there is usually a lag between the time that the U.S. dollar price of naphtha increases or the U.S. dollar appreciates and the time that we can effectively pass on the resulting increased cost inreaisto our customers in Brazil. Accordingly, if the U.S. dollar price of naphtha increases precipitously or therealdepreciates significantlydevalues precipitously against the U.S. dollar in the future, we may not immediately be able to pass on all of the corresponding increases in our naphtha costs to our customers in Brazil, which could materially adversely affect our results of operations and financial condition. See “Item 3. Key Information—Risk Factors—Informaion—Risks Relating to Our Company and the Petrochemical Industry— Higher naphtha costs would increase our cost of sales and services rendered and may reduce our gross margin and negatively affect our overall financial performance.Industry.”
ITEM 12. DESCRIPTION OF SECURITIES OTHER THAN EQUITY SECURITIES
Not applicable.
190
ITEM 13. DEFAULTS, DIVIDEND ARREARAGES AND DELINQUENCIES
Not applicable.
ITEM 14. MATERIAL MODIFICATIONS TO THE RIGHTS OF SECURITY HOLDERS AND USE OF PROCEEDS
Not applicable.
ITEM 15. CONTROLS AND PROCEDURES
Disclosure Controls and Procedures
Our chief executive officer, or CEO, and our chief financial officer, or CFO, are responsible for establishing and maintaining our disclosure controls and procedures. These controls and procedures were designed to ensure that information relating to our company that we are required to disclose in the reports that we file under the Exchange Act is recorded, processed, summarized and reported within the time periods specified in the applicable rules and forms of the Commission.Commission, and that it is accumulated and communicated to our management, including our CEO and CFO, as appropriate to allow timely decisions regarding required disclosure. We evaluated theseperformed an evaluation of the effectiveness of the design and operation of our disclosure controls and procedures as of December 31, 2007 under the supervision of our CEO and CFO as of December 31, 2004.CFO. Based on our evaluation, our CEO and CFO have concluded that our disclosure controls and procedures were effective as of December 31, 2007.
Management’s Annual Report on Internal Control over Financial Reporting and Report of Independent Registered Public Accounting Firm
We are effective in timely alerting them to information thatfiling herewith our management’s report on internal control over financial reporting and the report of independent registered accounting firm issued by our independent registered public accounting firm. Our management’s report on internal control over financial reporting is required to be included in our periodic reports to the Commission.
As of the date of this annual report there hason page F-1 and the opinion issued by our independent registered public accounting firm is included in the report of PricewaterhouseCoopers Auditores Independentes that is included in this annual report on page F-3.
Changes in Internal Control over Financial Reporting
There have been no changechanges in our internal controlscontrol over financial reporting in effectthat occurred during the year ended December 31, 20042007 that hashave materially affected or isare reasonably likely to materially affect our internal controlscontrol over financial reporting.
ITEM 16A. AUDIT COMMITTEE FINANCIAL EXPERT
Our fiscal council currently includes a “financial expert” within the meaning of this Item 16A. Our fiscal council has determined that Ismael Campos de Abreu is our fiscal council financial expert. Mr. Abreu’s biographical information is included in “Item 6. Directors, Senior Management and Employees.”
We have adopted a code of ethics that applies to member of our board of directors, fiscal council and board of executive officers, as well as to our other employees. We post our code of ethics on our website at http://www.braskem.com.br. We do not, however, incorporate by reference or otherwise make part of this annual report any information contained on our website.
191
ITEM 16C. PRINCIPAL ACCOUNTANT FEES AND SERVICES
Audit And Non-Audit Fees
The following table sets forth the fees billed to us by our independent registered public accounting firm, PricewaterhouseCoopers Auditores Independentes, during the fiscal years ended December 31, 20042006 and 2003:2005:
| Year ended December 31, | ||||
| 2004 | 2003 | |||
| (in millions ofreais) | ||||
Audit fees(l) | 8.1 | 8.6 | ||
Audit-related fees(2) | 1.2 | 0.5 | ||
Tax fees(3) | 0.5 | 0.4 | ||
Other fees | — | — | ||
Total fees | 9.8 | 9.5 | ||
| Year ended December 31, | ||||
| 2007 | 2006 | |||
| (in millions of reais) | ||||
| Audit fees(1) | R$7.0 | R$ 15.0 | ||
| Audit-related fees(2) | 0.1 | 1.3 | ||
| Tax fees(3) | 0.5 | 0.7 | ||
| Total fees | R$7.6 | R$ 17.0 | ||
| (1) | Audit fees consist of the aggregate fees billed by PricewaterhouseCoopers Auditores Independentes in connection with the audit of our annual financial statements, interim audits, interim reviews of our quarterly financial information, issuance of comfort letters, procedures as related to audit of income tax provisions and related reserves in connection with the audit and review of financial statements and review of documents filed with the Brazilian Securities Commission and the Commission. |
| (2) | Audit-related fees consist of the aggregate fees billed by PricewaterhouseCoopers Auditores Independentes for internal control reviews. |
| (3) | Tax fees consist of the aggregate fees billed by PricewaterhouseCoopers Auditores Independentes for tax compliance reviews. |
Pre-Approval Policies And Procedures
Our fiscal council and board of directors have approved an Audit and Non-Audit Services Pre-Approval Policy that sets forth the procedures and the conditions pursuant to which services proposed to be performed by our independent auditors may be pre-approved. This policy is designed to (1) provide both general pre-approval of certain types of services through the use of an annually established schedule setting forth the types of services that have already been pre-approved for a certain year and, with respect to services not included in an annual schedule, special pre-approval of services on a case by case basis by our fiscal council and our independent auditors and (2) assess compliance with the pre-approval policies and procedures. Our management periodically reports to our fiscal council the nature and scope of audit and non-audit services rendered by our independent auditors and is also required to report to our fiscal council any breach of this policy of which our management is aware.
ITEM 16D. EXEMPTIONS FROM THE LISTING STANDARDS FOR AUDIT COMMITTEES
We are relying on the general exemption from the listing standards relating to audit committees contained in Rule 10A-3(c)(3) under the Exchange Act for the following reasons:
192
|
We, however, do not believe that our reliance on this general exemption will materially adversely affect the ability of our fiscal council to act independently and to satisfy the other requirements of the listing standards relating to audit committees contained in Rule 10A-3 under the Exchange Act.
ITEM 16E. PURCHASES OF EQUITY SECURITIES BY THE ISSUER AND AFFILIATED PURCHASERS
Not Applicable.
During the year ended December 31, 2004, there were no purchases made by or on behalf193
We have responded to Item 18 in lieu of responding to this item.
Reference is made to Item 19 for a list of all financial statements filed as part of this annual report.
(a) Financial Statements
Braskem Financial Statements
| Management’s Report on Internal Controls over Financial Reporting | F-2 | |
Consolidated Balance Sheets as of December 31, | ||
Copesul Financial Statements
| F-15 | ||
Copesul Financial Statements | ||
| Report of Independent Registered Public Accounting Firm | ||
Consolidated Balance Sheet at December 31, | ||
Consolidated Statement of Income for the years ended December 31, 2006, 2005 and 2004 | ||
| F-148 | ||
| F-207 | ||
| Unaudited Interim Consolidated Statement of Income for the three month periods ended March 31, 2007 and 2006 | F-208 | |
| Unaudited Interim Statement of Changes in Shareholders’ Equity for the three month periods ended March 31, 2007 and 2006 | F-209 | |
| Unaudited Interim Consolidated Statement of Changes in Financial Position for the three month periods ended March 31, 2007 and 2006 | F-210 | |
| Unaudited Interim Consolidated Statement of Cash Flows for the three months ended March 31, 2007 and 2006 | F-211 | |
| Notes to the Consolidated Financial Statements | F-212 | |
(b) List of Exhibits
| 1.01 | ||||
| 2.01 | Amended and Restated Deposit Agreement, dated as of | |||
194
| 2.02 | Form of Certificate representing American Depositary Shares (incorporated by reference to Exhibit 4.02 to Form F-1 of Braskem S.A. filed on April 6, 2004). | |||
| 2.03 | The total amount of long-term debt securities of our company and its subsidiaries under any one instrument does not exceed 10% of the total assets of our company and its subsidiaries on a consolidated basis. We agree to furnish copies of any or all such instruments to the Commission upon request. | |||
| 3.01 | Shareholders Agreement of Braskem S.A., dated as of | |||
| Memorandum of Understanding Regarding Shareholders Agreement, dated July 20, 2001, among Odebrecht Química S.A., Petroquímica da Bahia S.A., | ||||
| 3.03 | ||||
| 3.04 | ||||
| 4.01 | Share Purchase Agreement, dated as of April 4, 2006, between Braskem S.A., SPQ Investimentos e Participações Ltda., Sumitomo Chemical Company, Limited, and Itochu Corporation (incorporated by reference to Exhibit 4.1 to Form 20-F of Braskem S.A. filed on June 23, 2006). | |||
| 4.02 | Protocol and Justification of the | |||
| 4.03 | Protocol and Justification of the | |||
| 4.04 | Share Purchase Agreement Between the Ipiranga Group Key Shareholders and Ultrapar dated March 18, 2007 (English summary) (incorporated by reference to Exhibit 4.04 to Form 20-F of Braskem S.A. filed on June | |||
| 4.08 | Agreement for Maintenance of | |||
| 4.09 | ||||
195
| 4.11 | ||||
| Naphtha and Gas Oil Purchase and Sale Contract, dated as of June 22, 1978, between Petróleo Brasileiro S.A. and the Registrant (English translation) (incorporated by reference to Exhibit 10.06 to Form F-1 of Braskem S.A. filed on April 6, 2004). | ||||
| First Amendment to Naphtha and Gas Oil Purchase and Sale Contract, dated as of February 8, 1993, between Petróleo Brasileiro S.A. and the Registrant (English translation) (incorporated by reference to Exhibit 10.07 to Form F-1 of Braskem S.A. filed on April 6, 2004). | ||||
| Second Amendment to Naphtha and Gas Oil Purchase and Sale Contract, dated as of February 24, 2003, between Petróleo Brasileiro S.A. and the Registrant. (English translation) (incorporated by reference to Exhibit | ||||
| 4.16 | ||||
| 4.17 | ||||
| 8.01 | List of subsidiaries (incorporated by reference to note 4 to our audited consolidated financial statements included elsewhere in this annual report). | |||
| 12.01 | ||||
| 12.02 | ||||
| 13.01 | ||||
196
SIGNATURES
The registrant hereby certifies that it meets all of the requirements for filing on Form 20-F and that it has duly caused and authorized the undersigned to sign this annual report to be signed on its behalf.
| BRASKEM S.A. | |||||
| By: | /s/ | ||||
| José Carlos Grubisich Filho | |||||
| Name: | José Carlos Grubisich Filho | ||||
| Title: | Chief Executive Officer | ||||
| Date: | June | ||||
197
Braskem Financial Statements
| ||
| F-2 | ||
| F-15 | ||
Copesul Financial Statements | | |
Copesul Financial Statements
| F-207 | ||
| F-208 | ||
| F-209 | ||
| F-210 | ||
| F-211 | ||
| F-212 | ||
Management’s Report on Internal Controls over Financial Reporting The management of Braskem S.A.(“Braskem” or the “Company”), including the CEO and CFO, is responsible for establishing and maintaining adequate internal controls over financial reporting. The Company’s internal control over financial reporting is a process designed to provide reasonable assurance regarding the reliability of financial reporting and the preparation of financial statements for external purposes in accordance with generally accepted accounting principles. The Company’s internal control over financial reporting includes those policies and procedures that (i) pertain to the maintenance of records that, in reasonable detail, accurately and fairly reflect the transactions and dispositions of the assets of the Company; (ii) provide reasonable assurance that transactions are recorded as necessary to permit preparation of financial statements in accordance with generally accepted accounting principles, and that receipts and expenditures of the company are being made only in accordance with authorizations of management and directors of the Company; and (iii) provide reasonable assurance regarding prevention or timely detection of unauthorized acquisition, use or disposition of the Company’s assets that could have a material effect on the financial statements. Because of its inherent limitations, internal control over financial reporting may not prevent or detect misstatements. Also, projections of any evaluation of the effectiveness of internal control to future periods are subject to the risk that controls may become inadequate because of changes in conditions, and that the degree of compliance with the policies or procedures may deteriorate. As disclosed in the Note 1 (xi) of its consolidated financial statements, during 2007, Braskem acquired control of Companhia Petroquímica do Sul (“Copesul”), Ipiranga Química S.A (“Ipiranga Química”) and Ipiranga Petroquimica S.A (“IPQ”). As provided under the Sarbanes –Oxley Act of 2002 and the applicable rules and regulations of the Securities and Exchange Commission, management has elected to exclude Copesul, Ipiranga Química and IPQ from this evaluation. Copesul, Ipiranga Química and IPQ are subsidiaries whose total assets and total revenues represent 16.7% and 27.5%, of the related consolidated financial statement amounts as of and for the year ended December 31, 2007. F-2 Braskem’s management has assessed the effectiveness of the Company’s internal controls over financial reporting as of December 31, 2007 based on the criteria established in Internal Control – “Integrated Framework” issued by the Committee of Sponsoring Organizations of the Treadway Commission (“COSO”) and, based on such criteria, Braskem’s management has concluded that, as of December 31, 2007, the Company’s internal control over financial reporting is effective. The effectiveness of the Company’s internal control over financial reporting as of December 31, 2007 has been audited by PricewaterhouseCoopers Auditores Independentes, an independent registered public accounting firm, as stated in their report which appears herein. F-3 Report of Independent Registered Public Accounting Firm To the Board of Directors and Shareholders of Braskem S.A. F-4 A company’s internal control over financial reporting is a process designed to provide reasonable assurance regarding the reliability of financial reporting and the preparation of financial statements for external purposes in accordance with generally accepted accounting principles. A company’s internal control over financial reporting includes those policies and procedures that (i) pertain to the maintenance of records that, in reasonable detail, accurately and fairly reflect the transactions and dispositions of the assets of the company; (ii) provide reasonable assurance that transactions are recorded as necessary to permit preparation of financial statements in accordance with generally accepted accounting principles, and that receipts and expenditures of the company are being made only in accordance with authorizations of management and directors of the company; and (iii) provide reasonable assurance regarding prevention or timely detection of unauthorized acquisition, use, or disposition of the company’s assets that could have a material effect on the financial statements. Because of its inherent limitations, internal control over financial reporting may not prevent or detect misstatements. Also, projections of any evaluation of effectiveness to future periods are subject to the risk that controls may become inadequate because of changes in conditions, or that the degree of compliance with the policies or procedures may deteriorate. As described in Management’s Report on Internal Controls over Financial Reporting, management has excluded Companhia Petroquímica do Sul – COPESUL (“Copesul”), Ipiranga Petroquímica S.A. (“Ipiranga Petroquímica”) and the year ended December 31, 2007. Salvador, June 30, 2008 PricewaterhouseCoopers F-5 F-6 The accompanying notes are an integral part of these financial statements. F-7 The accompanying notes are an integral part of these financial statements. F-8 The accompanying notes are an integral part of these financial statements. F-9 F-10 The accompanying notes are an integral part of these financial statements. F-11 F-12 Assets Current assets Cash and cash equivalents Other investments Trade accounts receivable Taxes recoverable Inventories Related parties Dividends receivable Advances to suppliers and other receivables Prepaid expenses Long-term assets Trade accounts receivable Related parties Other investments Judicial deposits and compulsory loan Deferred income tax Taxes recoverable Inventories Other assets Permanent assets Investments Associated companies Other investments Property, plant and equipment Deferred charges, including goodwill (Note 14) Total assetsREPORT OF INDEPENDENT REGISTERED PUBLIC ACCOUNTING FIRM/s/ José Carlos Grubisich Filho By: José Carlos Grubisich Filho Chief Executive Officer /s/ Carlos José Fadigas de Souza Filho Carlos José Fadigas de Souza Filho Chief Financial Officer and Its Subsidiaries1 We have auditedIn our opinion, the accompanying consolidated balance sheets of Braskem S.A. and its subsidiaries (the “Company”) as of December 31, 2004 and 2003, and the related consolidated and combined statements of operations, of changes in shareholders’ equity, of changes in financial position and of cash flows present fairly, in all material respects, the financial position of Braskem S.A. and its subsidiaries at December 31, 2007 and 2006, and the results of their operations and their cash flows for each of the three years in the three-year period ended December 31, 2004. These2007 in conformity with accounting practices adopted in Brazil. Also in our opinion, the Company maintained, in all material respects, effective internal control over financial reporting as of December 31, 2007, based on criteria established in Internal Control – Integrated Framework issued by the Committee of Sponsoring Organizations of the Treadway Commission (COSO). The Company’s management is responsible for these financial statements, are the responsibilityfor maintaining effective internal control over financial reporting and for its assessment of the Company’s management.effectiveness of internal control over financial reporting, included in the accompanying “Management’s Report on Internal Control Over Financial Reporting”. Our responsibility is to express an opinionopinions on these financial statements and on the Company’s internal control over financial reporting based on our audits.2audits (which were integrated audits in 2007 and 2006). We conducted our audits in accordance with the standards of the Public Company Accounting Oversight Board (United States). Those standards require that we plan and perform the auditaudits to obtain reasonable assurance about whether the financial statements are free of material misstatement. Anmisstatement and whether effective internal control over financial reporting was maintained in all material respects. Our audit of the financial statements includes examining, on a test basis, evidence supporting the amounts and disclosures in the financial statements. An audit also includesstatements, assessing the accounting principles used and significant estimates made by management, as well asand evaluating the overall financial statement presentation. Our audit of internal control over financial reporting included obtaining an understanding of internal control over financial reporting, assessing the risk that a material weakness exists, and testing and evaluating the design and operating effectiveness of internal control based on the assessed risk. Our audits also included performing such other procedures as we considered necessary in the circumstances. We believe that our audits provide a reasonable basis for our opinion.opinions.3 In our opinion, the consolidated and combined financial statements referred to above present fairly, in all material respects, the financial position of Braskem S.A. and its subsidiaries at December 31, 2004 and 2003, and the results of their operations, the changes in their shareholders’ equity and the changes in their financial position for each of the years in the three-year period ended December 31, 2004, in conformity with accounting practices adopted in Brazil.4 Accounting practices adopted in Brazil vary in certain significant respects from accounting principles generally accepted in the United States of America (“U.S. GAAP”). Information relating to the nature and effect of such differences is presented in Note 2931 to the consolidated and combined financial statements.5 As described in Notes 17Note 3(d) and 2112 to the consolidated and combined financial statements, Braskemthe Company changed the manner in which accounts for maintenance costs in 2006.certain subsidiaries are involved in significant legal proceedings involving exemptionIpiranga Química S.A. (“Ipiranga Química”) from its assessment of internal control over financial reporting as of December 31, 2007 because it was acquired by the Brazilian Social Contribution tax and a wage and salary adjustment clauseCompany in a collective labor agreement with the chemical workers union in the statepurchase business combination during 2007. We have also excluded Copesul, Ipiranga Petroquímica and Ipiranga Química from our audit of Bahia. Based on the opinionsinternal control over financial reporting. Copesul, Ipiranga Petroquímica and Ipiranga Química are subsidiaries whose total assets and total revenues represent 16.7% and 27.5%, respectively, of the Company’s external legal counselrelated consolidated financial statement amounts as of and management that losses in these cases are not probable, no provision for losses has been established for these proceedings.29, 2005
Auditores IndependentesBraskem S.A. and Its Subsidiaries Consolidated Balance Sheets at December 31 In millions of reais Assets 2007 2006 Current assets Cash and cash equivalents (Note 4) 1,890.1 1,547.1 Other investments (Note 5) 248.7 413.9 Trade accounts receivable (Note 6) 1,497.0 1,594.9 Inventories (Note 7) 2,264.3 1,767.3 Investment held for sale (Note 1(c)(xiv)) 136.7 - Taxes recoverable (Note 9) 310.3 408.1 Deferred income tax and social contribution (Note 17(b)) 63.0 20.6 Dividends and interest on capital receivable 3.9 - Prepaid expenses 72.5 84.6 Other receivables 109.8 114.5 6,596.3 5,951.0 Non-current assets Long-term assets - - Other investments (Note 5) 119.8 1.6 Trade accounts receivable (Note 6) 41.9 52.5 Inventories (Note 7) 22.8 22.9 Taxes recoverable (Note 9) 1,175.0 953.1 Deferred income tax and social contribution (Note 17(b)) 395.5 377.0 Judicial deposits and compulsory loan (Note 10) 107.7 90.5 Related parties (Note 8) 48.5 40.7 Other assets 47.9 58.8 1,959.1 1,597.1 Permanent assets Investments Jointly-controlled companies 6.9 6.5 Advances for acquisition of investments (Note 11(c)) 1,028.0 - Associated companies (Note 11) 24.5 26.2 Other investments 13.8 14.1 Property, plant and equipment (Note 12) 8,404.1 6,688.7 Intangible assets (Note 12) 172.4 129.5 Deferred charges, including goodwill (Note 13) 2,686.9 1,891.2 12,336.6 8,756.2 Total assets 20,892.0 16,304.3 Braskem S.A. and Its Subsidiaries Consolidated Balance Sheets at December31 In millions of reais (continued) Liabilities and shareholders' equity 2007 2006 Current liabilities Suppliers 2,967.9 3,022.1 Loans and financing (Note 14) 1,068.4 653.9 Debentures (Note 15) 111.6 1,157.7 Salaries and payroll charges 260.8 148.9 Taxes, charges and contributions 161.8 122.8 Income tax and social contribution 15.4 14.4 Interest on own capital and dividends payable (Note 20(e)) 307.9 41.4 Advances from customers 23.5 26.7 Creditors for investment acquisition (Notes 1(c)(vi) and 11(c)) 881.0 - Insurance premiums payable 9.4 50.0 Other liabilities 115.2 269.0 5,922.9 5,506.9 Non-current liabilities Long-term liabilities - - Suppliers 29.7 21.4 Loans and financing (Note 14) 6,401.9 3,935.8 Debentures (Note 15) 800.0 982.2 Taxes and contributions (Note 16) 1,145.8 1,322.0 Related parties (Note 8) - 4.8 Long-term incentives (Note 19) 4.9 2.3 Deferred income tax and social contribution (Note 17) 64.5 17.3 Private pension plans (Note 28) 35.7 64.2 Other liabilities 106.4 83.3 8,588.9 6,433.3 Deferred income Negative goodwill on investments in subsidiary companies 25.2 30.4 Minority interests 598.0 21.8 Shareholders' equity (Note 20) Capital 4,641.0 3,508.3 Capital reserves 458.1 408.7 Treasury shares (257.6) (255.6) Revenue reserves 1,013.8 748.8 Retained earnings (accumulated deficit) (98.3) (98.3) 5,757.0 4,311.9 Total liabilities and shareholders' equity 20,892.0 16,304.3 Braskem S.A. and Its Subsidiaries Consolidated Statements of Operations Years Ended December 31 In millions of reais, except amounts per shares (continued) 2007 2006 2005 Gross sales Domestic market 17,939.0 13,028.4 14,099.1 Foreign market 4,524.8 3,516.9 2,944.3 Taxes, freight and returns on sales (4,784.4) (3,552.6) (3,968.3) Net sales revenue 17,679.4 12,992.7 13,075.1 Cost of sales and services rendered (14,441.0) (10,792.1) (10,361.7) Gross profit 3,238.4 2,200.6 2,713.4 Operating expenses (income) Selling 554.2 399.0 261.9 General and administrative 684.3 552.5 525.2 Depreciation and amortization 479.1 385.0 355.6 Other operating income, net (Note 24) (131.5) (186.1) (22.8) 1,586.1 1,150.4 1,119.9 Operating income before equity accounting and financial income 1,652.3 1,050.2 1,593.5 Equity accounting Equity in the results of investees (0.1) 0.8 1.3 Amortization of (goodwill)/negative goodwill, net (106.2) (57.8) (152.5) Foreign exchange variation (11.6) (1.4) 3.6 Tax incentives 3.4 20.5 39.2 Reversal (provision) for loss (0.9) - - Other 8.1 9.1 (1.4) (107.3) (28.8) (109.8) Financial income (expenses) (Note 23) Financial expenses (180.1) (1,097.9) (675.8) Financial income (113.5) 159.5 (33.6) (293.6) (938.4) (709.4) Operating income 1,251.4 83.0 774.3 Non-operating income (expenses), net (Note 25) (67.2) 7.1 (25.2) Income before income tax and social contribution 1,184.2 90.1 749.1 Income tax and social contribution - - - Current (273.7) (88.1) (147.7) Deferred (103.3) 100.9 (29.6) Income before minority interests 807.2 102.9 571.8 Statutory employees' profit sharing (18.7) - - Minority interests (240.9) (1.6) 54.0 Net income for the year 547.6 101.3 625.8 Shares outstanding at the end of the year (thousands) 432,838 356,039 362,056 Net income per share at year end - R$ 1.2651 0.2845 1.7285 Braskem S.A. and Its Subsidiaries Statement of Changes in Shareholders' Equity In millions of reais Retained Capital reserves Revenue reserves earnings Tax Legal Retained Treasury (Accumulated Capital incentives Other reserve earnings shares deficit ) Total At December 31, 2004 3,403.0 344.2 0.6 34.6 454.7 (15.0 ) (38.4 ) 4,183.7 Tax incentives - 52.0 - - - - - 52.0 Interest on own capital (Note 20(f)) - - - - - - (270.0 ) (270.0 ) Net income for the year - - - - - - 625.8 625.8 Appropriations Legal reserve - - - 34.3 - - (34.3 ) - Proposed dividends (Note 20(e)) - - - - - - (55.7 ) (55.7 ) Retained earnings - - - - 325.7 - (325.7 ) - At December 31, 2005 3,403.0 396.2 0.6 68.9 780.4 (15.0 ) (98.3 ) 4,535.8 Capital increase (Notes 1(c) and 20(a)) 105.3 - - - - - - 105.3 Tax incentives - 11.9 - - - - - 11.9 Repurchase of shares (Note 20(c)) - - - - - (240.6 ) - (240.6 ) Effect of change in accounting practice (Note 12) - - - - - - (164.9 ) (164.9 ) Transfer from reserve for absorption of prior year adjustments (Note 20(d)) - - - - (164.9 ) - 164.9 - Net income for the year - - - - - - 101.3 101.3 Appropriations Legal reserve - - - 3.9 - - (3.9 ) - Proposed dividends (Note 20(e)) - - - - - - (36.9 ) (36.9 ) Retained earnings - - - - 60.5 - (60.5 ) - At December 31, 2006 3,508.3 408.1 0.6 72.8 676.0 (255.6 ) (98.3 ) 4,311.9 Capital increase (Note 1(b) and 20(a)) 1,132.7 - - - - (2.0 ) - 1,130.7 Dividends not redeemed and expired - - - - - - 0.3 0.3 Tax incentives - 49.4 - - - - - 49.4 Effect of exclusion of profits in subsidiaries inventories - - - - - - (4.4 ) (4.4 ) Transfer to reserve - - - - 0.2 - (0.2 ) - Net income for the year - - - - - - 547.6 547.6 Appropriations Legal reserve - - - 27.2 - - (27.2 ) - Proposed dividends (Note 20(e)) - - - - - - (278.5 ) (278.5 ) Retained earnings - - - - 237.6 - (237.6 ) - At December 31, 2007 4,641.0 457.5 0.6 100.0 913.8 (257.6 ) (98.3 ) 5,757.0 BRASKEM S.A. AND ITS SUBSIDIARIESBraskem S.A. and Its Subsidiaries Consolidated Statements of Changes in Financial Position Years Ended December 31 In millions of reais 2007 2006 2005 Financial resources were provided by Operations - - - Net income for the year 547.6 101.3 625.8 Expenses (income) not affecting working capital - - - Depreciation, amortization and depletion 1,203.6 962.4 841.5 Equity accounting - - - Equity in the results of investees 0.1 (0.8) (1.3) Amortization of goodwill (negative goodwill), net 106.2 57.8 152.5 Provision for loss on investments 0.9 - - Foreign exchange variation 11.6 1.4 (3.6) Tax incentives (3.4) (20.5) (39.2) Adjustment to investments' realization value 1.5 (11.4) 2.2 Impairment and disposal of long-lived assets 26.4 4.4 5.1 Long-term interest and monetary and exchange variations, net (719.4) 90.4 (54.4) Deferred tax expense (benefit) 103.7 (100.9) 29.6 Minority interest 240.9 1.6 (54.0) Assignment of rights to use - (19.7) (3.6) Tax recovery (110.1) (94.5) - Other (42.3) (16.1) (26.2) Total resulting from operations 1,367.3 955.4 1,474.4 Shareholders - - - Capital increase 1,132.7 110.9 2.5 Advance for future capital increase - - 0.2 Effect of working capital on change in interests 33.9 - - 1,166.6 110.9 2.7 Third parties - - - Transfer from long-term receivables to current assets 194.6 168.3 66.4 Decrease in long-term assets 295.9 28.4 123.3 Increase in long-term liabilities 3,612.9 2,290.1 2,036.1 Dividends receivable 2.0 2.0 2.0 Tax incentives 53.1 32.4 91.4 Working capital of merged companies, net 285.8 84.1 - Other 14.6 - 5.9 4,458.9 2,605.3 2,325.1 Total funds provided 6,992.8 3,671.6 3,802.2 Braskem S.A. and Its Subsidiaries Consolidated Statements of Changes in Financial Position Years Ended December 31 In millions of reais (continued) 2007 2006 2005 Financial resources were used for Dividends proposed and interest on own capital 302.9 66.2 331.3 Transfer from long-term liabilities to current liabilities 330.1 24.8 316.2 Transfer from long-term financing to current liabilities 482.6 1,767.8 504.2 Settlement of long-term financing 399.6 634.0 617.2 Decrease of current liabilities, net 3.9 4.3 117.8 Redemption of shares/debentures 110.1 192.7 9.1 Decrease in long-term liabilities 423.1 148.7 3.1 Increase in long-term receivables 204.2 202.4 507.7 Permanent assets - - - Investments 1,980.5 483.0 22.5 Property, plant, equipment and intangible assets 1,377.3 1,056.6 965.3 Deferred charges 1,149.2 40.3 87.6 Total funds used 6,763.5 4,620.8 3,482.0 Increase (decrease) in working capital 229.3 (949.2) 320.2 Changes in working capital Current assets - - - At the end of the year 6,596.3 5,951.0 5,837.5 At the beginning of the year 5,951.0 5,837.5 5,668.3 645.3 113.5 169.2 Current liabilities - - - At the end of the year 5,922.9 5,506.9 4,444.2 At the beginning of the year 5,506.9 4,444.2 4,595.2 416.0 1,062.7 (151.0) Increase (decrease) in working capital 229.3 (949.2) 320.2 CONSOLIDATED BALANCE SHEETS AT DECEMBER 31Table of ContentsBraskem S.A. and Its Subsidiaries Consolidated Statements of Cash Flows Years Ended December 31 In millions of reais 2007 2006 2005 Net income for the year 547.6 101.3 625.8 Adjustment to reconcile net income to cash provided Depreciation, amortization and depletion 1,203.6 962.4 841.5 Amortization of goodwill, net 106.2 57.8 152.5 Equity in earnings of associated companies 0.1 (0.8) (1.3) Provision for loss on investments 0.9 - - Tax incentives (3.4) (20.5) (39.2) Foreign exchange variation on investments 11.6 1.4 (3.6) Adjustment to realization value of investments and others (8.1) (11.4) 2.2 Loss on permanent assets disposed off 29.1 1.4 2.2 Interest and monetary and exchange variations, net (627.5) (1.3) (133.1) Minority interest 240.9 1.6 (54.0) Tax recovery (110.1) (94.5) - Deferred tax expense (benefit) 103.3 (100.9) 29.6 Other (42.5) 5.3 (30.9) Decrease (increase) in assets Other investments 253.9 (347.1) (82.1) Trade accounts receivable 493.8 53.9 161.7 Inventories 28.3 (148.2) (51.5) Taxes recoverable 313.5 (462.5) (130.3) Prepaid expenses 48.4 (56.7) 16.0 Other receivables 40.9 (25.8) (30.1) Increase (decrease) in liabilities Suppliers 286.2 415.0 485.1 Taxes and contributions payable (556.4) (66.5) (79.3) Tax incentives 53.1 32.4 91.2 Advances from customers (12.2) (24.4) (0.6) Other liabilities (7.4) 133.4 (52.4) Net cash provided by operating activities 2,393.8 405.3 1,719.4 Proceeds from sale of permanent assets 28.8 0.9 1.8 Effect of cash received from acquired subsidiaries 193.8 - - Additions to investments (1,345.5) (222.7) (34.0) Additions to property, plant, equipment and intangible assets (1,374.4) (953.0) (930.2) Additions to deferred charges (1,081.8) (40.3) (87.6) Dividends received 2.0 2.0 2.0 Net cash used in investing activities (3,577.1) (1,213.1) (1,048.0) In millionsTable of reaisContentsBraskem S.A. and Its Subsidiaries Consolidated Statements of Cash Flows Years Ended December 31 In millions of reais (continued) 2007 2006 2005 Short-term debt - - - Issuances 4,339.5 2,793.5 948.3 Repayment (5,887.6) (3,613.8) (2,338.8) Long-term debt - - - Issuances 3,579.8 2,235.8 1,624.7 Repayment (399.6) (659.1) (617.2) Quotas (shares) subject to mandatory redemption - - 400.0 Related parties - - - Issuances 2.0 0.2 0.2 Repayment (5.9) (4.1) (124.7) Dividends paid to shareholders and minorities (43.8) (343.4) (208.7) Share issuance 1.5 5.4 2.5 Treasury share re-issuances (purchases) - (192.7) - Repurchase of shares (60.2) - - Other 0.6 (2.6) (16.0) Net cash provided by (used in) financing activities 1,526.3 219.2 (329.7) Increase (decrease) in cash and cash equivalents 343.0 (588.6) 341.7 Represented by Cash and cash equivalents, at the beginning of the year 1,547.1 2,135.7 1,794.0 Cash and cash equivalents, at the end of the year 1,890.1 1,547.1 2,135.7 Increase (decrease) in cash and cash equivalents 343.0 (588.6) 341.7 Supplemental information Cash paid during the year for Interest 478.9 537.0 508.0 Income taxes 296.5 1.6 16.8 2004 2003 1,753.3 689.6 20.5 494.7 1,366.9 1,216.2 482.0 395.9 1,536.1 1,071.6 0.6 — — 1.1 117.8 121.4 56.9 87.0 5,334.1 4,077.5 23.1 27.1 34.8 62.7 89.8 49.2 198.6 191.3 303.8 166.0 256.1 640.6 50.4 115.6 9.3 12.9 965.9 1,265.4 55.7 37.7 35.0 34.5 5,397.2 5,352.9 3,105.0 3,175.5 8,592.9 8,600.6 14,892.9 13,943.5
F-13
BRASKEM S.A. AND ITS SUBSIDIARIESTable of Contents
| Braskem S.A. and Its Subsidiaries | |
| Consolidated Statements of Cash Flows | |
| Years Ended December 31 | |
| In millions of reais | (continued) |
Major non-cash transactions
CONSOLIDATED BALANCE SHEETS AT DECEMBER 31—(Continued)2007/2006/2005
In millions(i) Issue of reaisCompany shares and use of treasury shares to acquire minority interests in its subsidiaries (Notes 1(c)(ii)(vii) and (x)) affecting minority interests and share capital in the amount of R$ 19.2 and R$ 105.0 to Politeno and Polialden respectively.
2007
| 2004 | 2003 | |||||
Liabilities and shareholders’ equity | ||||||
Current liabilities | ||||||
Suppliers | 2,038.9 | 1,081.9 | ||||
Loans and financing | 1,775.6 | 2,726.5 | ||||
Debentures | 5.0 | 349.0 | ||||
Salaries and payroll charges | 95.6 | 81.7 | ||||
Taxes and social contributions payable | 230.2 | 152.4 | ||||
Interest on own capital and dividends payable | 191.6 | 7.3 | ||||
Advances from customers | 47.9 | 256.4 | ||||
Related parties | — | 0.2 | ||||
Insurance premiums payable | 53.2 | 72.6 | ||||
Other liabilities | 98.7 | 76.3 | ||||
| 4,536.7 | 4,804.3 | |||||
Long-term liabilities | ||||||
Suppliers | 74.1 | 61.3 | ||||
Loans and financing | 3,051.2 | 3,615.3 | ||||
Debentures | 1,167.9 | 1,143.0 | ||||
Advances for purchase of credit rights | — | 113.4 | ||||
Related parties | 115.7 | 177.6 | ||||
Deferred income tax | 9.3 | 9.8 | ||||
Taxes and contributions payable | 1,332.1 | 1,149.1 | ||||
Other liabilities | 121.2 | 133.5 | ||||
| 5,871.5 | 6,403.0 | |||||
Deferred income | ||||||
Negative goodwill on investments in subsidiary companies | 94.1 | 69.2 | ||||
Minority interest | 203.1 | 554.4 | ||||
Shareholders’ equity | ||||||
Capital | 3,403.0 | 1,887.4 | ||||
Capital reserves | 344.8 | 744.3 | ||||
Revenue reserves | 489.3 | — | ||||
Treasury shares | (15.0 | ) | (23.2 | ) | ||
Retained earnings (accumulated deficit) | (34.6 | ) | (495.9 | ) | ||
| 4,187.5 | 2,112.6 | |||||
Total liabilities and shareholders’ equity | 14,892.9 | 13,943.5 | ||||
(ii) Conversion of debentures into shares in the amount of R$ 1,113.5 under Brazilian GAAP (Note 15).
(iii) Advance to Ultrapar as a result of the acquisition of preferred shares held by minority shareholders of companies acquired in the amount of R$ 633.5 under Brazilian GAAP. (Note 11(c)).
2007/2006
(iv) Acquisition of Politeno shares settled in November 2007 in the amount of R$ 247.5 under Brazilian GAAP. (Note 1(c)(vi)).
2005
(v) Capitalization of investment with assignment of right to use in the amount of R$ 58.2 under Brazilian GAAP. (Note 11(b)).
The accompanying notes are an integral part of these financial statements.
F-14
BRASKEM S.A. AND ITS SUBSIDIARIES
CONSOLIDATED AND COMBINED STATEMENTS OF OPERATIONS
YEARS ENDED DECEMBER 31
In millionsTable of reais, except amounts per sharesContents
| Consolidated | Combined | ||||||||
| 2004 | 2003 | 2002 | |||||||
Gross sales | |||||||||
Domestic market | 13,406.2 | 9,927.0 | 7,810.3 | ||||||
Foreign market | 2,548.4 | 2,617.7 | 1,828.9 | ||||||
Taxes, freights and return on sales | (3,762.6 | ) | (2,408.9 | ) | (2,062.6 | ) | |||
Net sales revenue | 12,192.0 | 10,135.8 | 7,576.6 | ||||||
Cost of sales and services rendered | (9,078.3 | ) | (8,089.3 | ) | (6,175.5 | ) | |||
Gross profit | 3,113.7 | 2,046.5 | 1,401.1 | ||||||
Operating expenses (income) | |||||||||
Selling | 274.9 | 158.3 | 232.1 | ||||||
General and administrative | 375.1 | 313.6 | 345.6 | ||||||
Investment in associated companies | |||||||||
Equity in the results | (18.0 | ) | (13.6 | ) | (6.7 | ) | |||
Amortization of goodwill (negative goodwill), net | 152.7 | 256.0 | 294.4 | ||||||
Foreign exchange variation | 9.6 | (22.4 | ) | (39.3 | ) | ||||
Tax incentives and other | (53.4 | ) | (61.8 | ) | 3.3 | ||||
Depreciation and amortization | 359.4 | 193.5 | 222.4 | ||||||
Financial expenses | 1,291.0 | 712.6 | 3,481.5 | ||||||
Financial income | (60.3 | ) | (9.0 | ) | (619.6 | ) | |||
Zero-rated IPI credit | — | — | (1,030.1 | ) | |||||
Other operating income, net | (41.6 | ) | (49.7 | ) | (102.6 | ) | |||
| 2,289.4 | 1,477.5 | 2,781.0 | |||||||
Operating income (loss) | 824.3 | 569.0 | (1,379.9 | ) | |||||
Non-operating expenses, net | (29.9 | ) | (4.8 | ) | (98.0 | ) | |||
Income (loss) before income tax and social contribution | 794.4 | 564.2 | (1,477.9 | ) | |||||
Income tax and social contribution | |||||||||
Current | (217.3 | ) | (143.3 | ) | (128.0 | ) | |||
Deferred | 138.4 | 20.4 | 38.2 | ||||||
Income (loss) before minority interest | 715.5 | 441.3 | (1,567.7 | ) | |||||
Minority interest | (24.6 | ) | (226.2 | ) | 189.0 | ||||
Net income (loss) for the year | 690.9 | 215.1 | (1,378.7 | ) | |||||
Net income (loss) per shares outstanding at the end of the year—R$ (considering the retroactive effect of the 2005 share reverse split and share split for 2002) | 0.03 | 0.01 | (0.08 | ) | |||||
The accompanying notes are an integral part of these financial statements.
BRASKEM S.A. AND ITS SUBSIDIARIES
STATEMENTS OF CHANGES IN SHAREHOLDERS’ EQUITY
In millions of reais
| Capital | Capital reserves | Revenue reserves | Retained earnings (accumulated deficit ) | Total | ||||||||||||||||||||
| Capital restatement | Tax incentives | Other | Legal | Retained earnings | Treasury share | |||||||||||||||||||
At December 31, 2001 (combined) | 1,201.6 | 2.3 | 714.5 | 0.6 | 97.7 | — | (47.9 | ) | (239.8 | ) | 1,729.0 | |||||||||||||
Changes in treasury shares | — | — | — | — | — | — | 17.5 | — | 17.5 | |||||||||||||||
Capital increase | 643.8 | — | — | — | — | — | — | 821.0 | 1,464.8 | |||||||||||||||
Tax incentives | — | — | 0.4 | — | — | — | — | — | 0.4 | |||||||||||||||
Absorption of accumulated losses with legal reserve | — | — | — | — | (97.7 | ) | — | — | 97.7 | — | ||||||||||||||
Appropriation | — | — | — | — | — | — | — | — | — | |||||||||||||||
Interim dividends | ||||||||||||||||||||||||
Preferred class “A” and “B” shares—R$ 10.40 per thousand shares | — | — | — | — | — | — | — | (11.4 | ) | (11.4 | ) | |||||||||||||
Net loss for the year | — | — | — | — | — | — | — | (1,378.7 | ) | (1,378.7 | ) | |||||||||||||
Other | — | — | — | — | — | — | — | 0.2 | 0.2 | |||||||||||||||
At December 31, 2002 | 1,845.4 | 2.3 | 714.9 | 0.6 | — | — | (30.4 | ) | (711.0 | ) | 1,821.8 | |||||||||||||
Capital increase | 42.0 | (2.3 | ) | — | — | — | — | — | — | 39.7 | ||||||||||||||
Tax incentives | — | — | 28.8 | — | — | — | — | — | 28.8 | |||||||||||||||
Treasury share exchange | — | — | — | — | — | — | 7.2 | — | 7.2 | |||||||||||||||
Net income for the year | — | — | — | — | — | — | — | 215.1 | 215.1 | |||||||||||||||
At December 31, 2003 | 1,887.4 | — | 743.7 | 0.6 | — | — | (23.2 | ) | (495.9 | ) | 2,112.6 | |||||||||||||
Capital increase (Notes 1(c) and 20(a)) | 1,515.6 | — | — | — | — | — | — | — | 1,515.6 | |||||||||||||||
Exchange of shares | — | — | — | — | — | — | 8.2 | — | 8.2 | |||||||||||||||
Absorption of accumulated losses (Note 19(a)) | — | — | (463.2 | ) | — | — | — | — | 463.2 | — | ||||||||||||||
Tax incentives | — | — | 63.7 | — | — | — | — | — | 63.7 | |||||||||||||||
Prescribed dividends | — | — | — | — | — | — | — | 0.7 | 0.7 | |||||||||||||||
Interest on own capital (Note 20(e)) | — | — | — | — | — | — | — | (170.0 | ) | (170.0 | ) | |||||||||||||
Net income for the year | — | — | — | — | — | — | — | 690.9 | 690.9 | |||||||||||||||
Appropriations | ||||||||||||||||||||||||
Legal reserve | — | — | — | — | 34.6 | — | — | (34.6 | ) | — | ||||||||||||||
Proposed dividends | — | — | — | — | — | — | — | (34.2 | ) | (34.2 | ) | |||||||||||||
Retained earnings | — | — | — | — | — | 454.7 | — | (454.7 | ) | — | ||||||||||||||
At December 31, 2004 | 3,403.0 | — | 344.2 | 0.6 | 34.6 | 454.7 | (15.0 | ) | (34.6 | ) | 4,187.5 | |||||||||||||
The accompanying notes are an integral part of these financial statements.
BRASKEM S.A. AND ITS SUBSIDIARIES
CONSOLIDATED AND COMBINED STATEMENTS OF
CHANGES IN FINANCIAL POSITION
YEARS ENDED DECEMBER 31
In millions of reais
| Consolidated | Combined | ||||||||
| 2004 | 2003 | 2002 | |||||||
Financial resources were provided by | |||||||||
Operations | |||||||||
Net income (loss) for the year | 690.9 | 215.1 | (1,378.7 | ) | |||||
Expenses (income) not affecting working capital | |||||||||
Depreciation, amortization and depletion | 794.9 | 572.0 | 449.2 | ||||||
Amortization of goodwill (negative goodwill), net | 152.7 | 256.0 | 294.4 | ||||||
Investment in subsidiary and associated companies | |||||||||
Equity in the results | (18.0 | ) | (13.6 | ) | (6.7 | ) | |||
Foreign exchange variation | 9.6 | (22.4 | ) | (39.3 | ) | ||||
Tax incentives and other | (36.8 | ) | (61.8 | ) | 3.3 | ||||
Adjustment to investments realization value | (16.0 | ) | 3.8 | 41.5 | |||||
Impairment and disposal of long lived assets | 23.7 | 69.9 | 76.5 | ||||||
Long-term interest and monetary variations, net | (97.4 | ) | (94.4 | ) | 1,594.8 | ||||
Deferred tax expense (benefit) | (138.4 | ) | (20.4 | ) | (38.2 | ) | |||
Minority interest | 24.6 | 226.2 | (189.0 | ) | |||||
Recognition of tax credits, net of amounts realized | — | — | (813.4 | ) | |||||
Other | 39.1 | 93.0 | 46.8 | ||||||
Total resulting from operations | 1,428.9 | 1,223.4 | 41.2 | ||||||
Shareholders | |||||||||
Capital increase | 1,211.0 | — | 0.3 | ||||||
Advance for future capital increase | 0.6 | 2.9 | — | ||||||
Exchange of treasury stock | 8.2 | — | — | ||||||
Write-off of share premium | — | — | 6.6 | ||||||
| 1,219.8 | 2.9 | 6.9 | |||||||
Third parties | |||||||||
Transfer from long-term receivables to current assets | 510.0 | 374.2 | 73.9 | ||||||
Decrease in long-term assets | 59.6 | 964.1 | 189.3 | ||||||
Increase in long-term liabilities | 2,967.9 | 892.0 | 768.2 | ||||||
Dividends receivable | — | 1.2 | 2.4 | ||||||
Tax incentives | 111.9 | (65.6 | ) | 47.2 | |||||
Other | 0.6 | (0.2 | ) | 8.3 | |||||
| 3,650.0 | 2,165.7 | 1,089.3 | |||||||
Total funds provided | 6,298.7 | 3,392.0 | 1,137.4 | ||||||
BRASKEM S.A. AND ITS SUBSIDIARIES
CONSOLIDATED AND COMBINED STATEMENTS OF
CHANGES IN FINANCIAL POSITION
YEARS ENDED DECEMBER 31—(Continued)
In millions of reais
| Consolidated | Combined | ||||||||
| 2004 | 2003 | 2002 | |||||||
Financial resources were used for | |||||||||
Increase in long-term receivables | 151.6 | 164.3 | 180.9 | ||||||
Dividends proposed | 209.8 | 4.8 | 26.9 | ||||||
Transfer from long-term to current liabilities | 47.5 | 1,626.9 | 949.6 | ||||||
Transfer from long-term financing to current liabilities | 2,161.1 | — | — | ||||||
Settlement of long-term financing | 1,017.3 | — | — | ||||||
Decrease of current account liabilities, net | 55.5 | — | — | ||||||
Decrease in long-term liabilities | 126.1 | 108.2 | 89.7 | ||||||
Others | — | — | 4.2 | ||||||
Permanent assets | |||||||||
Investments | 23.6 | 71.7 | 13.1 | ||||||
Property, plant and equipment | 432.3 | 214.7 | 419.9 | ||||||
Deferred charges | 549.7 | 255.3 | 250.4 | ||||||
Net working capital of purchased companies | — | — | 175.6 | ||||||
Total funds used | 4,774.5 | 2,445.9 | 2,110.3 | ||||||
Increase (decrease) in working capital | 1,524.2 | 946.1 | (972.9 | ) | |||||
Current assets | |||||||||
At the end of the year | 5,334.1 | 4,077.5 | 3,550.4 | ||||||
At the beginning of the year | 4,077.5 | 3,550.4 | 2,308.4 | ||||||
| 1,256.6 | 527.1 | 1,242.0 | |||||||
Current liabilities | |||||||||
At the end of the year | 4,536.7 | 4,804.3 | 5,223.3 | ||||||
At the beginning of the year | 4,804.3 | 5,223.3 | 3,008.4 | ||||||
| (267.6 | ) | (419.0 | ) | 2,214.9 | |||||
Increase (decrease) in working capital | 1,524.2 | 946.1 | (972.9 | ) | |||||
The accompanying notes are an integral part of these financial statements.
BRASKEM S.A. AND ITS SUBSIDIARIES
CONSOLIDATED AND COMBINED STATEMENT OF CASH FLOWS
YEARS ENDED DECEMBER 31
In millions of reais
| Consolidated | Combined | ||||||||
| 2004 | 2003 | 2002 | |||||||
Net income (loss) for the year | 690.9 | 215.1 | (1,378.7 | ) | |||||
Adjustments to reconcile net income (loss) to cash provided by operating | |||||||||
Depreciation, amortization and depletion | 794.9 | 572.0 | 449.2 | ||||||
Amortization of goodwill (negative goodwill), net | 152.7 | 256.0 | 294.4 | ||||||
Equity in loss (earnings) of associated companies | (18.0 | ) | (13.6 | ) | (6.7 | ) | |||
Foreign exchange variation on investments | 9.6 | (22.4 | ) | (39.3 | ) | ||||
Tax incentives and other effects of investments in associated companies | (36.8 | ) | (61.8 | ) | 3.3 | ||||
Adjustment to realization value of investments | (16.0 | ) | 3.8 | 41.5 | |||||
Loss on permanent assets disposed of | 23.7 | 52.4 | 55.6 | ||||||
Interest and monetary and exchange variations | (339.5 | ) | (502.1 | ) | 1,838.8 | ||||
Deferred tax benefit | (138.4 | ) | (20.4 | ) | (38.2 | ) | |||
Minority interest | 24.6 | 226.2 | (189.0 | ) | |||||
Recognition of tax credit, net of amounts realized | — | — | (813.4 | ) | |||||
Other | 18.3 | 66.6 | 69.8 | ||||||
Decrease (increase) in assets: | |||||||||
Other investments | 21.1 | 124.6 | (425.3 | ) | |||||
Trade accounts receivable | (209.0 | ) | (238.9 | ) | (809.6 | ) | |||
Fair market value of derivative financial instruments | (4.1 | ) | 33.8 | (22.2 | ) | ||||
Inventories | (384.0 | ) | (197.3 | ) | (174.5 | ) | |||
Taxes recoverable | 289.4 | 321.2 | 52.1 | ||||||
Prepaid expenses | 29.6 | 26.0 | (14.0 | ) | |||||
Other receivables | 31.7 | 201.2 | 33.9 | ||||||
Increase (decrease) in liabilities: | |||||||||
Suppliers | 1,140.3 | (609.7 | ) | 1,482.5 | |||||
Taxes, charges and contributions | 150.9 | (57.4 | ) | 185.4 | |||||
Tax incentives | 111.9 | (65.6 | ) | 47.2 | |||||
Advances from customers | (212.3 | ) | 153.0 | 70.2 | |||||
Credit right | (113.4 | ) | — | — | |||||
Other payables | (69.1 | ) | 117.8 | 77.0 | |||||
Net cash provided by operating activities | 1,949.0 | 580.5 | 790.0 | ||||||
Proceeds from sale of permanent assets | — | 17.5 | 20.9 | ||||||
Additions to property, plant and equipment | (432.3 | ) | (214.7 | ) | (419.9 | ) | |||
Additions to investments | (23.6 | ) | (71.7 | ) | (13.1 | ) | |||
Additions to deferred charges | (549.7 | ) | (255.3 | ) | (250.4 | ) | |||
Dividends received | 0.8 | 63.8 | 11.7 | ||||||
Cash and cash equivalents of acquired businesses | — | — | 4.1 | ||||||
Net cash used in investing activities | (1,004.8 | ) | (460.4 | ) | (646.7 | ) | |||
BRASKEM S.A. AND ITS SUBSIDIARIES
CONSOLIDATED AND COMBINED STATEMENTS OF CASH FLOWS
YEARS ENDED DECEMBER 31—(Continued)
In millions of reais
| Consolidated | Combined | ||||||||
| 2004 | 2003 | 2002 | |||||||
Short-term debt, net | (2,495.1 | ) | (854.7 | ) | (566.8 | ) | |||
Long-term debt | |||||||||
Issuances | 2,454.3 | 1,693.5 | 1,142.0 | ||||||
Repayments | (991.6 | ) | (389.3 | ) | (1.8 | ) | |||
Related companies | |||||||||
Issuances | 40.2 | 833.6 | 1,140.6 | ||||||
Repayments | (109.2 | ) | (843.2 | ) | (1,920.9 | ) | |||
Dividends paid to shareholders and minority interests | (4.2 | ) | (72.3 | ) | (32.4 | ) | |||
Share issue | 1,211.0 | — | 14.4 | ||||||
Treasury share | 8.2 | — | — | ||||||
Other | 5.9 | 0.2 | (12.3 | ) | |||||
Net cash provided by (used in) financing activities | 119.5 | 367.8 | (237.2 | ) | |||||
Increase (decrease) in cash and cash equivalents | 1,063.7 | 487.9 | (93.9 | ) | |||||
Represented by | |||||||||
Cash and cash equivalents, at the beginning of the year | 689.6 | 201.7 | 295.6 | ||||||
Cash and cash equivalents, at the end of the year | 1,753.3 | 689.6 | 201.7 | ||||||
Increase (decrease) in cash and cash equivalents | 1,063.7 | 487.9 | (93.9 | ) | |||||
Supplemental information | |||||||||
Cash paid during the year for | |||||||||
Interest | 1,029.4 | 675.2 | 805.5 | ||||||
Income taxes | 13.9 | 0.3 | 0.5 | ||||||
Major non-cash transactions
The accompanying notes are an integral part of these financial statements.
BRASKEM S.A. AND ITS SUBSIDIARIES
NOTES TO THE CONSOLIDATED AND COMBINED FINANCIAL STATEMENTS
at December 31, 2004, 2003 and 2002
All amounts in millions of reais, unless otherwise indicated
| Notes to the Consolidated Financial Statements |
| at December 31, 2007, 2006 and 2005 |
| All amounts in millions of reais, unless otherwise indicated |
1 Operations
(a) Braskem S.A. (“Braskem”("Braskem") and its subsidiaries, including its jointly-controlled companies (together, “we”"we", “us”"us", “our”"our" or “the Company”"the Company"), is the onlylargest integrated petrochemical cracker and thermoplastics producer in Brazil, and produces a diversified portfolio of petrochemical products. Braskem’sBraskem's principal corporate objective is manufacturing, selling, importing and exporting chemical and petrochemical products and fuels, as well as producing and supplying utilities to companies in the Camaçari Petrochemical Complex, (the “Northeastern Complex”) in Bahia, and the Triunfo Petrochemical Complex, in Rio Grande do Sul, Brazil and rendering of services to those companies.
The companies acquired (Note 1(c)(xi)) are considered separate segments, resulting in a total of seven business units: Basic Petrochemicals; Polyolefins; Vinyls; Business Development; Copesul; Ipiranga Petroquímica; and Ipiranga Química.
(b) On May 16, 2007, the Company announced the temporary discontinuance of its PET resin production unit, located at Camaçari, Bahia. Braskem will continue to supply PET resin to all its customers through purchase agreements entered into with M&G Polímeros Brasil S.A. while the implementation of lower cost technology is being evaluated for the production unit.
(c) Formation of Braskem
Since its inception on August 16, 2002, the Company has undergone a major corporate restructuring process, disclosed to the market through material event notices. The major developments during 2005, 2006 and 2007 can be summarized as follows:
(i) Acquisition of control by Norquisa
Companhia Alagoas
Industrial S.A.'s shares
In 1995, as part of the Brazilian government’s privatization program,February 2005, pursuant to a Share Purchase and Sale Agreement entered into with Petrobras Química - Petroquisa S.A. (“Petroquisa”("Petroquisa"), the Company acquired 23,465,165 shares corresponding to 13.74% of the share capital of Companhia Alagoas Industrial ("CINAL"), for R$ 13.4. In this transaction, the Company recorded goodwill of R$ 0.4, which has been fully amortized.
(ii) Merger of Odebrecht Química S.A.
("Odequi") sold 32.8%into Braskem
At the Extraordinary General Meeting, held on March 31, 2005, shareholders approved the merger of Braskem’sOdequi into Braskem.
F-15
| Braskem S.A. and Its Subsidiaries |
| Notes to the Consolidated Financial Statements |
| at December 31, 2007, 2006 and 2005 |
| All amounts in millions of reais, unless otherwise indicated |
(iii) Petroquisa option to increase its interest in
the voting share capital.capital of the Company
On April 29, 2005, Odebrecht S.A. ("Odebrecht"), Nordeste Química S.A. (“Norquisa”("Norquisa"), a company owned by petrochemical producers locatedODBPAR Investimentos S.A. ("ODBPAR") and Petroquisa signed the second amendment of an agreement whereby Petroquisa was granted an option to increase its interest in the Northeastern Complex, acquired a portionvoting share capital of the Company by up to 30%, through the subscription of new shares soldof (i) petrochemical companies located at the Triunfo Petrochemical Complex, in Rio Grande do Sul; and (ii) other petrochemical companies considered strategic by the Company.
However, on March 31, 2006, due to absence of a final agreement on the terms and conditions, Petroquisa chose not to exercise the option to increase its percentage holding in the auction, and the reminder was acquired by various Brazilian pension funds. Through this auction, Norquisa became the Company’s controlling shareholder, with 58.4% of itsCompany's voting share capital.
(iv) Joint venture with Petroquímica Paulínia S.A.
("Petroquímica Paulínia")
(ii) EconômicoAt a meeting held on June 22, 2005, the boards of directors of the Company and Petroquisa approved capital expenditures of US$ 240.0 million to build a plant for the production of polypropylene in Paulínia, São Paulo. The investment was made through the joint venture company Petroquímica Paulínia, which was incorporated on September 16, 2005. On June 5, 2006, the board of directors of the Company approved an increase in the investment amount to US$ 356.0 million.
(v) Formation of Braskem Argentina S.R.L.
At a meeting held on November 8, 2005, the board of directors of the Company approved the formation of an entity in Argentina, named Braskem Argentina S.R.L., as a limited partnership, having as partners the Company and Braskem Distribuidora, holding 98% and 2% of the capital, respectively.
(vi) Acquisition of Politeno Indústria e
Comércio S.A. Empreendimentos (“ESAE”("Politeno") auctionshares
On April 4, 2006, Braskem acquired from Suzano Petroquímica, Sumitomo Chemical and related transactionsItochu Corporation 100% of the common and preferred shares of Politeno held by those companies, which comprised 62.2% of Politeno's total share capital.
Later in 1995, a Brazilian financial institution, Banco Econômico S.A. (“Banco Econômico”), collapsed, and the Central Bank intervened. At that time, Banco EconômicoFollowing such acquisition, Braskem held a majority100% of the voting share capital of Conepar—Companhia Nordeste de Participações (“Conepar”), which in turn held 35.0%and 96.16% of the votingtotal share capital of Politeno, Indústria e Comércio S.A. (“Politeno”) and 66.7%a company located in the Northeast Petrochemical Complex, with an annual production capacity of 360 thousand metric tons of polyethylene. The initial consideration paid by Braskem was R$ 237.5 (equivalent to US$ 111.3), which was subject to adjustment based on the performance of the voting share capitalentity acquired.
F-16
| Braskem S.A. and Its Subsidiaries |
| Notes to the Consolidated Financial Statements |
| at December 31, 2007, 2006 and 2005 |
| All amounts in millions of reais, unless otherwise indicated |
The Central Bank transferred Banco Econômico’s investment in Conepar to ESAE which was auctioned on July 25, 2001.
Nova Camaçari Participações S.A. (“Nova Camaçari”), an entity formed by the Odebrecht Groupfinal amount paid for the specific purposeshares was computed in November 2007, based on Politeno's average performance over the 18 months subsequent to the execution of participatingthe purchase and sale agreement, in accordance with the difference between the prices of polyethylene and those of ethylene in the auction, acquired ESAE in the auction. On the same date, Nova CamaçariBrazilian market, audited by an independent appraisal firm appointed by Braskem and the Odebrecht Group entered into the following coordinated transactions that were the first stepformer shareholders of Politeno. The balance due by Braskem, amounting to R$ 247.5, was paid in combining several Brazilian petrochemical companies into one company with integrated operations:
The acquisitions made by Nova Camaçari, described above, were performed for a total purchase price of R$ 1,448.9 for investments with a book value of R$ 160.0 resulting in goodwill of R$ 1,288.9. The goodwill was attributable to the expected future profitability of the operating companies acquired and is being amortized on the straight-line basis over ten years as from August 2001, in conformity with a forecast of annual profitability which is periodically reviewed. The Company acquired Nova Camaçari for a nominal amount (one hundred reais) and generated negative goodwill of R$ 45.9.
BRASKEM S.A. AND ITS SUBSIDIARIES
NOTES TO THE CONSOLIDATED AND COMBINED FINANCIAL STATEMENTS—(Continued)
at December 31, 2004, 2003 and 2002
All amounts in millions of reais, unless otherwise indicated
In September 2001, Nova Camaçari, Intercapital and Proppet were legally merged into Braskem. As a result Braskem held, directly and indirectly, 100% of the share capital of Conepar, as well as controlling and minority interests in several other petrochemical companies. We remained controlled by Norquisa. The Odebrecht Group owned 39.7% of the voting share capital of Norquisa and, together with the Mariani Group, held a combined 55.8% of the voting share capital of Norquisa. On July 27, 2001, Odebrecht Química S.A. (“Odequi”), a subsidiary of the Odebrecht Group, and Petroquímica da Bahia S.A. (“PQBA”), a subsidiary of the Mariani Group, entered into a shareholders’ agreement covering their direct and indirect equity interests in Norquisa and the Company. Considering this shareholders’ agreement and the related voting rights, the Company is controlled by the Odebrecht Group since July 2001. In addition, on July 3, 2001 and July 20, 2001, Odequi and PQBA entered into memorandum of understanding with other Braskem shareholders: Petroquisa, and the Brazilian pension funds of Petrobras S.A. (“Petrobras”) and Banco do Brasil S.A. Under this memorandum of understanding, Petroquisa had an option exercisable through April 30, 2005 to acquire from us and in certain circumstances from the Odebrecht Group an equity participation in our voting and total share capital that would provide it with the same participation as collectively held by the Odebrecht Group, PQBA and Norquisa. The option is exercisable using Petroquisa’s shares in COPESUL—Companhia Petroquímica do Sul (“Copesul”) as consideration.
The change in control of Braskem was reported in a timely manner to the Brazilian antitrust authorities. In July 2002, the Secretariat for Economic Monitoring of the Finance Ministry (“SEAE”) issued a favorable opinion on the operation. On May 2, 2003, the favorable opinion of the Secretariat for Economic Law (SDE) was published without any restriction. The operation was submitted for the review and analysis of the Administrative Council for Economic Defense (“CADE”), but has not been judged up to the present time.
The Company (through Nova Camacari) acquired (i) all of the share capital of Conepar and (ii) all the share capital of Proppet. The amounts paid in the auction and in the joint sale process This provision gave rise to goodwill of R$ 1,288.9 as follows:174.1.
Investment Acquired | Sellers | Purchase Price | Investments | Goodwill | ||||
100% of ESAE (56.31% of Conepar) | Banco Econômico | 785.0 | 87.6 | 697.4 | ||||
100% of Intercapital (31.92% of Conepar) | Nova Odequi Ltda. (51%)/Pronor Petroquímica S.A./CBP—Companhia Brasileira de Poliolefinas | 445.0 | 47.7 | 397.3 | ||||
11.76% of Conepar | BNDESPAR | 167.8 | 24.7 | 143.1 | ||||
Subtotal (Conepar) | 1,397.8 | 160.0 | 1,237.8 | |||||
100% Proppet | Nova Odequi Ltda. (49%)/Nitrocarbono S.A. | 51.1 | — | 51.1 | ||||
| 1,448.9 | 160.0 | 1,288.9 | ||||||
(vii) Merger of Polialden Petroquímica S.A.
("Polialden")
The Extraordinary General Meeting held on May 31, 2006 approved the merger of Polialden into the Company, through an exchange of shares and based on the book value of Polialden's shareholders' equity as of March 31, 2006, in the amount of R$ 289.9. The exchange ratio of Polialden shares for Braskem shares was determined based on the market value of shareholders' equity as of March 31, 2006, according to appraisal reports issued by an independent appraisal firm. This merger provision, resulted in the issuance of new shares by Braskem for the minority interests which exchanged shares (Note 20(a)), and in a cash payment by Braskem to minority interests that did not accept the share exchange.
Preferred shares of Polialden held by third parties were exchanged for Braskem class A preferred shares at the ratio of 33.62 class A preferred shares of Braskem for each 1,000 preferred shares of Polialden, which corresponded to an increase of 6.76% if compared to the ratio derived from the appraisal reports of the market value of shareholders' equity, as shown below:
| Braskem | Polialden | |||
| Current number of shares issued and outstanding | 362,523,521 | 645,253,380 | ||
| Market value of shareholders' equity (in R$) | 8,202,482,686.96 | 459,721,902.03 | ||
| Value per share based on the market value of | ||||
| shareholders' equity (in R$) | 22.626 | 0.713 | ||
| Exchange ratio - Shareholders' equity at market values | 31.49 | 1.00 |
F-17
| Braskem S.A. and Its Subsidiaries |
| Notes to the Consolidated Financial Statements |
| at December 31, 2007, 2006 and 2005 |
| All amounts in millions of reais, unless otherwise indicated |
| Braskem | Polialden | |||
| Book value of shareholders' equity (in R$) | 4,650,559,014.63 | 289,940,899.44 | ||
| Value per share based on the book value (in R$) | 12.828 | 0.449 | ||
| Ratio of exchange of Polialden preferred shares for | ||||
| Braskem class "A" preferred shares in the merger | 33.62 | 1.00 |
The equity variations determined during the period from the merger base date to the completion of the merger were recorded in the statement of operations of Braskem as equity in earnings.
The balance of goodwill generatedas of the merger date amounted to R$ 337.3 and was based on expectations of future profitability. Such amount was reclassified to deferred charges after the merger. Negative goodwill after the merger was no longer related to any investment and, therefore, the amount of R$ 53.0 was written off on the statement of operations under amortization of goodwill (negative goodwill), net in 2006.
Upon the merger of Polialden, the Company's share capital was increased by R$ 105.3, through the acquisitionissuance of Conepar was subsequently allocated to Conepar’s operating investees: Polialden and Politeno.
BRASKEM S.A. AND ITS SUBSIDIARIES(viii) Cinal spin-off
NOTES TO THE CONSOLIDATED AND COMBINED FINANCIAL STATEMENTS—(Continued)
at December 31, 2004, 2003 and 2002
All amounts in millions of reais, unless otherwise indicated
In summary,From May 19, 2006 through June 9, 2006 the Company acquired (i) 42.64%13.18% of the minority interests in Cinal. The purchase price was R$ 10.9, and the goodwill recorded was R$ 0.1. Following the acquisition, the Extraordinary General meeting held on July 20, 2006 approved the partial spin-off of Cinal and the related merger of Cinal's industrial assets into the Company. The spin-off did not have any impact in the consolidated financial statements of the Company, because Cinal was under common control.
(ix) Formation of Braskem Europe B.V.
At a meeting held on September 29, 2006, the board of directors of the Company approved the formation of an entity in The Netherlands, named Braskem Europe B.V. ("Braskem Europa"), as a limited liability partnership, with the Company as partner holding 100% of the capital.
F-18
| Braskem S.A. and Its Subsidiaries |
| Notes to the Consolidated Financial Statements |
| at December 31, 2007, 2006 and 2005 |
| All amounts in millions of reais, unless otherwise indicated |
(x) Merger of Politeno
At the Extraordinary General Meeting held on April 2, 2007, shareholders approved the merger of Politeno, based on its shareholders' equity as of December 31, 2006, amounting to R$ 499.0. The exchange ratio of Politeno shares for Braskem shares was determined based on the companies' shareholders' equity at book value, based on appraisal reports issued by an independent appraisal firm.
The Company's share capital was increased by R$ 19.2 to R$ 3,527.4 through the issuance of Polialden, (ii) 30.99%1,533,670 class A preferred shares.
In order to maintain the current capital structure of Braskem, comprising 1/3 common shares and 2/3 preferred shares, the share capitalconversion of Politeno, and (iii) all486,530 class A preferred shares into common shares was approved.
(xi) Acquisition of the remaining share capital of Proppet. The amounts paid in the auction and in the joint sale process gave rise to goodwill of R$ 1,288.9 under Brazilian GAAP as follows:Ipiranga Group
Investment Acquired | Purchase Price | Book Value of Investments | Goodwill | |||
30.99% of Politeno | 739.4 | 56.9 | 682.5 | |||
42.64% of Polialden | 658.4 | 103.1 | 555.3 | |||
Subtotal (100% of Conepar) | 1,397.8 | 160.0 | 1,237.8 | |||
100% of Proppet | 51.1 | — | 51.1 | |||
| 1,448.9 | 160.0 | 1,288.9 | ||||
(iii) Mergers with OPP Produtos Petroquímicos S.A. (“OPP PP”) and acquisition of 52114On April 18, 2007, Ultrapar Participações S.A. (“52114”("Ultrapar")
On August 16, 2002, for itself and acting as agent for the Company and Petróleo Brasileiro - S.A. - Petrobras ("Petrobras"), acquired for R$ 2,113.1 the equivalent to create a more fully integrated petrochemical company:
Pursuant to the agreement among Ultrapar, Braskem and Petrobras, the Company now controls certain petrochemical assets, represented by Ipiranga Química S.A. ("Ipiranga Química"), Ipiranga Petroquímica S.A. ("IPQ") and IPQ's interest in Companhia Petroquímica do Sul ("Copesul"). Assets associated with oil refining operations held by RPI are shared on equal terms by Petrobras, Ultrapar and Braskem.
Under the agency agreement, Ultrapar was merged into the Company which issued shares representing 43.7%responsible for carrying out a corporate reorganization of the voting and total share capitalacquired companies, with the purpose of segregating the assets assigned to each acquiring company. The stages of this process include the Odebrecht Group. This was a transaction between parties under common control and has been reflected retroactively in the financial statements since July 2001 when OPP PP and the Company initially came under common control. The principal assets of OPP PP were 81.3% of the total share capital of OPP Química S.A. (“OPP Química”), representing 100% of its voting share capital, (OPP Química, in turn, owned 64.6% of the voting share capital of Trikem) and 29.46% of the total share capital and voting share capital of Copesul; and
following:
The Company assumed the goodwill amounts already recorded in the legally merged companies, being, in August 2002, as follows: (1) R$ 1,935.4 in OPP PP directly related to expected future profitability and fair values of property, plant and equipment of OPP Química and Trikem; (2) R$ 281.6 in OPP PP relating to its participation in Copesul, based on expected future profitability; and (3) R$ 56.6 in 52114 directly related to fair values of property, plant and equipment of the then subsidiary Nitrocarbono.
(iv) Exchange(a) Tag-along public tender offer for remaining shares of Nitrocarbono and incorporation of subsidiaries
In February 2003, as a result of Braskem’s merger with 52114 and as required by the Brazilian Corporation Law, a public exchange offer was made for the remaining voting share capital of Nitrocarbono not owned by the Company. On February 13, 2003, immediately following Braskem’s purchase of the shares tendered in this exchange offer, Braskem owned 99.99% of the voting share capital of Nitrocarbono, representing 93.80% of its total share capital.
On March 31, 2003, OPP Química, ESAE and Nitrocarbono were legally merged into the Company. Before Braskem’s legal merger with OPP Química, Odebrecht Química transferred the shares of OPP Química that it owned to the Company.
BRASKEM S.A. AND ITS SUBSIDIARIES
NOTES TO THE CONSOLIDATED AND COMBINED FINANCIAL STATEMENTS—(Continued)
at December 31, 2004, 2003 and 2002
All amounts in millions of reais, unless otherwise indicated
(v) Sale of Norcell S.A. (“Norcell”) shares and acquisition of Cetrel S.A.—Empresa de Proteção Ambiental (“Cetrel”) shares
On July 31, 2003, we sold 75% of the total capital of our subsidiary Norcell to affiliates of Klabin S.A. (“Klabin”) for R$ 74.6. This amount was originally to be received in 32 quarterly installments as from October 2003, but in September 2003 we negotiated early settlement of this receivable for a discount of R$ 28.1. In connection with this transaction, we agreed to transfer an additional 10.54% of Norcell’s total capital to Klabin in exchange for 4.99% of the common shares of Cetrel ownedRPI, DPPI and CBPI.
(b) Merger of outstanding shares of RPI, DPPI and CBPI into Ultrapar.
F-19
| Braskem S.A. and Its Subsidiaries |
| Notes to the Consolidated Financial Statements |
| at December 31, 2007, 2006 and 2005 |
| All amounts in millions of reais, unless otherwise indicated |
(c) Segregation of assets, as follows: (i) transfer of the petrochemical assets then held by Klabin. Ultrapar, to be subsequently delivered to Braskem and Petrobras, in accordance with the agency agreement; and (ii) spin-off of CBPI in order to transfer the northern distribution assets to a subsidiary of Petrobras.
As referred to in item (a) above, on October 22, 2007 a result,public tender offer auction was carried out for the Company’s participation in Cetrel’s total capital increased from 27.17% to 33.92%.
(vi) Acquisitionacquisition of outstanding common shares of TrikemDPPI and Polialden held by Mitsubishi Chemical Corporation (“Mitsubishi”RPI, at a price per share of R$ 112.88 and R$ 107.05, respectively. The acquisition included: (i) 82% of outstanding common shares of RPI, thus increasing Ultrapar's interest in voting share capital from 61.6% to 93.1%, and (ii) 77% of outstanding common shares of DPPI, thus increasing Ultrapar's interest in voting share capital from 84.2% to 96.1% . Total amount disbursed was R$ 473.0, of which Braskem disbursed R$ 156.7.
The CBPI auction was conducted on November 8, 2007. The offer price was R$ 64.91 per share.
Through a public tender offer on October 5, 2007, the Company's subsidiary EDSP58 Participações Ltda. ("EDSP58") and Nissho Iwai Corporation (“Nisso Iwai”)
In July 2003, the Company increased its direct and indirect participation in the voting capitalacquired 34,040,927 common shares of its subsidiaries Trikem and Polialden to 87.9% and 100%, respectively, in transactions with the minority shareholders Nissho Iwai and Mitsubishi. Mitsubishi sold its participations in Trikem and PolialdenCopesul for R$ 28.0 and R$ 21.6, respectively, which includes R$ 5.4 payable when the claim brought by Polialden’s shareholders is settled. Additionally, further consideration of R$ 16.2 is payable to Mitsubishi should settlement of this claim be favorable to Polialden. Nissho Iwai exchanged its participations in Trikem and Polialden for a participation in Braskem resulting in an increase in Braskem’s capital of R$ 39.7.
(vii) Purchase of Trikem minority interests and upstream merger
On December 4, 2003, immediately following a Brazilian public exchange offer for the outstanding minority interests of Trikem in exchange for shares of the Company, we owned 52.33%38.02 per share, representing 98.63% of the total capitalshares eligible to participate in the offer. The financial settlement occurred on October 10, 2007 and the amount paid was approximately R$ 1,294.2, of Trikem. At an extraordinary general meeting held on January 15, 2004,which Braskem paid R$ 776.5. On October 18, 2007, the Company’s shareholders approved the upstream merger of Trikem into Braskem. As a result of the upstream merger, the Company acquired the remaining minority interests representing 46.4% of the total share capital of Trikem. The Company’s capital was increased by R$ 304.6 through the issue of 8,136,165,484 Class A preferred shares to be delivered to other shareholders of Trikem. Common shares were increased by 0.5% through the conversion of 121,948,261 Class A preferred shares into common shares.
(viii) Monômeros
Under an agreement for Purchase and Sale of Shares, dated February 3, 2004, the Company purchased the outstanding minority shareholders of Copene Monômeros Especiais S.A. (“Monômeros”), becoming owner of 100% of the shares of this subsidiary. The acquisition price totaled R$ 14.8, corresponding to the book value of the shares acquired as at December 31, 2003. On March 31, 2004, the Extraordinary General Meeting approved the upstream merger of Monômeros into Braskem.
(ix) Acquisition of minority interests of Polialden
On December 14, 2004, the Board of Directors approved the use of 505,050,433 Class A preferred shares of the Company, held in treasury, to be exchanged for 47,846,610 preferred shares of the subsidiary Polialden, held with third parties. In this transaction, the Company recorded negative goodwill of R$ 28.8. The Brazilian Securities Commission (Comissão de Valores Mobiliários or “CVM”- "CVM") approved the exchangedelisting of Copesul's common shares from the BOVESPA.
As less than 5% of Copesul's share capital remained outstanding, Copesul's board of directors negotiated directly with these shareholders and purchased their common shares, outsideoffering the São Paulo Stock Exchange.
BRASKEM S.A. AND ITS SUBSIDIARIES
NOTES TO THE CONSOLIDATED AND COMBINED FINANCIAL STATEMENTS—(Continued)
On December 6, 2007, the merger of EDSP58 into Copesul was approved. As a consequence, 35,710,357 common shares in Copesul held by EDSP58 were cancelled and Copesul's share capital was decreased by R$ 378.4, resulting in share capital at December 31, 2004, 2003 and 20022007 of R$ 531.6.
All amounts in millionsOn June 28, 2007, Braskem's indirect subsidiary EDSP67 Participações S.A. acquired 100% of reais, unless otherwise indicatedthe outstanding shares of IPQ, representing 7.61% of its total share capital. Braskem paid R$ 117.9 for this acquisition. As a result of this acquisition, the CVM approved the delisting request of IPQ on July 18, 2007.
F-20
| Notes to the Consolidated Financial Statements |
| at December 31, 2007, 2006 and 2005 |
| All amounts in millions of |
(xii) Acquisition of Shares and Merger of Tegal
On April 1, 2004,30, 2007, Braskem acquired 3.11% and 1.06% of quotas in TEGAL - Terminal de Gases Ltda. ("Tegal"), owned by Oxiteno Nordeste S.A. Indústria e Comércio ("Oxiteno") and Dow Brasil Nordeste Industrial Ltda., respectively. Following the Boardacquisition, Braskem held 100% of Directorsthe capital of Tegal, a company located in the Aratu Port, at Camaçari, Bahia, that provides services for the storage and movement of liquefied gases. The amount paid by Braskem was R$ 1.1, giving rise to goodwill of R$ 0.5, fully amortized to income, in accordance with CVM Instruction 247/96.
At the Extraordinary General Meeting held on July 31, 2007, shareholders approved the initial public offeringmerger of ClassTegal, based on its shareholders' equity as of May 31, 2007, amounting to R$ 12.9. Changes in shareholders' equity between May 31, 2007 and the date of merger were recognized in the statement of operations of Braskem.
(xiii) Conversion of ODBPAR INV S.A. Debentures
On June 18, 2007, Odebrecht S.A. ("Odebrecht"), through ODBPAR INV S.A. ("ODBPAR INV"), exercised its right to convert into shares of Braskem 100% of its 59,185 convertible subordinated debentures, in accordance with the indenture, upon maturity of the debentures. The debentures were converted into shares of Braskem on July 31, 2007 (Note 20(a)).
(xiv) Acquisition of Petroflex Shares
On August 15, 2007, the Company exercised its right of first refusal to acquire shares issued by Petroflex Indústria e Comércio S.A. ("Petroflex") owned by SPQ Investimentos e Participações Ltda., a subsidiary of Suzano, due to the sale of control of such subsidiary to Petrobras.
Upon transfer of the shares, on October 31, 2007, Braskem's interest in the total share capital of Petroflex increased from 20.12% to 33.53%, and its interest in the voting share capital increased from 20.14% to 33.57% . The right of first refusal was exercised at the book value of Petroflex, and in September 2007, the Company paid R$ 61.0 for this acquisition.
In December 2007, Braskem entered into a Share Purchase Agreement under which the Company has agreed to sell all its shares in Petroflex which has been classified as an Investment held for sale at the book value of the net investment of R$136.7, to Lanxess Deutschland GmbH for an aggregate price of R$ 252.1. On April 1, 2008, this transaction was completed, as described in Note 30(d).
F-21
| Braskem S.A. and Its Subsidiaries |
| Notes to the Consolidated Financial Statements |
| at December 31, 2007, 2006 and 2005 |
| All amounts in millions of reais, unless otherwise indicated |
(xv) Petrobras Transaction
On November 30, 2007, Braskem entered into an investment agreement with our controlling shareholder Odebrecht, Petrobras, Petroquisa and Odebrecht's subsidiary Nordeste Química S.A.- Norquisa, or "Norquisa", which we refer to as the "Petrobras Investment Agreement". We refer to the transactions under the Petrobras Investment Agreement collectively as the "Petrobras Transaction". Under the Petrobras Investment Agreement, the Petrobras Transaction will be completed in two phases. In the first phase Petroquisa will contribute the following assets to Braskem:
In the second phase Petroquisa will contribute the following assets to Braskem:
In exchange for these assets, assuming that the Triunfo Option is exercised in full, Braskem will issue an aggregate of 46,903,320 common shares and 56,531,819 class A preferred shares to Petroquisa. In the event that Petroquisa contributes less than 100% of the share capital of Triunfo to Braskem, Petrobras and Petroquisa may, in Braziltheir discretion, contribute an amount in cash equivalent to the economic value of the share capital of Triunfo not contributed to Braskem or elect to have the number of shares issued to them reduced to reflect the economic value of the share capital of Triunfo not contributed to Braskem.
As a result of the completion of the Petrobras Transaction, assuming that the Triunfo Option is exercised in full, Petrobras and overseas,Petroquisa will own, directly and indirectly, 25.0% of our total share capital, including 30.0% of our voting share capital, and Braskem will own, directly and indirectly:
F-22
| Braskem S.A. and Its Subsidiaries |
| Notes to the Consolidated Financial Statements |
| at December 31, 2007, 2006 and 2005 |
| All amounts in millions of reais, unless otherwise indicated |
The Petrobras Transaction will be implemented through an exchange of shares (incorporação de ações) to be approved by the shareholders of Braskem, Copesul, Ipiranga Química, Ipiranga Petroquímica, Paulínia and Triunfo, on or prior to May 30, 2008, see Note 30 (f).
(xvi) Capital increase in capital within the authorized capital limit.
of Petroquímica Paulínia S.A. ("Petroquímica Paulínia")
On September 22November 16, 2007, the Company and 27, 2004,Petrobras paid up for Petroquímica Paulínia shares with shares of CPP - Companhia Petroquímica Paulista ("CPP") at market value. On November 20, 2007, the Boardmerger of Directors approved the issues of 12,285,000,000 and 1,170,000,000 shares, respectively, in the amount of R$ 90.00 per thousand shares, to be subscribed in Brazil and US$ 31.38 per thousand shares, to be subscribed overseas.CPP into Petroquímica Paulínia was approved.
The closing of the offering occurred on September 28, 2004, after the payment of capital in the amount of R$ 1,211.0.
| (d) |
In accordance with the law, the concentration resulting from the change in control of Braskem was notified in a timely manner to the antitrust authorities. In July 2002, the Secretariat for Economic Monitoring of the Finance Ministry (SEAE) issued a favorable opinion on the transaction. On May 2003, the favorable opinion of the Secretariat for Economic Rights (SDE) was published without any restrictions. The transaction was submitted for the review and analysis of the Administrative Council for Economic Defense (CADE),- CADE
On April 25, 2007, the Company and CADE entered into an agreement to preserve the reversibility of Ipiranga transaction, under which Braskem has undertaken to maintain the normal conditions of free competition in the polyethylene and polypropylene markets prevalent before April 18, 2007 and to refrain from taking the following actions with respect to the petrochemical assets of the Ipiranga Group, until a final decision on the transaction is issued:
F-23
| Braskem S.A. and Its Subsidiaries |
| Notes to the Consolidated Financial Statements |
| at December 31, 2007, 2006 and 2005 |
| All amounts in millions of reais, unless otherwise indicated |
With regard to Copesul, CADE expressed no objections to the transaction, withoutsince the Company and Petrobras will continue to be controlling and minority shareholders, respectively, as prior to April 18, 2007 under the shareholders' agreement then in effect.
CADE may decide to review the agreement at any restrictions. In February 2004,time or may do so at the transaction was examined by the Federal Department of Public Prosecution, which also recommended the approvalrequest of the transaction. On September 27, 2004,companies if, in the discretion of CADE's full board, the parties are able to prove that the reasons that gave rise to the agreement are no longer relevant.
(e) Corporate governance
Braskem agreed to comply with Level 1 of the Corporate Governance Standards of the Bovespa, which mainly commits the Company filedto (i) provide additional information to the market; and (ii) increase the percentage of capital available for trading in the market, which Braskem satisfied through the Global Offering in 2004, reaching a request for the approvalfree float of approximately 47%. The Company intends to reach Level 2 of Corporate Governance Standards of the transaction arguing thatBovespa in due time.
2 Presentation of the statute of limitation to judge the transaction had taken effect. In February 2005, CADE Prosecution Service issued an opinion disapproving the transaction based on lapse of time. The claim is currently waiting inclusion in the agenda for judgment by CADE’s Plenary Session.
The financial statements have been prepared in accordance with the accounting practices adopted in Brazil (“("Brazilian GAAP”GAAP"), which are based on:
The consolidated financial statements prepared by the Company for statutory purposes, which include the stand-alone financial statements of Braskem S.AS.A. (holding company), were filed with the CVM inon February 2005.20, 2008. The financial statements presented herein do not include the holding company’scompany's stand-alone financial statements and are not intended to be used for statutory purposes.
F-24
The following reclassifications were made in 2003, for a better presentation and comparison between 2004 and 2003:
BRASKEM S.A. AND ITS SUBSIDIARIESContents
NOTES TO THE CONSOLIDATED AND COMBINED FINANCIAL STATEMENTS—(Continued)
at December 31, 2004, 2003 and 2002
All amounts in millions of reais, unless otherwise indicated
| Notes to the Consolidated Financial Statements |
| at December 31, 2007, 2006 and 2005 |
| All amounts in millions of reais, unless otherwise indicated |
3 Significant Accounting Practices
(a) Use of estimates |
In the preparation of the financial statements, it is necessary to use estimates to record certain assets, liabilities and transactions. The Company's financial statements of the Company include, therefore, various estimates regarding the selection of the useful lives of property, plant and equipment, deferred charges, amortization periods, as well as provisions for contingencies, income tax pension plan assumptions, valuation of derivative and financial instruments, allowance for doubtful accounts, impairment provisions for property, plant and equipment and other similar amounts.
| (b) Revenue recognition and other |
Revenue is recognized for productproducts sales when risk and title to the product are transferred to the Company’sCompany's customers.
Title generally passes to customer when the product is delivered to our customers or their freight carriers. For the year ended December 31, 2002, the Company recognized revenue for product sales when shipped. This change in practice resulted in a reduction in operational income of R$ 3.9 in 2003.
Shipping and handlingFreight expenses are reported within net sales and amounted R$ 285.4,609.1, R$ 171.1366.9 and R$ 145.6340.2 in 2004, 20032007, 2006 and 2002,2005, respectively.
Results of operations are determined on the accrual basis of accounting. The provisions for income tax and the value-added tax on sales and services (Imposto Sobre asobre Circulação de Mercadorias e Serviços, or “ICMS”"ICMS") expenses are recorded gross of the tax incentive portions, with the amounts related to tax exemptionexemptions and reductiontax reductions recorded inunder capital reserves.
In accordance with the requirementsMonetary and exchange variations of CVM Deliberation 273 and Instruction 371, deferred income tax is stated at expected realizable value, as described in Note 18(b).
Exchange variations on foreign currency assets and liabilities are recordedclassified as financial income and financial expenses, respectively.
The Company has recognized in the results of each year the change in market value of derivative instruments related to liabilities indexed to foreign currency or international interest rates. See Notes 22 and 23.
Advertising expenses are expensedrecorded when incurred and were not significant for the years presented herein.
Earnings per share are calculated based on the number of outstanding shares on the balance sheet date.
The Company has recognized in results for the year the market valueF-25
The sales transactions between the Company and the merged companies (Note 1(b)(iv)) from January 1 and March 31, 2003 have been eliminated, and the taxes resulting from these sales, in the amount of R$ 24.2, were classified as “Other operating expenses”.
Contents
| Notes to the Consolidated Financial Statements |
| at December 31, 2007, 2006 and 2005 |
| All amounts in millions of reais, unless otherwise indicated |
(c) Current and non-current assets
Cash and cash equivalents consist principally of cash deposits and marketable securities or investments maturing within 90 days or less.
less or which can be liquidated immediately in a secondary market (Note 4).
Other investments refers basically to marketable securities that are recorded at the lower of cost and market value, except for derivative instruments.
including accrued income earned up to the balance sheet date which is not significantly different from market value.
Derivative instruments are recorded at lower of cost and their estimated fair value, based on market quotations for similar instruments as to future foreign exchange and future interest rates. The Company has recognized in results for the year changes in the market value of derivative contracts relating to cross-currency interest rate and cross-currency interest rate swaps.
BRASKEM S.A. AND ITS SUBSIDIARIES
NOTES TO THE CONSOLIDATED AND COMBINED FINANCIAL STATEMENTS—(Continued)
at December 31, 2004, 2003 and 2002
All amounts in millions of reais, unless otherwise indicated
The allowance for doubtful accounts is set up at an amount considered sufficient to cover estimatedprobable losses on the realization of the receivables, taking into account the Company’sCompany's loss experience, and includes amounts subject to litigation.experience. In order to determine the overall adequacy of the allowance for doubtful accounts, we evaluate the amount and characteristics of our accounts receivable on a quarterlymonthly basis.
Inventories are stated at average purchase or production cost, which is lower than replacement cost or realizablerealization value. Imports in transit are stated at the accumulated cost of each import. Inventories of consumable materials ("Warehouse") are classified in current assets or long-term receivables,assets, considering their history of consumption.
Deferred tax assets are recognized in accordance with CVM Deliberation no. 273 and CVM Instruction No. 371, when recoverability is more likely than not.probable. Valuation allowances are recorded when necessary.for the amounts that will be recovered after ten years. Tax deductible goodwill generates an income tax benefit to the extent that it has been amortized.
Judicial deposits are stated net of the related contingent liabilities, pursuant to CVM Deliberation 489/05.
The otherOther assets are shown at realizable values, including, where applicable, accrued income and monetary variations, or at cost in the case of prepaid expenses.
| (d) Permanent assets |
Permanent assets are stated at cost indexed for inflation through December 31, 1995, and take into consideration the following:
F-26
| Braskem S.A. and Its Subsidiaries |
| Notes to the Consolidated Financial Statements |
| at December 31, 2007, 2006 and 2005 |
| All amounts in millions of reais, unless otherwise indicated |
the considerationamount paid and the book value of the net assets acquired. Total goodwill is divided between the fair values of assets and expected future profitability of the investees and is amortized over the useful life of the related assets or up to ten years in the case of future profitability. Goodwill in merged companies is presentedtransferred to property, plant and equipment and deferred charges, when based on asset appreciation and future profitability of the balance sheet within deferred charges.investees, respectively. Other investments are carried at the cost of acquisition.
acquisition adjusted for any permanent loss, if applicable;
BRASKEM S.A. AND ITS SUBSIDIARIES
NOTES TO THE CONSOLIDATED AND COMBINED FINANCIAL STATEMENTS—(Continued)
at December 31, 2004, 2003 and 2002
All amounts in millions of reais, unless otherwise indicated
These liabilities are stated at known or estimated amounts, including accrued charges and monetary and exchange adjustments, whenas applicable.
Defined benefit pension plans are accounted for based on the calculations performedmade by independent actuaries, based on assumptions determinedprovided by the Company.
Provisions are recorded based on (i) existingcurrent legislation (even ifwhen management believes that this legislation is expectedmay be considered unconstitutional); (ii) the need to be overturned as unconstitutional), (ii) for elimination ofeliminate contingent gains resulting from compensationthat may be obtained by offsetting credits received as a result of tax credits which arose from judicial disputesclaims; and (iii) estimated payments of indemnities considered probable.
F-27
| Braskem S.A. and Its Subsidiaries |
| Notes to the Consolidated Financial Statements |
| at December 31, 2007, 2006 and 2005 |
| All amounts in millions of reais, unless otherwise indicated |
(f) Deferred income
Deferred income includes negative goodwill of merged companies, supported by the expected future profitabilityresults of those companies.
The combined, statements of operations, changes in shareholders’ equity, changes in financial position and cash flows include results of OPP Produtos Petroquímicos S.A. (“OPP PP”) including retroactive amortization of goodwill generated from acquisitions of entities under common control, as from January 1, 2002. Braskem (previously Copene Petroquímica do Nordeste S.A. (“Copene”)) legally merged with OPP PP on August 16, 2002, and since that date, OPP PP has been consolidated in the Company’s previously disclosed financial statements. This presentation has been approved by CVM. The differences between the loss for 2002 as previously disclosed and as presented herein on a combined basis are as follows:
| |||
| |||
| |||
| |||
| |||
BRASKEM S.A. AND ITS SUBSIDIARIES
NOTES TO THE CONSOLIDATED AND COMBINED FINANCIAL STATEMENTS—(Continued)
at December 31, 2004, 2003 and 2002
All amounts in millions of reais, unless otherwise indicated
The consolidated financial statements were prepared in accordance with the consolidation principles set forth in the Brazilian Corporate Law and rules of the CVM and include the financial statements of Braskem, its subsidiaries, jointly-controlled companies, and jointly-controlled entitiesSpecial Purpose Entities ("SPEs") in which itthe Company has direct or indirect share control, as follows:shown below:
| Interest in total share capital - % | ||||||||
| Head office | ||||||||
| (country) | 2007 | 2006 | 2005 | |||||
| Subsidiaries | ||||||||
| Braskem Argentina S.R.L. | Argentina | 100.00 | 100.00 | 100.00 | ||||
| Braskem America Inc. ("Braskem America") (i) | USA | 100.00 | 100.00 | 63.68 | ||||
| Braskem Distribuidora de Combustíveis Ltda. (xii) | Brazil | 100.00 | 100.00 | 100.00 | ||||
| Braskem Europa (ii) | Holland | 100.00 | 100.00 | - | ||||
| Braskem Incorporated Ltd. | Cayman Islands | 100.00 | 100.00 | 100.00 | ||||
| Braskem Participações S.A. | Brazil | 100.00 | 100.00 | 100.00 | ||||
| Braskem International Ltd. ("Braskem International") (iii) | Bahamas | - | - | 100.00 | ||||
| CINAL (iv) | Brazil | 100.00 | 100.00 | 86.82 | ||||
| Companhia Petroquímica do Sul ("COPESUL") | Brazil | 62.70 | - | - | ||||
| CPP - Companhia Petroquímica Paulista ("CPP") (xix) | Brazil | - | 79.70 | 79.70 | ||||
| Ipiranga Química (xvii) | Brazil | 60.00 | - | - | ||||
| Polialden (v) | Brazil | - | - | 63.68 | ||||
| Politeno (vi) | Brazil | - | 96.16 | - | ||||
| Tegal Terminal de Gases Ltda. ("Tegal") (vii) | Brazil | - | 95.83 | 90.79 | ||||
| Investimentos Petroquímicos Ltda. ("IPL") (xiii) | Brazil | - | - | 100.00 | ||||
| Braskem Importação e Exportação Ltda. | Brazil | 100.00 | 100.00 | 100.00 | ||||
| Overseas (xiv) | Cayman Islands | - | 100.00 | 100.00 | ||||
| Lantana | Bahamas | 100.00 | 100.00 | 100.00 | ||||
| - | - | - | ||||||
| Jointly-controlled companies (viii) | - | - | - | |||||
| CETREL S.A. - Empresa de Proteção Ambiental ("CETREL") | Brazil | 53.61 | 49.03 | 48.02 | ||||
F-28
| Reference | Head office | Interest in total capital (%) | |||||||||
| 2004 | 2003 | 2002 | |||||||||
Subsidiaries | |||||||||||
Companhia Alagoas Industrial (“Cinal”) | (i | ) | Brazil | 63.03 | 32.98 | 19.86 | |||||
Monômeros | (ii | ) | Brazil | — | 87.24 | 87.24 | |||||
Copene Participações | Brazil | 100.00 | 100.00 | 100.00 | |||||||
CPC Cayman Ltd. (“CPC Cayman”) | (i | ) | Cayman Islands | 100.00 | 52.33 | 42.12 | |||||
CPN Distribuidora de Combustíveis Ltda. (“CPN Distribuidora”) | Brazil | 100.00 | 100.00 | 100.00 | |||||||
CPN Incorporated Ltd. (“CPN Inc.”) | Cayman Islands | 100.00 | 100.00 | 100.00 | |||||||
CPP—Companhia Petroquímica Paulista (“CPP”) | Brazil | 90.71 | 90.71 | 90.71 | |||||||
ESAE | (iii | ) | Brazil | — | — | 100.00 | |||||
Investimentos Petroquímicos Ltda. (“IPL”) | Brazil | 100.00 | 100.00 | 100.00 | |||||||
Lantana Trading Company Inc. (“Lantana”) | Bahamas | 100.00 | 100.00 | 100.00 | |||||||
Nitrocarbono | (iii | ) | Brazil | — | — | 92.29 | |||||
Odebrecht Mineração e Metalurgia Ltda. (“OMML”) | (iv | ) | Brazil | — | 52.33 | 42.12 | |||||
Odebrecht Química S.A. (“Odequi”) | Brazil | 100.00 | 100.00 | 100.00 | |||||||
Odequi Investments Ltd. (“OIL”) | Bahamas | 100.00 | 100.00 | 100.00 | |||||||
Odequi Overseas Inc. (“Overseas”) | Cayman Islands | 100.00 | 100.00 | 100.00 | |||||||
OPE Investimentos S.A. | (v | ) | Brazil | — | 100.00 | 100.00 | |||||
OPP Finance Ltd. (“OPP Finance”) | (vi | ) | Cayman Islands | — | 100.00 | 100.00 | |||||
OPP Química | (iii | ) | Brazil | — | — | 100.00 | |||||
OPP Resinas S.A. | (vii | ) | Brazil | — | — | 100.00 | |||||
OQPA Importação e Exportação Ltda. (“OQPA”) | Brazil | 100.00 | 100.00 | 100.00 | |||||||
Polialden América Inc. | (viii | ) | USA | 63.68 | 56.27 | 42.64 | |||||
Polialden | (viii | ) | Brazil | 63.68 | 56.27 | 42.64 | |||||
Proppet Overseas Ltd. (“Proppet Overseas”) | (vi | ) | Bahamas | — | 100.00 | 100.00 | |||||
PSA Trading AVV | (ix | ) | Aruba | — | — | 100.00 | |||||
Tegal—Terminal de Gases Ltda. (“Tegal”) | (i | ) | Brazil | 90.79 | 89.43 | 83.53 | |||||
Trikem | (x | ) | Brazil | — | 52.33 | 42.12 | |||||
TRK Brasil Trust S.A. | (iv | ) | Brazil | — | 52.33 | 42.12 | |||||
Jointly-controlled companies | (xi | ) | |||||||||
CETREL S.A—Empresa de proteção Ambiental (“CETREL”) | Brazil | 40.56 | 33.92 | 27.17 | |||||||
Codeverde—Cia. de Desenvolvimento Rio Verde (“Codeverde”) | Brazil | 35.49 | 35.44 | 35.42 | |||||||
COPESUL—Companhia Petroquímica do Sul (“Copesul”) | Brazil | 29.46 | 29.46 | 29.46 | |||||||
Norcell | (xii | ) | Brazil | — | — | 86.15 | |||||
Politeno Industria e Comércio S.A. | Brazil | 33.88 | 33.88 | 34.66 | |||||||
BRASKEM S.A. AND ITS SUBSIDIARIESTable of Contents
NOTES TO THE CONSOLIDATED AND COMBINED FINANCIAL STATEMENTS—(Continued)
at December 31, 2004, 2003 and 2002
All amounts in millions of reais, unless otherwise indicated
| Notes to the |
| at December 31, 2007, 2006 and 2005 |
| All amounts in millions of |
| Interest in total share capital - % | ||||||||
| Head office | ||||||||
| (country) | 2007 | 2006 | 2005 | |||||
| Companhia Petroquímica do Sul ("COPESUL") (xvi) | Brazil | 29.46 | 29.46 | |||||
| Petroflex Indústria e Comércio S.A. (xviii) | Brazil | 33.53 | 20.12 | 20.12 | ||||
| Petroquímica Paulínia (ix) | Brazil | 60.00 | 60.00 | 60.00 | ||||
| Politeno (vii) | Brazil | - | - | 33.96 | ||||
| Special-purpose entities ("SPEs") | ||||||||
| Chemical Fundo de Investimento em Direitos Creditórios ("Chemical Fund") (xi) | Brazil | - | 100.00 | 11.58 | ||||
| Chemical Fundo de Investimento em Direitos Creditórios ("Chemical Fund II") (xi) | Brazil | - | 9.19 | 9.09 | ||||
| Fundo Parin | 100.00 | |||||||
| ("Fundo Chemical II") (xv) | Brazil | 9.09 | ||||||
| Fundo Parin | Brazil | 100.00 | 100.00 | 100.00 | ||||
(i) Became a direct subsidiary of Braskem after Polialden's merger into the Company on May 31, 2006 (Note 1(c)(vii)).
(ii) Start-up in September 2006 (Note 1(c)(ix)).
(iii) Liquidated in March 2006.
(iv) In June 2006, the Company acquired the remaining shares from minority stockholders (Note 1(c)(viii)).
(v) Merged into the Company on May 31, 2006 (Note 1(c)(vii)).
(vi) Jointly-controlled entity until March 31, 2006. In the second quarter of 2006, the Company acquired the remaining share control of Politeno (Note 1(c)(vi)).
(vii) Interest acquired from subsidiary.
(viii) Investments proportionally consolidated, pursuant to CVM Instruction 247/96.
(ix) Jointly-controlled entity as a result of shareholders' agreement provisions.
(x) Investments consolidated in accordance with CVM Instruction 408/04.
(xi) Interest corresponding to subordinated quotas held by Braskem.
(xii) Upon the merger of IPL, the investment in Braskem Importação e Exportação is held by Braskem Distribuidora.
(xiii) Merged into Braskem Distribuidora in September 2006.
F-29
| at December 31, 2007, 2006 and 2005 | |
| All amounts in millions of | |
(xiv) Company in process of liquidation. (xv) Liquidated in October 2006. (xvi) Investment proportionally consolidated through March 2007 in accordance with CVM Instruction 247/96. (xvii) Investment consolidated as from April 2007, in accordance with the terms of the Grupo Ipiranga acquisition agreement (Note 1(c)). (xviii) Consolidation of the results through November 30, 2007. (xix) Company merged into Petroquímica Paulínia in November 2007 (Note 1(c)(xvi)). |
In the consolidated financial statements, the intercompany investments and the equity in the results, as well as the intercompany assets, liabilities, income, expenses and unrealized gains arising from transactions between consolidated companies have been eliminated.
MinorityThe minority interest in the equity and in the results of subsidiaries has been segregated in the consolidated balance sheetsheets and statementstatements of operations, respectively.operations. Minority interest correspondsinterests in the consolidated net income for 2007 include thirty-party interests in EDSP58, Politeno and Tegal calculated up to the respective participationsapplicable merger dates.
Goodwill is classified to a specific account in CINAL, CPP, Polialden, Tegal, Monômeros and Trikem.
permanent assets in accordance with CVM Instruction 247/96. Negative goodwill is presented under "Deferred income".
For purposesa better presentation of the consolidated financial statements, the cross-holding between the subsidiary CopeneCompany's shares held by its subsidiaries, Braskem Participações and the Company,Politeno, which arose from the corporate restructuring, hashave been reclassified to treasury stock. The subsidiary Copene Participações holds 145,082,980 common"Treasury shares". Braskem's total shares and 72,541,484 Class A preference shares, representing 0.24%the percentage of the Company’sinterest in total share capital atheld by these subsidiaries are presented as follows:
| Braskem | ||||
| Participações (i) | Politeno(ii) | |||
| Common shares | 580,331 | - | ||
| Class A preferred shares | 290,165 | 2,186,133 | ||
| Interest in total share capital - % | 0.24 | 0.60 | ||
(i) As of December 31, 2004.
BRASKEM S.A. AND ITS SUBSIDIARIES
NOTES TO THE CONSOLIDATED AND COMBINED FINANCIAL STATEMENTS—(Continued)
at2007 and 2006.
(ii) As of December 31, 2004, 20032006.
F-30
| Braskem S.A. and Its Subsidiaries |
| Notes to the Consolidated Financial Statements |
| at December 31, 2007, 2006 and 2005 |
| All amounts in millions of reais, unless otherwise indicated |
Pursuant to paragraph 1, article 23 of CVM Instruction 247/96 and 2002authorization by CVM Letter SNC 004/2008 and 005/2008, the Company has not proportionally consolidated the financial statements of the companies Companhia de Desenvolvimento Rio Verde - - CODEVERDE and RPI. These subsidiaries' financial statements do not show significant amounts and do not affect, in any material aspect, the Company's consolidated financial statements. These subsidiaries' summary balance sheets and statements of operations, adjusted to the Company's accounting practices, are as follows:
Balance Sheet
| Codeverde (*) | RPI | |||||
| 2007 | 2006 | 2007 | ||||
| Assets | ||||||
| Current assets | 0.4 | 0.3 | 85.3 | |||
| Non-current assets | 0.1 | 0.1 | 3.4 | |||
| Permanent assets | 46.6 | 45.0 | 34.8 | |||
| Total assets | 47.1 | 45.4 | 123.5 | |||
| Liabilities and stockholders' equity | ||||||
| Current liabilities | 0.1 | 0.1 | 93.2 | |||
| Non-current liabilities | 1.7 | 1.4 | 61.5 | |||
| Shareholders' equity | 45.3 | 43.9 | (31.2) | |||
| Total liabilities and stockholders' equity | 47.1 | 45.4 | 123.5 | |||
(*) In pre-operating stage.
F-31
| Braskem S.A. and Its Subsidiaries |
| Notes to the Consolidated Financial Statements |
| at December 31, 2007, 2006 and 2005 |
| All amounts in millions of reais, unless otherwise indicated |
Statement of operations
| RPI | ||
| 2007 | ||
| Net sales | 621.0 | |
| Cost of sales | (596.2) | |
| Gross profit | 24.8 | |
| Operating expenses, net | (23.2) | |
| Operating income before financial results | 1.6 | |
| Financial results | (5.0) | |
| Non-operating results | 0.4 | |
| Loss before taxes | (3.0) | |
| Deferred income tax and social contribution, net | 1.9 | |
| Loss for the year | (1.1) | |
F-32
| Braskem S.A. and Its Subsidiaries |
| Notes to the Consolidated Financial Statements |
| at December 31, 2007, 2006 and 2005 |
| All amounts in millions of reais, unless otherwise indicated |
The balance sheets and statements of operations of jointly-controlled companies and SPEs can be summarized as follows:
| Copesul (iii) | Cetrel (i) | Petroflex (ii) | ||||||||||||||||
| Three-month | Eleven-month | |||||||||||||||||
| period ended | period ended | |||||||||||||||||
| March 31, 2007 | 2006 | 2005 | 2007 | 2006 | 2005 | November 30, 2007 | 2006 | 2005 | ||||||||||
| Assets | ||||||||||||||||||
| Current assets | - | 1,261.8 | - | 31.8 | 25.5 | - | - | 605.0 | - | |||||||||
| Long-term receivables | - | 154.6 | - | 11.9 | 12.3 | - | - | 31.3 | - | |||||||||
| Permanent assets | - | 1,050.2 | - | 139.2 | 131.2 | - | - | 437.0 | - | |||||||||
| Total assets | - | 2,466.6 | - | 182.9 | 169.0 | - | - | 1,073.3 | - | |||||||||
| Liabilities and shareholders' equity | ||||||||||||||||||
| Current liabilities | - | 840.7 | - | 24.2 | 20.3 | - | - | 390.7 | - | |||||||||
| Long-term liabilities | - | 325.7 | - | 31.0 | 39.2 | - | - | 375.8 | - | |||||||||
| Shareholders' equity | - | 1,300.2 | - | 127.7 | 109.5 | - | - | 306.8 | - | |||||||||
| Total liabilities and shareholders' | ||||||||||||||||||
| equity | - | 2,466.6 | - | 182.9 | 169.0 | - | - | 1,073.3 | - | |||||||||
| Statement of operations | ||||||||||||||||||
| Net sales | 1,727.3 | 6,299.2 | 5,552.6 | 106.2 | 106.2 | 98.2 | 1,300.7 | 1,361.5 | 1,373.2 | |||||||||
| Cost of goods sold and services | ||||||||||||||||||
| rendered | (1,397.2) | (5,292.3) | (4,610.4) | (70.4) | (74.0) | (79.6) | (1,105.3) | (1,197.0) | (1,088.9) | |||||||||
| Gross profit | 330.1 | 1,006.9 | 942.2 | 35.8 | 32.2 | 18.6 | 195.4 | 164.5 | 284.3 | |||||||||
| Operating expenses, net | (37.2) | (117.5) | (151.1) | (16.5) | (19.7) | (11.1) | (93.1) | (131.3) | (160.8) | |||||||||
| Non operating income | ||||||||||||||||||
| (expenses), net | (2.8) | (4.3) | 5.4 | (1.8) | 0.2 | 0.3 | (0.2) | 0.9 | (1.5) | |||||||||
| Income before income tax and | ||||||||||||||||||
| social contribution | 290.1 | 885.1 | 796.5 | 17.5 | 12.7 | 7.8 | 102.1 | 34.1 | 122.0 | |||||||||
| Income tax and social | ||||||||||||||||||
| contribution | (97.1) | (269.9) | (230.5) | (4.7) | (2.5) | (0.7) | (33.2) | (8.1) | (33.7) | |||||||||
| Net income for the year | 193.0 | 615.2 | 566.0 | 12.8 | 10.2 | 7.1 | 68.9 | 26.0 | 88.3 | |||||||||
(i) Financial statements excluding non-mandatory asset revaluation effects to conform to the Company's accounting policies.
(ii) Investment consolidated through November 2007 when the investment was classified as "held for sale".
(iii) Investment consolidated as from April 1, 2007.
F-33
| Braskem S.A. and Its Subsidiaries |
| Notes to the Consolidated Financial Statements |
| at December 31, 2007, 2006 and 2005 |
| All amounts in millions of reais, unless otherwise indicated |
| Politeno | Petroquímica Paulínia (i) | |||||
| 2005 | 2007 | 2006 | ||||
| Assets | ||||||
| Current assets | - | 155.8 | 102.5 | |||
| Long-term receivables | - | - | - | |||
| Permanent assets | - | 647.6 | 115.5 | |||
| Total assets | - | 803.4 | 218.0 | |||
| Liabilities and shareholders' equity | ||||||
| Current liabilities | - | 101.3 | 3.8 | |||
| Long-term liabilities | - | 460.3 | 84.0 | |||
| Shareholders' equity | - | 241.8 | 130.2 | |||
| Total liabilities and shareholders' equity | - | 803.4 | 218.0 | |||
| Statement of operations | ||||||
| Net sales | 1,169.9 | - | - | |||
| Cost of goods sold and services rendered | (950.2) | - | - | |||
| Gross profit | 219.7 | - | - | |||
| Operating expenses, net | (116.9) | - | - | |||
| Non operating income (expenses), net | (5.6) | - | - | |||
| Income before income tax and | ||||||
| social contribution | 97.2 | - | - | |||
| Income tax and social contribution | (33.8) | - | - | |||
| Net income for the year | 63.4 | - | - | |||
(i) A development stage company.
F-34
| Braskem S.A. and Its Subsidiaries |
| Notes to the Consolidated Financial Statements |
| at December 31, 2007, 2006 and 2005 |
| All amounts in millions of reais, unless otherwise indicated |
| Fundo Parin | Guardian | FIQ Sol | Chemical Fund (i) | Chemical Fund II (i) | ||||||||||||||||||
| 2007 | 2006 | 2005 | 2005 | 2007 | 2006 | 2005 | 2006 | 2005 | 2006 | 2005 | ||||||||||||
| Assets | 458.4 | 538.0 | - | - | 258.8 | 395.2 | - | 6.1 | - | 442.6 | - | |||||||||||
| Liabilities | - | - | - | - | - | - | - | 0.2 | - | - | - | |||||||||||
| Shareholders' equity | 458.4 | 538.0 | - | - | 258.8 | 395.2 | - | 5.9 | - | 442.6 | - | |||||||||||
| Total liabilities and | ||||||||||||||||||||||
| shareholders' equity | 458.4 | 538.0 | - | - | 258.8 | 395.2 | - | 6.1 | - | 442.6 | - | |||||||||||
| Net income (loss) | ||||||||||||||||||||||
| for the year | (94.4) | (14.8) | 9.3 | 48.5 | 30.3 | 37.0 | 70.6 | (19.0) | 39.0 | 68.6 | 4.5 | |||||||||||
(i) Chemical Fund and Chemical Fund II are receivables securitization funds. Such funds are considered controlled SPEs and therefore consolidated for purposes of these financial statements. The senior quotas of these funds held by third-parties are recorded as liabilities in millionsthe consolidated financial statements.
F-35
Table of reais, unless otherwise indicatedContents
| Braskem S.A. and Its Subsidiaries |
| Notes to the Consolidated Financial Statements |
| at December 31, 2007, 2006 and 2005 |
| All amounts in millions of reais, unless otherwise indicated |
4 Cash and Cash Equivalents
| 2007 | 2006 | |||
| Cash and banks | 578.8 | 140.2 | ||
| Financial investments | ||||
| Domestic | 612.9 | 751.6 | ||
| Foreign | 698.4 | 655.3 | ||
| 1,890.1 | 1,547.1 | |||
Domestic investments are primarily quotas (shares) in a fund created exclusively for Braskem, which holds quotas of fixed income investment funds, investment fund quotas in credit rights, and other fixed-income securities. Foreign investments mainly comprise highly liquid government securities. The funds are highly liquid in secondary markets and are recorded at realizable values, which are similar to fair value.
Proportional consolidationCash and cash equivalents are allocated in order to: (i) seek a return compatible with the maximum volatility determined by the investment and risk policy; (ii) obtain a spread on the consolidated portfolio; (iii) seek to avoid credit risk arising from the concentration in a small number of investments; and (iv) follow market interest rate changes both in Brazil and abroad.
5 Other Investments
| 2007 | 2006 | |||
| Current assets | ||||
| Fair market value of derivative instruments | 114.6 | 27.6 | ||
| Government securities issued abroad | - | 311.1 | ||
| Investment funds | 134.1 | 63.9 | ||
| Subordinated quotas of investment fund - credit rights | ||||
| and other | - | 11.3 | ||
| 248.7 | 413.9 | |||
| Long-term receivables | ||||
| Investment funds | 118.1 | - | ||
| Other | 1.7 | 1.6 | ||
| 119.8 | 1.6 | |||
| Total | 368.5 | 415.5 | ||
F-36
| Braskem S.A. and Its Subsidiaries |
| Notes to the Consolidated Financial Statements |
| at December 31, 2007, 2006 and 2005 |
| All amounts in millions of reais, unless otherwise indicated |
The Company's investments comprise a portfolio of domestic and foreign investment funds, the risk of which is applied to all companies jointly controlledregularly reassessed by the Company, together with one or more other voting shareholders. Joint control does not require the participationall of all other voting shareholders. Information concerning the balance sheets and statement of operations of the jointly-controlled entities, which are proportionally consolidated (or combined, as applicable), is summarized as follows:recorded at fair value and are considered trading investments.
6 Trade Accounts Receivable
| Copesul | Cetrel | Norcell | Codeverde(ii) | Politeno | ||||||||||||||||||||||||||||||||
| 2004 | 2003 | 2002(i) | 2004 | 2003 | 2002 | 2002 | 2004 | 2003 | 2002 | 2004 | 2003 | 2002 | ||||||||||||||||||||||||
Assets | ||||||||||||||||||||||||||||||||||||
Current assets | 754.0 | 1,386.4 | 1,304.7 | 27.8 | 27.1 | 20.3 | 10.1 | 0.2 | 0.1 | 0.1 | 303.4 | 289.1 | 345.8 | |||||||||||||||||||||||
Long-term receivables | 294.8 | 445.3 | 768.6 | 12.9 | 8.7 | 9.4 | 2.6 | 0.1 | — | 0.1 | 144.4 | 56.0 | 15.2 | |||||||||||||||||||||||
Permanent assets | 1,158.8 | 1,230.3 | 1,435.3 | 108.3 | 107.2 | 107.8 | 114.6 | 42.6 | 41.7 | 40.9 | 191.3 | 199.3 | 198.8 | |||||||||||||||||||||||
Total assets | 2,207.6 | 3,062.0 | 3,508.6 | 149.0 | 143.0 | 137.5 | 127.3 | 42.9 | 41.8 | 41.1 | 639.1 | 544.4 | 559.8 | |||||||||||||||||||||||
Liabilities | ||||||||||||||||||||||||||||||||||||
Current liabilities | 745.7 | 1,052.2 | 1,713.1 | 26.4 | 20.0 | 15.2 | 3.1 | 0.1 | — | 0.1 | 155.9 | 87.3 | 99.7 | |||||||||||||||||||||||
Long-term liabilities | 307.1 | 950.1 | 794.7 | 66.0 | 57.7 | 50.6 | 0.7 | 1.0 | 0.7 | 0.7 | 32.7 | 15.4 | 26.3 | |||||||||||||||||||||||
Deferred income | — | — | — | — | — | — | 14.5 | — | — | — | — | — | — | |||||||||||||||||||||||
Minority interest | — | — | — | — | — | — | 0.6 | — | — | — | — | — | — | |||||||||||||||||||||||
Shareholders’ equity | 1,154.8 | 1,059.7 | 1,000.8 | 56.6 | 65.3 | 71.7 | 108.4 | 41.8 | 41.1 | 40.3 | 450.5 | 441.7 | 433.8 | |||||||||||||||||||||||
Total liabilities | 2,207.6 | 3,062.0 | 3,508.6 | 149.0 | 143.0 | 137.5 | 127.3 | 42.9 | 41.8 | 41.1 | 639.1 | 544.4 | 559.8 | |||||||||||||||||||||||
Statement of operations | ||||||||||||||||||||||||||||||||||||
Net sales revenue | 5,374.1 | 4,177.9 | 2,932.8 | 81.8 | 69.4 | 51.3 | 32.4 | — | — | — | 1,119.4 | 943.9 | 733.6 | |||||||||||||||||||||||
Cost of sales and services rendered | (4,417.6 | ) | (3,773.1 | ) | (2,536.7 | ) | (64.1 | ) | (57.0 | ) | (45.6 | ) | (28.5 | ) | — | — | — | (865.4 | ) | (749.0 | ) | (592.2 | ) | |||||||||||||
Gross profit | 956.5 | 404.8 | 396.1 | 17.7 | 12.4 | 5.7 | 3.9 | — | — | — | 254.0 | 194.9 | 141.4 | |||||||||||||||||||||||
Operating income (expenses), net | (155.3 | ) | (208.5 | ) | (405.1 | ) | (25.3 | ) | (19.0 | ) | (14.5 | ) | 2.3 | — | — | — | (112.9 | ) | (87.4 | ) | (67.9 | ) | ||||||||||||||
Non-operating income (expenses), net | (0.8 | ) | (0.9 | ) | (54.3 | ) | (1.1 | ) | 0.1 | (0.8 | ) | (8.1 | ) | — | — | — | — | — | — | |||||||||||||||||
Income (loss) before social contribution and income tax and minority interest | 800.4 | 195.4 | (63.3 | ) | (8.7 | ) | (6.5 | ) | (9.6 | ) | (1.9 | ) | — | — | — | 141.1 | 107.5 | 73.5 | ||||||||||||||||||
Social contribution and income tax | (242.0 | ) | (45.5 | ) | 31.2 | — | — | — | (2.9 | ) | — | — | — | (44.6 | ) | (40.3 | ) | (27.9 | ) | |||||||||||||||||
Minority interest | — | — | — | — | — | — | 0.1 | — | — | — | — | — | — | |||||||||||||||||||||||
Net income (loss) for the year/period | 558.4 | 149.9 | (32.1 | ) | (8.7 | ) | (6.5 | ) | (9.6 | ) | (4.7 | ) | — | — | — | 96.5 | 67.2 | 45.6 | ||||||||||||||||||
BRASKEM S.A. AND ITS SUBSIDIARIES
NOTES TO THE CONSOLIDATED AND COMBINED FINANCIAL STATEMENTS—(Continued)
at December 31, 2004, 2003 and 2002
All amounts in millions of reais, unless otherwise indicated
| 2004 | 2003 | |||
Current assets | ||||
Restricted cash equivalents | — | 60.1 | ||
Investment fund (trading) | 15.8 | 434.6 | ||
Others | 4.7 | — | ||
| 20.5 | 494.7 | |||
The Company’s investment fund comprises quotas, with underlying U.S. dollar-denominated debt securities, of a majority-owned fund which is managed and controlled by a leading international bank.
| 2004 | 2003 | |||
Shares of associated company held for sale | 22.1 | 19.6 | ||
Subordinated quotas of investment fund (trading) | 31.0 | 15.0 | ||
Others | 36.7 | 14.6 | ||
| 89.8 | 49.2 | |||
The shares in associated company held for sale refer to the book value of 20% of the capital of Borealis Brasil S.A. (“Borealis”). Subordinated quotas of investment fund represents our share of credit rights investment fund.
| 2004 | 2003 | |||||
Customers | ||||||
Domestic market | 1,004.4 | 996.6 | ||||
International market | 516.0 | 418.3 | ||||
Advances on foreign deliveries | (75.7 | ) | (65.9 | ) | ||
Allowance for doubtful accounts | (54.7 | ) | (105.7 | ) | ||
| 1,390.0 | 1,243.3 | |||||
Long-term receivables | (23.1 | ) | (27.1 | ) | ||
Current assets | 1,366.9 | 1,216.2 | ||||
| 2007 | 2006 | |||
| Customers | ||||
| Domestic market | 1,697.2 | 1,514.3 | ||
| Foreign market | 725.2 | 421.9 | ||
| Discounted trade receivables | (311.8) | (119.7) | ||
| Advances on bills of exchange delivered | (385.2) | (15.8) | ||
| Allowance for doubtful accounts | (186.5) | (153.3) | ||
| 1,538.9 | 1,647.4 | |||
| Non-current asset | (41.9) | (52.5) | ||
| Current assets | 1,497.0 | 1,594.9 | ||
The Company has been adoptinga policy of realizing domestic trade accounts consisting mainly of the sale ofby transferring its receivables to a credit rights investment fund which payssecuritization funds that were considered SPEs and consolidated in these financial statements (Chemical II). See Note 3(g). These funds pay the Company earlier than the normal due datevalue of these customer receivables.receivables minus discount before the due date.
During 2004, management wrote-off uncollectible receivables,In December 2007 and 2006, the Company carried out a trade bill discount transaction in which were fully provided for,it sold invoices to a financial institution at a discount, undertaking to reimburse it in the amountevent of R$ 102.4. This write-off resulteda default of the underlying customers.
Changes in a decrease of trade accounts receivable and allowance for doubtful accounts in this amount.
BRASKEM S.A. AND ITS SUBSIDIARIES
NOTES TO THE CONSOLIDATED AND COMBINED FINANCIAL STATEMENTS—(Continued)
at December 31, 2004, 2003 and 2002
All amounts in millions of reais, unless otherwise indicated
The changes inthe allowance for doubtful accounts are as follows:
| 2007 | 2006 | 2005 | ||||
| At the beginning of the year | 153.3 | 87.3 | 55.0 | |||
| Addition for the full consolidation of merged | ||||||
| companies | 45.3 | 15.5 | - | |||
| Additions classified as selling expenses | 44.1 | 99.3 | 38.9 | |||
| Recovery of credits written-off | (31.3) | (48.6) | (6.7) | |||
| Write-off of bad debts | (24.9) | (0.2) | - | |||
| Exchange variation | - | - | 0.1 | |||
| At the end of the year | 186.5 | 153.3 | 87.3 | |||
F-37
| 2004 | 2003 | |||||
At the beginning of the year | (105.7 | ) | (133.2 | ) | ||
Additions charged to selling expenses | (52.4 | ) | (24.2 | ) | ||
Write-off of uncollectible receivables | 102.4 | — | ||||
Recoveries | 1.0 | 51.7 | ||||
At the end of the year | (54.7 | ) | (105.7 | ) | ||
| Notes to the Consolidated Financial Statements |
| at December 31, 2007, 2006 and 2005 |
| All amounts in millions of reais, unless otherwise indicated |
7 Inventories
| 2004 | 2003 | |||||
Finished goods | 769.8 | 475.8 | ||||
Work in process | 47.9 | 58.6 | ||||
Raw material, production inputs and packaging | 415.6 | 224.4 | ||||
Maintenance materials | 276.7 | 224.5 | ||||
Advances to suppliers | 71.0 | 170.4 | ||||
Imports in transit and others | 5.5 | 33.5 | ||||
Total | 1,586.5 | 1,187.2 | ||||
Long-term maintenance materials (*) | (50.4 | ) | (115.6 | ) | ||
Current assets | 1,536.1 | 1,071.6 | ||||
| 2007 | 2006 | |||
| Finished products and work-in-process | 1,152.2 | 986.9 | ||
| Raw materials, production inputs and packaging | 651.4 | 393.4 | ||
| Maintenance materials (*) | 401.7 | 344.6 | ||
| Advances to suppliers | 53.2 | 64.0 | ||
| Imports in transit and others | 47.9 | 17.6 | ||
| Provision for adjustment to realization value | (19.3) | (16.3) | ||
| Total | 2,287.1 | 1,790.2 | ||
| Long-term maintenance materials (*) | (22.8) | (22.9) | ||
| Current assets | 2,264.3 | 1,767.3 | ||
(*) Based on management's expectation of utilization, part of the maintenance materials inventory was reclassified to long-term maintenance materials.
Advances to suppliers and expenditures for imports in transit are mainly relatedrelate to the acquisition of petrochemical naphtha, which is the Company’s main raw material.material used by the Company. Changes in the provision for adjustment to realization value of inventories can be summarized as follows:
| 2007 | 2006 | |||
| At the beginning of the year | 16.3 | 17.9 | ||
| Additions and (reduction) charge to statement of operations | 3.0 | (1.6 ) | ||
| At the end of the year | 19.3 | 16.3 | ||
F-38
| Notes to the Consolidated Financial Statements |
| at December 31, 2007, 2006 and 2005 |
| All amounts in millions of reais, unless otherwise indicated |
8RelatedParties
| 2004 | 2003 | |||
Judicial deposits | ||||
Social Integration Program (PIS)/Contribution for Social Security Financing (COFINS) (Note 17(iii)) | 96.5 | 94.0 | ||
Educational and social security contribution | 29.3 | 21.5 | ||
Work accident insurance | 14.1 | 14.1 | ||
Labor claims | 11.3 | 15.6 | ||
Other | 31.6 | 27.1 | ||
Compulsory loan (Eletrobrás) | 15.8 | 19.0 | ||
| 198.6 | 191.3 | |||
| Balances at December 31, 2007 | ||||||||
| Long-term | Current | |||||||
| Current assets | receivables | liabilities | ||||||
| Trade | Other | |||||||
| accounts | accounts | Related | ||||||
| receivable | receivable | parties | Suppliers | |||||
| Jointly-controlled companies | ||||||||
| CETREL | - | 1.4 | - | 0.1 | ||||
| Petroflex | 457.1 | - | - | - | ||||
| Petroquímica Paulina | - | - | 4.1 | - | ||||
| Associated company | ||||||||
| Borealis | 10.7 | - | - | - | ||||
| Related parties | ||||||||
| Refinaria Alberto Pasqualini - REFAP S.A. | ||||||||
| (related party to Copesul) | 26.2 | - | - | - | ||||
| CNO | 6.3 | - | - | 17.5 | ||||
| Petrobras | 54.9 | - | 41.9 | 579.2 | ||||
| Other | 0.8 | - | 2.5 | 2.7 | ||||
| At December 31, 2007 | 556.0 | 1.4 | 48.5 | 599.5 | ||||
F-39
BRASKEM S.A. AND ITS SUBSIDIARIES
NOTES TO THE CONSOLIDATED AND COMBINED FINANCIAL STATEMENTS—(Continued)
at December 31, 2004, 2003 and 2002
All amounts in millionsTable of reais, unless otherwise indicatedContents
| Notes to the Consolidated Financial Statements |
| at December 31, 2007, 2006 and 2005 |
| All amounts in millions of reais, unless otherwise indicated |
Relatedparties(continued)
| Balances at December 31, 2004 | ||||||||||||||
| Current assets | Long-term receivables | Current liabilities | Long-term liabilities | |||||||||||
| Trade accounts receivable | Related parties | Related parties | Suppliers | Suppliers | Debentures | Related parties | ||||||||
Jointly-controlled entities | ||||||||||||||
Copesul | 0.3 | — | — | 9.8 | — | — | 102.9 | |||||||
Cetrel | 0.1 | — | — | 1.0 | — | — | — | |||||||
Politeno | 13.2 | — | — | — | — | — | — | |||||||
Associated companies | ||||||||||||||
Petroflex Indústria e Comércio S.A. (“Petroflex”) | 40.6 | — | — | — | — | — | — | |||||||
Borealis | 6.6 | — | — | — | — | — | — | |||||||
Related parties | ||||||||||||||
Ipiranga Petroquímica S.A. (related party of Copesul) | 4.1 | — | — | 0.4 | — | — | — | |||||||
Monsanto Nordeste S.A. (related party of Cetrel) | 0.3 | 0.6 | 0.5 | — | — | — | 1.9 | |||||||
Nitroclor Produtos Químicos S.A. (related party of Cetrel) | 1.7 | — | — | — | — | — | 1.6 | |||||||
Odbpar Investimentos S.A. | — | — | — | — | — | 867.9 | — | |||||||
Petrobras S.A. (“Petrobras”) | — | — | 31.5 | 336.0 | 35.0 | — | — | |||||||
Petrobras Distribuidora S.A. | 0.1 | — | — | 4.6 | 30.7 | — | — | |||||||
Pronor (related party of Cetrel) | 0.3 | — | — | — | — | — | 3.2 | |||||||
Other | — | — | 2.8 | — | — | — | 6.1 | |||||||
| 67.3 | 0.6 | 34.8 | 351.8 | 65.7 | 867.9 | 115.7 | ||||||||
| Balances at December 31, 2003 | ||||||||||||||
| Current assets | Long-term receivables | Current liabilities | Long-term liabilities | |||||||||||
| Trade accounts receivable | Related parties | Suppliers | Related parties | Suppliers | Debentures | Related parties | ||||||||
Jointly-controlled entities | ||||||||||||||
Copesul | 2.6 | — | 259.3 | — | — | — | 157.4 | |||||||
Cetrel | — | 0.3 | 0.1 | — | — | — | — | |||||||
Politeno | 11.6 | — | — | — | — | — | — | |||||||
Associated company | ||||||||||||||
Petroflex | 18.1 | — | — | — | — | — | — | |||||||
Related parties | ||||||||||||||
Refinaria Alberto Pasqualini—REFAP S.A. (related party of Copesul) | — | — | 5.1 | — | — | — | — | |||||||
Ipiranga Petroquímica S.A. (related party of Copesul) | 123.0 | 18.1 | 0.5 | — | — | — | — | |||||||
Natal Trading (related party of Copesul) | — | 13.2 | — | — | — | — | — | |||||||
Nitroclor Produtos Químicos S.A. (related party of Cetrel) | 0.9 | — | — | — | — | — | 1.5 | |||||||
Odbpar Investimentos S.A. | — | — | — | — | — | 752.9 | — | |||||||
Petrobras | 0.3 | 28.0 | 250.2 | — | 58.4 | — | — | |||||||
Pronor (related party of Cetrel) | — | — | — | — | — | — | 3.1 | |||||||
Other | — | 3.1 | — | 0.2 | — | — | 15.6 | |||||||
| 156.5 | 62.7 | 515.2 | 0.2 | 58.4 | 752.9 | 177.6 | ||||||||
| Balances at December 31, 2006 | |||||||||||
| Current | Long-term | ||||||||||
| assets | receivables | Current liabilities | Long-term liabilities | ||||||||
| Trade | |||||||||||
| accounts | Related | Related | |||||||||
| receivable | parties | Suppliers | Debentures | Suppliers | parties | ||||||
| Jointly-controlled companies | |||||||||||
| CETREL | - | - | 0.6 | - | - | 2.0 | |||||
| Copesul | 1.7 | - | 358.5 | - | - | - | |||||
| Petroflex | 17.1 | - | - | - | - | - | |||||
| Associated company | |||||||||||
| Borealis | 2.8 | - | - | - | - | - | |||||
| Related parties | |||||||||||
| Refinaria Alberto Pasqualini - REFAP S.A. | |||||||||||
| (related party to Copesul) | 1.2 | - | 5.8 | - | - | - | |||||
| Ipiranga Petroquímica S.A. (related party | |||||||||||
| to Copesul) | 4.6 | - | 1.0 | - | - | - | |||||
| CNO | 7.7 | - | 6.7 | - | - | - | |||||
| Monsanto Nordeste S.A. (related party to | |||||||||||
| CETREL) | - | - | - | - | - | 2.8 | |||||
| ODBPAR | - | - | - | 1,130.8 | - | - | |||||
| Petrobras | 49.7 | 38.8 | 615.8 | - | 17.6 | - | |||||
| Other | 0.3 | 1.9 | 9.5 | - | - | - | |||||
| At December 31, 2006 | 85.1 | 40.7 | 997.9 | 1,130.8 | 17.6 | 4.8 | |||||
F-40
BRASKEM S.A. AND ITS SUBSIDIARIESTable of Contents
NOTES TO THE CONSOLIDATED AND COMBINED FINANCIAL STATEMENTS—(Continued)
at December 31, 2004, 2003 and 2002
All amounts in millions of reais, unless otherwise indicated
| Transactions | |||||||||||||||||||||
| 2004 | 2003 | 2002 | |||||||||||||||||||
| Products sales/ revenues | Utilities, services and raw material purchases | Interest income and (expenses) | Products sales/ revenues | Utilities and raw material purchases | Interest income and (expenses) | Products sales/ revenues | Utilities and raw material purchases | Interest income and (expenses) | |||||||||||||
Jointly-controlled entities | |||||||||||||||||||||
Copesul | 1.6 | 1,659.7 | (42.5 | ) | 72.0 | 1,220.9 | (80.2 | ) | 32.0 | 1,196.9 | (58.7 | ) | |||||||||
Cetrel | 0.7 | 12.5 | — | 0.1 | 7.5 | — | 0.1 | 13.5 | — | ||||||||||||
Politeno | 623.1 | — | — | 451.4 | — | — | 352.2 | — | — | ||||||||||||
Associated companies | |||||||||||||||||||||
Borealis | 141.3 | — | — | 107.6 | — | (0.2 | ) | 62.9 | — | — | |||||||||||
Petroflex | 390.8 | — | — | 331.3 | — | — | 216.9 | — | 3.6 | ||||||||||||
Related parties | |||||||||||||||||||||
Refinaria Alberto Pasqualini—REFAP S.A. (related party of Copesul) | — | 114.3 | — | — | 163.8 | — | 1.3 | 290.7 | — | ||||||||||||
Ipiranga Petroquímica S.A. (related party of Copesul) | 504.8 | 28.2 | 2.0 | 358.2 | 78.9 | 7.4 | 630.9 | 28.5 | 53.7 | ||||||||||||
Nitroclor Produtos Químicos (related party of Cetrel) | 0.8 | — | — | — | — | — | — | — | — | ||||||||||||
Monsanto Nordeste S.A. (related party of Cetrel) | 2.5 | — | — | — | — | — | — | — | — | ||||||||||||
Petrobras(*) | — | 4,190.2 | — | 14.1 | 4,546.9 | 2.8 | 14.0 | 2,801.1 | — | ||||||||||||
Petrobras Distribuidora S.A. | 4.0 | 164.5 | — | — | — | — | — | — | — | ||||||||||||
Pronor (related party of Cetrel) | 1.6 | — | — | — | — | — | — | — | — | ||||||||||||
Construtora Norberto Odebrecht S.A. | — | 32.5 | — | — | — | — | — | — | — | ||||||||||||
Other | — | — | 1.9 | — | — | 0.2 | 57.9 | 58.6 | — | ||||||||||||
Year ended December 31 | 1,671.2 | 6,201.9 | (38.6 | ) | 1,334.7 | 6,018.0 | (70.0 | ) | 1,368.2 | 4,389.3 | (1.4 | ) | |||||||||
| Notes to the Consolidated Financial Statements |
| at December 31, 2007, 2006 and 2005 |
| All amounts in millions of |
Relatedparties(continued)
| Transactions | |||||||||||||||||
| 2007 | 2006 | 2005 | |||||||||||||||
| Utilities, | Utilities, | Utilities, | |||||||||||||||
| Products | services and | Interest | Products | services and | Interest | Products | services and | Interest | |||||||||
| sales/ | raw material | income | sales/ | raw material | income | sales/ | raw material | income | |||||||||
| revenues | purchases | (expenses) | revenues | purchases | (expenses) | revenues | purchases | (expenses) | |||||||||
| Subsidiary | |||||||||||||||||
| Copesul | - | 472.9 | - | - | - | - | - | - | - | ||||||||
| Jointly - controlled companies | |||||||||||||||||
| Copesul | - | - | - | 12.2 | 1,941.9 | (0.8) | 4.5 | 1,814.3 | (1.7) | ||||||||
| Cetrel | 0.1 | 10.0 | - | 0.6 | 11.2 | - | 0.7 | 13.6 | - | ||||||||
| Petroflex | 336.3 | - | - | 365.5 | - | 1.6 | 353.2 | - | - | ||||||||
| Politeno | - | - | - | 166.7 | - | - | 696.0 | - | - | ||||||||
| Associated companies | |||||||||||||||||
| Borealis | 143.0 | - | - | 122.1 | - | - | 128.5 | - | - | ||||||||
| Related parties | |||||||||||||||||
| Refinaria Alberto Pasqualini | |||||||||||||||||
| - REFAP S.A. (related | |||||||||||||||||
| party of Copesul) | 543.2 | 1,654.2 | - | 22.8 | 264.9 | - | 35.7 | 636.5 | - | ||||||||
| Ipiranga Petroquímica S.A. | |||||||||||||||||
| (related party of Copesul) | - | - | - | 555.5 | 5.7 | 0.1 | 1,207.2 | 25.6 | 1.2 | ||||||||
| Construtora Norberto | |||||||||||||||||
| Odebrecht S.A. | - | 120.3 | - | - | 136.2 | - | - | 109.5 | - | ||||||||
| Monsanto Nordeste S.A. | |||||||||||||||||
| (related party of Cetrel) | 13.7 | - | - | 3.7 | - | - | - | - | - | ||||||||
| ODBPAR | - | - | - | - | - | - | - | - | (131.5) | ||||||||
| Petrobras (*) | 286.1 | 5,713.1 | (46.6) | 78.9 | 5,390.5 | (2.8) | - | 5,116.0 | 3.8 | ||||||||
| Petrobras Distribuidora S.A. | - | - | - | - | 298.1 | - | - | 195.4 | - | ||||||||
| Petroquímica União (related | |||||||||||||||||
| party of Petroflex) | - | - | - | - | 22.9 | - | - | - | - | ||||||||
| Odebrecht | - | - | (74.8) | - | - | (131.4) | - | - | - | ||||||||
| Other | 1.7 | - | - | 2.4 | - | - | - | - | - | ||||||||
| 1,324.1 | 7,970.5 | (121.4) | 1,330.4 | 8,071.4 | (133.3) | 2,425.8 | 7,910.9 | (128.2) | |||||||||
(*) The Company is dependent on Petrobras for supply of raw materials.
F-41
| Braskem S.A. and Its Subsidiaries |
| Notes to the Consolidated Financial Statements |
| at December 31, 2007, 2006 and 2005 |
| All amounts in millions of reais, unless otherwise indicated |
Trade accounts receivable and suppliers include the balances resulting from transactions with related parties, arising mainly from the following sales and purchases of goods and services:
| Sales of Braskem | ||
| Company | Products/inputs | |
| Borealis | Thermoplastic resins | |
| Petroflex | Butadiene | |
| Petrobras | Gasoline | |
| Purchases of Braskem | ||
| Company | Products/inputs/services | |
| Cetrel | Utilities, treatment and incineration of waste | |
| Petrobras | Naphtha | |
| Petrobras Distribuidora | Fuel | |
| CNO | Construction and maintenance services | |
Transactions with related parties are carried out at prices that take into account that purchases of naphtha from Petrobras are negotiated with the Company and the petrochemical companies using a European market prices.
The related parties balance includes current account balances and notes payable to affiliates of the Company, bearing interest at 100% of CDI. The current accounts are used by the Company and its direct and indirect subsidiaries to centralize available cash in a central pool for settlement of their obligations. Financial charges on remittances and balances of the pool of funds are agreed upon by the account holders, taking into account the cost of funds charged to the individual participants by financial institutions, so that such charges are paid/transferred to the Company.
9 Taxes Recoverable
| 2007 | 2006 | |||
| Excise tax (IPI) (standard operations) | 23.7 | 63.0 | ||
| Value-added Tax on Sales and Services (ICMS) | 1,090.4 | 936.3 | ||
| Social Integration Program (PIS) and Social Contribution | ||||
| on Revenues (COFINS) | 61.2 | 118.5 | ||
| Social Investment Fund (Finsocial) | - | 12.1 | ||
F-42
BRASKEM S.A. AND ITS SUBSIDIARIES
NOTES TO THE CONSOLIDATED AND COMBINED FINANCIAL STATEMENTS—(Continued)
at December 31, 2004, 2003 and 2002
All amounts in millionsTable of reais, unless otherwise indicatedContents
| Notes to the Consolidated Financial Statements |
| at December 31, 2007, 2006 and 2005 |
| All amounts in millions of reais, unless otherwise indicated |
| 2007 | 2006 | |||
| PIS - Decrees-Law 2445 and 2449/88 | 87.5 | 62.0 | ||
| Income tax and social contribution | 66.7 | 56.9 | ||
| Tax on Net Income - ILL | 55.8 | 17.4 | ||
| Other | 100.0 | 95.0 | ||
| Total | 1,485.3 | 1,361.2 | ||
| Current assets | (310.3) | (408.1) | ||
| Non-current assets | 1,175.0 | 953.1 | ||
| Reference | 2004 | 2003 | ||||||
Value-added Tax (ICMS) recoverable | (i) | 438.1 | 213.4 | |||||
Excise Tax (IPI) recoverable (regular operations) | 47.8 | 68.2 | ||||||
Zero-rated IPI | (ii) | — | 480.9 | |||||
PIS | 50.6 | 52.7 | ||||||
Income tax and social contribution | 77.8 | 108.8 | ||||||
Income tax on net income (ILL) | 68.0 | 67.0 | ||||||
Social investment fund—Finsocial | 14.2 | 14.2 | ||||||
Other | 41.6 | 31.3 | ||||||
| 738.1 | 1,036.5 | |||||||
Current assets | (482.0 | ) | (395.9 | ) | ||||
Long-term receivables | 256.1 | 640.6 | ||||||
Braskem increased its accumulated ICMS credit during 2004—in particular, in the States of Bahia and Rio Grande do Sul—on account of the high export volumes in these States and also because of changes in tax legislation that limited the transfer of credits to third parties.
The Company’s management is working on accelerating recovery of this asset as, for example, through the recent agreement with the State of Bahia which extends the ICMS deferral benefit to the import of petrochemical naphtha.
In July 2000, the merged company OPP Química filed a legal action to sustain the full application of the non-cumulative principle of the Excise Tax (IPI), requesting the right to a tax credit on purchases of raw materials that are exempt from IPI, whether or not subject to a zero rate, in relation to the operations of the establishments located in the State of Rio Grande do Sul.
On December 19, 2002, the Federal Supreme Court (STF), - based on its previous plenary decisions about the subject, judgedother precedents - entertained an Extraordinary Appealextraordinary appeal lodged by the National Treasury and fully confirmed theaffirmed an earlier decision ofby the Regional Federal Court (TRF), 4th Circuit, recognizing entitlement to IPI tax credits relating to acquisition of raw materials taxed at a zero-percent rate, when related to transactions involving the 4th. Region, which recognized thatfacilities of OPP Química S.A. (“OPP Química”, which has merged into the rightCompany) located in the State of Rio Grande do Sul. This STF determination confirmed the entitlement to a credit of IPI credits on these purchases,acquisitions of raw materials, covering the ten yearsten-year period prior to the filing ofdate and accruing at the suit, including the related monetary restatement and SELIC benchmark rate for the period up to the date of the actual use of the credits.
This lawsuit was filed by OPP Química in July 2000 seeking for full adoption of the non-cumulative tax principle to said facilities.
The STF decision is subject to appeal requestingwas challenged by the National Treasury andvia special appeal known as agravo regimental. In this special appeal, the National Treasury is still pending judgment by the Second Panel of the STF. The action no longer questionschallenging the rightcompany's entitlement to the IPI tax credit from acquisition of raw materials taxed at a zero rate, but alleges imprecisionrather alleging inaccuracies in the decision regarding exemptcourt's determination as to non-taxed inputs and raw materials, the restatement of the credittax credits, and the rate to be used for credit calculation purposes.
However, accordingrate. According to the opinion of itsthe Company's legal advisors, all these aspects have already been definedsettled in the STF and TRF court decisions favorable to OPP Química, or, even in the plenary decisions of the STF.some cases, in STF full-bench precedents. For this reason, the Company's view is that the special appeal does not represent any possibilityreferred to above poses only a remote risk of changes in the OPP Química’s right to the credit, sincemica decision, although the STF is appealingitself has revisited this matter on the mattermerits in a similar claim, involvinglawsuit by another taxpayer, the judgment of which is currently suspended.
BRASKEM S.A. AND ITS SUBSIDIARIES
NOTES TO THE CONSOLIDATED AND COMBINED FINANCIAL STATEMENTS—(Continued)
at December 31, 2004, 2003 and 2002
All amounts in millions of reais, unless otherwise indicated
taxpayer.
In December 2002,light of those aspects referring to the extent of the agravo regimental, OPP Química recognizedrecorded tax credits of R$ 1,030.1 in December 2002, and the corresponding undueCompany used those credits to offset IPI itself and other federal tax debts. Such credits were used up in the first quarter of 2005.
F-43
| Braskem S.A. and Its Subsidiaries |
| Notes to the Consolidated Financial Statements |
| at December 31, 2007, 2006 and 2005 |
| All amounts in millions of reais, unless otherwise indicated |
During 2006 and 2007, the Federal Revenue Office issued several infraction notices (autos de infração) against the Company to avoid forfeiture of the tax authorities' right to dispute the use of tax credits and demanding the tax payments paid by the Company by offsetting the tax credits recorded as from December 2002. Further, the Federal Revenue Office rejected approximately 200 applications for using these credits to offset other federal taxes payable by the Company. The Company disputed these rejections through administrative and judicial proceedings, and the likelihood of a favorable outcome for these disputes is viewed as probable by the Company's outside legal advisors.
The tax credits used by the Company (updated at the SELIC benchmark rate until December 2007) amount to R$ 2,506.9. The tax collection proceedings referred to above have reached R$ 2,263.5 to date, plus fines in the overall amount of R$ 1,030.1, which was offset731.0. The Company's outside legal advisors believe that such fines should not be payable by the Company withCompany.
In a session held on December 11, 2007, the STF First Panel granted the National Treasury's agravo regimental, agreeing to hear the extraordinary appeal and voiding the previous STF ruling. Such STF decision, containing the opinions and arguments of STF justices who took part in the judgment, has not been published to date. Braskem is ready to appeal after publication occurs.
All things considered, and in view that the new STF decision should be limited to procedural matters only, Braskem (in reliance on the opinion of its legal advisors) still defends the final and conclusive nature of the earlier STFdecision allowing it to use IPI and other federal taxes due. The Company also has similar lawsuits regardingtax credits deriving from the purchaseacquisition of exempt inputs and raw materials that are either tax-exempt or taxed at a zero-percent rate. In addition, Braskem believes that the new STF judgment on the extraordinary appeal should focus only on the subject ormatter of the agravo regimental (which means that the STF should not longer deliberate on entitlement to IPI tax credits themselves, as discussions over these specific matters should be precluded in this case).
Similar lawsuits have also been filed by the zero rate by itsCompany's branches located in the States of São Paulo, Bahia and Alagoas (Note 17(ii)16(ii)).
ICMS
The Company has recorded ICMS tax credits due to its high volume of exported products subject to deferred taxation.
The Company's management is working on a number of actions aimed at the optimal use of such credits, and currently no losses are expected from the realization of those credits. Examples of these actions are:
F-44
| Notes to the Consolidated Financial Statements |
| at December 31, 2007, 2006 and 2005 |
| All amounts in millions of reais, unless otherwise indicated |
The Company’s participation on associated companies is as follows:
Head office | Interest in total capital (%) | |||||||
| 2004 | 2003 | 2002 | ||||||
Associated companies | ||||||||
Rionil Compostos Vinílicos Ltda. (“Rionil”) | Brazil | 33.33 | 33.33 | 33.33 | ||||
Sansuy Indústrias Químicas S.A. (“Sansuy”) | Brazil | 20.00 | 20.00 | 20.00 | ||||
Petroflex | Brazil | 20.12 | 20.12 | 20.12 | ||||
| 2004 | 2003 | ||||||||||
| Rionil | Sansuy | Petroflex | Total | Total | |||||||
As of January 1 | 2.0 | 2.2 | 33.5 | 37.7 | 27.4 | ||||||
Equity in results | — | 0.7 | 17.3 | 18.0 | 12.7 | ||||||
Dividends | — | — | — | — | (0.7 | ) | |||||
Reversal of revaluation | — | — | — | — | (1.3 | ) | |||||
Amortization of goodwill | — | — | — | — | (0.4 | ) | |||||
As of December 31 | 2.0 | 2.9 | 50.8 | 55.7 | 37.7 | ||||||
| • | Authorization from the State of Bahia Government to increase the percentage of reduction in |
| • | Increasing the ICMS tax base in connection with the sale of fuel to refineries (from 40% to 100%), as per Article 347 of the Bahia State ICMS Regulations. |
| • | Replacing the exports of co-products by domestic market transactions with identified clients. |
| • | Starting feedstock imports under |
Copesul
Copesul is engaged in the manufacture, sale, import and export of basic petrochemical products and the production and supply of utilities, such as steam, water, compressed air, electrical energy, to the companies in the Triunfo Petrochemical Complex in the State of Rio Grande do Sul. Copesul also provides various other services to these companies. Goodwill on this investment is based on future profitability and will be amortized up to August 2011.
Politeno
Politeno is engaged in the manufacture, processing, direct or indirect sale, consignment, export, import and transportation of polyethylene and by-products, as well as the participation in other companies. The main raw material for all of its products is ethylene, which is supplied by Braskem. Politeno operates an industrial plant in the Northeastern Complex. Goodwill on this investment is based on future profitability and will be amortized up to August 2011.
The external auditors of Politeno issued an opinion on its financial statementsCompany's ICMS credit balance at December 31, 2004, with an emphasis paragraph showing2007 includes R$ 248.1, arising from the uncertaintiesmerged companies Politeno and Tegal. On a consolidated basis, the increase in relationthe credit balance is mainly attributable to the recoveryaddition of ICMS recoverable,Ipiranga Group assets, with credit balances of R$ 135.1.
Based on the projections of the Company's management concerning realization of those credits, the amount of R$ 865.1 (R$ 596.6 on 2006) was recorded as noncurrent assets.
ILL
This refers to a credit for Tax on Net Income (ILL) paid by subsidiary Copesul between 1989 and 1991, as this tax was considered unconstitutional under the Federal Senate Resolution 82 of November 18, 1996. Copesul has taken measures at the administrative level to offset this credit against other taxes.
F-45
| Braskem S.A. and Its Subsidiaries |
| Notes to the Consolidated Financial Statements |
| at December 31, 2007, 2006 and 2005 |
| All amounts in millions of reais, unless otherwise indicated |
10 Judicial Deposits and Compulsory Loan - Long-term Assets
| 2007 | 2006 | |||
| Judicial deposits | ||||
| Tax contingencies | 63.6 | 29.7 | ||
| Labor and other claims | 23.6 | 41.3 | ||
| Compulsory loan | ||||
| Eletrobrás | 20.5 | 19.5 | ||
| 107.7 | 90.5 | |||
11 Investments
(a) Information on investments
| Number of shares or quotas held (thousands) | Interest in | |||||||||||||||||
| Interest in total | voting share | |||||||||||||||||
| 2007 | 2006 | share capital - % | capital - % | |||||||||||||||
| Common | Pref. | |||||||||||||||||
| shares | shares | Quotas | Total | Total | 2007 | 2006 | 2007 | 2006 | ||||||||||
| Jointly-controlled | ||||||||||||||||||
| companies | ||||||||||||||||||
| Cetrel | 745 | - | - | 745 | 730 | 49.89 | 49.03 | 49.89 | 49.03 | |||||||||
| CODEVERDE | 9,894 | - | - | 9,894 | 9,755 | 35.53 | 35.55 | 35.53 | 35.55 | |||||||||
| Copesul | - | - | - | - | 44,255 | - | 29.46 | - | 29.46 | |||||||||
| Petroflex | 7,932 | 3,868 | - | 11,800 | 7,080 | 33.53 | 20.12 | 33.57 | 20.14 | |||||||||
| Petroquímica | ||||||||||||||||||
| Paulínia | 105,000 | - | - | 105,000 | 67,582 | 60.00 | 60.00 | 60.00 | 60.00 | |||||||||
| - | - | - | - | - | - | - | - | |||||||||||
| Associated companies | - | - | - | - | - | - | - | - | - | |||||||||
| Borealis | 18,949 | - | - | 18,949 | 18,949 | 20.00 | 20.00 | 20.00 | 20.00 | |||||||||
| Rionil | - | - | - | - | 3,061 | - | 33.33 | - | 33.33 | |||||||||
| Sansuy | - | - | 271 | 271 | 271 | 20.00 | 20.00 | 20.00 | 20.00 | |||||||||
Financial information from associated companies, excluding non-mandatory asset revaluation effects, conforming to the Company's accounting policies are presented below:
F-46
| Braskem S.A. and Its Subsidiaries |
| Notes to the Consolidated Financial Statements |
| at December 31, 2007, 2006 and 2005 |
| All amounts in millions of reais, unless otherwise indicated |
| Adjustment net income | Adjusted shareholders' equity | |||||||||||
| (loss) for the year | (unsecured liabilities) | |||||||||||
| 2007 | 2006 | 2005 | 2007 | 2006 | 2005 | |||||||
| Associated companies | ||||||||||||
| Borealis | 11.4 | 13.7 | 13.4 | 119.3 | 117.9 | 114.15 | ||||||
| Rionil | 0.3 | 0.2 | - | 5.8 | 6.1 | 5.8 | ||||||
| Sansuy | (5.5) | (10.2) | (12.7) | (30.9) | (25.4) | 5.0 | ||||||
| 2007 | 2006 | |||||||||
| Borealis | Rionil | Outros | Total | Total | ||||||
| At January 1 | 23.6 | 2.0 | 0.6 | 26.2 | 25.8 | |||||
| Equity in the results | 2.3 | (0.1) | - | 2.2 | 1.8 | |||||
| Write-off through sale | - | (1.9) | - | (1.9) | - | |||||
| Dividends | (2.0) | - | - | (2.0) | (2.0) | |||||
| Other | - | - | - | - | 0.6 | |||||
| At December 31 | 23.9 | - | 0.6 | 24.5 | 26.2 | |||||
Share prices of related parties' shares listed on the São Paulo Stock Exchange are presented below:
| Share Price - R$ | |||||||||||
| Trading | |||||||||||
| Type | Code | 2007 | 2006 | 2005 | unit | ||||||
| Copesul(*) | ON | CPSL3 | - | 38.10 | 27.9 | 1 share | |||||
| Petroflex | ON | PEFX3 | 17.10 | 14.40 | 16.61 | 1 share | |||||
| PNA | PEFX5 | 16.50 | 14.85 | 16.26 | 1 share | ||||||
(*) Delisted as from October 2007.
At December 31, 2007, the market value of Petroflex, based on the price of shares listed on the São Paulo Stock Exchange, was R$ 199.5.
F-47
| Braskem S.A. and Its Subsidiaries |
| Notes to the Consolidated Financial Statements |
| at December 31, 2007, 2006 and 2005 |
| All amounts in millions of reais, unless otherwise indicated |
(b) Information on investments in the amount
BRASKEM S.A. AND ITS SUBSIDIARIES
NOTES TO THE CONSOLIDATED AND COMBINED FINANCIAL STATEMENTS—(Continued)
at December 31, 2004, 2003 and 2002
All amounts in millions of reais, unless otherwise indicated
of R$ 115.3. According to the opinion, management is discussing with the Finance Secretariat of the State of Bahia the adoption of measures in order to provide choices for the recovery of the mentioned credit.
Cetrel
The principal activity of Cetrel is to provide services related to environmental controlsprotection and protectioncontrols to petrochemical companies. Goodwill on this investment is based on future profitabilitythe fair value of assets and will be amortized upthrough July 2015.
Petroquímica Paulínia
On September 16, 2005, Braskem and Petroquisa formed Petroquímica Paulínia, which will be responsible for the development and operation of a new polypropylene plant to July 2013.be built in Paulínia - São Paulo. This plant will use polymer-grade propylene supplied by Petrobrás as its main raw material. Operations are scheduled to start by the beginning of 2008, using advanced Braskem technology. The assignment of the right to use this technology gave rise to a gain of R$ 23.3 in 2005 for the Company.
Petroflex
Petroflex is a leading producer of synthetic rubber in Latin America and produces styrene-butadiene, polybutadiene, liquid hidroxylated polybutadiene and other elastomers. The main raw material for all of its products is butadiene, which is supplied by Braskem. Petroflex operates three plants in Brazil located in Rio de Janeiro, Pernambuco and Rio Grande do Sul.
(c) Advance for the acquisition of investments
This balance comprises expenses from the acquisition of the Ipiranga Group petrochemical assets, as mentioned in Note 1(c). The acquisition of RPI, DPPI and CBPI shares was carried out in three steps, as follows:
F-48
| Notes to the Consolidated Financial Statements |
| at December 31, 2007, 2006 and 2005 |
| All amounts in millions of reais, unless otherwise indicated |
| • | In October and November 2007, the Company purchased common and preferred shares held by minority shareholders of RPI, DPPI and CBPI, as required by the Brazilian Corporate Law. For this acquisition, Braskem made to Ultrapar an advance of R$ 203.7, and recorded a 17.87% interest in the total share capital of Ipiranga Química for purposes of consolidating these assets. |
| • | In December 2007, Ultrapar merged the preferred shares owned by minority shareholders in the acquired companies, and afterwards held 100% of the shares in RPI, DPPI and CBPI. Upon completion of this stage, the Company recorded the last purchase price installment to be assigned to Ultrapar in the amount of R$ 633.5 to be disbursed when the Company receives the Ipiranga Química shares from Ultrapar, which occurred in February 2008. This installment has been added to the "Advance for acquisition of investment" line against "Creditors on acquisition of investments". Following the accounting recognition of this stage of the acquisition process, the Company began to record a 60% interest in the total share capital of Ipiranga Química for purposes of consolidation of these assets. |
| 2004 | 2003 | Annual | |||||||||
| Cost | Accumulated depreciation | Net | Net | ||||||||
Land | 46.5 | — | 46.5 | 55.7 | — | ||||||
Buildings and improvements | 941.7 | (396.8 | ) | 544.9 | 440.2 | 2 to 10 | |||||
Machinery, equipment and installations | 7,417.8 | (3,203.3 | ) | 4,214.5 | 4,396.2 | 3.3 to 20 | |||||
Mines and wells | 26.0 | (21.4 | ) | 4.6 | 1.3 | 4 to 10 | |||||
Furniture and fixtures | 39.4 | (33.8 | ) | 5.6 | 7.0 | 10 | |||||
Information technology | 56.4 | (45.1 | ) | 11.3 | 9.9 | 20 | |||||
Construction-in-progress | 554.7 | — | 554.7 | 405.4 | — | ||||||
Other | 31.0 | (15.9 | ) | 15.1 | 37.2 | Up to 20 | |||||
| 9,113.5 | (3,716.3 | ) | 5,397.2 | 5,352.9 | |||||||
In addition to the amounts allocated to the purchase of shares, the Company considered as part of the investment cost those expenses directly associated with the process, which amounted to R$ 22.0 through December 2007. Taking into consideration all disbursements already made, in December 2007 the Company recorded goodwill of R$ 1,050.9, attributed to appreciation of property, plant and equipment.
ConstructionBetween April and December 2007, the Company recorded R$ 30.7 as equity in the earnings of Ipiranga Química. During the same period, the amount of R$ 22.9 was taken into income as realization of goodwill underlying this acquisition.
The unaudited pro forma condensed statement of operations for the years ended December 31, 2007 and 2006, consider that the acquisition of the Ipiranga Group (Note 1 (c)(xi)) and the Petrobras Transaction (Note 1 (c)(xv)) had occurred on January 1 , 2006, as below::
F-49
| Braskem S.A. and Its Subsidiaries |
| Notes to the Consolidated Financial Statements |
| at December 31, 2007, 2006 and 2005 |
| All amounts in millions of reais, unless otherwise indicated |
| 2007 | 2006 | |||
| Unaudited | Unaudited | |||
| Net sales revenue | 18,787.2 | 16,898.7 | ||
| Cost of sales and services rendered | (15,214.3) | (13,684.3) | ||
| Gross profit | 3,572.9 | 3,214.4 | ||
| Operating expenses (income) | (1,661.2) | (1,368.8) | ||
| Equity accounting | (185.7) | (237.0) | ||
| Financial expenses, net | (438.7) | (1,205.9) | ||
| Non-operating expenses, net | (69.1) | (28.8) | ||
| Income taxes | (422.5) | (131.3) | ||
| Profit sharings | (24.5) | (26.5) | ||
| Net income for the year | 771.2 | 216.1 | ||
F-50
| Braskem S.A. and Its Subsidiaries |
| Notes to the Consolidated Financial Statements |
| at December 31, 2007, 2006 and 2005 |
| All amounts in millions of reais, unless otherwise indicated |
12Property, Plant andEquipment, andIntangibleAssets
| 2007 | 2006 | Average | ||||||||
| annual | ||||||||||
| Accumulated | depreciation | |||||||||
| Cost | depreciation | Net | Net | rates - % | ||||||
| Property, plant and equipment | ||||||||||
| Land | 75.0 | - | 75.0 | 61.3 | - | |||||
| Buildings and improvements | 1,317.5 | (586.8 ) | 730.7 | 592.1 | 2.7 | |||||
| Machinery, equipment and facilities | 12,991.7 | (7,377.5 ) | 5,614.2 | 4,296.9 | 5.9 | |||||
| Mines and wells | 9.6 | (5.4 ) | 4.2 | 4.8 | 10.6 | |||||
| Furniture and fixtures | 79.7 | (50.7 ) | 29.0 | 16.5 | 10.0 | |||||
| Information technology equipment | 142.6 | (103.3 ) | 39.3 | 21.9 | 20.0 | |||||
| Maintenance stoppages in progress | 95.5 | - | 95.5 | 77.8 | - | |||||
| Constructions in progress | 1,657.3 | - | 1,657.3 | 1,523.8 | - | |||||
| Other | 250.0 | (91.1 ) | 158.9 | 93.6 | 16.0 | |||||
| 16,618.9 | (8,214.8 ) | 8,404.1 | 6,688.7 | - | ||||||
| Intangible assets | ||||||||||
| Brands and patents | 0.6 | (0.6 ) | - | 0.1 | 10.0 | |||||
| Technology | 35.1 | (25.6 ) | 9.5 | 13.8 | 12.3 | |||||
| Licensing rights for internal use of operating systems | 215.6 | (52.7 ) | 162.9 | 115.6 | 19.8 | |||||
| 251.3 | (78.9 ) | 172.4 | 129.5 | - | ||||||
| 16,870.2 | (8,293.7 ) | 8,576.5 | 6,818.2 | - | ||||||
Constructions in progress relates principallymainly to projects for expansion of industrial capacity, operating improvements to increase the useful lifelives of machinery and equipment, projects in maintenance and production, and programs in the industrial units, as well asareas of health, technology and security projects.security.
F-51
| Braskem S.A. and Its Subsidiaries |
| Notes to the Consolidated Financial Statements |
| at December 31, 2007, 2006 and 2005 |
| All amounts in millions of reais, unless otherwise indicated |
At December 31, 2004,2007, property, plant and equipment includesincluded goodwill arising from legally merged and consolidated companies (Note 1(b)) in the net amount of R$ 937.2 (2003—765.7 (2006 - R$ 717.5)819.8), transferred in conformity with CVM Instruction 319/99.
| 2004 | 2003 | |||||
Costs | ||||||
Pre-operating expenses | 244.6 | 289.4 | ||||
Rights to manufacturing processes | 57.0 | 53.7 | ||||
Organization and implementation expenses | 317.4 | 239.9 | ||||
Expenditures for structured operations | 436.0 | 314.3 | ||||
Goodwill acquisition investments | 2,409.5 | 2,538.1 | ||||
Expenditures for programmed stoppages (major overhauls) | 500.5 | 342.6 | ||||
Research and development | 91.2 | 86.2 | ||||
Catalysts and other | 104.3 | 57.1 | ||||
| 4,160.5 | 3,921.3 | |||||
Accumulated amortization | (1,055.5 | ) | (745.8 | ) | ||
| 3,105.0 | 3,175.5 | |||||
BRASKEM S.A. AND ITS SUBSIDIARIES
NOTES TO THE CONSOLIDATED AND COMBINED FINANCIAL STATEMENTS—(Continued)
As from January 1, 2006, in accordance with IBRACON Technical Interpretation 01/2006, the Company records all programmed maintenance shutdown expenses in property, plant and equipment as "Machinery equipment and facilities". These expenses, which arise from partial or full production shutdowns, occur at scheduled intervals from two to six years and are depreciated to production cost during the period until the beginning of the next maintenance shutdown. Until December 31, 2004, 20032005, such expenses were recorded as deferred charges and 2002amortized to production cost through the beginning of the next shutdown.
All amountsAlso, because of the adoption of Technical Interpretation 01/2006, in millionsthe first quarter of reais, unless otherwise indicated2006, the Company recorded an increase in accumulated depreciation of machinery and equipment in the amount of R$ 164.9. As this constituted a change in accounting principle and depreciation relating to years prior to 2006, this amount, was recorded under shareholders' equity, as accumulated losses, as required by Technical Interpretation 01/2006.
13 Deferred Charges
| 2007 | 2006 | Average | ||||||||
| annual | ||||||||||
| Accumulated | amortization | |||||||||
| Cost | amortization | Net | Net | rates - % | ||||||
| Organization and system implementation expenses | 300.9 | (192.2) | 108.7 | 134.0 | 17.9 | |||||
| Expenditures for structured transactions | 320.7 | (219.6) | 101.2 | 158.7 | 14.7 | |||||
| Goodwill on acquisition of investments | 3,554.8 | (1,150.0) | 2,404.8 | 1,531.0 | 11.3 | |||||
| Pre-operating expenses and other items | 215.8 | (143.5) | 72.2 | 67.5 | 9.8 | |||||
| 4,392.2 | (1,705.3) | 2,686.9 | 1,891.2 | |||||||
Goodwill on acquisition of investments is based on the future profitability and is being amortized inover up to ten years, according to the appraisal reports issued by independent experts.appraisal firms. The recordrecognition of goodwill inwithin deferred charges is in conformity with CVM Instructions 319/99no. 319 and 247/96.
no. 247.
Goodwill amortization areis recorded withinunder depreciation and amortization and amounted to R$ 332.1409.7 in 2004 (2003—2007 (2006 - R$ 362.9)360.1) . Included in these amounts are
F-52
| Braskem S.A. and Its Subsidiaries |
| Notes to the Consolidated Financial Statements |
| at December 31, 2007, 2006 and 2005 |
| All amounts in millions of reais, unless otherwise indicated |
14 Loans andFinancing
| Annual financial charges | 2007 | 2006 | |||||
| Foreign currency | |||||||
| Eurobonds | Note 14(b) | 1,401.2 | 1,715.8 | ||||
| Advance on exchange contracts | 2007 | US$ exchange variation + average interest of 5.65% | 28.3 | - | |||
| 2006 | US$ exchange variation + interest of 5.60% or fixed interest of 7.11% | - | 63.0 | ||||
| Export prepayments | Note 14(c) | 1,623.3 | 324.9 | ||||
| Medium - term notes | Note 14(d) | 632.5 | 763.5 | ||||
| Raw material financing | 2007/2006 | YEN exchange variation + fixed interest of 6.70% | 0.4 | 1.3 | |||
| 2007 | US$ exchange variation + average interest of 6.76% | 18.3 | - | ||||
| 2006 | US$ exchange variation + average interest of 5.73% | - | 20.9 | ||||
| 2007 | EUR exchange variation + average interest of 4.68% | 1.7 | - | ||||
| 2006 | EUR exchange variation + average interest of 2.0% above 6-month LIBOR | - | 1.8 | ||||
| Permanent assets financing | 2007 | US$ exchange variation + 1.60%aa annual LIBOR | 37.9 | - | |||
| 2007 | US$ exchange variation + 0.35%aa 4-month LIBOR (Note 14(a)) | 1,701.8 | - | ||||
| 2006 | US$ exchange variation + fixed interest of 7.14% | - | 0.6 | ||||
| 2006 | US$ exchange variation + interest of 9.73% | - | 8.8 | ||||
| BNDES | 2007 | Average fixed interest of 9.70%aa + post-fixed restatement (UMBNDES) | 44.8 | - | |||
| 2006 | Fixed interest of 10.00%+ post-fixed restatement (UMBNDES) | - | 40.9 | ||||
| 2006 | US$ exchange variation + average interest of 8.70% | - | 3.1 | ||||
| Working capital | 2007 | US$ exchange variation + average interest of 7.83% | 388.2 | - | |||
| 2006 | US$ exchange variation + interest of 8.10% | - | 168.7 | ||||
| 2006 | US$ exchange variation + average interest of 6.91% | - | 4.0 | ||||
F-53
| Braskem S.A. and Its Subsidiaries |
| Notes to the Consolidated Financial Statements |
| at December 31, 2007, 2006 and 2005 |
| All amounts in millions of reais, unless otherwise indicated |
| Annual financial charges | 2007 | 2006 | |||||
| Local currency | |||||||
| Working capital | 2007 | 102% of CDI | 128.8 | - | |||
| 2006 | Fixed interest of 13.42% + post-fixed restatement (CDI) | - | 6.7 | ||||
| Investment funds in credit rights | 2006 | Note 14(f) | - | 422.3 | |||
| FINAME | 2007 | Average interest of 4.44% + TJLP | 7.0 | - | |||
| 2006 | Average interest of 7.50% + TJLP | - | 13.0 | ||||
| BNDES | 2007 | Average fixed interest of 3.45% +TJLP | 667.5 | - | |||
| 2006 | Average fixed interest of 3.94% to 4.00% +TJLP | - | 346.0 | ||||
| BNB | 2007 | Fixed interest of 9.88% | 165.9 | - | |||
| 2006 | Fixed interest of 11.81% | - | 135.0 | ||||
| FINEP | 2007 | Post-fixed restatement (TJLP) | 64.3 | - | |||
| 2006 | US$ exchange variation + post-fixed restatement (TJLP) | - | 83.6 | ||||
| Project financing (NEXI) | 2007/2006 | Note 14(e) | 231.2 | 281.9 | |||
| Vendor | 2007/2006 | Average interest of 11.55% | 327.2 | 183.9 | |||
| Total | 7,470.3 | 4,589.7 | |||||
| Current liabilities | (1,068.4) | (653.9) | |||||
| Long-term liabilities | 6,401.9 | 3,935.8 | |||||
(i) UMBNDES = BNDES monetary unit.
F-54
| Braskem S.A. and Its Subsidiaries |
| Notes to the Consolidated Financial Statements |
| at December 31, 2007, 2006 and 2005 |
| All amounts in millions of reais, unless otherwise indicated |
(a) Investment financing
In April 2007, the goodwill amortizationCompany completed negotiations to obtain a bridge loan of legally merged companies whichup to US$ 1.2 billion to finance the acquisition of the Ipiranga Group petrochemical assets and delist Copesul. Amounts drawn down by the Company until December 31, 2007, plus charges and the portion released to subsidiary EDSP58, totaled R$ 170.7 in 2004 (2003—R$ 205.5)1,701.8, and are stated as "Permanent assets financing".
If the legal merger of Trikem S.A. had taken place in January 1, 2002 the following reclassifications would have been made for both years ended December 31, 2003(b) U.S. dollar - denominated notes and 2002:
On scheduled dates, varying from one to six years, the Company performs total or partial overhauls of its facilities. The costs associated with overhauls are deferred and amortized over the period until the beginning of the next corresponding overhaul.
Annual financial charges | 2004 | 2003 | ||||
Foreign currency-denominated | ||||||
Foreign notes payable (Eurobonds) | Note 15(a) | 700.5 | 1,636.9 | |||
Advances on export contracts | 2004 US$ + interest of 2.30% to 6.0 (2003 US$ + interest of 6.25% to 12.30%) | 351.9 | 458.5 | |||
Export prepayment | Note 15(b) | 910.9 | 1,182.5 | |||
Medium term notes | Note 15(c) | 1,581.4 | 1,369.2 | |||
Raw material financing | 2004 US$ + interest of 0.53% to 7.65% above LIBOR | 467.1 | 4.8 | |||
| 2004 US$ and YEN + fixed interest of 6.90% (2003 US$ and YEN + fixed interest of 4.75% to 8.26%) | 4.4 | 238.5 | ||||
Permanent assets financing | 2004 US$ + interest of 3.88% above LIBOR (2003 US$ + interest of 0.50% to 3.88% above LIBOR) | 29.9 | 276.3 | |||
| 2004 US$ + fixed interest of 4.75% to 13.64% (2003 US$ + fixed interest of 6.49% to 7.14%) | 28.9 | 45.3 | ||||
Working capital | 2004 US$ + interest of 5.00% to 7.50% (2003 US$ + interest of 3.55% to 13.64%) | 102.8 | 8.0 | |||
Local currency-denominated | ||||||
Working capital | 2004 interest of 0.30% to 11.00% + fixed restatement (IGPM TJLP and CDI) | |||||
| 2003 interest of 2.42% to 14.03% + fixed restatement (SELIC and CDI) | 34.1 | 332.5 |
BRASKEM S.A. AND ITS SUBSIDIARIES
NOTES TO THE CONSOLIDATED AND COMBINED FINANCIAL STATEMENTS—(Continued)
at December 31, 2004, 2003 and 2002
All amounts in millions of reais, unless otherwise indicated
Annual financial charges | 2004 | 2003 | ||||||
| 2004 US$ + interest of 4.50% 2003 US$ + interest of 7.0% to 13.00% | 11.0 | 148.8 | ||||||
| 2003 fixed interest of 30.61% to 41.42% | — | 74.7 | ||||||
Government Agency for Machinery | Fixed interest of 3.00% to 11.00% + fixed restatement (TJLP) | 17.1 | 32.0 | |||||
National Bank for economic and Social Development (BNDES) | Fixed interest of 2.50% to 12.60% + fixed restatement (TJLP and UMBNDES) | 171.2 | 280.1 | |||||
Bank of the Northeast of Brazil (BNB) | Fixed interest of 11.81% | 31.5 | — | |||||
Acquisition of shares | Fixed interest of 4.00% to 4.50% + fixed restatement (TJLP and IGPM) | 176.3 | 253.0 | |||||
Vendor | Fixed interest of 18.00% to 20.04% | 168.6 | — | |||||
Others | Fixed interest between 14.00% and 21.00% + payment bonus of 15.00% or 112.00% of CDI | 39.2 | 0.7 | |||||
| 4,826.8 | 6,341.8 | |||||||
Less: current liabilities | (1,775.6 | ) | (2,726.5 | ) | ||||
Long-term liabilities | 3,051.2 | 3,615.3 | ||||||
|
| |||
| ||||
| ||||
|
bonds
In June 1997,April 2006, the Company issued perpetual bonds in the amount of US$ 150.0 million, maturing in June 2007 and bearing annual interest of 9%, payable semiannually.
The Company also had outstanding bonds originally issued through OPP Química as follows: (1) US$ 125.0 million issued in February 1996, which matured in February 2004 and bore annual interest of 11.5%, payable semiannually; and (2) US$ 100.0 million issued in October 1996, which matured in October 2004 and bore annual interest of 11%, payable semiannually. These OPP Química bonds have been fully paid at maturity.
In July 1997, Trikem issued bonds in the amount of US$ 250.0 million, maturing in July 2007 and bearing annual interest of 10.625%, payable semiannually. These notes grant exclusively to Trikem the right to repurchase the bonds on July 24 of each year as from July 2002.
The consolidated balance of prepayment of exports includes the balance of an advance of US$ 100.0 million made by a foreign customer of Trikem in August 1997 with a limit for shipment of up to June 2004, bearing annual interest of 12%. This balance was fully paid in October 2004. At December 31, 2003, the balance amounted US$ 47.2 million (R$ 136.4).
BRASKEM S.A. AND ITS SUBSIDIARIES
NOTES TO THE CONSOLIDATED AND COMBINED FINANCIAL STATEMENTS—(Continued)
at December 31, 2004, 2003 and 2002
All amounts in millions of reais, unless otherwise indicated
On December 28, 2001, the Company obtained funds in the amount of US$ 250.0 million as prepayment of exports. This loan was placed in two tranches. The first tranche, in the amount of US$ 80.0 million, had a settlement term up to December 2004 and bore interest of 4.25% per annum plus 3 month LIBOR, payable on a quarterly basis and was repaid upon maturity. The second tranche, in the amount of US$ 170.0 million was also repaid upon maturity. The debt balance at December 31, 2003 was US$ 223.1 million—R$ 644.5.
In December 2002, OPP Química received an advance from a foreign customer, in the amount of US$ 97.2 million, with annual interest of 3.75%, plus semiannual LIBOR, in addition to the exchange variation. In November 2004, the Company renegotiated the terms of this advance, reducing the spread to 1.25% per annum (p.a.). This advance will be repaid through shipments made up to June 2006. The balance due at December 31, 2004 is US$ 47.0 million—R$ 124.8 (2003—US$ 96.7 million—R$ 279.3).
In June 2004, the Company obtained funds in the amount of US$ 200.0 million as a prepayment of exports divided in two tranches. The first tranche, in the amount of US$ 145.0 million, has a settlement term up to December 2007 and bears interest of 3.5% per annum plus six month LIBOR, payable semiannually. The second tranche, in the amount of US$ 55.0 million, has a settlement term up to June 2009 and bears interest of 4.5% per annum plus six month LIBOR, payable semiannually. The balance due, at December 31, 2004, was US$ 200.6 million—R$ 532.6.
In August 2004, the Company obtained funds in the amount of US$ 50.0 million as a prepayment of exports. In addition to the foreign exchange variation, the advance bears annual interest of 3% plus six month LIBOR up to January 2005 and 3 month LIBOR as from that date up to the final maturity, in October 2006. This advance will be amortized with exports between July 2004 and October 2006. The balance due, at December 31, 2004, was US$ 51.0 million—R$ 135.4.
The Company has also other export prepayment financing in the amount of US$ 45.2 million—R$ 119.9 at December 31, 2004. At December 31, 2003, the balance of these financings was US$ 42.3 million—R$ 122.3, which will be settled at various dates through February 2006. In addition to foreign exchange variation, the Company pays annual interest on these export prepayment financings ranging from 0.30% to 4.63% above LIBOR.
In July 2003, Braskem established an MTN Program providing for issuances of notes in an aggregate principal amount of up to US$ 500.0200.0 million. These bonds bear annual interest of 9.00%, payable on a quarterly basis in arrears on January 28, April 28, July 28 and October 28 of each year, commencing on July 28, 2006. The Company’s Boardproceeds were used for working capital purposes and acquisition of Directors, at a meeting on December 16, 2003, authorized an increasePoliteno shares.
In September 2006, the Company issued bonds in the MTN program up to an aggregate principal amount of US$ 1 billion275.0 million, with an 8% coupon and an extensiona maturity in the term from five to ten years. Funds raised were used mainly to repurchase the third tranche of the medium-term notes ("MTNs") (Note 14(d)).
In June 2007, the Company renegotiated the interest rate on certain bonds issued in June 1997, which decreased from 9.00% per annum to 8.25% per annum, while maturity was extended from 2007 to 2024.
The totalCompany's U.S. dollar-denominated notes and bond positions are summarized as follows:
| Amounts in | ||||||||||
| Date | US$ million | Maturity | Interest p.a. | 2007 | 2006 | |||||
| June 1997 | 150.0 | June 2007 | 8.25 | - | 321.1 | |||||
| July 1997 | 250.0 | June 2015 | 9.38 | 267.7 | 35.5 | |||||
| June 2005 | 150.0 | None | 9.75 | 266.8 | 322.0 | |||||
| April 2006 | 200.0 | None | 9.00 | 360.5 | 435.2 | |||||
| September 2006 | 275.0 | January 2017 | 8.00 | 506.2 | 602.0 | |||||
| 1,401.2 | 1,715.8 | |||||||||
F-55
| Braskem S.A. and Its Subsidiaries |
| Notes to the Consolidated Financial Statements |
| at December 31, 2007, 2006 and 2005 |
| All amounts in millions of reais, unless otherwise indicated |
(c) Export prepayments
The Company's export prepayments positions are summarized as follow:
| Amounts in | ||||||||||
| Date | US$ million | Maturity | Interest p.a. | 2007 | 2006 | |||||
| June 2004 | 200.0 | June 2009 | 1.45 + 6-month LIBOR | - | 268.2 | |||||
| January 2005 | 45.0 | January 2008 | 1.55 + 3-month LIBOR | 7.3 | 44.3 | |||||
| January 2005 | 28.0 | January 2008 | 1.66 + 6-month LIBOR | - | 12.4 | |||||
| May 2006 | 0.4 | June 2008 | US$ exchange variation+ | |||||||
| average interest of 5.41 | 1.0 | - | ||||||||
| May 2006 | 10.0 | May 2009 | US$ exchange variation + | |||||||
| average interest of 5.33 | 17.9 | - | ||||||||
| May 2006 | 20.0 | January 2010 | US$ exchange variation + | |||||||
| average interest of 5.19 | 37.5 | - | ||||||||
| July 2006 | 435.0 | August 2011 | US$ exchange variation + | |||||||
| interest of 6.56 | 727.7 | - | ||||||||
| April 2007 | 150.0 | April 2014 | 0.77 + 6-month LIBOR | 269.6 | - | |||||
| October 2007 | 312.5 | October 2009 | 1.50 + 4-month LIBOR | 562.3 | - | |||||
| 1,623.3 | 324.9 | |||||||||
(d) Medium-Term Notes ("MTN") program
The outstanding principal amounts of notes issued under the MTN program at December 31, 2004 is summarized2007 and 2006 are as follows:
| Amount in | ||||||||||||
| Issue | US$ million | Date | Maturity | Interest p.a. | 2007 | 2006 | ||||||
| 3rd tranche | 275.0 | November 2003 | November 2008 | 12.50% | 163.6 | 197.5 | ||||||
| 4th tranche | 250.0 | January 2004 | January 2014 | 11.75% | 468.9 | 566.0 | ||||||
| 632.5 | 763.5 | |||||||||||
| US$ million | R$ | |||||||||||
Issues | Interest % | Maturity | 2004 | 2003 | 2004 | 2003 | ||||||
1st Tranche—July 2003 | 10.50 | July 2004 | 121.0 | 121.0 | — | 349.6 | ||||||
2nd Tranche—October 2003 | 9.25 | October 2005 | 65.0 | 65.0 | 172.5 | 187.8 | ||||||
3rd Tranche—November 2003 | 12.50 | November 2008 | 275.0 | 275.0 | 730.0 | 794.5 | ||||||
4th Tranche—January 2004 | 11.75 | January 2014 | 250.0 | — | 663.6 | — | ||||||
| 711.0 | 461.0 | 1,566.1 | 1,331.9 | |||||||||
Interest accrued | 15.3 | 37.3 | ||||||||||
Balance at December 31 | 1,581.4 | 1,369.2 | ||||||||||
(e) Project financing (NEXI)
In March and September 2005, the Company obtained Japanese yen-denominated loans from Nippon Export and Investment Insurance, in the amount of ¥ 5,256.5 million (R$ 136.5) and ¥ 6,628.2 million (R$ 141.5), respectively, to finance several investment projects, including the "Braskem +" program. These loans bear annual interest of 0.95% above the Tokyo Interbank Rate (TIBOR) plus exchange variation, payable semi-annually.
F-56
BRASKEM S.A. AND ITS SUBSIDIARIES
NOTES TO THE CONSOLIDATED AND COMBINED FINANCIAL STATEMENTS—(Continued)
at December 31, 2004, 2003 and 2002
All amounts in millionsTable of reais, unless otherwise indicatedContents
| Notes to the Consolidated Financial Statements |
| at December 31, 2007, 2006 and 2005 |
| All amounts in millions of reais, unless otherwise indicated |
These loans relate to various operations for the increase in production capacity, environmental programs, operating control centers, laboratory and waste treatment stations. Principal and charges are payable monthly up to June 2016.
The loans for purchase of shares relate to:
(i) the acquisition from BNDESPAR of Conepar shares, in September 2001 by Nova Camaçari. The loan principal is payable in full on August 15, 2006.11 installments, commencing in March 2007, with a final maturity date in March 2012. The principal bearsfinancing contracts include insurance that guarantees 95% of commercial risk amounts and 97.5% of political risk amounts.
As part of its risk management policy (Note 22), the Company entered into a swap contract in the total amount of these loans, which, in effect, changes the annual interest rate and exchange variation to 101.59% of 4% plus TJLP, payable annually asCDI for the tranche drawn down in March 2005, and 103.98% of CDI and 104.29% of CDI for two tranches drawn down in September 2005. The swap contract was entered into with a leading foreign bank and its maturity, currencies, rates and amounts are matched to the financing contracts. The effect of this swap contract is recorded in financial results under monetary variation of financing (Note 22).
(f) Investment fund in credit rights
This financing arises from August 15, 2002.the consolidation of investment funds in credit rights ("FIDC"), named Chemical and Chemical II Funds. FIDCs raise funds by selling senior quotas with interest linked to the variation of the CDI rate. The charters of these funds also provide for the issuance of subordinated quotas in order to maintain the appropriate asset balance. These quotas are remunerated in accordance with the funds profitability. At December 31, 2004,2006, the subordinated quotas in these funds were owned by the Company. With the resources available, the funds purchase trade bills issued by Braskem, taking into account the selection criteria prescribed by the FIDC manager (Note 6).
In December 2006, the Chemical Fund redeemed its senior quotas (December 31, 2005 - R$ 201.6), whose remuneration was 113.5% of CDI. The fund no longer existed in 2007.
The Chemical II Fund issued the first tranche of senior quotas in December 2005, remunerated at 103.75% of CDI and redemption anticipated for December 2008. The subordinated quotas held by the Company were sold in the quarter ended March 2007. At December 31, 2007, the balance including accrued interest wasof these quotas amounted to zero (2006 - R$ 176.3 (2003—R$ 177.3); and401.4) .
F-57
| Braskem S.A. and Its Subsidiaries |
| Notes to the Consolidated Financial Statements |
| at December 31, 2007, 2006 and 2005 |
| All amounts in millions of reais, unless otherwise indicated |
(g) Repayment schedule
Long-term loans mature as follows:
| 2007 | 2006 | |||
| 2008 | - | 876.8 | ||
| 2009 | 2,593.7 | 260.3 | ||
| 2010 | 378.7 | 193.3 | ||
| 2011 | 304.6 | 127.8 | ||
| 2012 | 329.1 | 38.4 | ||
| 2013 and thereafter | 2,795.9 | 2,439.2 | ||
| 6,402.0 | 3,935.8 | |||
The company believes that it will meet its debt obligations in 2009 with its cash generated from operations, its existing cash and other liquid investment and use of existing credit facilities and receivables transactions, if needed.
(h) Guarantees
The Company and its subsidiaries Copesul and IPQ have provided securities for short- and long-term financing, as stated below:
Braskem
| Total | Loan | |||||||
| Maturity | guaranteed | amount | Guarantees | |||||
| BNB | January 2016 | 156.4 | 156.4 | Mortgage, machinery & equipment | ||||
| BNDES | November 2012 | 331.4 | 331.4 | Mortgage, machinery & equipment | ||||
| NEXI | March 2012 | 154.5 | 231.2 | Insurance premium | ||||
| FINEP | March 2012 | 64.3 | 64.3 | Mortgage and surety bond | ||||
| Prepayments | April 2014 | 276.9 | 1,138.0 | Mortgage and surety bond | ||||
| Other institutions | November 2007 to | Surety/endorsement and promissory | ||||||
| December 2012 | 20.3 | 388.5 | notes | |||||
| Total | 1,003.8 | 2,309.8 | ||||||
At December 31, 2007, the Company is the direct financing guarantor of the jointly-controlled entity Petroflex for R$ 8.6 (2006 - R$ 6.4), corresponding to 40% of Petroflex's debt to BNDES.
In December 2006, the Company, together with Petrobras Química S.A. - Petroquisa, entered into a support agreement with BNDES, under which Braskem and Petroquisa undertook to provide, in proportion to their respective interests in the following years:
| 2004 | 2003 | |||
2005 | — | 1,042.7 | ||
2006 | 620.0 | 503.4 | ||
2007 | 946.6 | 1,237.6 | ||
2008 | 772.5 | 831.6 | ||
2009 and thereafter | 712.1 | — | ||
| 3,051.2 | 3,615.3 | |||
Incapital of Petroquímica Paulínia, the caserequired funds to meet any insufficiencies arising from delinquency on the part of short-term loans,that company. Accordingly, the Company has given security in the formmay be required to make disbursements to Petroquímica Paulínia of trade bills receivable and promissory notes guaranteed by shares. Certain workingup to R$ 339.7, as capital borrowings are secured by letterscontribution or loan.
F-58
Table of credit and bank guarantees.
Long-term loans are secured by fixed assets, shares, guarantees of the shareholders and bank guarantees. Certain long-term borrowings are secured by mortgages on the Company’s industrial plants with a net book value of R$ 134.5. Additionally, certain loans related to the acquisition of fixed assets are secured by shares.
BRASKEM S.A. AND ITS SUBSIDIARIESContents
NOTES TO THE CONSOLIDATED AND COMBINED FINANCIAL STATEMENTS—(Continued)
at December 31, 2004, 2003 and 2002
All amounts in millions of reais, unless otherwise indicated
The Company’s debenture position is summarized as follows:
| 2004 | 2003 | |||||
As of January 1 | 1,492.0 | 1,222.3 | ||||
Accrued interest and financial charges | 444.1 | 280.7 | ||||
Issuance(*) | 1,500.0 | 140.3 | ||||
Repayments | (2,263.2 | ) | (151.3 | ) | ||
At the end of the year | 1,172.9 | 1,492.0 | ||||
Less: current liabilities | (5.0 | ) | (349.0 | ) | ||
Long-term liabilities | 1,167.9 | 1,143.0 | ||||
On May 31, 2002, OPP PP issued R$ 591.9 subordinated convertible debentures to Odebrecht S.A, and further transferred its title to ODBPAR Investimentos S.A. (“ODBPAR”). These debentures became the Company’s obligation as a result of the merger of OPP PP into the Company on August 16, 2002. These debentures have the following terms:
| Braskem S.A. and Its Subsidiaries | ||
Notes to the Consolidated Financial Statements | ||
| ||
| ||
These amounts correspond to the maximum amount of potential future repayments (not discounted) that the Company may be required to make.
Copesul
| Total | Loan | |||||||
| Maturity | guaranteed | amount | Guarantees | |||||
| Prepayments | January 2010 | 56.4 | 56.4 | Promissory note | ||||
| BNDES | January 2014 | 407.9 | 144.7 | Mortgage, machinery & equipment | ||||
| BRDE | July 2009 | 5.9 | 5.9 | Financed equipment | ||||
| Working capital financing - abroad | 21.3 | 21.3 | Promissory note | |||||
| Working capital financing - Brazil | April 2008 | 128.6 | 128.6 | Export Credit Note | ||||
| Total | 620.1 | 356.9 | ||||||
Copesul has secondary obligations with financial institutions, where it is guarantor of vendor transactions carried out by Petroflex, in the amount of R$ 18.4. No losses are anticipated from these obligations.
IPQ
| Total | Loan | |||||||
| Maturity | guaranteed | amount | Guarantees | |||||
| Banco Santander do Brasil S.A. | June /2013 | 173.1 | 173.1 | Copesul shares | ||||
| Banco Bradesco S.A. | July 2014 | 136.4 | 136.4 | Copesul shares | ||||
| Banco Bradesco S.A. | June 2008 | 11.2 | 11.2 | Shareholders' endorsements | ||||
| Total | 320.7 | 320.7 | ||||||
(i) Capitalized interest
As described in Note 3(d), the Company adopts the accounting practice of capitalizing interest on financing during the period of asset construction. The Company's policy is to apply the weighted average financial charge rate on the debt to the balance of projects in progress. This amount is limited to the amount of charges incurred in the period.
The average rate used during the period was 6.9% per annum, and the amounts capitalized are stated below:
F-59
| Braskem S.A. and Its Subsidiaries |
| Notes to the Consolidated Financial Statements |
| at December 31, 2007, 2006 and 2005 |
| All amounts in millions of reais, unless otherwise indicated |
| 2007 | 2006 | |||
| Gross financial charges | 669.3 | 609.1 | ||
| Less: Capítalized interest | (35.2) | (63.7) | ||
| Net financial charges | 634.1 | 545.4 | ||
(j) Loan covenants
ODBPAR hasCertain loan agreements entered into by the optionCompany establish limits for a number or ratios relating to convert thesethe ability to incur debts and pay interest. The ratios are as follows:
(*) EBITDA - Earnings before interest, tax, depreciation and amortization.
(**) EBITDA - Earnings before interest, tax, depreciation and amortization (excludes also dividends and interest on shareholders' equity received).
The above covenants are calculated on a consolidated basis for the past 12 months on a quarterly basis. Penalty for noncompliance is the potential acceleration of the debt. All commitments have been accomplished by the Company.
15 Debentures
At a meeting held on August 2, 2006, the board of directors approved the 14th issue of 50,000 simple, unsecured debentures, not convertible into shares, in a single series, for a total of R$ 500.0. The debentures were subscribed and paid up on September 1, 2006.
On June 4, 2007, the Company carried out the early, total redemption of the outstanding debentures of its 12th public issue, for the par value of the debentures, plus remuneration pursuant to clause 5.19 of the indenture.
Details on the Company's debenture transactions:
F-60
| Braskem S.A. and Its Subsidiaries |
| Notes to the Consolidated Financial Statements |
| at December 31, 2007, 2006 and 2005 |
| All amounts in millions of reais, unless otherwise indicated |
| Unit | Remuneration | |||||||||||
| Issue | value - R$ | Maturity | Remuneration | payment | 2007 | 2006 | ||||||
| 1st (i) | 10 | Jul/2007 | Long-term interest | |||||||||
| rate (TJLP) | ||||||||||||
| variation + interest | ||||||||||||
| of 5% p.a. | Upon maturity | - | 1,130.8 | |||||||||
| 12th (ii) | 100 | Jun/2009 | 117.0% of CDI | Biannually as from | ||||||||
| Dec/2004 | - | 151.7 | ||||||||||
| 13th (ii) | 10 | Jun/2010 | 104.1% of CDI | Biannually as from | ||||||||
| Dec/2005 | 302.6 | 303.1 | ||||||||||
| 14th (ii) | 10 | Sep/2011 | 103.5% of CDI | Biannually as from | ||||||||
| Mar/2007 | 517.8 | 521.8 | ||||||||||
| (iii) | 1 | Jun/2008 | 100.0% of CDI | Upon maturity | 91.2 | - | ||||||
| 4th (iv) | 10.000 | Dec/2010 | 104.5% of | Every 4 months | ||||||||
| accumulated | starting the 3rd | |||||||||||
| average daily rates | year as from the | |||||||||||
| of DIs | issue date | - | 32.5 | |||||||||
| 911.6 | 2,139.9 | |||||||||||
(i) Private issue of convertible debentures which were converted into Class A preferred shares at any time. on July 31, 2007 (Note 20(a)).
(ii) Public issue of non-convertible debentures.
(iii) Issued by subsidiary Ipiranga Química.
(iv) Issued by jointly-controlled company Petroflex.
The paymentdebenture changes in 2007 and 2006 were as follows:
| 2007 | 2006 | |||
| Balance at the beginning of the year | 2,139.9 | 1,608.6 | ||
| Accrued interest and financial charges | 192.3 | 248.6 | ||
| Issuance | - | 532.5 | ||
| Addition through acquisition of subsidiary | 83.3 | - | ||
| Write-off through deconsolidation of subsidiary | (32.5) | - | ||
| Repayments and conversions | (1,471.4) | (249.8) | ||
| Balance at the end of the year | 911.6 | 2,139.9 | ||
| Less: Current liabilities | (111.6) | (1,157.7) | ||
| Non-current liabilities | 800.0 | 982.2 | ||
F-61
Contents
| Notes to the Consolidated Financial Statements |
| at December 31, 2007, 2006 and 2005 |
| All amounts in millions of reais, unless otherwise indicated |
On October 1, 2001, the Company issued16 Taxes and sold two series of the 10th issue of its non-convertible debentures, consisting of 4,108 of the 1st series and 2,142 of the 2nd series, totaling R$ 625.0. In January 2004, the Company redeemed 2,289 of the 1st series of debentures and 945 of the 2nd series of debentures and, at September 30, 2004, the Company redeemed in advance the remaining debentures. All of the debentures are held in treasury and will be cancelled.Contributions Payable -Long-term Liabilities
The Company issued and sold the 11th series of its debentures in the aggregate principal amount of R$ 1,200.0 during the first quarter of 2004. These debentures were not convertible into shares and have a final maturity date of December 1, 2007. These debentures are repayable in 36 monthly equal, successive installments, beginning on January 1, 2005, and bear interest at the rate of CDI plus 4.5% per annum. On November 3, 2004, the Company redeemed in advance all debentures of this issue, as permitted by Clause 5.19 of the Deed of Issue. After redemption, debentures were cancelled.
BRASKEM S.A. AND ITS SUBSIDIARIES
NOTES TO THE CONSOLIDATED AND COMBINED FINANCIAL STATEMENTS—(Continued)
at December 31, 2004, 2003 and 2002
All amounts in millions of reais, unless otherwise indicated
On September 29, 2004, the Company issued and sold the 12th series of its debentures in the aggregate principal amount of R$ 300.0. These debentures are not convertible into shares and have a final maturity date of June 1, 2009. These debentures are repayable at its final maturity date and bear interest at the rate of 117% of CDI per annum.
| Reference | 2004 | 2003 | |||||
Compensation of IPI credits | |||||||
IPI—export credit | (i | ) | 462.8 | 413.1 | |||
IPI—purchase of zero-rated materials | (ii | ) | 406.9 | 307.0 | |||
IPI—consumable materials and equipment | 34.8 | 31.9 | |||||
Other taxes and contributions payable | |||||||
PIS/COFINS—Law 9718 of 1998 | (iii | ) | 320.6 | 284.9 | |||
Education contribution, SAT and INSS | 31.2 | 26.5 | |||||
Special Installment Program (PAES)—Law 10684/03 | (iv | ) | 49.7 | 56.3 | |||
Tax Recovery Program (REFIS)—Law 9964/00 | (v | ) | 3.2 | 9.2 | |||
Others | 22.9 | 20.2 | |||||
| 1,332.1 | 1,149.1 | ||||||
| 2007 | 2006 | |||
| IPI credits offset | ||||
| IPI - export credit (i) | 687.8 | 647.8 | ||
| IPI - zero-percent rate (ii) | 309.3 | 505.9 | ||
| IPI - consumption materials and property, plant | ||||
| and equipment | 42.5 | 54.7 | ||
| Other taxes and contributions payable | ||||
| PIS/COFINS - Law 9,718/98 (iii) | 50.6 | 146.8 | ||
| Education contribution, SAT and INSS | 38.6 | 37.1 | ||
| PAES - Law 10684 (iv) | 36.4 | 36.6 | ||
| Other | 59.2 | 21.5 | ||
| Less:Judicial deposits | (78.6) | (128.4) | ||
| 1,145.8 | 1,322.0 | |||
The Company has brought legal actions challenging certain alterationschanges in the tax lawlaws and defending, among other things, the right to IPI credits on the purchase of raw materials and the export of products. With regard to the contingent IPI credits, which hadhave been used to offset against variousseveral federal taxes payable, the Company and its subsidiaries recorded liabilities to eliminate the contingent gain and accrued interest on these liabilities based on SELIC.the SELIC rate. The Company has not recorded tax assets for uncompensated credits that have not been used to offset other tax obligations as they are considered contingent assets. Even though this refers to one of the matters brought to courts, the undue tax payment mentioned in Note 11(ii) was recorded because it was a credit effectively realized to the benefit of the Company.assets pending realization.
| (i) |
Relates to a legal action initiated by the merged company OPP Química and the subsidiary Trikem, requesting the legal recognition of the IPI credit, introduced by Decree Law 491/69 to provide incentives for exports of manufactured products. OPP Química obtained a preliminary injunction in this action, partially confirmed by a ruling, authorizing it to use the benefit calculated on the exports of the units located in Rio Grande do Sul to offset federal taxes due. The decision was revoked, against which special and extraordinary appeals were lodged by the Company.
- Export credits
The Company and its merged companies OPP Química, Trikem and Nitrocarbono challenged the merged company Nitrocarbono filed for a writexpiration of security that discusses the right toperiod of effectiveness of the IPI tax credit in September 2003. The decision was(crédito-prêmio) introduced by Decree-Law 491 of 1969 as an incentive to manufactured products exports. Most lower court decisions have been favorable, guaranteeing thatbut such favorable decisions may still be appealed.
In hearing the credit for the past five years as from the dateappeal lodged by another taxpayer seeking court recognition of initiation of the suit and its offset against all taxes administered by the Federal Revenue Secretariat. An appeal by the Federal Government was made and is waiting for a judgment by the TRF of the 1st Region.
BRASKEM S.A. AND ITS SUBSIDIARIES
NOTES TO THE CONSOLIDATED AND COMBINED FINANCIAL STATEMENTS—(Continued)
at December 31, 2004, 2003 and 2002
All amounts in millions of reais, unless otherwise indicated
The merged company OPP Química obtained a preliminary injunction in this action, partially confirmed by a sentence, authorizing itcurrent entitlement to use such tax benefit the benefit calculated on the exports of the units located in Rio Grande do Sul, to offset federal taxes due. The decision was revoked by the The Regional Federal (TRF) of the 4th Region, against which special and extraordinary appeals were lodged and are awaiting judgment in the HigherSuperior Court of Justice (STJ) upheld its rejection to such prospective use and Supreme Court (STF)affirmed that the above-mentioned tax benefit expired in 1990. When the STJ completes its judgment, the STF will revisit the right to use those tax credits after 1990, based on the application of Temporary Constitutional Provisions Act (ADCT) 41.
F-62
| Braskem S.A. and Its Subsidiaries |
| Notes to the Consolidated Financial Statements |
| at December 31, 2007, 2006 and 2005 |
| All amounts in millions of reais, unless otherwise indicated |
In the opinion of the Company's external legal advisors, it is not probable that the Company will lose these cases.
(ii) IPI - Purchase of zero-rated materials
Merged companies OPP Química, Trikem and Polialden have filed lawsuits claiming IPI tax credits from the acquisition of raw materials and inputs that are exempt, non-taxed or taxed at a zero-percent rate. Lower courts have granted most lawsuits to that end.
In a decision rendered in February 2007 in a case unrelated to the Company, the STF decided against the right to use zero-percent rate IPI credits to offset other taxes by a close majority (6 to 5). In June 2007, the STF full bench ruled, by majority opinion, that prospective-only effects could not be given to an STF decision that later reversed an earlier taxpayer-friendly determination made by the STF full bench itself (i.e., respectively.
The merged company Trikem, insuch reversals apply to the unit installed in São Paulo, filedearlier case and not only to future cases). This ruling had a injunction to requestnegative bearing on judgment of the same credit. The process is still waiting for a judgment in the Trial Court.
Thecases involving merged companies OPP Química and Trikem in Bahia, leading to payments in the industrial units installed in Bahia, filedamount of R$ 127.3 (August 2007). In addition, a civil action on the matter. The decision was unfavorable and the Company lodged an Appeal against it. The judgment of this appeal is pending a decision by the TRFportion of the 1st Region.
amount underlying the lawsuit involving merged company Polialden (R$ 99.6) was settled in October 2007. The outstanding amount relating to such case will be challenged in court.
The Company still benefits from a favorable court decision in the lawsuit lodged by its merged company Trikem in Alagoas, allowing the industrial units installed inCompany to use these tax credits. The Company will have to pay out the Stateoffset sums when the court decision on this case is reversed. It should be noted that all of Alagoas, filed a writ of securitythese amounts have been provisioned for, which will mitigate the adverse impact on the matter. The security was granted and the credit was assured for the 10 (ten) years before bringing the suit. The TRFCompany's results of the 5th Region maintained the favorable decision, however, it limited the lengthoperations.
(iii) PIS/COFINS - Law 9718 of the term for use of credits to five years. Against this decision; special and extraordinary appeals were lodged and are awaiting judgment in the Higher Court of Justice (STJ) and Supreme Court (STF), respectively.
1998
The external legal advisors of the Company, considers that the chances of success with respect to the export credit itself and the effects of the monetary restatement (expurgations, monetary correction and SELIC rate) are probable, even with the recent adverse decisions of the matter in the STJ.
(ii) IPI—Purchase of zero-rated materials
In addition to the legal action filed in the State of Rio Grande do Sul, with a decision of the STF in its favor (Note 11(ii)), the Company and its merged companies OPP Química, Trikem and TrikemPolialden have similar legal actions in the Statesbrought a number of São Paulo, Bahia and Alagoas,lawsuits to support the right to the IPI credit on the purchases of raw materials and input materials exempt, not taxed or taxed at the zero rate. The process in São Paulo is awaiting decision in the lower court. In this case, the preliminary injunction was denied and the TRF of the 3rd Region granted suspensive effects to recognize the right to that credit. The process originated in Bahia obtained a favorable decision in the TRF of the 1st Region, which was the object of a Special and Extraordinary Appeal by the Federal Government. The Special Appeal was not accepted by the TRF and STJ and the Extraordinary Appeal awaits judgment in the STF.
(iii) PIS/COFINS—Law 9718 of 1998
Effective as from February 1999, the basis and applicable rates for PIS and COFINS contributions were increased through Law 9718 of 1998.
COFINS—Increase in the rate from 2% to 3% and expansion of the concept of billings to include in the contribution calculation practically all income earned by companies, in addition to the sales of products and services.
PIS—Expansion of the calculation basis identical to COFINS.
The Company, in different legal actions, has challengedchallenge the constitutionality of the expansion in the calculation basis for the period from February 1999 to November 2002. Based on2002 for PIS and for the period from February 1999 to January 2004 for COFINS, and also the increase in the tax rate from 2% to 3% for COFINS, increased by Law 9,718/98.
In February 2006, the Company received a newfinal and conclusive favorable decision to one of these actions initiated in March 1999. Accordingly, the Company reversed a provision totaling R$ 89.6 (included in Note 24).
F-63
| Braskem S.A. and Its Subsidiaries |
| Notes to the Consolidated Financial Statements |
| at December 31, 2007, 2006 and 2005 |
| All amounts in millions of reais, unless otherwise indicated |
As the STF full bench had ruled, in November 2005, that the expansion of the PIS law issued in 2002,
BRASKEM S.A. AND ITS SUBSIDIARIES
NOTES TO THE CONSOLIDATED AND COMBINED FINANCIAL STATEMENTS—(Continued)
at December 31, 2004, 2003 and 2002
All amounts in millions of reais, unless otherwise indicated
the expandedCOFINS tax basis was applicable since December 2002, and is no longer questioned as from that date. The Company records provisions in accordance with amounts due under Law No. 9718, and,9,718/98 was unconstitutional, the Company, based on the adviceopinion of its external legal counsel, the Companyadvisors, believes that it is reasonably possible that the portionwill probably prevail in these cases. The Company recorded a gain of the LawR$ 110.7 in respect of the expanded contribution base may be upheld as being constitutional. Provisions have been recorded based on amounts payable under the expanded basis and increased rates in accordance with Law No. 9718, while awaiting a final decision2007 for these cases, when court decisions were finalized in relation to constitutionality.Braskem's claim.
The amounts set forth in Note 9 with respect to PIS and COFINS are judicial deposits made by the Company with respect to PIS and COFINS taxes calculated using the expanded basis under Law No. 9718 for the periods the law applied.
The statusSome of each of the actions is as follows:
cash on December 15, 2006.
(iv) Special Installment Program (PAES)- PAES - Law 10684/10,684/03
On May 30, 2003, Law No. 10684 was published, introducingno. 10,684 introduced the PAES program, which offers taxpayers with liabilities to the Federal Revenue Office or the National Treasury (that have been confessed or are being challenged in the courts) the option of paying their overdue tax obligations at February 28, 2003, in up to 180 consecutive monthly installments.
The legislation provides, among other benefits, provides for a 50% reduction in the fines on arrearsarreas as well as the utilization of the TJLP to update the installments due (replacing the usual SELIC rate which is more onerous).
In August 2003, merged company Trikem choseopted to desist from its legal action in relation to claims relating tofile a voluntary dismissal of the lawsuit against the COFINS (Note 17(iii))rate increase from 2% to take advantage of3% under Law 9,718/98, thus qualifying for the more favorable payment terms ofconditions under the program.PAES program instituted by Federal Law 10,684/03. The amount due is being paid in 120 installments and the option was confirmed with paymentmonthly installments. The total outstanding amount payable is R$ 36.6 as of the first installment on August 31, 2003. At December 31, 2004 the balance due is R$ 56.3, consisting of2007, representing R$ 6.6 in current liabilities and R$ 49.730.0 in long-termnon-current liabilities (2003—(2006 - R$ 62.8, consisting of43.2, representing R$ 6.56.6 in current liabilities and R$ 56.336.6 in long-termnon current liabilities).
Even though the Company had met all legal requirements and payments were being made as and when due, the National Treasury Attorney's Office (PFN) disqualified the Company for PAES on two different occasions, and the Company obtained a court relief reinstating it to PAES in these two events. In reliance on the opinion of the Company's advisors, management believes that the Company's eligibility for these installment payments will be upheld as originally requested.
F-64
BRASKEM S.A. AND ITS SUBSIDIARIESTable of Contents
NOTES TO THE CONSOLIDATED AND COMBINED FINANCIAL STATEMENTS—(Continued)
at December 31, 2004, 2003 and 2002
All amounts in millions of reais, unless otherwise indicated
(v) REFIS—Law 9964/00
On August 1, 1996, the Federal Revenue Office raised an assessment against Nitrocarbono, corresponding
| Braskem S.A. and Its Subsidiaries |
| Notes to the Consolidated Financial Statements |
| at December 31, 2007, 2006 and 2005 |
| All amounts in millions of reais, unless otherwise indicated |
17Income Tax and Social Contribution not previously paid based on a prior ruling, that would have been due for 1992 through 1995.Net Income
(a) Income tax reconciliation
| 2007 | 2006 | 2005 | ||||
| Income before income tax and minority interest | 1,184.2 | 90.1 | 749.1 | |||
| Income tax and social contribution benefit (expense) at | ||||||
| statutory rate 34% | (402.6) | (30.6) | (254.7) | |||
| Income tax on equity in earnings of associated companies | (0.1) | 6.1 | 3.0 | |||
| Non-deductible amortization of goodwill | (29.8) | (30.3) | (38.2) | |||
| Exempt exchange losses on foreign currency | (2.9) | (1.9) | (4.5) | |||
| Income tax incentives (Note 18(a)) | 0.9 | 5.6 | 15.5 | |||
| Other permanent differences | (71.8) | (22.7) | 25.9 | |||
| Tax effect of Social Contribution tax exemption (c) below | 52.3 | 5.7 | 70.6 | |||
| Net change in valuation allowance | (9.1) | 6.2 | 6.3 | |||
| Tax on goodwill of merged subsidiary Polialden | ||||||
| (Note 1(c)(vii)) | 85.8 | 75.9 | - | |||
| Other | 0.3 | (1.2) | (1.2) | |||
| Income tax expense, per consolidated statement | ||||||
| of operations | (377.0) | 12.8 | (177.3) | |||
In December 2000, management chose2007, R$ 49.4 of the income tax expense was entitled to settle the assessed amount ofincome tax exemption/ abatement. In 2006, due to tax losses, there were no such benefits (2005 - R$ 14.8, through enrollment in the REFIS program (established by Law No. 9964/00)44.2) . Under the REFIS program, Nitrocarbono began to pay the social contribution in accordance with current legislation.
| 2004 | 2003 | 2002 | |||||||
Income (loss) before income tax and minority interest | 794.4 | 564.2 | (1,477.9 | ) | |||||
Income tax and social contribution benefit (expense) at statutory rate 34% | (270.1 | ) | (191.8 | ) | 502.5 | ||||
Income tax on equity in earnings of associates | (9.5 | ) | 24.5 | (29.4 | ) | ||||
Non-deductible amortization of goodwill | (26.4 | ) | (87.0 | ) | (100.1 | ) | |||
Exempt exchange gains (losses) on foreign currency | (2.5 | ) | (43.2 | ) | 111.3 | ||||
Income tax incentives (Note 19(a)) | 16.9 | 28.8 | 0.4 | ||||||
Other permanent differences | (8.3 | ) | (23.4 | ) | (12.7 | ) | |||
Tax effect of social contribution tax exemption ((c) below) | 65.1 | 64.0 | (128.6 | ) | |||||
Net change in valuation allowance | 166.9 | 109.6 | (428.1 | ) | |||||
Other | (11.0 | ) | (4.4 | ) | (5.1 | ) | |||
Income tax expense, per consolidated and combined statement of operations | (78.9 | ) | (122.9 | ) | (89.8 | ) | |||
In accordance with a pronouncement issued by the Brazilian Institute of Independent Accountants (“IBRACON”)IBRACON on the accounting for income tax and social contribution, supplemented by CVM Instruction 371/02,no. 371, the Company has recognized deferred tax assets demonstrated as follows:
F-65
| 2004 | 2003 | |||||
Deferred tax assets | ||||||
Net operating loss carryfowards | 205.8 | 322.8 | ||||
Goodwill and deferred charges | 201.5 | 128.0 | ||||
Non-deductible accrued expenses and other temporary differences | 323.0 | 366.7 | ||||
Gross deferred tax assets | 730.3 | 817.5 | ||||
Valuation allowance | (426.5 | ) | (651.5 | ) | ||
Net long-term deferred tax assets | 303.8 | 166.0 | ||||
Deferred tax liabilities | ||||||
Accelerated depreciation | (9.3 | ) | (9.8 | ) | ||
Long-term deferred tax liabilities | (9.3 | ) | (9.8 | ) | ||
BRASKEM S.A. AND ITS SUBSIDIARIESTable of Contents
NOTES TO THE CONSOLIDATED AND COMBINED FINANCIAL STATEMENTS—(Continued)
at December 31, 2004, 2003 and 2002
All amounts in millions of reais, unless otherwise indicated
| Braskem S.A. and Its Subsidiaries |
| Notes to the Consolidated Financial Statements |
| at December 31, 2007, 2006 and 2005 |
| All amounts in millions of reais, unless otherwise indicated |
| 2007 | 2006 | 2005 | ||||
| Deferred tax assets | ||||||
| Net operating loss carryfowards | 146.4 | 162.2 | 110.3 | |||
| Goodwill and deferred charges | 153.7 | 100.4 | 37.8 | |||
| Non-deductible accrued expenses and other temporary | ||||||
| differences | 161.2 | 146.9 | 165.0 | |||
| Gross deferred tax assets | 461.3 | 409.5 | 313.1 | |||
| Valuation allowance | (2.8) | (11.9) | (18.1) | |||
| Total income tax | 458.5 | 397.6 | 295.0 | |||
| Less: current deferred tax assets | (63.0) | (20.6) | (22.0) | |||
| Long-term deferred tax assets | 395.5 | 377.0 | 273.0 | |||
| Deferred tax liabilities | ||||||
| Accelerated depreciation and other | (64.5) | (17.3) | (10.4) | |||
| Long-term deferred tax liabilities | (64.5) | (17.3) | (10.4) | |||
The Company believes that it is more likely than notprobable that the deferred tax asset, net of the valuation allowance, will be recovered within up to ten years. Valuation allowancesDeferred tax assets have not been provided for deferred tax assetstemporary differences and loss carryforwards whose realization is not considered not more likely than not.
probable.
In addition to the positive results arising from the corporate restructuring process described in Note 1(b)1(c), expected future taxable income is based on projections and feasibility studies based on price, exchange rate, interest rate, market growth assumptions as well asand other variables relevant to the Company’s performance.Company.
F-66
| Notes to the Consolidated Financial Statements |
| at December 31, 2007, 2006 and 2005 |
| All amounts in millions of reais, unless otherwise indicated |
(c) Social Contribution on Income ("CSL")
In view of the discussion ofdiscussions over the constitutionality of Law 7689/88,7,689/98, the Company and its merged companies OPP Química, and Trikem and its subsidiary Polialden filed a lawsuit to avoidcivil lawsuits against the payment of CSLL.
The TRF of the 1st Region expressly recognized the unconstitutionality of said tax, and the courts issuedCSL. A final and unappealable decisionscourt decision favorable to the Company and merged companies. these companies was rendered.
However, the Federal Government filed an action seeking to revokea suit on the judgment(ação rescisória) challenging the decisions on Braskem’sthe lawsuits filed by the Company, Trikem and merged Trikem’s lawsuits, arguingPolialden, based on the argument that - after the final decision favorable to those companies - the companies, the Plenary Sessionfull bench of the STF had declared the constitutionality of thethis tax except infor 1988. InAs the Federal Government did not file a suit on the judgment in the case of OPP Química, the Federal Government did not file any action,first final and so the first finalconclusive decision remained in force.
The decisionssuit on the judgment is pending review by the STJ and STF of lowera number of appeals concerning this specific matter. Even though the suit on the judgment and first appeal courts were favorable to the Federal Government however, tax payments are still suspended. Currently, the mentioned action is awaiting final judgment of the appeals lodged to the STF and STJ.
Based on the referred STF’s decision,hold, the Federal Revenue Secretariat (“SRF”) is raisingOffice has issued tax assessmentinfraction notices against the Company and theits merged companies, against whichand administrative defense argumentsdefenses have been filed.filed against such notices.
The CompanyBased on the opinion of its legal advisors (which stated the likelihood of a favorable outcome as reasonably possible), management believes that itthe following is reasonably possible that itlikely to occur: (i) the courts will loseeventually release the appealsCompany from paying this tax; and (ii) even if the suit on the judgment is held invalid, the effects of the judgment should not apply retroactively to maintain the Company’s exemption. year of enactment of the law. For these reasons the Company has created no provisions for this tax.
If retrospective collection is required by court order (contrary to the appeals are not successful,opinion of its legal advisors), the Company believes that the losspossibility of being imposed a fine is remote. Accordingly, the exemptionamount payable, adjusted for inflation and accruing interest at Brazil's SELIC benchmark rate, would be effective only as from the date of a final unfavorable decision and may not be applied retroactively. For this reason, no liability has been recorded. However, we believe that it is reasonably possible that we will be required to pay these taxes retroactively. If a retroactive claim were made by the government, the exposure to the Company would be, at December 31, 2004, approximately R$ 562.0 (2003—809.0 (2006 - R$ 416.8)743.0), not including interest but excluding fines.
| 18 Tax Incentives |
From 2002 to(a) Corporate income tax
Until calendar year 2011, the Company has the right to reduce by 75% the income tax rates on profitsthe profit arising from the sale of basic petrochemical products and utilities. The two Camaçari polyethylene plants have the same rights until calendar years 2011 and 2012. The polyvinylchloride ("PVC") plant of the merged company OPP Químicaat Camaçari has the same right for the same period.until 2013. The polyvinylchloride (“PVC”)PVC plants in BahiaAlagoas and Alagoasthe polyethylene teraphthalate ("PET") plant at Camaçari are exempt from Corporate Income Tax (“IRPJ”)corporate income tax calculated on the results of their industrial operations until 2004 and 2008, respectively. The subsidiary Polialden was exempt from income tax on the results2008.
F-67
BRASKEM S.A. AND ITS SUBSIDIARIESContents
| Braskem S.A. and Its Subsidiaries |
| Notes to the Consolidated Financial Statements |
| at December 31, 2007, 2006 and 2005 |
| All amounts in millions of reais, unless otherwise indicated |
NOTES TO THE CONSOLIDATED AND COMBINED FINANCIAL STATEMENTS—(Continued)
at December 31, 2004, 2003 and 2002
All amounts in millions of reais, unless otherwise indicated
ProductionsProduction of caustic soda, chloride, and ethylene dichloride enjoyand caprolactam enjoys the benefit of the 75% decrease of 75% ofin the income tax rate up to 2012.
At the end of each fiscal year, in the case of taxable profit resulting from the benefited operations, income tax calculated without giving effect to these exemptions and reduced rates is recorded as an expense for the amount ofyear and the income tax exemption or reductionbenefit of these exemptions and reduced rates is deducted from income tax payable and credited to a capital reserve account, which canmay only be used to increase capital or absorb losses. The incentive covered R$ 53.9 of the income tax of the Company in
Incentives determined for the year ended December 31, 2004 (2003—2007 were R$ 27.7).49.4.
On December 14, 2004,As from 2006, the Board of Directors approved the transfer of R$ 463.2 fromsubsidiary Copesul is entitled to the tax incentive reserve to the accumulated losses account,incentives provided for absorption of the balance of accumulated losses.in Law 11,196/05, Decree 5,798/06 and MCT Ordinance 782/06.
(b) Value-added tax - ICMS
The Company havehas ICMS tax incentives granted by the StateStates of Rio Grande do Sul and Alagoas, through the Company Operation Fund—Fund - FUNDOPEM with the purposeand State of providingAlagoas Integrated Development Program - PRODESIN, respectively. These incentives forare designed to foster the installation and expansion of industriesindustrial facilities in the State. Thisthose States. The incentive is determined based on approved projects and in percentages on the amounts of tax payments expected. The amounts are recorded in shareholders’ equity as a capital reserve. The ICMS tax benefit for the year ended December 31, 20042007 amounted to R$ 15.9 (2006 - R$ 12.9) . The accounting treatment of such incentives is the same as that applied to the income tax incentive.
19 Long-term Incentive Plan
In September 2005, an incentive plan called the "Long-Term Incentive Plan" was approved by a Shareholders' Meeting. Under the plan, which is not based on the Company's shares, certain employees nominated by management on an annual basis are entitled to purchase certificates of investments called "investment units". The plan goals include, among others, to foster the alignment of interests of Braskem's employees and shareholders to create long-term value, promote a sense of ownership, and foster the employees' commitment to long-term results.
F-68
| Braskem S.A. and Its Subsidiaries |
| Notes to the Consolidated Financial Statements |
| at December 31, 2007, 2006 and 2005 |
| All amounts in millions of reais, unless otherwise indicated |
Each year, the board of directors approves eligible participants, the number of investment units to be issued, the percentage of the Company's contribution in consideration of the acquisition by employees, as well as the number of units offered per participant. A participant's acceptance implies payment in cash of the amount assigned to him or her and the execution of a unit purchase agreement. Braskem then issues the related investment unit certificate.
As an incentive to purchase the certificate of investment, the participants receive a bonus of one investment unit certificate for each investment unit certificated purchased. This incentive is redeemable as from the fifth year at the ratio of 20% in the first year and 10% in subsequent years. The value of these units was determined based on the projected value of the Company's class A preferred shares.
The investment unit value is updated on an annual basis to reflect the average quotation of the Company's class A preferred shares at the closing sessions on the São Paulo Stock Exchange (Bovespa) from October to March. Participants do not become Company shareholders as a result of holding investment units, which do not carry any rights or privileges, including, in particular, voting and other political rights. Investment units are issued in the first half of each year and, in addition to the variation in its face value, their yield is equal to dividends and/or interest on capital distributed by Braskem.
There are three types of investment units:
Investment units (and related certificates) are issued on a strictly personal basis and can only be disposed of upon redemption by Braskem, under the following circumstances:
F-69
| Braskem S.A. and Its Subsidiaries |
| Notes to the Consolidated Financial Statements |
| at December 31, 2007, 2006 and 2005 |
| All amounts in millions of reais, unless otherwise indicated |
The composition and fair value of units on December 31, 2007 are as follows:
| Number | Value | |||
| Investment Units | ||||
| Issued (Alfa Units) | 285,180 | 4.3 | ||
| Granted as incentive (Beta Units) | 285,180 | 0.6 | ||
| Total | 570,360 | 4.9 | ||
20 Shareholders' Equity
(a) Capital
At December 31, 2007, the Company's subscribed and paid-up capital was R$ 9.9 (2003—R$ 1.1).
The Company’s authorized share capital at December 31, 2004, comprised 122,000,000,0004,641.0, divided into 449,432,611 shares, consisting of 43,920,000,000comprising 149,810,870 common shares, 76,860,000,000 Class298,818,675 class A preferred shares, and 1,220,000,000 Class803,066 class B preferred shares, with no par value. At the same date, the Company's authorized capital comprised 488,000,000 shares, of which 175,680,000 were common shares, 307,440,000 were class A preferred shares, and 4,880,000 were class B preferred shares.
At the Extraordinary General Meeting held on May 31, 2006, shareholders approved a capital increase of the Company by R$ 105.3 as a result of the merger of subsidiary Polialden (Note 1(c)(vii)), through the issuance of 7,878,725 class A preferred shares. On the same date, a conversion of 2,632,043 class A preferred shares into common shares at the ratio of 1:1 was also approved.
On March 31, 2003At the Company’sExtraordinary General Meeting held on April 2, 2007, shareholders approved the merger of Politeno into the Company (Note 1(c)(x)). As a result, the Company's capital was increased by R$ 37 through the contribution of the net assets of Nitrocarbono. As a result of the capital increase, 67,698 Class A preferred shares were issued (Note 1(b)).
The Ordinary General Meeting held on April 29, 2003 approved an increase in the Company’s capital, without the issue of new shares, by transfer of the Monetary Restatement Reserve, in the amount of19.1 to reach R$ 2.3.
In July 2003, due to the merger of NI Par by the Company, capital was increased by R$ 39.7,3,527.4 through the issue of 54,314,531 common shares, totaling R$ 1,887.4.
The Extraordinary General Meeting held on October 20, 2003 approved the split of the Company’s shares, as proposed by management. All shares were split using the ratio of 20 shares of each type and1,533,670 class for each existing share. Accordingly, the relation between the Class A preferred shares and the American Depository Share (ADS) was changed from 50 to 1,000 Class A preferred sharesshares. The conversion of each ADS. This 20-for-one share split has been retroactively applied to all periods presented in these financial statements.
In September 2004, in connection with the Global Offering (Note 1(c)), the Company increased capital in the amount of R$ 1,211.0, through the issue of 13,455,000,000 Class A preferred shares, at the price of R$ 90.00 per thousand shares in Brazil and US$ 31.38 overseas. Accordingly, capital totaled R$ 3,403.0.
On January 15, 2004, in order to maintain the minimum limit related to the proportion between common and preferred shares, in accordance with Brazilian Corporate Law, before the merger of Trikem, the conversion of
BRASKEM S.A. AND ITS SUBSIDIARIES
NOTES TO THE CONSOLIDATED AND COMBINED FINANCIAL STATEMENTS—(Continued)
at December 31, 2004, 2003 and 2002
All amounts in millions of reais, unless otherwise indicated
121,948,261 Class486,530 class A preferred shares into common shares was approved at the Extraordinary General Meeting. Accordingly, on September 17, 2004, before the conclusionalso approved.
As a result of the Global Offering,exercise of the conversionright to convert the 1st Issue debentures (Note 1(c)(xiii)), the Company's capital was increased by R$ 1,113.6 on July 31, 2007 to total capital of 4,484,963,007 Class A preferredR$ 4,641.0, through the issuance of 77,496,595 shares, intocomprising 25,832,198 common shares was approved at the Extraordinary General Meeting.
In September, October, November and December 2004, in accordance with the Company’s by-laws, an aggregate of 18,435,994 Class B preferred shares was converted into 9,217,997 Class51,664,397 class A preferred shares.
F-70
At December 31, 2004, subscribed and paid-up capital is R$ 3,403.0 and consistedTable of 90,635,856,547 shares, of which 30,215,024,848 were common shares, 60,210,112,893 were Class A preferred shares and 210,718,806 were Class B preferred shares, all nominative and with no par value.
Contents
| Notes to the Consolidated Financial Statements |
| at December 31, 2007, 2006 and 2005 |
| All amounts in millions of reais, unless otherwise indicated |
Under our by-laws, the general shareholders’ meeting may authorize the conversion of our preferred class A shares into common shares by means of the affirmative vote of shareholders representing the majority of our common shares, which will establish (i) the number of shares to be converted; (ii) the ratio of any such conversion; and (iii) the term during which any conversion must be performed.
Holders of our Class B preferred shares are not permitted to convert their shares into common shares, but are permitted by our by-laws to convert their shares into our Class A preferred shares. The ratio for any such conversion is two Class B preferred shares for each Class A preferred share.
(b) Share rights
Preferred shares do not carry voting rights, but they have a priority right to a minimum non-cumulative annual dividend of 6% per annum of their nominal value, depending on the availability of net income for distribution. Only the Class A preferred shares haveshareholders share equally with the right to participation equal to common shares in the remaining net income, for distributions exceeding the 6% minimum, and this right existscommon shares are entitled to dividends only after the payment of the 6% minimum dividendpriority dividends have been paid to the holders of preferred and common shares. The Class A preferred sharesshareholders also have equal rightsshare equally with the common shares to receive dividends arisingin the distribution of shares resulting from the capitalizationincorporation of other reserves. Subsequent toClass B preferred shares are not convertible into common shares. However, at the expirationend of the non-transfer period of non-transferability provided under applicable law, the Class B preferred shares maycan be converted into Class A preferred shares at any time, at the ratio of two Class B preferred shares for oneeach Class A preferred share.
Shares paid up through the Northeast Investment Fund (“FINOR”) tax incentives (Class B preferred shares) do not have preferential rights in the event of new share subscriptions.
In the event of dissolution of the Company, the Class A and Class B preferred shares have priority toin the return of capital reimbursement.
in the event of liquidation of Braskem.
All shareholders are entitled to an annual mandatory dividend of not less than 25% of theadjusted net income of eachfor the year, if there are accumulated retained earnings, calculated in accordance with the Brazilian CorporationCorporate Law.
As describedset forth in the shareholders’ agreementsa shareholders' agreement and memorandum of understanding, described in Note 1(b), the Company musthas a target to distribute dividends in a percentagecorresponding to not less than 50% of availablethe net income of eachfor the year, as long as remaining reservesthe required reserve amounts are sufficient to maintainallow for the efficient operationsoperation and business development.
Accordingdevelopment of the Company's businesses. However the legal obligation of the Company remains to the mandatory dividend of 25%.
Under the terms the export prepayment facility described in the first paragraph of Note 15(b)U.S. dollar-denominated medium-term notes (Note 14(d)), the payment of dividends or interest attributableon own capital is capped at two-times the minimum dividends accorded to shareholders’ equity or any other participation in profits is limited to 50% of net income for the year or 6% of the nominal value of the Class A and B preferred shares whichever is higher.
(c) Treasury shares
On May 3, 2006, Braskem's board of directors approved a Share Buyback Program under which common and class A preferred shares in the Company were to be acquired to be kept in treasury and subsequently sold and/or cancelled, with no reduction in capital.
F-71
BRASKEM S.A. AND ITS SUBSIDIARIES
NOTES TO THE CONSOLIDATED AND COMBINED FINANCIAL STATEMENTS—(Continued)
at December 31, 2004, 2003 and 2002
All amounts in millionsTable of reais, unless otherwise indicatedContents
| Notes to the Consolidated Financial Statements |
| at December 31, 2007, 2006 and 2005 |
| All amounts in |
Under the program, the Company acquired 13,131,054 class A preferred shares at the average cost of R$ 13.88. The low and high quotations during this period were R$ 9.97 and R$ 15.89 per share, respectively.
Upon the merger of Politeno (Note 1(c)(x)), the cross shareholding between the companies ceased. The Company's class A preferred shares held by Politeno, amounting to 2,186,133 shares, were added to treasury shares.
At December 31, 2004,2007, the Company held in treasury 116,836,839 Class16,595,000 class A preferred shares (2003—621,887,272(2006 - 14,363,480 shares) for a total value of R$ 257.6 (2006 - R$ 255.6) .
(d) Retention of revenue reserves
On March 28, 2006, Braskem's shareholders approved the transfer of R$ 164.9 from revenue reserves to retained earnings (accumulated deficit) for absorption of prior year adjustments related to IBRACON Technical Interpretation 01/2006 (Note 12). This refers to retention of the balance of retained earnings, to fund expansion projects included in the business plan, as provided in the capital budget proposed by management and submitted to the approval of the shareholders, in accordance with Article 196 of the Brazilian Corporate Law. Retained earnings appropriated to this reserve in 2006 and 2007 are stated in Note 20(e). (e) Appropriation of net income |
In accordance with the Company’sCompany's by-laws, net income for theeach year, adjusted as provided by Brazilian Corporate Law, No. 6404/76, will be appropriated as follows: (i) 5% for constitution of the legal reserve, not exceeding 20% of capital,capital; and (ii) 25% for payment of non-cumulative mandatory dividends, observing the legal and statutory advantages of the preferred shares.
When the priority dividend amount paid to the preferred shares is equal to or higher than 25% of the adjusted net income for the year, calculated in accordance with Article 202 of the Brazilian Corporate Law, the full payment of the mandatory dividend is carried out.paid. If there is a remaining mandatory dividend after the payment of the priority dividend, it will be appliedused as follows: (i) infor the payment to common shares of a dividend up to the limit of the priority dividend of preferred shares,shares; and (ii) if there is a remaining balance in the distribution of an additional dividend, to common shares and Class A preferred shares, underon the same conditions,basis, so asthat each common shares orshare and Class A preferred share of this class receives the same dividend.
F-72
| Braskem S.A. and Its Subsidiaries |
| Notes to the Consolidated Financial Statements |
| at December 31, 2007, 2006 and 2005 |
| All amounts in millions of reais, unless otherwise indicated |
The calculation of the dividends for 2007 and 2006 is as follows:
| 2007 | 2006 | |||
| Net income for the year | 547.6 | 101.3 | ||
| Excludes effect of consolidation adjustments (*) | (4.4) | (23.5) | ||
| Portion appropriated to legal reserve | (27.1) | (3.9) | ||
| Adjusted net income for the calculation of dividends | 516.1 | 73.9 | ||
| Distribution of profits | ||||
| Dividends proposed | ||||
| Common shares - (2007 - R$ 0.644) | 96.2 | |||
| Class A preferred shares - R$ 0.644 (2006 - R$ 0.159) | 181.8 | 36.8 | ||
| Class B preferred shares - R$ 0.644 (2006 - R$ 0.159) | 0.5 | 0.1 | ||
| Total dividends proposed | 278.5 | 36.9 | ||
| Amount allocated to revenue reserve | 237.6 | 37.0 | ||
| Minimum mandatory dividends - 25% | 129.0 | 18.5 | ||
(*) Recognizes income on intercompany transactions.
Dividends proposedThe amount appropriated to the retention of profits reserve in 2007 is linked to a capital budget included in the business plan and approved by management,the board of directors at a meeting held on December 19, 2007, subject to shareholders' approval at the shareholders general meeting, are as follows:Annual Shareholders' Meeting to be held in 2008.
| |||
| |||
| |||
| |||
| |||
| |||
| |||
(f) Interest on own capital | |||
| |||
| |||
| |||
| |||
| |||
| |||
The amountOn December 29, 2005, pursuant to an authorization from Braskem's board of directors, Braskem's executive officers approved the payment of interest on own capital creditedin the amount of R$ 270.0, consisting of: (i) R$ 179.4 to holders of Class A preferred shares isand holders of ADSs, corresponding to the gross amount of R$ 0.746145 per share and R$ 1.492290 per ADS; (ii) R$ 0.4 to the holders of Class B preferred shares, corresponding to the gross amount of R$ 0.563940 per share, equal to 6% of the share value, as provided in compliance withArticle 9 of Braskem's by-laws; and (iii) R$ 90.2 to the holders of common shares, corresponding to the gross amount of R$ 0.746145 per share. Payment began on April 18, 2006.
F-73
| Braskem S.A. and Its Subsidiaries |
| Notes to the Consolidated Financial Statements |
| at December 31, 2007, 2006 and 2005 |
| All amounts in millions of reais, unless otherwise indicated |
Interest on own capital was determined based on share ownership as of December 31, 2005, applying such amount to priority dividend established in the Company’sand mandatory dividends for 2005, as prescribed by Law 9249/95 and paragraph 6, Article 44 of Braskem's by-laws.
Revenue reserve complies with the investment plan Withholding income tax on interest credited was R$ 35.5 and the decrease inbenefit for the Company’s indebtedness.
BRASKEM S.A. AND ITS SUBSIDIARIES
NOTES TO THE CONSOLIDATED AND COMBINED FINANCIAL STATEMENTS—(Continued)
at December 31, 2004, 2003 and 2002
All amounts in millions of reais, unless otherwise indicated
In December 2004,For disclosure purposes, the payment of R$ 170.0 to Braskem shareholders, asexpense for interest on own capital was authorized by the Board of Directors and approved by management, including this amountreversed in the priority and mandatory dividendsstatement of 2004, as prescribed by Law No. 9249/95operations and the Company’s by-laws. The individual amountsreversal was recorded in operating expenses (income), and the income tax withheld,also reflected in the amountstatement of R$ 20.4, were recorded based on the shareholding control at December 31, 2004.changes in shareholders' equity, pursuant to CVM Deliberation No. 207.
21 Contingencies
The effective payment will be made up to 60 days after the Ordinary General Meeting to be held in 2005.
| (a) Collective labor agreement |
The chemical workers union in the Camaçari region (“("SINDIQUÍMICA”MICA") and the syndicate of chemical manufacturers in the same region (“SINPEQ”("SINPEQ") are disputing in the courts whether the wage and salary indexation clause in their collective labor agreement was overruled by a 1990 economic policy law which restricted wage and salary increases. Braskem Polialden,and Politeno and merged companies Trikem, Polialden and Nitrocarbono operated plants in the region in 1990 and are members of SINPEQ. The workers’workers' union is requesting that salaries and wages be adjusted retroactively and cumulatively since 1990. InThe most recent ruling by the STF, in December 2002, the Federal Supreme Court (STF), ruled in favor ofwas favorable to SINPEQ and established that the economic policy law overruled the collective labor agreement. SINDIQUIMICA appealed this decision. In May 2005, the appeal was rejected by unanimous decision. This decision is pending publication. Nevertheless, the decision is subject to reconsideration by the STF. On October 24, 2005, SINDIQUÍMICA filed a motion to review. The appeal was submitted to the Office of the Attorney General of the Federative Republic of Brazil for consideration, which issued a legal opinion essentially in favor to the employers' union in November 2006. The judgment started in June 2007 but was suspended by one of the court's judges.
However, managementManagement believes that it is reasonably possible that the employers’employers' union will lose this suit.lawsuit. If the employers’employers' union loses this law suit and assuming that (a) the Company is required to pay damages from April 1990 to September 1990 (the date of the next collective bargaining agreement) and (b) the employees’employees' union or individual employees file additional claims necessary to quantify the amount of damages, the Company estimates that it could be subject to liability of up to R$ 35.0.
F-74
| Notes to the Consolidated Financial Statements |
| at December 31, 2007, 2006 and 2005 |
| All amounts in millions of |
(b) Holders of preferred shares
Some holders of class B preferred shares issued by the Company under a tax incentive program are claiming that they are entitled to participate on an equal basis in the remaining profits with the holders of common and class A preferred shares.
Polialden faced an identical issue in a proceeding before the CVM; on August 10, 2000, the CVM Commission sided with the Poliladen's position that "the dividends payable to preferred shares should range from 6% to 8% of the par value of such shares, or the equivalent to 25% of net profits at year end, whichever is higher, as the company has done over the last 10 years. Such shares are not entitled to remaining profits, as the bylaws have clearly set the maximum dividedns attaching to such shares."
Most court decisions already rendered in this regard have been favorable to the Company. Most of judicial deposits made by the Company have already been released to the Company, and at December 31, 2006 there was only one judicial deposit at the historical value of R$ 0.8, related to the 2004 dividends.
The Company believes that the chances of loss in these cases are remote, based on opinions of outside legal counsel, recent court decisions in similar cases and CVM rulings on this specific issue. The Company continues to pay dividends accordingly up to a limit of 6% of the par value or 25% of the minimum mandatory dividends, as set forth in the Company's bylaws.
(c) Offsetting of tax credits
From May through October 2000, the merged companies OPP Química and Trikem offset their own federal tax debts with IPI tax credits assigned by an export trading company ("Assignor"). These offsetting procedures were recognized by the São Paulo tax officials (DERAT/SP) through offset supporting certificates ("DCCs") issued in response to an injunctive order entered in response to a motion for writ of mandamus ("MS SP"). Assignor also filed a motion for writ of mandamus against the Rio de Janeiro tax officials (DERAT/RJ) ("MS RJ") for recovery of IPI tax credits and their use for offsetting against third-party tax debts, among others. The MS SP was dismissed without prejudice, confirming the administrative and jurisdictional authority of the Rio de Janeiro tax officials to rule on the Assignor's tax credits.
In June 2005, DERAT/SP issued ordinances, canceling the DCCs. Based on these ordinances, the Federal Revenue Office unit in Camaçari, Bahia sent collection letters to the Company. Notices of dispute were presented by the Company, but the administrative authorities declined to process them. As a result, past-due federal tax liabilities of R$ 276.6 were assessed in December 2005 for the Company's tax debts that had been offset with these credits.
F-75
| Braskem S.A. and Its Subsidiaries |
| Notes to the Consolidated Financial Statements |
| at December 31, 2007, 2006 and 2005 |
| All amounts in millions of reais, unless otherwise indicated |
Both Assignor and the Company commenced judicial and administrative proceedings to defend the lawfulness and validity of those offsetting procedures, and the legal advisors to both companies believe the chances of success in those cases are probable, mostly in light of the indisputable validity of those credits as confirmed in a specific audit conducted by DERAT/RJ.
On October 3, 2005, the Federal Supreme Court ruled on the MS RJ favorably to Assignor in a final and conclusive manner, confirming Assignor's definite right to use the IPI tax credits from all its exports and their availability for offsetting against third-party debts. As a result, the legal advisors to Assignor and to the Company believe that the offsetting procedures carried out by the merged companies and duly recognized by DERAT/SP have been confirmed, and for this reason they also hold that the tax liabilities being imputed to the Company are not due. Irrespective of the final and conclusive decision in MS RJ, the legal advisors to Assignor and to the Company, in addition to a jurist when inquired of his opinion on this specific issue, believe that the tax liabilities that had been offset with these credits by the merged companies have become time-barred and, as such, can no longer be claimed by the tax authorities.
In January 2006, the Company was ordered to post bond in aid of execution of the tax claim referred to above. This bond was tendered in the form of an insurance policy currently under negotiation among the Company, the Assignor and insurance companies.
The Company believes, based on the advice of its external legal advisors, that the chances of success in all of the above claims are probable. Nevertheless, if the Company is eventually unsuccessful in all those cases, it will be entitled to full recourse against the Assignor concerning all amounts paid to the National Treasury, as per an assignment agreement executed in 2000.
(d) National Social Security Institute - INSS
The Company is a party to several social security claims totaling R$ 285.9 as of December 31, 2007 (2006 - R$ 164.8) . Out of these sums, R$ 18.2 are secured by a portion of the Company's inventory. Based on the opinion of its outside legal counsel, the Company believes that the chances of loss for the remaining amounts are remote, and, therefore, no provision has been recorded.
F-76
| Braskem S.A. and Its Subsidiaries |
| Notes to the Consolidated Financial Statements |
| at December 31, 2007, 2006 and 2005 |
| All amounts in millions of reais, unless otherwise indicated |
(e) Other court disputes involving the Company and its controlled companies
The Company is party to a civil lawsuitslawsuit filed by a former caustic soda customer, whichclaiming amounts, at December 31, 2004,2007, of R$ 168.3. At December 31, 2003, the Company had civil claims involving various matters totaling27.5 (2006 - R$ 252.0. The decrease in the claim of such former customer resulted from the fact that one of the lawsuits was ruled improcedent. Management,25.8) . Braskem's management, supported by the opinion of its external legal advisors, believe that an unfavorable decision ischances of losses are remote and, for this reason, no provisions have been established.recorded.
The Company acts as respondent in an arbitration commenced by a shipping company and pending in the City of Rio de Janeiro. Braskem was eventually sentenced to pay R$ 10.4 for breach of the original contractual conditions.
In the second quarter of 2005, the Petrochemical and Chemicals Companies Employees Union of Triunfo, Rio Grande do Sul and Camaçari, Bahia brought labor actions claiming payments in respect of overtime. The Company has filed defenses in those lawsuits and does not expect any losses in these actions.
The Company is defending various claims fileda defendant in an arbitration in the City of Rio de Janeiro commenced by employees. A provision had been madea freight company. Recently, the arbitrators asked for probable losses of R$ 10.9 relating to certain claims, while no provision was recorded for the remaining claims because, baseda technical expert opinion on the advicesubject matter and extent of externalthe dispute, which was estimated at R$ 29.0. However, in reliance on the opinion of legal advisors these latter claims should be judged in favor ofto the Company.
The Company and its subsidiary Polialden are parties to certain proceedings brought by some preferred shareholders which, based on its legal advisor opinions’, managementinterests, the Company believes that an unfavorable decisionit is remotelikely to prevail, and for this reason no provisions have been established. Inamounts were provisioned for this matter.
As of December 2004, as published31, 2007, the Company is a defendant in approximately 1,218 labor claims, including those mentioned in the Material Fact, some minority shareholders waivedparagraph above, totaling approximately R$ 292.3 (2006 - R$ 260.2) . Based on the lawsuits filed against Polialden, exchanging their Polialden preferred shares foropinion of its external legal advisors, the Company’s Class A preferred shares.
BRASKEM S.A. AND ITS SUBSIDIARIES
NOTES TO THE CONSOLIDATED AND COMBINED FINANCIAL STATEMENTS—(Continued)
Company has provided a provision of R$ 25.0 at December 31, 2004, 20032007 (2006 - R$ 21.9) for the probable losses in these claims.
The subsidiary Copesul was assessed by the Federal Revenue Office in 1999 for IRPJ and 2002CSL credits recorded for the base period of 1994, with respect to the monetary restatement of the balance sheet and equity in the earnings of subsidiaries, as a result of the recognition of dividends distributed by a foreign subsidiary. The restated amount of this claim, which is pending judgment of an appeal leged by the National Treasury with the Higher Chamber for Tax Appeals, is R$ 21.3. The legal advisors to Copesul believe that a favorable outcome in this claim is possible.
F-77
All amounts in millionsTable of reais, unless otherwise indicatedContents
| Braskem S.A. and Its Subsidiaries |
| Notes to the Consolidated Financial |
| at December 31, 2007, 2006 and 2005 |
| All amounts in millions of reais, unless otherwise indicated |
22 Financial Instruments
(a) Risk management |
Because the Company operates in the international markets, obtainingraises funds for its operations and makes investments in the international markets, it is exposed to market risks mainly arising from changes in the foreign exchange and interest rates. BankThe Company's bank accounts, financial investments and other accounts receivable are subject to credit risk. The Company has developed policies and procedures for risk evaluation, report preparation and mathematical models for the monitoring of derivative activity.
these risks and possible use of derivatives to decrease these risks.
To cover theits exposure to market risk,risks, the Company utilizes various types of currency hedges, some involving the use of cash and others not. The most common cash-based currency hedges used by the Company are financial instruments denominated in foreign currencies (certificates of deposit, U.S. dollar-denominated securities, foreign mutual funds, time deposits and overnight deposits) and put and call options. The non-cash types of currency hedges used by the Company are swaps of U.S. dollar obligations that bear interest at the CDI rateforeign currency and forwards.
forwards.
To hedge its exposure to exchange and interest rate risks arising from loan and financing agreements, as well as to meet the requirements established in loan agreements, the Company adopted, at December 31, 2001,in May 2004, the following methodology: hedging of the principal and interest (on a consolidated basis), falling due in the next 12 months of, at least, (i) 60% of the debt linked to exports (trade finance), except for advances on exchange contracts of up to six months and advances on export contracts; and (ii) 75% of the debt not linked to exports (non-trade finance). Implementation of this policy is dependent upon market conditions, credit availability and cash balances.
| (b) Exposure to foreign exchange risks |
The Company has long-term loans and financing to finance its operations, including cash flows and modernization projects.project financing. A substantial part of the long-term loans and financing is denominated in U.S. dollars (Note 15)14).
| (c) Exposure to interest rate risks |
The Company is exposed to interest rate risks on its short-term and long-term debt. The debt in foreign currency, bearing floating interest rates, is mainly subject to LIBOR variation, andwhile the domestic debt, bearing floating interest rates, is mainly subject to fluctuations in the TJLP and CDI rates and the CDI rate. MostIGP-M inflation index.
F-78
Table of LIBOR denominated financings have a cap for the LIBOR cost.
Contents
| Notes to |
| at December 31, 2007, 2006 and 2005 |
| All amounts in millions of reais, unless otherwise indicated |
(d) Exposure to commodity risks
The Company is exposed to fluctuations in the price of several petrochemical commodities, especially its main raw material, naphtha. Because the Company seeks to transfer to its own selling prices the effect of price changes in its raw material,materials, arising from changes in the international markets, financial instrument were not usedquotations for naphtha, part of its sales may be carried out under fixed-price contracts or contracts stating maximum and/or minimum fluctuation ranges. Such contracts are commercial agreements or derivative contracts relating to hedge the prices of this commodity, or any other petrochemical commodities sold by Braskem.future sales.
| (e) Exposure to credit risk |
The operations thatCompany is subject the Company to concentration of credit risk are mainlyin connection with bank accounts, financial investments and other accounts receivable.receivable, which expose the Company to risks relating to financial institutions involved. In order to manage the credit risk, the Company maintainskeeps its bank accounts and financial investments with large financial institutions.
In relation to customer credit risk, the Company protects itself by performing detailed analyses before granting credit and by obtaining realsecurity and personal guarantees, when necessary.
(f) Derivative instrument transactions
As of December 31, 2007, the Company had the following derivative contracts:
| Market value (i) | ||||||||
| Notional | December | December | ||||||
| Description | Maturity | amount | 2007 | 2006 | ||||
| Real/US$ - Option (Put US$) | February 2007 | US$ 306.0 | - | (11.6) | ||||
| Real + CDI/Yen + Tibor (swap) | March 2012 | R$ 136.0 | (45.5) | (45.2) | ||||
| Real + CDI/Yen + Tibor (swap) | June 2012 | R$ 143.0 | (31.3) | (22.8) | ||||
| Real + CDI/US$ (swap) | May 2007 | US$ 100.0 | - | (24.3) | ||||
| Real + CDI/US$ (swap) | February 2007 | US$ 200.0 | - | (19.1) | ||||
| Tax Sparing II (credit default swap) | June 2015 | US$ 100.0 | 0.1 | 0.1 | ||||
| Return Swap over investment funds | December 2007 | US$ 410.0 | 34.7 | 10.2 | ||||
| Benzene (non deliverable forward) | January 2007 | 146.7 th.tons | - | (6.9) | ||||
| Swap Austrian Notes | January 2010 | R$ 259.6 | (19.2) | - | ||||
| Swap Austrian Notes | January 2011 | R$ 243.5 | (20.7) | - | ||||
| Swap Cupom vs Libor | July 2008 | US$ 150.0 | 0.2 | - | ||||
BRASKEM S.A. AND ITS SUBSIDIARIES
NOTES TO THE CONSOLIDATED AND COMBINED FINANCIAL STATEMENTS—(Continued)
(i) The market value represents the amount receivable (payable) if transactions have been settled at December 31, 2004, 2003 and 20022006 or 2007, as applicable.
F-79
All amounts in millionsTable of reais, unless otherwise indicatedContents
| Braskem S.A. and Its Subsidiaries |
| Notes to the Consolidated Financial |
| at December 31, 2007, 2006 and 2005 |
| All amounts in millions of reais, unless otherwise indicated |
To determine the estimated market value of financial instruments, the Company uses reversal transaction quotations or public information available in the financial markets, as well as valuation methodologies generally accepted and utilized by counterparties. These estimates do not necessarily assure that such transactions could be realized in the market at the indicated amounts. The use of different market information and/or valuation methodologies could have a significant effect on the estimated market value.
Financial income (expenses)All outstanding derivative contracts are intended only to offset financial gains and losses (hedge) on the fair value of other Company's assets or liabilities. Accordingly, they are linked to purchases, sales, financial investments or debt agreements.
(g) Fair market value of financial instruments
The estimated fair market value of financial instruments as of December 31, 2007 is comprisedsimilar to their book value, as a result of the maturities or the frequent adjustments to the prices of these instruments, as follows:
| Book value | Fair value (MTM) | |||
| Assets | ||||
| Cash and cash equivalents and other investments | 2,350.9 | 2,350.9 | ||
| 2,350.9 | 2,350.9 | |||
| Liabilities | ||||
| Short and long-term debt | 7,470.4 | 6,629.6 | ||
| Debentures | 911.6 | 917.4 | ||
| 8,382.0 | 7,547.0 | |||
The fair market value of financial assets and short and long-term debt, when applicable, was determined by applying the current interest rate available for operations with similar conditions and remaining maturities.
| 2004 | 2003 | 2002 | |||||||
Interest income | 160.8 | 51.5 | 52.9 | ||||||
Monetary variation on financial investments, related parties and accounts receivables | 11.6 | 121.5 | 214.1 | ||||||
Gain (loss) on derivative operations | (5.6 | ) | (39.7 | ) | 137.3 | ||||
Foreign exchange variation | 90.1 | 758.3 | (1,938.5 | ) | |||||
Financing interest | (590.1 | ) | (543.6 | ) | (735.4 | ) | |||
Financing monetary variation | (380.9 | ) | (293.1 | ) | (319.2 | ) | |||
Monetary variation and interest in taxes and suppliers | (137.1 | ) | (362.9 | ) | (66.6 | ) | |||
Taxes on financial operations | (148.4 | ) | (105.3 | ) | (48.2 | ) | |||
Others | (231.1 | ) | (290.3 | ) | (158.3 | ) | |||
| (1,230.7 | ) | (703.6 | ) | (2,861.9 | ) | ||||
23 Financial Income (Expenses)
| 2007 | 2006 | 2005 | ||||
| Financial income | ||||||
| Interest income | 134.7 | 140.0 | 140.1 | |||
| Monetary variation of financial investments, related parties and | ||||||
| accounts receivable | 24.7 | 48.1 | 17.7 | |||
| Monetary variation of taxes recoverable | 12.2 | 48.6 | 7.6 | |||
| Gains on derivative transactions | 47.3 | 114.1 | 45.7 | |||
| Exchange variation on foreign currency assets | (350.4) | (204.2) | (288.8) | |||
| Other | 18.0 | 12.9 | 44.1 | |||
| (113.5) | 159.5 | (33.6) | ||||
| Financial expenses | ||||||
| Interest on financing and related parties | (341.9) | (287.8) | (347.0) | |||
| Monetary variation on financing and related parties | (203.8) | (255.5) | (203.1) | |||
| Monetary variation and interest on taxes and suppliers | (123.8) | (178.5) | (169.7) | |||
| Losses on derivative transactions | (44.8) | (161.9) | (61.5) | |||
| Expenses for sale of invoices at a discount | (128.3) | (119.7) | (108.2) | |||
| Discounts granted | (137.6) | (138.0) | (88.4) | |||
| Exchange variation on foreign currency liabilities | 1,073.1 | 333.4 | 556.9 | |||
| Taxes and charges on financial transactions | (274.7) | (228.4) | (110.6) | |||
| Interest on own capital | - | - | (270.0) | |||
| Reversal of interest on own capital | - | - | 270.0 | |||
| Other | 1.7 | (61.5) | (144.2) | |||
| (180.1) | (1,097.9) | (675.8) | ||||
| Financial results, net | (293.6) | (938.4) | (709.4) | |||
F-80
| Notes to the Consolidated Financial Statements |
| at December 31, 2007, 2006 and 2005 |
| All amounts in millions of reais, unless otherwise indicated |
24 Other Operating Income (Expenses)
| 2007 | 2006 | 2005 | ||||
| Income (expenses) | ||||||
| Rental of facilities and assignment of right of use | 24.3 | 45.4 | 3.9 | |||
| Recovery of taxes (Note 16(iii)) | 120.0 | 125.9 | 3.4 | |||
| Recovery of costs/inventory adjustments | (21.2) | (9.3) | 10.5 | |||
| Other operating income/(expenses), net | 8.4 | 24.1 | 5.0 | |||
| 131.5 | 186.1 | 22.8 | ||||
Recovery of taxes represents reversals of provisions for contingencies for which final unappeable decisions have been received.
Other operating income (expenses), net is comprised as follows:
| 2004 | 2003 | 2002 | |||||
Income (expenses) | |||||||
Rental of installations | 20.7 | 18.2 | 12.2 | ||||
Recovery of taxes and compulsory deposits | 15.3 | 22.8 | 60.9 | ||||
Insurance recoveries | 1.6 | 11.6 | 18.2 | ||||
Other operating income, net | 4.0 | (2.9 | ) | 11.3 | |||
| 41.6 | 49.7 | 102.6 | |||||
25 Non-operating income (expenses), net is comprised as follows:Income (Expenses)
| 2007 | 2006 | 2005 | ||||
| Income (expenses) | ||||||
| Change in interest in investments | (35.5) | 2.4 | 5.4 | |||
| Sale of permanent assets | (2.0) | (0.5) | 0.8 | |||
| Provision for loss on investments | - | - | (4.3) | |||
| Provision for loss/retirement of assets | (13.8) | - | (22.4) | |||
| Other non-operating income (expenses), net | (15.9) | 5.2 | (4.7) | |||
| (67.2) | 7.1 | (25.2) | ||||
| 2004 | 2003 | 2002 | |||||||
Income (expenses) | |||||||||
Gain (loss) on participation in investments | 3.5 | (2.7 | ) | 7.8 | |||||
Gain (loss) on permanent assets disposal | 0.5 | (0.1 | ) | (55.6 | ) | ||||
Assets removal costs | — | (16.2 | ) | — | |||||
Residual value of disposed fixed assets | (5.5 | ) | — | — | |||||
Loss on disposal of permanent assets | (18.2 | ) | (3.8 | ) | (41.5 | ) | |||
Other | (10.2 | ) | 18.0 | (8.7 | ) | ||||
| (29.9 | ) | (4.8 | ) | (98.0 | ) | ||||
| 26 Insurance Coverage |
The Company has a broadly-basedbroadly based risk management program designed to provide coveragecover and protection for all assets, as well as possible losses caused by production stoppages, through an “all risks”"all risks" insurance policy. This insurance policy establishes forthe amount of maximum probable damage, which the Company considersconsidered sufficient to cover possible losses, taking into account the nature of its Company’sthe Company's activities and the advice of insurance consultants. At December 31, 2004,2007, insurance coverage for inventories, property, plant and equipment, and loss of profits amounted to approximatelyof the Company was US$ 4.3 billion per claim, while the total of all insured assets was R$ 11,780.4.
F-81
BRASKEM S.A. AND ITS SUBSIDIARIES
NOTES TO THE CONSOLIDATED AND COMBINED FINANCIAL STATEMENTS—(Continued)
at December 31, 2004, 2003 and 2002
All amounts in millionsTable of reais, unless otherwise indicatedContents
| Braskem S.A. and Its Subsidiaries |
| Notes to the Consolidated Financial Statements |
| at December 31, 2007, 2006 and 2005 |
| All amounts in millions of reais, unless otherwise indicated |
27 Shares Traded Abroad - NYSE and LATIBEX
(a) American Depositary Receipts ("ADRs") program
The Company's ADSs are traded on the NYSE with the following characteristics:
. Type of shares: Class A preferred shares.
.. Each ADS represents two shares, traded under the symbol "BAK".
.. Foreign Depositary Bank: The Bank of New York ("BONY") - New York branch.
.. Brazilian Custodian Bank: Banco Itaú S.A.
(b) LATIBEX
The Company's Class A preferred shares are traded on LATIBEX, the Madrid Stock Exchange's market for Latin American companies quoted in euros. The shares are traded under the symbol "XBRK" and the Brazilian custodian bank is Banco Itaú S.A. LATIBEX has adjusted and altered the process for quotation and trading to comply with the new Corporate Governance Standards adopted by Bovespa. Accordingly, as from May 16, 2005, the shares have been traded in units.
28 Private Pension Plans
The actuarial obligations relating to the pension and retirement plans are accrued in conformity with the procedures established by CVM Resolution 371Deliberation 371/2000.
(a) PETROS/PREVINOR
In June 2005, the Company communicated to PETROS and PREVINOR its intention to withdraw as a sponsor effective June 30, 2005. With regard to PETROS, the calculation of December 13, 2000, except for ODEPREV—Odebrecht Previdência (“Odeprev”)mathematical reserves of participants was completed in November 2006 and submitted in that month to the Supplementary Pension Plan Secretary, a Social Security Ministry department in charge of regulating and inspecting private pension plans. The Company has a provision of R$ 19.6 (2006 - R$ 58.6), for which such proceduresis considered sufficient to face any disbursements at the time the commitments of this plan are not applicable.settled.
F-82
| Notes to the Consolidated Financial Statements |
| at December 31, 2007, 2006 and 2005 |
| All amounts in millions of reais, unless otherwise indicated |
Benefits to retired employees and pensioners will continue to be paid on a regular basis up to completion of the process.
The merged Companies OPP Química and Trikemcompany Politeno was a sponsor of PREVINOR until January 2007. The computation of the mathematical reserves was completed, as well as the Sponsorship Withdrawal Memorandum to be sent to SPC. Plans maintained by Politeno have a defined-contributionfunded status and no disbursements by Braskem are required.
It is expected that the Sponsorship Withdrawal Memorandum will be lodged with the authorities in the first quarter of 2008.
Polialden's commitments to participants under the PRENINOR plan were settled in the first half of 2007 with no requirement of contributions by the Company.
(b) ODEPREV
The Company has a defined contribution plan for theirits employees. The plan is managed by Odeprev,ODEPREV - Odebrecht Previdência which is sponsoredwas set up by the Odebrecht GroupS.A. as a closed private pension entity.
Sponsor’s contributions for 2004 were R$ 2.4 (2003—R$ 1.1 and 2002—R$ 1.0) and those of ODEPREV offers its participants, were R$ 5.8 (2003—R$ 3.9 and 2002—R$ 3.5).
The Company sponsors a defined-benefit plan for certain employees. The plan is managed by Petros. Its main objectives are to (i) complement retirement benefits provided by the government and (ii) implement social assistance programs with the supportemployees of the sponsoring companies. companies, the Optional Plan, a defined contribution plan, under which monthly and sporadic participant contributions and annual and monthly sponsor contributions are accumulated and managed in individual retirement savings accounts.
The sponsoring companies and their employees pay monthlyBoard of Trustees of ODEPREV defines each year in advance the parameters for contributions to Petros basedbe made by the participants and the sponsoring companies. With regard to the payment of benefits under the Optional Plan, the obligation of ODEPREV is limited to the total value of the quotas held by its participants and, to comply with the regulations for a defined-contribution plan, it will not be able to require any obligation or responsibility on the employees’ remuneration.part of the sponsoring company to assure minimum levels of benefits to the participants who retire.
At December 31, 2007, the number of active participants in ODEPREV amounted to 2,512 (2006 - 2,354), and the Company's and employees' contributions in 2007 amounted to R$ 5.9 (2006 - R$ 7.9) and R$ 16.3 (2006 - R$ 13.2), respectively.
(c) Copesul
Copesul and its employees make contributions to PETROS - Fundação Petrobras de Seguridade Social, under retirement and defined benefit pension plans. In 2006, the rate of the contribution salary was 12.93% over the total compensation of employees who participate in the plan. In 2007, contributions made by Copesul added up to R$ 5.7 (2006 - R$ 5.6) .
F-83
| Braskem S.A. and Its Subsidiaries |
| Notes to the Consolidated Financial Statements |
| at December 31, 2007, 2006 and 2005 |
| All amounts in millions of reais, unless otherwise indicated |
Pursuant to PETROS's charter and applicable law, in the event of a material insufficiency of technical reserves, both the sponsors and participants will be required to make a financial contribution, otherwise the plan benefits will be downsized in accordance with the available funds. As of the balance sheet date, this subsidiary was not required to make any supplementary contribution.
In accordance with CVM Deliberation 371, of December 13, 2000, Copesul determined the actuarial liabilities as of December 2007 of post-retirement benefits granted to its employees, by using the valuation method - credit units projected based on actual information up to November 30 of each year. The valuation results are as follows:
| 2007 | 2006 | |||
| Fair value of asset plans | 437.4 | 388.0 | ||
| Present value of actuarial liabilities | 496.8 | 405.9 | ||
| Actuarial liabilities | (59.4) | (17.9) | ||
| Net actuarial liabilities to be provided for | (59.4) | (17.9) | ||
| Actuarial liabilities provided for | 8.9 | 8.9 | ||
| Net actuarial liabilities - not provided for | (50.5) | (9.0) | ||
In compliance with CVM Resolution,Deliberation 371, of December 31, 2000, as from year 2000, Copesul records R$ 8.9 on a monthly basis, relating to benefits to which employees will be entitled after the required grace period, in relationaccordance with an actuarial study performed by an independent expert for the base date of December 31, 2001.
The actuarial assessment as of November 30, 2007 found that Copesul will be required to “Accounting for Employee Benefits”,increase its future contributions to be able to raise the benefits. However, as the Company is within the limits set forth in CVM Deliberation 371 and in compliance with accounting practices adopted in Brazil, it chose not to make the adjustment of the supplementary actuarial calculations were made forliability.
Gains (losses) previously recorded are associated with the profitability of the plan assets - differences between the actuarial assumptions and real facts. Such differences are considered actuarial gains (losses). Copesul's policy is to recognize such gains (losses) as income (expenses) only at such time as their accumulated amounts exceed, in each year, the higher of the following limits: (i) 10% of the present value of the total actuarial obligation of the defined benefit, underand (ii) 10% of the projected unit method.plan assets fair value. The portion to be recognized is amortized on a yearly basis, with the amortization amount determined by dividing its amount by the average remaining service time estimated for the plan participants.
F-84
| Braskem S.A. and Its Subsidiaries |
| Notes to the Consolidated Financial Statements |
| at December 31, 2007, 2006 and 2005 |
| All amounts in millions of reais, unless otherwise indicated |
The main actuarial assumptions at the balance sheet date are shown as follows:
| 2007 | 2006 | |||
| Actual discount rate | 6% | 6% | ||
| Expected yield rate of plan assets | 6% | 6% | ||
| Salary real growth | 2% up to 47 years and zero | 2% up to 487 years and zero | ||
| after 48 years of age | after 48 years of age | |||
| Biometric bases | ||||
| Mortality for pension and savings (able individuals) | AT-2000 | AT-2000 | ||
| Mortality for pension and savings (disabled individuals) | C.A.P. experience (*) | C.A.P. experience (*) | ||
| Disability | Álvaro Vindas (**) | Álvaro Vindas (**) | ||
| Other charges | STEA experience (***) | STEA experience(***) | ||
(*) C.A.P. - Caixa de Aposentados e Pensionistas used as a basis to develop the mortality table for actuarial computations.
(**) Álvaro Vindas - Disability Table used in actuarial computations.
(***) STEA - Serviços Técnicos de Estatística e Atuária Ltda.
In May 2003, the board of directors of Copesul approved the implementation of the Copesul Supplementary Private Pension Plan, called COPESULPREV. This is a closed, defined contribution plan intended to cover those employees not included in the former PETROS plan, which currently does not accept new participants. The plan is independently managed by PETROS - Fundação Petrobras de Seguridade Social, with no links to any other pension plan is sponsoredmanaged at present by that entity, pursuant to the Company.provisions of Complementary Law 109/2001. In 2007, Copesul's contributions added up to R$ 1.4 (2006 - R$ 1.1).
(d) Ipiranga Química and IPQ
Subsidiaries Ipiranga Química and IPQ sponsor Fundação Francisco Martins Bastos - FFMB, a closed supplementary private pension entity designed to manage pension benefit plans for the employees of Empresas Petróleo Ipiranga.
During the year ended December 31, 2007, the subsidiaries' contributions amounted to R$ 1.7 and R$ 0.5 relating to basic and supplementary benefits, respectively. The initial unfunded statussupplementary benefits and pension plan amounts were determined at the annual actuarial valuation carried out by independent actuaries, Towers Perrin Forster & Crosby Ltda., and are recorded in the financial statements in accordance with NPC 26.
F-85
| Braskem S.A. and Its Subsidiaries |
| Notes to the Consolidated Financial Statements |
| at December 31, 2007, 2006 and 2005 |
| All amounts in millions of reais, unless otherwise indicated |
The reconciliation of liabilities for post-retirement benefits at December 31 2001 was recorded directly against shareholders’ equity and the pension liability is recorded in long-term liabilities under “Other accounts payable”.
The amounts are as follows:
| 2004 | 2003 | |||||
Present value of actuarial obligation at year end | ||||||
Benefits to be granted (active employees) | 139.0 | 127.1 | ||||
Benefits granted (retired employees and pensioners) | 282.8 | 253.6 | ||||
| 421.8 | 380.7 | |||||
Fair value of plan assets at year end | 357.2 | 320.3 | ||||
Present value of obligations in excess of assets | 64.6 | 60.4 | ||||
Unrecognized net actuarial gain (loss) | (4.4 | ) | (2.5 | ) | ||
Cost upon the adoption of CVM 371 not yet recognized | (1.0 | ) | (1.6 | ) | ||
Net actuarial liability | 59.2 | 56.3 | ||||
Net Periodic Pension Cost | ||||||
Service cost | 9.4 | 8.8 | ||||
Interest cost—benefits to be granted (active employees) | 15.7 | 9.4 | ||||
Interest cost—benefits granted (retired employees and pensioners) | 30.6 | 17.2 | ||||
Expected return on plan assets | (39.7 | ) | (22.4 | ) | ||
Expected contributions of participants | (5.0 | ) | (3.8 | ) | ||
Cost of amortization | — | 0.5 | ||||
| 11.0 | 9.7 | |||||
BRASKEM S.A. AND ITS SUBSIDIARIES
NOTES TO THE CONSOLIDATED AND COMBINED FINANCIAL STATEMENTS—(Continued)
at December 31, 2004, 2003 and 2002
All amounts in millions of reais, unless otherwise indicated
Additional information on the pension plan managed by Petros:
|
2007 | |
| ||
| Present value of | ||
| ||
| ||
| ||
| ||
| Net liabilities for post-retirement benefits | ||
| Current liabilities | (1.7) | |
| Non-current liabilities | (5.3) | |
The portion of actuarial gains or losses to be recorded as income or expenses corresponds to the amount of unrecognized gains and losses in each year in excess of the higher of the following limits:
Sponsor’s contributions to this(i) 10% of the present value of the total actuarial obligation of defined benefits; and
(ii) 10% of the fair value of the plan's assets.
The portion in excess of the limits is amortized on an annual basis, with the amortization amount determined by dividing its amount by the average remaining service time estimated for the plan participants.
Amounts recognized in 2004 were R$ 7.7 (2003—R$ 6.5 and 2002—R$ 6.1).
the statements of operations are as follows:
2007 | ||
| Cost of current service | 3.1 | |
| Cost of interest | 13.2 | |
| Expected asset yield | (15.5) | |
| Amortization of actuarial losses | 0.2 | |
| Employees' contributions | (1.0) | |
| Total expenses (income) for the year | ||
F-86
The Company and its subsidiary Polialden have a defined-contribution plan for certain employees. The plan is managed by PREVINOR—Associação da Previdência Privada.
Sponsor’s contributions for 2004 were R$ 1.8 (2003—R$ 1.5 and 2002—R$ 1.3).
| Notes to the Consolidated Financial Statements |
| at December 31, 2007, 2006 and 2005 |
| All amounts in millions of reais, unless otherwise indicated |
Changes in net liabilities for post-retirement benefits are as follows:
2007 | ||
| Net liabilities at the beginning of the year | (6.8) | |
| Expenses (income) for the year | 0.1 | |
| Actual Company contributions during the year | 1.6 | |
| Actual benefits paid during the year | 0.8 | |
| Adjustment to present value of obligations and other adjustments | (2.7) | |
| Net liabilities at the end of the year | (7.0) | |
The main actuarial assumptions used were (percentage per year):
2007 | ||
| Discount rate to present value of actuarial obligation | 10.2 | |
| Expected long-term yield rate of assets | 10.2 | |
| Projected average salary growth rate | 6.1 | |
| Inflation rate (long term) | 4.0 | |
| Medical service growth rate | 7.1 | |
Biometric assumptions used:
(*) For Life Insurance benefit, the mortality table used was CSO-80.
Studies performed by the actuarial consultants to FFMB, Towers Perrin, identified positive actuarial impacts on the Plan as from 2005, with the ensuing reduction in post-retirement liabilities relating to retirement benefits. The negative impact of R$ 0.2, in 2007 was recorded as income under "Other operating income".
29 Raw Material Purchase commitments
Commitments
The Company has electric power purchase contracts for the consumptionpurchase of electric energy by its industrial plants located in the States of Alagoas, Bahia and Rio Grande do Sul. The minimum annual commitment under these contracts is approximately R$ 92.0 and the contracts extend for four years.
The Company purchases ethylene and propylene for its units in the Southern Petrochemical Complex from Copesul under a long-term contract that expires in 2014. The minimum annual purchase commitment is 268,200 metric tons of ethylene and 262,200 metric tons of propylene at December 31, 2004 market prices, amounts to R$ 1,428.3 (unaudited). If not purchased the Company must pay for the unpurchased amount at 40%248.5.
F-87
| Braskem S.A. and Its Subsidiaries |
| Notes to the Consolidated Financial Statements |
| at December 31, 2007, 2006 and 2005 |
| All amounts in millions of reais, unless otherwise indicated |
Braskem purchases naphtha based under contracts withestablishing a total minimum annual purchase volume of metric tons equivalent to R$ 5,086.2,5,771.3 (unaudited) at, based on market prices as of December 31, 20042007.
30 Subsequent Events
(a) Law 11,638
Law 11,638, published in the Official Daily Government Newspaper (DOU) of December 28, 2007, modified several provisions of the Brazilian Corporate Law, effective January 1, 2008.
The major amendments include the following matters which, in the opinion of management, may change the presentation of the financial statements and the criteria for determining the financial position and the results of Braskem and its subsidiaries as from the year ending December 31, 2008:
. The Statement of Changes in Financial Position (DOAR) will be discontinued and replaced with the Statement of Cash Flows (DFC). For publicly-held companies, the Statement of Added Value (DVA) will be mandatory. Braskem already discloses DFC in its quarterly and annual reports, as well as DVA in its annual reports, both as supplementary information.
. Intangible assets and rights will be segregated from tangible assets. Permanent assets will be composed of investments; plant, property and equipment; intangible assets, and deferred charges. Intangible assets will include acquired goodwill.
. A new line item has been created under shareholders' equity: 'market value adjustments". Market value adjustments to shareholders' equity, although not included in net income for the year under the accrual basis of accounting, will comprise counter entries to increases or decreases in the value ascribed to assets and liabilities, as a result of their valuation at market prices.levels and the exchange variation of corporate investments abroad (this new rule will be analyzed by CVM in 2008).
Deferred charges will be comprised only of pre-operating expenses and restructuring expenditures that effectively contribute to increasing the profitability of the corporation in more than one fiscal year and are not merely reductions in costs or increases in operating efficiency.
. Tax incentives will no longer be classified as capital reserves, but as part of net income for the year. Based on a resolution of management, the Annual Shareholders' Meeting may appropriate a portion of profits corresponding to these incentives to a Tax Incentive Reserve, recorded as part of revenue reserves, and which may be excluded from the calculation basis of mandatory dividends. Since the end of 2006, Braskem has adopted this classification for these incentives not required to be accounted for in capital reserves.
F-88
| Notes to the Consolidated Financial Statements |
| at December 31, 2007, 2006 and 2005 |
| All amounts in millions of reais, unless otherwise indicated |
. The law also changed the valuation criteria of assets and liabilities, in particular:
• Assets and liabilities arising from long-term transactions, as well as from material short-term transactions, will be required to be adjusted to present value, in accordance with International Financial Reporting Standards. The enforcement of this provision is subject to rules to be issued by CVM in 2008;
• "Available for sale" securities or "trading" securities will be required to be recorded at market value; and
• All other financial instruments will be required to be recorded at restated or adjusted cost, in accordance with their likely realization value, if lower.
. In the event of a merger, amalgamation or demerger transaction between unrelated parties or involving an effective transfer of control, the assets and liabilities of the merged or split-off entity will be recorded at their market value.
. Interests of debentures and participations of employees and management, even in the form of financial instruments, and of assistance or pension plan institutions or funds for employees, which are not expenses, will be included in the statement of operations for the year.
. Corporations will not be allowed to record revaluation reserves. The new law allows corporations to either maintain existing balances and realize such balances in accordance with the current standards or reverse the balances until the end of 2008.
Management is reviewing the effects of the above mentioned changes on its shareholders' equity and results for the year of 2008. It will also take into consideration the guidance and definitions to be issued by the regulators. At this time, management believes that it is not possible to ascertain the effects of such amendments on the results and shareholders' equity for the year ended December 31, 2007.
(b) 2nd Share Repurchase Program
On February 19, 2008 the board of directors of the Company approved the acquisition of up to 19,862,411 class A preferred shares issued by the Company, to be held in treasury and subsequently sold or canceled, without decreasing the Company's share capital.
F-89
| Notes to the Consolidated Financial Statements |
| at December 31, 2007, 2006 and 2005 |
| All amounts in millions of |
The Extraordinary General Meeting, held on March 31, 2005,Share Repurchase Program was approved the legal merger of our subsidiary Odebrecht Química S.A. (“Odequi”) into the Company, based on the appraisal report supporting the shareholders’ equity value of Odequi, issued by independent appraisers, in the amount of R$ 1,340,749 at December 31, 2004.
In order to improve negotiations and increase the liquidity of the Company’s shares, the Extraordinary General Meeting held on March 31, 2005, approved6, 2008 with the reverse-splitproposal to cancel all the shares held in treasury the program will last for twelve months.
On March 6, 2008, the Company announced the cancellation of 16,595,000 Class A Preferred shares including all types and classesthat were held in treasury with a book value of shares, in the proportion of 250 shares to each share. Additionally, an ADS split was also approved, in the proportion of 2 ADS for each existing ADS.
BRASKEM S.A. AND ITS SUBSIDIARIES
NOTES TO THE CONSOLIDATED AND COMBINED FINANCIAL STATEMENTS—(Continued)
at December 31, 2004, 2003 and 2002
All amounts in millions of reais, unless otherwise indicated
R$ 244.5 million.
As from May 16, 2005,that date, Braskem no longer holds shares in treasury. However, 580,331 common shares and 290,165 class A preferred shares are still held by Braskem Participações S.A., one of the Company's subsidiaries.
(c) Transfer of Petrochemical Assets from Ultra
On February 27, 2008, Ultrapar, in accordance with the agreement entered into among Braskem, Petrobras and Ultrapar in April 2007 (Note 1(c)(xi)), completed the transfer of the petrochemical assets of the Ipiranga Group to Braskem and Petrobras. These assets represent an interest in Ipiranga Química. Ipiranga Química owns 100% of the total voting share capital of IPQ, which owns 39.2% of the total voting capital of Copesul.
As a result of this transfer of assets, Braskem became owner of 60% of Ipiranga Química, directly, 60% of IPQ, indirectly, and 62.7% of Copesul, directly and indirectly. The remaining 40% of Ipiranga Química was transferred to Petrobras.
The completion of this transaction allows the implementation of the Investment Agreement entered into with Petrobras in November 2007 (Note 1(c)(xv)). Under this agreement, Petrobras and Petroquisa will transfer to Braskem:
. 40.0%of the voting and total capital of Ipiranga Química;
.. 40.0%of the voting and total capital of Paulínia; and
.. up to 100% of the total and voting share capital of Triunfo, at the option of Petrobras and Petroquisa.
(d) Sale of Petroflex's
In March 2008, as all precedent conditions set forth in the sale agreement had been complied with, the sale of Petroflex was recognized at the final amount of R$ 252.1. The financial settlement of the transaction and transfer of shares have been quotedtook place on April 1, 2008 (Note 1(c)(xiv).
F-90
| Braskem S.A. and Its Subsidiaries |
| Notes to the Consolidated Financial Statements |
| at December 31, 2007, 2006 and 2005 |
| All amounts in millions of reais, unless otherwise indicated |
Pursuant to the agreement, changes in unit batchesPetroflex working capital and traded on Bovespanet debt may give rise to an adjustment in the acquisition price.
The Company and its subsidiaries, as participants in the corporate restructuring process, may be affected by economic and/or corporate aspects as a result of the outcome of this process.
At March 31, 2008, the market value of Petroflex, based on the New Yorkprice of shares listed on the São Paulo Stock Exchange, (“NYSE”was R$ 192.8. Petroflex was delisted in May 2, 2008.
(e) Petroquímica Paulínia
On April 25, 2008, the industrial plant of the jointly-controlled subsidiary Petroquímica Paulínia started operations. The unit, located at the city of Paulínia, State of São Paulo, has a production capacity of 350 thousand/ton per year of polypropylene.
(f) Petrobras Transaction
On May 30, 2008 the first phase of the Petrobras Transaction (note 1(c)(xv)), consideringwas approved by the reverse-splitshareholders of sharesBraskem and splitGrust Holdings S.A., a wholly-owned subsidiary of ADS, respectively.Petroquisa that, directly and indirectly, owns the interests in Copesul, Ipiranga Química, Ipiranga Petroquímica, and Paulínia. Petrobras and Petroquisa own, directly and indirectly, 23.1% of the Company’s total share capital, including 30.0% of the Company’s voting share capital, and Braskem owns, directly and indirectly 99.2% of the outstanding share capital of Copesul, all of the outstanding share capital of Ipiranga Química and Ipiranga Petroquímica and all of the outstanding share capital of Paulínia.
F-91
| Notes to the Consolidated Financial Statements |
| at December 31, 2007, 2006 and 2005 |
| All amounts in millions of reais, unless otherwise indicated |
31 Summary of Main Differences Between Brazilian GAAP and U.S.GAAP
In addition to the disclosures(a) Presentation of Note 21(a), on May 31, 2005, the second panel of the Brazilian Federal Supreme Court (“STF”) unanimously reaffirmed its December 2002 decisionfinancial statements, consolidation basis and dismissed the workers’ union’s appeal. Nevertheless, the decision is subject to reconsideration by the STF.
functional currency
As described in Note 2, the Company has elected to use the consolidated financial statements prepared in accordance with Brazilian GAAP and expressed in reaisgenerally accepted accounting principles (Brazilian GAAP) as its primary financial statements, for the purposes of filling and listing at Securities and Exchange Commission - SEC and New York Securities Exchange - NYSE, under the rules applicable at the U.S. Securities Act of 1933.
1934.
A summary of main differences between Brazilian GAAP and those generally accepted in United States (U.S. GAAP), applicable to the Company’s principal accounting policies that differ significantlyCompany, has been disclosed in this Note to the aforementioned financial statements.
F-92
| Braskem S.A. and Its Subsidiaries |
| Notes to the Consolidated Financial Statements |
| at December 31, 2007, 2006 and 2005 |
| All amounts in millions of reais, unless otherwise indicated |
(i) Consolidation basis
Consolidation basis vary from Brazilian GAAP to U.S. GAAP, isfollowing provisions set forth below.in SFAS 94, APB 18 and FIN 46(R). The consolidated condensed balance sheet and statement of operations comprise assets, liabilities, operations and subsidiaries of the following entities:
| Controlling interest - % | ||||||
| 2007 | 2006 | 2005 | ||||
| Operating and Trading Companies | ||||||
| Braskem América | 100.00 | 100.00 | 63.68 | |||
| Braskem Argentina | 100.00 | 100.00 | 100.00 | |||
| Braskem Distribuidora de Combustíveis | 100.00 | 100.00 | 100.00 | |||
| Braskem Europa | 100.00 | 100.00 | - | |||
| Braskem Importação e Exportação | 100.00 | 100.00 | 100.00 | |||
| Braskem Inc. | 100.00 | 100.00 | 100.00 | |||
| Braskem International Ltd. | - | - | 100.00 | |||
| Braskem Overseas Inc. | - | 100.00 | 100.00 | |||
| Braskem Participações | 100.00 | 100.00 | 100.00 | |||
| Cayman | 100.00 | 100.00 | 100.00 | |||
| CINAL | 100.00 | 100.00 | 86.82 | |||
| Copesul | 62.70 | - | - | |||
| CPP | - | 79.70 | 79.70 | |||
| Ipiranga Química | 60.00 | - | - | |||
| Ipiranga Petroquímica | 60.00 | - | - | |||
| IPL - Investimentos Petroquímico Ltda. | 100.00 | |||||
| Lantana Trading Company Inc. | 100.00 | 100.00 | 100.00 | |||
| Polialden | - | - | 63.68 | |||
| Politeno | - | 96.16 | - | |||
| Politeno Empreendimentos | 99.99 | - | - | |||
| Tegal | - | 95.83 | 90.79 | |||
| Variable Interest Entities | ||||||
| Parin Fund | 100.00 | 100.00 | 100.00 | |||
| Sol Fund | 100.00 | 100.00 | 100.00 | |||
| "Chemical I" Fund | - | 100.00 | 11.58 | |||
| "Chemical II" Fund | - | 9.19 | 9.09 | |||
Places of our businesses have been disclosed in Note 3(g). Assets, liabilities and operations of IPL and Polialden were incorporated into Braskem in 2006 and CPP, Politeno and Tegal during 2007, instead of operations carried out by Braskem International Ltd. ceased in 2006.
F-93
| Braskem S.A. and Its Subsidiaries |
| Notes to the Consolidated Financial Statements |
| at December 31, 2007, 2006 and 2005 |
| All amounts in millions of reais, unless otherwise indicated |
(ii) Functional currency under U.S. GAAP
The Braskem Group headquarter has elected Brazilian Reais as both functional and reporting currencies for all companies presented herein.
(b) Supplementary inflation restatement in 1996 and 1997 for U.S. GAAP
Under Brazilian GAAP, inflation accounting was discontinued effective January 1, 1996. Prior to that date, Brazilian GAAP statements included indexation adjustments which partially accounted for the effect of inflation on property, plant and equipment, investments, deferred charges (together denominated “permanent assets”"permanent assets") and shareholders’shareholders' equity, and reported the net charge or credit in the statement of operations.
However, under U.S. GAAP, according to SFAS 52, Brazil ceased to be treated as a highly inflationary economy only as from January 1, 1998.1998 requiring additional indexation to the Brazilian Reais. Accordingly, the financial information for purposes of U.S. GAAP should include additional inflation restatement adjustments for 1996 and 1997 made by applying the General Price Index—Internal Availability (“IGP-DI”) to permanent assets and shareholders’ equity. The IGP-DI indexIndex increased by 9.3% in 1996 and 7.5% in 1997.
, respectively, once Brazilian Reais was not considered to be functional currency at that time under SFAS 52.
For purposes of the U.S. GAAP reconciliation, shareholders’shareholders' equity under U.S. GAAP was increased by R$ 761.7656.2 and R$ 798.9,693.2, at December 31, 20042007 and 2003,2006, respectively, due to the additional inflation restatement adjustments,remeasurement accounting, net of depreciation. These amounts generated increases in depreciation charges of R$ 37.3,(37.4), R$ 33.2(28.6) and R$ 36.8(39.9) in 2004, 20032007, 2006 and 2002,2005 respectively.
| (c) Property, plant and equipment |
(i) Capitalized interest
UnderSince January 2006 under Brazilian GAAP, priorthe Company adopted the same methodology to capitalize interest as those adopted under U.S. GAAP, except for positive exchange variations capitalized under Brazilian GAAP and taken to the income statement under U.S. GAAP. Therefore, as from January 1, 19972006, except for positive exchange variations, there wasare no accounting standard requiring capitalizationmore differences between Brazilian GAAP and U.S. GAAP in the reconciliation going forward, except for the amortization of the predecessor difference. The depreciation of interest as partcapitalized under U.S.GAAP before 2006 continues to be depreciated based on the economic useful life of the costunderlying asset.
F-94
| Braskem S.A. and Its Subsidiaries |
| Notes to the Consolidated Financial Statements |
| at December 31, 2007, 2006 and 2005 |
| All amounts in millions of reais, unless otherwise indicated |
(ii) Impairment of the financial costs of borrowed funds, excluding foreign exchange losses, during construction of major facilities is recognized as part of the cost of the related assets.
BRASKEM S.A. AND ITS SUBSIDIARIES
NOTES TO THE CONSOLIDATED AND COMBINED FINANCIAL STATEMENTS—(Continued)
at December 31, 2004, 2003 and 2002
All amounts in millions of reais, unless otherwise indicated
(ii) Impairment
Long-Live Assets
Under Brazilian GAAP, companies are required to determine if operating income discounted cash flow is sufficient to absorb the depreciation or amortization of long-lived assets in order to assess potential asset impairment. In the event of such operating income discounted cash flow is insufficient to recover the depreciation, the assets, or groups of assets, are written down to recoverable values, preferably based on the projected discounted cash flows of future operations.values. In the event of a planned substitution of assets prior to the end of the original estimated useful life of the asset, depreciation of such asset is accelerated to ensure that the asset is depreciated according to the estimated net realizable values at the estimateda future date of substitution.
Under U.S. GAAP, Statement of Financial Accounting Standard (“SFAS”("SFAS") No. 144, “Accounting"Accounting for the Impairment orof Disposal of Long-Lived Assets”Assets", requires companies to evaluateevaluation of the carrying value of long-lived assets to be held and used, and for long-lived assets to be disposed off, when events andof, one of the changes in circumstances require such a review.stated in paragraph 8 of SFAS 144 occurs. The carrying value of long-lived assets is considered impaired when the anticipated undiscounted cash flow from identified asset groups, representing the lowest level for which identifiable cash flow are largely independent of the cash flows of other groups of assets, is less than their carrying value. In that event, a loss is recognized based on the amount by which the carrying value exceeds the fair market value of the assets or discounted cash flows generated by the assets.
There is no impairment recorded for U.S. GAAP purposes as of December 31, 2007 and 2006.
F-95
| Braskem S.A. and Its Subsidiaries |
| Notes to the Consolidated Financial Statements |
| at December 31, 2007, 2006 and 2005 |
| All amounts in millions of reais, unless otherwise indicated |
(d) Deferred charges and other intangible assets
Brazilian GAAP permits deferral of expenses, major overhaul costs, pre-operating expenses incurred in the construction or expansion of a facility before the facility begins operations, research and development expenditure and other items listed in Note 14.
13.
For purposes of the U.S. GAAP reconciliation, only costs relative to major overhauls meet the conditions established for deferral and, accordingly, all other Brazilian GAAP deferred costs, other than those reclassified to property, plant and equipment, and goodwill generated on common control transactions, which is eliminated, have been charged off to income.
For purposes of the U.S. GAAP reconciliation, deferredincome, including related annual amortization charges adjustments, netthat have been reverted under U.S. GAAP amounted toin the net amount of R$ 80.0,122.6, R$ 7.534.5 and R$ (78.9)82.1 in 2004, 20032007, 2006 and 2002,2005, respectively.
Under U.S. GAAP research and development costs are expensed as incurred and recorded in the statement of operations within general and administrative expense. Expenditure on research and development totaled R$ 59.2, R$ 35.5 and R$ 20.1, for the years ended December 31, 2004, 2003 and 2002, respectively.
BRASKEM S.A. AND ITS SUBSIDIARIES
NOTES TO THE CONSOLIDATED AND COMBINED FINANCIAL STATEMENTS—(Continued)
at December 31, 2004, 2003 and 2002
All amounts in millions of reais, unless otherwise indicated
AThe reconciliation of the net adjustments to net income for all three years presented is set forth in the following table:
| 2007 | 2006 | 2005 | ||||
| Charges written-down for those expenses | ||||||
| deferred under Brazilian GAAP, including | ||||||
| equity investees | ||||||
| Pre-operating expenses | (1.0) | |||||
| Organizational expenses | (6.1) | (35.2) | (33.7) | |||
| Expenditures on restructuring | (1.7) | (6.7) | (4.3) | |||
| Research and development | (0.8) | - | (0.7) | |||
| Other | (5.4) | (25.5) | ||||
| (14.0) | (67.4) | (39.7) | ||||
| Reversal of amortization of amounts assigned | ||||||
| to deferred charges under Brazilian GAAP, | ||||||
| including equity investees | ||||||
| Pre-operating expenses | 32.0 | 4.2 | 6.4 | |||
| Organizational expenses | 25.2 | 54.1 | 67.1 | |||
| Expenditures on restructuring | 54.6 | 35.7 | 43.4 | |||
| Research and development | 19.5 | 6.3 | 4.2 | |||
| Other | 5.3 | 1.6 | 0.7 | |||
| 136.6 | 101.9 | 121.8 | ||||
| 122.6 | 34.5 | 82.1 | ||||
F-96
| 2004 | 2003 | 2002 | |||||||
Expense of deferred charges under U.S. GAAP | |||||||||
Pre-operating expenses | (13.6 | ) | (0.2 | ) | (45.2 | ) | |||
Organization and implementation expenses | (116.3 | ) | (29.9 | ) | (5.1 | ) | |||
Expenditures for structured operations | (86.8 | ) | (33.3 | ) | (61.2 | ) | |||
Research and development | (13.1 | ) | (0.1 | ) | (11.6 | ) | |||
Other | (6.6 | ) | (6.6 | ) | (26.6 | ) | |||
| (236.4 | ) | (70.1 | ) | (149.7 | ) | ||||
Reversal of amortization of deferred charges under Brazilian GAAP | |||||||||
Pre-operating expenses | 44.7 | 12.9 | 23.8 | ||||||
Organization and implementation expenses | 11.4 | 20.8 | 14.4 | ||||||
Expenditures for structured operations | 33.8 | 10.3 | 22.1 | ||||||
Research and development | 6.0 | 8.6 | 9.1 | ||||||
Goodwill(i) | 222.9 | 5.1 | — | ||||||
Other | (2.4 | ) | 19.9 | 1.4 | |||||
| 316.4 | 77.6 | 70.8 | |||||||
| 80.0 | 7.5 | (78.9 | ) | ||||||
| Notes to the Consolidated Financial Statements |
| at December 31, 2007, 2006 and 2005 |
| All amounts in millions of reais, unless otherwise indicated |
Under U.S. GAAP all research and development costs are expensed as incurred and recorded in the statement of operations within general and administrative expense whereas certain of such costs are capitalized deferred charges under Brazilian GAAP. Expenditure on research and development totaled R$ 76.5, R$ 44.3 and R$ 47.2 for the years ended December 31, 2007, 2006 and 2005, respectively.
(e) Business combinations, purchase price allocation and goodwill
As mentioned in Note 1(c), the Company acquired, through its agent "Ultrapar", 60.0% of the common and total shares of Ipiranga Química and Ipiranga Petroquímica and related investment in Copesul - known as "Petrochemical Assets" under the "Share Purchase Agreement" signed among Braskem, Petrobras and Ultrapar on March 18, 2007 for which the effective date of acquisition is April 18, 2007, for which a Form F-4 has been filed by Ultrapar in the U.S. Securities and Exchange Commission - SEC following rules applicable to such relevant business combination.
Additionally, minority interests were subsequently purchased during the year, for which the purchase accounting method was applied. The total purchase price for the acquisition of Ipiranga (Química e Petroquímica) and Copesul, without any contingent consideration on its computation, amounted to approximately R$ 2.4 billion, as demonstrated herein.
On May 14, 2008, Braskem publicly announced an amendment made to the "Share Purchase Agreement" by assembling clauses increasing the participation of Braskem in net assets of Ipiranga, Copesul as well as Petroquímica Paulínia to 100%, by issuing additional shares to Petrobras, as a result of the incorporation of the remaining minorities interest held by Petrobras in such investees as of December 31, 2007, known as "Petrobras Petrochemical Asstes", within Brazilian Petrochemical industry restructuring.
The acquisition of such additional shares occurred as of May 30, 2008 and the incorporation of such companies into Braskem operations are expected to be concluded during the second semester of 2008.
F-97
| Braskem S.A. and Its Subsidiaries |
| Notes to the Consolidated Financial Statements |
| at December 31, 2007, 2006 and 2005 |
| All amounts in millions of reais, unless otherwise indicated |
(i) Purchase Price Allocation
Under Brazilian GAAP, goodwill arises fromthe Ipiranga transaction, resulting in the acquisition of an effective 60% participation in IQ and IPQ held via Ultrapar, was accounted for under historical cost, with the difference between the amountconsideration paid and the Brazilian GAAPhistorical book value (normally alsobeing recorded as goodwill. This resulted in the tax basis)consolidation of IQ, IPQ and Copesul as from April 2007.
Under USGAAP, although we did not obtain legal ownership of the net assets acquired. Goodwill is generally justified onIQ and IPQ shares, however, we concluded that IQ, IPQ and Copesul are VIEs in accordance with FIN 46R, and through the difference betweenUltrapar agency agreement we concluded that we had the book value and the market value of assets acquired and/or based on expectation of future profitability and is amortized over the remaining useful livesmajority of the assets or up to 10 years, respectively. Negative goodwill arisesrisks and benefits of those entities. Therefore, under Brazilian GAAP when the book value of assets acquired exceeds the purchase consideration. Negative goodwill is amortized over 10 years. Goodwill in a subsidiary subsequently merged into its parent is reclassified to deferred charges, or property, plant and equipment.
Under U.S. GAAP fair values are assigned to acquired assetswe also, consolidated IQ, IPQ and liabilities in business combinations, including intangible assets. The residualCopesul uner FIN46R, as from the date of consideration paid overthe agreement, April 18, 2007, using the fair value of the assets and liabilities is recorded as goodwill. Upon the adoptionacquired.
The allocation of SFAS No. 142, “Goodwill and Other Intangible Assets”, as from January 1, 2002 goodwill is no longer amortized but is instead assigned to an entity’s reporting units and tested for impairment at least annually. Goodwill is not recorded on transactions between partiespurchase price under common control; instead the difference between consideration and book valueU.S. GAAP was:
| Company | % acquired | In R$ millions | ||
| Ipiranga Química S.A. | 60.0 | 121.0 | ||
| Ipiranga Petroquímica S.A. | 60.0 | 562.8 | ||
| Copesul | 17.68 | 866.7 | ||
| Total | 1,550.5 | |||
F-98
| Braskem S.A. and Its Subsidiaries |
| Notes to the Consolidated Financial Statements |
| at December 31, 2007, 2006 and 2005 |
| All amounts in millions of reais, unless otherwise indicated |
The fair values of the nettotal assets less liabilities of the companies acquired were as follows:
| IQ | IPQ | Copesul | ||||
| Cash and cash equivalents | 7.5 | 24.1 | 239.6 | |||
| Other current assets | 104.9 | 754.7 | 1,267.1 | |||
| Long-term assets | 83.6 | 673.5 | 3,520.9 | |||
| Current liabilities | (18.6) | (910.9) | (828.4) | |||
| Long-term liabilities | (90.1) | (569.6) | (303.9) | |||
| Fair value of net assets | 87.3 | (28.2) | 3,895.3 | |||
| Pre-existing book value (1) | 436.7 | |||||
| Fair value of the consideration paid | 121.0 | 562.8 | 866.7 | |||
| Fair value of non-controlling interest | 80.6 | 375.2 | 2,591.9 | |||
| Goodwill | 114.3 | 966.2 |
(1) We previously held a 29,19% interest in Copesul, which was accounted under the equity method under Brazilian and U.S. GAAP.
As part of the acquisition, the Company also acquired long term customers contracts, which are intangible assets of definite useful life. The acquisition cost at April 18, 2007 amounted to R$172.0 and the expected residual value at the end of those contracts is recordedzero. The weighted average useful life of those contracts are twelve years.
In the related acquisition of 60% in IQ and IPQ, indirectly Braskem has acquired also an additional participation of 17.68% from Copesul according the previous participation from IPQ in Copesul of 29.46% .
In the last quarter of 2007, Copesul repurchased all minority interests other than those relating to Petrobras for R$1,417.7 million and issued debt in the same amount. This resulted in an increase of 15.56% in our Copesul participation which was accounted for as a capital distribution or contribution. Understep acquisition under U.S. GAAP,GAAP. After this transaction our participation in Copesul was 62.7% and remaining minorities, representing a 37.3% participation held by Petrobras, was outstanding. This transaction resulted in the elimination of 46.97% of the total minorities of Copesul previously outstanding, in the amount of R$ 1,269.0 and generated goodwill generated after July 1, 2001 is not being amortized in 2001 and no goodwill amortization is recorded as from 2002. The differencesof R$ 148.7.
F-99
| Braskem S.A. and Its Subsidiaries |
| Notes to the Consolidated Financial Statements |
| at December 31, 2007, 2006 and 2005 |
| All amounts in millions of reais, unless otherwise indicated |
(ii) Goodwill
Differences in relation to Brazilian GAAP arise principallyhave mainly arisen from (i) non-recognition of goodwill arising from transactions between parties under common control under U.S. GAAP (note 29(g)(Note 31(g)); (ii) valuation of assets and liabilities acquired at their fair
BRASKEM S.A. AND ITS SUBSIDIARIES
NOTES TO THE CONSOLIDATED AND COMBINED FINANCIAL STATEMENTS—(Continued)
at December 31, 2004, 2003 and 2002
All amounts in millions of reais, unless otherwise indicated
value at the date of acquisition; and (iii) difference between goodwill calculatedacquisition, aforementioned, generating a reduction in the statement of operations under U.S. GAAP by the amortization derived from the fair value accounting method; and (iii) reversal of Brazilian GAAP amortization expense related to the goodwill, for which under U.S. GAAP a impairment test is required annually instead of amortization.
| 2007 | 2006 | |||
| US GAAP business combination accounting (*) | 229.3 | 262.9 | ||
| Reversal of Brazilian GAAP goodwill amortization(**) | 401.7 | 28.7 | ||
| Net adjustment to the shareholders’ equity | 631.0 | 291.6 | ||
(*) It includes recurring adjustments for the differences described above - Note 31(g) as well as fair value adjustments for net assets acquired up to December 31, 2007 net of accumulated depreciation and amortization.
(**) It includes differences in Brazilian GAAP.
TheseGAAP goodwill balances, can be summarized as follows:
| 2004 | 2003 | |||||
Fair value adjustments | (829.5 | ) | (818.2 | ) | ||
Difference on goodwill with third parties | 515.9 | 345.0 | ||||
Total | (313.6 | ) | (473.2 | ) | ||
net of accumulated amortization of goodwill and net of negative goodwill.
For Brazilian GAAP purposes, the balance of goodwill at December 31, 2004 was2007 amounts to R$ 1,819.9 (2003—2,404.8 (2006 - R$ 1,912.7)820.2), which is being amortized to income over a period of up to 10 years for items reclassified to deferred charges, or the remaining useful lives of the underlying assets, for the items reclassified to property, plant and equipment. Negative goodwill at December 31, 2004 was2007 amounts to R$ 94.1 (2003—25.2 (2006 - R$ 69.2)30.4) .
Under U.S. GAAP, the net balancechanges on goodwill balances totaling R$ 1,688.6 as of goodwill at December 31, 2004 was R$ 829.5 (2003—R$ 818.2). 2007 are as follows:
F-100
| Braskem S.A. and Its Subsidiaries |
| Notes to the Consolidated Financial Statements |
| at December 31, 2007, 2006 and 2005 |
| All amounts in millions of reais, unless otherwise indicated |
| Petrochemicals | Business | Ipiranga | ||||||||||||
| Polyolefins | Vinyls | Development | Others | Química | Petroquímica | Copesul | ||||||||
| December 31, 2006 | 416.9 | 3.0 | 17.4 | 13.2 | ||||||||||
| Business combination | - | - | - | 9.0 | 114.3 | 966.2 | 148.7 | |||||||
| Impairment | - | - | - | |||||||||||
| December 31, 2007 | 416.9 | 3.0 | 17.4 | 22.2 | 114.3 | 966.2 | 148.7 | |||||||
For purposes of U.S. GAAP reconciliation, goodwill and negative goodwill amortization under Brazilian GAAP have been reversed and amounted to R$ 152.7106.2 in 2004,2007, R$ 256.057.8 in 20032006 and R$ 294.4152.5 in 2002.2005.
(iii) Impairment of goodwill and intangibles for business combinations
For purposes of U.S. GAAP, goodwill impairment is determined using a two-step process. The first step of the goodwill impairment test is to identify a potential impairment by comparing the fair value of a reporting unit with its carrying amount, including goodwill. The estimates of fair value of a reporting unit, are determined using a discounted cash flow analysis. A discounted cash flow analysis requires one to make various judgmental assumptions including assumptions about future cash flows, growth rates and discount rates. The assumptions about future cash flows and growth rates are based on the Company's budget and business plans. Discount rate assumptions are based on an assessment of the risk inherent in the respective reporting units. If the carrying amount of a reporting unit exceeds its fair value, the second step of the goodwill impairment test is performed to measure the amount of impairment loss, if any.
F-101
| Notes to the Consolidated Financial Statements |
| at December 31, 2007, 2006 and 2005 |
| All amounts in millions of reais, unless otherwise indicated |
The second step of the goodwill impairment test compares the implied fair value of the reporting unit's goodwill with the carrying amount of that goodwill. If the carrying amount of the reporting unit's goodwill exceeds the implied fair value of that goodwill, an impairment loss is recognized in an amount equal to that excess. The implied fair value of goodwill is determined in the same manner as the amount of goodwill recognized in a business combination.
Under Brazilian GAAP, goodwill is analyzed in relation to its future recovery based on total estimated future profitability and discounted cash flows. No impairment has been recorded for Brazilian GAAP purposes.
The Company has been testing for impairment on goodwill balances for which no balances should have been impaired for the year-ended as of December 31, 2007 and 2006.
The Company performed its annual impairment review for goodwill and recorded a charge for purposes of reconciliation of R$ 373.8 at December 31, 2005 within Operating Income in the condensed consolidated statement of operations. This impairment charge reflects the impact of the decrease in market conditions of its investment in Politeno.
(f) Equity earnings for interests in investees and respectively U.S. GAAP adjustments on equity investees
Under BR GAAP the equity investees Norcell, Cetrel, Copesul, Petroflex and CodeverdePetroquímica Paulínia are proportionally consolidated according to Instruction CVM Instruction 247/96. Under U.S. GAAP such equity investees are accounted for under the equity method.
For purposes of the U.S. GAAP reconciliation, the effects in the statement of operations of U.S. GAAP adjustments on equity investees amounted to R$ (92.2)(5.8), R$ (44.8)(56.8) and R$ 37.6(46.5) in 2004, 20032007, 2006 and 2002,2005, respectively.
In addition, due to the adoption of SFAS no. 158 "Employers' Accounting for Defined Benefit Pension and Other Postretirement Plans - an Amendment of FASB Statements No. 87, 88, 106, and 132(R)" (Note 31(i)), the Company recognized the effects from its investees Petroflex and Copesul through comprehensive income, in the amount of R$ 10.9 and R$ 2.1, respectively, as of December 31, 2006.
F-102
| Notes to |
| at December 31, 2007, 2006 and |
| All amounts in millions of reais, unless otherwise indicated |
(g) Transactions giving rise to distributions
to and contribution from shareholders
according to U.S. GAAP
Transactions between parties under common control gave raise to goodwill under Brazilian GAAP which is treated as capital distributions and contributions under U.S. GAAP:
| 2007 | 2006 | |||
| Acquisition of ESAE and related transactions (i) | (363.2) | (363.2) | ||
| OPP PP transaction (ii) | (1,814.6) | (1,814.6) | ||
| Contributions from shareholders (iii) | 406.5 | 406.5 | ||
| (1,771.3) | (1,771.3) | |||
| 2004 | 2003 | |||||
Acquisition of ESAE and related transactions | (363.2 | ) | (363.2 | ) | ||
OPP PP transaction | (1,814.6 | ) | (1,814.6 | ) | ||
Contributions from shareholders | 400.6 | 15.0 | ||||
Total | (1,777.2 | ) | (2,162.6 | ) | ||
(i) Acquisition of ESAE and Related Transactions (Note 1(b))
Under Brazilian GAAP, the acquisition of ESAE was accounted for at book value. Under U.S. GAAP, the acquisition would be accounted for using the purchase method with the assets acquired and the liabilities assumed from third parties recorded at fair value. The portions of net assets that were already held by the Odebrecht Group would be maintained at their existing book values, and the excess of the proportional amount of the purchase price over these book values would be considered a distribution to the Odebrecht Group in the amount of R$363.2.
| Purchase | Value of | Capital | ||||||
| Investment acquired | price | investments | Goodwill | distribution | ||||
| 30.99% of Politeno | 739.4 | 141.9 | 373.8 | 223.7 | ||||
| 42.64% of Polialden | 658.4 | 157.3 | 387.8 | 113.3 | ||||
| Subtotal (100% - Braskem Participações) | 1,397.8 | 299.2 | 761.6 | 337.0 | ||||
| 100% of Proppet | 51.1 | 10.6 | 14.3 | 26.2 | ||||
| 1,448.9 | 309.8 | 775.9 | 363.2 | |||||
F-103
BRASKEM S.A. AND ITS SUBSIDIARIESTable of Contents
NOTES TO THE CONSOLIDATED AND COMBINED FINANCIAL STATEMENTS—(Continued)
at December 31, 2004, 2003 and 2002
All amounts in millions of reais, unless otherwise indicated
Under U.S. GAAP, the acquisition of ESAE and related transactions were accounted for as follows:
Investment Acquired | Purchase Price | Value of Investments | Goodwill | Capital Distribution | ||||
30.99% of Politeno | 739.4 | 141.9 | 373.8 | 223.7 | ||||
42.64% of Polialden | 658.4 | 157.3 | 387.8 | 113.3 | ||||
Subtotal (100% of Conepar) | 1,397.8 | 299.2 | 761.6 | 337.0 | ||||
100% of Proppet | 51.1 | 10.6 | 14.3 | 26.2 | ||||
| 1,448.9 | 309.8 | 775.9 | 363.2 | |||||
| Braskem S.A. and Its Subsidiaries |
| Notes to the Consolidated Financial Statements |
| at December 31, 2007, 2006 and 2005 |
| All amounts in millions of reais, unless otherwise indicated |
Under U.S. GAAP, the total payment of R$ 1,448.9 made in the acquisition of ESAE and related transactions is divided into payments made to third parties and payments made to companies under common control are as follows:
| Common control transactions | Third party transactions | ||||||||||||
| Payment made | Book value | Capital distribution | Purchase price | Fair value of net assets | Goodwill | ||||||||
100% of Conepar | 381.0 | 44.1 | 336.9 | 1,016.7 | 255.1 | 761.6 | |||||||
100% of Proppet | 39.1 | 12.8 | 26.4 | 12.0 | (2.3 | ) | 14.3 | ||||||
| 420.2 | 56.9 | 363.2 | 1,028.7 | 252.8 | 775.9 | ||||||||
| Common control transactions | Third party transactions | |||||||||||
| Payment | Capital | Purchase | Net assets | |||||||||
| made | Book value | distribution | price | at fair value | Goodwill | |||||||
| 100% Braskem Part. | 381.1 | 44.1 | 337.0 | 1,016.7 | 255.1 | 761.6 | ||||||
| 100% Proppet | 39.1 | 12.8 | 26.2 | 12.0 | (2.3) | 14.3 | ||||||
| Total | 420.2 | 56.9 | 363.2 | 1,028.7 | 252.8 | 775.9 | ||||||
Nova Camaçari acquired ConeparBraskem Participações through the acquisition of the entire share capital of ESAE and Intercapital and the acquisition of an 11.76% direct interest in Conepar. Nova Camaçari acquired Intercapital for total consideration of R$ 445.0, of which R$ 381.0 was paid to members of the Odebrecht Group and the remaining R$ 64.0 was paid to members of the Mariani Group (Pronor Petroquímica S.A. and Companhia Brasileira de Poliolefinas). The net assets acquired from the Odebrecht Group were valued at a carryover basis of R$ 12.8, while the net assets acquired from the Mariani Group were valued at fair value of R$ 16.1.
(ii) OPP PPPreferred Shares Transaction (Note 1(b))
Under Brazilian GAAP, since the terms of the exchange of Braskem and OPP PPpreferred shares were based on the appraised economic value of each company, the transaction was accounted for on that basis.
Under U.S. GAAP, the common control transaction would be recorded at the book value of OPP PP’sPP's consolidated net assets as of July 25, 2001. On that date the difference between consideration paid and the net liabilities of OPP PP under U.S. GAAP was R$1,814.6 and the issuance of Braskem shares to the Odebrecht Group would, therefore, be considered a distribution in that amount.
The fair value of the stock issued by the Company for the acquisition of OPP PP was R$ 1,268.4 on August 16, 2002. At that time OPP PP had a negative carryover book basis of R$ 546.2 under U.S. GAAP, resulting in a capital distribution of R$ 1,814.6 under U.S. GAAP. The Company adjusted the Brazilian GAAP shareholders’shareholders' equity to reflect the U.S. GAAP capital distribution of R$ 1,814.6 and made corresponding adjustments to deferred charges, property, plant and equipment and goodwill recorded in investments.
F-104
| Braskem S.A. and Its Subsidiaries |
| Notes to the Consolidated Financial Statements |
| at December 31, 2007, 2006 and 2005 |
| All amounts in millions of reais, unless otherwise indicated |
At December 31, 2004,2007, the residual balances within deferred charges of R$ 593.1268.9 (2006 - R$ 395.1) was represented by cost of R$ 834.7994.3 and accumulated amortization of R$ 241.6.
BRASKEM S.A. AND ITS SUBSIDIARIES
NOTES TO THE CONSOLIDATED AND COMBINED FINANCIAL STATEMENTS—(Continued)
at December 31, 2004, 2003 and 2002
All amounts in millions of reais, unless otherwise indicated
(iii) Contributions from shareholders
Under Brazilian GAAP, the acquisition of 46.4% of minority interests of Trikem, as described in Note 1(b(vii)), was undertaken through exchange of shares, and accounted for on that basis. Under U.S. GAAP, the difference between the book and the fair value of the shares issued was recorded as additional paid in capital. Accordingly, during 2004, this transaction generated a contribution from shareholders amounting to R$339.4
339.4.
Also, during 2004, the Company acquired minority interests of Polialden utilizing shares held in treasury, as described in Note 1(b(ix)).treasury. Under U.S. GAAP, the difference between the book value and the market value of the shares amounting to R$46.5 was recorded as additional paid in capital.
As mentioned in Note 1 (vii), the Company acquired minority interests representing 32.6% of the total share capital of Polialden, by the issuance of 7,878,725 class A preferred shares. Under Brazilian GAAP, the Class A preferred shares were issued based upon the book value. Under U.S. GAAP, the difference raised between the book and the fair-value of these shares issued was recorded as an additional paid in capital. This transaction generated a contribution to shareholders amounting to R$ 5.9 at that time.
(h) Guarantees |
The fair value of guarantees is initially determined by consideration of data in observable markets and comparable transactions and the utilization ofby using probability-weighted discounted net cash flow models. The fair value of guarantees issued or modified since the company’s adoption of FASB Interpretation No. 45 on January 1, 2003 was not material.
The Company has directly guaranteedendorsed debt obligations under financing agreements withof third parties related to an equity affiliate.affiliates. At December 31, 2004,2007, the Company had directly guaranteedendorsed guarantees on financing agreements of the affiliate entities, Petroflex and Petroquímica Paulínia for R$ 12.3 relating to guarantees of certain obligations8.6 (2006 - R$ 6.4) and liabilities of Petroflex Indústria e Comércio S.A.R$ 339.7 (2006 - R$ 339.7), respectively. This represents the maximum potential amount of future (undiscounted) payments that the companyCompany could be required to make under the guarantees. In addition the Company has some commitments regarding purchase agreements as stated in the Note 29.
TheChanges that occurred in fair value of the guarantees that have been issued or modifiedsuch collaterals since the company’s adoptionimplementation of FASB Interpretation No. 45, onas of January 1, 2003, is not material. are considered to be immaterial.
F-105
| Braskem S.A. and Its Subsidiaries |
| Notes to the Consolidated Financial Statements |
| at December 31, 2007, 2006 and 2005 |
| All amounts in millions of reais, unless otherwise indicated |
As of December 31, 2004, the2007, recognition of liabilities recorded for these obligations were not material.are neither required nor contingent.
| (i) Pension plan |
In determining the pension and other post-retirement benefit obligations for Brazilian GAAP purposes, Brazilian Accounting Standard NPC 26 is effective for financial statements beginning with the year ended December 31, 2001. As permitted by NPC 26, the transitional obligation, which is the difference between a plan’splan's net assets and the projected benefit obligation at that date, was fully recognized as a direct charge to retained earnings. After January, 2002 under U.S. GAAP, SFAS No. 87, “Employer’s"Employer's Accounting for Pensions”Pensions", is effective for fiscal years beginning after 1988. As from such date, when an initial transition obligation determined based on an actuarial valuation is recognized, actuarial gains and losses, as well as unexpected variations in plan assets and the projected benefit obligation and the effects of amendments, settlements and other events, would be recorded in accordance with these standards and therefore result in deferral differences. Through 1997, these amounts were treated as non-monetary and were indexed for inflation. U.S. GAAP also requires recognition of an additional minimum liability.
Unrecognized actuarial gains and losses are amortized either over the estimated future service period of employees or over the estimated remaining period until the plan final settlement, whichever the less.
Although the calculation of the sufficiency funded status ishas been the same since December 31, 2001, differences arise on (i) actuarial gains and losses as there is initially no actuarial gain or loss atas of December 31, 2001, (ii) recognition of the initial transition obligation and (iii) the minimum liability under U.S. GAAP.
Based onSFAS No. 158 "Employers' Accounting for Defined Benefit Pension and Other Postretirement Plans - an Amendment of FASB Statements No. 87, 88, 106, and 132(R)"requires an employer to recognize the reportoverfunded or underfunded status of a defined benefit pension and post-retirement plan (other than a multiemployer plan) as an asset or liability in its statement of financial position and to recognize changes in that funded status in the year in which the changes occur through comprehensive income of a business entity or changes in unrestricted net assets of a not-for-profit organization. SFAS 158 also requires an employer to measure the funded status of a plan as of the Company’s independent actuaries,date of its year-end statement of financial position, with limited exceptions. We are required to initially recognize the funded status of our defined benefit pension and post-retirement plans and to provide the required disclosures as of December 31, 2006. The requirement to measure plan assets and benefit obligations as of the date of the employer's fiscal year end statement of financial position is effective for us for our fiscal year ending December 31, 2008.
F-106
| Braskem S.A. and Its Subsidiaries |
| Notes to the Consolidated Financial Statements |
| at December 31, 2007, 2006 and 2005 |
| All amounts in millions of reais, unless otherwise indicated |
The summary of the sufficiency of funds and amounts recorded in the U.S. GAAP condensed balance sheet as at December 31, 20042007 and 2003 and2006 as well as at the condensed statement of
BRASKEM S.A. AND ITS SUBSIDIARIES
NOTES TO THE CONSOLIDATED AND COMBINED FINANCIAL STATEMENTS—(Continued)
at December 31, 2004, 2003 and 2002
All amounts in millions of reais, unless otherwise indicated
operations for 2004, 20032007, 2006 and 2002 for our2005 regarding pension obligations to retireesliabilities in accordance with SFAS No. 132, “Employer’s"Employer's Disclosures About Pensions and Other Post-Retirement Benefits”Benefits - revised", as amended,for Braskem, IQ, IPQ and Copesul are as follows:
Pension Accounting
| 2004 | 2003 | |||||
Change in benefit obligation | ||||||
Net projected benefit obligation at beginning of year | (305.2 | ) | (258.3 | ) | ||
Service cost | (7.5 | ) | (4.6 | ) | ||
Interest cost | (33.3 | ) | (14.1 | ) | ||
Actuarial loss | (11.5 | ) | (44.5 | ) | ||
Gross benefits paid | 21.3 | 16.3 | ||||
Net projected benefit obligation at end of year | (336.2 | ) | (305.2 | ) | ||
Accumulated benefit obligation at end of year | 324.7 | 295.8 | ||||
| 2007 | 2006 | ||||
| (i) Change in Projected Benefit Obligations - PBO | |||||
| Benefit obligation at the beginning of year | (459.4) | (415.5) | |||
| Service Cost | (8.1) | ||||
| Interest Cost | (81.9) | (46.9) | |||
| Actuarial (gain) loss | (124.7) | ||||
| Effects from business combination relating to consolidation | |||||
| of IQ, IPQ and Copesul | (551.8) | ||||
| Benefits paid | 65.1 | 3.0 | |||
| Projected Benefit Obligation at the end of year | (1,160.8) | (459.4) | |||
| (ii) | Change in plan assets | ||||
| Fair value of plan assets at the beginning of year | 406.5 | 360.1 | |||
| Gain on plan assets | 241.4 | 46.4 | |||
| Employer contribution | 9.9 | - | |||
| Employee contribution | - | - | |||
| Effects from business combination relating to | |||||
| consolidation of IQ, IPQ and Copesul | 554.9 | - | |||
| Benefits paid from plan assets | (64.2) | - | |||
| Fair value of plan assets at the end of year | 1,148.5 | 406.5 | |||
| (iii) | Funded status = (ii) - (i) | (12.4) | (52.8) | ||
| Prior service cost | 14.2 | - | |||
| Unrecognized actuarial loss (gain) | (12.7) | 4.3 | |||
| Accrued pension cost | (10.9) | (48.5) | |||
| Accrued pension cost | (10.9) | (48.5) | |||
| Accumulated other comprehensive income (loss) | (1.5) | (4.3) | |||
| Minimum pension liability | (12.4) | (52.8) | |||
As Braskem, as well as IQ, IPQ and Copesul, had already recognized the liability for the unfunded status, unrecognized loss has been accounted for as a debit to a separate account within shareholders' equity by the initial application of SFAS 158 which had neither impacted assets/liabilities nor shareholders' equity.
The measurement date forF-107
| Braskem S.A. and Its Subsidiaries |
| Notes to the Consolidated Financial Statements |
| at December 31, 2007, 2006 and 2005 |
| All amounts in millions of reais, unless otherwise indicated |
In addition, the pension plan was November 30, 2004.for which each company are entitled to participate is not considered to be a multi-employer plan.
| 2004 | �� | 2003 | ||||
Change in plan assets | ||||||
Fair value of plan assets at beginning of year | 235.2 | 214.2 | ||||
Actual return on plan assets | 66.6 | 30.6 | ||||
Employer contributions | 5.4 | 4.0 | ||||
Employee contributions | 3.6 | 2.7 | ||||
Gross benefits paid | (21.3 | ) | (16.3 | ) | ||
Fair value of plan assets at end of year | 289.5 | 235.2 | ||||
Prepaid pension cost | ||||||
Unfunded status at end of year | (46.7 | ) | (70.0 | ) | ||
Unrecognized net actuarial gain | 84.5 | 124.1 | ||||
Prepaid pension cost | 37.8 | 54.1 | ||||
Additional minimum pension liability | ||||||
Prepaid pension cost | 37.8 | 59.6 | ||||
Additional amount recognized in shareholders equity | (73.0 | ) | (120.2 | ) | ||
Minimum pension liability | (35.2 | ) | (60.6 | ) | ||
| % | ||||
| 2004 | 2003 | |||
Weighted-average assumptions as of December 31 | ||||
Discount rate | 6.0 | 6.0 | ||
Expected return on plan assets | 6.0 | 6.0 | ||
Rate of compensation increase | 2.0 | 2.1 | ||
Projected annual inflation rate (added to the above percentages) | 5.0 | 5.0 | ||
BRASKEM S.A. AND ITS SUBSIDIARIES
NOTES TO THE CONSOLIDATED AND COMBINED FINANCIAL STATEMENTS—(Continued)
at December 31, 2004, 2003 and 2002
All amounts in millions of reais, unless otherwise indicated
The charge in thePension charges to income statement, of operations is comprisedknown as net periodic pension cost, may be expressed as follows:
| 2007 | 2006 | 2005 | |||||
| (iv) | Pension costs (gain) | ||||||
| Service cost | 8.1 | - | 3.7 | ||||
| Interest cost | 95.2 | 46.9 | 36.9 | ||||
| Expected return on plan assets | (80.3) | (40.7) | (29.9) | ||||
| Amortization of prior service cost | 2.0 | 52.2 | 22.4 | ||||
| Employee contributions | (4.6) | - | (2.0) | ||||
| Net periodic pension cost | 20.4 | 58.4 | 31.1 | ||||
| (v) | Actuarial assumptions | ||||||
| Discount rate for determining projected benefit obligations | 11.3 | 11.3 | 11.3 | ||||
| Expected long-term rate of return on plan assets | 11.3 | 11.3 | 11.3 | ||||
| Rate of compensation increase | 0.0 | 0.0 | 0.0 | ||||
| Projected annual inflation rate (included in the above | |||||||
| percentages) | 5.0 | 5.0 | 5.0 | ||||
In June 2005, the Company communicated to its employees the permanent suspension of the Braskem defined benefit plan effective on June 30, 2005. As a result, the Company recorded a curtailment gain of R$ 11.5 which was recorded as a reduction of the unrecognized actuarial losses. Settlement requires approval of the Secretariat for Complementary Pension and unrecognized actuarial losses are being amortized since July 2005, over the expected period to final approval which is shorter than the remaining service life of the active employees.
| 2004 | 2003 | 2002 | |||||||
Components of net periodic benefit cost (credit) | |||||||||
Service cost | 7.5 | 4.6 | 5.1 | ||||||
Interest cost | 33.3 | 14.1 | 13.7 | ||||||
Expected return on assets | (25.9 | ) | (11.5 | ) | (10.1 | ) | |||
Amortization of: | |||||||||
Transition obligation | 5.1 | (2.6 | ) | (2.6 | ) | ||||
Employee contributions | (3.6 | ) | (2.7 | ) | (3.7 | ) | |||
Total net periodic benefit cost (credit) | 16.4 | 1.9 | 2.4 | ||||||
F-108
| Braskem S.A. and Its Subsidiaries | ||||
| Notes to the Consolidated Financial Statements | ||||
at December 31, 2007, 2006 and 2005 | ||||
| All amounts in millions of reais, unless otherwise indicated | ||||
| ||||
| ||||
| ||||
| ||||
| ||||
Plan assets
BecauseThe weighted-average assets, as percentages of total assets, for these plans as of December 31, 2007 are as follows:
| Range of allocation in - % | ||||
| 2007 | 2006 | |||
| Fixed income securities | 55.0 to 74.0 | 55.0 to 74.0 | ||
| Equity securities | 20.0 to 30.0 | 20.0 to 30.0 | ||
| Loans | 3.0 to 6.0 | 3.0 to 6.0 | ||
| Real estate | 2.5 to 4.5 | 2.5 to 4.5 | ||
Defined contribution plan
For the year-ended as of December 31, 2007 contributions by the Company to this defined contribution plan have amounted to R$ 5.9 (2006 - R$ 7.8; 2005 - R$ 4.6) . The Company expects a continuing decrease in returns on fixed income investments, it has set new allocation targetsto contribute R$ 6.1 for 2005 based on reductions of either federal government securities or fixed income investments and increases in private securities.the year to be ended December 31, 2008.
Sponsor’s contributions in 2005 are estimated at R$ 6.1.
| (j) Earnings per share |
Under Brazilian GAAP, net income or loss per share is calculated based on the number of shares outstanding at the balance sheet date retroactively restated for the 20-for-one250 for one share reverse split in October 2003 (Note 20(a))March 2005 for all periods. Information is disclosed per lot of one thousand shares, because generally this is the minimum number of shares that can be traded on the Brazilian stock exchanges.
share.
Under U.S. GAAP, because the preferred and common shares have different voting and liquidation rights, basic and diluted earnings per share have been calculated using the “two-class”"two-class" method, pursuant to SFAS No. 128 “Earnings- Appendix C - paragraph 155, "Earnings per Share”Share", which provides computation, presentation and disclosure requirements for earnings per share.
The two-class method is an earnings allocation formula that determines earnings per share for preferred and common shares according to the dividends to be paid as required by the Company’sCompany's by-laws and participation rights in undistributed earnings.
F-109
| Braskem S.A. and Its Subsidiaries |
| Notes to the Consolidated Financial Statements |
| at December 31, 2007, 2006 and 2005 |
| All amounts in millions of reais, unless otherwise indicated |
Basic earnings per common share are computed by dividing net income by the weighted-average number of common and preferred shares outstanding during the year.
References earnings per share amounts have been restated to give retroactive effect, for all periods presented, to the May 2005 share reverse split transaction.
All type and classes of shares are equally entitled to receive a minimum dividend amount equal to 6% of its book value prevailing at the latest year-end financial statements.
On May 31, 2006 the shareholders of the Company approved the conversion of 2,632,043 class A preferred shares into common shares (Note 20(a)).
On May 31, 2006 the shareholders of the Company approved the conversion of 2,632,043 class A preferred shares into common shares and on April 2, 2007 the Company approved the conversion of 486,530 class A preferred shares into common shares (Note 20(a)). In accordance with EITF Topic No. D-42“The Effect on the Calculation of Earnings per Share for the Redemption or Induced Conversion of Preferred Stock” the amount of R$ 3.3 and R$ 8.6 was subtracted from net earnings available to common shareholders in the calculation of earnings per share for the year ended December 31, 2007 and 2006, respectively.
The table below presents the determination of U.S. GAAP net income available to common and preferred shareholders and weighted average common and preferred shares outstanding used to calculate basic and diluted earnings per share for each of the years presented under U.S. GAAP.
BRASKEM S.A. AND ITS SUBSIDIARIES
NOTES TO THE CONSOLIDATED AND COMBINED FINANCIAL STATEMENTS—(Continued)
at December 31, 2004, 2003 and 2002
All amounts in millions of reais, unless otherwise indicated
All references to the number of preferred and common shares and per share amounts have been restated to give retroactive effect to the May 2005 share reverse split (Note 28(b)) and the October 2003 share split (Note 20(a)) for all periods presented.
F-110
| December 31, 2004 | ||||||||
| Common Share | Class A Preferred Shares | Class B Preferred Shares | Total | |||||
Basic numerator—undiluted | ||||||||
Minimum 6% dividend | 68.2 | 135.5 | 0.5 | 204.2 | ||||
Undistributed earnings allocation | 228.7 | 454.9 | — | 683.6 | ||||
Total undistributed earnings | 296.9 | 590.4 | 0.5 | 887.8 | ||||
Weighted average number of outstanding shares—undiluted (millions) | 107.4 | 208.7 | 0.9 | 317.0 | ||||
Basic and diluted earnings per outstanding | 2.77 | 2.83 | 0.51 | |||||
| December 31, 2003 | ||||||||||
| Common Share | Class A Preferred Shares | Class B Preferred Shares | Total | |||||||
Basic numerator—undiluted | ||||||||||
Minimum 6% dividend | 42.0 | 70.9 | 0.4 | 113.3 | ||||||
Undistributed earnings allocation | 98.5 | 166.3 | — | 264.8 | ||||||
Total undistributed earnings | 140.5 | 237.2 | 0.4 | 378.1 | ||||||
Weighted average number of outstanding shares—undiluted (millions) | 99.9 | 173.1 | 0.9 | 273.9 | ||||||
Basic earnings per outstanding | 1.41 | 1.37 | 0.44 | |||||||
Effect of conversion of class B preferred shares to class A preferred shares | (0.00 | ) | (0.00 | ) | ||||||
Effect of conversion of debentures to class A preferred shares | (0.01 | ) | — | |||||||
Diluted earnings per outstanding | 1.40 | 1.37 | ||||||||
BRASKEM S.A. AND ITS SUBSIDIARIES
NOTES TO THE CONSOLIDATED AND COMBINED FINANCIAL STATEMENTS—(Continued)
at December 31, 2004, 2003 and 2002
All amounts in millionsTable of reais, unless otherwise indicatedContents
| Braskem S.A. and Its Subsidiaries | ||
| Notes to the Consolidated Financial Statements | ||
| at December 31, 2007, 2006 and 2005 | ||
| All amounts in millions of reais, unless otherwise indicated | ||
| December 31, 2007 | ||||||||
| Class A | Class B | |||||||
| Common | Preferred | Preferred | ||||||
| Share | Shares | Shares | Total | |||||
| Basic numerator – undiluted | ||||||||
| Minimum 6% dividend | 86.8 | 191.1 | 0.6 | 278.5 | ||||
| Induced conversion of Class A preferred shares into | 3.3 | 3.3 | ||||||
| Common shares (Note 20 (a)) | ||||||||
| Undistributed earnings allocation | 251.8 | 553.9 | 1.6 | 807.3 | ||||
| Total undistributed earnings | 338.6 | 748.3 | 2.2 | 1,089.1 | ||||
| Weighted average numbers of shares | ||||||||
| Basic | 122.4 | 269.3 | 0.8 | 392.5 | ||||
| Diluted | 132.3 | 294.5 | 426.8 | |||||
| Basic earnings per thousand outstanding shares – | ||||||||
| (whole reais) - R$ | 2.76 | 2.79 | 2.75 | |||||
| Effects of conversion | (0.08 ) | (0.11) | ||||||
| Diluted earnings per thousand shares – | ||||||||
| (whole reais) - R$ | 2.68 | 2.68 | ||||||
| December 31, 2006 | ||||||||
| Class A | Class B | |||||||
| Common | Preferred | Preferred | ||||||
| Share | Shares | Shares | Total | |||||
| Basic numerator – undiluted | ||||||||
| Minimum 6% dividend | 15.5 | 137.0 | 0.5 | 153.0 | ||||
| Induced conversion of Class A preferred shares into | ||||||||
| Common shares (Note 20 (a)) | - | 8.6 | - | 8.6 | ||||
| Total undistributed earnings | 15.5 | 145.6 | 0.5 | 161.6 | ||||
| Weighted average numbers of shares | ||||||||
| Basic and diluted | 122.4 | 248.3 | 0.8 | 371.5 | ||||
| Basic and diluted earnings per thousand outstanding | ||||||||
| shares – (whole reais) – R$ | 0.13 | 0.59 | 0.63 | |||||
F-111
| Notes to the Consolidated Financial Statements | ||
| |||
| reais, unless otherwise indicated | ||
| |||
| December 31, 2005 | ||||||||
| Class A | Class B | |||||||
| Common | Preferred | Preferred | ||||||
| Share | Shares | Shares | Total | |||||
| Basic numerator – undiluted | ||||||||
| Minimum 6% dividend | 68.2 | 135.6 | 0.5 | 204.3 | ||||
| Undistributed earnings allocation | 179.6 | 357.3 | - | 536.9 | ||||
| Total undistributed earnings | 247.8 | 492.9 | 0.5 | 741.2 | ||||
| Weighted average numbers of shares | ||||||||
| Basic | 120.9 | 240.4 | 0.8 | 362.1 | ||||
| Diluted | 142.1 | 290.0 | - | 432.1 | ||||
| Basic earnings per thousand outstanding shares – | ||||||||
| (whole reais) - R$ | 2.05 | 2.05 | 0.63 | |||||
| Effects of conversion | (0.10) | (0.10) | ||||||
| Diluted earnings per thousand shares – | ||||||||
| (whole reais) - R$ | 1.95 | 1.95 | ||||||
| (k) Comprehensive income |
Under Brazilian GAAP, the concept of comprehensive income is not recognized.
adopted.
Under U.S. GAAP, SFAS No. 130, “Reporting"Reporting Comprehensive Income”Income", requires the disclosure of comprehensive income. Comprehensive income is comprised ofby net income and other comprehensive income that includeincludes charges or credits directly to equity which are not the result of transactions with owners. For Braskem and its investees, the components of comprehensive income are itsrelated to the net income or loss and theadded/subtracted by changes in minimum pension liability (Note 29 (x(iii))31(x)(c)(iii)).
Under BR GAAP, costs ofincurred on issuance of equity securities areissued through December 31, 2005, were accounted as deferred charges in the balance sheet.
As required by CVM “Ofício-Circular” 01/2006, the costs of issuance of equity securities issued as from 2006, will be accounted as non recurrent expenses in the operational results. No capital issuance costs were incurred in 2005, 2006 and 2007.
Under U.S. GAAP, according to SEC Accounting Bulletin Topic 5— “Miscellaneous Accounting”, specific incremental costs directly attributable to a proposed or actualpublic stock offering of securities may properly be deferred and chargednetted off against the gross proceeds ofcapital issued. For the offering. Atyear ended December 31, 2004, the Company had incurred in R$58.1 million of capital issuance costs, charged against the gross proceeds of the offering.offering by decreasing shareholders' equity at that time in the same amount. As of December 31, 2007 the remaining balance, net of amortization, to be adjusted for U.S. GAAP purposes, in shareholders' equity, amounts to R$ 40.7 (2006 - R$46.5).
F-112
| Braskem S.A. and Its Subsidiaries |
| Notes to the Consolidated Financial Statements |
| at December 31, 2007, 2006 and 2005 |
| All amounts in millions of reais, unless otherwise indicated |
(m) Income taxes
Under Brazilian GAAP, according to CVM Deliberation 273/98 and CVM Instruction 371/02, the deferred income tax asset represents the estimated amount to be recovered.
In addition, under Brazilian GAAP no deferred tax asset is recognized relating to temporary timing differences or income tax losses which are expected to be realized after a period of ten years from the balance sheet date.
Under U.S. GAAP, deferred taxes are accrued on all temporary tax differences. Deferred tax assets and liabilities are classified as current or long-term based on the classification of the asset or liability underlying the temporary difference. Deferred income
According to SFAS 109, Brazilian nominal rate is applied for U.S. GAAP reporting purposes, however there is no limit to the period in which irrevocable tax assetscredits may be realized and liabilitiesthe valuation allowance recognition for Brazilian GAAP purposes at December 31, 2007 in the same tax jurisdictionamount of R$ 2.8 (2006 - R$ 11.9) has been reversed for U.S. GAAP purposes.
The adjustment for deferred taxes are netted rather than presented gross.
For purposes ofdisclosed in the U.S. GAAP reconciliation the adjustment for deferred taxes relates to the U.S. GAAP adjustments. Additional income tax (charges) in the reconciliation benefits relating to other U.S. GAAP adjustments were recognized in the statement of operations under U.S. GAAP in the amount of R$ 48.8,94.6, R$ (20.6)(123.2) and R$ 12.539.9 in 2004, 20032007, 2006 and 2002,2005, respectively.
There are neither accrued interests nor penalties during 2007 in the condensed statement of operations since it is more likely than not that Braskem and subsidiaries will not have any adjustment to its tax returns filed to various tax authorities.
Each year the company files income tax returns in the various national taxing jurisdictions in which it operates. These tax returns are subject to examination and possible challenge by the taxing authorities. Positions challenged by the taxing authorities may be settled or appealed by the company. With few exceptions, the Company and subsidiaries are no longer subject to Brazilian federal, state and local, nor non-Brazilian income tax examinations by various tax authorities for years before December 31, 2002.
Uncertainties in income taxes are recognized in the company's financial statements in accordance with SFAS No. 109, "Accounting for Income Taxes" (SFAS 109). In 2006, the FASB issued FASB Interpretation No. 48 - FIN 48, which clarifies the application of SFAS 109 by defining criteria that an individual income tax position must meet for any part of the benefit of that position to be recognized in an enterprise's financial statements and provides guidance on measurement, derecognition, classification, accounting for interest and penalties, accounting in interim periods, disclosure, and transition.
F-113
| Notes to the Consolidated Financial Statements |
| at December 31, 2007, 2006 and 2005 |
| All amounts in millions of reais, unless otherwise indicated |
In accordance with the transition provisions, the company adopted FIN 48 effective January 1, 2007, for which there are neither unrecognized tax benefits to be disclosed under this rule nor interests and penalties accounted for by the Company.
Interest and penalties raised on tax uncertain position are recognized within income statement whenever tax benefits are considered to be “more likely than not” realizable for settling/netting them under tax and accounting rules.
(n) Income tax incentives
Under Brazilian GAAP, the various tax incentives of the Company (in the form of tax reduction or exemption for defined periods) aremay be accounted for directly in aas capital reserve account in shareholders’within shareholders' equity.
BRASKEM S.A. AND ITS SUBSIDIARIES
NOTES TO THE CONSOLIDATED AND COMBINED FINANCIAL STATEMENTS—(Continued)
at December 31, 2004, 2003 and 2002
All amounts in millions of reais, unless otherwise indicated
For U.S. GAAP reconciliation purposes, the amount of those incentives has been credited to the statement of operations instead of to a capital reserve.reserve, in the amount of R$ 49.5, R$11.9 and R$52.0, in 2007, 2006 and 2005 respectively.
(o) Revenue recognition
Under Brazilian GAAP, it is acceptable to recordThe Company has been recognizing sales revenues either at the date of shipment or at the date thatwhenever the product is delivered to and accepted by the customer, although the prevalent practice under Brazilian GAAP is to record sales at the date of shipment. In 2003 Braskem changed the practice to the acceptance date, resulting in a reduction of R$ 3.9 in operating profit in 2003.
Under U.S. GAAP, and in accordance with SEC Staff Accounting Bulletin No. 101 and 104, sales are normally recorded when legal title passes to the buyer. In addition, multiple element service contracts are recognized only when certain conditions are met. Accordingly, for U.S. GAAP reconciliation purposes, the amount of sales shipped but not deliveredCompany has deferred the gain on multiple element contract with its investee Petroquímica Paulínia, amounting to R$ (18.1) at December 31, 2002 has been adjusted2006 (2005 - R$ 3.6), with no effect in the balance sheet at those dates, with corresponding effects on the results2007.
F-114
Table of each of the years presented.
Contents
| Notes to the Consolidated Financial Statements |
| at December 31, 2007, 2006 and 2005 |
| All amounts in millions of |
(p) Consolidation of variable interest entities
InUnder Brazilian GAAP, until the year ended 2003, in respect of the accounting treatment for the Braskem’sBraskem trade receivable securitization program, under Brazilian GAAP, the transfer of receivables to the fund iswas treated as a sale of receivables and the discount on the sale iswas immediately recorded in the statement of operations. In August 2004, CVM issued CVM Instruction 408 providing for the inclusion of Special Purpose Entities in the consolidated financial statement of publicly - held companies and therefore those entities have been consolidated in 2004 and 2005.
Under U.S. GAAP, SFAS 140 "Accounting for Transfers and Servicing of Financial Assets and Extinguishment of Liabilities" requires fair value accounting method on such assets transferred to special purposes entities, as well as consolidation of securitized financial assets in accordance with FASB Interpretation No. 46 “Consolidation"Consolidation of Variable Interest Entities (revised December 2003)”", trade receivable securitization fundsas follows:
| Parin Fund | SOL Fund | |||||||
| 2007 | 2006 | 2007 | 2006 | |||||
| Net assets | 458.4 | 537.9 | 258.8 | 395.2 | ||||
| Net income | (94.4) | 25.5 | 30.4 | 14.0 | ||||
In March 2006, the FASB issued SFAS 156, "Accounting for Servicing Financial Assets", which amends FASB Statements No. 140 "Accounting for Transfers and Servicing of Financial Assets and Extinguishments of Liabilities". This Statement resolves issues addressed in Statement 140 regarding recognition for all servicing financial asset or liability and its measurement methods. The Company did not have a significant impact on its financial position, results of operations or cash flows by the implementation of SFAS 156.
F-115
| Braskem S.A. and Its Subsidiaries |
| Notes to the Consolidated Financial Statements |
| at December 31, 2007, 2006 and 2005 |
| All amounts in millions of reais, unless otherwise indicated |
(q) Long-term share incentive plan
SFAS Statement 123 (R) "Share Based Payment", requires the measuring and recording of the cost of employee services in exchange for awards of equity instruments based on the fair value of those awards (with limited exceptions). Awards granted shall be classified as liability awards. That cost will be recognized over the period during which the employee is required to provide the service in exchange for the award. No compensation cost should be recognized for equity instruments for which employees do not render the requisite service. SFAS 123 (R) requires entities to initially measure the cost of employee services received in exchange for an award of liability instruments based on its current fair value. Changes in fair value during the requisite service period will be recognized as compensation cost over that period. The grant date fair value and the fair value of each reporting period of employee share options are variableestimated using the Black-Scholes option-pricing model. SFAS 123 (R) is effective as of the beginning of the first interim or annual reporting period that begins after June 15, 2005. As described in further details below, the Company has granted a long-term share incentive plan (the "Plan") to certain employees, which have acquired investment certificates at prices below market at the time of the issuance. The market value of the options granted will be recognized for U.S. GAAP purposes as expense over the period in which the services are rendered. The fair value of the options classified as liability award will be reassessed each reporting date. The award is classified as liabilities because the employees have the right to receive cash.
Braskem's Plan entitles officers and employees involved in strategic plans of the Company to buy investment certificates, up to pre-defined maximum quantities. The investment certificates bought by the participants are named alpha. The costs to employees of the certificates are equivalent to the average value of one Class A Preferred Share negotiated at Bovespa from the months of October through March of previous year to the purchase.
For each "alpha" acquired by participant, the Company grants one "beta" certificate, which is legally equal to that "alpha" purchased. In addition, each beneficiary of the plan is entitled to receive "gama" certificates in each year, corresponding to the dividends and interest entitiesin own capital paid by the Company to preferred shares. "Gama" certificates which were not collected by participant during each year are transformed into "alpha" certificates at the following year.
Alpha and gama certificates represent the right to receive the fair value of a Class A Preferred at vesting.
F-116
| Braskem S.A. and Its Subsidiaries |
| Notes to the Consolidated Financial Statements |
| at December 31, 2007, 2006 and 2005 |
| All amounts in millions of reais, unless otherwise indicated |
Braskem Board of Directors approved the maximum amount of 285,180 alpha certificates to be offered to participants. The certificates are generally offered to the participants in April of each year. Following the offer, the participants generally have 30 days to acquire via payment the certificates. Only certificates bought by the participants are considered granted once certificates offered and not paid do not generate any benefit to the participant. The amount deposited by the employees was initially recognized as a liability for both Brazilian and U.S. GAAP and totaled R$ 4.6 as of December 31, 2007 (2006 - R$ 1.7) .
Under Brazilian GAAP, liability is updated based on the average value of one Class A Preferred Share negotiated at Bovespa from the months of October through March, annually, and outstanding quantities of certificates.
According to the Plan, 20% of the balance of alpha and beta certificates vests after 5 years of continuous service and the remaining balance vests at the rate of 10% per year after the 6th year. After the 10th year, beta certificates not redeemed are transformed to alpha certificates and the employee has no further incentive for that grant. Gama certificates vests and are paid to the employees when dividends and interest on own capital is paid to the Company's shareholders. Gama certificate provide the employee with a cash flow similar to one preferred share and are valued as such for the purposes of the amounts initially deposited. The beta certificate is considered to generate an incentive similar to a share option scheme, employees may be awarded shares if they remain employees for a number of years.
Under U.S. GAAP, the Company accounts for alpha and beta certificates in accordance with FASB 123 (R) since 2006. The beta certificate is a considered a liability award, compensation cost has been consolidatedrecognized as the fair value of beta certificate at each reporting date. The fair value for these options was estimated at the date of grant using a Black-Scholes-Merton option pricing model with the following weighted-average assumptions:
| 2007 | 2006 | |||
| Statistical and financial-economic variables | 2nd grant | 1st grant | ||
| Risk-free interest rate, net of inflation effect - % | 6.79 | 8.42 | ||
| Dividend yield - % | 6.00 | 6.00 | ||
| Volatility at Brazilian capital markets - % | 57.09 | 54.10 | ||
| Exercise price - in R$ | 15.03 | 18.14 | ||
| Stock market price at year end - in R$ | 13.80 | 14.85 | ||
| Expected life of the option - in years | 9.1 | 9.3 | ||
F-117
| Braskem S.A. and Its Subsidiaries |
| Notes to the Consolidated Financial Statements |
| at December 31, 2007, 2006 and 2005 |
| All amounts in millions of reais, unless otherwise indicated |
A summary of certificate (alpha plus beta) activity under the Plan as of December 31, and changes during the year then ended is presented below:
| Weighted average | ||||||||
| unit exercise price | Alpha and Beta certificates | |||||||
| (units) | ||||||||
| 2007 | 2006 | 2007 | 2006 | |||||
| Outstanding as of January 1 | 18.14 | - | 95,719 | - | ||||
| Granted | 15.03 | 18.14 | 189,461 | 97,372 | ||||
| Exercised | - | - | - | - | ||||
| Expired/cancelled | - | - | - | (1,653) | ||||
| Outstanding as of December 31 | 16.22 | 18.14 | 285,180 | 95,719 | ||||
| Redeemable as of December 31 | - | - | - | - | ||||
| Compensation cost - millions of R$ | 0.6 | 0.5 | ||||||
The weighted average grant fair values of the beta certificates was R$15.03 and R$18.14 per beta certificate at the time of grant in all periods presented. 2007 and 2006, respectively. Beta certificates have an intrinsic value equal to the value of a preferred share which is approximately the exercise price disclosed above. Under Brazilian GAAP, as of December 31, 2007, the liability recorded in the statement of operations related to the compensation cost of outstanding certificates amounted to R$ 0.6 (2006 - R$ 0.5) .
Under U.S. GAAP, expense related to beta certificates will be recorded based on the term that the participant are expected to provide service to the Company, limited to the contractual life of the Plan, considering computation by using Black-Scholes-Merton pricing model, as well.
For the yearsyear ended December 31, 2004, 2003 and 2002, financial expenses related2007, under U.S. GAAP, the Company recorded a reversal of compensation cost, as computed under Brazilian GAAP, in the amount of R$ 0.6 (2006- addition to the salecompensation cost of trade receivables to securitization funds totaled R$ (3.8), R$(0.6) and R$(0.2)0.5) .
F-118
| Notes to the Consolidated Financial Statements |
| at December 31, 2007, 2006 and 2005 |
| All amounts in millions of |
(r) Proportional consolidation of
jointly-controlled entities
Under Brazilian GAAP, jointly-controlled entities must be consolidated using the proportional consolidation method. Proportional consolidation requires that the share of the assets, liabilities, income and expenses be combined on a line-by-line basis with similar items in the Company’sCompany's financial statements.
Under U.S. GAAP, jointly-controlled entities are recorded under the equity method, except that joint ventures for which the principal financialwhere investment of such holders are registered as equity investment and operational decisionspro-rated net income are jointly controlled byconsidered as equity earnings in affiliates, within statement of operations, all of them prepared in accordance with U.S. GAAP. For the entities equity holderspurposes of this footnote all joint-ventures are permitted to be proportionally consolidated for U.S. GAAP reconciliation purposes. The pro-rated accountsconsolidated.
For purposes of our jointly-controlled investees have not been proportionally consolidated in thepresentation of condensed U.S. GAAP balance sheet and statementsstatement of operations, except for thosethe Company has reverted total assets of Politeno which meetsjointly-controlled entities in the amount of R$ 1,252.8 at December 31, 2007 (2006 - R$ 867.4) .
Earnings in equity affiliate under U.S. GAAP, joint venture requirements.
recorded in the statement of operations, of such proportionally consolidated companies under Brazilian GAAP, amounts to R$ 12.1, R$ 12.9 and R$ 176.3, in 2007, 2006 and 2005, respectively.
The following table presents summarized assets and liabilities of PolitenoPetroquímica Paulínia that are proportionally consolidated in the balance sheet in accordance with U.S. GAAP:
| At December 31 | ||||
| 2004 | 2003 | |||
Balance sheet | ||||
Total current assets | 115.5 | 81.3 | ||
Property, plant and equipment | 107.3 | 119.1 | ||
Total assets | 275.2 | 232.5 | ||
Total current liabilities | 51.8 | 21.1 | ||
Total long-term liabilities | 17.5 | 5.2 | ||
BRASKEM S.A. AND ITS SUBSIDIARIES
NOTES TO THE CONSOLIDATED AND COMBINED FINANCIAL STATEMENTS—(Continued)
at December 31, 2004, 2003 and 2002
All amounts in millions of reais, unless otherwise indicated
| Petroquímica Paulínia | ||||
| 2006 | 2005 | |||
| Total current assets | 61.5 | 4.5 | ||
| Property, plant and equipment | 67.3 | 34.9 | ||
| Total assets | 128.8 | 39.4 | ||
| Total current liabilities | 2.3 | |||
| Total long-term liabilities | 50.4 | 34.9 | ||
The following table shows summarized income and expenses and cash flow of Politeno and Petroquímica Paulinia that are proportionally consolidated in the statement of operations in accordance with U.S. GAAP:
F-119
| For the Year Ended December 31, | |||||||||
| 2004 | 2003 | 2002 | |||||||
Statement of operations | |||||||||
Net sales | 379.2 | 123.8 | 80.4 | ||||||
Operating income (loss) | 82.7 | 4.2 | 25.3 | ||||||
Net income | 33.0 | 30.6 | 15.7 | ||||||
Cash flows | |||||||||
Net cash provided by operating activities | 18.0 | 34.0 | 13.5 | ||||||
Net cash used in investing activities | (7.7 | ) | (3.1 | ) | (24.4 | ) | |||
Net cash provided by financing activities | (13.6 | ) | (29.7 | ) | (4.3 | ) | |||
| Notes to the Consolidated Financial Statements |
| at December 31, 2007, 2006 and 2005 |
| All amounts in millions of |
| Politeno | Petroquímica | |||||
| Paulínia | ||||||
| 2005 | 2006 | 2005 | ||||
| Net sales | 397.3 | |||||
| Operating income (loss) | 29.1 | (2.0) | ||||
| Net income | 11.9 | (2.0) | ||||
| Net cash provided by operating activities | 31.3 | 1.8 | ||||
| Net cash used in investing activities | (7.3) | (34.3) | ||||
| Net cash used by financing activities | (23.8) | 86.6 | 4.5 | |||
(s) Dividends
Under Brazilian GAAP, the Company's executive officers proposed a dividend distribution from earnings, which has been recorded. Under U.S. GAAP, the amount of dividends exceeding the minimum mandatory dividend is not deemed declared before the distribution is approved by the shareholders. For purposes of reconciliation, the Company has excluded the amount which exceeded the minimum mandatory dividend amounting to R$ 149.4 at December 31, 2007 (2006 - R$ 18.5) .
Under Braskem's by laws, interest earned in own capital may be paid up upon authorization of the Board of Directors but is only considered declared when approved by the shareholders.
Embedded derivatives
Brazilian GAAP does not prescribe the accounting for embedded derivatives.
Under U.S. GAAP, SFAS nº 133, as amended and interpreted, "Accounting for Derivative Instruments and Hedging Activities", requires that embedded derivative instruments shall be separated from the host contract and accounted for as a derivative instrument if and only if all of the following criteria are met: (a) The economic characteristics and risks of the embedded derivative instrument are not clearly and closely related to the economic characteristics and risks of the host contract; (b) the contract that embodies both the embedded derivative instrument and the host contract is not remeasured at fair value under otherwise applicable generally accepted accounting principles with changes in fair value reported in earnings as they occur; and (c) a separate instrument with the same terms as the embedded derivative instrument would be a derivative instrument subject to the requirements of SFAS no. 133 .
F-120
| Braskem S.A. and Its Subsidiaries |
| Notes to the Consolidated Financial Statements |
| at December 31, 2007, 2006 and 2005 |
| All amounts in millions of |
For U.S.GAAP purposes the Company has bifurcated the embedded derivatives of sales contracts. For purposes of reconciliation, the fair value of embedded derivatives amounted to R$3.5 in the year ended December 31, 2007. During the previous years, the amounts were considered immaterial.
(t) Classification of statement of
operations line items
Under Brazilian GAAP, in addition to the issues noted above, the classificationclassifications of certain income and expense items isare presented differently from U.S. GAAP. We have recastrestated our statement of operations under Brazilian GAAP to present a condensed statement of operations in accordance with U.S. GAAP (Note 29(x)31(x)(c)(ii)). The reclassifications are summarized as follows:
(i) Interest income and interest expense, together with otherUnder Brazilian GAAP discounts granted are classified as financial charges,expenses. Under U.S. GAAP are displayed within operating income in the statementclassified as deductions of operations presented in accordance with Brazilian GAAP. These amounts have been reclassified to non-operating income and expenses in the condensed statement of operations in accordance with U.S. GAAP;
sales;
(ii) Under Brazilian GAAP, gains and losses on the disposal or impairment of permanent assets are classified as non-operatingnonoperating income (expense). Under U.S. GAAP, gains and losses on the disposal or impairment of property, plant and equipment are classified as an adjustment to operating income;
(iii) Under Brazilian GAAP, charges arising from provision for contingencies are presented in a single line item in operating expense. Under U.S. GAAP, provisions for contingencies are recorded in the statement of operations based on the type of contingency;
(iv) Under Brazilian GAAP equity in income of associated companies are included in operating income. Under U.S. GAAP equity in the income of associated companies is recorded net of income taxes after income taxes;
(v) Under Brazilian GAAP, foreign exchange gains and losses arisen from assets and liabilities may be recorded as financialnetted off within interest income or expenses.expense. Under U.S. GAAP such foreign exchange gains and losses are recorded as financialinterest income and expenses, respectively; andexpense, separately;
(vi)(iv) Under Brazilian GAAP, shipping and handling costs are deducted from gross revenues and handling costs are recorded as selling expenses, whereas under U.S. GAAP such costs are included in cost of sales.
(v) Under Brazilian GAAP recovery of indirect taxes on net interest income was recorded under other operating income, whereas under U.S. GAAP, such recoveries are recorded under the same line item as the taxes were initially recorded (interest income, net). As a result R$ 110.7 and R$ 112.4 have been reclassified from other operating income to interest expenses during 2007 and 2006, respectively;
(vi) Under Brazilian GAAP production of dimetiltereftalato - (DMT - basic petrochemicals) has been discontinued as from May 16, 2007, for which a valuation allowance in the amount of R$ 22.6 was provisioned as "non-operating expense" based on the difference between the fair market value and respective book value of such assets, consistent with SFAS 144, for which under U.S. GAAP it was classified as an operating expense.
F-121
BRASKEM S.A. AND ITS SUBSIDIARIES
NOTES TO THE CONSOLIDATED AND COMBINED FINANCIAL STATEMENTS—(Continued)
at December 31, 2004, 2003 and 2002
All amounts in millionsTable of reais, unless otherwise indicatedContents
| Braskem S.A. and Its Subsidiaries |
| Notes to the Consolidated Financial Statements |
| at December 31, 2007, 2006 and 2005 |
| All amounts in millions of reais, unless otherwise indicated |
(u) Classification of balance sheet line items
Under Brazilian GAAP, the classification of certain balance sheet items is presented differently from U.S. GAAP. We have recastrestated our consolidated balance sheet under Brazilian GAAP to present a condensed consolidated balance sheet in accordance with U.S. GAAP (Note 29(x)31(x)(c)(i)). The reclassifications are summarized as follows:
(i) Under U.S. GAAP, certain deferred charges were reclassified to property, plant and equipment and other, directly to expense, and goodwill on legally merged companies within deferred charges isare reclassified to goodwill accordingly to their nature;
(ii) Under U.S. GAAP, certain property, plant and equipment were reclassified to intangible assets, according to their nature;
(iii) Under Brazilian GAAP, deferred income taxes are not netted and assets are shown separately from liabilities. For U.S. GAAP purposes, deferred tax assets and liabilities are netted by legal tax paying entity and classified as current or non-current based on the classification of the underlying temporary difference;
(iv) Under Brazilian GAAP advances to suppliers of raw materials and maintenance material are classified as inventories, such advances are classified as other current assetsadvances to suppliers under U.S. GAAP;
(v)(iii) Under Brazilian GAAP, restricted cash equivalents are recorded based on the liquidity of the asset whereas under U.S. GAAP restricted assets are classified based on the classification of the related liability that has caused the restriction;
(vi)(iv) Under Brazilian GAAP, the Company’s majority owned independently controlled investment funds are classified separately within other investments whereas under U.S. GAAP the underlying debt securities held by these funds are consolidated, eliminating the entire fund balance against the Company’s long-term debt. The amounts consolidated are R$ 553.7, and R$ 406.5 at December 31, 2004 and 2003, respectively; and
(vii) Under BR GAAP, according to "Normas e Procedimentos de Contabilidade No. 20—“Demonstração dos Fluxos de Caixa”Nº 20"-"Cash flow statement" cash and cash equivalents consist principally of highly liquid cash deposits and marketable securities, but there is no requirement that there is insignificant potencialpotential changes in value because of interest rate change nor is there a maximum 90 day original period to maturity.
Under U.S. GAAP, the Company’sCompany's minority owned independently controlled investment funds are considered to be subject to potential risk of change in value due to changes in interest rates or have underlying securities with original maturities greater than 90 days. Therefore, under U.S. GAAP, such funds were classified under short term investments trading securities in the balance sheet. At December 31, 2004,2007, the balance of such funds was R$849.4. 1,375.8 (2006 - R$ 789.8). Taking into account these reclassifications, the net cash provided by operating activities in the statements of cash flows under U.S. GAAP at December 31, 2007, 2006 and 2005 would be R$ 1,614.6, R$ 883.4 and R$ 1,368.1, respectively
(viii)(v) Under Brazilian GAAP, investments in equity investees intended for saleaccording to "Normas e Procedimentos de ContabilidadeNo. 20"-"Cash flow statement" additions to deferred charges are recorded under investing activites. Under U.S. GAAP such costs are recorded under operating activites;
(vi) Under Brazilian GAAP discounted trade receivables are classified as long-term investments whereastrade accounts receivable, such items are classified as short-term debt under U.S. GAAP;
F-122
| Braskem S.A. and Its Subsidiaries |
| Notes to the Consolidated Financial Statements |
| at December 31, 2007, 2006 and 2005 |
| All amounts in millions of reais, unless otherwise indicated |
(vii) Under Brazilian GAAP fair market value of derivative financial instruments are classified as a reduction to the underlying debt. Under U.S. GAAP they are classified as investmentsfair market value of derivative of financial instruments; and
(viii) Under Brazilian GAAP, pursuant to CVM Deliberation 489/05, the Company states judicial deposits net of the corresponding contingent liabilities. According to U.S. GAAP, these deposits were fully stated as long-term receivables.
(ix) Braskem entered into a Share Purchase Agreement under which the Company has agreed to sell all its shares in equity investees.Petroflex which has been classified as an Investment held for sale at the book value of the net investment of R$136.7, to Lanxess Deutschland GmbH for an aggregate price of R$ 252.1. On April 1, 2008, this transaction was completed, as described in Note 30(d). Under U.S. GAAP investment held at Petroflex as of December 31, 2007 was not classified as held for sale and the related balance has been demonstrated within “Equity investment in affiliates”.
| (v) Segment reporting |
Under Brazilian GAAP, there is no obligation to present disaggregated information with respect to the business segments of an enterprise.
BRASKEM S.A. AND ITS SUBSIDIARIES
NOTES TO THE CONSOLIDATED AND COMBINED FINANCIAL STATEMENTS—(Continued)
at December 31, 2004, 2003 and 2002
All amounts in millions of reais, unless otherwise indicated
Under U.S. GAAP, SFAS No. 131, “Disclosures"Disclosures About Segments of an Enterprise and Related Information”Information", requires that public enterprises disclose certain information about segments on the basis that top management uses to allocate resources among segments and evaluate their performance.
F-123
| Braskem S.A. and Its Subsidiaries |
| Notes to the Consolidated Financial Statements |
| at December 31, 2007, 2006 and 2005 |
| All amounts in millions of reais, unless otherwise indicated |
Braskem has the following business segments:
| • | Basic Petrochemicals-comprising basic petrochemical production activities and supply of electricity, steam and compressed air to second generation producers. This segment is dependent on Petrobras for supply of raw material. |
| • | Polyolefins-comprising activities related to the production of polyethylene and polypropylene. |
| • | Vinyls-comprising activities related to the production of PVC, caustic soda and chlorine. One client represents 11.8%, 11.1% and 10.2% of Vinyl's revenues for the years ended December 31, 2007, 2006 and 2005, respectively. |
| • | Business Development-comprising activities related to the production of other second generation petrochemical products. One client represents 12.1%, 23.3% and 22.6% of Business Development revenues for the years ended December 31, 2007, 2006 and 2005, respectively. |
| • | Copesul- comprising basic petrochemical production activities and supply of electricity, steam and compressed air to second generation producers. This segment depends on Petrobrás for supply of raw material. Business acquired and consolidated only as from April 18, 2007. |
| • | Ipiranga- comprising activities related to the production of polyethylene and polypropylene of IQ and IPQ. Business acquired and consolidated only as from April 18, 2007. |
The Company evaluates and manages segment performance based on information generated from its statutory accounting records maintained in accordance with accounting practices adopted in Brazil and reflected in its consolidated and combined financial statements. However, management evaluates jointly controlled companies under the equity method as the Company does not control these companies. Certain equity investments are not allocated to any segment. Additionally, operating income figures presented in business segment information does not include financial expenses, financial income and investment in associated companies.
F-124
| Braskem S.A. and Its Subsidiaries |
| Notes to the Consolidated Financial Statements |
| at December 31, 2007, 2006 and 2005 |
| All amounts in millions of reais, unless otherwise indicated |
Information on total assets for each segment assets as at December 31, 20042007 and 2003,2006 under Brazilian GAAP, is as follows:
| 2007 | 2006 | |||
| Basic Petrochemicals | 5,016.3 | 5,426.6 | ||
| Polyolefins | 3,420.3 | 4,200.6 | ||
| Vinyls | 2,113.8 | 2,294.9 | ||
| Business Development | 513.5 | 573.3 | ||
| Copesul | 4,055.3 | - | ||
| Ipiranga Petroquímica | 1,573.1 | - | ||
| Ipiranga Química | 188.7 | - | ||
| Other | 4,011.0 | 3,808.9 | ||
| Total assets | 20,892.0 | 16,304.3 | ||
| December 31 | ||||
| 2004 | 2003 | |||
Basic Petrochemicals | 6,398.7 | 5,871.1 | ||
Polyolefins | 3,266.3 | 3,367.1 | ||
Vinyls | 2,282.4 | 2,551.3 | ||
Business Development | 584.8 | 598.0 | ||
Other | 2,360.7 | 1,556.0 | ||
Total assets | 14,892.9 | 13,943.5 | ||
Allocation of investments byInvestments in affiliates in each business segment was not significantwere immaterial in the periods presented.
BRASKEM S.A. AND ITS SUBSIDIARIES
NOTES TO THE CONSOLIDATED AND COMBINED FINANCIAL STATEMENTS—(Continued)
at December 31, 2004, 2003 and 2002
All amounts in millions of reais, unless otherwise indicated
Information on segment results for 2004, 2003 and 2002 isCompany's sales may be demonstrated as follows:
| 2004 | |||||||||||||||||||||||||||||||||
| Business Segments | Total | Eliminations | Braskem consolidated before CVM 247(*) | CVM 247 | Braskem consolidated | U.S. GAAP Differences | U.S. GAAP | ||||||||||||||||||||||||||
| Vinyls | Polyolefins | Basic Petrochemicals | Business Development | ||||||||||||||||||||||||||||||
Net sales revenue | 1,858.8 | 3,489.4 | 6,480.0 | 620.8 | 12,449.0 | (1,404.8 | ) | 11,044.2 | 1,147.8 | 12,192.0 | (467.2 | ) | 11,724.8 | ||||||||||||||||||||
Cost of sales | (1,157.1 | ) | (2,523.0 | ) | (5,330.1 | ) | (564.9 | ) | (9,575.1 | ) | 1,269.4 | (8,305.7 | ) | (772.6 | ) | (9,078.3 | ) | 138.3 | (8,940.0 | ) | |||||||||||||
Gross profit | 701.7 | 966.4 | 1,149.9 | 55.9 | 2,873.9 | (135.4 | ) | 2,738.5 | 375.2 | 3,113.7 | (328.9 | ) | 2,784.8 | ||||||||||||||||||||
Operating expenses (income) | |||||||||||||||||||||||||||||||||
Selling and general administrative | 80.1 | 199.1 | 213.8 | 24.9 | 517.9 | 62.8 | 580.7 | 69.3 | 650.0 | 200.7 | 850.7 | ||||||||||||||||||||||
Depreciation and amortization | 0.6 | 5.9 | 2.6 | 0.7 | 9.8 | 344.0 | 353.8 | 5.6 | 359.4 | (295.7 | ) | 63.7 | |||||||||||||||||||||
Other, net | (14.9 | ) | (6.3 | ) | (22.2 | ) | (2.6 | ) | (46.0 | ) | 10.8 | (35.2 | ) | (6.4 | ) | (41.6 | ) | 14.4 | (27.2 | ) | |||||||||||||
| 65.8 | 198.7 | 194.2 | 23.0 | 481.7 | 417.6 | 899.3 | 68.5 | 967.8 | (80.6 | ) | 887.2 | ||||||||||||||||||||||
Operating income | 635.9 | 767.7 | 955.7 | 32.9 | 2,392.2 | (553.0 | ) | 1,839.2 | 306.7 | 2,145.9 | (248.3 | ) | 1,897.6 | ||||||||||||||||||||
BRASKEM S.A. AND ITS SUBSIDIARIES
NOTES TO THE CONSOLIDATED AND COMBINED FINANCIAL STATEMENTS—(Continued)
at December 31, 2004, 2003 and 2002
All amounts in millions of reais, unless otherwise indicated
| 2003 | |||||||||||||||||||||||||||||||||
| Business Segments | Total Segments | Eliminations and adjustments | Braskem before | CVM 247 | Braskem consolidated | U.S. GAAP Differences | U.S. GAAP | ||||||||||||||||||||||||||
| Vinyls | Polyolefins | Basic Petrochemicals | Business Development | ||||||||||||||||||||||||||||||
Net sales | 1,371.8 | 3,386.8 | 4,765.3 | 455.3 | 9,979.2 | (788.3 | ) | 9,190.9 | 944.9 | 10,135.8 | (607.6 | ) | 9,528.2 | ||||||||||||||||||||
Cost of sales | (1,007.0 | ) | (2,719.7 | ) | (4,111.5 | ) | (416.8 | ) | (8,255.0 | ) | 913.4 | (7,341.6 | ) | (747.7 | ) | (8,089.3 | ) | 426.8 | (7,662.5 | ) | |||||||||||||
Gross profit | 364.8 | 667.1 | 653.8 | 38.5 | 1,724.2 | 125.1 | 1,849.3 | 197.2 | 2,046.5 | (180.8 | ) | 1,865.7 | |||||||||||||||||||||
Operating expenses (income) | |||||||||||||||||||||||||||||||||
Selling and general administrative | 54.8 | 139.3 | 196.0 | 19.2 | 409.3 | (7.8 | ) | 401.5 | 70.4 | 471.9 | 41.5 | 513.4 | |||||||||||||||||||||
Depreciation and amortization | — | 0.9 | 9.0 | 0.5 | 10.4 | 177.8 | 188.2 | 5.3 | 193.5 | (179.7 | ) | 13.8 | |||||||||||||||||||||
Other, net | (3.7 | ) | (2.6 | ) | (51.1 | ) | (10.0 | ) | (67.4 | ) | 16.2 | (51.2 | ) | 1.5 | (49.7 | ) | (2.1 | ) | (51.8 | ) | |||||||||||||
| 51.1 | 137.6 | 153.9 | 9.7 | 352.3 | 186.2 | 538.5 | 77.2 | 615.7 | (140.3 | ) | 475.4 | ||||||||||||||||||||||
Operating income | 313.7 | 529.5 | 499.9 | 28.8 | 1,371.9 | (61.1 | ) | 1,310.8 | 120.0 | 1,430.8 | (40.5 | ) | 1,390.3 | ||||||||||||||||||||
BRASKEM S.A. AND ITS SUBSIDIARIES
NOTES TO THE CONSOLIDATED AND COMBINED FINANCIAL STATEMENTS—(Continued)
at December 31, 2004, 2003 and 2002
All amounts in millions of reais, unless otherwise indicated
| 2002 | |||||||||||||||||||||||||||||||||
| Business Segments | Total Segments | Eliminations and adjustments | Braskem combined before CVM 247(*) | CVM 247 | Braskem combined | U.S. GAAP Differences | U.S. GAAP | ||||||||||||||||||||||||||
| Vinyls | Polyolefins | Basic Petrochemicals | Business Development | ||||||||||||||||||||||||||||||
Net sales | 1,117.8 | 2,482.3 | 3,499.1 | 290.8 | 7,390.0 | (522.4 | ) | 6,867.6 | 709.0 | 7,576.6 | (504.8 | ) | 7,071.8 | ||||||||||||||||||||
Cost of sales | (804.7 | ) | (2,062.4 | ) | (3,006.3 | ) | (246.1 | ) | (6,119.5 | ) | 490.6 | (5,628.9 | ) | (546.6 | ) | (6,175.5 | ) | 254.7 | (5,920.8 | ) | |||||||||||||
Gross profit | 313.1 | 419.9 | 492.8 | 44.7 | 1,270.5 | (31.8 | ) | 1,238.7 | 162.4 | 1,401.1 | (250.1 | ) | 1,151.0 | ||||||||||||||||||||
Operating expenses (income) | |||||||||||||||||||||||||||||||||
Selling and general administrative | 48.6 | 135.4 | 158.1 | 9.6 | 351.7 | 172.0 | 523.7 | 54.0 | 577.7 | (57.4 | ) | 520.3 | |||||||||||||||||||||
Depreciation and amortization | 2.5 | 3.1 | 9.8 | 0.2 | 15.6 | 156.9 | 172.5 | 49.9 | 222.4 | (26.0 | ) | 196.4 | |||||||||||||||||||||
Other, net | (3.8 | ) | (3.3 | ) | (84.2 | ) | (0.4 | ) | (91.7 | ) | (1,022.1 | ) | (1,113.8 | ) | (18.9 | ) | (1,132.7 | ) | (6.3 | ) | (1,139.0 | ) | |||||||||||
| 47.3 | 135.2 | 83.7 | 9.4 | 275.6 | (693.2 | ) | (417.6 | ) | 85.0 | (332.6 | ) | (89.7 | ) | (422.3 | ) | ||||||||||||||||||
Operating income | 265.8 | 284.7 | 409.1 | 35.3 | 994.9 | 661.4 | 1,656.3 | 77.4 | 1,733.7 | (160.4 | ) | 1,573.3 | |||||||||||||||||||||
BRASKEM S.A. AND ITS SUBSIDIARIES
NOTES TO THE CONSOLIDATED AND COMBINED FINANCIAL STATEMENTS—(Continued)
at December 31, 2004, 2003 and 2002
All amounts in millions of reais, unless otherwise indicated
| Years Ended December 31 | ||||||
| 2004 | 2003 | 2002 | ||||
Domestic sales | 9,824.2 | 7,606.4 | 6,076.1 | |||
Exports from Brazil | 2,367.8 | 2,529.4 | 1,500.5 | |||
Total net sales | 12,192.0 | 10,135.8 | 7,576.6 | |||
| 2007 | 2006 | 2005 | ||||
| Domestic sales | 13,472.0 | 9,671.7 | 10,348.0 | |||
| Exports from Brazil | 4,207.4 | 3,321.0 | 2,727.1 | |||
| Total net sales | 17,679.4 | 12,992.7 | 13,075.1 | |||
Information on the geographical composition of the Company’sCompany's sales, under Brazilian GAAP, is as follows:
| 2007 | 2006 | 2005 | ||||
| Destination of exports from Brazil | ||||||
| Americas | 2,878.2 | 2,059.0 | 1,827.2 | |||
| Asia and Pacific | 206.9 | 431.7 | 327.3 | |||
| Europe | 1,122.3 | 830.3 | 572.6 | |||
| Other | - | - | - | |||
| Total exports | 4,207.4 | 3,321.0 | 2,727.1 | |||
| Domestic sales | 13,472.0 | 9,671.7 | 10,348.0 | |||
| Total net sales | 17,679.4 | 12,992.7 | 13,075.1 | |||
F-125
| Years Ended December 31 | ||||||
| 2004 | 2003 | 2002 | ||||
Destination of exports from Brazil | ||||||
Americas | 1,539.1 | 1,365.9 | 810.3 | |||
Far East | 284.1 | 556.5 | 330.1 | |||
Europe | 520.9 | 505.9 | 300.1 | |||
Other | 23.7 | 101.1 | 60.0 | |||
Total exports | 2,367.8 | 2,529.4 | 1,500.5 | |||
Domestic sales | 9,824.2 | 7,606.4 | 6,076.1 | |||
Total net sales | 12,192.0 | 10,135.8 | 7,576.6 | |||
| Braskem S.A. and Its Subsidiaries |
| Notes to the Consolidated Financial Statements |
| at December 31, 2007, 2006 and 2005 |
| All amounts in millions of reais, unless otherwise indicated |
Information on segment results for 2007, 2006 and 2005 is as follows:
| 2007 | |||||||||||||||||||||||||||
| Business segments | Eliminations and adjustments (*) | Braskem consolidated before CVM 247 (*) | CVM 247 | Braskem consolidated | U.S.GAAP differences | U.S.GAAP | |||||||||||||||||||||
| Petrochemicals | Ipiranga | Copesul | Other | Total segments | |||||||||||||||||||||||
| Vinyls | Polyolefins | Basic | Química | Petroquímica | |||||||||||||||||||||||
| Net sales revenue | 1,789.4 | 5,669.1 | 7,220.7 | 392.6 | 1,551.4 | 5,516.1 | 489.7 | 22,629.0 | 5,617.4 | 17,011.6 | 667.8 | 17,679.4 | (392.0) | 17,287.4 | |||||||||||||
| Cost of sales | (1,438.1) | (4,636.1) | (6,341.2) | (338.9) | (1,232.5) | (4,924.7) | (510.3) | (19,421.8) | (5,488.4) | (13,933.4) | (507.6) | (14,441.0) | 26.0 | (14,415.0) | |||||||||||||
| - | |||||||||||||||||||||||||||
| Gross profit | 351.3 | 1,033.0 | 879.5 | 53.7 | 318.9 | 591.4 | (20.6) | 3,207.2 | 129.0 | 3,078.2 | 160.2 | 3,238.4 | (366.0) | 2,872.4 | |||||||||||||
| Operating expenses | |||||||||||||||||||||||||||
| (income) | |||||||||||||||||||||||||||
| Selling, general | |||||||||||||||||||||||||||
| and administrative | 201.7 | 427.1 | 324.6 | 39.1 | 85.1 | 74.6 | 16.5 | 1,168.7 | 32.8 | 1,201.5 | 37.0 | 1,238.5 | 76.5 | 1,315.0 | |||||||||||||
| Depreciation and | |||||||||||||||||||||||||||
| amortization | 2.1 | 13.9 | 1.4 | 4.3 | 5.7 | 17.6 | - | 45.0 | 432.0 | 477.0 | 2.1 | 479.1 | (421.7) | 57.4 | |||||||||||||
| Other, net | (25.9) | 14.4 | (15.9) | 0.7 | 25.9 | (10.1) | 22.8 | 12.0 | (142.3) | (130.3) | (1.2) | (131.5) | 50.0 | (81.5) | |||||||||||||
| 177.9 | 455.4 | 310.1 | 44.1 | 116.7 | 82.1 | 39.3 | 1,225.7 | 322.5 | 1,548.2 | 37.9 | 1,586.1 | (295.2) | 1,290.9 | ||||||||||||||
| Operating income | 173.4 | 577.6 | 569.4 | 9.6 | 202.2 | 509.3 | (59.9) | 1,981.5 | 451.5 | 1,530.0 | 122.3 | 1,652.3 | (70.8) | 1,581.5 | |||||||||||||
(*) "CVM 247" refers to proportional consolidation under Brazilian GAAP (Note 4) and "Braskem consolidated before CVM 247" includes depreciation at R$ 728.7 within this cost of sales.
F-126
| Braskem S.A. and Its Subsidiaries |
| Notes to the Consolidated Financial Statements |
| at December 31, 2007, 2006 and 2005 |
| All amounts in millions of reais, unless otherwise indicated |
| 2006 | |||||||||||||||||||||
| Business segments | Total segments | Eliminations and adjustments (*) | Braskem consolidated before CVM 247 (*) | CVM 247 | Braskem consolidated | U.S. GAAP differences | U.S. GAAP | ||||||||||||||
| Basic Petrochemicals | Business development | ||||||||||||||||||||
| Vinyls | Polyolefins | ||||||||||||||||||||
| Net sales revenue | 1,541.7 | 4,775.8 | 6,883.6 | 483.1 | 13,684.2 | (1,965.2) | 11,719.0 | 1,273.7 | 12,992.7 | (1,029.3) | 11,963.4 | ||||||||||
| Cost of sales | (1,245.3) | (3,985.4) | (5,994.8) | (545.7) | (11,771.2) | 1,889.6 | (9,881.6) | (910.5) | (10,792.1) | 468.3 | (10,323.8) | ||||||||||
| Gross profit | 296.4 | 790.4 | 888.8 | (62.6) | 1,913.0 | (75.6) | 1,837.4 | 363.2 | 2,200.6 | (561.0) | 1,639.6 | ||||||||||
| Operating expenses | |||||||||||||||||||||
| (income) | |||||||||||||||||||||
| Selling, general and | |||||||||||||||||||||
| administrative | 123.0 | 344.5 | 339.0 | 26.0 | 832.5 | 41.9 | 874.4 | 77.1 | 951.5 | 10.7 | 962.2 | ||||||||||
| Depreciation and | |||||||||||||||||||||
| amortization | 0.4 | 10.4 | 0.4 | 0.1 | 11.3 | 368.3 | 379.6 | 5.4 | 385.0 | (366.7) | 18.3 | ||||||||||
| Other, net | (35.1) | (22.5) | 10.4 | (1.9) | (49.1) | (107.8) | (156.9) | (29.2) | (186.1) | (139.0) | (47.1) | ||||||||||
| 88.3 | 332.4 | 349.8 | 24.2 | 794.7 | 302.4 | 1,097.1 | 53.3 | 1,150.4 | (217.0) | 933.4 | |||||||||||
| Operating income | 208.1 | 458.0 | 539.0 | (86.8) | 1,118.3 | (378.0) | 740.3 | 309.9 | 1,050.2 | (344.0) | 706.2 | ||||||||||
(*) "CVM 247" refers to proportional consolidation under Brazilian GAAP (Note 4) and "Braskem consolidated before CVM 247" includes depreciation at R$ 576.4 within this cost of sales.
F-127
| Braskem S.A. and Its Subsidiaries |
| Notes to the Consolidated Financial Statements |
| at December 31, 2007, 2006 and 2005 |
| All amounts in millions of reais, unless otherwise indicated |
| 2005 | |||||||||||||||||||||
| Business segments | Total segments | Eliminations and adjustments (*) | Braskem consolidated before CVM 247 (*) | CVM 247 | Braskem consolidated | U.S. GAAP differences | U.S. GAAP | ||||||||||||||
| Basic Petrochemicals | Business development | ||||||||||||||||||||
| Vinyls | Polyolefins | ||||||||||||||||||||
| Net sales revenue | 1,794.1 | 3,919.0 | 7,226.7 | 569.0 | 13,508.8 | (1,894.2) | 11,614.6 | 1,460.5 | 13,075.1 | (1,067.3) | 12,007.8 | ||||||||||
| Cost of sales | (1,271.9) | (3,182.8) | (6,138.5) | (552.9) | (11,146.1) | 1,827.6 | (9,318.5) | (1,043.2) | (10,361.7) | 709.1 | (9,652.6) | ||||||||||
| Gross profit | 522.2 | 736.2 | 1,088.2 | 16.1 | 2,362.7 | (66.6) | 2,296.1 | 417.3 | 2,713.4 | (358.2) | 2,355.2 | ||||||||||
| Operating expenses | |||||||||||||||||||||
| (income) | |||||||||||||||||||||
| Selling, general and | |||||||||||||||||||||
| administrative | 89.2 | 229.0 | 250.3 | 18.2 | 586.7 | 89.7 | 676.4 | 110.7 | 787.1 | (5.5) | 781.6 | ||||||||||
| Depreciation and | |||||||||||||||||||||
| amortization | 0.8 | 6.9 | - | 0.3 | 8.0 | 342.2 | 350.2 | 5.4 | 355.6 | (283.7) | 71.9 | ||||||||||
| Impairment | - | - | - | - | - | - | - | - | - | 373.8 | 373.8 | ||||||||||
| Other, net | (6.6) | (53.0) | (57.1) | (9.2) | (125.9) | 56.1 | (69.8) | 47.0 | (22.8) | 13.3 | (9.5) | ||||||||||
| 83.4 | 182.9 | 193.2 | 9.3 | 468.8 | 488.0 | 956.8 | 163.1 | 1,119.9 | 97.9 | 1,217.8 | |||||||||||
| Operating income | 438.8 | 553.3 | 895.0 | 6.8 | 1,893.9 | (554.6) | 1,339.3 | 254.2 | 1,593.5 | (456.1) | 1,137.4 | ||||||||||
(*) "CVM 247" refers to proportional consolidation under Brazilian GAAP (Note 4) and "Braskem consolidated before CVM 247" includes depreciation at R$ 409.9 within this cost of sales.
F-128
| Braskem S.A. and Its Subsidiaries |
| Notes to the Consolidated Financial Statements |
| at December 31, 2007, 2006 and 2005 |
| All amounts in millions of reais, unless otherwise indicated |
(w) Recently issued accounting standards
The CVM approved on August 2004 Instruction No. 408 which requires consolidation of special purpose entities (“SPE”) when a company has decision-making rights with respect to the activities of a SPE or has the right to obtain the majority of the benefits or is exposed to the majority of the losses of the SPE or of the assets of the SPE. Instruction No. 408 is effective as from January 1, 2005 and the Company expects to consolidate, as from January 1, 2005, FIDC as result of the application of Instruction No. 408.
In December 2004,September 2006, the FASB issued SFAS No. 123 (revised 2004)157, "Fair Value Measurements," which formally defines fair value, creates a standardized framework for measuring fair value in generally accepted accounting principles ("GAAP"), Share-Based Payment.and expands fair value measurement disclosures. SFAS 157 will be effective for fiscal years beginning after November 15, 2007. The primary focusCompany has been currently evaluating the impact that the application of this new standard will have on its financial statements, as from January 1, 2008.
In addition to the implementation of SFAS 157, paragraph 67 of Concepts Statement isNo.5 - "Recognition and Measurement in Financial Statements", issued by FASB, describes five measurement attributes used in financial statements under current financial accounting principles, for transactionswhich some of them are detailed approached in Concepts Statement No. 7 (CON 7) "Using Cash Flow Information and Present Value in Accounting Measurements". In addition, SFAS 157 defines fair value as the exchange price that would be received for an asset or paid to transfer a liability (an exit price) in the principal or most advantageous market for the asset or liability in an orderly transaction between market participants on the measurement date. SFAS 157 also establishes a fair value hierarchy which requires an entity obtains employee servicesto maximize the use of observable inputs and minimize the use of unobservable inputs when measuring fair value.
The standard aforementioned describes three levels of inputs that may be used to measure fair value:
Level 1 - Quoted prices in share-based payment transactions, suchactive markets for identical assets or liabilities method;
Level 2 - Observable markets are fair valued by using either present value or expected present value methods - deterministic model;
Level 3 - Mostly known as hybrid methodology since applies both deterministic and probabilistic models. Observable and unobservable variables are determined and computed by the granting of stock options. The Company will be requiredusing either estimated cash flow or expected cash flow methods. Unobservable variables that are supported by little or no market activity and that are significant to apply SFAS No. 123 (revised 2004) no later than the third quarter 2005, using the fair value-based methodvalue of accounting for share-based payment transactions with employees, rather than the intrinsic method previously allowed by APB Opinion No. 25, Accounting for Stock Issued to Employees. As noted above, the Company has already adopted the fair-value-based method for accounting for its share-based payment transactions with employees, and SFAS No. 123 (revised 2004) is not expected to have a material impactassets or liabilities are determined on Braskem’s financial statements.probabilistically path basis.
AlsoIn addition, in December 2004,February 2008, the FASB issued the FASB staff position (FSP) 157-2, which defers the effective date of SFAS No. 153, Exchanges of Nonmonetary Assets, which amends APB Opinion No. 29, Accounting157 for Nonmonetary Transactions,nonfinancial assets and nonfinancial liabilities except for items that are recognized on disclosed at fair value in the financial statements on a recurring basis to eliminatefiscal years begining after November 15, 2008.
Regarding SFAS 157, the exceptionCompany applies "CON 7" for nonmonetary exchanges of similar productiveobservable markets on fair valuing its financial assets which is replacedand liabilities. Level 2 approaching model considers prices and other relevant information generated by market transactions involving identical or comparable assets or liabilities on assumptions made with a general exception for exchanges of nonmonetary assets that do not have commercial substance. A nonmonetary exchange is defined to have commercial substance if the future cash flows of the entity are expected to change significantly as a result of the exchange.present value techniques. The Company has been evaluating the impact of such standard will be requiredhave on its financial statements as from January 1, 2008.
F-129
| Braskem S.A. and Its Subsidiaries |
| Notes to the Consolidated Financial Statements |
| at December 31, 2007, 2006 and 2005 |
| All amounts in millions of reais, unless otherwise indicated |
In February, 2007, the FASB issued FAS 159 "The fair value option for financial assets and financial liabilities" including an amendment of FASB Statement 115 "Accounting for certain investments in debt and equity securities", permits the company to adopt SFAS No. 153 for nonmonetary transactions within periods after June 15, 2005.choose to measure many financial instruments and certain other items at fair value. The Company is currently evaluating the impact if any, that the application of SFAS No. 153this new standard will have on its financial statements.
BRASKEM S.A. AND ITS SUBSIDIARIES
NOTES TO THE CONSOLIDATED AND COMBINED FINANCIAL STATEMENTS—(Continued)
atIn December 31, 2004, 2003 and 2002
All amounts in millions of reais, unless otherwise indicated
In November 2004,2007, the FASB issued SFAS No. 151, Inventory Costs.141 (revised 2007), "Business Combinations". The statement requiresSFAS 141 - Revised 2007 to converge USGAAP to IFRS, therefore several changes were made regarding accounting treatment for business combinations. The major changes provided by this Statement are related to accounting for business combinations costs, which can no longer be considered as part of the total consideration paid; accounting for all assets acquired, liabilities assumed and non-controlling interests of the acquired entity at fair value, at full amounts of their fair values, and not on the percentage of the shares acquired; measurement and recognition of contractual contingencies as of the acquisition date, and provides also guidance on the subsequent accounting treatment for these situations; recognition of contingent consideration as part of the goodwill computation on the date of acquisition, and not after the contingent is resolved, and defines also the concept of bargain purchase, in which the fair value of the acquired assets, assumed liabilities and noncontrolling interest of the acquired company are higher than the total consideration paid, and defines this bargain purchases shall be recognized as a gain on income from operations when they arise, and not to be allocated to the eligible assets. This Statement is effective as of the beginning of an entity's fiscal year that begins after December 15, 2008, for which earlier adoption is forbidden. The Company has been evaluating future possible impact on eventual future business combination under SFAS 141 - Revised 2007.
F-130
| Braskem S.A. and Its Subsidiaries |
| Notes to the Consolidated Financial Statements |
| at December 31, 2007, 2006 and 2005 |
| All amounts in millions of reais, unless otherwise indicated |
In December 2007, the FASB issued SFAS No. 160, "Noncontrolling interests in Consolidated Financial Statements - an amendment of ARB No. 51", which was also issued to converge USGAAP to IFRS. The major changes provided by this Statement are related to the classification of noncontrolling interest as part of the equity, an not as a liability or a mezzanine section between liabilities and equity, as well as the classification of the noncontrolling interest on income of operations, which now should be shown as income attributable to noncontrolling interest, and should not anymore be recognized as an expense or gain to arrive at net income from operations; this Statement also provides guidance on the deconsolidation of subsidiary, in order to measure the gain or loss on this deconsolidation using the fair value of any abnormal amountsnoncontrolling equity investment rather than the carrying amount of idle facility expense, freight, handling costs,the retained investment. This Statement is effective as of the beginning of an entity's fiscal year that begins after December 15, 2008, and spoilage as period costs.the entity cannot apply it before that date. The provisionsCompany has been evaluating future possible impact on eventual future business combination under SFAS 160.
In March 2008, the FASB issued SFAS No. 161, "Disclosure about Derivative Instruments and Hedging Activities - an amendment of SFAS 133". This Statement changes the disclosure requirements for derivative instruments and hedging activities. Entities are required to provide enhanced disclosures about (a) how and why an entity uses derivative instruments, (b) how derivative instruments and related hedged items are accounted for under Statement 133 and its related interpretations, and (c) how derivative instruments and related hedged items affect an entity's financial position, financial performance, and cash flows. This Statement is effective as of the beginning of an entity's fiscal year that begins after December 15, 2008, with early adoption encouraged. The Company has been evaluating future possible impact on reporting under SFAS 161.
In May 2008, the FASB issued SFAS No. 151162, "The Hierarchy of Generally Accepted Accounting Principles". SFAS 162 provides entities to be responsible for selecting its accounting principles for the preparation of financial statements that are presented in conformity with GAAP. This Statement will be applied prospectively upon implementation, which is required no later thaneffective 60 days following the first quarter 2006.approval by the Public Company Accounting Oversight Board - PCAOB. The Company does not expect application of SFAS No. 151 to have a materialsignificant impact on its financial statements.
In September 2004, FASB issued FSP EITF No. 03-1-1, which defersfrom the application of paragraphs 10-20this standard.
F-131
At March 31, 2004, the Emerging Issues Task Force (EITF) has reached a final consensus on EITF 03-6, “Participating Securities and the Two-Class Method under FASB Statement No. 128”. The participation in shares of capital gives right to a share of earnings of a Company, usually through an earnings allocation formula based on common shareholders dividends. The Task Force reached a consensus on the meaning of “participating security”, as mentioned in FASB Statement No. 128. A participating security is a security that may participate in undistributed earnings with common stock, whether that participation is conditioned upon the occurrence of a specified event or not. An instrument considered to be a participating security has a potential to reduce significantly basic earnings that would be allocated to common shares, since the two-class method shall be applied in order to compute the effects of such instrument in the earnings per share calculation. The consensus also reached other instruments with specific participations. Also EITF 03-6 consensus establishes that an entity would allocate losses to a nonconvertible participating security in periods of net loss if, (1) based on the contractual terms of the participating security, the security had not only the right to participate in the earnings of the issuer, but also a contractual obligation to share in the losses of the issuing entity, and (2) such contractual obligation is objectively determinable. EITF 03-6 is effective for fiscal periods beginning after March 31, 2004. Earnings per Share presented in previous financial statements shall be retroactively adjusted. The Company does not expect application of EITF 03-6 to have a material effect on basic and diluted Earnings per Share calculation.
BRASKEM S.A. AND ITS SUBSIDIARIESContents
NOTES TO THE CONSOLIDATED AND COMBINED FINANCIAL STATEMENTS—(Continued)
at December 31, 2004, 2003 and 2002
All amounts in millions of reais, unless otherwise indicated
| at December 31, 2007, 2006 and 2005 |
| All amounts in millions of |
(x) Reconciliation from Brazilian GAAP to U.S. GAAP
Net(a) Statement of Operations - net income (loss)balances
| Ref. | ||||||||
| Note 31 | 2007 | 2006 | 2005 | |||||
| Net income under Brazilian GAAP | 556.3 | 101.3 | 625.8 | |||||
| Depreciation of additional indexation of | ||||||||
| permanent assets for 1996 and 1997 | (b) | (37.4) | (28.6) | (39.9) | ||||
| Capitalized interest | (c) | 35.3 | - | 50.3 | ||||
| Amortization of capitalized interest | (c) | (34.8) | (38.7) | (38.3) | ||||
| Deferred charges, net | (d) | 42.2 | 34.5 | 82.1 | ||||
| Business Combination adjustments | (e) | 406.2 | 330.6 | 35.5 | ||||
| Pension plan | (i) | 3.2 | (58.4) | (27.7) | ||||
| Tax incentives | (n) | 49.5 | 11.9 | 52.0 | ||||
| Revenue recognition | (o) | - | (18.1) | (3.6) | ||||
| Amortization of capital raising costs | (l) | 5.8 | 5.8 | 5.8 | ||||
| Effects of U.S. GAAP adjustments on investees | (f) | (5.8) | (56.8) | (46.5) | ||||
| Long-term share incentive plan | (q) | 0.6 | 0.5 | - | ||||
| Embedded Derivatives | (3.5) | - | - | |||||
| Other | 4.2 | - | - | |||||
| Deferred income tax on adjustments above | (m) | 94.6 | (123.2) | 39.9 | ||||
| Minorities interest on adjustments above | (27.3) | 0.8 | 1.7 | |||||
| Net income under U.S. GAAP - as reported | 1,089.1 | 161.6 | 737.1 | |||||
| Change in accounting principle - | ||||||||
| maintenance costs | - | - | 4.1 | |||||
| Net income under U.S. GAAP - as adjusted | 1,089.1 | 161.6 | 741.2 | |||||
F-132
| Years Ended December 31 | ||||||||||||
| Reference | 2004 | 2003 | 2002 | |||||||||
Net income (loss) under Brazilian GAAP | 690.9 | 215.1 | (1,378.7 | ) | ||||||||
Depreciation of additional indexation of permanent assets for 1996 and 1997 | 29 | (b) | (37.3 | ) | (33.2 | ) | (36.8 | ) | ||||
Capitalized interest | 29 | (c(i)) | 34.1 | 34.7 | 60.0 | |||||||
Amortization of capitalized interest | 29 | (c) | (38.1 | ) | (38.9 | ) | (38.6 | ) | ||||
Deferred charges, net | 29 | (d) | 80.0 | 7.5 | (78.9 | ) | ||||||
Business combination adjustments | 29 | (e)(g) | 159.6 | 260.1 | 290.0 | |||||||
Pension plan | 29 | (i) | 20.2 | (2.2 | ) | (2.6 | ) | |||||
Tax incentives | 29 | (n) | 63.7 | 28.8 | 0.4 | |||||||
Sales shipped but not delivered | 29 | (o) | — | 3.9 | (2.9 | ) | ||||||
Consolidation of variable interest entities | 29 | (p) | (3.8 | ) | (0.6 | ) | (0.2 | ) | ||||
Effects of U.S. GAAP adjustments on equity investees | 29 | (f) | (92.2 | ) | (44.8 | ) | 37.6 | |||||
Deferred income tax on adjustments above | 29 | (m) | 48.8 | (20.6 | ) | 12.5 | ||||||
Minority interest on adjustments above | 2.3 | (31.7 | ) | (5.8 | ) | |||||||
Net income (loss) under U.S. GAAP | 887.8 | 378.1 | (1,144.0 | ) | ||||||||
Shareholders’ Equity
| December 31 | |||||||||
| Reference | 2004 | 2003 | |||||||
Shareholders’ equity under Brazilian GAAP | 4,187.5 | 2,112.6 | |||||||
Additional indexation of permanent assets for 1996 and 1997 | 29 | (b) | 1,135.8 | 1,135.8 | |||||
Depreciation of additional indexation of permanent assets for 1996 and 1997 | 29 | (b) | (374.1 | ) | (336.9 | ) | |||
Capitalized interest, net | 29 | (c) | 486.0 | 451.9 | |||||
Amortization of capitalized interest | 29 | (c) | (292.6 | ) | (254.5 | ) | |||
Deferred charges, net | 29 | (d) | (302.0 | ) | (382.0 | ) | |||
Business combination adjustments | 29 | (e) | (313.6 | ) | (473.2 | ) | |||
Distributions to shareholders | 29 | (g) | (1,777.2 | ) | (2,162.6 | ) | |||
Capital issuance costs | 29 | (l) | (58.1 | ) | — | ||||
Pension plan | 29 | (i) | 5.5 | (9.7 | ) | ||||
Consolidation of variable interest entities | 29 | (p) | (3.1 | ) | 0.7 | ||||
Equity investees | (136.3 | ) | (43.9 | ) | |||||
Treasury Shares | 10.4 | — | |||||||
Deferred income tax adjustments | 29 | (m) | (102.4 | ) | (151.2 | ) | |||
Minority interest on adjustments above | 123.1 | 120.8 | |||||||
Shareholders’ equity under U.S. GAAP | 2,588.9 | 7.8 | |||||||
BRASKEM S.A. AND ITS SUBSIDIARIES
NOTES TO THE CONSOLIDATED AND COMBINED FINANCIAL STATEMENTS—(Continued)
at December 31, 2004, 2003 and 2002
All amounts in millionsTable of reais, unless otherwise indicatedContents
| Braskem S.A. and Its Subsidiaries |
| Notes to the Consolidated Financial Statements |
| at December 31, 2007, 2006 and 2005 |
| All amounts in millions of reais, unless otherwise indicated |
(b) Balance Sheet - shareholders' equity balances
| Ref. | ||||||
| Note 31 | 2007 | 2006 | ||||
| Shareholders' equity under Brazilian GAAP | 5,757.0 | 4,311.9 | ||||
| Additional indexation of permanent assets for | ||||||
| 1996 and 1997 | (b) | 1,135.8 | 1,135.8 | |||
| Depreciation of additional indexation of permanent | ||||||
| assets for 1996 and 1997 | (b) | (479.6) | (442.6) | |||
| Capitalized interest, net | (c) | 571.6 | 536.3 | |||
| Amortization of capitalized interest | (c) | (404.5) | (369.6) | |||
| Deferred charges, net | (d) | (455.6) | (408.3) | |||
| Business combination adjustments | (e) | 631.0 | 291.6 | |||
| Distributions to shareholders | (g) | (1,771.3) | (1,771.3) | |||
| Capital raising costs | (l) | (40.7) | (46.5) | |||
| Pension plan | (i) | 3.3 | (12.1) | |||
| U.S. GAAP adjustments on investees | (f) | (11.0) | (225.5) | |||
| Treasury Shares | 12.4 | 10.4 | ||||
| Reversal of proposed dividend | (s) | 149.4 | 18.5 | |||
| Revenue recognition | (o) | - | (2.2) | |||
| Long-term share incentive plan | (q) | 1.1 | 0.5 | |||
| Embedded Derivatives | (3.5) | |||||
| Other | 2.9 | |||||
| Deferred income tax adjustments | (m) | (166.3) | (185.7) | |||
| Minorities interest on adjustments above | 99.9 | 125.6 | ||||
| Shareholders' equity under U.S. GAAP | 5,031.9 | 2,966.8 | ||||
F-133
| Braskem S.A. and Its Subsidiaries |
| Notes to the Consolidated Financial Statements |
| at December 31, 2007, 2006 and 2005 |
| All amounts in millions of reais, unless otherwise indicated |
(c) U.S. GAAP condensed financial information
Based on the reconciling items and discussion above, Braskem’sthe Company consolidated balance sheet, statement of operations and statement of changes in shareholders’shareholders' equity under U.S. GAAP have been recast inprepared as a condensed format as follows:
(i) Condensed balance sheet under U.S. GAAP
| Assets | 2007 | 2006 | ||
| Current assets | ||||
| Cash and cash equivalents | 1,024.6 | 667.2 | ||
| Marketable securities | 923.5 | 1,174.0 | ||
| Trade accounts receivable, net | 2,348.7 | 1,598.6 | ||
| Taxes recoverable | 619.0 | 383.0 | ||
| Inventories | 2,220.4 | 1,504.3 | ||
| Dividends receivable | 12.6 | 4.9 | ||
| Prepaid expenses | 70.5 | 79.5 | ||
| Advances to suppliers | 83.0 | 125.0 | ||
| Fair Market Value of derivatives investments | 114.6 | - | ||
| Other receivables | 75.9 | 46.4 | ||
| 7,492.8 | 5,582.9 | |||
| Equity investment in affiliates | 371.1 | 554.1 | ||
| Goodwill | 1,688.6 | 450.5 | ||
| Property, plant and equipment | 11,880.0 | 6,636.8 | ||
| Non-current assets | ||||
| Receivables from related parties | 49.7 | 40.9 | ||
| Prepaid expenses | 61.3 | 99.0 | ||
| Inventories, net | 22.8 | 22.9 | ||
| Intangible assets | 171.7 | 175.1 | ||
| Indirect taxes recoverable | 1,175.0 | 912.3 | ||
| Deferred income tax | 161.0 | 143.4 | ||
| Restricted deposits for legal proceedings | 103.0 | 206.5 | ||
| Other receivables | 196.1 | 66.3 | ||
| 1,940.6 | 1,666.4 | |||
| Total assets | 23,373.1 | 14,890.7 | ||
F-134
| Braskem S.A. and Its Subsidiaries |
| Notes to the Consolidated Financial Statements |
| at December 31, 2007, 2006 and 2005 |
| All amounts in millions of reais, unless otherwise indicated |
| Liabilities and shareholders' equity | 2007 | 2006 | ||
| Current liabilities | ||||
| Suppliers | 2,589.2 | 3,080.4 | ||
| Payroll and related charges | 257.2 | 128.6 | ||
| Taxes on income payable | 274.1 | 0.7 | ||
| Other taxes payable | 121.2 | 101.2 | ||
| Derivatives payable | 87.3 | 98.2 | ||
| Short-term debt, including current portion of long-term debt | 2,080.6 | 418.1 | ||
| Interest payable | 52.5 | 271.3 | ||
| Debentures | 111.6 | 958.6 | ||
| Advances from customers | 21.7 | 12.1 | ||
| Dividends payable | 49.4 | 22.0 | ||
| Business combination to be settled off | 881.0 | - | ||
| Other | 121.4 | 425.3 | ||
| 6,647.2 | 5,516.5 | |||
| Non-current liabilities | ||||
| Long-term debt | 6,084.6 | 3,799.0 | ||
| Debentures | 800.0 | 950.0 | ||
| Derivatives payable | 43.7 | 31.7 | ||
| Taxes and contributions payable | 1,148.9 | 1,418.0 | ||
| Deferred income tax | 1,312.6 | - | ||
| Other | 243.9 | 179.2 | ||
| 9,633.7 | 6,377.9 | |||
| Minorities interest | 2,060.3 | 29.5 | ||
| Shareholders' equity | 5,031.9 | 2,966.8 | ||
| Total liabilities and shareholder's equity | 23,373.1 | 14,890.7 | ||
F-135
| 2004 | 2003 | |||
Assets | ||||
Current assets | ||||
Cash and cash equivalents | 496.4 | 590.9 | ||
Short-term investments | 849.5 | 30.8 | ||
Trade accounts receivable, net | 1,595.8 | 1,248.3 | ||
Taxes recoverable | 472.6 | 353.6 | ||
Inventories | 1,355.4 | 840.9 | ||
Dividends receivable | 40.2 | 7.1 | ||
Prepaid expenses | 52.3 | 82.6 | ||
Advances to suppliers | 54.1 | 149.8 | ||
Other receivables | 114.1 | 114.4 | ||
| 5,030.4 | 3,418.4 | |||
Investments | 393.3 | 363.1 | ||
Goodwill, net | 829.5 | 818.2 | ||
Property, plant and equipment | 5,193.9 | 4,936.4 | ||
Other noncurrent assets | ||||
Receivables from related parties | 34.3 | 32.1 | ||
Long term investments | 59.1 | 60.9 | ||
Prepaid expenses | 122.2 | 82.1 | ||
Inventories, net | 50.4 | 115.6 | ||
Intangible assets | 29.5 | 19.3 | ||
Deferred charges, net | 342.8 | 246.6 | ||
Other taxes recoverable | 222.4 | 626.5 | ||
Deferred income tax | 294.5 | 105.1 | ||
Restricted deposits for legal proceedings | 187.2 | 181.2 | ||
Other receivables | 31.5 | 52.7 | ||
| 1,373.9 | 1,522.1 | |||
Total assets | 12,821.0 | 11,058.2 | ||
BRASKEM S.A. AND ITS SUBSIDIARIESTable of Contents
| Braskem S.A. and Its Subsidiaries |
| Notes to the Consolidated Financial Statements |
| at December 31, 2007, 2006 and 2005 |
| All amounts in millions of reais, unless otherwise indicated |
NOTES TO THE CONSOLIDATED AND COMBINED FINANCIAL STATEMENTS—(Continued)
at December 31, 2004, 2003 and 2002
All amounts in millions of reais, unless otherwise indicated
| 2004 | 2003 | |||
Liabilities and shareholders’ equity | ||||
Current liabilities | ||||
Suppliers | 2,167.9 | 1,124.6 | ||
Payroll and related charges | 77.6 | 70.3 | ||
Fair market value of derivative financial instruments | — | 4.1 | ||
Taxes on income payable | 68.3 | 17.1 | ||
Other taxes payable | 141.8 | 108.9 | ||
Short-term debt, including current portion of long-term debt | 1,282.7 | 2,058.4 | ||
Interest payable on short-term debt and debentures | 264.6 | 543.6 | ||
Debentures | 5.0 | 262.3 | ||
Related parties | 10.9 | |||
Advances from customers | 23.2 | 192.4 | ||
Dividends payable | 185.8 | 8.8 | ||
Other | 142.1 | 177.8 | ||
| 4,359.0 | 4,579.2 | |||
Long-term liabilities | ||||
Long-term debt | 2,616.7 | 2,826.1 | ||
Debentures | 1,167.9 | 1,143.0 | ||
Advances for credits rights | — | 113.4 | ||
Quotas subject to mandatory redemption | 201.8 | 100.0 | ||
Related parties | 145.8 | 266.1 | ||
Minimum pension liability | 35.2 | 60.6 | ||
Taxes and contributions payable | 1,332.3 | 1,145.3 | ||
Other | 120.8 | 198.9 | ||
| 5,620.5 | 5,853.4 | |||
Minority interest | 252.6 | 617.8 | ||
Shareholders’ equity | 2,588.9 | 7.8 | ||
Total liabilities and shareholders’ equity | 12,821.0 | 11,058.2 | ||
BRASKEM S.A. AND ITS SUBSIDIARIES
NOTES TO THE CONSOLIDATED AND COMBINED FINANCIAL STATEMENTS—(Continued)
at December 31, 2004, 2003 and 2002
All amounts in millions of reais, unless otherwise indicated
(ii) Condensed statement of operations under U.S. GAAP
| 2007 | 2006 | 2005 | ||||
| Gross sales | 21,640.6 | 15,045.5 | 15,341.0 | |||
| Value-added taxes, discounts and returns | (4,353.2) | (3,082.1) | (3,333.2) | |||
| Net sales | 17,287.4 | 11,963.4 | 12,007.8 | |||
| Cost of sales | (14,415.0) | (10,323.8) | (9,652.6) | |||
| Gross profit | 2,872.4 | 1,639.6 | 2,355.2 | |||
| Operating income (expenses) | ||||||
| Selling, general and administrative | (1,315.0) | (962.2) | (781.6) | |||
| Depreciation and amortization | (57.4) | (18.3) | (71.9) | |||
| Other, net | 81.5 | 47.1 | (364.3) | |||
| Operating income | 1,581.5 | 706.2 | 1,137.4 | |||
| Interest income/(expense) | ||||||
| Interest income | 652.3 | 232.6 | (46.5) | |||
| Interest expenses | (788.8) | (916.0) | (565.8) | |||
| Other | - | 17.3 | (24.4) | |||
| Income before income tax, earnings in equity | ||||||
| affiliates and minorities interest | 1,445.0 | 40.1 | 500.7 | |||
| Income tax benefit (expense) | ||||||
| Current | (183.0) | (3.9) | (24.0) | |||
| Deferred | (19.4) | (21.9) | 17.3 | |||
| Income before earnings in equity | ||||||
| affiliates and minority interest | 1,242.6 | 14.3 | 494.0 | |||
| Earnings in equity affiliates | 81.4 | 147.3 | 179.5 | |||
| Minorities interest | (234.9) | - | 67.7 | |||
| (153.5) | 147.3 | 247.2 | ||||
| Net income for the year | 1,089.1 | 161.6 | 741.2 | |||
F-136
| Braskem S.A. and Its Subsidiaries |
| Notes to the Consolidated Financial Statements |
| at December 31, 2007, 2006 and 2005 |
| All amounts in millions of reais, unless otherwise indicated |
(iii)Condensedchanges inshareholders' equity under U.S. GAAP
| 2004 | 2003 | 2002 | |||||||
Gross sales | 14,780.0 | 11,487.0 | 8,833.8 | ||||||
Value-added and other taxes, discounts and returns | (3,055.2 | ) | (1,958.8 | ) | (1,762.0 | ) | |||
Net sales revenue | 11,724.8 | 9,528.2 | 7,071.8 | ||||||
Cost of sales | (8,940.0 | ) | (7,662.5 | ) | (5,920.8 | ) | |||
Gross profit | 2,784.8 | 1,865.7 | 1,151.0 | ||||||
Operating income (expenses) | |||||||||
Selling, general and administrative | (850.7 | ) | (513.4 | ) | (520.3 | ) | |||
Depreciation and amortization | (63.7 | ) | (13.8 | ) | (196.4 | ) | |||
Zero-rated tax credit | — | — | 1,030.1 | ||||||
Other, net | 27.2 | 51.8 | 108.9 | ||||||
Operating income | 1,897.6 | 1,390.3 | 1,573.3 | ||||||
Non-operating income (expenses) | |||||||||
Financial income | (62.3 | ) | 58.7 | 565.1 | |||||
Financial expenses | (1,190.9 | ) | (770.8 | ) | (3,354.0 | ) | |||
Other | (24.3 | ) | 27.8 | (74.0 | ) | ||||
Income (loss) before income tax, equity in results of associated companies and minority interest | 620.1 | 706.0 | (1,289.6 | ) | |||||
Income tax benefit (expense) | |||||||||
Current | (66.2 | ) | (42.9 | ) | (67.0 | ) | |||
Deferred | 185.1 | (120.9 | ) | 12.5 | |||||
Income (loss) before equity in results of associated companies and minority interest | 739.0 | 542.2 | (1,344.1 | ) | |||||
Equity in earnings of associated companies | 171.1 | 36.7 | 7.6 | ||||||
Minority interest | (22.3 | ) | (200.8 | ) | 192.5 | ||||
Net income (loss) for the year | 887.8 | 378.1 | (1,144.0 | ) | |||||
BRASKEM S.A. AND ITS SUBSIDIARIES
| 2007 | 2006 | 2005 | ||||||||||||||||
| Other | Other | Other | ||||||||||||||||
| equity | Total | equity | Total | equity | Total | |||||||||||||
| OCI | accounts | Equity | OCI | accounts | Equity | OCI | accounts | Equity | ||||||||||
| At beginning of the year - as original presented | 1,748.1 | 1,218.7 | 2,966.8 | 1,512.6 | 1,405.8 | 2,918.4 | 763.8 | 1,825.1 | 2,588.9 | |||||||||
| Change in accounting principle – maintenance | ||||||||||||||||||
| cost adoption of SFAS 158 | - | - | - | 73.9 | - | 73.9 | - | (149.3) | (149.3) | |||||||||
| At beginning of the year - as adjusted | 1,748.1 | 1,218.7 | 2,966.8 | 1,586.5 | 1,405.8 | 2,992.3 | 763.8 | 1,675.8 | 2,439.6 | |||||||||
| Comprehensive income of the year | 1,089.1 | - | 1,089.1 | 161.6 | - | 161.6 | 741.2 | - | 741.2 | |||||||||
| Change in minimum pension liability | - | - | - | - | - | - | 7.6 | - | 7.6 | |||||||||
| Total comprehensive income | 2,837.2 | 1,218.7 | 4,055.9 | 1,748.1 | 1,405.8 | 3,153.9 | 1,512.6 | 1,675.8 | 3,188.4 | |||||||||
| Capital increase | - | 1,130.7 | 1,130.7 | - | 105.3 | 105.3 | - | - | - | |||||||||
| Distribution shareholders | - | - | - | - | 5.9 | 5.9 | - | - | - | |||||||||
| Repurchase of treasury shares | - | - | - | - | (224.3) | (224.3) | - | - | - | |||||||||
| Dividends and interest in own capital | - | (154.7) | (154.7) | - | (74.0) | (74.0) | - | (270.0) | (270.0) | |||||||||
| At end of the year | 2,837.2 | 2,194.7 | 5,031.9 | 1,748.1 | 1,218.7 | 2,966.8 | 1,512.6 | 1,405.8 | 2,918.4 | |||||||||
F-137
NOTES TO THE CONSOLIDATED AND COMBINED FINANCIAL STATEMENTSTable of Contents
| Report of Independent Registered Public Accounting Firm | ||
| To the Board of Directors and Shareholders Copesul — Companhia Petroquímica do Sul and Subsidiaries | ||
| 1 | We have audited the accompanying consolidated balance sheets of Copesul — Companhia Petroquímica do Sul and subsidiaries (“the Company”) as of December 31, 2006 and 2005 and the related consolidated statements of income, of changes in shareholders’ equity, of changes in financial position and of cash flows for each of the three years in the period ended December 31, 2006. These financial statements are the responsibility of the Company’s management. Our responsibility is to express an opinion on these financial statements based on our audits. | |
| 2 | We conducted our audits in accordance with the standards of the Public Company Accounting Oversight Board (United States). Those standards require that we plan and perform the audit to obtain reasonable assurance about whether the financial statements are free of material misstatement. An audit includes examining, on a test basis, evidence supporting the amounts and disclosures in the financial statements. An audit also includes assessing the accounting principles used and significant estimates made by management, as well as evaluating the overall financial statement presentation. We believe that our audits provide a reasonable basis for our opinion. |
F-138
| Copesul — Companhia Petroquímica do Sul and Subsidiaries | ||
| 3 | In our opinion, the consolidated financial statements referred to above present fairly, in all material respects, the consolidated financial position of Copesul — Companhia Petroquímica do Sul and subsidiaries at December 31, 2006 and 2005 and the consolidated results of their operations, the changes in their financial position and their cash flows for each of the three years in the period ended December 31, 2006, in conformity with accounting practices adopted in Brazil. | |
| 4 | Accounting practices adopted in Brazil vary in certain significant respects from accounting principles generally accepted in the United States of America. Information relating to the nature and effect of such differences is presented in Note 28 to the consolidated financial statements. |
| PricewaterhouseCoopers | Porto Alegre, Brazil | |
| Auditores Independentes | April 30, 2007 |
F-139
All amounts in millions of reais unless otherwise indicated
(iii) Condensed changes in shareholders’ equity under U.S. GAAP
| Years Ended December 31 | ||||||
| 2004 | 2003 | |||||
At beginning of the year | 7.8 | (415.2 | ) | |||
Net income (loss) | 887.8 | 378.1 | ||||
Changes in minimum pension liability | 35.5 | (17.1 | ) | |||
Total comprehensive income | 923.3 | 361.0 | ||||
Capital increase | 1,515.5 | 39.7 | ||||
Capital issuance costs | (58.1 | ) | ||||
Contribution from (distribution to) shareholders | 385.4 | 15.1 | ||||
Exchange of treasury shares | 18.6 | 7.2 | ||||
Dividends and interest on own capital | (203.6 | ) | — | |||
At end of the year | 2,588.9 | 7.8 | ||||
* * *
REPORT OF INDEPENDENT REGISTERED PUBLIC ACCOUNTING FIRM
To the Board of Directors and Shareholders
Copesul—Companhia Petroquímica do Sul and Subsidiaries
1 We have audited the accompanying consolidated balance sheets of Copesul—Companhia Petroquímica do Sul and subsidiaries (“the Company”) as of December 31, 2004 and 2003 and the related consolidated statements of operations, of changes in shareholders’ equity, of changes in financial position and of cash flows for each of the three years in the period ended December 31, 2004. These financial statements are the responsibility of the Company’s management. Our responsibility is to express an opinion on these financial statements based on our audits.
2 We conducted our audits in accordance with the standards of the Public Company Accounting Oversight Board (United States). Those standards require that we plan and perform the audit to obtain reasonable assurance about whether the financial statements are free of material misstatement. An audit includes examining, on a test basis, evidence supporting the amounts and disclosures in the financial statements. An audit also includes assessing the accounting principles used and significant estimates made by management, as well as evaluating the overall financial statement presentation. We believe that our audits provide a reasonable basis for our opinion.
3 In our opinion, the consolidated financial statements referred to above present fairly, in all material respects, the consolidated financial position of Copesul—Companhia Petroquímica do Sul and subsidiaries at December 31, 2004 and 2003 and the consolidated results of their operations, the changes in their financial position and their cash flows for each of the three years in the period ended December 31, 2004, in conformity with accounting practices adopted in Brazil.
4 In our report dated January 26, 2003 we expressed a qualified opinion on the consolidated financial statements for statutory purposes of the Company as of and for the year ended December 31, 2002 since the Company deferred net foreign exchange losses incurred in 2001 on foreign-currency-denominated assets and liabilities, which was not in accordance with accounting practices adopted in Brazil. As described in Note 2, retained earnings in the accompanying financial statements have been adjusted with respect to the consolidated financial statements for statutory purposes to retroactively recognize net foreign exchange losses as expense when incurred in 2001. Accordingly, our present opinion on the financial statements as of and for the year ended December 31, 2002 is different from that expressed in our previous report.
5 Accounting practices adopted in Brazil vary in certain significant respects from accounting principles generally accepted in the United States of America. The application of the latter would have affected the determination of consolidated net income for each of the three years in the period ended December 31, 2004 and the determination of consolidated shareholders’ equity at December 31, 2004 and 2003 to the extent summarized in Note 28.
Porto Alegre, Brazil, May 10, 2005
PricewaterhouseCoopers
Auditores Independentes
COPESUL—COMPANHIA PETROQUÍMICA DO SUL
CONSOLIDATED BALANCE SHEETS AT DECEMBER 31
All amounts in millions of reais unless otherwise indicated
| 2004 | 2003 | |||||
Assets | ||||||
Current assets | ||||||
Cash and banks | 175 | 456 | ||||
Trade accounts receivable | ||||||
Third parties | 190 | 98 | ||||
Related parties | 29 | 398 | ||||
Export drafts—billed | (170 | ) | (14 | ) | ||
Credits ceded to receivables securitization fund (FIDC) | (23 | ) | — | |||
Swap receivables | 1 | 10 | ||||
Marketable securities | 69 | — | ||||
Inventories | 427 | 283 | ||||
Taxes and charges recoverable | 38 | 126 | ||||
Other accounts receivable | 5 | 8 | ||||
Prepaid expenses | 13 | 22 | ||||
| 754 | 1,387 | |||||
Long-term assets | ||||||
Marketable securities | 12 | — | ||||
Related parties | 146 | 330 | ||||
Taxes and charges recoverable | 115 | 93 | ||||
Judicial deposits | 7 | 4 | ||||
Prepaid expenses | 5 | 7 | ||||
Loans to third parties | 9 | 9 | ||||
Claims receivable and other | 1 | 2 | ||||
| 295 | 445 | |||||
Permanent assets | ||||||
Investments | 11 | 9 | ||||
Property, plant and equipment | 1,138 | 1,207 | ||||
Deferred charges | 10 | 14 | ||||
| 1,159 | 1,230 | |||||
Total assets | 2,208 | 3,062 | ||||
COPESUL—COMPANHIA PETROQUÍMICA DO SUL
CONSOLIDATED BALANCE SHEETS AT DECEMBER 31—(Continued)
All amounts in millions of reais unless otherwise indicated
| 2004 | 2003 | |||
Liabilities and stockholders’ equity | ||||
Current liabilities | ||||
Suppliers | ||||
Third parties | 146 | 87 | ||
Related parties | 2 | 27 | ||
Loans and financing | 213 | 592 | ||
Export drafts | 21 | 121 | ||
Taxes and charges payable | 35 | 38 | ||
Social and labor contributions and charges | 53 | 31 | ||
Proposed dividends | 118 | 9 | ||
Interest on own capital | 19 | 14 | ||
Income tax and social contribution | 33 | 43 | ||
Provision for scheduled stoppage | 55 | 10 | ||
Swap and options payable | 8 | 40 | ||
Advances from customers | 11 | 7 | ||
Profit sharing and other | 26 | 15 | ||
| 740 | 1,034 | |||
Long-term liabilities | ||||
Loans and financing | 143 | 383 | ||
Export drafts | 103 | 500 | ||
Provision for scheduled stoppage | 44 | 53 | ||
Deferred contributions and taxes | 3 | 4 | ||
Provision for contingencies | 9 | 6 | ||
Actuarial liability—PETROS | 5 | 4 | ||
| 307 | 950 | |||
Stockholders’ equity | ||||
Capital | 700 | 610 | ||
Capital reserve | 248 | 247 | ||
Revaluation reserve | 144 | 179 | ||
Revenue reserve | 69 | 42 | ||
| 1,161 | 1,078 | |||
Total liabilities and stockholders’ equity | 2,208 | 3,062 | ||
| 2006 | 2005 | 2006 | 2005 | |||||||||||||||
Assets | Liabilities and shareholders' equity | |||||||||||||||||
Current assets | Current liabilities | |||||||||||||||||
| Cash and banks (Note 4) | 201 | 113 | Suppliers | |||||||||||||||
| Trade accounts receivable | Third parties (Note 14) | 290 | 154 | |||||||||||||||
| Third parties (Note 5) | 195 | 149 | Related parties (Note 27) | 63 | 2 | |||||||||||||
| Related parties (Note 27) | 59 | 49 | Loans and financing (Note 15) | 50 | 288 | |||||||||||||
| Export drafts — billed (Note 16) | (1 | ) | (18 | ) | Export drafts - to be invoiced (Note 16) | 39 | 1 | |||||||||||
| Credits ceded to receivables securitization fund (FIDC) (Note 7) | (13 | ) | Taxes and charges payable (Note 17) | 45 | 42 | |||||||||||||
| Swap receivables (Note 6) | 64 | 53 | Social and labor contributions and charges | 45 | 49 | |||||||||||||
| Marketable securities (Note 7) | 38 | 13 | Proposed dividends (Note 19 (d) (iii)) | 185 | 68 | |||||||||||||
| Inventories (Note 8) | 571 | 495 | Interest on own capital (Note 19 (d) (iii)) | 17 | 21 | |||||||||||||
| Taxes and charges recoverable (Note 9) | 115 | 43 | Income tax and social contribution (Note 18) | 44 | 9 | |||||||||||||
| Prepaid expenses (Note 10) | 14 | 14 | Provision for programmed manintenance (Note 19 (e) (i)) | 16 | ||||||||||||||
| Other accounts receivable | 5 | 9 | Swap and options payable (Note 6) | 23 | 5 | |||||||||||||
| Advances from customers | 5 | 13 | ||||||||||||||||
| 1,261 | 907 | Profit sharing and other | 35 | 27 | ||||||||||||||
Non-current assets | 841 | 695 | ||||||||||||||||
Long-term assets | Non-current liabilities | |||||||||||||||||
| Marketable securities (Note 7) | 1 | 1 | Long-term liabilities | |||||||||||||||
| Taxes and charges recoverable (Note 9) | 137 | 133 | Loans and financing (Note 15) | 107 | 84 | |||||||||||||
| Judicial deposits (Note 11) | 9 | 8 | Export drafts - to be invoiced (Note 16) | 139 | 91 | |||||||||||||
| Prepaid expenses (Note 10) | 4 | 6 | Provision for programmed maintenance (Note 19 (e) (i)) | 52 | ||||||||||||||
| Loans to third parties | 3 | 6 | Deferred contributions and taxes (Note 18) | 37 | 1 | |||||||||||||
| Claims receivable and other | 2 | 1 | Provision for contingencies (Note 24) | 34 | 11 | |||||||||||||
| Actuarial liability - PETROS (Note 25) | 9 | 7 | ||||||||||||||||
| 156 | 155 | 326 | 246 | |||||||||||||||
Permanent assets | Shareholders’ equity (Note 19) | |||||||||||||||||
| Investments | 10 | 9 | Capital | 850 | 750 | |||||||||||||
| Property, plant and equipment (Note 12) | 1,030 | 1,106 | Capital reserve | 296 | 341 | |||||||||||||
| Deferred charges (Note 13) | 10 | 11 | Revaluation reserve | 75 | 109 | |||||||||||||
| Revenue reserve | 79 | 47 | ||||||||||||||||
| 1,050 | 1,126 | 1,300 | 1,247 | |||||||||||||||
Total assets | 2,467 | 2,188 | Total liabilities and shareholders’ equity | 2,467 | 2,188 | |||||||||||||
F-140
COPESUL—COMPANHIA PETROQUÍMICA DO SUL
CONSOLIDATED STATEMENT OF INCOMETable of Contents
Gross sales Sale of petrochemical products and utilities Local market Foreign market Sale of services and resale of goods Taxes and contributions on sales ICMS PIS, COFINS, CIDE and other Net sales and services Cost of products, utilities and services Gross profit Operating (expenses) income Selling General and administrative Management fees Financial expenses, net (Note 2) Other operating income (expenses), net Operating profit Non-operating result, net Income before income tax and social contribution Income tax and social contribution Income before profit sharing Employees profit sharing Management profit sharing Income before reversal of interest on own capital Reversal of interest on own capital Net income for the year Earnings per share (in Brazilian Reais) unless otherwise indicated F-141YEARS ENDED DECEMBERCOPESUL — Companhia Petroquímica do SulConsolidated Statements of Income
Years Ended December 31
In millions of reais, 2004 2003 2002 6,267 4,794 3,266 774 630 456 112 29 19 7,153 5,453 3,741 (1,051 ) (865 ) (597 ) (661 ) (362 ) (213 ) (1,712 ) (1,227 ) (810 ) 5,441 4,226 2,931 (4,418 ) (3,773 ) (2,537 ) 1,023 453 394 (136 ) (115 ) (87 ) (41 ) (28 ) (32 ) (2 ) (1 ) (1 ) (163 ) (161 ) (261 ) 42 (9 ) 36 (300 ) (314 ) (345 ) 723 139 49 (1 ) (1 ) (5 ) 722 138 44 (242 ) (46 ) (7 ) 480 92 37 (20 ) (10 ) (7 ) (1 ) (1 ) (1 ) 459 81 29 88 87 13 547 168 42 36.39 11.17 2.80 2006 2005 2004 Gross sales Sale of petrochemical products and utilities Local market 7,186 6,527 6,267 Foreign market 761 765 774 Sale of services and resale of goods 201 56 112 8,148 7,348 7,153 Taxes and contributions on sales ICMS (982 ) (1,041 ) (1,051 ) PIS, COFINS, CIDE and other (790 ) (691 ) (661 ) (1,772 ) (1,732 ) (1,712 ) Net sales and services 6,376 5,616 5,441 Cost of products, utilities and services (5,292 ) (4,610 ) (4,418 ) Gross profit 1,084 1,006 1,023 Operating (expenses) income Selling (133 ) (125 ) (136 ) General and administrative (51 ) (43 ) (41 ) Management fees (3 ) (2 ) (2 ) Other operating income (expenses), net (Note 21) 20 22 42 (167 ) (148 ) (137 ) Operating profit before financial result 917 858 886 Financial result (Note 20) Financial expenses (463 ) (279 ) (670 ) Financial income 372 137 507 (91 ) (142 ) (163 ) Operating profit 826 716 723 Non-operating result, net Non-operating income (6 ) (4 ) 1 Non-operating expenses 2 10 (2 ) (4 ) 6 (1 ) Income before income tax and social contribution 822 722 722 Income tax and social contribution (Note 18) (270 ) (231 ) (242 ) Income before profit sharing 552 491 480 Employees profit sharing (24 ) (22 ) (20 ) Management profit sharing (3 ) (1 ) (1 ) Income before reversal of interest on own capital 525 468 459 Reversal of interest on own capital (Note 19) 90 99 88 Net income for the year 615 567 547 Earnings per share (in Brazilian Reais) (Note 19) 4.10 3.77 3.64 The accompanying notes are an integral part of these consolidated financial statements.
COPESUL—COMPANHIA PETROQUÍMICA DO SUL
STATEMENT OF CHANGES IN STOCKHOLDERS’ EQUITYTable of Contents
F-142COPESUL — Companhia Petroquímica do SulStatement of Changes in Shareholders’ Equity
In millions of reais Capital reserve Revenue reserve Retained earnings Revaluation (Acummulated Capital Fiscal incentives reserve Legal losses) Total At December 31, 2003 610 247 179 42 1,078 Capitalization of capital reserve — fiscal incentives FUNDOPEM 90 (90 ) Fiscal incentives FUNDOPEM 89 89 Program for Technological and Industrial Development (PDTI) 2 2 Realization of revaluation reserve Revaluation - 1983 (3 ) 3 Revaluation - 1989 (32 ) 32 Income tax and social contribution on realized revaluation reserve (10 ) (10 ) Net income for the year 547 547 Appropriation of net income Legal reserve 27 (27 ) Proposed dividends — R$0.785 per share (118 ) (118 ) Interim dividends — R$2.252 per share (339 ) (339 ) Interest on own capital — R$0.587 per share (88 ) (88 ) At December 31, 2004 700 248 144 69 1,161 Capitalization of revenue reserve Legal Reserve 50 (50 ) Fiscal incentives FUNDOPEM 89 89 Program for Technological and Industrial Development (PDTI) 4 4 Realization of revaluation reserve Revaluation - 1983 (3 ) 3 Revaluation - 1989 (32 ) 32 Income tax and social contribution on realized revaluation reserve (11 ) (11 ) Net income for the year 567 567 Appropriation of net income Legal reserve 28 (28 ) Proposed dividends — R$0.454 per share (68 ) (68 ) Interim dividends — R$2.635 per share (396 ) (396 ) Interest on own capital — R$0.660 per share (99 ) (99 ) At December 31, 2005 750 341 109 47 1,247
| Capital | Capital reserve | Revaluation reserve | Revenue reserve | Retained (Note 2) | Total | |||||||||||
| Fiscal incentives | Legal | |||||||||||||||
At December 31, 2001 | 558 | 52 | 249 | 34 | (49 | ) | 844 | |||||||||
Distribution of retained earnings | — | — | — | — | (12 | ) | (12 | ) | ||||||||
Tax on net income (ILL) | — | — | — | — | 40 | 40 | ||||||||||
Capitalization of capital reserve—fiscal incentives | ||||||||||||||||
Income tax | 1 | (1 | ) | — | — | — | — | |||||||||
FUNDOPEM | 51 | (51 | ) | — | — | — | — | |||||||||
Fiscal incentives | ||||||||||||||||
FUNDOPEM | — | 143 | — | — | — | 143 | ||||||||||
Realization of revaluation reserve | ||||||||||||||||
Revaluation—1983 | — | — | (3 | ) | — | 3 | — | |||||||||
Revaluation—1989 | — | — | (32 | ) | — | 32 | — | |||||||||
Income tax and social contribution on realized revaluation reserve | — | — | — | — | (10 | ) | (10 | ) | ||||||||
Net income for the year | — | — | — | — | 42 | 42 | ||||||||||
Appropriation of net income | ||||||||||||||||
Proposed dividends | — | — | — | — | (65 | ) | (65 | ) | ||||||||
Interest on own capital | — | — | — | — | (13 | ) | (13 | ) | ||||||||
At December 31, 2002 | 610 | 143 | 214 | 34 | (32 | ) | 969 | |||||||||
Fiscal incentives | ||||||||||||||||
FUNDOPEM | — | 104 | — | — | — | 104 | ||||||||||
Realization of revaluation reserve | ||||||||||||||||
Revaluation—1983 | — | — | (3 | ) | — | 3 | — | |||||||||
Revaluation—1989 | — | — | (32 | ) | — | 32 | — | |||||||||
Income tax and social contribution on realized revaluation reserve | — | — | — | — | (10 | ) | (10 | ) | ||||||||
Net income for the year | — | — | — | — | 168 | 168 | ||||||||||
Appropriation of net income | ||||||||||||||||
Legal reserve | — | — | — | 8 | (8 | ) | — | |||||||||
Proposed dividends | — | — | — | — | (9 | ) | (9 | ) | ||||||||
Interim dividends | — | — | — | — | (57 | ) | (57 | ) | ||||||||
Interest on own capital | — | — | — | — | (87 | ) | (87 | ) | ||||||||
At December 31, 2003 | 610 | 247 | 179 | 42 | — | 1,078 | ||||||||||
COPESUL—COMPANHIA PETROQUÍMICA DO SUL
STATEMENT OF CHANGES IN STOCKHOLDERS’ EQUITY—(Continued)Table of Contents
Capital reserve Retained (Note 2) At December 31, 2003 Capitalization of capital reserve—fiscal incentives FUNDOPEM Fiscal incentives FUNDOPEM Program for Technological and Industrial Development (PDTI) Realization of revaluation reserve Revaluation—1983 Revaluation—1989 Income tax and social contribution on realized revaluation reserve Net income for the year Appropriation of net income Legal reserve Proposed dividends Interim dividends Interest on own capital At December 31, 2004 F-143COPESUL — Companhia Petroquímica do SulStatement of Changes in Stockholders’ Equity
In millions of reais Capital Revaluation
reserve Revenue
reserve
earnings/
(deficit) Total Fiscal
incentives Legal 610 247 179 42 — 1,078 90 (90 ) — — — — — — — — — — — 89 — — — 89 — 2 — — — 2 — — (3 ) — 3 — — — (32 ) — 32 — — — — — (10 ) (10 ) — — — — 547 547 — — — 27 (27 ) — — — — — (118 ) (118 ) — — — — (339 ) (339 ) — — — — (88 ) (88 ) 700 248 144 69 — 1,161 Capital reserve Revenue reserve Revaluation Capital Fiscal incentives reserve Legal Retained earnings Total At December 31, 2005 750 341 109 47 1,247 Adjustment from previous years (Note 19 (e)) 38 38 Capitalization of capital reserve — FUNDOPEM 100 (100 ) Fiscal incentives FUNDOPEM 50 50 Program for Technological and Industrial Development (PDTI) 5 5 Realization of revaluation reserve Revaluation - 1983 (4 ) 4 Revaluation - 1989 (30 ) 30 Income tax and social contribution on realized revaluation reserve (8 ) (8 ) Net income for the year 615 615 Appropriation of net income Legal reserve 32 (32 ) Proposed dividends — R$1,229 per share (185 ) (185 ) Interim dividends — R$2.475 per share (372 ) (372 ) Interest on own capital — R$0.597 per share (90 ) (90 ) At December 31, 2006 850 296 75 79 1,300 The accompanying notes are an integral part of these consolidated financial statements.
COPESUL—COMPANHIA PETROQUÍMICA DO SUL
CONSOLIDATED STATEMENT OF CHANGES IN FINANCIAL POSITIONTable of Contents
F-144COPESUL — Companhia Petroquímica do SulConsolidated Statements of Changes in Financial Position
In millions of reais 2006 2005 2004 Financial resources were provided by: Operations Net income for the year 615 567 547 Expenses (income) not affecting working capital Depreciation and amortization 234 202 206 Provision for realization of investments at market value (1 ) Long-term taxes recoverable (5 ) Write off of non current assets prepaid expenses 1 Provision for long-term programmed maintenance 19 34 Provision for administrative, civil and labor contingencies 24 4 3 Provision for actuarial liability — PETROS 2 2 2 Interest on long-term amounts receivable (1 ) (10 ) (47 ) Interest on long-term financing 6 3 Interest on income tax and social contribution on long-term liabilities 2 Monetary and exchange variations on long-term items Long-term liabilities (5 ) (11 ) (2 ) Long-term receivables (5 ) (3 ) (23 ) Disposals of property, plant and equipment and investments 2 5 Income tax and social contribution Long-term receivavles (25 ) Long-term liabilities 10 (2 ) (1 ) Retained earnings revaluation reserve (10 ) (11 ) (10 ) 837 769 712 Third parties Decrease in long-term assets Marketable securities 1 11 12 Related parties 154 572 Taxes and charges recoverable 50 6 3 Prepaid expenses 3 3 6 Loans to third parties and other 5 5 4 Increase in long-term liabilities Financial institutions 47 77 121 Export drafts to be invoiced 138 114 Fiscal incentives of FUNDOPEM and Program for Technological and Industrial Development 55 93 91 299 349 923 Other Effect on net working capital from the change in the accounting procedure and prior year adjustments 1 Total funds provided 1,137 1,118 1,635
| 2004 | 2003 | 2002 | |||||||
Financial resources were provided by: | |||||||||
Operations | |||||||||
Net income for the year (Note 2) | 547 | 168 | 42 | ||||||
Expenses (income) not affecting working capital | |||||||||
Depreciation and amortization | 206 | 205 | 202 | ||||||
Swap difference receivable—long-term portion, net | — | 115 | (107 | ) | |||||
Increase in taxes and charges recoverable | — | — | (34 | ) | |||||
Provision for long-term scheduled stoppage | 34 | 29 | 23 | ||||||
Claims for indemnities | — | — | (4 | ) | |||||
Provision for administrative, civil and labor contingencies | 5 | 5 | 4 | ||||||
Interest on long-term amounts receivable | (47 | ) | (65 | ) | (43 | ) | |||
Interest on long-term financing | 3 | — | 5 | ||||||
Monetary variations on long-term items | |||||||||
Long-term liabilities | (2 | ) | (108 | ) | 371 | ||||
Long-term receivables | (23 | ) | 55 | (147 | ) | ||||
Disposals of property, plant and equipment and investments | — | 3 | — | ||||||
Income tax and social contribution | |||||||||
Long-term liabilities | (1 | ) | 1 | — | |||||
Retained earnings revaluation reserve | (10 | ) | (10 | ) | (10 | ) | |||
| 712 | 398 | 302 | |||||||
Third parties | |||||||||
Decrease in long-term receivables | |||||||||
Marketable securities | 12 | — | 47 | ||||||
Related parties | 572 | 1,069 | 226 | ||||||
Taxes and charges recoverable | 3 | 29 | 42 | ||||||
Prepaid expenses | 6 | 4 | 4 | ||||||
Loans to third parties and other | 4 | 4 | 9 | ||||||
Increase in long-term liabilities | |||||||||
Financial institutions | 121 | 76 | 15 | ||||||
Export drafts to be invoiced | 114 | 514 | — | ||||||
Fiscal incentives of FUNDOPEM and Program for Technological and | 91 | 104 | 143 | ||||||
| 923 | 1,800 | 486 | |||||||
Other | |||||||||
Income taxes on foreign profits | — | (5 | ) | — | |||||
Tax credit related to tax on net income (ILL) | — | — | 40 | ||||||
| — | (5 | ) | 40 | ||||||
Total funds provided | 1,635 | 2,193 | 828 | ||||||
COPESUL—COMPANHIA PETROQUÍMICA DO SUL
CONSOLIDATED STATEMENT OF CHANGES IN FINANCIAL POSITION—(Continued)Table of Contents
In millions of reais
| 2004 | 2003 | 2002 | |||||||
Financial resources were used for: | |||||||||
Long-term receivables | |||||||||
Marketable securities | 23 | — | — | ||||||
Related parties | 325 | 880 | 381 | ||||||
Taxes and charges recoverable | 19 | 2 | 61 | ||||||
Prepaid expenses | 4 | 3 | 1 | ||||||
Loans to third parties and other | 6 | 2 | 1 | ||||||
Permanent assets | |||||||||
Investments | 2 | — | — | ||||||
Property, plant and equipment | 131 | 47 | 24 | ||||||
Deferred charges | 2 | 5 | 4 | ||||||
Transfer from long-term to current liabilities | |||||||||
Financial institutions | 195 | 218 | 250 | ||||||
Export drafts to be invoiced | 371 | 117 | 339 | ||||||
Provision for scheduled stoppage | 43 | 20 | 2 | ||||||
Contributions and taxes | — | — | 10 | ||||||
Administrative, civil and labor contingencies | 1 | 1 | 1 | ||||||
Amortization of long-term liabilities | |||||||||
Financial institutions | 174 | — | — | ||||||
Export drafts to be invoiced | 133 | — | — | ||||||
Distribution of net income | |||||||||
Proposed dividends | 118 | 9 | 65 | ||||||
Dividends distributed from retained earnings | 339 | 57 | 12 | ||||||
Interest on own capital | 88 | 87 | 13 | ||||||
Total funds used | 1,974 | 1,448 | 1,164 | ||||||
Increase (decrease) in working capital | (339 | ) | 745 | (336 | ) | ||||
Current assets | |||||||||
At the end of the year | 754 | 1,387 | 1,305 | ||||||
At the beginning of the year | 1,387 | 1,305 | 746 | ||||||
| (633 | ) | 82 | 559 | ||||||
Current liabilities | |||||||||
At the end of the year | 740 | 1,034 | 1,697 | ||||||
At the beginning of the year | 1,034 | 1,697 | 802 | ||||||
| (294 | ) | (663 | ) | 895 | |||||
Increase (decrease) in working capital | (339 | ) | 745 | (336 | ) | ||||
| COPESUL — Companhia Petroquímica do Sul | ||
| Consolidated Statements of Changes in Financial Position In millions of reais | (continued) |
| 2006 | 2005 | 2004 | ||||||||||
Financial resources were used for: | ||||||||||||
| Long-term assets | ||||||||||||
| Marketable securities | 23 | |||||||||||
| Related parties | 325 | |||||||||||
| Taxes and charges recoverable | 42 | 21 | 19 | |||||||||
| Prepaid expenses | 1 | 5 | 4 | |||||||||
| Loans to third parties and other | 2 | 1 | 6 | |||||||||
| Permanent assets | ||||||||||||
| Investments | 2 | |||||||||||
| Property, plant and equipment | 126 | 171 | 131 | |||||||||
| Deferred charges | 2 | 3 | 2 | |||||||||
| Transfer from long-term to current liabilities | ||||||||||||
| Financial institutions | 24 | 64 | 195 | |||||||||
| Export drafts to be invoiced | 35 | 371 | ||||||||||
| Provision for programmed maintenance | 11 | 43 | ||||||||||
| Amortization of long-term liabilities | ||||||||||||
| Financial institutions | 79 | 174 | ||||||||||
| Export drafts to be invoiced | 49 | 133 | ||||||||||
| Administrative, civil and labor contingencies | 1 | 2 | 1 | |||||||||
| Distribution of net income | ||||||||||||
| Proposed dividends | 185 | 68 | 118 | |||||||||
| Prepaid dividends | 372 | 396 | 339 | |||||||||
| Interest on own capital | 90 | 99 | 88 | |||||||||
Total funds used | 929 | 920 | 1,974 | |||||||||
Increase (decrease) in working capital | 208 | 198 | (339 | ) | ||||||||
Current assets | ||||||||||||
| At the end of the year | 1,261 | 907 | 754 | |||||||||
| At the beginning of the year | 907 | 754 | 1,387 | |||||||||
| 354 | 153 | (633 | ) | |||||||||
Current liabilities | ||||||||||||
| At the end of the year | 841 | 695 | 740 | |||||||||
| At the beginning of the year | 695 | 740 | 1,034 | |||||||||
| 146 | (45 | ) | (294 | ) | ||||||||
Increase (decrease) in working capital | 208 | 198 | (339 | ) | ||||||||
F-145
COPESUL—COMPANHIA PETROQUÍMICA DO SUL
CONSOLIDATED STATEMENT OF CASH FLOWSTable of Contents
YEARS ENDED DECEMBER 31
Cash provided by operating activities Net income for the year Expenses (income) not affecting cash Depreciation and amortization Provision for scheduled stoppage Provision for contingencies Interest and monetary and exchange variations on liabilities Interest Monetary and exchange variations Interest and monetary and exchange variations on assets Interest Monetary and exchange variations Loss on disposals of property, plant and equipment and other Net changes in swap receivable Net changes in swap and options difference payable Loans, financing and export drafts Interest Monetary and exchange variations Deferred income tax and social contribution Fiscal incentives of FUNDOPEM, income tax and Program for Technological and Industrial Development Decrease (increase) in assets Trade accounts receivable Trade notes linked to the FIDC Inventories Other accounts receivable Related parties Increase (decrease) in liabilities: Suppliers—third parties Other accounts payable Net cash provided by operating activities Marketable securities Purchases Redemptions Loans to related parties Issuances Repayments Additions to investments Additions to property, plant and equipment Additions to deferred charges Net cash provided by (used in) investing activities Loans, financing and export drafts Issuances Repayments Interest on own capital payable paid Dividends paid Net cash used in financing activities Net change in cash Initial cash balance Final cash balance Net change in cash F-146COPESUL — Companhia Petroquímica do SulConsolidated Statements of Cash Flows
In millions of reais 2004 2003 2002 (Reclassified) 547 168 42 206 205 202 36 17 23 5 4 4 4 — 5 — (108 ) 371 5 (4 ) (21 ) (18 ) 56 (147 ) 3 9 305 (257 ) (32 ) (11 ) 14 (7 ) (3 ) 9 (21 ) (127 ) 231 (30 ) 3 (33 ) 91 104 143 277 (213 ) (71 ) 23 — — (144 ) 21 (177 ) 102 19 (4 ) (25 ) (302 ) 307 59 (20 ) 57 21 59 44 1,108 176 742 (997 ) — — 910 — — (325 ) (880 ) (381 ) 522 1,007 204 (2 ) — — (131 ) (47 ) (24 ) (2 ) (5 ) (4 ) (25 ) 75 (205 ) COPESUL—COMPANHIA PETROQUÍMICA DO SULCONSOLIDATED STATEMENT OF CASH FLOWS—(Continued)YEARS ENDED DECEMBER 31In millions of reais 2004 2003 2002 (Reclassified) 772 1,553 781 (1,707 ) (1,601 ) (1,124 ) (83 ) (72 ) (13 ) (346 ) (123 ) (16 ) (1,364 ) (243 ) (372 ) (281 ) 8 165 456 448 283 175 456 448 (281 ) 8 165 2006 2005 2004 Cash provided by operating activities Net income for the year 615 567 547 Expenses (income) not affecting cash Depreciation and amortization 234 202 206 Provision for programmed maintenance (31 ) 36 Provision for administrative, civil and labor contingencies 23 4 3 Provision for actuarial liabilities — PETROS 2 2 2 Provision for realization of investments at market value (1 ) Interest and monetary and exchange variations on assets Interest 5 15 5 Monetary and exchange variations (4 ) 6 (18 ) Disposals of property, plant and equipment and other investments 2 5 Net changes in swap receivable (11 ) (52 ) 9 Net changes in swap and options payable 18 (3 ) (32 ) Loans, financing and export drafts Interest (11 ) (1 ) (3 ) Monetary and exchange variations (7 ) (36 ) (21 ) Deferred income tax and social contribution 4 10 (30 ) Interest on provision for income tax and social contribution 2 Decrease (increase) in assets Trade accounts receivable (57 ) 21 277 Trade notes linked to the FIDC (13 ) (10 ) 23 Inventories (76 ) (68 ) (144 ) Other accounts receivable (92 ) (36 ) 102 Related parties 61 (25 ) Increase (decrease) in liabilities Suppliers — third parties 137 8 59 Other accounts payable 13 (28 ) 21 Fiscal incentives of FUNDOPEM, income tax and Program for Technological and Industrial Development 55 93 91 Net cash provided by operating activities 899 668 1,108 The accompanying notes are an integral part of these consolidated financial statements.
COPESUL—COMPANHIA PETROQUÍMICA DO SUL
NOTES TO THE CONSOLIDATED FINANCIAL STATEMENTSTable of Contents
| COPESUL — Companhia Petroquímica do Sul | ||
| Consolidated Statements of Cash Flows In millions of reais | (continued) |
| 2006 | 2005 | 2004 | ||||||||||
| Marketable securities | ||||||||||||
| Purchases | (210 | ) | (145 | ) | (997 | ) | ||||||
| Redemptions | 181 | 201 | 910 | |||||||||
| Loans to related parties | ||||||||||||
| Issuances | 5 | (325 | ) | |||||||||
| Repayments | 130 | 522 | ||||||||||
| Additions to investments | (2 | ) | ||||||||||
| Additions to property, plant and equipment | (126 | ) | (171 | ) | (131 | ) | ||||||
| Additions to deferred charges | (2 | ) | (3 | ) | (2 | ) | ||||||
| Net cash provided by (used in) investing activities | (152 | ) | 12 | (25 | ) | |||||||
| Loans, financing and export drafts | ||||||||||||
| Issuances | 1,320 | 1,279 | 772 | |||||||||
| Repayments | (1,447 | ) | (1,411 | ) | (1,707 | ) | ||||||
| Interest on own capital payable paid | (94 | ) | (97 | ) | (83 | ) | ||||||
| Dividends paid | (438 | ) | (513 | ) | (346 | ) | ||||||
| Net cash used in financing activities | (659 | ) | (742 | ) | (1,364 | ) | ||||||
| Net change in cash | 88 | (62 | ) | (281 | ) | |||||||
| Initial cash balance | 113 | 175 | 456 | |||||||||
| Final cash balance | 201 | 113 | 175 | |||||||||
| Net change in cash | 88 | (62 | ) | (281 | ) | |||||||
F-147
2005
All amounts in millions of reais, unless otherwise indicated
| 1 | Operations |
The Company’s main objectives are: (a) manufacture, sale, import and export of chemical and petrochemical products and fuel; (b) production and distribution of goods, as well as rendering services to companies of the Southern Petrochemical Complex and management of the logistic services relating to its waterway and terrestrial terminals; and (c) participation in other companies as quotaholder or shareholder.
The main suppliers of raw materials in the local market are PETROBRAS—Petróleo Brasileiro S.A. and its subsidiary Refinaria Alberto Pasqualini—REFAP S.A. (REFAP), and most sales of products are made to companies located in the Southern Petrochemical Complex in Triunfo, State of Rio Grande do Sul, and to REFAP.
| The Company, headquartered in Triunfo, Rio Grande do Sul, is a publicly held corporation and main objectives are: a) manufacture, sale, import and export of chemical and petrochemical products and fuel; b) production and distribution of goods, as well as rendering services to companies of the Southern Petrochemical Complex and management of the logistic services pertinent to its waterway and terrestrial terminals; c) participation in other companies as quotaholder or shareholder. Its main shareholders are Braskem S.A., Ipiranga Petroquímica S.A. and Petrobras Química S.A. - PETROQUISA. | ||
| The main suppliers of raw materials in the local market are PETROBRAS — Petróleo Brasileiro S.A. and Refinaria Alberto Pasqualini — REFAP S.A. and overseas, the companies Sonatrach SPA and Repsol YPF S.A. | ||
| The Company’s main customers are located in the Petrochemical Complex in Triunfo, Rio Grande do Sul. Additionally, the Company’s sales of hydrocarbon solvents and fuels are made to both national and international market, and the latter being mainly to Mercosur (Southern Common Market) and the United States. | ||
| 2 | Presentation of financial statements |
The financial statements prepared by the Company for statutory purposes were filed with the CVM in January 2005. The financial statements presented herein are not intended for statutory purposes and has been adjusted with respect to the financial statements for statutory purposes to include in Note 28 a reconciliation of net equity and net income between the amounts under accounting practices adopted in Brazil and generally accepted accounting principles in the United States of America as well as certain additional disclosure to facilitate its understanding by readers not familiar with accounting practices adopted in Brazil as described below.
F-148
Adjustments to the financial statements for statutory purposes
In the financial statements as of December 31, 2002 and for the year then ended prepared by the Company for statutory purposes, the Company deferred net foreign exchange loss incurred in 2001 on foreign-currency-denominated assets and liabilities, which was not in accordance with accounting practices adopted in Brazil, which require foreign exchange differences to be recognized in income and expense when they occur. In the financial statements for the year ended December 31, 2003 for statutory purposes the amount deferred and recognized as deferred charges as of January 1, 2003 was recorded as a direct reduction of retained earnings in the statement of changes in shareholders equity. Those financial statements as of December 31, 2002 and for the year then ended for statutory purposes were audited by our independent auditors who issued a qualified opinion on January 26, 2003, were published in newspapers, filed with the CVM—Comissão de Valores Mobiliários (the Brazilian stock exchange regulator) and approved at the respective annual shareholders meetings.
Considering that one of the shareholders of the Company is required to file audited financial statements of the Company with the United States Securities and Exchange Commission (SEC), and the SEC does not accept qualified audit opinions, the Company has prepared these adjusted financial statements in which the foreign exchange loss deferred in 2001 is reflected in net income for that year (not presented herewith), and the related amortization expense has been reversed. These adjusted financial statements have been prepared for the reason described above and are not intended to replace the financial statements of the Company for statutory and regulatory purposes.
COPESUL—COMPANHIA PETROQUÍMICA DO SUL
NOTES TO THE CONSOLIDATED FINANCIAL STATEMENTS—(Continued)
Consolidated Financial Statements
at December 31, 20042006 and 2003
2005
All amounts in millions of reais, unless otherwise indicated
The following table presents the reconciliation between shareholders’ equity at December 31, 2002 and net income for the year ended December 31, 2002, as presented in the financial statements prepared by the Company for statutory purposes, and the same amounts in these financial statements. The adjustments presented in the reconciliation below have not been recorded in the statutory books of the Company.
Shareholders equity | Net income for the year | ||||
| 2002 | 2002 | ||||
As presented in the financial statements for regulatory purposes | 1,001 | — | |||
Reversal of amortization of deferred foreign exchange losses, net of tax effects | (32 | ) | 42 | ||
As presented in these adjusted financial statements | 969 | 42 |
| shown in Note 19 (e) (i). | ||
| The preparation of financial statements in conformity with generally accepted accounting practices requires the use of estimates to account for certain assets and liabilities and other transactions. Therefore, the Company’s financial statements include estimates referring to the selection of useful lives of fixed assets, provisions for contingent liabilities and determination of income tax liabilities. Actual results may differ from such estimates. | ||
| 3 | Significant accounting practices |
| (a) | Consolidated financial statements |
These consolidated statements include the wholly-owned subsidiaries Copesul International Trading, Inc. and CCI—Comercial Importadora S.A. and, as from 2004, the Fundo Copesul de Investimento Financeiro, a mutual fund whose quotas are wholly-owned by the Company. In the consolidation process, the intercompany balances, income, expenses and unrealized profits arising from intercompany transactions are eliminated, as well as the investment in the subsidiaries.
| These consolidated statements include the wholly-owned subsidiaries Copesul International Trading, Inc., CCI — Comercial Importadora S.A. and the Fundo de Investimento Financeiro Multimercado Copesul, a mutual fund whose quotas are wholly-owned by the Company. In the consolidation process, intercompany balances, income, expenses and unrealized profits arising from intercompany transactions are eliminated, as well as the investment in the subsidiaries. | ||
| (b) | Marketable securities and swap receivables and payables |
These assets are recorded at cost plus accrued income up to the balance sheet date (accrual basis), adjusted to market value, when lower.
| Marketable securities are recorded at cost plus accrued income up to the balance sheet date (accrual basis), adjusted to market value, when lower. Investment in quotas of mutual funds are valued at its market value at period-end with gain and losses regognized in the statement of income. As required by accounting standards specifically applicable to mutual funds, investments held by mutual funds, such as the “Fundo de Investimento Financeiro Multimercado Copesul” are valued at its market value at period-end with gain and losses recognized in the statement of income. Derivatives financial instruments, which include swaps and options (Note 6) are recorded at fair value with realized and unrealized gains and losses recognized in income. | ||
| (c) | Allowance for doubtful accounts | |
| The Company has no allowance for doubtful accounts, since losses are not consider to be probable to occur in relation to accounts receivable. |
F-149
The allowance is established in an amount considered sufficient to cover probable losses on the non-collection of receivables.
The Company has no allowance for doubtful accounts, since losses are not expected to occur in relation to accounts receivable.
Inventories are stated at average cost of acquisition or production, adjusted to market value, when lower.
Investments are recorded at acquisition cost and adjusted to market value, when applicable.
Property, plant and equipment are stated at cost, plus revaluation, less accumulated depreciation. Depreciation is calculated on the straight-line method in accordance with the estimated useful lives of assets, supported by an independent appraisal report, as shown in Note 12.
COPESUL—COMPANHIA PETROQUÍMICA DO SUL
NOTES TO THE CONSOLIDATED FINANCIAL STATEMENTS—(Continued)Table of Contents
2005 F-150COPESUL — Companhia Petroquímica do SulNotes to the Consolidated Financial Statements
at December 31, 20042006 and 2003
All amounts in millions of reais, unless otherwise indicated(g)(d)Inventories Inventories are stated at average cost of acquisition or production, adjusted to market value, when lower. (e) Investments Investments are recorded at acquisition cost and adjusted to market value, when applicable. (f) Property, plant and equipment Property, plant and equipment are stated at cost, plus revaluation, less accumulated depreciation. Depreciation is calculated on the straight-line method in accordance with the estimated useful lives of assets, supported by an independent appraisal report, as shown in Note 12. (g) Deferred charges Deferred charges include pre-operating expenses related to expansion, projects for new products and systems, and organizational restructuring expenditures, amortized at the rate of 20% per annum.(h)Deferred charges include pre-operating expenses related to expansion, projects for new products and systems and organizational restructuring expenditures, amortized at the rate of 20% per year (p.a.), as shown in Note 13. (h) Rights and obligations Rights and obligations subject to monetary or exchange variation are stated at their restated amounts at the balance sheet date, on a daily prorated basis.(i)Rights are stated at cost or realization value, including, when applicable, interest and monetary restatements and exchange rate variations. Liabilities are recognized at their known or calculable values, including corresponding charges, monetary restatements and exchange rate variations when applicable. (i) Provision for programmed maintenance Up to December 31, 2005, the Provision for Programmed maintenance was set up accruing in advance the estimated costs of scheduled maintenance stoppage, especially the general stoppage that occurs every six years. The most recent stoppage of Plant 1 occurred in the first half of 2001 and the next one should be in 2008. The most recent stoppage of Plant 2 took place in November 2005 and the next one is planned for November 2011. Due to the change of accounting practice, the provision for programmed maintenance, beginning on January 1, 2006, was totally reversed against retained earnings as established by Deliberation of the Brazilian Securities and Exchange Commission — CVM no. 489 of October 3, 2005 and Technical Interpretation — IT IBRACON no. 01/2006 and its effects are shown in Note 19 (e) (i).
This provision represents the estimated costs to be incurred in maintenance of equipment during scheduled stoppages, which occurs every six years. Total expected costs for the shut-down are provided for in advance of the shut-down on a straight-line basis over the period between one shut-down and the next scheduled one. The last scheduled stoppage of Plant 1 occurred in the first half of 2001, and the next such stoppage should be in 2007. The scheduled stoppage for Plant 2 is expected for November 2005.
Deferred income tax and social contribution on temporary differences were fully recognized at current rates, considering that realization is probable.
Income tax and social contribution are provided based on taxable income determined in accordance with current tax legislation.
Income and expenses are determined on the accrual basis.
In accordance with IBRACON Accounting Standards and Procedures (NPC) 20, the Company is presenting the consolidated statements of cash flows for the years ended December 31, 2004,2003 and 2002.
| 2004 | 2003 | |||
Cash and banks—checking account | 1 | 10 | ||
Marketable securities | ||||
Investments of Fundo Copesul de Investimento Financeiro | ||||
Bank Deposit Certificates (CDB) | 87 | 90 | ||
Financial Brazilian Government Treasury Bills (LFT) | 2 | 8 | ||
Mutual Fund Quotas | — | 84 | ||
Bank Deposit Certificates (CDB) | 2 | 23 | ||
Mutual Fund Quotas (FAQ) | — | 211 | ||
Collection account | 4 | — | ||
Government securities | 78 | — | ||
Overnight deposits | 1 | 30 | ||
| 175 | 456 | |||
COPESUL—COMPANHIA PETROQUÍMICA DO SUL
NOTES TO THE CONSOLIDATED FINANCIAL STATEMENTS—(Continued)Table of Contents
2005 Local customers Foreign customers Swap with anticipatory breach clause Swap receivables Total—current assets Options payable Swap payable Total—current liabilities F-151COPESUL — Companhia Petroquímica do SulNotes to the Consolidated Financial Statements
at December 31, 20042006 and 2003
All amounts in millions of reais, unless otherwise indicated5Trade Accounts Receivable—Third PartiesAs from January 1, 2006 and in accordance with IT IBRACON 01/2006 no provision is recognized for programmed maintenance. IT IBRACON 01/2006 establishes that “no provision is recognized for costs that need to be incurred to operate in the future. The only liabilities recognized in the balance sheet of an entity are those that exist at the balance sheet date.” As from January 1, 2006 amounts incurred in programmed maintenance are capitalized and amortized over the estimated period to the next programmed maintenance. 2004 2003 86 58 104 40 190 98 6(j) SwapIncome tax and Options Receivables and Payablessocial contributionThese transactions were carried out to protect the Company against the impact of exchange rate devaluations and were contracted mainly through Fundo Copesul de Investimento Financeiro (the “Fund”), managed by Copesul—Companhia Petroquímica do Sul, the custodian and administrator of which is Banco Citibank S.A.The Fund has been consolidated, and its assets and liabilities were classified in accordance with the nature of the respective accounts. Amounts receivable 2004 2003 — 9 1 1 1 10 Amounts payable 2004 2003 3 15 5 25 8 40 7Marketable Securities 2004
Deferred income tax and social contribution on temporary differences were fully recognized at current rates, considering that its realization is probable.Receivables Securitization Fund (FIDC) (*)26Term deposit55
Income tax and social contribution are provided based on taxable income determined in accordance with current tax legislation.Total(k) 81Determination of results of operationsCurrent69
Income and expenses are determined on the accrual basis.Long-term receivables(l) 12Statement of cash flows (*In accordance with IBRACON (“Instituto dos Auditores Independentes do Brasil”)On March 1, 2004, Accounting Standards and Procedures (NPC) 20, the Company raised funds throughis presenting the Copesul Receivables Securitization Fund (FIDC). The Fund is managed by Votorantim Assets and has net assetsconsolidated statements of R$ 130 atcash flows for the years ended December 31, 2004, comprising R$ 1042006, 2005 and 2004. For purposes of the statements of cash flows, cash and banks comprises all cash in seniorhand, amounts deposited in banks and securities, quotas in mutual funds and R$ 26 in subordinated quotas, all of which are held by the Company. Amortization of principal, which started in November 2004, will occur over a period of 22 months. Of the amount raised by the Fund, R$ 125 isamounts invested in billed and unbilled receivables originatedother debt securities which might be sold by the Company from DSM Elastômeros Brasil Ltda. and Petroquímica Triunfo S.A. and R$ 25at any moment in receivables from several other Copesul customers.exchange for cash.
COPESUL—COMPANHIA PETROQUÍMICA DO SULTable of Contents
NOTES TO THE CONSOLIDATED FINANCIAL STATEMENTS—(Continued)
2005 Raw materials Finished products Resupply and other materials Chemical products Intermediary products Provision for adjustment to market value Advances for supply of raw material F-152Notes to the Consolidated Financial Statements
at December 31, 20042006 and 2003
All amounts in millions of reais, unless otherwise indicated84InventoriesCash and banks Inventories are comprised as follows: 2004 2003 284 103 62 43 63 59 11 9 7 4 — (1 ) — 66 427 283 2006 2005 Cash and banks — checking account 7 6 Marketable securities Investments of Fundo de Investimento Financeiro Multimercado Copesul Bank Deposit Certificates 88 43 Financial Brazilian Government Treasury Bills 13 12 National Treasury Bills 1 1 Mutual Fund quotas 12 13 Receivables investment Fund — FIDC 9 Debentures and other debt securities 43 15 Bank Deposit Certificates 13 Government securities Overnight and term deposits 37 1 201 113 95Trade accounts receivable — Third parties 2006 2005 Local customers 121 103 Foreign customers 74 46 195 149
| 6 | Swap and options receivables and payables | |
| The Company entered into operations involving options with respect to US dollars called ‘Box Options’ as commented below. Its purpose has been to invest cash resources at rates higher than other available investment options. The Company also entered into swap operations which were entered into by Fundo de Investimento Financeiro Multimercado Copesul, whose custodian and manager is Banco Santander Brasil S.A. |
| Amounts receivable | ||||||||
| 2006 | 2005 | |||||||
| Swap receivables | 27 | 2 | ||||||
| Swap with anticipatory breach clause | 1 | |||||||
| Options — Box operations | 37 | 50 | ||||||
| Total — current assets | 64 | 53 | ||||||
| Amounts payable | ||||||||
| 2006 | 2005 | |||||||
| Options payable | 1 | |||||||
| Options — Box operations | 2 | |||||||
| Swap payable | 23 | 2 | ||||||
| Total — current liabilities | 23 | 5 | ||||||
| Box options are combined operations that involve both the purchase and the sale of options in US dollars for the same maturity at a certain price, so that, regardless of the future US dollar rate, the Company knows in advance the net result of such operations providing what the Company views as a fixed return over its investment. The value paid for the options, called premium, correspond to the amount invested by the Company and the sum redeemed will be the premium plus a pre-fixed rate of return. | ||
| Swaps correspond to cross-currency interest rate swaps by which the Company pays a fixed interest rate and receives a variable rate based on the Interbank Deposit Certificates — CDI rate. |
F-153
| 7 | Marketable securities |
| 2006 | 2005 | |||||||
| Receivables Securitization Fund (FIDC) (*) | 13 | |||||||
| Term deposits | 39 | 1 | ||||||
| Total | 39 | 14 | ||||||
| Current | (38 | ) | (13 | ) | ||||
| Long-term | 1 | 1 | ||||||
| (*) | The ‘Fundo Copesul de Investimentos em Direitos Creditórios’ — FIDC (Copesul Receivables Securitization Fund) was closed with amortization of the last installment on August 21, 2006. |
| 8 | Inventories | |
| Inventories are comprised as follows: |
| 2006 | 2005 | |||||||
| Raw materials | 234 | 267 | ||||||
| Raw materials in transit | 145 | 90 | ||||||
| Finished products | 99 | 46 | ||||||
| Spare parts and other materials | 73 | 75 | ||||||
| Chemical products | 7 | 8 | ||||||
| Intermediary products | 13 | 9 | ||||||
| 571 | 495 | |||||||
F-154
| 9 | Taxes and |
| Current | Long-term | |||||||
| 2004 | 2003 | 2004 | 2003 | |||||
Withholding income tax on financial investments | — | 26 | — | — | ||||
Prepaid income tax | — | 39 | — | — | ||||
Prepaid social contribution | — | 18 | — | — | ||||
Tax on Net Income (ILL)(a) | — | — | 48 | 46 | ||||
Additional State Income Tax (ADIRE)(b) | — | — | 33 | 30 | ||||
Deferred income tax on tax loss (c) | — | 3 | — | — | ||||
Deferred income tax on temporary additions (c) | 22 | 9 | 13 | 10 | ||||
Deferred social contribution on temporary additions (c) | 8 | 3 | 5 | 4 | ||||
Presumed PIS/COFINS credits | 1 | 1 | — | — | ||||
PIS recoverable | — | 4 | 1 | — | ||||
COFINS recoverable | 1 | — | 3 | — | ||||
ICMS recoverable | — | 20 | — | — | ||||
ICMS on acquisition of property, plant and equipment (d) | 4 | 3 | 8 | 3 | ||||
IPI recoverable and other | 2 | — | 4 | — | ||||
| 38 | 126 | 115 | 93 | |||||
| Current | Long-term | |||||||||||||||
| 2006 | 2005 | 2006 | 2005 | |||||||||||||
Deferred taxes | ||||||||||||||||
| Deferred income tax and social contribution on tax loss — CITI (c) | 1 | |||||||||||||||
| Deferred income tax on temporary additions (c) | 1 | 4 | 11 | 21 | ||||||||||||
| Deferred social contribution on temporary additions (c) | 1 | 2 | 4 | 8 | ||||||||||||
| 2 | 6 | 15 | 30 | |||||||||||||
Other taxes and charges recoverable | ||||||||||||||||
| Withholding income tax on financial investments | 4 | |||||||||||||||
| IRPJ and CSLL recoverable | 12 | 4 | ||||||||||||||
| Tax on Net Income (ILL) (a) | 54 | 51 | ||||||||||||||
| Additional State Income Tax (ADIR) (b) | 28 | 32 | ||||||||||||||
| ICMS on acquisition of property, plant and equipment (d) | 8 | 7 | 9 | 15 | ||||||||||||
| PIS recoverable | 1 | |||||||||||||||
| PASEP recoverable (h) | 15 | 23 | ||||||||||||||
| PIS on acquisition of property, plant and equipment (e) | 1 | |||||||||||||||
| COFINS recoverable | 3 | |||||||||||||||
| COFINS on acquisition of property, plant and equipment (e) | 2 | 1 | 2 | 1 | ||||||||||||
| Prepaid ICMS (f) | 72 | 20 | ||||||||||||||
| CSLL withheld — Law 10833 | 1 | |||||||||||||||
| IPI recoverable (g) | 5 | 4 | ||||||||||||||
| Other taxes and charges recoverable | 113 | 37 | 122 | 103 | ||||||||||||
| 115 | 43 | 137 | 133 | |||||||||||||
| (a) | This refers to the tax credit of |
| (b) | As of December 31, |
COPESUL—COMPANHIA PETROQUÍMICA DO SUL
NOTES TO THE CONSOLIDATED FINANCIAL STATEMENTS—(Continued)
at December 31, 2004 and 2003
All amounts in millions of reais, unless otherwise indicated
|
F-155
| (c) | The Company recorded deferred |
| 2006 | 2005 | |||||||
| % | % | |||||||
| 2006 | 17 | |||||||
| 2007 | 13 | 80 | ||||||
| 2008 | 3 | |||||||
| 2009 and after | 87 | |||||||
| 100.00 | 100.00 | |||||||
| (d) | As from August 2000, the Company started recording the ICMS credits paid on acquisitions of property, plant and equipment, |
Year | 2004 | 2003 | ||
2004 | — | 3 | ||
2005 | 4 | 1 | ||
2006 | 3 | 1 | ||
2007 | 3 | 1 | ||
2008 | 2 | — | ||
| 12 | 6 | |||
Current | 4 | 3 | ||
Long-term | 8 | 3 | ||
| 2006 | 2005 | |||||||
| 2006 | 8 | |||||||
| 2007 | 8 | 7 | ||||||
| 2008 | 6 | 6 | ||||||
| 2009 | 2 | 2 | ||||||
| 2010 | 1 | |||||||
| 17 | 23 | |||||||
| Current | (8 | ) | (8 | ) | ||||
| Long-term | 9 | 15 | ||||||
| The Company recognizes PIS and COFINS recoverable credits on the acquisitions of property, plant and equipment, which will be realized in 24 and 48 months depending on the asset acquired as permitted by Law 10865/04 and Decree 5222/04. |
F-156
Prepaid expenses comprise:
Realization terms | 2004 | 2003 | ||||
Insurance | Up to Nov/2005 (2003—up to Nov/2004) | 10 | 18 | |||
Chemical products (catalysts) | Up to Feb/2009 (2003—up to Mar/2008) | 7 | 7 | |||
Debt issuance costs | Up to Dec/2006 (2003—up to Apr/2007) | 1 | 4 | |||
Total, net | 18 | 29 | ||||
Current | 13 | 22 | ||||
Long-term | 5 | 7 | ||||
Chemical products (catalysts) are used as agents that promote a chemical reaction in the productionTable of basic petrochemicals. The expected period over which they will be consumed is 5 years.Contents
Financial expenses relate
The Company has judicial deposits and has recorded a provision for contingencies relating to income tax in the amount of R$ 2 Consolidated Financial Statements
at December 31, 2004 (2003—R$ 2) in connection with lawsuits.
COPESUL—COMPANHIA PETROQUÍMICA DO SUL
NOTES TO THE CONSOLIDATED FINANCIAL STATEMENTS—(Continued)
at December 31, 20042006 and 2003
2005
All amounts in millions of reais, unless otherwise indicated
| (f) | During 2006, the Company made an advance payment of amounts related to ICMS on future sales in the amount of 72 (2005 — R$ 20). The offset of the prepaid ICMS will be done in 6 equal payments, monthly and consecutives, adjusted by the ‘Unidade Padrão Fiscal do RS’ — UPF (Standard Fiscal Unit of RS) of 2007, beginning in January 2007. |
| (g) | The Company recognizes an IPI credit in the acquisitions of raw materials used in the production process. In order to use these credits, every quarter they are offset with federal taxes in accordance with Decree 4544/2002 and paragraph 4, article 16 of the Regulatory Instruction no 460/2004 of the Brazilian Revenue and Customs Secretariat. The long-term balance refers to the IPI Credit Bonus that was judicially gained and will be realized by the end of 2008. |
| (h) | During 2006 the Company recognized a PASEP judicial tax credit in the amount of R$ 45, seeking the right to carry out the payments in accordance with Complementary Law 8/70, using as a calculation basis the revenue of the sixth month previous to the occurrence of the taxable event, in light of Resolution no. 49/95 of the Federal Senate in a final decision. This credit was recognized in the income statement for the year in “Other net operating income” in the amount of R$ 14 and financial income of R$ 30. | |
| The Company expects to settle the remaining balance at December 31, 2006 as follows: |
| PASEP credit with final favorable judgment and recognized in 2006 | 45 | |||
| Credit amount to be offset in 2006 with PIS | (8 | ) | ||
| PASEP balance at December 31, 2006 | 37 | |||
| 2007 | 15 | |||
| 2008 | 14 | |||
| 2009 | 8 | |||
| 37 | ||||
F-157
Since August 2002,
Also, the Company has civil, administrative and labor claims amounting to R$ 2 Consolidated Financial Statements
at December 31, 2004 (2003—R$ 0.3).
Annual depreciation rates—% | 2004 | 2003 | |||||||||
Revalued and restated cost | Accumulated depreciation | Net | Net | ||||||||
Equipment and installations | |||||||||||
Operations | 10 | 1,883 | (1,248 | ) | 635 | 748 | |||||
Utilities | 10 | 905 | (759 | ) | 146 | 176 | |||||
Storage and transfers | 10 | 423 | (282 | ) | 141 | 124 | |||||
Other | 10 to 20 | 86 | (61 | ) | 25 | 24 | |||||
Buildings and construction | 4 | 55 | (20 | ) | 35 | 34 | |||||
Improvements | 4 | 22 | (10 | ) | 12 | 12 | |||||
Land | 37 | — | 37 | 37 | |||||||
Construction in progress | 107 | — | 107 | 52 | |||||||
| 3,518 | (2,380 | ) | 1,138 | 1,207 | |||||||
Revaluations of property, plant2006 and equipment made in 1983 and 1989, based on appraisal reports issued by specialized companies, produced the following effects on the balance sheet:
| 2004 | 2003 | ||||||||
| Revaluation | Accumulated realization | Net | Net | ||||||
Equipment and installations | 1,338 | (1,242 | ) | 96 | 140 | ||||
Buildings and construction | 18 | (6 | ) | 12 | 5 | ||||
Improvements | 7 | (2 | ) | 5 | 2 | ||||
Land | 32 | (1 | ) | 31 | 32 | ||||
Total | 1,395 | (1,251 | ) | 144 | 179 | ||||
Revaluation reserve | 144 | 179 | |||||||
Realization of the revaluation reserve occur through depreciation and disposals of the revalued assets each year. The amounts realized are transferred directly to retained earnings.
The Company did not set up a provision for deferred income tax on the balance of the revaluation reserve, since CVM Deliberation 183/95 determines that such provision is only required on revaluations made as from July 1, 1995. The revaluation reserve is taxable when realized through depreciation and disposals of items, and the related tax payable is recorded as a charge to Retained Earnings within stockholders’ equity . Considering current tax legislation, the revaluation reserve is subject to future taxation estimated at R$ 33 (2003—R$ 43).
COPESUL—COMPANHIA PETROQUÍMICA DO SUL
NOTES TO THE CONSOLIDATED FINANCIAL STATEMENTS—(Continued)
at December 31, 2004 and 2003
2005
All amounts in millions of reais, unless otherwise indicated
| Prepaid expenses | ||
| Prepaid expenses comprise: |
Deferred charges comprise:
Annual amortization rates—% | 2004 | 2003 | |||||||||
Restated cost | Accumulated amortization | Net | Net | ||||||||
Development programs | 20 | 14 | (4 | ) | 10 | 10 | |||||
Pre-operating expenses—Plant 2 | 20 | 40 | (40 | ) | — | 4 | |||||
| 54 | (44 | ) | 10 | 14 | |||||||
| Realization period | 2006 | 2005 | ||||||||
| Insurance | Up to Nov/2007 (2005 - up to Nov/2006) | 10 | 10 | |||||||
| Chemical products (catalysts) | Up to Nov/2018 (2005 - up to Nov/2011) | 8 | 10 | |||||||
| Total, net | 18 | 20 | ||||||||
| Current | (14 | ) | (14 | ) | ||||||
| Long-term | 4 | 6 | ||||||||
| The long-term portion refers to chemical products (catalysts) which are used as agents that promote a chemical reaction in the production of basic petrochemicals. Their average useful life and amortization period is 6 years. | ||
| 11 | Judicial deposits |
| 2004 | 2003 | |||
Local | 32 | 37 | ||
Foreign | 114 | 50 | ||
| 146 | 87 | |||
| 2006 | 2005 | |||||||
| Tax matters: | ||||||||
| Income tax | 2 | 2 | ||||||
| CIDE on technical assistance service | 4 | 3 | ||||||
| Income tax on technical assistance service | 1 | 1 | ||||||
| 7 | 6 | |||||||
| Labor, Civil and Administrative matters | 2 | 2 | ||||||
| 9 | 8 | |||||||
| The Company has judicial deposits and |
F-158
Liabilities for loans and financing are as follows:
Annual charges as of December 2004 (%) | 2004 | 2003 | ||||||
Foreign currency | ||||||||
Credit lines (2003—US$ 109 million) | — | 315 | ||||||
Financing (Plant 2) (2003—US$ 111 million) | — | 321 | ||||||
Loans and financing (US$ 52 million; 2003—US$ 49 million) | Currency basket plus 10.85 Libor plus 3.46 and 2.82 to 7.65 | 139 | 142 | |||||
| 139 | 778 | |||||||
Current | (65 | ) | (458 | ) | ||||
Long-term liabilities | 74 | 320 | ||||||
Local currency | ||||||||
Credit lines | — | 45 | ||||||
Loans and financing | TJLP plus 1 to 5.5 | 36 | 25 | |||||
Supplier financing | — | 24 | ||||||
Financing (Plant 2) | TJLP plus 3.5 to 4.0 | 50 | 103 | |||||
Copesul Receivables Securitization Fund | 112 of CDI | 131 | — | |||||
| 217 | 197 | |||||||
Current | (148 | ) | (134 | ) | ||||
Long-term liabilities | 69 | 63 | ||||||
Total financing | 356 | 975 | ||||||
Current | (213 | ) | (592 | ) | ||||
Long-term liabilities | 143 | 383 | ||||||
CDI—Interbank Deposit Certificate TJLP—Long-Term Interest Rate |
COPESUL—COMPANHIA PETROQUÍMICA DO SUL
NOTES TO THE CONSOLIDATED FINANCIAL STATEMENTS—(Continued)Table of Contents
2005 F-159COPESUL — Companhia Petroquímica do SulNotes to the Consolidated Financial Statements
at December 31, 20042006 and 2003
All amounts in millions of reais, unless otherwise indicated12 Property, plant and equipment 2006 2005 Annual depreciation Revalued rates - and restated Accumulated % (*) cost (*) depreciation Net Net Equipment and installations Operations 10 2,001 (1,466 ) 535 624 Utilities 10 910 (831 ) 79 116 Storage and transfers 10 434 (335 ) 99 119 Maintenance — CVM Del. No. 489/05 (**) 21 92 (35 ) 57 Other (***) 10 to 20 89 (69 ) 20 23 Buildings and construction 4 56 (23 ) 33 33 Improvements 4 22 (11 ) 11 11 Land 37 37 37 Construction in progress 141 141 143 Other 18 18 3,800 (2,770 ) 1,030 1,106 (*) weighted average rate that reflects the depreciation expense (Note 2 (f)). (**) supported by appraisal reports issued by specialized companies. (***) information technology equipment, furniture and fixtures, among others are included in this account. Certain items of fixed assets were given as guarantee for financing operations (Note 15 (d)). (a) Revaluations Revaluations of property, plant and equipment made in 1983 and 1989, based on appraisal reports issued by specialized companies, produced the following effects on the balance sheet: 2006 2005 Accumulated Revaluation realization Net Net Equipment and installations 1,338 (1,310 ) 28 62 Buildings and construction 17 (6 ) 11 11 Improvements 7 (2 ) 5 5 Land 32 (1 ) 31 31 Total 1,394 (1,319 ) 75 109 Revaluation reserve 75 109
In April 2004, the subsidiary Copesul International Trading, Inc. established a “Euro-Medium Term Note Program” guaranteed by Copesul—
| Realizations of the revaluation reserve occur through depreciation and disposals of the revalued assets each year. The amounts realized are transferred directly from revaluation reserve to retained earnings, considering the related effects of income tax and social contribution at the current rates. | ||
| The Company did not set up a provision for deferred income tax and deferred social Contribution on the balance of the revaluation reserve, since CVM Deliberation 183/95 determines that such provision is only required on revaluations made as from July 1, 1995. The revaluation reserve is taxable when realized through depreciation and disposals of items. Considering current tax legislation, the revaluation reserve is subject to future taxation estimated as follows: |
| 2006 | 2005 | |||||||
Income tax | ||||||||
| Balance of revaluation reserve | 75 | 108 | ||||||
| Revaluation reserve on land | (31 | ) | (31 | ) | ||||
| Income tax calculation basis | 44 | 77 | ||||||
| Income tax (rate - 25%) | (11 | ) | (19 | ) | ||||
Social contribution | ||||||||
| Income tax calculation basis | 44 | 77 | ||||||
| Difference regarding IPC/BTNF on revaluation reserve balance | (22 | ) | (40 | ) | ||||
| Social contribution calculation basis | 22 | 37 | ||||||
| Social contribution (rate - 9%) | (2 | ) | (3 | ) | ||||
| Income tax and social contribution | (13 | ) | (22 | ) | ||||
| During this year, the portion of R$ 33 (2005 — R$ 35) was transferred to retained earnings as a result of realization of the revaluation reserve, as shown in the changes in stockholders’ equity. The tax effect on the realization was R$ 10 (2005 — R$ 10). | ||
| (b) | Acquisitions of property, plant and equipment | |
| COPESUL invested in 2006 the amount of R$ 126 (R$ 171 in 2005). The main investments are R$ 38 — replacement equipment to be used during scheduled programmed maintenance ; R$ 19 - operational reliability, technological updating, and profitability increase projects to be |
F-160
| implemented during the PGM that is forecasted to take place in 2008; R$ 18 — industrial automation programs; R$ 10 — replacement of coils and revamping (technological updating) the furnaces; R$ 5 — building of Butadiene Unit, and R$ 7 — conversion of the MTBE unit to ETBE. The remaining balance of R$ 29 refers to various investment projects. | ||
| 13 | Deferred charges | |
| Deferred charges comprises: |
| 2006 | 2005 | |||||||||||||||||||
| Annual | ||||||||||||||||||||
| amortization | Restated | Accumulated | ||||||||||||||||||
| rates - % | cost | amortization | Net | Net | ||||||||||||||||
| Development programs and other | 20 | 18 | (8 | ) | 10 | 11 | ||||||||||||||
| 18 | (8 | ) | 10 | 11 | ||||||||||||||||
| 14 | Suppliers — Third parties |
| 2006 | 2005 | |||||||
| Local | 30 | 27 | ||||||
| Foreign | 260 | 127 | ||||||
| 290 | 154 | |||||||
F-161
| 15 | Loans and financing | |
| (a) | Liabilities for loans and financing are as follows: |
| Annual | ||||||||||||||||
| Index | charges (%)* | 2006 | 2005 | |||||||||||||
Foreign currency | ||||||||||||||||
| Financing (investments) (US$2 million) | Currency basket and US$ | 8.70 | 5 | |||||||||||||
| Financing and loans (US$3 million; 2004- US$18 million) | Currency Basket | 9.76 | 6 | 44 | ||||||||||||
| 11 | 44 | |||||||||||||||
Local currency | ||||||||||||||||
| Loans and financing | TJLP | 11.67 | 40 | 49 | ||||||||||||
| Hot money, “Compror”, NCE, and BACEN Resolution no. 2770 | CDI | 13.42 | 23 | 172 | ||||||||||||
| Financing (investments) | TJLP | 10.00 | 83 | 50 | ||||||||||||
| Copesul Receivables Securitization Fund | CDI | 57 | ||||||||||||||
| 146 | 328 | |||||||||||||||
| 157 | 372 | |||||||||||||||
| Current liabilities | (50 | ) | (288 | ) | ||||||||||||
| Long-term liabilities | 107 | 84 | ||||||||||||||
| * | weighted average rate that reflects charges on loans. |
| NCE — Export Credit Note CDI — Interbank Deposit Certificate TJLP — Long-Term Interest Rate | ||
| In April 2004, Copesul International Trading, Inc. (CITI) established the “Euro Medium-term Note Program” guaranteed by COPESUL — Companhia Petroquímica do Sul for the issuance of US$ 125 million Notes (“Series I Notes”) in the foreign market (United States of America and Canada). In the last quarter of 2004, the CITI issued 100 million Notes, corresponding to US$ 100,000 thousand, which are held in treasury, without cost to the Company. In December 2006, all the contractual commitments were closed. |
F-162
| (b) | The changes in loans and financing were as follows: |
| Current | Long-term | Total | |||||||
At December 31, 2002 | 786 | 605 | 1,391 | ||||||
Additions | 752 | 76 | 828 | ||||||
Interest | 101 | — | 101 | ||||||
Transfer to short-term | 218 | (218 | ) | — | |||||
Amortization | (1,170 | ) | — | (1,170 | ) | ||||
Monetary and exchange variation | (95 | ) | (80 | ) | (175 | ) | |||
At December 31, 2003 | 592 | 383 | 975 | ||||||
Additions | 311 | 121 | 432 | ||||||
Interest | 55 | 3 | 58 | ||||||
Transfer to short-term | 195 | (195 | ) | — | |||||
Amortization | (950 | ) | (174 | ) | (1,124 | ) | |||
Monetary and exchange variation | 10 | 5 | 15 | ||||||
At December 31, 2004 | 213 | 143 | 356 | ||||||
| Current | Long-term | Total | ||||||||||
| At December 31, 2004 | 213 | 143 | 356 | |||||||||
| Additions | 1,012 | 77 | 1,089 | |||||||||
| Interest | 39 | 6 | 45 | |||||||||
| Transfer to short-term | 64 | (64 | ) | |||||||||
| Amortization | (1,037 | ) | (79 | ) | (1,116 | ) | ||||||
| Monetary and exchange variation | (3 | ) | 1 | (2 | ) | |||||||
| At December 31, 2005 | 288 | 84 | 372 | |||||||||
| Additions | 604 | 47 | 651 | |||||||||
| Interest | 28 | 28 | ||||||||||
| Transfer to short-term | 25 | (25 | ) | |||||||||
| Amortization | (893 | ) | (893 | ) | ||||||||
| Monetary and exchange variation | (2 | ) | 1 | (1 | ) | |||||||
| At December 31, 2006 | 50 | 107 | 157 | |||||||||
| During 2006, the subsidiary CITI settled some loans for working capital and the additions and amortizations the Company made refer mostly to Export Credit Note operations. | ||
| During the third quarter of 2006, the Company entered into a credit line agreement with BNDES - Banco Nacional de Desenvolvimento Social in the amount of R$ 338 for future investment in order to improve its manufacturing facilities. As of December 31, 2006 the Company had used R$ 43 of this credit line. | ||
| (c) | Long-term financing falls due as follows: |
Year | 2004 | 2003 | ||
2005 | — | 276 | ||
2006 | 132 | 78 | ||
2007 | 5 | 28 | ||
2008 | 4 | 1 | ||
2009 | 2 | — | ||
| 143 | 383 | |||
| Year | 2006 | 2005 | ||||||
| 2007 | 22 | |||||||
| 2008 | 33 | 23 | ||||||
| 2009 | 30 | 20 | ||||||
| 2010 | 22 | 13 | ||||||
| 2011 | 14 | 6 | ||||||
| 2012 | 8 | |||||||
| 107 | 84 | |||||||
| Guarantees |
| The foreign currency financing are guaranteed in part by the mortgage of plant 2 and by letter of guarantee. | ||
COPESUL—COMPANHIA PETROQUÍMICA DO SUL
NOTES TO THE CONSOLIDATED FINANCIAL STATEMENTS—(Continued)
at December 31, 2004 and 2003
All amounts in millions of reais, unless otherwise indicated
| Local currency financing via FINEM and FINAME programs is guaranteed by Plant 2 and by the financed machinery and equipment, respectively. |
F-163
The changes in advances contracted with financial institutions relating to exports to be invoiced are as follows:
| Exports already invoiced and provided as source of repayment of export drafts | Short-term | Long-term | Total | |||||||||
At December 31, 2002 | 87 | 287 | 131 | 505 | ||||||||
Additions | — | 211 | 514 | 725 | ||||||||
Interest | — | 25 | — | 25 | ||||||||
Transfer to short-term | — | 117 | (117 | ) | — | |||||||
New export receivables | 466 | (466 | ) | — | — | |||||||
Amortization | (535 | ) | (25 | ) | — | (560 | ) | |||||
Monetary and exchange variation | (4 | ) | (28 | ) | (28 | ) | (60 | ) | ||||
At December 31, 2003 | 14 | 121 | 500 | 635 | ||||||||
Additions | — | 226 | 114 | 340 | ||||||||
Interest | — | 43 | — | 43 | ||||||||
Transfer to short-term | — | 371 | (371 | ) | — | |||||||
New export receivables | 677 | (677 | ) | — | — | |||||||
Amortization | (507 | ) | (48 | ) | (133 | ) | (688 | ) | ||||
Monetary and exchange variation | (14 | ) | (15 | ) | (7 | ) | (36 | ) | ||||
At December 31, 2004 | 170 | 21 | 103 | 294 | ||||||||
Export drafts bear U.S. dollar exchange variation plus average interest of 9.97% per annum (2003—5.95%), which are recorded in the statement of income as financial expenses.
COPESUL—COMPANHIA PETROQUÍMICA DO SUL
NOTES TO THE CONSOLIDATED FINANCIAL STATEMENTS—(Continued)
Consolidated Financial Statements
at December 31, 20042006 and 2003
2005
All amounts in millions of reais, unless otherwise indicated
Long-term export drafts fall due as follows:
Year | 2004 | 2003 | ||
2005 | — | 323 | ||
2006 | — | 33 | ||
2007 | 103 | 24 | ||
2008 | — | 24 | ||
2009 | — | 24 | ||
2010 | — | 24 | ||
After 2010 | — | 48 | ||
| 103 | 500 | |||
Upon advanced settlement of the export drafts, R$ 14 was paid as early liquidation penalty.
| The financing contracted with the Banco Nacional de Desenvolvimento Econômico e Social — BNDES, on September 9, 2005, amounting to R$ 50 million, for the installation of a pyrolysis furnace, has as a guarantee a guarantee letter issued by the Banco Regional de Desenvolvimento do Extremo Sul — BRDE. For the rest of the investment financing, the Company placed plant 2 as guarantee. |
Transactions with related parties mainly include commercial transactions and intercompany loans and are classified in the balance sheet according to the applicable legislation and maturity dates.
Loans receivable from related parties were granted by the Company as follows:
The NCE operations in the amount of R$ 23 (2005 — R$ 123) are guaranteed by COPESUL itself in the same NCE contracted document. | ||||
| 16 |
Export drafts | |||
| ||||
| Asset | Liability | |||||||||||||||
| Exports already | ||||||||||||||||
| invoiced and | ||||||||||||||||
| provided as | ||||||||||||||||
| source of | ||||||||||||||||
| repayment of | ||||||||||||||||
| export drafts | Short-term | Long-term | Total | |||||||||||||
| At December 31, 2004 | 170 | 21 | 103 | 294 | ||||||||||||
| Additions | 190 | 190 | ||||||||||||||
| Interest | 17 | 17 | ||||||||||||||
| New export receivables | 209 | (209 | ) | |||||||||||||
| Amortization | (339 | ) | (19 | ) | (358 | ) | ||||||||||
| Monetary and exchange variation | (22 | ) | 1 | (12 | ) | (33 | ) | |||||||||
| At December 31, 2005 | 18 | 1 | 91 | 110 | ||||||||||||
| Additions | 531 | 138 | 669 | |||||||||||||
| Interest | 13 | 13 | ||||||||||||||
| Transfer to short-term | 35 | (35 | ) | |||||||||||||
| New export receivables | 526 | (526 | ) | |||||||||||||
| Amortization | (545 | ) | (12 | ) | (49 | ) | (606 | ) | ||||||||
| Monetary and exchange variation | 2 | (3 | ) | (6 | ) | (7 | ) | |||||||||
| At December 31, 2006 | 1 | 39 | 139 | 179 | ||||||||||||
| ||||
| ||||
|
F-164
The criterion used to define the interest rate for these loans is the opportunity cost of applying the funds, increased by charges and taxes due, plus a spread of 1% per annum.
The Company has given guarantees to financial institutions in relation to trade account receivables with related parties transferred to such financial institutions under “vendor” transactions, as follows:
| 2004 | 2003 | |||
Braskem S.A. | 573 | 111 | ||
Ipiranga Petroquímica S.A. | 244 | 232 | ||
Innova S.A. | 2 | 2 | ||
| 819 | 345 | |||
COPESUL—COMPANHIA PETROQUÍMICA DO SUL
NOTES TO THE CONSOLIDATED FINANCIAL STATEMENTS—(Continued)Table of Contents
2005 F-165COPESUL — Companhia Petroquímica do SulNotes to the Consolidated Financial Statements
at December 31, 20042006 and 2003
All amounts in millions of reais, unless otherwise indicatedExport drafts to be invoiced bear exchange variation plus average interest of 7.11% p.a. (11.75% in 2005), which are recorded in the statement of income as financial expenses. Long-term export drafts will fall due as shown below. 2006 2005 2007 91 2009 75 2010 64 139 91 17 Taxes and charges payable 2006 2005 ICMS payable 22 26 ICMS — tax replacement 3 5 CIDE on fuels payable 16 6 IRRF on interest on capital payable 3 3 Other retentions payable 1 2 45 42
| Assets | Liabilities | Financial expenses | Financial income | Sales | Purchases | ||||||||||||||||||||||||||||
| 2004 | 2003 | 2004 | 2003 | 2004 | 2003 | 2002 | 2004 | 2003 | 2002 | 2004 | 2003 | 2002 | 2004 | 2003 | 2002 | ||||||||||||||||||
Braskem S.A . (OPP S.A up to 6/22/2003) | 14 | 259 | — | 4 | — | — | — | 8 | 113 | 8 | 2,349 | 1,772 | 1,224 | 100 | 102 | 32 | |||||||||||||||||
Ipiranga Petroquímica S.A. | 15 | 200 | 2 | 1 | — | — | 1 | 7 | 25 | 77 | 1,713 | 1,216 | 894 | 96 | 79 | 40 | |||||||||||||||||
Refinaria Alberto Pasqualini—REFAP S.A. | — | — | — | 7 | — | — | — | — | — | — | — | — | 2 | 388 | 556 | 412 | |||||||||||||||||
Petróleo Brasileiro S.A.—PETROBRAS | — | — | — | 14 | — | — | — | — | — | — | — | — | — | 1,781 | 1,422 | 955 | |||||||||||||||||
Petrobras Distribuidora S.A. | — | 1 | — | 1 | — | — | — | — | — | — | 14 | 16 | 12 | 19 | 17 | 9 | |||||||||||||||||
PSA Trading AVV | — | — | — | — | — | — | — | — | — | 27 | — | — | — | — | — | — | |||||||||||||||||
Odebrecht Química S.A. | — | — | — | — | — | — | — | — | — | 17 | — | — | — | — | — | — | |||||||||||||||||
CPN—Incorporated Limited. | — | — | — | — | — | — | — | — | — | — | 36 | — | — | — | — | — | |||||||||||||||||
Natal Trading Ltd. | — | 45 | — | — | — | — | — | 6 | 1 | — | — | — | — | — | — | — | |||||||||||||||||
Lantana Trading Co. Ltd. | 146 | 223 | — | — | — | — | — | 52 | (17 | ) | 58 | — | — | — | — | — | — | ||||||||||||||||
| 175 | 728 | 2 | 27 | — | — | 1 | 73 | 122 | 187 | 4,112 | 3,004 | 2,132 | 2,384 | 2,176 | 1,448 | ||||||||||||||||||
Current | 29 | 398 | 2 | 27 | |||||||||||||||||||||||||||||
Long-term | 146 | 330 | — | — | |||||||||||||||||||||||||||||
The Company is the guarantor of a borrowing contracted by Ipiranga
| Current | Long-term | |||||||
| 2004 | 2003 | 2004 | 2003 | |||||
Corporate income tax and social contribution | 32 | 42 | — | — | ||||
Deferred income tax on accelerated depreciation | 1 | 1 | 3 | 4 | ||||
| 33 | 43 | 3 | 4 | |||||
| 2004 | 2003 | 2002 | |||||||
Income before income tax and social contribution, net of employees and management profit sharing and before reversal of interest on own capital | 701 | 127 | 36 | ||||||
Social Contribution on Net Income (CSLL) | |||||||||
Social Contribution (9%) | (63 | ) | (11 | ) | (3 | ) | |||
Permanent additions | |||||||||
Realization of revaluation reserve—difference In IPC/BTNF indices | (2 | ) | (2 | ) | — | ||||
Foreign profits [not taxed/taxed at different rate] | (7 | ) | (4 | ) | (2 | ) | |||
Amortization and depreciation—Law No. 8200/91 | (1 | ) | (1 | ) | (2 | ) | |||
Other | (1 | ) | — | (4 | ) |
COPESUL—COMPANHIA PETROQUÍMICA DO SUL
NOTES TO THE CONSOLIDATED FINANCIAL STATEMENTS—(Continued)
Consolidated Financial Statements
at December 31, 20042006 and 2003
2005
All amounts in millions of reais, unless otherwise indicated
| 2004 | 2003 | 2002 | |||||||
Permanent exclusions | |||||||||
Equity in results | 7 | 4 | 6 | ||||||
Other | — | — | (1 | ) | |||||
Social contribution expense | (67 | ) | (14 | ) | (6 | ) | |||
Income tax (IR) | |||||||||
Income tax (25%) | (175 | ) | (32 | ) | (9 | ) | |||
Permanent additions | |||||||||
Provision for loss of investments | |||||||||
Foreign profits [not taxed/taxed at different rate] | (20 | ) | (12 | ) | (6 | ) | |||
Other | (1 | ) | (1 | ) | (1 | ) | |||
Permanent exclusions | |||||||||
Equity in results | 20 | 12 | 17 | ||||||
Other | 1 | 1 | (2 | ) | |||||
Income tax expense | (175 | ) | (32 | ) | (1 | ) | |||
Total income tax and social contribution in the income statement | (242 | ) | (46 | ) | (7 | ) | |||
The Company elected to pay income tax and social contribution based on annual taxable income, with prepayment based on the quarterly trial balances.
| Income tax and social contribution | ||
| Income tax and social contribution are calculated based on official rates. Their composition as of December 31, 2006 and 2005 is as follows: | ||
| (a) | Composition of deferred income tax and social contribution |
| 2006 | 2005 | |||||||||||||||
| Income | Social | Income | Social | |||||||||||||
| Calculation basis for deferred income tax and social contribution | Tax | Contribution | Tax | Contribution | ||||||||||||
| Provision for administrative, civil and labor contingencies | 29 | 29 | 7 | 8 | ||||||||||||
| Provision for fiscal contingencies — IR and CIDE on services abroad | 5 | 5 | 4 | 4 | ||||||||||||
| Provision for contingencies — pension plan | 9 | 9 | 4 | 4 | ||||||||||||
| Exchange variation — deferred | (26 | ) | (26 | ) | ||||||||||||
| Provision for programmed maintenance | 68 | 68 | ||||||||||||||
| Other provisions | 8 | 8 | 19 | 19 | ||||||||||||
| Copesul International Trading tax loss | 2 | 2 | ||||||||||||||
| Accelerated depreciation Law 11051/05 | (15 | ) | ||||||||||||||
| Accelerated depreciation incentive | (4 | ) | (7 | ) | ||||||||||||
| Deferred taxes calculation basis | 21 | 10 | 97 | 105 | ||||||||||||
| Deferred income tax (25%) | 5 | 24 | ||||||||||||||
| Deferred social contribution (9%) | 1 | 9 | ||||||||||||||
| Deferred total taxes | 5 | 1 | 24 | 9 | ||||||||||||
Assets | ||||||||||||||||
| Short-term | 2 | 1 | 4 | 1 | ||||||||||||
| Long-term | 11 | 4 | 22 | 8 | ||||||||||||
| 13 | 5 | 26 | 9 | |||||||||||||
Liabilities | ||||||||||||||||
| Short-term | (1 | ) | ||||||||||||||
| Long-term | (8 | ) | (4 | ) | (1 | ) | ||||||||||
| (8 | ) | (4 | ) | (2 | ) | |||||||||||
| 5 | 1 | 24 | 9 | |||||||||||||
| Changes in deferred taxes | ||||||||||||||||
| Recognized in income | (2 | ) | (2 | ) | (7 | ) | (3 | ) | ||||||||
| Recognized in stockholders’ equity | (17 | ) | (6 | ) | ||||||||||||
| (19 | ) | (8 | ) | (7 | ) | (3 | ) | |||||||||
| Deferred income tax and social contribution assets and liabilities arose from temporary differences and are recognized in accounting terms taking into consideration the probable realization of these taxes based on forecasts of future results prepared with basis on internal assumptions and on future economic scenarios that can, however, may change. |
F-166
(a) The Company has ongoing labor claims, mainly related to salary equivalence claims and overtime. A provision for these contingencies was set up considering the estimates
Table of legal advisors for probable losses. Judicial deposits were made when required.Contents
(b) There are also federal tax lawsuits related
(c) For income tax and CIDE on the payment of technical assistance services, the Company set up provisions at amounts equal to the judicial deposits (Note 11).
(d) A civil lawsuit is still in progress against the Company by the minority stockholder Petroquímica Triunfo S.A., questioning aspects involved in the privatization process related to the conversion of preferred shares into common shares before the privatization auction and the preference for subscription of Company shares in relation to the bidders in the auction. Management and the legal advisors do not expect losses to arise from this process.
(e) In September 2003, the Company was assessed by Federal Tax Auditors due to alleged failure to pay PIS and COFINS on certain transactions. The Company appealed the tax assessment notice because it understood that the assessment arose from an incorrect interpretation of the applicable legal rules by the tax authorities.
Based on the opinion of its legal advisors and external tax consultants, the Company decided not to set up a provision in relation to the mentioned tax assessment, considering the possibility of a favorable outcome to the appeal. The restated amount of the assessments totals R$ 200.
COPESUL—COMPANHIA PETROQUÍMICA DO SUL
NOTES TO THE CONSOLIDATED FINANCIAL STATEMENTS—(Continued)
Consolidated Financial Statements
at December 31, 20042006 and 2003
2005
All amounts in millions of reais, unless otherwise indicated
At December 31, fully subscribed and paid-up capital comprises 15,021,716,784 common shares, with no par value.
The Company is authorized to increase capital up to the limit of R$ 1.1, without changing the by-laws, assuring preference to existing stockholders on subscription.
| (b) | Estimated realization period | |
| The values of the assets, net of the deferred tax liabilities, have the following expectations of realization: |
| Net credits | ||||||||
| 2006 | 2005 | |||||||
| 2006 | 6 | |||||||
| 2007 | 1 | 23 | ||||||
| 2010 | (1 | ) | (1 | ) | ||||
| 2011 | (4 | ) | ||||||
| 2015 and 2016 | 10 | 5 | ||||||
| 6 | 33 | |||||||
| Since the taxable basis of the income tax and social contribution on the net income arise from not only the profit that can be generated, but also the existence of non-taxable income, non-deductible expenses, fiscal incentives, and other variables, there is not an immediate correlation between the Company’s net income and the result of income tax and social contribution. Therefore, the expectation of using the tax credits should not be taken as a single indicator of the Company’s future results. | ||
| (c) | Reconciliation of income tax and social contribution |
| 2006 | 2005 | 2004 | ||||||||||
| Income before income tax and social contribution | 822 | 722 | 722 | |||||||||
Social contribution on net income (CSLL) | ||||||||||||
| Social contribution (9%) | (74 | ) | (65 | ) | (65 | ) | ||||||
| Permanent additions | ||||||||||||
| Realization of revaluation reserve — difference in IPC/BTNF | (1 | ) | (2 | ) | (2 | ) | ||||||
| Foreign profits | (2 | ) | (7 | ) | ||||||||
| Amortization and depreciation — Law 8200/91 | (1 | ) | (1 | ) | (1 | ) | ||||||
| Other | (1 | ) | 1 | |||||||||
| Permanent exclusions | ||||||||||||
| Positive equity in results | 2 | 7 | ||||||||||
| PDI fiscal incentive | 1 | |||||||||||
| Other | 2 | 5 | ||||||||||
| Social contribution expense (carryforward) | (74 | ) | (63 | ) | (67 | ) | ||||||
F-167
| 2004 | 2003 | |||
FUNDOPEM | 246 | 247 | ||
Fiscal incentives—Program for Technological and Industrial Development | 2 | — | ||
| 248 | 247 | |||
In September 1998, the Company started to set up a capital reserve based on the financial incentive
Table of the Company Operation Fund (FUNDOPEM) for the State of Rio GrandeContents
| 2006 | 2005 | 2004 | ||||||||||
| Social contribution expense (brought forward) | (74 | ) | (63 | ) | (67 | ) | ||||||
Income tax (IR) | ||||||||||||
| Income tax (25%) | (205 | ) | (181 | ) | (181 | ) | ||||||
| Permanent additions | ||||||||||||
| Negative result of equity method | (1 | ) | ||||||||||
| Foreign profits | (4 | ) | (20 | ) | ||||||||
| Other | (4 | ) | (3 | ) | ||||||||
| Permanent exclusions | ||||||||||||
| Equity in results | 4 | 20 | ||||||||||
| Fiscal Incentives | 7 | |||||||||||
| Other | 6 | 17 | 6 | |||||||||
| Income tax expense | (196 | ) | (168 | ) | (175 | ) | ||||||
| Total income tax and social contribution in the income statement | (270 | ) | (231 | ) | (242 | ) | ||||||
| The Company elected to pay income tax and social contribution based on annual taxable income, with advance payments made based on quarterly interim trial balances. | ||
| (d) | Fiscal incentives | |
| The Company exercised its rights to fiscal incentives of PDTI — Program for Technological and Industrial Development based on Law No. 9532/97 of Decree No. 949/93 and on Ordinance No. 130/02 of the Ministry of Science and Technology (MCT) up to the year 2005. Beginning in 2006, the Company migrated to the incentives of Law 11196/05 of Decree No. 5798/06 and of MCT Ordinance No. 782/06 with incentive of R$ 3 in the present year. Fiscal incentives in audiovisual, child and adolescent fund, and operations of a cultural and artistic nature were also used during 2006 as well as the PAT — Program for the Worker’s Nutrition, reaching a total of R$ 7. These incentives were recorded directly as reductions of the IRPJ and CSLL accounts in the statement of income. |
F-168
| 19 | Stockholders’ equity | |
| (a) | Capital | |
| The proposal of the Board of Directors for the 1-to-100 reverse split of the Company’s shares was approved at the Extraordinary General Meeting of stockholders No. 107 held on January 20, 2005. This decreased the number of shares of the Company’s capital from 15,021,716,784 to 150,217,167 common shares, with no par value. The Company’s stockholder composition at December 31, 2006 and 2005 is shown below. |
| Stockholders | Number of shares | (%) | ||||||
| Ipiranga Group | 44,255,077 | 29.46 | ||||||
| Braskem Group / Odebrecht | 44,255,077 | 29.46 | ||||||
| Petrobras Química S.A. — PETROQUISA | 23,482,008 | 15.63 | ||||||
| Other | 38,225,005 | 25.45 | ||||||
| Total | 150,217,167 | 100.00 | ||||||
| On March 6, 2006, as approved at the Ordinary/Extraordinary General Meeting, the Company carried out a capital increase in the amount of R$ 100 by the capitalization of fiscal incentive reserves of FUNDOPEM (2005 — R$ 50 from capitalization of legal reserve), without changing the number of original shares. | ||
| The Company is authorized to increase capital up to the limit of R$ 1,100, without changing the by-laws, assuring preference to existing stockholders on subscription. | ||
| (b) | Capital reserves |
| 2006 | 2005 | |||||||
| FUNDOPEM | 284 | 334 | ||||||
| Fiscal incentives — Program of Technological and Industrial Development — PDTI | 12 | 7 | ||||||
| 296 | 341 | |||||||
F-169
| In September 1998, the Company started to set up a capital reserve based on the financial incentive of the Company Operation Fund (FUNDOPEM) — RS, according to Law No. 6427 of October 18, 1972 and amendments. The incentive was granted to the Company through Decree No. 38502, of May 11, 1998, and the benefit obtained is 50% of ICMS due for a maximum period of 8 years, as from September 1998 to August 2006. The amount accumulated since the beginning of the benefit, recorded as a capital reserve in stockholders’ equity, is R$ 610 (2005 — R$ 561), of which R$ 326 was used to increase capital, as approved at the General Meetings in 2006, 2004, 2003, 2001, and 2000. | ||
| Beginning in 2003, the Company obtained the benefit of fiscal incentives of PDTI — Program for Technological and Industrial Development based on Law No. 9532/97 of Decree No. 949/93 and on Ordinance No. 130/02 of the Ministry of Science and Technology. There is a 60-month period in which these benefits must be used, beginning from March 2002 and therefore terminating in February 2007. During 2006, the Company recorded the benefit of this fiscal incentive in the amount of R$ 6 (2005 - - R$ 4) directly on the stockholders’ equity, as mentioned in Note 18 (d). | ||
| (c) | Revaluation reserve | |
| The realization of the revaluation reserve, based on depreciation, write-offs or disposals of the corresponding revalued assets, is transferred to retained earnings, also considering the tax effects of the provisions constituted. | ||
| The tax charges levied on the revaluation reserve are recognized as this reserve is realized since they are previous to the publication of the CVM Deliberation No. 183/95. The tax charges levied on these reserves total R$ 13 (2005 — R$ 22), as shown in Note 12. | ||
| (d) | Distribution of net income | |
| According to the by-laws, net income for the year, adjusted under the terms of Law 6404/76, is to be appropriated as follows: (i) 5% to the legal reserve, not to exceed 20% of capital, and (ii) mandatory non-cumulative dividends, equivalent to 6% of capital, up to the limit of 25% of adjusted net income. Dividends will only be distributed when there is available income. The appropriation of the remaining net income will be determined by the General Meeting. |
F-170
According
| The mandatory dividend, calculated according to corporate legislation and the by-laws, is as follows: |
| 2006 | 2005 | |||||||
| Capital at the end of the year | 850 | 750 | ||||||
| Dividend based on 6% of capital | 51 | 45 | ||||||
| Net income for the year | 615 | 566 | ||||||
| Transfer to legal reserve (5% of net income) | (31 | ) | (28 | ) | ||||
| Net income basis for calculation of dividend | 584 | 538 | ||||||
| Mandatory dividends (25% of adjusted net income) | 146 | 135 | ||||||
| (ii) | Dividends proposed by management, subject to approval by the General Meeting, are as follows: |
| 2006 | 2005 | |||||||
| Retained earnings | ||||||||
| Prior year adjustment | 38 | |||||||
| Realization of revaluation reserve | 34 | 35 | ||||||
| Income tax and social contribution on realized revaluation reserve | (8 | ) | (11 | ) | ||||
| Net income for the year | 615 | 567 | ||||||
| Profit retained | ||||||||
| Legal reserve | (32 | ) | (28 | ) | ||||
| Profit distribution | ||||||||
| Interest on capital paid and credited | (90 | ) | (99 | ) | ||||
| Prepaid dividends | (372 | ) | (396 | ) | ||||
| Proposed dividends | 185 | 68 | ||||||
| (iii) | For the year ended December 31, 2006, the Company paid the amount of R$ 90 (2005 — R$ 99) as interest on capital calculated based on the variation of the Long-Term Interest Rate - TJLP and recorded according to Law No. 9249/95, including the amount of the mandatory minimum dividend, of which R$ 70 (2005 — R$ 78) had been paid by the closing of the year. |
F-171
| 2004 | 2003 | |||||
Capital at the end of the year | 700 | 610 | ||||
Dividend based on 6% of capital | 42 | 37 | ||||
Net income for the year | 547 | 168 | ||||
Transfer to legal reserve | (27 | ) | (8 | ) | ||
Base net income for calculation of dividend | 520 | 160 | ||||
Mandatory dividends (25% of adjusted net income) | 130 | 40 | ||||
COPESUL—COMPANHIA PETROQUÍMICA DO SUL
NOTES TO THE CONSOLIDATED FINANCIAL STATEMENTS—(Continued)Table of Contents
2005 F-172 Accumulated deficit at the beginning of the year Realization of revaluation reserve Income tax and social contribution on realized revaluation reserve Net income for the year Profit retained Legal reserve Profit distribution Interest on own capital paid and credited Interim dividends Proposed dividendsCOPESUL — Companhia Petroquímica do SulNotes to the Consolidated Financial Statements
at December 31, 20042006 and 2003
All amounts in millions of reais, unless otherwise indicatedThe Extraordinary General Meeting No. 115 held on December 1, 2006 approved the complementary crediti of interest on capital for those stockholders of record on December 21, 2006 in the amount of R$ 19 at the ratio of R$ 0.129826274 per share, with retention of 15% withholding income tax of R$ 3. In 2005 these amounts were R$ 25 at the ratio of R$ 0.165087656 approved at the Extraordinary General Meeting No. 111 on November 28, 2005 and R$ 3 of withholding income tax. The income tax and social contribution benefit arising from the deductibility of this interest, recorded in the results for the year ended December 31, 2006, is R$ 30 (2005 — R$ 34). In compliance with tax legislation, the amount of interest on capital was recorded as financial expense. However, for the purposes of these financial statements, the interest on capital is presented as a distribution of net income in the year as provided for in CVM Deliberation No. 207/96. (iv) In addition, during the year ended December 31, 2006, the Company prepaid dividends in the amount of R$ 372 (2005 — R$ 396), approved by the Extraordinary General Meetings held on May 22, 2006, August 23, 2006, and December 1, 2006. Payments were made on June 9, September 15, and December 15, 2006, respectively. (e) Dividends proposed by management, subject to approval at the General Meeting of stockholders, arePrior year adjustments The adjustment can be summarized as follows:shown below.2006 Provision for programmed maintenance (i) 66 Taxes (ii) (28 ) Prior year adjustment — Total 38 2004 2003 — (32 ) 35 35 (10 ) (10 ) 547 168 (27 ) (8 ) (88 ) (87 ) (339 ) (57 ) 118 9
(f) During the year ended December 31, 2004, the Company credited shareholders with interest payable on own capital in the amount
Table of R$ 88 (2003—R$ 87, 2002—R$ 13), of which R$ 69 was paid upContents
(g) In addition, during the year ended December 31, 2004, the Company prepaid interim dividends in the amount of R$ 339, approved by the Extraordinary General Stockholders Meetings held on May 31, August 30 and November 16, 2004. Payments were made on June 14, September 15 and November 30, 2004, respectively.
Consolidated Financial income (expenses), net is summarized as follows:
| 2004 | 2003 | 2002 | |||||||
Income on financial investments | 9 | (137 | ) | 534 | |||||
Monetary variations on assets | 2 | (8 | ) | 8 | |||||
Exchange variations on assets | (3 | ) | (82 | ) | 187 | ||||
Interest on loans receivable | 82 | 200 | 64 | ||||||
Other financial income | 28 | 25 | 4 | ||||||
Interest and charges on loans and financing | (102 | ) | (218 | ) | (421 | ) | |||
Monetary variations on liabilities | (4 | ) | (8 | ) | (8 | ) | |||
Exchange variations on liabilities | 25 | 255 | (586 | ) | |||||
Interest on own capital (Note 20(f)) | (88 | ) | (87 | ) | (13 | ) | |||
Other financial expenses | (112 | ) | (101 | ) | (30 | ) | |||
Net total | (163 | ) | (161 | ) | (261 | ) | |||
COPESUL—COMPANHIA PETROQUÍMICA DO SUL
NOTES TO THE CONSOLIDATED FINANCIAL STATEMENTS—(Continued)
Statements
at December 31, 20042006 and 2003
2005
All amounts in millions of reais, unless otherwise indicated
| Up to December 31, 2005, the Provision for Programmed maintenance was set up considering the estimated costs of programmed maintenance, especially the general stoppage that occurs every six years. The stoppage of Plant 1 occurred in the first half of 2001 and the next one should be in 2008. The stoppage of Plant 2 took place in November 2005 and the next one is planned for November 2011. In accordance with the provisions contained in CVM Deliberation no. 489, dated October 3, 2005, that approved and made mandatory for listed companies the Accounting Pronouncement and Standard — NPC No. 22 (“Provisions, Liabilities and Contingent Assets and Liabilities”), |
| 2004 | 2003 | 2002 | |||||||
Operating income | |||||||||
Tax credit—IPI Premium credit (Decree Law 1724/79) | — | — | 18 | ||||||
Tax credit—PIS—six-month period (Complementary Law 7/70) | — | — | 16 | ||||||
Claims for indemnities | — | — | 7 | ||||||
Recovery of PIS, COFINS and ICMS | 48 | — | — | ||||||
Reversal of long-term contributions and taxes | 2 | 2 | — | ||||||
Other | — | 2 | 10 | ||||||
| 50 | 4 | 51 | |||||||
Operating expenses | |||||||||
Taxes, charges and contributions | (5 | ) | (10 | ) | (2 | ) | |||
Provisions for administrative, civil and labor contingencies | (2 | ) | (1 | ) | (2 | ) | |||
Actuarial liability—PETROS | (1 | ) | (2 | ) | (2 | ) | |||
Other | — | — | (4 | ) | |||||
| (8 | ) | (13 | ) | (10 | ) | ||||
Other operating income (expenses), net | 42 | (9 | ) | 41 | |||||
| 2006 | ||||
| Reversal of the provision set up on December 31, 2005, net of the tax effects | 45 | |||
| Capitalization of the expenses incurred with previous stoppages in property, plant and equipment, net of the tax effects | 41 | |||
| Depreciation accumulated up to December 31, 2005 on the expenses incurred with previous stoppages in property, plant and equipment that were capitalized | (20 | ) | ||
| 66 | ||||
| (ii) | On November 2001, COPESUL filed a Restitution Request of the Tax on Net Income — ILL with the Brazilian Revenue and Customs Secretariat seeking a compensation for the ILL paid from 1990 to 1992 as this tax has been considered unconstitutional according to the Federal Senate Resolution No. 82 of November 22, 1996. See Note 9.(a). | |
| In December 2002, the Company recognized this credit because the legal advisors considered this a legal right. When originally recorded the credit the Company has not recognized the corresponding IRPJ and CSLL payable on the monetary correction of the credit. During 2006 the Company recognized the amount of R$ 28 as a tax payable. The monetary variations recorded in 2002 represents taxable income and during 2006 the Company recorded the corresponding tax payable against retained earnings as a correction of an error.. |
F-173
The Company means transactions
| 20 | Financial result | |
| The net financial result is as follows: |
| Consolidated | ||||||||
| 2006 | 2005 | |||||||
| Financial income | ||||||||
| Earnings on financial investments | 23 | 16 | ||||||
| Revenue with derivatives of Fundo de Investimento Financeiro Multimercado Copesul | 315 | 113 | ||||||
| Monetary variations on assets | 4 | 4 | ||||||
| Exchange variations on assets | (11 | ) | (22 | ) | ||||
| Interest on loans granted and other assets | 10 | 25 | ||||||
| PASEP adjustment | 30 | |||||||
| Other financial income | 1 | 1 | ||||||
| 372 | 137 | |||||||
| Financial expenses | ||||||||
| Interest and charges on loans and financing | (40 | ) | (62 | ) | ||||
| Expense with derivatives of Fundo de Investimento Financeiro Multimercado Copesul | (284 | ) | (85 | ) | ||||
| Monetary variations on liabilities | (1 | ) | (2 | ) | ||||
| Exchange variations on liabilities | 9 | 33 | ||||||
| Interest on capital | (90 | ) | (99 | ) | ||||
| Other financial expenses | (57 | ) | (64 | ) | ||||
| (463 | ) | (279 | ) | |||||
| Net financial result | (91 | ) | (142 | ) | ||||
| 21 | Other operating income (expenses), net |
| 2006 | 2005 | |||||||
| Operating income | ||||||||
| Recovery of PIS, COFINS and ICMS | 8 | 11 | ||||||
| Recovery of PASEP (Note 8 (h)) | 14 | |||||||
| Recovery of IPI (a) | 16 | |||||||
| Adjustment to the accrual for sale contract | 16 | |||||||
| Other | 8 | 3 | ||||||
| 46 | 30 | |||||||
| Operating expenses | �� | |||||||
| Taxes, charges and contributions | (2 | ) | (1 | ) | ||||
| Provisions for administrative, civil and labor contingencies | (22 | ) | (3 | ) | ||||
| Actuarial liability — PETROS | (2 | ) | (2 | ) | ||||
| (26 | ) | (6 | ) | |||||
| Other operating income, net | 20 | 24 | ||||||
F-174
| (a) | During 2005 the Company recognized as operating income a credit in the amount of R$ 16. The credit derives from the recalculation of presumed IPI credit on petrochemical naphtha acquisitions made from April 2002 to January 2004 according to provisions in Law No. 9.363/96. Such credit was used to offset federal taxes (IRPJ and CSLL) in that year. The corresponding taxes on the recognized credit were paid in order to avoid future challenges by the tax authorities. | |
| 22 | Financial instruments | |
| The Company evaluated its assets and liabilities in relation to market and/or realizable values through available information and valuation methodologies established by management. However, both the interpretation of market data and the selection of valuation methods require considerable judgment and reasonable estimates to produce the appropriate realizable value. Consequently, the estimates presented do not necessarily indicate the amounts that can be realized in the current market. The use of different market assumptions and/or methodologies for estimates can have a significant effect on estimated realizable values. | ||
| Valuation of the financial instruments | ||
| The Company’s main asset and liability financial instruments at December 31, 2006, as well as the criteria for their valuation are described below. | ||
| (a) | Cash and banks, financial investments, accounts receivable, other current assets and accounts payable | |
| The amounts recorded are similar to their realizable values. | ||
| (b) | Investments | |
| The investments are mainly in a privately held subsidiary, recorded on the equity method of accounting, in which the Company has a strategic interest. Considerations of the market value of shares held are not applicable. | ||
| (c) | Financing | |
| These are subject to interest at normal market rates, as mentioned in Note 15 (a). The estimated market value was calculated based on the present value of the future disbursement of cash, using interest rates that are available to the Company for the issuance of debts with similar maturities and terms. |
F-175
| (d) | Interest rate risk | |
| This risk derives from the possibility of the Company incurring losses due to fluctuations in the interest rates that would increase the financial expenses related to loans and financings from the market. The Company made contracts of derivatives to hedge against the risk in some operations and it is also continually monitoring the market interest rate with the objective of evaluating the need of contracting new operations in order to protect itself from the risk of the volatility of these rates. | ||
| (e) | Exchange rate risk | |
| This risk derives from the possibility of the Company incurring losses due to fluctuations in the exchange rates that would reduce the nominal values billed or increase the amounts owed to the market. | ||
| Since part of the Company’s revenues (around 10% — unaudited) is in US dollars, the main strategy is that this serves as a natural hedge for its liability operations recorded in foreign currency. | ||
| At December 31, 2006, the Company had assets and liabilities denominated in US dollars in the amount of US$ 16 thousand and US$ 88 thousand, respectively, and it had no instrument to protect this exposure on that date. | ||
| (f) | Derivatives | |
| The net foreign exchange exposure is as follows: |
| 2006 | 2005 | |||||||
| Financing and export drafts contracted originally in US$ | (189 | ) | (136 | ) | ||||
| Assets contracted originally in US$ | 34 | 2 | ||||||
| Derivative instruments contracted originally in US$ | 11 | |||||||
| Net exposure | (144 | ) | (134 | ) | ||||
F-176
Consolidated Financial Statements
at December 31, 2006 and 2005
All amounts in millions of reais, unless otherwise indicated
| 2004 | 2003 | |||||||||||
| Book value | Market value | Book value | Market value | |||||||||
Cash and banks | 175 | 175 | 456 | 456 | ||||||||
Swap receivables | 1 | 1 | 10 | 10 | ||||||||
Marketable securities | 81 | 81 | — | — | ||||||||
Receivables from related parties | 146 | 146 | 330 | 329 | ||||||||
Loans to third parties | 9 | 10 | 9 | 10 | ||||||||
Loans and financing | (356 | ) | (351 | ) | (975 | ) | (974 | ) | ||||
Export drafts to be invoiced | (124 | ) | (124 | ) | (621 | ) | (621 | ) | ||||
Swaps and options payable | (8 | ) | (8 | ) | (40 | ) | (38 | ) | ||||
In order to minimize the effect of exchange rate fluctuations on liabilities, the subsidiary Copesul International Trading, Inc. contracted NDF (non-deliverable forward) instruments, through which the Company locks in advance the exchange rate on the maturity date of its debt.
| 2006 | 2005 | |||||||||||||||
| Book value | Market value | Book value | Market value | |||||||||||||
| Cash and banks | 200 | 200 | 113 | 113 | ||||||||||||
| Swap receivables | 64 | 64 | 53 | 53 | ||||||||||||
| Marketable securities | 39 | 39 | 14 | 14 | ||||||||||||
| Locked exchange contract advance receivable | 2 | 2 | ||||||||||||||
| Loans to third parties | 2 | 2 | 6 | 6 | ||||||||||||
| Financial institutions | (156 | ) | (156 | ) | (372 | ) | (366 | ) | ||||||||
| Export drafts billed and to be invoiced | (180 | ) | (178 | ) | (92 | ) | (92 | ) | ||||||||
| Swaps and options payable | (23 | ) | (23 | ) | (5 | ) | (5 | ) | ||||||||
| (52 | ) | (50 | ) | (283 | ) | (277 | ) | |||||||||
| Cross-currency swap operations receiving US dollars and paying a fixed rate in reais were entered into in order to minimize the effect of the variations of the exchange rates on liabilities. The Company also opted to use time deposits indexed to the US dollar. | ||
| At December 31, 2006, the Company had forward purchase of foreign exchange, not yet settled, related to operations for purchasing raw material in the amount of US$ 109 thousand (2005 — US$ 41 thousand) equivalent to R$ 232 thousand (2005 — R$ 95 thousand). | ||
| As shown above, the book values of the financial instruments are recorded at values that approximate its estimated market value. | ||
| 23 | Insurance | |
| The Company’s policy is to contract insurance at levels adequate for the risks involved with its operations. Considering the characteristics of its risks, management contracts insurance under the concept of maximum possible loss in a single event, and maintains coverage for operational risks, civil responsibilities and loss of profits. Also, the Company contracts transportation, group life, sundry risks and vehicle insurance. |
F-177
The Company’s policy is to contract insurance at levels adequate for the risks involved in its operations. Considering the characteristics of its risks, management contracts insurance under the concept of maximum possible loss in a single event, and maintains coverage for operational risks, civil responsibilities and loss of profits.
COPESUL—COMPANHIA PETROQUÍMICA DO SUL
NOTES TO THE CONSOLIDATED FINANCIAL STATEMENTS—(Continued)Table of Contents
2005 F-178COPESUL — Companhia Petroquímica do SulNotes to the Consolidated Financial Statements
at December 31, 20042006 and 2003
All amounts in millions of reais, unless otherwise indicatedAlso, the Company contracts transportation, group life, sundry risks and vehicle insurance.2524Fundação PETROBRAS de Seguridade Social—PETROSProvision for contingencies On the dates of the financial statements, the Company presented the following liabilities and the corresponding judicial deposits related to the contingencies: Provisions for Judicial deposits contingencies 2006 2005 2006 2005 Tax contingencies (a) 7 6 5 4 Labor and social security contingencies (b) 1 1 27 4 Civil complaints (c) 2 3 8 7 34 11 The Company is a party to labor, civil, and tax claims as well as others in progress and is discussing these issues from both an administrative and judicial point of view and these are backed by judicial deposits when applicable. The provisions for the possible losses from these processes are estimated and updated by the administration based on the opinion of its legal external consultants. (a) Tax contingencies With respect to the Income Tax and Economic Domain Intervention Contribution (CIDE) on payment of technical assistance services, the Company has been judicially questioning the legality of charging these taxes since August 2002 and has made judicial deposits. The purpose of the process is to avoid double taxation with respect to the countries with which Brazil has tax treaties and provisions have been made in the same amounts as judicial deposits as shown in Note 10. (b) Labor and social security contingencies The Company has ongoing labor claims, mainly related to salary equivalence claims and overtime. A provision for these contingencies was recorded considering the estimates of the legal advisors for probable loss. Judicial deposits were made when required. The Company is a party to in labor, civil, and tax claims as well as others in progress and is discussing these issues from both an administrative and judicial point of view and these are backed by judicial deposits when applicable.
(a) The Company and its employees contribute to PETROS—Fundação PETROBRAS de Seguridade Social, in connection with retirement and defined benefit pension plans. In 2004, the rate on the contribution salary
According
(b) In compliance with CVM Deliberation 371/2000, the calculation of the actuarial liability Consolidated Financial Statements
at December 31, for post-employment benefits granted to employees, using the projected unit credit method, resulted in the following:
| 2004 | 2003 | |||||
Fair value of plan assets | 270 | 230 | ||||
Present value of actuarial obligations | 301 | 256 | ||||
Actuarial liability | (31 | ) | (26 | ) | ||
Total net actuarial liability to be provided | (31 | ) | (26 | ) | ||
Actuarial liability recorded as of December 31, 2004 | 5 | 4 | ||||
Unrecorded net actuarial liability | (26 | ) | (22 | ) | ||
According to CVM Deliberation 371 of December 13, 2000, item 84, the Company started recognizing monthly, as from 2002, 1/60 of the unrecorded actuarial liability at December 31, 2001. Accordingly, the amount of R$ 1 was recorded in other operating expenses in 2004 (2003—R$ 1).
The actuarial valuation at November 30, 2004 concluded that the Company needs to increase the future contributions in order to complement the benefits, but since it is within the limits defined by CVM Deliberation 3712006 and in accordance with accounting practices adopted in Brazil, the Company opted not to adjust the supplementary actuarial liability.
COPESUL—COMPANHIA PETROQUÍMICA DO SUL
NOTES TO THE CONSOLIDATED FINANCIAL STATEMENTS—(Continued)
at December 31, 2004 and 2003
2005
All amounts in millions of reais, unless otherwise indicated
| Furthermore, the Company has made provision for labor losses related to suits filed by the Petrochemical Industry Labor Union of Triunfo concerning the rights claimed by the Company’s shift workers to receive overtime, claiming delays during transfer and change of shifts. A partial grant was given in trial court in deference to the workers claims to overtime. However in appellate court on December 11, 2006 an ordinary appeal was filed by the Company and the expectation is the total or at least partial reversal of the unfavorable decision in the 4th Regional Labor Court of Appeals. | ||
| (c) | Civil contingencies | |
| The main lawsuits are related to complaints made by contracted workers related to losses that supposedly occurred as a result of various economic plans. | ||
| Possible losses | ||
| The Company has suits of both a tax and civil nature involving risks of loss classified by the management as possible based on the evaluation of its legal advisors and for which no provisions have been set up. They are listed below. | ||
| (a) | Tax losses | |
| The Brazilian Revenue and Customs Secretariat (SRF) penalized the Company in 1999, establishing a tax assessment referring to IRPJ and CSLL for 1994, related to the monetary restatement of the balance sheet and equity method adjustment, arising from accounting recognition of dividends distributed by its subsidiary overseas. The adjusted amount is R$ 21. In 2002, the Company filed an Appeal with the Taxpayer Board, which was judged in 2005, with a result totally favorable to the Company. The court decision of the Taxpayers Council was published in the 4th quarter of 2006 and an appeal was made by the Attorney of the Internal Revenue Service to the High Court of Appeals for Fiscal Matters, to which the Company has already offered a brief of respondent. This lawsuit now awaits the decision of this Court. | ||
| (b) | Civil losses | |
| A civil lawsuit is still outstanding against the Company brought by the minority stockholder Petroquímica Triunfo S.A., questioning aspects involved in the privatization process related to the conversion of preferred shares into common shares before the privatization auction and the preference for subscription of Company shares in relation to the bidders in the auction. Management and the legal advisors do not expect losses to arise from this lawsuit. |
F-179
| Remote losses | ||
| (a) | Tax losses | |
| (i) | Federal tax lawsuits related to the effects of Law No. 8200/91 on the social contribution on net income and on corporate income tax, for which provisions were not recorded, considering the opinion of management and the legal advisors that there are good chances of a favorable outcome. | |
| (ii) | In September 2003, the Company was assessed by the Federal Tax Auditors for alleged failure to pay PIS and COFINS on certain transactions. The Company appealed the tax assessment because it understood that it arose from an incorrect interpretation of the applicable legal rules by the tax authorities. Based on the opinion of its legal advisors and external tax consultants, the Company decided not to record a provision for this tax assessment, considering the possibility of a favorable outcome to the appeal. In view of the contents of an infraction notice, in a recent decision the Brazilian Federal Supreme Court — STF denied the expansion of the calculation basis of PIS and COFINS, established by Law 9718/98, prevailing the revenue concept provided in Complementary Law No. 70/91. This fact is in agreement with the opinion of the Company and its legal counselors of not establishing an accrual. Considering the judgment of STF, the Company considers as remote the chances of an unfavorable result. | |
| 25 | Actuarial liability — PETROS | |
| (a) | The Company and its employees contribute to PETROS — Fundação PETROBRAS de Seguridade Social, in connection with retirement and defined benefit pension plans. In 2006, the rate of salary contribution was 12.93% on the total of income of employees linked to the plan. Company contributions during 2006 totaled R$ 6 (2005 — R$ 6). | |
| According to the PETROS by-laws and pertinent legislation, in case of a significant shortfall of technical reserves, the sponsors and participants will contribute additional financial resources, or there should be an adjustment of the benefits of the plan to the available funds. Up to the end of the year, no such contribution was needed. |
F-180
| (b) | In compliance with CVM Deliberation 371/2000, the Company calculated the actuarial liability at December 31 for post-employment benefits granted to employees, using the projected unit credit method based on the information as of November 30, presenting the following result: |
| 2006 | 2005 | |||||||
| Fair value of plan assets | 388 | 337 | ||||||
| Present value of actuarial obligations | 406 | 357 | ||||||
| Actuarial liability | (18 | ) | (20 | ) | ||||
| Total net actuarial liability to be provided | (18 | ) | (20 | ) | ||||
| Actuarial liability already provided | 9 | 7 | ||||||
| Net actuarial liability — unprovided | (9 | ) | (13 | ) | ||||
| According to CVM Deliberation 371 of December 13, 2000, item 84, in the year 2002 the Company began to recogne monthly 1/60 of its actuarial liability, amounting to R$ 9, based on the actuarial study prepared by an independent actuary at December 31, 2001. Accordingly, the amount of R$ 2 was recorded in other operating expenses in 2006 (2005 — R$ 2). | ||
| The actuarial valuation at November 30, 2006 concluded that the Company needs to increase the future contributions in order to complement the benefits, but since it is within the limits defined by CVM Deliberation 371 and in accordance with accounting practices adopted in Brazil, the Company opted not to adjust the supplementary actuarial liability. | ||
| (c) | The gains (losses) identified previously are related to the profitability of the plan assets — differences between the actuarial assumptions and what actually happened, thus being considered actuarial gains (losses). The Company adopted the policy of recognizing these gains (losses) as revenue (expenses) only when their accumulated amounts were larger than the following limits in each year: (i) 10% of the present value of the total actuarial obligations of the benefit defined and (ii) 10% of the fair value of the plan assets. The portion to be recognized is amortized annually, dividing this amount by the average remaining time of estimated work for the employees participating in the plan. |
F-181
| 2006 | 2005 | |||||||
| Real discount rate | 6 | % | 6 | % | ||||
| Expected return on the assets of the plan | 6 | % | 6 | % | ||||
| Real salary growth | 2% up to 47 years of age and none after 48 years old | 2% up to 47 years of age and none after 48 years old | ||||||
Biometrics bases | ||||||||
| Mortality for pension and charges (not disabled) | AT-2000 | AT-2000 | ||||||
| Mortality for pension and charges (disabled) | Experience of C.A.P. (*) | Experience of C.A.P. (*) | ||||||
| Disability | Álvaro Vindas (**) | Álvaro Vindas (**) | ||||||
| Other charges | Experience of STEA (***) | Experience of STEA (***) | ||||||
| (*) |
|
C.A.P. — Retiree and Pensioner Fund used as the basis to develop the mortality table in the actuarial calculations. | ||
| ||||
| ||||
|
|
| ||
| ||||
| ||||
|
|
| ||
| Álvaro | |||
|
|
|
| (***) | STEA — Serviços Técnicos de Estatística e Atuária Ltda. |
| (d) | In May 2003, the | |
| 26 | Related parties | |
| According to CVM Deliberation 26/86, related parties are defined as those entities, whether individuals or companies, with which the Company has the possibility of contracting, in the broad sense of this word, in conditions which might not be following terms of interchangeability and independence which are found in transactions with third parties not related to the Company, not subject to its managerial control or not subject to any other influence. |
F-182
(c) In May 2003, the Administrative Council approved the Complementary Pension Plan called COPESULPREV, a closed defined contribution plan. This plan aims to provide benefits to employees not included in the old PETROS plan, which is now closed to new members. Plan management will be carried out through PETROS, in an independent manner, not linked to any other pension plan managed by that entity, in compliance with Complementary Law No.109/2001. Regulations with actuarial bases and the Adhesion Covenant between the Company and Petros were submitted for the appreciation of the Complementary Pension Secretariat (SPC) of the Ministry of Social Security, and were approved in May 2004.
Purchase CommitmentsTable of Contents
The Company purchases naphtha of Petrobras and condensate (a raw material) based under contracts with a total minimum annual purchase volume of metric tons equivalent
Copesul purchases coal for its utility unit based under a contract that expires in 2008. The minimum annual purchase commitment is 120,000 metric tons, which amounts to R$ 9 at December 31, 2004 market prices.
The Company purchases natural gas under two long-term contracts that expire in 2023. One contract is for consumption of natural gas by its cogeneration turbine. The minimum annual purchase commitment is 66,576 metric tons, which amounts to R$ 28 at December 31, 2004 market prices. The other contract is for consumption in its utility unit. The minimum annual purchase commitment is 15,238 metric tons, which amounts to R$ 11 at December 31, 2004 market prices.
All these contracts described above have take-or-pay clauses for its quantities.
COPESUL—COMPANHIA PETROQUÍMICA DO SUL
NOTES TO THE CONSOLIDATED FINANCIAL STATEMENTS—(Continued)
at December 31, 20042006 and 2003
2005
All amounts in millions of reais, unless otherwise indicated
| Assets | Liabilities | Financial expenses | Financial income | Sales | Purchases | |||||||||||||||||||||||||||||||||||||||||||||||||||||||||||
| 2006 | 2005 | 2006 | 2005 | 2006 | 2005 | 2004 | 2006 | 2005 | 2004 | 2006 | 2005 | 2004 | 2006 | 2005 | 2004 | |||||||||||||||||||||||||||||||||||||||||||||||||
| Braskem S.A. | 39 | 20 | 2 | 1 | 1 | 2 | 8 | 2,753 | 2,573 | 2,349 | 17 | 66 | 100 | |||||||||||||||||||||||||||||||||||||||||||||||||||
| Ipiranga Petroquímica S.A. | 15 | 18 | 3 | 1 | 2 | 7 | 1,886 | 1,711 | 1,713 | 19 | 36 | 96 | ||||||||||||||||||||||||||||||||||||||||||||||||||||
| Refinaria Alberto Pasqualini — REFAP S.A. | 4 | 11 | 20 | 77 | 51 | 900 | 902 | 388 | ||||||||||||||||||||||||||||||||||||||||||||||||||||||||
| Petróleo Brasileiro S.A. — PETROBRAS | 37 | 1,655 | 1,104 | 1,781 | ||||||||||||||||||||||||||||||||||||||||||||||||||||||||||||
| Petrobras Distribuidora S.A. | 1 | 2 | 4 | 14 | 10 | 8 | 19 | |||||||||||||||||||||||||||||||||||||||||||||||||||||||||
| CPN — Incorporated Limited. | 33 | 36 | 42 | |||||||||||||||||||||||||||||||||||||||||||||||||||||||||||||
| Natal Trading Ltd. | 6 | |||||||||||||||||||||||||||||||||||||||||||||||||||||||||||||||
| Lantana Trading Co. Ltd. | 8 | 52 | ||||||||||||||||||||||||||||||||||||||||||||||||||||||||||||||
| 58 | 49 | 63 | 2 | 1 | 12 | 73 | 4,718 | 4,372 | 4,112 | 2,643 | 2,116 | 2,384 | ||||||||||||||||||||||||||||||||||||||||||||||||||||
F-183
| 27 | Commitments |
On January 20, 2005 the Extraordinary Stockholders Meeting approved a reverse stock split at the ratio of 1 new share per 100 shares previously owned.
| Purchase commitments | ||
| The Company purchases naphtha from Petrobras and Repsol-YPF as well as condensate (a raw material) from Sonatrach, based under contracts with a total minimum annual purchase volume of metric tons equivalent to R$ 4,062 (2005 — R$ 3,941) valued at the prices for purchase of such products ruling at the respective year end. | ||
| Copesul purchases coal for its utility unit based under a contract that expires in 2008. The minimum annual purchase commitment is 120,000 metric tons, which amounts to R$ 12 (2005 — R$ 13) valued at the prices for purchase of such products ruling at the respective year end. | ||
| The Company purchases natural gas under two long-term contracts that expire in 2023. One contract is for consumption of natural gas by its cogeneration turbine. The minimum annual purchase commitment is 65,664 metric tons, which amounts to R$ 25 (2005 — R$ 25) valued at the prices for purchase of such products ruling at the respective year end. The other contract is for consumption in its utility unit. The minimum annual purchase commitment is 5,472 metric tons (2005 — 7,600 metric tons), which amounts to R$ 5 (2005 — R$ 6) valued at the prices for purchase of such products ruling at the respective year end. | ||
| All these contracts described above have take-or-pay clauses for its quantities. | ||
| 28 | Summary of |
| 28.1 | Narrative description of differences between Brazilian GAAP and US GAAP | |
| A summary of the Company’s principal accounting policies that affect the determination of net income and shareholder’s equity in Brazilian GAAP as compared to US GAAP is set forth in this section. Section 29.2 includes a quantitative reconciliation of net income and shareholders’ equity between Brazilian GAAP and US GAAP. |
F-184
A summary
| (a) | Remeasurement of financial statements for the effects of inflation |
Under Brazilian GAAP until 1995, theComissão de Valores Mobiliarios (CVM, the Brazilian securities exchange regulator) required publicly traded companies subject to its reporting requirements to prepare and publish: (a) statutory financial information prepared according to the accounting principles prescribed by Brazilian Corporate Law and (b) as supplemental information, financial statements expressed in currency of constant purchasing power (the “constant currency method”). The requirement to present financial statements following the constant currency method was eliminated when indexation of financial statements for Brazilian statutory and tax purposes was discontinued on January 1, 1996. As such, these financials statements prepared following Brazilian GAAP have been remeasured to reflect the effect of inflation through December 31, 1995. The index selected for this remeasurement was the Fiscal Reference Unit (UFIR), the index established by the tax authorities for preparation of financial statements under Corporate Law as well as the index selected by the CVM.
Under US GAAP Brazil was considered to be a hyperinflationary economy until June 30, 1997, and, accordingly, all balances and transactions prior to that date should be remeasured at June 30, 1997 price-levels. As from January 1, 1996, with the elimination of the requirement to present constant currency financial statements, no index has been established for this purpose under Brazilian GAAP. The index the Company selected for remeasurement as from January 1, 1996 to June 30, 1997, for purposes of the reconciliation to US GAAP, is the General Market Price Index—Internal Availability (IGP—DI).
This difference affects the carrying amount of property, plant and equipment and related depreciation as well as of inventories, exclusively due to the effect of depreciation of property, plant and equipment on the cost of inventories.
| Under Brazilian GAAP until 1995, the CVM required publicly traded companies subject to its reporting requirements to prepare and publish: (a) statutory financial information prepared according to the accounting principles prescribed by Brazilian Corporate Law and (b) as supplemental information, financial statements expressed in currency of constant purchasing power (the “constant currency method”). The requirement to present financial statements following the constant currency method was eliminated when indexation of financial statements for Brazilian statutory and tax purposes was discontinued on January 1, 1996. As such, these financials statements prepared following Brazilian GAAP have been remeasured to reflect the effect of inflation through December 31, 1995. The index selected for this remeasurement was the Fiscal Reference Unit (UFIR), the index established by the tax authorities for preparation of financial statements under Corporate Law as well as the index selected by the CVM. | ||
| Under US GAAP, Brazil was considered to be a hyperinflationary economy until June 30, 1997, and, accordingly, all balances and transactions prior to that date should be remeasured at June 30, 1997 price-levels. As from January 1, 1996, with the elimination of the requirement to present constant currency financial statements, no index has been established for this purpose under Brazilian GAAP. The index the Company selected for remeasurement as from January 1, 1996 to June 30, 1997, for purposes of the reconciliation to US GAAP, is the General Market Price Index — Internal Availability (IGP — DI). | ||
| This difference affects the carrying amount of property, plant and equipment and related depreciation as well as of inventories, exclusively due to the effect of depreciation of property, plant and equipment on the cost of inventories. | ||
| (b) | Revaluation of property, plant and equipment | |
| Under Brazilian GAAP, as explained in Note 12, the Company has recorded in prior years a revaluation of certain of its fixed assets. | ||
| Under US GAAP, property, plant and equipment is recorded at its historical cost and revaluations are not allowed. | ||
| As a result, the reconciliations presented in Note 29.2 include a reversal of such revaluation and related depreciation recognized under Brazilian GAAP. |
F-185
Under Brazilian GAAP, as explained in Note 12, the Company has recorded in prior years a revaluation of certain of its fixed assets.
Under US GAAP, property, plant and equipment is recorded at its historical cost and revaluations are not allowed.
As a result, the reconciliations presented in Note 28.2 include a reversal of such revaluation and related depreciation recognized under Brazilian GAAP.
COPESUL—COMPANHIA PETROQUÍMICA DO SUL
NOTES TO THE CONSOLIDATED FINANCIAL STATEMENTS—(Continued)Table of Contents
2005 F-186COPESUL — Companhia Petroquímica do SulNotes to the Consolidated Financial Statements
at December 31, 20042006 and 2003
All amounts in millions of reais, unless otherwise indicated(c) Capitalization of interest on property, plant and equipment Under Brazilian GAAP, only interest on loans and financing which have been obtained for the specific purpose of financing property, plant and equipment is capitalized.For US GAAP purposes, interest is capitalized during the construction period of qualifying assets in accordance with Statement of Financial Accounting Standards (“SFAS”) No. 34, “Capitalization of interest cost”, which requires capitalization of interest expense no only of loans and financing for the specific purpose of financing property, plant and equipment. Interest is capitalized based on the average borrowing rate of the company applied to qualifying assets under constructions.(d)Under Brazilian GAAP, only interest on loans and financing which have been obtained for the specific purpose of financing property, plant and equipment is capitalized. For US GAAP purposes, interest is capitalized during the construction period of qualifying assets in accordance with Statement of Financial Accounting Standards (“SFAS”) No. 34, “Capitalization of interest cost”, which requires capitalization of interest expense no only of loans and financing for the specific purpose of financing property, plant and equipment. Interest is capitalized based on the average borrowing rate of the company applied to qualifying assets under constructions. (d) Pension benefits Pension benefit obligations for Brazilian GAAP purposes should be accounted for following CVM Instruction 371/2000, which requires the mandatory application of Brazilian Accounting Standard IBRACON NPC 26. Under CVM Instruction 371/2000, disclosure of pension and other post-retirement obligations is required as from December 31, 2001 while recognition of the related obligations is required as from years ended December 31 2002. As permitted by NPC 26 the initial transitional obligation, which is the difference between plan assets and plan projected benefit obligation at the date of initial recognition, may be recognized by the Company over a 60 month period as from the year ended December 31, 2002. After initial application of the standard, actuarial gains and losses are deferred and recognized in income over the estimated remaining service period of the employees to the extent that those actuarial gains and losses exceed 10% of the higher of the plan assets and the projected benefit obligation.
reais, unless otherwise indicated
GAAP, and (iii) the recognition as from December 31, 2006 as asset or liability, as appropriate, of the funded status against accumulated other comprehensive income.
F-187
COPESUL—COMPANHIA PETROQUÍMICA DO SUL
NOTES TO THE CONSOLIDATED FINANCIAL STATEMENTS—(Continued)Table of Contents
2005 F-188COPESUL — Companhia Petroquímica do SulNotes to the Consolidated Financial Statements
at December 31, 20042006 and 2003
All amounts in millions of reais, unless otherwise indicatedThe funded status of the defined benefit pension plan as at December 31, 20042006 and 20032005 and the additional disclosures required by SFAS No. 132, “Employer’s Disclosures About Pensions and Other Post-Retirement Benefits”, as amended, are as follows:Changes in plan assets, Benefit Obligationsbenefit obligation and funded statusChange in benefit obligation Years ended December 31 2006 2005 2004 Benefit obligation at beginning of year 359 305 256 Service cost 8 7 6 Interest cost 37 33 28 Benefit payments (31 ) (19 ) (14 ) Actuarial losses 36 33 29 Benefit obligation at end of year 409 359 305 Plan assets at fair value Years ended December 31 2006 2005 2004 Plan assets at fair value at beginning of year 347 282 230 Actual return on plan assets 86 74 57 Employer contributions (net of administrative fee) 5 6 5 Employee contributions (net of administrative fee) 4 4 4 Benefit payments (31 ) (19 ) (14 ) Plan assets at fair value at end of year 411 347 282 Funded status At December 31 2006 2005 Funded status at end of year 2 (12 ) Unrecognized prior service cost 20 Unrecognized net actuarial gain (15 ) Accrued benefit cost (pre-paid plan) 2 (7 ) Additional minimum liability (1 ) Total asset (liability) recorded in the balance sheet 2 (8 )
Change in benefit obligation | Year ended December 31, 2004 | Year ended December 31, 2003 | Year ended December 31, 2002 | ||||||
Benefit obligation at beginning of year | 256 | 209 | — | ||||||
Segregation from multi-employer plan (August 31, 2002) | — | — | 194 | ||||||
Service cost | 6 | 5 | 1 | ||||||
Interest cost | 28 | 23 | 7 | ||||||
Benefit payments | (14 | ) | (11 | ) | (3 | ) | |||
Actuarial losses | 29 | 30 | 10 | ||||||
Benefit obligation at end of year | 305 | 256 | 209 | ||||||
Plan assets at fair value | Year ended December 31, 2004 | Year ended December 31, 2003 | Year ended December 31, 2002 | ||||||
Plan assets at fair value at beginning of year | 230 | 196 | — | ||||||
Segregation from multi-employer plan (August 31, 2002) | — | — | 165 | ||||||
Actual return on plan assets | 57 | 38 | 31 | ||||||
Employer contributions (net of administrative fee) | 5 | 4 | 2 | ||||||
Employee contributions (net of administrative fee) | 4 | 3 | 1 | ||||||
Benefit payments | (14 | ) | (11 | ) | (3 | ) | |||
Plan assets at fair value at end of year | 282 | 230 | 196 | ||||||
| At December, 31 | ||||||
Funded status | 2004 | 2003 | ||||
Funded status at end of year | (23 | ) | (26 | ) | ||
Unrecognized prior service cost | 23 | 25 | ||||
Unrecognized net actuarial losses | (5 | ) | (2 | ) | ||
Accrued benefit cost | (5 | ) | (3 | ) | ||
The amounts to be recognized under US GAAP and the difference with respect
| 2004 | 2003 | |||
Accrued benefit cost to be recognized under US GAAP | 5 | 3 | ||
Accrued benefit cost recognized under BR GAAP | 5 | 4 | ||
Difference affecting shareholders’ equity presented in reconciliation in Note 28.2 | — | 1 | ||
COPESUL—COMPANHIA PETROQUÍMICA DO SUL
NOTES TO THE CONSOLIDATED FINANCIAL STATEMENTS—(Continued)
Consolidated Financial Statements
at December 31, 20042006 and 2003
2005
All amounts in millions of reais, unless otherwise indicated
| 2004 | 2003 | |||
Accrued benefit cost to be recognized under US GAAP | 5 | 3 | ||
Total minimum liability | 18 | 21 | ||
Amount of additional minimum liability and intangible asset | 13 | 18 | ||
| 2006 | ||||
| Unrecognized prior service cost | (17 | ) | ||
| Unrecognized net actuarial gain | 28 | |||
| 11 | ||||
| Years ended December 31 | ||||||||||||
| 2006 | 2005 | 2004 | ||||||||||
| Service cost | 8 | 7 | 6 | |||||||||
| Interest cost | 37 | 33 | 28 | |||||||||
| Expected return on plan assets | (36 | ) | (31 | ) | (26 | ) | ||||||
| Amortization of unrecognized prior service cost | 3 | 3 | 4 | |||||||||
| Employee contributions (net of administrative fee) | (4 | ) | (4 | ) | (4 | ) | ||||||
| Net periodic benefit cost | 8 | 8 | 8 | |||||||||
F-189
Components2006 and 2005
All amounts in millions of Net Periodic Benefit Cost
| Year ended December 31, 2004 | Year ended December 31, 2003 | Four-month period ended December 31, 2002 | |||||||
Service cost | 6 | 5 | 1 | ||||||
Interest cost | 28 | 23 | 7 | ||||||
Expected return on plan assets | (26 | ) | (22 | ) | (6 | ) | |||
Amortization of unrecognized prior service cost | 4 | 3 | 1 | ||||||
Employee contributions (net of administrative fee) | (4 | ) | (3 | ) | (1 | ) | |||
Net periodic benefit cost | 8 | 6 | 2 | ||||||
reais, unless otherwise indicated
|
|
| ||||
| ||||||
|
|
|
| |||
| ||||||
| ||||||
|
| 2006 | 2005 | 2004 | ||||
| Assumed discount rate | Inflation + 6.0% p.a. | Inflation + 6.0% p.a. | Inflation + 6.0% p.a. | |||
| Expected rate of future salary increases | Inflation + 1.7% p.a. up to 47 years old and none after 48 years old | Inflation + 2% p.a. up to 47 years old and none after 48 years old | Inflation + 2% p.a. up to 47 years old and none after 48 years old | |||
| Expected rate of future pension increases | Inflation + 0.0% p.a. | Inflation + 0.0% p.a. | Inflation + 0.0% p.a. | |||
| Expected rate of return on plan assets | Inflation + 6.0% p.a. | Inflation + 6.0% p.a. | Inflation + 6.0% p.a. | |||
| Inflation | 4.5% p.a. | 5% p.a. | 5% p.a. |
Asset Category | 2004 | 2003 | ||||
Equity securities | 43.80 | % | 33.18 | % | ||
Debt securities | 40.29 | % | 48.72 | % | ||
Real estate | 6.94 | % | 8.27 | % | ||
Other (loans and financing) | 8.97 | % | 9.83 | % | ||
| 100.00 | % | 100.00 | % | |||
COPESUL—COMPANHIA PETROQUÍMICA DO SUL
NOTES TO THE CONSOLIDATED FINANCIAL STATEMENTS—(Continued)
at December 31, 2004 and 2003
All amounts in millions of reais, unless otherwise indicated
| 2006 | 2005 | |||||||
| Equity securities | 39.23 | % | 33.42 | % | ||||
| Debt securities | 45.88 | % | 50.51 | % | ||||
| Real estate | 6.38 | % | 6.96 | % | ||||
| Other (loans and financing) | 8.51 | % | 9.11 | % | ||||
| 100.00 | % | 100.00 | % | |||||
F-190
Year | ||
2005 | 14 | |
2006 | 15 | |
2007 | 16 | |
2008 | 17 | |
2009 | 19 | |
2010 to 2014 | 117 | |
| 198 | ||
| Year | ||||
| 2007 | 38 | |||
| 2008 | 38 | |||
| 2009 | 37 | |||
| 2010 | 37 | |||
| 2011 | 37 | |||
| 2012 to 2016 | 174 | |||
| 361 | ||||
| (e) | Deferred charges |
F-191
Under US GAAP, the rules are restrictive as to the costs that can be capitalized and the amounts recorded as deferred charges under Brazilian GAAP do not meet the criteria for capitalization and should be expensed as incurred.
As a result, the reconciliations presented in Note 28.2 include a reversal of those charges which were deferred under Brazilian GAAP.
Under Brazilian GAAP, the various tax incentives of the Company (in the form of tax reduction or exemption for defined periods) are accounted for directly as an increase in a capital reserve account in stockholders’ equity. The Company records the taxes as expense in the consolidated statement of income for the amounts that would be due absent the benefit, and recognizes a reduction in the tax payable against the capital reserve.
COPESUL—COMPANHIA PETROQUÍMICA DO SUL
NOTES TO THE CONSOLIDATED FINANCIAL STATEMENTS—(Continued)
Consolidated Financial Statements
at December 31, 20042006 and 2003
2005
All amounts in millions of reais, unless otherwise indicated
For US GAAP reconciliation purposes the amount of those incentives is recognized directly in the statement of income.
| (g) | Income tax and social contribution on the revaluation of property, plant and equipment |
Under US GAAP, no deferred tax is required to be recorded on the revaluation because the revaluation is already reverted. The increase in income tax payable resulting from non-deductibility of the revaluation is considered an expense for purposes of the reconciliation presented in Note 28.2.
| Under US GAAP, no deferred tax is required to be recorded on the revaluation because the revaluation is reverted. The increase in income tax payable resulting from non-deductibility of the revaluation is considered an expense for purposes of the reconciliation presented in Note 29.2. | ||
| (h) | Derivative financial instruments | |
| Under Brazilian GAAP, foreign currency derivatives are recorded by comparing contractual exchange rates to exchange rates ruling at month end. Under the swap agreements, the Company pays or receives at maturity the amounts of the difference between the variation corresponding to an interest rate based on the CDI rate and an amount based on the US Dollar exchange rate plus a | ||
| Under US GAAP, all derivatives are required to be recorded at fair value on the balance sheet and all variations in fair value are required to be recorded in the statement of income, unless they qualify as a hedge. None of the derivatives entered into by the Company qualified for hedge accounting during the periods presented. |
F-192
Under Brazilian GAAP, the subsidiary Copesul International Trading Inc. recorded, financial income during the year ended December 31, 2001 related
The transfer of receivables did not qualify to be accounted for as a sale of financial assets under US GAAP, and the amount of the gain recorded under Brazilian GAAP was recognized as a loan as of December 31, 2001. In the reconciliation of net income for the year ended December 31, 2002, the loss of R$ 26 recognized under Brazilian GAAP was reversed.
Under Brazilian GAAP, foreign currency derivatives are recorded by comparing contractual exchange rates to exchange rates at month end. Under the swap agreements, the Company pays or receives at maturity the amounts of the difference between the variation corresponding to an interest rate based on the CDI rate and an amount based on the US Dollar exchange rate plus a fixed rate. Gains and losses on swap agreements are recorded based on the contractual rates and year-end exchange rates. Gains on options and forward contracts are recorded when the contracts expire, while losses are recorded based on the position of each individual instrument at year-end.
Under US GAAP, all derivatives are required to be recorded at fair value on the balance sheet and all variations in fair value are required to be recorded in the statement of income, unless they qualify as a hedge. None of the derivatives entered into by the Company qualified for hedge accounting during the periods presented.
COPESUL—COMPANHIA PETROQUÍMICA DO SUL
NOTES TO THE CONSOLIDATED FINANCIAL STATEMENTS—(Continued)
Consolidated Financial Statements
at December 31, 20042006 and 2003
2005
All amounts in millions of reais, unless otherwise indicated
| Provision for dividends and interest on own capital | ||
| Under Brazilian GAAP, at each balance sheet date the directors are required to propose a dividend distribution from earnings and accrue for this in the financial statements. Under Brazilian GAAP, companies are permitted to distribute or capitalize an amount of interest on own capital, subject to certain limitations and calculated based on a government interest rate multiplied by shareholders’ equity. Such interest is deductible for tax purposes and is recorded as a dividend. Although not affecting net income, except for the tax benefit, the Company includes this nominal charge in financial expenses and reverses out the same amount before net income. | ||
| Under US GAAP, since proposed dividends in excess of the mandatory minimum dividend required to be paid by its by-laws may be ratified or modified at the annual Shareholders’ Meeting, such proposed dividends in excess of the mandatory minimum dividends are not considered declared at the balance sheet date and therefore are not accrued. However, interim dividends paid or interest on own capital already credited to the shareholders as capital remuneration under Brazilian legislation is considered declared for US GAAP purposes. Under US GAAP, interest on own capital are accounted for as tax-deductible dividends. Dividends paid during the years ended December 31, 2006 and 2005 as interim dividends exceeded mandatory minimum dividends and for that reason the porivin for dividends and interest on own capital recorded under Brazilian GAAP is being reverted in the reconciliation to US GAAP. | ||
| (j) | Provision for programmed maintenance | |
| As indicated in Note 19 up to December 31, 2005 the Company recorded a provision accruing in advance for programmed maintenance on its financial statements in Brazilian GAAP. Effective January 1, 2006 the Company adopted the provisions of NPC No. 22 and modified its accounting policy to no longer provide in advance expected amounts to be incurred in the future during scheduled stoppages but rather to capitalize as part of property, plant and equipment the amounts incurred during each stoppage and amortize those amounts over the expected period until the next stoppage, a method know as “built-in overhaul method”. The effect of changing the accounting policy has been recorded as an adjustment to retained earnings as of January 1, 2006. | ||
| Under US GAAP, FASB Staff Position AUG AIR-1 “Accounting for Planned Major Maintenance Activities” was issued on September 2006. AUG AIR-1 prohibits the use of the accrue-in-advance method and allows to use either the built-in overhaul method, the direct expensing method or the deferral method. AUG AIR-1 is mandatory to the first fiscal year beginning after December 15, 2006. Earlier adoption is permitted. The guidance in AUG AIR-1 shall be applied retrospectively for all financial statements presented. |
F-193
Under Brazilian GAAP, at each balance sheet date the directors are required to propose a dividend distribution from earnings and accrue for this in the financial statements. Under Brazilian GAAP, companies are permitted to distribute or capitalize an amount
Under US GAAP, since proposed dividends may be ratified or modified at the annual Shareholders’ Meeting, such dividends are not considered declared at the balance sheet date and therefore are not accrued. However, interim dividends paid or interest on own-capital credited to shareholders as capital remuneration under Brazilian legislation is considered declared for US GAAP purposes. Under US GAAP, no similar interest on own-capital distribution concept exists.
Under Brazilian GAAP, disclosure of earnings per share is normally computed based on the number of shares outstanding at the end of the year, although a weighted-average basis is acceptable.
Under US GAAP, in accordance with SFAS 128, “Earnings per Share”, the presentation of earnings per share is required for public companies, including earnings per share from continuing operations and net income per shares on the face of the income statement, and the per share effect of changes in accounting principles. A dual presentation is required: basic and diluted. Computations of basic and diluted earnings per share data should be based on the weighted average number of common shares outstanding during the period and all dilutive potential commom shares outstanding during each period presented, respectively. If a stock dividend, stock split or reverse stock split is approved earnings per share should be retroactively restated as if such change had been in effect as of the beginning of the earliest period presented.
No financial instruments have been issued by the Company which have a dilutive effect, and therefore basic and diluted earnings per share are the same.
On March 1, 2004 the Company obtained financing through the FIDC, a special purpose entity. The FIDC is managed by Votorantim Assets Management DTVM Ltda., an independent asset manager. The FIDC has two classes of quotas: senior quotas and subordinated quotas. The FIDC issued senior quotas in exchange of R$ 125 contributed by third-parties and subordinated quotas in exchange of R$ 25. All the subordinated quotas were issued to and are held by the Company. The senior quotas have the right to a fixed return of 106.5% of CDI. Subordinated quotas have right to any excess of net income of the fund over the return attributed to senior quotas. Senior quotas are mandatorily redeemable by the fund under an amortization schedule beginning on November 2004 and over a 22 month period. The subordinated quotas should represent at least 15% of total equity of the Fund. The FIDC is required to invest in receivables originated by the Company. As of December 31, 2004 the Company received R$ 125 from the FIDC as payment for the purchase of receivables, R$ 25 of receivables were transferred
COPESUL—COMPANHIA PETROQUÍMICA DO SUL
NOTES TO THE CONSOLIDATED FINANCIAL STATEMENTS—(Continued)
Consolidated Financial Statements
at December 31, 20042006 and 2003
2005
All amounts in millions of reais, unless otherwise indicated
Under
| For US GAAP purposes, the Company has early applied AUG AIR-1 and has also adopted the “built-in overhaul method” for US GAAP, and has restated the reconciliation for years ended December 31, 2005 and 2004 to adjust for the application of the new accounting policy. Upon application of AUG AIR-1 the Company presents: | ||
| (i) | in the reconciliation of shareholders equity the reversal of the “accrue-in-advance” provision for programmed maintenance which is recorded in Brazilian GAAP and to capitalize the costs incurred in prior stoppages net of the related depreciation; and | |
| (ii) | in the reconciliation of net income the reversal of the amount charged to expense in Brazilian GAAP to create the provision for programmed maintenance and is recognizing depreciation for the year of the capitalized costs under the new policy. |
| Years ended December 31, | ||||||||
| 2005 | 2004 | |||||||
| Net income under US GAAP, as originally reported | 623 | 611 | ||||||
| Effect of change in accounting policy for programmed maintenance | (7 | ) | 21 | |||||
| Net income under US GAAP, retrospectively adjusted | 616 | 632 | ||||||
| Earnings per share (basic and diluted), as originally reported | 4.15 | 4.06 | ||||||
| Effect of change in accounting policy for programmed maintenance | (0.05 | ) | 0.15 | |||||
| Earnings per share (basic and diluted), retrospectively adjusted | 4.10 | 4.21 | ||||||
| (k) | Income tax payable on monetary correction | |
| As described in Note 19.(ii) the Company recorded as prior year adjustment in retained earnings the recognition of a tax payable amounting to R$ 28 corresponding to income tax and social contribution on the monetary correction of certain tax credits that should have been recognized in prior years. | ||
| For US GAAP the Company has concluded that the effect of this prior year adjustment is not material to net income for the year ended December 31, 2006 and has therefore recorded the tax payable against the 2006 net income. |
F-194
Under US GAAP, in accordance with FASB Interpretation No. 46 “Consolidation of Variable Interest Entities (revised December 2003)”, the FIDC is considered a variable interest entity and is being consolidated by the Company since its inception.
| Earnings per share | ||
| Under Brazilian GAAP, disclosure of earnings per share is normally computed based on the number of shares outstanding at the end of the year, although a weighted-average basis is acceptable. | ||
| Under US GAAP, in accordance with SFAS 128, “Earnings per Share”, the presentation of earnings per share is required for public companies. A dual presentation is required: basic and diluted. Computations of basic and diluted earnings per share data should be based on the weighted average number of common shares outstanding during the period and all dilutive potential commom shares outstanding during each period presented, respectively. If a share dividend, share split or reverse share split is approved earnings per share should be retroactively restated as if such change had been in effect as of the beginning of the earliest period presented. | ||
| No financial instruments have been issued by the Company which have a dilutive effect, and therefore basic and diluted earnings per share are the same. | ||
| (m) | Consolidation of receivables securitization fund (“FIDC”) | |
| On March 1, 2004 the Company obtained financing through the FIDC, a special purpose entity. The FIDC is managed by Votorantim Assets Management DTVM Ltda., an independent asset manager. The FIDC has two classes of quotas: senior quotas and subordinated quotas. The FIDC issued senior quotas in exchange of R$ 125 contributed by third-parties and subordinated quotas in exchange of R$ 25. All the subordinated quotas were issued to and are held by the Company. The senior quotas have the right to a fixed return of 106.5% of CDI. Subordinated quotas have right to any excess of net income of the fund over the return attributed to senior quotas. Senior quotas are mandatorily redeemable by the fund under an amortization schedule that begin on November 2004 and ended on August 2006 when the FIDC was liquidated. The subordinated quotas should represent at least 15% of total equity of the Fund. The FIDC is required to invest in receivables originated by the Company. As of December 31, 2005 and 2004 the Company received R$ 125 from the FIDC as payment for the purchase of receivables, R$ 25 of receivables were transferred to the FIDC in exchange for the subornidated quotas and R$ 2 of receivables were transferred to the FIDC as repayment of the proceeds received (2005 — R$ 13). |
F-195
| Under Brazilian GAAP, the Company accounts for the subordinated quotas received as marketable securities at the net asset value determined by the administrator of the FIDC and recognizes a debt under loan and financig for the proceeds received, carrying interest at 112% of CDI. When receivables are transferred to the FIDC, they are transferred at a discount to their face amount; at the transfer of the receivables they are derecognized for their carrying amount, a loss is recognized for the discount and the debt with the FIDC is reduced by the discounted amount. | ||
| Under US GAAP, in accordance with FASB Interpretation No. 46 “Consolidation of Variable Interest Entities (revised December 2003)”, the FIDC is considered a variable interest entity and is being consolidated by the Company since its inception. | ||
| (n) | Classification of statement of income line items |
Under Brazilian GAAP, in addition to the differences described in the items above, the classification of certain income and expense items is presented differently from US GAAP. We have recast our statement of income under Brazilian GAAP to present a condensed statement of income in accordance with US GAAP (Note 28.3). The reclassifications are summarized as follows:
| Under Brazilian GAAP, in addition to the differences described in the items above, the classification of certain income and expense items is presented differently from US GAAP. We have recast our statement of income under Brazilian GAAP to present a condensed statement of income in accordance with US GAAP (Note 28.3). The reclassifications are summarized as follows: | ||
| (i) | Interest income and interest expense, together with other financial charges, are displayed within operating income in the statement of income presented in accordance with Brazilian GAAP. These amounts have been reclassified to non-operating income and expenses in the condensed statement of income in accordance with US GAAP; |
| (ii) | Under Brazilian GAAP, foreign exchange gains and losses are displayed as financial income or expenses. Under US GAAP foreign exchange gains and losses are recorded in a specific line as non-operating income (expenses); |
| (iii) | Under Brazilian GAAP, losses incurred in 2004 on the early payment of debt are recorded as financial expense. Under US GAAP such cost is recorded in a specific line as non-operating expense; |
| (iv) | Under Brazilian GAAP, management fees are recorded in a specific line as operating expenses. For US GAAP purposes such costs are included as operating expenses in selling, general and administrative expenses; |
| (v) | Under Brazilian GAAP, employees and management profit sharing are recorded after income tax and social contribution. Under US GAAP, these items are included as operating expenses. |
F-196
| Classification of balance sheet line items |
Under Brazilian GAAP, the classification of certain balance sheet items is presented differently from US GAAP. We have recast our consolidated balance sheet under Brazilian GAAP to present a condensed consolidated balance sheet in accordance with US GAAP Note 28.3 . The reclassifications are summarized as follows:
| Under Brazilian GAAP, the classification of certain balance sheet items is presented differently from US GAAP. We have recast our consolidated balance sheet under Brazilian GAAP to present a condensed consolidated balance sheet in accordance with US GAAP Note 28.3. The reclassifications are summarized as follows: | ||
| (i) | Cash equivalents is not specifically defined under Brazilian GAAP. Cash and banks under Brazilian GAAP comprises cash in hand, placed in banks, |
COPESUL—COMPANHIA PETROQUÍMICA DO SUL
NOTES TO THE CONSOLIDATED FINANCIAL STATEMENTS—(Continued)
at December 31, 2004 and 2003
All amounts in millions of reais, unless otherwise indicated
| (ii) | Under Brazilian GAAP, in accordance with Law |
| (iii) | Under Brazilian GAAP, invoices for export sales for which the Company authorized a bank to use, upon their collection, the proceeds to repay export draft debt are recognized as a reduction of current assets, and debt is also reduced for the same amount. For US GAAP purposes, the invoices are presented as receivables and the debt is not reduced until collection of the proceeds and settlement of the debt have actually took place; |
| (iv) | Under Brazilian GAAP, deferred income taxes are not netted and assets are shown separately from liabilities. For US GAAP purposes, deferred tax assets and liabilities are netted within the same taxpayer and same tax jurisdiction and are classified as current or non-current based on the classification of the underlying temporary difference. |
F-197
Advertising costs are expensed as incurred and are included in selling, general and administrative expense. Advertising costs amounted
Freight expenses are recorded in a specific line as selling expenses in the following amounts: R$ 69, R$ 62 and R$ 52 Consolidated Financial Statements
at December 31, 2004, 20032006 and 2002, respectively.
The CVM approved on August 2004 Instruction No. 408 which requires consolidation of special purpose entities (“SPE”) when a company has decision-making rights with respect to the activities of a SPE or has the right to obtain the majority of the benefits or is exposed to the majority of the losses of the SPE or of the assets of the SPE. Instruction No. 408 is effective as from January 1, 2005 and the Company expects to consolidate, as from January 1, 2005, FIDC as result of the application of Instruction No. 408.
In December 2003, the Financial Accounting Standard Board (“FASB”) issued FASB Interpretation No. 46—“Consolidation of Variable Interest Entities, (revised December 2003)” (“FIN 46R”). The primary objectives of FIN 46R are to provide guidance on the identification of entities for which control is achieved through means other than through voting rights (variable interest entities or “VIEs”) and how to determine when and which business enterprise should consolidate the VIE (the primary beneficiary). This new model for consolidation applies to an entity in which either (1) the equity investors (if any) do not have a controlling financial interest; or (2) the equity investment at risk is insufficient to finance that entity’s activities without receiving additional subordinated financial support from other parties. In addition, FIN 46R requires that both the primary beneficiary and all other enterprises with a significant variable interest in a VIE make additional disclosures regarding the nature, purpose, size and activities of the VIE and the enterprise’s maximum exposure to loss as a result of its involvement with the VIE.
The implementation date of FIN 46R is the first period ending after December 15, 2003 for Special Purpose Entities (“SPEs”) and as from January 1, 2004 for previously existing variable interest entities which are not SPEs. FIN 46R may be applied prospectively with a cumulative adjustment as of the date on which it is first applied or by restating previously issued financing statements for one or more years with a cumulative-effect adjustment as of the beginning of the first year restated. The adoption of FIN 46R resulted in the consolidation of the receivable securitization fund.
COPESUL—COMPANHIA PETROQUÍMICA DO SUL
NOTES TO THE CONSOLIDATED FINANCIAL STATEMENTS—(Continued)
at December 31, 2004 and 2003
All amounts in millions of reais, unless otherwise indicated
| (p) | Additional disclosures required by US GAAP | |
| (i) | Advertising costs | |
| Advertising costs are expensed as incurred and are included in selling, general and administrative expense. Advertising costs amounted to R$ 21, R$ 14 and R$ 9 for the years ended December 31, 2006, 2005 and 2004, respectively. | ||
| (ii) | Freight expenses | |
| Freight expenses are recorded in a specific line as selling expenses in the following amounts: R$ 83, R$ 70 and R$ 69 at December 31, 2006, 2005 and 2004, respectively. | ||
| (q) | Recently issued accounting standards | |
| In July 2006, the FASB released FASB Interpretation No. 48, “Accounting for Uncertainty in Income Taxes, an interpretation of FASB Statement No. 109” (FIN 48). FIN 48 prescribes a comprehensive model for the financial statement recognition, measurement, presentation and disclosure of income tax uncertainties with respect to positions taken or expected to be taken in income tax returns. Management is currently evaluating the effect of FIN 48 on the Company’s financial condition and results of operations. | ||
| In September 2006, the FASB issued SFAS No. 157, “Fair Value Measurements”. SFAS 157 defines fair value, establishes a framework for measuring fair value under generally accepted accounting principles and enhances disclosures about fair value measurements. SFAS 157 retains the exchange price notion and clarifies that the exchange price is the price that would be received for an asset or paid to transfer a liability (an exit price) in an orderly transaction between market participants on the measurement date. SFAS 157 is effective for the Company’s financial statements for the year beginning on January 1, 2008, with earlier adoption permitted. Management is currently evaluating the effect of SFAS 157 on the Company’s financial condition and results of operations. |
F-198
In November 2004, the FASB issued SFAS No. 151, Inventory Costs, an amendment of ARB No. 43, Chapter 4, which requires idle facility expenses, excessive spoilage, and double freight and rehandling costs to be treated as current period charges and also requires that the allocation of fixed production overheads
| 28.2 | Reconciliation of differences between Brazilian GAAP and US GAAP |
| 28.2.1 | Differences in net income |
| Years ended December 31 | ||||||||||||||
| Reference | ||||||||||||||
| in 29.1 | 2006 | 2005 | 2004 | |||||||||||
Net income under Brazilian GAAP | 615 | 567 | 547 | |||||||||||
| 1. Remeasurement of financial statements for the effect of inflation — Depreciation on fixed assets for the year | (a) | (69 | ) | (77 | ) | (76 | ) | |||||||
| 2. Reversal of depreciation for the year on revaluation of property, plant and equipment | (b) | 34 | 35 | 35 | ||||||||||
| 3. Depreciation of capitalized interest on construction of property, plant and equipment | (c) | (8 | ) | (9 | ) | (8 | ) | |||||||
| 4. Effect in net income of pension benefits | (d) | (1 | ) | |||||||||||
| 5. Reversal of amortization related to deferred charges | (e) | 1 | 2 | 5 | ||||||||||
| 6. Recognition as expense of amounts recorded as deferred charges during the year | (e) | (1 | ) | (3 | ) | (1 | ) | |||||||
| 7. Tax incentives | (f) | |||||||||||||
| (i) Company Operation Fund — FUNDOPEM | 50 | 89 | 89 | |||||||||||
| (ii) Program for Technological and Industrial Development — PDTI | 5 | 4 | 3 | |||||||||||
| 8. Income tax and social contribution on the revaluation of property, plant and equipment | (g) | (8 | ) | (11 | ) | (10 | ) | |||||||
| 9. Effects from change in accounting policy for programmed maintenance | (j) | (11 | ) | 32 | ||||||||||
| 10. Income tax payable on monetary correction | (k) | (28 | ) | |||||||||||
| 11. Derivative financial instruments | (h) | (1 | ) | |||||||||||
| 12. Deferred income tax on all adjustments except for 2, 7, 8 and 10 | 28 | 36 | 16 | |||||||||||
| 13. Other adjustments | (4 | ) | (6 | ) | 2 | |||||||||
Net income under US GAAP | 615 | 616 | 632 | |||||||||||
F-199
| Years ended December 31 | ||||||||||||
| Reference in 28.1 | 2004 | 2003 | 2002 | |||||||||
Net income under Brazilian GAAP | 547 | 168 | 42 | |||||||||
1. Remeasurement of financial statements for the effect of inflation: | ||||||||||||
(i) Depreciation on fixed assets for the year | (a | ) | (76 | ) | (76 | ) | (76 | ) | ||||
(ii) Inventories | (a | ) | ||||||||||
2. Reversal of depreciation for the year on revaluation of property, plant and equipment | (b | ) | 35 | 35 | 35 | |||||||
3. Depreciation of capitalized interest on construction of property, plant and equipment | (c | ) | (8 | ) | (8 | ) | (8 | ) | ||||
4. Effect in income of pension benefits | (d | ) | (1 | ) | 1 | |||||||
5. Reversal of deferred charges and related amortization | (e | ) | 4 | 5 | 8 | |||||||
6. Tax incentives: | (f | ) | ||||||||||
(i) Company Operation Fund—FUNDOPEM | 89 | 104 | 143 | |||||||||
(ii) Program for Technological and Industrial | 3 | |||||||||||
7. Income tax and social contribution on the revaluation of property, plant and equipment | (g | ) | (10 | ) | (10 | ) | (10 | ) | ||||
8. Reversal of gain on the transfer of receivables to a financial institution | (h | ) | 26 | |||||||||
9. Derivative financial instruments | (i | ) | (1 | ) | 115 | (114 | ) | |||||
10. Deferred income tax on all adjustments except | 27 | (15 | ) | 57 | ||||||||
11. Other adjustments | 2 | 7 | 4 | |||||||||
Net income under US GAAP | 611 | 326 | 107 | |||||||||
Weighted average number of shares issued and outstanding after giving retroactive effect to the reverse stock split approved on January 20, 2005 | 150,217,167 | 150,217,167 | 150,217,167 | |||||||||
Earnings per share (in Brazilian Reais) | 4.06 | 2.17 | 0.71 | |||||||||
COPESUL—COMPANHIA PETROQUÍMICA DO SUL
NOTES TO THE CONSOLIDATED FINANCIAL STATEMENTS—(Continued)Table of Contents
2005 F-200COPESUL — Companhia Petroquímica do SulNotes to the Consolidated Financial Statements
at December 31, 20042006 and 2003
All amounts in millions of reais, unless otherwise indicated Years ended December 31 Reference in 28.1 2006 2005 2004 Weighted average number of shares issued and outstanding after giving retroactive effect at December 31, 2004 to the reverse share split approved on January 20, 2005 - Basic and diluted 150,217,167 150,217,167 150,217,167 Earnings per share (in Brazilian Reais) 4.09 4.10 4.21 28.2.2 Differences in Shareholders’ equity December 31 Reference 2006 2005 Shareholders’ equity under Brazilian GAAP 1,300 1,247 1. Remeasurement of financial statements for the effect of inflation: (i) Fixed assets net of accumulated depreciation (a) 16 85 (ii) Inventories (a) 1 1 2. Reversal of revaluation of property, plant and equipment (b) (75 ) (109 ) 3. Capitalization of interest on construction of property, plant and equipment (c) 186 186 4. Depreciation of capitalized interest on construction of property, plant and equipment (c) (148 ) (140 ) 5. Reversal of amortization related to deferred charges (e) 63 62 6. Recognition as expense of amounts recorded as deferred charged during the year (e) (73 ) (73 ) 9. Effects from change in accounting policy for programmed maintenance: (j) Reversal of provision recorded under Brazilian GAAP 68 Capitalization of cost in prior stoppage, net of depreciation 33 10. Difference between amount recognized of pension plan asset (liability) (d) 11 (1 ) 8. Deferred income tax on all adjustments except for 2 (17 ) (76 ) 9. Proposed dividends in excess of mandatory minimum dividend (i) 185 68 10. Other adjustments (3 ) 2
| Reference | December, 31 | ||||||||
| 2004 | 2003 | ||||||||
Stockholders’ equity under Brazilian GAAP | 1,161 | 1,078 | |||||||
1. Remeasurement of financial statements for the effect of inflation: | |||||||||
(i) Fixed assets net of accumulated depreciation | (a | ) | 162 | 238 | |||||
(ii) Inventories | (a | ) | 1 | 1 | |||||
2. Reversal of revaluation of property, plant and equipment | (b | ) | (144 | ) | (179 | ) | |||
3. Capitalization of interest on construction of property, plant and equipment | (c | ) | 186 | 186 | |||||
4. Depreciation of capitalized interest on construction of property, plant and equipment | (c | ) | (131 | ) | (123 | ) | |||
5. Pension benefits | (d | ) | 1 | ||||||
6. Reversal of deferred charges | (e | ) | (10 | ) | (14 | ) | |||
7. Derivative financial instruments | (i | ) | 1 | ||||||
8. Deferred income tax on all adjustments except for 2 and 9 | (j | ) | (73 | ) | (100 | ) | |||
9. Proposed dividends | (j | ) | 118 | 9 | |||||
10. Other adjustments | 6 | 4 | |||||||
Stockholders’ equity under US GAAP | 1,276 | 1,102 | |||||||
Based on the reconciling items and discussion above, Copesul’s condensed consolidated balance sheet, statement of income and statement of changes in stockholders’ equity under US GAAP are as follows:
| 2004 | 2003 | |||
Assets | ||||
Current assets | ||||
Cash and cash equivalents | 97 | 138 | ||
Trading investments | 132 | 295 | ||
Certificates of deposit | 2 | 23 | ||
Loans to related parties | 146 | 330 | ||
Trade accounts receivable | 219 | 495 | ||
Inventories, net | 427 | 284 | ||
Taxes and charges recoverable | 7 | 111 | ||
Deferred income taxes | 29 | 14 | ||
Swaps receivable | 1 | 10 | ||
Prepaid expenses | 13 | 22 | ||
Other accounts receivable | 7 | 8 | ||
| 1,080 | 1,730 | |||
COPESUL—COMPANHIA PETROQUÍMICA DO SUL
NOTES TO THE CONSOLIDATED FINANCIAL STATEMENTS—(Continued)Table of Contents
2005 F-201COPESUL — Companhia Petroquímica do SulNotes to the Consolidated Financial Statements
at December 31, 20042006 and 2003
All amounts in millions of reais, unless otherwise indicated December 31 Reference 2006 2005 Shareholders’ equity under US GAAP 1,446 1,353
| 2004 | 2003 | |||
Property, plant and equipment, net | 1,210 | 1,328 | ||
Other noncurrent assets | ||||
Held-to-maturity investments | 1 | — | ||
Investments at cost, net | 11 | 9 | ||
Judicial deposits | 14 | 10 | ||
Taxes and charges recoverable | 97 | 79 | ||
Prepaid expenses | 5 | 7 | ||
Loans to third parties | 9 | 9 | ||
Intangible asset—recognition of minimum pension obligation | 13 | 18 | ||
Other accounts receivable | 1 | 2 | ||
| 151 | 134 | |||
Total assets | 2,441 | 3,192 | ||
Liabilities and shareholders’ equity | ||||
Current liabilities | ||||
Suppliers | 148 | 114 | ||
Social and labor contributions and charges | 53 | 31 | ||
Provision for income taxes | 33 | 43 | ||
Taxes and charges payable | 35 | 38 | ||
Short-term debt, including current portion of long-term debt | 128 | 592 | ||
Short-term export drafts, including current portion of long-term export drafts | 191 | 135 | ||
Quotas subject to mandatory redemption | 85 | — | ||
Provision for scheduled stoppage | 55 | 10 | ||
Interest on shareholders’ equity | 19 | 14 | ||
Payables related to swaps, forwards and options | 8 | 38 | ||
Advances from customers | 11 | 7 | ||
Retirement benefit obligation | 5 | 4 | ||
Profit sharing and other | 26 | 15 | ||
| 797 | 1,041 | |||
Long-term liabilities | ||||
Long-term debt, net of current portion | 98 | 383 | ||
Long-term export draft, net of current portion | 103 | 500 | ||
Quotas subject to mandatory redemption | 45 | — | ||
Provision for schedule stoppage | 44 | 53 | ||
Deferred income taxes | 57 | 91 | ||
Provision for tax, civil and labor proceedings | 9 | 6 | ||
Retirement benefit obligation | 12 | 16 | ||
| 368 | 1,049 | |||
Commitments and contingencies | ||||
Shareholders’ equity | 1,276 | 1,102 | ||
Total liabilities and shareholders’ equity | 2,633 | 3,192 | ||
COPESUL—COMPANHIA PETROQUÍMICA DO SUL
NOTES TO THE CONSOLIDATED FINANCIAL STATEMENTSTable of Contents
2005 F-202COPESUL — Companhia Petroquímica do SulNotes to the Consolidated Financial Statements
at December 31, 20042006 and 2003
All amounts in millions of reais, unless otherwise indicated28.3 US GAAP condensed financial information Based on the reconciling items and discussion above, Copesul’s condensed consolidated balance sheet, statement of income condensed consolidated and statement of changes in shareholders’ equity under US GAAP are as follows: (a) Condensed balance sheet under US GAAP Assets 2006 2005 Current assets Cash and cash equivalents 169 64 Trading investments 70 41 Certificates of deposit 3 Loans to related parties Trade accounts receivable 254 198 Inventories,net 572 495 Taxes and charges recoverable 101 29 Deferred income taxes 2 Swaps receivable 64 53 Prepaid expenses 13 14 Prepaid income taxes 227 230 Other accounts receivable 6 9 1,478 1,136 Property, plant and equipment, net 1,010 1,162 Other noncurrent assets Held-to-maturity investments 1 1 Investments at cost,net 10 9 Judicial deposits 9 8 Taxes and charges recoverable 121 103 Prepaid expenses 4 6 Loans to third parties 2 6 Intangible asset — recognition of minimum pension obligation 1 Prepaid pension cost 2 Other accounts receivable 1 1 150 135 Total assets 2,638 2,433
| Liabilities and shareholders’ equity | 2006 | 2005 | ||||||
| Current liabilities | ||||||||
| Suppliers | 354 | 156 | ||||||
| Social and labor contributions and charges | 45 | 49 | ||||||
| Provision for income taxes | 259 | 242 | ||||||
| Taxes and charges payable | 45 | 42 | ||||||
| Short-term debt, including current portion of long-term debt | 50 | 231 | ||||||
| Short-term export drafts, including current portion of long-term export drafts | 40 | 19 | ||||||
| Quotas subject to mandatory redemption | 51 | |||||||
| Interest on own capital | 17 | 21 | ||||||
| Payables related to swaps, forwards and options | 23 | 5 | ||||||
| Advances from customers | 4 | 13 | ||||||
| Retirement benefit obligation | 6 | |||||||
| Profit sharing and other | 35 | 27 | ||||||
| 872 | 862 | |||||||
| Long-term liabilities | ||||||||
| Long-term debt, net of current portion | 107 | 84 | ||||||
| Long-term export draft, net of current portion | 139 | 91 | ||||||
| Quotas subject to mandatory redemption | ||||||||
| Taxes and charges payable | 26 | |||||||
| Deferred income taxes | 14 | 30 | ||||||
| Provision for tax, civil and labor proceedings | 34 | 11 | ||||||
| Retirement benefit obligation | 2 | |||||||
| 320 | 218 | |||||||
Commitments and contingencies | ||||||||
| Shareholders’ equity | 1,446 | 1,353 | ||||||
| Total liabilities and shareholders’ equity | 2,638 | 2,433 | ||||||
F-203
| 2006 | 2005 | 2004 | ||||||||||
Gross sales | 8,148 | 7,348 | 7,153 | |||||||||
| Taxes and contributions on sales | (1,722 | ) | (1,642 | ) | (1,623 | ) | ||||||
Net sales and services | 6,426 | 5,706 | 5,530 | |||||||||
| Cost of products, utilities and services | (5,326 | ) | (4,661 | ) | (4,423 | ) | ||||||
Gross profit | 1,100 | 1,045 | 1,107 | |||||||||
Operating (expenses) income | ||||||||||||
| Selling, general and administrative | (190 | ) | (184 | ) | (189 | ) | ||||||
| Employees profit sharing | (24 | ) | (22 | ) | (20 | ) | ||||||
| Other operating income (expenses), net | 18 | 28 | 44 | |||||||||
Operating profit | 904 | 867 | 942 | |||||||||
Non-operating income (expenses) | ||||||||||||
| Financial income (expenses), net | 1 | (62 | ) | (81 | ) | |||||||
| Loss on anticipated payment of debt paid in advance settlement | (16 | ) | ||||||||||
| Foreign exchange gains, net | (2 | ) | 12 | 22 | ||||||||
| Other | (12 | ) | 5 | |||||||||
Income before income taxes and social contribution | 891 | 822 | 867 | |||||||||
Income tax benefit (expense) | ||||||||||||
| Current | (297 | ) | (238 | ) | (271 | ) | ||||||
| Deferred | 21 | 32 | 35 | |||||||||
Net income for the year | 615 | 616 | 632 | |||||||||
| (c) | Condensed statement of changes in shareholders’ equity under US GAAP |
| Years Ended December 31 | ||||||||||||
| 2006 | 2005 | 2004 | ||||||||||
At beginning of the year | 1,353 | 1,350 | 1,154 | |||||||||
| Net income | 615 | 616 | 632 | |||||||||
| Transition effect of application of SFAS 158, net of taxes | 8 | |||||||||||
| Dividends | (440 | ) | (514 | ) | (348 | ) | ||||||
| Interest on own capital | (90 | ) | (99 | ) | (88 | ) | ||||||
At end of the year | 1,446 | 1,353 | 1,350 | |||||||||
F-204
| 2006 | 2005 | 2004 | ||||||||||
| Cash provided by operating activities | ||||||||||||
| Net income for the year | 615 | 616 | 632 | |||||||||
| Adjustments to reconcile net income to net cash provided by operating activities | ||||||||||||
| Depreciation and amortization | 288 | 250 | 248 | |||||||||
| Provision for administrative, civil and labor contingencies | 24 | 4 | 3 | |||||||||
| Net effects on working capital related to Programmed maintenance | (1 | ) | (21 | ) | 6 | |||||||
| Provision for actuarial liabilities — PETROS | 2 | 2 | 2 | |||||||||
| Loss on disposals of assets | 29 | 5 | ||||||||||
| Interest, foreign exchange and monetary variation on long-term | ||||||||||||
| Liabilities | (4 | ) | (16 | ) | (11 | ) | ||||||
| Other assets | (6 | ) | 5 | (7 | ) | |||||||
| Loss (gain) on trading investments | 10 | 14 | ||||||||||
| Interest on investment in certificates of deposit | (1 | ) | (1 | ) | (2 | ) | ||||||
| Interest on quotas subject to mandatory redemption | (44 | ) | (10 | ) | 16 | |||||||
| Unrealized gain related to forwards, swaps and options, net | 17 | (3 | ) | (30 | ) | |||||||
| Interest, foreign exchange and monetary variation on loans to related parties and other current liabilities | 15 | (12 | ) | |||||||||
| Interest and monetary variation on short-term debts | 5 | (22 | ) | (33 | ) | |||||||
| Deferred income tax | (21 | ) | (32 | ) | (35 | ) | ||||||
| Decrease/increase in assets and liabilities | ||||||||||||
| Trade accounts receivable | (56 | ) | 21 | 277 | ||||||||
| Inventories | (76 | ) | (68 | ) | (144 | ) | ||||||
| Purchases of trading investments | (195 | ) | (186 | ) | (928 | ) | ||||||
| Sales and redemptions of trading investments | 165 | 267 | 1,077 | |||||||||
| Other assets | (24 | ) | 155 | (94 | ) | |||||||
| Suppliers | 198 | 8 | 34 | |||||||||
| Other liabilities | 26 | (203 | ) | 214 | ||||||||
Net cash provided by operating activities | 941 | 796 | 1,227 | |||||||||
F-205
| 2006 | 2005 | 2004 | ||||||||||
Cash flows from investing activities | ||||||||||||
| Held-to-maturity investments, net | (1 | ) | ||||||||||
| Redemptions in certificates of deposit | 24 | |||||||||||
| Investment in certificates of deposit | 4 | (1 | ) | |||||||||
| Receivables related to forwards, swaps and options, net | (11 | ) | (52 | ) | 9 | |||||||
| Loans to related parties | ||||||||||||
| Issuances | (325 | ) | ||||||||||
| Repayments | 130 | 522 | ||||||||||
| Acquisitions of property, plant and equipment | (198 | ) | (171 | ) | (131 | ) | ||||||
| Acquisitions of investments | (2 | ) | ||||||||||
Net cash provided by (used in) investing activities | (205 | ) | (94 | ) | 96 | |||||||
Cash flows from financing activities | ||||||||||||
| Short-term debt | ||||||||||||
| Proceeds | 1,660 | 1,198 | 514 | |||||||||
| Payments | (1,864 | ) | (1,183 | ) | (706 | ) | ||||||
| Long-term debt | ||||||||||||
| Proceeds | 185 | 81 | 133 | |||||||||
| Payments | (71 | ) | (153 | ) | (989 | ) | ||||||
| Quotas subject to mandatory redemption | ||||||||||||
| Proceeds | 125 | |||||||||||
| Payments | (8 | ) | (68 | ) | (12 | ) | ||||||
| Dividends paid | (439 | ) | (513 | ) | (346 | ) | ||||||
| Interest on own capital paid | (94 | ) | (97 | ) | (83 | ) | ||||||
Net cash used in financing activities | (631 | ) | (735 | ) | (1,364 | ) | ||||||
Net decrease in cash and cash equivalents | 105 | (33 | ) | (41 | ) | |||||||
Cash and cash equivalents at beginning of year | 64 | 97 | 138 | |||||||||
Cash and cash equivalents at end of the year | 169 | 64 | 97 | |||||||||
Cash paid during the period for | ||||||||||||
Interest | 33 | 63 | 106 | |||||||||
Income taxes | 240 | 238 | 244 | |||||||||
F-206
COPESUL - Companhia Petroquímica do Sul and subsidiaries
Consolidated Balance Sheets
In millions of reais
| 3/31/2007 | 12/31/2006 | |||||
| Unaudited | ||||||
Assets | ||||||
Current assets | ||||||
Cash and cash equivalents (Note 4) | 272 | 201 | ||||
Marketable securities (Note 5) | 41 | 38 | ||||
Customers | ||||||
Local customers | 129 | 180 | ||||
Foreign customers | 198 | 75 | ||||
Export drafts - billed (Note 16) | (75 | ) | (1 | ) | ||
Swap receivables (Note 6) | 87 | 64 | ||||
Inventories (Note 7) | 541 | 571 | ||||
Taxes and charges recoverable (Note 8) | 113 | 115 | ||||
Prepaid expenses (Note 9) | 11 | 14 | ||||
Other accounts receivable | 9 | 5 | ||||
| 1,326 | 1,262 | |||||
Noncurrent assets | ||||||
Long-term receivables | ||||||
Marketable securities (Note 5) | 1 | 1 | ||||
Taxes and charges recoverable (Note 8) | 147 | 137 | ||||
Judicial deposits (Note 10) | 9 | 9 | ||||
Prepaid expenses (Note 9) | 4 | 4 | ||||
Loans to third parties | 1 | 2 | ||||
Claims receivable and other | 2 | 2 | ||||
| 164 | 155 | |||||
Permanent assets | ||||||
Investments (Note 11) | 7 | 10 | ||||
Property, plant and equipment (Note 12) | 994 | 1,030 | ||||
Deferred charges (Note 13) | 10 | 10 | ||||
| 1,011 | 1,050 | |||||
| 1,175 | 1,205 | |||||
Total assets | 2,501 | 2,467 | ||||
Liabilities and stockholders’ equity | ||||||
Current liabilities | ||||||
Suppliers (Note 14) | 275 | 354 | ||||
Loans and financing (Note 15) | 87 | 50 | ||||
Export drafts - to be invoiced (Note 16) | 85 | 39 | ||||
Taxes and charges payable (Note 17) | 33 | 45 | ||||
Social and labor contributions and charges | 42 | 45 | ||||
Proposed dividends | 185 | |||||
Interest on own capital | 1 | 17 | ||||
Income tax and social contribution (Note 18) | 105 | 44 | ||||
Swaps and options payable (Note 6) | 43 | 23 | ||||
Advances from customers | 7 | 5 | ||||
Profit sharing and other | 17 | 34 | ||||
| 695 | 841 | |||||
Noncurrent liabilities | ||||||
Long-term liabilities | ||||||
Loans and financing (Note 15) | 99 | 107 | ||||
Export drafts - to be invoiced (Note 16) | 133 | 139 | ||||
Income tax and social contribution (Note 18) | 37 | 37 | ||||
Provision for contingencies (Note 24) | 36 | 34 | ||||
Actuarial liability - PETROS (Note 25) | 8 | 9 | ||||
| 313 | 326 | |||||
Stockholders’ equity (Note 19) | ||||||
Capital | 910 | 850 | ||||
Capital reserve | 238 | 296 | ||||
Revaluation reserve | 68 | 75 | ||||
Revenue reserve | 79 | 79 | ||||
Retained earnings | 198 | |||||
| 1,493 | 1,300 | |||||
Total liabilities and stockholders’ equity | 2,501 | 2,467 | ||||
The accompanying notes are an integral part of these financial statements.
COPESUL - Companhia Petroquímica do Sul and subsidiaries
Unaudited Interim Consolidated Statements of Operations
In millions of reais, except when otherwise indicated
| Quarter ended 3/31/2007 | Quarter ended 3/31/2006 | |||||
Gross sales | ||||||
Sale of petrochemical products and utilities | ||||||
Local market | 1,939 | 1,703 | ||||
Foreign market | 229 | 157 | ||||
| 2,168 | 1,860 | |||||
Taxes, contributions and freight on sales | ||||||
ICMS | (228 | ) | (233 | ) | ||
PIS, COFINS, CIDE and ISS | (194 | ) | (186 | ) | ||
Freight | (19 | ) | (14 | ) | ||
| (441 | ) | (433 | ) | |||
Net sales and services | 1,727 | 1,427 | ||||
Cost of products, utilities and services | (1,397 | ) | (1,176 | ) | ||
Gross profit | 330 | 251 | ||||
Operating (expenses) income | ||||||
Selling | (18 | ) | (8 | ) | ||
General and administrative | (13 | ) | (11 | ) | ||
Management fees | (1 | ) | (1 | ) | ||
Depreciation and amortization | (3 | ) | (3 | ) | ||
Other operating income (expenses), net (Note 21) | (1 | ) | 10 | |||
| (36 | ) | (13 | ) | |||
Operating profit before financial result | 294 | 238 | ||||
Financial result (Note 20) | ||||||
Financial expenses | (154 | ) | (51 | ) | ||
Financial income | 159 | 49 | ||||
| 5 | (2 | ) | ||||
Operating profit | 299 | 236 | ||||
Non-operating result | ||||||
Non operating income | 1 | |||||
Non-operating expenses | (3 | ) | (6 | ) | ||
| (3 | ) | (5 | ) | |||
Income before income tax and social contribution | 296 | 231 | ||||
Provision for income tax and social contribution (Note 18) | (102 | ) | (78 | ) | ||
Deferred income tax and social contribution (Note 18) | 5 | 1 | ||||
Net income of the period before profit sharing | 199 | 154 | ||||
Profit sharing | (6 | ) | (5 | ) | ||
Net income of the period | 193 | 149 | ||||
Outstanding shares at the end of the period (in thousands) | 150,217 | 150,217 | ||||
Net income per share (in R$) | 1.28 | 0.99 | ||||
The accompanying notes are an integral part of these financial statements.
COPESUL - Companhia Petroquímica do Sul and subsidiaries
Unaudited Interim Statement of Changes in Stockholders’ Equity
In millions of reais, except per share amounts
| Capital | Capital reserve Fiscal incentives | Revaluation reserve | Revenue reserve Legal | Retained earnings | Total | |||||||||||
At December 31, 2005 | 750 | 341 | 108 | 48 | 1,247 | |||||||||||
Prior year adjustment | 38 | 38 | ||||||||||||||
Capitalization of capital reserve - FUNDOPEM | 100 | (100 | ) | |||||||||||||
Fiscal incentives | ||||||||||||||||
FUNDOPEM | 18 | 18 | ||||||||||||||
Program for Technological and Industrial Development - PDTI | 8 | 8 | ||||||||||||||
Realization of revaluation reserve | ||||||||||||||||
Revaluation - 1983 | (1 | ) | 1 | |||||||||||||
Revaluation - 1989 | (7 | ) | 7 | |||||||||||||
Income tax and social contribution on realized revaluation reserve | (2 | ) | (2 | ) | ||||||||||||
Net income for the period | 149 | 149 | ||||||||||||||
At March 31, 2006 | 850 | 267 | 100 | 48 | 193 | 1,458 | ||||||||||
At December 31, 2006 | 850 | 296 | 75 | 79 | 1,300 | |||||||||||
Capitalization of capital reserve - FUNDOPEM | 60 | (60 | ) | |||||||||||||
Fiscal incentives - PDI - Technological Research and Industrial Development | 2 | 2 | ||||||||||||||
Realization of revaluation reserve | ||||||||||||||||
Revaluation - 1989 | (7 | ) | 7 | |||||||||||||
Income tax and social contribution on realized revaluation reserve | (2 | ) | (2 | ) | ||||||||||||
Net income for the period | 193 | 193 | ||||||||||||||
At March 31, 2007 | 910 | 238 | 68 | 79 | 198 | 1,493 | ||||||||||
The accompanying notes are an integral part of these financial statements.
COPESUL - Companhia Petroquímica do Sul and subsidiaries
Consolidated Statements of Changes in Financial Position
In millions of reais
| Quarter ended 3/31/2007 | Quarter ended 3/31/2006 | |||||
| Unaudited | Unaudited | |||||
Financial resources were provided by | ||||||
Operations | ||||||
Net income for the period | 193 | 149 | ||||
Expenses (income) not affecting working capital | ||||||
Depreciation | 57 | 57 | ||||
Amortization | 1 | |||||
Provision for administrative, civil and labor contingencies | 1 | (1 | ) | |||
Monetary and exchange variations of long -term liabilities | ||||||
Long-term liabilities | (6 | ) | (6 | ) | ||
Long-term receivables | (2 | ) | ||||
Disposals of property, plant and equipment | 3 | 2 | ||||
Income tax and social contribution | ||||||
Long-term receivables | (2 | ) | (18 | ) | ||
Realization of revaluation reserve | (2 | ) | (2 | ) | ||
| 245 | 179 | |||||
Third parties | ||||||
Decrease in long-term receivables | ||||||
Marketable securities | 18 | |||||
Related parties | (6 | ) | 1 | |||
Prepaid expenses | 1 | 2 | ||||
Increase in long-term liabilities | ||||||
Financial institutions | 2 | |||||
Fiscal incentives of FUNDOPEM and Program for Technological and | ||||||
Industrial Development - PDTI | 2 | 25 | ||||
| (3 | ) | 48 | ||||
Other | ||||||
Effect on working capital from the change in the accounting procedure adjustments | (22 | ) | ||||
| (22 | ) | |||||
Total funds provided | 242 | 205 | ||||
Financial resources were used for | ||||||
Long-term receivables | ||||||
Taxes and charges recoverable | 2 | 3 | ||||
Loans to third parties and other | 1 | |||||
Permanent assets | ||||||
Property, plant and equipment | 22 | 15 | ||||
Transfer from long-term to current liabilities | ||||||
Financial institutions | 8 | 5 | ||||
Total funds used | 32 | 24 | ||||
Increase in working capital | 210 | 181 | ||||
Current assets | ||||||
At the end of the period | 1,326 | 971 | ||||
At the beginning of the period | 1,262 | 908 | ||||
| 64 | 63 | |||||
Current liabilities | ||||||
At the end of the period | 695 | 577 | ||||
At the beginning of the period | 841 | 695 | ||||
| (146 | ) | (118 | ) | |||
Increase in working capital | 210 | 181 | ||||
COPESUL - Companhia Petroquímica do Sul and subsidiaries
Unaudited Interim Consolidated Statements of Cash Flows
In millions of reais
| Quarter ended 3/31/2007 | Quarter ended 3/31/2006 | |||||
Net income of the period | 193 | 149 | ||||
Expenses (income) not affecting cash | ||||||
Depreciation | 57 | 57 | ||||
Amortization | 1 | |||||
Provision for administrative, civil and labor contingencies | 1 | (1 | ) | |||
Monetary and exchange variations | (2 | ) | ||||
Interest and monetary variations on current assets | ||||||
Interest | 1 | (6 | ) | |||
Monetary and exchange variations | (10 | ) | (13 | ) | ||
Disposals of property, plant and equipment and other | 3 | |||||
Swap difference receivable, net | (23 | ) | (8 | ) | ||
Swap and options difference payable, net | 21 | (3 | ) | |||
Deferred income tax and social contribution | (5 | ) | (1 | ) | ||
Trade accounts receivable | (72 | ) | 18 | |||
Trade notes linked to the FIDC | 3 | |||||
Inventories | 29 | 38 | ||||
Other accounts receivable - current and long-term | (3 | ) | (86 | ) | ||
Suppliers | (79 | ) | 4 | |||
Other accounts payable - current and long-term | 28 | 33 | ||||
Fiscal incentives - FUNDOPEM and PDTI | 2 | 25 | ||||
Net cash provided by operating activities | 144 | 207 | ||||
Marketable securities in current and long-term investments | ||||||
Investments | (36 | ) | (26 | ) | ||
Redemptions | 32 | 8 | ||||
Loans to third-parties -Receipts | 1 | 2 | ||||
Additions to property, plant and equipment | (21 | ) | (15 | ) | ||
Net cash used in investing activities | (24 | ) | (31 | ) | ||
Loans, financing and export drafts | ||||||
Issuances | 321 | 241 | ||||
Repayments | (169 | ) | (278 | ) | ||
Interest on own capital | (17 | ) | (21 | ) | ||
Dividends paid | (184 | ) | (68 | ) | ||
Net cash used in financing activities | (49 | ) | (126 | ) | ||
Net change in cash and cash equivalents | 71 | 50 | ||||
Initial cash and cash equivalents balance | 201 | 113 | ||||
Final cash and cash equivalents balance | 272 | 163 | ||||
Net change in cash and cash equivalents | 71 | 50 | ||||
The accompanying notes are an integral part of these financial statements.
COPESUL - Companhia Petroquímica do Sul and subsidiaries
Notes to the consolidated financial statements
at March 31, 2007 and 2006 (Unaudited) and December 31, 2006
In millions of reais, except when otherwise indicated
| 1 | Operations |
The Company, headquartered in Triunfo, Rio Grande do Sul, is a closely-held corporation and its main objectives are (a) manufacture, sale, import and export of chemical and petrochemical products and fuel; b) production and distribution of goods, as well as rendering services to companies of the Southern Petrochemical Complex and management of the logistic services pertinent to its waterway and terrestrial terminals; c) participation in other companies as quotaholder or stockholder.
The main suppliers of raw materials in the local market are PETROBRAS - Petróleo Brasileiro S.A. and Refinaria Alberto Pasqualini - REFAP S.A. and overseas, the companies Sonatrach SPA and Repsol YPF S.A.
The Company’s main customers are located in the Petrochemical Complex in Triunfo, Rio Grande do Sul. Additionally, the Company’s sales of hydrocarbon solvents and fuels are made both in the domestic and international markets, and the latter being mainly to Mercosur (Southern Common Market) and the United States.
| 2 | Presentation of the financial statements |
The financial statements for the three-months ended March 31, 2007 for legal and regulatory purposes were approved by the Company’s Board of Directors on April 24, 2007 (the financial statements for the year ended December 31, 2006 were approved on January 30, 2007).
The consolidated financial statements were prepared and are being presented in accordance with accounting practices adopted in Brazil, based on the provisions included in Brazilian Corporate Law as well as the Brazilian Securities Commission (CVM) standards and procedures. The financial statements presented here do not include the parent company’s stand-alone financial statements and are not intended for statutory purposes.
The preparation of financial statements requires the use of estimates to account for certain assets and liabilities and other transactions. Therefore, the Company’s financial statements include estimates referring to the selection of useful lives of fixed assets, provisions for contingent liabilities and determination of income tax liabilities. Actual results may differ from such estimates.
COPESUL - Companhia Petroquímica do Sul and subsidiaries
Notes to the consolidated financial statements
at March 31, 2007 and 2006 (Unaudited) and December 31, 2006
In millions of reais, except when otherwise indicated
| 3 | Significant accounting practices |
The accounting practices adopted in the presenting consolidated financial statements as of March 31, 2007 are consistent with those disclosed in the audited financial statements as of December 31, 2006.
| (a) | Consolidated financial statements |
These consolidated financial statements include the wholly-owned subsidiaries Copesul International Trading, Inc., CCI - Comercial Importadora S.A., and Fundo de Investimento Financeiro Multimercado Copesul, a mutual fund whose quotas are wholly-owned by the Company. In the consolidation process, intercompany balances, income, expenses, and unrealized profits arising from intercompany transactions were eliminated, as well as investments in subsidiaries.
| (b) | Marketable securities and swap receivables and payables |
These assets are recorded at cost plus accrued income up to the balance sheet date (accrual basis), adjusted to market value, when lower.
| (c) | Allowance for doubtful accounts |
The Company has no allowance for doubtful accounts, since losses are not expected to occur in relation to accounts receivable.
| (d) | Inventories |
Inventories are stated at average cost of acquisition or production, adjusted to market value, when lower.
| (e) | Investments |
Investments are recorded at acquisition cost and adjusted to market value, when applicable.
COPESUL - Companhia Petroquímica do Sul and subsidiaries
Notes to the consolidated financial statements
at March 31, 2007 and 2006 (Unaudited) and December 31, 2006
In millions of reais, except when otherwise indicated
| (f) | Property, plant and equipment |
Property, plant and equipment are stated at cost, plus revaluation, less accumulated depreciation combined with the following aspects:
Capitalization of the financial charges incurred during the construction period of property, plant, and equipment.
Depreciation of property, plant and equipment, calculated on the straight-line basis in accordance with the estimated useful lives of assets, supported by an independent appraisal report, using the rates mentioned in Note 12.
Revaluations of property, plant and equipment made in 1983 and 1989 based on appraisals carried out by independent appraisers.
| (g) | Deferred charges |
Deferred charges include pre-operating expenses related to expansion, projects for new products, development of systems, and organizational restructuring expenditures, amortized at the rate of 20% per annum (p.a.), Note 13.
| (h) | Rights and obligations |
Rights are stated at cost or realization value, including, when applicable, earnings and monetary restatements and exchange rate variations. Liabilities are recognized at their known or estimated values, including corresponding charges, monetary restatements and exchange rate variations when applicable.
| (i) | Income tax and social contribution |
Provision for income tax is recorded with the inclusion of the portion of fiscal incentives. Deferred taxes were recognized considering current rates for income tax and social contribution on tax losses and temporary differences, to the extent that realization is considered probable, as shown in Note 18.
| (j) | Determination of results of operations |
Income and expenses are determined on the accrual basis.
COPESUL - Companhia Petroquímica do Sul and subsidiaries
Notes to the consolidated financial statements
at March 31, 2007 and 2006 (Unaudited) and December 31, 2006
In millions of reais, except when otherwise indicated
| (k) | Reclassifications in the statement of operations |
In order to be consistent with the presentation criteria followed by the Braskem group, in the preparation of this financial statements, the Company made certain changes in the classification criteria used in prior periods, which for comparative purposes were also made to the financial information for the year ended December 31, 2006 and for the three-months ended March 31, 2006 presented herewith. The reclassifications were as follows:
| i. | Sale of services and resale of goods were distributed between domestic and foreign market; |
| ii. | Freight expenses are currently presented as deductions from gross revenues while previously were considered selling expenses; |
| iii. | Depreciation and amortization are separately disclosed which before were included as selling expenses and general and administrative expenses, as appropriate; and |
| iv. | Deferred income tax and social contribution are separately presented. In prior periods were presented together with current income tax expense under provisions for income tax and social contribution. |
Below is a summary of the effects:
| 3/31/2007 (Unaudited) | |||||||||
| Previous criterion | Reclassifications | Current criterion | |||||||
Domestic market | 1,735 | 204 | 1,939 | ||||||
Sale of services and resale of goods | 204 | (204 | ) | ||||||
| 1,939 | 1,939 | ||||||||
Taxes, contributions, and freight on sales | (421 | ) | (19 | ) | (440 | ) | |||
Selling | (40 | ) | 21 | (19 | ) | ||||
General and administrative | (14 | ) | 1 | (13 | ) | ||||
Depreciation and amortization | (3 | ) | (3 | ) | |||||
Management and employees profit sharing | (6 | ) | 6 | ||||||
Provision for income tax and social contribution | (97 | ) | (5 | ) | (102 | ) | |||
Deferred income tax and social contribution | 5 | 5 | |||||||
| (572 | ) | (572 | ) | ||||||
COPESUL - Companhia Petroquímica do Sul and subsidiaries
Notes to the consolidated financial statements
at March 31, 2007 and 2006 (Unaudited) and December 31, 2006
In millions of reais, except when otherwise indicated
| 3/31/2006 (Unaudited) | |||||||||
| Previous criterion | Reclassifications | Current criterion | |||||||
Domestic market | 1,691 | 12 | 1,703 | ||||||
Sale of services and resale of goods | 12 | (12 | ) | ||||||
| 1,703 | 1,703 | ||||||||
Taxes, contributions, and freight on sales | (419 | ) | (14 | ) | (433 | ) | |||
Selling | (25 | ) | 17 | (8 | ) | ||||
General and administrative | (12 | ) | 1 | (11 | ) | ||||
Depreciation and amortization | (3 | ) | (3 | ) | |||||
Management and employees profit sharing | (5 | ) | 5 | ||||||
Provision for income tax and social contribution | (76 | ) | (2 | ) | (78 | ) | |||
Deferred income tax and social contribution | 1 | 1 | |||||||
| (532 | ) | (532 | ) | ||||||
| (l) | Statement of cash flows |
The consolidated statement of cash flows is prepared in accordance with the Accounting Standards and Procedures - NPC no. 20 of IBRACON (Institute of Independent Auditors of Brazil).
| 4 | Cash and cash equivalents |
The investments included in this account have a term of no longer than 90 days.
| 3/31/2007 | 12/31/2006 | |||
| Unaudited | ||||
Cash and banks | 1 | 7 | ||
Investments in Fundo Investimento Financeiro Multimercado Copesul: | ||||
Bank Deposit Certificates - CDB | 43 | 88 | ||
Financial Treasury Bills - LFT | 14 | 13 | ||
National Treasury Bills | 1 | 1 | ||
Investment Funds | 13 | 12 | ||
Simple debentures and other | 110 | 43 | ||
Interest bearing account | 8 | |||
Overnight and term deposits | 82 | 37 | ||
| 272 | 201 | |||
COPESUL - Companhia Petroquímica do Sul and subsidiaries
Notes to the consolidated financial statements
at March 31, 2007 and 2006 (Unaudited) and December 31, 2006
In millions of reais, except when otherwise indicated
| 5 | Marketable Securities |
| 3/31/2007 | 12/31/2006 | |||
| Unaudited | ||||
Term deposit | 42 | 39 | ||
Total | 42 | 39 | ||
Current assets | 41 | 38 | ||
Long-term receivables | 1 | 1 | ||
COPESUL - Companhia Petroquímica do Sul and subsidiaries
Notes to the consolidated financial statements
at March 31, 2007 and 2006 (Unaudited) and December 31, 2006
In millions of reais, except when otherwise indicated
| 6 | Swap receivables and payables |
The Company entered into transactions involving US dollar options, called ‘Box Options’ as shown and commented below with the sole purpose of investing cash at a more attractive rate. Besides that, it also contracted Swap operations aiming to obtain maximization of the profitability earned by ‘Fundo de Investimento Financeiro Multimercado Copesul’, which is managed by COPESUL and whose custodian and manager is Banco Santander Brasil S.A.
On March 31, 2007 and December 31, 2006, the assets and liabilities of ‘Fundo de Investimento Financeiro Multimercado Copesul’ were distributed among the various accounts of the balance sheet in accordance with the nature of the respective accounts in compliance with Instruction CVM 408/2004.
| (a) | Amounts receivable |
| 3/31/2007 | 12/31/2006 | |||
| Unaudited | ||||
Swap receivables | 7 | 27 | ||
Options - Fixed income Box Operations | 80 | 37 | ||
| 87 | 64 | |||
| (b) | Amounts payable |
| 3/31/2007 | 12/31/2006 | |||
| Unaudited | ||||
Swap payable | 4 | 23 | ||
Options payable | 39 | |||
| 43 | 23 | |||
Box options are combined operations that involve purchase and sale of options in US dollars for the same maturity at a certain price, so that, regardless of the future US dollar rate, the Company previously knows the net result of those operations. It is similar, therefore, to fixed income operations. The value paid for the options, called a premium, refers to the amount invested by the Company and the sum redeemed will be the premium plus the earned pre-fixed return. In parallel to the contracting of purchase and sale operations of options, the Company uses Swaps with the purpose of exchanging the fixed income yield for the variance of Interbank Deposit Certificates - CDI.
COPESUL - Companhia Petroquímica do Sul and subsidiaries
Notes to the consolidated financial statements
at March 31, 2007 and 2006 (Unaudited) and December 31, 2006
In millions of reais, except when otherwise indicated
| 7 | Inventories |
Inventories are represented as follows:
| 3/31/2007 | 12/31/2006 | |||
| Unaudited | ||||
Raw materials | 367 | 379 | ||
Finished products | 89 | 99 | ||
Resupply and other materials | 73 | 73 | ||
Chemical and intermediate products | 12 | 20 | ||
| 541 | 571 | |||
| 8 | Taxes and charges recoverable |
This account is represented as follows:
| Current | Long-term | |||||||
| 3/31/2007 | 12/31/2006 | 3/31/2007 | 12/31/2006 | |||||
| Unaudited | Unaudited | |||||||
Deferred taxes | ||||||||
Deferred income tax on temporary additions (a) | 4 | 2 | 12 | 11 | ||||
Deferred social contribution on temporary additions (a) | 2 | 4 | 4 | |||||
| 6 | 2 | 16 | 15 | |||||
Other taxes and charges recoverable | ||||||||
Prepaid IRPJ | 32 | |||||||
Prepaid CSLL | 17 | |||||||
Withholding tax | 1 | |||||||
CSLL recoverable | 12 | |||||||
Tax on Net Income (ILL) (b) | 54 | 54 | ||||||
ADIR - Additional State Income Tax (c) | 27 | 28 | ||||||
ICMS on acquisition of property, plant and equipment (d) | 9 | 8 | 10 | 10 | ||||
PASEP recoverable (e) | 15 | 33 | 23 | |||||
COFINS recoverable | 3 | |||||||
COFINS on acquisition of property, plant and equipment (f) | 2 | 2 | 2 | 2 | ||||
Prepaid ICMS (g) | 43 | 72 | ||||||
ICMS recoverable | 3 | 1 | ||||||
IPI recoverable (h) | 5 | 5 | ||||||
| 107 | 113 | 131 | 122 | |||||
| 113 | 115 | 147 | 137 | |||||
COPESUL - Companhia Petroquímica do Sul and subsidiaries
Notes to the consolidated financial statements
at March 31, 2007 and 2006 (Unaudited) and December 31, 2006
In millions of reais, except when otherwise indicated
| (a) | The Company recorded deferred assets on the loss of its subsidiary Copesul International Trading, Inc. - CITI in view of the loss in March 2007, which were offset with profits during this year. The Company also recorded deferred tax assets on temporary differences in current assets and long-term receivables in accordance with the expectation of their realization. The credits totaled R$22 (R$17 on December 31, 2006) and are expected to be realized as follows: |
| % | ||||
Year | 3/31/2007 | 12/31/2006 | ||
| Unaudited | ||||
2007 | 27.76 | 12.90 | ||
2008 | * | * | ||
2009 and after | 72.24 | 87.10 | ||
| 100.00 | 100.00 | |||
| (b) | This refers to the tax credit of Tax on Net Income - ILL paid from 1989 to 1991 and was recognized in accounting terms in the assets of December 2002 as this tax was considered unconstitutional according to Resolution of the Federal Senate No. 82 of November 18, 1996 and republished on November 22, 1996. The Company is seeking administratively the right of compensation of this credit with other taxes. |
| (c) | On March 31, 2007, the Company had recorded a receivable of R$27 (R$28 on December 31, 2006) relating to Additional State Income Tax (ADIR), for which the Company was awarded a final favorable judgment, and a security to cover court-ordered debts was issued. This security should be received at its original amount, in cash, plus legal interest, in successive and equal annual installments over a maximum ten-year period, from 2001. Up to March 31, 2007, no installment had been settled on its maturity, but they may be offset in future years against State taxes, as determined by Article 2 of Constitutional Amendment 30 of September 13, 2000. As a means of precaution, the Company filed an appeal in order to avoid the first installment becoming time-barred as well as to offset the ICMS tax credit with ICMS payable generated in its operations. |
COPESUL - Companhia Petroquímica do Sul and subsidiaries
Notes to the consolidated financial statements
at March 31, 2007 and 2006 (Unaudited) and December 31, 2006
In millions of reais, except when otherwise indicated
| (d) | As from August 2000, the Company started recording the ICMS credits paid on acquisitions of property, plant and equipment, as determined by Complementary Law 102 dated July 11, 2000. The credits to be offset are as follows: |
Year | 3/31/2007 | 12/31/2006 | ||
| Unaudited | ||||
2007 | 7 | 8 | ||
2008 | 7 | 7 | ||
2009 | 3 | 3 | ||
2010 | 2 | * | ||
| 19 | 18 | |||
Current assets | 9 | 8 | ||
Long-term receivables | 10 | 10 | ||
| (e) | During 2006 the Company recognized a PASEP judicial tax credit in the amount of R$45, seeking the right to carry out the payments in accordance with Complementary Law 8/70, using as a calculation basis the revenue of the sixth month prior to the occurrence of the taxable event, in light of Resolution No. 49/95 of the Federal Senate in a final decision. This credit was recognized in the income statement for the year 2006 in the accounts of other net operating income in the amount of R$14 and financial income of R$30. |
The changes in this credit are shown below:
| 3/31/2007 | 12/31/2006 | |||||
| Unaudited | ||||||
Beginning balance | 38 | |||||
PASEP credit with final favorable judgment | 45 | |||||
Amount of credit compensated with PIS | (5 | ) | (7 | ) | ||
PASEP balance | 33 | 38 | ||||
Currently the Company has the right to make the offset of the PASEP credit with PIS and under orientation of its legal advisors filed a judicial claim for the right to offset it with other federal taxes.
| (f) | The Company recognizes PIS and COFINS recoverable credits on the acquisitions of property, plant and equipment, which will be realized in 24 and 48 months depending on the asset acquired as permitted by Law 10865/04 and Decree 5222/04. |
COPESUL - Companhia Petroquímica do Sul and subsidiaries
Notes to the consolidated financial statements
at March 31, 2007 and 2006 (Unaudited) and December 31, 2006
In millions of reais, except when otherwise indicated
| (g) | During the year 2006, the Company advanced the amounts related to ICMS on future sales in the amount of R$72. The offset of the prepaid ICMS is being done in 10 monthly and consecutive payments, with charges adjusted by the ‘Unidade Padrão Fiscal do RS’-UPF (Standard Fiscal Unit of RS), having begun in January 2007. The prepayment amount not yet offset on March 31, 2007 totals R$43. |
| (h) | The Company recognizes an IPI credit on the acquisitions of raw materials used in the production process, despite these products being defined as “zero rate”. In order to use these credits, every quarter they are offset with federal taxes in accordance with Decree 4544/2002 and paragraph 4, article 16 of the Regulatory Instruction No. 460/2004 of the Brazilian Revenue Secretariat. The long-term balance refers to the IPI Credit Premium that was judicially recognized and will be realized by the end of 2008. |
| 9 | Prepaid Expenses |
Prepaid expenses comprise payments made in advance, relating to benefits or services to be received by the Company in future years.
Realization will not be in cash, but by appropriation to the results of operations, as follows:
Realization terms | 3/31/2007 | 12/31/2006 | ||||
| Unaudited | ||||||
Insurance | Up to Nov/2007 (Dec/06 to Nov/2007) | 7 | 10 | |||
Chemical products (catalysts) | Up to Sep/2018 (Dec/06 to Sep/2018) | 8 | 8 | |||
Total | 15 | 18 | ||||
Current assets | 11 | 14 | ||||
Long-term receivables | 4 | 4 | ||||
The long-term portion refers to chemical products (catalysts) which are used as agents that promote a chemical reaction in the production of basic petrochemicals. Their average useful life and amortization period is 6 years.
COPESUL - Companhia Petroquímica do Sul and subsidiaries
Notes to the consolidated financial statements
at March 31, 2007 and 2006 (Unaudited) and December 31, 2006
In millions of reais, except when otherwise indicated
| 10 | Judicial deposits |
| 3/31/2007 | 12/31/2006 | |||
| Unaudited | ||||
Tax claims: | ||||
Income tax | 2 | 2 | ||
CIDE on technical assistance services | 4 | 4 | ||
IRRF on technical assistance services | 1 | 1 | ||
| 7 | 7 | |||
Labor claims | 2 | 2 | ||
| 9 | 9 | |||
The Company has made judicial deposits and has recorded a provision for contingencies relating to income taxes and CIDE in connection with lawsuits, as described in Note 24 (a).
| 11 | Investments |
| (a) | Information on investments: |
| 3/31/2007 | 12/31/2006 | |||
| Unaudited | ||||
Other Investments | 7 | 10 | ||
| 7 | 10 | |||
COPESUL - Companhia Petroquímica do Sul and subsidiaries
Notes to the consolidated financial statements
at March 31, 2007 and 2006 (Unaudited) and December 31, 2006
In millions of reais, except when otherwise indicated
| (b) | Information on subsidiaries |
Copesul International Trading, Inc. - CITI has the function of performing “Trading Company” operations and prepares its financial statements in Brazilian Real.
| Parent company | ||||||
Copesul International Trading, Inc. - CITI | 3/31/2007 | 12/31/2006 | ||||
| Unaudited | ||||||
Capital | 99 | 99 | ||||
Stockholders’ equity | 97 | 116 | ||||
Holding percentage - total and voting capital | 100 | % | 100 | % | ||
Number of shares | 98,529,157 | 98,529,157 | ||||
| 3/31/2007 | 3/31/2006 | |||||
| Unaudited | Unaudited | |||||
Income (loss) in the period/year | (5 | ) | 17 | |||
| 12 | Property, plant and equipment |
| 3/31/2007 Unaudited | 12/31/2006 | ||||||||||
| Annual depreciation rates % (*) | Revalued and restated cost | Accumulated depreciation | Net | Net | |||||||
Equipment and installations | |||||||||||
Operations | 10 | 2,010 | (1,503 | ) | 507 | 535 | |||||
Utilities | 10 | 911 | (840 | ) | 71 | 79 | |||||
Storage and transfers | 10 | 434 | (341 | ) | 93 | 98 | |||||
Maintenance Stoppage - CVM Del. No. 489/05 (**) | 21 | 92 | (39 | ) | 53 | 57 | |||||
Other (***) | 15 | 89 | (70 | ) | 19 | 20 | |||||
Buildings and construction | 4 | 56 | (23 | ) | 33 | 33 | |||||
Improvements | 4 | 22 | (11 | ) | 11 | 10 | |||||
Land | 38 | 38 | 38 | ||||||||
Construction in progress | 150 | 150 | 141 | ||||||||
Maintenance Stoppage in Progress - CVM Del. No. 489/05 | 19 | 19 | 19 | ||||||||
| 3,821 | (2,827 | ) | 994 | 1,030 | |||||||
| (*) | weighted-average rate that reflects the depreciation expense (Note 3 (f)). |
| (**) | supported by appraisal reports issued by specialized companies. |
| (***) | information technology equipment, furniture and fixtures, among others are included in this account. |
COPESUL - Companhia Petroquímica do Sul and subsidiaries
Notes to the consolidated financial statements
at March 31, 2007 and 2006 (Unaudited) and December 31, 2006
In millions of reais, except when otherwise indicated
Certain items of fixed assets were given as guarantee for financing operations, as shown in Note 15 (d).
| (a) | Revaluations |
Revaluations of property, plant and equipment made in 1983 and 1989, based on appraisal reports issued by specialized companies, produced the following effects on the balance sheet:
| 3/31/2007 (Unaudited) | 12/31/2006 | ||||||||
| Revaluation | Accumulated realization | Net | Net | ||||||
Equipment and installations | 1,339 | (1,317 | ) | 22 | 28 | ||||
Buildings and construction | 17 | (7 | ) | 10 | 11 | ||||
Improvements | 7 | (3 | ) | 4 | 4 | ||||
Land | 32 | 32 | 32 | ||||||
Total | 1,395 | (1,327 | ) | 68 | 75 | ||||
Revaluation reserve | 68 | 75 | |||||||
Realizations of the revaluation reserve occur through depreciation and disposals of the revalued assets each year. The amounts realized are transferred directly to retained earnings, on which the effects of income tax and social contribution are also considered at the current rates.
The Company did not set up a provision for deferred income tax and deferred social contribution on the balance of the revaluation reserve, since CVM Deliberation 183/95 determines that such provision is only required on revaluations made as from July 1, 1995. The revaluation reserve is taxable when realized through depreciation and disposals of items. Considering current tax legislation, the revaluation reserve is subject to future taxation estimated as follows:
COPESUL - Companhia Petroquímica do Sul and subsidiaries
Notes to the consolidated financial statements
at March 31, 2007 and 2006 (Unaudited) and December 31, 2006
In millions of reais, except when otherwise indicated
Statement of the calculation used to estimate future income tax and social contribution on the revaluation reserve:
| 3/31/2007 | 12/31/2006 | |||||
| Unaudited | ||||||
Income tax: | ||||||
Balance of revaluation reserve | 68 | 75 | ||||
Revaluation reserve on land | (31 | ) | (31 | ) | ||
Income tax calculation basis | 37 | 44 | ||||
Income tax (rate - 25%) | (9 | ) | (11 | ) | ||
Social contribution: | ||||||
Income tax calculation basis | 37 | 44 | ||||
Difference regarding IPC/BTNF on revaluation reserve balance | (18 | ) | (22 | ) | ||
Social contribution calculation basis | 19 | 22 | ||||
Social contribution (rate - 9%) | (2 | ) | (2 | ) | ||
Income tax and social contribution | (11 | ) | (13 | ) | ||
During this quarter, the portion of R$7 (R$33 during year 2006) was transferred to retained earnings upon realization of the revaluation reserve, as shown in the changes in shareholders’ equity. The tax effect on the realization was R$2 (R$10 during year 2006).
| (b) | Acquisitions of property, plant and equipment |
COPESUL invested the amount of R$21 in the first quarter 2007. The main investments are R$4 - operational reliability, technological updating, and profitability increase projects to be implemented during the PGM that is forecasted to take place in 2008; R$5 - industrial automation programs; R$6 - replacement of coils and technological updating of the furnaces and R$4 - conversion of the MTBE unit to ETBE. The remaining balance of R$2 refers to various investment projects. In the year 2006 COPESUL invested the amount of R$126. The main investments are R$38 - direct investments to make feasible the General Maintenance Stoppage (PGM); R$19 - operational reliability, technological updating, and profitability increase projects to be implemented during the PGM that is forecasted to take place in 2008; R$19 - industrial automation programs; R$10 - replacement of coils and technological updating of the furnaces; R$5 - building of Butadiene Unit, and R$7 - conversion of the MTBE unit to ETBE. The remaining balance of R$28 refers to various investment projects.
COPESUL - Companhia Petroquímica do Sul and subsidiaries
Notes to the consolidated financial statements
at March 31, 2007 and 2006 (Unaudited) and December 31, 2006
In millions of reais, except when otherwise indicated
| 13 | Deferred charges |
Deferred charges comprise:
| Annual amortization | 3/31/2007 Unaudited | 12/31/2006 | |||||||||
| rates % (p.a.) | Restated cost | Accumulated amortization | Net | Net | |||||||
Development programs | 20 | 63 | (53 | ) | 10 | 10 | |||||
| 63 | (53 | ) | 10 | 10 | |||||||
| 14 | Suppliers |
| 3/31/2007 | 12/31/2006 | |||
| Unaudited | ||||
Local | 51 | 94 | ||
Foreign | 224 | 260 | ||
| 275 | 354 | |||
COPESUL - Companhia Petroquímica do Sul and subsidiaries
Notes to the consolidated financial statements
at March 31, 2007 and 2006 (Unaudited) and December 31, 2006
In millions of reais, except when otherwise indicated
| 15 | Loans and financing |
| (a) | Liabilities for loans and financing are as follows: |
Index | Annual charges (%)* | 3/31/2007 | 12/31/2006 | |||||
| Unaudited | ||||||||
Foreign currency | ||||||||
Financing (investments) - US$2 million | Currency basket and US$ | 9.04 | 4 | 4 | ||||
Financing and loans (US$25 million) | Currency Basket | 10.11 | 51 | 7 | ||||
| 55 | 11 | |||||||
Local currency | ||||||||
Loans and financing | TJLP | 11.53 | 37 | 40 | ||||
Hot money, NCE and BACEN Resolution 2770 | CDI | 12.95 | 13 | 23 | ||||
Financing (Investments) | TJLP | 9.64 | 81 | 83 | ||||
| 131 | 146 | |||||||
| 186 | 157 | |||||||
Current liabilities | 87 | 50 | ||||||
Long-term liabilities | 99 | 107 | ||||||
| * | weighted-average rate that reflects the charges on loans. |
NCE - Export Credit Note
CDI - Interbank Deposit Certificate
TJLP - Long-Term Interest Rate
BACEN - Brazilian Central Bank
| (b) | The changes in loans and financing were as follows: |
| Short-term | Long-term | Total | |||||||
At December 31, 2005 | 288 | 84 | 372 | ||||||
Additions | 604 | 47 | 651 | ||||||
Interest | 28 | 28 | |||||||
Transfer to short-term | 24 | (24 | ) | ||||||
Linked | (893 | ) | (893 | ) | |||||
Monetary and exchange variations | (1 | ) | (1 | ) | |||||
At December 31, 2006 | 50 | 107 | 157 | ||||||
Additions | 116 | 116 | |||||||
Interest | 4 | 4 | |||||||
Transfer to short-term | 8 | (8 | ) | ||||||
Linked | (90 | ) | (90 | ) | |||||
Monetary and exchange variations | (1 | ) | (1 | ) | |||||
At March 31, 2007 (Unaudited) | 87 | 99 | 186 | ||||||
COPESUL - Companhia Petroquímica do Sul and subsidiaries
Notes to the consolidated financial statements
at March 31, 2007 and 2006 (Unaudited) and December 31, 2006
In millions of reais, except when otherwise indicated
During the third quarter of 2006, the Company entered into a credit line agreement with BNDES - Banco Nacional de Desenvolvimento Econômico e Social in the amount of R$338 for future investment in order to improve its manufacturing facilities. By March 31, 2007 the Company had used R$43 of this credit line.
| (c) | Long-term financing falls due as follows: |
Year | 3/31/2007 | 12/31/2006 | ||
| Unaudited | ||||
2008 | 25 | 33 | ||
2009 | 30 | 30 | ||
2010 | 23 | 22 | ||
2011 | 13 | 14 | ||
2012 | 8 | 8 | ||
| 99 | 107 | |||
| (d) | Guarantees |
The foreign currency financing are guaranteed in part by the mortgage of plant 2 and by letter of guarantee.
Local currency financing via FINEM and FINAME programs is guaranteed by Plant 2 and by the financed machinery and equipment, respectively.
The financing contracted with the Banco Nacional de Desenvolvimento Econômico e Social - BNDES, on September 9, 2005, amounting to R$50, for the installation of a pyrolysis furnace, has as a fiduciary guarantee a letter of guarantee issued by the Banco Regional de Desenvolvimento do Extremo Sul - BRDE. For the rest of the investment financing, the Company placed plant 2 as guarantee.
The Company is the guarantor of working capital loans of its subsidiary amounting to R$45 through the issuing of promissory notes.
The NCE operations in the amount of R$3 (R$23 at December 31, 2006) are guaranteed by COPESUL itself in the same NCE contracted document.
COPESUL - Companhia Petroquímica do Sul and subsidiaries
Notes to the consolidated financial statements
at March 31, 2007 and 2006 (Unaudited) and December 31, 2006
In millions of reais, except when otherwise indicated
The Company has given secondary guarantees to financial institutions in relation to “vendor” transactions for Braskem S.A. and the amount of the principal is R$585 (R$613 at December 31, 2006). Losses are not expected for the Company as a result of these obligations.
Additionally, in March 2007, the Company placed R$1 (R$1 at December 31, 2006) as a guarantee of energy purchase operations (National Operator of the Electric System - ONS), recorded in long-term marketable securities.
| 16 | Export drafts |
The changes in advances contracted with financial institutions relating to exports to be invoiced are as follows:
| Billed | To be invoiced | |||||||||||
| Current assets | Current liabilities | Long-term liabilities | Total | |||||||||
At December 31, 2005 | 18 | 1 | 91 | 110 | ||||||||
Additions | 531 | 138 | 669 | |||||||||
Interest | 13 | 13 | ||||||||||
Transfer to short-term | 35 | (35 | ) | |||||||||
New export receivables | 527 | (527 | ) | |||||||||
Amortization | (545 | ) | (12 | ) | (49 | ) | (606 | ) | ||||
Monetary and exchange variations | 1 | (2 | ) | (6 | ) | (7 | ) | |||||
At December 31, 2006 | 1 | 39 | 139 | 179 | ||||||||
Additions | 205 | 205 | ||||||||||
Interest | 3 | 3 | ||||||||||
New export receivables | 159 | (159 | ) | |||||||||
Amortization | (84 | ) | (2 | ) | (86 | ) | ||||||
Monetary and exchange variations | (1 | ) | (1 | ) | (6 | ) | (8 | ) | ||||
At March 31, 2007 (Unaudited) | 75 | 85 | 133 | 293 | ||||||||
Export drafts to be invoiced bear exchange variation plus average interest of 7.55% p.a. (7.11% p.a. in 2006), which are recorded in the statement of income as financial expenses.
COPESUL - Companhia Petroquímica do Sul and subsidiaries
Notes to the consolidated financial statements
at March 31, 2007 and 2006 (Unaudited) and December 31, 2006
In millions of reais, except when otherwise indicated
Long-term export drafts falls due as follows:
Year | 3/31/2007 | 12/31/2006 | ||
| Unaudited | ||||
2009 | 72 | 75 | ||
2010 | 61 | 64 | ||
| 133 | 139 | |||
| 17 | Taxes and charges payable |
| 3/31/2007 | 12/31/2006 | |||
| Unaudited | ||||
ICMS payable | 18 | 22 | ||
ICMS - tax replacement | 3 | 3 | ||
CIDE on fuels payable | 11 | 16 | ||
IRRF on interest on own capital payable | 3 | |||
Other retentions payable | 1 | 1 | ||
| 33 | 45 | |||
COPESUL - Companhia Petroquímica do Sul and subsidiaries
Notes to the consolidated financial statements
at March 31, 2007 and 2006 (Unaudited) and December 31, 2006
In millions of reais, except when otherwise indicated
| 18 | Income tax and social contribution |
| (a) | Composition of deferred income tax and social contribution |
| 3/31/2007 Unaudited | 12/31/2006 | |||||||||||
| Income tax | Social contribution | Income tax | Social contribution | |||||||||
Calculation basis for deferred income tax and social contribution | ||||||||||||
Provision for administrative, civil and labor contingencies | 30 | 30 | 29 | 29 | ||||||||
Provision for fiscal contingencies - IR and CIDE on services abroad | 5 | 5 | 5 | 5 | ||||||||
Provision for contingencies - pension plan | 9 | 9 | 9 | 9 | ||||||||
Exchange variation - deferred | (25 | ) | (25 | ) | (26 | ) | (26 | ) | ||||
Provision for employee profit-sharing | 5 | 5 | ||||||||||
Other provisions | 10 | 9 | 8 | 8 | ||||||||
Copesul International Trading tax loss | 5 | 5 | ||||||||||
Accelerated depreciation Law 11.051/05 | (18 | ) | (15 | ) | ||||||||
Accelerated depreciation incentive | (4 | ) | * | (4 | ) | |||||||
Deferred taxes calculation basis | 35 | 20 | 21 | 10 | ||||||||
Deferred income tax (25%) | 9 | 5 | ||||||||||
Deferred social contribution (9%) | 2 | 1 | ||||||||||
Deferred total taxes | 9 | 2 | 5 | 1 | ||||||||
Assets | ||||||||||||
Short-term | 4 | 2 | 2 | |||||||||
Long-term | 12 | 4 | 11 | 4 | ||||||||
| 16 | 6 | 13 | 4 | |||||||||
Liabilities | ||||||||||||
Long-term | (7 | ) | (4 | ) | (8 | ) | (3 | ) | ||||
| (7 | ) | (4 | ) | (8 | ) | (3 | ) | |||||
| 9 | 2 | 5 | 1 | |||||||||
| 3/31/2007 Unaudited | 12/31/2006 | |||||||||||
| Income tax | Social contribution | Income tax | Social contribution | |||||||||
Changes in the deferred taxes in the result | 4 | 1 | (2 | ) | (2 | ) | ||||||
COPESUL - Companhia Petroquímica do Sul and subsidiaries
Notes to the consolidated financial statements
at March 31, 2007 and 2006 (Unaudited) and December 31, 2006
In millions of reais, except when otherwise indicated
The deferred income tax and social contribution assets and liabilities arose from temporary differences and are recognized in accounting terms taking into consideration the probable realization of these taxes based on forecasts of future results prepared and founded on internal assumptions and on future economic scenarios that can, however, undergo changes.
| (b) | Estimated realization period |
The values of the assets, net of the deferred tax liabilities, have the following expectations of realization:
Year | 3/31/2007 | 12/31/2006 | ||||
| Unaudited | ||||||
2007 | 6 | 1 | ||||
2010 | (1 | ) | (1 | ) | ||
2011 | (4 | ) | (4 | ) | ||
2015 and 2016 | 10 | 10 | ||||
| 11 | 6 | |||||
Since the taxable basis of the income tax and social contribution arises from not only the profit that can be generated, but also the existence of non-taxable income, non-deductible expenses, fiscal incentives, and other variables, there is not an immediate correlation between the Company’s net income and the result of income tax and social contribution. Therefore, the expectation of using the tax credits should not be taken as the only indicator of the Company’s future results.
COPESUL - Companhia Petroquímica do Sul and subsidiaries
Notes to the consolidated financial statements
at March 31, 2007 and 2006 (Unaudited) and December 31, 2006
In millions of reais, except when otherwise indicated
| (c) | Reconciliation of income tax and social contribution |
| 3/31/2007 | 03/31/2006 | |||||
| Unaudited | Unaudited | |||||
Income before income tax and social contribution | 296 | 231 | ||||
Social contribution on net income (CSLL) | ||||||
Social contribution (9%) | (27 | ) | (21 | ) | ||
Permanent additions | ||||||
Realization of revaluation reserve - difference in IPC/BTNF | (1 | ) | ||||
Equity in losses of subsidiares | (1 | ) | ||||
Other | (1 | ) | (1 | ) | ||
Permanent exclusions | ||||||
Equity in earnings of subsidiaries | 1 | |||||
CITI tax credit/loss | 1 | |||||
Other | 1 | |||||
Social contribution expense | (27 | ) | (22 | ) | ||
Income tax (IR) | ||||||
Income tax (25%) | (74 | ) | (58 | ) | ||
Permanent additions | ||||||
Equity in losses of subsidiaries | (1 | ) | (2 | ) | ||
Other | (2 | ) | ||||
Permanent exclusions | ||||||
Equity in earnings of subsidiaries | 2 | |||||
CITI tax credit/loss | 1 | |||||
Fiscal incentives | 1 | 1 | ||||
Other | 1 | |||||
Income tax expense | (75 | ) | (56 | ) | ||
Total income tax and social contribution in the income statement | (102 | ) | (78 | ) | ||
During 2007 and 2006, the taxation basis was annual taxable income, with an election for payment by monthly estimate.
COPESUL - Companhia Petroquímica do Sul and subsidiaries
Notes to the consolidated financial statements
at March 31, 2007 and 2006 (Unaudited) and December 31, 2006
In millions of reais, except when otherwise indicated
| (d) | Fiscal incentives |
The Company exercised its rights to fiscal incentives of PDTI - Program for Technological and Industrial Development based on Law No. 9532/97, Decree No. 949/93 and on Ordinance No. 130/02 of the Ministry of Science and Technology (MCT) up to the year 2005. Beginning in 2006, the Company migrated to the incentives of PDI - Technological Research and Technological Innovation Development resulting from Law 11,196/05, Decree No. 5.798/06 and of MCT Ordinance No. 782/06 with income tax and social contribution incentive of R$1 in the present quarter. Fiscal incentives in child and adolescent fund, and operations of a cultural and artistic nature were also used during 2007 as well as the PAT - Program for the Worker’s Nutrition, reaching a total of R$2 (R$1 in the same period of 2006). These incentives were recorded directly as reductions of the IRPJ accounts in the statement of income.
| 19 | Stockholders’ equity |
| (a) | Capital |
The Company’s stockholder composition at March 31, 2007 and 2006 is shown below.
STOCKHOLDERS | Number of shares | (%) | ||
Ipiranga Group (i) | 44,255,077 | 29.46 | ||
Braskem Group / Odebrecht | 44,255,077 | 29.46 | ||
Petrobras Química S.A. - PETROQUISA | 23,482,008 | 15.63 | ||
Other | 38,225,005 | 25.45 | ||
Total | 150,217,167 | 100.00 | ||
On March 5, 2007, as approved at the Ordinary/Extraordinary General Meeting, the Company carried out a capital increase in the amount of R$ 60 by the capitalization of fiscal incentive reserves of FUNDOPEM, without changing the number of original shares.
COPESUL - Companhia Petroquímica do Sul and subsidiaries
Notes to the consolidated financial statements
at March 31, 2007 and 2006 (Unaudited) and December 31, 2006
In millions of reais, except when otherwise indicated
| (i) | Relevant fact |
Acquisition of the Ipiranga Group
A Relevant Fact was published in the press on March 19, 2007 that deals with the acquisition of the Ipiranga Group by Ultrapar Participações S.A. (Ultrapar) in the capacity of agent for the account and order of Braskem and Petrobras. Braskem and Petrobras will own the petrochemical assets represented by Ipiranga Química S.A., Ipiranga Petroquímica S.A. (IPQ) and by the latter’s interest in Copesul, in the proportion of 60% for Braskem and 40% for Petrobras.
On April 18, 2007, Braskem and Copesul announced by a Relevant Fact that Braskem, through its subsidiary EDSP58 Participações S.A. (“Offeror”), together with Unibanco - União de Bancos Brasileiros S.A., as intermediary institution (“Intermediary”), submitted a request for registering a public tender offer for the acquisition of Copesul shares (“Offer”) to delist it from the São Paulo Stock Exchange - BOVESPA (“BOVESPA”) as provided for in article 4, paragraph 4 of Law no. 6,404/76 and the CVM Instruction no. 361/02 and in compliance with the information already disclosed by the Relevant Fact published on March 19, 2007. The Offeror is a corporation with capital held by Braskem and by Petróleo Brasileiro S.A. - Petrobras, in the proportion of 60% and 40%, respectively.
The appraisal report on the above-mentioned Offer, issued by Calyon Corporate Finance Brasil - Consultoria Financeira Ltda., dated April 16, 2007, was sent on April 18 to the Brazilian Securities Commission - CVM (“CVM”) and is available for anyone interested at the São Paulo Stock Exchange - Bovespa, at Braskem’s headquarters, and at the Offeror, the Intermediary, at Copesul, as well as at CVM, and was also available beginning on that date, at the following electronic addresses: www.braskem.com.br, www.copesul.com.br, www.bovespa.com.br, and www.cvm.gov.br, as established by article 8, paragraph 5, of CVM Instruction no. 361/02.
COPESUL - Companhia Petroquímica do Sul and subsidiaries
Notes to the consolidated financial statements
at March 31, 2007 and 2006 (Unaudited) and December 31, 2006
In millions of reais, except when otherwise indicated
Tender Offer for shares of Copesul (“Offer”):
On October 5, 2007, Braskem and Copesul by means of a Relevant Fact, which has been copied below, informed the result of the Tender Offer for Copesul shares (“Offer”):
“Braskem S.A. (“Braskem”), for the account and through its controlled company EDSP58 Participações S.A. (“Offeror”) and Copesul - Companhia Petroquímica do Sul (“Copesul”), in compliance to the terms of CVM Instruction no. 358/02, inform that in the Tender Offer for the Acquisition of Common Shares Issued by Copesul (“Offer”) held on this date in the electronic trading system of the São Paulo Stock Exchange - Bovespa, the Offeror purchased 34,040,927 (thirty-four million, forty thousand, nine hundred and twenty seven) common shares of Copesul, which represent more than 2/3 (two-thirds) of the outstanding shares.
Since more than 2/3 (two-thirds) of the shares in circulation were purchased, after verifying compliance with the norms that apply to the Offer, the Brazilian Securities Commission (“CVM”) delisted Copesul on October 17, 2007.
During 3 (three months) from the offer date, the holders of Copesul shares may sell their shares to the Offeror for the same price as during the Offer, updated through the date of the actual payment, according to the notification of the Offer published on August 14, 2007.
Furthermore, considering that the remaining shares in circulation are less than 5% (five percent) of the total shares, Copesul’s Board of Directors will call a Stockholders’ General Meeting to discuss the purchase of these shares for the price of the Offer, according to paragraph 5 of article 4 of Law no. 6,404/76.
According to the terms of Ruling 361/02, Bovespa has 4 business days to send to CVM the final reports regarding the auction.”
| (b) | Capital reserves |
Capital reserves are made up as follows:
| 3/31/2007 | 12/31/2006 | |||
| Unaudited | ||||
FUNDOPEM | 223 | 284 | ||
Fiscal incentives - PDI - Technological Research and Technological Innovation Development | 15 | 12 | ||
| 238 | 296 | |||
COPESUL - Companhia Petroquímica do Sul and subsidiaries
Notes to the consolidated financial statements
at March 31, 2007 and 2006 (Unaudited) and December 31, 2006
In millions of reais, except when otherwise indicated
In September 1998, the Company started to set up a capital reserve based on the financial incentive of the Company Operation Fund (FUNDOPEM) - RS, according to Law 6427 of October 18, 1972 and amendments. The incentive was granted to the Company through Decree 38502, of May 11, 1998, and the benefit obtained is 50% of ICMS due for a maximum period of 8 years, beginning in September 1998 until August 2006. The amount accumulated since the beginning of the benefit, recorded as a capital reserve in stockholders’ equity was R$610, of which R$386 (R$326 at December 31, 2006) was used to increase capital, as approved at the General Meetings in 2007, 2006, 2004, 2003, 2001, and 2000.
Beginning in 2003, the Company obtained the benefit of fiscal incentives of PDTI - Fiscal incentives - PDI - Technological Research and Technological Innovation Development based on Law No. 9532/97 and No. 11196/05, Decrees No. 949/93 and 5798/06 and on Ordinance No. 130/02 and No. 783/06 of the Ministry of Science and Technology. There is a 60-month period in which these benefits must be used, beginning from March 2002 and terminating in February 2007. During this quarter, the Company recorded the benefit of this fiscal incentive in the amount of R$2 directly in the stockholders’ equity.
| (c) | Revaluation reserve |
The realization of the revaluation reserve, based on depreciation, write-offs or disposals of the corresponding revalued assets, is transferred to retained earnings, also considering the tax effects of the provisions constituted.
The tax charges levied on the revaluation reserve are recognized as this reserve is realized since they are previous to the publication of the CVM Deliberation No. 183/95. The tax charges levied on these reserves total R$11 (R$13 on December 31, 2006) as shown in Note 12(a).
| (e) | Prior year adjustments |
The adjustment can be summarized as shown below.
| 2006 | |||
Provision for programmed maintenance (i) | 66 | ||
Taxes (ii) | (28 | ) | |
Prior year adjustment - Total | 38 | ||
COPESUL - Companhia Petroquímica do Sul and subsidiaries
Notes to the consolidated financial statements
at March 31, 2007 and 2006 (Unaudited) and December 31, 2006
In millions of reais, except when otherwise indicated
| (i) | Up to December 31, 2005, the Provision for Programmed maintenance was set up considering the estimated costs of programmed maintenance, especially the general stoppage that occurs every six years. The stoppage of Plant 1 occurred in the first half of 2001 and the next one should be in 2008. The stoppage of Plant 2 took place in November 2005 and the next one is planned for November 2011. In accordance with the provisions contained in CVM Deliberation no. 489, dated October 3, 2005, that approved and made mandatory for listed companies the Accounting Pronouncement and Standard - NPC No. 22 (“Provisions, Liabilities and Contingent Assets and Liabilities”), issued by the Brazilian Institute of Independent Auditors - IBRACON which establishes that “…no provision is recognized for costs that need to be incurred to operate in the future. The only liabilities recognized in the balance sheet of an entity are those that exist at the balance sheet date.” Thus, the effects of the adoption of the procedures described above were recognized as a prior year adjustment due to a change in accounting practice, on January 1, 2006, charged directly to retained earnings. The effects of adopting this new accounting practice, net of the tax effects, are as follows: |
| 2006 | |||
Reversal of the provision set up on December 31, 2005, net of the tax effects | 45 | ||
Capitalization of the expenses incurred with previous stoppages in property, plant and equipment, net of the tax effects | 41 | ||
Depreciation accumulated up to December 31, 2005 on the expenses incurred with previous stoppages in property, plant and equipment that were capitalized. | (20 | ) | |
| 66 | |||
| (ii) | On November 2001, COPESUL filed a Restitution Request of the Tax on Net Income - ILL with the Brazilian Revenue and Customs Secretariat seeking a compensation for the ILL paid from 1990 to 1992 as this tax has been considered unconstitutional according to the Federal Senate Resolution No. 82 of November 22, 1996. See Note 9.(a). |
In December 2002, the Company recognized this credit because the legal advisors considered this a legal right. When originally recorded the credit the Company has not recognized the corresponding IRPJ and CSLL payable on the monetary correction of the credit. During 2006 the Company recognized the amount of R$28 as a tax payable. The monetary variations recorded in 2002 represents taxable income and during 2006 the Company recorded the corresponding tax payable against retained earnings as a correction of an error.
COPESUL - Companhia Petroquímica do Sul and subsidiaries
Notes to the consolidated financial statements
at March 31, 2007 and 2006 (Unaudited) and December 31, 2006
In millions of reais, except when otherwise indicated
| 20 | Financial result |
The Company’s financial result in the first quarter 2007, compared with 2006, is as follows:
| 3/31/2007 | 3/31/2006 | |||||
| Unaudited | Unaudited | |||||
Financial income | ||||||
Earnings on financial investments | 2 | 4 | ||||
Revenue with derivatives of Fundo de Investimento Financeiro Multimercado Copesul | 158 | 42 | ||||
Monetary variations on assets | 3 | 4 | ||||
Exchange variations on assets | (6 | ) | (4 | ) | ||
Interest on loans receivable | 1 | 3 | ||||
Other financial income | 1 | |||||
| 159 | 49 | |||||
Financial expenses | ||||||
Interest and charges on loans and financing | (7 | ) | (11 | ) | ||
Expense with derivatives of Fundo de Investimento Financeiro Multimercado Copesul | (151 | ) | (34 | ) | ||
Monetary variations on liabilities | (1 | ) | ||||
Exchange variations on liabilities | 14 | 7 | ||||
Other financial expenses | (10 | ) | (12 | ) | ||
| (154 | ) | (51 | ) | |||
Net financial result | 5 | (2 | ) | |||
| 21 | Other operating income (expenses), net |
| 3/31/2007 | 03/31/2006 | ||||
| Unaudited | Unaudited | ||||
Operating income | |||||
Recovery of PIS, COFINS and ICMS | 1 | 2 | |||
Other | 7 | ||||
| 1 | 9 | ||||
Operating expenses | |||||
Taxes, charges and contributions | |||||
Provisions for administrative, civil, and labor contingencies | (1 | ) | |||
Profit sharing | (1 | ) | 1 | ||
| (2 | ) | 1 | |||
Other operating income (expenses) - net | (1 | ) | 10 | ||
COPESUL - Companhia Petroquímica do Sul and subsidiaries
Notes to the consolidated financial statements
at March 31, 2007 and 2006 (Unaudited) and December 31, 2006
In millions of reais, except when otherwise indicated
| (i) | In 2005, according to provisions in Law No. 9363/96, the Company recalculated the presumed IPI credit on petrochemical naphtha acquisitions made from April 2002 to January 2004, establishing an additional credit of R$16, which was completely compensated with federal taxes that same year and the taxes levied on the recognized credit were paid in order to avoid future challenges by the tax authorities. This payment was recognized in accounting terms in the group of recoverable taxes. |
| 22 | Financial Instruments |
The Company evaluated its assets and liabilities in relation to market and/or realizable values through available information and evaluation methodologies established by management. However, both the interpretation of market data and the selection of valuation methods require considerable judgment and reasonable estimates to produce the appropriate realizable value. Consequently, the estimates presented do not necessarily indicate the amounts that can be realized in the current market. The use of different market hypotheses and/or methodologies for estimates can have a significant effect on estimated realizable values.
Valuation of the financial instruments
The Company’s main asset and liability financial instruments at March 31, 2007, as well as the criteria for their valuation/evaluation are described below.
| (a) | Cash and banks, financial investments, accounts receivable, other current assets and accounts payable |
The amounts recorded are similar to their realizable values.
| (b) | Investments |
The investments are mainly in a privately held subsidiary, recorded on the equity method of accounting, in which the Company has a strategic interest. Considerations of the market value of shares held are not applicable.
| (c) | Financing |
These are subject to interest at normal market rates, as mentioned in Note 15 (a). The estimated market value was calculated based on the present value of the future disbursement of cash, using interest rates that are available to the Company for the issuance of debts with similar maturities and terms.
COPESUL - Companhia Petroquímica do Sul and subsidiaries
Notes to the consolidated financial statements
at March 31, 2007 and 2006 (Unaudited) and December 31, 2006
In millions of reais, except when otherwise indicated
| (d) | Interest rate risk |
This risk derives from the possibility of the Company incurring losses due to fluctuations in the interest rates that would increase the financial expenses related to loans and financings from the market. The Company made contracts of derivatives to hedge against the risk in some operations and it is also continually monitoring the market interest rate with the objective of evaluating the need of contracting new operations in order to protect itself from the risk of the volatility of these rates.
| (e) | Exchange rate risk |
This risk derives from the possibility of the Company incurring losses due to fluctuations in the exchange rates that would reduce the nominal values billed or increase the amounts owed to the market.
Since part of the Company’s revenues (around 10%) is in US dollars, the main strategy is that this serves as a natural hedge for its liability operations recorded in foreign currency.
At March 31, 2007, the Company had assets and liabilities denominated in US dollars in the amount of US$60 million and US$133 million, respectively, and it had no instrument to protect this exposure on that date.
| (f) | Derivatives |
The net exchange exposure is as follows:
| 3/31/2007 | 12/31/2006 | |||||
| Unaudited | ||||||
Financing and export drafts in US$ | (273 | ) | (189 | ) | ||
Assets in US$ | 124 | 34 | ||||
Derivative instruments in US$ | 45 | 11 | ||||
Net exposure | (104 | ) | (144 | ) | ||
COPESUL - Companhia Petroquímica do Sul and subsidiaries
Notes to the consolidated financial statements
at March 31, 2007 and 2006 (Unaudited) and December 31, 2006
In millions of reais, except when otherwise indicated
The book value and market value of the main financial instruments are as follows:
| 3/31/2007 Unaudited | 12/31/2006 | |||||||||||
| Book value | Market value | Book value | Market value | |||||||||
Cash and banks | 272 | 272 | 200 | 200 | ||||||||
Swaps and options receivable | 87 | 87 | 64 | 64 | ||||||||
Marketable securities | 42 | 42 | 39 | 39 | ||||||||
Locked exchange contract advance receivable | 2 | 2 | ||||||||||
Loans to third parties | 1 | 1 | 2 | 2 | ||||||||
Financial institutions | (185 | ) | (185 | ) | (156 | ) | (156 | ) | ||||
Export drafts billed and to be invoiced | (293 | ) | (294 | ) | (180 | ) | (178 | ) | ||||
Swaps and options payable | (44 | ) | (44 | ) | (23 | ) | (23 | ) | ||||
| (120 | ) | (121 | ) | (52 | ) | (50 | ) | |||||
Asset swap operations in US dollars and liability at a fixed rate were contracted in order to minimize the effect of the variations of the exchange rates on liabilities. As for the cash operations, the Company opted to use time deposits indexed to the US dollar.
At March 31, 2007, the Company had lock-in operations on exchange not yet settled on operations for purchasing raw material in the amount of US$24 million (US$109 million at December 31, 2006) equivalent to R$48 (R$232 at December 31, 2006).
As shown above, the accounting values of the financial instruments are recorded at levels that are close to the market.
| 23 | Insurance |
The Company’s policy is to contract insurance at levels adequate for the risks involved with its operations. Considering the characteristics of its risks, management contracts insurance under the concept of maximum possible loss in a single event, and maintains coverage for operational risks, civil responsibilities and loss of profits. Also, the Company contracts transportation, group life, sundry risks and vehicle insurance.
COPESUL - Companhia Petroquímica do Sul and subsidiaries
Notes to the consolidated financial statements
at March 31, 2007 and 2006 (Unaudited) and December 31, 2006
In millions of reais, except when otherwise indicated
| 24 | Contingencies |
On the dates of the financial statements, the Company presented the following liabilities and the corresponding judicial deposits related to the contingencies, as determines CVM Instruction no. 489 of October 3, 2005 that approved the IBRACON Pronouncement no. 22 as to forecasts, liabilities, liability contingencies, and asset contingencies:
| Judicial deposits | Provisions for contingencies | |||||||
| 3/31/2007 | 12/31/2006 | 3/31/2007 | 12/31/2006 | |||||
| Unaudited | Unaudited | |||||||
Tax contingencies (a) | 7 | 7 | 5 | 5 | ||||
Labor and social security contingencies (b) | 2 | 2 | 28 | 27 | ||||
Civil complaints (c) | 3 | 2 | ||||||
| 9 | 9 | 36 | 34 | |||||
The Company is a party to labor, civil, and tax claims as well as others in progress and is discussing these issues at both the administrative and judicial levels and these are backed by judicial deposits when applicable. The provisions for the losses from these processes are estimated and updated by management based on the opinion of its external legal advisors.
| (a) | Tax contingences |
With respect to the Income Tax and Economic Domain Intervention Contribution (CIDE) on payment of technical assistance services, the Company has been judicially questioning the legality of charging these taxes since August 2002 and has made judicial deposits. The purpose of the process is to avoid double taxation with respect to the countries with which Brazil has tax treaties and provisions have been made in the same amounts as judicial deposits as shown in Note 10.
| (b) | Labor and social security contingencies |
The Company has ongoing labor claims, mainly related to salary equalization and overtime. A provision for these contingencies was recorded considering the estimates of the legal advisors for probable loss. Judicial deposits were made when required. The Company is a party to labor, civil, and tax claims as well as others in progress and is discussing these at both the administrative and judicial levels, backed by judicial deposits when applicable.
COPESUL - Companhia Petroquímica do Sul and subsidiaries
Notes to the consolidated financial statements
at March 31, 2007 and 2006 (Unaudited) and December 31, 2006
In millions of reais, except when otherwise indicated
Furthermore, the Company has made provision for labor losses related to suits filed by the Petrochemical Industry Labor Union of Triunfo concerning the rights claimed by the Company’s shift workers to receive overtime, due to alleged delays during transfer and change of shifts. A partial grant was given in trial court in favor of the workers’ claims to overtime. However, in appellate court on December 11, 2006 an ordinary appeal was filed by Copesul and the expectation is the total or at least partial reversal of the unfavorable decision in the 4th Regional Labor Court of Appeals.
| (c) | Civil contingencies |
The main lawsuits are related to complaints made by contracted workers related to losses that supposedly occurred as a result of various economic plans.
Possible losses
The Company has suits of both tax and civil nature involving risks of loss classified by the management as possible, but not probable, based on the evaluation of its legal advisors and for which no provisions have been set up.
| (a) | Tax claims |
The Brazilian Revenue Secretariat (SRF) raised an assessment against Copesul in 1999, referring to IRPJ and CSLL for 1994, in connection with the monetary restatement of the balance sheet and equity method adjustment, arising from accounting recognition of dividends distributed by its subsidiary overseas. The adjusted amount on September 30, 2006 was R$21. In 2002, the investee filed an appeal with the Taxpayer Board, which was judged in 2005 with a result totally favorable to Copesul. The court decision of the Taxpayer Board was published in the 4th quarter of 2006 and an appeal was made by the Attorney of the Internal Revenue Service to the High Court of Appeals for Fiscal Matters, to which the Company has already offered a brief of respondent. This lawsuit now awaits the decision of this Court.
| (b) |
A civil lawsuit is still outstanding against Copesul brought by the minority stockholder Petroquímica Triunfo S.A., questioning aspects involved in the privatization process related to the conversion of preferred shares into common shares before the privatization auction and the preference for subscription of shares in relation to the bidders in the auction. Management and the legal advisors do not expect losses to arise from this lawsuit.
COPESUL - Companhia Petroquímica do Sul and subsidiaries
Notes to the consolidated financial statements
at March 31, 2007 and 2006 (Unaudited) and December 31, 2006
In millions of reais, except when otherwise indicated
| 25 | Pension plan |
The Company and its employees contribute to PETROS - Fundação Petrobras de Seguridade Social, in connection with retirement and defined benefit pension plans. In 2006, the global contribution rate was 12.93% on the total of income of employees linked to the plan. The Company contributed during the first quarter of 2007 with R$1 (R$6 in the year 2006).
According to the regulations of the PETROS - Fundação Petrobras de Seguridade Social Benefits Plan and pertinent legislation, in case of a significant shortfall of technical reserves, the sponsors and participants will contribute additional financial resources, or there should be an adjustment of the benefits of the plan to the available funds. Up to the present date no such contribution was needed.
In May 2003, the Board of Directors approved the Complementary Pension Plan called COPESULPREV, a closed defined contribution plan. This plan aims to provide benefits to employees not included in the old PETROS plan, which is now closed to new members. Plan management will be carried out through Fundação PETROBRAS de Seguridade Social - PETROS, in an independent manner, not linked to any other pension plan managed by that entity, in compliance with Complementary Law 109/2001.
| 26 | Related parties |
According to CVM Deliberation 26/86, related parties are defined as those entities, whether individuals or companies, with which the Company has the possibility of contracting, in the broad sense of this word, other than those which might apply to transactions with independent third parties, not subject the Company’s managerial control or any other influence.
COPESUL - Companhia Petroquímica do Sul and subsidiaries
Notes to the consolidated financial statements
at March 31, 2007 and 2006 (Unaudited) and December 31, 2006
In millions of reais, except when otherwise indicated
| (a) | Assets and Liabilities |
| 2004 | 2003 | 2002 | |||||||
Gross Sales | 7,153 | 5,453 | 3,741 | ||||||
Taxes and contributions on sales | (1,623 | ) | (1,123 | ) | (665 | ) | |||
Net sales and services | 5,530 | 4,330 | 3,076 | ||||||
Cost of products, utilities and services | (4,454 | ) | (3,799 | ) | (2,572 | ) | |||
Gross profit | 1,076 | 531 | 504 | ||||||
Operating (expenses) income | |||||||||
Selling, general and administrative | (189 | ) | (157 | ) | (121 | ) | |||
Employees profit sharing | (20 | ) | (10 | ) | (7 | ) | |||
Other operating income (expenses), net | 44 | (7 | ) | 33 | |||||
Operating profit | 911 | 357 | 409 | ||||||
Non-operating income (expenses) | |||||||||
Financial income (expenses), net | (81 | ) | (132 | ) | 62 | ||||
Loss on anticipated payment of debt paid in advance settlement | (16 | ) | |||||||
Foreign exchange gains, net | 22 | 173 | (399 | ) | |||||
Other | (1 | ) | (5 | ) | |||||
Income before income taxes and social contribution | 836 | 397 | 67 | ||||||
Income tax benefit (expense) | |||||||||
Current | (272 | ) | (44 | ) | (16 | ) | |||
Deferred | 47 | (27 | ) | 56 | |||||
Net income for the year | 611 | 326 | 107 | ||||||
| 3/31/2007 | 12/31/2006 | |||
| Unaudited | ||||
Assets | ||||
Current - Credits - Customers | ||||
Local customers | ||||
Braskem S.A. | 29 | 39 | ||
Ipiranga Petroquímica S.A. | 8 | 15 | ||
Refinaria Alberto Pasqualini - REFAP S.A. | 5 | 5 | ||
Petróleo Brasileiro S.A. - PETROBRAS | 4 | * | ||
| 46 | 59 | |||
Foreign Customers | ||||
Ipiranga Trading | 121 | * | ||
| 121 | * | |||
| 167 | 59 | |||
| 3/31/2007 | 12/31/2006 | |||
| Unaudited | ||||
Liabilities | ||||
Current liabilities | ||||
Suppliers | ||||
Braskem S.A. | 3 | 3 | ||
Ipiranga Petroquímica S.A. | 3 | 3 | ||
Refinaria Alberto Pasqualini - REFAP S.A. | 16 | 20 | ||
Petróleo Brasileiro S.A. - PETROBRAS | 4 | 37 | ||
| 26 | 63 | |||
| Years Ended December 31 | |||||||||
| 2004 | 2003 | 2002 | |||||||
At beginning of the year | 1,102 | 985 | 907 | ||||||
Net income | 611 | 326 | 107 | ||||||
Dividends paid | (349 | ) | (123 | ) | (16 | ) | |||
Interest on own capital | (88 | ) | (86 | ) | (13 | ) | |||
At end of the year | 1,276 | 1,102 | 985 | ||||||
| 3/31/2007 | 3/31/2006 | |||
| Unaudited | Unaudited | |||
Operations | ||||
Gross sales and/or Services | ||||
Braskem S.A. | 650 | 650 | ||
Ipiranga Petroquímica S.A. | 476 | 461 | ||
Refinaria Alberto Pasqualini - REFAP S.A. | 42 | 5 | ||
Ipiranga Trading | 129 | |||
| 1,297 | 1,116 | |||
Purchases | ||||
Braskem S.A. | 7 | 3 | ||
Ipiranga Petroquímica S.A. | 7 | 3 | ||
Refinaria Alberto Pasqualini - REFAP S.A. | 325 | 160 | ||
Petrobras Brasileiro S.A. - PETROBRAS | 221 | 300 | ||
Braskem Incorporated Limited | 42 | |||
| 560 | 508 | |||
COPESUL - Companhia Petroquímica do Sul and subsidiaries
Notes to the consolidated financial statements
at March 31, 2007 and 2006 (Unaudited) and December 31, 2006
In millions of reais, except when otherwise indicated
| 27 | Subsequent events |
During December 2007, the EDSP58 Participações S.A. was incorporated by Copesul. As a result of this transaction, COPESUL - Companhia Petroquímica do Sul is now a direct subsidiary of Braskem S.A.
* * *
EXHIBIT INDEX
F-248