| (1) | Including the Milford Haven refinery, in which TOTAL has a 20% interest. Taweelah A1 currently has a total power generation capacity of 1,430 MW and a water desalination capacity of 385,000 m3 per day. Near the end of 2006, it was decided to develop an additional 250 MW of capacity, which is expected to enter into operation in 2009.In Thailand, TOTAL owns 28% of Eastern Power and Electric Company Ltd (EPEC) which has operated the combined cycle gas power plant of Bang Bo, with a capacity of 350 MW, since March 2003.
In Argentina, in November 2006 TOTALGroup sold its 63.9% interest in Central Puerto SA, a company which owns and operates gas-fired power stations in Buenos Aires and in the Neuquén region. In December 2006, TOTAL also sold itsentire 70% interest in Hidroneuquen, a company owning a 59% interest in Hidroeléctrica Piedra del Aguila, a hydroelectric dam located in the Neuquén region.
In Nigeria, TOTAL and its partner, the state-owned NNPC, are participating in two projects to construct gas-fired power generation units. These projects are part of the Nigerian government’s policy to develop power generation, stop gas flaring and privatize the power generation sector:
The Afam project, part of the SPDC joint venture in which TOTAL holds a 10% interest, concerns the upgrading of the Afam V power plant capacity, to 276 MW, and the development of the Afam VI power plant, with a planned capacity of approximately 600 MW; and
The OML 58 project, part of the EPNL joint venture in which TOTAL holds a 40% interest (operator), concerns the development of a new 400 MW combined-cycle power plant near the city of Obite.
In the UK, in September 2005 TOTAL sold its 40% interest in Humber Power Ltd, which owns a gas-fired combined cycle power station.
Renewable Energy
As part of its sustainable development policy, TOTAL is developing its position in renewable energy, with a particular focus on solar-photovoltaic energy, where the Group has been present since 1983, and wind power. In
(1) | Source: Poten & Partners – LPG IN WORLD MARKETS – Yearbook 2006. |
addition, since 2005 TOTAL, has been participating in the development of marine energy, a third possibility for renewable energy.
Solar-photovoltaic power
In solar power (silicon-crystal technology), TOTAL manufactures photovoltaic cells (Photovoltech), manufactures solar panels and designs solar systems (TENESOL). The Group is also involved in financing projects for rural electrification (Temasol in Morocco and KES in South Africa).
In January 2006, TOTAL increased its interest in Photovoltech, a company specialized in manufacturing photovoltaic cells, from 42.5% to 47.8%. Photovoltech sales amounted to approximately 44 M€ in 2006, compared to 25 M€ in 2005. Due to strong demand for and the successful marketing of its products, Photovoltech is planning to increase its total production capacity from 20 MWp/y to 80 MWp/y by the end of 2007. Civil engineering for the new production facilities to increase capacity began in the fall of 2006.
TOTAL holds a 50% interest in TENESOL, its partnership with EDF, which designs, manufactures, markets and operates solar-photovoltaic power systems. TENESOL’s consolidated sales decreased by approximately 8% between 2005 and 2006, amounting to approximately 134 M€ in 2006, compared to 145 M€ in 2005, the equivalent of an installed capacity of 33 MWp. Its principal markets are for network connections in Europe (Germany and Spain) and for decentralized rural electrification and telecommunication systems in the French Overseas Territories. TENESOL owns two solar panel manufacturing plants: TENESOL Manufacturing in South Africa, with an annual production capacity of 35 MWp, and TENESOL Technologies in the region of Toulouse, France, with an annual production capacity of 15 MWp.
TOTAL is pursuing decentralized rural electrification activities by responding to a call for tenders from authorities in several countries, including Mali, Morocco, Senegal and South Africa.
In South Africa, an ongoing project to equip 15,000 households, led by Kwazulu Energy Service Company (TOTAL, 35%), had equipped nearly 9,000 households by the end of 2006.
In Morocco, Temasol, in which TOTAL has indirect interests through Total Maroc (32.2%) and TENESOL (35.6%), continued work on a project awarded in May 2002 to equip 16,000 households. In 2004, Temasol was also awarded a project to equip 37,000 households. In
2005, it was awarded part of a project to equip an additional 5,500 households. At the end of 2006, approximately 24,000 of the total of 58,500 households covered by these projects were equipped, compared to 20,000 at the end of 2005 and 10,000 at the end of 2004.
Wind power
TOTAL currently operates a wind farm in Mardyck (near its Flanders refinery in northern France) and is conducting development studies for onshore and offshore projects in France, the UK and Spain.
Mardyck, commissioned in November 2003, has a capacity of 12 MW and produced approximately 25.2 GWh of electricity in 2006, compared to 26.4 GWh in 2005. It is designed to allow comparison of different technologies at the same site in order to prepare for possible larger scale offshore or onshore projects in the future.
In December 2005, after a tender invitation, TOTAL was selected by the French Ministry of Industry for an onshore wind power project with a planned capacity of 90 MW to be built in Aveyron region. Pursuant to the terms of the bid, the project is subject to obtaining a construction permit. The public consultation for this project began in January 2007, and the wind farm is expected to begin operations in 2009. Work on this project will be conducted by the Éoliennes de Mounès company, in which TOTAL has a 50% interest.
TOTAL is also preparing for the development of a wind farm with a 120 MW capacity offshore Dunkirk, France. This project, in which TOTAL holds a 50% interest, should benefit from the power purchase terms set in the tariff order released on July 10, 2006.
Marine energy
In marine energy, TOTAL acquired a 10% interest in a pilot project located offshore Santona, on the northern coast of Spain, in June 2005. In 2006, the project decided to build and test its first buoy, which should allow the project’s final size and planned generation capacity to be determined. This pilot project is expected to provide information necessary to assess the technical and economic potential of this technology.
TOTAL has a 21.5% interest in Scotrenewables Marine Power, a company located in the Orkney islands in Scotland. This company is developing tidal current energy converter technology.
Coal
For more than 25 years, TOTAL has exported steam coal from its mines located in South Africa, primarily to Europe and Asia. Today, TOTAL owns and operates three mines and is examining several other mining projects. The Group also trades and markets steam coal through its trading subsidiaries Total Coal International (Atlantic zone), Total Energy resources (Pacific zone) and CDF Énergie (France).
TOTAL sold approximately 9.2 Mt of coal worldwide in 2006 (compared to 9.5 Mt in 2005 and 11.3 Mt in 2004), of which 4.4 Mt was South African steam coal produced by the Group. Approximately 75% of the Group’s South African coal production was sold to European utility companies and approximately 12% was sold in Asia.
The Group’s South African coal is exported through the port of Richard’s Bay, the world largest coal terminal, of which 5.7% is owned by TOTAL. On the South African
domestic market, sales amounted to 0.6 Mt in 2006, primarily intended for the industrial and metallurgic sectors.
In parallel, Total Coal South Africa is developing new mines. This included construction of the Forzando South mine, which was completed near the end of 2006 and which is expected to reach its planned production capacity of 1.2 Mt/y over the next two years.
TOTAL is also active in coal trading through its wholly-owned subsidiary Total Energy Resources (TER) in Hong Kong and through a representative office established in Jakarta in September 2004. Of the 2.6 Mt of coal traded in 2006, 62% was sold in Asia.
In France, TOTAL, through its subsidiary CDF Énergie, is an important steam coal distributor in the industrial sector (paper, cement, agro-food, residential heating, etc.), with sales of 2.2 Mt in 2006, originating from diverse sources outside the Group, compared to 2 Mt in 2005.
Downstream
The Downstream segment conducts TOTAL’s refining, marketing, trading and shipping activities.
Refining & Marketing
As of December 31, 2006, TOTAL’s worldwide refining capacity was 2,700 thousand barrels per day (kb/d). The Group’s refined products sales worldwide remained stable at 3,786 kb/d (including trading activities), compared to 3,792 kb/d in 2005 and 3,761 kb/d in 2004. TOTAL is the largest refiner/marketer(1) in Western Europe and, with a market share of 11%, the largest marketer in Africa(2). As of December 31, 2006, TOTAL’s marketing network consisted of 16,534 retail stations worldwide (compared to 16,976 in 2005 and 16,857 in 2004), of which approximately 50% are owned by the Group. TOTAL’s refineries also allow the Group to produce a broad range of specialty products, such as lubricants, liquefied petroleum gas (LPG), jet fuel, special fluids, bitumen and petrochemical feedstock.
Since 2004 TOTAL has pursued a sustained refining investment program to respond to changes in the oil market. This program, initiated through the construction of a distillate hydrocracker (DHC) at the Group’s refinery
in Normandy, France, continued in 2006 with the launch of engineering studies for two major projects: the construction of a full-conversion refinery in Saudi Arabia and the construction of a deep conversion unit at the Port Arthur, Texas, refinery. Under this program, the Group plans to invest an average of 1 B€ per year in refining over the 2006-2010 period (excluding capitalization of turnarounds).
For its marketing activities, the Group’s strategy is to strengthen its positions in Europe and Africa and to pursue targeted growth in certain other markets, in particular in Asia.
Refining
As of December 31, 2006, TOTAL held interests in 27 refineries (including 13 that it operates), located in Europe, the United States, the French West Indies, Africa and China.
(1)2007. | Source: Oil and Gas Journal, December 18, 2006. |
(2) | Company sources, PFC Energy, December 2006. |
TOTAL’s activities in Western Europe have a refining capacity of 2,342 kb/d, accounting for more than 85% of the Group’s refining capacity and making TOTAL the leading refiner in this region. TOTAL operates 12 refineries in Western Europe. Six are located in France, one in Belgium, one in Germany, two in the UK, one in Italy and one in the Netherlands. TOTAL also has minority interests in another German refinery (Schwedt) as well as interests in four Spanish refineries through its holding in CEPSA.
In the United States, TOTAL operates the Port Arthur, Texas, refinery near the Gulf of Mexico, which has a production capacity of 174kb/d.
TOTAL, Sinochem and PetroChina have been in partnership for more than ten years in the WEPEC refinery located in Dalian, whose annual refining capacity averages 219 kb/d. TOTAL holds a 22.41% interest in this refinery.
From 2006 to 2010, TOTAL plans to invest approximately 5 B€ in refining, excluding capitalization of turnarounds. Nearly 40% is designated for projects to increase refining capacities and for conversion projects to upgrade heavier crudes. Nearly 20% is designated for developing units and desulphurization to process high-sulphur crudes. Finally, approximately 30% is designated for modernizing refining sites, improving safety and energy efficiency and reducing environmental impacts.
Concerning growth and conversion, two major projects were initiated in Saudi Arabia and the United States in the first half 2006.
TOTAL and The Saudi Arabian Oil Company (Saudi Aramco) signed a Memorandum of Understanding (MOU) related to a project for the construction and operation of a refinery with a capacity of 400 kb/d in Jubail, Saudi Arabia. This full-conversion refinery is being designed to process Arabian Heavy crude and produce high-quality refined products adapted for all markets, mainly for exportation. A comprehensive joint Front-End Engineering and Design (FEED) study was undertaken in July 2006. Saudi Aramco and TOTAL agreed to form a joint venture company in which Saudi Aramco and TOTAL would each hold a 35% ownership interest. The remaining 30% is expected to be listed on the Saudi stock exchange, subject to the approval of the relevant authorities, at the end of the FEED (beginning of 2008). Start-up of the refinery is scheduled for 2011.
TOTAL launched studies for the construction of a deep conversion unit or “coker” at the Port Arthur refinery in the United States. This project is being
designed to upgrade heavy crudes and produce lighter products for a structurally short American fuel market.
Performance investments are designed to adapt TOTAL’s refineries to changes in the European oil market: growing demand for diesel and increasing supply of high-sulphur crudes.
The first project of this type is the construction of a distillate hydrocracker (DHC) at the Normandy refinery in France. This unit, whose construction began in the spring of 2004, came onstream successfully in 2006. The project represented a total investment of approximately 550 M€ over the 2003-2006 period, and also included the construction of a hydrogen production unit.
The Group also decided to construct a desulphurization unit at the Lindsey (Immingham) refinery in the UK. This investment is being designed to raise the portion of high-sulphur crude that the plant can process from 10% to 70%. The unit is scheduled to begin operating in 2009. A second project to construct a desulphurization unit at the Donges refinery in France is currently being studied. Commissioning is planned for 2010. A third project to construct a desulphurization unit at the Leuna refinery in Germany is also being studied.
In addition, CEPSA(1) has announced investments to improve the performance of its refineries, including the construction of a 2.1 Mt hydrocracker(2) unit at the Huelva refinery in Spain. This unit is scheduled to begin operating near the end of 2009.
Investments are being made to modernize refining sites, improve safety and energy efficiency and reduce environmental impacts.
At the Dalian (China) refinery, a modernization program was launched to respond to changes in the volumes and quality of products demanded on national and international markets. A distillate hydrocracker with a planned capacity of 1.5 Mt/y is under construction and is scheduled to begin operating in the summer of 2007. A desulphurization unit with a 2 Mt/y capacity is also under construction. This investment should allow the refinery to meet new diesel specifications.
In 2006, two refineries operated by TOTAL were affected by major turnarounds, compared to six in 2005 and five in 2004. Ten refineries are scheduled for major turnarounds, spread throughout 2007.
(1) | Group’s share in CEPSA: 48.83% as of December 31, 2006. |
(2) | To which should be added a crude distillation unit (CDU), a vacuum distillation unit (VDU) and a steam methane reformer (SMR). |
Crude oil refining capacity The table below sets forth TOTAL’s share of the daily crude oil refining capacity of its refineries. | | | | | | | | As of December 31(a) (kb/d) | | 2008 | | 2007 | | 2006 | Refineries operated by the Group | | | | | | | Normandy (France) | | 339 | | 331 | | 331 | Provence (France) | | 158 | | 158 | | 158 | Flandres (France) | | 137 | | 141 | | 141 | Donges (France) | | 230 | | 230 | | 230 | Feyzin (France) | | 117 | | 117 | | 116 | Grandpuits (France) | | 101 | | 101 | | 99 | Antwerp (Belgium) | | 350 | | 350 | | 350 | Leuna (Germany) | | 230 | | 227 | | 227 | Rome (Italy)(b) | | 64 | | 63 | | 64 | Immingham (UK) | | 221 | | 221 | | 221 | Milford Haven (UK)(c) | | — | | — | | 74 | Vlissingen (Netherlands)(d) | | 81 | | 81 | | 81 | Port Arthur, Texas (United States) | | 174 | | 174 | | 174 | Sub-total | | 2,202 | | 2,194 | | 2,266 | Other refineries in which the Group has an interest(e) | | 402 | | 404 | | 434 | Total | | 2,604 | | 2,598 | | 2,700 |
| (a) | For refineries not 100% owned by TOTAL, the indicated capacity represents TOTAL’s share of the daily crude oiloverall refining capacity of its refineries. | | | | | | | | As of December 31,(a) (kb/d) | | 2006 | | 2005 | | 2004 | Refineries operated by the Group | | | | | | | Normandy (France) | | 331 | | 331 | | 328 | Provence (France) | | 158 | | 158 | | 155 | Flandres (France) | | 141 | | 159 | | 160 | Donges (France) | | 230 | | 229 | | 231 | Feyzin (France) | | 116 | | 118 | | 119 | Grandpuits (France) | | 99 | | 99 | | 99 | Antwerp (Belgium) | | 350 | | 350 | | 352 | Leuna (Germany) | | 227 | | 225 | | 227 | Rome (Italy)(b) | | 64 | | 64 | | 52 | Immingham (UK) | | 221 | | 221 | | 223 | Milford Haven (UK)(c) | | 74 | | 73 | | 73 | Vlissingen (Netherlands)(d) | | 81 | | 84 | | 84 | Port Arthur, Texas (United States) | | 174 | | 174 | | 176 | Subtotal | | 2,266 | | 2,285 | | 2,279 | Other refineries in which the Group has an interest(e) | | 434 | | 423 | | 413 | Total | | 2,700 | | 2,708 | | 2,692 |
(a) | For refineries not 100% owned by TOTAL, the indicated capacity represents TOTAL’s proportionate share of the overall refining capacity of the refinery. |
(b) | TOTAL’s interest was 71.9% as of December 31, 2006 and 2005; TOTAL’s interest was 57.5% as of December 31, 2004. |
(c) | TOTAL’s interest is 70%. |
(d) | TOTAL’s interest is 55%. |
(e) | Fourteen refineries in which TOTAL has interests ranging from 16.7% to 55.6% (seven in Africa, four in Spain, one in Germany, one in Martinique and one in China) and the Reichstett refinery in France in 2004. |
Refined products(b)The table below sets forth by product category
| TOTAL’s net share of the quantities produced at TOTAL’s refineries. | | | | | | | | (kb/d) | | 2006 | | 2005 | | 2004 | Gasoline | | 532 | | 534 | | 580 | Avgas and jet fuel | | 179 | | 191 | | 188 | Kerosene and diesel fuel | | 660 | | 639 | | 712 | Fuel oils and heating oils | | 582 | | 593 | | 552 | Other products | | 455 | | 406 | | 419 | Total(a) | | 2,408 | | 2,363 | | 2,451 |
(a) | Including TOTAL’s share in CEPSA: 48.83% since October 2006, compared to its previous interest of 45.3%interest is 71.9%. |
Utilization rate(c) | (crude refining)TOTAL’s interest was 70% as of December 31, 2006. Interest sold in 2007. | | | | | | | | | | | | | 2006 | | | 2005 | | | 2004 | | | | | 88 | % | | 88 | % | | 92 | % |
|
Marketing(d) | The GroupTOTAL’s interest is one of the leading marketers in the combined six largest European markets (France, Spain, Benelux, the UK, Germany and Italy)(1). TOTAL is also the largest marketer in Africa, with a market share of 11%, after acquiring distribution affiliates in 14 African countries in 2005 and 2006.Sales of refined products(a)
The table below sets forth by geographic area TOTAL’s average daily volumes of refined petroleum products sold for the years indicated.
| | | | | | | | (kb/d) | | 2006 | | 2005 | | 2004 | France | | 837 | | 852 | | 882 | Rest of Europe(a) | | 1,438 | | 1,444 | | 1,495 | United States | | 264 | | 256 | | 257 | Africa | | 274 | | 260 | | 245 | Rest of the World | | 153 | | 151 | | 129 | Total excluding Trading | | 2,966 | | 2,963 | | 3,008 | Trading (Balancing and Export Sales) | | 820 | | 829 | | 753 | Total including Trading | | 3,786 | | 3,792 | | 3,761 |
(a) | Including TOTAL’s net share in CEPSA: 48.83% since October 2006, compared to its previous interest of 45.3%55%. |
Retail stations(e)The table below sets forth by geographic area
| TOTAL has interests ranging from 16.7% to 50% in thirteen refineries (six in Africa, four in Spain, one in Germany, one in Martinique and one in China). TOTAL disposed of its 55.6% interest in the number of retail stationsLuanda refinery in Angola in 2007. |
Refined products(a) The table below sets forth by product category TOTAL’s net share of refined quantities produced at the Group’s refineries. | | | | | | | | (kb/d) | | 2008 | | 2007 | | 2006 | Gasoline | | 443 | | 501 | | 532 | Avgas and jet fuel(b) | | 208 | | 208 | | 203 | Diesel and heating oils | | 987 | | 964 | | 952 | Heavy fuel oils | | 257 | | 254 | | 266 | Other products | | 417 | | 412 | | 455 | Total | | 2,312 | | 2,339 | | 2,408 |
| (a) | Including TOTAL’s share in CEPSA. |
| (b) | Avgas, jet fuel and kerosene. |
Utilization rate(a) The table below sets forth the utilization rate of the Group’s refineries. | | | | | | | | | | | | | 2008 | | | 2007 | | | 2006 | | Crude | | 88 | % | | 87 | % | | 88 | % | Crude and other feedstock | | 91 | % | | 89 | % | | 91 | % |
| (a) | Including TOTAL’s share in CEPSA. |
Marketing TOTAL is one of the leading marketers in Western Europe.(1) The Group is also the largest marketer in Africa, with a market share of 11%.(2) TOTAL markets a wide range of specialty products, which it produces from its refineries and other facilities. TOTAL is among the leading companies in the specialty products market(3), in particular for lubricants, liquefied petroleum gas (LPG), jet fuel, special fluids and bitumen, with products marketed in approximately 150 countries(4). Sales of refined products(a) The table below sets forth by geographic area TOTAL’s volumes of refined petroleum products sold for the years indicated. | | | | | | | | | | (kb/d) | | 2008 | | 2007 | | | 2006 | | France | | 822 | | 846 | | | 837 | | Rest of Europe(a) | | 1,301 | | 1,432 | | | 1,438 | | United States | | 147 | | 162 | (b) | | 160 | (b) | Africa | | 279 | | 286 | | | 274 | | Rest of world | | 171 | | 167 | | | 153 | | Total excluding Trading | | 2,720 | | 2,893 | (b) | | 2,862 | (b) | Trading (Balancing and Export Sales) | | 938 | | 881 | | | 820 | | Total including Trading | | 3,658 | | 3,774 | (b) | | 3,682 | (b) |
| (a) | Including TOTAL’s share in CEPSA. |
| (b) | Amounts are different from those in TOTAL’s network. | | | | | | | | As of December 31, | | 2006 | | 2005 | | 2004 | France(a) | | 5,220 | | 5,459 | | 5,626 | Rest of Europe (excluding CEPSA) | | 4,628 | | 4,937 | | 5,003 | CEPSA(b) | | 1,672 | | 1,677 | | 1,697 | Africa | | 3,562 | | 3,505 | | 3,199 | Rest of the World | | 1,452 | | 1,398 | | 1,332 | Total | | 16,534 | | 16,976 | | 16,857 |
(a) | Retail stations under the TOTAL and Elf brands and approximately 2,000 retail stations under the Elan brand. |
(b) | Including all the retail stations within the CEPSA network.2007 and 2006 Forms 20-F due to a change in the calculation method for sales of the Port Arthur refinery. |
(1) | Company data, based on quantities sold. |
Western Europe(1)
In Europe, TOTAL has a network of retail stations in
| Based on publicly available information, quantities sold. Portfolio: France, Belgium, Luxembourg, the Netherlands,Benelux, United Kingdom, Germany, the UK, Portugal, Italy, and, through its 48.83% interest in CEPSA, Spain and Portugal. |
| (2) | PFC Energy September 2008, based on quantities sold. |
| (3) | Based on publicly available information, quantities sold. |
| (4) | Including through national distributors. |
Retail stations The table below sets forth by geographic area the number of retail stations in TOTAL’s network. | | | | | | | | | As of December 31, | | 2008 | | | 2007 | | 2006 | France | | 4,782 | (a) | | 4,992 | | 5,220 | Rest of Europe (excluding France and CEPSA) | | 4,541 | | | 4,762 | | 4,628 | CEPSA(b) | | 1,811 | | | 1,680 | | 1,672 | Africa | | 3,500 | | | 3,549 | | 3,562 | Rest of world | | 1,791 | | | 1,514 | | 1,452 | Total | | 16,425 | | | 16,497 | | 16,534 |
In France, the TOTAL-branded network has a diverse selection of products (such as theBonjour(a) convenience stores) and strong customer loyalty programs. As of December 31, 2006, the TOTAL-branded network consisted of approximately 2,600 | Of which nearly 2,400 retail stations in France, whileare under the Elf-branded network includedTOTAL brand, nearly 300 retail stations. Elf-brandedstations are under the Elf brand and more than 1,800 retail stations offer quality fuels and basic services at prices that are particularly competitive. TOTAL also markets fuels at nearly 2,000 Elan-brandedunder the Elan brand. |
| (b) | Including all retail stations generally located in rural areas.In Germany, a major network reorganization program was completed in 2006, withwithin the closing of 40CEPSA network.
|
Europe InEurope, TOTAL has a network of 11,134 retail stations in France, Belgium, The Netherlands, Luxembourg, Germany, the United Kingdom, Italy, and, through its 48.83% interest in CEPSA, Spain and Portugal. TOTAL is among the leaders in Europe for fuel-payment cards, with approximately 3.4 million cards issued in more than twenty European countries. InFrance, the TOTAL-branded network benefits from a wide number of retail stations and a diverse selection of products (such as theBonjour convenience stores and car washes). Elf-branded retail stations offer quality fuels at prices that are particularly competitive. As of December 31, 2008, nearly 2,400 TOTAL-branded retail stations and 300 Elf-branded retail stations were operating in France. TOTAL also markets fuels at more than 1,800 Elan-branded retail stations, generally located in rural areas. TOTAL launched, in the fall of 2008, a universal Visa® card entitling customers to immediate discounts on fuels in all French TOTAL-branded retail stations. The Group intends to strengthen its leadership(1) in the marketing of fuels in France by increasing the attractiveness of its network to its individual customers. In 2008, TOTAL continued its efforts to optimize its marketing activities inWestern Europe. In Portugal, TOTAL and CEPSA merged their oil marketing activities in 2008. The combined entity has a leading position on the Portuguese oil market with a market share of approximately 11%(1), a network of 300 retail stations and a strengthened position in the specialty products market. In Spain, the Group sold its LPG marketing activities in August 2008. In France and Germany, TOTAL continued a program initiated in 2007 to adapt and restructure its marketing activities to optimize its organization and to reduce operating costs. InCentral and Eastern Europe, the Group is developing its positions primarily through its specialty products. In 2008, TOTAL continued to expand its presence in the growing markets of Eastern Europe, in particular for lubricants. In September 2008, the Group finalized the acquisition of bitumen assets in Poland, strengthening its position in the rapidly growing market for bitumen in that country. As of December 31, 2008, TOTAL had a network of more than 500 “AS24”-branded retail stations in twenty European countries specialized in the marketing of fuels to professional transporters. During the next few years, the AS24 network is expected to continue its growth and to expand to other countries in northern and southeastern Europe. Africa & the Middle East As of December 31, 2008, TOTAL is the leading marketer of petroleum products in the African continent, with a market share of 11%(2) and 3,500 retail stations in more than forty countries. The Group operates two major networks in South Africa and Nigeria. TOTAL also has a large presence in the Mediterranean Basin, principally in Turkey, Morocco and Tunisia. In the Middle East, the Group is primarily active in the specialty products market and is pursuing its growth strategy in the region, notably through the production and marketing of lubricants. In 2008, the Group continued to strengthen its positions on the African continent. In November 2008, TOTAL entered into an agreement to acquire marketing and logistics assets in Kenya and Uganda. The transaction covers 165 retail stations, aviation product distribution as well as several logistics sites and a lubricant manufacturing plant. Subject to the approval of the relevant authorities, this agreement is expected to enable the Group to strengthen its position in Eastern Africa. In August 2008, TOTAL disposed of its marketing activities in Rwanda, Burundi and Guinea-Bissau. | (1) | Based on publicly available information, quantities sold. |
| (2) | PFC Energy September 2008, based on quantities sold. |
Asia-Pacific As of December 31, 2008, TOTAL was present in nearly twenty countries in the Asia-Pacific region, primarily through its specialty products. The Group is also developing its position as a fuel distributor in the region, in particular in China, and operates two major networks, in Pakistan and the Philippines. InChina, the Group operated approximately 100 retail stations as of December 31, 2008, pursuant to two joint venture agreements signed in 2005 by TOTAL and Sinochem to develop a network of 500 retail stations in the Beijing and Shanghai areas. InSouth Korea, TOTAL increased its interest in its subsidiary Total ISU Oil Co. Ltd to 100% early in 2008 by acquiring the interests of Isu Chemical Co. Ltd and at the same time announced the creation of a joint venture (TOTAL, 50%) with a South Korean company, S-Oil. This transaction is expected to make TOTAL a leading marketer of lubricants in South Korea.(1) InIndia, the Group is pursuing the development of its specialty products activities. In September 2008, a joint venture (TOTAL, 50%) was created for bitumen activities to supply the Indian road industry in special and emulsion bitumen. Marketing under this joint venture started in December 2008. InVietnam, TOTAL acquired a company specialized in the marketing of LPG in December 2008. This transaction is expected to enable the Group to substantially strengthen its presence on the market. Rest of world InLatin America and theCaribbean, TOTAL is active in nearly twenty countries, primarily through its specialty products. In the Caribbean, the Group pursued the development of its marketing activities through the acquisition, in the second half 2008, of marketing and logistics assets in Puerto Rico, Jamaica and the Virgin Islands. This transaction covers approximately 200 retail stations, aviation product distribution and several terminals. The purchase of these assets is expected to strengthen TOTAL’s activities in the region. InNorth America, TOTAL markets lubricants and, late in 2008, it expanded its presence in the United States by acquiring a company present in nearly twenty U.S. states. The Group intends to accelerate the development of its specialty products activities inRussia and theUkraine, two regions with significant potential for growth. Through the development of its presence in these markets in 2008, the Group has primarily targeted the growth of its lubricant sales. Biofuels and hydrogen Biofuels TOTAL is active in the biodiesel and biogasoline biofuel sectors. In 2008, TOTAL consolidated its position as a leading oil and gas company in the European biofuels market(1) by producing and incorporating 790 kt of ETBE(2) at ten refineries(3) (compared to 710 kt in 2007 and 500 kt in 2006) and incorporating 1,470 kt of VOME(4) at fourteen European refineries and several storage sites (compared to 880 kt in 2007 and 420 kt in 2006). TOTAL, in partnership with the leading companies in this area, is developing second generation biofuels derived from biomass. The Group is also participating in French, European and international bioenergy development programs. In this framework, TOTAL announced in September 2008 its participation in Futurol, a research and development project for cellulosic bioethanol, which intends to perfect and promote on an industrial scale a production process involving hydrolisis of lignocellulosic biomass. Hydrogen In 2008, TOTAL continued its research and testing programs for fuel cell and hydrogen fuel technologies. For several years, TOTAL has been developing cooperation agreements for automotive applications (with BMW in 2006, Renault in 2003 and Delphi in 2001) and stationary applications (Electrabel and Idatech in 2004). Under its partnership with BVG, the largest public transport company in Germany and a bus operator in Berlin, TOTAL participated in the creation of a Center of Excellence for Hydrogen in Berlin. TOTAL is also participating in the hydrogen technology platform launched by the European Commission and is a founding member of the industrial group created in 2007 to participate in the European Joint Technology Initiative to promote the development of hydrogen technology. | (1) | Based on publicly available information, quantities sold. |
| (2) | ETBE: Ethyl-Tertio-Buthyl-Ether. |
| (3) | Including the Algeciras and the development of non-fuel sales. In the UK, a program launched in 2003 to rationalize sitesHuelva refineries (CEPSA). |
| (4) | VOME: Vegetable-Oil-Methyl-Ester. |
Trading & Shipping The Trading & Shipping division: sells and markets the Group’s crude oil production; provides a supply of crude oil for the Group’s refineries; imports and exports the appropriate petroleum products for the Group’s refineries to be able to adjust their production to the needs of local markets; charters appropriate ships for these activities; and undertakes trading on various derivatives markets. Although the Trading & Shipping division’s main focus is serving the Group, its know-how and expertise also allow this division to extend the scope of its activities beyond meeting the strict needs of the Group. Trading & Shipping’s worldwide activities are conducted through various wholly-owned subsidiaries, including TOTSA Total Oil Trading S.A., Total International Ltd, Socap International Ltd, Atlantic Trading & Marketing Inc., Total Trading Asia Pte, Total Trading Canada Ltd, Total Trading and Marketing Canada L.P. and Chartering & Shipping Services S.A. Trading TOTAL is one of the world’s major traders of crude oil and refined products on the basis of volumes traded. The table below sets forth selected information with respect to TOTAL’s worldwide sales and source of supply of crude oil for each of the last three years. Supply and sales of crude oil | | | | | | | | For the year ended December 31 (kb/d, except %) | | 2008 | | 2007 | | 2006 | Supply of crude oil | | | | | | | Total supply | | 3,839 | | 4,194 | | 4,112 | Production sold(a)(b) | | 1,365 | | 1,502 | | 1,473 | Purchased from external suppliers | | 2,474 | | 2,692 | | 2,639 | Production by the Group as a percentage of total supply | | 36% | | 36% | | 36% | Sales of crude oil | | | | | | | Total sales | | 3,839 | | 4,194 | | 4,112 | Sales to Downstream segment(c) | | 1,995 | | 2,042 | | 2,074 | Sales to external customers | | 1,844 | | 2,152 | | 2,038 | Sales to external customers as a percentage of total sales | | 48% | | 51% | | 50% |
| (a) | Including condensates and increase non-fuel sales continued in 2006. Non-fuel sales increased following the opening of approximately 20natural gas liquids. |
Bonjour(b) convenience stores. As of December 31, 2006, TOTAL had a network of 475 AS24-branded retail stations in 20 European countries. This network, dedicated to professional transporters, opened 43 new retail stations in 2006, mainly in Central and Eastern Europe. | TOTAL is among the leaders in Europe for fuel-payment cards, with approximately 3.5 million cards issued in 16 European countries. In 2006, more than 4.7 Mm3 of motor fuels were sold and paid by card, compared to 4.5 Mm3 in 2005 and 4.4 Mm3 in 2004.In 2006, TOTAL continued to enlarge its distribution in Europe of two new high-performance fuels branded TOTAL EXCELLIUM 98 and TOTAL EXCELLIUM diesel. These new generation fuels reduce fuel consumption and carbon dioxide emissions. With the launch of the EXCELLIUM range, TOTAL has acquired a significantIncluding TOTAL’s proportionate share of the market for next generation fuels in Europe.
In 2005, TOTAL began distributing an urea-based additive called AdBlue intended for professional transporters in Europe. Asproduction of December 31, 2006, more than 130 TOTAL and AS24 retail stations were equipped to distribute bulk and conditioned urea. Between now and 2009, TOTAL expects to progressively expand its distribution of AdBlue to include a network of approximately 400 retail stations in 27 European countries.
Africa
TOTAL is present in more than 40 African countries and has interests in seven refineries.
In 2005, TOTAL strengthened its position in Africa through the acquisition of distribution affiliates in 14 African countries (Djibouti, Eritrea, Ethiopia, Ghana, Guinea Conakry, Liberia, Malawi, Mauritius, Mozambique, Sierra Leone, Chad, Togo, Zambia and Zimbabwe). This acquisition, completed in 2006, includes 500 retail stations and 29 terminals and depots with an overall capacity of 380,000 m3. Through this agreement, TOTAL has strengthened its presence in West Africa, consolidating its positions in East Africa and become the largest marketer of petroleum products in Africa.
Asia
TOTAL is present in nearly 20 Asian countries.
Building upon their experience together at the Dalian refinery, in 2005 TOTAL and Sinochem decided to develop two retail station network partnerships in China. A joint-venture agreement, signed in March 2005, is designed to develop a network of 200 retail stations in Beijing and in the area north of the city. At the end of December 2006, 22 retail stations were operating. A second joint-venture agreement for the creation of a network of 300 retail stations in the provinces of Shanghai, Jiangsu and Zhejiang in eastern China was signed in September 2005. The first retail station opened in November 2006. These investments represent a major step forward in TOTAL’s strategy of expanding its petroleum products marketing operations in China.
In July 2006, TOTAL strengthened its positions in the Pacific area through the acquisition of assets in Fiji, Samoa and Tonga. The acquisition includes a network of retail stations, approximately ten terminals and depots, as well as sales and distribution of fuel, lubricants, aviation and marine petroleum products. TOTAL also acquired assets in Cambodia in December 2006 to strengthen its existing activities. Both acquisitions remain subject to any necessary approval by the relevant authorities in each country.
In 2006, after the distribution of petroleum products was partially opened to foreign companies in Indonesia, TOTAL decided to develop a pilot network of five retail stations in Jakarta.
Other countries
TOTAL has activities in Turkey and in the Caribbean.
In 2004, TOTAL strengthened its positions in the Caribbean with the creation of two new subsidiaries in Jamaica and Puerto Rico. These new subsidiaries complement TOTAL’s existing activities in Haiti, the French West Indies, Cuba and Costa Rica.
Specialties
TOTAL produces a wide range of refined petroleum products at its refineries and other facilities. TOTAL is among the leading companies in the European specialty products market, particularly in the bitumen, jet fuel and lubricant markets.
TOTAL markets lubricant in more than 150 countries. In 2006, TOTAL strengthened its positions in the lubricants market by signing supply agreements with car manufacturers Nissan and Honda. In September 2006, TOTAL entered into a joint-venture agreement with Veolia Group (TOTAL 35%) to build a 120 kt capacity oil recycling plant in France. Commissioning of the plant is scheduled for 2008. In 2005, TOTAL and the Romanian company Lubrifin signed a joint-venture agreement (TOTAL 51%) to produce and market lubricants and greases intended for the automotive and industrial markets.
TOTAL continued to develop its LPG distribution activities on a worldwide scale, and is the fourth largest international distributor(1).
Bio-fuels and hydrogen
The Group plays an active part in the promotion of renewable energies and alternative fuels.
In 2006, TOTAL consolidated its position as an important oil and gas company active in biofuels in Europe by producing and incorporating 500 kt of ETBE(2) in seven refineries(3) (compared to 360 kt in 2005 and 310 kt in 2004) and incorporating 420 kt of VOME(4) in diesel fuels at nine European refineries and several
storage sites (compared to 310 kt in 2005 and 210 kt in 2004). In 2005, TOTAL signed a VOME supply contract with Sofiprotéol and Diester Industry for periodically increasing quantities reaching 600 kt/y.
In November 2006, TOTAL and several other parties (car manufacturers, oil companies, agricultural representatives, ethanol producers) signed the Superethanol E85 Development Charter, a charter to develop superethanol in France (fuel with up to 85% of ethanol from agricultural production, also called “flexfuel”). As part of this charter, TOTAL undertook to equip 200 to 275 retail stations to distribute flexfuel by the end of 2007. The rate at which Superethanol is adopted by the market will depend both on the creation of appropriate tax incentives and the marketing of suitable vehicles.
In 2006, TOTAL continued its research and testing programs for fuel cell and hydrogen fuels technologies. In this area, TOTAL entered into cooperation agreements for automotive applications (with BMW in March 2006, Renault in 2003 and Delphi in 2001) and for stationary applications (with Electrabel and Idatech in 2004). Under its partnership with BVG, the largest public transport company in Germany and the bus operator in Berlin, TOTAL created a Center of Excellence for Hydrogen in Berlin. The first consumer hydrogen fueling station opened in Berlin in March 2006. As part of the partnership with BMW, a second hydrogen fueling station opened in December 2006 near the car manufacturer’s Innovation and Research Center. The construction of a third hydrogen fueling station in Europe is under study. TOTAL is also an active participant in the hydrogen technology platform program launched by the European Commission at the end of 2003, intended to promote the development of this technology in Europe.
(1)joint ventures. | Company sources, on the basis of volumes sold. |
(2) | ETBE: Ethyl-Tertio-Butyl-Ether. |
(3) | Including Algeciras and Huelva refineries (CEPSA). |
(4) | VOME: Vegetable-Oil-Methyl-Esther. |
Trading & Shipping
The Trading & Shipping sector:
sells and markets the Group’s crude oil production,
provides a supply
| (c) | Excluding share of crude oil for the Group’s refineries,imports and exports the appropriate petroleum products for the Group’s refineries to be able to adjust their production to the needs of local markets,
charters appropriate ships for these activities, and
undertakes trading on various derivatives markets.
Although Trading & Shipping’s main focus is serving the Group, its know-how and expertise also allow Trading & Shipping to extend the scope of its activities beyond meeting the strict needs of the Group.
Trading
TOTAL is one of the world’s major traders of crude oil and refined products on the basis of volumes traded.
The table below sets forth selected information with respect to TOTAL’s worldwide sales and source of supply of crude oil for each of the last three years.
| | | | | | | | (kb/d, except %) | | 2006 | | 2005 | | 2004 | Sales of crude oil | | | | | | | Total Sales | | 4,112 | | 4,465 | | 4,720 | Sales to Downstream segment(a) | | 2,074 | | 2,111 | | 2,281 | Sales to external customers | | 2,038 | | 2,354 | | 2,439 | Sales to external customers as a percentage of total sales | | 50% | | 53% | | 52% | Supply of crude oil | | | | | | | Total supply | | 4,112 | | 4,465 | | 4,720 | Produced by the Group(b)(c) | | 1,473 | | 1,615 | | 1,686 | Purchased from external suppliers | | 2,639 | | 2,850 | | 3,034 | Production by the Group as a percentage of total supply | | 36% | | 36% | | 36% |
(a) | Excludes share of CEPSA, in which TOTAL has a 48.83% interest since October 2006, compared to its previous 45.3% interest.CEPSA. |
(b) | Includes condensates and natural gas liquids. |
(c) | Includes TOTAL’s proportionate share of the production of equity affiliates. |
The Trading division operates extensively on physical and derivatives markets, both organized and over the counter. In connection with its trading activities, TOTAL, like most other oil companies, uses derivative energy instruments (futures, forwards, swaps, options) to adjust its exposure to fluctuations in the price of crude oil and refined products. These transactions are entered into with various counterparties. For additional information concerning Trading & Shipping’s derivatives, see Notes 30 and 31 to the Consolidated Financial Statements.
All of TOTAL’s trading activities are subject to strict internal controls and trading limits. Throughout 2008, the Trading division maintained a level of activity similar to the levels attained in 2007 and 2006, trading physical volumes of crude oil and refined products amounting to an average of approximately 5 Mb/d. In 2008, the principal market benchmarks stood at historically high levels of volatility: | | | | | | | | | | | | | | | | | | | | | | | | 2008 | | 2007 | | 2006 | | min 2008 | | | max 2008 | | Brent ICE Futures — 1st Line(a) | | ($/b) | | 98.52 | | 72.67 | | 66.11 | | 36.61 | | (Dec 24 | ) | | 146.08 | | (Jul 03 | ) | Gasoil ICE Futures — 1st Line(a) | | ($/t) | | 920.65 | | 637.8 | | 580.4 | | 402 | | (Dec 26 | ) | | 1,325.25 | | (Jul 11 | ) | VLCC Ras Tanura Chiba — BITR(b) | | ($/t) | | 24.09 | | 13.93 | | 14.52 | | 11.16 | | (Nov 28 | ) | | 45.49 | | (Jan 02 | ) |
The Trading division operates extensively on physical and derivatives markets, both organized and over the counter. In connection with its trading activities, TOTAL, like most other oil companies, uses derivative energy instruments to adjust its exposure to fluctuations in the price of crude oil and refined products.
The Trading division undertakes certain physical transactions on a spot basis, but also enters into term
and exchange arrangements and uses derivative instruments such as futures, forwards, swaps and options. These operations are entered into with various counterparties.
All of TOTAL’s trading activities are subject to strict internal controls and trading limits.
In 2006, the principal market components stood at high levels:
| | | | | | | | | | | | | | | | | | | | | | | | 2006 | | 2005 | | 2004 | | min 2006 | | | max 2006 | | Brent ICE Futures — 1st Line(a) | | ($/b) | | 66.11 | | 55.25 | | 38.04 | | 57.87 | | (2-Nov | ) | | 78.30 | | (7-Aug | ) | Gasoil ICE Futures — 1st Line(a) | | ($/t) | | 580.4 | | 507.9 | | 347.5 | | 510.5 | | (12-Jan | ) | | 668.8 | | (10-Aug | ) | VLCC Ras Tanura Chiba — BITR(b) | | ($/t) | | 14.52 | | 13.91 | | 19.97 | | 8.35 | | (6-Apr | ) | | 27.21 | | (25-Jan | ) |
(a) | 1st line: Quotation for first month nearby delivery ICE Futures. |
| (b) | VLCC: Very Large Crude Carrier. Data estimated from BITR’sBITR market quotations. BITR: Baltic International Tanker Routes. |
Shipping The Shipping division arranges the transportation of crude oil and refined products necessary for the Group’s activities. The Shipping division provides the wide range of shipping services required by the Group to develop its activities and maintains a rigorous safety policy. Like a certain number of other oil companies and shipowners, the Group uses freight rate derivative contracts in its shipping activity to adjust its exposure to freight-rate fluctuations. In 2008, the Shipping division of the Group chartered 3,182 voyages to transport approximately 128 Mt of oil. As of December 31, 2008, the Group employed a fleet of sixty-two vessels chartered under long-term or medium-term agreements (including six LPG carriers). The fleet, consisting entirely of double-hulled vessels, has an average age of approximately five years. While the beginning of the year was marked by relatively low freight-rate levels, the shrinkage in the freight market in 2008, particularly between the end of April and the beginning of August, led to historically high freight-rate levels. On route TD3 (transportation of crude, Persian Gulf -Japan, VLCC), spot interest rates averaged WS209(1) between May and July (compared to an average of WS106 over the 2003-2007 period). Daily average income on TD3 from May to July exceeded $158,000/d (compared to approximately $61,000/d over the 2003- 2007 period). Consistent with past experience, freight rates for other ship sizes predominantly followed the trend recorded by VLCCs. Transport of petroleum products also benefited, to a lesser extent, from the general increase of freight rates. These historically high freight-rate levels can be explained by several factors. Worldwide tanker fleet growth was moderate, notably with a reduction in size of the VLCC fleet during the first three quarters of the year (with zero overall growth in 2008) and a stagnation of the Suezmax fleet over the same period (weak growth in 2008). This is particularly due to the removal of single-hulled tankers from the fleet for conversion into dry bulks. The use of several VLCCs to store Iranian crude between June and August 2008 also limited the effective tonnage (40 Mb at the beginning of June,i.e., the equivalent of nearly twenty VLCCs). In addition, demand for transport in 2008 remained strong, in particular during the summer months due to Saudi Arabia’s increased production as from July, which led to a growth in demand for crude transport, especially on long-haul VLCC flows from the Persian Gulf. From the end of August 2008, market trends reversed. The decrease in global oil demand due to the global economic crisis led the OPEC countries to cut production, resulting in a decrease in crude transport demand. As offered tonnage levels increased and demand remained stable, the surplus in tonnage increased, leading to a drop in spot freight rates.
Chemicals The Chemicals segment includes the Base Chemicals and Specialty Chemicals divisions: Base Chemicals encompasses the Group’s petrochemicals and fertilizers activities; and Specialty Chemicals encompasses the Group’s rubber processing, resins, adhesives and electroplating activities. TOTAL is one of the world’s largest integrated chemical producers.(2) On May 12, 2006, TOTAL’s shareholders approved the spin-off of Arkema, which, since October 1, 2004, included vinyl products, industrial intermediates and performance products. Arkema has been listed on Euronext Paris since May 18, 2006. The Chemicals segment improved its safety performance in 2008 by focusing on on-the-job safety, safety management systems and major risk prevention.
(1) | Throughout 2006,WS (Worldscale rate): "Worldscale" refers to the Trading division maintained"New Worldwide Tanker Nominal Freight Scale," an index intended to permit the comparison of freight rates for various size tanker routes. A particular route’s "Worldscale Rate" represents a level of activity similar to levels attainedvoyage charter rate for a hypothetical 75,000 dwt tanker on such route, with Worldscale 100 representing the break-even cost for such a tanker on that route. Worldscale Rates are calculated in 2004 and 2005, trading physical volumesUSD per ton of crude oil and refined products amounting to an average of approximately 5 Mb/d.are updated annually.
|
| (2) | Based on publicly available information, consolidated sales. |
Shipping
The principal activity of the Shipping division is to arrange the transportation of crude oil and refined products necessary for Group activities. The Shipping division provides the wide range of shipping services required by the Group to develop its activities and maintains a rigorous safety policy. Like a certain number of other oil companies and shipowners, the Group uses freight-rate derivative contracts in its shipping activity in order to adjust its exposure to freight-rate fluctuations.
In 2006, the Shipping division of the Group chartered 3,170 voyages to transport approximately 127 Mt of oil. As of December 31, 2006, the Group employs a fleet made up of sixty-three vessels chartered under long-term or medium-term agreements (including six LPG tankers). The fleet is modern, with an average age of approximately five years and is predominately comprised of double-hulled vessels.
Throughout 2006, world crude tanker tonnage increased by 4.9%.This was the fourth consecutive year of high-growth in terms of available crude tonnage (+7.5% in
2005, +4.5% in 2004 and +5 % in 2003). Tonnage demand in 2006 was less sustained than the year before, due to the slowdown in the growth of global oil demand.
These trends reinforce a structural surplus of available tonnage, particularly in a situation where the orderbook reaches a historical record, both in absolute value (124 million deadweight tons) and as a percentage of the active fleet (30% of the global fleet, between 30% and 65% according to the different tanker segments).
On the crude tanker segments, after the seasonal rise observed during the last quarter 2005, the chartering markets significantly dropped throughout the year 2006, apart from some volatile peaks. Following a strengthening of freight rates during the second and third quarter, the rates have significantly fallen since August, particularly for VLCCs. The situations in both the crude and the petroleum products freight markets during the last quarter 2006 are thus not comparable to the historical level observed at the end of 2004 and 2005.
The large number of deliveries expected in 2007, which should not be offset by the demolition of ships, should lead to an increase in tonnage supply (5.8%)(1) greater than the increase in ton-miles (3%)(1).
Chemicals
TOTAL is one of the world’s largest integrated chemical producers.(2)
The Chemicals segment is organized into Base Chemicals activities (petrochemicals and fertilizers) and Specialties activities, which include the Group’s rubber processing, resins, adhesives and electroplating activities.
On May 12, 2006, TOTAL S.A.’s shareholders approved the spin-off of Arkema which included, since October 2004, vinyl products, industrial intermediates and performance products.
Since May 18, 2006, Arkema has been listed on the Eurolist by Euronext exchange in Paris.
Base Chemicals
TOTAL’sThe Base Chemicals activities encompass petrochemicalsdivision includes TOTAL’s Petrochemicals and fertilizers.Fertilizers activities.
Sales reached2008 sales amounted to 13.18 B€, compared to 12.56 B€ in 2007 and 12.01 B€ in 2006, compared to 10.25 B€ in 2005 and 8.86 B€ in 2004. Demand remained strong throughout the year due to the favorable economic environment. In 2006, naphtha prices were very volatile,
increasing markedly during the first half of the year before decreasing significantly during the second half. As a result, margins markedly improved during the latter part of the year.2006. Adjusted net operating income from Base Chemicals activities increaseddecreased by more than 9%25% in 20062008 compared to 2005 and by 9%2007, after an 11% decrease in 20052007 compared to 2004.2006. This change primarily reflects the fall in petrochemicals margins in the first half 2008 due to the significant increase in the price of naphtha and the
decrease in sales volume of polymers stemming from the global economic slowdown. In petrochemicals, the Group’s operations in Qatar helped to offset the decrease in results in the mature markets of Europe and the United States. The Fertilizers activity benefited from a favorable environment and an improvement of its industrial operations, which contributed to the significant recovery of its results in 2008.
(2) | Company data, based on annual sales. |
Petrochemicals TOTAL’S PRODUCTION CAPACITIES BY MAIN PRODUCT GROUPS AND REGIONS | | | | | | | | | | | | | | | | 2006 | | 2005 | | 2004 | | As of December 31, (kt/y) | | Europe | | North
America | | Asia and
Middle
East(c) | | Worldwide | | Worldwide | | Worldwide | Olefins(a) | | 5,185 | | 1,195 | | 655 | | 7,035 | | 7,005 | | 7,055 | Aromatics | | 2,600 | | 930 | | 725 | | 4,255 | | 4,125 | | 4,040 | Polyethylene | | 1,315 | | 440 | | 280 | | 2,035 | | 2,035 | | 2,130 | Polypropylene | | 1,205 | | 1,070 | | 145 | | 2,420 | | 2,420 | | 2,305 | Styrenics(b) | | 1,240 | | 1,350 | | 515 | | 3,105 | | 3,175 | | 3,110 |
| | | | | | | | | | | | | | | | 2008 | | 2007 | | 2006 | | (kt/y) | | Europe | | North
America | | Asia and
Middle
East(c) | | Worldwide | | Worldwide | | Worldwide | Olefins(a) | | 5,085 | | 1,195 | | 1,005 | | 7,285 | | 7,175 | | 7,035 | Aromatics | | 2,665 | | 940 | | 755 | | 4,360 | | 4,335 | | 4,255 | Polyethylene | | 1,315 | | 440 | | 280 | | 2,035 | | 2,035 | | 2,035 | Polypropylene | | 1,275 | | 1,180 | | 295 | | 2,750 | | 2,575 | | 2,420 | Styrenics(b) | | 1,240 | | 1,350 | | 630 | | 3,220 | | 3,160 | | 3,105 |
| (a) | Ethylene, propylene and butadiene. |
| (b) | Styrene, polystyrene and elastomers (activity discontinued at the end of 2006). |
| (c) | Including minority interests in Qatar and 50% of Samsung-Total Petrochemicals capacities in Daesan (South Korea). |
TOTAL’sThe Petrochemicals activities of Total Petrochemicals include base petrochemicals activities include olefins(olefins and aromatics (base petrochemicals) as well as polyethylene,aromatics) and their derivatives (polyethylene, polypropylene and styrenics. On October 1, 2004, Total Petrochemicals was created to regroup these activities.styrenics).
TOTAL’s main petrochemicals sites are located in Belgium (Antwerp, Feluy), France (Gonfreville, Carling, Lavéra, Feyzin), and the United States (Port Arthur, HoustonLa Porte and Bayport in Texas and Carville in Louisiana) as well as in, Singapore and China (Foshan). Most of these sites are either adjacent to or connected by pipelines to Group refineries. As a result, most of TOTAL’s petrochemicals activities are closely integrated withwithin the Group’s refining operations. In August 2003, TOTAL entered intoowns a 50/50 joint venture with Samsung General Chemicals. This joint venture, named Samsung-Total Petrochemicals, has an integrated50% interest in the Daesan petrochemicals site at Daesan in South Korea, where it producesin partnership with Samsung. This integrated site is located 400 km off the Chinese coast.
TOTAL also holds a wide range of petrochemicals products20% interest in a site with a steam cracker and polymers which are marketedtwo polyethylene units in Asia.Mesaieed, Qatar. TOTAL’s objective is
TOTAL has continued to reinforcestrengthen its position amongleadership positions in the leaders in petrochemicals. industry by focusing on the following strategic areas: In mature markets, TOTAL intends to improveis improving the competitiveness of its sites notably through continued improvement of energy efficiency and industrial safety at its facilities. The reorganization plans of 2006 (approved) and 2009 (presented) for the Carling and Gonfreville sites in France are part of this strategy. The first plan calls for the closing of a steam cracker and the styrene plant at Carling and the construction of a world-class(1) styrene plant at Gonfreville to replace the existing largeone on this site. Implementation of this plan is expected to be completed in the first half 2009. In addition, the Group presented in March 2009 a second plan to upgrade its most efficient units and consolidate its petrochemicals competitiveness in France. As part of the project, approximately 230 M€€
| (1) | Facilities ranking among the first quartile for production capacities based on publicly available information. |
will be invested to bring to the most efficient level the energy efficiency and competitive strength of the steamcracker and high-density polyethylene (HDPE) unit in Gonfreville and to consolidate polystyrene production at the Carling facility. It will also lead to the closure of structurally loss-making units: a low-density polyethylene line in Carling in eastern France and a low-density polyethylene line and a polystyrene line in Gonfreville in northwestern France. This reorganization plan is also intended to improve the efficiency of support services and central services. Furthermore, following the sole customer’s termination of the supply contract for the secondary butyl alcohol produced at the Notre-Dame-de-Gravenchon facility in northwestern France, this dedicated facility will have to be closed. Implementation of this project is subject to prior consultation with employee representatives. Finally, debottlenecking operations conducted in 2008 at the Feluy (Belgium), La Porte and Port Arthur (Texas, United States) sites are expected to strengthen the competitiveness of these sites. In the faster growing Asian markets, TOTAL’s strategy • | | In Asia, the principal growth area for demand for petrochemicals, Samsung-Total Petrochemicals Co. Ltd completed in 2008 the first modernization phase of the Daesan site in South Korea. This major development increased the site’s initial production capacity by nearly one-third by expanding the steam cracking and styrene units, by building a new polypropylene line in 2007 and by starting up a new metathesis(1) plant in 2008. The project was completed on time and on budget. |
• | | In May 2008, the project to build a paraxylene plant in Saudi Arabia was confirmed by both partners, TOTAL and Saudi Aramco. This project, carried out in cooperation with the Group’s Refining & Marketing division, is expected to lead to the construction of a world-class(2) paraxylene plant to supply the Asian market. Start-up of this project is scheduled for 2013. |
TOTAL continues to expand its activities, either from plants located within the more dynamic markets or fromdevelop sites located in countries benefiting fromwith favorable access to raw materials. Samsung-Total Petrochemicals’ launch of a major program to expand and upgrade its site at Daesan is part of this strategy. This investment targets a significant expansion of the capacities of the steam cracker and of the styrene plant, as well as the construction of a new polypropylene line. Construction on these plants is continuing, and they are expected to be brought onstream in 2007 and 2008, respectively.
In Qatar, where the Group has had a long-term presence viabeen present since 1974 through its 20% interest in Qapco, TOTAL, through itsTOTAL’s 49% affiliate Qatofin is participating in the construction ofbuilding an ethane-based steam cracker at Ras Laffan, with a production capacity of 1.3 Mt, and of a new world-class(2) linear low-density polyethylene plant at Mesain Mesaieed.ïeed. These two units are scheduled to become onstream in the second half 2009. In addition, Qapco’s existing steam cracker in Mesaieed was debottlenecked and its production capacity brought onstreamto 720 kt/y in August 2007. Qapco expects to build a new low-density polyethylene unit whose commissioning is scheduled in 2011. Pursuant to the contract signed in July 2007, TOTAL is continuing its partnership with Sonatrach, the Algerian national oil company, to build a petrochemicals site in Arzew (Algeria). The project includes an ethane-based steam cracker with a production capacity of 1.1 Mt, two polyethylene units and a monoethylene glycol production unit. This world-class(2) project, with favorable access to one of the last particularly competitive sources of relevant raw materials, is ideally located to supply Europe, the Americas and Asia. In addition, TOTAL inaugurated in October 2008 a pilot MTO plant (Methanol to Olefins) at its Feluy site (Belgium). This research project, one of the endGroup’s most important research projects, is intended to assess, on a semi-industrial scale, the technical and economical feasibility of 2008.producing olefins from methanol derived from natural gas, as well as from coal and biomass, and to consider new methods to produce polyolefins. AtOn all of TOTAL’s petrochemicals sites, safetythe progress realized in 2008 with respect to industrial security and environmental improvements were in lineprotection was in-line with the yearly targets set by the Group.Group’s annual objectives.
Base petrochemicals Base petrochemicals encompass theinclude olefins and aromatics produced by steamcrackingsteam cracking petroleum cuts, mainly naphtha, as well as propylene and aromatics producedmanufactured in the refineries of the Group.Group’s refineries. The economic environment for these activities is extremely volatile and margins are strongly influenced by supply and demand and the evolution of the price of naphtha.naphtha, the principal raw material used. 20062008 was characterizedmarked by important fluctuations in the price of naphtha and a strong global demand in steam cracker derivatives, reflecting the healthy economical environment.
In addition, a number of unplanned outages within the industry disturbed the supply of aromatics in North America and olefins in Europe, while the start-up of some petrochemical plants in the Middle East was significantly delayed. These factors,highly volatile commodity prices combined with stronga decrease of demand anddue to the decrease in the price of naphtha in the second half of the year, contributed to keeping margins at high levels throughout the second half 2006.global economic slowdown.
Olefins production increased 1%decreased by 2% in 20062008 compared to 2005,2007, after having decreased by 1%a 2% increase in 20052007 compared to 2004.2006. Polyethylene Polyethylene is a plastic produced by the polymerization of ethylene manufactured in the Group’s steam crackers. It is principallyprimarily intended for the packaging, automotive, food, cable and pipe markets. Margins are strongly influenced by the level of demand and by competition from expanding production in the Middle East, which takes advantage of favorable access to the raw materials (ethylene madematerial, ethane, to produce ethylene. | (1) | Conversion of ethylene and butene into propylene. |
| (2) | Facilities ranking among the first quartile for production capacities based on publicly available information. |
2008 was marked by the global economic slowdown and strong decline in mature regions (Europe and the United States). TOTAL’s sales volume dropped by 9% in 2008 compared to 2007 and margins shrank. This pressure on margins is expected to persist during the upcoming years due to competition from ethane). In 2006, strong world demand helped absorb new production brought onstreamplants in the Middle East and Asia. In this context, TOTAL intends to focus on lowering the break-even points in China as well as contributingits plants and strengthening its efforts to maintaining margins in spitebetter differentiate its range of the increase in the price of raw materials. Sales in Europe were negatively affected by limited availability of ethylene. Nevertheless, TOTAL’s sales volumes globally increased 1.4% in 2006 compared to 2005, after having decreased by 3% in 2005 compared to 2004.products.
Polypropylene Polypropylene is a plastic produced by the polymerization of propylene manufactured in Groupthe Group’s steam crackers and refineries and principallyrefineries. It is primarily intended for the automotive, packaging, appliance, car industry, carpet, and household, appliances, fibers and sanitary goods markets. Margins are primarilymainly influenced by the level of demand and the availability and price of propylene. In 2006,2008 was marked by a decline of the polypropylene demand was strongmarket, notably in Europe where supply and demand were generally balanced, and margins remained satisfactory. However in the United States, both demand and margins were negatively affectedwith TOTAL’s sales volume having decreased by the volatility and high price of propylene. In Asia, demand and margins improved4% compared to 2007. Taking into account increased competition in the second semester after a weak startyears to come from the start-up of new plants in the year. Sales volumes increased by 1.8%Middle East, TOTAL benefits from plants whose industrial performance, both in 2006 compared to 2005, after having increased by 6.6% between 2005Europe and 2004.the United States, places the Group among the industry’s leaders. In this regard, TOTAL successfully achieved capacity increases of 60 kt/y in Feluy (Belgium) and 110 kt/y in La Porte (Texas, United States) in 2008.
Styrenics This business unit encompassesactivity includes the production of styrene monomer and polystyrene. The elastomers activity was shut down at the end of 2006. Most of the styrene producedmanufactured by the Group is used in the production of polystyrene. Polystyrene isto produce polystyrene, a plastic principally used in packaging, domestic appliances, electronics and audio-video. Margins are strongly influenced by the level of polystyrene demand as well as byand the price of benzene, thewhich is polystyrene’s principal raw material. In 2006, the increaseAfter a slight rise in world styrene demand was relatively weak, approximately 2%,in 2007, the polystyrene market decreased in 2008, marked by a sharp decline of demand in mature zones and demanda net slowdown of growth in Asia, notably in China. After two years of slight increases, TOTAL’s polystyrene sales volume decreased againby 7% in Europe.2008 compared to 2007.
World polystyrene demand varied little after the effect of the increased competition of other materials, plastics and paper. Margins were affected by the high prices of raw materials, ethylene and benzene, and by the high costs of energy. Nevertheless, TOTAL’s polystyrene sales volumes increased by 0.3% in 2006 compared to 2005, after having decreased by 2% in 2005 compared to 2004.
Fertilizers The Fertilizers business unit (Grande Paroisse)Through its subsidiary GPN, TOTAL manufactures and markets nitrogen fertilizers manufactured usingmade from natural gas, and complex fertilizers manufactured using nitrogen, phosphorus and potassium products.gas. Margins are strongly influenced by the price of natural gas.
2008 was marked by the significant recovery of GPN’s results. GPN’s sales increased by 47% in 2008 compared to 2007, after a 20% rise in 2007. The rise in global demand for cereals was reflected in a growth of nearly 5% of fertilizer demand in Europe compared to 2007. Improved production of the ammonia plants at Grandpuits and Rouen (France) enabled GPN to take advantage of this favorable environment. In 2006, Grande Paroisse’s sales decreased by 11% comparedthe Fertilizers activity launched a major restructuring plan to 2005 after having increased by 7% in 2005 compared to 2004. The activity was negatively affected by turnarounds and various technical problems incurred in the Group’s nitrogen plants, and also by the weak demand for fertilizers during the first part of the year. Furthermore, the increase in the price of natural gas hadrestore its profitability on a negative impact on margins.long-term basis: In July 2006, Grande Paroisse
GPN stopped its French production in France of complex fertilizers, made from nitrogen, phosphorus and potassium products, due to the continuously declining market for thosethese products, and closed its plants in Bordeaux, Basse Indre, Rouen and Granville. Besides, ZuydIn addition, TOTAL sold its Dutch affiliate, Zuid Chemie, -to Engrais Rosier, in which the Netherlands affiliate of Grande Paroisse - was sold to Rosier, of which Elf AquitaineGroup holds a 57% share, to create a more competitive player in the Benelux market. Grande Paroisse also unveiled an important plan intended to support its nitrogen derivatives
• | | The Fertilizers activity’s core business, the production of nitrogen fertilizers, was strengthened through a major investment in the construction of two competitive nitric acid plants in Rouen and a urea plant in Grandpuits. Start-up of these plants is expected in the first half 2009. This additional urea production is expected to position GPN on the growing markets for DENOX products for industrial applications and Adblue for transportation applications. These products contribute to reducing nitrogen oxide emissions.(1) |
In France, the Oissel site and announced the construction of a new urea plant at Grandpuits as well as a new world-classthree obsolete nitric acid plant in Rouen. The plants are scheduled to be put onstream in 2008, concurrent with the shutdown of the fertilizers plant in Oissel and four small obsolete acid nitric linesunits in Rouen and Mazingarbe. Grande Paroisse continuedMazingarbe are expected to faceshut down during 2009.
This plan is expected to improve the consequencescompetitiveness of GPN by regrouping its operations at three sites, two of which feature a production capacity greater than the explosion which struck its Toulouse plant on September 21, 2001 and made payments, underEuropean average, as market perspectives remain satisfactory in the French law presumption of civil responsibility, over and above the compensation paid by insurance companies, reaching a cumulative amount approaching 1,227 M€ as of December 31, 2006.medium term. SpecialtiesSpecialty Chemicals
TOTAL’s Specialties sectorSpecialty Chemicals division includes rubber processing (Hutchinson), resins (Cray Valley, Sartomer and Cook Composites & Polymers), adhesives (Bostik) and electroplating (Atotech). The sector coversdivision serves consumer and industrial markets for which customer-oriented marketing and service as well as innovation are | (1) | Nitrogen oxide’s emissions are noxious to the environment and subject to regulation. |
key drivers. The Group markets specialty products in more than 55fifty-five countries. Its strategy is to continuepursue its international expansion by combining internal growth and targeted acquisitions while concentrating on growing markets and focusing on the distribution of new products with high added value. In 2006,2008, Specialty Chemicals faced a difficult environment due to the Specialties sector benefited from a generally favorable environmenteconomic slowdown in the United States and particularly from stronger demand in Europe. In 2006,this adverse environment, Specialty Chemicals’ sales reached 7.10 B€, an increasedecreased by nearly 9%4% compared to 2005, after having increased by 8% in 2005 compared to 2004. The adjusted2007. Adjusted net operating income from the Specialties activities increaseddecreased by 10% in 200618% compared to 2005, after having increased by 14% in 2005 compared to 2004.2007. Rubber processing Hutchinson manufactures and markets products obtainedderived from rubber processing that are principally intended for the automotive, aerospace and aerospacedefense industries as well as forand consumer markets. Sales increased
• | | In the industrial market (automotive, aerospace, defense and transports), Hutchinson, among the industry’s leaders(1), intends to provide its customers with innovative solutions in the domains of fluid transfer, water and airtightness, transmission, mobility and vibration, sound and thermal insulation. |
Globally, Hutchinson’s 2008 sales remained at a level similar to 2007 despite an uneven environment for its various activities. Automotive’s sales decreased by approximately 5% in 20066% compared to 2005, after having increased2007 in an increasingly challenging environment, both in North America and in Europe, due to the difficulties faced by approximately 4% in 2005 compared to 2004. In 2006, the automotive industryindustry. In the other industrial markets, sales increased by 4%more than 15% in 2008 compared to 2005 despite a difficult environment in Europe and in the United States. In 2006, sales from the industrial division increased by approximately 10% compared2007 due to 2005, weakerstrong demand from the defense industry in the United States was offset by growthand from other segments. Sales from the consumer goods sector increased by approximately 2% due to higher consumer demand in Europe. Early in 2006, Hutchinson strengthened its industrial division by acquiring the French company Jehier, a manufacturer of various insulating components for the aerospace and defense industries. railway industries in Europe. To strengthen its position in the aerospace industry, Hutchinson acquired late in 2008 a company specialized in the expanding carbon fiber industry.
Throughout 2006,2008, Hutchinson continued to develop in expanding markets, such as Central andprimarily Eastern Europe, South America and China.China, relying notably on the sites launched in 2006 in Romania (Brasov), Poland (Lodz) and China (Suzhou). To further this strategic objective, Hutchinson is expected to open a new site in Tunisia in 2009. • | | The consumer market is essentially oriented towards two ranges of products: baby care (Nuk® and Tigex®) and household specialties (Mapa® and |
| Spontex®). These activities depend highly on the level of household consumption. Despite the adverse effects of the economic slowdown that began mid-2008, the baby care sector and the household specialties sector continued to grow in 2008. The purchase of Gerber®’s baby care products in 2008 is expected to consolidate Hutchinson’s leading position(1) in this activity by strengthening its presence in the Western Hemisphere, notably in the United States, Canada and Brazil. |
Resins TOTAL produces and markets resins for adhesives, inks, paints, coatings and structural materials through its three subsidiariessubsidiaries: Cray Valley, Sartomer, and Cook Composites & Polymers. In 2006, TOTAL’s resins activities improved its results, benefitingSince the middle of 2007, this sector was affected by the slowdown of the U.S. economy. This trend continued in 2008. The decrease in volumes extended to Europe from the favorable environment.middle of 2008. Sales grewdecreased by approximately 8%9% in 20062008 compared to 2005,2007, after having increased by 13%a 4% decrease in 2005 compared to 2004.2007.
In 2006, Cray-Valley decided2008, Cray Valley continued to debottleneckstreamline its tackifying resinsEuropean production. Cook Composites & Polymers, through its affiliate Composite One, strengthened its composite materials distribution activities in the United States. In the first quarter 2008, Sartomer started its new plant in Beaumont, Texas, United States, acquiredNansha, southern China, to pursue its development in 2005. Sartomer started the expansion of its photocure plant in Villers-Saint-Paul, France and pursued the construction of a new monomers and oligomers plant near Guangzhou, China. Cray-Valley pursued the streamlining of its resin coatings production in Europe and closed its plant in Tönisworth (Germany), whose production is being transferred to other Cray-Valley plants in Zwickau (Germany) and Boretto (Italy).growing markets. Adhesives TOTAL’s adhesives subsidiary, Bostik is one of the worldwideworld leaders in its sector, based on sales(2), with leading positions in the industrial, hygiene, construction and consumer and professional distribution markets.
In 2006,2008, sales increaseddecreased by 15%6% compared to 2005, after having increased by 6%2007 but remained relatively stable (-1%) at constant exchange rates. These results in 2005 compared to 2004. The increase in sales recorded in 2006 stems partly from acquisitions made in the second half 2005 and early in 2006, and partly from healthy global economic conditions. The activity was sustained in the Asia-Pacific zone, remained well oriented in the United States and improved significantly in Europe. Nevertheless, margins were negatively affected by the increase in the pricesan adverse economy confirm Bostik’s strategy of raw materials. In 2006, Bostik strengthenedstrengthening its position in the industrial market, which has been less affected than the construction industry, and distribution segments by acquiring Sealocrete and Wetherby (UK) and Paso (Germany). Bostik also acquired Pegaso (Mexico)continuing its development in growing markets, especially in the industrial segmentAsia-Pacific region.
As a result, new production units were commissioned in China (Zhuhai) and the laminated adhesives activities of Du Pont in Germany, as well as purchasing the minority shareholders’ shares of ASA (Australia)Australia (Sydney). | (1) | Based on publicly available information, consolidated sales. |
| (2) | Based on publicly available information. |
Furthermore, Bostik is actively pursuing its program for innovation and is focusing notably on new products and applications contributing to sustainable development. Electroplating Atotech, which encompasses TOTAL’s electroplating activities, is the second largest company in this market,sector, based on worldwide sales(1).Its activity It is divided betweenactive in both the electronicelectronics and general metal finishing markets. The electroplating activities faced a slowdown at the end of 2008 that affected the general metal finishing sectors.market, In 2006, sales grewinfluenced by approximately 19%the difficulties faced by the automotive industry and the electronics industry. Sales decreased by 4% in 2008 compared to 2005, after having increased by 7%2007.
During this period of economic slowdown, Atotech intends to pursue a full-service strategy for its customers in 2005 comparedterms of equipment, chemical products and global geographical coverage through its technical centers. Major research will continue, notably to 2004. Electroplating activity benefited frombring new solutions that meet the growth of the electronics industry strictest environmental requirements. Finally, Atotech intends to continue its development in Asia, and also from strong demand for general metal finishing.
In 2006, Atotech strengthened its general metal finishing activities by acquiring the shares of Kunz GmbH (Germany), a company specialized in anti-corrosion coating technologies intended for automotive uses.
Atotech also expanded the production capacitywhich represents more than 50% of its Neuruppin (Germany) and Guangzhou (China) plants and commissioned a new industrial complex gathering both manufacturing and technical center facilities at Jang-An (South Korea).global sales.
Other Matters
Various factors, including certain events or circumstances discussed below, have affected or may affect ourTOTAL’s business and results. Exploration and production legal considerations TOTAL’ sTOTAL’s exploration and production activities are conducted in many different countries and are therefore subject to an extremely broad range of legislation and regulations. These cover virtually all aspects of exploration and production activities, including matters such as land tenure,leasehold rights, production rates, royalties, environmental protection, exports, taxes and foreign exchange.exchange rates. The terms of the concessions, licenses, permits and contracts governing the Group’s ownership of oil and gas interests vary from country to country. These concessions, licenses, permits and contracts are generally granted by or entered into with a government entity or a state-owned company and are sometimes entered into with private owners. These arrangements usually take the form of concessions or production sharing agreements.
The “oiloil concession agreement”agreement remains the classictraditional model for agreements entered into with States: the oil company owns the assets and the facilities and is entitled to the entire production. In exchange, the operating risks, costs and investments are the oil company’s responsibility and it agrees to remit to the relevant State, asusually the owner of the subsoil resources, a production-based royalty, income tax, and possibly other taxes that may apply under the local tax legislation. The “productionproduction sharing contract”contract (PSC) involves a more complex legal framework than the concession agreement: it defines the terms and conditions of production sharing and sets the rules governing the cooperation between the company or consortium in possession of the license and the host State, which is generally represented by a statestate-owned company. The latter can thus be involved in operating decisions, cost accounting and production allocation. The consortium agrees to undertake and finance all exploration, development and production activities at its own risk. In exchange, it is entitled to a portion of the production, known as “cost oil”, the sale of which should cover all of these expenses (investments and operating costs). The balance of production, known as “profit oil”, is then shared in varying proportions, between the company or consortium, on the one hand, and with the State or the state company.state-owned company, on the other hand. In some instances, concession agreements and PSCs coexist, sometimes in the same country. Even though other contractual structures still exist, TOTAL’s license portfolio is comprised mainly of concession agreements. In all countries, the authorities of the host state,State, often assisted by international accounting firms, perform joint venture and PSC cost audits and ensure the observance of contractual obligations. In some countries, TOTAL has also signed contracts called “contracts for risk services” which are similar to production sharing contracts, with the main difference being that the repayment of expenses and the compensation for services are established on a monetary basis. Current contracts for risk services are backed by a compensation agreement (“buyback”)(buyback), which allows TOTAL to receive part of the production equal to the cash value of its expenses and compensation. Hydrocarbon exploration activities and production activities are subject to permits,public authorizations (permits), which can be | (1) | Based on publicly available information. |
different for each of these activities. These permits are granted for limited periods of time and include an obligation to return a large portion, – in case of failure the entire portion, – of the permit area at the end of the exploration period.
(1) | Based on Company data. |
In general, TOTAL is required to pay income tax on income generated from its production and salesales activities under its concessions or licenses. In addition, depending on the country, TOTAL’s production and sale activities may be subject to a range of other taxes, fees and withholdings, including special petroleum taxes and fees. The taxes imposed on oil and gas production and sale activities may be substantially higher than those imposed on other businesses.
The legal framework of TOTAL’s exploration and production activities, established through concessions, licenses, permits and contracts granted by or entered into with a government entity, a state-owned company or, sometimes, private owners, is subject to certain risks which in certain cases can diminish or challenge the protections offered by this legal framework. Industrial and environmental considerations TOTAL’s activities involve certain industrial and environmental risks which are inherent toin the production of products that are flammable, explosive or toxic. Its activities are therefore subject to extensive government regulations concerning environmental protection and industrial safety in most countries. For example,More specifically, in Europe, TOTAL operates industrial sites that meet the criteria of the European Union Seveso II directive for classification as high-risk sites. Other sites operated by TOTAL in other parts of the world involve similar risks. The broad scope of TOTAL’s activities, which include drilling, oil and gas production, on-site processing, transportation, refining, petrochemicals activities, storage and distribution of petroleum products, production of base chemical products and specialty chemicals,products, involve a wide range of operational risks. Among these risks are those of explosion, fire or leakage of toxic products. In the transportation area, the type of risks depends not only on the hazardous nature of the products transported, but also on the transportation methods used (mainly pipelines, maritime, river-maritime, rail, road), the volumes involved, and the sensitivity of the regions through which the transport passes (population density, environmental considerations). Most of these activities involve environmental risks related to emissions into the air, water or soil and the creation of waste, and also require environmental site restorationremediation and closure and decommissioning after production is discontinued. Certain branches or activities face specific risks. In oil and gas exploration and production, there are risks related to the physical characteristics of an oil or gas field. These include eruptions of crude oil or of natural gas, discovery of hydrocarbon pockets with abnormal pressure, crumbling of well openings, leaks generating toxic risks and risks of fire or explosion. All these events could possibly damage or even destroy crude oil or natural gas wells as well as related equipment and other property, cause injury or even death, lead to an interruption of activity or cause environmental damage. In addition, since exploration and production activities may take place on sites that are ecologically sensitive (tropical forest, marine environment, etc.), each site requires a specific approach to avoid or minimize the impact on the related ecosystem, biodiversity and human health. TOTAL’s activities in the Chemicals segment and to a lesser extent, the Downstream segmentRefining & Marketing division may also have health, safety and environmental risks related to the overall life cycle of the products manufactured. These risks can arise from the intrinsic characteristics of the products involved, which may, for example, be flammable, toxic, or linked to theresult in long-term environmental impacts such as greenhouse gas effect.emissions. Risks of facility contamination and off-site impacts may also arise from emissions and discharges resulting from processing or refining, and from recycling or disposing of materials and wastes at the end of their useful life. Health, safety and environment regulations TOTAL is subject in general to extensive and increasingly strict environmental regulation in the European Union. Significant directives which apply to its operations and products, particularly refining and marketing, but also its chemicals and, to a lesser extent, its upstream business, are: The directive for a system of Integrated Pollution Prevention and Control (IPPC), a cost/benefit framework used to comprehensively assess the environmental quality standards, prior environmental impacts, and potential additional emissions limits on, large industrial plants, including ourits refineries and chemical sites. Air Quality Framework Directive and related directives on ambient air quality assessment and management, which, among other things, limit emissions for sulfur dioxide, oxides of nitrogen, particulate matter, lead, carbon monoxide, benzene and ozone. The Sulfur Content Directive, under which sulfur in diesel fuel ishas been limited to 0.2% beginningsince July 2000, and 0.1% beginningas of January 2008. BeginningSince January 2003, sulfur in heavy fuel oil ishas been limited to 1%, with certain exceptions for combustion plants provided that local air quality standards are met. The Large Combustion Plant Directive, a directive which limits certain emissions from large combustion plants, including sulfur dioxide, nitrogen oxides and particulates; this directive will becomebecame effective in 2008. Automobile emission directives which control and limit exhaust emissions from cars and other motor vehicles. Under these directives, emission controls will continue to become more stringent over time. FromSince 2005, maximum sulfur levels for gasoline and diesel fuels arehave been 50 ppm and, frombeginning in 2009, a maximum sulfur content of 10 ppm will be mandatory throughout the EU. The directive, adopted in September 2003, implementing the Kyoto Protocol within the European Union by establishing a system for greenhouse gas emissions quotas. This system, which entered into effect in January 2005, requires the Member States of the European Union to prepare quotas for industrial activities, in particular the energy sector, and to deliver carbon dioxide emissions permits based on these quotas. | European Union by establishing a system for greenhouse gas emissions quotas. This system, which entered into effect in January 2005, requires the Member States of the European Union to prepare quotas for industrial activities, in particular the energy sector, and to deliver carbon dioxide emissions permits based on these quotas.
|
The Major Hazards Directive, which requires emergency planning, public disclosure of emergency plans, assessment of hazards, and effective emergency management systems. The Framework Directive on Waste Disposal is intended to ensure that waste is recovered or disposed of without endangering human health and without using processes or methods whichthat could unduly harm the environment. Numerous related directives regulate specific categories of waste. In November 2008, the Framework Directive on Waste Disposal was partially modified by the Directive on Waste 2008/98, which features more precise definitions and stronger provisions. This directive is expected to completely enter into force and replace the Framework Directive and certain other directives by 2010. Maritime oil spill directives, a number of which were passed in the wake of the Erika spill. Recent regulations require that tankers have double hulls and mandate improvements to navigation practices in the English Channel. Numerous water directives impose water quality standards based on the various uses of inland and coastal waters, including ground water, by setting limits on the discharges of many dangerous substances and by imposing information gathering and reporting requirements. Adopted and effective in 2003, a comprehensive framework water directive has begun progressively replacing the numerous existing directives with a comprehensive set of requirements, including additional regulation obligingregulations obligating member countries to classify all water courses according to their biological, chemical and ecological quality; and to completely ban the discharges of approximately 30thirty toxic substances by 2017. Numerous directives regulating the classification, labeling and packaging of chemical substances and their preparation as well as restricting and banning the use of certain chemical substances and products. The EU Member States, the European Commission is stilland the European Chemical Agency in the process of adopting a new system for Registration, Evaluation and Authorization of Chemicals (REACH) which will partially replace or complement the existing rules in this area. REACH is expected to require the registration of up to 100,000 chemicals, including intermediaries and polymers. Detailed economic studies are currently underway to evaluate the costs to the chemicals industry of implementing this new system. | Copenhagen are still in the process of implementing a new system for Registration, Evaluation and Authorization of Chemicals (REACH) which replaces or complements the existing rules in this area. REACH was adopted in June 2006 and will require the registration of up to 100,000 chemicals, including intermediaries and polymers. Detailed economic studies have shown that implementing this regulation is expected to involve significant costs and administrative burden. |
In March 2004, the European Union adopted a Directive on Environmental Liability. This directive was transposed into EU Member States have three years from the time of adoption to transpose the directive into theirState national legislation.legislations in 2007 and 2008, and in France in August 2008. The directive seeks to implement a strict liability approach for damage to biodiversity from high-risk operations. Citizens’ right to know about activities which potentially harm the environment is ensured through a 1990 directive regarding access to environmental information. In January 2003, this directive was replaced by a subsequent right-to-know directive which goes beyond the previous directive in setting the timescale in which information must be provided and imposing fines for non-compliance. The directive also increases public disclosure of emissions to the environment. A directiveDirectives implementing the Aarhus Convention concerning public information rights and certain public participation rights in a variety of activities affecting the environment waswere adopted in January and May 2003.2003, respectively.
In November 2008, the European Commission adopted an environmental protection directive which obliges EU Member States to provide for criminal penalties in respect of serious infringements of EC law. Member States must transpose this directive into their national legislation by December 26, 2010. In the United States, where TOTAL’s operations are less extensive than in Europe, itTOTAL is also subject to significant environmental and safety regulation. Of particular relevance to TOTAL’s lines of business are: The Comprehensive Environmental Response, Compensation, and Liability Act (also known as CERCLA or Superfund), under which waste generators, former and current site owners and operators, and certain other parties can be held jointly and severally liable for the entire cost of remediating abandoned, non-operating or other sites contaminated by spills or waste disposal regardless of fault or the amount of waste sent to a site. The U.S. Environmental Protection Agency has authority, under Superfund, to order responsible parties to clean up sites and may seek from responsible parties recovery of the government response costs and natural resource damages. Additionally, each state has separate laws similar to CERCLA and state environmental agencies have broad authority under these laws and under CERCLA to impose investigation and remediation obligations and liability for releases to the environment.
| • | | The Comprehensive Environmental Response, Compensation, and Liability Act (also known as CERCLA or Superfund), under which waste generators, former and current site owners and operators, and certain other parties can be held jointly and severally liable for the entire cost of remediating active, abandoned or non-operating sites contaminated by releases of hazardous substances regardless of fault or the amount of hazardous substances sent to a site. The U.S. Environmental Protection Agency has authority under Superfund to order responsible parties to clean up contaminated sites and may seek recovery of the government’s response costs from responsible parties. States have similar legal authority to compel site investigations and cleanups and to recover costs from responsible parties. The U.S. government and states may also sue responsible parties for injuries to natural resources (e.g., rivers and wetlands) arising from contamination. |
National and international maritime oil spill laws, regulations and conventions, including the Oil Pollution Act of 1990 which imposes significant oil spill prevention requirements, spill response planning obligations, ship design requirements (including in certain instances double hull requirements), operational restrictions and spill liability for tankers and barges transporting oil, offshore oil platform facilities and onshore terminals. | Pollution Act of 1990, which imposes significant oil spill prevention requirements, spill response planning obligations, ship design requirements (including in certain instances double hull requirements), operational restrictions and spill liability for tankers and barges transporting oil, offshore oil platform facilities and onshore terminals. |
The Clean Air Act and its regulations, which require, among other things,measures: stricter phased-in fuel specifications and sulphur reductions,reductions; enhanced emissions controls and monitoring at major sources of volatile organic compounds, nitrogen oxides, and other specific and hazardous air pollutants; stringent airpollutant emission limits, andlimits; construction and operating permits for major sources at chemical plants, refineries, marine and distribution terminals and other facilities; and risk management plans for the handling and storage of hazardous substances. The Clean Water Act, which regulates the discharge of wastewater and other pollutants from both onshore and offshore operations and, among other things,measures, requires industrial facilities to obtain permits for most surface water discharges, install control equipment and treatment systems, implement operational controls, and preventative measures, including spill prevention and control plans and practices to control stormwater runoff. The Resource Conservation and Recovery Act (RCRA), which regulates the generation, storage, handling, treatment, transportation and disposal of hazardous and non-hazardous wasteswaste and imposes corrective action requirements on regulated activities that mandate thefacilities requiring investigation and remediation of potentially contaminated areas at these facilities. Other significant U.S. environmental legislation includes the Toxic Substances Control Act, which regulates the development, testing, import, export and introduction of new chemical products into commerce and the Emergency Planning and Community Right-to-Know Act, which requires emergency planning and spill notification as well as public disclosure of chemical usage and emissions. In addition, the Occupational Safety and Health Act, which imposes workplace safety and health, training and extensive process safety standards to reduce the risks of chemical exposure and injury to employees, has a significant impact on U.S. operations due to the comprehensive nature of its regulations which directly affect numerous aspects of refinery and chemical plant operations. Environmental regulation of industrial activities in the U.S.United States is extensive at both the federal and subject to future changes. Instate levels. One area of particular increased concern over climate changefocus for the U.S. government is emissions of greenhouse gases (primarily carbon dioxide) and their effect on the partEarth’s climate. Although emissions of carbon dioxide from industrial processes are not currently regulated, it appears increasingly likely that the public,U.S. government officials and corporations may result in future mandatory carbon and other emissions restrictions. Certain U.S. states, including California, along with a number of cities and counties have enacted or arewill, in the processfuture, seek to impose restrictions on greenhouse gas emissions from industrial sources, institute a greenhouse gas cap and trade system for large industrial facilities, or otherwise regulate emissions of enacting mandatory greenhouse restrictions. Regulation atcarbon dioxide as a criteria pollutant under the federal level may occur in the future.Clean Air Act. Proceedings instituted by governmental authorities are pending or known to be contemplated against certain U.S.-based subsidiaries of TOTAL under applicable environmental laws whichthat could result in monetary sanctions in excess of $100,000. No individual proceeding is, nor are the proceedings as a group, expected to have a material adverse effect on TOTAL’s consolidated financial position or profitability. Risk evaluation Prior to developing their activities and then on a regular basis during the operations, business units evaluate the related industrial and environmental risks, taking into account the regulatory requirements of the countries where these activities are located. On sites with significant technological risks, analyses are performed for new developments, updated in case of planned significant modifications of existing equipment, and periodically re-evaluated. To harmonize these analyses and reinforce risk management, TOTAL has developed a group-wide methodology which is being implemented progressively throughout the sites it operates. In France, three pilotall the sites that meet the criteria of the European Union Seveso II directive are developing Risk Management Plans in application ofpursuant to the French law of July 30, 2003. TheseEach of these plans will implementintroduce various urbanizationurban planning measures to reduce risks to urban environments surrounding industrial sites. The texts implementing these aspects of the law of July 30, 2003 were published at the end of 2005 and during 2006. Similarly, environmental impact studies are done prior to any industrial development with a thorough initial site analysis, taking into account any special sensitivities and plans to prevent and reduce the impact of accidents. These studies also take into account the impact of the activities on the local population, based on a common methodology. In countries where prior authorization and supervision is required, the projects are not undertaken without informingthe authorization of the relevant authorities ofaccording to the studies.studies they are provided with. For new products, risk characterizations and evaluations are performed. Furthermore, life cycle analyses for related risks are performed on certain products to study all the stages of a product’s life cycle from its conception until the end of its existence.useful life. TOTAL’s entities actively monitor regulatory developments to comply with local and international rules and standards for the evaluation and management of industrial and environmental risks. The Group’s environmental contingencies and asset retirement obligations are describedaddressed in Note 19 to the Consolidated Financial Statements. Future expenses related to asset retirement obligations are accounted for in accordance with the principles described in paragraph Q of Note1Note 1 to the Consolidated Financial Statements. Risk management Risk evaluations lead to the establishment of management measures that are designed to prevent and decrease the environmental impacts, to minimize the risks of accidents and to limit their consequences.consequences and environmental impacts. These measures may be put into place throughconcern the equipment design itself, reinforcingthe reinforcement of safety devices, designsthe design of structures to be built and protectionsthe protection against the consequences of environmental risks.events. Risk evaluations may be accompanied, on a case by casecase-by-case basis, by an evaluation of the cost of risk control and impact reduction measures. TOTAL is working to minimize industrial and environmental risks inherent to its activities by putting in place performance procedures and quality, safety and environmental management systems, as well as by moving towards obtaining certification for or assessment of its management systems (including International Safety Rating System, ISO 14001, European Management and Audit Scheme), by performing strictdetailed inspections and audits, training staff and heightening awareness of all the parties involved, and by an active investment policy. More specifically, following up on the 2002-2005 plan, an action plan was defined for the 2006-2009 period. This plan is focused on two initiatives for improvement: reducing the frequency and seriousness of on-the-job accidents and managingstrengthening the management of industrial risks. The results related to reducing on-the-job accidents are in line with goals, with a significant decrease in the rate of accidents (with or without time-lost) per million hours worked by nearly 70%75% between the end of 2001 and the end of 2006.2008. In terms of industrial risks, this plan’s initiatives include specific organization and behavioral plans as well as plans to minimize risks at source and increase safety for people and equipment.equipment use. Several environmental action plans have been put in place in different activities of the Group covering periods throughup until 2012. These plans are designed to improve environmental performance, particularly regarding the use of natural resources, air and water pollution, waste production and treatment, and site decontamination. They also contain quantified objectives to reduce greenhouse gas emissions, water pollution and sulphur dioxide emissions and to improve energy efficiency. As part of its efforts to reduce greenhouse gases and combat climate change, in December 2006 the Group committed to reducing gas flaring at its Exploration & Production sites by 50% compared to 2005 volumes by 2012. TheBy the end of 2009, the Group also expects that 75% of its major sites will receiveintends to obtain ISO 14001 certification by 2007.for all of its sites that it considers particularly important to the environment (as of today, 80% of such sites are so certified). More than 250 of the Group’s sites worldwide are certified ISO 14001. These activities are monitored through periodic, coordinated reporting by all Group entities. Although theThe Group believes that, according to its current estimates, contingencies or liabilities related to health, safety and environmental concerns would not have a material impact on its consolidated financial situation, its cash flow or its income, dueincome. Due to the nature of such concerns, however, it is impossible to predict if in thewhether additional future these types of commitments or liabilities could have a material adverse effect on the Group’s activities.
Asbestos Like many other industrial groups, TOTAL is involved in claims related to occupational diseases caused by asbestos exposure. The circumstances described in these claims generally concern activities prior to the beginning of the 1980s, long before the complete banadoption of more comprehensive bans on the usenew installation of asbestosasbestos-containing products in most of the countries where the Group operates (January 1, 1997 in France). The Group’s various activities are not particularly likely to lead to significant exposure to asbestos relatedasbestos-related risks, since this material was generally not used in manufacturing processes, except in limited cases. The main potential sources of exposure are related to the use of certain insulating components in industrial equipment. These components are being gradually eliminated from the Group’s equipment through asbestos-elimination plans that have been underway for several years. However, considering the long period of time that may elapse before the harmful results of exposure to asbestos manifest themselvesarise (up to 40 years), we anticipateTOTAL anticipates that claims may be filed in the years to come. Asbestos relatedAsbestos-related issues have been subject to close monitoring in all branches of the Group. As of December 31, 2006,2008, the Group estimates that the ultimate cost of all asbestos relatedasbestos-related claims paid or pending is not likely to have a material adverse effect on the financial situation of the Group. Oil and gas exploration and production operations Oil and gas exploration and production require high levels of investment and are associated with particular risks and opportunities. These activities are subject to risks related specifically to the difficulties of exploring underground, to the characteristics of hydrocarbons as well as relatingand to the physical characteristics of an oil or gas field. Of risks related to oil and gas field. The first stage of exploration, involves geologic risks. risks are the most important. For example, exploratory wells may not result in the discovery of hydrocarbons, or in amounts that would be insufficient to allow for economic development. Even if an economic analysis of estimated hydrocarbon reserves justifies the development of a discovery, the reserves can prove lower than the estimates during the production process, thus adversely affecting the economic development. Almost all the exploration and production activities of TOTAL are accompanied by a high level of risk of loss of the invested capital.capital due to the risks related to economic or political factors detailed hereafter. It is impossible to guarantee that new resources of crude oil or of natural gas will be discovered in sufficient amounts to replace the reserves currently being developed, produced and sold to enable TOTAL to recover the capital it has invested. The development of oil and gas fields, the construction of facilities and the drilling of production or injection wells require advanced technology in order to extract and exploit fossil fuels with complex properties over several decades. The deployment of this technology in such a difficult environment makes cost projections uncertain. TOTAL’s activities can be limited, delayed or cancelled as a result of numerous factors, such as administrative delays, particularly in terms of the host states’ approval processes for development projects, shortages, late delivery of equipment and weather conditions, (the productionincluding the risk of four fields situatedhurricanes in the Gulf of Mexico were affected by hurricane damage, principally by Hurricane Ivan in September 2004 and, to a lesser degree, by Hurricane Katrina at the end of August 2005).Mexico. Some of these risks may also affect TOTAL’s projects and facilities further down the oil and gas chain. Economic or political factors The oil sector is subject to domestic regulations and the intervention of governments or state-owned companies in such areas as: the award of exploration and production interests; authorizations by governments or by a state-controlled partner, especially for development projects, annual programs or the selection of contractors or suppliers; the imposition of specific drilling obligations; environmental protection controls ;controls; control over the development and abandonment of a field causing restrictions on production; calculating the costs that may be recovered from the relevant authority and what expenditures are deductible from taxes; and possible, though exceptional, nationalization, expropriation or modificationreconsideration of contract rights. The oil industry is also subject to the payment of royalties and taxes, which may be high compared with those imposed with respect to other commercial activities and which may be subject to material modifications by the governments of certain countries. Substantial portions of TOTAL’s oil and gas reserves are located in certain countries which may be considered politically and economically unstable. These reserves and the related operations are subject to certain additional risks, including: the establishment of production and export limits; the compulsory renegotiation of contracts; the expropriation or nationalization of assets; risks relating to changes of local governments or resulting changes in business customs and practices; currency exchange restrictions; depreciation of assets due to the devaluation of local currencies or other measures taken by governments that might have a significant impact on the value of activities; and losses and impairment of operations due to armed conflicts, civil unrest or the actions of terrorist groups. TOTAL, like other major international oil companies, has a geographically diverse portfolio of reserves and operational sites, which allows it to conduct its business and financial affairs so as to reduce its exposure to such political and economic risks. However, there can be no assurance that such events will not adversely affect the Group. Geopolitical situation in the Middle East
In 2006, the Middle East represented 17% of the Group’s production of oil and gas and 7% of the Group’s operating income. The Group produces oil and gas in the United Arab Emirates, Iran, Oman, Qatar, Syria and Yemen. TOTAL cannot predict developments of the geopolitical situation in the Middle East and its potential consequences on the Group’s activities in this area.
Regulations concerning Iran and Sudan In September 2006, the U.S. legislation implementing sanctions against Iran and Libya (Iran(Iran and Libya Sanction Act,, referred to as ILSA)“ILSA”), was amended and extended until December 2011. Pursuant to this statute, which now concerns only Iran (Iran(Iran Sanctions Act,, referred to as “ISA”) upon receipt by the United States of information indicating potential violations,, the President of the United States is authorized to initiate an investigation into the possible imposition of sanctions (from a list that includes denial of financing by the U.S. Export-Import Bank and limitations on the amount of loans or credits available from U.S. financial institutions) against persons found, in particular, to have knowingly made investments of $20 million or more in any 12 month12-month period in the petroleum sector in Iran. In May 1998, the U.S. government waived the application of sanctions for TOTAL’s investment in the South Pars gas field in Iran. field. This waiver, which has not been modified since it was granted, does not address TOTAL’s other activities in Iran, although TOTAL has not been notified of any related sanctions. In November 1996, the Council of the European Union adopted Council Regulation No. 2271/96regulations which prohibitsprohibit TOTAL from complying with any requirement or prohibition based on or resulting directly or indirectly from certain enumerated legislation, including ILSA. It also prohibits TOTAL from extending its waiver for South Pars to other activities. In each of the years since the passage of ILSA (now ISA), until 2007, TOTAL has made investments in Iran (excluding South Pars) in excess of $20 million. TOTAL’s activities in Iran are currently limited mainly to the implementation of two buyback contracts signed between 1995 and 1999 for two permits on which the Group is no longer the operator. As a result, TOTAL’s involvement consists essentially in being reimbursed for its past investments. In 2006,2008, TOTAL’s average daily production in Iran amounted to 20was 8.8 kboe/d, approximately 1%0.4% of its average dailythe Group’s worldwide production. TOTAL expects to continuedoes not believe that its activities in Iran have a material impact on the Group’s results. In the future, TOTAL may decide to invest amounts significantly in excess of $20 million per year in Iran in the foreseeable future.country. TOTAL cannot predict interpretations of or the implementation policy of the U.S. government under ISA with respect to its current orpossible future activities in Iran. It is possible that the United States may determine that these or other activities constitute activity prohibited by ISA and will subject TOTAL to sanctions. TOTAL does not believe that enforcement of ISA, including the imposition of the maximum sanctions under the current applicable law and regulations would have a material negative effect on its results of operations or financial condition. France and the European Union have adopted measures, based on United Nations Security Council resolutions, that restrict the movement of certain individuals and goods to or from Iran as well as certain financial transactions with Iran, in each case when such individuals, goods or transactions are related to nuclear proliferation and weapons activities or likely to contribute to their development. As currently applicable, the Group believes that these measures do not cover TOTAL’s activities and projects in this country. TOTAL has no active business in Sudan. TOTAL has no oil or gas production in Sudan and, to date, has not made any significant investments or industrial investments there. TOTAL holds a 32.5% interest in Block B in southern Sudan through a 1980 Exploration and Production Sharing Agreement (EPSA). Operations were voluntarily suspended in 1985 because of escalating security concerns, but the company maintained its exploration rights. The EPSA was revised, effective December 21, 2004, and provided that the parties (the Government of Sudan and the consortium partners) would mutually agree upon a resumption date when the petroleum operations could be undertaken physically in the contract area. Such resumption date would mark the starting point of the Group’s work obligations as foreseen in the contract. A joint decision on the resumption date has not occurred yet. If TOTAL were to resume its activities in southern Sudan, it would do so in compliance with applicable national, European and international laws and regulations, as well as with the Group’s Code of Conduct and Ethics Charter. Within the Group’s scope of operations and authority, it is committed to upholding human rights and fundamental freedoms, including social, economic and cultural rights, and the rights and interests of local residents, minorities and any other vulnerable groups. In particular, the Group will study the situation with non-governmental organizations and stakeholders involved in southern Sudan and conduct socio-economic programs adapted to the needs of the local population. Significant programs were launched at the end of 2008 in the fields of access to potable water, social infrastructures and schools with two international non-governmental organizations present in the region. Certain U.S. states have adopted legislation requiring state pension funds to divest themselves of investments in any company with active business operations in Iran or Sudan. On December 31, 2007, the U.S. Congress adopted the Sudan Accountability and Divestment Act, which supports these state legislative initiatives. If TOTAL’s activities in Iran or Sudan were determined to fall within the prohibited scope of these laws, and TOTAL were to not qualify for exemptions provided by such laws, certain U.S. state pension funds holding interests in TOTAL may be required to sell their interests. If significant, such sales could have an adverse effect on TOTAL’s share price. Furthermore, the United States currently imposes economic sanctions, which are administrated by the U.S. Treasury Department’s Office of Foreign Assets Control and which apply to U.S. persons, with the objective of denying certain countries, including Iran, Syria and Sudan, the ability to support international terrorism and, additionally in the case of Iran and Syria, to pursue weapons of mass destruction and missile programs. TOTAL does not believe that these sanctions are applicable to any of its activities in these countries. On February 27, 2007, pursuant to resolution 1737 of the Security Council of the United Nations, dated December 23, 2006, the European Union adopted sanctions that restrict the travel of certain individuals associated with Iranian nuclear proliferation activities as well as restricting trade and financing related to these activities. Additionally, a new French decree entered into effect on February 8, 2007 to reinforce the monitoring of financial relations between France and Iran. In addition, the Security Council of the United Nations adopted resolution 1747 on March 24, 2007, which extends the scope of resolution 1737. The Group believes that these measures, under their current terms, are not applicable to TOTAL’s activities in Iran.
Geopolitical and economic situation in South America
In 2006, South America represented 10% of the Upstream segment’s oil and gas production and 5% of the Group’s operating income. The Group produces in Argentina, Bolivia, Colombia, Trinidad & Tobago, and Venezuela.
Circumstances related to the Group’s activities in Argentina, Bolivia and Venezuela are described in more detail above under “—Upstream”.
Competition The Group is subject to intense competition within the oil sector and between the oil sector and other sectors aiming to fulfill the energy needs of the industry and of individuals. TOTAL is subject to competition from other oil companies in the acquisition of assets and licenses for the exploration and production of oil and natural gas. Competition is particularly strong with respect to the acquisition of undeveloped resources of oil and natural gas, which are in great demand. Competition is also intense in the sale of manufactured products based on crude and refined oil. In this respect,regard, the mainmajor international competitors ofoil companies in competition with TOTAL are ExxonMobil, Royal Dutch Shell, BPChevron and Chevron. At the endBP. As of 2006,December 31, 2008, TOTAL ranked fourthfifth among these international oil companies in terms of market capitalizationcapitalization.(1). Insurance and risk management Organization TOTAL has its own insurance and reinsurance company, Omnium Insurance and Reinsurance Company (OIRC). OIRC is totally integrated into the Group’s insurance management and actsis used as a centralized global operations tool for covering the Group’s risks. It allows the Group to implement its worldwide insurance program notwithstandingin compliance with the varyingvarious regulatory environments in the range of countries where the Group is present.operates. CertainSome countries require the purchase of insurance from a local insurance company. When aIf the local insurer accepts to cover the subsidiary company of the Group is subject to these constraints and is able to obtainin compliance with its worldwide insurance from a local company meeting Group standards,program, OIRC attempts to obtainrequests a retrocession of the covered risks.risks from the local insurer. As a result, OIRC negotiates reinsurance contracts with the subsidiaries’ local insurance companies, which transfer almost allmost of
the risk (between 97.5% and 100%) to OIRC. When a local insurer covers the risks at a lower level than that defined by the Group, OIRC provides additional coverage in an attemptso as to standardize coverage Group-wide. Onthroughout the other hand, certain countries require insurance in excess of what the Group may deem necessary under Group-wide standards. In these cases, OIRC also provides the additional coverage necessary to satisfy these legal obligations and the Group does not need to turn to an outside insurer.Group. At the same time, OIRC negotiates a reinsurance program at the Group level with mutual insurance companies for the oil industry and commercial reinsurers. OIRC permits the Group to better manage price variations in the insurance market by taking on a greater or lesser amount of risk corresponding to the price trends in the insurance market. In 2006,2008, the net amount of risk retained by OIRC after reinsurance was $50 million50 M€ per propertyproperty/business interruption insurance incident.claim and 60 M€ per third party liability insurance claim. Risk and insurance management policy In this context, the Group risk and insurance management policy is to work with the relevant internal department of each subsidiary to: define scenarios of major disaster risks by analyzing those events whose consequences would be the most significant for third parties, for employees and for the Group;(estimated maximum loss); assess the potential financial impact on the Group in case these disasters should occur; implementhelp in implementing measures to limit the possibility such events occurprobability of the event and the scopeextent of damage in casethe occurrences of their occurrence;such events; and
manage the level of risk from such events that isto be either covered internally by the Group and that which isor to be transferred to the insurance market. Insurance policy The Group has worldwide tortthird party liability and property insurance coverage for all its subsidiaries. These programs are contracted with first-class insurers (or reinsurers and mutual insurance companies of the oil industry through OIRC). The amounts insured depend on the financial risks defined in the disaster scenarios discussed above and the coverage terms offered by the market (available capacities and price conditions). More specifically, for: Third Party Liabilityparty liability insurance: since the maximum financial risk cannot be evaluated usingby a systemicsystematic approach, the amounts insured are based on market conditions and industry practice, in particular, the oil industry. The insurance cap in 20062008 for general and product liability was $750$800 million. Property damages insurance:damage and business interruption: the amounts insured by sector and by site are based on estimated costs and reconstruction scenarios under the identified worst-case disasterestimated maximum loss scenarios and on insurance market conditions. The Group subscribed for business interruption coverage in 2008 for its main refining and petrochemical sites. For example, for the highest estimated riskrisks of the Group (the Alwyn field in the UK)(main European refineries), the insurance caplimit of indemnity was $1.1$1.4 billion in 2006.2008. Moreover, deductiblesDeductibles for materialproperty damages fluctuate between 0.1 M€ and 10 M€ depending on the level of risk, and are carriedborne by the subsidiary. For business interruption, they represent 60 days.
In 2006, as a result of less favorableOther insurance terms available on the market,contracts are bought by the Group did not renew its loss-of-operations coverage. However, in 2007 the Group was ableaddition to obtain thisproperty damage and third party liability coverage, mainly for its principal refiningcar fleets, credit insurance and petrochemical sites once again.employee benefits. These risks are entirely underwritten by outside insurance companies.
The above-described policy described above is given as an example of past practice over a certain period of time and cannot be considered to representas representative of future conditions. The Group’s insurance policy may be changed at any time depending on the market conditions, specific circumstances and on management’s assessment of the risks incurred risks and the adequacy of their coverage. The Group cannot guarantee that it will not suffer any uninsured loss. Organizational Structure TOTAL S.A. is the parent company of the TOTAL Group. As of December 31, 2006,2008, there were 718721 consolidated subsidiaries, of which 614622 were fully consolidated, 1312 were proportionately consolidated and 9187 were accounted for under the equity method. For a list of the Principal Subsidiariesprincipal subsidiaries of the Company, see Note 3335 to the Consolidated Financial Statements. Property, Plants and Equipment TOTAL has freehold and leasehold interests in numerous countries throughout the world, none of which is material to TOTAL. See “— Business Overview — Upstream” for a description of TOTAL’s reserves and sources of crude oil and natural gas. ITEM 4A. UNRESOLVED STAFF COMMENTS None. ITEM 5. OPERATING AND FINANCIAL REVIEW AND PROSPECTS Management’s Discussion and AnalysisThis section is the Company’s analysis of its financial performance and of significant trends that may affect its future performance. It should be read in conjunction with the Consolidated Financial Statements included elsewhere in this Annual Report. The Consolidated Financial Statements are prepared in accordance with International Financial Reporting Standards (IFRS) as issued by the IASB and IFRS as adopted by the European Union, which differ in certain respects from U.S. GAAP.Union.
For a description of such differences and a reconciliation of net income and shareholders’ equity to U.S. GAAP, see Note 34 to the Consolidated Financial Statements. This section contains forward-looking statements which are subject to risks and uncertainties. For a list of important factors that could cause actual results to differ materially from those expressed in the forward-looking statements, see “Cautionary Statement Concerning Forward-Looking Statements” on page v.
Overview
TOTAL’s operating results are generally affected by a variety of factors, including changes in crude oil and natural gas prices as well as refining and refiningmarketing margins, which are bothall generally denominatedexpressed in dollars, and in exchange rates, particularly the value of the euro againstcompared to the dollar. Higher crude oil and natural gas prices generally have a positive effect on the operating income of TOTAL, since its Upstream oil and gas business benefits from the resulting increase in revenues realized from production. Lower crude oil and natural gas prices generally have a corresponding negative effect. The effect of changes in crude oil prices on TOTAL’s Downstream activities depends upon the speed at which the prices of refined petroleum products adjust to reflect such changes. In the past several years, until the fourth quarter of 2008 when prices dropped sharply, TOTAL has benefited from a sharp increase in crude oil and natural gas prices, which have been offset in part by a significant weakening of the dollar relative to the euro (despite a more recent strengthening of the dollar) as TOTAL reports its results in euros. TOTAL’s operatingresults are also significantly affected by the costs of our activities, in particular related to exploration and production, and by the outcome of our strategic decisions with respect to cost reduction efforts in the current period of significant economic uncertainty. TOTAL’s results are also affected by general economic and political conditions as well asand changes in governmental laws and regulations.regulations, as well as by the impact of decisions by OPEC on oil and gas prices. For more information, see “Item 3. Key Information — Risk Factors” and “Item 4. Information on the Company — Other Matters”. Pursuant to IFRS,Following the spin-off of Arkema in May 2006, 2005 and 2004the 2006 income statement figures for the Group and the Chemicals segment with(with the exception of the Group’s net income,income), as well as the return on average capital employed (ROACE)(1) for the Chemicals segment, have been recalculated pursuant to IFRS to exclude contributions from the activities of Arkema to the Chemicals segment, which weresegment. The Arkema spun-off in May 2006. These activities are treated as
“discontinued “discontinued operations”, the results of which are presented on the corresponding line in the income statement.
2004-2006 results
In 2006, TOTAL’s operating income was 24,130 M€, stable compared to 24,169 M€ in 2005 and up from 17,026 M€ in 2004. In 2006, the positive impacts of higher hydrocarbon prices and, to a lesser extent, performance improvements in the Downstream and Chemicals segments were offset by the negative impact of prices on the Downstream segment’s inventory valuation (under the First-In, First-Out method in accordance with IFRS), lower refining margins, lower production volumes, portfolio changes and higher costs (including exploration costs). The 42% increase in operating income in 2005 compared to 2004 was mainly due to the positive impacts of higher hydrocarbon prices, higher European refining margins, generally more favorable market conditions for Chemicals and the lower negative impacts of restructuring and impairment charges on operating income in 2005 compared to 2004. Hurricanes in the Gulf of Mexico had a negative impact on operating income for all segments in 2005. The positive impact of ongoing self-help programs in 2005 offset the negative impacts of higher costs in the Upstream segment and strikes in France.
| (1) | ROACE = adjusted net operating income divided by the average capital employed. For more information on ROACE, see “—Results 2004-2006—2006-2008 — Business Segment Reporting” below and Note 2 to the Consolidated Financial Statements.Statements included elsewhere herein. |
2006-2008 results TOTAL’s net income (Group share) was 11,76810,590 M€ in 2006(1)2008 compared to 12,27313,181 M€ in 2005 and 10,868 M€ in 2004.2007. The 4%20% decrease in net income in 20062008 compared to 20052007 was mainly due tothe after taxnegative after-tax impact of prices on inventory valuation (-1.4(-3.8 B€), due to the sharp drop in oil prices in the last quarter of 2008. Other factors contributing to the variation in net income in 2008 compared to 2007 consisted mainly of: the weaker dollar (-0.8 B€); special items (-0.5 B€); higher Upstream costs (-0.5 B€); lower production (-0.5 B€); less favorable results from U.S. refining, mainly due to a less favorable business environment and hurricanes (-0.2 B€); a less favorable environment in the Chemicals business (-0.2 B€); the Group’s equity share of the amortization of intangibles related to the Sanofi-Aventis merger (-0.1 B€); and a decrease in income from equity affiliates in the Downstream segment, mainly due to losses incurred through TOTAL’s participation in Wepec, its affiliate for refining in China (-0.1 B€). These negative impacts were partially offset by the positive impacts of higher hydrocarbon prices (+3.5 B€) and a more favorable Downstream business environment (+0.6 B€). The 12% increase in TOTAL’s net income (Group share) in 2007 compared to 2006 was mainly due to the positive after-tax impact of prices on inventory valuation (+1.7 B€), the impactoverall more favorable environment (+0.6 B€), production growth in the Upstream segment (+0.6 B€) and growth and productivity plans in the Downstream and Chemicals segments (+0.3 B€), which were partially offset by the negative impacts of lower volumes andthe weaker dollar (-1.0 B€), higher costs (-0.8in the Upstream and Downstream segments (-0.4 B€), increased exploration expense (-0.3 B€) and the impacthigher net cost of changes in tax rates (-0.4net debt for the Group (-0.1 B€) which were only partially offset by the impacts of a more favorable environment (+1.5 B€), gains from the sale of certain non-strategic financial assets (+0.3 B€) and productivity gains (+0.3 B€). The 13% increase in net income in 2005 compared to 2004 was mainly due to the increase in operating income, which was partially offset bythe net negative difference in 2005 compared to 2004 of the impact of items related to TOTAL’s equity share of Sanofi-Aventisand a higher effective tax rate. ). The Group’s total expenditures(2)(1) in 2008 were 13,640 M€ compared to 11,722 M€ in 2007 and 11,852 M€ for 2006. Included in 2006 compared to 11,195the 2008 expenditures are 1,022 M€ of acquisitions reflecting mainly the acquisitions of Synenco in 2005,Canada and 8,904 MGoal in The Netherlands, the acquisition of a 60% stake in the Bemolanga permit in Madagascar and payments for new permits and contract extensions in Nigeria and Libya. Included in the 2007 expenditures are approximately 0.2 B€ in 2004.of acquisitions related primarily to new permits. In 2006, expenditures included approximately 0.8 B€ for acquisitions, principally Ichthys LNG and Tahiti, while expenditures in 2005 included 1.1 B€ in the Upstream segment for the acquisition of Deer Creek Energy Ltd.Tahiti. Total divestmentsDivestments in 20062008 amounted to 2,2782,585 M€ compared to 1,0881,556 M€ in 20052007 and 1,1922,278 M€ in 2004.2006. Divestments in 2008 included asset sales of 1,451 M€, consisting mainly of the sale of Sanofi-Aventis shares. The 2007
divestments included Upstream assets in Canada, the UK and Norway and Downstream assets in the UK, as well as the sale of shares representing 0.4% of Sanofi- Aventis in the fourth quarter. In 2006, divestments included the sale of Upstream assets in the United States and in France as well as the reimbursement of carried investments on Akpo in Nigeria and the sale of non-strategic financial assets. Divestments in 2005 included the sale of 1.85% of the Kashagan permit to KazMunayGas and the sale of TOTAL’s interest in Humber Power in the UK. In each of the three years, the main source of funding for expenditures was cash from operating activities. Outlook In the Upstream segment, TOTAL intends to pursuebenefits from the high-quality of its strategyportfolio. Production start-ups for several major projects planned for 2009 include Akpo in Nigeria, Yemen LNG and Qatargas II. In addition, engineering studies for the next wave of profitable organic growth with the objective of increasing hydrocarbon production by more than 5% per year on average over the period 2006 to 2010(3), including production growth of 6% in 2007(4). This growth is alsomajor projects that are expected to be particularly significantlaunched between 2009 and 2010 are ongoing, notably for Egina in Nigeria, Laggan Tormore in the Group’s LNG activities, which are expected to grow by 13% per year on average. TOTAL’s portfolio of projects offers strong visibility through 2010, dueUK North Sea, Shtokman in particular to the number of exploration successesRussia, Ichthys in recent yearsAustralia and to major newcertain heavy oil projects in LNGCanada. The Group seeks to maintain its technical costs at one of the lowest levels among the major oil and heavy oil. gas companies, which it considers one of its competitive advantages in a weaker oil market environment. In the Downstream segment, the Group intendsaddition, TOTAL is continuing with its efforts to upgrade its refineries by adding conversion and desulphurization projects and by implementing programs to modernize and improve the reliability of its units.facilities and to emphasize safety throughout its operations. In petrochemicals, TOTAL’s objective isthe Downstream and Chemicals segments, the Group will define the necessary changes needed to continueadapt its industrial assets to increase its polymers production, particularlynew trends in Asiamarket demand. At the same time, major construction projects are continuing, notably for the modernization of the Port Arthur refinery in the United States, the Jubail refinery project in Saudi Arabia and the Middle East, while improvingstart-up of the competitiveness of its operationsQatofin cracker in mature markets.Qatar. Implementing the Group’s growth strategy depends on a sustained investment program. The 20072009 budget for investmentscapital expenditures, which is comparable to the 2008 budget, is approximately 12.814 B€(5)(2), with 75% of which is intended forit allocated to the Upstream segment.
TOTAL is actively seeking to reduce the cost of its projects by reviewing contractual terms, technical plans and project timing. The net-debt-to-equity ratio(6)Group has implemented company-wide productivity plans to reduce costs and to lower breakeven points for the Group is targetedits operations. In an environment marked by significant economic weakness, TOTAL continues to remain in the range of 25%adhere to 30%. TOTAL intends to pursue a dynamic dividend policy, in line with its strategy for profitable growth overof strict financial discipline and is committed to taking the long term. Future dividends will, however, depend on the Company’s earnings,actions necessary to adapt and rebalance its industrial assets. TOTAL believes that a solid financial position and other factors(7). In addition to dividends, the Company expects to continue to buy back its shares using cash flow from operations that is available after paying the dividend and funding the investment program.
Highlights for 2007 are expected to include the ramp-up of production at the Dalia field in Angola and at the distillate hydrocracker at Normandy as well as the start-up of major Upstream projects such as Rosa in Angola and Dolphin in Qatar.
Since the beginning of 2007, the oil and gas market environment has remained generally favorable with oil and gas prices at relatively high levels and refining margins in Europe comparable to the average level of 2006.base should
56
| (1) | Net income under U.S. GAAP amounted to 11,400 M€ in 2006 compared to 11,597 M€ in 2005 and 7,221 M€ in 2004. For all periods presented, the difference in net income under IFRS and under U.S. GAAP reflected the difference in accounting treatment primarily of goodwill and purchase accounting related to Elf Aquitaine and Petrofina acquisitions and to the Sanofi-Aventis merger, derivative instruments and hedging activities, impairment of assets and employee benefits. |
(2) | Total expendituresExpenditures include intangible assets and property, plant and equipment additions; acquisitions of subsidiaries, net of cash acquired; investments in equity affiliates and other securities; and increases in non-current loans. |
(3)(2) | Based on a Brent price of $60/bIncluding net investments in 2007equity affiliates and $40/b thereafter. |
(4) | Excluding the effect of portfolio changes. |
(5) | Excludingnon-consolidated companies, excluding acquisitions, and based on $1.25/€1 = $1.30 for 2009.. |
(6) | This ratio comprises the sum of the Group’s current borrowings and bank overdrafts and its non-current debt, net of cash and cash equivalents and short-term investments, divided by the sum of shareholder’s equity, redeemable preferred shares issued by consolidated subsidiaries and minority interest after expected dividends. |
(7)
| The payment and amount of dividends are subject to the recommendation of the Board of Directors and resolution by the company’s shareholders. For more information, see “Item 8. Financial Information—Dividend Policy”.
|
allow the company to pursue a sustained investment program to prepare for the long term, while also maintaining good profitability, its dividend policy and a net-debt-to-equity ratio around 25-30%. In addition, the Company plans to continue to progressively divest its Sanofi-Aventis shares over the short to medium term to give the Group a certain amount of financial flexibility to adapt its financial resources to its growth and dividend strategies. Since the beginning of 2009, the price of Brent has traded around $45 per barrel. Additional production cuts announced by OPEC may better balance existing supply to the currently weakened market demand. Critical Accounting Policies
A summary of the Group’sGroup accounting policies is included in Note 1 to the Consolidated Financial Statements. Management believes that the application of these policies on a consistent basis enables the Group to report useful and reliable information about the Group’s financial condition and results of operations. The preparation of financial statements in accordance with IFRS requires management to make estimates and apply assumptions that affect the reported amounts of assets, liabilities and contingent liabilities at the date of preparation of the financial statements and reported income and expenses for the period. Management reviews these estimates and assumptions on an on-goingongoing basis, by reference to past experience and various other factors considered as reasonable which form the basis for assessing the book value of assets and liabilities. Actual results may differ significantly from these estimates, if different assumptions or circumstances apply. Lastly, where the accounting treatment of a specific transaction is not addressed by any accounting standards or interpretation, management applies its judgment to define and apply accounting policies that will lead to relevant and reliable information, so that the financial statements: give a true and fair view of the Group’s financial position, financial performance and cash flow;flows; reflect the substance of transactions; are prepared on a prudent basis; and are complete in all material aspects. The following summary provides further information about the critical accounting policies, which could have a significant impact foron the results of the Group andGroup. It should be read in conjunction with Note 1 to the Consolidated Financial Statements. The assessment of critical accounting policies below is not meant to be an all-inclusive discussion of the uncertainties ofin financial results that couldcan occur as a resultfrom the application of the applicationfull range of the Company’s accounting policies. Materially different financial results could occur uponin the application of differentother accounting policies. policies as well. Likewise, materially different results couldcan occur upon the adoption of new accounting standards promulgated by the various rule-making bodies. Successful efforts method of oil and gas accounting The Group follows the successful efforts method of accounting for its oil and gas activities. The Group’s oil and gas reserves are estimated by the Group’s petroleum engineers in accordance with industry standards and SEC regulations. In December 2008, the SEC published a revised set of rules for the estimation of reserves. These revised rules will be used for the 2009 year-end estimation of reserves, and have not been used in the determination of reserves for the year-end 2008. Proved oil and gas reserves are the estimated quantities of crude oil, natural gas and natural gas liquids which geological and engineering data demonstrate with reasonable certainty to be recoverable in future years from known reservoirs under existing economic and operating conditions. Accordingly, these estimates do not include probable or possible reserves. Estimated oil and gas reserves are based on available reservoir data and prices and costs in the accounting period during which the estimate is made and are subject to future revision. The Group reassesses its oil and gas reserves at least once a year on all its properties. Exploration leasehold acquisition costs are capitalized when acquired. During the exploration phase, management exercises judgment on the probability that prospects ultimately would partially or fully fail to find proved oil and gas reserves. OnBased on this basisjudgmental approach, a leasehold impairment charge may be determined.recorded. This position is assessed and adjusted throughout the contractual period of the leasehold based in particular on the results of exploratory activity and theany impairment may beis adjusted prospectively. When a discovery is made, exploratory drilling costs continue to be capitalized pending determination of whether potentially economic oil and gas reserves have been discovered by the drilling effort. The length of time necessary for this determination depends on the specific technical or economic difficulties in assessing the recoverability of the reserves. If a determination is made that the well did not encounter oil and gas in economically viable quantities, the well costs are expensed and are reported in exploration expense. Exploratory drilling costs are temporarily capitalized pending determination of whether the well has found proved reserves if both of the following conditions are met: the well has found a sufficient quantity of reserves to justify, if appropriate, its completion as a producing well, assuming that the required capital expenditure is made; and satisfactory progress toward ultimate development of the reserves is being achieved, with the Company making sufficient progress assessing the reserves and the economic and operating viability of the project. The Company evaluates the progress made on the basis of regular project reviews which take into account the following factors: First, if additional exploratory drilling or other exploratory activities (such as seismic work or other significant studies) are either underway or firmly planned, the Company deems there to beis satisfactory progress. For these purposes, exploratory activities are considered firmly planned only if they are included in the Company’s three-year exploration plan/budget. At December 31, 2006, the Company had capitalized 342 M€ of exploratory drilling costs on this basis. In cases where exploratory activity has been completed, the evaluation of satisfactory progress takes into account indicators such as the fact that costs for development studies are incurred in the current period, or that governmental or other third-party authorizations are pending or that the availability of capacity on an existing transport or processing facility awaits confirmation. At December 31, 2006, exploratory drilling costs capitalized on this basis amounted to 77 M€ and mainly related to three projects. See paragraph N of Note 34 to the Consolidated Financial Statements for additional information.
The successful efforts method, among other things, requires that the capitalized costs for proved oil and gas properties (which include the costs of drilling successful wells) be amortized on the basis of reserves that are produced in a period as a percentage of the total estimated proved reserves. The impact of changes in estimated proved reserves areis dealt with prospectively by amortizing the remaining book value of the asset over the expected future production. If proved reserve estimates are revised downward, earnings could be affected by higher depreciation expense or an immediate write-down of the property’s book value. Conversely, if the oil and gas quantities were revised upwards, future per-barrel depreciation and depletion expense would be lower. Valuation of long-lived assets In addition to oil and gas assets that could become impaired under the application of successful efforts accounting, other assets could become impaired and require write-down if circumstances warrant. Conditions that could cause an asset to become impaired include lower-than-forecasted commodity sales prices, changes in the Group’s business plans or a significant adverse change in the local or national business climate. The amount of an impairment charge would be based on estimates of an asset’s fair value compared with its book value. The fair value usually is usually based on the present values of expected future cash flows using assumptions commensurate with the risks involved in the asset group. The expected future cash flows used for impairment reviews are based on judgmental assessments of future production volumes, prices and costs, considering information available at the date of review. Asset retirement obligations and environmental remediation When legal and contractual obligations require it, the Group, upon application of International Accounting Standard (IAS) 37 and IAS 16, records provisions for the future decommissioning of production facilities at the end of their economic lives. Management makes judgments and estimates in recording liabilities. Most of these removal obligations are many years in the future and the precise requirements that will have to be met when the removal event actually occurs are uncertain. Asset removal technologies and costs are constantly changing, as well as political, environmental, safety and public expectations. The Group also makes judgments and estimates in recording costs and establishing provisions for environmental clean-up and remediation costs which are based on current information on costs and expected plans for remediation. For environmental provisions, actual costs can differ from estimates because of changes in laws and regulations, public expectations, discovery and analysis of site conditions and changes in clean-up technology. Pensions and post-retirement benefits Accounting for pensions and other post-retirement benefits involves judgments about uncertain events, including estimated retirement dates, salary levels at retirement, mortality rates, rates of return on plan assets, determination of discount rates for measuring plan obligations, healthcare cost-trend rates and rates of utilization of healthcare services by retirees. These assumptions are based on the environment in each country. The assumptions used are reviewed at the end of each year and may vary from year-to-year, based on the evolution of the situation, which will affect future results of operations. Any differences between these assumptions and the actual outcome will also impact future results of operations. The significant assumptions used to account for pensions and other post-retirement benefits are determined as follows: Discount and inflation rates reflect the rates at which the benefits could be effectively settled, taking into account the duration of the obligation. Indications used in selecting the discount rate include rates of annuity contracts and rates of return on high-quality fixed-income investments (such as government bonds). The inflation rates reflect market conditions observed on a country-by-country basis. Salary increase assumptions (when relevant) are determined by each entity. They reflect an estimate of the actual future salary levels of the individual employees involved, including future changes attributed to general price levels (consistent with inflation rate assumptions), productivity, seniority, promotion and other factors. Healthcare cost trend assumptions (when relevant) reflect an estimate of the actual future changes in the cost of the healthcare related benefits provided to the plan participants and are based on past and current healthcare cost trends including healthcare inflation, changes in healthcare utilization, and changes in health status of the participants. Demographic assumptions such as mortality, disability and turnover reflect the best estimate of these future events for the individual employees involved, based principally on available actuarial data. Determination of expected rates of return on assets is made through compound averaging. For each plan, there are taken into account the distribution of investments among bonds, equities and cash and the expected rates of return on bonds, equities and cash.cash are taken into account. A weighted-average rate is then calculated. The effect pensions had on results of operations, cash flow and liquidity is fully set out in Note 18 to the Consolidated Financial Statements. Net periodicemployee benefit chargeexpense in 20062008 amounted to 297232 M€ and the Company’s contributions to pension plans were 617 M€. In 2006, the Group covered certain employee pension benefit plans through insurance companies for an amount of 269855 M€. Differences between projected and actual costs and between the projected return and the actual return on plan assets routinely occur and are called actuarial gains and losses. The Group applies the corridor method to amortize its actuarial losses and gains. This method amortizes the net cumulative actuarial gains and losses that exceed 10% of the greater of (i) the present value of the defined benefit obligation, and (ii) the fair value of plan assets, over the average expected remaining working lives of the employees participating in the plan. The unrecognized actuarial losses of pension benefits as of December 31, 20062008, were 423953 M€ compared to 777160 M€ as of December 31, 2005.for 2007. The decreaseincrease in unrecognized actuarial losses wasis explained by actuarial losses due to a decrease in the value of plan assets that were partially offset by an increase in discount rates in 2006 and was partially offset by actuarial gains due to an increase in the value of plan assets.2008. As explained above, pension accounting principles allow that such actuarial losses be deferred and amortized over future periods, in the Company’s case a period of 15 years. While the Company has not completed its calculations for 2007,2009, it is considering an increaseda decreased weighted-average expected return on pension plan assets for the year (6.26%(6.13% compared to the 20062008 rate of 6.14%6.60%), mainly due to a change in the pension assets allocation as of December 31, 2008, that was partially offset by an increase in discount rates in 2006.2008. The Company does not believe that it will be significantly modifying its discount rate in the near future. The Company’s estimates indicate that a 1% increase or decrease in the expected rate of return on pension plan assets would have caused a 6366 M€ decrease or increase, respectively, in the 20062008 net periodic pension cost. The estimated impact on the benefit chargeexpense of the amortization of the unrecognized actuarial losses of 423953 M€ as of December 31, 2006,2008, is 1699 M€ for 2007,2009, compared to 2620 M€ in 2006.2008. Income tax computation The computation of the Group’s income tax expense requires the interpretation of complex tax laws and regulations in many taxing jurisdictions around the world, the determination of expected outcomes from pending litigation, and the assessment of audit findings that are performed by numerous taxing authorities. Actual income tax expense may differ from management’s estimates. Results 2004-20062006-2008
| | | | | | | | As of and for the year ended December 31, (M€, except per share data) | | 2006 | | 2005 | | 2004 | Sales(a) | | 153,802 | | 137,607 | | 116,842 | Operating Income(a) | | 24,130 | | 24,169 | | 17,026 | Net income (Group share) | | 11,768 | | 12,273 | | 10,868 | Diluted earnings per share(b) | | 5.09 | | 5.20 | | 4.48 | Total expenditures | | 11,852 | | 11,195 | | 8,904 | Total divestments | | 2,278 | | 1,088 | | 1,192 | Cash flow from operating activities | | 16,061 | | 14,669 | | 14,662 |
| | | | | | | | As of and for the year ended December 31, (M€, except per share data) | | 2008 | | 2007 | | 2006 | Sales(a) | | 179,976 | | 158,752 | | 153,802 | Net income (Group share) | | 10,590 | | 13,181 | | 11,768 | Diluted earnings per share | | 4.71 | | 5.80 | | 5.09 | Investments | | 13,640 | | 11,722 | | 11,852 | Divestments | | 2,585 | | 1,556 | | 2,278 | Cash flow from operating activities | | 18,669 | | 17,686 | | 16,061 |
| (a) | Pursuant to IFRS 5, excludes contributions from Arkema. |
(b) | Recalculated to reflect the four-for-one stock split on May 18,Arkema in 2006. |
Group Results 20062008 vs. 20052007 Unprecedented volatility marked the 2008 oil market environment. In the first part of the year, the price of Brent crude climbed rapidly toward $150/b. In the second part of the year, the global economy suffered a sharp slowdown, which contributed to driving Brent down to a new low for the year of $35/b in December. The average Brent oil price in 2008 increased by 34% to $97.30/b from $72.40/b in 2007, and its price averaged $55/b for the fourth quarter of 2008. Refining margins also increased in 2008, with the European refining margin indicator used by TOTAL’s management (TRCV) up 16% to $37.80/t from $32.50/t in 2007. The Chemicals environment weakened in 2008 compared to 2007, turning sharply negative at year-end due to decreasing demand resulting from the global economic slowdown. While the dollar lost 7% of its value against the euro during 2008, with the average dollar/euro exchange rate being $1.47/€ in 2008 compared to $1.37/€ in 2007, it did gain 14% against the euro during the fourth quarter. TOTAL’s consolidated sales increased by 13% to 180.0 B€ in 2008 from 158.8 B€ in 2007. TOTAL’s net income (Group share) was 10,590 M€ in 2008 compared to 13,181 M€ in 2007. The 20% decrease in net income in 2008 compared to 2007 was mainly due to the negative after-tax impact of prices on inventory valuation (-3.8 B€), due to the sharp drop in oil prices in the last quarter of 2008. Other factors contributing to the decrease in net income in 2008 compared to 2007 consisted mainly of: the weaker dollar (-0.8 B€); special items (-0.5 B€); higher Upstream costs (-0.5 B€); lower production (-0.5 B€); less favorable results from U.S. refining, mainly due to a less favorable business environment and hurricanes (-0.2 B€); a less favorable environment in the Chemicals business (-0.2 B€); the Group’s equity share of the amortization of intangibles related to the Sanofi-Aventis merger (-0.1 B€); and a decrease in income from equity affiliates in the Downstream segment, mainly due to losses incurred through TOTAL’s participation in Wepec, its affiliate for refining in China (-0.1 B€). These negative impacts were partially offset by the positive impacts of higher hydrocarbon prices (+3.5 B€) and a more favorable Downstream business environment (+0.6 B€). The effective tax rate for the Group was 56.3% in 2008 compared to 55.6% in 2007 due primarily to the relatively higher comparative weight of the Upstream segment in the Group’s results. In 2008, the Group bought back 27.6 million of its shares(1) for 1,339 M€. The number of fully-diluted shares at December 31, 2008, was 2,235 million compared to 2,265 million at December 31, 2007. Diluted earnings per share, based on 2,247 million fully-diluted weighted-average shares, decreased by 19% to€4.71 in 2008 from€5.80 in 2007. Group Results 2007 vs. 2006 The average oil market environment in 20062007 was marked by higher oil prices, with the average Brent oil price increasing 19%11% to $65.10/$72.40/b from $54.50/$65.10/b in 2005, while refining2006. Refining margins decreased,also increased in 2007, with the European refining marginsmargin indicator used by TOTAL’s management (TRCV) down 31%up 12% to $32.50/t from $28.90/t in 2006 from $41.60/t in 2005.2006. The environment for Chemicals activities was generally comparable overweakened in 2007 compared to 2006, essentially due to the two years.negative impact on petrochemical margins from the rapid increase in the price of naphtha late in 2007. The average dollar/euro exchange rate was $1.37/€ in 2007 compared to $1.26/€ in 2006, compared to $1.24/€an 8% decline in 2005.the value of the dollar. TOTAL’s consolidated sales increased by 12%3% to 158.8 B€ in 2007 from 153.8 B€ in 2006 from 137.6 B€ in 2005.2006. In 2006, TOTAL’s operating income was 24,130 M€, stable compared to 24,169 M€ in 2005. The positive impacts of higher hydrocarbon prices and, to a lesser extent, performance improvements in the Downstream and Chemicals segments were offset by the negative impacts of prices on the Downstream segment’s inventory valuation (under the First-In, First-Out method in accordance with IFRS), lower refining margins, lower production volumes, portfolio changes and higher costs.
| (1) | Includes 2.8 million shares purchased to cover restricted share grants pursuant to the decision of the Board on September 9, 2008. |
TOTAL’s net income (Group share) was 13,181 M€ in 2007 compared to 11,768 M€ compared to 12,273 M€in 2005.2006. The 4% decrease12% increase in net income in 20062007 compared to 20052006 was mainly due to the after tax impactpositive after-tax impacts of prices on inventory valuation (-1.4(+1.7 B€), the impact of lower volumes and higher costs (-0.8overall more favorable environment (+0.6 B€), growth in the Upstream segment (+0.6 B€) and growth and productivity plans in the impact of changes in tax rates (-0.4Downstream and Chemicals segments (+0.3 B€), which were only partially offset by the negative impacts of a more favorable environment (+1.5the weaker dollar (-1.0 B€), gains fromhigher costs in the sale of certain non-strategic financial assets (+0.3Upstream and Downstream segments (-0.4 B€), increased exploration expense (-0.3 B€) and productivity gains (+0.3the higher net cost of net debt for the Group (-0.1 B€). ). The effective tax rate for the Group was 56% in 20062007, stable compared to 53%56% in 2005.2006. The higher rate was mainly due to the increase in UK petroleum taxes, higher hydrocarbon prices, and the larger share of the more heavily taxed Upstream segment had a comparable relative weight in the results.results of both years. In 2006,2007, the Group bought back 75.932.4 million of its shares(1)(2) for 3,9751,787 M€. The number of fully-diluted shares at December 31, 20062007, was 2,2852,265 million compared to 2,3442,285 million at December 31, 2005.2006. Diluted earnings per share, based on 2,3122,274 million fully-diluted weighted-average shares, decreased 2%increased by 14% to€5.80 in 2007 from€5.09 in 2006, from€5.20(2) in 2005, lessslightly greater than the decreaseincrease in net income due to the accretive effect of the share buybacks. Group Results 2005 vs. 2004
The 2005 oil market environment was more favorable than in 2004. The average Brent oil price increased by 42% to $54.5/b in 2005 from $38.3/b in 2004 and the TRCV refining margins indicator rose sharply to $41.60/t from $32.80/t in 2004. The average dollar/euro exchange rate was unchanged at $1.24/€ . The environment for Chemicals activities was generally more favorable in 2005 than in 2004.
TOTAL’s consolidated sales increased by 18% to 137.6 B€ in 2005 from 116.8 B€ in 2004.
Operating income increased by 42% to 24,169 M€ in 2005 from 17,026 M€ in 2004. The 42% increase in operating income reflects the positive impact of higher hydrocarbon prices, the stronger refining environment and improved market conditions for Chemicals activities.
60
(1)
| Excludes 2.3 million shares reserved for restricted share grants pursuant to the decision of the Board on July 18, 2006.
|
(2) | Recalculated to reflect the four-for-one stock split on May 18, 2006. |
Productivity improvements in the Downstream and Chemicals segments were more than offset by less favorable conditions for marketing activities, the impact of hurricanes in the Gulf of Mexico on the Group’s activities, higher costs in the Upstream segment and the impact of strikes in France. Asset impairment and restructuring charges and provisions, mainly in the Chemicals segment, had a negative impact on operating income of 90 M€ in 2005. In 2004, asset impairment and restructuring charges and provisions had a negative impact of 328 M€ on operating income.
TOTAL’s net income (Group share) was 12,273 M€ in 2005 compared with 10,868 M€ in 2004. The 13% increase in net income in 2005 compared to 2004 was mainly due to the increase in operating income, which was partially offset by the net negative difference between the 542 M€ negative impact on net income in 2005 of TOTAL’s equity share of the amortization of intangibles related to the Sanofi-Aventis merger and of special items recorded by Sanofi-Aventis and the positive impact of 2,286 M€ on net income in 2004 due to a gain on dilution related to the Sanofi-Aventis merger (after taking into account TOTAL’s equity share of the amortization of intangible assets also related to the Sanofi-Aventis merger), as well as the negative impact of the higher effective tax rate in 2005.
Over the course of 2005, the Group bought back 73.2(1) million of its shares, or nearly 3% of its share capital, for 3,485 M€. Diluted earnings per share increased to€5.20(a) in 2005 from€4.48(a) in 2004(a), an increase of 16%, which was higher than the increase in net income due to the accretive effect of share buybacks.
Business Segment Reporting The financial information for each business segment is reported on the same basis as that used internally by the chief operating decision maker in assessing segment performance and the allocation of segment resources. Due to their particular nature or significance, certain transactions qualified as “special items” are excluded from the business segment figures. In general, special items relate to transactions that are significant, infrequent or unusual. However, in certain instances, certain transactions such as restructuring costs or assets disposals, which are not considered to be representative of the normal course of business, may be qualified as special items although they may have occurred in prior years or are likely to recur in following years. In accordance with IAS 2, the Group values inventories of petroleum products in the financial statements according to the FIFO (First-In, First-Out) method and other inventories using the weighted-average cost method. TheUnder the FIFO method, the cost of inventory is based on the historic cost of acquisition or manufacture rather than the current replacement cost. In volatile energy markets, this can have a significant distorting effect on the reported income. Accordingly, the adjusted results of the Downstream segment and Chemicals segment are presented according to the replacement cost method in order to facilitate the comparability of the Group’s results with those of its competitors, mainly North American.in the United States, and to help illustrate the operating performance of these segments excluding the impact of oil price changes on the replacement of inventories. In the replacement cost method, which approximates the LIFO (Last-In, First-Out) method, the variation of inventory value in the income statement is determined by the average prices of the period rather than the historical value. The inventory valuation effect is the difference between the results according to the FIFO method and the replacement cost method. The adjusted business segment results (adjusted operating income and adjusted net operating income) are defined as replacement cost results, adjusted for special items. For further information on the adjustments affecting operating income on a segment-by-segment basis, and for a reconciliation of segment figures to figures reported in the Company’s audited consolidated financial statements, see Note 4 to the Consolidated Financial Statements. In addition, the Group measures performance at the segment level on the basis of net operating income and adjusted net operating income. Net operating income comprises operating income atof the relevant segment level after deducting the amortization and the depreciation of intangible assets other than leasehold rights, translation adjustments and gains or losses on the sale of assets, as well as all other income and expenses related to capital employed (dividends from non-consolidated companies, equity in income infrom equity affiliates, capitalized interest expenses), and after income taxes applicable to the above. The income and expenses not included in net operating income which are included in net income are only interest expenses related to long-term liabilities net of interest earned on cash and cash equivalents, after applicable income taxes (net cost of net debt and minority interests). Adjusted net operating income excludes the effect of the adjustments (special items and the inventory valuation effect) described above. For further discussion on the calculation of net operating income and the calculation of ROACE, see Note 2 to the Consolidated Financial Statements.
| (1) | Amounts recalculatedIncludes 2.4 million shares purchased to reflectcover restricted share grants pursuant to the four-for-one stock splitdecision of the Board on May 18, 2006.July 17, 2007. |
Upstream results | | | | | | | | | | | (M€) | | 2006 | | | 2005 | | | 2004 | | Non-Group sales | | 20,782 | | | 20,888 | | | 15,037 | | Operating income | | 20,307 | | | 18,421 | | | 12,844 | | Equity in income (loss) of affiliates and other items | | 1,211 | | | 587 | | | 148 | | Tax on net operating income | | (12,764 | ) | | (10,979 | ) | | (7,281 | ) | Net operating income | | 8,754 | | | 8,029 | | | 5,711 | | Adjustments affecting net operating income | | (45 | ) | | — | | | 148 | | Adjusted net operating income(a) | | 8,709 | | | 8,029 | | | 5,859 | | Total expenditures | | 9,001 | | | 8,111 | | | 6,202 | | Total divestments | | 1,458 | | | 692 | | | 637 | | | | | | ROACE | | 35% | | | 40% | | | 36% | |
| | | | | | | | | | | (M€) | | 2008 | | | 2007 | | | 2006 | | Non-Group sales | | 24,256 | | | 19,706 | | | 20,782 | | Operating income(a) | | 23,468 | | | 19,503 | | | 20,307 | | Equity in income (loss) of affiliates and other items | | 1,541 | | | 1,330 | | | 1,211 | | Tax on net operating income | | (14,563 | ) | | (11,996 | ) | | (12,764 | ) | Net operating income(a) | | 10,446 | | | 8,837 | | | 8,754 | | Adjustments affecting net operating income | | 278 | | | 12 | | | (45 | ) | Adjusted net operating income(b) | | 10,724 | | | 8,849 | | | 8,709 | | Investments | | 10,017 | | | 8,882 | | | 9,001 | | Divestments | | 1,130 | | | 751 | | | 1,458 | | | | | | ROACE | | 36% | | | 34% | | | 35% | |
| (a) | For the definition of operating income and net operating income, see Note 2 to the Consolidated Financial Statements. |
| (b) | Adjusted for special items. See Notes 2 and 4 to the Consolidated Financial Statements. |
20062008 vs. 20052007
Upstream segment sales (excluding sales to other segments) were 20,782up 23% to 24,256 M€ in 20062008 compared to 20,88819,706 M€ in 2005. The increase2007, reflecting higher average hydrocarbon prices, which more than offset the impacts of the decrease of the dollar compared to the euro and a decrease in production. TOTAL’s average liquids price realization in 2008 increased 32% to $61.80/$91.1/b from $68.9/b in 2006 from $51.00/b in 2005 was globally2007, in line with the increase in the average Brent price of Brent oil, which was $65.10/$97.3/b in 20062008 compared to $54.50/$72.4/b in 2005.2007. TOTAL’s average natural gas price realization increased 37% to $5.91/$7.38/MBtu in 20062008 from $4.77/Mbtu$5.40/MBtu in 2005, comparatively greater than the percentage increase for liquids price realizations due to the delayed impact of oil prices on gas price formulas under long-term contracts, mainly in Europe, and strong LNG prices in Asia.2007. For 2006,2008, adjusted net operating income for the Upstream segment was 8,709increased 21% to 10,724 M€ compared to 8,0298,849 M€ in 2005, an increase of 8%. The contribution of income from equity affiliates rose sharply, reflecting mainly the growth in LNG activities, particularly the larger contribution from trains 4 and 5 at Nigeria LNG.2007. The increase of 0.7 B€ compared to 2005in adjusted net operating income was mainly due to the 2positive impacts of the price of hydrocarbons (+3.5 B€ positive impact of higher hydrocarbon prices,) partially offset by the negative impactimpacts of lower production volumes and effects of portfolio changes,(approximately 0.5the weaker dollar (-0.6 B€), lower production (-0.5 B€) and higher production costs (approximately 0.4 B€, including 0.2 B€ for exploration) and the impact ofchanges in tax terms (approximately 0.4(-0.5 B€). The exclusion of special items (which in 20062008 comprised capital gainsprincipally an asset impairment of 171 M€ on asset disposals)the Joslyn project and the net impact of contract renegotiations of 106 M€) had a negativepositive impact of 45278 M€ on adjusted net operating income for the Upstream segment in 2006.There were no adjustments affecting Upstream net operating income2008 compared to a positive impact of 12 M€ in 2005.2007 (comprised principally of asset impairments of 93 M€ largely offset by capital gains of 89 M€). ROACE for the Upstream segment was 35%increased to 35.9% in 2006 compared to 40%2008 from 33.6% in 2005.2007. The declineincrease was mainly due to an increase inadjusted net operating income having increased more than the level ofcapital employed for work-in-progress assets, which reflects the sustainedaverage level of investments being madecapital employed, which was principally due to fuel future growth.higher hydrocarbon prices. In 2006,2008, Upstream net operating income amounted to 8,75410,446 M€ (for 2005, 8,0292007, 8,837 M€) from operating income of 20,30723,468 M€ (for 2005, 18,4212007, 19,503 M€), with the difference resulting primarily from taxes on net operating income of 12,76414,563 M€ (for 2005, 10,979(11,996 M€) in 2007), partially offset by income fromequityfrom equity affiliates and other items of 1,2111,541 M€ (for 2005, 587(1,330 M€). The increase in taxes in 2006 occured primarily in the UK and Venezuela.2007). Oil and gas production in 2006 was 2,3562008 averaged 2,341 kboe/d compared to 2,4892,391 kboe/d in 2005, a2007. This 2% decrease of 5%was due principally to the negative impacts of the price effect (-2%)(1) (-2%), unscheduled shutdowns of production(-2.5%, mainly on the Elgin Franklin field in February, the Bruce and Alwyn fields in the Niger Delta area becausesummer and the Al Jurf field from April to the end of security issues (-2%)December 2008, as described in Item 4 of this Annual Report) and changes in the Group’s perimeterportfolio (-1%). Excluding these items, partially offset by the positive impact of new field start-upswas offset byunderlying production growth (+3.5%, primarily from production ramp-ups and start-ups of major TOTAL-operated projects, including Dolphin, Rosa, Jura and Dalia, net of the normal decline on existing fields). Underlying production declines at mature fieldsgrowth in 2008, excluding the price effect and shutdownschanges in the North Seaportfolio, was +1%. The Upstream segment’sGroup’s proved reserves at December 31, 2006 increased slightly2008, remained steady at 10,458 Mboe compared to 11,12010,449 Mboe from 11,106 at December 31, 2005.2007. At current ratesthe 2008 average rate of production, these reserves represent approximately 12 years of production.
See “Item 4. Information on the Company — Exploration & Production — Reserves” for a table showing changes in proved reserves by year and “Supplemental Oil and Gas Information (Unaudited)” contained elsewhere herein for additional information on proved reserves, including tables showing changes in proved reserves by region. 62
(1) | The “price effect” refers to the impact of hydrocarbon prices on entitlement volumes from production sharing and buyback contracts. For example, as the price of oil or gas increases above certain pre-determined levels, TOTAL’s share of production normally decreases. |
13Total expenditures of the Upstream segment increased by 13% to 10,017 M€ in 2008 from 8,882 M€ in 2007. In 2008, expenditures mainly included the following projects: Kashagan in Kazakhstan; Akpo, Usan and OML 58 in Nigeria; Pazflor, Angola LNG and Tombua Landana in Angola; Ekofisk in Norway; the Mahakam zone in Indonesia; the Alwyn zone in the United Kingdom; Moho Bilondo in the Republic of Congo and Anguille in Gabon.
2007 vs. 2006 Upstream segment sales (excluding sales to other segments) were down 5% to 19,706 M€ in 2007 compared to 20,782 M€ in 2006, reflecting the impact of the decrease of the dollar compared to the euro, which more than offset the impacts of the increase in production and higher average hydrocarbon prices. TOTAL’s average liquids price realization in 2007 increased 11% to $68.9/b from $61.80/b in 2006, in line with the increase in the average Brent price of oil, which was $72.4/b in 2007 compared to $65.10/b in 2006. TOTAL’s average gas price realization decreased 9% to $5.40/MBtu from $5.91/MBtu in 2006 due to weakness in the UK spot price as well as the ramp-up in production from the Dolphin project in the second half of 2007. For 2007, adjusted net operating income for the Upstream segment increased 2% to 8,849 M€ compared to 8,709 M€ in 2006. The increase in adjusted net operating income was mainly due to the positive impacts of the more favorable environment (+0.75 B€) and growth (+0.6 B€) which were for the most part offset by the negative impacts of the weaker dollar (-0.65 B€), higher production costs (-0.3 B€ ) and increased exploration expense (-0.25 B€). The exclusion of special items (which in 2007 comprised principally asset impairments of 93 M€ largely offset by capital gains of 89 M€) had a positive impact of 12 M€ on adjusted net operating income for the Upstream segment in 2007 and a negative impact of 45 M€ in 2006 (comprised of capital gains on asset disposals). ROACE for the Upstream segment was down slightly to 34% in 2007 from 35% in 2006 because the average level of capital employed increased slightly more than adjusted net operating income as a result of the increased investment program to support future growth. In 2007, Upstream net operating income amounted to 8,837 M€ (for 2006, 8,754 M€) from operating income of 19,503 M€ (for 2006, 20,307 M€), with the difference resulting primarily from taxes on net operating income of 11,996 M€ (12,764 M€ in 2006), partially offset by income from equity affiliates and other items of 1,330 M€ (1,211 M€ in 2006). The decrease in taxes in 2007 was primarily due to a relative increase in the share of the Group’s production in countries with lower tax rates. Oil and gas production in 2007 averaged 2,391 kboe/d compared to 2,356 kboe/d in 2006. This 1.5% increase was due to the positive impact of underlying production growth (+5%, primarily from production ramp-ups and start-ups of major TOTAL-operated projects, including Dalia, Rosa and Dolphin), partially offset by the negative impacts of the price effect, OPEC quota reductions and shutdowns in the Niger delta because of security issues (-2%), of changes in the Group’s portfolio, mainly the termination of a concession in Dubai (-1%), and of the May 2007 fire on the Nkossa platform in Congo (-0.5%). The Group’s proved reserves at December 31, 2007 decreased 6% to 10,449 Mboe from 11,120 Mboe at December 31, 2006. At the 2007 average rate of production, these reserves represent approximately 12 years of production. Changes in 2007 proved reserves were primarily due to the sale of 16.7% of Sincor to PDVSA and other divestments (-4%), the price effect (-2%) and production over the year 2007 (-1.5%), which were only partially offset by new additions from successful exploration and business developments (+2%). See “Item 4. Information on the Company — Exploration & Production — Reserves ”Reserves” for a table showing changes in proved reserves by year and “Supplemental Oil and Gas Information (Unaudited)” contained elsewhere herein for additional information on proved reserves, including tables showing changes in proved reserves by region. Total expenditures of the Upstream segment increaseddecreased by 11%1% to 8,882 M€ in 2007 from 9,001 M€ in 2006 from 8,111 M€ in 2005.2006. In 2006,2007, expenditures mainly included the following projects: Kashagan (Kazakhstan), Akpo (Nigeria), Yemen LNG (Yemen), Ekofisk and Snøhvit (Norway), Dalia and Rosa (Angola), Akpo (Nigeria), Tunu/Tambora (Indonesia), Moho Bilondo (Congo), DolphinDalia, Rosa, Tombua/Landana and Qatargas IIAngola LNG (Angola), Snøhvit and Tyrihans (Norway), Dunbar and Jura (UK), Anguille (Gabon), Dolphin (Qatar), Surmont and Joslyn (Canada) and Tahiti (United States). Strategically, TOTAL plans to continue to increase the weight of the Upstream segment within its overall activities. The Group’s priority is to increase its hydrocarbon production, notably through the development of large projects, including conventional oil and gas, midstream gas, LNG, and enhanced recovery projects, while maintaining high profitability.
Downstream results | | | | | | | | | | | (M€) | | 2008 | | | 2007 | | | 2006 | | Non-Group sales | | 135,524 | | | 119,212 | | | 113,887 | | Operating income(a) | | 826 | | | 4,824 | | | 3,372 | | Equity in income (loss) of affiliates and other items | | (158 | ) | | 284 | | | 384 | | Tax on net operating income | | (143 | ) | | (1,482 | ) | | (1,125 | ) | Net operating income(a) | | 525 | | | 3,626 | | | 2,631 | | Adjustments affecting net operating income | | 2,044 | | | (1,091 | ) | | 153 | | Adjusted net operating income(b) | | 2,569 | | | 2,535 | | | 2,784 | | Investments | | 2,418 | | | 1,875 | | | 1,775 | | Divestments | | 216 | | | 394 | | | 428 | | | | | | ROACE | | 20% | | | 21% | | | 23% | |
| (a) | For the definition of operating income and net operating income, see Note 2 to the Consolidated Financial Statements. |
| (b) | Adjusted for special items and the inventory valuation effect. See Notes 2 and 4 to the Consolidated Financial Statements. |
20052008 vs. 20042007
UpstreamDownstream segment sales (excluding sales to other segments) were 20,888increased 14% to 135,524 M€ in 20052008 compared to 15,037119,212 M€ in 2004, reflecting2007.
In 2008, refined product sales averaged 3,658 kb/d, down 3% from 3,774 kb/d in 2007. 2008 refinery throughput decreased slightly to 2,362 kb/d from 2,413 kb/d in 2007. The refinery utilization rate for 2008 based on crude throughput was 88% (91% based on crude and other feedstock) compared to 87% (89% based on crude and other feedstock) in 2007. In 2008, six refineries were affected by turnarounds compared to ten in 2007. The level of refinery turnarounds in 2009 is expected to be comparable to the positive impact of higher hydrocarbon prices, which were only partially offset by a decline in production volumes notably due to hurricanes in the Gulf of Mexico and maintenance in the North Sea.2008 level. Adjusted net operating income from the Upstream segment increased by 37% to 8,029 M€ in 2005 from 5,859 M€ in 2004. This nearly 2.2 B€ increase inFor 2008, adjusted net operating income for the Downstream segment increased 1% to 2,569 M€ compared to 2,535 M€ in 2007. This result mainly reflects the generally satisfactory environment, with gains in Europe (0.55 B€) in 2008 offset by losses in U.S. refining (-0.2 B€) stemming from the Upstream segmentnegative environment and from hurricanes, as well as benefits recorded from increased productivity and supply optimization, particularly during the fourth quarter of 2008. However, net operating income was negatively affected by a 70% decrease in income from equity affiliates to 77 M€ in 2008 from 258 M€ in 2007, mainly due to an estimatedlosses incurred through TOTAL’s participation in Wepec, its Chinese refining affiliate.
The adjustment for the inventory valuation effect had a positive impact on Downstream adjusted net operating income of 2.4 B1,971 M€ from the stronger oil and gas market environment which was partially offset by an estimatedin 2008 compared to a negative impact of approximately 0.15 B1,098 M€ from lower production, excluding the effect of higher hydrocarbon prices on entitlement volumes under production sharing and buyback contracts, that was essentially due to hurricanes in the Gulf of Mexico, and by other factors, including higher costs, with an estimated negative impact of less than 0.1 B€. There were no adjustments affecting Upstream net operating income in 2005.2007. In 2004,2008, the exclusion of special items (comprised primarily(relating principally to restructuring charges of asset impairment charges)70 M€ and other special items) had a positive impact of 14873 M€ on adjusted net operating income. The exclusion of special items in 2007 had a negative impact of 7 M€, with capital gains of 101 M€ more than offsetting restructuring charges, asset impairments and other special items.
Upstream ROACE for the Downstream segment was 40%19.9% in 20052008 compared to 36%20.6% in 2004, reflecting primarily the increase2007 due principally to increased investment in adjusted net operating income.2008.
In 2005,2008, Downstream net operating income amounteddecreased to 8,029525 M€ (for 2004, 5,7112007, 3,626 M€) from operating income of 18,421826 M€ (for 2004, 12,8442007, 4,824 M€), with the difference resulting primarily from taxes on net operating income of 10,979143 M€ (for 2004, 7,2812007, 1,482 M€), offset by income and from the loss from equity affiliates and other items of 587158 M€ (for 2004, 1482007, income of 284 M€). Oil and gas production declinedInvestments by 3.7% to 2,489 kboe/d in 2005 from 2,585 kboe/d in 2004. Adjusted for the negative impact of higher oil and gas prices on entitlement volumes from production sharing and buyback contracts and excluding the impact of the hurricanes in the Gulf of Mexico, the Group’s production remained stable in 2005 compared to 2004. Production growth mainly from Venezuela, Libya, Indonesia, Trinidad & Tobago and Argentina was offset by decreases in the North Sea (due, in particular, to the decommissioning of Frigg) and Syria.
The Upstream segment’s proved reserves declined by 0.4% to 11,106 Mboe at December 31, 2005 from 11,148 Mboe at December 31, 2004. This slight decline includes the negative impact of the higher year-end 2005 price on the calculation of proved reserves.
Total expenditures of the UpstreamDownstream segment increased by 31% to 8,111were 2,418 M€ in 2005 from 6,2022008 compared to 1,875 M€ in 2004. In 2005, expenditures mainly included the following projects: Kashagan in Kazakhstan; Ekofisk and Snøhvit in Norway; Dalia, Rosa and BBLT in Angola; Tunu-Tambora in Indonesia; Dolphin in Qatar; Forvie in the UK; Akpo and Bonga in Nigeria. In 2005, 1.1 B€ was dedicated to the acquisition of Deer Creek Energy Ltd in Canada. In 2004, capital expenditures were made mainly in France, Angola, Nigeria, Norway, Kazakhstan, the United States and Venezuela.2007.
Downstream results
| | | | | | | | | | | (M€) | | 2006 | | | 2005 | | | 2004 | | Non-Group sales | | 113,887 | | | 99,934 | | | 86,896 | | Operating income | | 3,372 | | | 5,096 | | | 3,638 | | Equity in income (loss) of affiliates and other items | | 384 | | | 422 | | | 95 | | Tax on net operating income | | (1,125 | ) | | (1,570 | ) | | (1,131 | ) | Net operating income | | 2,631 | | | 3,948 | | | 2,602 | | Adjustments affecting net operating income | | 153 | | | (1,032 | ) | | (271 | ) | Adjusted net operating income(a) | | 2,784 | | | 2,916 | | | 2,331 | | Total expenditures | | 1,775 | | | 1,779 | | | 1,675 | | Total divestments | | 428 | | | 204 | | | 200 | | ROACE | | 23% | | | 28% | | | 25% | |
(a) | Adjusted for special items and the inventory valuation effect. |
20062007 vs. 20052006
Downstream segment sales (excluding sales to other segments) increased to 119,212 M€ in 2007 compared to 113,887 M€ in 2006 compared to 99,934 M€ in 2005.2006. In 2006,2007, refined product sales averaged 3,863 kb/d, up 2% from 3,786 kbd, stable compared to 2005. 2006kb/d in 2006.(1) 2007 refinery throughput increased 2%decreased slightly to 2,413 kb/d from 2,454 kb/d compared to 2,410 kb/d in 2005.2006. The refinery utilization rate for 2006 remained at2007 based on crude throughput was 87% (89% based on crude and | (1) | These 2007 and 2006 refined product sales averages reflect a method of calculating volumes for the Port Arthur refinery adopted prior to 2008. |
other feedstock) compared to 88%, the same as (91% based on crude and other feedstock) in 2005.There are more major2006. In 2007, ten refineries were affected by turnarounds scheduled for 2007 than there werecompared to three in 2006, but most of these turnarounds will only partially affect the refineries involved.2006. For 2006,2007, adjusted net operating income for the Downstream segment decreased 5%9% to 2,535 M€ compared to 2,784 M€ compared to 2,916 M€in 2005.2006. The decrease was mainly due to aweaker refining environment, partially offset byfavorable market effects, which hadthe impact of a negative impact estimated at 0.5weaker dollar (-0.25 B€. Performance improvement contributed 0.2), as the negative impacts of higher maintenance activity (-0.11 B€ and volumes recuperated from losses in 2005 (due to strikes in France), cost inflation (-0.07 B€) and the aftermath of Hurricane Rita in the United Sates) added an estimated 0.2overall slightly negative environment (-0.04 B€.) were offset by the positive effect of growth and productivity programs (+0.22 B€), notably the contribution from the Normandy distillate hydrocracker for a full year. The adjustment for the inventory valuation effect had a positivenegative impact on Downstream adjusted net operating income of 1,098 M€ in 2007 compared to a positive impact of 327 M€ in 2006 compared to a negative impact of 1,032 M€ in 2005.2006. The exclusion of special items in 2007 had a negative impact of 7 M€, with capital gains of 101 M€ more than offsetting restructuring charges, asset impairments and other special items. In 2006, special items (relating to capital gains on the sale of certain non-strategic financial interests) had a negative impact of 174 M€ on Downstream adjusted net operating income, while there were no Downstream special items in 2005.income. ROACE for the Downstream segment was 21% in 2007 compared to 23% in 2006 compared to 28% in 2005 due principally to weaker refining margins.increased investment in 2007. In 2006,2007, Downstream net operating income declinedincreased to 2,6313,626 M€ (for 2005, 3,9482006, 2,631 M€) from operating income of 3,3724,824 M€ (for 2005, 5,096 M€), with the difference resulting primarily from taxes on net operating income of 1,125 M€ (for 2005, 1,570 M€), partially offset by income from equity affiliates and other items of 384 M€ (for 2005, 422 M€).
Total expenditures by the Downstream segment were 1,775 M€ in 2006, compared to 1,779 M€ in 2005.Downstream investments in 2006 included approximately 1 B€ in refining (excluding turnarounds).
2005 vs. 2004
Downstream segment sales (excluding sales to other segments) increased to 99,934 M€ in 2005 compared to 86,896 M€ in 2004.
Refinery throughput declined by 3% to 2,410 kb/d in 2005 from 2,496 kb/d in 2004. The refinery utilization rate fell to 88% in 2005 from 92% in 2004 largely due to the effect of strikes in France and Hurricane Rita in the United States. Excluding the impact of the strikes and Hurricane Rita, the refinery utilization rate would have been 91%, slightly lower than the rate in 2004 due to a larger program of major turnarounds.
Adjusted net operating income from the Downstream segment rose to 2,916 M€ in 2005 from 2,331 M€ in 2004, an increase of 25%. The stronger Downstream environment had a positive impact estimated at 0.6 B€. Self-help programs contributed approximately 0.1 B€, but this contribution was more than offset by an estimated 0.2 B€ negative impact from strikes in France and Hurricane Rita in the United States. The inventory valuation effect had a negative impact on adjusted net operating income of 1,032 M€ in 2005 and 349 M€ in 2004.
There were no special items in the Downstream segment in 2005 while in 2004 the exclusion of special items had a positive impact of 78 M€ on adjusted net operating income from the Downstream segment.
Downstream ROACE increased to 28% in 2005 from 25% in 2004, reflecting primarily the increase in adjusted net operating income.
In 2005, net operating income amounted to 3,948 M€ (for 2004, 2,602 M€) from operating income of 5,096 M€ (for 2004, 3,6383,372 M€), with the difference resulting primarily from taxes on net operating income of 1,5701,482 M€ (for 2004, 1,1312006, 1,125 M€), partially offset by income from equity affiliates and other items of 422284 M€ (for 2004, 952006, 384 M€).
Total expendituresInvestments by the Downstream segment were 1,7791,875 M€ in 20052007 compared to 1,6751,775 M€ in 2004. Downstream investments in 2005 included 0.2 B€ for the construction of the distillate hydrocracker at the Normandy refinery, whichbegan operations in 2006, as well as the acquisition of marketing activities in 14 African countries.2006.
Chemicals(1)(1) | | | | | | | | | | | (M€) | | 2006 | | | 2005 | | | 2004 | | Non-Group sales | | 19,113 | | | 16,765 | | | 14,886 | | Operating income | | 996 | | | 1,119 | | | 893 | | Equity in income (loss) of affiliates and other items | | (298 | ) | | (348 | ) | | (170 | ) | Tax on net operating income | | (191 | ) | | (170 | ) | | (73 | ) | Net operating income | | 507 | | | 601 | | | 650 | | Adjustments affecting net operating income | | (377 | ) | | (366 | ) | | (286 | ) | Adjusted net operating income(a) | | 884 | | | 967 | | | 936 | | Total expenditures | | 995 | | | 1,115 | | | 949 | | Total divestments | | 128 | | | 59 | | | 122 | | ROACE | | 13% | | | 15% | | | 15% | |
| | | | | | | | | | | (M€) | | 2008 | | | 2007 | | | 2006 | | Non-Group sales | | 20,150 | | | 19,805 | | | 19,113 | | Operating income(a) | | (58 | ) | | 1,424 | | | 996 | | Equity in income (loss) of affiliates and other items | | (34 | ) | | (11 | ) | | (298 | ) | Tax on net operating income | | 76 | | | (426 | ) | | (191 | ) | Net operating income(a) | | (16 | ) | | 987 | | | 507 | | Adjustments affecting net operating income | | 684 | | | (140 | ) | | 377 | | Adjusted net operating income(b) | | 668 | | | 847 | | | 884 | | Investments | | 1,074 | | | 911 | | | 995 | | Divestments | | 53 | | | 83 | | | 128 | | | | | | ROACE | | 9% | | | 12% | | | 13% | |
| (a) | For the definition of operating income and net operating income, see Note 2 to the Consolidated Financial Statements. |
| (b) | Adjusted for special items and the inventory valuation effect. See Notes 2 and 4 to the Consolidated Financial Statements. |
20062008 vs. 20052007
Chemicals segment sales (excluding sales to other segments) increased by 14%2% to 19,11320,150 M€ in 20062008 from 16,76519,805 M€ in 2005.2007. Adjusted net operating income for the Chemicals segment decreased by 9%21% to 884 M€ from 967668 M€ in 2005, due principally to the impact of deferred tax credits related to Arkema activities, which amounted to 182008 from 847 M€ in 2006 compared2007, due to 151 M€ in 2005, slightly offsetthe negative market environment faced by the positive impactChemicals segment. In the first half of growth and productivity programs.2008, the Chemicals segment was challenged by the rapid increase in oil prices, while in the second half of the year, despite benefiting from a rebound in margins, it suffered from falling demand linked to the worldwide economic downturn. The adjustment for the inventory valuation effect had a positive impact of 504 M€on adjusted net operating income for the Chemicals segment of 28 M€in 2006,2008, compared to a negative impact of 50201 M€ in 2005.2007. In 2008, the exclusion of special items (relating principally to restructuring costs, asset impairment and other elements) had a positive impact of 180 M€ on adjusted net operating income. In 2007, the exclusion of special items (comprised of restructuring charges, asset impairments and other elements) had a positive impact of 61 M€ on adjusted net operating income. ROACE for the Chemicals segment was 9.2% in 2008 compared to 12.1% in 2007 due principally to a decrease in adjusted net operating income. | (1) | For 2006, pursuant to IFRS 5, income statement data and ROACE have been recalculated to exclude Arkema. |
In 2008, net operating income amounted to a loss of 16 M€ (for 2007, a gain of 987 M€) from an operating loss of 58 M€ (for 2007, operating income of 1,424 M€), with the difference resulting primarily from losses from equity affiliates and other items of 34 M€ (for 2007, 11 M€), and gains on taxes on net operating income of 76 M€ (for 2007, a loss of 426 M€). Investments by the Chemicals segment increased to 1,074 M€ in 2008 compared to 911 M€ in 2007. 2007 vs. 2006 Chemicals segment sales (excluding sales to other segments) increased by 4% to 19,805 M€ in 2007 from 19,113 M€ in 2006. Adjusted net operating income for the Chemicals segment decreased by 4% to 847 M€ in 2007 from 884 M€ in 2006, due principally to the negative impacts of the weaker dollar (-0.11 B€) and the petrochemicals environment (-0.07 B€), essentially linked to the weak margins in the fourth quarter 2007, which were only partially offset by the positive impact of growth and productivity programs (+0.15 B€). The adjustment for the inventory valuation effect had a negative impact of 201 M€ on adjusted net operating income for the Chemicals segment in 2007, compared to a positive impact of 28 M€ in 2006. In 2007, the exclusion of special items (comprised of restructuring charges, asset impairments and other elements) had a positive impact of 61 M€ on adjusted net operating income. In 2006, the exclusion of special items (comprised mainly of restructuring charges and asset impairments) had a positive impact of 349 M€ on adjusted net operating income. In 2005, the exclusion of special items (comprised mainly of restructuring charges, impairments and provisions for environmental liabilities in the Chemicals segment) had a positive impact of 416 M€ on adjusted net operating income. For further information on the impairment charges, including facts and circumstances giving rise to certain of them, see paragraph D of Note 4 to the Consolidated Financial Statements. ROACE for the Chemicals segment was 12% in 2007 compared to 13% in 2006 compared to 15% in 2005 (12% in 2005 excluding the deferred tax credits related to Arkema).2006. In 2006,2007, net operating income amounted to 507987 M€ (for 2005, 6012006, 507 M€) from operating income of 9961,424 M€ (for 2005, 1,1192006, 996 M€), with the difference resulting primarily from losses from equity affiliates and other items of 29811 M€ (for 2005,2006, a loss of 348298 M€), as well as from taxes on net operating income of 191426 M€ (for 2005, 1702006, 191 M€). Total expendituresInvestments by the Chemicals segment decreased to 911 M€ in 2007 compared to 995 M€ in 2006 compared to 1,115 M€ in 2005. In 2006, 49% of these expenditures were for Base Chemicals, 42% for Specialties and 8% for Arkema activities which were spun off in May 2006.
2005 vs. 2004
Chemicals segment sales (excluding sales to other segments) increased by 13% to 16,765 M€ in 2005 from 14,886 M€ in 2004, primarily in response to an overall improved market environment for Chemicals.
Adjusted net operating income from the Chemicals segment was 967 M€ in 2005 compared to 936 M€ in 2004, reflecting improvement in the operating income from the Base Chemicals and Specialities activities.
(1) | Pursuant to IFRS 5, income statement data and ROACE have been recalculated to exclude Arkema. |
Market conditions for base chemicals were volatile during 2005, with a very favorable first quarter in 2005 followed by margin weakness resulting from erratic customer demand linked to volatile raw material prices. Specialities performed well despite higher raw material costs.
The adjustment for the inventory valuation effect had a negative impact on adjusted net operating income for the Chemicals segment of 50 M€ in 2005 and 157 M€ in 2004. In 2005, the exclusion of special items (comprised mainly of restructuring charges, impairments and provisions for environmental liabilities in the Chemicals segment) had a positive impact of 416 M€ on adjusted net operating income. In 2004, the exclusion of special items had a positive impact of 443 M€ on adjusted net operating income. For further information on the
impairment charges, including facts and circumstances giving rise to certain of them, see paragraph D of Note 4 to the Consolidated Financial Statements.
Chemicals ROACE was 15% in 2005 compared to 15% in 2004.
In 2005, net operating income amounted to 601 M€ (for 2004, 650 M€) from operating income of 1,119 M€ (for 2004, 893 M€), with the difference resulting primarily from losses from equity affiliates and other items of 348 M€ (for 2004, a loss of 170 M€), as well as from taxes on net operating income of 170 M€ (for 2004, 73 M€).
Total expenditures by the Chemicals segment increased to 1,115 M€ in 2005 compared to 949 M€ in 2004. Capital expenditures in both years were made mainly in Europe, the United States and Asia.
Liquidity And Capital Resources
TOTAL’s cash requirements for working capital, share buybacks, capital expenditures and acquisitions over the past three years were financed primarily by a combination of funds generated from operations, borrowings and divestments of non-core assets. In the current environment, TOTAL expects its external debt to be principally financed from the international debt capital markets. The Group continually monitors the balance between cash flow from operating activities and net expenditures. In the Company’s opinion, its working capital is sufficient for its present requirements. The largest part (approximately 90%) of TOTAL’s capital expenditures are made up of additions to intangible assets and property, plant and equipment, with the remainder attributable to acquisitions of subsidiaries and equity-method affiliates. In the Upstream segment, as described in more detail under “Supplemental Oil and Gas Information (Unaudited) — Costs incurred”, capital expenditures are principally development costs (approximately 75%80% mainly for construction of new production facilities), exploration expenditures (successful or unsuccessful, approximately 11%8%) and acquisitions of proved and unproved properties (approximately 3%8%). In the Downstream segment, about 45%65% of capital expenditures are related to refining activities (essentially 51%55% for upgrading units and 49%45% for new construction), the balance being used in marketing/retail activities and for information systems. In the Chemicals segment, capital expenditures relate to all activities, and are split between upgrading units (approximately 80%55%) and new construction (approximately 20%45%). For detailed information on expenditures by business segment, please refer to the discussion of Company Resultsresults for each segment above. Total expendituresExpenditures (cash flow used in investing activities) were 13,640 M€ in 2008, up 16% from 11,722 M€ in 2007 after decreasing 1% from 11,852 M€ in 2006, up 6% from 11,195 M€ in 2005 after increasing 26% from 8,904 M€
in 2004.2006. During 2008, 73% of the expenditures were made by the Upstream segment, 18% by the Downstream segment and 8% by the Chemicals segment. During 2007, 76% of the expenditures were made by the Upstream segment, 16% by the Downstream segment and 8% by the Chemicals segment. During 2006, 76% of the expenditures were made by the Upstream segment, 15% by the Downstream segment, 8% by the Chemicals segment and 1% by Corporate.During 2005, 72% of the expenditures were made by the Upstream segment, 16% by the Downstream segment, 10% by the Chemicals segment and 2% by Corporate. During 2004, 71% of the expenditures were made by the Upstream segment, 18% by the Downstream segment, 10% by the Chemicals segment and 1% by Corporate. The main source of funding for these expenditures has been cash from operating activities.
Cash flow from operating activities was 18,669 M€ in 2008 compared to 17,686 M€ in 2007 and 16,061 M€ in 20062006. Cash flow from operating activities increased 983 M€€ from 2007 to 2008 despite a 2,591 M€€ decrease in net income (Group share) from 2007 to 2008 due primarily to such decrease being compensated by a 2,571 M€ decrease in the Group’s working capital requirement from 2007 to 2008. Cash and cash equivalents increased to 12,321 M€ at year-end 2008 compared to 14,6695,988 M€ at year-end 2007 in 2005order to increase financial flexibility. Cash and 14,662cash equivalents were 2,493 M€ in 2004.at year-end 2006. TOTAL’s non-current financial debt was 16,191 M€ at year-end 2008 compared to 14,876 M€ at year-end 2007 and 14,174 M€ at year-end 2006 compared to 13,793 M€ at year-end 2005 and 11,289 M€ at year-end 2004.2006. For further information on the Company’s level of borrowing and the type of financial instruments, including maturity profile of debt and currency and interest rate structure, see Note 20 to the Consolidated Financial Statements. For further information on the Company’s treasury policies, including the use of instruments for hedging purposes and the currencies in which cash and cash equivalents are held, see “Item 11. Quantitative and Qualitative Disclosures aboutAbout Market Risk”. Total divestments,Divestments, based on selling price and net of cash sold, were 2,585 M€ in 2008 compared to 1,556 M€ in 2007 and 2,278 M€ in 2006 compared to 1,0882006. In 2008, the Group’s principal divestments were asset sales of 1,451 M€, consisting mainly of Sanofi-Aventis shares, and reimbursements for carried investments in 2005Yemen, Venezuela and 1,192Nigeria. In 2007, the Group sold certain Upstream assets in Canada, the UK and Norway and Downstream assets in the UK. The Group also sold 0.4% of the share capital of Sanofi-Aventis in the fourth quarter of 2007 for 316 M€ in 2004.. In 2006, the Group sold certain Upstream assets in the U.S. and in France, was reimbursed for carried investments on Akpo in Nigeria and sold certain non-strategic financial interests. In 2005, the Group sold an interest of 1.85% in Kashagan to KazMunayGas and its interest in the UK
power generation company Humber Power. In 2004, TOTAL sold certain financial assets and non-strategic operating assets in the Upstream, Downstream and Chemicals segments and also transferred certain assets to Gaz de France in an asset swap.
Shareholders’ equity remained stableincreased to 49,950 M€ at December 31, 2008, from 45,700 M€ at December 31, 2007, and 41,148 M€ at December 31, 2006 from 41,4832006. Changes in shareholders’ equity in 2008 were primarily due to the addition of net income, which was only partially offset by the payment of dividends, translation adjustments and share buybacks. During 2008, TOTAL repurchased 27.6 million of its own shares for 1,339 M€ at December 31, 2005 after increasing from 32,418. Changes in shareholders’ equity in 2007 were primarily due to the addition of net income, which was only partially offset by the payment of dividends, translation adjustments and share buybacks. During 2007, TOTAL repurchased 32.4 million of its own shares for 1,787 M€ at December 31, 2004.. Changes to shareholders’ equity in 2006 were due primarily to the addition of net income, offset by the payment of the annual dividend, cancellation of treasury shares,share buybacks, the spin-off of Arkema and translation adjustments. During 2006, TOTAL repurchased 75.9(1)(2) million of its own shares for 3,975 M€. Changes to shareholders’ equity in 2005 were due primarily to the addition of net income, offset by the cancellation of treasury shares, the payment of the annual dividend and translation adjustments. During 2005, TOTAL repurchased 73.2(2) million of its own shares for 3.5 B€. During 2004, TOTAL repurchased 90.2(2) million of its own shares for approximately 3.6 B€. As of December 31, 2006,2008, TOTAL’s net-debt-to-equity ratio, which is the sum of its current borrowings, net other current financial instrumentsliabilities and non-current financial debt, net of itscurrent financial assets, hedging instruments ofon non-current financial debt and cash and cash equivalents, divided by the sum of shareholders’ equity redeemable preferred shares issued by consolidated subsidiaries and minority interestinterests after expected dividends payable, was 34%23%, compared to 32%27% and 31%34% at year-end 20052007 and year-end 2004,2006, respectively. Over the 2004-20062006-2008 period, TOTAL used its net cash flow (cash flow from operating activities less total expendituresinvestments plus total divestments) tomaintainto maintain this ratio in its target range of around 2525% to 30%, primarily by managing net debt (financial short-term debt plus non-current debt less cash and cash equivalents), while higher net income increased shareholders’ equity and repurchases and cancellations of shares decreased shareholders’ equity. As of December 31, 2006,2008, TOTAL S.A. had $7,701$8,966 million of long-term confirmed lines of credit, of which $7,649$8,725 million were unused. In 2007,2009, the Company expects to use net cash flow after dividends to maintain its net debt-to-equity ratio after payment of dividends in the targeted range of around 2525% to 30% and to continue to repurchase shares of the Company depending on the market environment and the level of divestments.. Guarantees and Other Off-balance Sheet Arrangements
Neither TOTALAs part of certain project financing arrangements, Total S.A. has provided guarantees for a maximum aggregate amount of 1.3 B€ in connection with the financing of the Yemen LNG project, presented under “Guarantees given against borrowings” in Note 23 to the Consolidated Financial Statements. In turn, certain partners involved in this project have given commitments that could, in the case of Total S.A.’s guarantees being called for the maximum amount, reduce the Group’s exposure by up to 0.4 B€, recorded under “Other commitments received” in the same Note. These guarantees and other information on the Company’s commitments and
contingencies are presented in Note 23 to the Consolidated Financial Statements. The Group does not currently consider that these guarantees, or any other off-balance sheet arrangements of Total S.A. nor any other members of the Group, has any off-balance sheet arrangements that currently have or are reasonably likely to have in the future to have a material effect on the Group’s financial condition, changes in financial condition, revenues or expenses, results of operation, liquidity, capital expenditure or capital resources. See Note 23 to the Consolidated Financial Statements for information on the Company’s commitments and contingencies.
(1) | Excludes 2.3 million shares reserved for restricted share grants pursuant to the decision of the Board on July 18, 2006. |
(2) | Amounts recalculated to reflect the four-for-one stock split on May 18, 2006. |
Contractual Obligations
| | | | | | | | | | | | Payment due by period (M€) | | Less
than 1 year | | 1-3
years | | 3-5
years | | More
than 5 years | | Total | | | | | Non-current debt obligations(a) | | — | | 4,501 | | 6,047 | | 2,769 | | 13,317 | Current debt obligations(b) | | 2,140 | | — | | — | | — | | 2,140 | Capital (finance) lease obligations(c) | | 29 | | 96 | | 89 | | 186 | | 400 | Asset retirement obligations(d) | | 221 | | 226 | | 350 | | 3,096 | | 3,893 | Operating lease obligations(c) | | 381 | | 685 | | 399 | | 422 | | 1,887 | Purchase obligations(e) | | 3,551 | | 4,886 | | 4,810 | | 24,080 | | 37,327 | Total | | 6,322 | | 10,394 | | 11,695 | | 30,553 | | 58,964 |
| | | | | | | | | | | | Payment due by period (M€) | | Less
than 1 year | | 1-3
years | | 3-5
years | | More
than 5 years | | Total | Non-current debt obligations(a) | | — | | 6,578 | | 6,486 | | 1,967 | | 15,031 | Current portion of non-current debt obligations(b) | | 2,025 | | — | | — | | — | | 2,025 | Finance lease obligations(c) | | 23 | | 72 | | 70 | | 126 | | 291 | Asset retirement obligations(d) | | 154 | | 357 | | 296 | | 3,693 | | 4,500 | Operating lease obligations(c) | | 429 | | 549 | | 374 | | 675 | | 2,027 | Purchase obligations(e) | | 4,420 | | 7,027 | | 6,100 | | 42,679 | | 60,226 | Total | | 7,051 | | 14,583 | | 13,326 | | 49,140 | | 84,100 |
| (a) | Non-current debt obligations are included in the itemsitem “Non-current financial debt” and “Hedging(“Hedging instruments of non-current financial debt”debt,” as presented in Note 20 to the Consolidated Financial Statements) of the balance sheet. It includesConsolidated Balance Sheet. The figure in this table is net of the non-current portion of issue swaps and swaps hedging debenture loans,bonds, and excludes non-current capitalfinance lease obligations of 371268 M€. |
| (b) | The current portion of non-current debt is included in the items “Current borrowings”, “Current financial assets” and “Other current financial liabilities” and “Current financial assets” of the balance sheet. It includesThe figure in this table is net of the current portion of issue swaps and swaps hedging debenture loansbonds and excludes the current portion of capitalfinance lease obligations of 2923 M€. |
| (c) | Capital (finance)Finance lease obligations and operating lease obligations: the Group leases real estate, serviceretail stations, ships, and other equipment through non-cancelable capital and operating leases. These amounts represent the future minimum lease payments on non-cancelable leases to which the Group is committed as of December 31, 2006,2008, less the financial expensesexpense due on capital (finance)finance lease obligations for 8770 M€. |
| (d) | The discounted present value of upstreamUpstream asset retirement obligations, primarily asset removal costs at the completion date. |
| (e) | Purchase obligations are obligations under contractual agreements to purchase goods or services, including capital projects, thatprojects. These obligations are enforceable and legally binding on the Company,TOTAL and that specify all significant terms, including the amount and the timing of the payments. These obligations include mainly:mainly include: hydrocarbon unconditional purchase contracts (except where an active, highly-liquidhighly liquid market exists and whichwhen the hydrocarbons are expected to be re-sold shortly after purchase), bookingreservation of transport capacities in pipelines, unconditional exploration works and development works in Upstream, and contracts for capital investment projects in Downstream. This disclosure does not include contractual exploration obligations with host states where a monetary value is not attributed and purchases of booking capacities in pipelines where the Group has a participation superior to the capacity used. |
For additional information on the Group’s contractual obligations, see Note 23 to the Consolidated Financial Statements. The Group has other obligations in connection with pension plans which are described in Note 18 to the Consolidated Financial Statements. As these obligations are not contractually fixed as to timing and amount, they have not been included in this disclosure. Other non-current liabilities, detailed in Note 19 to the Consolidated Financial Statements, are liabilities related to risks that are probable and amounts that can be reasonably estimated. However, no contractual agreements exist related to the settlement of such liabilities, and the timing of the settlement is not known. Research and Development
The Group strategyThere are four major axes for research and development is focused on its three business segments, principally in the following areas:at TOTAL:
•
| | Exploration & Production technology to allow access, at acceptable costs, to new energy resources (high-pressure/high-temperature, deep offshore, heavy crude oils, polyphasic transportation, acidic gas), as well as environment-friendly technologies such as reduction of greenhouse gas emissions, capture and sequestration of CO2 produced by the Group’s units, containment of acidic gas emissions and efficient use of water in the upstream industrial process.
|
Refining technologyinformation on and understanding of energy resources, mainly oil and gas but also biomass and next generation energies, to allow the identification, anticipationoptimize exploitation;
competitiveness, renewal and quality of products, including adapting to market needs, and understanding their life cycle and their environmental impacts; efficiency, reliability and longevity of industrial production facilities, including their energy efficiency; and environmental issues related to water, air, soil and biodiversity at industrial sites, and the reductionfuture of constraints linked to the operation of facilities, the evolution of | specifications and the control of environmental emissions, including by exploiting biofuels and, more generally, bioenergy, and marketing technology allowing the creation of innovative products representing sales opportunities.
|
Chemical processes to increase competitiveness, quality, safety and respect of the environment, in particular on the following themes: new catalyst and polymerization technologies, new products (bio-polymers and bio-degradable polymers, elastomers, anti-vibration systems, new coatings)emissions such as well as nano-technologies.carbon dioxide.
Research and development costs amounted to 612 M€ in 2008 (or 0.34% of sales), compared to 594 M€ in 2007 (or 0.37% of sales) and 569 M€ in 2006 (or 0.4%0.37% of sales) compared to 676 M€ in 2005 (or 0.5% of sales) and 635 M€ in 2004.. The number of employees dedicated to research and development activities in 20062008 was 4,0914,285, compared to 5,3124,216 in 20052007 and 5,2574,091 in 2004.2006. ITEM 6. DIRECTORS, SENIOR MANAGEMENT AND EMPLOYEES Directors and Senior Management
MembersComposition of the Board of Directors
Directors are appointed by the shareholders for a three-year term (Article 11 of the Company’s bylaws). In case of the resignation or death of a director between two shareholders’ meetings, the Board may temporarily appoint a replacement director. This appointment must be ratified by the next shareholders’ meeting. The terms of office of the members of the Board are staggered to more evenly space the renewal of appointments. The Board of Directors appoints the Chairman of the Board of Directors from among its members. The Board of Directors also appoints the Chief Executive Officer who may or may not be a member of the Board. As of December 31, 2008, the Board of Directors has sixteen members. Of these, one director has been elected by the shareholders to represent employee shareholders. The following individuals were members of the Board of Directors of TOTAL S.A. in 2006: (Information as of December 31, 2006)2008(1).
Thierry Desmarest 6163 years old.
A graduate of theÉcole Polytechnique and a Mining Engineer, Mr. Desmarest served as Director of Mines and Geology in New Caledonia, then as technical advisor on the staffs of the Minister of Industry and the Minister of Economy. He joined TOTAL in 1981, where he held various management positions, then served as President of Exploration and& Production until 1995. He served as Chairman and Chief Executive Officer of TOTAL from May 1995 until February 2007, and continues to serve as Chairman of the Board of TOTAL. Director of TOTAL S.A. since 1995 and until 2007.2010 (last renewal: May 11, 2007). Holds 477,200385,576 shares. Principal other directorships Chairman and Chief Executive Officer of Elf Aquitaine.
Director of Sanofi-Aventis.* Member of the Supervisory Board of AREVA.Areva.* | • | | Director of Air Liquide.* |
| • | | Director of Renault SA.* |
Member of the Supervisory Board and then Director of Air Liquide.*Renault SAS.
Daniel BoeufPatricia Barbizet
5853 years old.
A graduate of theEcoleÉcole Supérieure de Commerceof Paris in 1976, Mrs. Barbizet started her career in the Renault Group as the Treasurer of Renault Véhicules Industriels and Chief Financial Officer of Renault Crédit International. She joined the Pinault group in 1989 as the Chief Financial Officer. Since 1992, she has been serving as the Chief Executive Officer of Financière Pinault and the Director and Chief Executive Officer of Artémis. Since 2005, she has been the Vice-President of the PPR Board of Directors and Chairman of Christie’s. Director of TOTAL S.A. since May 16, 2008 and until 2011. Holds 1,000 shares. Principal other directorships Vice-President of PPR Board.* Chief Executive Officer and Director of Artémis. Director of Air France-KLM.* | * | Company names marked with an asterisk are publicly listed companies. |
| (1) | Information as of December 31, 2008. |
Daniel Boeuf 60 years old. A graduate of theÉcole Supérieure des Sciences EconomiquesÉconomiques et Commerciales (ESSEC), Mr. Boeuf joined the Group in October 1973 and served in several sales positions before holding various operational positions in Refining & Marketing entities. He is currently responsible for training and skills management in specialties within the Refining & Marketing division. An elected member of the Supervisory Board of the TOTAL ACTIONNARIAT FRANCE employeecollective investment fund since 1999, he served as the Chairman of its Supervisory Board from 2003 to 2006. Director of TOTAL S.A. representing employee shareholders since 2004 and until 2007.2010 (last renewal: May 11, 2007). Holds 2,4003,964 TOTAL shares and 3,1123,842 shares of the TOTAL ACTIONNARIAT FRANCE employeecollective investment fund.
69
* | Publicly listed company. |
Daniel Bouton(1) 5658 years old.
Inspector General of Finance, Mr. Bouton has held various positions within the French Ministry of Economy. He served as Budget Director at the Ministry of Finance from 1988 to 1990. He joined Société Générale in 1991, where he was appointed Chief Executive Officer in 1993, then Chairman and Chief Executive Officer in November 1997. He has been serving as the Chairman of the Société Générale group since May 12, 2008. Director of TOTAL S.A. since 1997 and until 2009.2009 (last renewal: May 12, 2006). Holds 3,200 shares. Principal other directorships Chairman and Chief Executive Officer of Société Générale.* Director of Veolia Environnement.*
Bertrand Collomb 6466 years old.
A graduate of theÉcole Polytechnique and a Mining Engineer, Mr. Collomb held a number of positions within the Ministry of Industry and other staff positions from 1966 to 1975. He joined the Lafarge group in 1975, where he served in various management positions. He served as Chairman and Chief Executive Officer of Lafarge from 1989 to 2003, then as Chairman of the Lafarge Board of Directors. Directors from 2003 to 2007 and has been the honorary President since 2007. He is also President of the French association of private-sector companies (AFEP)Institut des Hautes Etudes pour la Science et la Technologie (IHEST) and theInstitut Français des Relations Internationales (IFRI). Director of TOTAL S.A. since 2000 and until 2009.2009 (last renewal: May 12, 2006). Holds 4,712 shares. Principal other directorships Chairman of the Board of DirectorsDirector of Lafarge.*
Director of DuPont* (United States). Director of Atco* (Canada).
| * | Company names marked with an asterisk are publicly listed companies. |
Paul Desmarais Jr.(2)(1) 5254 years old.
A graduate of McGill University in Montreal and INSEAD in Fontainebleau, Mr. Desmarais was elected Vice Chairman (1984) then Chairman of the Board (1990) of Corporation Financière Power, a company he helped to found. Since 1996, he has served as Chairman of the Board and Co-Chief Executive Officer of Power Corporation of Canada. Director of TOTAL S.A. since 2002 and until 2008.2011 (last renewal: May 16, 2008). Holds 2,000 ADRs (corresponding to 2,000 shares). Principal other directorships Chairman of the Board and Co-Chief Executive Officer of Power Corporation of Canada.* Chairman of the Executive Committee and Member of the Board of Corporation Financière PowerPower* (Canada).* Vice-Chairman and DeputyActing Managing Director of Pargesa Holding S.A.* (Switzerland).* Vice-ChairmanMember of the Board of Directors and member of the StrategicExecutive Committee of Imerys (France)Great-West Lifeco Inc.* (Canada).*
Member of the Board of Directors and Executive Committee of Groupe Bruxelles Lambert S.A.* (Belgium). Director of GDF Suez* (France). Director of Suez (France)IGM Financial Inc.* (Canada).* Director of Power Corporation International.
70
* | Publicly listed company. |
(1) | Mr. Bouton is Chairman and Chief Executive Officer of Société Générale, which, to the Company’s knowledge, owns less than 0.1% of the Company’s shares and less than 0.1% of the voting rights. Mr. Bouton disclaims beneficial ownership of such shares. |
(2) | Mr. Desmarais Jr. is a Director of Groupe Bruxelles Lambert (Belgium), which acting in concert with Compagnie Nationale à Portefeuille and other entities, to the Company’s knowledge, owns 5.3% of the Company’s shares and 5.4% of the voting rights. Mr. Desmarais Jr. disclaims beneficial ownership of such shares. |
Jacques Friedmann
74 years old.
Director of TOTAL S.A. since 2000 and until May 12, 2006.
Bertrand Jacquillat 6264 years old.
A graduate ofÉofÉcole des Hautes Études Commerciales(HEC),Institut d’études politiques de Paris and Harvard Business School, Mr. Jacquillat holds both a PhD and anagrégé in management. He has been a university professor (France(in both France and the United States) since 1969, and has been on the faculty ofis a professor at theInstitut d’Études politiquesPolitiques dein Paris since 1999.as well as Vice-President of theCercle des Economistes. Director of TOTAL S.A. since 1996 and until 2008.2011 (last renewal: May 16, 2008). Holds 3,600 shares. Principal other directorships Chairman and Chief Executive Officer of Associés en Finance. Member of the Supervisory Board of Klepierre.Klépierre.* Member of the Supervisory Board of Presses Universitaires de France (PUF).
Antoine Jeancourt-Galignani 6971 years old.
Inspector of Finance, Mr. Jeancourt-Galignani held various positions within the Ministry of Finance before serving as Deputy Managing Director of Crédit Agricole from 1973 to 1979. He became chief executive officerChief Executive Officer of Indosuez bank in 1979 before serving as its Chairman from 1988 to 1994. He then served as Chairman of Assurances Généralerales de France (AGF) from 1994 to 2001, before serving as Chairman of Gecina from 2001 to 2005, where he currently serves as a director. Director of TOTAL S.A. since 1994 and until 2009.2009 (last renewal: May 12, 2006). Holds 4,4405,440 shares. Principal other directorships Chairman of the Supervisory Board of Euro Disney SCA.* Director of Assurances Générale de France.* Director of Kaufman & Broad S.A.*
Director of Société Générale.* Member of the Supervisory Board of Oddo et Cie.
| * | Company names marked with an asterisk are publicly listed companies. |
| (1) | Mr. Desmarais Jr. is a director of Groupe Bruxelles Lambert, which acting in concert with Compagnie Nationale à Portefeuille, to the Company’s knowledge, owns 5.4% of the Company’s shares and 5.4% of the voting rights. Mr. Demarais Jr. disclaims beneficial ownership of such shares. |
Anne Lauvergeon(1)(1) 4749 years old.
Chief Mining Engineer and a graduate of theÉcole NormaleSupérieure with a doctorate in physical sciences, Mrs. Lauvergeon held various positions with Usinor, the French Atomic Energy Commission (CEA) and then with the Paris region subsoil assets administration (1985-1988).in industry before becoming Deputy Chief of Staff in the Office of the President of the Republic from 1990 to 1995, she thenin 1990. She joined Lazard Frères et Cie from 1995 to 1997 as Managing Partner. She joinedPartner in 1995. From 1997 to 1999 she was Executive Vice President and member of the Executive Committee of Alcatel, before becoming Chairmanin charge of Cogema in June 1999. Since July 2001, sheindustrial partnerships. Mrs. Lauvergeon has beenserved as Chairman of the Management Board of AREVA. AREVA since July 2001 and Chairman and Chief Executive Officer of Areva NC (formerly Cogema) since June 1999. Director of TOTAL S.A. since 2000 and until 2009.2009 (last renewal: May 12, 2006). Holds 2,000 shares. Principal other directorships ChairmanChairperson of the ManagmentManagement Board of AREVA.Areva.*
Chairperson and CEO of Areva NC. Director of VODAFONEVodafone Group Plc.* Vice-President and Member of the Supervisory Board of Safran.*
* | Publicly listed company. |
(1) | Ms. Lauvergeon is Chairman of the Managing Board of Areva, which, to the Company’s knowledge, owns 0.3% of the Company’s shares and 0.6% of the voting rights. Ms. Lauvergeon disclaims beneficial ownership of such shares. |
Lord Peter Levene of Portsoken 6567 years old.
Lord Levene served in various positions within the Ministry of Defense, the office of the Secretary of State for the Environment, the office of the Prime Minister and the Ministry of Trade in the UK from 1984 to 1995. He then served as senior adviser at Morgan Stanley from 1996 to 1998 before becoming the Chairman of Bankers Trust International from 1998 to 2002. He was Lord Mayor of London from 1998 to 1999. He is currently Chairman of Lloyd’s. Director of TOTAL S.A. since 2005 and until 2008.2011 (last renewal: May 16, 2008). Holds 2,000 shares. Principal other directorships Chairman of International Financial Services. Chairman of General Dynamics UK Ltd. Director of Haymarket Group Ltd. Director of China Construction Bank.*
Maurice LippensClaude Mandil
6366 years old.
Mr. Lippens holds a law degree fromA graduate of theUniversité Libre de BruxellesÉcole Polytechnique and is a graduate of Harvard Business School (MBA). He hasGeneral Mining Engineer, Mr. Mandil served as a Mining Engineer in the Lorraine and Bretagne provinces. He then served as a Project Manager at theDélégation de l’Aménagement du Territoire et de l’Action Régionale (City and Department planning/DATAR) and as the Interdepartmental Head of Industry and Research and regional delegate of ANVAR. From 1981 to 1982, he served as the technical advisor on the staff of the Prime Minister, in charge of the industry, energy and research sectors. He was then appointed Chief Executive Officer, then Chairman and Chief Executive Officer of theInstitutde Développement Industriel (Industry Development Institute) until 1988. He was Chief Executive Officer
ofBureau de Recherches Géologiques et Minières (BRGM) from 1988 to 1990. From 1990 to 1998, Mr. Mandil was Chief Executive Officer for Energy and Commodities at the French Industry Ministry and the first representative for France at the Management Board of the Energy International Agency (EIA) Executive Committee. He served as the Chairman of the EIA in 1997 and 1998. In 1998, he was appointed Deputy Chief Executive Officer of Gaz de France and, in April 2000, Chairman of theInstitut Français du Pétrole (French Institute of Oil). From 2003 to 2007, he was the Executive Director of a venture capital company (Scienta SA), then as head of his own company in Brussels. He was appointed as Managing Director (1983), then as Chairman and Managing Director (1988) of the AG Group. Chairman of Fortis since 1990, he is the author of a corporate governance code for Belgian publicly traded companies, which was adopted in 2005.EIA. Director of TOTAL S.A. since 2003May 16, 2008 and until 2008.2011. Holds 3,2001,000 shares. Principal other directorships Chairman of Fortis S.A./N.V.*
Chairman of Compagnie Het Zoute.
Director of Groupe Bruxelles Lambert.*Institut Veolia Environnement.
| * | Company names marked with an asterisk are publicly listed companies. |
| (1) | Ms. Lauvergeon is Chairperson of the Management Board of Areva, which, to the Company’s knowledge, owns 0.3% of the Company’s shares and 0.6% of the voting rights. Ms. Lauvergeon disclaims beneficial ownership of such shares. |
Christophe de Margerie 5657 years old.
ChristopheMr. de Margerie joined the Group after graduating from theEcoleÉcole Supérieure de Commercede in Paris in 1974. He served in several positions in the Group’s FinancialFinance Department and Exploration-ProductionExploration & Production division. He became president of TOTAL Moyen-OrientTotal Middle East in 1995 before joining the Group’s executive committee as the President of the exploration and productionExploration & Production division in May 1999. He then became Senior Executive Vice-President of exploration and productionExploration & Production of the new
TotalFinaElf group in 2000. In January 2002 he became President of the Exploration & Production division of TOTAL. He has served as a member of the Executive Committee since 1999. He was appointed a member of the Board of Directors by the shareholders’ meeting held on May 12, 2006 and became Chief Executive Officer of TOTAL as fromon February 14, 2007. Director of TOTAL S.A. since May 12, 2006 and until 2009. Holds 72,000 shares.85,230 TOTAL shares and 39,330 shares of the TOTAL ACTIONNARIAT FRANCE collective investment fund.
72
* | Publicly listed company. |
Michel Pébereau((1)1) 6466 years old.
Honorary Inspector General of Finance, Mr. Pébereau held various positions in the Ministry of Economy and Finance, before serving, from 1982 to 1993, as Chief Executive Officer and then as Chairman and CEO of Crédit Commercial de France (CCF) from 1982 to 1993.. He was Chairman and Chief Executive Officer of BNP then BNP Paribas from 1993 to 2003, and is currently Chairman of the Board of BNP Paribas. Director of TOTAL S.A. since 2000 and until 2009.2009 (last renewal: May 12, 2006). Holds 2,356 shares. Principal other directorships Chairman of BNP Paribas.* Director of Saint Gobain.Saint-Gobain.* Director of Pargesa Holding SAS.A.* (Switzerland). Member of the Supervisory Board of AXA.* Member of the Supervisory Board of Axa.Banque marocaine pour le Commerce et l’Industrie.* Chairman of the European Banking Federation.
| • | | Non-voting member (Censeur) of the Supervisory Board of Galeries Lafayette. |
Thierry de Rudder(2) 5759 years old.
A graduate of theUniversité de Genève in mathematics, theUniversité Libre de Bruxelles and Wharton (MBA), Mr. Dede Rudder served in various positions at Citibank from 1975 to 1986 before joining Groupe Bruxelles Lambert, where he was appointed Acting Managing Director. Director of TOTAL S.A. since 1999 and until 2007.2010 (last renewal: May 11, 2007). Holds 3,956 shares. Principal other directorships Acting Managing Director of Groupe Bruxelles Lambert.* Director of Compagnie Nationale à Portefeuille.* Director of Suez-Tractebel.
Jürgen Sarrazin
70 years old.
Director of TOTAL S.A. since 2000 and until May 12, 2006.Lafarge.*
| * | PubliclyCompany names marked with an asterisk are publicly listed company.companies. |
| (1) | Mr. Pébereau is Chairman of BNP Paribas, which, to the Company’s knowledge, owns 0.3%0.2% of the Company’s shares and 0.4%0.2% of the voting rights. Mr. Pébereau is also a Directordirector of Pargesa Holding SA, (Switzerland), part of the GroupeGroup Bruxelles Lambert, (Belgium). Groupe Bruxelles Lambert (Belgium)which acting in concert with Compagnie Nationale à Portefeuille, and other entities, to the Company’s knowledge, owns 5.3%5.4% of the Company’s shares and 5.4% of the voting rights. Mr. Pébereau disclaims beneficial ownership of such shares. |
| (2) | Mr. de Rudder is Managing Directoracting managing director of Groupe Bruxelles Lambert (Belgium), which, acting in concert with Compagnie Nationale à Portefeuille and other entities, to the Company’s knowledge, owns 5.3%5.4% of the Company’s shares and 5.4% of the voting rights. Mr. de Rudder disclaims beneficial ownership of such shares. |
Serge Tchuruk 6971 years old.
A graduate of theÉcole Polytechniqueand anIngénieur de l’armement, Mr. Tchuruk held various management positions with Mobil Corporation, then with Rhône-Poulenc, where he was named Chief Executive Officer in 1983. He served as Chairman and CEO of CDF-Chimie/Orkem from 1986 to 1990, then as Chairman and CEO of TOTAL from 1990 to 1995. In 1995, he became Chairman and Chief Executive Officer of Alcatel. In 2006, he becamewas appointed Chairman of the Board of Alcatel-Lucent. Director of TOTAL S.A. since 1989 and until 2007.2010 (last renewal: May 11, 2007). Holds 61,060 shares. Principal other directorships Chairman of the Board of Alcatel-Lucent.*
Director of Thales.Thalès.* • | | Member of the Board of Directors of theÉcole Polytechnique.
|
Pierre Vaillaud 7173 years old.
A graduate of the ÉcoleÉcole Polytechnique, a Mining Engineer and a graduate of theÉcole Nationale Supérieure du Pétrole et des Moteurs,, Mr. Vaillaud worked as an Engineerengineer with Technip and Atochem before joining TOTAL. He served as Chief Executive Officer of TOTAL from 1989 to 1992, before becoming Chairman and Chief Executive Officer of Technip from 1992 to 1999, and of Elf Aquitaine from 1999 to 2000. Director of TOTAL S.A. since 2000 and until 2009.2009 (last renewal: May 12, 2006). Holds 2,000 shares. Principal other directorships Member of the Supervisory Board of Oddo et Cie.
Directors are elected for a three-year term of office, pursuant to articleArticle 11 of the Company’s bylaws. Other information The current members of the Board of Directors of the Company have informed the Company that they have not been convicted, have not been associated with a bankruptcy, receivership or liquidation, and have not been incriminated or publicly sanctioned or disqualified, as stipulated in item 14.1 of Annex I of (EC) Regulation 809/2004 of April 29, 2004. Management General Management May 14, 2004 the Board of Directors resolved to continue to entrust the general management of the Company to the Chairman of the Board and confirmed that Thierry Desmarest would continue to serve as its Chairman and as Chief Executive Officer of the Company. At its meeting on February 13, 2007, the Board resolved to change this method of general management andDirectors, based on the recommendation of the then existing Nominating & Compensation Committee(1), resolved to have separate individuals act asserve in the positions of Chairman of the Board and of Chief Executive Officer of the Company.Company to ensure continuity during changes to the Group’s management.
The Executive Committee (COMEX) is the primary decision-making body of the Group. It implements the strategy formulated by the Board of Directors and authorizes related investments. investments, subject to the approval by the Board of Directors for investments exceeding 3% of the Group’s equity. The Management Committee (CODIR) of the Group facilitates coordination among the divisions and monitors the operating results and activity reports of these divisions. The Executive Committee The following indivualsindividuals were serving as members of TOTAL’sthe Executive Committee as of December 31, 2006:2008: Thierry Desmarest,Christophe de Margerie, Chairman of the COMEX (Chairmain and Chief(Chief Executive Officer);.
François Cornélis, Vice-ChairmainVice-Chairman of the COMEX (President of the Chemicals division);. Michel Bénézit (President of the Refining-MarketingRefining & Marketing division); Robert Castaigne (Chief Financial Officer);.
Yves-Louis Darricarrère (President of the Gas & Power division); Christophe de Margerie (President of the Exploration & Production division); and.
Bruno Weymuller (President of the Strategy & Risk assessment department)Jean-Jacques Guilbaud (General Secretary).
Patrick de La Chevardière (Chief Financial Officer).
| * | PubliclyCompany names marked with an asterisk are publicly listed company.companies. |
(1) | In February 2007, the then existing Nominating & Compensation Committee was separated into the existing Nominating & Governance Committee and the Compensation Committee (see “Item 6. Corporate Governance”). |
The Management Committee In addition to the members of the COMEX, the following 23twenty-one individuals from various non-operating departments and operating divisions were serving as members of TOTAL’sthe Management Committee as of December 31, 2006:2008(1): Holding Jean-Pierre Cordier, Senior
René Chappaz, Vice-President, Executive Career Management. Yves-Marie Dalibard, Vice-President, Corporate Communications. Jean-Michel Gires, SeniorExecutive Vice-President, Sustainable Development and the Environment. Jean-Jacques Guilbaud, Senior Vice-President, Human Resources and Corporate Communications.
Peter Herbel, General Counsel. Ian Howat, Vice-President, Corporate Strategy.
Jean-Marc Jaubert, Senior Vice-President, Industrial Safety. Patrick de La Chevardière, Deputy Chief Financial Officer.
Jean-François Minster, Senior Vice-President, Scientific Development. Jean-Jacques Mosconi, Vice-President, Strategic Planning. François Viaud, Senior Vice-President, Human Resources. Upstream Philippe Boisseau, President, Gas & Power. Jacques Marraud des Grottes, Senior Vice-President, Middle East,Africa, Exploration & Production. Jean-Marie Masset, Senior Vice-President, Geosciences, Exploration & Production. Charles Mattenet, Senior Vice-President, Asia and the Far East, Exploration & Production. Patrick Pouyanné, Senior Vice-President, Strategy, Business Development and R&D, Exploration & Production. Jean Privey, Senior Vice-President, Africa, Exploration & Production.
Downstream Pierre Barbé, Senior Vice-President, Trading & Shipping. Alain Champeaux, Senior Vice-President, Overseas, Refining & Marketing.Overseas. Alain Grémillet, General Secretrary, Refining & Marketing. François Groh, President, Trading & Shipping.
Eric de Menten, Senior Vice-President, Marketing Europe, Refining & Marketing. Jean-Jacques Mosconi, Senior Vice-President, Strategy, Business Development and R&D, Refining & Marketing.
André Tricoire, Senior Vice-President, Refining, Refining & Marketing. Chemicals Pierre-Christian Clout, Senior Vice-President, Chairman and Chief Executive Officer of Hutchinson.Hutchinson, Mapa-Spontex. Françoise Leroy, General Secretary.Secretary, Chemicals. Hugues Woestelandt, Senior Vice-President, Specialties & Fertilizers.
In addition, Charles Paris de Bollardière serves as the Group’s Treasurer. Recent Developments
On February 13, 2007, Christophe de Margerie was appointed Chief Executive OfficerAs of TOTAL S.A., with Thierry Desmarest continuing to serve as non-executive Chairman of the Board of the Company. From February 14, 2007, Christophe de Margerie became the President of TOTAL’s Executive Committee and of TOTAL’s Management Committee. Yves-Louis Darricarrère replaced Christophe de Margerie as President of the Exploration & Production division ofMarch 1, 2008, the Group and Philippe Boisseau was appointed President of the Gas & Power division. Jean-Jacques Guilbaud, President of the Human Resources & Communications department of the Group was appointed asmodified its organization to include, notably, a member of the Executive Committee on February 19, 2007.Corporate Affairs Division containing several cross-functional departments.
75
* | Publicly listed company. |
Compensation
Board Compensation The amount paid to the members of the Board of Directors as directors’ fees was 0.820.83 M€ in 20062008 in accordance with the decision of the shareholders’ meeting held on May 14, 2004.11, 2007. There were 15sixteen directors as of December 31, 20062008, compared with 16fourteen as of December 31, 2005.2007. Compensation was paid to the members of the Board of Directors in 20062008 based on the following principles:principles, which remain unchanged from 2007: A fixed amount of€15,00020,000 was paid to each director (paid prorata temporis in case of a change during the period)., apart from the Chairman of the Audit Committee who was paid€30,000 and the other Audit Committee members who were paid€25,000.
| (1) | In January 2009, Marc Blaizot and Bertrand Deroubaix succeeded Jean-Marie Masset and Alain Grémillet, respectively, as members of the Management Committee, and Bruno Weymuller resigned as a member of the Management Committee. |
Each director was paid€5,000 for each meeting of the Board of Directors, of the Audit Committee, of the Compensation Committee or of the Nominating & CompensationGovernance Committee attended. This amount was increased to€7,000 for those directors who reside outside of France. Neither the Chairman of the Board, nor the Chief Executive Officer received directors’ fees as directors of TOTAL S.A. or any other company of the Group.
Total compensation (including in-kind benefits) paid to each director in the year indicatedTOTAL COMPENSATION (INCLUDING IN-KIND BENEFITS) PAID TO EACH DIRECTOR IN THE YEAR INDICATED
| | | | | | | | (€) | | 2006 | | 2005 | | 2004 | Thierry Desmarest | | 3,227,123 | | 2,963,452 | | 2,787,239 | Daniel Boeuf(a) | | 160,846 | | 150,529 | | 128,260 | Daniel Bouton | | 50,000 | | 45,000 | | 37,500 | Bertrand Collomb | | 55,000 | | 30,000 | | 42,000 | Paul Desmarais Jr. | | 43,000 | | 43,000 | | 37,500 | Jacques Friedmann(b) | | 35,383 | | 80,000 | | 82,500 | Bertrand Jacquillat | | 80,000 | | 80,000 | | 78,000 | Antoine Jeancourt-Galignani | | 65,000 | | 45,000 | | 46,500 | Anne Lauvergeon | | 40,000 | | 40,000 | | 42,000 | Peter Levene of Portsoken | | 50,000 | | 23,410 | | — | Maurice Lippens | | 50,000 | | 57,000 | | 37,500 | Christophe de Margerie(c) | | 1,426,443 | | — | | — | Michel Pébereau | | 65,000 | | 55,000 | | 51,000 | Thierry de Rudder | | 106,000 | | 106,000 | | 82,500 | Jürgen Sarrazin(b) | | 33,383 | | 50,000 | | 46,500 | Serge Tchuruk | | 50,000 | | 50,000 | | 46,500 | Pierre Vaillaud(d) | | 186,340 | | 178,906 | | 177,933 |
| | | | | | | | (€) | | 2008 | | | 2007 | | Thierry Desmarest | | (a | ) | | (a | ) | Christophe de Margerie | | (a | ) | | (a | ) | Patricia Barbizet(b) | | 39,651 | | | — | | Daniel Boeuf(c) | | 173,910 | | | 170,124 | | Daniel Bouton | | 40,000 | | | 55,000 | | Bertrand Collomb | | 55,000 | | | 65,000 | | Paul Desmarais Jr. | | 48,000 | | | 41,000 | | Bertrand Jacquillat | | 90,000 | | | 90,000 | | Antoine Jeancourt-Galignani | | 95,000 | | | 90,000 | | Anne Lauvergeon | | 45,000 | | | 50,000 | | Peter Levene of Portsoken | | 41,000 | | | 55,000 | | Maurice Lippens(d) | | — | | | 21,177 | | Claude Mandil(b) | | 27,568 | | | — | | Michel Pébereau | | 70,000 | | | 70,000 | | Thierry de Rudder | | 116,000 | | | 109,000 | | Serge Tchuruk(e) | | 143,427 | | | 137,368 | | Pierre Vaillaud(f) | | 186,873 | | | 189,814 | |
| (a) | IncludingFor the salary received by Mr. Boeuf as an employeeChairman of Total France, a subsidiarythe Board of TOTAL S.A., which amountedDirectors and the Chief Executive Officer, see the summary tables “— Summary of compensation, stock options and restricted shares granted to€100,753 in 2004,€105,529 in 2005 the Chairman and€110,846 in 2006. |
(b) | Term the Chief Executive Officer” and “—Compensation of office expired on May 12, 2006. |
(c) | Including the salary paid by TOTAL S.A.Chairman and in-kind benefits valued at€5,508. Mr.the Chief Executive Officer”. Thierry Desmarest and Christophe de Margerie does not receive anyreceived no directors’ fees for histheir service on the Company’s Board of Directors. |
| (b) | Appointed as a director on May 16, 2008. |
| (c) | Including the compensation received by Mr. Boeuf as an employee of Total Raffinage Marketing, a subsidiary of TOTAL S.A., which amounted to€115,123.88 in 2007 and€123,910.48 in 2008. |
| (d) | Term of office expired on May 11, 2007. |
| (e) | Including pension payments related to previous employment by the Group, which amounted to€131,43372,368 in 2004,€133,906 in 20052007 and€136,40073,427 in 2006.2008. |
| (f) | Including pension payments related to previous employment by the Group, which amounted to€139,814 in 2007 and€141,873 in 2008. |
Over the past threetwo years, the directors currently in office have not received any compensation or in-kind benefits from companies controlled by TOTAL S.A., except for Mr. Daniel Boeuf, who is an employee of Total France.Raffinage Marketing. The compensation indicated in the table above (except for that of the Chairman, the Chief Executive Officer and Messrs. Boeuf, de MargerieTchuruk and Vaillaud) consists solely of directors’ fees (gross amount) paid during the relevant period. None of the directorsDirectors of TOTAL S.A. have service contracts which provide for benefits upon termination of employment. Compensation of the Chairman The total gross compensation paid to Mr. Thierry Desmarest for fiscal 2008 was set by the Board of Directors, based upon the proposal of the Compensation Committee. This compensation is composed of a fixed base salary of€1,100,000 and a variable portion. The variable portion is calculated by taking into account the Group’s return on equity, the Group’s earnings compared to those of other major international oil companies, as well as the Chairman’s personal contribution to the Group’s strategy, corporate governance and performance. The variable portion can reach a maximum amount of 100% of the fixed base salary. The objectives related to personal contribution were considered to be fulfilled, and taking into account the comparison of TOTAL’s earnings with the major international oil companies that are its competitors, the variable portion paid to the Chairman in 2009 for his contribution in 2008 amounted to€969,430. The total gross compensation paid to the Chairman for fiscal year 2008 amounted to€2,069,430. Mr. Desmarest does not receive any in-kind benefits.
See the tables “Summary of Compensation, Stock Options and Restricted Shares Granted to the Chairman and the Chief Executive Officer” and “Compensation of the Chairman and the Chief Executive Officer” below for additional compensation information. Compensation of the Chief Executive Officer The total gross compensation paid to Mr. Christophe de Margerie for fiscal 2008 was set by the Board of Directors, based upon the proposal of the Compensation Committee. This compensation is composed of a fixed base salary of€1,250,000 and a variable portion. The variable portion is calculated by taking into account the Group’s return on equity, the Group’s earnings compared to those of other major international oil companies, as well as the Chief Executive Officer’s personal contribution to the Group’s strategy, evaluated on the basis of objective operational criteria related to the Group’s business segments. The variable portion can reach a maximum amount of 140% of the fixed base salary, which limit may be increased to 165% to reward exceptional performance. The objectives related to personal contribution were considered to be fulfilled, and taking into account the comparison of TOTAL’s earnings with the major international oil companies that are its competitors, the variable portion paid to the Chief Executive Officer in 2009 for his contribution in 2008 amounted to€1,552,875. The total gross compensation paid to the Chief Executive Officer for fiscal year 2008 amounted to€2,802,875. Mr. Christophe de Margerie has the use of a company car. See the tables “Summary of Compensation, Stock Options and Restricted Shares Granted to the Chairman and the Chief Executive Officer” and “Compensation of the Chairman and the Chief Executive Officer” below for additional compensation information. Executive Officer Compensation In 2006,2008, the aggregate amount paid directly or indirectly by the French and foreign affiliates of the Company as compensation to the executive officers of TOTAL (31in office as of December 31, 2008 (twenty-eight individuals, members of the Management Committee and the Treasurer) as a group was 19.718.0 M€, including 97.4 M€ paid to the sevensix members of the Executive Committee. Variable compensation accounted for 44.7%44.2% of the aggregate amount of 18.0 M€paid to executive officers in 2006.
Executive officers who are directors of affiliates of the Company are not entitled to retain any directors’ fees.
Compensation of the Chairman and Chief Executive Officerofficers.
The total gross compensation paid to Mr. Thierry Desmarest for fiscal 2006 amounted to€3,199,844. This compensation, set by the Board of Directors, is composed of a fixed base salary of€1,523,735 for 2006 and a variable portion, to be paid in 2007, which amounted to€1,676,109. The variable portion is calculated by taking into account the Group’s return on equity during the relevant fiscal year, the Group’s earnings compared to those of other major international oil companies and the Group’s future prospects based on action taken in the year in question.
Mr. Thierry Desmarest’s total gross compensation for fiscal 2005 amounted to€3,154,623, composed of a fixed base salary of€1,451,235 and a variable portion of€1,703,388 paid in 2006.
Mr. Desmarest does not receive any in-kind benefits.
Pensions and other commitments The Group does not have a specific pension plan for the Chairman and the Chief Executive Officer.
| 1) | The Chairman and the Chief Executive Officer, pursuant to applicable law, are eligible for French social security benefits, ARRCO (French Association for Complementary Pension Schemes) and AGIRC (French executive pension scheme federation) complementary pensions, defined benefit pension plans (RECOSUP) and the supplementary pension plan created by the Company. This supplementary pension plan, which is not limited to the Chairman and the Chief Executive Officer, is described in more detail below. |
The Chairman and the Chief Executive Officer are entitled to a retirement benefit calculated pursuant to the same formula used for all employees of TOTAL S.A. The method for calculating this benefit is determined by the National Collective Bargaining Agreement for the Petroleum Industry and is based on the annual gross compensation (including fixed and variable portions) paid to the Chairman or the Chief Executive Officer, as the case may be.
The Chairman and the Chief Executive Officer are also eligible for a complementary pension plan open to all employees of the Group whose annual compensation is greater than the annual social security threshold multiplied by eight. There are no French legal or collective bargaining provisions that apply to remuneration above this social security ceiling.
| 2) | The Chairman and the Chief Executive Officer are eligible for a supplementary pension plan open to all employees of the Group whose annual compensation is greater than the annual French social security threshold multiplied by eight. |
This complimentarysupplementary pension plan is financed and managed by TOTAL S.A. to award a pension that is based on the period of employment (up to a limit of 20 years) and the portion of annual gross compensation (including fixed and variable portions) that exceeds by at least eight times the annual French social security threshold multiplied by eight.threshold. This pension is indexed to the French Association for Complementary Pensions Schemes (ARRCO) index. As of December 31, 2006,2008, the Group’s supplementary pension obligations related to the Chairman are the equivalent of an annual pension of 15.46%23.8% of the Chairman’s 20062008 compensation. For Mr. de Margerie,the Chief Executive Officer, the Group’s pension obligations are, as of December 31, 2006,2008, the equivalent of an annual pension of 26.10%18.9% of his 20062008 compensation. | 3) | The Company also funds a life insurance policy which guarantees a payment, upon death, equal to two years’ compensation (both fixed and variable), increased to three years upon accidental death, as well as, in case of disability, a payment proportional to the degree of disability. |
| 4) | The Chairman and the Chief Executive Officer are also entitled to retirement benefits equal to those available to eligible members of the Group under the French National Collective Bargaining Agreement for the Petroleum Industry, amounting to 25% of the annual gross compensation (including fixed and variable portions) paid in the 12-month period preceding the retirement of the Chairman or the Chief Executive Officer, as the case may be. |
| 5) | If the Chairman or the Chief Executive Officer’s employment is terminated or his term of office is not renewed, he is eligible for severance benefits equal to two times an individual’s annual pay, based upon the gross compensation (both fixed and variable) paid in the 12-month period preceding termination of employment or term of office. |
The severance benefits to be paid upon a change of control or a change of strategy of the Company are cancelled in the case of disability, a payment proportional to the degree of disability. If the Chairmangross negligence or the Chief Executive Officer’s employment is terminatedwilful misconduct or his term of office is not renewed, he is eligible for severance benefits calculated according to terms of the National Collective Bargaining Agreement for the Petroleum Industry that applies to employees of TOTAL S.A. The maximum severance benefit, based upon 30 years of employment with the Group, is equal to two times an individual’s annual pay, based upon the gross compensation (both fixed and variable) paid in the previous 12-month period.
These severance benefits may be increased by an amount equal to an additional year’s gross pay (calculated as specified above) if the Chairman or the Chief Executive Officer enters into a non-compete agreement or, in the case of a change in control of the ownership ofleaves the Company if termination occursof his own volition, accepts new responsibilities within the two-year period following the change in control.Group, or may claim full retirement benefits within a short time period.
These provisions for severance benefits are not applicable if, at the time of severance or non-renewal, the Chairman or the Chief Executive OfficerSince Mr. Desmarest is eligible to receiveclaim his full retirement benefits. benefits, these provisions are only relevant to Mr. de Margerie.
| 6) | The commitments related to the supplementary pension plan, retirement benefits and severance benefits upon termination of employment or term of office will be subject to the procedure for regulated agreements set forth in article L. 225-38 of the French Commercial Code. |
| 7) | Pursuant to the provisions to the French law of August 21, 2007, which modifies article L. 225-42-1 of the French Commercial Code, the commitments described above related to retirement benefits and severance benefits upon termination of employment or term of office are subject to performance conditions. |
These performance conditions are deemed to be met if at least two of the three following criteria are satisfied: The benefits mentioned above are considered to cover any amounts dueaverage ROE (return on equity) over the three years immediately preceding the year in which the officer retires is at least 12%. The average ROACE (return on average capital employed) over the three years immediately preceding the year in which the officer retires is at least 10%. The Company’s oil and gas production growth over the three years immediately preceding the year in which the officer retires is greater than or equal to the Chairman oraverage production growth of the Chief Executive Officer, as the case may be, for all functions he may have performed for the Group. If the Group terminates employment or does not renew a term of office for reason (faute grave orfaute lourde), these provisions for benefits do not apply. In addition to the pension commitments described above, the Company has thefour following commitments to Messrs. Tchurukcompanies: ExxonMobil, Shell, BP and Vaillaud:Chevron.
| 8) | In addition, the Company has the following pension commitments (described in paragraph 2, above), as defined under French law, to Messrs. Tchuruk and Vaillaud: |
The Company has funded a complementarysupplementary pension for Mr. Tchuruk related to his previous employment by the Group. After retirement, the amount paid per year to Mr. Tchuruk under this complementaryreceives an annual supplementary pension would amount toof approximately€71,150,73,427, based upon calculations as of December 31, 2008. This pension is indexed to the ARRCO index.
| based upon calculations as of December 31, 2006. This pension is indexed to the ARRCO index.
|
The Company has funded a complementarysupplementary pension for Mr. Vaillaud related to his previous employment by the Group. Mr. Vaillaud receives an annual supplementary pension of approximately€141,873, based upon calculations as of December 31, 2008. This pension is indexed to the ARRCO index. | 9) | For the year 2008, the total amount of the Group’s pension commitments related to the directors of the Group is equal to 25.8 M€. |
| | | | | | | | | | Summary table as of February 28, 2009 | | Employment
contract | | Benefits or advantages
due or likely to be due
upon termination or
change of office | | | Benefits related
to a non-compete
agreement | | Benefits or advantages
due or likely to be
due after
termination or
change of office | Thierry Desmarest Chairman of the Board of Directors Member of the Board since May 1995(a) Expiry of current term of office:
The shareholders’ meeting called in 2010 to approve the financial statements for the year ending December 31, 2009 | | NO | | NO | | | NO | | YES employment by(retirement benefit)(b) (supplementary pension plan also applicable to some Group employees)
| Christophe de Margerie Chief Executive Officer
Member of the Group. Mr. Vaillaud receives an annual complementaryBoard since February 2007 Expiry of current term of office:
The shareholders’ meeting called for May 15, 2009 | | NO | | YES
(termination benefit
|
)(b)
| | NO | | YES (retirement benefit)(b) (supplementary pension of approximately€137,450, based upon calculations as of December 31, 2006. This pension is indexedplan also applicable to the ARRCO index.some Group employees) |
| (a) | Chairman and Chief Executive Officer until February 13, 2007, and Chairman of the Board of Directors from February 14, 2007. |
| (b) | Payment subject to a performance condition in accordance with the decision of the Board of Directors on February 11, 2009. |
Corporate Governance
For several years, TOTAL has been actively examinesexamining corporate governance matters. In particular, the Group maintains a policy of transparency regarding the compensation of and the allocation of stock options and restricted share grants toAt its corporate officers. Directors are appointed by the shareholders for a three-year term. In case of the resignation or death of a director, the Board may temporarily appoint a replacement director. This appointment must be ratified by the next shareholders’ meeting. The terms of office of the members of the Board are staggered to more evenly space the renewal of appointments.
In 1995, the Group established two special committees, the Nominating & Compensation Committee and the Audit Committee.
In 2003,meeting on November 4, 2008, the Board of Directors amendedconfirmed its decision to use the Corporate Governance Code for Listed Companies published in 2008 by the principal French business confederations, theAssociation Française des Entreprises Privées (AFEP) and theMouvement des Entreprises de France (MEDEF) (the “AFEP-MEDEF Code”) as its reference for corporate governance policies initially adoptedmatters.
The Company’s corporate governance practices differ from the recommendations contained in 1995 and in 2001 to take into account recent developments in this area, including the AFEP-MEDEF report publishedCode on the following limited matters: The AFEP-MEDEF Code recommends that a director no longer be considered as independent upon the expiry of the term of office during which the length of his service on the board reaches 12 years. The Board has not followed this recommendation in Franceregards to one of its members, in September 2002.consideration of the experience and authority of which this director is in possession, which reinforce | his independence and contribute to the Board’s work. |
The Chairman of the Board of Directors chairs the Nominating & Governance Committee of the Board. The Board of Directors and this Committee consider that the participation of the Chairman on the Nominating & Governance Committee enables the Committee to benefit from his experience and his knowledge of the Company’s activities, environment and executive teams, which is particularly useful to inform the Committee’s deliberations concerning the appointment of executives and directors. The fact that the Chairman of the Board, who does not exercise executive duties, chairs the committee permits close collaboration between the Board and the Committee, the latter being responsible for the review of the Board’s workings and corporate governance matters. This committee is comprised of a majority of independent directors and the Chairman and the Chief Executive Officer do not attend deliberations concerning their own situation.
In
Pursuant to the AFEP-MEDEF Code, on February 11, 2009, the Board of Directors noted that, effective from the same day, the employment contracts of its Chairman and its Chief Executive Officer had been terminated. Since 2004, the Board of Directors adoptedhas had a financial code of ethics that, in the overall context of the Group’s Code of Conduct, applies tosets forth specific rules for its Chairman, Chief Executive Officer, Chief Financial Officer, Chief Accounting Officer and the financial and accounting officers for its principal activities. The Board has made the Audit Committee responsible for implementing and ensuring compliance with this Code.code. At its meeting on February 18, 2004,In 2005, the Board had designated Jacques Friedman, Chairman ofapproved the procedure for alerting the Audit Committee and an independent director, as Audit Committee financial expert. Mr. Friedman served in this capacity until the end of his term of office as a director, on May 12, 2006. Mr. Antoine Jeancourt-Galignani, an independent director, has been designated to succeed Mr. Friedman as Chairman of the Audit Committee and Audit Committee financial expert.
At its meeting on July 19, 2005, the Board of Directors amended the Audit Committee’s charter to clarify its role in supervising the independent auditors and the criteria for the independence of its members. The Board also approved the Audit Committee’s procedures for complaints or concerns regarding accounting, internal accounting controls or auditing matters.
TOTAL’s corporate governance practices conform with those generally followed by companies listed in France.
The shareholders’ meeting held on May 14, 2004 appointed a director, Mr. Daniel Boeuf, representing employee shareholders.
Rules of Procedure of the Board of Directors TheAt its meeting on February 13, 2007, the Board of Directors adopted Rules of Procedure to replace the Directors’ charter specifiesCharter and to take into account the separation of the positions of Chairman of the Board and Chief Executive Officer implemented at the same meeting.
The Board’s Rules of Procedure specify the obligations of each director and setsset forth the rolesmission and working procedures of the Board.Board of Directors. They also define the respective responsibilities and authority of the Chairman and of the Chief Executive Officer. The principal matters covered by the Rules of Procedure are summarized below. Each director undertakes to maintain the independence of his analysis, judgment, decision making and actionactions as well as not to be unduly influenced. When a director participates in and votes at Board meetings, he is required to represent the interest of the shareholders and the Company as a whole. Directors must actively participate in the affairs of the Board, specifically on the basis of information communicated to himthem by the Company. Directors undertake to devote the amount of time required to consider the information they are given and otherwise prepare for meetings of the Board and of the committees on which they sit. Directors may request any additional information that they feel is necessary or useful from the Chairman or the Chief Executive Officer. A director, if he considers it necessary, may request training on the Company’s specificities, businesses and activities. Directors participate in all Board meetings and all committees or shareholders’ meetings, unless they have previously contacted the Chairman to inform him of scheduling conflicts. Each director must inform the Board of conflicts of interest that may arise, including the nature and terms of any proposed transactions that could give rise to such situations. If a directorhe is opposed to a project brought before the Board, he is required to clearly express his opposition. He is required to own at least 1,000 Companycompany shares in registered form (with the exception of the director representing employee shareholders, for whom the requirements are more flexible) and comply strictly with provisions regarding the use of material non-public information. The requirement to hold a minimum of 1,000 shares while in office is accepted by each Directordirector as a restriction on his ability to freely dispose of these shares. In addition to stipulating that any shares and ADRs of TOTAL S.A. and its publicly traded subsidiaries held by directors are to be held in registered form, the Directors’ Charter prohibitsRules of Procedure prohibit buying on margin or short selling those same securities. ItThey also prohibitsprohibit trading shares of TOTAL S.A. on and during the 15 calendar days preceding, the dates of the Company’s periodic earnings announcements.announcements, as well as the 15 calendar days preceding such dates. The Board’s roleBoard of Directors’ mission is to determine the strategic vision fordirection of the Group and supervise the implementation of this vision.
With the exception of the powers and authority expressly reserved for shareholders and within the limits of the Company’s legal purpose, the Board may address any issue related to the operation of the Company and take any decision concerning the matters falling within its purview. Within this framework, the Board’s duties and responsibilities include, but are not limited to, the following: Appointingappointing the officers responsible for managingChairman and the CompanyChief Executive Officer and supervising the handling of their actions;responsibilities;
Definingdefining the Company’s strategic orientationsorientation and, more generally, thosethat of the Group;
Considering major transactions to be pursuedapproving investments or divestments under study by the Group;Group that concern amounts greater than 3% of shareholders’ equity, whether or not the project is part of the announced strategy;
Receivingreviewing information on significant events related to the Company’s affairs;affairs, in particular for investments or divestments that are greater than 1% of shareholders’ equity;
Monitoringmonitoring the quality of information supplied to shareholders and the financial markets through the financial statements that it approves and the annual report,reports, or when major transactions are conducted;
Conveningconvening and setting the agenda for shareholders’ meetings;
Preparing,preparing, for each year, a list of the directors it deems to be independent under generally recognized corporate governance criteria; and
Conductingconducting audits and investigations as it may deem appropriate.
The Board, with the assistance of its specialized committees where appropriate, ensures the following:that: That authority within the Company has been properly delegated before it is exercised, and that the various entities of the Company respect the authority, duties and responsibilities they have been given;
That no individual is authorized to both contract and reimburse obligationson behalf of the Company or to commit to pay, or to make payments, on behalf of the Company, without proper supervision and control;
That the internal auditcontrol function functionsoperates properly and that the independentstatutory auditors are able to conduct their audits under appropriate circumstances; and
That the committees it has created duly perform their responsibilities.
The Board of Directors is regularly informed, through the Audit Committee, of the Group’s financial position, cash position and obligations. Board of Directors’ activity: The Board of Directors meets at least four times a year and additionallyas often as circumstances may require. Directors are generally given written notice eight days prior to Board meetings. Documents to be considered for decisions to be made at Board meetings are, when possible, sent with the notice of meetings, or otherwise delivered to the directors. The minutes of the previous meeting are expressly approved at each Board meeting. Directors may participate in meetings either by being present, by being represented by another director or via video conference (in compliance with the technical requirements set by applicable regulations). The Board may establish specialized committees, whether permanent or ad hoc, as required by applicable legislation or as it may deem appropriate. The Board allocates directors’ fees to and may allocate additional directors’ fees to directors who participate on specialized committees, within the total amount established by the shareholders. The Chairman and the Chief Executive Officer are not awarded directors’ fees for their work on the Board and Committees. The Board regularly (at least everyconducts, at regular intervals not to exceed three years)years, an assessment of its practices. It also conducts an evaluationannual discussion of its own practices. Each year it also discusses its performance.methods. The Board, in general, is convened by written notice at least eight days in advance of a meeting. The documents provided to inform the Board’s decisions are, when possible, included with the convening notice or otherwise provided as soon as possible thereafter. At each meeting, the minutes
Responsibility and authority of the preceding meeting are submitted forChairman: The Chairman represents the approvalBoard, and, except in exceptional circumstances, is the sole member authorized to act and speak on behalf of the Board. He is responsible for organizing and presiding over the Board’s activities and monitors corporate bodies to ensure that they are functioning effectively and respecting corporate governance principles. He is responsible, with the Group’s management, for maintaining relations between the Board and the Company’s shareholders. He monitors the quality of the information disclosed by the Company. In close cooperation with the Group’s management, he may represent the Group in high level discussions with government authorities and the Group’s important partners, on both a national and international level. He is regularly informed by the Chief Executive Officer of events and situations that are important for the Group and may request that the Chief Executive Officer provide any useful information for the Board or its committees. He may also work with the statutory auditors to prepare matters before the Board or the Audit Committee. Authority of the Chief Executive Officer: The Chief Executive Officer is responsible for the general management of the Company. He chairs the Group’s Executive Committee and Management Committee. Subject to the Company’s corporate governance rules, he has the full extent of authority to act on behalf of the Company in all instances, with the exception of actions that are, by law, reserved to the Board of Directors or to shareholders’ meetings. He is responsible for periodic reporting of the Group’s results and outlook to shareholders and the financial community. He reports on significant Group activities to the Board. The Board held seven meetings in 2006, with an average attendance of 86.2%.Directors has three specialized committees: the Audit Committee, the Compensation Committee, and the Nominating & Governance Committee. Audit Committee The Audit Committee’s role is to assist the Board of Directors in ensuring effective internal financial control and oversight and appropriate disclosureover financial reporting to shareholders and the financial markets. The Audit Committee’s duties include: Recommendingrecommending the appointment of independentstatutory auditors and their compensation, and ensuring their independence;independence and monitoring their work;
Establishingestablishing the rules for the use of independentstatutory auditors for non-audit services;services and verifying their implementation;
supervising the audit by the statutory auditors of the Company’s financial statements and consolidated financial statements; Examiningexamining the accounting policies used to prepare the financial statements, examining the parent companycompany’s annual financial statements and the consolidated annual, semi-annual, and quarterly financial statements prior to their examination by the Board, after regularly monitoring the financial situation, cash flow statementposition and obligations of the Company;
Reviewingsupervising the implementation of internal control and risk management procedures and the evaluation of their effectivenesseffective application, with the assistance of the internal audit department;
Reviewingsupervising procedures for preparing financial information;
monitoring the creationimplementation and activities of the disclosure committee, including reviewing the conclusions of this committee; Approving the scope ofreviewing the annual audit work program of internal and external auditors;
Keeping regularly informed ofreceiving information periodically on completed audits and examining annual internal audit reports and other reports (independent(statutory auditors, annual report,reports, etc.),;
Examining the appropriateness of risk oversight procedures;
Examiningreviewing the choice of appropriate accounting principles and methods;
Examiningreviewing the Group’s policy for the use of derivative instruments;
Giving,reviewing, if requested by the Broard, its opinion regardingBoard, major transactions contemplated by the Group;
Annually reviewing significant litigation;litigation annually;
Implementingimplementing, and monitoring compliance with, the Financial Codefinancial code of Ethics;ethics;
Proposingproposing to the Board, for implementation, a procedure for complaints or concerns of employees, shareholders and others, related to accounting, internal accounting controls or auditing matters;matters, and monitoring the implementation of this procedure; and
Examiningreviewing the procedure for booking the Group’s proved reserves.
Audit Committee membership and practices The committeeCommittee is made up of at least three directors designated by the Board of Directors. Members must be independent directors. In selecting the members of the committee,Committee, the Board pays particular attention to their independence and their financial and accounting qualifications. Members of the committeeCommittee may not be executive officers of the Company or one of its subsidiaries, nor own more than 10% of the Company’s shares, whether directly or indirectly, individually or acting together with another party. Members of the Audit Committee may not receive from the Company and its subsidiaries, whether directly or indirectly, any compensation other than: (i) | directors’ fees paid for their services as directors or as members of the Audit Committee or, if applicable, another committee of the Board; and |
directors’ fees paid for their services as directors or as members of the Audit Committee or, if applicable, another committee of the Board; and (ii) | compensation and pension benefits related to prior employment by the Company which are not dependant upon future work or activities. |
compensation and pension benefits related to prior employment by the Company, or another Group company, which are not dependent upon future work or activities. The committeeCommittee appoints its own Chairman. The Chairman appoints the Committee secretary who may be the Chief Financial Officer serves as the committee secretary.Officer. The committeeCommittee meets at least four times a year to examine the consolidated annual and quarterly financial statements. The Audit Committee may meet with the Chairman orof the Board, the Chief Executive Officer, and, if applicable, any acting Managing Director of the Company and perform inspections and consult with managers of operating or non-operating departments, as may be useful in performing its duties. The committeeCommittee meets with the independentstatutory auditors and examines their work, and may do so without management being present. If it deems it necessary forto accomplish its duties, the accomplishment of its mission, the committeeCommittee may request from the Board the means and resources to make use of outside assistance.engage external consultants. The committeeCommittee submits written reports to the Board of Directors regarding its work. In 2006,2008, the Committee’s members were Messrs. Antoine Jeancourt-Galignani, Bertrand Jacquillat, Thierry de Rudder and, from July 31, 2008, Mrs. Patricia Barbizet. All of the members of the committee were Mr. Jacques Friedmann, who servedCommittee are independent directors and have recognized experience in the financial and accounting fields, as chairmain, until May 12, 2006, when he was succeeded by Mr. Antoine Jeancourt-Galignani, and Messrs, Bertrand Jacquillat and Thierry de Rudder, each of whom is an independent director.illustrated in their summary biographies above. The committeeCommittee is chaired by Mr. Antoine Jeancourt-Galignani, who was appointed audit committeedetermined to be the Audit Committee financial expert by the Board at its meeting on September 5, 2006. As of December 31, 2006,Compensation Committee
In February 2007, the members ofCompensation Committee was separated from the committee had served as directors of TOTAL S.A. for twelve, ten and seven years, respectively. The Audit Committee met six times in 2006, with an effective attendance rate of 100%.
Each quarter, the committee reviewed the financial condition of the Group and a presentation made by the head of the internal audit regarding internal audit activity.
then existing Nominating & Compensation Committee Committee. The principal objectives of this committeeCommittee are to: Recommend to the Board of Directors the persons that are qualified to be appointed as directors or corporate officers and to prepare the corporate governance rules and regulations that are applicable to the Company; and
Review and examine the executive compensation policies implemented inby the Group and the compensation of members of the Executive Committee,Committee; and
evaluate the performance and recommend the compensation of the Chairman of the Board and of the Chief Executive Officer, and prepare any report that the Company must submit on these subjects.Officer. It performs the following specific tasks:
1. With respect to nominations:
a) | Assists the Board in the selection of directors, corporate officers, and directors as Committee members; |
b) | Recommends annually to the Board the list of directors who may be considered as “independent directors” of the Company; and |
c) | Proposes methods for the Board to evaluate its performance. |
2. With respect to compensation:Its duties include the following:
a) | Makes recommendations and proposals to the Board regarding: |
examining the criteria and objectives proposed by management for executive compensation and advising on this subject; presenting recommendations and proposals to the Board concerning: | | (i) | compensation, pension and insurance plans, in-kind benefits, and other compensation, including severance benefits, for the Chairmain orChairman and the Chief Executive Officer of TOTAL S.A.,the Company, and |
| | (ii) | awards of stock options and restricted share grants including specific awards to the Chairman orand the Chief Executive Officer; and |
b) | Reviews the compensation of members of the Executive Committee, including stock option plans, restricted share grants and equity-based plans as well as pension and insurance plans and in-kind benefits. |
examining stock option plans, restricted share grants, equity-based plans and pension and insurance plans. Compensation Committee membership and practices The committeeCommittee is made up of at least three directors designated by the Board of Directors. A majority of the members must be independent directors. Members of the Nominating & Compensation Committee may not receive from the Company and its subsidiaries, either directly or indirectly, any compensation other than: (i) | directors’ fees paid for their services as directors or as members of the Nominating & Compensation Committee; and |
directors’ fees paid for their services as directors or as members of the committee, or, if applicable, as members of another committee of the Company’s Board; and (ii) | compensation and pension benefits related to prior employment by the Company which are not dependant upon future work or activities. |
compensation and pension benefits related to prior employment by the Company which are not dependant upon future work or activities. The committeeCommittee appoints its Chairman as well as achairman and its secretary. The secretary who is a Company senior executive of the Company.executive. The committeeCommittee meets at least twice a year. The committeeCommittee invites the President orChairman and the Chief Executive Officer of the Company to present their recommendations. The President orNeither the Chairman nor the Chief Executive Officer may not be present during deliberations regarding his own compensation.
While maintaining the appropriate level of confidentiality for its discussions, the committeeCommittee may request that the Chief Executive Officer provide it with the assistance of any senior executive of the Company whose skills and qualifications could facilitate the handling of an agenda item. If it deems it necessary to accomplish its duties, the committeeCommittee may request from the Board the resources to engage external consultants. The committeeCommittee reports on its activities to the Board of Directors. The committee met on January 30, July 12 and November 28 in 2006, with an average effective attendance of 88.9%.In 2008, the Committee’s members were Messrs. Bertrand Collomb, Michel Pébereau and Serge Tchuruk, each an independent director, are the members of the committee and director.
Mr. Michel Pébereau serves as its Chairman.chairs the Committee. Nominating & Governance Committee In February 2007, the Nominating & Governance Committee was separated from the then existing Nominating & Compensation Committee. The committee proposedprincipal objectives of this Committee are to: recommend to the Board of Directors the persons that are qualified to be appointed as directors, Chairman or Chief Executive Officer; prepare the Company’s corporate governance rules and supervise their implementation; and examine any questions referred to it by the Board or the Chairman of the Board, in particular questions related to ethics. Its duties include the following: presenting recommendations to the Board for its membership and the membership of its committees; proposing annually to the Board the list of directors towho may be recommended for appointment byconsidered as “independent directors” of the shareholders’ meeting.Company; In addition to its proposals forassisting the compensationBoard in the selection and evaluation of the Chairman of the Board and the Chief Executive Officer and regarding stock optionsexamining the preparation of their possible successors, in cooperation with the Compensation Committee;
preparing a list of individuals who might be considered for election as Directors and restricted share grants,those who might be named to serve on Board committees; proposing methods for the committee also proposedBoard to modifyevaluate its performance; proposing the rulesprocedure for awardingallocating directors’ fees. This proposal was adoptedfees; and
developing and recommending to the Board the corporate governance principles applicable to the Company. Nominating & Governance Committee membership and practices The Committee is made up of at least three directors designated by the Board subject to the approvalof Directors. A majority of the total amount tomembers must be distributed to directors byindependent directors. Members of the shareholders’ meeting to be held on May 11, 2007. The committee also proposed a policy for determiningNominating & Governance Committee, other than the compensation and other advantages awarded to the Chairman and to the Chief Executive Officer.
The committee directed a self-evaluation of the Board and selected the Chief Executive Officer, may not receive from the Company and its subsidiaries any compensation other than:
directors’ fees paid for their services as directors or as members of the committee, or, if applicable, as members of another committee of the Company’s Board; and compensation and pension benefits related to prior employment by the Company which are not dependant upon future work or activities. The Committee appoints its chairman and its secretary. The secretary is a Company senior executive. The Committee meets at least twice a year. The Committee may invite the Chairman of the Board or the Chief Executive Officer of the Company, as applicable, to present recommendations. Neither the Chairman nor the Chief Executive Officer may be present during deliberations regarding his own situation. While maintaining the appropriate level of confidentiality for its discussions, the Committee may request that the Chief Executive Officer provide it with the assistance of any senior executive of the Company whose skills and qualifications could facilitate the handling of an agenda item. If it deems it necessary to accomplish its duties, the Committee may request from the Board the resources to engage external consultancy retainedconsultants. The Committee reports on its activities to assist with this evaluation. The self-evaluation was conducted in the fall of 2006 and confirmed that the Board of Directors had made appropriate choices in organizing its operations. A discussionDirectors. In 2008, the Committee’s members were Messrs. Bertrand Collomb, Thierry Desmarest, Michel Pébereau and Serge Tchuruk. Each, with the exception of the results of this self-evaluation was on the agendaChairman of the Board, meeting held on February 13, 2007.is an independent director. The committee also conducted a financial reviewMr. Thierry Desmarest chairs the Committee.
Board of the compensation of the Company’s management bodies and of the Company’s pension and insurance plans, in preparation for the disclosure of this information in the Company’s annual report for 2006. Director IndependenceDirectors practices
The committee proposed to the Board a list of independent directors based on generally recognized corporate governance principles. The Nominating & Compensation committee proposed that the Board consider a director to be independent when that director has “no relationship, of any nature, with the company, group or its management which could compromise the independent exercise of his judgement”, pursuant to the AFEP-MEDEF (French corporate associations) report of 2002.
At its meeting on February 13, 2007,11, 2009, the Board acting on a proposal fromof Directors discussed its practices. Pursuant to the committee, determined that, as of December 31, 2006, the following directors were independent: Messrs. Bouton, Collomb, Desmarais, Jacquillat, Jeancourt-Galignani, Levene, Lippens, Pébereau, de Rudder, Tchuruk and Vaillaud.
These directors meet the independence criteria contained in the AFEP-MEDEF report of 2002, with the exception of Mr. Tchuruk, who has been a directorrecommendation of the Company for a period exceeding the 12 years recommended by the report. The Board, taking into account the nature of the Company’s industry, with the associated long-term investments and activities, considered that service as a director over a long period corresponds to certain experience and authority that strengthens the independence of a director. Upon this basis,Nominating & Governance Committee, at its meeting on February 11, 2009, the Board concluded that Mr. Tchuruk was an independent director.
its methods and practices were appropriate to meet its responsibilities, both in regards to the number and length of its meetings and to the issues addressed at these meetings. In evaluating the independence criteria under the reportparticular, it concluded that matters related to material client, supply, banking or investment banking relationships between a directorthe technical, economic and geopolitical environment had been adequately addressed through the Company,agenda of its meetings in 2008. In addition, the Board considereddecided that certain cross-functional issues related to the business dealings between Group companiesenvironment and the banking institutions where Messrs. Bouton and Pébereau are members of the administrative or management bodies, which amount to less than 0.1% of their net banking income, are not material. The Board concluded the Messrs. Bouton and Pébereau were independent directors. Under this evaluation, 73.3% of the members of the Board of Directors are considered totransportation would be independent.
The Board also noted that there were no potential conflicts of interest between the Company and its directors.examined starting in 2009.
Policy for determining the compensation and other benefits of the Chairman and of the Chief Executive Officer Based on a proposal by the committee,Compensation Committee, on February 11, 2009, the Board adopted the following policy for determining the compensation and other advantagesbenefits of the Chairman and of the Chief Executive Officer: Compensation and benefits for the Chairman and the Chief Executive Officer isare set by the Board of Directors after considering proposals from the Compensation Committee. Such compensation shall be reasonable and fair, in a context that values both teamwork and motivation within the Company. Compensation for the Chairman and the Chief Executive Officer is related to market practice, work performed, results obtained and responsibilities held. Compensation for the Chairman and the Chief Executive Officer includes both a fixed portion and a variable portion, each of which are reviewed annually.
| Compensation for the Chairman and the Chief Executive Officer includes both a fixed portion and a variable portion, each of which is reviewed annually. |
The amount of variable compensation may not exceed a stated percentage of fixed compensation. Variable compensation is determined based on pre-defined quantitative and qualitative criteria. Quantitative criteria are limited in number, objective, measurable and adapted to the Group’s strategy. | | Variable compensation is determined based on pre-defined quantitativedesigned to reward short-term performance and progress towards medium-term objectives. The qualitative criteria. Quantitative criteria for variable compensation are limited in number, objective, measurable and adapteddesigned to the Group’s strategy. allow exceptional circumstances to be taken into account, when appropriate. |
Variable compensation is designed
The Group does not have a specific pension plan for the Chairman and the Chief Executive Officer. They are eligible for retirement benefits and pensions available to reward short-term performance and progress towards medium-term objectives. The qualitative criteria for variable compensation are designed to allow exceptional circumstances to be taken into account, when appropriate.other employees of the Group under conditions determined by the Board. Stock options are designed to align the long-term interests of the Chairman and the Chief Executive Officer with those of the shareholders. | Awards of stock options are considered in light of the amount of the total compensation paid to the Chairman and the Chief Executive Officer. The exercise of stock options to which the Chairman and the Chief Executive Officer are entitled is subject to a performance condition. |
| The exercise price for stock options awarded is not discounted compared to the market price, at the time of the grant, for the underlying share. |
| Stock options are awarded at regular intervals to prevent opportunistic behavior. |
| The Board has put in place restrictions on the transfer of a portion of shares issued upon the exercise of options. |
After three years in light ofoffice, the amount of the total compensation paid to the Chairman and the Chief Executive Officer. The exercise price for stock options awarded is not discounted compared to the market price for the underlying share.
Stock options are awarded at regular intervals to prevent opportunistic behavior.
The Chairman and Chief Executive Officer are required to hold aat least the number of Company shares ofset by the Company equal in value to two years of the fixed portion of their annual compensation.Board.
The Chairman and Chief Executive Officer do not receive restricted share grants. Recent Corporate Governance DevelopmentsDirector independence
At its meeting on February 13, 2007,11, 2009, the Board of Directors, acting on a proposal byfrom the Nominating & Compensation Committee, enacted certain changes related to the Group’s corporate governance, effective as of February 2007. The Board amended the Directors Charter, subsequently renamed the Rules of Procedure of the Board of Directors, mainly to take into account the fact that separate individuals would serve as Chairman and as Chief Executive Officer and to create a separate Nominating & Governance Committee, reviewed the independence of the Company’s directors as of December 31, 2008. Also based on the Committee’s proposal, the Board considered that, pursuant to the AFEP-MEDEF Code, a director is independent when “he or she has no relationship, of any nature, with the company, its group or the management of either, that may compromise the exercise of his or her freedom of judgement”. Mrs. Barbizet, Mr. Bouton, Mr. Collomb, Mr. Desmarais, Mr. Jacquillat, Mr. Jeancourt-Gallignani, Lord Levene of Portsoken, Mr. Mandil, Mr. Pébereau, Mr. de Rudder, Mr. Tchuruk and Compensation CommitteeMr. Vaillaud were deemed to dividebe independent directors. These directors meet the dutiescriteria set forth in the AFEP-MEDEF Code, with the exception of one individual who has been a director for longer than twelve years. For a company that has long-term investments and activities, a longer term of office gives experience and authority, and thereby reinforces the independence of directors. The Board concluded that Mr. Tchuruk, the only director concerned by this criterion, should be considered as independent. Concerning “material” relationships, as a client, supplier, investment or finance banker, between a director and the Company, the Board deemed that the level of activity between Group companies and the banks at which two of its Directors are officers, which is less than 0.1% of their net banking income and less than 5% of the former Nominating & Compensation Committee. Group’s overall external financing (including confirmed but undrawn credit lines) represent neither a material portion of the overall activity of these banks nor a material portion of the Group’s external financing. The Board concluded that Mr. Bouton and Mr. Pébereau should be considered as independent Directors. 75% of the directors are independent. The Board also adopted charters for these committees. Also on February 13, 2007,noted the Boardabsence of Directors appointed Mr. Christophe de Margerie as Chief Executive Officerpotential conflicts of interests between the Company. Mr. Thierry Desmarest remains Chairman of the Board of Directors.Company and its directors.
Employees, Share Ownership, Stock Options and Restricted Share Grants
Employees The tables below set forth the number of employees, by divisionsdivision and geographic location, of the Group (fully consolidated subsidiaries) as of the end of the periods indicated.indicated: | | | | | | | | | | | | | | Upstream | | Downstream | | Chemicals | | Corporate | | Total | 2006(a) | | 14,862 | | 34,467 | | 44,504 | | 1,237 | | 95,070 | 2005 | | 14,849 | | 34,611 | | 62,214 | | 1,203 | | 112,877 | 2004 | | 14,597 | | 34,045 | | 61,570 | | 1,189 | | 111,401 | | | | | | France | | Rest of Europe | | Rest of world | | Total | 2006(a) | | | | 37,831 | | 26,532 | | 30,707 | | 95,070 | 2005 | | | | 48,751 | | 30,140 | | 33,986 | | 112,877 | 2004 | | | | 49,174 | | 29,711 | | 32,516 | | 111,401 |
(a) | At December 31, 2006, these figures exclude the employees of Arkema, pursuant to the spin-off of these activities in May 2006. |
| | | | | | | | | | | | | | Upstream | | Downstream | | Chemicals | | Corporate | | Total | 2008 | | 16,005 | | 34,040 | | 45,545 | | 1,369 | | 96,959 | 2007 | | 15,182 | | 34,185 | | 45,797 | | 1,278 | | 96,442 | 2006 | | 14,862 | | 34,467 | | 44,504 | | 1,237 | | 95,070 | | | | | | France | | Rest of Europe | | Rest of world | | Total | 2008 | | | | 37,101 | | 27,495 | | 32,363 | | 96,959 | 2007 | | | | 37,296 | | 27,374 | | 31,772 | | 96,442 | 2006 | | | | 37,831 | | 26,532 | | 30,707 | | 95,070 |
TOTAL believes that the relationship between its management and labor unions is, in general, satisfactory. Arrangements for involving employees in the capital of the Company Pursuant to agreements signed on March 15, 2002, as amended, the Group created a “Total Group Savings Plan” (PEGT), a “Partnership for Voluntary Wage Savings Plan” (PPESV, later becoming PERCO) and a “Complementary Company Savings Plan” (PEC) for employees of the Group’s French companies. These plans allow investments in a number of mutual funds including one that invests in Company shares (“Total Actionnariat France”TOTAL ACTIONNARIAT FRANCE”). A “Shareholder Group Savings Plan” (PEG-A) has also been in place since November 19, 1999 to facilitate capital increases reserved for employees of the Group’s French and foreign subsidiaries covered by these plans. Savings PlansCompany savings plans
The various Company Savingssavings plans (PEGT, PEC) and the Group Savings plan (“Plan d’Épargne Groupe Actionnariat” (PEG-A) linked to the capital increase operations reserved for employees, give the employees of French Group Companies belonging to these savings plans access to several collective investment plans (Fondsfunds (Fonds communs de placement)placement), including a Fund invested in shares of the Company (“Total Actionnariat France”TOTAL ACTIONNARIAT FRANCE”). For the employees of foreign companies, theThe capital increases reserved for employees wereare conducted under PEG-A through the “Total Actionnariat International” Fund and the Caisse Autonome“TOTAL ACTIONNARIAT FRANCE” fund for employees of the Group in Belgium.Group’s French subsidiaries and through the “TOTAL ACTIONNARIAT INTERNATIONAL CAPITALISATION” fund for the employees of foreign companies. In addition, U.S. employees participate in these operations through ADRs and Italian employees
may participate by directly subscribing to new shares.shares at the Caisse Autonome of the Group in Belgium. Incentive agreements Performance indicators used under the June 30, 2006, profit-sharing agreements for employees of ten Group companies, when permitted by local law, link amounts available for profit sharing to the performance (ROE) of the Group as a whole. Employee shareholding The total number of TOTAL shares held by employees as of December 31, 20062008, is as follows: | | | Total Actionnariat FranceTOTAL ACTIONNARIAT FRANCE
| | 68,675,75469,206,754 | Total Actionnariat InternationalTOTAL ACTIONNARIAT INTERNATIONAL CAPITALISATION
| | 15,542,25316,364,272 | Privatisation No. 1ELF PRIVATISATION No.1
| | 1,683,2551,423,273 | Shares held by U.S. employees | | 1,905,522779,445 | Group Caisse Autonome (Belgium)in Belgium | | 491,784336,001 | TOTAL shares from the exercise of the Company’s stock options and held as registered shares within a Company Savings Plan (PEE) | | 2,530,3853,201,243 | Total shares held by employee shareholder funds | | 90,828,95391,310,988 |
As of December 31, 2006,2008, the employees of the Group held, on the basis of the definition of employee shareholding contained in Article L. 225-102 of the French Commercial Code, 90,828,95391,310,988 TOTAL shares, representing 3.74%3.85% of the Company’s share capital and 7.40% of the voting rights that could be exercised at a shareholders’ meeting on that date.
Capital increase reserved for employees TheAt the shareholders’ meeting held on May 17, 200511, 2007, the shareholders delegated to the Board of Directors the authority to undertake,increase the share capital of the Company in one or several steps,more transactions and within a maximum period of 26 months a capital increase reserved forfrom the employees participating in a savings plan. Pursuant to this delegationdate of authority, the number of shares to be issued cannot exceedmeeting, by an amount not exceeding 1.5% of the share capital stockoutstanding on the daydate of the meeting of the Board of Directors at which a decision to proceed with an issuance is made reserving subscriptions for such issuance to the Group employees participating in a company savings plan. It was specified that decided on the issue. Theamount of any such capital stock issued willincrease reserved for Group employees would be counted against the overall ceiling for theaggregate maximum nominal amount of share capital increase that could beincreases authorized under the same delegation of authority granted by the shareholders’ meeting held on May 17, 200511, 2007, for issuing new ordinary shares or other securities granting immediate or future access to the Board whenCompany’s share capital is increased through ordinary share issues or through any marketable security linked to the capital that maintains preferentialwith pre-emptive subscription rights (4 B€ of parin nominal value). This delegation of authority has cancelled and replaced, for the unused
part, the one granted by the shareholders’ meeting of May 14, 2004.17, 2005. Pursuant to this delegation of authority, the Board of Directors decided on November 3, 20056, 2007, to proceed with a capital increase of a maximum of three million Company shares with a par value of€10 per share, representing 12 million shares with a par valuesubscription price of€2.5044.40 per share reserved for TOTAL employees, bearing dividends as of January 1, 2007. In accordance with Article 14 of the FrenchAutorité des marchés financiers (AMF) instruction No. 2005-11 as of December 13, 2005, atregarding the information to be disclosed in case of a pricecapital increase operation, TOTAL S.A. released on January 16, 2008, on its website and filed with the AMF a press release which specified the terms of€166.60 per share with a par value of€10 or€41.65 per share with a par value of€2.50.The the offering. The offering was opened to the employees of TOTAL S.A. and to the employees of its French and foreign subsidiaries in which TOTAL S.A. holds directly or indirectly 50% at least of the capital, who are participants in the TOTAL Group Savings Plan (PEG-A) and for which local regulatory approval was obtained. The offering was also openedopen to former employees of TOTAL S.A. and its French subsidiaries who took their retirement.have retired and still have holdings in TOTAL employee savings plans. Subscription was openedopen from February 6March 10, 2008, through February 24, 2006,March 28, 2008, and resulted4,870,386 new TOTAL shares were issued in the issuance of 2,785,330 new shares with a par value of€10 per share, or 11,141,320 new shares with a par value of€2.50 per share, in 2006.2008. Shares held by Directorsdirectors and Executive Officersexecutive officers OnAs of December 31, 2006,2008, based upon information from the members of the Board and the share registrar, the members of the Board and the Executive Officers of the Group (Management Committee and Treasurer) held a total of less than 0.5% of the Company’s shares:
Members of the Board of Directors (including the Chairman)Chairman and the Chief Executive Officer): 680,773569,094 shares. Executive Officers (including the Chairman): 1,616,337 shares.
Chairman of the Board of Directors: 477,200385,576 shares. Chief Executive Officer: 85,230 shares and 39,330 shares of the TOTAL ACTIONNARIAT FRANCE collective investment plan. Management Committee and Treasurer (including the Chief Executive Officer): 830,461 shares. By decision of the Board of Directors: The Chairman and Chief Executive Officer are required to hold a number of shares of the Company equal in value to two years of the fixed portion of their annual compensation. Members of the Executive Committee are required to hold a number of shares of the Company equal in value to two years of the fixed portion of their annual compensation. These shares have to be acquired within three years of the appointment to the Executive Committee. The number of TOTAL shares to be considered includes: directly held shares, whether or not they are subject to transfer restrictions; and shares in collective investment plans (FCPE) invested in TOTAL shares.
ShareSummary of transactions in the Company’s securities
The following table presents transactions, of which the Company has been informed, in the Company’s shares or related financial instruments carried out in 20062008 by the relevant individuals(1) concerned under paragraphs a) through c) of Article L.621-18-2L. 621-18-2 of the French Monetary and Financial Code. Year 2008 | | | | | | | | | | | | | | | | | Purchases(a) | | Subscriptions(a) | | Sales(a) | | | Swaps(a) | Thierry Desmarest | | TOTAL shares | | 276,000.00 | | 116,000.00 | | 208,000.00 | (c) | | | | | Shares in savings plans (FCPE), and other related financial instruments(b) | | | | | | | | | | Christophe de Margerie | | TOTAL shares | | 36,000.00 | | | | | | | | | | Shares in savings plans (FCPE), and other related financial instruments(b) | | 1,071.06 | | 7,704.63 | | | | | | Daniel Boeuf | | TOTAL shares | | | | | | | | | | | | Shares in savings plans (FCPE), and other related financial instruments(b) | | | | 312.12 | | | | | | Pierre Vaillaud | | TOTAL shares | | 2,000.00 | | | | 2,000.00 | | | | | | Shares in savings plans (FCPE) and other related financial instruments(b) | | | | | | | | | | François Cornélis | | TOTAL shares | | 225,748.00 | | | | 215,748.00 | | | | | | Shares in savings plans (FCPE), and other related financial instruments(b) | | 207.08 | | 4,184.00 | | | | | | Michel Bénézit | | TOTAL shares | | 70,000.00 | | 5,350.00 | | 42,500.00 | | | | | | Shares in savings plans (FCPE), and other related financial instruments(b) | | 6.42 | | 3,018.82 | | 3,105.26 | | | | Robert Castaigne | | TOTAL shares | | | | 45,232.00 | | 20,000.00 | | | | | | Shares in savings plans (FCPE), and other related financial instruments(b) | | 2.25 | | 6,800.00 | | 7,015.81 | | | | Yves-Louis Darricarrère | | TOTAL shares | | | | 10,880.00 | | | | | | | | Shares in savings plans (FCPE), and other related financial instruments(b) | | 0.43 | | 3,721.49 | | | | | | Bruno Weymuller | | TOTAL shares | | | | | | | | | | | | Shares in savings plans (FCPE), and other related financial instruments(b) | | 242.78 | | 3,961.58 | | 5,201.99 | | | |
| | | | | | | | | | | | | | | | | | Acquisition | | Subscription | | Transfer | | Exchange | | Exercise
of stock options | Thierry Desmarest(a) | | TOTAL shares | | 12,000 | | | | 160,000 | | | | 139,000 | | | | Shares in collective investment plans (FCPE), and other related financial instruments(b) | | | | | | | | | | | Christophe de Margerie(a) | | TOTAL shares | | | | | | 45,982 | | | | 73,012 | | | | Shares in collective investment plans (FCPE), and other related financial instruments(b) | | 1,713.28 | | 1,857.26 | | | | | | | Michel Bénézit(a) | | TOTAL shares | | | | | | 135 | | | | | | | | Shares in collective investment plans (FCPE), and other related financial instruments(b) | | 149.18 | | 4,539.46 | | | | | | | Robert Castaigne(a)(c) | | TOTAL shares | | | | | | 10,000 | | | | 39,696 | | | | Shares in collective investment plans (FCPE), and other related financial instruments(b) | | | | 7,100.00 | | 6,950.00 | | | | | François Cornélis(a) | | TOTAL shares | | | | | | 13,576 | | | | 13,576 | | | | Shares in collective investment plans (FCPE), and other related financial instruments(b) | | 557.46 | | 4,353.00 | | | | | | | Yves-Louis Darricarrère(a) | | TOTAL shares | | | | | | | | | | 2,500 | | | | Shares in collective investment plans (FCPE), and other related financial instruments(b) | | 2.52 | | 2,071.08 | | 2,108.45 | | | | | Jean-Jacques Guilbaud(a) | | TOTAL shares | | | | | | 14,000 | | | | 3,043 | | | | Shares in collective investment plans (FCPE), and other related financial instruments(b) | | 232.22 | | 3,928.61 | | 1,320.03 | | | | | Antoine Jeancourt-Galignani(a) | | TOTAL shares | | 1,000 | | | | | | | | | | | | Shares in collective investment plans (FCPE), and other related financial instruments(b) | | | | | | | | | | | Patrick de La Chevardière(a)(d) | | TOTAL shares | | | | | | | | | | | | | Shares in collective investment plans (FCPE), and other related financial instruments(b) | | 21.06 | | 113.07 | | | | | | |
| (a) | To reflectIncluding the four-for-one stock split approved byrelated persons in the shareholders’ meeting on May 12, 2006,meaning of the numberprovisions of TOTAL sharesthe Article R. 621-43-1 of the French Monetary and interests in FCPEs for transactions carried out prior to May 18, 2006, either directly or through a FCPE, has been multiplied by four.Financial Code. |
| (b) | FCPECollective investment plans (FCPE) primarily investing in Company shares. |
| (c) | In addition, on January 2, 2007 Mr. Desmarest sold 80,000 shares.Until May 30, 2008. |
Stock options and restricted share grants policy AwardGeneral policy
Stock options and restricted share grants concern only shares of TOTAL S.A. No options for or restricted grants of shares of any of the Group’s listed subsidiaries are awarded. AlllAll plans are approved by the Board of Directors, based on recommendations by the Compensation Committee. For each plan, the committee establishesCompensation Committee proposes a list of the beneficiaries and the number of options or restricted shares granted to each beneficiary. The Board of Directors then gives final approval for this list.
(1) | Including related persons as defined under Article R.621-43-1 of the French Monetary and Financial Code. |
Stock options have a term of eight years, with an exercise price set at the average of the opening share prices during the 20 trading days prior to the grantaward date, without any discount being applied. For the option plans established after 2002, options may only be exercised after an initial two-year period and the shares issued upon exercise may not be transferred prior to the termination of an additional two-year holding period. For the option plans established on July 17, 2007 and October 9, 2008, decided by the Board of Directors on July 17, 2007 and September 9, 2008, respectively, the transfer or conversion to bearer shares of shares issued from the exercise of stock options, for the beneficiaries of an employment contract with a non-French subsidiary on the date of the award, can take place after the termination of the initial two-year period. Restricted share grants become final after a two-year vesting period, subject to certain pre-defined conditions, set by the Board acting upon recommendations from the Compensation Committee,a performance condition related to the returnReturn on equityEquity (ROE) of the Group, based on the Group’s consolidated accounts in the fiscal year preceding the year of final attribution. This performance condition is defined in advance by the Board of Directors on recommendations by the Compensation Committee. At the end of this vesting period, and subject to these performance conditions, the restricted share grants become final. However, these shares may not be transferred prior to the end of an additional two-year holding period. For the 2006, 2007 and 2008 Plans, the conditional restricted share grants are subject to a performance condition. This condition states that the number of restricted shares finally granted is based on the ROE of the Group related to the fiscal year preceding the year of the final grant. This final acquisition rate, expressed as a percentage of the restricted shares granted by the Board of Directors: is equal to zero if the ROE is less than or equal to 10%; varies on a straight-line basis between 0% and 80% if the ROE is more than 10% and less than 18%; varies on a straight-line basis between 80% and 100% if the ROE is more than or equal to 18% and less than 30%; and is equal to 100% if the ROE is more than or equal to 30%. The 2005 Plan was subject to a performance condition that stated that the acquisition rate of the restricted shares granted was equal to zero if the ROE for 2006 was less than 10%, equal to 100% if the ROE was more than 20% and varied on a straight-line basis between 0% and 100% if the ROE was between 10% and 20%. The grant of these options or restricted shares is used to complement, based upon individual performance assessments at the time of each plan, the Group-wide policy of developing employee shareholding (including saving plans, and capital increases reserved for employees every two years) andwhich allows employees to be more closely associated with the financial and share price performance of TOTAL. Grants to the Chairman, the Chief Executive Officer and executive officers Pursuant to the requirements introduced by French law 2006-1770 of December 30, 2006, the Board of Directors decided that, for the share subscription option plans of July 17, 2007 and October 9, 2008, the Chairman of the Board and the Chief Executive Officer will have to hold a number of TOTAL shares representing 50% of the capital gains, net of tax and related contributions, resulting from the exercise of stock options under these plans in the form of TOTAL shares. Once the Chairman and the Chief Executive Officer hold a number of shares (including shares or interests in collective investment funds invested in Company securities) corresponding to more than five times their current gross annual fixed salary, this holding requirement will be reduced to 10%. If in the future this ratio is no longer met, the previous 50% holding requirement will once again apply. The Chairman of the Board of Directors was not granted any stock options under the plan of October 9, 2008, created by the Board of Directors on September 9, 2008. In addition, performance indicators used under profit-sharing agreements allow the Group, when permitted by local legislation, to benefit from the performanceChairman of the GroupBoard of Directors was not granted any restricted shares under the plans awarded on July 18, 2006, July 17, 2007 and October 9, 2008. The Chief Executive Officer was not granted any restricted shares under the plans awarded on July 18, 2006, July 17, 2007 and October 9, 2008.
In addition, as part of the share subscription option plans awarded on July 17, 2007 and September 9, 2008, the Board required that, for each beneficiary of more than 25,000 stock options, one third of the options granted in excess of this number be subject to a whole.performance condition. This condition states that the final grant rate will be based on the ROE of the Group. The ROE will be calculated on the consolidated accounts published by TOTAL related to the fiscal year preceding the year of vesting. The grant rate:
is equal to zero if the ROE is less than or equal to 10%; varies on a straight-line basis between 0% and 80% if the ROE is more than 10% and less than 18%; varies on a straight-line basis between 80% and 100% if the ROE is more than or equal to 18% and less than 30%; and is equal to 100% if the ROE is more than or equal to 30%.
SUMMARY OF COMPENSATION, STOCK OPTIONS AND RESTRICTED SHARES GRANTED TO THE CHAIRMAN AND THE CHIEF EXECUTIVE OFFICER | | | | | | (€) | | 2008 | | 2007 | Thierry Desmarest Chairman of the Board of Directors | | | | | | | | Compensation(a) | | 2,069,430 | | 2,263,905 | Value of options granted(b) | | — | | 1,529,000 | Value of restricted shares granted(c) | | — | | — | Total | | 2,069,430 | | 3,792,905 | Christophe de Margerie Chief Executive Officer | | | | | | | | Compensation(a) | | 2,808,395 | | 2,693,435 | Value of options granted(b) | | 998,000 | | 2,780,000 | Value of restricted shares granted(c) | | — | | — | Total | | 3,806,395 | | 5,473,435 |
| (a) | Compensation further detailed in the table “— Compensation of the Chairman and the Chief Executive Officer”. |
| (b) | Options granted in 2008 are detailed in the table “— Stock options granted in 2008 to the Chairman and the Chief Executive Officer”. The value of options granted was calculated on the day they were granted using the Black-Scholes model based on the assumptions used for the consolidated accounts (see Note 25 to the Consolidated Financial Statements). |
| (c) | The Chairman and Chief Executive Officer were not granted any restricted shares as part of the plans awarded on July 17, 2007 and October 9, 2008. |
COMPENSATION OF THE CHAIRMAN AND THE CHIEF EXECUTIVE OFFICER | | | | | | | | | | | | 2008 | | 2007 | | (€) | | Amount
due for
2008 | | Amount
paid in
2008(a) | | Amount
due for
2007 | | Amount
paid in
2007(a) | Thierry Desmarest Chairman of the Board of Directors | | | | | | Fixed compensation | | 1,100,000 | | 1,100,000 | | 1,151,706 | | 1,151,706 | Variable compensation(b) | | 969,430 | | 1,112,199 | | 1,112,199 | | 1,676,109 | Extraordinary compensation | | — | | — | | — | | — | Directors’ fees | | — | | — | | — | | — | In-kind benefits | | — | | — | | — | | — | Total | | 2,069,430 | | 2,212,199 | | 2,263,905 | | 2,827,815 | Christophe de Margerie | | | | | | | | | Chief Executive Officer | | | | | | | | | | | | | | Fixed compensation | | 1,250,000 | | 1,250,000 | | 1,191,580 | | 1,191,580 | Variable compensation(c) | | 1,552,875 | | 1,496,335 | | 1,496,335 | | 705,140 | Extraordinary compensation | | — | | — | | — | | — | Directors’ fees | | — | | — | | — | | — | In-kind benefits(d) | | 5,520 | | 5,520 | | 5,520 | | 5,520 | Total | | 2,808,395 | | 2,751,855 | | 2,693,435 | | 1,902,240 |
| (a) | Variable portion paid for prior fiscal year. |
| (b) | The variable portion for the Chairman is calculated by taking into account the Group’s return on equity during the relevant fiscal year, the Group’s earnings compared to those of other major international oil companies, as well as the Chairman’s personal contribution to the Group strategy, corporate governance and performance. The variable portion can reach a maximum amount of 100% of the fixed base salary. The objectives related to personal contribution were considered to be met in 2008. |
| (c) | The variable portion for the Chief Executive Officer is calculated by taking into account the Group’s return on equity during the relevant fiscal year, the Group’s earnings compared to those of other major international oil companies as well as the Chief Executive Officer’s personal contribution based on operational target criteria. The variable portion can reach a maximum amount of 140% of the fixed base salary, which may be increased up to 165% for exceptional performance. The objectives related to personal contribution were considered to be met in 2008. |
| (d) | Mr. de Margerie has the use of a company car. |
STOCK OPTIONS GRANTED IN 2008 TO THE CHAIRMAN AND THE CHIEF EXECUTIVE OFFICER | | | | | | | | | | | | | | | | | | Date of plan | | | Type of options | | Value of
options (€) | | | Number of options
granted during
fiscal year(a) | | Exercise
price (€) | | Exercise period | Thierry Desmarest | | 2008 Plan | (b) | | Subscription
options | | — | | | — | | — | | — | Chairman of the Board of Directors | | 10/09/2008 | | | | | | | | | | | | | Total | | | | | | | — | | | — | | | | | Christophe de Margerie | | 2008 Plan | (b) | | Subscription
options | | 998,000 | (c) | | 200,000 | | 42.90 | | October 10, 2010 | Chief Executive Officer | | 10/09/2008 | | | | | | | | | | | | October 9, 2016 | Total | | | | | | | 998,000 | (c) | | 200,000 | | | | |
| (a) | As part of the share subscription option plan awarded on October 9, 2008, the Board of Directors decided that for each beneficiary of more than 25,000 options, a portion of these options will be finally awarded after a two-year vesting period, subject to a performance condition. |
| (b) | Option plan decided by the Board of Directors on September 9, 2008, and awarded on October 9, 2008. |
| (c) | The value of options granted was calculated on the day they were granted using the Black-Scholes model based on the assumptions used for the consolidated accounts (see Note 25 to the Consolidated Financial Statements). |
STOCK OPTIONS EXERCISED IN 2008 BY THE CHAIRMAN AND THE CHIEF EXECUTIVE OFFICER | | | | | | | | | | Date of plan | | Number of options
exercised during
fiscal year | | Exercise
price (€) | Thierry Desmarest | | 2002 Plan | | | | | Chairman of the Board of Directors | | 07/09/2002 | | 139,000 | | 39.03 | Total | | | | 139,000 | | | Christophe de Margerie Chief Executive Officer | | 2000 Plan
07/11/2000 | | 73,012 | | 40.11 | Total | | | | 73,012 | | |
RESTRICTED SHARE GRANTS AWARDED IN 2008 TO THE CHAIRMAN, THE CHIEF EXECUTIVE OFFICER OR ANY DIRECTOR (CONDITIONAL AWARD) | | | | | | | | | | | | | | | | | Date of plan | | | Number of shares
granted during
fiscal year | | Value of
shares
granted (€)(a) | | Acquisition
date | | Availability
date | | Performance
condition | Thierry Desmarest Chairman of the Board of Directors | | 2008 Plan
10/09/2008 | (b)
| | — | | — | | — | | — | | — | Christophe de Margerie Chief Executive Officer | | 2008 Plan
10/09/2008 | (b)
| | — | | — | | — | | — | | — | Daniel Boeuf Director representing the employee shareholders | | 2008 Plan
10/09/2008 | (b)
| | 588 | | 18,175 | | 10/10/2010 | | 10/10/2012 | | Condition based on the Group’s ROE for fiscal year 2009 | Total | | | | | 588 | | 18,175 | | | | | | |
| (a) | The value of the restricted shares granted is determined on the day of the award in compliance with IFRS 2. |
| (b) | Share grant decided by the Board of Directors on September 9, 2008, and awarded on October 9, 2008. The Chairman and Chief Executive Officer were not granted any restricted shares as part of the plan awarded on October 9, 2008. |
RESTRICTED SHARES FINALLY GRANTED IN 2008 TO THE CHAIRMAN, THE CHIEF EXECUTIVE OFFICER OR ANY DIRECTOR | | | | | | | | | | Date of plan | | Number of shares
finally granted during
fiscal year(a) | | Acquisition
condition | | Thierry Desmarest Chairman of the Board of Directors | | 2006 Plan
07/18/2006 | | — | | n/a | | Christophe de Margerie Chief Executive Officer | | 2006 Plan
07/18/2006 | | — | | n/a | | Daniel Boeuf Director representing the employee shareholders | | 2006 Plan
07/18/2006 | | 416 | | (b | ) | Total | | | | 416 | | | |
| (a) | Shares finally granted to the beneficiaries after a 2-year vesting period (i.e., on July 19, 2008). |
| (b) | The Chairman and Chief Executive Officer were not granted any restricted shares as part of the plan decided by the Board of Directors on July 18, 2006. In addition, the Board of Directors on May 6, 2008 noted that the acquisition rate, connected to the performance condition, amounted to 100%. Moreover, the transfer of the restricted shares finally granted will only be permitted after the end of a 2-year mandatory holding period (i.e., from July 19, 2010). |
TOTAL stock options plans The following table gives a breakdown of stock options awarded by category of beneficiaries (executive officers, senior managers and other employees) for the plans in effect during 2006.2008. | | | | | | | | | | | | | | | | | Number of
beneficiaries | | Number of options
awarded(g) | | Percentage | | | Average number
of options per
beneficiary(g) | 1998 Plan(a) | | | | | | | | | | | | Stock purchase options | | Executive Officers(f) | | 16 | | 157,500 | | 16.5 | % | | 9,844 | (Decision of the Board on March 17, 1998; exercise price:€93.76 (615 French francs); discount: 4.94%) | | Senior managers Other employees | | 162
824 | | 347,600
449,900 | | 36.4
47.1 | %
% | | 2,146
546 | | | Total | | 1,002 | | 955,000 | | 100.0 | % | | 953 | | | | | | | 1999 Plan(a) | | | | | | | | | | | | Stock purchase options | | Executive Officers(f) | | 19 | | 279,000 | | 18.6 | % | | 14,684 | (Decision of the Board on June 15, 1999; exercise price:€113.00; discount: 4.74%; exercise price after May 24, 2006:€27.86(g)) | | Senior managers Other employees | | 215
1,351 | | 517,000
703,767 | | 34.5
46.9 | %
% | | 2,405
521 | | | Total | | 1,585 | | 1,499,767 | | 100 | % | | 946 | | | | | | | 2000 Plan(b)(e) | | | | | | | | | | | | Stock purchase options | | Executive Officers(f) | | 24 | | 246,200 | | 10.2 | % | | 10,258 | (Decision of the Board on July 11, 2000; exercise price:€162.70; discount: 0.0%; exercise price after May 24, 2006:€40.11(g)) | | Senior managers Other employees | | 298
2,740 | | 660,700
1,518,745 | | 27.2
62.6 | %
% | | 2,217
554 | | | Total | | 3,062 | | 2,425,645 | | 100 | % | | 792 | | | | | | | 2001 Plan(c)(e) | | | | | | | | | | | | Stock purchase options | | Executive Officers(f) | | 21 | | 295,350 | | 11.0 | % | | 14,064 | (Decision of the Board on July 10, 2001; exercise price:€168.20; discount: 0.0%; exercise price after May 24, 2006:€41.47(g)) | | Senior managers Other employees | | 281
3,318 | | 648,950
1,749,075 | | 24.1
64.9 | %
% | | 2,309
527 | | | Total | | 3,620 | | 2,693,375 | | 100 | % | | 744 |
| | | | | | | | | | | | | | | | | Number of
beneficiaries | | Number of
options
awarded(i) | | Percentage | | | Average number
of options per
beneficiary(i) | 2000 Plan(a)(f): | | | | | | | | | | | | Purchase options | | Executive officers(g) | | 24 | | 246,200 | | 10.2 | % | | 10,258 | (Decision of the Board on July 11, 2000; exercise price:€162.70; discount: 0.0%, exercice price since May 24, 2006:€40.11(i)) | | Senior managers Other employees | | 298
2,740 | | 660,700
1,518,745 | | 27.2
62.6 | %
% | | 2,217
554 | | | Total | | 3,062 | | 2,425,645 | | 100 | % | | 792 | | | | | | | 2001 Plan(b)(f): | | | | | | | | | | | | Purchase options | | Executive officers(g) | | 21 | | 295,350 | | 11.0 | % | | 14,064 | (Decision of the Board on July 10, 2001; exercise price:€168.20; discount: 0.0%, exercice price since May 24, 2006:€41.47(i)) | | Senior managers Other employees | | 281
3,318 | | 648,950
1,749,075 | | 24.1
64.9 | %
% | | 2,309
527 | | | Total | | 3,620 | | 2,693,375 | | 100 | % | | 744 | | | | | | | 2002 Plan(c)(f): | | | | | | | | | | | | Purchase options | | Executive officers(g) | | 28 | | 333,600 | | 11.6 | % | | 11,914 | (Decision of the Board on July 9, 2002; exercise price:€158.30; discount: 0.0%, exercice price since May 24, 2006:€39.03(i)) | | Senior managers Other employees | | 299
3,537 | | 732,500
1,804,750 | | 25.5
62.9 | %
% | | 2,450
510 | | | Total | | 3,864 | | 2,870,850 | | 100 | % | | 743 | | | | | | | 2003 Plan(c)(f): | | | | | | | | | | | | Subscription options | | Executive officers(g) | | 28 | | 356,500 | | 12.2 | % | | 12,732 | (Decision of the Board on July 16, 2003; exercise price:€133.20; discount: 0.0%, exercice price since May 24, 2006:€32.84(i)) | | Senior managers Other employees | | 319
3,603 | | 749,206
1,829,600 | | 25.5
62.3 | %
% | | 2,349
508 | | | Total | | 3,950 | | 2,935,306 | | 100 | % | | 743 | | | | | | | 2004 Plan(c): | | | | | | | | | | | | Subscription options | | Executive officers(g) | | 30 | | 423,500 | | 12.6 | % | | 14,117 | (Decision of the Board on July 20, 2004; exercise price:€159.40; discount: 0.0%, exercice price since May 24, 2006:€39.30(i)) | | Senior managers Other employees | | 319
3,997 | | 902,400
2,039,730 | | 26.8
60.6 | %
% | | 2,829
510 | | | Total | | 4,346 | | 3,365,630 | | 100 | % | | 774 | | | | | | | 2005 Plan(c): | | | | | | | | | | | | Subscription options | | Executive officers(g) | | 30 | | 370,040 | | 24.3 | % | | 12,335 | (Decision of the Board on July 19, 2005; exercise price:€198.90; discount: 0.0%, exercice price since May 24, 2006:€49.04(i)) | | Senior managers Other employees | | 330
2,361 | | 574,140
581,940 | | 37.6
38.1 | %
% | | 1,740
246 | | | Total | | 2,721 | | 1,526,120 | | 100 | % | | 561 | | | | | | | 2006 Plan(c): | | | | | | | | | | | | Subscription options | | Executive officers(g) | | 28 | | 1,447,000 | | 25.3 | % | | 51,679 | (Decision of the Board on July 18, 2006; exercise price:€50.60; discount: 0.0%) | | Senior managers Other employees | | 304
2,253 | | 2,120,640
2,159,600 | | 37.0
37.7 | %
% | | 6,976
959 | | | Total | | 2,585 | | 5,727,240 | | 100 | % | | 2,216 |
| | | | | | | | | | | | | | | | | Number of
beneficiaries | | Number of options
awarded(g) | | Percentage | | | Average number
of options per
beneficiary(g) | | | | | | | 2002 Plan(d)(e) | | | | | | | | | | | | Stock purchase options | | Executive Officers(f) | | 28 | | 333,600 | | 11.6 | % | | 11,914 | (Decision of the Board on July 9, 2002; exercise price:€158.30; discount: 0.0%; exercise price after May 24, 2006:€39.03(g)) | | Senior managers Other employees | | 299
3,537 | | 732,500
1,804,750 | | 25.5
62.9 | %
% | | 2,450
510 | | | Total | | 3,864 | | 2,870,850 | | 100 | % | | 743 | | | | | | | 2003 Plan(d)(e) | | | | | | | | | | | | Stock subscription options | | Executive Officers(f) | | 28 | | 356,500 | | 12.2 | % | | 12,732 | (Decision of the Board on July 16, 2003; exercise price:€133.20; discount: 0.0%; exercise price after May 24, 2006:€32.84(g)) | | Senior managers Other employees | | 319
3,603 | | 749,206
1,829,600 | | 25.5
62.3 | %
% | | 2,349
508 | | | Total | | 3,950 | | 2,935,306 | | 100 | % | | 743 | | | | | | | 2004 Plan(d) | | | | | | | | | | | | Stock subscription options | | Executive Officers(f) | | 30 | | 423,500 | | 12.6 | % | | 14,117 | (Decision of the Board on July 20, 2004; exercise price:€159.40; discount: 0.0%; exercise price after May 24, 2006:€39.30(g)) | | Senior managers Other employees | | 319
3,997 | | 902,400
2,039,730 | | 26.8
60.6 | %
% | | 2,829
510 | | | Total | | 4,346 | | 3,365,630 | | 100 | % | | 774 | | | | | | | 2005 Plan(d) | | | | | | | | | | | | Stock subscription options | | Executive Officers(f) | | 30 | | 370,040 | | 24.3 | % | | 12,335 | (Decision of the Board on July 19, 2005; exercise price:€198.90; discount: 0.0%; exercise price after May 24, 2006:€49.04(g)) | | Senior managers Other employees | | 330
2,361 | | 574,140
581,940 | | 37.6
38.1 | %
% | | 1,740
246 | | | Total | | 2,721 | | 1,526,120 | | 100 | % | | 561 | | | | | | | 2006 Plan(d) | | | | | | | | | | | | Stock subscription options | | Executive Officers(f) | | 28 | | 1,447,000 | | 25.3 | % | | 51,679 | (Decision of the Board on July 19, 2006; exercise price:€50.60; discount 0.0%) | | Senior managers Other employees | | 304
2,253 | | 2,120,640
2,159,600 | | 37.0
37.7 | %
% | | 6,976
959 | | | Total | | 2,585 | | 5,727,240 | | 100 | % | | 2,216 |
| | | | | | | | | | | | | | | | | Number of
beneficiaries | | Number of
options
awarded(i) | | Percentage | | | Average number
of options per
beneficiary(i) | 2007 Plan(d): | | | | | | | | | | | | Subscription options | | Executive officers(g)(h) | | 27 | | 1,329,360 | | 22,8 | % | | 49,236 | (Decision of the Board on July 17, 2007; exercise price:€60.10; discount: 0.0%) | | Senior managers Other employees | | 298
2,401 | | 2,162,270
2,335,600 | | 37,1
40,1 | %
% | | 7,256
973 | | | Total | | 2,726 | | 5,827,230 | | 100 | % | | 2,138 | | | | | | | 2008 Plan(e): | | | | | | | | | | | | Subscription options | | Executive officers(g)(h) | | 26 | | 1,227,500 | | 27.6 | % | | 47,212 | (Grant decided by the Board of Directors on September 9, 2008 and awarded on October 9, 2008; exercise price:€42.90; discount: 0.0%) | | Senior managers Other employees | | 298
1,690 | | 1,988,420
1,233,890 | | 44.7
27.7 | %
% | | 6,673
730 | | | Total | | 2,014 | | 4,449,810 | | 100 | % | | 2,209 |
(a) | Options are exercisable after a five-year vesting period from the individual award date of individual grant and expire eight years after this date.
|
(b)
| Options are exercisable after a four-year vesting period from the individual award date of the Board meeting awarding the options and expire eight years after this date. The underlying shares may not be transferred during the five-year period from the individual award date.date of the Board meeting awarding the options. |
(c)(b)
| Options are exercisable after January 1, 2005, and expire eight years after the individual award date.date of the Board meeting awarding the options. The underlying shares may not be transferred during the four-year period from the individual award date.date of the Board meeting awarding the options. |
(d)(c)
| Options are exercisable after a two-year vesting period from the individual award date of the Board meeting awarding the options and expire eight years after this date. The underlying shares may not be transferred during the four-year period from the individual award date.date of the Board meeting awarding the options. |
(e)(d)
| CertainsOptions are exercisable after a two-year vesting period from the date of the Board meeting awarding the options and expire eight years after this date. The underlying shares may not be transferred during the four-year period from the date of the Board meeting awarding the options. The four-year transfer restriction period does not apply to employees of non-French subsidiaries as of July 17, 2007, who may transfer the underlying shares after July 18, 2009.
|
| (e) | Options are exercisable after a two-year vesting period from the date of the Board meeting awarding the options and expire eight years after this date. The underlying shares may not be transferred during the four-year period from the date of the Board meeting awarding the options. The four-year transfer restriction period does not apply to employees of non-French subsidiaries as of October 09, 2008, who may transfer the underlying shares after October 10, 2010. |
| (f) | Certain employees of the Elf Aquitaine group in 1998 also benefited in 2000, 2001, 2002 and 2003 from the vesting of Elf Aquitaine options awarded in 1998 subject to performance conditions related to the Elf Aquitaine group from 1998 to 2002. These Elf Aquitaine plans expired on March 31, 2005. |
(f)(g)
| Members of the ExecutiveManagement Committee and the Treasurer as of the date of the Board meeting awarding the options. |
(g)(h)
| The Chairman of the Board, not being a member of the Management Committee as of the Board of Directors meetings held on July 17, 2007 and September 9, 2008, is not included in the Executive Officers. The Chairman was granted 110,000 options by the July 17, 2007 Board meeting and no option as decided by the Board of Directors on September 9, 2008. |
| (i) | To reflecttake into account the spin-off of Arkema, pursuant to Articles 174-9, 174-12 and 174-13 of Decree number 67-236 of March 23, 1967, effective at that time and as of the date of the shareholders’ meeting ofon May 12, 2006, at its meeting onof March 14, 2006, the Board of Directors resolved to adjust the rights of holders of TOTAL stock options. For each plan and each holder, the exercise prices for TOTAL stock options were multiplied by 0.986147 and the number of unexercised stock options was multiplied by 1.014048 (and then rounded up), effective as of May 24, 2006. Additionally, to reflecttake into account the four-for-one stock split approved by the shareholders’ meeting on May 12, 2006, the exercise price for stock options was divided by four and the number of unexercised stock options was multiplied by four. The presentation in this table of the number of options initially awarded has not been adjusted to reflect the four-for-one stock split. |
TOTAL STOCK OPTIONS AS OF DECEMBER 31, 20062008 | | | | | | | | | | | | | | | | | | | | | | | | | | | | | | | | | | 1998 Plan | | | 1999 Plan | | | 2000 Plan | | | 2001 Plan | | | 2002 Plan | | | 2003 Plan | | | 2004 Plan | | | 2005 Plan | | | 2006 Plan | | | Total | | Type of options | | Purchase
options |
| | Purchase
options |
| | Purchase
options |
| | Purchase
options |
| | Purchase
options |
| | Subscription
options |
| | Subscription
options |
| | Subscription
options |
| | Subscription
options |
| | | | | | | | | | | | | | | Date of the shareholders’ meeting | | May 21,
1997 |
| | May 21,
1997 |
| | May 21,
1997 |
| | May 17,
2001 |
| | May 17,
2001 |
| | May 17,
2001 |
| | May 14,
2004 |
| | May 14,
2004 |
| | May 14,
2004 |
| | | | Date of the Board meeting | | March 17,
1998 |
| | June 15,
1999 |
| | July 11,
2000 |
| | July 10,
2001 |
| | July 9,
2002 |
| | July 16,
2003 |
| | July 20,
2004 |
| | July 19,
2005 |
| | July 18,
2006 |
| | | | Options awarded by the Board (before taking into account the four-for-one stock split (a)), of which: | | 955,000 | | | 1,499,767 | | | 2,425,645 | | | 2,693,375 | | | 2,870,850 | | | 2,935,306 | | | 3,365,630 | | | 1,526,120 | | | 5,727,240 | | | | | • Executive directors(b) | | 30,000 | | | 40,000 | | | 50,000 | | | 75,000 | | | 60,000 | | | 60,000 | | | 60,000 | | | 60,180 | | | 400,720 | | | | | • Ten highest awards to employees(c) | | 111,000 | | | 172,000 | | | 138,000 | | | 166,000 | | | 176,500 | | | 175,000 | | | 204,000 | | | 184,000 | | | 633,000 | | | | | Options awarded by the Board (after taking into account the four-for-one stock split(a)), of which: | | 3,820,000 | | | 5,999,068 | | | 9,702,580 | | | 10,773,500 | | | 11,483,400 | | | 11,741,224 | | | 13,462,520 | | | 6,104,480 | | | 5,727,240 | | | 78,814,012 | | • Executive directors(b) | | 120,000 | | | 160,000 | | | 200,000 | | | 300,000 | | | 240,000 | | | 240,000 | | | 240,000 | | | 240,720 | | | 400,720 | | | 2,141,440 | | • Ten highest awards to employees(c) | | 444,000 | | | 688,000 | | | 552,000 | | | 664,000 | | | 706,000 | | | 700,000 | | | 816,000 | | | 736,000 | | | 633,000 | | | 5,939,000 | | Date as of which options may be exercised | | March 18,
2003 |
| | June 16,
2004 |
(d) | | July 12,
2004 |
(e) | | January 1,
2005 |
| | July 10,
2004 |
| | July 17,
2005 |
| | July 21,
2006 |
| | July 20,
2007 |
| | July 19,
2008 |
| | | | | | | | | | | | | | | Expiration date | | March 17,
2006 |
| | June 15,
2007 |
| | July 11,
2008 |
| | July 10,
2009 |
| | July 9,
2010 |
| | July 16,
2011 |
| | July 20,
2012 |
| | July 19,
2013 |
| | July 18,
2014 |
| | | | | | | | | | | | | | | Initial exercise price (€) | | 93.76 | | | 113.00 | | | 162.70 | | | 168.20 | | | 158.30 | | | 133.20 | | | 159.40 | | | 198.90 | | | — | | | | | | | | | | | | | | | | Exercise price until May 23, 2006 (€)(f) | | 23.44 | | | 28.25 | | | 40.68 | | | 42.05 | | | 39.58 | | | 33.30 | | | 39.85 | | | 49.73 | | | — | | | | | Exercise price from May 24, 2006 (€)(f) | | — | | | 27.86 | | | 40.11 | | | 41.47 | | | 39.03 | | | 32.84 | | | 39.30 | | | 49.04 | | | 50.60 | | | | | Number of options:(a) | | | | | | | | | | | | | | | | | | | | | | | | | | | | | | | • Outstanding as of January 1, 2006 | | 589,652 | | | 2,052,432 | | | 6,509,944 | | | 8,735,900 | | | 11,283,480 | | | 11,196,796 | | | 13,411,320 | | | 6,094,080 | | | | | | 59,873,604 | | • Awarded in 2006 | | — | | | — | | | — | | | — | | | — | | | — | | | — | | | 134,400 | | | 5,727,240 | | | 5,861,640 | | • Cancelled in 2006 | | (72,692 | ) | | — | | | (7,272 | )(h) | | (15,971 | ) | | (26,694 | ) | | (22,200 | ) | | (57,263 | ) | | (43,003 | ) | | (1,080 | ) | | (246,175 | ) | • Adjustments related to the Arkema spin-off(g) | | — | | | 25,772 | | | 84,308 | | | 113,704 | | | 165,672 | | | 163,180 | | | 196,448 | | | 90,280 | | | — | | | 839,364 | | • Exercised in 2006 | | (516,960 | ) | | (707,780 | ) | | (1,658,475 | ) | | (1,972,348 | ) | | (2,141,742 | ) | | (729,186 | ) | | (120,133 | ) | | — | | | — | | | (7,846,624 | ) | • Outstanding as of December 31, 2006 | | — | | | 1,370,424 | | | 4,928,505 | | | 6,861,285 | | | 9,280,716 | | | 10,608,590 | | | 13,430,372 | | | 6,275,757 | | | 5,726,160 | | | 58,481,809 | |
| | | | | | | | | | | | | | | | | | | | | | | | | | | | | | | | | | 2000 Plan | | | 2001 Plan | | | 2002 Plan | | | 2003 Plan | | | 2004 Plan | | | 2005 Plan | | | 2006 Plan | | | 2007 Plan | | | 2008 Plan | | | Total | | Type of options | | Purchase
options |
| | Purchase
options |
| | Purchase
options |
| | Subscription
options |
| | Subscription
options |
| | Subscription
options |
| | Subscription
options |
| | Subscription
options |
| | Subscription
options |
| | | | Date of the shareholders’ meeting | | May 21,
1997 |
| | May 17,
2001 |
| | May 17,
2001 |
| | May 17,
2001 |
| | May 14,
2004 |
| | May 14,
2004 |
| | May 14,
2004 |
| | May 11,
2007 |
| | May 11,
2007 |
| | | | Date of the award(a) | | July 11,
2000 |
| | July 10,
2001 |
| | July 9,
2002 |
| | July 16,
2003 |
| | July 20,
2004 |
| | July 19,
2005 |
| | July 18,
2006 |
| | July 17,
2007 |
| | October 9,
2008 |
| | | | Total number of options granted, including(b): | | 9,702,580 | | | 10,773,500 | | | 11,483,400 | | | 11,741,224 | | | 13,462,520 | | | 6,104,480 | | | 5,727,240 | | | 5,937,230 | | | 4,449,810 | | | 79,381,984 | | • directors(c) | | 200,000 | | | 300,000 | | | 240,000 | | | 240,000 | | | 240,000 | | | 240,720 | | | 400,720 | | | 310,840 | | | 200,660 | | | 2,372,940 | | • T. Desmarest | | 200,000 | | | 300,000 | | | 240,000 | | | 240,000 | | | 240,000 | | | 240,000 | | | 240,000 | | | 110,000 | | | — | | | 1,810,000 | | • C. de Margerie | | n/a | | | n/a | | | n/a | | | n/a | | | n/a | | | n/a | | | 160,000 | | | 200,000 | | | 200,000 | | | 560,000 | | • D. Boeuf | | n/a | | | n/a | | | n/a | | | n/a | | | — | | | 720 | | | 720 | | | 840 | | | 660 | | | 2,940 | | Additional award | | — | | | 16,000 | | | — | | | — | | | 24,000 | | | 134,400 | | | — | | | — | | | — | | | 174,400 | | Adjustments related to the spin-off of Arkema(d) | | 84,308 | | | 113,704 | | | 165,672 | | | 163,180 | | | 196,448 | | | 90,280 | | | — | | | — | | | — | | | 813,592 | | Date as of which the options may be exercised | | July 12,
2004 |
(e) | | January 1,
2005 |
| | July 10,
2004 |
| | July 17,
2005 |
| | July 21,
2006 |
| | July 20,
2007 |
| | July 19,
2008 |
| | July 18,
2009 |
| | October 10,
2010 |
| | | | Expiration date | | July 11,
2008 |
| | July 10,
2009 |
| | July 9,
2010 |
| | July 16,
2011 |
| | July 20,
2012 |
| | July 19,
2013 |
| | July 18,
2014 |
| | July 17,
2015 |
| | October 9,
2016 |
| | | | Exercise price (€)(f) | | 40.11 | | | 41.47 | | | 39.03 | | | 32.84 | | | 39.30 | | | 49.04 | | | 50.60 | | | 60.10 | | | 42.90 | | | | | Cumulated number of options exercised as of December 31, 2008 | | 9,220,289 | | | 6,115,039 | | | 5,107,425 | | | 4,315,134 | | | 655,895 | | | 38,497 | | | 8,620 | | | — | | | — | | | | | Cumulated number of options cancelled as of December 31, 2008 | | 566,599 | | | 96,739 | | | 90,790 | | | 87,922 | | | 259,896 | | | 98,959 | | | 67,564 | | | 51,785 | | | 6,000 | | | | | Number of options: | | | | | | | | | | | | | | | | | | | | | | | | | | | | | | | • Outstanding as of January 1, 2008 | | 3,142,188 | | | 5,150,258 | | | 7,063,183 | | | 8,368,378 | | | 13,197,236 | | | 6,243,438 | | | 5,711,060 | | | 5,920,105 | | | — | | | 54,795,846 | | • Granted in 2008 | | — | | | — | | | — | | | — | | | — | | | — | | | — | | | — | | | 4,449,810 | | | 4,449,810 | | • Cancelled in 2008 | | (480,475 | ) | | (3,652 | ) | | (13,392 | ) | | (25,184 | ) | | (118,140 | ) | | (34,032 | ) | | (53,304 | ) | | (34,660 | ) | | (6,000 | ) | | (768,839 | ) | • Exercised in 2008 | | (2,661,713 | ) | | (455,180 | ) | | (598,934 | ) | | (841,846 | ) | | (311,919 | ) | | (17,702 | ) | | (6,700 | ) | | — | | | — | | | (4,893,994 | ) | • Outstanding as of December 31, 2008 | | — | | | 4,691,426 | | | 6,450,857 | | | 7,501,348 | | | 12,767,177 | | | 6,191,704 | | | 5,651,056 | | | 5,885,445 | | | 4,443,810 | | | 53,582,823 | |
| (a) | The date of the award is the date of the Board meeting awarding the options, except for the share subscription option plan of October 9, 2008 decided by the Board on September 9, 2008. |
| (b) | The number of options awarded outstanding, cancelled and exercised up tobefore May 23, 2006, has been multiplied by four to take into account the four-for-one stock split approved by TOTAL’s shareholders’ meeting on May 12, 2006. |
(b)(c) | Options awarded to employees of the Group serving on the Boarddirectors at the time of award. For the share subscription option plan of July 18, 2006, plan, options awarded to Messrs. Thierry Desmarest, Chairman of the Board of Directors and Chief Executive Officer of TOTAL S.A.,CEO, Christophe de Margerie, Board member, and Daniel Boeuf, the director representing employee shareholders,shareholders. For the share subscription option plan of July 17, 2007 and ChristopheOctober 9, 2008, options awarded to Messrs. Desmarest, Chairman, de Margerie, CEO, and Boeuf, director of TOTAL S.A. and President of the Exploration & Production division. |
(c) | Employees of TOTAL S.A. and any company in the Group who were not executive directors of TOTAL S.A. at the time of award.representing employee shareholders. |
| (d) | January 1, 2003 for employees under contract with a subsidiary incorporated outside of France. |
(e) | January 1, 2004 for employees under contract with a subsidiary incorporated outside of France. |
(f) | To take into account the four-for-one stock split, the exercise price of stock options has been divided by four. In addition, to take into account the Arkema spin-off, the exercise price of stock options was multiplied by an adjustment ratio of 0.986147, effective as of May 24, 2006. |
(g) | Adjustments approved by the Board on March 14, 2006 pursuant to Articles 174-9, 174-12 and 174-13 of Decree No. 67-236 dated March 23, 1967 in effect at the time of the Board meeting as well as at the time of the shareholders’ meeting of TOTAL S.A. on May 12, 2006, related to the spin-off of Arkema. The adjustments were made on May 22, 2006 and became effective on May 24, 2006. |
(h)(e) | Including the confirmation in 2006 by the CompanyJanuary 1, 2004 for employees under contract with a subsidiary incorporated outside of the award of 500 stock options (for underlying shares,par value€10 per share) that had been cancelled erroneously in 2001.France. |
TOTAL STOCK OPTIONS AWARDED TO EXECUTIVE OFFICERS (MANAGEMENT COMMITTEE AND TREASURER AS OF DECEMBER 31, 2006)
| | | | | | | | | | | | | | | | | | | | | | | | | | | | | | | 1998 Plan | | | 1999 Plan | | | 2000 Plan | | | 2001 Plan | | | 2002 Plan | | | 2003 Plan | | | 2004 Plan | | 2005 Plan | | 2006 Plan | | Total | | | Type of option | | Purchase
options | | | Purchase
options | | | Purchase
options | | | Purchase
options | | | Purchase
options | | | Subscription
options | | | Subscription
options | | Subscription
options | | Subscription
options | | | | Expiration date | | March 17, 2006 | | | June15, 2007 | | | July 11, 2008 | | | July 10, 2009 | | | July 9, 2010 | | | July 16, 2011 | | | July 20, 2012 | | July 19, 2013 | | July 18, 2014 | | | | Initial exercise price (€) | | 93.76 | | | 113.00 | | | 162.70 | | | 168.20 | | | 158.30 | | | 133.20 | | | 159.40 | | 198.90 | | — | | | | Exercise price until May 23, 2006 (€)(a) | | 23.44 | | | 28.25 | | | 40.68 | | | 42.05 | | | 39.58 | | | 33.30 | | | 39.85 | | 49.73 | | — | | | | Exercise price from May 24, 2006 (€)(a) | | — | | | 27.86 | | | 40.11 | | | 41.47 | | | 39.03 | | | 32.84 | | | 39.30 | | 49.04 | | 50.60 | | | | Options awarded by the Board (before taking into account the four-for-one stock split)(b) | | 106,700 | | | 183,000 | | | 215,000 | | | 269,550 | | | 280,300 | | | 307,276 | | | 369,000 | | 326,360 | | 1,438,920 | | | | Options awarded by the Board (after taking into account the four-for-one stock split)(b) | | 426,800 | | | 732,000 | | | 860,000 | | | 1,078,200 | | | 1,121,200 | | | 1,229,104 | | | 1,476,000 | | 1,305,440 | | 1,438,920 | | 9,667,664 | | Options outstanding as of January 1, 2006(b) | | 67,448 | | | 247,076 | | | 540,000 | | | 1,056,200 | | | 1,121,200 | | | 1,102,592 | | | 1,476,000 | | 1,305,440 | | — | | 6,915,956 | | Options exercised up to May 23, 2006(b) | | (67,448 | ) | | (59,000 | ) | | (112,800 | ) | | (327,200 | ) | | — | �� | | (23,680 | ) | | — | | — | | — | | (590,128 | ) | Adjustment related to the Arkema spin-off(c) | | — | | | 2,664 | | | 6,048 | | | 10,300 | | | 15,820 | | | 15,228 | | | 20,796 | | 18,400 | | — | | 89,256 | | Options awarded after May 24, 2006 | | | | | — | | | — | | | — | | | — | | | — | | | — | | — | | 1,438,920 | | 1,438,920 | | Options exercised after May 24, 2006 | | — | | | (8,918 | ) | | (17,852 | ) | | (100,272 | ) | | (164,284 | ) | | (205,216 | ) | | — | | — | | — | | (496,542 | ) | Options outstanding as of December 31, 2006 | | — | | | 181,822 | | | 415,396 | | | 639,028 | | | 972,736 | | | 888,924 | | | 1,496,796 | | 1,323,840 | | 1,438,920 | | 7,357,462 | |
(a)(f) | Exercise price as of May 24, 2006. To take into account the four-for-one stock split that took place on May 18, 2006, the exercise price of stock options from plans then-current has been divided by four. In addition, to take into account the Arkema spin-off, the exercise price of stock options was multiplied by an adjustment ratio of 0.986147, effective as of May 24, 2006. Exercise prices prior to May 24, 2006, are shown in Note 25 to the Consolidated Financial Statements. |
If all the outstanding stock options as of December 31, 2008, were exercised, the corresponding shares would represent 2.22%(1) of the Company’s potential share capital as of December 31, 2008. | (1) | Out of a total potential share capital of 2,415,383,826 shares, including 2,371,808,074 existing shares as of December 31, 2008, 42,965,666 shares that could be issued through the exercise of stock options awarded by the Company and 610,086 new shares that could be issued through the exercise of Elf Aquitaine options that benefit from exchange rights for TOTAL shares. |
TOTAL STOCK OPTIONS AWARDED TO EXECUTIVE OFFICERS (MANAGEMENT COMMITTEE AND TREASURER) AS OF DECEMBER 31, 2008 | | | | | | | | | | | | | | | | | | | | | | | | | | | | | 2000 Plan | | | 2001 Plan | | | 2002 Plan | | 2003 Plan | | | 2004 Plan | | | 2005 Plan | | 2006 Plan | | 2007 Plan | | 2008 Plan | | Total | | | Type of options | | Purchase
options | | | Purchase
options | | | Purchase
options | | Subscription
options | | | Subscription
options | | | Subscription
options | | Subscription
options | | Subscription
options | | Subscription
options | | | | Expiration date | | July 11, 2008 | | | July 10, 2009 | | | July 9, 2010 | | July 16, 2011 | | | July 20, 2012 | | | July 19, 2013 | | July 18, 2014 | | July 17, 2015 | | October 9, 2016 | | | | Exercise price (€)(a) | | 40.11 | | | 41.47 | | | 39.03 | | 32.84 | | | 39.30 | | | 49.04 | | 50.60 | | 60.10 | | 42.90 | | | | Options granted by the Board(b) | | 523,800 | | | 627,000 | | | 722,400 | | 808,904 | | | 1,028,000 | | | 882,240 | | 1,016,920 | | 1,203,840 | | 1,240,000 | | 8,053,104 | | Adjustments related to the spin-off of Arkema(c) | | 3,972 | | | 5,116 | | | 9,856 | | 10,492 | | | 14,500 | | | 12,316 | | — | | — | | — | | 56,252 | | Outstanding options as of January 1, 2008 | | 191,320 | | | 319,460 | | | 401,232 | | 536,268 | | | 1,033,500 | | | 894,664 | | 1,016,920 | | 1,203,840 | | | | 5,597,204 | | Options awarded in 2008(d) | | — | | | — | | | — | | — | | | — | | | — | | — | | — | | 1,240,000 | | 1,240,000 | | Options exercised in 2008 | | (177,120 | ) | | (2,500 | ) | | — | | (82,849 | ) | | (14,368 | ) | | — | | — | | — | | — | | (276,837 | ) | Options cancelled in 2008 | | (14,200 | ) | | — | | | — | | — | | | — | | | — | | — | | — | | — | | (14,200 | ) | Options outstanding as of December 31, 2008 | | — | | | 316,960 | | | 401,232 | | 453,419 | | | 1,019,132 | | | 894,664 | | 1,016,920 | | 1,203,840 | | 1,240,000 | | 6,546,167 | |
| (a) | Exercise price as of May 24, 2006. To take into account the four-for-one stock split that took place on May 18, 2006, the exercise price of stock options from plans then-current has been divided by four. In addition, to take into account the Arkema spin-off, the exercise price of stock options was multiplied by an adjustment ratio of 0.986147, effective as of May 24, 2006. Exercise prices prior to May 24, 2006, are shown in Note 25 to the Consolidated Financial Statements. |
| (b) | The number of options awarded outstanding or exercised up tobefore May 23, 2006, has been multiplied by four to take into account the four-for-one stock split approved by TOTAL’s shareholders’ meeting on May 12, 2006. |
| (c) | Adjustments approved by the Board on March 14, 2006, pursuant to Articles 174-9, 174-12 and 174-13 of Decree No. 67-236 dated March 23, 1967 in effect at the time of the Board meeting as well as at the time of the shareholders’ meeting of TOTAL S.A. on May 12, 2006, related to the spin-off of Arkema. The adjustments were made on May 22, 2006 and became effective on May 24, 2006. |
In 2006, Mr. Christophe de Margerie, a director of TOTAL S.A. and member of the Executive Committee, was awarded 160,000 options under the 2006 Plan and exercised 9,000 options, awarded under the 1998 Plan, for 9,000 underlying shares, par value€10 per share (after the stock split, 36,000 shares, par value€2.50 per share). Pursuant to the adjustments related to the Arkema spin-off, Mr. Christophe de Margerie was attributed an additional 9,876 options based on his options outstanding as of May 23, 2006. These options from the adjustment give rights, upon exercise, to a total of 9,876 shares, par value€2.50 per share.
In 2006, Mr. Daniel Boeuf, the director of TOTAL S.A. representing employee shareholders, was awarded 720 options under the 2006 Plan and did not exercise any options. Pursant to the adjustments related to the Arkema spin-off, Daniel Boeuf was attributed an additional 12 options related to the options he had been awarded under the 2005 Plan. These options from the adjustment give rights, upon exercise, to a total of 12 shares, par value€2.50 per share.
| (d) | The number of options awarded in 2008 to executive officers, having this title as of December 31, 2008, does not match the amount shown in the table “— TOTAL stock options as of December 31, 2008”, due to the appointment of a new Management Committee member after the date the Board decided the share option plan. |
Certain Executive Officersexecutive officers of TOTAL as of December 31, 20062008, who were previously with the Elf Aquitaine group hold Elf Aquitaine options that, upon exercise, benefit from exchange rights for TOTAL shares based upon the exchange ratio used in the public tender offer of TOTAL for Elf Aquitaine in 1999.1999, adjusted on May 22, 2006 to six TOTAL shares for each Elf Aquitaine share in order to take into account the Arkema spin-off and the four-for-one stock split. Furthermore, as part of the share subscription option plans of July 17, 2007, and October 9, 2008, the Board of Directors required that for each beneficiary of more than 25,000 stock options, the grant be subject to a performance condition. In addition, Mr. Daniel Boeuf, the director representing employee shareholders, has not exercised any option in 2008 and was awarded 660 share subscription options on October 9, 2008. TOTAL STOCK OPTIONS AWARDED TO MR. THIERRY DESMAREST, CHAIRMAN OF THE BOARD OF TOTAL S.A. | | | | | | | | | | | | | | | | | | | | | | | | | | | | | 1998 Plan | | 1999 Plan | | | 2000 Plan | | | 2001 Plan | | | 2002 Plan | | 2003 Plan | | | 2004 Plan | | 2005 Plan | | 2006 Plan | | Total | | | Type of option | | Purchase
options | | Purchase
options | | | Purchase
options | | | Purchase
options | | | Purchase
options | | Subscription
options | | | Subscription
options | | Subscription
options | | Subscription
options | | | | Expiration date | | March 17,
2006 | | June15,
2007 |
| | July 11,
2008 |
| | July 10,
2009 |
| | July 9,
2010 | | July 16,
2011 |
| | July 20,
2012 | | July 19,
2013 | | July 18,
2014 | | | | Initial exercise price (€) | | 93.76 | | 113.00 | | | 162.70 | | | 168.20 | | | 158.30 | | 133.20 | | | 159.40 | | 198.90 | | — | | | | Exercise price until May 23, 2006 (€)(a) | | 23.44 | | 28.25 | | | 40.68 | | | 42.05 | | | 39.58 | | 33.30 | | | 39.85 | | 49.73 | | — | | | | Exercise price from May 24, 2006 (€)(a) | | — | | 27.86 | | | 40.11 | | | 41.47 | | | 39.03 | | 32.84 | | | 39.30 | | 49.04 | | 50.60 | | | | Options awarded by the Board (before taking into account the four-for-one stock split)(b) | | 30,000 | | 40,000 | | | 50,000 | | | 75,000 | | | 60,000 | | 60,000 | | | 60,000 | | 60,000 | | 240,000 | | | | Options awarded by the Board (after taking into account the four-for-one stock split)(b) | | 120,000 | | 160,000 | | | 200,000 | | | 300,000 | | | 240,000 | | 240,000 | | | 240,000 | | 240,000 | | 240,000 | | 1,980,000 | | Options outstanding as of January 1, 2006(b) | | — | | 24,000 | | | 52,000 | | | 300,000 | | | 240,000 | | 176,000 | | | 240,000 | | 240,000 | | — | | 1,272,000 | | Options exercised up to May 23, 2006(b) | | — | | (24,000 | ) | | (52,000 | ) | | (120,000 | ) | | — | | — | | | — | | — | | — | | (196,000 | ) | Adjustment related to the Arkema spin-off(c) | | — | | — | | | — | | | 2,532 | | | 3,372 | | 2,476 | | | 3,372 | | 3,372 | | — | | 15,124 | | Options awarded after May 24, 2006 | | — | | — | | | — | | | — | | | — | | — | | | — | | — | | 240,000 | | 240,000 | | Options exercised after May 24, 2006 | | — | | — | | | — | | | (80,000 | ) | | — | | (116,000 | ) | | — | | — | | — | | (196,000 | ) | Options outstanding as of December 31, 2006 | | — | | — | | | — | | | 102,532 | | | 243,372 | | 62,476 | | | 243,372 | | 243,372 | | 240,000 | | 1,135,124 | |
| | | | | | | | | | | | | | | | | | | | | | | | | | 2000 Plan | | 2001 Plan | | 2002 Plan | | | 2003 Plan | | 2004 Plan | | 2005 Plan | | 2006 Plan | | 2007 Plan | | 2008 Plan | | Total | | | Type of options | | Purchase
options | | Purchase
options | | Purchase
options | | | Subscription
options | | Subscription
options | | Subscription
options | | Subscription
options | | Subscription
options | | Subscription
options | | | | Expiration date | | July 11, 2008 | | July 10, 2009 | | July 9, 2010 | | | July 16, 2011 | | July 20, 2012 | | July 19, 2013 | | July 18, 2014 | | July 17, 2015 | | October 9, 2016 | | | | Exercise price (€)(a) | | 40.11 | | 41.47 | | 39.03 | | | 32.84 | | 39.30 | | 49.04 | | 50.60 | | 60.10 | | 42.90 | | | | Options granted by the Board(b) | | 200,000 | | 300,000 | | 240,000 | | | 240,000 | | 240,000 | | 240,000 | | 240,000 | | 110,000 | | — | | 1,810,000 | | Adjustments related to the spin-off of Arkema(c) | | — | | 2,532 | | 3,372 | | | 2,476 | | 3,372 | | 3,372 | | — | | — | | — | | 15,124 | | Outstanding options as of January 1, 2008 | | — | | — | | 209,372 | | | — | | 243,372 | | 243,372 | | 240,000 | | 110,000 | | | | 1,046,116 | | Options awarded in 2008 | | — | | — | | — | | | — | | — | | — | | — | | — | | — | | — | | Options exercised in 2008 | | — | | — | | (139,000 | ) | | — | | — | | — | | — | | — | | — | | (139,000 | ) | Options outstanding as of December 31, 2008 | | — | | — | | 70,372 | | | — | | 243,372 | | 243,372 | | 240,000 | | 110,000 | | — | | 907,116 | |
| (a) | Exercise price as of May 24, 2006. To take into account the four-for-one stock split that took place on May 18, 2006, the exercise price of stock options from plans then-current has been divided by four. In addition, to take into account the Arkema spin-off, the exercise price of stock options was multiplied by an adjustment ratio of 0.986147, effective as of May 24, 2006. Exercise prices prior to May 24, 2006, are shown in Note 25 to the Consolidated Financial Statements. |
| (b) | The number of options awarded outstanding or exercised up tobefore May 23, 2006, has been multiplied by four to take into account the four-for-one stock split approved by TOTAL’s shareholders’ meeting on May 12, 2006. |
(c) | Adjustments approved by the Board on March 14, 2006, pursuant to Articles 174-9, 174-12 and 174-13 of Decree No. 67-236 dated March 23, 1967, in effect at the time of the Board meeting as well as at the time of the shareholders’ meeting of TOTAL S.A. on May 12, 2006, related to the spin-off of Arkema. The adjustments were made on May 22, 2006, and became effective on May 24, 2006. |
As part of the plan awarded on July 17, 2007, the Board has conditioned the award of these options to the Chairman of the Board on the fulfillment of a performance condition. As of December 31, 2008, the Chairman of the Board of Directors’ outstanding options represent 0.038%(1) of the Company’s potential share capital as of December 31, 2008, and the exercise price of such options exceeds the price of the underlying shares. | (1) | Out of a total potential share capital of 2,415,383,826 shares, including 2,371,808,074 existing shares as of December 31, 2008, 42,965,666 shares that could be issued through the exercise of stock options awarded by the Company and 610,086 new shares that could be issued through the exercise of Elf Aquitaine options that benefit from exchange rights for TOTAL shares. |
TOTAL STOCK OPTIONS EXERCISED BY THE TEN EMPLOYEES (OTHER THANAWARDED TO MR. CHRISTOPHE DE MARGERIE, CHIEF EXECUTIVE DIRECTORS) EXERCISING THE LARGEST NUMBEROFFICER OF OPTIONSTOTAL S.A. | | | | | | | | | | | | | | | | Total number of options
exercised(a) | | | | Exercise price up
to May 23, 2006(b) (€) | | Exercise price
from May 24,
2006(b) (€) | | Date of the Board
meeting awarding the
options | | Expiration date | Options exercised in 2006 by the ten employees of TOTAL S.A., or any company in the Group, exercising the largest number of options | | 3,200 | | | | 23.44 | | — | | March 17, 1998 | | March 17, 2006 | | | 31,256 | | | | 28.25 | | 27.86 | | June 15, 1999 | | June 15, 2007 | | | 55,888 | | | | 40.68 | | 40.11 | | July 11, 2000 | | July 11, 2008 | | | 256,544 | | | | 42.05 | | 41.47 | | July 10, 2001 | | July 10, 2009 | | | 183,638 | | | | 39.58 | | 39.03 | | July 9, 2002 | | July 9, 2010 | | | 108,690 | | | | 33.30 | | 32.84 | | July 16, 2003 | | July 16, 2011 | | | 22,312 | | | | 39.85 | | 39.30 | | July 20, 2004 | | July 20, 2012 | | | 661,528 | | | | 38.70(c) | | | | |
| | | | | | | | | | | | | | | | | | | | | | | | | | 2000 Plan | | | 2001 Plan | | 2002 Plan | | 2003 Plan | | 2004 Plan | | 2005 Plan | | 2006 Plan | | 2007 Plan | | 2008 Plan | | Total | | | Type of options | | Purchase
options | | | Purchase
options | | Purchase
options | | Subscription
options | | Subscription
options | | Subscription
options | | Subscription
options | | Subscription
options | | Subscription
options | | | | Expiration date | | July 11,
2008 |
| | July 10,
2009 | | July 9,
2010 | | July 16,
2011 | | July 20,
2012 | | July 19,
2013 | | July 18,
2014 | | July 17,
2015 | | October 9,
2016 | | | | Exercise price (€)(a) | | 40.11 | | | 41.47 | | 39.03 | | 32.84 | | 39.30 | | 49.04 | | 50.60 | | 60.10 | | 42.90 | | | | Options granted by the Board(b) | | 72,000 | | | 88,000 | | 112,000 | | 112,000 | | 128,000 | | 130,000 | | 160,000 | | 200,000 | | 200,000 | | 1,202,000 | | Adjustments related to the spin-off of Arkema(c) | | 1,012 | | | 1,240 | | 1,576 | | 1,576 | | 1,800 | | 1,828 | | — | | — | | — | | 9,032 | | Outstanding options as of January 1, 2008 | | 73,012 | | | 89,240 | | 113,576 | | 113,576 | | 129,800 | | 131,828 | | 160,000 | | 200,000 | | | | 1,011,032 | | Options awarded in 2008 | | — | | | — | | — | | — | | — | | — | | — | | — | | 200,000 | | 200,000 | | Options exercised in 2008 | | (73,012 | ) | | — | | — | | — | | — | | — | | — | | — | | — | | (73,012 | ) | Options outstanding as of December 31, 2008 | | — | | | 89,240 | | 113,576 | | 113,576 | | 129,800 | | 131,828 | | 160,000 | | 200,000 | | 200,000 | | 1,138,020 | |
| (a) | Exercise price as of May 24, 2006. To take into account the four-for-one stock split that took place on May 18, 2006, the exercise price of stock options from plans then-current was divided by four. In addition, to take into account the Arkema spin-off, the exercise price of stock options was multiplied by an adjustment ratio of 0.986147, effective as of May 24, 2006. Exercise prices prior to May 24, 2006, are shown in Note 25 to the Consolidated Financial Statements. |
| (b) | The number of options exercised up toawarded before May 23, 2006, has been multiplied by four to take into account the four-for-one stock split approved by TOTAL’s shareholders’ meeting on May 12, 2006. |
| (c) | Adjustments approved by the Board on March 14, 2006 pursuant to Articles 174-9, 174-12 and 174-13 of Decree No. 67-236 dated March 23, 1967, in effect at the time of the Board meeting as well as at the time of the shareholders’ meeting of TOTAL S.A. on May 12, 2006, related to the spin-off of Arkema. The adjustments were made on May 22, 2006, and became effective on May 24, 2006. |
As part of the plans awarded on July 17, 2007 and October 9, 2008, the Board has conditioned the award of these options to the Chief Executive Officer on the fulfillment of a performance condition. As of December 31, 2008, the Chief Executive Officer’s outstanding options represent 0.047%(1) of the Company’s potential share capital as of December 31, 2008, and only the exercise price of the 2003 Plan options is below the price of the underlying shares. | (1) | Out of a total potential share capital of 2,415,383,826 shares, including 2,371,808,074 existing shares as of December 31, 2008, 42,965,666 shares that could be issued through the exercise of stock options awarded by the Company and 610,086 new shares that could be issued through the exercise of Elf Aquitaine options that benefit from exchange rights for TOTAL shares. |
STOCK OPTIONS AWARDED TO THE TEN EMPLOYEES (OTHER THAN DIRECTORS) RECEIVING THE LARGEST AWARDS/STOCK OPTIONS EXERCISED BY THE TEN EMPLOYEES (OTHER THAN DIRECTORS) EXERCISING THE LARGEST NUMBER OF OPTIONS | | | | | | | | | | | | | Total number of options
awarded/options
exercised | | Exercise price (€) | | | Date of the award(a) | | Expiration date | Options awarded in 2008 to the ten employees of TOTAL S.A., or any company in the Group, receiving the largest number of options | | 700,000 | | 42.90 | | | 10/09/2008 | | 10/09/2016 | Options exercised in 2008 by the ten employees of TOTAL S.A., or any company in the Group, exercising the largest number of options(b) | | 114,256 | | 40.11 | | | 07/11/2000 | | 07/11/2008 | | | 42,430 | | 41.47 | | | 07/10/2001 | | 07/10/2009 | | | 34,168 | | 39.03 | | | 07/09/2002 | | 07/09/2010 | | | 96,284 | | 32.84 | | | 07/16/2003 | | 07/16/2011 | | | 12,172 | | 39.30 | | | 07/20/2004 | | 07/20/2012 | | | 299,310 | | 37.81 | (c) | | | | |
| (a) | The date of the award is the date of the Board meeting awarding the options, except for the share subscription option plan awarded on October 9, 2008, decided by the Board on September 9, 2008. |
| (b) | Exercise price as of May 24, 2006. To take into account the four-for-one stock split that took place on May 18, 2006, the exercise price of stock options from plans then-current has been divided by four. In addition, to take into account the Arkema spin-off, the exercise price of stock options was multiplied by an adjustment ratio of 0.986147, effective as of May 24, 2006. Exercise prices prior to May 24, 2006, are shown in Note 25 to the Consolidated Financial Statements. |
| (c) | Weighted-average price. |
TOTAL restricted share grants The following table gives a breakdown of restricted share grants by category of grantee (executive officers, senior managers and other employees). | | | | | | | | | | | | | | | | | Number of grantees | | Number of restricted shares granted(a) | | Percentage | | | Average number of restricted shares per grantee(b) | 2005 Plan(b) | | Executive officers(d) | | 29 | | 13,692 | | 2.4 | % | | 472 | (Decision of the Board on July 19, 2005) | | Senior managers | | 330 | | 74,512 | | 13.1 | % | | 226 | | | Other employees | | 6,956 | | 481,926 | | 84.5 | % | | 69 | | | Total | | 7,315 | | 570,130 | | 100 | % | | 78 | 2006 Plan(c) | | Executive officers(d) | | 26 | | 49,200 | | 2.2 | % | | 1,892 | (Decision of the Board on July 18, 2006) | | Senior managers | | 304 | | 273,832 | | 12.0 | % | | 901 | | | Other employees(e) | | 7,509 | | 1,952,332 | | 85.8 | % | | 260 | | | Total | | 7,839 | | 2,275,364 | | 100 | % | | 290 |
| | | | | | | | | | | | | | | | Number of
grantees | | Number of
restricted shares
granted(a) | | Percentage | | Average number
of restricted
shares per
beneficiary | 2005 Plan(b) | | Executive Officers(f) | | 29 | | 13,692 | | 2.4% | | 472 | (Decision of the Board on July 19, 2005) | | Senior managers | | 330 | | 74,512 | | 13.1% | | 226 | | | Other employees(g) | | 6,956 | | 481,926 | | 84.5% | | 69 | | | Total | | 7,315 | | 570,130 | | 100% | | 78 | 2006 Plan(c) | | Executive Officers(f) | | 26 | | 49,200 | | 2.2% | | 1,892 | (Decision of the Board on July 18, 2006) | | Senior managers | | 304 | | 273,832 | | 12.0% | | 901 | | | Other employees(g) | | 7,509 | | 1,952,332 | | 85.8% | | 260 | | | Total | | 7,839 | | 2,275,364 | | 100% | | 290 | 2007 Plan(d) | | Executive Officers(f) | | 26 | | 48,928 | | 2.1% | | 1,882 | (Decision of the Board on July 17, 2007) | | Senior managers | | 297 | | 272,128 | | 11.5% | | 916 | | | Other employees(g) | | 8,291 | | 2,045,309 | | 86.4% | | 247 | | | Total | | 8,614 | | 2,366,365 | | 100% | | 275 | 2008 Plan(e) | | Executive Officers(f) | | 25 | | 49,100 | | 1.8% | | 1,964 | (Decision of the Board on September 9, 2008, and awarded on October 9, 2008) | | Senior managers | | 300 | | 348,156 | | 12.5% | | 1,161 | | | Other employees(g) | | 9,028 | | 2,394,712 | | 85.8% | | 265 | | | Total | | 9,353 | | 2,791,968 | | 100% | | 299 |
| (a) | The number of restricted shares granted shown in this table has not been recalculated to take into account the four-for-one stock split approved by the shareholders’ meeting on May 12, 2006. |
| (b) | Grant approved by the Board on July 19, 2005, pursuant to the authorityauthorization given by the shareholders’ meeting on May 17, 2005. Grants of theseThese restricted shares, which the Company purchased on the market in 2005, will become final, subject to performance conditions, on July 20, 2007,were finally granted after a two-year vesting period. Under theseperiod (i.e., on July 20, 2007). The final grant was conditioned to fulfilling a performance conditions,condition. The Board of Directors on May 3, 2007, noticed that the final numberacquisition rate, connected to the performance condition, amounted to 100%. Moreover, the transfer of the restricted shares granted will not be calculated according topermitted between the return on average capital employed, based on the accounts published by the Group for the financial year, in this case 2006, preceding the yeardate of final grant. The restricted shares finally granted are then subject togrant and the end of a two-year mandatory holding period, in this case ending on July 20, 2009. To provide for the eventual final grant of these restricted shares, the Company purchased 574,000 previously issued shares, par value€10 per share, on the market at an average price of€206.49 per share, par value€10 per share, the equivalent of an average price of€51.62 per share, par value€2.50 per share. |
| (c) | Grant approved by the Board on July 18, 2006, pursuant to the authorityauthorization given by the shareholders’ meeting on May 17, 2005. These restricted shares, which the Company purchased on the market in 2006, were finally granted after a two-year vesting period (i.e., on July 19, 2008). The final grant was conditioned to fulfilling a performance condition. The Board of Directors on May 6, 2008, noticed that the acquisition rate, connected to the performance condition, amounted to 100%. Moreover, the transfer of the restricted shares will not be permitted until the end of a two-year mandatory holding period (i.e., from July 19, 2010). To provide for the eventual final grant of these restricted shares, the Company purchased 2,295,684 previously issued shares at an average price of€51.91 per share. |
| (d) | Grant approved by the Board on July 17, 2007, pursuant to the authorization given by the shareholders’ meeting on May 17, 2005. Grants of these restricted shares, which the Company purchased on the market in 2006,2007, will become final, subject to performance conditions on July 19, 2008, after a two-year vesting period. Under these performance conditions,period (i.e., on July 18, 2009). Moreover, the final numbertransfer of the restricted shares granted will not be calculated according topermitted until the return on average capital employed, based on the accounts published by the Group for the financial year, in this case 2007, preceding the yearend of final grant. The restricted shares finally granted are then subject to a two-year mandatory holding period in this case ending(i.e., on July 19, 2010.18, 2011). To provide for the eventual final grant of these restricted shares, the Company purchased 2,295,6842,387,355 previously issued shares on the market at an average price of€51.9161.49 per share. |
(d)(e) | Shares granted on October 9, 2008, as decided by the Board at its meeting on September 9, 2008, pursuant to the authorization given by the shareholders’ meeting on May 16, 2008. Grants of these restricted shares, which the Company purchased on the market in 2008, will become final, subject to performance conditions after a two-year vesting period (i.e., on October 10, 2010). Moreover, the transfer of the restricted shares will not be permitted until the end of a two-year mandatory holding period (i.e., on October 10, 2012). To provide for the eventual final grant of these restricted shares, the Company purchased 2,800,000 previously issued shares at an average price of€41.63 per share. |
| (f) | Members of the ExecutiveManagement Committee and the Treasurer as of the date of the Board meeting granting the restricted shares. The Chairman of the Board is not granted restricted shares. Mr. Christophe de Margerie, a director of TOTAL S.A., wasand the Chief Executive Officer were not granted restricted shares under the 2006, Plan.2007 and 2008 Plans. |
(e)(g) | Mr. Daniel Boeuf, employee of Total Raffinage Marketing, a subsidiary of TOTAL S.A. and the director of TOTAL S.A. representing employee shareholders, was granted 416 restricted shares underby the July 19, 2005 Board meeting, 416 restricted shares by the July 18, 2006 Plan.Board meeting, 432 restricted shares by the July 17, 2007 Board meeting and 588 shares by the September 9, 2008 Board meeting. |
RESTRICTED SHARE PLANS AS OF DECEMBER 31, 20062008 | | | | | | | | | | 2005 Plan(a) | | | 2006 Plan | | Date of the shareholders’ meeting | | May 17, 2005 | | | May 17, 2005 | | Date of the Board meeting | | July 19, 2005 | | | July 18, 2006 | | Closing share price on the date of the Board meeting (€)(b) | | 52.13 | | | 50.40 | | Average repurchase price per share paid by the Company (€)(b) | | 51.62 | | | 51.91 | | Total number of restricted shares granted, of which | | 2,280,520 | | | 2,275,364 | | - Executive directors(c) | | 416 | | | 416 | | - Ten employees with largest grants(d) | | 20,000 | | | 20,000 | | Start of the vesting period | | July 19, 2005 | | | July18, 2006 | | Date of final grant, subject to specified conditions (end of the vesting period) | | July 20, 2007 | | | July 19, 2008 | | Transfer possible from (end of the holding period) | | July 20, 2009 | | | July 19, 2010 | | Number of restricted shares: | | | | | | | - Outstanding as of January 1, 2006 | | 2,274,528 | | | — | | - Granted in 2006 | | — | | | 2,275,364 | | - Cancelled in 2006 | | (7,432 | ) | | (3,068 | ) | - Outstanding as of December 31, 2006 | | 2,267,096 | | | 2,272,296 | | Number of restricted shares finally granted in 2006 | | — | | | — | |
| | | | | | | | | | | | | | | | 2005 Plan(a)(b) | | | 2006 Plan(c) | | | 2007 Plan(d) | | | 2008 Plan(e) | | Date of the shareholders’ meeting | | May 17, 2005 | | | May 17, 2005 | | | May 17, 2005 | | | May 16, 2008 | | Date of the award(f) | | July 19, 2005 | | | July 18, 2006 | | | July 17, 2007 | | | October 9, 2008 | | Closing price on the date of the award(g) | | €52.13 | | | €50.40 | | | €61.62 | | | €35.945 | | Average repurchase price per share paid by the Company | | €51.62 | | | €51.91 | | | €61.49 | | | €41.63 | | Total number of restricted shares granted to | | 2,280,520 | | | 2,275,364 | | | 2,366,365 | | | 2,791,968 | | • directors(h) | | 416 | | | 416 | | | 432 | | | 588 | | • ten employees with largest grants(i) | | 20,000 | | | 20,000 | | | 20,000 | | | 20,000 | | Start of the vesting period | | July 19, 2005 | | | July 18, 2006 | | | July 17, 2007 | | | October 9, 2008 | | Date of final grant, subject to specified condition (end of the vesting period) | | July 20, 2007 | | | July 19, 2008 | | | July 18, 2009 | | | October 10, 2010 | | Transfer possible from (end of the holding period) | | July 20, 2009 | | | July 19, 2010 | | | July 18, 2011 | | | October 10, 2012 | | Number of restricted shares: | | | | | | | | | | | | | • Outstanding as of January 1, 2008 | | — | | | 2,263,956 | | | 2,363,057 | | | — | | • Granted in 2008 | | — | | | — | | | — | | | 2,791,968 | | • Cancelled in 2008 | | 2,840 | (k) | | (43,822 | ) | | (29,504 | ) | | (19,220 | ) | • Finally granted in 2008(j) | | (2,840 | )(k) | | (2,220,134 | ) | | (336 | ) | | — | | • Outstanding as of December 31, 2008 | | — | | | — | | | 2,333,217 | | | 2,772,748 | |
| (a) | Grant approved by the Board on July 19, 2005, pursuant to the authorization given by the shareholders’ meeting on May 17, 2005. These restricted shares, which the Company purchased on the market in 2005, were finally granted after a two-year vesting period (i.e., on July 20, 2007). The final grant was conditioned to fulfilling a performance condition. The Board of Directors on May 3, 2007, noticed that the acquisition rate, connected to the performance condition, amounted to 100%. Moreover, the transfer of the restricted shares will not be permitted between the date of final grant and the end of a two-year mandatory holding period, on July 20, 2009. To provide for the eventual final grant of these restricted shares, the Company purchased 574,000 previously issued shares, par value€10 per share, on the market at an average price of€206.49 per share, par value€10 per share, the equivalent of an average price of€51.62 per share, par value€2.50 per share. |
| (b) | The number of restricted shares granted has been multiplied by four to take into account the four-for-one stock split approved by TOTAL’sTOTAL shareholders’ meeting on May 12, 2006. |
(b)(c) | Grant approved by the Board on July 18, 2006, pursuant to the authorization given by the shareholders’ meeting on May 17, 2005. These restricted shares, which the Company purchased on the market in 2006, were finally granted after a two-year vesting period (i.e., on July 19, 2008). The final grant was conditioned to fulfilling a performance condition. The Board of Directors on May 6, 2008, noticed that the acquisition rate, connected to the performance condition, amounted to 100%. Moreover, the transfer of the restricted shares will not be permitted until the end of a two-year mandatory holding period (i.e., from July 19, 2010). |
| (d) | Grant approved by the Board on July 17, 2007, pursuant to the authorization given by the shareholders’ meeting on May 17, 2005. Grants of these restricted shares, which the Company purchased on the market in 2007, will become final, subject to performance conditions, after a two-year vesting period (i.e., on July 18, 2009). Moreover, the transfer of the restricted shares will not be permitted until the end of a two-year mandatory holding period (i.e., on July 18, 2011). To provide for the eventual final grant of these restricted shares, the Company purchased 2,387,355 previously issued shares at an average price of€61.49 per share. |
| (e) | Shares granted on October 9, 2008, as decided by the Board at its meeting on September 9, 2008, pursuant to the authorization given by the shareholders’ meeting on May 16, 2008. Grants of these restricted shares, which the Company purchased on the market in 2008, will become final, subject to performance conditions after a two-year vesting period (i.e., on October 10, 2010). Moreover, the transfer of the restricted shares will not be permitted until the end of a two-year mandatory holding period (i.e., on October 10, 2012). To provide for the eventual final grant of these restricted shares, the Company purchased 2,800,000 previously issued shares at an average price of€41.63 per share. |
| (f) | The date of the award is the date of the Board meeting awarding the restricted share grant, except for the restricted shares awarded on October 9, 2008, decided by the Board on September 9, 2008. |
| (g) | The closing price for TOTAL shares on July 19, 2005 (€208.50) has been divided by four in order to take into account the four-for-one stock split. The average repurchase price per share in 2005 (€206.49) has also been divided by four. |
(c)(h) | Restricted shares granted to executive directors as of the date of grant. The Chairman of the Board iswas not granted restricted shares.shares by the Board meetings on July 19, 2005, July 18, 2006, July 17, 2007, and September 9, 2008. Furthermore, Mr. Christophe de Margerie, Director of TOTAL S.A. since May 12, 2006 and Chief Executive Officer of TOTAL S.A. since February 13, 2007, was not granted restricted shares by the Board meetings of July 18, 2006, July 17, 2007, and September 9, 2008. The Chief Executive Officer was finally granted on July 20, 2007, the 2,000 restricted shares he had been granted by the Board meeting of July 19, 2005, date at which he was not a director of TOTAL S.A. Mr. Daniel Boeuf, the director of TOTAL S.A. representing employee shareholders, was finally granted on July 19, 2008, the 416 shares he had been granted by the July 18, 2006, Board meeting, and was granted 588 restricted shares underby the 2006 Plan. Mr. Christophe de Margerie, a director of TOTAL S.A. and President of the Exploration & Production division, was not granted restricted shares under the 2006 Plan.September 9, 2008, Board meeting. |
(d)(i) | Employees of TOTAL S.A., or of any Group company, who were not executive directors of TOTAL S.A. as of the date of grant. |
| (j) | For the 2007 Plan, final grants following the death of the beneficiary. |
| (k) | Final restricted share grants for which entitlement right had been cancelled erroneously. |
In case of a final award of the outstanding restricted shares as of December 31, 2008, the corresponding shares would represent 0.21%(1) of the Company’s potential share capital as of such date. | (1) | Out of a total potential share capital of 2,415,383,826 shares, including 2,371,808,074 existing shares as of December 31, 2008, 42,965,666 shares that could be issued through the exercise of stock options awarded by the Company and 610,086 new shares that could be issued through the exercise of Elf Aquitaine options that benefit from exchange rights for TOTAL shares. |
RESTRICTED SHARE GRANTS TO THE TEN EMPLOYEES (OTHER THAN DIRECTORS) RECEIVING THE LARGEST AMOUNT OF GRANTS/RESTRICTED SHARES FINALLY GRANTED TO THE TEN EMPLOYEES (OTHER THAN DIRECTORS AT THE TIME) RECEIVING THE MOST SHARES | | | | | | | | | | | Restricted share
grants/Shares
finally granted | | Date of the award | | Date of the final grant | | End of the holding
period | TOTAL restricted share grants decided by the Board meeting of September 9, 2008 to the ten employees (other than directors) receiving the largest amount of grants(a) | | 20,000 | | 10/09/2008 | | 10/10/2010 | | 10/10/2012 | TOTAL restricted shares finally granted in 2008, following the decision by the Board meeting of July 18, 2006, to the ten employees (other than directors at the time) receiving the largest amount of shares(b) | | 20,000 | | 07/18/2006 | | 07/19/2008 | | 07/19/2010 |
| (a) | Shares granted on October 9, 2008, as decided by the Board at its meeting on September 9, 2008, pursuant to the authorization given by the shareholders’ meeting on May 16, 2008. Grants of these restricted shares, which the Company purchased on the market in 2008, will become final, subject to performance conditions after a two-year vesting period (i.e., on October 10, 2010). Moreover, the transfer of the restricted shares will not be permitted until the end of a two-year mandatory holding period (i.e., on October 10, 2012). |
| (b) | Grant approved by the Board on July 18, 2006, pursuant to the authorization given by the shareholders’ meeting on May 17, 2005. These restricted shares, which the Company purchased on the market in 2006, were finally granted after a two-year vesting period (i.e., on July 19, 2008). The final grant was conditioned to fulfilling a performance condition. The Board of Directors on May 6, 2008, noticed that the acquisition rate, connected to the performance condition, amounted to 100%. Moreover, the transfer of the restricted shares will not be permitted until the end of a two-year mandatory holding period (i.e., from July 19, 2010). |
Elf Aquitaine share subscription options ELF AQUITAINE STOCK OPTIONS OF EXECUTIVE OFFICERS (MEMBERS OF THE MANAGEMENT COMMITTEE AND THE TREASURER AS OF DECEMBER 31, 2006)2008) Certain Executive Officersexecutive officers of TOTAL as of December 31, 20062008, who were previously with the Elf Aquitaine group hold Elf Aquitaine options that, upon exercise, benefit from exchange rights for TOTAL shares based upon the exchange ratio used in the public tender offer of TOTAL for Elf Aquitaine in 1999. This exchange ratio was adjusted on May 22, 2006, as described in note (c) to the table below as well as in Note 2425 to the Consolidated Financial Statements.Statements included elsewhere herein. | | | | | Elf Aquitaine stock subscription plan | | 1999 Plan No.1 | | Exercise price per Elf Aquitaine share until May 23, 2006 (€)(a) | | 115.60 | | Exercise price, per Elf Aquitaine share, from May 24, 2006 (€)(a)
| | 114.76 | | Expiration date | | March 30, 2009 | | Options awarded | | 16,13015,280 | Adjustments for S.D.A. spin-off(b) | | 36 | Options outstanding as of January 1, 20062008 | | 4,287 | 700 | Options exercised in 20062008 | | (1,356 | ) | Adjustments for S.D.A. spin-off(b)
| | 28 | — | Options outstanding as of 2006December 31, 2008 | | 2,959 | 700 | Corresponding number of TOTAL shares, as of December 31, 2006,2008, likely to be created pursuant to the exchange guarantee(c) | | 17,7544,200 | |
| (a) | Exercise price as of May 24, 2006. The exercise price for Elf Aquitaine share subscription options was adjusted to take into account the spin-off of S.D.AS.D.A. (Société de Développement Arkema) by Elf Aquitaine. This adjustment consisted of multiplying the exercise price by 0.992769, effective as of May 24, 2006. Exercise prices prior to May 24, 2006, are shown in Note 25 to the Consolidated Financial Statements. |
| (b) | Adjustments approved by the Board of Elf Aquitaine on March 10, 2006, pursuant to Articles 174-9, 174-12 and 174-13 of Decree No-67-236No. 67-236 dated March 23, 1967, in effect at the time of this meeting as well as at the time of the shareholders’ meeting of Elf Aquitaine on May 10, 2006, related to the spin-off of S.D.A. The adjustments were made on May 22, 2006, and became effective on May 24, 2006. |
(c) | To take into account the spin-off of S.D.A. by Elf Aquitaine, the spin-off of Arkema by TOTAL S.A. and the four-to-onefour-for-one TOTAL stock split, on March 14, 2006 the Board of TOTAL S.A. approved an adjustment to the exchange ratio used under the exchange guarantee mentioned above. This exchange ratio was adjusted to become six TOTAL shares per each Elf Aquitaine share upon approval of the S.D.A. spin-off by the shareholders’ meeting of Elf Aquitaine on May 10, 2006, and of the Arkema spin-off as well as the four-for-one TOTAL stock split by the shareholders’ meeting of TOTAL S.A. on May 12, 2006. |
ITEM 7. MAJOR SHAREHOLDERS AND RELATED PARTY TRANSACTIONS Major Shareholders As of December 31, 2006,February 28, 2009, to the Company’s knowledge, Total Actionnariat France, an employee investment fund, held shares representing 2.8%2.9% of the Company’s shares and 5.5%5.7% of the voting rights in the Company. In addition, Frère-Bourgeois S.A. (mainly through Compagnie Nationale à Portefeuille) and the Desmarais family indirectly control Groupe Bruxelles Lambert. These parties have declared that, acting in concert, they hold 5.3% of the Company’s shares and 5.4% of the voting rights. Neither TOTALTotal Actionnariat France, Compagnie Nationale à Portefeuille nor Groupe Bruxelles Lambert has voting rights different from other shareholders of the Company having held their shares in registered form for over two years. As of March 31, 2007,2009, there were 180,713,411198,248,022 ADSs outstanding in the United States, representing 7.55%approximately 8.4% of the total outstanding shares. The Company is not directly or indirectly owned or controlled by another corporation, by any foreign government or by any other natural or legal person. The Company does not know of any arrangements that may, at a subsequent date, result in a change of control of TOTAL. The so-called “golden share” of the French State, which previously allowed the State to restrict the transfer of control of Elf Aquitaine, was abrogated on October 3, 2002 and has no further effect. Related Party Transactions The Group’s main transactions with related parties (principally all the investments carried under the equity method) and the balances receivable from and payable to them are shown in Note 2824 to the Consolidated Financial Statements included elsewhere herein.Statements. In the ordinary course of its business, TOTAL enters into transactions with various organizations with which certain of its directors or executive officers may be associated, but no such transactions of a material or unusual nature have been entered into during the period commencing on January 1, 20052007, and ending on March 31, 2007.2009. ITEM 8. FINANCIAL INFORMATION Consolidated Statements and other supplemental information See pages F-1 through F-83F-86 and S-1 through S-11S-9 for TOTAL’s Consolidated Financial Statements and other supplemental information. Legal or arbitration proceedings While it is not feasible to predict the outcome of the pending claims, proceedings, and investigations described below with certainty, management is of the opinion that their ultimate disposition should not have a material adverse effect on the Company’s financial position, cash flows, or results of operations. Grande Paroisse An explosion occurred at the Grande Paroisse industrial site in the city of Toulouse (France)in France on September 21, 2001. Grande Paroisse, a former subsidiary of Atofina which became a subsidiary of Elf Aquitaine Fertilisants on December 31, 2004 pursuant to the reorganization of the Chemicals segment, was principally engaged in the production and sale of agricultural fertilizers. The explosion, which involved a stockpile of ammonium nitrate pellets, destroyed a portion of the site and caused the death of 3031 people, including 21 workers at the site, and injured many others. In addition,The explosion also caused significant damage to certain property in an areapart of Toulouse was damaged.the city of Toulouse. This plant has been closed and the site is being restored. Individualindividual assistance packages have been provided for employees. The site has been restored. On December 14, 2006, Grande Paroisse signed, under the supervision of the city of Toulouse, the deed whereby it donated the former site of the AZF plant to the greater agglomeration of Toulouse (CAGT) and theCaisse des Dédépôts et Consignationsconsignations and its subsidiary ICADE. Under this deed, TOTAL S.A. guaranteed the site restoration obligations of Grande Paroisse and granted a 10 M€ endowment to the InNaBioSanté research foundation in the framework of the city of Toulouse’s project to create a cancer research center at the site. Regarding the cause of the explosion, the hypothesis that the explosion was caused by Grande Paroisse through the accidental mixing of hundreds of kilos of a chlorine compound at a storage site for amoniumammonium nitrate was discredited over the course of the investigation. As a result, proceedings against ten of the eleven Grande Paroisse employees charged during the criminal investigation conducted by the Toulouse Regional Court (Tribunal de Grande Instancegrande instance) were dismissed and this dismissal was upheld by the Appeals Court of Appeal of Toulouse. Nevertheless, the final experts’ report filed on May 11, 2006 continuescontinued to focus on the hypothesis of a chemical accident, although this hypothesis was not confirmed by anduring the attempt to reconstruct the accident at the site. The hypothesisAfter having articulated several hypotheses, the experts no longer is based onmaintain that the mixing of 500 kilogramsaccident was caused by pouring a large quantity of a chlorine compound over ammonium nitrate. Instead, the experts have retained a scenario where a container of chlorine compound sweepings was poured between a layer of wet ammonium nitrate covering the floor and a quantity of dry agricultural nitrate at a location not far from the principal storage site for ammonium nitrate, but insteadsite. This is claimed to have caused an explosion which then spread into the pouring of 500 kilograms of ammonium nitrate in a container whose floor was supposedly covered with sweepings of a chlorine compound.main storage site. Grande Paroisse was investigated based on this new hypothesis in 2006. Grande Paroisse is contesting this explanation, which it believes to be based on elements that are not factually accurate. The Court of Appeal of Toulouse rejected all the requests for additional investigations that were submitted by Grande Paroisse, the former site manager and various plaintiffs after the end of the criminal investigation procedure. On September 21, 2006,July 9, 2007, the investigating judge closed his investigation.brought charges against Grande Paroisse and the former site manager ofbefore the site have requested that additional information be obtained relating to the expert’s investigations. These requests are currently being reviewed by theChambre d’Instructioncriminal chamber of the Court of AppealsAppeal of Toulouse. A decisionThe trial for this case began on this appealFebruary 23, 2009, and is expectedscheduled to last approximately four months. Furthermore, TOTAL S.A. and Mr. Thierry Desmarest received a request to appear before the court in the first half 2007.context of this trial. Pursuant to applicable French law, Grande Paroisse is presumed to bear sole responsibility for the explosion as long as the cause of the explosion remains unknown. While awaiting the conclusion of the investigation, Grande Paroisse has set up a compensation system for victims. At this stage, the estimate for the compensation of all claims and related expenses has been increasedamounts to 2.152.19 B€ (compared to 2.05 B€ in 2005). This figure exceeds by 1.351.39 B€ Grande Paroisse’s insurance coverage for legal liability (capped at 0.8 B€). The After taking into account payments previously made and new claims in 2008, the provision for potential liability and complementary claims was increased by 100 M€appearing in 2006, and as a result the total unused provisionConsolidated Balance Sheet stands at 176256 M€ as of December 31, 2006,2008 (which includes an increase of 140 M€ in 2008), compared to a provision of 133134 M€ as of December 31, 2005.2007. Antitrust investigations 1)• | | Following investigations into certain commercial practices in the chemicals industry in the United States, certain chemicalsome subsidiaries of the Arkema(1) group are involved in several civil liability lawsuits in the United States and Canada for violations of antitrust laws. TOTAL S.A. has been named in certain of these suits as the parent company. |
| In Europe, the European Commission commenced investigations in 2000, 2003 and 2004 into alleged anti-competitive practices involving certain products sold by Arkema(1).Arkema. In January 2005, followingunder one of these investigations, the European Commission fined Arkema 13.5 M€ and jointly fined Arkema and Elf Aquitaine 45 M€. Arkema and Elf Aquitaine have appealed these decisions to the Court of First Instance of the European Union. |
| | The Commission notified Arkema, TOTAL S.A. and Elf Aquitaine of complaints concerning two other product lines in January and August 2005, respectively. Arkema has cooperated with the authorities in these procedures and investigations. As a result of these proceedings, inIn May 2006, the European Commission fined Arkema 78.7 M€and 219.1 M€, respectively.as a result of, respectively, each of these two proceedings. Elf Aquitaine was held jointly and severally liable for, respectively, 65.1 M€ and 181.35 M€ of these fines while TOTAL S.A. was held jointly and severally liable, respectively, for 42 M€ and 140.4 M€. TOTAL S.A., Arkema and Elf Aquitaine and Arkema have appealed these decisions to the Court of First Instance of the European Union. |
(1) | Arkema is usedand Elf Aquitaine received a statement of objections from the European Commission in August 2007 concerning alleged anti-competitive practices related to another line of chemical products. As a result, Arkema and Elf Aquitaine have been jointly and severally fined in an amount of 22.7 M€ and individually in an amount of 20.43 M€ for Arkema and 15.89 M€ for Elf Aquitaine. The companies concerned appealed this sectiondecision to designatee those companies of the Arkema group whose ultimate parent company is Arkema S.A. Arkema became an independent company after being spun-off from TOTAL S.A. in May 2006.relevant European court. |
| Arkema and Elf Aquitaine received a statement of objections from the European Commission in March 2009 concerning alleged anti-competitive practices related to another line of chemical products. As of today, the Commission has not rendered a decision. |
| | No facts have been alleged that would implicate TOTAL S.A. or Elf Aquitaine in the practices questioned in these proceedings, and the fines received are based solely on their status as parent companies. |
| | Arkema began implementing compliance procedures in 2001 that are designed to prevent its employees from violating antitrust provisions. However, it is not possible to exclude the possibility that the relevant authorities could commence additional proceedings involving Arkema, andas well as TOTAL S.A. and Elf Aquitaine. |
2)(1) | As partArkema is used in this section to designate those companies of the agreement relating to the spin-off of Arkema group whose ultimate parent company is Arkema S.A., which became an independent company after being spun off from TOTAL S.A. or certain other Group companies agreed to grant Arkema guarantees for certain risks related to antitrust proceedings arising from events prior to the spin-off.in May 2006. |
As part of the agreement relating to the spin-off of Arkema, TOTAL S.A. or certain other Group companies agreed to grant Arkema guarantees for certain risks related to antitrust proceedings arising from events prior to the spin-off. | | These guarantees cover, for a period of ten years that began in 2006, 90% of the amounts paid by Arkema companies related to (i) fines imposed by European authorities or European member-states for competition law violations, (ii) fines imposed by AmericanU.S. courts or antitrust authorities for federal antitrust violations or violations of the competition laws of U.S. states, (iii) damages awarded in civil proceedings related to the government proceedings mentioned above, and (iv) certain costs related to these proceedings. |
| | The guarantee covering anticompetitionthe risks related to anti-competition violations in Europe applies to amounts that exceedabove a 176.5 M€ threshold. |
| | If one or more individuals or legal entities, acting alone or together, directly or indirectly holds more than one-third of the voting rights of Arkema, or if the Arkema group transfers more than 50% of its assets (as calculated under the enterprise valuation method, as of the date of the transfer) to a third party or parties acting together, irrespective of the type or number of transfers, these guarantees will become void. |
| | On the other hand, the agreements provide that Arkema will indemnify TOTAL S.A. or any Group companiescompany for 10% of any amount that TOTAL S.A. or any Group companiescompany are required to pay under any of the proceedings covered by these guarantees. |
3) | The Group has recorded provisions amounting to 138 M€ in its consolidated accounts as of December 31, 2006 to cover the risks mentioned above. |
The Group has recorded provisions amounting to 85 M€ in its consolidated financial statements as of December 31, 2008 to cover the risks mentioned above. 4) | Moreover, as a result of investigations initiated by the European Commission in October 2002 concerning certain Refining & Marketing |
| subsidiaries of the Group, Total Nederland N.V. received a statement of objections in October 2004. A statement of objections regarding these practices has also been addressed to TOTAL S.A. These proceedings resultingMoreover, as a result of investigations started by the European Commission in October 2002 concerning certain Refining & Marketing subsidiaries of the Group, Total Nederland N.V. and TOTAL S.A. received a statement of objections in October 2004. These proceedings resulted, in September 2006, in Total Nederland N.V. being fined 20.25 M€ and in TOTAL S.A. as its parent company being held jointly responsible for 13.5 M€ of this amount, although no facts implicating TOTAL S.A. in the practices under investigation were alleged. TOTAL S.A. and Total Nederland N.V. have appealed this decision to the Court of First Instance of the European Union. | In addition, in May 2007, Total France and TOTAL S.A. received a statement of objections regarding |
| alleged antitrust practices concerning another product line of the Refining & Marketing division. These proceedings resulted, in October 2008, in Total France being fined 128.2 M€ and in TOTAL S.A., as its parent company, being held jointly responsible although no facts implicating TOTAL S.A. in the practices under investigation were alleged. |
| TOTAL S.A. and Total Nederland N.V.Raffinage & Marketing (the new corporate name of Total France) have appealed this decision to the Court of First Instance of the European Union. |
5) | Given the discretionary powers granted to the European Commission for determining fines, it is not currently possible to determine with certainty the outcome of these investigations and proceedings. TOTAL S.A. and Elf Aquitaine are contesting their liability and the method of determining these fines. Although it is not possible to predict the outcome of these proceedings, the Group believes that they will not have a material adverse effect on its financial condition or results. |
Given the discretionary powers granted to the European Commission for determining fines relating to antitrust regulations, it is not currently possible to determine with certainty the outcome of these investigations and proceedings. TOTAL S.A. and Elf Aquitaine are contesting their liability and the method of determining these fines. Although it is not possible to predict the ultimate outcome of these proceedings, the Group believes that they will not have a material adverse effect on its financial condition or results. Sinking of the Erika Following the sinking in December 1999 of the Erika, a tanker that was transporting products belonging to one of the Group companies, the clean-up of parts of the coastline, pumping out the remaining cargo from the wreck and processing of more than 200,000 tons of waste was completed from 2000 to 2003, pursuant to the Company’s undertakings. As part of a criminal investigation, on February 1, 2006 the investigating judge brought charges in theTribunal correctionnel de Parisagainst 15 parties, including four entities.
TOTAL S.A. and two of its subsidiaries responsible for shipping have been charged with marine pollution and as accessories to the endangerment of human life. A manager in the shipping department was charged with the same offenses, as well as with the failure to take action to limit the damage from an accident. The case is being heard by theTribunal de grande instance of Paris convicted TOTAL S.A. of marine pollution pursuant to a judgment issued on January 16, 2008, finding that TOTAL S.A. was negligent in Paris. Proceedings began on February 12, 2007its vetting procedure for vessel selection. TOTAL S.A. was fined€375,000. The court also ordered compensation to be paid to the victims of pollution from the Erika up to an aggregate amount of 192 M€, declaring TOTAL S.A. jointly and are scheduled to continue until June 13, 2007.severally liable for such payments together with the Erika’s inspection and classification firm, the Erika’s owner and the Erika’s manager.
TOTAL believes that the violations with whichfinding of negligence and the Group and its employee were chargedrelated conviction for marine pollution are without substance as a matter of fact and as a matter of law. TOTAL also considers that this verdict is contrary to the intended aim of enhancing maritime transport safety. TOTAL has appealed the verdict of January 16, 2008. In the meantime, it has nevertheless proposed to pay third parties who so request definitive compensation as determined by the court. As of today, thirty-six third parties have received compensation payments, representing an aggregate amount of 170.1 M€. The hearing of the appeal before the Court of Appeals of Paris is expected to begin in October 2009. At the current stage of the proceedings, TOTAL S.A. believes that, based on a reasonable estimate of its liability, the case will not have a material impact on the Group’s financial situation or consolidated results.
Buncefield On December 11, 2005, several explosions, followed by a major fire, occurred at an oil storage depot at Buncefield, north of London, in an oil storage depot.London. This depot is operated by HOSL,Hertfordshire Oil Storage Limited (HOSL), a company in which the British subsidiary of TOTAL holds 60% and another oil group holds 40%.
The explosion injured 40caused minor injuries to a number of people most of whom suffered slight injuries, and caused property damage to the depot and the buildings and homes located nearby. The HSEofficial Independent Investigation Board has indicated that the explosion was caused by the overflow of a tank at the depot. The Board’s final HSE report detailing the circumstances and the exact cause of the explosion is expected to bewas released before the end of 2007. At this stage, responsibilityon December 11, 2008. The civil procedure for the explosion and the allocation of liabilitiesclaims, which have not yet been determined.settled, took place between October and December 2008. The Court’s decision of March 20, 2009, declared the British subsidiary of TOTAL liable for the accident and solely liable for indemnifying the victims. TOTAL’s British subsidiary intends to appeal this decision. The Group is insuredcarries insurance for damage to its interests in these facilities, operating lossesbusiness interruption and civil liability claims from third parties, under its civil liability and believes that, based on the current information currently available, this accident should not have a significant impact on itsthe Group’s financial position, cash flowssituation or consolidated results. On December 1, 2008, the Health and Safety Executive (HSE) and the Environment Agency (EA) issued a Notice of prosecution against five companies, including the British subsidiary of TOTAL. An initial court hearing is expected in the second quarter 2009. Myanmar Under the Belgian “universal jurisdiction” laws of June 16, 1993 and February 10, 1999, a complaint was filed in Belgium on April 25, 2002, against the Company, its Chairman and the former president of its subsidiary in Myanmar. These laws were repealed by the Belgian law of August 5, 2003 on “serious violations of international human rights”, which also provided a procedure for terminating certain proceedings that were underway. In this framework, the BelgianCour de cassation terminated the proceedings against TOTAL in a decision dated June 29, 2005.The2005. The plaintiffs’ appeal againstrequest to withdraw this decision was rejected by theCour de cassation on March 28, 2007. Despite this decision, the Belgian Ministry of Justice asked the Belgian federal prosecutor to request that the investigating judge reopen the case. The Belgian federal prosecutor decided to submit the admissibility of this request to the Court of Appeal of Brussels. In its decision of March 5, 2008, the Court of Appeal confirmed the termination of the proceedings against TOTAL, its Chairman and the former president of its subsidiary, based on the principle ofres judicata applying to theCour de cassation’s decision of June 29, 2005. The plaintiffs have appealed the decision of March 5, 2008. On October 29, 2008, theCour de cassation rejected the plaintiffs’ appeal, thus ending definitively the proceedings. TOTAL has always maintained that the accusations made against the Company and its management arising out of the activities of its subsidiary in Myanmar arewere without substance as a matter of fact and as a matter of law. South Africa In a threatened class action proceeding in the United States, TOTAL, is being accused, together with approximately 100 other multinational companies, is the subject of accusations by certain South African citizens who allegealleged that their human rights were violated during the era of apartheid by the army, the police or militias, and who consider that these companies were accomplices in the actions by the South African authorities at the time. The claims against the companies named in the class action, which haswere not yet been officially brought against TOTAL, were dismissed by a federal judge in New York. The plaintiffs have appealed this dismissal.dismissal and, after a procedural hearing on November 3, 2008, decided to remove TOTAL from the list of companies against which it was bringing claims. Iran In 2003, the SEC issued a non-public formal order directing a private investigation in the matter of certain oil companies (including, among others, TOTAL), in connection with the pursuit of business in Iran. More recently,In 2006, a judicial inquiry related to TOTAL was initiated in France. In 2007, Christophe de Margerie,the Company’s Chief Executive Officer was placed under formal investigation in relation to this inquiry, as the former President of the Middle East department of the Upstream segment, was placed under formal investigation in relation to this inquiry. Group’s Exploration & Production division. The inquiry concerns an agreement concluded by the Group that relates to the South Pars gas field and allegations that certain payments were made pursuant tounder this agreement were paid to Iranian officials in connection with contracts entered into between the Group and the National Iranian Oil Company (NIOC). The Company has not been notified of any significant developments in the proceedings since the formal investigation was launched. The Company believes that the negotiation and execution of the agreement did not violate any applicable laws or applicable international conventions. TheHowever, the Company cannot however, exclude the possibility that additional procedures may be initiated with respect to this matter.
Italy As part of an investigation led by the Prosecutor of the Republic of the Potenza court, Total Italia is the subject of an investigation related to certain calls for tenders that it made for the preparation and development of the Tempa Rossa oil field. On February 16, 2009, as a preliminary measure before the proceedings go before the court, the preliminary investigating judge of Potenza served notice to Total Italia of a decision that would suspend the concession for this field for one year. Total Italia is contesting the allegations and has appealed the decision by the preliminary investigation judge to the court of appeals of Potenza. Oil-for-Food Program Several countries have commenced investigations concerning possible violations related to the United Nations (UN) Oil-for-Food program in Iraq. Pursuant to a French judicialcriminal investigation, certain current or former Group employees were placed under formal criminal investigation for possible charges as accessories to the misappropriation of corporate assets and as accessories to the corruption of foreign public agents. The PresidentChief Executive Officer of the Company, formerly president of the Group’s Exploration & Production division, who is now the Company’s Chief Executive Officer, was also placed under formal investigation in October 2006. In 2007, the criminal investigation was closed and the case was transferred to the prosecutor’s office. The prosecutor’s office must now submit to the investigating judge its recommendation on whether or not to pursue the case. The Company believes that its activities related to the Oil-for-Food program have been in compliance with this program, as organized by the UN.UN in 1996. CEPSABlue Rapid and the Russian Olympic Committee
TOTALBlue Rapid, a Panamanian company, and the Russian Olympic Committee filed a claim for damages with the
Paris Commercial Court against Elf Aquitaine concerning its withdrawal from an exploration and production project in Russia that was negotiated early in the 1990s. Elf Aquitaine believes this claim to be unfounded. On January 12, 2009, the Commercial Court of Paris rejected Blue Rapid’s claim and found that the Russian Olympic Committee did not have standing in the matter. This decision has been a shareholder in the Spanish oil and gas company CEPSA since 1990. The other main shareholders of CEPSA are Santander Central Hispano S.A. (SCH), Unión Fenosa and International Petroleum Investment Company. In March 2006, the Netherlands Arbitration Institute at The Hague settled a dispute between TOTAL and SCH. In August 2006, TOTAL and SCH signed an agreement in order to implement this arbitration award, thus enabling TOTAL to directly hold the 7.51% of CEPSA’s stock that it used to indirectly hold through the holding entity Somaen Dos, while shareholders’ agreements between TOTAL and SCH in respect of CEPSA were terminated.
Furthermore, following the authorization of the European Commission in October 2006, SCH sold to TOTAL 4.35% of CEPSA’s shares at a price of€4.54 per share, representing an aggregate amount of approximately 53 M€, also to implement the aforementioned arbitration award.appealed.
Dividend policy The Company has paid dividends on its share capital in each year since 1946. Future dividends will depend on the Company’s earnings, financial condition and other factors. The payment and amount of dividends are subject to the recommendation of the Board of Directors and resolution by the Company’s shareholders’ at the annual shareholders’ meeting. For the 20062008 fiscal year, the Board of Directors has proposed a dividend of€1.872.28 per share. This proposed dividend will be voted on by the shareholders’ meeting to be held on May 11, 2007.15, 2009. An interim dividend of€0.871.14 per share was paid on November 17, 2006.19, 2008. If approved, the balance of€1.001.14 per share will be paid on May 18, 2007.22, 2009. Dividends paid to holders of ADRs will be subject to a charge by the Depositary for any expenses incurred by the Depositary in the conversion of euro to dollars. See “Taxation” under “Item 10. Additional Information”Information — Taxation”, for a summary of certain U.S. federal and French tax consequences to holders of shares and ADRs. Significant changes For a description of significant changes that have occurred since the date of the Company’s Consolidated Financial Statements, see “Item 4. Information on the Company” and “Item 5. Operating and Financial Review and Prospects”, which include descriptions of certain recent 20072009 activities.
ITEM 9. THE OFFER AND LISTING Markets The principal trading market for the shares is the Eurolist by Euronext Paris exchange in Paris.France. The shares are also listed on Euronext Brussels and the London Stock Exchange, and are quoted on SEAQ International.Exchange. Offer and listing details Trading on Euronext Paris Official trading of listed securities on Euronext Paris, including the shares, is transacted through French investment service providers that are members of Euronext Paris and takes place continuously on each
business day in Paris from 9:00 a.m. to 5:30 p.m. (Paris time), with a fixing of the closing price at 5:35 p.m.p.m. Euronext Paris may suspend or resume trading in a security listed on EurolistEuronext Paris, if the quoted price of the security exceeds certain price limits defined by the regulations of Euronext Paris. From April 1, 2006, all theThe markets of Euronext Paris settle and transfer ownership three trading days after a transaction (T+3). Highly liquid shares, including those of the Company, are eligible for deferred settlement(Service à Réde Règlement Différé — SRD). Payment and delivery for shares under the SRD occurs on the last trading day of each month. Use of the SRD service requires payment of a commission. Under this system, the determination date for settlement on the following month occurs on the fifth trading day prior to the last trading day (inclusive) of each month.
In France, the shares are included in the principal index published by Euronext Paris (the “CAC 40 Index”). The CAC 40 Index is derived daily by comparing the total market capitalization of 40 stocks included in the Eurolist bytraded on Euronext exchange in Paris to the total market capitalization of the same stocks that made up the CAC 40 Index on December 31, 1987. Adjustments are made to allow for expansion of the sample due to new issues. The CAC 40 Index indicates trends in the French stock market as a whole and is one of the most widely followed stock price indices in France. In the UK, the shares are listed in both the FTSE Eurotop 100 and FTSEurofirst 300 index. As a result of the creation of Euronext, the shares are included in Euronext 100, the index representing Euronext’s blue chip companies based on market capitalization. The shares are also included in the Dow Jones Stoxx 50 and Dow Jones Euro Stoxx 50, blue chip indices comprised of the 50 most highly capitalized and most actively traded equities throughout Europe and within the European Monetary Union, respectively. Since June 2000, the shares have been included in the Dow Jones Global Titans Index which consists of 50 global companies selected based on market capitalization, book value, assets, revenue and earnings. Pursuant to the vote of the May 12, 2006, shareholders’ meeting approving to TOTAL’s four-for-one stock split, each shareholder received on May 18, 2006, four new TOTAL shares, par value of€2.50 per share, in return for each old share with a par value of€10. The table below sets forth, for the periods indicated, the reported high and low quoted prices in euros for the currently outstanding shares on Euronext Paris. Data prior to May 18, 2006, reported in this table has been adjusted to reflect this stock split by dividing stock prices by four. The May 12, 2006, shareholders’ meeting also approved the spin-off of Arkema and the allocation, as of May 18, 2006, of one Arkema share allocation right for each TOTAL share with a par value of€10, ten allocation
rights entitling the holder to one Arkema share. Data prior to May 18, 2006, reported in the third and fourth columns of this table are adjusted in order to consider Arkema’s share allocation right partition.
| | Price per share (€) | | High | | Low | | High adjusted | | Low adjusted | | High | | Low | | High adjusted | | Low adjusted | 2002 | | 44.85 | | 30.30 | | 44.27 | | 29.91 | | 2003 | | 36.98 | | 27.63 | | 36.50 | | 27.27 | | 2004 | | 42.95 | | 34.85 | | 42.40 | | 34.40 | | 42.95 | | 34.85 | | 42.40 | | 34.40 | 2005 | | 57.28 | | 39.50 | | 56.54 | | 38.99 | | 57.28 | | 39.50 | | 56.54 | | 38.99 | 2006 | | | 58.15 | | 46.52 | | 57.40 | | 46.52 | 2007 | | | 63.40 | | 48.33 | | — | | — | First Quarter | | 46.03 | | 39.50 | | 45.43 | | 38.99 | | 55.45 | | 48.33 | | — | | — | Second Quarter | | 49.15 | | 42.85 | | 48.52 | | 42.30 | | 60.31 | | 52.05 | | — | | — | Third Quarter | | 57.28 | | 48.03 | | 56.54 | | 47.41 | | 63.40 | | 50.52 | | — | | — | Fourth Quarter | | 57.05 | | 49.75 | | 56.32 | | 49.11 | | 57.98 | | 53.00 | | — | | — | | 2006 | | 58.15 | | 46.52 | | 57.40 | | 46.52 | | 2008 | | | 59.50 | | 31.52 | | — | | — | First Quarter | | 58.15 | | 51.43 | | 57.40 | | 50.76 | | 59.50 | | 45.45 | | — | | — | Second Quarter | | 57.43 | | 46.52 | | 56.69 | | 46.52 | | 58.25 | | 46.35 | | — | | — | Third Quarter | | 54.50 | | 49.45 | | — | | — | | 54.24 | | 40.50 | | — | | — | Fourth Quarter | | 56.95 | | 50.10 | | — | | — | | 44.55 | | 31.52 | | — | | — | October | | 54.80 | | 50.10 | | — | | — | | 43.90 | | 31.52 | | — | | — | November | | 56.95 | | 52.30 | | — | | — | | 44.55 | | 36.115 | | — | | — | December | | 56.00 | | 52.20 | | — | | — | | 42.00 | | 35.44 | | — | | — | | 2007 (through April 5) | | 55.45 | | 48.33 | | — | | — | | 2009 (through March 31) | | | 42.465 | | 34.25 | | — | | — | First Quarter | | 55.45 | | 48.33 | | — | | — | | 42.465 | | 34.25 | | — | | — | January | | 55.45 | | 50.80 | | — | | — | | 42.465 | | 34.35 | | — | | — | February | | 53.95 | | 51.02 | | — | | — | | 42.185 | | 36.64 | | — | | — | March | | 52.99 | | 48.33 | | — | | — | | 39.42 | | 34.25 | | — | | — | Second Quarter | | 52.99 | | 52.05 | | — | | — | | April | | 52.99 | | 52.05 | | — | | — | |
Trading on the New York Stock Exchange ADRs have been listed on the New York Stock Exchange since October 25, 1991. The Bank of New York Mellon serves as depositary with respect to the ADRs traded on the New York Stock Exchange. The table below sets forth, for the periods indicated, the reported high and low prices quoted in dollars for the currently outstanding ADRs on the New York Stock Exchange. After the four-for-one stock split, which was approved by the shareholders’ meeting on May 12, 2006, and effective on May 18, 2006, and after the split of the ADRs by two on May 23, 2006, one ADR now corresponds to one TOTAL share. Data prior to May 23, 2006, reported in this table has been adjusted to take into account this stock split by dividing ADR prices by two. The May 12, 2006, shareholders’ meeting also approved the spin-off of Arkema and the allocation, as from May 18, 2006, of one Arkema share allocation right for each TOTAL share with a par value of€10, 10ten allocation rights entitling the holder to one Arkema share. Data prior to May 23, 2006, reported in the third and fourth columns of this table has been adjusted in order to reflect Arkema’s share allocation right partition.
| | Price Per ADR ($) | | High | | Low | | High adjusted | | Low adjusted | | High | | Low | | High adjusted | | Low adjusted | 2002 | | 41.62 | | 30.15 | | 40.95 | | 29.66 | | | 2003 | | 46.73 | | 30.48 | | 45.98 | | 29.98 | | | 2004 | | 55.28 | | 43.88 | | 54.39 | | 43.17 | | 55.28 | | 43.88 | | 54.39 | | 43.17 | | 2005 | | 68.97 | | 51.87 | | 67.86 | | 51.03 | | 68.97 | | 51.87 | | 67.86 | | 51.03 | 2006 | | | 73.46 | | 58.06 | | 73.46 | | 58.06 | 2007 | | | 87.34 | | 63.89 | | — | | — | First Quarter | | 61.38 | | 51.87 | | 60.38 | | 51.03 | | 72.65 | | 63.89 | | — | | — | Second Quarter | | 59.99 | | 54.21 | | 59.03 | | 53.33 | | 81.55 | | 69.57 | | — | | — | Third Quarter | | 68.97 | | 58.61 | | 67.86 | | 57.66 | | 87.34 | | 68.01 | | — | | — | Fourth Quarter | | 67.58 | | 59.76 | | 66.49 | | 58.79 | | 84.46 | | 76.66 | | — | | — | | 2006 | | 73.46 | | 58.06 | | 73.46 | | 58.06 | | 2008 | | | 91.34 | | 42.60 | | — | | — | First Quarter | | 69.76 | | 61.52 | | 68.63 | | 60.53 | | 86.90 | | 67.11 | | — | | — | Second Quarter | | 72.27 | | 58.06 | | 71.10 | | 58.06 | | 91.34 | | 73.09 | | — | | — | Third Quarter | | 69.73 | | 62.23 | | — | | — | | 83.99 | | 57.19 | | — | | — | Fourth Quarter | | 73.46 | | 63.71 | | — | | — | | 60.90 | | 42.60 | | — | | — | October | | 69.05 | | 63.71 | | — | | — | | 60.90 | | 42.60 | | — | | — | November | | 72.13 | | 66.84 | | — | | — | | 58.17 | | 43.93 | | — | | — | December | | 73.46 | | 69.48 | | — | | — | | 60.19 | | 44.90 | | — | | — | | 2007 (through April 9) | | 72.65 | | 63.89 | | — | | — | | 2009 (through March 31) | | | 57.85 | | 42.88 | | — | | — | First Quarter | | 72.65 | | 63.89 | | — | | — | | 57.85 | | 42.88 | | — | | — | January | | 72.65 | | 66.13 | | — | | — | | 57.85 | | 44.73 | | — | | — | February | | 70.97 | | 66.99 | | — | | — | | 55.09 | | 46.35 | | — | | — | March | | 70.44 | | 63.89 | | — | | — | | 53.32 | | 42.88 | | — | | — | Second Quarter | | 71.00 | | 69.57 | | — | | — | | April | | 71.00 | | 69.57 | | — | | — | |
ITEM 10. ADDITIONAL INFORMATION Memorandum and Articles of Association Register Information TOTAL S.A. is registered with the Nanterre Trade Register under the registration number 542 051 180. Objects and Purposes The Company’s purpose can be found in Article 3 of itsstatuts (the Company’s bylaws). Generally, the Company may engage in all activities relating toto: (i) the exploration and extraction of mining deposits and the performance of industrial refining, processing, and trading of these materials, as well as their derivatives and by-products; (ii) the production and distribution of all forms of energy; (iii) the chemicals, rubber and health industries; (iv) the transportation and shipping of hydrocarbons and other products or materials relating to the Company’s business purpose; and (v) all financial, commercial, and industrial operations and operations relating to any fixed or unfixed assets and real estate, acquisitions of interests or holdings in any business or company that may relate to any of the above-mentioned purposes or to any similar or related purposes, of such nature as to promote the Company’s extension or its development.
Director Issues Compensation Directors receive attendance fees, the maximum aggregate amount of which, determined by the shareholders acting at a shareholders’ meeting, remains in effect until a new decision is made. The Board of Directors may apportion this amount among its members in whatever way it considers appropriate. The Board may also grant its Chairman compensation in addition to attendance fees. Retirement The number of directors of TOTAL who are acting in their own capacity or as permanent representatives of a legal entity and are over 70 years old may not exceed one-third of the number of directors in office at the end of the fiscal year. If such number is exceeded, the oldest Board member is automatically deemed to have resigned. Directors who are the permanent representative of a legal person may not continue in office beyond their seventieth70th birthday.
Currently, the duties of the Chairman of the Board automatically cease on his 65th birthday at the latest. At its meeting of February 11, 2009, the Board resolved to propose to the shareholders’ meeting to be held on May 15, 2009, an amendment of the bylaws pertaining to the rules relating to the nomination of the Chairman. The amendment will allow the Board, as an exception to the currently applicable 65-year age limit, to appoint as Chairman of the Board for a period of up to two years a director who is more than 65 years old but less than 70 years old.Shareholdings Each director must own at least 1,000 shares of TOTAL during his or her term of office. Election Directors are elected for a term of three years. In 2003, TOTAL amended its Articles of Incorporation to provide for the election of one director to represent employee shareholders. This director was appointed for the first time at the shareholders’ meeting held on May 14, 2004. Description of Shares The following is a summary of the material rights of holders of fully paid shares and is based on thestatutsof the Company and French Company Law as codified in Volume II of the French Commercial Code (referred to herein as the “French Company Law”). For more complete information, please read thestatutsof TOTAL S.A., a copy of which has been filed as an exhibit to this Annual Report. Dividend rights The Company may make dividend distributions to its shareholders from net income in each fiscal year, after deduction of the overhead and other social charges, as well as of any amortization of the business assets and of any provisions for commercial and industrial contingencies, as reduced by any loss carried forward from prior years, and less any contributions to reserves or amounts that the shareholders decide to carry forward. These distributions are also subject to the requirements of French Company Law and the Company’sstatuts. Under French Company Law, the Company must allocate 5% of its net profits in each fiscal year to a legal reserve fund until the amount in that fund is equal to 10% of the nominal amount of its share capital. The Company’sstatutsprovide that its shareholders may decide to allocate all or a part of any distributable profits among special or general reserves, to carry them forward to the next fiscal year as retained earnings, or to allocate them to the shareholders as dividends. Thestatutsprovide that the remainder of any distributable profits shall be distributed among the shareholders in the form of dividends, either in cash or in shares. Under French Company Law, the Company must distribute dividends to its shareholders pro rata, according to their shareholdings. Dividends are payable to holders of outstanding shares on the date fixed by the shareholders’ meeting approving the distribution of dividends or, in the case of interim dividends, on the date fixed by the Company’s Board of Directors at the meeting that approves the distribution of interim dividends. Under French Company Law, dividends not claimed within five years of the date of payment revert to the French State. Voting rights Each shareholder of the Company is entitled to the number of votes he or she possesses, or for which he or she holds proxies. According to French Company Law, voting rights may not be exercised in respect of fractional shares. Each registered share that is fully paid and registered in the name of the same shareholder for a continuous period of at least two years is granted a double voting right after such two-year period. Upon capital increase by capitalization of reserves, profits or premiums on shares, a double voting right is granted to each registered share allocated to a shareholder relating to previously existing shares that already carry double voting rights. The double voting right is automatically canceled when the share is converted into a bearer share or when the share is transferred, unless the transfer is due to inheritance, division of community property between spouses, or a donation during the lifetime of the shareholder to the benefit of a spouse or relatives eligible to inherit.
In certain circumstances,
French Company Law limits a shareholder’s right to vote:vote in the following circumstances: Sharesshares held by the Company or entities controlled by the Company, which cannot be voted;
Sharesshares held by shareholders making a contribution in-kind to the Company, which cannot be voted with respect to resolutions relating to such in-kind contributions; and
Sharesshares held by interested parties, which cannot be voted with respect to resolutions relating to such shareholders.
Under the Company’sstatuts, the voting rights exercisable by a shareholder, directly, indirectly or by proxy, at any shareholders’ meeting are limited to 10% of the total number of voting rights attached to the shares on the date of such shareholders’ meeting. This 10% limitation may be increased by taking into account double voting rights held directly or indirectly by the shareholder or by proxy, provided that the voting rights exercisable by a shareholder at any shareholders’ meeting may never exceed 20% of the total number of voting rights attached to the shares. These limitations on voting lapse automatically if any individual or entity acting alone or in concert with an individual or entity holds at least two-thirds of the total number of shares as a result of a tender offer for 100% of the shares.
Liquidation rights In the event the Company is liquidated, its assets remaining after payment of its debts, liquidation expenses and all of its other remaining obligations will first be distributed to repay the nominal value of the shares. After these payments have been made, any surplus will be distributed pro rata among the holders of shares based on the nominal value of their shareholdings. Future capital calls Shareholders are not liable to the Company for further capital calls other than the nominal value ofon their shares. Preferential subscription rights Holders of shares have preferential rights to subscribe on a pro rata basis for additional shares issued for cash. Shareholders may waive their preferential rights, either individually or, under certain circumstances, as a group at an extraordinary shareholders’ meeting. During the subscription period relating to a particular offering of shares, shareholders may transfer their preferential subscription rights that they have not previously waived. Changes in share capital Under French Company Law, the Company may increase its share capital only with the approval of its shareholders at an extraordinary shareholders’ meeting (or with a delegation of authority from its shareholders). There are two methods to increase share capital: (i) by issuing additional shares, including the creation of a new class of securities and (ii) by increasing the nominal value of existing shares. The Company may issue additional shares for cash or for assets contributed in kind, upon the conversion of debt securities, or other securities giving access to its share capital, that it may have issued, by capitalization of its reserves, profits or issuance premiums or, subject to certain conditions, in satisfaction of its indebtedness. Under French Company Law, TOTAL S.A. may decrease its share capital only with the approval of its shareholders at an extraordinary shareholders’ meeting (or with a delegation of authority from its shareholders). There are two methods to reduce share capital: (i) by reducing the number of shares outstanding and (ii) by decreasing the nominal value of existing shares. The conditions under which the share capital may be reduced will vary depending upon whether the reduction is attributable to losses. The Company may reduce the number of outstanding shares either by an exchange of shares or by the repurchase and cancellation of its shares. Any decrease must meet the requirements of French Company Law, which states that all the holders of shares in each class of shares must be treated equally, unless the affected shareholders otherwise agree. Form of shares The Company has only one class of shares, par value€2.50 per share. Shares may be held in either bearer or registered form. Shares traded on theEurolistof Euronext Paris S.A. are cleared and settled through Euroclear France. The Company may use any lawful means to identify holders of shares, including a procedure known astitres au porteur identifiableaccording to which Euroclear France will, upon the Company’s request, disclose to the Company the name, nationality, address and number of shares held by each shareholder in bearer form. The information may only be requested by the Company and may not be communicated to third parties. Holding of shares Under French Company Law concerning the “dematerialization” of securities, the ownership rights of shareholders are represented by book entries instead of share certificates (other than certificates representing French securities which are outstanding exclusively outside the territory of France and are not held by French residents). Registered shares are entered into an account maintained by the Company or by a representative that it
has nominated, while shares in bearer form must be held in an account maintained by an accredited financial intermediary on the shareholder’s behalf. For all shares in registered form, the Company maintains a share account with Euroclear France which is administered by BNP Paribas Securities Services. In addition, the Company maintains accounts in the name of each registered shareholder either directly or, at a shareholder’s request, through a shareholder’s accredited intermediary, in separate accounts maintained by BNP Paribas Securities Services on behalf of the Company. Each shareholder’s account shows the name and number of shares held and, in the case of shares registered through an accredited financial intermediary, the fact that they are so held. BNP Paribas Securities Services, as a matter of course, issues confirmations to each registered shareholder as to shares registered in a shareholder’s account, but these confirmations do not constitute documents of title. Shares held in bearer form are held and registered on the shareholder’s behalf in an account maintained by an accredited financial intermediary and are credited to an account at Euroclear France maintained by the intermediary. Each accredited financial intermediary maintains a record of shares held through it and will
issue certificates of inscription for the shares that it holds. Transfers of shares held in bearer form only may be made through accredited financial intermediaries and Euroclear France. Cancellation of treasury shares TheAfter receiving authorization through a shareholders’ meeting, the Board of Directors of the Company may cancel treasury shares owned by the Company in accordance with French Company Law up to a maximum of 10% of the share capital within any period of 24 months.
Description of TOTAL Share Certificates The TOTAL share certificates are issued by Euroclear France. French law allows Euroclear France to create certificates representing French securities provided that these certificates are intended to be outstanding exclusively outside the territory of France and cannot be held by residents of France. Furthermore, TOTAL share certificates may not be held by a foreign resident in France, either personally or in the form of a bank deposit, but the coupons and rights may be exercised in France. Certificates for TOTAL shares are either in bearer form or registered in a securities trading account. Under Euroclear France regulations applicable to bearer stock certificates, TOTAL share certificates cannot be categorized as secondary securities, such as ADSs, issued by a foreign company to represent TOTAL shares. TOTAL share certificates have the characteristics of a bearer security, meaning:meaning they are: negotiable outside France; transmissiontransmitted by delivery; and
fungibility of thefungible with TOTAL share certificate,certificates, which may be converted freely from bearer form to registration in an account.
All rights attached to TOTAL shares must be exercised directly by the bearer of the TOTAL share certificates. Description of TOTAL ADRs
The following is a general description of the depositary arrangement, including a summary of all material provisions of the deposit agreement pursuant to which ADSs are issued. The deposit agreement is among the Company, The Bank of New York, as depositary, and the holders from time to time of ADRs. For more complete information, please read the deposit agreement and the Form of ADR itself, copies of which are attached as Exhibit 1 to the registration statement on Form F-6 (Reg. No. 333-107311) filed with the Securities and Exchange Commission on July 24, 2003. Additional copies of the deposit agreement are available for inspection at the Corporate Trust Office of the depositary in New York, which is presently located at
101 Barclay Street, New York, New York 10286. The depositary’s principal executive office is located at One Wall Street, New York, New York 10286.
ADRs
ADRs evidencing the ADSs are issuable by the depositary pursuant to the deposit agreement. An ADR may evidence any number of ADSs. Each ADS represents one share deposited under the deposit agreement.
Deposit and withdrawal of shares
All references to the deposit, surrender, delivery, transfer and withdrawal of the shares when referring to shares not in certificated form, refer to book-entry transfers and do not contemplate the physical transfer of certificates representing the shares.
Upon receipt of notice, as provided in the deposit agreement, of a deposit with the custodian in Paris, and subject to the terms of the deposit agreement, the depositary will execute and deliver through its Corporate Trust Office to the holders of such ADSs, ADRs registered in the names of those holders for the number of ADSs requested by each holder. This execution and delivery will occur only upon payment to the depositary of a fee for the execution and delivery of the ADRs and of all taxes, governmental charges and fees.
Upon surrender of ADRs at the Corporate Trust Office of the depositary and payment of the fee of the depositary, and of all taxes and governmental charges, and subject to the provisions of the deposit agreement and thestatutsof the Company, ADR holders are entitled to the transfer of deposited securities to an account in the name of such holder as shall be designated by such holder maintained by the Company in the case of shares in registered form, or by an accredited financial institution, as in the case of shares in bearer form. The depositary will not accept for surrender an ADR representing fewer than two ADSs or integral multiples thereof.
The forwarding of documents of title for delivery at the Corporate Trust Office of the depositary in New York City will be at the request, risk and expense of the ADR holder.
Pre-release of ADRs
In certain circumstances, subject to the provisions of the deposit agreement, The Bank of New York may issue ADRs before deposit of the underlying shares. This issuance is a “pre-release”. The Bank of New York may also deliver shares prior to receipt and cancellation of ADRs (even if they are cancelled before the pre-release
transaction has been closed out). A pre-release is closed out as soon as the underlying shares are delivered to The Bank of New York. The Bank of New York may receive ADRs instead of shares to close out a pre-release. The Bank of New York may pre-release ADRs only under the following conditions:
before or at the time of the pre-release, the person to whom the pre-release is being made must represent to The Bank of New York in writing that it or its customer owns the shares or ADRs to be deposited;
the pre-release must be fully collateralized with cash or other collateral that The Bank of New York considers appropriate; and
The Bank of New York must be able to close out the pre-release on not more than five business days’ notice.
In addition, The Bank of New York will limit the number of ADRs that may be outstanding at any time as a result of pre-release. The Bank of New York, however, may disregard the limit from time to time, if it thinks it is appropriate to do so.
Dividends, other distributions and rights
Whenever the depositary receives any cash dividend or cash distribution from the Company, the depositary will, to the extent that in its judgment it can convert euros or any other foreign currency on a reasonable basis into dollars and transfer the resulting dollars to the United States:
convert all cash dividends and other cash distributions that it receives on the underlying deposited securities into dollars; and
distribute the amount received net of any expense, taxes, governmental charges incurred by the depositary in connection with the conversion, to the holders of the ADRs in proportion to the number of the ADSs representing shares held by each holder.
The amount distributed will be reduced by any amounts required to be withheld by the Company or the French paying agent on account of taxes. The depositary may convert euros into dollars by sale or in any other manner that it may determine. If the depositary determines in its judgment that any foreign currency received cannot be converted on a reasonable basis and transferred to the United States, the depositary may, after consultation with the Company, distribute the foreign currency received by it or, at its discretion, hold the foreign currency, uninvested and without liability for interest, for the respective accounts of the holders of the ADRs entitled to receive the amounts. The depositary will distribute only whole U.S. dollars and cents and will
round fractional cents to the nearest whole cent. If the exchange rates fluctuate during a time when the depositary cannot convert the foreign currency, the holder may lose some or all of the value.
The depositary will use reasonable efforts to follow the procedures established by the French Treasury for eligible U.S. Holders of ADRs to recover the excess 10% French withholding tax initially withheld and deducted in respect of dividends distributed to them and any fiscal or tax credit payment to be made to them by the French Treasury. To effect this recovery, the depositary will provide U.S. Holders of depositary receipts registered on the books of the depositary with the appropriate French tax forms and instructions, which will be provided by the Company to the depositary. Upon receipt by the depositary of properly completed and executed forms, the depositary will promptly cause them to be filed with the appropriate French tax authorities. Upon receipt of any resulting remittance, the depositary will distribute to the holders of the Company ADRs entitled to remittance, as soon as practicable, the remittance converted into dollars, net of expenses incurred by the depositary in connection with conversion.
If any distribution by the Company consists of a dividend in, or free distribution of, shares, the depositary may, upon prior consultation with and approval of the Company, and will, if the Company so requests, issue an amount of ADRs evidencing ADSs representing the amount of shares received as a dividend or free distribution. The depositary will distribute to the holders of outstanding ADRs, in proportion to their holding and subject to the provisions of the deposit agreement, including the withholding of taxes and governmental charges and the payment of fees, additional ADRs evidencing an aggregate number of ADSs representing the number of shares received as a dividend or free distribution.
In lieu of distributing fractional ADSs, the depositary will sell the amount of the shares represented by the aggregate amount of shares representing fractional ADSs and distribute the net proceeds in accordance with the provisions of the deposit agreement.
If additional ADSs are not so distributed, each ADS will represent the additional shares distributed. The Company and the depositary will not offer the shares to holders of ADRs unless a registration statement is in effect with respect to the securities represented by those rights under the Securities Act of 1933, as amended (the “Securities Act”) or the offer and sale of such shares to the holders are exempt from registration under the provisions of the Securities Act.
Record dates
Whenever:
any cash dividend or other cash distribution becomes payable or any distribution other than cash is made;
rights are issued with respect to the underlying deposited securities;
for any reason the depositary causes, at the Company’s election, a change in the number of shares represented by each ADS; or
the depositary receives notice of any shareholders’ meeting’
the depositary will fix a record date, after consultation with the Company if the date is to be different from any payment date established by the Company in respect of the shares, for the determination of the holders of ADSs who are entitled to receive the dividend, distribution or rights. The depositary will, further, give instructions for the exercise of voting rights at any such meeting or for fixing the date on or after which each ADS will represent a changed number of shares, subject to the provisions of the deposit agreement.
Voting of the deposited securities
As soon as practicable after receipt by the depositary of a notice of any shareholders’ meeting, the depositary will mail a notice to the holders of the ADRs registered on the books of the depositary which will contain:
a summary in English of the notice of such meeting;
• | | a statement that the holders of ADRs at the close of business on a specified record date will be entitled, subject to any applicable provisions of French Company Law, the Company’sstatutsand the shares, to instruct the depositary to exercise the voting rights, if any, pertaining to the shares represented by their ADSs;
|
summaries in English of any materials or other documents provided by the Company for the purpose of enabling holders of the ADRs to exercise voting rights; and
a statement as to the manner in which instructions for exercising voting rights may be given to the depositary, including a statement as to the manner in which the shares with respect to which the depositary does not receive properly completed voting instructions or receives a blank proxy will be voted, and stating the date established by the depositary for the receipt of those instructions.
The depositary intends so far as practicable to vote or cause to be voted the amount of the shares evidenced by the ADSs in accordance with the nondiscretionary instructions of the holders of ADSs. The depositary has agreed not to vote any of the shares so evidenced unless (i) it has received instructions from the record holders of ADRs or (ii) in accordance with the last statement of the paragraph above, if it does not receive properly completed voting instructions or it receives a blank proxy. Ownership of two ADRs or integral multiples of ADRs is required to exercise such voting rights subject to appropriate adjustment.
In accordance with French Company Law and thestatutsof the Company, shares that have been fully paid and registered in the name of the same holder for a continuous period of at least two years will be entitled to double voting rights. Similarly, holders of ADSs that have been held in the same name for a continuous period of two years or more and representing shares held in registered form for two years or more are entitled to double voting rights. No other ADSs will be entitled to double voting rights. Therefore, in order to be eligible for double voting rights, each holder of the ADSs must (i) request that the depositary hold shares in registered form and (ii) hold the ADRs in registered form (i.e., registered in the name of such holder in the books of the depositary).
Liability of ADR holders for taxes
The holders of ADRs will be responsible for any tax or other governmental charge that becomes payable with respect to any ADRs or any underlying deposited securities evidenced by any of the ADRs.
Amendment and termination of the deposit agreement
The ADRs and the deposit agreement may at any time be amended by written agreement between the Company and the depositary. Any amendment which:
imposes or increases any fees or charges, other than taxes and other governmental charges, registration fees, cable, telex, or facsimile transmission costs, deliver costs or other such expenses; or
which otherwise prejudices any substantial existing rights of holders of the ADRs,
will not take effect as to outstanding ADRs until the expiration of 90 days after written notice of the amendment has been mailed to the holders of outstanding ADRs registered on the books of the depositary.
Every holder of ADRs at the time such amendment becomes effective will be deemed, if such notice shall have been mailed to the holder, by continuing to hold such ADRs, to consent to the amendment and to be bound by the deposit agreement or ADRs as amended. In no event may any amendment impair the right of any holder of ADRs to surrender his or her ADRs and receive the shares of the Company and any property represented by the ADR, except in accordance with applicable law. In the event that the depositary resigns, is removed or is otherwise substituted and the Company enters into a new deposit agreement, holders of ADRs will be notified by the successor depositary.
Whenever so directed by the Company, the depositary has agreed to terminate the deposit agreement by mailing notice of such termination to the holders of all then outstanding ADRs registered on the books of the depositary at least 30 days prior to the date fixed in the notice for the termination. The depositary may likewise terminate the deposit agreement by mailing notice of the termination to the Company and the holders of outstanding ADRs registered on the books of the depositary, if at any time 60 days after the depositary shall have delivered to the Company a written notice of its resignation, a successor depositary shall not have been appointed and accepted its appointment as provided in the deposit agreement.
The depositary will mail notice of the termination to the registered holders of ADRs then outstanding at least 30 days prior to the date fixed in the notice for the termination. On and after the date of termination, each holder shall, upon:
surrender of the holder’s ADRs at the Corporate Trust Office;
payment of the fees of the depositary for the surrender of the ADRs provided in the deposit agreement; and
payment of any applicable taxes and governmental charges;
be entitled to delivery, to the holder or upon his or her order, of the amount of deposited TOTAL securities represented by the ADRs.
If any of the ADRs remain outstanding after the date of termination, the depositary will discontinue the registration of transfers of the ADRs, will suspend the distribution of dividends to the holders of the ADRs, and will not give any further notices or perform any further acts under the deposit agreement. The depositary will, however:
continue to collect dividends and other distributions pertaining to the underlying deposited securities;
sell rights as provided in the deposit agreement; and
continue to deliver the underlying deposited securities, together with any dividends or other distributions received, and the net proceeds of the sale of any rights or other property, in exchange for surrendered ADRs after deducting, in each case, fees and expenses of the depositary for the surrender of the ADRs, expenses for the account of the holders of the ADRs in accordance with the provisions of the deposit agreement, and taxes and governmental charges.
At any time after the expiration of one year from the date of termination, the depositary may sell:
the underlying deposited securities and any other property represented by the ADSs; and
hold the net proceeds, together with any other cash then held, unsegregated and without liability for interest, for the pro rata benefit of the holders of the ADRs that have not been surrendered, in which case, the holders will become general creditors of the depositary with respect to such proceeds.
Charges of depositary
The depositary will charge the party to whom the ADRs are issued and the party surrendering the ADRs for delivery of shares or other underlying securities, a fee not in excess of $5 per 100 ADSs for the issuance or surrender, respectively, of ADRs. The depositary will also charge holders of the ADRs a fee for, and will deduct the fee from, the distribution of proceeds from the sale of rights pursuant to the deposit agreement. This fee will be in an amount equal to the fee that would have been charged as a result of the deposit by holders of shares received in exercise of rights distributed to them had such rights not been sold by the depositary and the net proceeds distributed.
In addition, the following charges will be incurred by any party depositing or withdrawing shares, surrendering the ADRs or to whom the ADRs are issued, whenever applicable:
taxes and other governmental charges;
any applicable registration fees for the registration of transfers of shares generally on the share register of the Company and applicable to transfers of shares to the name of the depositary or the custodian on the making of deposits or withdrawals under the deposit agreement;
any cable, telex and facsimile charges provided in the deposit agreement;
and expenses incurred by the depositary in the conversion of foreign currency pursuant to the deposit agreement.
The charges and expenses of the custodian are for the sole account of the depositary.
Transfer of ADRs
The ADRs are transferable on the books of the depositary, provided that the depositary may close the transfer books, after consultation with or at the request of the Company, at any time or from time to time, when deemed expedient by the depositary in connection with the performance of its duties. Holders of the ADRs will have the right to inspect the transfer books, subject to certain conditions provided in the deposit agreement.
As a condition precedent to the execution and delivery, registration of transfer, split-up, combination or surrender of any of the ADRs, the delivery of any distribution thereon or the withdrawal of the underlying deposited securities, the depositary or the custodian may require payment of a sum sufficient to reimburse it for any share transfer, registration or conversion fee and payments of any applicable fees provided in the deposit agreement.
The depositary may refuse to effect any transfer of any of the ADRs or any withdrawal of the underlying deposited securities until all tax or other governmental charges payable with respect to the ADRs or deposited securities are paid. The depositary may also withhold any dividends or other distributions or, after attempting by reasonable means to notify the holder of any of the ADRs, may sell for the account of the holder any part or all of the underlying deposited securities evidenced by the ADRs, and may apply such dividends or other distributions or the proceeds of any sale to the payment of a tax or other governmental charge, with the holder of the ADRs remaining liable for any deficiency.
The delivery, transfer and registration of transfer of the ADRs generally may be suspended during any period when the transfer books of the depositary are closed, or if any such action is deemed necessary or advisable by the depositary or the Company at any time or from time to time, subject to the provisions of the deposit agreement.
The surrender of outstanding ADRs and the withdrawal of the underlying deposited securities may not be suspended subject only to:
temporary delays caused by closing the transfer books of the depositary or the Company for the
| deposit of shares of the Company in connection with voting at a shareholders’ meeting or the payment of dividends;
|
the payment of fees, taxes and similar charges; and
compliance with any U.S. or foreign laws or governmental regulations relating to the ADRs or to the withdrawal of the underlying deposited securities.
Notices and reports
The Company will furnish to the depositary for distribution to the holders of ADRs:
summaries of notices of shareholders’ meetings; and
other reports and summaries that are generally distributed by the Company to its shareholders.
The depositary will arrange for the mailing of copies of such reports and summaries in English to all record holders of the ADSs.
Compliance with U.S. securities laws
Notwithstanding anything in the deposit agreement to the contrary, the Company and the depositary each agrees that it will not exercise any rights it has under the deposit agreement to permit the withdrawal or delivery of the underlying deposited securities in a manner which would violate U.S. securities laws.
Governing law
The deposit agreement is governed by the laws of the State of New York.
Other Issues Shareholders’ meetings French companies may hold either ordinary or extraordinary shareholders’ meetings. Ordinary shareholders’ meetings are required for matters that are not specifically reserved by law to extraordinary shareholders’ meetings: the election of the members of the Board of Directors, the appointment of statutory auditors, the approval of a management report prepared by the Board of Directors, the approval of the annual financial statements, the declaration of dividends and the issuance of bonds. Extraordinary shareholders’ meetings are required for approval of amendments to a company’sstatuts, modification of shareholders’ rights,
mergers, increases or decreases in share capital, including a waiver of preferential subscription rights, the creation of a new class of shares, the authorization of the issuance of investment certificates or securities convertible, exchangeable or redeemable into shares and for the sale or transfer of substantially all of a company’s assets. The Company’s Board of Directors is required to convene an annual shareholders’ meeting for approval of the annual financial statements. This meeting must be held within six months of the end of the fiscal year. However, the president of theTribunal de Commerceof Nanterre, the local French commercial court, may ordergrant an extension of this six-month period. The Company may convene other ordinary and extraordinary meetings at any time during the year. Meetings of shareholders may be convened by the Board of Directors or, if it fails to call a meeting, by the Company’s statutory auditors or by a court-appointed agent. A shareholder or shareholders holding at least 5% of the share capital, the employee committee or another interested party under certain exceptional circumstances, may request that the court appoint an agent. The notice of meeting must state the agenda for the meeting. French Company Law requires that a preliminary notice of a listed company’s shareholders’ meeting be published in theBulletin des annonces légales obligatoires(“BALO”) at least 3035 days prior to the meeting.meeting (or 15 days in the event the Company is subject
to a tender offer and the Company calls a shareholders’ meeting to approve measures, the implementation of which would be likely to cause such tender offer to fail). The preliminary notice must first be sent to theAutorité des marchés financiers with an indication of the date it is to be published in the BALO. The preliminary notice must include the agenda of the meeting and the proposed resolutions that will be submitted to a shareholders’ vote. Within 10 days of publication, one or more shareholders holding a certain percentage of the Company’s share capital determined on the basis of a formula related to capitalization may propose additional resolutions. Notice of a shareholders’ meeting is sent by mail at least 15 days (or six days in the event of shareholders’ meetings convened in the situation where the Company was subject to a tender offer to approve measures, the implementation of which would be likely to cause such tender offer to fail) before the meeting to all holders of registered shares who have held their shares for more than one month. However, in the case where the original meeting was adjourned because a quorum was not met, this time period is reduced to six days.days (or four days in the event of shareholders’ meetings convened in the situation where the Company were subject to a tender offer to approve measures, the implementation of which would be likely to cause such tender offer to fail). Attendance and the exercise of voting rights at both ordinary and extraordinary shareholders’ meetings are subject to certain conditions. UnderPursuant to French Company Law, participation at shareholders’ meetings is subject to the Company’sstatuts,condition that an entry of registration has been made, for the owner of registered shares, in order to participate in any shareholders’ meeting, the owners of bearer shares or shares that are entered in an account notrecords maintained by the Company, must,or, for the owner of bearer shares, in the records of an authorized intermediary, in each case at least one12:00 a.m. (Paris time) on the third trading day beforepreceding the dateshareholders’ meeting. For the owner of bearer shares the meeting, fileregistration is evidenced by a certificate of participation(certificat d’immobilisation des titres au porteurattestation de participation)) prepared issued by the broker who keeps their accounts, recording the non-transferability of theauthorized intermediary. securities until the meeting date at the places indicated in the meeting notice. The owners of registered shares entered in an account maintained by the Company must be entered into the Company’s registers at least one day before the day scheduled for the meeting.
Subject to the above restrictions, all of the Company’s shareholders have the right to participate in the Company’s shareholders’ meetings, either in person or by proxy. No shareholder may delegate voting authority to another person except the shareholder’s spouse or another shareholder or, if the shareholder is not a resident of France, by a registered intermediary in conformity with applicable regulations. Shareholders may vote, either in person, by proxy, or by mail, and each is entitled to as many votes as he or she possesses or as many shares as he or she holds proxies for. If the shareholder is a legal entity, it may be represented by a legal representative. A shareholder may grant a proxy to the Company by returning a blank proxy form. In this last case, the chairman of the shareholders’ meeting may vote the shares in favor of all resolutions proposed or agreed to by the Board of Directors and against all others. The Company will send proxy forms to shareholders upon request. In order to be counted, proxies must be received at least one day prior to the shareholders’ meeting at the Company’s registered office or at another address indicated in the notice convening the meeting. Under French Company Law, shares held by entities controlled directly or indirectly by the Company are not entitled to voting rights. There is no requirement that a shareholder have a minimum number of shares in order to be able to attend or be represented at shareholders’ meetings. Under French Company Law, a quorum requires the presence, in person or by proxy, including those voting by mail, of shareholders having at least 20% of the shares entitled to vote in the case of (i) an ordinary shareholders’ meeting, or at(ii) an extraordinary meeting where shareholders are voting on a capital increase by capitalization of reserves, profits or share premium or (iii) an extraordinary general meeting of shareholders convened in the situation where the Company is subject to a tender offer in order to approve an issuance of warrants allowing the subscription, at preferential conditions, of shares of the Company and the free allotment of such warrants to existing shareholders of the Company, the implementation of which would be likely to cause such tender offer to fail, or 25% of the shares entitled to vote in the case of any other extraordinary shareholders’ meeting. If a quorum is not present at any meeting, the meeting is adjourned. There is no quorum requirement when an ordinary shareholders’ meeting is reconvened, but the reconvened meeting may consider only questions which were on the agenda of the adjourned meeting. When an extraordinary shareholders’ meeting is reconvened, the quorum required is 20% of the shares entitled to vote, except where the reconvened meeting is considering capital increases through capitalization of reserves, profits or share premium. For these matters, no quorum is required at the reconvened meeting. If a quorum is not present at a reconvened meeting requiring a quorum, then the meeting may be adjourned for a maximum of two months.
At an ordinary shareholders’ meeting, approval of any resolution requires the affirmative vote of a simple majority of the votes of the shareholders present or represented by proxy. The approval of any resolution at an extraordinary shareholders’ meeting requires the affirmative vote of a two-thirds majority of the votes cast, except that (i) any resolution to approve a capital increase by capitalization of reserves profits, or share premium or (ii) any resolution, in the situation where the Company is subject to a tender offer in order to approve an issuance of warrants allowing the subscription, at preferential conditions, of shares of the Company and
the free allotment of such warrants to existing shareholders of the Company, the implementation of which would be likely to cause such tender offer to fail, only requires the affirmative vote of a simple majority of the votes cast. Notwithstanding these rules, ana unanimous vote is required to increase shareholders’ liabilities. Abstention from voting by those present or represented by proxy is counted as a vote against any resolution submitted to a vote. As set forth in the Company’sstatuts, shareholders’ meetings are held at the Company’s registered office or at any other location specified in the written notice. Ownership of shares by non-French persons There is no limitation on the right of non-resident or foreign shareholders to vote securities of the Company, either under French Company Law or under thestatutsof the Company. Requirement for holdings exceeding certain percentages French Company Law provides that any individual or entity, acting alone or in concert with others, that holds, directly or indirectly, more than 5%, 10%, 15%, 20%, 25%, 33 1/3%, 50%, 66 2/3%3%, 90% or 95% of the outstanding shares or the voting rights(1) attached to the shares, or that increases or decreases its shareholding or voting rights by any of the above percentages must notify the Company by registered letter, with return receipt, within 5five business days of crossing that threshold, of the number of shares and voting rights it holds. An individual or entity must also notify the AMF, the self-regulatory organization that has general regulatory authority over the French stock exchanges and whose members include representatives of French stockbrokers, by registered letter, with return receipt, within five trading days of crossing that threshold. Any shareholder who fails to comply with these requirements will have its voting rights in excess of such thresholds suspended for a period of two years from the date such shareholder complies with the notification requirements and may have all or part of its voting rights suspended for up to five years by the commercial court at the request of the Company’s Chairman, any of the Company’s shareholders or theAutorité des marchés financiers. In addition, every shareholder who, directly or indirectly, acting alone or in concert with others, acquires ownership or control of shares representing 10% or 20% of the Company’s share capital must notify the Company and theAutorité des marchés financiersof its intentions for the 12 months following such an acquisition. Failure to comply with this notification of intentions will result in the suspension of the voting rights attached to the shares exceeding this 10% or 20% threshold held by the shareholder for a period of two years from the date on which the shareholder has cured such default and, upon a decision of the commercial court part or all the shares held by such shareholder may be suspended for up to five years. In addition, the Company’sstatutsprovide that any person, whether a natural person or a legal entity, who comes to hold, directly or indirectly, 1% or more, or any multiple of 1%, of the Company’s share capital or voting rights or of securities that may include future voting rights or future access to share capital or voting rights, must notify the Company by registered letter with return receipt requested, within 15 calendar days of crossing such threshold. Failure to comply with these notification provisions will result in the suspension of the voting rights attached to the shares exceeding this 1% threshold held by the shareholder if requested at a shareholders’ meeting by one or more shareholders holding shares representing at least 3% of the share capital. Any individual or legal entity whose direct or indirect holding of shares falls below each of the levels mentioned must also notify the Company in the manner and within the time limits set forth above. Subject to certain limited exemptions, any person, or persons acting in concert, owning in excess of 33 1/3%3% of the share capital or voting rights of the Company must initiate a public tender offer for the balance of the share capital, voting rights and securities giving access to such share capital or voting rights. Material Contracts There have been no material contracts (not entered into in the ordinary course of business) entered into by members of the Group since March 31, 2005.2006. Exchange Controls Under current French exchange control regulations, no limits exist on the amount of payments that TOTAL may remit to residents of the United States. Laws and regulations concerning foreign exchange controls do require, however, that an accredited intermediary must handle all payments or transfer of funds made by a French resident to a non-resident.
| (1) | For purposes of shareholding threshold declarations, pursuant to Article 223-11 of the General Regulation of the AMF, voting rights are calculated on the basis of all outstanding shares, whether or not these shares would have rights to vote at a shareholders’ meeting. |
Taxation General This section describesgenerally summarizes the material U.S. federal income tax and French tax consequences of owning and disposing of shares and ADSs of TOTAL to U.S. Holders that hold their shares or ADSs as capital assets for tax purposes. A U.S. Holder is a beneficial owner of shares or ADSs that is (i) a citizen or resident of the United States for U.S. federal income tax purposes, (ii) a domestic corporation or other domestic entity treated as a corporation for U.S. federal income tax purposes, (iii) an estate whose income is subject to U.S. federal income tax regardless of its source, or (iv) a trust if a U.S. court can exercise primary supervision over the trust’s administration and one or more U.S. persons are authorized to control all substantial decisions of the trust. This section does not apply to members of special classes of holders subject to special rules, including: dealers in securities,securities; traders in securities that elect to use a mark-to-market method of accounting for their securities holdings,holdings; tax-exempt organizations,organizations; life insurance companies,companies; persons liable for alternative minimum tax,tax; persons that actually or constructively own 5% or more of the share capital or voting rights in TOTAL,TOTAL; persons that hold the shares or ADSs as part of a straddle or a hedging or conversion transaction,transaction; or U.S. Holderspersons whose functional currency is not the U.S. dollar.
If a partnership holds ordinary shares or ADSs, the tax treatment of a partner will generally depend upon the status of the partner and upon the activities of the partnership. Partners of partnership holding these ordinary shares or ADSs should consult their tax advisors as to the tax consequences of owning or disposing of ordinary shares or ADSs, as applicable. In addition, the discussion of the material French tax consequences is limited to U.S. Holders that (i) are residents of the United States for purposes of the Treaty (as defined below), (ii) do not maintain a permanent establishment or fixed base in France to which the shares or ADSs are attributable and through which the respective U.S. Holders carry on, or have carried on, a business (or, if the holder is an individual, performs or has performed independent personal services), and (iii) are otherwise eligible for the benefits of the Treaty in respect of income and gain from the shares or ADSs. In addition, this section is based in part upon the representations of the Depositary and the assumption that each obligation in the Deposit Agreement and any related agreement will be performed in accordance with its terms. This section is based on the Internal Revenue Code of 1986, as amended, its legislative history, existing and proposed regulations, published rulings and court decisions, and with respect to the description of the material French tax consequences, the laws of the Republic of France and French tax regulations, all as currently in effect, as well as on the Convention Between the United States and the Republic of France for the Avoidance of Double Taxation and the Prevention of Fiscal Evasion with respect to Taxes on Income and Capital dated August 31, 1994 (the “Treaty”). as currently in effect. These laws, regulations and the Treaty are subject to change, possibly on a retroactive basis. This discussion is intended only as a descriptive summary and does not purport to be a complete analysis or listing of all potential tax effects of the ownership or disposition of the shares and ADSs and is not intended to substitute competent professional advice. Individual situations of holders of shares and ADSs may vary from the description made below. Holders are urged to consult their own tax advisor regarding the U.S. federal, state and local, and French and other tax consequences of owning and disposing shares or ADSs of TOTAL in their respective circumstances. In particular, a holder is encouraged to confirm whether the holder is a U.S. Holder eligible for the benefits of the Treaty with its advisor. Taxation of Dividends French taxes The term “dividends” used in the following discussion means dividends within the meaning of applicable income tax treaties, or, where not defined by such treaties, within the meaning of the French domestic tax law as set forth in administrative guidelines dated February 25, 2005 (4 J-1-05) (the “Administrative Guidelines”). Dividends paid to non-residents of France are subject to French withholding tax at a rate of 25% unless. As a result of the 2008 French Finance Law, this withholding tax is reduced to 18% to dividends distributed to non-residents of France who are residents of certain States located within the European Economic Area. However, the rate ismay be reduced pursuant to a tax treaty or similar agreement. Under the Treaty, a U.S. Holder is generally is entitled to a reduced rate of French withholding tax of 15% with respect to dividends, provided the ownership of shares or ADSs is not effectively connected withattributable to a permanent establishment or to a fixed base in France and certain other requirements are satisfied.
InResidents of France companies may pay dividends only out of income remaining after tax has been paid. Until December 31, 2004, when dividends were received by shareholders resident in France, such persons were under certain circumstances entitled to a tax credit (Avoir fiscal) representing a portion of the underlying tax paid at the corporate level.
The French Finance Law of 2004, which reformed the taxation of dividends, repealed the benefit of theAvoir fiscal. Instead, for dividends received as from January 1, 2006, French resident shareholders who are individuals and who receive dividends are taxed on only 60% of the amount of dividends.the dividends received. In addition, French resident shareholders who are individuals are entitled to a new tax credit (Créditd’impôt) equal to 50% of the amount of dividends they received but with an overall annual cap of€230 or, as the case may be,€115 depending on the marital status of the individual holder. In addition, residents of France may instead opt for a withholding tax equal to 18% of the dividends received and, in such a case, will not be eligible for the receipt ofCrédit d’impôt.
Under French domestic law, shareholders who are not residentresidents of France for tax purposes are not eligible to the benefit of theCrédit d’impôt. However, U.S. Holders who benefit from the Treaty may be entitled to the refund of theCrédit d’impôt(less applicable withholding tax). The procedure to obtain payment of this tax credit has not yet been released byPlease note that the French tax authorities.authorities have not yet provided for the procedure of refund of such credit.
U.S. Holders should consult their own tax advisors in order to determine the effect of the Treaty and the applicable procedures in respect of the Administrative Guidelines, in light of such particular circumstances. With respect to dividends distributed as from January 1, 2005, the administrative guidelines issued on February 25, 2005 (4 J-1-05) (the “February 25, 2005The Administrative Guidelines”)Guidelines set forth the conditions under which the reduced French withholding tax at the rate of 15% may be available. The immediate application of the reduced 15% rate is available to those U.S. Holders that may benefit from the so-called “simplified” procedure“simplified procedure” (within the meaning of the February 25, 2005 Administrative Guidelines).
Under the “simplified procedure,”procedure”, U.S. Holders may claim the immediate application of withholding tax at the rate of 15% on the French dividends to be received by them, provided that: | (i) | they furnish to the U.S. financial institution managing their securities account a certificate of residence conforming with the model attached to the February 25, 2005 Administrative Guidelines. The immediate application of the 15% withholding tax will be available only if the certificate of residence is sent to the U.S. financial institution managing their securities account before the dividend payment date. Furthermore, each financial institution managing the U.S. Holders’ securities account must also send to the French paying agent the figure of the total amount of dividends to be received which are eligible to the reduced withholding tax rate before the dividend payment date; |
| (ii) | the U.S. financial institution managing the U.S. Holder’s securities account provides to the French paying agent a list of the eligible U.S. Holders and |
| other pieces of information set forth in the February 25, 2005 Administrative Guidelines. Furthermore, the financial institution managing the U.S. Holders’ securities account should certify that each U.S. Holder is, to the best of its knowledge, a United States resident within the meaning of the Treaty. These documents must be sent as soon as possible, in all cases before the end of the third month computed as from the end of the month of the dividend payment date. |
Where the U.S. Holder’s identity and tax residence are known by the French paying agent, the latter may release such U.S. Holder from furnishing to (i) the financial institution managing its securities account, or (ii) as the case may be, the Internal Revenue Service, the abovementioned certificate of residence, and apply the 15% withholding tax rate to dividends it pays to such U.S. Holder. U.S. Pension Funds and Other Tax-Exempt Entities created and operating in accordance with the provisions of Sections 401 (a), 403 (b), 457 or 501 (c) (3) of the U.S. Internal Revenue Code (IRC) are subject to the same general filing requirements except that, in addition, they have to supply a certificate issued by the U.S. Internal Revenue Service (“IRS”) or any other document stating that they have been created and are operating in accordance with the provisions of the abovementioned Code Sections. This certificate must be produced together with the first request of application of the reduced rate, once together with the first request of immediate application of the 15% withholding tax and at French Tax Authorities specific request. In the same way, regulated companies such as RIC, REIT or REMIC will have to send to the financial institution managing their securities account a certificate from the IRS indicating that they are classified as Regulated Companies (RIC, REIT or REMIC) within the provisions of the relevant sections of the IRC. In principle, this certification must be produced each year and before the dividend payment. For a U.S. Holder that is not entitled to the “simplified” procedure and whose identity and tax residence are not known by the paying agent at the time of the payment, the 25% French withholding tax will be levied at the time the dividends are paid. Such U.S. Holder may, however, be entitled to a refund of the withholding tax in excess of the 15% rate under the “standard,”“standard”, as opposed to the “simplified,”“simplified”, procedure, provided that the U.S. Holder furnishes to the French paying agent an application for refund on form RF 1B EU-No 5053forms No. 5000-FR and/or 5001-FR (or any other relevant form to be issued by the French tax authorities), certified by the U.S. financial institution managing the U.S. Holder’s securities account (or, if not, by the competent U.S. tax authorities), before December 31 of the second year following the date of payment of the withholding tax at the 25% rate to the
French tax authorities. Any French withholding tax refund is generally expectedauthorities, according to be paid within 12 months from the filing of form RF 1B EU-No 5053 (or any other relevant form to be issuedrequirements provided by the French tax authorities).Administrative Guidelines. However, it will not be paid before January 15 of the year following the year in which the dividend was paid. Copies of form RF 1B EU-No 5053forms No. 5000-FR and 5001-FR (or any other relevant form to be issued by the French tax authorities) as well as the form of the certificate of residence and the U.S. financial institution certification, together with instructions, are (or will be, as soon as practical) available from the U.S. Internal Revenue Service and the FrenchCentre des Impôts des Non-Residents at 10 rue du Centre, 93463 Noisy le Grand, France. These forms, together with instructions, will also be provided by the Depositary to all U.S. Holders of ADRs registered with the Depositary. The Depositary will use reasonable efforts to follow the procedures established by the French tax authorities for U.S. Holders to benefit from the immediate application of the 15% French
withholding tax rate or, as the case may be, to recover the excess 10% French withholding tax initially withheld and deducted in respect of dividends distributed to them by the Company,TOTAL, and obtain, in respect to dividend distributions made as from January 1, 2005 to U.S. Holders who are individuals, the refund of theCrédit d’impôt (less applicable withholding tax), in accordance with the procedures established by the French tax authorities. To effect such benefit, recovery and/or refund, the Depositary shall advise such U.S. Holder to return the relevant forms to it, properly completed and executed. Upon receipt of the relevant forms properly completed and executed by such U.S. Holder, the Depositary shall cause them to be filed with the appropriate French tax authorities, and upon receipt of any resulting remittance, the Depositary shall distribute to the U.S. Holder entitled thereto, as soon as practicable, the proceeds thereof in U.S. Dollars.dollars. The identity and address of the French paying agent is available from the Company.TOTAL. U.S. taxation For U.S. federal income tax purposes and subject to the passive foreign investment company rules discussed below, the gross amount of dividend a U.S. Holder must include in gross income equals the amount paid by TOTAL plus any amount of theCrédit d’impôt described above (see “— French Taxes” above) transferred to the U.S. Holder with respect to this amount (including any French tax withheld with respect to the distribution made by TOTAL and theCrédit d’impôt) to the extent of the current and accumulated earnings and profits of TOTAL (as determined for U.S. federal income tax purposes). The dividend will be income from foreign sources. Dividends paid to a noncorporate U.S. Holder in taxable years beginning before January 1, 2011 that constitute qualified dividend income will be taxable to the holder at a maximum tax rate of 15% provided that the shares or ADSs are held for more than 60 days during the 121-day period beginning 60 days before the ex-dividend date and the holder meets other holding period requirements. TOTAL believes that dividends paid by TOTAL with respect to its shares or ADSs will be qualified dividend income. The dividend will not be eligible for the dividends-received deduction allowed to a U.S. corporation under Section 243 of the Code. The dividend is taxable to the U.S. Holder when the holder, in the case of shares, or the Depositary, in the case of ADSs, receives the dividend, actually or constructively. To the extent that an amount received by a U.S. Holder exceeds the allocable share of the Company’sTOTAL’s current and accumulated earnings and profits, it will be applied first to reduce such holder’s tax basis in shares or ADSs owned by such holder and then, to the extent it exceeds the holder’s tax basis, it will constitute capital gain. The amount of any dividend distribution includible in the income of a U.S. Holder equals the U.S. dollar value of the euro payment made, determined at the spot dollar/euro exchange rate on the date the dividend distribution is includible in the U.S. Holder’s income, regardless of whether the payment is in fact converted into U.S. dollars. Any gain or loss resulting from currency exchange fluctuations during the period from the date the dividend payment is includible in the U.S. Holder’s income to the date the payment is converted into U.S. dollars will generally be treated as ordinary income or loss from sources within the United States and will not be eligible for the special tax rate applicable to qualified dividend income. Subject to certain conditions and limitations, French taxes withheld in accordance with the Treaty will generally be eligible for credit against the U.S. Holder’s U.S. federal income tax liability. The limitation on foreign taxes eligible for credit is calculated separately with respect to specific classes of income. In addition, special rules apply in determining the foreign tax credit limitation with respect to dividends that are subject to the maximum 15% tax rate. To the extent a refund of the tax withheld is available to a U.S. Holder under French law or under the Treaty, the amount of tax withheld that is refundable will not be eligible for credit against such an individual’s United States federal income tax liability. For this purpose, dividends distributed by the CompanyTOTAL and the relatedCrédit d’impôt payments paid in taxable years beginning before January 1, 2007 generally will constitute “passive income”, or, in the case of certain U.S. Holders, “financial services income”, and dividends paid in taxable years beginning after December 31, 2006 will depending on your circumstances, be “passive”constitute “passive income”, or, in the case of certain U.S. Holders, “general income”., which, in either case, is treated separately from other types of income for purposes of computing the foreign tax credit
allowable to the U.S Holder. Alternatively, a U.S. Holder may claim all foreign taxes paid as an itemized deduction in lieu of claiming a foreign tax credit. Taxation of Disposition of Shares In general, a U.S. Holder who is eligible for the benefits of the Treaty will not be subject to French tax on any capital gain from the sale or exchange of the ADSs or redemption of the underlying shares unless those ADSs or shares form part of a business property of a permanent establishment or fixed base that the U.S. Holder has in France. Special rules may apply to individuals who are residents of more than one country. A 1.1%3% registration duty assessed on the higher of the purchase price and the market value of the shares (subject to a maximum of€4,0005,000 per transfer) applies to certain transfers of shares in French companies. The duty does not apply to transfers of shares in TOTAL provided that the transfer is not evidenced by a written agreement, or that such written agreement is executed outside France. For U.S. federal income tax purposes and subject to the passive foreign investment company rules discussed below, a U.S. Holder generally will recognize capital gain or loss upon
the sale or disposition of shares or ADSs equal to the difference between the U.S. dollar value of the amount realized on the sale or disposition and the holder’s tax basis, determined in U.S. dollars, in the shares or ADSs. The gain or loss generally will be U.S. source gain or loss and will be long-term capital gain or loss if the U.S. Holder’s holding period of the shares or ADSs is more than one year at the time of the disposition. Long-term capital gain of a non-corporate U.S. Holder that is recognized on or after May 6, 2003 andin taxable years beginning before January 1, 2011 is taxed at a maximum rate of 15%. The deductibility of capital losses is subject to limitation. Passive Foreign Investment Status TOTAL believes that the Shares or ADSs will not be treated as stock of a passive foreign investment company, or PFIC, for United States federal income tax purposes, but this conclusion is a factual determination that is made annually and thus is subject to change. If TOTAL is treated as a PFIC, unless a U.S. Holder elects to be taxed annually on a mark-to-market basis with respect to the Shares or ADSs, gain realized on the sale or other disposition of the Shares or ADSs would in general not be treated as capital gain. Instead a U.S. Holder would be treated as if he or she had realized such gain and certain “excess distributions” ratably over the holding period for the Shares or ADSs and would be taxed at the highest tax rate in effect for each such year to which the gain was allocated, in addition to which an interest charge in respect of the tax attributable to each such year would apply. Dividends paid will not be eligible for the special tax rates applicable to qualified dividend income if TOTAL is treated as a PFIC with respect to a U.S. Holder either in the taxable year of the distribution or the preceding taxable year, but instead will be taxable at rates applicable to ordinary income. French Estate and Gift Taxes In general, a transfer of ADSs or shares by gift or by reason of the death of a U.S. Holder that would otherwise be subject to French gift or inheritance tax, respectively, will not be subject to such French tax by reason of the Convention between the United States of America and the French Republic for the Avoidance of Double Taxation and the Prevention of Fiscal Evasion with Respect to Taxes on Estates, Inheritances and Gifts, dated November 24, 1978, unless the donor or the transferor is domiciled in France at the time of making the gift, or at the time of his death, or if the ADSs or shares were used in, or held for use in, the conduct of a business through a permanent establishment or a fixed base in France. French Wealth Tax The French wealth tax does not apply to a U.S. Holder (i) that is not an individual, or (ii) in the case of individuals who are eligible for the benefits of the Treaty and who own, alone or with related persons, directly or indirectly, TOTAL shares which give right to less than 25 per cent of TOTAL’s earnings. U.S. State and Local Taxes In addition to U.S. federal income tax, U.S. Holders of shares or ADSs may be subject to U.S. state and local taxes with respect to their shares or ADSs. U.S. Holders should consult their own tax advisors. Dividends and Paying Agents After BNP Paribas Securities Services performs centralizing procedures, dividends are paid through the accounts of financial intermediaries participating in Euroclear France’s direct payment procedures. The Bank of New York Mellon acts as paying agent for dividends distributed to ADS holders. Documents on Display TOTAL files annual, periodic, and other reports and information with the Securities and Exchange Commission. You may read and copy any reports, statements or other information TOTAL files with the Securities and Exchange Commission at the Securities and Exchange Commission’s public reference rooms by
calling the Securities and Exchange Commission for more information at 1-800-SEC-0330. All of TOTAL’s Securities and Exchange Commission filings made after December 31, 2001, are available to the public at the Securities and Exchange Commission web site at http://www.sec.gov and from certain commercial document retrieval services. You may also read and copy any document the Company files with the Securities and Exchange Commission at the offices of The New York Stock Exchange, 20 Broad Street, New York, New York 10005.
ITEM 11. QUANTITATIVE AND QUALITATIVE DISCLOSURES ABOUT MARKET RISK SensitivityPlease refer to market environment
The financial performance of TOTAL is sensitiveNote 31 to the Consolidated Financial Statements included elsewhere herein for a number of parameters, the most significant being oilqualitative and gas prices, generally expressed in dollars, and exchange rates, in particular that of the dollar versus the euro.
Overall, a rise in the price of crude oil has a positive effect on earnings as a result of an increase in revenues from oil and gas production. Conversely, a decline in crude oil prices reduces revenues. For the year 2007,
the Group estimates that an increase or decrease of $1.00 per barrel in the price of Brent crude would respectively improve or reduce annual operating income by approximately 0.38 B€(1). The impact of changes in crude oil prices on Downstream and Chemicals operations depends upon the speed at which the prices of finished products adjust to reflect these changes. The Group estimates that an increase or decrease in TRCV refining margins of $1.00 per ton would improve or reduce annual operating income by approximately 0.09 B€(a).
(1) | Calculated with a base case exchange rate of $1.25 /€. |
Allquantitative discussion of the Group’s activities are,exposure to various degrees, sensitivemarket risks. Please also refer to fluctuations inNote 30 to the dollar/euro exchange rate. ForConsolidated Financial Statements included elsewhere herein for details of the year 2007,different derivatives owned by the Group estimates that a strengthening or weakening of the dollar against the euro by€0.10/$ would respectively improve or reduce annual operating income, expressed in euros, by approximately 2.2 B€.
The Group’s results, particularly in the Chemicals segment, also depend on the overall economic environment.
| | | | | | | | | 2007 Sensitivities | | Scenario | | | Change | | Estimated impact on
operating income | | Dollar/euro exchange rate
| | $1.25/ | € | | +€0.10/$ | | +2.2 B | € | Brent
| | $60/b | | | +$1/b | | +0.38 B | € | European refining margins (TRCV)
| | $30/t | | | +$1/t | | +0.09 B | € |
Oil and gas market related risks
Due to the nature of its business, the Group has significant oil and gas trading activities as part of its day-to-day operations in order to attempt to optimize revenues from its oil and gas production and to obtain favorable pricing for supplies for its refineries.
In its international oil trading activities, the Group follows a policy of not selling its future oil and gas production for future delivery. However, in connection with these trading activities, the Group, like most other oil
companies, uses energy derivative instruments to adjust its exposure to price fluctuations of crude oil, refined products, natural gas and electricity. The Group also uses freight-rate derivatives contracts in its shipping activities to adjust its exposure to freight-rate fluctuations. To hedge against this risk, the Group uses various instruments such as futures, forwards, swaps and options on organized markets or over-the-counter markets.
The notional and fair values of derivatives as of December 31, 2006 were as follows:
| | | | | | | | | | | | ASSETS / (LIABILITIES) (M€) | | Notional
value -
assets(a) | | Notional
value -
liabilities(a) | | Carrying
amount | | | Fair
Value | | Commodities instruments on crude oil, petroleum products and
freight rates | | | | | | | | | | | Petroleum products and crude oil swaps(a) | | 8,258 | | 9,459 | | (43 | ) | | (43 | ) | Swap freight agreements | | 56 | | 86 | | 2 | | | 2 | | Forwards(b) | | 5,145 | | 5,830 | | (11 | ) | | (11 | ) | Options(c) | | 6,046 | | 4,835 | | 66 | | | 66 | | Futures(d) | | 1,274 | | 2,434 | | 79 | | | 79 | | Options on futures(c) | | 143 | | 165 | | (4 | ) | | (4 | ) | Total - Commodities instruments on crude oil, petroleum products and freight rates | | | | | | 89 | | | 89 | | | | | | | Commodities instruments on gas and power | | | | | | | | | | | Swaps(a) | | 890 | | 716 | | (25 | ) | | (25 | ) | Forwards | | 9,973 | | 9,441 | | (73 | ) | | (73 | ) | Options(c) | | 18 | | 58 | | 2 | | | 2 | | Futures(d) | | 92 | | 46 | | 31 | | | 31 | | Total - Commodities instruments on gas and power | | | | | | (65 | ) | | (65 | ) | Total | | | | | | 24 | | | 24 | | Total of fair value not recognized in the balance sheet | | | | | | | | | — | |
(a) | Swaps (including “Contracts for differences”): the “Notional value” columns correspond to receive-fixed and pay-fixed swaps. |
(b) | Forwards: contracts resulting in physical delivery are accounted for as derivative commodity contracts and included in the amounts shown. The 2005 amounts for commodities instruments on gas and power have been reclassified accordingly. |
(c) | Options: the “Notional value” columns correspond to the nominal value of options (calls or puts) purchased and sold, valued based on the strike price. |
(d) | Futures: the “Notional value” columns correspond to the net purchasing/selling positions, valued based on the closing rate on the organized exchange market. |
To measure market risk related to oil, gas and electricity price movements, the Group uses the “value at risk” method. Under this method, there is a 97.5% probability that unfavorable daily market variations for the Group’s trading activities of crude oil, refined products and freight rate derivatives would result in a loss of less than 11.4 M€ per day, defined as the “value at risk”, based on positions as of December 31, 2006.
As part of its gas and electricity trading activities, the Group also uses derivative instruments such as futures, forwards, swaps and options in both organized and over-the-counter markets. In general, the transactions are settled at maturity through physical delivery. Based on positions as of December 31, 2006, there is a 97.5% probability that unfavorable daily market variations would result in a loss of less than 6.0 M€ per day.
The Group has implemented strict policies and procedures to manage and monitor these market risks. These are based on an organization that separates supervisory functions from operational functions and on an integrated information system that enables real-time monitoring of trading activities.
Limits on trading positions are approved by the Group’s Executive Committee and are monitored daily. To increase flexibility and encourage liquidity, hedging operations are performed with numerous independent operators, including other oil companies, major energy
producers and consumers and financial institutions. The Group has established counterparty limits and monitors amounts outstanding with each counterparty on an ongoing basis.
Financial markets related risks
As part of its financing and cash management activities, the Group uses derivative instruments to manage its exposure to changes in interest rates and foreign exchange rates. These instruments are principally interest rate and currency swaps. The Group may also use, on a less frequent basis, futures, caps, floors and options contracts. These operations and their accounting treatment are detailed in Note 1 paragraph M of Note 1 and Notes 20, 28 and 27 to the Consolidated Financial Statements. Risks relative to cash management activities and to interest rate and foreign exchange financial instruments are managed in accordance with rules set by the Group’s senior management. Liquidity positions and the management of financial instruments are centralized by the treasury/financing department, where they are managed by a group specialized in foreign exchange and interest rate market transactions. The cash monitoring and management group monitors limits and positions on a daily basis and reports of results. This group also prepares marked-to-market valuations and, as necessary, performs sensitivity analysis.
The classification by strategy and the notional amount of derivative instruments as of December 31, 2006 was as follows:
| | | | | | | | | | | | | | | | | | | | | | | | | | Notional amount(a) | | ASSETS/(LIABILITIES) (M€) | | Fair
Value | | | Total | | 2007 | | 2008 | | 2009 | | 2010 | | 2011 | | 2012 and
after | | Financial instruments hedging non-current financial debt | | | | | | | | | | | | | | | | | | Issue swaps and swap hedging debenture
issues - non-current (liabilities) | | (193 | ) | | 5,691 | | | | | | | | | | | | | Issue swaps and swap hedging debenture
issues - non-current (assets) | | 486 | | | 5,317 | | | | | | | | | | | | | Issue swaps and swap hedging debenture
issues - non-current | | 293 | | | 11,008 | | | | 1,756 | | 2,018 | | 1,870 | | 2,740 | | 2,624 | Non-current currency and interest rate swaps
hedging bank loans | | | | | | | | | | | | | | | | | | Issue swaps and swap hedging debenture
issues - less than one year (liabilities) | | | | | 475 | | | | | | | | | | | | | Issue swaps and swap hedging debenture
issues - less than one year (assets) | | 341 | | | 1,341 | | | | | | | | | | | | | Issue swaps and swap hedging debenture
issues - less than one year | | 341 | | | 1,816 | | 1,816 | | | | | | | | | | | | | | | | | | | | | Financial instruments hedging net investment | | | | | | | | | | | | | | | | | | N/A | | | | | | | | | | | | | | | | | | | | | | | | | | | | Financial instruments held for trading | | 3,496 | | | 3,496 | | 3,496 | | | | | | | | | | | | Other interest rate swaps - assets | | 12 | | | 6,488 | | | | | | | | | | | | | Other interest rate swaps - liabilities | | (8 | ) | | 9,580 | | | | | | | | | | | | | Other swaps assets and liabilities | | 4 | | | 16,068 | | 16,062 | | — | | | | 4 | | — | | 2 | | Currency swaps and forward exchange contracts - assets | | 59 | | | 5,003 | | | | | | | | | | | | | Currency swaps and forward exchange contracts - liabilities | | (67 | ) | | 6,065 | | | | | | | | | | | | | | Currency swaps and forward exchange contracts - assets and liabilities | | (8 | ) | | 11,068 | | 10,513 | | 287 | | 201 | | 45 | | 22 | | — |
(a) | These amounts set the levels of notional involvement and are not indicative of a contingent gain or loss. |
Currency exposure
The Group seeks to minimize the currency exposure of each entity to its operating currency (primarily the euro, U.S. dollar, pound sterling, and Norwegian krone).
For currency exposure generated by commercial activity, the hedging of revenues and costs in foreign currencies is typically performed using currency operations on the spot market and in some cases on the forward market. The Group rarely hedges future cash flows, although it may use options to do so.
With respect to currency exposure linked to non-current assets booked in a currency other than the euro, the Group has a policy of reducing the related currency exposure by financing these assets in the same currency.
Net short-term currency exposure is periodically monitored against limits set by the Group’s senior management. This currency exposure is managed by the Group’s central treasury entities, which are responsible for debt issuances on the financial markets (the proceeds of which are then loaned to borrowing subsidiaries), cash centralization for Group companies and cash management on the monetary markets.
Short-term interest rate exposure and cash
Cash balances, which are primarily composed of euros and dollars, are managed according to the guidelines established by senior management (maintain maximum liquidity, optimize revenue from investments considering existing interest rate yield curves, and minimize the cost of borrowing) over a less than 12-month horizon and on the basis of a daily interest rate benchmark, primarily through short-term interest rate swaps and short-term currency swaps, without modifying the currency exposure.
Interest rate risk on non-current debt
The Group’s policy consists of incurring non-current debt primarily at a floating rate, or at a fixed rate depending on the levels of interest rates, in dollars or in euros according to general corporate needs. Long-term interest rate and currency swaps can hedge debenture loans at their issuance in order to create a variable rate synthetic debt. In order to partially modify the interest rate structure of the long-term debt, TOTAL can also enter into long-term interest rate swaps.
Sensitivity analysis on interest rate and foreign exchange risk
The tables below present the potential impact of an increase or decrease of 10% in the interest rate yield curves in each of the currencies on the fair value of the current financial instruments as of December 31, 2006 and 2005.
| | | | | | | | | | | | | ASSETS/(LIABILITIES) | | Carrying amount | | | Estimated fair value | | | Change in fair value with a 10% interest rate increase | | | Change in fair value with a 10% interest rate decrease | | As of December 31, 2006 (M€) | | | | | Debenture loans (non-current portion, before swaps) | | (11,413 | ) | | (11,413 | ) | | 26 | | | (26 | ) | | | | | | Issue swaps and swaps hedging debenture loans (liabilities) | | (193 | ) | | (193 | ) | | | | | | | | | | | | Issue swaps and swaps hedging debenture loans (assets) | | 486 | | | 486 | | | | | | | | Total issue swaps and swaps hedging debenture loans – assets and liabilities | | 293 | | | 293 | | | (26 | ) | | 26 | | | | | | | Fixed-rate bank loans | | (210 | ) | | (207 | ) | | 6 | | | (6 | ) | | | | | | | Current portion of non-current debt after swap (excluding capital lease obligations) | | (2,140 | ) | | (2,140 | ) | | 1 | | | (1 | ) | | | | | | Other interest rates swaps | | 12 | | | 12 | | | (1 | ) | | 1 | | | | | | | Currency swaps and forward exchange contracts | | (8 | ) | | (8 | ) | | 1 | | | (1 | ) | | | | | | Currency options | | — | | | — | | | — | | | — | | ASSETS/(LIABILITIES) | | Carrying
amount | | | Estimated fair value | | | Change in fair value with a 10% interest rate increase | | | Change in fair value with a 10% interest rate decrease | | As of December 31, 2005 (M€) | | | | | Debenture loans (non-current portion, before swaps) | | (11,025 | ) | | (11,025 | ) | | 126 | | | (129 | ) | | | | | | Issue swaps and swaps hedging debenture loans (liabilities) | | (128 | ) | | (128 | ) | | | | | | | | | | | | Issue swaps and swaps hedging debenture loans (assets) | | 450 | | | 450 | | | | | | | | | | | | | Total issue swaps and swaps hedging debenture loans – assets and liabilities | | 322 | | | 322 | | | (115 | ) | | 117 | | | | | | | Fixed-rate bank loans | | (411 | ) | | (406 | ) | | 7 | | | (7 | ) | | | | | | Current portion of non-current debt after swap (excluding capital lease obligations) | | (920 | ) | | (919 | ) | | 1 | | | (1 | ) | | | | | | Other interest rates swaps | | 3 | | | 3 | | | (3 | ) | | 3 | | | | | | | Currency swaps and forward exchange contracts | | 260 | | | 260 | | | 4 | | | (4 | ) | | | | | | Currency options | | — | | | — | | | — | | | — | |
As a result of its policy for the management of currency exposure previously described, the Group believes that its short-term currency exposure is not material. The Group’s sensitivity to long-term currency exposure is primarily influenced by the net equity of the subsidiaries whose functional accounting currency is the dollar and, to a lesser extent, the pound sterling and the Norwegian
krone. This sensitivity is reflected by the historical evolution of the currency translation adjustment imputed in the statement of changes in shareholders’ equity which, in the course of the last three fiscal years, is essentially related to the evolution of the dollar and is set forth in the table below:
| | | | | | | | | Dollar/euro exchange rate | | Currency translation adjustments (M€) | | As of December 31, 2006 | | 1.32 | | (1,383 | ) | As of December 31, 2005 | | 1.18 | | 1,421 | | As of December 31, 2004 | | 1.36 | | (1,429 | ) |
The non-current debt in dollars described in Note 2029 to the Consolidated Financial Statements included elsewhere herein.
The financial performance of TOTAL is sensitive to a number of factors, the most significant being oil and gas prices, generally raised by the treasury entities either in dollars or in euros, or in other currencies which are then systematically exchanged for dollars or euros according to the general corporate purposes, through issue swaps. The proceeds from these debt issuances are principally loaned to affiliates whose accounts are keptexpressed in dollars, and any remaining balance is heldexchange rates, in dollar-denominated investments. Thus, the net sensitivity of these positions to currency exposure is not material. The Group’s short-term currency swaps, the nominal amounts of which appear in Note 27 to the Consolidated Financial Statements, are used to attempt to optimize the centralized cash managementparticular that of the Group. Thusdollar versus the sensitivity to currency fluctuations which may be induced is likewise considered negligible.
Aseuro. Generally, a rise in the price of crude oil has a positive effect on earnings as a result of this policy, thean increase in revenues from oil and gas production. Conversely, a decline in crude oil prices reduces revenues. The impact of currency exchangechanges in crude oil prices on consolidated income, as illustrated in Note 7Downstream and Chemicals operations depends upon the speed at which the prices of finished products adjust to the Consolidated Financial Statements, has not been significant over the last three years despite the considerable fluctuationreflect these changes. All of the dollar (loss of 30 M€ in 2006, gain of 76 M€ in 2005, loss of 75 M€ in 2004).
Counterparty risk
The Group has established standards for market transactions according to which bank counterparties
must be approved in advance, based on an assessment of the counterparty’s financial soundness and its rating (Standard & Poors, Moody’s), which must be of high quality.
An overall authorized credit limit is set for each bank and is divided among the subsidiaries and the Group’s central treasury entities according to their needs.
Stock market risk
The Group holds interests in a number of publicly-traded companies (see Note 13 to the Consolidated Financial Statements). The market value of these holdings fluctuates dueactivities are, to various factors, including stock market trends, valuations ofdegrees, sensitive to fluctuations in the sectors in which the companies operate, and the economic and financial condition of each individual company.
Liquidity risk
TOTAL S.A. has confirmed lines of credit granted by international banks, which are calculated to allow it to manage its short-term liquidity needs as required.
The following tables show the maturity of the financial assets and debt instruments of the Group as of December 31, 2006 and 2005 (see Note 20 to the Consolidated Financial Statements).dollar/euro exchange rate.
| | | | | | | | | | ASSETS/(LIABILITIES) | | | | | | | | | | As of December 31, 2006 (M€) | | Less than 1 year | | Between 1 and 5
years | | More than 5
years | | Total | Financial debt after swaps | | (2,025) | | (10,733) | | (2,955) | | (15,713) | Cash and cash equivalents | | 2,493 | | — | | — | | 2,493 | Net amount | | 468 | | (10,733) | | (2,955) | | (13,220) | | ASSETS/(LIABILITIES) | | | | | | | | | | As of December 31, 2005 (M€) | | Less than 1 year | | Between 1 and 5
years | | More than 5
years | | Total | Financial debt after swaps | | (3,619) | | (9,057) | | (4,259) | | (16,935) | Cash and cash equivalents | | 4,318 | | — | | — | | 4,318 | Net amount | | 699 | | (9,057) | | (4,259) | | (12,617) |
ITEM 12. DESCRIPTION OF SECURITIES OTHER THAN EQUITY SECURITIES Not applicable. ITEM 13. DEFAULTS, DIVIDEND ARREARAGES AND DELINQUENCIES None. ITEM 14. MATERIAL MODIFICATIONS TO THE RIGHTS OF SECURITY HOLDERS AND USE OF PROCEEDS None. ITEM 15. CONTROLS AND PROCEDURES Disclosure Controls and Procedures An evaluation was carried out under the supervision and with the participation of the Group’s management, including the Chief Executive Officer and the Chief Financial Officer, of the effectiveness, as of the end of the period covered by this report, of the design and operation of the Group’s disclosure controls and procedures, which are defined as those controls and procedures designed to ensure that information required to be disclosed in reports filed under the U.S. Securities Exchange Act of 1934, as amended, is recorded, summarized and reported within specified time periods. There are inherent limitations to the effectiveness of any system of disclosure controls and procedures, including the possibility of human error and the circumvention or overriding of the controls and procedures. Accordingly, even effective disclosure controls and procedures can provide only reasonable assurance of achieving their control objectives. Based on this evaluation, the Chief Executive Officer and Chief Financial Officer concluded that the design and operation of these disclosure controls and procedures were effective to provide reasonable assurance that information required to be disclosed in the reports that the Company files under the Exchange Act is recorded, processed, summarized and reported, within the time periods specified in the applicable rules and forms, and that it is accumulated and communicated to management, including the Chief Executive Officer and Chief Financial Officer, as appropriate to allow timely decisions regarding required disclosure.
Management’s Annual Report on Internal Control Over Financial Reporting The Group’s management is responsible for establishing and maintaining adequate internal control over financial reporting. Because of its inherent limitations, internal control over financial reporting may not prevent or detect misstatements and even when determined to be effective, can only provide reasonable assurance with respect to financial statement preparation and presentation. Also, the effectiveness of an internal control system may change over time. The Group’s management, including the Chief Executive Officer and the Chief Financial Officer, conducted an evaluation of the effectiveness of internal control over financial reporting using the criteria set forth inInternal Control –— Integrated Framework issued by the Committee of Sponsoring Organizations of the Treadway Commission (“COSO”). Based on the results of this evaluation, the Group’s management concluded that its internal control over financial reporting was effective as of December 31, 2006.2008. This assessmentThe effectiveness of internal control over financial reporting as of December 31, 2006 by the Group’s management2008, was audited by KPMG AuditS.A. and Ernst & Young Audit, independent registered public accounting firms, as stated in their report beginning on page F-2 of this report.Annual Report.
Changes in Internal Control Over Financial Reporting There were no changes in the Group’s internal control over financial reporting that occurred during the period covered by this report that have materially affected, or that were reasonably likely to materially affect, the Group’s internal control over financial reporting.
ITEM 16A. AUDIT COMMITTEE FINANCIAL EXPERT Mr. Antoine Jeancourt-Galignani is the Audit Committee financial expert. Mr. Jeancourt-Galignani is an independent member of the Board of Directors in accordance with the NYSE listing standards applicable to TOTAL, as are the other members of the Audit Committee. ITEM 16B. CODE OF ETHICS At its meeting on February 18, 2004, the Board of Directors adopted a code of ethics that applies to its Chief Executive Officer, Chief Financial Officer, Chief Accounting Officer and the financial and accounting officers for its principal activities. A copy of this code of ethics is included as an exhibit to this annual report.Annual Report. ITEM 16C. PRINCIPAL ACCOUNTANT FEES AND SERVICES During the fiscal years ended December 31, 20062008 and 2005,2007, fees for services provided by Ernst & Young Audit and KPMG S.A. were as follows: | | | | | | | | | | | | KPMG S.A.
Year Ended December 31, | | Ernst & Young Audit
Year Ended December 31, | | (M€) | | 2006 | | 2005 | | 2006 | | 2005 | Audit Fees | | 17.5 | | 12.7 | | 19.2 | | 12.8 | Audit-Related Fees(a) | | 2.4 | | 8.1 | | 1.7 | | 3.4 | Tax Fees(b) | | 1.1 | | 1.0 | | 1.3 | | 1.4 | All Other Fees(c) | | 0.1 | | 0.1 | | 0.0 | | 0.1 | Total | | 21.1 | | 21.9 | | 22.2 | | 17.7 |
| | | | | | | | | | | | KPMG Year Ended December 31, | | Ernst & Young Audit Year Ended December 31, | | (M€) | | 2008 | | 2007 | | 2008 | | 2007 | Audit Fees | | 15.9 | | 15.7 | | 17.7 | | 17.3 | Audit-Related Fees(a) | | 3.4 | | 2.6 | | 1.0 | | 0.7 | Tax Fees(b) | | 1.2 | | 1.2 | | 1.8 | | 1.7 | All Other Fees(c) | | 0.2 | | 0.2 | | 0.0 | | 0.1 | Total | | 20.7 | | 19.7 | | 20.5 | | 19.8 |
| (a) | Audit-related fees are generally fees billed for services that are closely related to the performance of the audit or review of financial statements. These include due diligence services related to business combinations, attestation services not required by statute or regulation, agreed upon or expanded auditing procedures related to accounting or billing records required to respond to or comply with financial, accounting or regulatory reporting matters, consultations concerning financial accounting and reporting standards, information system reviews, internal control reviews and assistance with internal control reporting requirements. |
| (b) | Tax fees are fees for services related to international and domestic tax compliance, including the preparation of tax returns and claims for refund, tax planning and tax advice, including assistance with tax audits and tax appeals, and tax services regarding statutory, regulatory or administrative developments and expatriate tax assistance and compliance. |
| (c) | All other fees are principally for risk management advisory services. |
Audit Committee Pre-Approval Policy The Audit Committee has adopted an Audit and Non-Audit Services Pre-Approval Policy that sets forth the procedures and the conditions pursuant to which services proposed to be performed by the statutory auditors may be pre-approved. This policy provides for both general pre-approval of certain types of services through the use of an annually establishedannual budget approved by the Audit Committee for these types of services and special pre-approval of services by the Audit Committee on a case by casecase-by-case basis. The Audit Committee has designatedreviews on an annual basis the Company’s internal audit department to monitor the performance of services provided by the statutory auditors and to assess compliance with the pre-approval policies and procedures. The internal audit department reports the results of its monitoring to the Audit Committee on a periodic basis. Both the internal audit department and management are required to report any breach of this policy to the chairman of the Audit Committee.auditors. During 2006,2008, no audit-related fees, tax fees or other non-audit fees were approved by the Audit Committee pursuant to thede minimisexception to the pre-approval requirement provided by paragraph (c)(7)(i)(C) of Rule 2-01 of Regulation S-X.
ITEM 16D. EXEMPTIONS FROM THE LISTING STANDARDS FOR AUDIT COMMITTEES None. ITEM 16E. PURCHASES OF EQUITY SECURITIES BY THE ISSUER AND AFFILIATED PURCHASERS | | | | | | | | | | | | Period | | Total Number Of
Shares Purchased(a) | | Average Price
Paid Per
Share (€)(a) | | Total Number Of
Shares Purchased,
As Part Of Publicly
Announced
Plans Or Programs(a) | | | Maximum Number
Of Shares That May
Yet Be Purchased
Under The Plans Or
Programs(a)(d) | | January 2006 | | 7,600,000 | | 55.37 | | 7,600,000 | (b) | | 102,605,540 | | February 2006 | | 3,860,000 | | 53.48 | | 3,860,000 | (b) | | 99,097,892 | | March 2006 | | 10,540,000 | | 53.36 | | 10,540,000 | (b) | | 90,191,983 | | April 2006 | | 2,000,000 | | 55.12 | | 2,000,000 | (b) | | 89,015,146 | | May 2006 | | 7,000,000 | | 50.67 | | 7,000,000 | (b)(c) | | 82,074,439 | | June 2006 | | 11,000,000 | | 49.05 | | 11,000,000 | (c) | | 71,166,117 | | July 2006 | | 5,215,684 | | 51.24 | | 5,215,684 | (c) | | 109,011,392 | (e) | August 2006 | | 8,310,000 | | 52.95 | | 8,310,000 | (c) | | 101,428,133 | | September 2006 | | 8,770,000 | | 50.91 | | 8,770,000 | (c) | | 92,924,937 | | October 2006 | | 4,700,000 | | 52.30 | | 4,700,000 | (c) | | 89,014,781 | | November 2006 | | 5,725,000 | | 54.65 | | 5,725,000 | (c) | | 84,349,006 | | December 2006 | | 3,500,000 | | 53.57 | | 3,500,000 | (c) | | 81,376,088 | | January 2007 | | — | | — | | — | (c) | | 111,353,833 | (e) | February 2007 | | 1,100,000 | | 51.95 | | 1,100,000 | (c) | | 110,604,421 | |
| | | | | | | | | | | Period | | Total Number Of Shares
Purchased | | Average Price
Paid Per
Share (€) | | Total Number Of
Shares Purchased,
As Part Of Publicly
Announced Plans Or
Programs | | | Maximum Number
Of Shares That May
Yet Be Purchased Under The Plans Or
Programs(c) | January 2008 | | 4,100,000 | | 51.39 | | 4,100,000 | (b) | | 84,436,108 | February 2008 | | 1,624,000 | | 50.01 | | 1,624,000 | (b) | | 82,881,230 | March 2008 | | 3,276,000 | | 47,80 | | 3,276,000 | (a) | | 79,659,940 | April 2008 | | 1,250,000 | | 49.12 | | 1,250,000 | (a) | | 79,254,626 | May 2008 | | 1,868,000 | | 54.85 | | 1,868,000 | (a)(b) | | 78,708,334 | June 2008 | | 3,882,000 | | 52.97 | | 3,882,000 | (b) | | 75,379,616 | July 2008 | | 2,120,000 | | 50.65 | | 2,120,000 | (b) | | 103,468,536 | August 2008 | | 2,198,500 | | 48.16 | | 2,198,500 | (b) | | 101,316,940 | September 2008 | | 3,681,500 | | 44.10 | | 3,681,500 | (b) | | 97,660,059 | October 2008 | | 3,600,000 | | 40.32 | | 3,600,000 | (b) | | 94,063,057 | November 2008 | | — | | — | | — | | | 94,074,937 | December 2008 | | — | | — | | — | | | 94,098,712 | January 2009 | | — | | — | | — | | | 94,103,139 | February 2009 | | — | | — | | — | | | 94,121,817 |
| (a) | Amounts recalculated to reflect the four-for-one stock split on May 18, 2006. |
(b) | Since May 18, 2005:14, 2007: the shareholders’ meeting of May 17, 200511, 2007, authorized the Board of Directors to trade the company’s own shares on the market for a period of 18 months within the framework of the stockshare purchase program approved by the Autorité des marchés financiers (AMF) under visa no. 05-247 of April 11, 2005.program. The maximum number of shares held or acquiredthat may be purchased by virtue of this authorization may not exceed 10% of the authorizedtotal number of shares constituting the share capital, this amount being periodically adjusted to take into account operations modifying the share capital after each shareholders’ meeting. Under no circumstances may the total number of shares the Company holds, either directly or indirectly through its subsidiaries, exceed 10% of the share capital. Under this authorization, 66,862,63635,615,355 shares have been repurchased from May 18, 200514, 2007 to May 12, 2006.16, 2008. |
(c)(b) | Since May 15, 2006:19, 2008: the shareholders’ meeting of May 12, 200616, 2008, cancelled and replaced the previous resolution from the shareholders’ meeting of May 17, 2005,11, 2007, authorizing the Board of Directors to trade in the Company’s own shares on the market for a period of 18 months within the framework of the stock purchase program. The maximum number of shares that may be purchased by virtue of this authorization may not exceed 10% of the total number of shares constituting the share capital, this amount isbeing periodically adjusted to take into account operations modifying the share capital after each shareholders’ meeting. Under no circumstances may the total number of shares the Company holds, either directly or indirectly through its subsidiaries, exceed 10% of the share capital. Under this authorization, 55,252,04816,422,000 shares have been repurchased from May 15, 200619, 2008 to February 28, 2007,2009, including 2,295,6842,800,000 shares that were purchased to cover restricted share grants to Group employees. |
(d)(c) | Based on 10% of the Company’s share capital, and after deducting the shares held by the Company for cancellation and the shares held by the Company to cover the share purchase option plans for Company employees and restricted share grants for Company employees, as well as after deducting the shares held by the subsidiaries. |
(e) | The increase in the maximum number of shares is mainly due to the cancellation by the Board of Directors on July 18, 2006 and January 10, 2007 of, respectively, 47,020,000 and 33,005,000 shares. |
ITEM 16F. CHANGE IN REGISTRANT’S CERTIFYING ACCOUNTANT Not applicable. ITEM 16G. CORPORATE GOVERNANCE Summary of Significant Differences between French Corporate Governance Practices and the NYSE’s Corporate Governance Standards Overview The following paragraphs provide a brief, general summary of significant differences between the corporate governance standards followed by TOTAL under French law and guidelines, and those required by the listing standards of the New York Stock Exchange (the “NYSE”) for U.S. companies that have common stock listed on the NYSE. The principal sources of corporate governance standards in France are the French Commercial Code (Code de Commerce) and the French Financial and Monetary Code (Code monétaire et financier), both as amended inter alia in August 2003 by the French Financial Security Act (Loi de sécurité financière), as well as a number of general recommendations and guidelines on corporate governance, most notably the Corporate Governance Code for Listed Companies published in 2008 by the principal French business confederations, theAssociation Française des Entreprises Privées (AFEP) and theMouvement des Entreprises de France (MEDEF) (the “AFEP-MEDEF Code”). The AFEP-MEDEF Code includes, among other things, recommendations relating to the role and operation of the board of directors (creation, composition and evaluation of the board of directors and the audit, compensation and nominating committees) and the independence criteria for board members. The French Financial Security Act prohibits statutory auditors from providing certain non-audit services and defines certain criteria for the independence of statutory auditors. In France, the independence of statutory auditors is also monitored by an independent body, the High Council for Statutory Auditors (Haut Conseil du commissariat aux comptes). Composition of Board of Directors; Independence The NYSE listing standards provide that the board of directors of a U.S. listed company must consist of a majority of independent directors and that certain committees must consist solely of independent directors. A director qualifies as independent only if the board affirmatively determines that the director has no material relationship with the company, either directly or indirectly. In addition, the listing standards enumerate a number of relationships that preclude independence. French law does not contain any independence requirement for the members of the board of directors of a French company, unless the board establishes an audit committee, as described below, and the functions of board chairman and chief executive officer are frequently performed by the same person. The AFEP- MEDEF Code recommends, however, that at least half of the members of the board of directors be independent in companies that have a dispersed ownership structure and no controlling shareholder. The AFEP-MEDEF Code states that a director is independent when “he or she has no relationship of any nature with the company, its group or the management of either, that may compromise the exercise of his or her freedom of judgment.” The Code also enumerates specific criteria for determining independence, which are on the whole consistent with the goals of the NYSE’s rules although the specific tests under the two standards may vary on some points. Based on the proposal of TOTAL’s Nominating & Corporate Governance Committee, the Board of Directors of TOTAL considers that all of the directors of the Company are independent, with the exceptions of Mr. Desmarest, Chairman of the Board of Directors, Mr. de Margerie, Chief Executive Officer of the Company, Mr. Boeuf, the director representing employee shareholders, and Mrs. Lauvergeon, CEO of a company of which Mr. Desmarest sits on the board. Board committees Overview.The NYSE listing standards require that a U.S. listed company have an audit committee, a nominating/corporate governance committee and a compensation committee. Each of these committees must consist solely of independent directors and must have a written charter that addresses certain matters specified in the listing standards. With the exception of an audit committee, as described below, French law requires neither the establishment of board committees nor the adoption of written charters. The AFEP-MEDEF Code recommends, however, that the board of directors set up, in addition to an audit committee, a nominating committee and a compensation committee, indicating that the nominating and compensation committees may form one committee. The AFEP-MEDEF Code also recommends that at least two-thirds of the audit committee members and a majority of the members of each of the compensation committee and the nominating committee be independent directors. TOTAL has established an Audit Committee, a Nominating & Corporate Governance Committee and a Compensation Committee, and considers all of the members of these committees to be independent with the exception of Mr. Desmarest, who chairs the Nominating & Corporate Governance Committee. For the membership of each committee, see “Item 6. Corporate Governance”. Each of these committees has a charter that defines the scope of its activity. Audit committee. The NYSE listing standards contain detailed requirements for the audit committees of U.S. listed companies. Some, but not all, of these requirements also apply to non-U.S. listed companies, such as TOTAL. French law requires the board of directors of companies listed in France either to establish an audit committee or to perform itself the functions of an audit committee. If the board appoints an audit committee, at least one member must be an independent director and must be competent in finance or accounting. Pursuant to French law and the AFEP-MEDEF Code, the audit committee is responsible for, among other things, examining the company’s risk exposure and material off-balance sheet commitments and the scope of consolidation, reviewing the financial statements, monitoring the efficiency of internal control procedures, managing the process of selecting statutory auditors, expressing an opinion on the amount of their fees and monitoring compliance with rules designed to ensure auditor independence, regularly interviewing statutory auditors without executive management present and calling upon outside experts if necessary. Although the audit committee requirements under French law and recommendations under the AFEP-MEDEF Code are less detailed than those contained in the NYSE listing standards, the NYSE listing standards, French law and the AFEP-MEDEF Code share the goal of establishing a system for overseeing the company’s accounting that is independent from management and that ensures auditor independence. As a result, they address similar topics, and there is some overlap. For the specific tasks performed by the Audit Committee of TOTAL that exceed those required by French law and those recommended by the AFEP-MEDEF Code, see “Item 6. Corporate Governance — Audit Committee”. One structural difference between the legal status of the audit committee of a U.S. listed company and that of a French listed company concerns the degree of the committee’s involvement in managing the relationship between the company and the auditor. French law requires French companies that publish consolidated financial statements, such as TOTAL, to have two co-auditors. While the NYSE listing standards require that the audit committee of a U.S. listed company have direct responsibility for the appointment, compensation, retention, and oversight of the work of the auditor, French law provides that the election of the co-auditors is the sole responsibility of the shareholders’ meeting. In making its decision, the shareholders meeting may rely on proposals submitted to it by the board of directors, the decision of the latter being taken upon consultation with the audit committee. The shareholders’ meeting elects the auditors for an audit period of six fiscal years. The auditors may only be dismissed by a court and only on grounds of professional negligence or incapacity to perform their mission. Disclosure The NYSE listing standards require U.S. listed companies to adopt, and post on their websites, a set of corporate governance guidelines. The guidelines must address, among other things: director qualification standards, director responsibilities, director access to management and independent advisers, director compensation, director orientation and continuing education, management succession, and an annual performance evaluation. In addition, the chief executive officer of a U.S. listed company must certify to the NYSE annually that he or she is not aware of any violations by the company of the NYSE’s corporate governance listing standards. The certification must be disclosed in the company’s annual report to shareholders. French law requires neither the adoption of such guidelines nor the publication of such certifications. The AFEP-MEDEF Code recommends, however, that the board of directors of a French listed company perform an annual review of its operation and that a formal evaluation, possibly with the assistance of an outside consultant, be undertaken every three years, which for TOTAL took place in November 2006, and that shareholders be informed each year in the annual report of the evaluations. Code of business conduct and ethics The NYSE listing standards require each U.S. listed company to adopt, and post on its website, a code of business conduct and ethics for its directors, officers and employees. There is no similar requirement or recommendation under French law. However, under the SEC’s rules and regulations, all companies required to submit periodic reports to the SEC, including TOTAL, must disclose in their annual reports whether they have adopted a code of ethics for their principal executive officer and senior financial officers. In addition, they must file a copy of the code with the SEC, post the text of the code on their website or undertake to provide a copy upon request to any person without charge. There is significant, though not complete, overlap between the code of ethics required by the NYSE listing standards and the code of ethics for senior financial officers required by the SEC’s rules. For a discussion of the code of ethics adopted by TOTAL, see “Item 6. Corporate Governance” and “Item 16B. Code of Ethics”. ITEM 17. FINANCIAL STATEMENTS Not applicable. ITEM 18. FINANCIAL STATEMENTS The following financial statements, together with the report of Ernst & Young Audit and KPMG S.A. thereon, are held as part of this annual report. | | | | | | Page | Report of Independent Registered Public Accounting FirmFirmss | | F-1 | Report of Independent Registered Public Accounting Firms | | F-2 | Consolidated Statement of Income for the Years Ended December 31, 2006, 20052008, 2007 and 20042006 | | F-3 | Consolidated Balance Sheet at December 31, 2006, 20052008, 2007 and 20042006 | | F-4 | Consolidated Statement of Cash FlowsFlow for the Years Ended December 31, 2006, 20052008, 2007 and 20042006 | | F-5 | Consolidated Statement of ChangeChanges in Shareholders’ Equity for the years ended December 31, 2006, 20052008, 2007 and 20042006 | | F-6 | Notes to the Consolidated Financial Statements | | F-7 | | | Schedules for the years ended December 31, 2006, 2005 and 2004
| | | Schedule II — Valuation and Qualifying Accounts
| | F-83 | | | Supplemental Oil and Gas Information (Unaudited) | | S-1 |
All other Schedules have been omitted since they are not required under the applicable instructions or the substance of the required information is shown in the financial statements.
ITEM 19. EXHIBITS The following documents are filed as part of this annual report: | | | | | | 1. | | Statuts of TOTAL S.A. (as amended through January 10, 2007)December 31, 2008) | | | | 8. | | List of Subsidiaries (see Note 3335 to the Consolidated Financial Statements included in this Annual Report) | | | | 11. | | Code of Ethics (incorporated by reference to the Company’s Annual Report on Form 20-F for the year ended December 31, 2005). | | | | 12.1 | | Certification of Chief Executive Officer | | | | 12.2 | | Certification of Chief Financial Officer | | | | 13.1 | | Certification of Chief Executive Officer | | | | 13.2 | | Certification of Chief Financial Officer | | | | 15 | | Consent of ERNST & YOUNG AUDIT and of KPMG S.A. |
SIGNATURE The registrant hereby certifies that it meets all of the requirements for filing on Form 20-F and that it has duly caused and authorized the undersigned to sign this annual report on its behalf. | | | | TOTAL S.A. | | | By: | | /s/ CHRISTOPHEDE MARGERIE | | | Name: Christophe de Margerie | | | Title: Chief Executive Officer |
Date: April 10, 20073, 2009 REPORT OF INDEPENDENT REGISTERED PUBLIC ACCOUNTING FIRMS Year ended December 31, 20062008 The Board of Directors and Shareholders TOTAL S.A. We have audited the accompanying consolidated balance sheets of TOTAL S.A. and subsidiaries (the “Company”) as of December 31, 2006, 20052008, 2007 and 2004,2006, and the related consolidated statements of income, cash flows and changes in shareholders’ equity for each of the three years in the period ended December 31, 2006. In connection with our audits of the consolidated financial statements, we also have audited the financial statement schedule listed in the Index as Schedule II.2008. These consolidated financial statements and the financial statement schedule are the responsibility of the Company’s management. Our responsibility is to express an opinion on these consolidated financial statements and financial statement schedule based on our audits. We conducted our audits in accordance with the standards of the Public Company Accounting Oversight Board (United States). Those standards require that we plan and perform the audit to obtain reasonable assurance about whether the financial statements are free of material misstatement. An audit includes examining, on a test basis, evidence supporting the amounts and disclosures in the financial statements. An audit also includes assessing the accounting principles used and significant estimates made by management, andas well as evaluating the overall financial statement presentation. We believe that our audits provide a reasonable basis for our opinion. In our opinion, the consolidated financial statements referred to above present fairly, in all material respects, the consolidated financial position of the Company at December 31, 2006, 20052008, 2007 and 2004,2006, and the consolidated results of its operations and its consolidated cash flows for each of the three years in the period ended December 31, 2006,2008, in conformity with International Financial Reporting Standards as adopted by the European Union. Also,Union and in our opinion, the related financial statement schedule, when considered in relation to the basic consolidated financial statements taken as a whole, presents fairly in all material respects the information set forth therein. conformity with International Financial Reporting Standards as adoptedissued by the European Union differ in certain respects from United States generally accepted accounting principles. Information relating to the nature and effect of such differences is presented in Note 34 to the Consolidated Financial Statements.International Accounting Standards Board. We also have audited, in accordance with the standards of the Public Company Accounting Oversight Board (United States), the effectiveness of the Company’s internal control over financial reporting as of December 31, 2006,2008, based on criteria established in Internal Control-Integrated Framework issued by the Committee of Sponsoring Organizations of the Treadway Commission (the COSO criteria) and our report dated April 3, 20072, 2009 expressed an unqualified opinion on management’s assessmentthe effectiveness of and the effective operation of,Company’s internal control over financial reporting. Paris-La Défense, France April 3, 20072, 2009 | | | | | KPMG Audit AUDIT | | ERNST & YOUNG AUDIT Audit | A division of KPMG S.A. | | /s/ Gabriel Galet S/ GABRIEL GALET | | /S/ PHILIPPE DIU | /S/ RENÉ AMIRKHANIAN | | Gabriel Galet | | Philippe Diu | René Amirkhanian | | | | |
REPORT OF INDEPENDENT REGISTERED PUBLIC ACCOUNTING FIRMS Year ended December 31, 20062008 The Board of Directors and Shareholders TOTAL S.A. We have audited management’s assessment, included in the accompanying management report on internal control over financial reporting disclosed in Item 15, that TOTAL S.A. and subsidiaries (the “Company”subsidiaries’ (“the Company”) maintained effective internal control over financial reporting as of December 31, 2006,2008, based on criteria established in Internal Control—IntegratedControl-Integrated Framework issued by the Committee of Sponsoring Organizations of the Treadway Commission (the COSO criteria).The. The Company’s management is responsible for maintaining effective internal control over financial reporting and for its assessment of the effectiveness of internal control over financial reporting included in the accompanying management’s annual report on internal control over financial reporting. Our responsibility is to express an opinion on management’s assessment and an opinion on the effectiveness of the Company’s internal control over financial reporting based on our audit. We conducted our audit in accordance with the standards of the Public Company Accounting Oversight Board (United States). Those standards require that we plan and perform the audit to obtain reasonable assurance about whether effective internal control over financial reporting was maintained in all material respects. Our audit included obtaining an understanding of internal control over financial reporting, evaluating management’s assessment,assessing the risk that a material weakness exists, and testing and evaluating the design and operating effectiveness of internal control andbased on the assessed risk. Our audit also included performing such other procedures as we considered necessary in the circumstances. We believe that our audit provides a reasonable basis for our opinion. A company’s internal control over financial reporting is a process designed to provide reasonable assurance regarding the reliability of financial reporting and the preparation of financial statements for external purposes in accordance with generally accepted accounting principles. A company’s internal control over financial reporting includes those policies and procedures that (1) pertain to the maintenance of records that, in reasonable detail, accurately and fairly reflect the transactions and dispositions of the assets of the company; (2) provide reasonable assurance that transactions are recorded as necessary to permit preparation of financial statements in accordance with generally accepted accounting principles, and that receipts and expenditures of the company are being made only in accordance with authorizations of management and directors of the company; and (3) provide reasonable assurance regarding prevention or timely detection of unauthorized acquisition, use, or disposition of the company’s assets that could have a material effect on the financial statements. Because of its inherent limitations, internal control over financial reporting may not prevent or detect misstatements. Also, projections of any evaluation of effectiveness to future periods are subject to the risk that controls may become inadequate because of changes in conditions, or that the degree of compliance with the policies or procedures may deteriorate. In our opinion, management’s assessment that the Company maintained effective internal control over financial reporting as of December 31, 2006, is fairly stated, in all material respects, based on the COSO criteria. Also, in our opinion, the Company maintained, in all material respects, effective internal control over financial reporting as of December 31, 2006,2008, based ontheon the COSO criteria.criteria. We also have audited, in accordance with the standards of the Public Company Accounting Oversight Board (United States), the consolidated balance sheets of the Company as of December 31, 2006, 20052008, 2007 and 2004,2006 and the related consolidated statements of income, cash flows and changes in shareholders’ equity for each of the three years in the period ended December 31, 2006,2008, and our report dated April 3, 2007,2, 2009 expressed an unqualified opinion on those consolidated financial statements. Paris-La DéParis-La-Défense, France
April 3, 20072, 2009 | | | | | KPMG Audit AUDIT | | ERNST & YOUNG AUDIT Audit | A division of KPMG S.A. | | /s/S/ GABRIEL GALET | | /s/S/ PHILIPPE DIU | /s/S/ RENÉ AMIRKHANIAN | | Gabriel Galet | | Philippe Diu | | René Amirkhanian | | | | |
CONSOLIDATED STATEMENT OF INCOME
TOTAL | | | | | | | | | | | | (M€)(a) | | | | | | | | | | | | For the year ended December 31, | | | | 2006 | | | 2005 | | | 2004 | | Sales | | (Notes 4 & 5) | | 153,802 | | | 137,607 | | | 116,842 | | Excise taxes | | | | (21,113 | ) | | (20,550 | ) | | (21,517 | ) | Revenues from sales | | | | 132,689 | | | 117,057 | | | 95,325 | | | | | | | Purchases net of inventory variation | | (Note 6) | | (83,334 | ) | | (70,291 | ) | | (56,020 | ) | Other operating expenses | | (Note 6) | | (19,536 | ) | | (17,159 | ) | | (16,770 | ) | Exploration costs | | (Note 6) | | (634 | ) | | (431 | ) | | (414 | ) | Depreciation, depletion, and amortization of tangible assets and leasehold rights | | | | (5,055 | ) | | (5,007 | ) | | (5,095 | ) | Operating income | | (Note 4) | | 24,130 | | | 24,169 | | | 17,026 | | Other income | | (Note 7) | | 789 | | | 174 | | | 3,138 | | Other expense | | (Note 7) | | (703 | ) | | (455 | ) | | (836 | ) | | | | | | Financial interest on debt | | | | (1,731 | ) | | (1,214 | ) | | (702 | ) | Financial income from marketable securities & cash equivalents | | | | 1,367 | | | 927 | | | 572 | | Cost of net debt | | | | (364 | ) | | (287 | ) | | (130 | ) | | | | | | Other financial income | | (Note 8) | | 592 | | | 396 | | | 321 | | Other financial expense | | (Note 8) | | (277 | ) | | (260 | ) | | (227 | ) | Income taxes | | (Note 9) | | (13,720 | ) | | (11,806 | ) | | (8,603 | ) | Equity in income (loss) of affiliates | | (Note 12) | | 1,693 | | | 1,173 | | | 1,158 | | Consolidated net income from continuing operations (Group without Arkema) | | | | 12,140 | | | 13,104 | | | 11,847 | | Consolidated net income from discontinued operations (Arkema) | | (Note 32) | | (5 | ) | | (461 | ) | | (698 | ) | Consolidated net income | | | | 12,135 | | | 12,643 | | | 11,149 | | Group share | | | | 11,768 | | | 12,273 | | | 10,868 | | Minority interests and dividends on subsidiaries’ redeemable preferred shares | | | | 367 | | | 370 | | | 281 | | | | | | | | | | | | | | | Earnings per share (euros)(b) | | | | 5.13 | | | 5.23 | | | 4.50 | | Diluted earnings per share (euros)(b) | | | | 5.09 | | | 5.20 | | | 4.48 | | | | | | | | | | | | | | |
| | | | | | | | | | | | For the year ended December 31,(M€)(a) | | | | 2008 | | | 2007 | | | 2006 | | Sales | | (Notes 4 & 5) | | 179,976 | | | 158,752 | | | 153,802 | | Excise taxes | | | | (19,645 | ) | | (21,928 | ) | | (21,113 | ) | Revenues from sales | | | | 160,331 | | | 136,824 | | | 132,689 | | | | | | | Purchases net of inventory variation | | (Note 6) | | (111,024 | ) | | (87,807 | ) | | (83,334 | ) | Other operating expenses | | (Note 6) | | (19,101 | ) | | (17,414 | ) | | (19,536 | ) | Exploration costs | | (Note 6) | | (764 | ) | | (877 | ) | | (634 | ) | Depreciation, depletion and amortization of tangible assets and mineral interests | | | | (5,755 | ) | | (5,425 | ) | | (5,055 | ) | Other income | | (Note 7) | | 369 | | | 674 | | | 789 | | Other expense | | (Note 7) | | (554 | ) | | (470 | ) | | (703 | ) | | | | | | Financial interest on debt | | | | (1,000 | ) | | (1,783 | ) | | (1,731 | ) | Financial income from marketable securities & cash equivalents | | | | 473 | | | 1,244 | | | 1,367 | | Cost of net debt | | (Note 29) | | (527 | ) | | (539 | ) | | (364 | ) | Other financial income | | (Note 8) | | 728 | | | 643 | | | 592 | | Other financial expense | | (Note 8) | | (325 | ) | | (274 | ) | | (277 | ) | | | | | | Equity in income (loss) of affiliates | | (Note 12) | | 1,721 | | | 1,775 | | | 1,693 | | | | | | | Income taxes | | (Note 9) | | (14,146 | ) | | (13,575 | ) | | (13,720 | ) | Net income from continuing operations (Group without Arkema) | | | | 10,953 | | | 13,535 | | | 12,140 | | Net income from discontinued operations (Arkema) | | (Note 34) | | — | | | — | | | (5 | ) | Consolidated net income | | | | 10,953 | | | 13,535 | | | 12,135 | | Group share | | | | 10,590 | | | 13,181 | | | 11,768 | | Minority interests | | | | 363 | | | 354 | | | 367 | | Earnings per share (€)(b) | | | | 4.74 | | | 5.84 | | | 5.13 | | Fully-diluted earnings per share (€)(b) | | | | 4.71 | | | 5.80 | | | 5.09 | |
| (a) | Except for per share amounts. |
| (b) | 2005 and 2004 amounts are recalculated to reflect the four-for-one stock split that took place on May 18, 2006. The earnings per share from continuing and discontinued operations are disclosed in Note 3234 to the Consolidated Financial Statements. |
The accompanying Notes are an integral part of these Consolidated Financial Statements
CONSOLIDATED BALANCE SHEET
TOTAL | | | | | | | | | | | | | As of December 31,(M€) | | | | 2006 | | | 2005 | | | 2004 | | ASSETS | | | | | | | | | | | | Non-current assets | | | | | | | | | | | | Intangible assets, net | | (Notes 5 & 10) | | 4,705 | | | 4,384 | | | 3,176 | | Property, plant and equipment, net | | (Notes 5 & 11) | | 40,576 | | | 40,568 | | | 34,906 | | Equity affiliates: investments and loans | | (Note 12) | | 13,331 | | | 12,652 | | | 10,680 | | Other investments | | (Note 13) | | 1,250 | | | 1,516 | | | 1,198 | | Hedging instruments of non-current financial debt | | (Notes 20 & 27) | | 486 | | | 477 | | | 1,516 | | Other non-current financial assets | | (Note 14) | | 2,088 | | | 2,794 | | | 2,351 | | Total non-current assets | | | | 62,436 | | | 62,391 | | | 53,827 | | Current assets | | | | | | | | | | | | Inventories, net | | (Note 15) | | 11,746 | | | 12,690 | | | 9,264 | | Accounts receivable, net | | (Note 16) | | 17,393 | | | 19,612 | | | 14,025 | | Prepaid expenses and other current assets | | (Note 16) | | 7,247 | | | 6,799 | | | 5,314 | | Current financial assets | | (Notes 20 & 27) | | 3,908 | | | 334 | | | 477 | | Cash and cash equivalents | | | | 2,493 | | | 4,318 | | | 3,860 | | Total current assets | | | | 42,787 | | | 43,753 | | | 32,940 | | Total assets | | | | 105,223 | | | 106,144 | | | 86,767 | | LIABILITIES & SHAREHOLDERS’ EQUITY | | | | | | | | | | | | Shareholders’ equity | | | | | | | | | | | | Common shares | | | | 6,064 | | | 6,151 | | | 6,350 | | Paid-in surplus and retained earnings | | | | 41,460 | | | 37,504 | | | 31,717 | | Cumulative translation adjustment | | | | (1,383 | ) | | 1,421 | | | (1,429 | ) | Treasury shares | | | | (5,820 | ) | | (4,431 | ) | | (5,030 | ) | Total shareholders’ equity - Group share | | (Note 17) | | 40,321 | | | 40,645 | | | 31,608 | | Minority interests and subsidiaries’ redeemable preferred shares | | | | 827 | | | 838 | | | 810 | | Total shareholders’ equity | | | | 41,148 | | | 41,483 | | | 32,418 | | Non-current liabilities | | | | | | | | | | | | Deferred income taxes | | (Note 9) | | 7,139 | | | 6,976 | | | 6,402 | | Employee benefits | | (Note 18) | | 2,773 | | | 3,413 | | | 3,607 | | Other non-current liabilities | | (Note 19) | | 6,467 | | | 7,051 | | | 6,274 | | Total non-current liabilities | | | | 16,379 | | | 17,440 | | | 16,283 | | Non-current financial debt | | (Note 20) | | 14,174 | | | 13,793 | | | 11,289 | | Current liabilities | | | | | | | | | | | | Accounts payable | | | | 15,080 | | | 16,406 | | | 11,672 | | Other creditors and accrued liabilities | | (Note 21) | | 12,509 | | | 13,069 | | | 11,148 | | Current borrowings | | (Note 20) | | 5,858 | | | 3,920 | | | 3,614 | | Other current financial liabilities | | (Notes 20 & 27) | | 75 | | | 33 | | | 343 | | Total current liabilities | | | | 33,522 | | | 33,428 | | | 26,777 | | Total liabilities and shareholders’ equity | | | | 105,223 | | | 106,144 | | | 86,767 | |
The accompanying Notes are an integral part of these Consolidated Financial Statements
| | | | | | | | | | | | | As of December 31,(M€) | | | | 2008 | | | 2007 | | | 2006 | | ASSETS | | | | | | | | | | | | Non-current assets | | | | | | | | | | | | Intangible assets, net | | (Notes 5 & 10) | | 5,341 | | | 4,650 | | | 4,705 | | Property, plant and equipment, net | | (Notes 5 & 11) | | 46,142 | | | 41,467 | | | 40,576 | | Equity affiliates: investments and loans | | (Note 12) | | 14,668 | | | 15,280 | | | 13,331 | | Other investments | | (Note 13) | | 1,165 | | | 1,291 | | | 1,250 | | Hedging instruments of non-current financial debt | | (Note 20) | | 892 | | | 460 | | | 486 | | Other non-current assets | | (Note 14) | | 3,044 | | | 2,155 | | | 2,088 | | Total non-current assets | | 71,252 | | | 65,303 | | | 62,436 | | Current assets | | | | | | | | | | | | Inventories, net | | (Note 15) | | 9,621 | | | 13,851 | | | 11,746 | | Accounts receivable, net | | (Note 16) | | 15,287 | | | 19,129 | | | 17,393 | | Other current assets | | (Note 16) | | 9,642 | | | 8,006 | | | 7,247 | | Current financial assets | | (Note 20) | | 187 | | | 1,264 | | | 3,908 | | Cash and cash equivalents | | (Note 27) | | 12,321 | | | 5,988 | | | 2,493 | | Total current assets | | | | 47,058 | | | 48,238 | | | 42,787 | | Total assets | | | | 118,310 | | | 113,541 | | | 105,223 | | LIABILITIES & SHAREHOLDERS’ EQUITY | | | | | | | | | | | | Shareholders’ equity | | | | | | | | | | | | Common shares | | | | 5,930 | | | 5,989 | | | 6,064 | | Paid-in surplus and retained earnings | | | | 52,947 | | | 48,797 | | | 41,460 | | Currency translation adjustment | | | | (4,876 | ) | | (4,396 | ) | | (1,383 | ) | Treasury shares | | | | (5,009 | ) | | (5,532 | ) | | (5,820 | ) | Total shareholders’ equity - Group share | | (Note 17) | | 48,992 | | | 44,858 | | | 40,321 | | Minority interests | | | | 958 | | | 842 | | | 827 | | Total shareholders’ equity | | | | 49,950 | | | 45,700 | | | 41,148 | | Non-current liabilities | | | | | | | | | | | | Deferred income taxes | | (Note 9) | | 7,973 | | | 7,933 | | | 7,139 | | Employee benefits | | (Note 18) | | 2,011 | | | 2,527 | | | 2,773 | | Provisions and other non-current liabilities | | (Note 19) | | 7,858 | | | 6,843 | | | 6,467 | | Total non-current liabilities | | | | 17,842 | | | 17,303 | | | 16,379 | | Non-current financial debt | | (Note 20) | | 16,191 | | | 14,876 | | | 14,174 | | Current liabilities | | | | | | | | | | | | Accounts payable | | | | 14,815 | | | 18,183 | | | 15,080 | | Other creditors and accrued liabilities | | (Note 21) | | 11,632 | | | 12,806 | | | 12,509 | | Current borrowings | | (Note 20) | | 7,722 | | | 4,613 | | | 5,858 | | Other current financial liabilities | | (Note 20) | | 158 | | | 60 | | | 75 | | Total current liabilities | | | | 34,327 | | | 35,662 | | | 33,522 | | Total liabilities and shareholders’ equity | | | | 118,310 | | | 113,541 | | | 105,223 | |
CONSOLIDATED STATEMENT OF CASH FLOWSFLOW
TOTAL | | | | | | | | | | (Note 26) | | | | | | | | | | For the year ended December 31,(M€) | | 2006 | | | 2005 | | | 2004 | | CASH FLOW FROM OPERATING ACTIVITIES | | | | | | | | | | Consolidated net income | | 12,135 | | | 12,643 | | | 11,149 | | Depreciation, depletion, and amortization | | 5,555 | | | 6,083 | | | 6,682 | | Non-current liabilities, valuation allowances, and deferred taxes | | 601 | | | 515 | | | 715 | | Impact of coverage of pension benefit plans | | (179 | ) | | (23 | ) | | (181 | ) | (Gains) Losses on sales of assets | | (789 | ) | | (99 | ) | | (3,139 | ) | Undistributed affiliates’ equity earnings | | (952 | ) | | (596 | ) | | (583 | ) | (Increase) Decrease in operating assets and liabilities | | (441 | ) | | (4,002 | ) | | (253 | ) | Other changes, net | | 131 | | | 148 | | | 272 | | Cash flow from operating activities | | 16,061 | | | 14,669 | | | 14,662 | | CASH FLOW USED IN INVESTING ACTIVITIES | | | | | | | | | | Intangible assets and property, plant and equipment additions | | (9,910 | ) | | (8,848 | ) | | (7,777 | ) | Acquisitions of subsidiaries, net of cash acquired | | (127 | ) | | (1,116 | ) | | (131 | ) | Investments in equity affiliates and other securities | | (402 | ) | | (280 | ) | | (209 | ) | Increase in non-current loans | | (1,413 | ) | | (951 | ) | | (787 | ) | Total expenditures | | (11,852 | ) | | (11,195 | ) | | (8,904 | ) | Proceeds from sale of intangible assets and property, plant and equipment | | 413 | | | 274 | | | 225 | | Proceeds from sale of subsidiaries, net of cash sold | | 18 | | | 11 | | | 1 | | Proceeds from sale of non-current investments | | 699 | | | 135 | | | 408 | | Repayment of non-current loans | | 1,148 | | | 668 | | | 558 | | Total divestments | | 2,278 | | | 1,088 | | | 1,192 | | Cash flow used in investing activities | | (9,574 | ) | | (10,107 | ) | | (7,712 | ) | CASH FLOW USED IN FINANCING ACTIVITIES | | | | | | | | | | Issuance (repayment) of shares: | | | | | | | | | | - Parent company’s shareholders | | 511 | | | 17 | | | 371 | | - Treasury shares | | (3,830 | ) | | (3,189 | ) | | (3,554 | ) | - Minority shareholders | | 17 | | | 83 | | | 162 | | - Subsidiaries’ redeemable preferred shares | | — | | | (156 | ) | | (241 | ) | Cash dividends paid to: | | | | | | | | | | - Parent company’s shareholders | | (3,999 | ) | | (3,510 | ) | | (4,293 | ) | - Minority shareholders | | (326 | ) | | (237 | ) | | (207 | ) | Net issuance (repayment) of non-current debt | | 3,722 | | | 2,878 | | | 2,249 | | Increase (Decrease) in current borrowings | | (6 | ) | | (951 | ) | | (2,195 | ) | Changes in current financial assets and liabilities | | (3,496 | ) | | — | | | — | | Other changes, net | | — | | | (1 | ) | | (6 | ) | Cash flow used in financing activities | | (7,407 | ) | | (5,066 | ) | | (7,714 | ) | Net increase/decrease in cash and cash equivalents | | (920 | ) | | (504 | ) | | (764 | ) | Effect of exchange rates and changes in reporting entity | | (905 | ) | | 962 | | | (236 | ) | Cash and cash equivalents at the beginning of the period | | 4,318 | | | 3,860 | | | 4,860 | | Cash and cash equivalents at the end of the period | | 2,493 | | | 4,318 | | | 3,860 | |
The accompanying Notes are an integral part of these Consolidated Financial Statements
| | | | | | | | | | (Note 27) | | | | | | | | | | For the year ended December 31,(M€) | | 2008 | | | 2007 | | | 2006 | | CASH FLOW FROM OPERATING ACTIVITIES | | | | | | | | | | Consolidated net income | | 10,953 | | | 13,535 | | | 12,135 | | Depreciation, depletion and amortization | | 6,197 | | | 5,946 | | | 5,555 | | Non-current liabilities, valuation allowances, and deferred taxes | | (150 | ) | | 826 | | | 601 | | Impact of coverage of pension benefit plans | | (505 | ) | | — | | | (179 | ) | (Gains) losses on disposals of assets | | (257 | ) | | (639 | ) | | (789 | ) | Undistributed affiliates’ equity earnings | | (311 | ) | | (821 | ) | | (952 | ) | (Increase) decrease in working capital | | 2,571 | | | (1,476 | ) | | (441 | ) | Other changes, net | | 171 | | | 315 | | | 131 | | Cash flow from operating activities | | 18,669 | | | 17,686 | | | 16,061 | | CASH FLOW USED IN INVESTING ACTIVITIES | | | | | | | | | | Intangible assets and property, plant and equipment additions | | (11,861 | ) | | (10,549 | ) | | (9,910 | ) | Acquisitions of subsidiaries, net of cash acquired | | (559 | ) | | (20 | ) | | (127 | ) | Investments in equity affiliates and other securities | | (416 | ) | | (351 | ) | | (402 | ) | Increase in non-current loans | | (804 | ) | | (802 | ) | | (1,413 | ) | Total expenditures | | (13,640 | ) | | (11,722 | ) | | (11,852 | ) | Proceeds from disposal of intangible assets and property, plant and equipment | | 130 | | | 569 | | | 413 | | Proceeds from disposal of subsidiaries, net of cash sold | | 88 | | | 5 | | | 18 | | Proceeds from disposal of non-current investments | | 1,233 | | | 527 | | | 699 | | Repayment of non-current loans | | 1,134 | | | 455 | | | 1,148 | | Total divestments | | 2,585 | | | 1,556 | | | 2,278 | | Cash flow used in investing activities | | (11,055 | ) | | (10,166 | ) | | (9,574 | ) | CASH FLOW USED IN FINANCING ACTIVITIES | | | | | | | | | | Issuance (repayment) of shares: | | | | | | | | | | - Parent company shareholders | | 262 | | | 89 | | | 511 | | - Treasury shares | | (1,189 | ) | | (1,526 | ) | | (3,830 | ) | - Minority shareholders | | (4 | ) | | 2 | | | 17 | | Dividends paid: | | | | | | | | | | - Parent company shareholders | | (4,945 | ) | | (4,510 | ) | | (3,999 | ) | - Minority shareholders | | (213 | ) | | (228 | ) | | (326 | ) | Net issuance (repayment) of non-current debt | | 3,009 | | | 3,220 | | | 3,722 | | Increase (decrease) in current borrowings | | 1,437 | | | (2,654 | ) | | (6 | ) | Increase (decrease) in current financial assets and liabilities | | 850 | | | 2,265 | | | (3,496 | ) | Cash flow used in financing activities | | (793 | ) | | (3,342 | ) | | (7,407 | ) | Net increase (decrease) in cash and cash equivalents | | 6,821 | | | 4,178 | | | (920 | ) | Effect of exchange rates | | (488 | ) | | (683 | ) | | (905 | ) | Cash and cash equivalents at the beginning of the period | | 5,988 | | | 2,493 | | | 4,318 | | Cash and cash equivalents at the end of the period | | 12,321 | | | 5,988 | | | 2,493 | |
CONSOLIDATED STATEMENT OF CHANGES IN SHAREHOLDERS’ EQUITY
TOTAL | | | | | | | | | | | | | | | | | | | | | | | | | | | | | | | | | | Common shares issued | | | Paid-in surplus
and
retained
earnings | | | Cumulative
translation
adjustment | | | Treasury shares | | | Share holders’
equity | | | Subsidiaries’ redeemable preferred shares | | | Minority interest | | | Total
equity | | | (M€) | | Number | | | Amount | | | | | Number | | | Amount | | | | | | As of January 1, 2004 | | 649,118,236 | | | 6,491 | | | 27,360 | | | — | | | (37,112,105 | ) | | (4,613 | ) | | 29,238 | | | 396 | | | 683 | | | 30,317 | | Net income 2004 | | — | | | — | | | 10,868 | | | — | | | — | | | — | | | 10,868 | | | 6 | | | 275 | | | 11,149 | | Items recognized directly in equity | | — | | | — | | | 29 | | | (1,429 | ) | | — | | | — | | | (1,400 | ) | | (14 | ) | | (88 | ) | | (1,502 | ) | Total excluding transactions with shareholders | | — | | | — | | | 10,897 | | | (1,429 | ) | | — | | | — | | | 9,468 | | | (8 | ) | | 187 | | | 9,647 | | - Cash dividend | | — | | | — | | | (4,293 | ) | | — | | | — | | | — | | | (4,293 | ) | | — | | | (207 | ) | | (4,500 | ) | - Issuance of common shares (Note 17) | | 5,770,804 | | | 58 | | | 478 | | | — | | | — | | | — | | | 536 | | | — | | | — | | | 536 | | - Purchase of treasury shares | | — | | | — | | | — | | | — | | | (22,550,000 | ) | | (3,554 | ) | | (3,554 | ) | | — | | | — | | | (3,554 | ) | - Sale of treasury shares | | — | | | — | | | 14 | | | — | | | 715,686 | | | 61 | | | 75 | | | | | | | | | 75 | | - Repayment of subsidiaries’ redeemable preferred shares | | | | | | | | | | | | | | | | | | | | — | | | (241 | ) | | | | | (241 | ) | - Share-based payments (Note 24) | | | | | | | | 138 | | | | | | | | | | | | 138 | | | | | | | | | 138 | | Transactions with shareholders | | 5,770,804 | | | 58 | | | (3,663 | ) | | — | | | (21,834,314 | ) | | (3,493 | ) | | (7,098 | ) | | (241 | ) | | (207 | ) | | (7,546 | ) | Cancellation of purchased shares (Note 17) | | (19,873,932 | ) | | (199 | ) | | (2,877 | ) | | — | | | 19,873,932 | | | 3,076 | | | — | | | — | | | — | | | — | | As of December 31, 2004 | | 635,015,108 | | | 6,350 | | | 31,717 | | | (1,429 | ) | | (39,072,487 | ) | | (5,030 | ) | | 31,608 | | | 147 | | | 663 | | | 32,418 | | Net income 2005 | | — | | | — | | | 12,273 | | | — | | | — | | | — | | | 12,273 | | | 1 | | | 369 | | | 12,643 | | Items recognized directly in equity (Note 17) | | — | | | — | | | 418 | | | 2,850 | | | — | | | — | | | 3,268 | | | 8 | | | 43 | | | 3,319 | | Total excluding transactions with shareholders | | — | | | — | | | 12,691 | | | 2,850 | | | — | | | — | | | 15,541 | | | 9 | | | 412 | | | 15,962 | | - Cash dividend | | — | | | — | | | (3,510 | ) | | — | | | — | | | — | | | (3,510 | ) | | — | | | (237 | ) | | (3,747 | ) | - Issuance of common shares (Note 17) | | 1,176,756 | | | 12 | | | 88 | | | — | | | — | | | — | | | 100 | | | — | | | — | | | 100 | | - Purchase of treasury shares | | — | | | — | | | — | | | — | | | (18,318,500 | ) | | (3,485 | ) | | (3,485 | ) | | — | | | — | | | (3,485 | ) | - Sale of treasury shares | | — | | | — | | | 34 | | | — | | | 2,066,087 | | | 226 | | | 260 | | | — | | | — | | | 260 | | - Repayment of subsidiaries’ redeemable preferred shares | | — | | | — | | | — | | | — | | | — | | | — | | | — | | | (156 | ) | | — | | | (156 | ) | - Share-based payments (Note 24) | | — | | | — | | | 131 | | | — | | | — | | | — | | | 131 | | | — | | | — | | | 131 | | Transactions with shareholders | | 1,176,756 | | | 12 | | | (3,257 | ) | | — | | | (16,252,413 | ) | | (3,259 | ) | | (6,504 | ) | | (156 | ) | | (237 | ) | | (6,897 | ) | Cancellation of purchased shares (Note 17) | | (21,075,568 | ) | | (211 | ) | | (3,647 | ) | | — | | | 21,075,568 | | | 3,858 | | | — | | | — | | | — | | | — | | As of December 31, 2005 | | 615,116,296 | | | 6,151 | | | 37,504 | | | 1,421 | | | (34,249,332 | ) | | (4,431 | ) | | 40,645 | | | — | | | 838 | | | 41,483 | | Net income 2006 | | — | | | — | | | 11,768 | | | — | | | — | | | — | | | 11,768 | | | — | | | 367 | | | 12,135 | | Items recognized directly in equity (Note 17) | | — | | | — | | | (37 | ) | | (2,595 | ) | | — | | | — | | | (2,632 | ) | | | | | (44 | ) | | (2,676 | ) | Total excluding transactions with shareholders | | — | | | — | | | 11,731 | | | (2,595 | ) | | — | | | — | | | 9,136 | | | — | | | 323 | | | 9,459 | | Four-for-one split of shares par value | | 1,845,348,888 | | | — | | | — | | | — | | | (102,747,996 | ) | | — | | | — | | | — | | | — | | | — | | - Spin-off of Arkema | | — | | | — | | | (2,061 | ) | | (209 | ) | | — | | | 16 | | | (2,254 | ) | | — | | | (8 | ) | | (2,262 | ) | - Cash dividend | | — | | | — | | | (3,999 | ) | | — | | | — | | | — | | | (3,999 | ) | | — | | | (326 | ) | | (4,325 | ) | - Issuance of common shares (Note 17) | | 12,322,769 | | | 30 | | | 469 | | | — | | | — | | | — | | | 499 | | | — | | | — | | | 499 | | - Purchase of treasury shares | | — | | | — | | | — | | | — | | | (78,220,684 | ) | | (4,095 | ) | | (4,095 | ) | | — | | | — | | | (4,095 | ) | - Sale of treasury shares | | — | | | — | | | — | | | — | | | 6,997,305 | | | 232 | | | 232 | | | — | | | — | | | 232 | | - Share-based payments (Note 24) | | — | | | — | | | 157 | | | — | | | | | | | | | 157 | | | — | | | — | | | 157 | | Transactions with shareholders | | 1,857,671,657 | | | 30 | | | (5,434 | ) | | (209 | ) | | (173,971,375 | ) | | (3,847 | ) | | (9,460 | ) | | — | | | (334 | ) | | (9,794 | ) | Cancellation of purchased shares (Note 17) | | (47,020,000 | ) | | (117 | ) | | (2,341 | ) | | — | | | 47,020,000 | | | 2,458 | | | — | | | — | | | — | | | — | | As of December 31, 2006 | | 2,425,767,953 | | | 6,064 | | | 41,460 | | | (1,383 | ) | | (161,200,707 | ) | | (5,820 | ) | | 40,321 | | | — | | | 827 | | | 41,148 | |
The accompanying Notes are an integral part of these Consolidated Financial Statements
| | | | | | | | | | | | | | | | | | | | | | | | | | | | | | | Common shares issued | | | Paid in
surplus
and
retained
earnings | | | Currency
translation
adjustment | | | Treasury shares | | | Shareholders’
equity
Group share | | | Minority
interests | | | Total
shareholders’
equity | | | (M€) | | Number | | | Amount | | | | | Number | | | Amount | | | | | As of January 1, 2006 | | 615,116,296 | | | 6,151 | | | 37,504 | | | 1,421 | | | (34,249,332 | ) | | (4,431 | ) | | 40,645 | | | 838 | | | 41,483 | | Net income 2006 | | — | | | — | | | 11,768 | | | — | | | — | | | — | | | 11,768 | | | 367 | | | 12,135 | | Items recognized directly in equity (Note 17) | | — | | | — | | | (37 | ) | | (2,595 | ) | | — | | | — | | | (2,632 | ) | | (44 | ) | | (2,676 | ) | Total excluding transactions with shareholders | | — | | | — | | | 11,731 | | | (2,595 | ) | | — | | | — | | | 9,136 | | | 323 | | | 9,459 | | Four-for-one stock split | | 1,845,348,888 | | | — | | | — | | | — | | | (102,747,996 | ) | | — | | | — | | | — | | | — | | Spin-off of Arkema | | — | | | — | | | (2,061 | ) | | (209 | ) | | — | | | 16 | | | (2,254 | ) | | (8 | ) | | (2,262 | ) | Dividend | | — | | | — | | | (3,999 | ) | | — | | | — | | | — | | | (3,999 | ) | | (326 | ) | | (4,325 | ) | Issuance of common shares (Note 17) | | 12,322,769 | | | 30 | | | 469 | | | — | | | — | | | — | | | 499 | | | — | | | 499 | | Purchase of treasury shares | | — | | | — | | | — | | | — | | | (78,220,684 | ) | | (4,095 | ) | | (4,095 | ) | | — | | | (4,095 | ) | Sale of treasury shares | | — | | | — | | | — | | | — | | | 6,997,305 | | | 232 | | | 232 | | | — | | | 232 | | Share-based payments (Note 25) | | — | | | — | | | 157 | | | — | | | — | | | — | | | 157 | | | — | | | 157 | | Transactions with shareholders | | 1,857,671,657 | | | 30 | | | (5,434 | ) | | (209 | ) | | (173,971,375 | ) | | (3,847 | ) | | (9,460 | ) | | (334 | ) | | (9,794 | ) | Share cancellation (Note 17) | | (47,020,000 | ) | | (117 | ) | | (2,341 | ) | | — | | | 47,020,000 | | | 2,458 | | | — | | | — | | | — | | As of December 31, 2006 | | 2,425,767,953 | | | 6,064 | | | 41,460 | | | (1,383 | ) | | (161,200,707 | ) | | (5,820 | ) | | 40,321 | | | 827 | | | 41,148 | | Net income 2007 | | — | | | — | | | 13,181 | | | — | | | — | | | — | | | 13,181 | | | 354 | | | 13,535 | | Items recognized directly in equity (Note 17) | | — | | | — | | | 117 | | | (3,013 | ) | | — | | | — | | | (2,896 | ) | | (111 | ) | | (3,007 | ) | Total excluding transactions with shareholders | | — | | | — | | | 13,298 | | | (3,013 | ) | | — | | | — | | | 10,285 | | | 243 | | | 10,528 | | Dividend | | — | | | — | | | (4,510 | ) | | — | | | — | | | — | | | (4,510 | ) | | (228 | ) | | (4,738 | ) | Issuance of common shares (Note 17) | | 2,769,144 | | | 7 | | | 82 | | | — | | | — | | | — | | | 89 | | | — | | | 89 | | Purchase of treasury shares | | — | | | — | | | — | | | — | | | (32,387,355 | ) | | (1,787 | ) | | (1,787 | ) | | — | | | (1,787 | ) | Sale of treasury shares | | — | | | — | | | (77 | ) | | — | | | 9,161,830 | | | 341 | | | 264 | | | — | | | 264 | | Share-based payments (Note 25) | | — | | | — | | | 196 | | | — | | | — | | | — | | | 196 | | | — | | | 196 | | Transactions with shareholders | | 2,769,144 | | | 7 | | | (4,309 | ) | | — | | | (23,225,525 | ) | | (1,446 | ) | | (5,748 | ) | | (228 | ) | | (5,976 | ) | Share cancellation (Note 17) | | (33,005,000 | ) | | (82 | ) | | (1,652 | ) | | — | | | 33,005,000 | | | 1,734 | | | — | | | — | | | — | | As of December 31, 2007 | | 2,395,532,097 | | | 5,989 | | | 48,797 | | | (4,396 | ) | | (151,421,232 | ) | | (5,532 | ) | | 44,858 | | | 842 | | | 45,700 | | Net income 2008 | | — | | | — | | | 10,590 | | | — | | | — | | | — | | | 10,590 | | | 363 | | | 10,953 | | Items recognized directly in equity (Note 17) | | — | | | — | | | (258 | ) | | (480 | ) | | — | | | — | | | (738 | ) | | (34 | ) | | (772 | ) | Total excluding transactions with shareholders | | — | | | — | | | 10,332 | | | (480 | ) | | — | | | — | | | 9,852 | | | 329 | | | 10,181 | | Dividend | | — | | | — | | | (4,945 | ) | | — | | | — | | | — | | | (4,945 | ) | | (213 | ) | | (5,158 | ) | Issuance of common shares (Note 17) | | 6,275,977 | | | 16 | | | 246 | | | — | | | — | | | — | | | 262 | | | — | | | 262 | | Purchase of treasury shares | | — | | | — | | | — | | | — | | | (27,600,000 | ) | | (1,339 | ) | | (1,339 | ) | | — | | | (1,339 | ) | Sale of treasury shares | | — | | | — | | | (71 | ) | | — | | | 5,939,137 | | | 221 | | | 150 | | | — | | | 150 | | Share-based payments (Note 25) | | — | | | — | | | 154 | | | — | | | — | | | — | | | 154 | | | — | | | 154 | | Transactions with shareholders | | 6,275,977 | | | 16 | | | (4,616 | ) | | — | | | (21,660,863 | ) | | (1,118 | ) | | (5,718 | ) | | (213 | ) | | (5,931 | ) | Share cancellation (Note 17) | | (30,000,000 | ) | | (75 | ) | | (1,566 | ) | | — | | | 30,000,000 | | | 1,641 | | | — | | | — | | | — | | As of December 31, 2008 | | 2,371,808,074 | | | 5,930 | | | 52,947 | | | (4,876 | ) | | (143,082,095 | ) | | (5,009 | ) | | 48,992 | | | 958 | | | 49,950 | |
TOTAL NOTES TO THE CONSOLIDATED FINANCIAL STATEMENTS
On February 13, 2007,11, 2009, the Board of Directors established and authorized the publication of the consolidated financial statementsConsolidated Financial Statements of TOTAL S.A. for the year ended December 31, 2006.2008, which will be submitted for approval to the shareholders’ meeting to be held on May 15, 2009. INTRODUCTION The consolidated financial statementsConsolidated Financial Statements of TOTAL S.A. and its subsidiaries (the Group) have been prepared on the basis of IFRS (International Financial Reporting Standards) as adopted by the European Union and IFRS as issued by the IASB (International Accounting Standard Board) as of December 31, 2006. As2008. The accounting principles applied in the Consolidated Financial Statements as of December 31, 2006,2008, were the same as those that were used as of December 31, 20052007, except for amendments and interpretations of IFRS which were mandatory for the periods beginning after January 1, 2008 (and not early adopted). Their adoption has no impact on the Consolidated Financial Statements as of December 31, 2004, TOTAL’s consolidated financial statements would not have been different if presented under “IFRS as published by the IASB” or under “IFRS as adopted by the EU”.2008. The preparation of financial statements in accordance with IFRS requires the management to make estimates and apply assumptions that affect the reported amounts of assets, liabilities and contingent liabilities at the date of preparation of the financial statements and reported income and expenses for the period. ManagementThe management reviews these estimates and assumptions on an ongoing basis, by reference to past experience and various other factors considered as reasonable which form the basis for assessing the book valuecarrying amount of assets and liabilities. Actual results may differ significantly from these estimates, if different assumptions or circumstances apply. These judgments and estimates relate principally to the application of the successful efforts method for the oil and gas accounting, the valuation of long-lived assets, the provisions for asset retirement obligations and environmental remediation, the pensions and post-retirements benefits and the income tax computation. Lastly, where the accounting treatment of a specific transaction is not dealt with inaddressed by any standardsaccounting standard or interpretation, the management applies its judgment to define and apply accounting policies that will lead to relevant and reliable information, so that the financial statements: give a true and fair view of the Group’s financial position, financial performance and cash flow;flows; reflect the substance of transactions; are prepared on a prudent basis; and are complete in all material aspects. 1.1) ACCOUNTING POLICIES
The consolidatedPursuant to the accrual basis of accounting followed by the Group, the financial statements have been prepared on a historical cost basis, except for certain financialreflect the effects of transactions and other events when they occur. Assets and liabilities such as property, plant and equipment and intangible assets are usually measured at amortized cost. Financial assets and liabilities that have beenare usually measured at fair value.
The accountingAccounting policies used by the Group are described below.below:
A.A) PRINCIPLES OF CONSOLIDATION
The subsidiariesSubsidiaries that are directly controlled by the parent company or indirectly controlled by other consolidated subsidiaries are fully consolidated.
Investments in jointly controlledjointly-controlled entities are proportionately consolidated. Investments in associates, in which the Group has significant influence, are accounted for by the equity method. Significant influence is presumed when the Group holds, directly or indirectly (e.g.(e.g. through subsidiaries), 20% or more of the voting rights. Companies in which ownership interest is less than 20%, but over which the Company has the ability to exercise significant influence, are also accounted for by the equity method. All significant intercompany balances, transactions and income have been eliminated. B.B) BUSINESS COMBINATIONS
Business combinations are accounted for using the purchase method. This method implies the recognition of the assets, liabilities and contingent liabilities of the companies acquired by the Group at their fair value. The difference between the acquisition cost of the shares and the total valuation, at fair value of the acquired share of the assets, liabilities and contingent liabilities identified on the acquisition date is recorded as goodwill. If the cost of an acquisition is less than the fair value of the net assets of the subsidiary acquired, an additional analysis is performed on the identification and valuation of the identifiable elements of the assets and liabilities. Any residual negative goodwill is recorded as net operating income. The analysis of goodwill is finalized within one year from the acquisition date. C.C) FOREIGN CURRENCY TRANSLATION
The financial statements of subsidiaries are prepared in the currency that most clearly reflects their business environment. This is referred to as their functional currency. Transactions denominated in foreign currencies are translated at the exchange rate prevailing aton the transaction date. At each balance sheet date, monetary assets and liabilities are translated at the closing rate and the resulting exchange differences are recognized in “Other income” or “Other expenses”expense”. | (ii) | Translation of financial statements denominated in foreign currencies |
Assets and liabilities of foreign entities are translated into euros on the basis of the exchange rates at the end of the period. The income and cash flow statements are translated using the average exchange rates offor the period. Foreign exchange differences resulting from such translations are either recorded in Shareholders’shareholders’ equity under “Cumulative“Currency translation adjustments”adjustment” (for the Group share) or under “Minority interests” (for the minority share) as deemed appropriate. D.D) SALES AND REVENUES FROM SALES
Revenues from sales are recognized when the significant risks and rewards of ownership have been passed to the buyer and the amount can be reasonably measured. Sales figures include excise taxes collected by the Group within the course of its oil distribution operations. Excise taxes are deducted from sales in order to obtain the “Revenue“Revenues from sales” indicator.. Revenues from sales of crude oil, natural gas and coal are recorded upon transfer of title, according to the terms of the sales contracts. Revenues from the production of crude oil and natural gas properties, in which the Group has an interest with other producers, are recognized based on actual volumes sold during the period. Any difference between volumes sold and entitlement volumes, based on the Group net working interest, which are deemed to be non-recoverable through remaining production, are recognized as accounts“Crude oil and natural gas inventories” or “Accounts receivable, net” or accounts payable,“Accounts payable”, as appropriate. Revenues from gas transport are recognized when the services are rendered,rendered. These revenues are based on the quantities transported and measured according to procedures defined in each service contract. Revenues from sales of electricity to the Downstream and Chemicals segment, are recorded upon transfer of title, according to the terms of the related contracts. Revenues from services are recognized when the services have been rendered. Shipping revenues and expenses from chartertime-charter activities are recognized on a pro rata basis over a period that commences upon the unloading of the previous voyage and terminates upon the unloading of the current voyage. Shipping revenue recognition starts only when a charter has been agreed to by both the Group and the customer, and revenue begins to be earned.customer. Oil and gas sales are inclusive of quantities delivered that represent production royalties and taxes, when paid in cash, and outside the United States and Canada. Certain transactions within the trading activities (contracts involving quantities that are purchased outside the Groupto third parties then resold outside the Group)to third parties) are shown at their net value in sales. Exchanges of crude oil and petroleum products within normal trading activities do not generate any income:income and therefore these flows are shown at their net value in both the statement of income statement and the balance sheet. E.E) SHARE-BASED PAYMENTS
The Group may grant employees stock options, create employee share purchase plans and offer its employees the opportunity to subscribe to reserved capital increases. These employee benefits are recognized as expenses with a corresponding credit to shareholders’ equity. The expense is determined atequal to the fair value by reference toof the instruments granted. The fair value of the options is calculated using the Black-Scholes methodmodel at the grant date. The expense is allocatedrecognized on a straight-line basis between the grant date and vesting date. For restricted share plans, the expense is calculated using the market price at the grant date after deducting the expected distribution rate during the vesting period. The cost of employee-reserved capital increases is immediately expensed. A discount reduces the expense in order to take into account for the non-transferabilitynontransferability of the shares awarded to the employees over a period of five years. F.F) INCOME TAXES
Income taxes showndisclosed in the statement of income statement include the current income tax expenses and the deferred income tax expenses. The Group uses the liability method whereby deferred income taxes are recorded based on the temporary differences between the financial statement and tax basiscarrying amounts of assets and liabilities and for carry-forwardstheir tax bases, and on carryforwards of unused tax losses and tax credits.
Deferred tax assets and liabilities are measured using the tax rates that have been enacted or substantially enacted at the balance sheet date. The tax rates used depend on the maturitytiming of renewalreversals of temporary differences, tax losses and other tax credits. The effect of thea change in tax rate is recognized either in the consolidated statementConsolidated Statement of incomeIncome or in shareholders’ equity depending on the item to which it is related.relates to. Deferred tax assets are recognized when future recovery is probable. Asset retirement obligations and finance leases give rise to the recognition of assets and liabilities for accounting purposes as described in paragraph K “Leases” and paragraph Q “Asset retirement obligations” and paragraph K “Leases” of this Note. Deferred income taxes onresulting from temporary differences resulting from the difference between the carrying valueamounts and taxable basistax bases of such assets and liabilities are recognized. Deferred tax liabilities onresulting from temporary differences resulting from the difference between the carrying valueamounts of the equity-method investments and the taxable basis of these investmentstheir tax bases are recognized. The deferred tax calculation is based on the expected future tax effect (dividend distribution rate or tax rate on the gain or loss upon saledisposal of these investments). Taxes paid on the Upstream production are included in operating expenses, including those related to historical concessions held by the Group in the Middle East producing countries. G.G) EARNINGS PER SHARE
Earnings per share areis calculated by dividing net income (Group share) by the weighted-average number of common shares outstanding during the period. Diluted earnings per share areis calculated by dividing net income (Group share) by the fully-diluted weighted-average number of common shares outstanding during the period. Treasury For both of these calculations, treasury shares held by the parent company, TOTAL S.A., and TOTAL shares held by the Group subsidiaries are deducted from consolidated shareholders’ equity andequity. These shares are not considered outstanding for purposes of thisthese calculations. In addition, in the case of the diluted earnings per share calculation, whichthe calculation also takes into account the dilutive effect of stock options, restricted share grants and capital increases with a subscription period closing after the end of the fiscal year. The weighted-average number of fully-diluted shares is calculated in accordance with the treasury stock method provided for by IAS 33. The proceeds, which would be recovered in the event of an exercise of rights related to dilutive instruments, are presumed to be a share buyback of shares at the average market price over the period. The number of shares thereby obtained leads to a reduction in the total number of shares that would result from the exercise of rights.
H.H) OIL AND GAS EXPLORATION AND PRODUCING PROPERTIES
The Group applies IFRS 6 “Exploration for and Evaluation of Mineral Resources”. Oil and gas exploration and production properties and assets are accounted for in accordance with the successful efforts method. Geological and geophysical costs, including seismic surveys for exploration purposes are expensed as incurred. Leasehold rightsMineral interests are capitalized as intangible assets when acquired. TheyThese acquired interests are tested for impairment on a regular basis, property-by-property, based on the results of explorationthe exploratory activity and the management’s evaluation.
In the event of a discovery, the unproved leasehold rightsmineral interests are transferred to proved leasehold rightsmineral interests at their net book value as soon as proved reserves are booked. Exploratory wells are tested for impairment on a well-by-well basis and accounted for as follows: costsCosts of exploratory wells that have foundwhich result in proved reserves are capitalized. Capitalized successful exploration wells arecapitalized and then depreciated using the unit-of-production method based on proved developed reserves;
costsCosts of dry exploratory wells and wells that have not found proved reserves are charged to expense;
costsCosts of exploratory wells are temporarily capitalized until a determination is made as to whether the well has found proved reserves if both of the following conditions are met:
theThe well has found a sufficient quantity of reserves to justify its completion as a producing well, if appropriate, assuming that the required capital expenditures are made;
theThe Group is making sufficient progress assessing the reserves and the economic and operating viability of the project. This progress is evaluated on the basis of indicators such as whether additional exploratory works are underwayunder way or firmly planned (wells, seismic or significant studies), whether costs are being incurred for development studies and whether the Group is waiting for governmental or other third-party authorization of a proposed project, or availability of capacity on an existing transport or processing facility.
Costs of exploratory wells not meeting these conditions are charged to expense. | (ii) | Oil and Gas producing assets |
Development costs incurred for the drilling of development wells and infor the construction of production facilities are capitalized, together with interestborrowing costs incurred during the period of construction and the present value of estimated discounted costs of asset retirement obligations. The depletion rate is usually equal to the ratio of oil and gas production for the period to proved developed reserves (unit-of-production method). With respect to production sharing contracts, this computation is based on the portion of production and reserves assigned to the Group taking into account estimates based on the contractual clauses regarding the reimbursement of exploration and development costs (cost oil) as well as the sharing of hydrocarbon rights (profit oil). Transportation assets are depreciated using the unit-of-production method based on throughput or by using the straight-line method whichever best reflects the economic life of the asset. Proved leasehold rightsmineral interests are depreciated using the unit-of-production method based on proved reserves. I.I) GOODWILL AND OTHER INTANGIBLE ASSETS
Other intangible assets include goodwill, patents, trademarks, and leasehold rights.mineral interests. Intangible assets are carried at cost, after deducting any accumulated depreciation and accumulated impairment losses. Goodwill in a consolidated companysubsidiary is calculated as the excess of the cost of shares, including transaction expenses, over the fair value of the Group’s share of the net assets at the acquisition date. Goodwill is not amortized but is tested for impairment annually or as soon as there is any indication that an asset may be impairedof impairment (see paragraph L “Impairment of long-lived assets” of this Note.)Note). In equity affiliates, the book value of goodwill is included in the book value of the investment. investment carrying amount. Other intangible assets (except goodwill) have a finite useful life and are amortized on a straight-line basis over 10 to 40 years depending on the useful life of the assets. Research and development Research costs are charged to expense as incurred. Development expenses are capitalized when the following can be demonstrated: the technical feasibility of the project and the availability of the appropriateadequate resources for the completion of the intangible asset; the ability of the asset to generate probable future economic benefits; the ability to measure reliably the expenditures attributable to the asset.asset; and the feasibility and intention of the Group to complete the intangible asset and use or sell it. Advertising costs are charged to expense as incurred. J.J) OTHER PROPERTY, PLANT AND EQUIPMENT
Other property, plant and equipment are carried at cost, after deducting any accumulated depreciation and accumulated impairment losses. This includes interest expensesborrowing costs incurred until assets are placed in service. Investment subsidies are deducted from the cost of the related expenditures. Routine maintenance and repairs are charged to expense as incurred. The costs of major turnarounds of refineries and large petrochemical units are capitalized as incurred and depreciated over the period of time between two consecutive major turnarounds. Other property, plant and equipment are depreciated using the straight-line method over their useful life,lives, which are as follows: | | | • Furniture, office equipment, machinery and tools | | 3-12 years | • Transportation equipmentequipments | | 5-20 years | • Storage tanks and related equipment | | 10-15 years | • Specialized complex installations and pipelines | | 10-30 years | • Buildings | | 10-50 years |
K.K) LEASES
A financialfinance lease transfers substantially all the risks and rewards incidental to ownership from the lessor to the lessee. These contracts are capitalized as assets at fair value or, if lower, at the present value of the minimum lease payments according to the contract. A corresponding financial debt is recognized as a financial liabilities.liability. These assets are depreciated over the corresponding useful life used by the Group. Leases that are not financialfinance leases as defined above are recorded as operating leases. Certain arrangements do not take the legal form of a lease but convey the right to use an asset or a group of assets in return for fixed payments. Such arrangements are accounted for as leases and are analyzed to determine whether they should be classified as operating leases or as financialfinance leases. L.L) IMPAIRMENT OF LONG-LIVED ASSETS
The recoverable amounts of intangible assets and property, plant and equipment are tested for possible impairment as soon as there is any indication that the assets may be impaired.of impairment exists. This test is performed at least annually for goodwill. The recoverable valueamount is the higher of the sale price (net of sale expenses) andfair value (less costs to sell) or its useful value.value in use. For this purpose, assetsAssets are grouped into cash-generating units (or CGUs). for testing purposes. A cash-generating unit is a homogeneous group of assets that generates cash flowsinflows that are largely independent of the cash flows ofinflows from other groups of assets.
The recoverable amountvalue in use of a CGU is determined by reference to the discounted expected future cash flows, expected from it, based upon the management’s expectation of future economic and operating conditions. If the recoverable amountthis value is less than the carrying amount, an impairment loss on property, plant and equipment and leaseholds rights,mineral interests, or on other intangible assets, is recognized either in “Depreciation, depletion and amortization of tangible assets and leaseholds rights”mineral interests” or in “Other expense”, respectively. This impairment loss is first allocated to reduce the carrying amount of any goodwill, then to the other assets of the CGU.goodwill. Impairment losses recognized in prior periods couldcan be reversed up to the net book value that the asset would haveoriginal carrying amount, had if the impairment loss had not been recognized. Impairment losses recognized for goodwill are notcannot be reversed. M.M) FINANCIAL ASSETS AND LIABILITIES
Financial assets and liabilities are financial loans and receivables, investments in non-consolidated companies, and publicly-tradedpublicly traded equity securities, derivativederivatives instruments and current and non-current financial liabilities. The accounting treatment of these financial assets and liabilities is as follows.follows: | (i) | Financial loansLoans and receivables |
Financial loans and receivables are recognized at amortized cost. They are tested for impairment, by comparing the net book value being comparedcarrying amount of the assets to estimates of the discounted future recoverable cash flows. These tests are conducted as soon as there is any evidence that their fair value is less than their net book value,carrying amount, and at least annually. The potentialAny impairment loss is recorded in the statement of income. | (ii) | Investments in non-consolidated companies and publicly-traded equity securities |
These assets are classified as financial assets available for sale and therefore measured at their fair value. For listed securities, this fair value is equal to the market price. For unlisted securities, if the fair value is not reliably determinable, securities are recorded at their historical value. Changes in fair value are recorded in shareholders’ equity. If there is any evidence of a significant or long-lasting loss,prolonged decline in the fair value of the investments below their cost, an impairment loss is recorded in the consolidated statement of income. This impairment is reversed in the statement of income only when the securities are sold. | (iii) | Derivative instruments |
The Group uses derivative instruments to manage its exposure to movementsrisks of changes in interest rates, foreign exchange rates and commodity prices. Changes in fair value of derivative instruments are recognized in the statement of income or in shareholders’ equity and are recognized in the balance sheet in the accounts corresponding to their nature, according to the risk management strategy described in Note 2931 to the Consolidated Financial Statements. The derivative instruments used by the Group are the following: Financial instruments used for cash management purposes are part of a hedging strategy of currency and interest rate risks within global limits set by the Group and are considered to be usedas held for transactions (held for trading).trading. Changes in fair value are systematically recorded in the income statement.statement of income. The balance sheet value of those instruments is included in “Current financial assets” or “Other current financial liabilities”. | • | | Long-term financing (other than euro) |
When an external long-term financing is set up, specifically to finance subsidiaries in a currency other than the euro, which is mainly the case for subsidiaries whose functional currency is the U.S. dollar, and when this financing involves currency and interest rate derivatives, these instruments qualify as fair value hedges of the interest rate risk on the external debt and of the currency risk of the loans to subsidiaries. Changes in fair value of derivatives are recognized in the statement of income statement as are changes in fair value of financial debts and loans to subsidiaries. The fair value of those hedging instruments of long-term financing is included in the assets under « Hedging“Hedging instruments onof non-current financial debt»debt” or in the liabilities under « Non-current“Non-current financial debt»debt” for the non-current part.portion. The current partportion (less than one year) is accounted for in “Current financial assets” or “Other current financial liabilities”. In case of the anticipated termination of derivative instruments accounted for as fair value hedge,hedges, the amount paid or received is recognized in the statement of income statement and: If this termination is due to an early cancellation of the hedged items, the adjustment previously recorded as revaluation of those hedged items is also recognized in the income statement.statement of income. If the hedged items remain in the balance sheet, the adjustment previously recorded as a revaluation of those hedged items is spread over the remaining life of those items. | • | | Foreign subsidiaries’ equity hedge |
Certain financial instruments hedge against risks related to the equity of foreign subsidiaries whose functional currency is not the euro (mainly the U.S. dollar). TheyThese instruments qualify as “net investment hedges”. Changes in fair value are recorded in shareholders’ equity. The fair value of these instruments is recorded under “Current financial assets” or “Other current financial liabilities”. | • | | Financial instruments related to commodity contracts |
Financial instruments related to commodity contracts, including all the crude oil, petroleum products, natural gas and power purchasing/selling contracts related to the trading activities, together with the commodity contract derivative instruments such as energy contracts and forward freight agreements, are used to adjust the Group’s exposure to price fluctuations within global trading limits. TheseAccording to industry practice, these instruments are considered according to the industry practice, as held for trading. Changes in fair value are recorded in the income statement.statement of income. The fair value of these instruments is recorded in the appropriate operating third party headings “Accounts receivable and other“Other current assets” or “Accounts payable“Other creditors and other creditors”accrued liabilities” depending on whether they are assets or liabilities. Detailed information about the closing balancesderivatives positions is disclosed in Notes 20, 2728, 29, 30 and 2931 to the Consolidated Financial Statements. | (iv) | Current and non-current financial liabilities |
Current and non-current financial liabilities (excluding derivatives) are recognized at amortized cost, except those for which a hedge accounting can beis applied as described in the previous paragraph. | (v) | Fair value of financial instruments |
Fair values are estimated for the majority of the Group’s financial instruments, with the exception of publicly traded equity securities and marketable securities for which the market price is used. Estimated fair values, which are based on principles such as discounting future cash flows to present value, must be weighted by the fact that the value of a financial instrument at a given time may be modified depending oninfluenced by the market environment (liquidity especially), and also the fact that subsequent changes in interest rates and exchange rates are not taken into account. In some cases, the estimates have been made based on simplifying assumptions. As a consequence, the use of different estimates, methodologies and assumptions maycould have a material effect on the estimated fair value amounts. The methods used are as follows: Financial debts, swaps:swaps: The market value of swaps and debenture loansof bonds that are hedged by those swaps, have been determined on an individual basis by discounting future cash flows with the zero coupon interest rate curves existing at year-end.year-end; Financial instruments related to commodity contracts: The valuation methodology is to mark to market all open positions for both physical and derivatives risks. The valuations are determined on a daily basis using observable market data based on organized markets and over the counter (OTC) markets. In particular cases when market data are not directly available, the valuations are derived from observable data such as arbitrages, freight or spreads and market corroboration. For valuation of risks based on calculated data, such as options for example, commonly known models are used to compute the fair value. Other financial instruments:instruments: The fair value of the interest rate swaps and of FRA (Forward RightRate Agreement) are calculated by discounting future cash flows on the basis of the zero coupon interest rate curves existing at year-end after adjustment for interest accrued yetbut unpaid. Forward exchange contracts and currency swaps are valued on the basis of a comparison of the negociated forward rates negotiated with the rates in effect on the financial markets at year-end for similar maturities. Exchange options are valued based on the Garman-Kohlhagen model including market quotations at year-end. N.N) INVENTORIES
Inventories are valuedmeasured in the consolidated financial statementsConsolidated Financial Statements at the lower of historical cost onor market value. Costs for petroleum and petrochemical products are determined according to the FIFO (First-In, First-Out) method and those of other inventories useare measured using the weighted-average cost method. Downstream (Refining –— Marketing) Petroleum product inventories are mainly comprised of crude oil and refined products. Refined products principally consist of gasoline, kerosene, diesel, fuel oil and heating oil and are produced by the Group’s refineries. The turnover of petroleum products does not exceed two months on average. Crude oil costs include raw material and receiving costs. Refining costs principally include the crude oil costs, production costs (energy, labor, depreciation of producing assets) and allocation of production overhead (taxes, maintenance, insurance, etc.). Start-up costs and general administrative costs are excluded from the cost pricecarrying amount of refined products. Chemicals Costs of chemical products inventories consist of raw material costs, direct labor costs and an allocation of production overhead. Start-up costs and general administrative costs are excluded from the cost of inventories of chemicals products. O.O) TREASURY SHARES
Treasury shares of the Companyparent company held by it on its subsidiaries or itself are deducted from consolidated shareholders’ equity. Gains or losses on sales of treasury shares are excluded from the determination of net income and are recognized in shareholders’ equity. P.P) PROVISIONS AND OTHER NON-CURRENT LIABILITIES
Non-currentProvisions and non-current liabilities compriseare comprised of liabilities for which the amount and the timing are uncertain. They arise from environmental risks, legal and tax risks, litigation and other risks.
A provision is recognized when the Group has a present obligation (legal or constructive) as a result of a past event for which it is probable that an outflow of resources will be required and when a reliable estimate can be made ofregarding the amount of the obligation. The amount of the liability corresponds to the best possible estimate. Q.Q) ASSET RETIREMENT OBLIGATIONS
Asset retirement obligations, which result from a legal or constructive obligation, are recognized based on the basis of a reasonable estimate of their fair value in the period in which the obligation arises. The associated asset retirement costs are capitalized as part of the carrying amount of the long-lived assetsunderlying asset and depreciated over the useful life of the associated long-livedthis asset. An entity is required to measure changesChanges in the liability for an asset retirement obligation due to the passage of time (accretion) are measured by applying a risk-free discount rate that reflects the time value of money to the amount of the liability at the beginning of the period.liability. The increase of the provision due to the passage of time is recognized as “Other financial expense”.
R.R) EMPLOYEE BENEFITS
In accordance with the laws and practices of each country, the Group participates in employee benefit plans offering retirement, death and disability, healthcare and special termination benefits. These plans provide benefits based on various factors such as length of service, salaries, and contributions made to the governmental bodies responsible for the payment of benefits. These plans can be either defined contribution or defined benefit pension plans and may be entirely or partially funded with investments made in various non-Group instruments such as mutual funds, insurance contracts, and others.other instruments. For defined contribution plans, expenses correspond to the contributions paid.are expensed as incurred. Defined benefit obligations are determined according to the Projected Unit Method. Actuarial gains and losses may arise from differences between actuarial valuation and projected commitments (depending on new calculations or assumptions) and between projected and actual return of plan assets. The Group applies the corridor method to amortize its actuarial gains and losses. This method amortizes the net cumulative actuarial gains and losses that exceed 10% of the greater of the present value of the defined benefit obligation and the fair value of plan assets, over the average expected remaining working lives of the employees participating in the plan. In case of a change in or creation of a plan, the vested portion of the cost of past services is recorded immediately in the statement of income, statement, and the unvested past service cost is amortized over the vesting period. The net periodic pension cost is recognized under “Other operating expenses”. S.S) CONSOLIDATED STATEMENT OF CASH FLOWSFLOW
The consolidated statement of cashCash flows prepared in foreign currencies has beenare translated into euros using the exchange rate on the transaction date or the average exchange rate offor the period. Currency translation differences arising from the translation of monetary assets and liabilities denominated in foreign currency into euros using the closing exchange rates at the end of the period
are shown in the balance sheetConsolidated Statement of Cash Flow under “Effect of exchange rates and changes in reporting entity”rates”. Therefore, the consolidated statementConsolidated Statement of cash flowsCash Flow will not agree with the figures derived from the consolidated balance sheet.Consolidated Balance Sheet. Cash and cash equivalents Cash and cash equivalents compriseare comprised of cash on hand and highly liquid short-term investments that are easily convertible into known amounts of cash and are subject to insignificant risks of changes in value. Investments with maturity greater than three months and less than twelve months are shown under “Current financial assets”. Changes in bank overdraftscurrent financial assets and liabilities are included in the financing activities section of the consolidated statementConsolidated Statement of cash flows.Cash Flow. Non-current financial debt Changes in non-current financial debt have been presented as thea net variation to reflect significant changes mainly related to revolving credit agreements. T.T) CARBON DIOXIDE EMISSION RIGHTS
In the absence of a current IFRS standard or interpretation on accounting for emission rights of CO2,carbon dioxide, the following principles have been applied: emission rights granted free of charge are accounted for at zero book value;carrying amount; the liabilities resulting from potential differences between available quotas and quotas to be delivered at the end of the compliance period are accounted for as liabilities and measured at fair market value;
spot market transactions are recognized in income at cost in operating income;cost; and forward transactions are recognized at their fair market value on the face of the balance sheet. Changes in the fair value of such forward transactions are recognized in operating income. U.U) NON-CURRENT ASSETS HELD FOR SALE AND DISCONTINUED OPERATIONS
Pursuant to IFRS 5 “Non-current assets held for sale and discontinued operations”, assets and liabilities of affiliates that are held for sale are presented separately on the face of the balance sheet. Net income from discontinued operations is presented separately on the face of the statement of income. Therefore, the Notesnotes to the Consolidated Financial Statements related to the statement of income only refer only to continuing operations. A discontinued operation is a component of the Group for which cash flows are independent. It represents a major line of business or geographical area of operations which has been disposed of or is currently being held for sale. V. INFORMATION RELATED TO THE FIRST-TIME APPLICATION OF IFRS
Pursuant to IFRS 1 “First-time adoption of International Financial Reporting Standards”, the Group has chosen to apply the following exemptions:
offsetting currency translation adjustment (CTA) against retained earnings, as of January 1, 2004;
recording unrecognized actuarial losses and gains related to employee benefit obligations as of January 1, 2004 in retained earnings;
no retroactive restatement of business combinations that occurred before January 1, 2004;
retrospective application of IFRS 2 “Share-based payment” to all transactions within the scope of IFRS 2 and not solely to the share-based compensation plans granted after November 7, 2002.
The other exemptions included in IFRS 1 “First time adoption” have not been applied at the transition date to the IFRS or did not have any material impact on the consolidated financial statements.
IAS 32 “Financial Instruments: Disclosure and Presentation” and IAS 39 “Financial Instruments: Recognition and Measurements” have been applied as from January 1, 2004. The Group has decided on an early application in 2004 of IFRS 6 “Exploration for and Evaluation of Mineral Resources”. This standard is compatible with previously used methods to record exploration and production costs (see paragraph H “Oil and gas exploration and producing properties” to this Note).
Description of the effects of the transition to IFRS on the net equity and the results of the Group were provided for in the Annual Report on Form 20-F for 2005. This information is presented in the Note 32 to the Consolidated Financial Statements as of December 31, 2005.
The financial data for 2004 and 2003 were presented under French GAAP in the 2004 Registration Document.
W.V) ALTERNATIVE IFRS METHODS
For measuring and recognizing assets and liabilities, the following choices among alternative methods permittedallowable under IFRS have been made: property, plant and equipment, and intangible assets are measured using historical cost model instead of revaluation model; interest expenseborrowing costs incurred during the construction and acquisition period of tangibleproperty, plant and equipment and intangible assets isare capitalized, as provided for under IAS 23 “Borrowing Costs”;
actuarial gains and losses on pension and other post-employment benefit obligations are recognized according to the corridor method as from January 1, 2004 (see paragraph R toof this Note); and jointly-controlled entities are consolidated using the proportionate method, as provided for in IAS 31 “Interests in Joint Ventures”joint ventures”. X.W) NEW ACCOUNTING PRINCIPLES NOT YET IN EFFECT
The standards or interpretations published respectively by the International Accounting Standards Board (IASB) and the International Financial Reporting Interpretations Committee (IFRIC) which were not yet in effect at December 31, 2006,2008, were as follows: Revised IAS 1 “Presentation of financial statements” (i) | IFRS 7 “Financial Instruments: disclosures” |
In August 2005,September 2007, the IASB issued IFRS 7 “Financial Instruments: Disclosures”a revised version of IAS 1 “Presentation of financial statements”. The newrevised standard replaces IAS 30 “Disclosures indeals with the presentation of financial statements and introduces the presentation of Banks and Similar Financial Institutions” and provides amendments to IAS 32 “Financial Instruments: Disclosure and Presentation”. IFRS 7 requires disclosure of qualitative and quantitative information about exposure to risks resulting from financial instruments. Entities shall apply IFRS 7 toa comprehensive income statement. It is effective for annual periods beginning on or after January 1, 2007.2009. The application of IFRS 7revised IAS 1 should not have any material impact for the Group given the disclosures already presented in the consolidated statementsConsolidated Financial Statements for the year ended December 31, 2006.2008. Revised IAS 23 “Borrowing costs” In March 2007, the IASB issued a revised version of IAS 23 “Borrowing costs”. Under the revised standard, an entity shall capitalize borrowing costs that are directly attributable to the acquisition or production of a qualifying asset. The revised standard is effective for annual periods beginning on or after January 1, 2009. The application of revised IAS 23 should not have any material impact on the Group’s balance sheet, income statement and shareholders’ equity, given that the Group has already applied this method (see paragraph V of this Note). (ii) | IFRS 8 “Operating segments” |
Revised IFRS 3 “Business Combinations” and revised IAS 27 “Consolidated and Separate Financial Statements” In January 2008, the IASB issued revised versions of IFRS 3 “Business Combinations” and IAS 27 “Consolidated and Separate Financial Statements”. These revised standards introduce new provisions regarding the accounting for business combinations. They are effective as of the first annual period starting after July 1, 2009 (i.e. as of January 1, 2010 for the Group). Their application is prospective. IFRS 8 “Operating segments” In November 2006, the IASB issued IFRS 8 “Operating segments”. The new standard replaces IAS 14 “Segment reporting”. It requires entities to adopt an approach based on internal information used by the management of the entity to determine reportable segments, whereas IAS 14 is based on segment risks and profitability. Entities shall apply IFRS 8 to annual periods beginning on or after January 1, 2009. The application of IFRS 8 should not have any material impact foron the Group given the disclosures already presentedpresentation of information by business segment in the consolidated financial statementsConsolidated Financial Statements of the Group. IFRIC 16 “Hedges of a Net Investment in a Foreign Operation” (iii)
| IFRIC 9 “Reassessment of Embedded Derivatives” |
In March 2006,July 2008, the IFRIC publishedissued interpretation IFRIC 9 “Reassessment16 “Hedges of Embedded Derivatives”a Net Investment in a Foreign Operation”. The interpretation addresses embedded derivatives withinprovides guidance on accounting for the scopehedge of a net investment in a foreign operation as defined by IAS 39 relating to Financial Instruments and their reassessment. IFRIC 9 concludes that an entity must assess whether an embedded derivative is required to be separated from the host contract and accounted for as a derivative when the entity first becomes a party to the contract. Subsequent reassessment is prohibited unless there is a significant change in the terms of the contract. IFRIC 939. The interpretation is effective for annual periods beginningstarting on or after JuneOctober 1, 2006.2008 (i.e.starting January 1, 2009 for the Group). The application of IFRIC 916 should not have any material effect on the Group’s consolidated balance sheet, statement of income statement or consolidated shareholder’sand shareholders’ equity. IFRIC 17 “Distributions of Non-cash Assets to Owners” (iv)
| IFRIC 10 “Interim Financial Reporting and Impairment” |
In July 2006,November 2008, the IFRIC publishedissued interpretation IFRIC 10 “Interim Financial Reporting17 “Distributions of Non-cash Assets to Owners”. The interpretation addresses the accounting of non-cash assets distributed among two entities which are not jointly-controlled. It provides that the dividend payable should be measured at the fair value of the net assets to be distributed and Impairment”. In accordancethat any difference with IFRIC 10, an entity shall not reverse an impairment lossthe carrying amount of the net assets distributed should be recognised in a previous interim period in respect of goodwillprofit or an investment in either an equity instrument or a financial asset carried at cost, in subsequent interim or annual period. IFRIC 10loss. The interpretation is effective for annual periods beginningstarting on or after NovemberJuly 1, 2006. 2009 (i.e. starting January 1, 2010 for the Group). The application of IFRIC 1017 should not have any material effect on the Group’s consolidated balance sheet, statement of income statement and consolidated shareholder’sshareholders’ equity. 2.2) MAIN INDICATORS -— INFORMATION BY BUSINESS SEGMENT
Performance indicators excluding the adjustment items, such as adjusted operating income, adjusted net operating income, and adjusted net income are meant to facilitate the analysis of the financial performance and the comparison of income between periods. Adjusting items:
Due to their unusual nature or particular significance, certain transactions qualified as “special items” are excluded from the business segment figures. In general, special items relate to transactions that are significant, and infrequent or unusual. However, in certain instances, transactions such as restructuring costs or assets disposals, which are not considered to be representative of the normal course of business, may be qualified as special items although they may have occurred within prior years or are likely to occur again within the coming years. | (ii) | The inventory valuation effect |
The adjusted results of the Downstream and ChemicalChemicals segments are also presented according to the replacement cost method. This method is used to assess the segments’ performance and ensure the comparability of the segments’ resultsperformance with those of itsthe Group’s competitors, mainly North-American. In the replacement cost method, which approximates the LIFO (Last-In, First-Out) method, the variation of inventory values in the statement of income statement is determined by the average prices of the period rather than the historical value. The inventory valuation effect is the difference between the results according to the FIFO (First-In, First-Out) and the replacement cost. | (iii) | PortionEquity share of amortization of intangible assets amortization related to the Sanofi-Aventis merger |
The detail of these adjustment items is presented in Note 4 to the Consolidated Financial Statements.
Operating income (measure used to evaluate operating performance)
| (i) | Operating income (measure used to evaluate operating performance) |
RevenueRevenues from sales after deducting cost of goods sold and inventory variations, other operating expenses, exploration expenses and depreciation, depletion, and amortization.
Operating income excludes the amortization and depreciation of intangible assets other than leasehold rights,mineral interests, currency translation adjustmentsadjustment and gains or losses on the saledisposal of assets. Net operating income (measure used to evaluate the return on capital employed)
| (ii) | Net operating income (measure used to evaluate the return on capital employed) |
Operating income after deductingtaking into account the amortization and the depreciation of intangible assets other than leasehold rights,mineral interests, currency translation adjustments andadjustment, gains or losses on the saledisposal of assets, as well as all other income and expenses related to capital employed (dividends from non-consolidated companies, equity in income inof affiliates, capitalized interest expenses), and after income taxes applicable to the above. The income and expense not included in net operating income which arebut included in net income are only interest expenses related to non-current liabilities net of interest earned on cash and cash equivalents,financial debt only, after applicable income taxes (net cost of net debt and minority interests). Adjusted income
Operating income, net operating income, or net income excluding the effect of adjustingadjustment items described above. Capital employed
Non-current assets and working capital, requirements, at replacement cost, net of deferred income taxes and non-current liabilities. ROACE (Return on Average Capital Employed)
| (v) | ROACE (Return on Average Capital Employed) |
Ratio of adjusted net operating income to average capital employed between the beginning and the end of the period. Net debt
Non-current debt, including current portion, current borrowings, other current financial liabilities less cash and cash equivalentequivalents and other current financial assets. 3.3) CHANGES IN THE GROUP STRUCTURE, MAIN ACQUISITIONS AND DIVESTMENTS
2008 Pursuant to the tender offer described in the prospectus on May 13, 2008 and renewed by the notices on June 19, July 4 and July 16, 2008, TOTAL acquired 100% of Synenco Energy Inc’s Class A ordinary shares. Synenco’s main asset is a 60% interest in the Northern Lights project in the Athabasca region of the Canadian province of Alberta. The acquisition cost, net of cash acquired (161 M€) for all shares amounted to 352 M€. This cost essentially represents the value of the company’s mineral interests that have been recognized as “Intangible assets, net” on the face of the Consolidated Balance Sheet for 221 M€. Synenco Energy Inc. is fully consolidated in TOTAL’s Consolidated Financial Statements. Its contribution to the consolidated net income for fiscal year 2008 is not material. In August, TOTAL acquired the Dutch company Goal Petroleum B.V. The acquisition cost amounted to 349 M€. This cost essentially represents the value of the company’s mineral interests that have been recognized as intangible assets on the face of the Consolidated Balance Sheet for 292 M€. Goal Petroleum B.V. is fully consolidated in TOTAL’s Consolidated Financial Statements. Its contribution to the consolidated net income for fiscal year 2008 is not material. Pursuant to the agreements signed between the partners in November, the Group’s interest in the Kashagan field decreased from 18.52% to 16.81% (see Note 32 to the Consolidated Financial Statements). During 2008, TOTAL progressively sold 1.68% of Sanofi-Aventis’ share capital, thus reducing its interest to 11.38%. Sanofi-Aventis is accounted for by the equity method in TOTAL’s Consolidated Financial Statements. 2007 The changes in TOTAL’s activities in Venezuela and their consequences in the Consolidated Financial Statements are presented in Note 32 “Other risks and contingent liabilities”. In December 2007, TOTAL completed the sale of its 70% interest in the Milford Haven Refinery in Wales (UK) to its partner Murco Petroleum Company. This operation will allow TOTAL to concentrate its UK refining operations at the wholly-owned Lindsey Oil Refinery. During the fourth quarter 2007, TOTAL progressively sold 0.4% of Sanofi-Aventis’ share capital, thus reducing its interest to 13.06%. Sanofi-Aventis is accounted for by the equity method in TOTAL’s Consolidated Financial Statements. 2006 After approval on October 13, 2006 by the European Commission, Banco Santander Central Hispano (Santander) sold 4.35% of CEPSA’s share | capital to TOTAL at a price of€4.54 per share, for a total transaction amount of approximately 53 M€. The transaction follows the agreement signed on August 2, 2006 by TOTAL and Santander to implement the provisions of the partial award rendered on March 24, 2006 by the Netherlands Arbitration Institute, which adjudicated the dispute concerning CEPSA. |
As a result, TOTAL now holds 48.83% of CEPSA. In 2004, TOTAL announced a reorganization of its ChemicalChemicals segment to regroup its chlorochemicals, intermediates and performance polymers in a new entity that was named Arkema on October 1, 2004. The shareholders’ meeting on May 12, 2006 approved a resolution related to the spin-off of Arkema and the distribution of Arkema shares to TOTAL shareholders. Pursuant to this approval, Arkema shares were publicly listed on May 18, 2006 on the Eurolist by Euronext exchangemarket in Paris. For all periods presented, the contribution of Arkema entities to the consolidated net income is presented on the line “Consolidated net“Net income from discontinued operations” on the face of the income statement.statement of income. Detailed information on the impact of this transaction is presented in Note 3234 to the Consolidated Financial Statements. 2005
Pursuant to its public offer and takeover bid circular dated August 5, 2005 and extended to September 2, 2005 TOTAL has acquired 78 % of Deer Creek Energy Ltd as of September 13, 2005. Its offer was extended in order to acquire the shares which had not been tendered. The acquisition of all ordinary shares was completed December 13, 2005.
Deer Creek Energy Ltd has an 84% interest in the Joslyn permit in the Athabasca region of the Canadian province of Alberta.
The acquisition cost, net of cash acquired (0.1 B€) for all shares amounts to 1.1 B€. This cost essentially
represents the value of the company’s leasehold rights that have been recognized as intangible assets on the face of the consolidated balance sheet for 1 B€.
Deer Creek Energy Ltd is fully consolidated in TOTAL’s consolidated financial statements. Its contribution to 2005 consolidated net income is not material.
2004
Following the outcome of a share and cash offer by Sanofi-Synthélabo for Aventis in 2004, the merger via takeover of Aventis, thereby creating the entity Sanofi-Aventis, was approved by the Sanofi-Aventis extraordinary shareholders’ meeting on December 23, 2004 and took effect on December 31, 2004.
The acquisition of Aventis by Sanofi-Synthélabo results in a dilution of the Group’s equity in the company. After deduction of Sanofi-Aventis’ own shares, the Group owns 13.25% of the capital of Sanofi-Aventis as of December 31, 2004 instead of 25.63% of the capital of Sanofi-Synthélabo as of December 31, 2003.
Sanofi-Aventis is consolidated in the Group accounts according to the equity method.
4.4) BUSINESS SEGMENT INFORMATION
Financial information by business segment is reported in accordance with the internal reporting system and shows internal segment information that is used to manage and measure the performance of TOTAL. The Group’s activities are conducted through three business segments: Upstream, Downstream and Chemicals. Thethe Upstream segment includes the explorationactivities of the Exploration & Production division and production of hydrocarbons, gas, power and other energies activities.the Gas & Power division;
Thethe Downstream segment includes refiningactivities of the Refining & Marketing division and marketing activities along with tradingthe Trading & Shipping division; and shipping activities.
The Chemicalthe Chemicals segment includes Base Chemicals and Specialties.
The Corporate segment includes the operating and financial activities of the holding companies as well as healthcare activitiesactivity (Sanofi-Aventis). The operational profit and assets are broken down by business segment prior to the consolidation and inter-segment adjustments. Sales prices between business segments approximate market prices. A.A) INFORMATION BY BUSINESS SEGMENT
| 2006 (M€) | | Upstream | | | Downstream | | | Chemicals | | | Corporate | | | Inter-company | | | Total | | | For the year ended December 31, 2008 (M€) | | | Upstream | | | Downstream | | | Chemicals | | | Corporate | | | Intercompany | | | Total | | Non-Group sales | | 20,782 | | | 113,887 | | | 19,113 | | | 20 | | | — | | | 153,802 | | | 24,256 | | | 135,524 | | | 20,150 | | | 46 | | | — | | | 179,976 | | Intersegment sales | | 20,603 | | | 4,927 | | | 1,169 | | | 177 | | | (26,876 | ) | | — | | | 25,132 | | | 5,574 | | | 1,252 | | | 120 | | | (32,078 | ) | | — | | Excise taxes | | — | | | (21,113 | ) | | — | | | — | | | — | | | (21,113 | ) | | — | | | (19,645 | ) | | — | | | — | | | — | | | (19,645 | ) | Revenues from sales | | 41,385 | | | 97,701 | | | 20,282 | | | 197 | | | (26,876 | ) | | 132,689 | | | 49,388 | | | 121,453 | | | 21,402 | | | 166 | | | (32,078 | ) | | 160,331 | | Operating expenses | | (17,759 | ) | | (93,209 | ) | | (18,706 | ) | | (706 | ) | | 26,876 | | | (103,504 | ) | | (21,915 | ) | | (119,425 | ) | | (20,942 | ) | | (685 | ) | | 32,078 | | | (130,889 | ) | Depreciation, depletion and amortization of tangible assets and leasehold rights | | (3,319 | ) | | (1,120 | ) | | (580 | ) | | (36 | ) | | — | | | (5,055 | ) | | Depreciation, depletion and amortization of tangible assets and mineral interests | | | (4,005 | ) | | (1,202 | ) | | (518 | ) | | (30 | ) | | — | | | (5,755 | ) | Operating income | | 20,307 | | | 3,372 | | | 996 | | | (545 | ) | | — | | | 24,130 | | | 23,468 | | | 826 | | | (58 | ) | | (549 | ) | | — | | | 23,687 | | Equity in income (loss) of affiliates and other items | | 1,211 | | | 384 | | | (298 | ) | | 797 | | | — | | | 2,094 | | | 1,541 | | | (158 | ) | | (34 | ) | | 590 | | | — | | | 1,939 | | Tax on net operating income | | (12,764 | ) | | (1,125 | ) | | (191 | ) | | 206 | | | — | | | (13,874 | ) | | (14,563 | ) | | (143 | ) | | 76 | | | 315 | | | — | | | (14,315 | ) | Net operating income | | 8,754 | | | 2,631 | | | 507 | | | 458 | | | — | | | 12,350 | | | 10,446 | | | 525 | | | (16 | ) | | 356 | | | — | | | 11,311 | | Net cost of net debt | | | | | | | | | | | | (210 | ) | | | | | | | | | | | | (358 | ) | Minority interests and dividends on subsidiaries’ redeemable preferred shares | | | (367 | ) | | | Net income from continuting operations Group share | | | | | | | | | | | | 11,773 | | | | Net income from discontinued operations Group share | | | (5 | ) | | Minority interests | | | (363 | ) | Net income from continuing operations | | | | | | | | | | | | | 10,590 | | Net income from discontinued operations | | | — | | Net income | | | 11,768 | | | 10,590 | |
| | | | | | | | | | | | | | | | | | For the year ended December 31, 2008
(adjustments)(a) (M€) | | Upstream | | | Downstream | | | Chemicals | | | Corporate | | | Intercompany | | Total | | Non-Group sales | | | | | | | | | | | | | | | | | | Intersegment sales | | | | | | | | | | | | | | | | | | Excise taxes | | | | | | | | | | | | | | | | | | Revenues from sales | | | | | | | | | | | | | | | | | | Operating expenses | | — | | | (2,776 | ) | | (925 | ) | | — | | | | | (3,701 | ) | Depreciation, depletion and amortization of tangible assets and mineral interests | | (171 | ) | | — | | | (6 | ) | | — | | | | | (177 | ) | Operating income(b) | | (171 | ) | | (2,776 | ) | | (931 | ) | | — | | | | | (3,878 | ) | Equity in income (loss) of affiliates and other items(c) | | (164 | ) | | (195 | ) | | (82 | ) | | (345 | ) | | | | (786 | ) | Tax on net operating income | | 57 | | | 927 | | | 329 | | | (2 | ) | | | | 1,311 | | Net operating income(b) | | (278 | ) | | (2,044 | ) | | (684 | ) | | (347 | ) | | | | (3,353 | ) | Net cost of net debt | | | | | | | | | | | | | | | | — | | Minority interests | | | | | | | | | | | | | | | | 23 | | Net income from continuing operations | | | | | | | | | | | | | | | | (3,330 | ) | Net income from discontinued operations | | | | | | | | | | | | | | | | — | | Net income | | | | | | | | | | | | | | | | (3,330 | ) |
| | | | | | | | | | | | | | | | | | 2006 (adjustments)* (M€) | | Upstream | | | Downstream | | | Chemicals | | | Corporate | | | Intercompany | | Total | | | Non-Group sales | | | | | | | | | | | | | | | | | | | Intersegment sales | | | | | | | | | | | | | | | | | | | Excise taxes | | | | | | | | | | | | | | | | | | Revenues from sales | | | | | | | | | | | | | | | | | | | Operating expenses | | — | | | (272 | ) | | (158 | ) | | (27 | ) | | | | (457 | ) | Depreciation, depletion and amortization of tangible assets and leasehold rights | | — | | | — | | | (61 | ) | | — | | | | | (61 | ) | Operating income(a) | | — | | | (272 | ) | | (219 | ) | | (27 | ) | | | | (518 | ) | Equity in income (loss) of affiliates and other items(b) | | 195 | | | 178 | | | (327 | ) | | (295 | ) | | | | (249 | ) | Tax on net operating income | | (150 | ) | | (59 | ) | | 169 | | | (5 | ) | | | | (45 | ) | Net operating income(a) | | 45 | | | (153 | ) | | (377 | ) | | (327 | ) | | | | (812 | ) | | Net cost of net debt | | | | | | | | | | | | | | | | — | | Minority interests and dividends on subsidiaries’ redeemable preferred shares | | | | | | | | | | | | | | | | 14 | | | Net income from continuing operations Group share | | | | | | | | | | | | | | | | (798 | ) | Net income from discontinued operations Group share | | | | | | | | | | | | | | | | (19 | ) | Net income | | | | | | | | | | | | | | | | (817 | ) |
*(a) | adjustments include special items, inventory valuation effect and equity share of amortization of intangible assets related to the Sanofi-Aventis merger. |
| | | | | | | | | | | | | | | | | (a) Of which inventory valuation effect | | | | | | | | | | | | | | | | On operating income | | — | | (272 | ) | | (42 | ) | | — | | | | | | On net operating income | | — | | (327 | ) | | (28 | ) | | — | | | | | | (b) Of which equity share of amortization of intangible assets related to Sanofi-Aventis | | — | | — | | | — | | | (311 | ) | | | | |
| | | | | | | | | | | | | | | | | | | 2006 (adjusted) (M€) | | Upstream | | | Downstream | | | Chemicals | | | Corporate | | | Intercompany | | | Total | | | Non-Group sales | | 20,782 | | | 113,887 | | | 19,113 | | | 20 | | | — | | | 153,802 | | | Intersegment sales | | 20,603 | | | 4,927 | | | 1,169 | | | 177 | | | (26,876 | ) | | — | | | Excise taxes | | — | | | (21,113 | ) | | — | | | — | | | — | | | (21,113 | ) | Revenues from sales | | 41,385 | | | 97,701 | | | 20,282 | | | 197 | | | (26,876 | ) | | 132,689 | | | Operating expenses | | (17,759 | ) | | (92,937 | ) | | (18,548 | ) | | (679 | ) | | 26,876 | | | (103,047 | ) | Depreciation, depletion and amortization of tangible assets and leasehold rights | | (3,319 | ) | | (1,120 | ) | | (519 | ) | | (36 | ) | | — | | | (4,994 | ) | Adjusted operating income | | 20,307 | | | 3,644 | | | 1,215 | | | (518 | ) | | — | | | 24,648 | | Equity in income (loss) of affiliates and other items | | 1,016 | | | 206 | | | 29 | | | 1,092 | | | — | | | 2,343 | | Tax on net operating income | | (12,614 | ) | | (1,066 | ) | | (360 | ) | | 211 | | | — | | | (13,829 | ) | Adjusted net operating income | | 8,709 | | | 2,784 | | | 884 | | | 785 | | | — | | | 13,162 | | | Net cost of net debt | | | | | | | | | | | | | | | | | (210 | ) | Minority interests and dividends on subsidiaries’ redeemable preferred shares | | | | | | | | | | | | | | | | | (381 | ) | | Adjusted net income from continuing operations Group share | | | | | | | | | | | | | | | | | 12,571 | | Adjusted net income from discontinued operations Group share | | | | | | | | | | | | | | | | | 14 | | Adjusted net income | | | | | | | | | | | | | | | | | 12,585 | |
| | | | | | | | | | | | | | | | | | | 2006(M€) | | Upstream | | | Downstream | | | Chemicals | | | Corporate | | | Intercompany | | Total | | | Total expenditures | | 9,001 | | | 1,775 | | | 995 | | | 81 | | | | | 11,852 | | | Divestments at sale price | | 1,458 | | | 428 | | | 128 | | | 264 | | | | | 2,278 | | Cash flow from operating activities | | 11,524 | | | 3,626 | | | 972 | | | (61 | ) | | | | 16,061 | | | | | | | | | | | | | | | | | | | | | | Balance Sheet as of December 31, 2006 | | | | | | | | | | | | | | | | | | | Property, plant and equipment, | | 31,875 | | | 8,211 | | | 4,983 | | | 212 | | | | | 45,281 | | intangible assets, net | | | | | | | | | | | | | | | | | | | Investments in equity affiliates | | 2,153 | | | 1,922 | | | 713 | | | 7,010 | | | | | 11,798 | | Loans to equity affiliates and other non-current assets | | 2,744 | | | 1,065 | | | 477 | | | 585 | | | | | 4,871 | | | Working capital | | 199 | | | 6,067 | | | 2,609 | | | (78 | ) | | | | 8,797 | | Provisions and other non-current liabilities | | (11,427 | ) | | (2,093 | ) | | (1,807 | ) | | (1,052 | ) | | | | (16,379 | ) | Capital Employed (Balance Sheet) | | 25,544 | | | 15,172 | | | 6,975 | | | 6,677 | | | | | 54,368 | | Less inventory valuation effect | | — | | | (2,789 | ) | | (231 | ) | | 738 | | | | | (2,282 | ) | | Capital Employed (Business segment information) | | 25,544 | | | 12,383 | | | 6,744 | | | 7,415 | | | | | 52,086 | | ROACE as a percentage (of continuting operations) | | 35% | | | 23% | | | 13% | | | | | | | | 26% | |
| | | | | | | | | | | | | | | | | | | 2005 (M€) | | Upstream | | | Downstream | | | Chemicals | | | Corporate | | | Intercompany | | | Total | | | Non-Group sales | | 20,888 | | | 99,934 | | | 16,765 | | | 20 | | | — | | | 137,607 | | | Intersegment sales | | 19,139 | | | 4,293 | | | 602 | | | 170 | | | (24,204 | ) | | — | | | Excise taxes | | — | | | (20,550 | ) | | — | | | — | | | — | | | (20,550 | ) | | Revenues from sales | | 40,027 | | | 83,677 | | | 17,367 | | | 190 | | | (24,204 | ) | | 117,057 | | | Operating expenses | | (18,275 | ) | | (77,517 | ) | | (15,669 | ) | | (624 | ) | | 24,204 | | | (87,881 | ) | Depreciation, depletion and amortization of tangible assets and leasehold rights | | (3,331 | ) | | (1,064 | ) | | (579 | ) | | (33 | ) | | — | | | (5,007 | ) | | Operating income | | 18,421 | | | 5,096 | | | 1,119 | | | (467 | ) | | — | | | 24,169 | | | Equity in income (loss) of affiliates and other items | | 587 | | | 422 | | | (348 | ) | | 367 | | | — | | | 1,028 | | | Tax on net operating income | | (10,979 | ) | | (1,570 | ) | | (170 | ) | | 819 | | | — | | | (11,900 | ) | | Net operating income | | 8,029 | | | 3,948 | | | 601 | | | 719 | | | — | | | 13,297 | | | Net cost of net debt | | | | | | | | | | | | | | | | | (193 | ) | Minority interests and dividends on subsidiaries’ redeemable preferred shares | | | | | | | | | | | | | | | | | (373 | ) | | Net income from continuing operations Group share | | | | | | | | | | | | | | | | | 12,731 | | Net income from discontinued operations Group share | | | | | | | | | | | | | | | | | (458 | ) | Net income | | | | | | | | | | | | | | | | | 12,273 | |
| | | | | | | | | | | | | | | | | 2005 (adjustments)* (M€) | | Upstream | | Downstream | | | Chemicals | | | Corporate | | | Intercompany | | Total | | | Non-Group sales | | | | | | | | | | | | | | | | | | Intersegment sales | | | | | | | | | | | | | | | | | | Excise taxes | | | | | | | | | | | | | | | | | | Revenues from sales | | | | | | | | | | | | | | | | | | Operating expenses(a) | | — | | 1,197 | | | 49 | | | — | | | | | 1,246 | | Depreciation, depletion and amortization of tangible assets and leasehold rights | | — | | — | | | (78 | ) | | — | | | | | (78 | ) | | Operating income | | — | | 1,197 | | | (29 | ) | | — | | | | | 1,168 | | | Equity in income (loss) of affiliates and other items(a)(b) | | — | | 76 | | | (386 | ) | | (545 | ) | | | | (855 | ) | | Tax on net operating income | | — | | (241 | ) | | 49 | | | 590 | | | | | 398 | | | Net operating income | | — | | 1,032 | | | (366 | ) | | 45 | | | | | 711 | | | Net cost of net debt | | | | | | | | | | | | | | | — | | Minority interests and dividends on subsidiaries’ redeemable preferred shares | | | | | | | | | | | | | | | (8 | ) | | Net income from continuing operations Group share | | | | | | | | | | | | | | | 703 | | | Net income from discontinued operations Group share | | | | | | | | | | | | | | | (433 | ) | Net income | | | | | | | | | | | | | | | 270 | |
| | | | | | | | | | | | | | | | *(b) Of which inventory valuation effect | | | | | | | | | | | | | | | | On operating income | | — | | (2,776 | adjustments include special items, inventory valuation effect and) | | (727 | ) | | — | | | | | | On net operating income | | — | | (1,971 | ) | | (504 | ) | | — | | | | | | (c) Of which equity share of amortization of intangible assets related to the Sanofi-Aventis merger. | | — | | — | | | — | | | (393 | ) | | | | |
| | | | | | | | | | | | | | (a) Of which inventory valuation effect | | | | | | | | | | | | | | On operating income | | — | | 1,197 | | 68 | | — | | | | | | On net operating income | | — | | 1,032 | | 50 | | — | | | | | | (b) Of which equity share of amortization of intangible assets related to Sanofi-Aventis | | — | | — | | — | | (337 | ) | | | | |
| | | | | | | | | | | | | | | | | | | For the year ended December 31, 2008 (adjusted) (M€) | | Upstream | | | Downstream | | | Chemicals | | | Corporate | | | Intercompany | | | Total | | Non-Group sales | | 24,256 | | | 135,524 | | | 20,150 | | | 46 | | | — | | | 179,976 | | Intersegment sales | | 25,132 | | | 5,574 | | | 1,252 | | | 120 | | | (32,078 | ) | | — | | Excise taxes | | — | | | (19,645 | ) | | — | | | — | | | — | | | (19,645 | ) | Revenues from sales | | 49,388 | | | 121,453 | | | 21,402 | | | 166 | | | (32,078 | ) | | 160,331 | | Operating expenses | | (21,915 | ) | | (116,649 | ) | | (20,017 | ) | | (685 | ) | | 32,078 | | | (127,188 | ) | Depreciation, depletion and amortization of tangible assets and mineral interests | | (3,834 | ) | | (1,202 | ) | | (512 | ) | | (30 | ) | | — | | | (5,578 | ) | Adjusted operating income | | 23,639 | | | 3,602 | | | 873 | | | (549 | ) | | — | | | 27,565 | | Equity in income (loss) of affiliates and other items | | 1,705 | | | 37 | | | 48 | | | 935 | | | — | | | 2,725 | | Tax on net operating income | | (14,620 | ) | | (1,070 | ) | | (253 | ) | | 317 | | | — | | | (15,626 | ) | Adjusted net operating income | | 10,724 | | | 2,569 | | | 668 | | | 703 | | | — | | | 14,664 | | Net cost of net debt | | | | | | | | | | | | | | | | | (358 | ) | Minority interests | | | | | | | | | | | | | | | | | (386 | ) | Adjusted net income from continuing operations | | | | | | | | | | | | | | | | | 13,920 | | Adjusted net income from discontinued operations | | | | | | | | | | | | | | | | | — | | Adjusted net income | | | | | | | | | | | | | | | | | 13,920 | |
| | | | | | | | | | | | | | | | | | | 2005 (adjusted) (M€) | | Upstream | | | Downstream | | | Chemicals | | | Corporate | | | Intercompany | | | Total | | | Non-Group sales | | 20,888 | | | 99,934 | | | 16,765 | | | 20 | | | — | | | 137,607 | | | Intersegment sales | | 19,139 | | | 4,293 | | | 602 | | | 170 | | | (24,204 | ) | | — | | | Excise taxes | | — | | | (20,550 | ) | | — | | | — | | | — | | | (20,550 | ) | | Revenues from sales | | 40,027 | | | 83,677 | | | 17,367 | | | 190 | | | (24,204 | ) | | 117,057 | | | Operating expenses | | (18,275 | ) | | (78,714 | ) | | (15,718 | ) | | (624 | ) | | 24,204 | | | (89,127 | ) | Depreciation, depletion and amortization of tangible assets and leasehold rights | | (3,331 | ) | | (1,064 | ) | | (501 | ) | | (33 | ) | | — | | | (4,929 | ) | | Adjusted operating income | | 18,421 | | | 3,899 | | | 1,148 | | | (467 | ) | | — | | | 23,001 | | | Equity in income (loss) of affiliates and other items | | 587 | | | 346 | | | 38 | | | 912 | | | — | | | 1,883 | | | Tax on net operating income | | (10,979 | ) | | (1,329 | ) | | (219 | ) | | 229 | | | — | | | (12,298 | ) | | Adjusted net operating income | | 8,029 | | | 2,916 | | | 967 | | | 674 | | | — | | | 12,586 | | | Net cost of net debt | | | | | | | | | | | | | | | | | (193 | ) | Minority interests and dividends on subsidiaries’ redeemable preferred shares | | | | | | | | | | | | | | | | | (365 | ) | | Adjusted net income from continuing operations Group share | | | | | | | | | | | | | | | | | 12,028 | | | Adjusted net income from discontinued operations Group share | | | | | | | | | | | | | | | | | (25 | ) | | Adjusted net income | | | | | | | | | | | | | | | | | 12,003 | |
| | | | | | | | | | | | | | | | | | | For the year ended December 31, 2008(M€) | | Upstream | | | Downstream | | | Chemicals | | | Corporate | | | Intercompany | | Total | | Total expenditures | | 10,017 | | | 2,418 | | | 1,074 | | | 131 | | | | | 13,640 | | Total divestments | | 1,130 | | | 216 | | | 53 | | | 1,186 | | | | | 2,585 | | Cash flow from operating activities | | 13,765 | | | 3,111 | | | 920 | | | 873 | | | | | 18,669 | | Balance sheet as of December 31, 2008 | | | | | | | | | | | | | | | | | | Property, plant and equipment, intangible assets, net | | 37,090 | | | 8,823 | | | 5,323 | | | 247 | | | | | 51,483 | | Investments in equity affiliates | | 3,892 | | | 1,958 | | | 677 | | | 6,134 | | | | | 12,661 | | Loans to equity affiliates and other non-current assets | | 3,739 | | | 1,170 | | | 762 | | | 545 | | | | | 6,216 | | Working capital | | 570 | | | 5,317 | | | 2,348 | | | (132 | ) | | | | 8,103 | | Provisions and other non-current liabilities | | (12,610 | ) | | (2,191 | ) | | (1,903 | ) | | (1,138 | ) | | | | (17,842 | ) | Capital Employed (balance sheet) | | 32,681 | | | 15,077 | | | 7,207 | | | 5,656 | | | | | 60,621 | | Less inventory valuation effect | | — | | | (1,454 | ) | | (46 | ) | | 387 | | | | | (1,113 | ) | Capital Employed (Business
segment information) | | 32,681 | | | 13,623 | | | 7,161 | | | 6,043 | | | | | 59,508 | | ROACE as a percentage
(of continuing operations) | | 36 | % | | 20 | % | | 9 | % | | | | | | | 26 | % |
| | | | | | | | | | | | | | | | | | 2005 (M€) | | Upstream | | | Downstream | | | Chemicals | | | Corporate | | | Intercompany | | Total | | | Total expenditures | | 8,111 | | | 1,779 | | | 1,115 | | | 190 | | | | | 11,195 | | | Divestments at sale price | | 692 | | | 204 | | | 59 | | | 133 | | | | | 1,088 | | | Cash flow from operating activities | | 10,111 | | | 2,723 | | | 946 | | | 889 | | | | | 14,669 | | | Balance Sheet as of December 31, 2005 | | | | | | | | | | | | | | | | | | Property, plant and equipment, intangible assets, net | | 30,140 | | | 8,016 | | | 6,567 | | | 229 | | | | | 44,952 | | | Investments in equity affiliates | | 1,958 | | | 1,575 | | | 733 | | | 7,087 | | | | | 11,353 | | Loans to equity affiliates and other non-current assets | �� | 2,673 | | | 1,386 | | | 848 | | | 702 | | | | | 5,609 | | | Working capital | | (432 | ) | | 6,035 | | | 3,927 | | | 96 | | | | | 9,626 | | | Provisions and other non-current liabilities | | (10,817 | ) | | (2,409 | ) | | (2,827 | ) | | (1,387 | ) | | | | (17,440 | ) | | Capital Employed (Balance Sheet) | | 23,522 | | | 14,603 | | | 9,248 | | | 6,727 | | | | | 54,100 | | | Less inventory valuation effect | | — | | | (3,182 | ) | | (261 | ) | | 786 | | | | | (2,657 | ) | Capital Employed (Business segment information) | | 23,522 | | | 11,421 | | | 8,987 | | | 7,513 | | | | | 51,443 | | ROACE as a percentage (of continuting operations) | | 40% | | | 28% | | | 15% | | | | | | | | 29% | |
| | | | | | | | | | | | | | | | | | | For the year ended December 31, 2007
(M€) | | Upstream | | | Downstream | | | Chemicals | | | Corporate | | | Intercompany | | | Total | | Non-Group sales | | 19,706 | | | 119,212 | | | 19,805 | | | 29 | | | — | | | 158,752 | | Intersegment sales | | 21,173 | | | 5,125 | | | 1,190 | | | 181 | | | (27,669 | ) | | — | | Excise taxes | | — | | | (21,928 | ) | | — | | | — | | | — | | | (21,928 | ) | Revenues from sales | | 40,879 | | | 102,409 | | | 20,995 | | | 210 | | | (27,669 | ) | | 136,824 | | Operating expenses | | (17,697 | ) | | (96,367 | ) | | (19,076 | ) | | (627 | ) | | 27,669 | | | (106,098 | ) | Depreciation, depletion and amortization of tangible assets and mineral interests | | (3,679 | ) | | (1,218 | ) | | (495 | ) | | (33 | ) | | — | | | (5,425 | ) | Operating income | | 19,503 | | | 4,824 | | | 1,424 | | | (450 | ) | | — | | | 25,301 | | Equity in income (loss) of affiliates and other items | | 1,330 | | | 284 | | | (11 | ) | | 745 | | | — | | | 2,348 | | Tax on net operating income | | (11,996 | ) | | (1,482 | ) | | (426 | ) | | 128 | | | — | | | (13,776 | ) | Net operating income | | 8,837 | | | 3,626 | | | 987 | | | 423 | | | — | | | 13,873 | | Net cost of net debt | | | | | | | | | | | | | | | | | (338 | ) | Minority interests | | | | | | | | | | | | | | | | | (354 | ) | Net income from continuing operations | | | | | | | | | | | | | | | | | 13,181 | | Net income from discontinued operations | | | | | | | | | | | | | | | | | — | | Net income | | | | | | | | | | | | | | | | | 13,181 | |
| 2004 (M€) | | Upstream | | Downstream | | Chemicals | | Corporate | | Intercompany | | Total | | | For the year ended December 31, 2007
(M€) (adjustments)(a) | | | Upstream | | Downstream | | Chemicals | | Corporate | | Intercompany | | Total | | | Non-Group sales | | 15,037 | | | 86,896 | | | 14,886 | | | 23 | | | — | | | 116,842 | | | | | | | | | | | | | | | Intersegment sales | | 14,208 | | | 2,836 | | | 466 | | | 183 | | | (17,693 | ) | | — | | | | | | | | | | | | | | | Excise taxes | | | (21,517 | ) | | — | | | (21,517 | ) | | | Revenues from sales | | 29,245 | | | 68,215 | | | 15,352 | | | 206 | | | (17,693 | ) | | 95,325 | | | | Operating expenses | | (13,213 | ) | | (63,524 | ) | | (13,636 | ) | | (524 | ) | | 17,693 | | | (73,204 | ) | | (11 | ) | | 1,580 | | | 273 | | | — | | | | | 1,842 | | Depreciation, depletion and amortization of tangible assets and leasehold rights | | (3,188 | ) | | (1,053 | ) | | (823 | ) | | (31 | ) | | — | | | (5,095 | ) | | Depreciation, depletion and amortization of tangible assets and mineral interests | | | — | | | (43 | ) | | (4 | ) | | — | | | (47 | ) | Operating income | | 12,844 | | | 3,638 | | | 893 | | | (349 | ) | | — | | | 17,026 | | | (11 | ) | | 1,537 | | | 269 | | | — | | | 1,795 | | Equity in income (loss) of affiliates and other items | | 148 | | | 95 | | | (170 | ) | | 3,477 | | | — | | | 3,550 | | | (4 | ) | | 24 | | | (54 | ) | | (225 | ) | | | | (259 | ) | | Tax on net operating income | | (7,281 | ) | | (1,131 | ) | | (73 | ) | | (152 | ) | | — | | | (8,637 | ) | | 3 | | | (470 | ) | | (75 | ) | | (2 | ) | | (544 | ) | Net operating income | | 5,711 | | | 2,602 | | | 650 | | | 2,976 | | | — | | | 11,939 | | | (12 | ) | | 1,091 | | | 140 | | | (227 | ) | | 992 | | | Net cost of net debt | | | | | | | | | | | | (92 | ) | | | | | | | | | | | | — | | Minority interests and dividends on subsidiaries’ redeemable preferred shares | | | (284 | ) | | Net income from continuing operations Group share | | | | | | | | | | | | 11,563 | | | Net income from discontinued operations Group share | | | (695 | ) | | Minority interests | | | (14 | ) | Net income from continuing operations | | | | | | | | | | | | | 978 | | Net income from discontinued operations | | | — | | | Net income | | | 10,868 | | | 978 | |
| | | | | | | | | | | | | | | | | | 2004 (adjustments)* (M€) | | Upstream | | | Downstream | | | Chemicals | | | Corporate | | | Intercompany | | Total | | Non-Group sales | | | | | | | | | | | | | | | | | | Intersegment sales | | | | | | | | | | | | | | | | | | Excise taxes | | | | | | | | | | | | | | | | | | Revenues from sales | | | | | | | | | | | | | | | | | | Operating expenses(a) | | — | | | 437 | | | 232 | | | — | | | | | 669 | | Depreciation, depletion and amortization of tangible assets and leasehold rights | | — | | | (34 | ) | | (299 | ) | | — | | | | | (333 | ) | Operating income | | — | | | 403 | | | (67 | ) | | — | | | | | 336 | | Equity in income (loss) of affiliates and other items(a)(b) | | (172 | ) | | (3 | ) | | (309 | ) | | 2,805 | | | | | 2,321 | | Tax on net operating income | | 24 | | | (129 | ) | | 90 | | | (392 | ) | | | | (407 | ) | Net operating income | | (148 | ) | | 271 | | | (286 | ) | | 2,413 | | | | | 2,250 | | Net cost of net debt | | | | | | | | | | | | | | | | — | | Minority interests and dividends on subsidiaries’ redeemable preferred shares | | | | | | | | | | | | | | | | (12 | ) | Net income from continuing operations Group share | | | | | | | | | | | | | | | | 2,238 | | Net income from discontinued operations Group share | | | | | | | | | | | | | | | | (501 | ) | Net income | | | | | | | | | | | | | | | | 1,737 | |
*(a) | adjustments include special items, inventory valuation effect and equity share of amortization of intangible assets related to the Sanofi-Aventis merger. |
| | | | | | | | | | | | | | (a) Of which inventory valuation effect | | | | | | | | | | | | | | On operating income | | — | | 487 | | 232 | | — | | | | | | On net operating income | | — | | 349 | | 157 | | — | | | | | | (b) Of which equity share of amortization of intangible assets related to Sanofi-Aventis | | — | | — | | — | | (114 | ) | | | | |
| | | | | | | | | | | | | | (b) Of which inventory valuation effect | | | | | | | | | | | | | | on operating income | �� | — | | 1,529 | | 301 | | — | | | | | | on net operating income | | — | | 1,098 | | 201 | | — | | | | | | (c) Of which equity share of amortization of intangible
assets related to the Sanofi-Aventis merger. | | — | | — | | — | | (318 | ) | | | | |
| | | | | | | | | | | | | | | | | | | 2004(M€) (adjusted) | | Upstream | | | Downstream | | | Chemicals | | | Corporate | | | Intercompany | | | Total | | | Non-Group sales | | 15,037 | | | 86,896 | | | 14,886 | | | 23 | | | — | | | 116,842 | | | Intersegment sales | | 14,208 | | | 2,836 | | | 466 | | | 183 | | | (17,693 | ) | | | | | Excise taxes | | — | | | (21,517 | ) | | — | | | — | | | — | | | (21,517 | ) | | Revenues from sales | | 29,245 | | | 68,215 | | | 15,352 | | | 206 | | | (17,693 | ) | | 95,325 | | | Operating expenses | | (13,213 | ) | | (63,961 | ) | | (13,868 | ) | | (524 | ) | | 17,693 | | | (73,873 | ) | Depreciation, depletion and amortization of tangible assets and leasehold rights | | (3,188 | ) | | (1,019 | ) | | (524 | ) | | (31 | ) | | — | | | (4,762 | ) | Adjusted operating income | | 12,844 | | | 3,235 | | | 960 | | | (349 | ) | | — | | | 16,690 | | | Equity in income (loss) of affiliates and other | | | | | | | | | | | | | | | | | | | | items | | 320 | | | 98 | | | 139 | | | 672 | | | — | | | 1,229 | | Tax on net operating income | | (7,305 | ) | | (1,002 | ) | | (163 | ) | | 240 | | | — | | | (8,230 | ) | Adjusted net operating income | | 5,859 | | | 2,331 | | | 936 | | | 563 | | | — | | | 9,689 | | | Net cost of net debt | | | | | | | | | | | | | | | | | (92 | ) | | | | | | | | Minority interests and dividends on subsidiaries’ redeemable preferred shares | | | | | | | | | | | | | | | | | (272 | ) | | Adjusted net income from continuingoperationsGroup share | | | | | | | | | | | | | | | | | 9,325 | | Adjusted net income from discontinued operations Group share | | | | | | | | | | | | | | | | | (194 | ) | Adjusted net income | | | | | | | | | | | | | | | | | 9,131 | | | | | | | | | | | | | | | | | | | | | | | 2004(M€) | | Upstream | | | Downstream | | | Chemicals | | | Corporate | | | Intercompany | | | Total | | | Total expenditures | | 6,202 | | | 1,675 | | | 949 | | | 78 | | | | | | 8,904 | | | Divestments at sale price | | 637 | | | 200 | | | 122 | | | 233 | | | | | | 1,192 | | | Cash flow from operating activities | | 10,347 | | | 3,269 | | | 600 | | | 446 | | | | | | 14,662 | | | | | | | | | | | | | | | | | | | | | | | Balance Sheet as of December 31, 2004 | | | | | | | | | | | | | | | | | | | Property, plant and equipment, intangible assets, net | | 24,249 | | | 7,466 | | | 6,146 | | | 221 | | | | | | 38,082 | | | Investments in equity affiliates | | 1,455 | | | 1,347 | | | 589 | | | 6,412 | | | | | | 9,803 | | Loans to equity affiliates and other non-current assets | | 1,865 | | | 1,064 | | | 791 | | | 706 | | | | | | 4,426 | | | Working capital | | (1,665 | ) | | 3,870 | | | 3,436 | | | 142 | | | | | | 5,783 | | | Provisions and other non-current liabilities | | (9,624 | ) | | (2,347 | ) | | (2,610 | ) | | (1,702 | ) | | | | | (16,283 | ) | Capital Employed (Balance Sheet) | | 16,280 | | | 11,400 | | | 8,352 | | | 5,779 | | | | | | 41,811 | | Less inventory valuation effect | | — | | | (1,746 | ) | | (199 | ) | | 404 | | | | | | (1,541 | ) | Capital Employed (Business segment information) | | 16,280 | | | 9,654 | | | 8,153 | | | 6,183 | | | | | | 40,270 | | ROACE as a percentage (of continuing operations) | | 36% | | | 25% | | | 15% | | | | | | | | | 26% | |
| | | | | | | | | | | | | | | | | | | For the year ended December 31, 2007
(adjusted)(M€) | | Upstream | | | Downstream | | | Chemicals | | | Corporate | | | Intercompany | | | Total | | Non-Group sales | | 19,706 | | | 119,212 | | | 19,805 | | | 29 | | | — | | | 158,752 | | Intersegment sales | | 21,173 | | | 5,125 | | | 1,190 | | | 181 | | | (27,669 | ) | | — | | Excise taxes | | — | | | (21,928 | ) | | — | | | — | | | — | | | (21,928 | ) | Revenues from sales | | 40,879 | | | 102,409 | | | 20,995 | | | 210 | | | (27,669 | ) | | 136,824 | | Operating expenses | | (17,686 | ) | | (97,947 | ) | | (19,349 | ) | | (627 | ) | | 27,669 | | | (107,940 | ) | Depreciation, depletion and amortization of tangible assets and mineral interests | | (3,679 | ) | | (1,175 | ) | | (491 | ) | | (33 | ) | | — | | | (5,378 | ) | Adjusted operating income | | 19,514 | | | 3,287 | | | 1,155 | | | (450 | ) | | — | | | 23,506 | | Equity in income (loss) of affiliates and other items | | 1,334 | | | 260 | | | 43 | | | 970 | | | — | | | 2,607 | | Tax on net operating income | | (11,999 | ) | | (1,012 | ) | | (351 | ) | | 130 | | | — | | | (13,232 | ) | Adjusted net operating income | | 8,849 | | | 2,535 | | | 847 | | | 650 | | | — | | | 12,881 | | Net cost of net debt | | | | | | | | | | | | | | | | | (338 | ) | Minority interests | | | | | | | | | | | | | | | | | (340 | ) | Adjusted net income from continuing operations | | | | | | | | | | | | | | | | | 12,203 | | Adjusted net income from discontinued operations | | | | | | | | | | | | | | | | | — | | Adjusted net income | | | | | | | | | | | | | | | | | 12,203 | |
| | | | | | | | | | | | | | | | | | For the year ended December 31, 2007
(M€) | | Upstream | | | Downstream | | | Chemicals | | | Corporate | | | Intercompany | | Total | | Capital expenditures | | 8,882 | | | 1,875 | | | 911 | | | 54 | | | | | 11,722 | | Divestments at selling price | | 751 | | | 394 | | | 83 | | | 328 | | | | | 1,556 | | Cash flow from operating activities | | 12,692 | | | 4,148 | | | 1,096 | | | (250 | ) | | | | 17,686 | | Balance sheet as of December 31,
2007 | | | | | | | | | | | | | | | | | | Property, plant and equipment, intangible assets, net | | 32,535 | | | 8,308 | | | 5,061 | | | 213 | | | | | 46,117 | | Investments in equity affiliates | | 3,021 | | | 2,105 | | | 728 | | | 6,851 | | | | | 12,705 | | Loans to equity affiliates and other non-current assets | | 3,748 | | | 1,183 | | | 456 | | | 634 | | | | | 6,021 | | Working capital | | (94 | ) | | 6,811 | | | 2,774 | | | 506 | | | | | 9,997 | | Provisions and other non-current liabilities | | (12,147 | ) | | (2,018 | ) | | (1,697 | ) | | (1,441 | ) | | | | (17,303 | ) | Capital Employed (balance sheet) | | 27,063 | | | 16,389 | | | 7,322 | | | 6,763 | | | | | 57,537 | | Less inventory valuation effect | | — | | | (4,198 | ) | | (424 | ) | | 1,112 | | | | | (3,510 | ) | Capital Employed (Business segment information) | | 27,063 | | | 12,191 | | | 6,898 | | | 7,875 | | | | | 54,027 | | ROACE as a percentage (of continuing operations) | | 34% | | | 21% | | | 12% | | | | | | | | 24% | |
| | | | | | | | | | | | | | | | | | | For the year ended December 31, 2006
(M€) | | Upstream | | | Downstream | | | Chemicals | | | Corporate | | | Intercompany | | | Total | | Non-Group sales | | 20,782 | | | 113,887 | | | 19,113 | | | 20 | | | — | | | 153,802 | | Intersegment sales | | 20,603 | | | 4,927 | | | 1,169 | | | 177 | | | (26,876 | ) | | — | | Excise taxes | | — | | | (21,113 | ) | | — | | | — | | | — | | | (21,113 | ) | Revenues from sales | | 41,385 | | | 97,701 | | | 20,282 | | | 197 | | | (26,876 | ) | | 132,689 | | Operating expenses | | (17,759 | ) | | (93,209 | ) | | (18,706 | ) | | (706 | ) | | 26,876 | | | (103,504 | ) | Depreciation, depletion and amortization of tangible assets and mineral interests | | (3,319 | ) | | (1,120 | ) | | (580 | ) | | (36 | ) | | — | | | (5,055 | ) | Operating income | | 20,307 | | | 3,372 | | | 996 | | | (545 | ) | | — | | | 24,130 | | Equity in income (loss) of affiliates and other items | | 1,211 | | | 384 | | | (298 | ) | | 797 | | | — | | | 2,094 | | Tax on net operating income | | (12,764 | ) | | (1,125 | ) | | (191 | ) | | 206 | | | — | | | (13,874 | ) | Net operating income | | 8,754 | | | 2,631 | | | 507 | | | 458 | | | — | | | 12,350 | | Net cost of net debt | | | | | | | | | | | | | | | | | (210 | ) | Minority interests | | | | | | | | | | | | | | | | | (367 | ) | Net income from continuing operations | | | | | | | | | | | | | | | | | 11,773 | | Net income from discontinued operations | | | | | | | | | | | | | | | | | (5 | ) | Net income | | | 11,768 | |
| | | | | | | | | | | | | | | | | | For the year ended December 31, 2006
(adjustments)(a) (M€) | | Upstream | | | Downstream | | | Chemicals | | | Corporate | | | Intercompany | | Total | | | | | | | | | | | | | | | | Non-Group sales | | | | | | | | | | | | | | | | | | Intersegment sales | | | | | | | | | | | | | | | | | | Excise taxes | | | | | | | | | | | | | | | | | | Revenues from sales | | | | | | | | | | | | | | | | | | Operating expenses | | — | | | (272 | ) | | (158 | ) | | (27 | ) | | | | (457 | ) | Depreciation, depletion and amortization of tangible assets and mineral interests | | — | | | — | | | (61 | ) | | — | | | | | (61 | ) | Operating income(b) | | — | | | (272 | ) | | (219 | ) | | (27 | ) | | | | (518 | ) | Equity in income (loss) of affiliates and other items(c) | | 195 | | | 178 | | | (327 | ) | | (295 | ) | | | | (249 | ) | Tax on net operating income | | (150 | ) | | (59 | ) | | 169 | | | (5 | ) | | | | (45 | ) | Net operating income(b) | | 45 | | | (153 | ) | | (377 | ) | | (327 | ) | | | | (812 | ) | Net cost of net debt | | — | | Minority interests | | 14 | | Net income from continuing operations | | (798 | ) | Net income from discontinued operations | | (19 | ) | Net income | | (817 | ) |
| (a) | adjustments include special items, inventory valuation effect and equity share of amortization of intangible assets related to the Sanofi-Aventis merger. |
| | | | | | | | | | | | | | | | (b) Of which inventory valuation effect | | | | | | | | | | | | | | | | On operating income | | — | | (272 | ) | | (42 | ) | | — | | | | | | On net operating income | | — | | (327 | ) | | (28 | ) | | — | | | | | | (c) Of which equity share of amortization of intangible assets related to the Sanofi-Aventis merger. | | — | | — | | | — | | | (311 | ) | | | | |
| | | | | | | | | | | | | | | | | | | For the year ended December 31, 2006
(adjusted) (M€) | | Upstream | | | Downstream | | | Chemicals | | | Corporate | | | Intercompany | | | Total | | Non-Group sales | | 20,782 | | | 113,887 | | | 19,113 | | | 20 | | | — | | | 153,802 | | Intersegment sales | | 20,603 | | | 4,927 | | | 1,169 | | | 177 | | | (26,876 | ) | | — | | Excise taxes | | — | | | (21,113 | ) | | — | | | — | | | — | | | (21,113 | ) | Revenues from sales | | 41,385 | | | 97,701 | | | 20,282 | | | 197 | | | (26,876 | ) | | 132,689 | | Operating expenses | | (17,759 | ) | | (92,937 | ) | | (18,548 | ) | | (679 | ) | | 26,876 | | | (103,047 | ) | Depreciation, depletion and amortization of tangible assets and mineral interests | | (3,319 | ) | | (1,120 | ) | | (519 | ) | | (36 | ) | | — | | | (4,994 | ) | Adjusted operating income | | 20,307 | | | 3,644 | | | 1,215 | | | (518 | ) | | — | | | 24,648 | | Equity in income (loss) of affiliates and other items | | 1,016 | | | 206 | | | 29 | | | 1,092 | | | — | | | 2,343 | | Tax on net operating income | | (12,614 | ) | | (1,066 | ) | | (360 | ) | | 211 | | | — | | | (13,829 | ) | Adjusted net operating income | | 8,709 | | | 2,784 | | | 884 | | | 785 | | | — | | | 13,162 | | Net cost of net debt | | | | | | | | | | | | | | | | | (210 | ) | Minority interests | | | | | | | | | | | | | | | | | (381 | ) | Adjusted net income from continuing operations | | | | | | | | | | | | | | | | | 12,571 | | Adjusted net income from discontinued operations | | | | | | | | | | | | | | | | | 14 | | Adjusted net income | | | | | | | | | | | | | | | | | 12,585 | |
| | | | | | | | | | | | | | | | | | For the year ended December 31, 2006
(M€) | | Upstream | | | Downstream | | | Chemicals | | | Corporate | | | Intercompany | | Total | | Capital expenditures | | 9,001 | | | 1,775 | | | 995 | | | 81 | | | | | 11,852 | | Divestments at selling price | | 1,458 | | | 428 | | | 128 | | | 264 | | | | | 2,278 | | Cash flow from operating activities | | 11,524 | | | 3,626 | | | 972 | | | (61 | ) | | | | 16,061 | | Balance sheet as of December 31,
2006 | | | | | | | | | | | | | | | | | | Property, plant and equipment, intangible assets, net | | 31,875 | | | 8,211 | | | 4,983 | | | 212 | | | | | 45,281 | | Investments in equity affiliates | | 2,153 | | | 1,922 | | | 713 | | | 7,010 | | | | | 11,798 | | Loans to equity affiliates and other non-current assets | | 2,744 | | | 1,065 | | | 477 | | | 585 | | | | | 4,871 | | Working capital | | 199 | | | 6,067 | | | 2,609 | | | (78 | ) | | | | 8,797 | | Provisions and other non-current liabilities | | (11,427 | ) | | (2,093 | ) | | (1,807 | ) | | (1,052 | ) | | | | (16,379 | ) | Capital Employed (balance sheet) | | 25,544 | | | 15,172 | | | 6,975 | | | 6,677 | | | | | 54,368 | | Less inventory valuation effect | | — | | | (2,789 | ) | | (231 | ) | | 738 | | | | | (2,282 | ) | Capital Employed (Business segment information) | | 25,544 | | | 12,383 | | | 6,744 | | | 7,415 | | | | | 52,086 | | ROACE as a percentage (of continuing operations) | | 35% | | | 23% | | | 13% | | | | | | | | 26% | |
B. RECONCILATIONB) RECONCILIATION BETWEEN BUSINESS SEGMENT INFORMATION AND THE CONSOLIDATED STATEMENT OF INCOME
The table below reconciles the information presented above with the consolidated statementConsolidated Statement of income:Income: | | | | | | | | | | | 2006 (M€) | | Adjusted | | | Adjustment
items* | | | Consolidated
statement of
income | | Sales | | 153,802 | | | — | | | 153,802 | | Excise taxes | | (21,113 | ) | | — | | | (21,113 | ) | Revenues from sales | | 132,689 | | | — | | | 132,689 | | Purchases, net of inventory variation | | (83,020 | ) | | (314 | ) | | (83,334 | ) | Other operating expenses | | (19,393 | ) | | (143 | ) | | (19,536 | ) | Exploration costs | | (634 | ) | | — | | | (634 | ) | Depreciation, depletion and amortization of tangible assets and leasehold rights | | (4,994 | ) | | (61 | ) | | (5,055 | ) | Operating income | | | | | | | | | | Corporate | | (518 | ) | | (27 | ) | | (545 | ) | Business segments | | 25,166 | | | (491 | ) | | 24,675 | | Total operating income | | 24,648 | | | (518 | ) | | 24,130 | | Other income | | 423 | | | 366 | | | 789 | | Other expense | | (330 | ) | | (373 | ) | | (703 | ) | Financial interest on debt | | (1,731 | ) | | — | | | (1,731 | ) | Financial income from marketable securities & cash equivalents | | 1,367 | | | — | | | 1,367 | | Cost of net debt | | (364 | ) | | — | | | (364 | ) | Other financial income | | 592 | | | — | | | 592 | | Other financial expense | | (277 | ) | | — | | | (277 | ) | Income taxes | | (13,675 | ) | | (45 | ) | | (13,720 | ) | Equity in income (loss) of affiliates | | 1,935 | | | (242 | ) | | 1,693 | | Net income from continuing operations (Group without Arkema) | | 12,952 | | | (812 | ) | | 12,140 | | Net income from discontinued operations (Arkema) | | 14 | | | (19 | ) | | (5 | ) | Consolidated net income | | 12,966 | | | (831 | ) | | 12,135 | | Group share | | 12,585 | | | (817 | ) | | 11,768 | | Minority interests | | 381 | | | (14 | ) | | 367 | |
| | | | | | | | | | For the year ended December 31, 2008
(M€) | | Adjusted | | | Adjustments(a) | | | Consolidated
statement of
income | | Sales | | 179,976 | | | — | | | 179,976 | | Excise taxes | | (19,645 | ) | | — | | | (19,645 | ) | Revenues from sales | | 160,331 | | | — | | | 160,331 | | | | | | Purchases, net of inventory variation | | (107,521 | ) | | (3,503 | ) | | (111,024 | ) | Other operating expenses | | (18,903 | ) | | (198 | ) | | (19,101 | ) | Exploration costs | | (764 | ) | | — | | | (764 | ) | Depreciation, depletion and amortization of tangible assets and mineral interests | | (5,578 | ) | | (177 | ) | | (5,755 | ) | Other income | | 153 | | | 216 | | | 369 | | Other expense | | (147 | ) | | (407 | ) | | (554 | ) | | | | | Financial interest on debt | | (1,000 | ) | | — | | | (1,000 | ) | Financial income from marketable securities & cash equivalents | | 473 | | | — | | | 473 | | Cost of net debt | | (527 | ) | | — | | | (527 | ) | Other financial income | | 728 | | | — | | | 728 | | Other financial expense | | (325 | ) | | — | | | (325 | ) | | | | | Equity in income (loss) of affiliates | | 2,316 | | | (595 | ) | | 1,721 | | | | | | Income taxes | | (15,457 | ) | | 1,311 | | | (14,146 | ) | Net income from continuing operations (Group without Arkema) | | 14,306 | | | (3,353 | ) | | 10,953 | | Net income from discontinued operations (Arkema) | | — | | | — | | | — | | Consolidated net income | | 14,306 | | | (3,353 | ) | | 10,953 | | Group share | | 13,920 | | | (3,330 | ) | | 10,590 | | Minority interests | | 386 | | | (23 | ) | | 363 | |
*(a) | Adjustments include special items, inventory valuation effect and equity share of amortization of intangible assets related to the Sanofi-Aventis merger. |
| | | | | | | | | | | 2005(M€) | | Adjusted | | | Adjustment
items* | | | Consolidated
statement of
income | | Sales | | 137,607 | | | — | | | 137,607 | | Excise taxes | | (20,550 | ) | | — | | | (20,550 | ) | Revenues from sales | | 117,057 | | | — | | | 117,057 | | Purchases, net of inventory variation | | (71,555 | ) | | 1,264 | | | (70,291 | ) | Other operating expenses | | (17,141 | ) | | (18 | ) | | (17,159 | ) | Unsuccessful exploration costs | | (431 | ) | | — | | | (431 | ) | Depreciation, depletion and amortization of tangible assets and leasehold rights | | (4,929 | ) | | (78 | ) | | (5,007 | ) | Operating income | | | | | | | | | | Corporate | | (467 | ) | | — | | | (467 | ) | Business segments | | 23,468 | | | 1,168 | | | 24,636 | | Total operating income | | 23,001 | | | 1,168 | | | 24,169 | | Other income | | 174 | | | — | | | 174 | | Other expense | | (64 | ) | | (391 | ) | | (455 | ) | Financial interest on debt | | (1,214 | ) | | — | | | (1,214 | ) | Financial income from marketable securities & cash equivalents | | 927 | | | — | | | 927 | | Cost of net debt | | (287 | ) | | — | | | (287 | ) | Other financial income | | 396 | | | — | | | 396 | | Other financial expense | | (260 | ) | | — | | | (260 | ) | Income taxes | | (12,204 | ) | | 398 | | | (11,806 | ) | Equity in income (loss) of affiliates | | 1,637 | | | (464 | ) | | 1,173 | | Net income from continuing operations (Group without Arkema) | | 12,393 | | | 711 | | | 13,104 | | Net income from discontinued operations (Arkema) | | (28 | ) | | (433 | ) | | (461 | ) | Consolidated net income | | 12,365 | | | 278 | | | 12,643 | | Group share | | 12,003 | | | 270 | | | 12,273 | | Minority interests | | 362 | | | 8 | | | 370 | |
| | | | | | | | | | For the year ended December 31, 2007 (M€) | | Adjusted | | | Adjustments(a) | | | Consolidated
statement of
income | | Sales | | 158,752 | | | — | | | 158,752 | | Excise taxes | | (21,928 | ) | | — | | | (21,928 | ) | Revenues from sales | | 136,824 | | | — | | | 136,824 | | Purchases, net of inventory variation | | (89,688 | ) | | 1,881 | | | (87,807 | ) | Other operating expenses | | (17,375 | ) | | (39 | ) | | (17,414 | ) | Exploration costs | | (877 | ) | | — | | | (877 | ) | Depreciation, depletion and amortization of tangible assets and mineral interests | | (5,378 | ) | | (47 | ) | | (5,425 | ) | Other income | | 384 | | | 290 | | | 674 | | Other expense | | (225 | ) | | (245 | ) | | (470 | ) | Financial interest on debt | | (1,783 | ) | | — | | | (1,783 | ) | Financial income from marketable securities & cash equivalents | | 1,244 | | | — | | | 1,244 | | Cost of net debt | | (539 | ) | | — | | | (539 | ) | Other financial income | | 643 | | | — | | | 643 | | Other financial expense | | (274 | ) | | — | | | (274 | ) | Equity in income (loss) of affiliates | | 2,079 | | | (304 | ) | | 1,775 | | Income taxes | | (13,031 | ) | | (544 | ) | | (13,575 | ) | Net income from continuing operations (Group without Arkema) | | 12,543 | | | 992 | | | 13,535 | | Net income from discontinued operations (Arkema) | | — | | | — | | | — | | Consolidated net income | | 12,543 | | | 992 | | | 13,535 | | Group share | | 12,203 | | | 978 | | | 13,181 | | Minority interests | | 340 | | | 14 | | | 354 | |
*(a) | Adjustments include special items, inventory valuation effect and equity share of amortization of intangible assets related to the Sanofi-Aventis merger. |
| | | | | | | | | | For the year ended December 31, 2006 (M€) | | Adjusted | | | Adjustments(a) | | | Consolidated
statement of
income | | Sales | | 153,802 | | | —�� | | | 153,802 | | Excise taxes | | (21,113 | ) | | — | | | (21,113 | ) | Revenues from sales | | 132,689 | | | — | | | 132,689 | | Purchases, net of inventory variation | | (83,020 | ) | | (314 | ) | | (83,334 | ) | Other operating expenses | | (19,393 | ) | | (143 | ) | | (19,536 | ) | Exploration costs | | (634 | ) | | — | | | (634 | ) | Depreciation, depletion and amortization of tangible assets and mineral interests | | (4,994 | ) | | (61 | ) | | (5,055 | ) | Other income | | 423 | | | 366 | | | 789 | | Other expense | | (330 | ) | | (373 | ) | | (703 | ) | Financial interest on debt | | (1,731 | ) | | — | | | (1,731 | ) | Financial income from marketable securities & cash equivalents | | 1,367 | | | — | | | 1,367 | | Cost of net debt | | (364 | ) | | — | | | (364 | ) | Other financial income | | 592 | | | — | | | 592 | | Other financial expense | | (277 | ) | | — | | | (277 | ) | Equity in income (loss) of affiliates | | 1,935 | | | (242 | ) | | 1,693 | | Income taxes | | (13,675 | ) | | (45 | ) | | (13,720 | ) | Net income from continuing operations (Group without Arkema) | | 12,952 | | | (812 | ) | | 12,140 | | Net income from discontinued operations (Arkema) | | 14 | | | (19 | ) | | (5 | ) | Consolidated net income | | 12,966 | | | (831 | ) | | 12,135 | | Group share | | 12,585 | | | (817 | ) | | 11,768 | | Minority interests | | 381 | | | (14 | ) | | 367 | |
| (a) | Adjustments include special items, inventory valuation effect and equity share of amortization of intangible assets related to the Sanofi-Aventis merger. |
| | | | | | | | | | | 2004(M€) | | Adjusted | | | Adjustment
items* | | | Consolidated
statement of
income | | Sales | | 116,842 | | | — | | | 116,842 | | Excise taxes | | (21,517 | ) | | — | | | (21,517 | ) | Revenues from sales | | 95,325 | | | — | | | 95,325 | | Purchases, net of inventory variation | | (56,738 | ) | | 718 | | | (56,020 | ) | Other operating expenses | | (16,721 | ) | | (49 | ) | | (16,770 | ) | Exploration costs | | (414 | ) | | — | | | (414 | ) | Depreciation, depletion and amortization of tangible assets and leasehold rights | | (4,762 | ) | | (333 | ) | | (5,095 | ) | Operating income | | | | | | | | | | Corporate | | (349 | ) | | — | | | (349 | ) | Business segments | | 17,039 | | | 336 | | | 17,375 | | Total operating income | | 16,690 | | | 336 | | | 17,026 | | Other income | | 104 | | | 3,034 | | | 3,138 | | Other expense | | (386 | ) | | (450 | ) | | (836 | ) | Financial interest on debt | | (702 | ) | | — | | | (702 | ) | Financial income from marketable securities & cash equivalents | | 572 | | | — | | | 572 | | Cost of net debt | | (130 | ) | | — | | | (130 | ) | Other financial income | | 321 | | | — | | | 321 | | Other financial expense | | (227 | ) | | — | | | (227 | ) | Income taxes | | (8,196 | ) | | (407 | ) | | (8,603 | ) | Equity in income (loss) of affiliates | | 1,421 | | | (263 | ) | | 1,158 | | Net income from continuing operations (Group without Arkema) | | 9,597 | | | 2,250 | | | 11,847 | | Net income from discontinued operations (Arkema) | | (195 | ) | | (503 | ) | | (698 | ) | Consolidated net income | | 9,402 | | | 1,747 | | | 11,149 | | Group share and dividends on subsidiaries’ redeemable preferred share | | 9,131 | | | 1,737 | | | 10,868 | | Minority interests | | 271 | | | 10 | | | 281 | |
* | Adjustments include special items, inventory valuation effect and equity share of amortization of intangible assets related to the Sanofi-Aventis merger. |
C.C) ADJUSTMENT ITEMS BY BUSINESS SEGMENT
The adjustment items for income as per Note 2 to the Consolidated Financial Statements are detailed as follows: Adjustments to operating income | | | | | | | | | | | | | | | | 2006(M€) | | Upstream | | Downstream | | | Chemicals | | | Corporate | | | Total | | Inventory valuation effect | | — | | (272 | ) | | (42 | ) | | — | | | (314 | ) | Restructuring charges | | — | | — | | | (25 | ) | | — | | | (25 | ) | Asset impairment charges | | — | | — | | | (61 | ) | | — | | | (61 | ) | Other | | — | | — | | | (91 | ) | | (27 | ) | | (118 | ) | Total | | — | | (272 | ) | | (219 | ) | | (27 | ) | | (518 | ) |
| | | | | | | | | | | | | | | | For the year ended December 31, 2008(M€) | | Upstream | | | Downstream | | | Chemicals | | | Corporate | | Total | | Inventory valuation effect | | — | | | (2,776 | ) | | (727 | ) | | — | | (3,503 | ) | Restructuring charges | | — | | | — | | | — | | | — | | — | | Asset impairment charges | | (171 | ) | | — | | | (6 | ) | | — | | (177 | ) | Other items | | — | | | — | | | (198 | ) | | — | | (198 | ) | Total | | (171 | ) | | (2,776 | ) | | (931 | ) | | — | | (3,878 | ) |
Adjustments to net income | | | | | | | | | | | | | | | | | 2006(M€) | | Upstream | | | Downstream | | | Chemicals | | | Corporate | | | Total | | Inventory valuation effect | | — | | | (330 | ) | | (28 | ) | | — | | | (358 | ) | TOTAL’s equity share of special items recorded by | | | | | | | | | | | | | | | | Sanofi-Aventis | | — | | | — | | | — | | | (81 | ) | | (81 | ) | Adjustment related to Sanofi-Aventis merger | | — | | | — | | | — | | | (309 | ) | | (309 | ) | Restructuring charges | | — | | | — | | | (154 | ) | | — | | | (154 | ) | Asset impairment charges | | — | | | — | | | (40 | ) | | — | | | (40 | ) | Gains/(Losses) on sales of assets | | 130 | | | 174 | | | — | | | — | | | 304 | | Other | | (71 | ) | | | | | (172 | ) | | 64 | | | (179 | ) | Total | | 59 | | | (156 | ) | | (394 | ) | | (326 | ) | | (817 | ) |
| | | | | | | | | | | | | | | | | For the year ended December 31, 2008(M€) | | Upstream | | | Downstream | | | Chemicals | | | Corporate | | | Total | | Inventory valuation effect | | — | | | (1,949 | ) | | (503 | ) | | — | | | (2,452 | ) | TOTAL’s equity share of special items recorded by Sanofi-Aventis | | — | | | — | | | — | | | — | | | — | | TOTAL’s equity share of adjustments related to the Sanofi-Aventis merger | | — | | | — | | | — | | | (393 | ) | | (393 | ) | Restructuring charges | | — | | | (47 | ) | | (22 | ) | | — | | | (69 | ) | Asset impairment charges | | (172 | ) | | (26 | ) | | (7 | ) | | — | | | (205 | ) | Gains (losses) on disposals of assets | | 130 | | | — | | | — | | | 84 | | | 214 | | Other items | | (236 | ) | | — | | | (151 | ) | | (38 | ) | | (425 | ) | Total | | (278 | ) | | (2,022 | ) | | (683 | ) | | (347 | ) | | (3,330 | ) |
Adjustments to operating income | | 2005(M€) | | Upstream | | Downstream | | Chemicals | | Corporate | | Total | | | | For the year ended December 31, 2007(M€) | | | Upstream | | Downstream | | Chemicals | | Corporate | | Total | | Inventory valuation effect | | | | 1,197 | | 68 | | | | | 1,265 | | | — | | | 1,529 | | | 301 | | | — | | 1,830 | | Restructuring charges | | | | | | (19 | ) | | | | (19 | ) | | — | | | — | | | — | | | — | | — | | Asset impairment charges | | | | | | (71 | ) | | | | (71 | ) | | — | | | (43 | ) | | (4 | ) | | — | | (47 | ) | Other | | | | | | (7 | ) | | | (7 | ) | | Other items | | | (11 | ) | | 51 | | | (28 | ) | | — | | 12 | | Total | | — | | 1,197 | | (29 | ) | | — | | 1,168 | | | (11 | ) | | 1,537 | | | 269 | | | — | | 1,795 | |
Adjustments to net income | | | | | | | | | | | | | | | 2005 (M€) | | Upstream | | Downstream | | Chemicals | | | Corporate | | | Total | | Inventory valuation effect | | — | | 1,022 | | 50 | | | | | | 1,072 | | TOTAL’s equity share of special items recorded by | | | | | | | | | | | | | | Sanofi-Aventis | | — | | | | | | | (207 | ) | | (207 | ) | Adjustment related to Sanofi-Aventis merger | | — | | | | | | | (335 | ) | | (335 | ) | Restructuring charges | | — | | | | (130 | ) | | | | | (130 | ) | Asset impairment charges | | — | | | | (215 | ) | | | | | (215 | ) | Gains/(Losses) on sales of assets | | — | | | | | | | | | | — | | Other | | — | | | | (501 | ) | | 586 | | | 85 | | Total | | — | | 1,022 | | (796 | ) | | 44 | | | 270 | |
| | | | | | | | | | | | | | | | | For the year ended December 31, 2007(M€) | | Upstream | | | Downstream | | | Chemicals | | | Corporate | | | Total | | Inventory valuation effect | | — | | | 1,084 | | | 201 | | | — | | | 1,285 | | TOTAL’s equity share of special items recorded by Sanofi-Aventis | | — | | | — | | | — | | | 75 | | | 75 | | TOTAL’s equity share of adjustments related to the Sanofi-Aventis merger | | — | | | — | | | — | | | (318 | ) | | (318 | ) | Restructuring charges | | — | | | (20 | ) | | (15 | ) | | — | | | (35 | ) | Asset impairment charges | | (93 | ) | | (61 | ) | | (8 | ) | | — | | | (162 | ) | Gains (losses) on disposals of assets | | 89 | | | 101 | | | — | | | 116 | | | 306 | | Other items | | (8 | ) | | (27 | ) | | (38 | ) | | (100 | ) | | (173 | ) | Total | | (12 | ) | | 1,077 | | | 140 | | | (227 | ) | | 978 | |
Adjustments to operating income | | 2004(M€) | | Upstream | | Downstream | | Chemicals | | Corporate | | Total | | | For the year ended December 31, 2006 (M€) | | | Upstream | | Downstream | | Chemicals | | Corporate | | Total | | Inventory valuation effect | | — | | | 487 | | | 232 | | | — | | | 719 | | | — | | (272 | ) | | (42 | ) | | — | | | (314 | ) | Restructuring charges | | — | | | (50 | ) | | | | — | | | (50 | ) | | — | | — | | | (25 | ) | | — | | | (25 | ) | Asset impairment charges | | — | | | (34 | ) | | (244 | ) | | — | | | (278 | ) | | — | | — | | | (61 | ) | | — | | | (61 | ) | Other | | — | | | — | | | (55 | ) | | — | | | (55 | ) | | Other items | | | — | | — | | | (91 | ) | | (27 | ) | | (118 | ) | Total | | — | | | 403 | | | (67 | ) | | — | | | 336 | | | — | | (272 | ) | | (219 | ) | | (27 | ) | | (518 | ) | | Adjustments to net income | | | | | 2004(M€) | | Upstream | | Downstream | | Chemicals | | Corporate | | Total | | | | Inventory valuation effect | | — | | | 349 | | | 157 | | | — | | | 506 | | | TOTAL’s equity share of special items recorded by
Sanofi-Aventis (dilution income included) | | — | | | — | | | — | | | 2,399 | | | 2,399 | | | | Adjustment related to Sanofi-Aventis merger | | — | | | — | | | — | | | (113 | ) | | (113 | ) | | | Restructuring charges | | — | | | (31 | ) | | (112 | ) | | — | | | (143 | ) | | | Asset impairment charges | | (114 | ) | | (21 | ) | | (637 | ) | | — | | | (772 | ) | | | Gains/(Losses) on sales of assets | | — | | | — | | | — | | | 53 | | | 53 | | | | Other | | (34 | ) | | (26 | ) | | (197 | ) | | 64 | | | (193 | ) | | Total | | (148 | ) | | 271 | | | (789 | ) | | 2,403 | | | 1,737 | | |
Adjustments to net income | | | | | | | | | | | | | | | | For the year ended December 31, 2006 (M€) | | Upstream | | | Downstream | | | Chemicals | | | Corporate | | | Total | | Inventory valuation effect | | — | | | (330 | ) | | (28 | ) | | — | | | (358 | ) | TOTAL’s equity share of special items recorded by Sanofi-Aventis | | — | | | — | | | — | | | (81 | ) | | (81 | ) | TOTAL’s equity share of adjustments related to the Sanofi-Aventis merger | | — | | | — | | | — | | | (309 | ) | | (309 | ) | Restructuring charges | | — | | | — | | | (154 | ) | | — | | | (154 | ) | Asset impairment charges | | — | | | — | | | (40 | ) | | — | | | (40 | ) | Gains (losses) on disposals of assets | | 130 | | | 174 | | | — | | | — | | | 304 | | Other items | | (71 | ) | | — | | | (172 | ) | | 64 | | | (179 | ) | Total | | 59 | | | (156 | ) | | (394 | ) | | (326 | ) | | (817 | ) |
D) ADDITIONAL INFORMATION ON IMPAIRMENTS In the Upstream, Downstream and Chemicals segment,segments, impairments of assets (property, plant and equipment and intangible assets) have been recognized for the year ended December 31, 2006,2008, with an impact of 61216 M€ in operating income and 40244 M€ in net income, Group share. These impairments were disclosed as adjustments to operating income for 177 M€ and adjustments to net income for 205 M€. These items are identified in paragraph C of this Note4C above as adjustment items underwith the heading “Asset impairment charges”. TheseThe impairment losses impact certain Cash Generating Units (CGU) of the Chemicals segment for which there were indications that assets may be impaired,of impairment, due mainly to changes in the operating conditions or the economic environment of their specific businesses.
The CGUs of the Upstream segment affected by these impairments are oil fields and associates accounted for by the equity method. The impairments recorded during 2008 are mainly due to the deterioration in the operating conditions of the specific assets. Economic assumptions, notably on hydrocarbon prices, made by management have not triggered the recognition of impairments and would not have even if hydrocarbon prices had been 25% lower than assumed by management. The CGUs of the Dowstream segment are affiliates or groups of affiliates organized mostly by country. The CGUs of the Chemicals segment are worldwide business units, including activities or products with common strategic, commercial and industrial characteristics. In addition, the recoverable amount of CGUs has been based on their value in use, as defined in Note 1 paragraph L of Note 1 to the Consolidated Financial Statements “Impairment"Impairment of long-lived assets”assets"; and future cash flows including specific risks attached to CGU assets have been discounted using ana 8% after-taxafter tax discount rate. This rate is a weighted-average capital cost estimated from historical market data. These assumptions have been applied consistently for the years 2006, 2007 and 2008. For the yearsyear ended December 31, 20052007, impairments of assets have been recognized in the Upstream, Downstream and 2004,Chemicals segments with an impact of 47 M€ in operating income and 162 M€ in net income, Group share. For the year ended December 31, 2006, changes in the economic environment of certain business units of the Chemicals segment had triggered the recognition of impairments of assets for respectively, 71 M€ and 24461 M€ in operating income and 21540M€ in net income, Group share. For the year ended December 31, 2008, reversals of impairment losses have been recognized in the Upstream segment with an impact of 41 M€ in operating income and 63729 M€ in net income, Group share. No reversal of impairment losses has been recognized in 2004, 20052006 and 2006.2007. 5.5) INFORMATION BY GEOGRAPHICAL AREA
| | | | | | | | | | | | | | (M€) | | France | | Rest of
Europe | | North
America | | Africa | | Far East and
rest of the world | | Total | 2006 | | | | | | | | | | | | | Non-Group sales* | | 36,890 | | 70,992 | | 13,031 | | 10,086 | | 22,803 | | 153,802 | Property, plant and equipment, intangible assets, net | | 5,860 | | 14,066 | | 4,318 | | 10,595 | | 10,442 | | 45,281 | Capital expenditures | | 1,919 | | 2,355 | | 881 | | 3,326 | | 3,371 | | 11,852 | 2005 | | | | | | | | | | | | | Non-Group sales* | | 34,362 | | 53,727 | | 17,663 | | 8,304 | | 23,551 | | 137,607 | Property, plant and equipment, intangible assets, net | | 6,300 | | 14,148 | | 4,748 | | 9,546 | | 10,210 | | 44,952 | Capital expenditures | | 1,967 | | 2,178 | | 1,691 | | 2,858 | | 2,501 | | 11,195 | 2004 | | | | | | | | | | | | | Non-Group sales* | | 29,888 | | 45,523 | | 16,765 | | 6,114 | | 18,552 | | 116,842 | Property, plant and equipment, intangible assets, net | | 5,724 | | 13,859 | | 3,096 | | 7,322 | | 8,081 | | 38,082 | Capital expenditures | | 2,125 | | 2,060 | | 762 | | 2,004 | | 1,953 | | 8,904 |
| | | | | | | | | | | | | | (M€) | | France | | Rest of
Europe | | North
America | | Africa | | Asia-Pacific
and rest of world | | Total | For the year ended December 31, 2008 | | | | | | | | | | | | | Non-Group sales | | 43,616 | | 82,761 | | 14,002 | | 12,482 | | 27,115 | | 179,976 | Property, plant and equipment, intangible assets, net | | 7,260 | | 13,485 | | 5,182 | | 15,460 | | 10,096 | | 51,483 | Capital expenditures | | 1,997 | | 2,962 | | 1,255 | | 4,500 | | 2,926 | | 13,640 | For the year ended December 31, 2007 | | | | | | | | | | | | | Non-Group sales | | 37,949 | | 73,757 | | 12,404 | | 10,401 | | 24,241 | | 158,752 | Property, plant and equipment, intangible assets, net | | 6,437 | | 14,554 | | 4,444 | | 11,872 | | 8,810 | | 46,117 | Capital expenditures | | 1,627 | | 2,538 | | 740 | | 3,745 | | 3,072 | | 11,722 | For the year ended December 31, 2006 | | | | | | | | | | | | | Non-Group sales(a) | | 36,890 | | 70,992 | | 13,031 | | 10,086 | | 22,803 | | 153,802 | Property, plant and equipment, intangible assets, net | | 5,860 | | 14,066 | | 4,318 | | 10,595 | | 10,442 | | 45,281 | Capital expenditures | | 1,919 | | 2,355 | | 881 | | 3,326 | | 3,371 | | 11,852 |
*(a) | Non-Group sales from continuing operations. |
6.6) OPERATING EXPENSES
| | | | | | | | | | | Year ended December 31,(M€) | | 2006 | | | 2005 | | | 2004 | | Purchases, net of inventory variation(a) | | (83,334 | ) | | (70,291 | ) | | (56,020 | ) | Exploration costs | | (634 | ) | | (431 | ) | | (414 | ) | Other operating expenses(b) | | (19,536 | ) | | (17,159 | ) | | (16,770 | ) | Of which non-current operating liabilities (allowances) reversals | | 454 | | | 394 | | | 711 | | Of which current operating liabilities (allowances) reversals | | (111 | ) | | (51 | ) | | (25 | ) | Operating expenses | | (103,504 | ) | | (87,881 | ) | | (73,204 | ) |
| | | | | | | | | | | For the year ended December 31,(M€) | | 2008 | | | 2007 | | | 2006 | | Purchases, net of inventory variation(a) | | (111,024 | ) | | (87,807 | ) | | (83,334 | ) | Exploration costs | | (764 | ) | | (877 | ) | | (634 | ) | Other operating expenses(b) | | (19,101 | ) | | (17,414 | ) | | (19,536 | ) | of which non-current operating liabilities (allowances) reversals | | 459 | | | 781 | | | 454 | | of which current operating liabilities (allowances) reversals | | (29 | ) | | (42 | ) | | (111 | ) | Operating expenses | | (130,889 | ) | | (106,098 | ) | | (103,504 | ) |
| (a) | Includes royalties paid on oil and gas production in the Upstream segment (see in particular the taxes paid to Middle East oil producing countries for the Group’s concessions as detailed in Note 3133 to the Consolidated Financial Statements “Other information”). |
| (b) | Principally composed of production and administrative costs (see in particular the payroll costs as detailed in Note 2526 to the Consolidated Financial Statements “Payroll and staff”). |
7.7) OTHER INCOME AND OTHER EXPENSE
| | As of December 31,(M€) | | 2006 | | 2005 | | 2004 | | | 2008 | | 2007 | | 2006 | | Gain (loss) on sales of assets | | 789 | | | 98 | | | 3,138 | | | Gains (losses ) on disposal of assets | | | 257 | | | 639 | | | 789 | | Foreign exchange gains | | — | | | 76 | | | — | | | 112 | | | 35 | | | — | | Other income | | 789 | | | 174 | | | 3,138 | | | 369 | | | 674 | | | 789 | | Foreign exchange losses | | (30 | ) | | — | | | (75 | ) | | — | | | — | | | (30 | ) | Amortization of other intangible assets (excl. leasehold rights) | | (182 | ) | | (182 | ) | | (375 | ) | | Toulouse-AZF | | (100 | ) | | (100 | ) | | (150 | ) | | Amortization of other intangible assets (excluding mineral interests ) | | | (162 | ) | | (178 | ) | | (182 | ) | Other | | (391 | ) | | (173 | ) | | (236 | ) | | (392 | ) | | (292 | ) | | (491 | ) | Other expense | | (703 | ) | | (455 | ) | | (836 | ) | | (554 | ) | | (470 | ) | | (703 | ) |
In 2008, gains and losses on disposal of assets are mainly related to sales of non-current assets in the Upstream segment, as well as disposal of shares of Sanofi-Aventis. The “Other” heading is mainly comprised of: 107 M€ of restructuring charges in the Upstream, Downstream and Chemicals segments; and 48 M€ of changes in provisions related to various antitrust investigations as described in Note 32 to the Consolidated Financial Statements “Other risks and contingent liabilities”. In 2007, gains and losses on disposal of assets were mainly related to sales of non-current assets in the Upstream and Downstream segments, as well as disposal of shares of Sanofi-Aventis. The “Other” heading was mainly comprised of: 51 M€ of restructuring charges in the Downstream and Chemicals segments; and 100 M€ of changes in provisions related to various antitrust investigations as described in Note 32 to the Consolidated Financial Statements “Other risks and contingent liabilities”. In 2006, gains and losses on salesdisposal of assets arewere mainly related to sales of financial assets. The “Other” heading iswas mainly comprised of: 100 M€ of changes in provisions related to the Toulouse-AZF plant explosion (civil liability); 188 M€ of restructuring charges in the Chemicals segment; and 32 M€ increaseof changes in provisions related to various antitrust investigations as described in the Note 3032 to the Consolidated Financial StatementStatements “Other risks and contingent liabilities”. In 2004, the deterioration of the economic cycle generated impairment losses on intangible assets in the
Chemicals segment. As a consequence, an impairment loss of 118 M€ was recorded in 2004 to adjust the carrying amount of the intangible assets to their recoverable amount. The gains (losses) on sales of assets included a pre-tax dilution gain on the Sanofi-Aventis merger of 2,969 M€ in 2004. The “Other” heading mainly included early retirement plans and restructuring costs for 18 M€, and other allowances for various litigation reserves for 46 M€.
8.8) OTHER FINANCIAL INCOME AND EXPENSE
| | As of December 31,(M€) | | 2006 | | | 2005 | | | 2004 | | | 2008 | | 2007 | | 2006 | | Dividend income on non-consolidated companies | | 237 | | | 164 | | | 154 | | | 238 | | | 218 | | | 237 | | Capitalized financial expenses | | 236 | | | 101 | | | 34 | | | 271 | | | 322 | | | 236 | | Other | | 119 | | | 131 | | | 133 | | | 219 | | | 103 | | | 119 | | Other financial income | | 592 | | | 396 | | | 321 | | | 728 | | | 643 | | | 592 | | | Accretion of asset retirement obligation | | (182 | ) | | (162 | ) | | (143 | ) | | Accretion of asset retirement obligations | | | (229 | ) | | (189 | ) | | (182 | ) | Other | | (95 | ) | | (98 | ) | | (84 | ) | | (96 | ) | | (85 | ) | | (95 | ) | Other financial expense | | (277 | ) | | (260 | ) | | (227 | ) | | (325 | ) | | (274 | ) | | (277 | ) |
9.9) INCOME TAXES
Since 1966, the Group has been taxed in accordance with the consolidated income tax treatment approved on a renewable basis by the French Ministry of Economy, FinanceIndustry and Industry.Employment. The renewal of the agreementapproval for the consolidated income tax treatment has been grantedrequested for 2008 to 2010. It is being reviewed by the period 2005-2007.French Ministry of Budget. French income and foreign withholding taxes do not provideNo deferred tax is recognized for the temporary differences between the financial statement carrying amountamounts and tax bases of investments in foreign subsidiaries, which are considered
to be permanent investments. Undistributed earnings offrom foreign subsidiaries considered to be reinvested indefinitely amounted to 21,71720,661 M€ as of December 31, 2006.2008. The determination of the tax effect relating to such reinvested income is not reliably feasible.practicable. In addition, no provision for income taxesdeferred tax is recognized on unremitted earnings (approximately 8,49113,534 M€) of the Group’s French subsidiaries has been made since the remittance of such earnings would be tax exempt for the subsidiaries, in which the Company owns 95% or more of the outstanding shares. Income taxes are detailed as follows: | | As of December 31,(M€) | | 2006 | | | 2005 | | | 2004 | | | | For the year ended December 31, (M€) | | | 2008 | | 2007 | | 2006 | | Current income taxes | | (12,997 | ) | | (11,362 | ) | | (7,641 | ) | | (14,117 | ) | | (12,141 | ) | | (12,997 | ) | Deferred income taxes | | (723 | ) | | (444 | ) | | (962 | ) | | (29 | ) | | (1,434 | ) | | (723 | ) | Total income taxes | | (13,720 | ) | | (11,806 | ) | | (8,603 | ) | | (14,146 | ) | | (13,575 | ) | | (13,720 | ) |
Before netting deferred tax assets and liabilities by fiscal entities,entity, the components of deferred tax balances as of December 31, 20052008, 2007 and 2006 are as follows: | | As of December 31,(M€) | | 2006 | | | 2005 | | | 2008 | | 2007 | | 2006 | | Net operating losses and tax carry forwards | | 633 | | | 484 | | | 1,031 | | | 560 | | | 633 | | Employee benefits | | 830 | | | 949 | | | 519 | | | 760 | | | 830 | | Other temporarily non-deductible provisions | | 2,157 | | | 2,637 | | | Other temporary non-deductible provisions | | | 2,075 | | | 2,341 | | | 2,157 | | Gross deferred tax assets | | 3,620 | | | 4,070 | | | 3,625 | | | 3,661 | | | 3,620 | | Valuation allowance | | (572 | ) | | (536 | ) | | (475 | ) | | (449 | ) | | (572 | ) | Net deferred tax assets | | 3,048 | | | 3,534 | | | 3,150 | | | 3,212 | | | 3,048 | | | Excess tax over book depreciation | | (8,180 | ) | | (7,769 | ) | | (8,836 | ) | | (9,254 | ) | | (8,180 | ) | Other temporary tax deductions | | (1,237 | ) | | (1,435 | ) | | (1,171 | ) | | (1,209 | ) | | (1,237 | ) | Gross deferred tax liability | | (9,417 | ) | | (9,204 | ) | | (10,007 | ) | | (10,463 | ) | | (9,417 | ) | Net deferred tax liability | | (6,369 | ) | | (5,670 | ) | | (6,857 | ) | | (7,251 | ) | | (6,369 | ) |
After netting deferred tax assets and liabilities by fiscal entity, deferred taxes are presented on the balance sheet as follows: | | As of December 31,(M€) | | 2006 | | | 2005 | | | | 2008 | | 2007 | | 2006 | | Deferred tax assets, non-current (Note 14 “Other non-current assets”) | | 806 | | | 1,392 | | | Deferred tax assets, current (Note 16 “Accounts receivables & other current assets”) | | 94 | | | 126 | | | Deferred tax liabilities, non-current (Deferred tax) | | (7,139 | ) | | (6,976 | ) | | Deferred tax assets, non-current | | | (Note 14 | ) | | 1,010 | | | 797 | | | 806 | | Deferred tax assets, current | | | (Note 16 | ) | | 206 | | | 112 | | | 94 | | Deferred tax liabilities, non-current | | | | | (7,973 | ) | | (7,933 | ) | | (7,139 | ) | Deferred tax liabilities, current | | (130 | ) | | (212 | ) | | | (100 | ) | | (227 | ) | | (130 | ) | Net amount | | (6,369 | ) | | (5,670 | ) | | | (6,857 | ) | | (7,251 | ) | | (6,369 | ) |
The net deferred tax variation in the balance sheet is analyzed as follows: | | | | | | | | As of December 31,(M€) | | 2006 | | | 2005 | | Opening balance | | (5,670 | ) | | (5,100 | ) | Deferred tax on income for continuing operations | | (723 | ) | | (444 | ) | Deferred tax on income for discontinued operations | | (10 | ) | | 53 | | Deferred tax on shareholders’ equity(a) | | (17 | ) | | 176 | | Consolidated scope changes(b) | | (311 | ) | | 29 | | Currency translation adjustment | | 362 | | | (384 | ) | Closing balance | | (6,369 | ) | | (5,670 | ) |
| | | | | | | | | | | As of December 31,(M€) | | 2008 | | | 2007 | | | 2006 | | Opening balance | | (7,251 | ) | | (6,369 | ) | | (5,670 | ) | Deferred tax on income for continuing operations | | (29 | ) | | (1,434 | ) | | (723 | ) | Deferred tax on income for discontinued operations | | — | | | — | | | (10 | ) | Deferred tax on shareholders’ equity(a) | | 30 | | | (6 | ) | | (17 | ) | Changes in scope of consolidation(b) | | (1 | ) | | 158 | | | (311 | ) | Currency translation adjustment | | 394 | | | 400 | | | 362 | | Closing balance | | (6,857 | ) | | (7,251 | ) | | (6,369 | ) |
| (a) | This amount includes mainly current income taxes and deferred taxes for transactions on treasury shares and for changes in fair value of listed securities classified as financial assets available for sale. |
| (b) | This amount includes mainly the impact of the spin-off of Arkema.Arkema for 2006. |
Reconciliation between provision for income taxes and pre-tax income (excluding Arkema):income: | | As of December 31,(M€) | | 2006 | | | 2005 | | | 2004 | | | Net income from continuing operations | | 12,140 | | | 13,103 | | | 11,847 | | | | For the year ended December 31,(M€) | | | 2008 | | 2007 | | 2006(a) | | Net income | | | 10,953 | | | 13,535 | | | 12,140 | | Provision for income taxes | | 13,720 | | | 11,806 | | | 8,603 | | | 14,146 | | | 13,575 | | | 13,720 | | Pre-tax income | | 25,860 | | | 24,909 | | | 20,450 | | | 25,099 | | | 27,110 | | | 25,860 | | French statutory tax rate | | 34.43% | | | 34.93% | | | 35.43% | | | 34.43% | | | 34.43% | | | 34.43% | | Theoretical tax charge | | (8,904 | ) | | (8,701 | ) | | (7,245 | ) | | (8,642 | ) | | (9,334 | ) | | (8,904 | ) | Difference between French and foreign income tax rates | | (5,484 | ) | | (4,128 | ) | | (2,740 | ) | | (6,326 | ) | | (5,118 | ) | | (5,484 | ) | Tax effect of equity in income (loss) of affiliates | | 583 | | | 410 | | | 410 | | | 593 | | | 611 | | | 583 | | Permanent differences | | 324 | | | 253 | | | 982 | | | 315 | | | 122 | | | 324 | | Adjustments on prior years income taxes | | (87 | ) | | (55 | ) | | (44 | ) | | 12 | | | 75 | | | (87 | ) | Adjustments on deferred tax related to tax rates variations | | (88 | ) | | 576 | | | 104 | | | Change in valuation allowance | | (62 | ) | | (151 | ) | | (71 | ) | | Adjustments on deferred tax related to changes in tax rates | | | (31 | ) | | (16 | ) | | (88 | ) | Changes in valuation allowance of deferred tax assets | | | (63 | ) | | 80 | | | (62 | ) | Other | | (2 | ) | | (10 | ) | | 1 | | | (4 | ) | | 5 | | | (2 | ) | Net provision for income taxes | | (13,720 | ) | | (11,806 | ) | | (8,603 | ) | | (14,146 | ) | | (13,575 | ) | | (13,720 | ) |
| (a) | Excluding discontinued operations. |
The French statutory tax rate includes the standard corporate tax rate (33.33%) and additional applicable taxes applicable that bring the overall tax rate to 34.43% in 2006 (34.93%2008 (34.43% in 2005)2007 and 2006). Permanent differences are mainly due to impairment of goodwill and to dividends from non-consolidated companies as well as the specific taxation rules applicable to somecertain activities and within the consolidated income tax treatment. Net operating losses and tax credit carryforwards:carryforwards Deferred tax assets related to net operating losses and tax carryforwards were available in various tax juridictions,jurisdictions, expiring in the following years:
| | | | | | | | | | As of December 31, (M€) | | 2006 | | 2005 | | | | Basis | | Tax | | Basis | | Tax | 2006 | | — | | — | | 225 | | 106 | 2007 | | 234 | | 115 | | 165 | | 81 | 2008 | | 210 | | 102 | | 144 | | 70 | 2009 | | 157 | | 80 | | 68 | | 32 | 2010(a) | | 299 | | 104 | | 27 | | 11 | 2011 and after | | 23 | | 9 | | — | | — | Unlimited | | 638 | | 223 | | 559 | | 184 | Total | | 1,561 | | 633 | | 1,188 | | 484 |
| | | | | | | | | | | | | | As of December 31,(M€) | | 2008 | | 2007 | | 2006 | | | | Basis | | Tax | | Basis | | Tax | | Basis | | Tax | 2007 | | — | | — | | — | | — | | 234 | | 115 | 2008 | | — | | — | | 290 | | 141 | | 210 | | 102 | 2009 | | 233 | | 115 | | 222 | | 109 | | 157 | | 80 | 2010 | | 167 | | 79 | | 129 | | 59 | | 299 | | 104 | 2011(a) | | 93 | | 42 | | 33 | | 13 | | 23 | | 9 | 2012(b) | | 61 | | 19 | | 68 | | 22 | | — | | — | 2013 and after | | 1,765 | | 587 | | — | | — | | — | | — | Unlimited | | 560 | | 189 | | 641 | | 216 | | 638 | | 223 | Total | | 2,879 | | 1,031 | | 1,383 | | 560 | | 1,561 | | 633 |
| (a) | Net operating losses and tax credit carryforwards in 2011 and after for 20102006. |
| (b) | Net operating losses and subsequent years related to fiscal 2005.tax credit carryforwards in 2012 and after for 2007. |
10.10) INTANGIBLE ASSETS
| | As of December 31,(M€) | | 2006 | | 2005 | | | As of December 31, 2008(M€) | | | | | | | Cost | | Depreciation
and
amortization | | Net | | Cost | | Depreciation
and
amortization | | Net | | Cost | | Amortization
and
impairment | | Net | Goodwill | | 1,759 | | (635 | ) | | 1,124 | | 2,479 | | (1,318 | ) | | 1,161 | | 1,690 | | (616 | ) | | 1,074 | Proved and unproved leasehold rights | | 5,457 | | (2,473 | ) | | 2,984 | | 5,213 | | (2,659 | ) | | 2,554 | | Proved and unproved mineral interests | | | 6,010 | | (2,268 | ) | | 3,742 | Other intangible assets | | 2,377 | | (1,780 | ) | | 597 | | 2,684 | | (2,015 | ) | | 669 | | 2,519 | | (1,994 | ) | | 525 | Total intangible assets | | 9,593 | | (4,888 | ) | | 4,705 | | 10,376 | | (5,992 | ) | | 4,384 | | 10,219 | | (4,878 | ) | | 5,341 |
| | | | | | | | | | | | | | | | | | | (M€) | | Net intangible
assets as of
January 1 | | Acquisitions | | Disposals | | | Net depreciation
and amortization
of intangible assets | | | Currency
translation
adjustment | | | Other | | Net intangible
assets as of
December 31 | 2006 | | 4,384 | | 675 | | (25 | ) | | (282 | ) | | (337 | ) | | 290 | | 4,705 | 2005 | | 3,176 | | 274 | | (91 | ) | | (370 | ) | | 296 | | | 1,099 | | 4,384 |
| | | | | | | | | As of December 31, 2007(M€) | | | | | | Cost | | Amortization and impairment | | | Net | Goodwill | | 1,684 | | (617 | ) | | 1,067 | Proved and unproved mineral interests | | 5,327 | | (2,310 | ) | | 3,017 | Other intangible assets | | 2,452 | | (1,886 | ) | | 566 | Total intangible assets | | 9,463 | | (4,813 | ) | | 4,650 |
| | | | | | | | | As of December 31, 2006(M€) | | | | | | Cost | | Amortization and impairment | | | Net | Goodwill | | 1,759 | | (635 | ) | | 1,124 | Proved and unproved mineral interests | | 5,457 | | (2,473 | ) | | 2,984 | Other intangible assets | | 2,377 | | (1,780 | ) | | 597 | Total intangible assets | | 9,593 | | (4,888 | ) | | 4,705 |
Changes in net intangible assets are analyzed in the following table: | | | | | | | | | | | | | | | | | | | (M€) | | Net amount as of
January 1, | | Acquisitions | | Disposals | | | Amortization and impairment | | | Currency
translation
adjustment | | | Other | | Net amount as of
December 31, | 2008 | | 4,650 | | 404 | | (3 | ) | | (259 | ) | | (93 | ) | | 642 | | 5,341 | 2007 | | 4,705 | | 472 | | (160 | ) | | (274 | ) | | (208 | ) | | 115 | | 4,650 | 2006 | | 4,384 | | 675 | | (25 | ) | | (282 | ) | | (337 | ) | | 290 | | 4,705 |
In 2005,2008, the heading “Other” includes mainly the impact of “proved and unproved mineral rights of Deer Creekinterests” from Synenco Energy LtdInc. for 1,015221 M€ and Goal Petroleum B.V. for 292 M€ (see Note 3 to the Consolidated Financial Statements). A summary of changes in the carrying amount of goodwill by business segment for the year ended December 31, 20062008 is as follows: | | (M€) | | Net goodwill as of
January 1, 2006 | | Increases | | Impairments | | Other | | Net goodwill as of
December 31, 2006 | | Net goodwill as of
January 1, 2008 | | Increases | | Impairments | | Other | | Net goodwill as of
December 31, 2008 | Upstream | | 96 | | — | | — | | (1 | ) | | 95 | | 78 | | — | | — | | | — | | | 78 | Downstream | | 123 | | 19 | | — | | (4 | ) | | 138 | | 132 | | 4 | | — | | | (6 | ) | | 130 | Chemicals | | 917 | | 84 | | — | | (135 | ) | | 866 | | 832 | | 24 | | (3 | ) | | (12 | ) | | 841 | Holding | | 25 | | — | | — | | — | | | 25 | | Corporate | | | 25 | | — | | — | | | — | | | 25 | Total | | 1,161 | | 103 | | — | | (140 | ) | | 1,124 | | 1,067 | | 28 | | (3 | ) | | (18 | ) | | 1,074 |
11.11) PROPERTY, PLANT AND EQUIPMENT
| | As of December 31,(M€) | | 2006 | | 2005 | | | As of December 31, 2008(M€) | | | | | | | Cost | | Depreciation
and
amortization | | Net | | Cost | | Depreciation
and
amortization | | Net | | Cost | | Depreciation
and
impairment | | Net | Upstream properties | | | | | | | | | | | | | | | | | | | Proved properties | | 60,063 | | (39,211 | ) | | 20,852 | | 58,980 | | (38,646 | ) | | 20,334 | | 61,727 | | (39,315 | ) | | 22,412 | Unproved properties | | 20 | | (1 | ) | | 19 | | 8 | | (1 | ) | | 7 | | 106 | | (1 | ) | | 105 | Work in progress | | 7,080 | | (22 | ) | | 7,058 | | 6,136 | | (29 | ) | | 6,107 | | 9,586 | | — | | | 9,586 | Subtotal | | 67,163 | | (39,234 | ) | | 27,929 | | 65,124 | | (38,676 | ) | | 26,448 | | 71,419 | | (39,316 | ) | | 32,103 | Other property, plant and equipment | | | | | | | | | | | | | | | | | | | Land and preparation costs | | 1,550 | | (445 | ) | | 1,105 | | 1,646 | | (392 | ) | | 1,254 | | Land | | | 1,446 | | (429 | ) | | 1,017 | Machinery, plant and equipment (including transportation equipment) | | 20,724 | | (14,131 | ) | | 6,593 | | 23,533 | | (16,699 | ) | | 6,834 | | 21,734 | | (14,857 | ) | | 6,877 | Buildings | | 5,392 | | (3,289 | ) | | 2,103 | | 6,444 | | (4,070 | ) | | 2,374 | | 5,739 | | (3,441 | ) | | 2,298 | Construction in progress | | 1,228 | | (14 | ) | | 1,214 | | 1,482 | | (31 | ) | | 1,451 | | Work in progress | | | 2,226 | | (10 | ) | | 2,216 | Other | | 6,154 | | (4,522 | ) | | 1,632 | | 7,805 | | (5,598 | ) | | 2,207 | | 6,258 | | (4,627 | ) | | 1,631 | Subtotal | | 35,048 | | (22,401 | ) | | 12,647 | | 40,910 | | (26,790 | ) | | 14,120 | | 37,403 | | (23,364 | ) | | 14,039 | Total property, plant and equipment | | 102,211 | | (61,635 | ) | | 40,576 | | 106,034 | | (65,466 | ) | | 40,568 | | 108,822 | | (62,680 | ) | | 46,142 |
| | | | | | | | | | | | | | | | | | | | (M€) | | Net tangible
assets as of
January 1 | | Acquisitions | | Disposals | | | Net depreciation
and amortization
of tangible
assets | | | Currency
translation
adjustment | | | Other | | | Net tangible
assets as of
December 31 | 2006 | | 40,568 | | 9,209 | | (175 | ) | | (5,010 | ) | | (2,373 | ) | | (1,643 | ) | | 40,576 | 2005 | | 34,906 | | 8,208 | | (336 | ) | | (5,282 | ) | | 3,013 | | | 59 | | | 40,568 |
| | | | | | | | | As of December 31, 2007 (M€) | | | | | | Cost | | Depreciation
and
impairment | | | Net | Upstream properties | | | | | | | | Proved properties | | 60,124 | | (38,735 | ) | | 21,389 | Unproved properties | | 48 | | (1 | ) | | 47 | Work in progress | | 7,010 | | — | | | 7,010 | Subtotal | | 67,182 | | (38,736 | ) | | 28,446 | Other property, plant and equipment | | | | | | | | Land | | 1,460 | | (417 | ) | | 1,043 | Machinery, plant and equipment (including transportation equipment) | | 20,575 | | (14,117 | ) | | 6,458 | Buildings | | 5,505 | | (3,430 | ) | | 2,075 | Work in progress | | 1,832 | | (4 | ) | | 1,828 | Other | | 6,291 | | (4,674 | ) | | 1,617 | Subtotal | | 35,663 | | (22,642 | ) | | 13,021 | Total property, plant and equipment | | 102,845 | | (61,378 | ) | | 41,467 |
| | | | | | | | | As of December 31, 2006(M€) | | | | | | Cost | | Depreciation
and
impairment | | | Net | Upstream properties | | | | | | | | Proved properties | | 60,063 | | (39,211 | ) | | 20,852 | Unproved properties | | 20 | | (1 | ) | | 19 | Work in progress | | 7,080 | | (22 | ) | | 7,058 | Subtotal | | 67,163 | | (39,234 | ) | | 27,929 | Other property, plant and equipment | | | | | | | | Land | | 1,550 | | (445 | ) | | 1,105 | Machinery, plant and equipment (including transportation equipment) | | 20,724 | | (14,131 | ) | | 6,593 | Buildings | | 5,392 | | (3,289 | ) | | 2,103 | Work in progress | | 1,228 | | (14 | ) | | 1,214 | Other | | 6,154 | | (4,522 | ) | | 1,632 | Subtotal | | 35,048 | | (22,401 | ) | | 12,647 | Total property, plant and equipment | | 102,211 | | (61,635 | ) | | 40,576 |
Changes in net property, plant and equipment are analyzed in the following table: | | | | | | | | | | | | | | | | | | | | (M€) | | Net amount
as of
January 1, | | Acquisitions | | Disposals | | | Depreciation
and
impairment | | | Currency
translation
adjustment | | | Other | | | Net amount
as of
December 31, | 2008 | | 41,467 | | 11,442 | | (102 | ) | | (5,941 | ) | | (1,151 | ) | | 427 | | | 46,142 | 2007 | | 40,576 | | 10,241 | | (729 | ) | | (5,674 | ) | | (2,347 | ) | | (600 | ) | | 41,467 | 2006 | | 40,568 | | 9,209 | | (175 | ) | | (5,010 | ) | | (2,373 | ) | | (1,643 | ) | | 40,576 |
In 2008, the “Other” heading mainly includes changes in net property, plant and equipment related to asset retirement obligations. In 2007, the “Disposals” heading mainly included the impact of conversion of the Sincor project and the disposal of the Group’s interest in the Milford Haven refinery. The “Other” heading mainly included the impact of conversion of Sincor and the changes in Property, plant and equipment related to asset retirement obligations. As of December 31,In 2006, the “Other” heading includes mainly included the impact of the spin-off of Arkema for 1,310 M€.
Property, plant and equipment presented above include the following amounts for facilities and equipment under finance leases that have been capitalized: | | | | | | | | | | | | | | | | As of December 31,(M€) | | 2006 | | 2005 | | | | Cost | | Depreciation
and
amortization | | | Net | | Cost | | Depreciation
and
amortization | | | Net | Machinery, plant, and equipment | | 518 | | (244 | ) | | 274 | | 491 | | (212 | ) | | 279 | Buildings | | 40 | | (27 | ) | | 13 | | 26 | | (18 | ) | | 8 | Development works | | — | | — | | | — | | — | | — | | | — | Total | | 558 | | (271 | ) | | 287 | | 517 | | (230 | ) | | 287 |
| | | | | | | | | As of December 31, 2008(M€) | | | | | | Cost | | Depreciation
and
impairment | | | Net | Machinery, plant and equipment | | 558 | | (316 | ) | | 242 | Buildings | | 35 | | (28 | ) | | 7 | Other | | — | | — | | | — | Total | | 593 | | (344 | ) | | 249 |
| | | | | | | | | As of December 31, 2007(M€) | | | | | | Cost | | Depreciation
and
impairment | | | Net | Machinery, plant and equipment | | 503 | | (265 | ) | | 238 | Buildings | | 35 | | (29 | ) | | 6 | Other | | — | | — | | | — | Total | | 538 | | (294 | ) | | 244 |
| | | | | | | | | As of December 31, 2006(M€) | | | | | | Cost | | Depreciation
and
impairment | | | Net | Machinery, plant and equipment | | 518 | | (244 | ) | | 274 | Buildings | | 40 | | (27 | ) | | 13 | Other | | — | | — | | | — | Total | | 558 | | (271 | ) | | 287 |
12.12) EQUITY AFFILIATES: INVESTMENTS AND LOANS
| | | | | | | | | | | | | | | | | | | | | | (M€) | | As of December 31, | | | | | | | | | | | | | | 2006
% owned | | | 2005
% owned | | | 2006
equity
value | | 2005
equity
value | | | 2006
equity in
income
(loss) | | | 2005
equity in
income
(loss) | | | 2004
equity in
income
(loss) | | NLNG | | 15.00 | % | | 15.00 | % | | 887 | | 726 | | | 329 | | | 190 | | | 158 | | CEPSA (Upstream share) | | 48.83 | % | | 45.28 | % | | 253 | | 311 | | | 104 | | | 99 | | | 75 | | Qatargas | | 10.00 | % | | 10.00 | % | | 186 | | 156 | | | 119 | | | 46 | | | 42 | | Gasoducto Gasandes Argentina | | 56.50 | % | | 56.50 | % | | 115 | | 132 | | | 7 | | | 7 | | | 6 | | SCP Limited | | 10.00 | % | | 10.00 | % | | 100 | | 89 | | | — | | | — | | | — | | Ocensa | | 15.20 | % | | 15.20 | % | | 64 | | 71 | | | — | | | — | | | — | | Société du Terminal Méthanier De Fos Cavaou(c) | | 30.30 | % | | — | | | 63 | | — | | | (4 | ) | | — | | | — | | Moattama Gas Transportation Cy | | 31.24 | % | | 31.24 | % | | 61 | | 64 | | | 63 | | | 45 | | | 40 | | Hidroneuquen Piedra del Aguila(a) | | — | | | 41.30 | % | | — | | 61 | | | — | | | 4 | | | 41 | | Total Tractebel Emirates Power Company | | 50.00 | % | | 50.00 | % | | 61 | | 55 | | | 3 | | | 3 | | | 4 | | Qatar Liquefied Gas Company Limited(c) | | 8.35 | % | | — | | | 55 | | — | | | — | | | — | | | — | | Abu Dhabi Gas Ind, Ltd | | 15.00 | % | | 15.00 | % | | 48 | | 54 | | | — | | | — | | | — | | Gas Invest SA | | 27.24 | % | | 27.24 | % | | 53 | | 47 | | | 12 | | | (3 | ) | | (59 | ) | Gasoducto Gasandes sa (Chili) | | 56.50 | % | | 56.50 | % | | 39 | | 40 | | | — | | | — | | | 2 | | Humber Power Ltd(a) | | — | | | — | | | — | | — | | | — | | | 16 | | | 24 | | CFMH(a) | | — | | | — | | | — | | — | | | — | | | — | | | 35 | | Other | | — | | | — | | | 168 | | 145 | | | 13 | | | 28 | | | 35 | | Total Upstream | | | | | | | | 2,153 | | 1,951 | | | 646 | | | 435 | | | 403 | | CEPSA (Downstream share) | | 48.83 | % | | 45.28 | % | | 1,735 | | 1,372 | | | 246 | | | 321 | | | 211 | | Wepec(b) | | 22.41 | % | | 22.41 | % | | 62 | | 74 | | | 1 | | | 11 | | | — | | Other | | — | | | — | | | 125 | | 129 | | | 26 | | | 24 | | | 15 | | Total Downstream | | | | | | | | 1,922 | | 1,575 | | | 273 | | | 356 | | | 226 | | CEPSA (Chemicals share) | | 48.83 | % | | 45.28 | % | | 503 | | 431 | | | 26 | | | 39 | | | 29 | | Qatar Petrochemical Company Ltd | | 20.00 | % | | 20.00 | % | | 147 | | 141 | | | 45 | | | 39 | | | 32 | | Other | | — | | | — | | | 63 | | 161 | | | — | | | 4 | | | 9 | | Total Chemicals | | | | | | | | 713 | | 733 | | | 71 | | | 82 | | | 70 | | Sanofi-Aventis | | 13.13 | % | | 13.19 | % | | 7,010 | | 7,087 | | | 556 | | | 299 | | | 459 | | CEPSA (Holding share) | | 48.83 | % | | 45.28 | % | | — | | — | | | 147 | | | — | | | — | | Other | | — | | | — | | | — | | 7 | | | — | | | 1 | | | — | | Total Holding | | | | | | | | 7,010 | | 7,094 | | | 703 | | | 300 | | | 459 | | Total investments | | | | | | | | 11,798 | | 11,353 | | | 1,693 | | | 1,173 | | | 1,158 | | Loans | | | | | | | | 1,533 | | 1,299 | | | | | | | | | | | Total investments and loans | | | | | | | | 13,331 | | 12,652 | | | | | | | | | | |
| | | | | | | | | | | | | | | | | Equity value (M€) | | As of December 31, | | | | 2008 | | | 2007 | | | 2006 | | | 2008 | | 2007 | | 2006 | | | | | | | % owned | | | | | | Equity value | NLNG | | 15.00 | % | | 15.00 | % | | 15.00 | % | | 1,135 | | 1,062 | | 887 | PetroCedeño — EM(b) | | 30.32 | % | | 30.32 | % | | — | | | 760 | | 534 | | — | CEPSA (Upstream share) | | 48.83 | % | | 48.83 | % | | 48.83 | % | | 403 | | 246 | | 253 | Angola LNG Ltd.(b) | | 13.60 | % | | 13.60 | % | | — | | | 326 | | 155 | | — | Qatargas | | 10.00 | % | | 10.00 | % | | 10.00 | % | | 251 | | 172 | | 186 | Société du Terminal Méthanier de Fos Cavaou(a) | | 30.30 | % | | 30.30 | % | | 30.30 | % | | 114 | | 92 | | 63 | SCP Limited | | 10.00 | % | | 10.00 | % | | 10.00 | % | | 96 | | 91 | | 100 | Dolphin Energy Ltd (Del) Abu Dhabi | | 24.50 | % | | 24.50 | % | | 24.50 | % | | 85 | | 37 | | 16 | Qatar Liquefied Gas Company Limited II(a) | | 8.35 | % | | 8.35 | % | | 8.35 | % | | 82 | | 86 | | 55 | Moattama Gas Transportation Cy | | 31.24 | % | | 31.24 | % | | 31.24 | % | | 65 | | 53 | | 61 | Ocensa | | 15.20 | % | | 15.20 | % | | 15.20 | % | | 60 | | 57 | | 64 | Gasoducto Gasandes Argentina | | 56.50 | % | | 56.50 | % | | 56.50 | % | | 58 | | 74 | | 115 | GazTransport et Technigaz(b) | | 30.00 | % | | 30.00 | % | | — | | | 53 | | 46 | | — | Laffan Refinery | | 10.00 | % | | 10.00 | % | | 10.00 | % | | 53 | | 39 | | 22 | Other | | — | | | — | | | — | | | 350 | | 277 | | 331 | Total Upstream | | | | | | | | | | | 3,891 | | 3,021 | | 2,153 | CEPSA (Downstream share) | | 48.83 | % | | 48.83 | % | | 48.83 | % | | 1,810 | | 1,932 | | 1,735 | Saudi Aramco Total Refining & Petrochemicals(c) | | 37.50 | % | | — | | | — | | | 75 | | — | | — | Wepec | | 22.41 | % | | 22.41 | % | | 22.41 | % | | — | | 70 | | 62 | Other | | | | | | | | | | | 73 | | 103 | | 125 | Total Downstream | | | | | | | | | | | 1,958 | | 2,105 | | 1,922 | CEPSA (Chemicals share) | | 48.83 | % | | 48.83 | % | | 48.83 | % | | 424 | | 524 | | 503 | Qatar Petrochemical Company Ltd | | 20.00 | % | | 20.00 | % | | 20.00 | % | | 192 | | 150 | | 147 | Other | | | | | | | | | | | 61 | | 54 | | 63 | Total Chemicals | | | | | | | | | | | 677 | | 728 | | 713 | Sanofi-Aventis | | 11.38 | % | | 13.06 | % | | 13.13 | % | | 6,137 | | 6,851 | | 7,010 | Other | | | | | | | | | | | — | | — | | — | Total Corporate | | | | | | | | | | | 6,137 | | 6,851 | | 7,010 | Total investments | | | | | | | | | | | 12,663 | | 12,705 | | 11,798 | Loans | | | | | | | | | | | 2,005 | | 2,575 | | 1,533 | Total investments and loans | | | | | | | | | | | 14,668 | | 15,280 | | 13,331 |
| (a) | Investment disposed of in 2005 andaccounted for by the equity method as from 2006. |
| (b) | Investment accounted for underby the equity method beginning in 2005.as from 2007. |
| (c) | New acquisitionsInvestment accounted for by the equity method as from 2008. |
| | | | | | | | | | | | | | | | | | | | Equity in income (loss) (M€) | | As of December 31, | | | For the year ended December 31, | | | | | 2008 | | | 2007 | | | 2006 | | | 2008 | | | 2007 | | | 2006 | | | | | | | | % owned | | | | | | Equity in income (loss) | | NLNG | | 15.00 | % | | 15.00 | % | | 15.00 | % | | 554 | | | 477 | | | 329 | | PetroCedeño — EM(b) | | 30.32 | % | | 30.32 | % | | — | | | 193 | | | — | | | — | | CEPSA (Upstream share) | | 48.83 | % | | 48.83 | % | | 48.83 | % | | 50 | | | 88 | | | 104 | | Angola LNG Ltd.(b) | | 13.60 | % | | 13.60 | % | | — | | | 10 | | | 7 | | | — | | Qatargas | | 10.00 | % | | 10.00 | % | | 10.00 | % | | 126 | | | 74 | | | 119 | | Société du Terminal Méthanier de Fos Cavaou(a) | | 30.30 | % | | 30.30 | % | | 30.30 | % | | (5 | ) | | (2 | ) | | (4 | ) | SCP Limited | | 10.00 | % | | 10.00 | % | | 10.00 | % | | 4 | | | 1 | | | — | | Dolphin Energy Ltd (Del) Abu Dhabi | | 24.50 | % | | 24.50 | % | | 24.50 | % | | 83 | | | 5 | | | (2 | ) | Qatar Liquefied Gas Company Limited II(a) | | 8.35 | % | | 8.35 | % | | 8.35 | % | | (11 | ) | | (5 | ) | | — | | Moattama Gas Transportation Cy | | 31.24 | % | | 31.24 | % | | 31.24 | % | | 81 | | | 67 | | | 63 | | Ocensa | | 15.20 | % | | 15.20 | % | | 15.20 | % | | — | | | — | | | — | | Gasoducto Gasandes Argentina | | 56.50 | % | | 56.50 | % | | 56.50 | % | | (10 | ) | | (22 | ) | | 7 | | GazTransport et Technigaz(b) | | 30.00 | % | | 30.00 | % | | — | | | 51 | | | 45 | | | — | | Laffan Refinery | | 10.00 | % | | 10.00 | % | | 10.00 | % | | 2 | | | — | | | — | | Other | | — | | | — | | | — | | | 50 | | | 6 | | | 30 | | Total Upstream | | | | | | | | | | | 1,178 | | | 741 | | | 646 | | CEPSA (Downstream share) | | 48.83 | % | | 48.83 | % | | 48.83 | % | | 76 | | | 253 | | | 246 | | Saudi Aramco Total Refining & Petrochemicals(c) | | 37.50 | % | | — | | | — | | | — | | | — | | | — | | Wepec | | 22.41 | % | | 22.41 | % | | 22.41 | % | | (110 | ) | | 14 | | | 1 | | Other | | | | | | | | | | | (13 | ) | | (1 | ) | | 26 | | Total Downstream | | | | | | | | | | | (47 | ) | | 266 | | | 273 | | CEPSA (Chemicals share) | | 48.83 | % | | 48.83 | % | | 48.83 | % | | 10 | | | 24 | | | 26 | | Qatar Petrochemical Company Ltd | | 20.00 | % | | 20.00 | % | | 20.00 | % | | 66 | | | 55 | | | 45 | | Other | | | | | | | | | | | (1 | ) | | 1 | | | — | | Total Chemicals | | | | | | | | | | | 75 | | | 80 | | | 71 | | Sanofi-Aventis | | 11.38 | % | | 13.06 | % | | 13.13 | % | | 515 | | | 688 | | | 556 | | CEPSA (Corporate share) | | 48.83 | % | | 48.83 | % | | 48.83 | % | | — | | | — | | | 147 | | Other | | | | | | | | | | | — | | | — | | | — | | Total Corporate | | | | | | | | | | | 515 | | | 688 | | | 703 | | Total investments | | | | | | | | | | | 1,721 | | | 1,775 | | | 1,693 | |
| (a) | Investment accounted for by the equity method as from 2006. |
| (b) | Investment accounted for by the equity method as from 2007. |
| (c) | Investment accounted for by the equity method as from 2008. |
The market value of the Group’sGroup's share in CEPSA amounted to 7,7628,833 M€ as of December 31, 2006. 2008 for an equity value of 2,637 M€. The market value of the Group’s share in Sanofi-Aventis amounted to 12,4856,744 M€ as of December 31, 2006.2008. In Group share, the main financial items of the equity affiliates are as follows: | | | | | | | | CEPSA | | | | | | | | Condensed Balance Sheet as of December 31, 2006(M€) | Non-current assets | | 4,465 | | Shareholders’ equity | | 4,838 | Current assets | | 4,259 | | Non-current liabilities | | 1,356 | | | | | | Current liabilities | | 2,530 | Total | | 8,724 | | Total | | 8,724 | | | | | | | | | Income Statement Information as of December 31, 2006(M€) | Revenues | | | | | | 18,473 | Consolidated net income, Group share | | | | | | 812 |
| | | | As of December 31, (M€) | | 2008 | Assets | | 23,173 | Shareholders' equity | | 12,663 | Liabilities | | 10,510 |
| | | | | | | | Sanofi-Aventis | | | | | | | | Condensed Balance Sheet as of December 31, 2006(M€) | Non-current assets | | 65,603 | | Shareholders’ equity | | 45,820 | Current assets | | 12,160 | | Non-current liabilities | | 21,665 | | | | | | Current liabilities | | 10,278 | Total | | 77,763 | | Total | | 77,763 | | | | | | | | | Income Statement information as of December 31, 2006(M€) | Revenues | | | | | | 28,373 | Consolidated net income, Group share | | | | | | 4,006 |
| | | | For the year ended December 31,(M€) | | 2008 | | Revenues from sales | | 19,982 | | Pre-tax income | | 2,412 | | Income tax | | (691 | ) | Net income | | 1,721 | |
13.13) OTHER INVESTMENTS
| | | | | | | | | | | | | | As of December 31,(M€) | | 2006 | | 2005 | | | | Carrying
amount | | Unrealized
gain (loss) | | Balance
sheet value | | Carrying
amount | | Unrealized
gain (loss) | | Balance
sheet value | I.C.E. (Inter Continental Exchange)(a) | | — | | — | | — | | 1 | | 138 | | 139 | Santander Central Hispano (SCH)(a) | | — | | — | | — | | 93 | | 88 | | 181 | Areva | | 69 | | 135 | | 204 | | 69 | | 79 | | 148 | Arkema | | 16 | | 8 2 | | 98 | | — | | — | | — | Other publicly traded equity securities | | 1 | | 1 | | 2 | | 1 | | — | | 1 | Total publicly traded equity securities(b) | | 86 | | 218 | | 304 | | 164 | | 305 | | 469 | BBPP | | 80 | | — | | 80 | | 89 | | | | 89 | Oman LNG LLC | | 6 | | — | | 6 | | 7 | | | | 7 | BTC Limited | | 185 | | — | | 185 | | 177 | | | | 177 | Other equity securities | | 675 | | — | | 675 | | 774 | | | | 774 | Total other equity securities(b) | | 946 | | — | | 946 | | 1,047 | | — | | 1,047 | Other investments | | 1,032 | | 218 | | 1,250 | | 1,211 | | 305 | | 1,516 |
| | | | | | | | | As of December 31,2008(M€) | | Carrying
amount | | Unrealized gain (loss) | | | Balance
Sheet value | Areva(a) | | 69 | | 59 | | | 128 | Arkema | | 16 | | 15 | | | 31 | Chicago Mercantile Exchange Group(b) | | 1 | | 5 | | | 6 | Olympia Energy Fund(c) | | 36 | | (5 | ) | | 31 | Other publicly traded equity securities | | — | | — | | | — | Total publicly traded equity securities(d) | | 122 | | 74 | | | 196 | BBPP | | 75 | | — | | | 75 | BTC Limited | | 161 | | — | | | 161 | Other equity securities | | 733 | | — | | | 733 | Total other equity securities(d) | | 969 | | — | | | 969 | Other investments | | 1,091 | | 74 | | | 1,165 | | | | | | | | | | As of December 31, 2007(M€) | | Carrying
amount | | Unrealized gain (loss) | | | Balance
Sheet value | Areva(a) | | 69 | | 216 | | | 285 | Arkema | | 16 | | 97 | | | 113 | Nymex Holdings Inc | | 1 | | 15 | | | 16 | Other publicly traded equity securities | | — | | — | | | — | Total publicly traded equity securities(d) | | 86 | | 328 | | | 414 | BBPP | | 71 | | — | | | 71 | BTC Limited | | 161 | | — | | | 161 | Other equity securities | | 645 | | — | | | 645 | Total other equity securities(d) | | 877 | | — | | | 877 | Other investments | | 963 | | 328 | | | 1,291 |
| | | | | | | | As of December 31,(M€) | | 2006 | | | | Carrying
amount | | Unrealized
gain (loss) | | Balance
sheet value | Areva(a) | | 69 | | 135 | | 204 | Arkema | | 16 | | 82 | | 98 | Other publicly traded equity securities | | 1 | | 1 | | 2 | Total publicly traded equity securities(d) | | 86 | | 218 | | 304 | BBPP | | 80 | | — | | 80 | BTC Limited | | 185 | | — | | 185 | Other equity securities | | 681 | | — | | 681 | Total other equity securities(d) | | 946 | | — | | 946 | Other investments | | 1,032 | | 218 | | 1,250 |
| (a) | Shares sold in 2006.Unrealized gain based on the investment certificate. |
| (b) | The Nymex Holdings Inc. securities have been exchanged during the acquisition process running from June 11 to August 22, 2008 through which Chicago Mercantile Exchange Group acquired all the Nymex Holdings Inc. securities. |
| (c) | Securities acquired in 2008. |
| (d) | Including cumulative impairments of 608 M€ in 2008, 632 M€ in 2007 and 668 M€ in 2006 and 820 M€ in 2005.2006. |
These investments are recognized under “Financialclassified as financial assets available for sale”sale (see paragraph M of Note 1 paragraph Mii to the Consolidated Financial Statements). 14.14) OTHER NON-CURRENT ASSETS
| | | | | | | | | | | | | | | | As of December 31,(M€) | | 2006 | | 2005 | | | | Gross
value | | Valuation
allowance | | | Net
value | | Gross
value | | Valuation
allowance | | | Net
value | Deferred income tax assets | | 806 | | — | | | 806 | | 1,392 | | — | | | 1,392 | Loans and advances(a) | | 1,513 | | (488 | ) | | 1,025 | | 1,786 | | (584 | ) | | 1,202 | Other | | 257 | | — | | | 257 | | 200 | | — | | | 200 | Total | | 2,576 | | (488 | ) | | 2,088 | | 3,378 | | (584 | ) | | 2,794 |
| | | | | | | | | As of December 31, 2008(M€) | | Gross
value | | Valuation
allowance | | | Net
value | Deferred income tax assets | | 1,010 | | — | | | 1,010 | Loans and advances(a) | | 1,932 | | (529 | ) | | 1,403 | Other | | 631 | | — | | | 631 | Total | | 3,573 | | (529 | ) | | 3,044 |
| | | | | | | | | As of December 31, 2007(M€) | | Gross
value | | Valuation
allowance | | | Net
value | Deferred income tax assets | | 797 | | — | | | 797 | Loans and advances(a) | | 1,378 | | (527 | ) | | 851 | Other | | 507 | | — | | | 507 | Total | | 2,682 | | (527 | ) | | 2,155 |
| | | | | | | | | As of December 31, 2006(M€) | | Gross
value | | Valuation
allowance | | | Net
value | Deferred income tax assets | | 806 | | — | | | 806 | Loans and advances(a) | | 1,513 | | (488 | ) | | 1,025 | Other | | 257 | | — | | | 257 | Total | | 2,576 | | (488 | ) | | 2,088 |
| (a) | Excluding loans to equity affiliates. |
Changes in the valuation allowance on loans and advances are detailed as follows: | | | | | | | | | | | | | | | (M€) For the year ended December 31, | | Valuation
allowance as of
January 1, | | | Increases | | | Decreases | | Currency
translation
adjustment and
other variations | | | Valuation
allowance as of
December 31, | | 2008 | | (527 | ) | | (33 | ) | | 52 | | (21 | ) | | (529 | ) | 2007 | | (488 | ) | | (13 | ) | | 6 | | (32 | ) | | (527 | ) | 2006 | | (584 | ) | | (6 | ) | | 23 | | 79 | | | (488 | ) |
15.15) INVENTORIES
| | As of December 31,(M€) | | 2006 | | 2005 | | | | | Gross
value | | Valuation
allowance | | Net
value | | Gross
value | | Valuation
allowance | | Net
value | | | As of December 31, 2008(M€) | | | Gross value | | Valuation
allowance | | Net value | Crude oil and natural gas | | 4,038 | | (90 | ) | | 3,948 | | 3,619 | | — | | | 3,619 | | 2,772 | | (326 | ) | | 2,446 | Refined products | | 5,373 | | (44 | ) | | 5,329 | | 5,584 | | (14 | ) | | 5,570 | | 4,954 | | (416 | ) | | 4,538 | Chemical products | | 1,544 | | (90 | ) | | 1,454 | | 2,803 | | (175 | ) | | 2,628 | | Chemicals products | | | 1,419 | | (105 | ) | | 1,314 | Other inventories | | 1,231 | | (216 | ) | | 1,015 | | 1,097 | | (224 | ) | | 873 | | 1,591 | | (268 | ) | | 1,323 | Total | | 12,186 | | (440 | ) | | 11,746 | | 13,103 | | (413 | ) | | 12,690 | | 10,736 | | (1,115 | ) | | 9,621 |
| | | | | | | | | As of December 31, 2007(M€) | | Gross value | | Valuation
allowance | | | Net value | Crude oil and natural gas | | 4,746 | | — | | | 4,746 | Refined products | | 6,874 | | (11 | ) | | 6,863 | Chemicals products | | 1,188 | | (91 | ) | | 1,097 | Other inventories | | 1,368 | | (223 | ) | | 1,145 | Total | | 14,176 | | (325 | ) | | 13,851 |
| | | | | | | | | As of December 31, 2006(M€) | | Gross value | | Valuation
allowance | | | Net value | Crude oil and natural gas | | 4,038 | | (90 | ) | | 3,948 | Refined products | | 5,373 | | (44 | ) | | 5,329 | Chemicals products | | 1,544 | | (90 | ) | | 1,454 | Other inventories | | 1,231 | | (216 | ) | | 1,015 | Total | | 12,186 | | (440 | ) | | 11,746 |
Changes in the valuation allowance on inventories are as follows: | | | | | | | | | | | | | (M€) For the year ended December 31, | | Valuation allowance
as of
January 1, | | | Increase
(net) | | | Currency
translation
adjustment
and other
variations | | | Valuation
allowance
as of
December 31, | | 2008 | | (325 | ) | | (740 | ) | | (50 | ) | | (1,115 | ) | 2007 | | (440 | ) | | 124 | | | (9 | ) | | (325 | ) | 2006 | | (413 | ) | | (118 | ) | | 91 | | | (440 | ) |
16.16) ACCOUNTS RECEIVABLE AND OTHER CURRENT ASSETS
| | As of December 31,(M€) | | 2006 | | 2005 | | | | | Gross
value | | Valuation
allowance | | Net
value | | Gross
value | | Valuation
allowance | | Net
value | | | As of December 31, 2008(M€) | | | Gross
value | | Valuation
allowance | | Net
value | Accounts receivable | | 17,882 | | (489 | ) | | 17,393 | | 20,174 | | (562 | ) | | 19,612 | | 15,747 | | (460 | ) | | 15,287 | Other receivables | | 1,878 | | — | | | 1,878 | | 1,534 | | — | | | 1,534 | | Recoverable taxes | | 2,098 | | — | | | 2,098 | | 2,119 | | — | | | 2,119 | | 2,510 | | — | | | 2,510 | Other operating receivables | | | 6,227 | | (19 | ) | | 6,208 | Deferred income tax | | 94 | | — | | | 94 | | 126 | | — | | | 126 | | 206 | | — | | | 206 | Prepaid expenses | | 745 | | — | | | 745 | | 799 | | — | | | 799 | | 650 | | — | | | 650 | Other current assets | | 2,471 | | (39 | ) | | 2,432 | | 2,284 | | (63 | ) | | 2,221 | | 68 | | — | | | 68 | Other current assets | | 7,286 | | (39 | ) | | 7,247 | | 6,862 | | (63 | ) | | 6,799 | | 9,661 | | (19 | ) | | 9,642 |
| | | | | | | | | As of December 31, 2007(M€) | | Gross
value | | Valuation
allowance | | | Net
value | Accounts receivable | | 19,611 | | (482 | ) | | 19,129 | Recoverable taxes | | 2,735 | | — | | | 2,735 | Other operating receivables | | 4,457 | | (27 | ) | | 4,430 | Deferred income tax | | 112 | | — | | | 112 | Prepaid expenses | | 687 | | — | | | 687 | Other current assets | | 42 | | — | | | 42 | Other current assets | | 8,033 | | (27 | ) | | 8,006 |
| | | | | | | | | As of December 31, 2006(M€) | | Gross
value | | Valuation
allowance | | | Net
value | Accounts receivable | | 17,882 | | (489 | ) | | 17,393 | Recoverable taxes | | 2,098 | | — | | | 2,098 | Other operating receivables | | 4,306 | | (39 | ) | | 4,267 | Deferred income tax | | 94 | | — | | | 94 | Prepaid expenses | | 745 | | — | | | 745 | Other current assets | | 43 | | — | | | 43 | Other current assets | | 7,286 | | (39 | ) | | 7,247 |
Changes in the valuation allowance on “Accounts receivable” and “Other current assets” are as follows: | | | | | | | | | | | | | (in M€) | | Valuation
allowance as of
January 1, | | | Increase (net) | | | Currency translation
adjustments and
other variations | | Valuation
allowance as of
December 31, | | Accounts receivable | | | | | | | | | | | | 2008 | | (482 | ) | | 9 | | | 13 | | (460 | ) | 2007 | | (489 | ) | | (25 | ) | | 32 | | (482 | ) | 2006 | | (562 | ) | | 6 | | | 67 | | (489 | ) | | | | | | Other current assets | | | | | | | | | | | | 2008 | | (27 | ) | | 7 | | | 1 | | (19 | ) | 2007 | | (39 | ) | | (4 | ) | | 16 | | (27 | ) | 2006 | | (63 | ) | | (1 | ) | | 25 | | (39 | ) |
As of December 31, 2008, the portion of the past due receivables included in “Accounts receivable” and “Other current assets” is 3,744 M€, of which 2,420 M€ has been overdue for less than 90 days, 729 M€ between 90 days and 6 months, 54 M€ between 6 and 12 months and 541 M€ for more than 12 months. 17.17) SHAREHOLDERS’ EQUITY
NUMBER OF TOTAL SHARES The Company’s common shares, par value€2.50, per share as of December 31, 2006,2008 are the only category of shares. Following the decision of the shareholders’ meeting held on May 12, 2006, through the 15th resolution, a four-for-one stock split took place on May 18, 2006. Shares may be held in either bearer or registered form. Double voting rights are granted to holders of shares that are fully-paid and held in the name of the same shareholder for at least two years.years, with due consideration for the total portion of the share capital represented. Double voting rights are also assigned to restricted shares in the event of an increase in share capital by incorporation of reserves, profits or premiums based on shares already held that are entitled to double voting rights. Pursuant to the Company’s by-lawsbylaws (statuts)Statuts), no shareholder may cast a vote at a shareholders’ meeting, either by himself or through an agent, representing more than 10% of the total voting rights for the Company’s shares. This limit applies to the aggregated amount of voting rights held directly, indirectly or through voting proxies. However, in the case of double voting rights, this limit may be extended to 20%. These restrictions no longer apply if any individual or entity, acting alone or in concert, acquires at least two-thirds of the total share capital of the Company, directly or indirectly, following a public tender offer for all of the Company’s shares.
The authorized share capital amounts to 4,081,629,7943,413,204,025 shares as of December 31, 2006 against 1,034,280,6402008 compared to 4,042,585,605 as of December 31, 20052007 and 1,069,761,1344,081,629,794 as of December 31, 2004 (or respectively 4,137,122,560 and 4,279,044,536 pursuant to the four-for-one split of the shares of May 18, 2006).2006.
| | | | | | | | | | | | | | Historical figures | | | Restated
historical
figures(5) | | As of January 1, 2004 | | | | 649,118,236 | | | 2,596,472,944 | | Shares issued in connection with: | | Capital increase reserved for employees | | 3,434,830 | | | 13,739,320 | | | | Exercise of TOTAL share subscription options | | 950 | | | 3,800 | | | | Exchange guarantee offered to the beneficiaries of Elf Aquitaine share subscription options | | 2,335,024 | | | 9,340,096 | | Cancellation of shares(a) | | | | (19,873,932 | ) | | (79,495,728 | ) | As of January 1, 2005 | | | | 635,015,108 | | | 2,540,060,432 | | Shares issued in connection with: | | Exercise of TOTAL share subscription options | | 133,257 | | | 533,028 | | | | Exchange guarantee offered to the beneficiaries of Elf Aquitaine share subscription options | | 1,043,499 | | | 4,173,996 | | Cancellation of shares(b) | | | | (21,075,568 | ) | | (84,302,272 | ) | As of January 1, 2006 | | | | 615,116,296 | | | 2,460,465,184 | | Shares issued in connection with: | | Four-for-one split of shares par value | | 1,845,348,888 | | | — | | | | Capital increase reserved for employees | | 11,141,320 | | | 11,141,320 | | | | Exercise of TOTAL share subscription options | | 849,319 | | | 849,319 | | | | Exchange guarantee offered to the beneficiaries of Elf Aquitaine share subscription options | | 332,130 | | | 332,130 | | Cancellation of shares(c) | | | | (47,020,000 | ) | | (47,020,000 | ) | As of December 31, 2006(d) | | | | 2,425,767,953 | | | 2,425,767,953 | |
| | | | | | | | | | | | | | Historical figures | | | Restated
historical
figures(a) | | As of January 1, 2006 | | | | 615,116,296 | | | 2,460,465,184 | | Shares issued in connection with: | | Four-for-one stock split of share par value | | 1,845,348,888 | | | | | | | Capital increase reserved for employees | | 11,141,320 | | | 11,141,320 | | | | Exercise of TOTAL share subscription options | | 849,319 | | | 849,319 | | | | Exchange guarantee offered to the beneficiaries of Elf Aquitaine share subscription options | | 332,130 | | | 332,130 | | Cancellation of shares(b) | | | | (47,020,000 | ) | | (47,020,000 | ) | As of January 1, 2007 | | | | 2,425,767,953 | | | 2,425,767,953 | | Shares issued in connection with: | | Exercise of TOTAL share subscription options | | 2,453,832 | | | | | | | Exchange guarantee offered to the beneficiaries of Elf Aquitaine share subscription options | | 315,312 | | | | | Cancellation of shares(c) | | | | (33,005,000 | ) | | | | As of January 1, 2008 | | | | 2,395,532,097 | | | | | Shares issued in connection with: | | Capital increase reserved for employees | | 4,870,386 | | | | | | | Exercise of TOTAL share subscription options | | 1,178,167 | | | | | | | Exchange guarantee offered to the beneficiaries of Elf Aquitaine share subscription options | | 227,424 | | | | | Cancellation of shares(d) | | | | (30,000,000 | ) | | | | As of December 31, 2008(e) | | | | 2,371,808,074 | | | | |
| (a) | Decided byHistorical figures are restated to take into account the Board of Directorsfour-for-one stock split on November 9, 2004.May 18, 2006. |
| (b) | Decided by the Board of Directors on July 19, 2005 and November 3, 2005. |
(c) | Decided by the Board of Directors on July 18, 2006. |
| (c) | Decided by the Board of Directors on January 10, 2007. |
| (d) | Decided by the Board of Directors on July 31, 2008. |
| (e) | Including 161,200,707143,082,095 treasury shares deducted from consolidated shareholders’ equity. |
The calculation of the weighted-average number of shares and of diluted shares, used for the presentation of the earnings per share and the diluted earnings per share respectively is detailed as follows: | | | | | | | | | | | | | 2008 | | | 2007 | | | 2006(a) | | | Number of shares as of January 1, | | 2,395,532,097 | | | 2,425,767,953 | | | 2,460,465,184 | | Number of shares issued during the year (pro rated) | | | | | | | | | | Exercise of TOTAL share subscription options | | 742,588 | | | 1,020,190 | | | 304,461 | | Exercise of TOTAL share purchase options | | 2,426,827 | | | 4,141,186 | | | 3,756,803 | | Exchange guarantee offered to the beneficiaries of Elf Aquitaine share subscription options | | 86,162 | | | 163,074 | | | 169,146 | | TOTAL restricted shares | | 1,112,393 | | | 1,114,796 | | | — | | Capital increase reserved for employees | | 3,246,924 | | | — | | | 9,284,433 | | TOTAL shares held by TOTAL S.A. or by its subsidiaries and deducted from shareholders’ equity | | (168,290,440 | ) | | (176,912,968 | ) | | (180,916,837 | ) | Weighted-average number of shares | | 2,234,856,551 | | | 2,255,294,231 | | | 2,293,063,190 | | Dilutive effect | | | | | | | | | | TOTAL share subscription and purchase options | | 6,784,200 | | | 13,698,928 | | | 14,758,984 | | TOTAL restricted shares | | 4,172,944 | | | 4,387,761 | | | 3,218,410 | | Exchange guarantee offered to the beneficiaries of Elf Aquitaine share subscription options | | 460,935 | | | 655,955 | | | 833,908 | | Capital increase reserved for employees | | 383,912 | | | 348,109 | | | 430,160 | | Weighted-average number of diluted shares | | 2,246,658,542 | | | 2,274,384,984 | | | 2,312,304,652 | |
(e)(a) | Historical figuresFigures are restated to reflecttake into account the four-for-one stock split of the shares on May 18, 2006. |
The variation of the weighted-average number of diluted shares used in the calculation of earnings per share is detailed as follows:
| | | | | | 2006 | | Number of shares as of January 1,(a) | | 2,460,465,184 | | Number of shares issued during the year (pro rated)
| | | | Exercise of TOTAL share subscription options
| | 304,461 | | Exercise of TOTAL share purchase options
| | 3,756,803 | | Exchange guarantee offered to the beneficiaries of Elf Aquitaine share subscription options
| | 169,146 | | Capital increase reserved for employees
| | 9,284,433 | | TOTAL shares held by TOTAL S.A. or by its subsidiaries and deducted from shareholders’ equity
| | (180,916,837 | ) | Weighted-average number of shares
| | 2,293,063,190 | | Dilutive effect
| | | | TOTAL share subscription and purchase options
| | 14,758,984 | | TOTAL restricted shares
| | 3,218,410 | | Exchange guarantee offered to the beneficiaries of Elf Aquitaine share subscription options
| | 833,908 | | Capital increase reserved for employees
| | 430,160 | | Weighted-average number of diluted shares
| | 2,312,304,652 | |
(a) | Historical figures are restated as per the four-for-one split of the shares of May 18, 2006. |
CAPITAL INCREASE RESERVED FOR GROUP EMPLOYEES At the shareholders’ meeting held on May 17, 2005,11, 2007, the shareholders delegated to the Board of Directors the authority to increase the share capital of the Company in one or more transactions and within a maximum period of 26 months from the date of the meeting, by an amount not exceeding 1.5% of the share capital outstanding on the date of the meeting of the Board of Directors at which a decision to proceed with an issuance is made reserving subscriptions for such issuance to the Group employees participating in a company savings plan. It is beingwas specified that the amount of any such capital increase reserved for Group employees willwould be counted against the aggregate maximum nominal amount of share capital increases authorized by the shareholders’ meeting held on May 17, 200511, 2007 for issuing new ordinary shares or other securities granting immediate or future access to the Company’s share capital with preferential subscription rights (4 B€ in nominal value). Pursuant to this delegation of authorization, the Board of Directors, during its November 3, 20056, 2007 meeting, implemented a first capital increase reserved for employees within the limit of 3 million shares with a par value of€10 per share (or 12 million shares, with a par value of€2.50, per share), at a price of€166.6044.40 per share, with a par value of€10 (or€ 41.65 per share with a par value of€2.50), with dividend rights as of the January 1, 2005.2007. The subscription period ranwas open from February 6, 2006March 10, 2008, to February 24, 2006,March 28, 2008, and 2,785,3304,870,386 new TOTAL shares with a par value of€10 per share (or 11,141,320 shares with a par value of€2.50 per share), were subscribed within the framework of this capital increase.issued in 2008. SHARE CANCELLATION Pursuant to the authorization granted by the shareholders’ meeting held on May 7, 200211, 2007 authorizing reduction of capital by cancellation of shares held by the Company within the limit of 10% of the outstanding capital every twenty-four24 months, the Board of Directors decided on July 18, 200631, 2008 to cancel 47,020,00030,000,000 shares with a par value of€2.50 per share,acquired in 2007 at an average price of€52.3154.69 per share. TREASURY SHARES (TOTAL SHARES HELD BY TOTAL S.A.) As of December 31, 2008, TOTAL S.A held 42,750,827 of its own shares, representing 1.80% of its share capital, detailed as follows: 12,627,522 shares allocated to covering TOTAL share purchase option plans for Group employees; 5,323,305 shares allocated to TOTAL restricted shares plans for Group employees; and 24,800,000 shares purchased for cancellation between January and October 2008 pursuant to the authorization granted by the shareholders’ meetings held on May 11, 2007 and May 16, 2008.
These shares are deducted from the consolidated shareholders’ equity. As of December 31, 2007, TOTAL S.A. held 51,089,964 of its own shares, representing 2.13% of its share capital, detailed as follows: 16,343,349 shares allocated to covering TOTAL share purchase option plans for Group employees; 4,746,615 shares allocated to TOTAL restricted share plans for Group employees; and 30,000,000 shares purchased for cancellation between February and December 2007 pursuant to the authorization granted by the shareholders’ meetings held on May 12, 2006 and May 11, 2007. The Board of Directors on July 31, 2008 decided to cancel these 30,000,000 shares acquired at an average price of€54.69 per share. These shares were deducted from the consolidated shareholders’ equity. As of December 31, 2006, TOTAL S.AS.A. held 60,869,439 of its own shares, representing 2.51% of its share capital, detailed as follows: 23,272,755 shares allocated to covering TOTAL share purchase option plans for Group employees; 4,591,684 shares allocated to TOTAL restricted share plans for Group employees; and 33,005,000 shares purchased for cancellation between July and December 2006 pursuant to the authorization granted by the shareholders’ meetingmeetings held on May 12, 2006. The Board of Directors helddecided on January 10, 2007 decided to cancel these 33,005,000 shares, at an average price of€52.52 per share. These shares arewere deducted from the consolidated shareholders’ equity. TOTAL SHARES HELD BY THE GROUP SUBSIDIARIES As of December 31, 2008, 2007 and 2006, TOTAL S.A. held indirectly through its subsidiaries 100,331,268 of its own shares, representing 4.23% of its share capital as of December 31, 2008, 4.19% of its share capital as of December 31, 2007, and 4.14% of its share capital as of December 31, 2006, detailed as follows: 2,023,672 shares held by a consolidated subsidiary, Total Nucléaire, 100%a wholly-owned subsidiary indirectly ownedcontrolled by TOTAL S.A.; 98,307,596 shares held by subsidiaries of Elf Aquitaine (Financière Valorgest, Sogapar and Fingestval) These shares are deducted from the consolidated shareholders’ equity. DIVIDEND PER SHARE During the year 2006,In 2008, TOTAL S.A. paid on May 18, 2006,23, 2008, the balance of the dividend of€3.481.07 per share par valuefor the 2007 fiscal year (the ex-dividend date was May 20, 2008.). In addition, TOTAL S.A. paid on November 19, 2008, an interim dividend of€10 per share, or€0.87 per share, par value€2.501.14 per share for the fiscal year 2005, as well as on2008 (the ex-dividend date was November 17, 2006, an interim dividend of€0.87 per share, par value of€2.50 per share, for the fiscal year 2006.14, 2008).
A resolution will be submitted at the shareholders’ meeting ofon May 11, 200715, 2009 to pay a dividend of€1.872.28 per share par valuefor the 2008 fiscal year,i.e., a balance of€2.50 for the fiscal year 2006, which leaves a balance1.14 per share to be paid of€1.00 per sharedistributed after deduction ofdeducting the interim dividend of€0.87 paid on November 17, 2006.1.14 already paid. PAID-IN SURPLUS In accordance with French law, the paid-in surplus corresponds to share premiums of the parent company which can be capitalized or used to offset losses if the legal reserve has reached its minimum required level. The amount of the paid-in surplus may also be distributed subject to taxation unless the unrestricted reserves of the parent company are distributed prior to or simultaneously with this item. As of December 31, 2006, the2008, paid-in surplus was 31,156amounted to 28,284 M€ (34,563(29,598 as of December 31, 2007, and 31,156 M€ as of December 31, 2005)2006).
RESERVES Under French laws, 5% of net income must be transferred to the legal reserve until the legal reserve reaches 10% of the nominal value of the share capital. This reserve cannot be distributed to the shareholders other than upon liquidation but can be used to offset losses. If wholly distributed, the unrestricted reserves of the parent company would be taxed for an approximate amount of 70 M€ as of December 31, 20062008 (70 M€ as of December 31, 2005)2006 and 2007).
ITEMS RECOGNIZED DIRECTLY IN EQUITY Shareholders’ equity wasis directly credited with (2,676)debited for 772 M€ in 20062008 due to the following items:items. Items recognized directly in equity are as follows: | | | | | | | Amounts(M€) | | 2006 | | | 2005 | Cumulative translation adjustment, Group share | | (2,595 | ) | | 2,850 | Changes in deferred taxes on treasury shares | | — | | | 242 | Changes in fair value of financial assets available for sale | | (61 | ) | | 160 | Other | | 24 | | | 16 | Group share | | (2,632 | ) | | 3,268 | Minority interests and preferred shares | | (44 | ) | | 51 | Total items recognized directly in equity | | (2,676 | ) | | 3,319 |
| | | | | | | | | | | For the year ended(M€) | | 2008 | | | 2007 | | | 2006 | | Currency translation adjustment, Group share | | (480 | ) | | (3,013 | ) | | (2,595 | ) | Changes in fair value of financial assets available for sale | | (224 | ) | | 104 | | | (61 | ) | Others | | (34 | ) | | 13 | | | 24 | | Group share | | (738 | ) | | (2,896 | ) | | (2,632 | ) | Minority interests | | (34 | ) | | (111 | ) | | (44 | ) | Total items recognized directly in equity | | (772 | ) | | (3,007 | ) | | (2,676 | ) |
18.18) EMPLOYEE BENEFITS OBLIGATIONS
ProvisionsLiabilities for employee benefits obligations consist of the following:
| | As of December 31,(M€) | | 2006 | | 2005 | | 2008 | | 2007 | | 2006 | Pension benefits liabilities | | 1,918 | | 2,524 | | 1,187 | | 1,721 | | 1,918 | Other benefits liabilities | | 647 | | 718 | | 608 | | 611 | | 647 | Restructuring reserves (early retirement plans) | | 208 | | 171 | | 216 | | 195 | | 208 | Total | | 2,773 | | 3,413 | | 2,011 | | 2,527 | | 2,773 |
The Group’s main defined benefit pension plans are located in France, the United Kingdom, the United States, Belgium and Germany. Their characteristics are the following: The benefits are usually based on the final salary and seniority; They are usually funded (pension fund or insurer); They are closed to new employees who benefit from defined contribution pension plans. The pension benefits include also termination indemnities and early retirement benefits. The other benefits are the employer contribution to post-employment medical care.
The fair value of the defined benefit obligation and plan assets in the consolidated financial statementsConsolidated Financial Statements is detailed as follows: | | | | | | | | | | | | | | | | Pension benefits | | | Other benefits | | | As of December 31,(M€) | | 2006 | | | 2005 | | | 2006 | | | 2005 | | | | | | | Change in benefit obligation | | | | | | | | | | | | | Benefit obligation at beginning of year | | 9,647 | | | 8,117 | | | 774 | | | 675 | | Service cost | | 174 | | | 168 | | | 11 | | | 14 | | Interest cost | | 392 | | | 411 | | | 30 | | | 36 | | Curtailments | | (6 | ) | | — | | | (1 | ) | | — | | Settlements | | (243 | ) | | (14 | ) | | — | | | — | | Special termination benefits | | — | | | — | | | — | | | — | | Plan participants’ contributions | | 11 | | | 15 | | | — | | | — | | Benefits paid | | (444 | ) | | (436 | ) | | (36 | ) | | (48 | ) | Plan amendments | | 17 | | | 139 | | | 7 | | | 2 | | Actuarial losses (gains) | | (151 | ) | | 1,003 | | | (21 | ) | | 57 | | Translation adjustement and other(a) | | (655 | ) | | 244 | | | (116 | ) | | 38 | | Benefit obligation at year-end | | 8,742 | | | 9,647 | | | 648 | | | 774 | | | | | | | Change in fair value of plan assets | | | | | | | | | | | | | Fair value of plan assets at beginning of year | | (6,274 | ) | | (5,362 | ) | | — | | | — | | Expected return on plan assets | | (353 | ) | | (356 | ) | | — | | | — | | Actuarial losses (gains) | | (104 | ) | | (364 | ) | | — | | | | | Settlements | | 201 | | | 12 | | | — | | | — | | Plan participants’ contributions | | (11 | ) | | (15 | ) | | — | | | — | | Employer contributions(b) | | (617 | ) | | (323 | ) | | — | | | — | | Benefits paid | | 327 | | | 337 | | | — | | | — | | Foreign currency translation and other(c) | | 430 | | | (203 | ) | | — | | | — | | Fair value of plan assets at year-end | | (6,401 | ) | | (6,274 | ) | | — | | | — | | | | | | | Unfunded status | | 2,341 | | | 3,373 | | | 648 | | | 774 | | Unrecognized prior service cost | | (149 | ) | | (171 | ) | | 23 | | | 35 | | Unrecognized actuarial (losses) gains | | (423 | ) | | (777 | ) | | (24 | ) | | (91 | ) | As set ceiling | | 4 | | | 5 | | | — | | | — | | Net recognized amount | | 1,773 | | | 2,430 | | | 647 | | | 718 | | Accrued benefit cost | | 1,918 | | | 2,524 | | | 647 | | | 718 | | Prepaid benefit cost | | (145 | ) | | (94 | ) | | — | | | — | |
| | | | | | | | | | | | | | | | | | | | | | Pension benefits | | | Other benefits | | | As of December 31,(M€) | | 2008 | | | 2007 | | | 2006 | | | 2008 | | | 2007 | | | 2006 | | | | | | | | | Change in benefit obligation | | | | | | | | | | | | | | | | | | | Benefit obligation at beginning of year | | 8,129 | | | 8,742 | | | 9,647 | | | 583 | | | 648 | | | 774 | | Service cost | | 143 | | | 160 | | | 174 | | | 14 | | | 12 | | | 11 | | Interest cost | | 416 | | | 396 | | | 392 | | | 24 | | | 28 | | | 30 | | Curtailments | | (3 | ) | | (9 | ) | | (6 | ) | | — | | | — | | | (1 | ) | Settlements | | (5 | ) | | (20 | ) | | (243 | ) | | (4 | ) | | — | | | — | | Special termination benefits | | — | | | — | | | — | | | — | | | — | | | — | | Plan participants’ contributions | | 12 | | | 10 | | | 11 | | | — | | | — | | | — | | Benefits paid | | (463 | ) | | (448 | ) | | (444 | ) | | (37 | ) | | (40 | ) | | (36 | ) | Plan amendments | | 12 | | | (70 | ) | | 17 | | | (12 | ) | | (2 | ) | | 7 | | Actuarial losses (gains) | | (248 | ) | | (384 | ) | | (151 | ) | | (27 | ) | | (38 | ) | | (21 | ) | Foreign currency translation and other(a) | | (588 | ) | | (248 | ) | | (655 | ) | | 3 | | | (25 | ) | | (116 | ) | Benefit obligation at year-end | | 7,405 | | | 8,129 | | | 8,742 | | | 544 | | | 583 | | | 648 | | | | | | | | | Change in fair value of plan assets | | | | | | | | | | | | | | | | | | | Fair value of plan assets at beginning of year | | (6,604 | ) | | (6,401 | ) | | (6,274 | ) | | — | | | — | | | — | | Expected return on plan assets | | (402 | ) | | (387 | ) | | (353 | ) | | — | | | — | | | — | | Actuarial losses (gains) | | 1,099 | | | 140 | | | (104 | ) | | — | | | — | | | — | | Settlements | | 2 | | | 8 | | | 201 | | | — | | | — | | | — | | Plan participants’ contributions | | (12 | ) | | (10 | ) | | (11 | ) | | — | | | — | | | — | | Employer contributions(b) | | (855 | ) | | (556 | ) | | (617 | ) | | — | | | — | | | — | | Benefits paid | | 375 | | | 349 | | | 327 | | | — | | | — | | | — | | Foreign currency translation and other(c) | | 633 | | | 253 | | | 430 | | | — | | | — | | | — | | Fair value of plan assets at year-end | | (5,764 | ) | | (6,604 | ) | | (6,401 | ) | | — | | | — | | | — | | | | | | | | | Unfunded status | | 1,641 | | | 1,525 | | | 2,341 | | | 544 | | | 583 | | | 648 | | Unrecognized prior service cost | | (48 | ) | | (49 | ) | | (149 | ) | | 21 | | | 18 | | | 23 | | Unrecognized actuarial (losses) gains | | (953 | ) | | (160 | ) | | (423 | ) | | 43 | | | 10 | | | (24 | ) | Asset ceiling | | 5 | | | 5 | | | 4 | | | — | | | — | | | — | | Net recognized amount | | 645 | | | 1,321 | | | 1,773 | | | 608 | | | 611 | | | 647 | | Pension benefits and other benefits liabilities | | 1,187 | | | 1,721 | | | 1,918 | | | 608 | | | 611 | | | 647 | | Other non-current assets | | (542 | ) | | (400 | ) | | (145 | ) | | — | | | — | | | — | |
| (a) | In 2006, the changevariation in foreign currency translation and other includesincluded the spin-off of Arkema which amountsamounted to (587) M€ for benefit obligation and 375 M€ for fair value of plan assets related to pension benefits, and (107) M€ offor benefit obligation for pension benefits andrelated to other pension benefits, respectively.benefits. |
| (b) | In 2006,2008, the Group covered certain employee pension benefit plans through insurance companies for an amount of 269757 M€ (269 M€ in 2006). |
| (c) | In 2006, the changevariation in foreign currency translation and other includesincluded the spin-off of Arkema which amountsamounted to 375 M€ of fair value of plan assets. |
As of December 31, 2006,2008, the presentfair value of pension benefits and other pension benefits which are entirely or partially funded amounted to 7,3586,515 M€ and the present value of the unfunded benefits amounted to 2,0321,434 M€ (respectively 8,046(7,175 M€ and 2,3751,537 M€, respectively, as of December 31, 2005)2007, and 7,358 M€ and 2,032 M€, respectively, as of December 31, 2006). | | | | | | | | | | | As of December 31,(M€) | | 2006 | | | 2005 | | | 2004 | | | Pension benefits | | | | | | | | | | Benefit obligation | | 8,742 | | | 9,647 | | | 8,117 | | Fair value of plan assets | | (6,401 | ) | | (6,274 | ) | | (5,362 | ) | Unfunded status | | 2,341 | | | 3,373 | | | 2,755 | | Other benefits | | | | | | | | | | Benefit obligation | | 648 | | | 774 | | | 675 | | Fair value of plan assets | | — | | | — | | | — | | Unfunded status | | 648 | | | 774 | | | 675 | |
| | | | | | | | For the year ended(M€) | | 2008 | | | 2007 | | Experience actuarial gains (losses) related to the defined benefit obligation | | (12 | ) | | (80 | ) | Experience actuarial gains (losses) related to the fair value of plan assets | | (1,099 | ) | | (140 | ) |
| | | | | | | | | | | | | | | | | As of December 31,(M€) | | 2008 | | | 2007 | | | 2006 | | | 2005 | | | 2004 | | Pension benefits | | | | | | | | | | | | | | | | Benefit obligation | | 7,405 | | | 8,129 | | | 8,742 | | | 9,647 | | | 8,117 | | Fair value of plan assets | | (5,764 | ) | | (6,604 | ) | | (6,401 | ) | | (6,274 | ) | | (5,362 | ) | Unfunded status | | 1,641 | | | 1,525 | | | 2,341 | | | 3,373 | | | 2,755 | | Other benefits | | | | | | | | | | | | | | | | Benefits obligation | | 544 | | | 583 | | | 648 | | | 774 | | | 675 | | Fair value of plan assets | | — | | | — | | | — | | | — | | | — | | Unfunded status | | 544 | | | 583 | | | 648 | | | 774 | | | 675 | |
The Group expects to contribute 32482 M€ to its pension plans in 2007.2009. | Estimated future payments (M€) | | Pension benefits | | Other benefits | | Pension benefits | | Other benefits | 2007 | | 433 | | 39 | | 2008 | | 449 | | 35 | | 2009 | | 454 | | 36 | | 518 | | 35 | 2010 | | 471 | | 35 | | 497 | | 36 | 2011 | | 484 | | 36 | | 494 | | 37 | 2012-2016 | | 2,597 | | 183 | | 2012 | | | 501 | | 37 | 2013 | | | 527 | | 39 | 2014-2018 | | | 2,652 | | 180 |
| | Asset allocation | | Pension benefits | | Pension benefits | | As of December 31,(M€) | | 2006 | | 2005 | | 2008 | | 2007 | | 2006 | Equity securities | | 42% | | | | 46% | | 25% | | 36% | | 42% | Debt securities | | 48% | | | | 48% | | 56% | | 56% | | 48% | Monetary | | 6% | | | | 3% | | 16% | | 4% | | 6% | Real estate | | 4% | | | | 3% | | 3% | | 4% | | 4% |
The Group’s assumptions forof expected returns on assets are built up by asset class and by country based on long-term bond yields and risk premiums. The discount rate retained corresponds to the rate of high quality corporate bonds based on a benchmark per country of different market data on the closing date. | | | | | | | | | | Assumptions used to determine benefits obligations | | Pension benefits | | Other benefits | | As of December 31,(M€) | | 2006 | | 2005 | | 2006 | | 2005 | Discount rate | | 4.69% | | 4.51% | | 4.89% | | 4.56% | Average expected rate of salary increase | | 4.14% | | 3.63% | | — | | — | Expected rate of healthcare inflation | | | | | | | | | - Initial rate | | — | | — | | 5.57% | | 5.41% | - Ultimate rate | | — | | — | | 3.65% | | 4.00% |
| Assumptions used to determine the net periodic benefit
cost (income) | | Pension benefits | | Other benefits | | | Assumptions used to determine benefits obligations | | | Pension benefits | | | Other benefits | | As of December 31,(M€) | | 2006 | | 2005 | | 2004 | | 2006 | | 2005 | | 2004 | | 2008 | | 2007 | | 2006 | | | | 2008 | | 2007 | | 2006 | Discount rate | | 4.51% | | 5.12% | | 5.41% | | 4.56% | | 5.28% | | 5.83% | | 5.93% | | 5.50% | | 4.69% | | | | 6.00% | | 5.50% | | 4.89% | Average expected rate of salary increase | | 3.63% | | 3.66% | | 3.74% | | — | | — | | — | | 4.56% | | 4.29% | | 4.14% | | | | — | | — | | — | Expected return on plan assets | | 6.14% | | 6.57% | | 6.96% | | — | | — | | — | | Expected rate of healthcare inflation | | | | | | | | | | | | | | | | | | | | | | | | | | | - Initial rate | | — | | — | | — | | 5.41% | | 5.70% | | 6.37% | | - Ultimate rate | | — | | — | | — | | 4.00% | | 4.15% | | 3.83% | | — initial rate | | | — | | — | | — | | | | 4.88% | | 5.16% | | 5.57% | — ultimate rate | | | — | | — | | — | | | | 3.64% | | 3.64% | | 3.65% |
| | | | | | | | | | | | | | | Assumptions used to determine the net periodic benefit cost (income) | | Pension benefits | | | | Other benefits | | As of December 31,(M€) | | 2008 | | 2007 | | 2006 | | | | 2008 | | 2007 | | 2006 | Discount rate | | 5.50% | | 4.69% | | 4.51% | | | | 5.50% | | 4.89% | | 4.56% | Average expected rate of salary increase | | 4.29% | | 4.14% | | 3.63% | | | | — | | — | | — | Expected return on plan assets | | 6.60% | | 6.26% | | 6.14% | | | | — | | — | | — | Expected rate of healthcare inflation | | | | | | | | | | | | | | | — initial rate | | — | | — | | — | | | | 5.16% | | 5.57% | | 5.41% | — ultimate rate | | — | | — | | — | | | | 3.64% | | 3.65% | | 4.00% |
A 0,5% increase or decrease in discount rates – all other things being equal – would have the following approximate impact: | | | | | | | (M€) | | 0.5%
increase | | | 0.5%
decrease | Benefit obligation as of December 31, 2008 | | (420 | ) | | 475 | Net periodic benefit cost (income) | | (30 | ) | | 37 |
A 10% increase or decrease in the fair value of plan assets – all other things being equal – would have the following approximate impact: | | | | | | | | (M€) | | 10%
increase | | | 10%
decrease | | Fair value of plan assets as of December 31, 2008 | | 576 | | | (576 | ) | Net periodic benefit cost (income) | | (86 | ) | | 105 | |
The components of the net periodic benefit cost (income) in 20062008, 2007 and 20052006 are: | | | | | | | | | | | | | | | | | | | | | Pension benefits | | | Other benefits | | As of December 31,(M€) | | 2006 | | | 2005 | | | 2004 | | | 2006 | | | 2005 | | | 2004 | Service cost | | 174 | | | 168 | | | 141 | | | 11 | | | 14 | | | 10 | Interest cost | | 392 | | | 411 | | | 414 | | | 30 | | | 36 | | | 31 | Expected return on plan assets | | (353 | ) | | (356 | ) | | (348 | ) | | — | | | — | | | — | Amortization of transition obligation (asset) | | — | | | — | | | — | | | — | | | — | | | — | Amortization of prior service cost | | 41 | | | 64 | | | 29 | | | (2 | ) | | (6 | ) | | 55 | Amortization of actuarial losses (gains) | | 26 | | | — | | | 14 | | | (2 | ) | | 2 | | | — | Asset ceiling | | — | | | 5 | | | — | | | — | | | — | | | — | Curtailments | | (4 | ) | | — | | | — | | | (1 | ) | | — | | | — | Settlements | | (15 | ) | | (3 | ) | | 39 | | | — | | | — | | | — | Special termination benefits | | — | | | — | | | 10 | | | — | | | — | | | — | Net periodic benefit cost (income) | | 261 | | | 289 | | | 299 | | | 36 | | | 46 | | | 96 | Net periodic benefit cost (income) from continuing operations (Group without Arkema) | | 256 | | | 233 | | | 215 | | | 35 | | | 40 | | | 85 | Net periodic benefit cost (income) from discontinued operations (Arkema) | | 5 | | | 56 | | | 84 | | | 1 | | | 6 | | | 11 |
| | | | | | | | | | | | | | | | | | | | | | | | Pension benefits | | | | | Other benefits | | | As of December 31,(M€) | | 2008 | | | 2007 | | | 2006 | | | | | 2008 | | | 2007 | | | 2006 | | Service cost | | 143 | | | 160 | | | 174 | | | | | 14 | | | 12 | | | 11 | | Interest cost | | 416 | | | 396 | | | 392 | | | | | 24 | | | 28 | | | 30 | | Expected return on plan assets | | (402 | ) | | (387 | ) | | (353 | ) | | | | — | | | — | | | — | | Amortization of prior service cost | | 34 | | | 31 | | | 41 | | | | | (10 | ) | | (5 | ) | | (2 | ) | Amortization of actuarial losses (gains) | | 22 | | | 17 | | | 26 | | | | | (2 | ) | | (1 | ) | | (2 | ) | Asset ceiling | | 1 | | | — | | | — | | | | | — | | | — | | | — | | Curtailments | | (3 | ) | | (8 | ) | | (4 | ) | | | | — | | | — | | | (1 | ) | Settlements | | (2 | ) | | (12 | ) | | (15 | ) | | | | (3 | ) | | (1 | ) | | — | | Special termination benefits | | — | | | — | | | — | | | | | — | | | — | | | — | | Net periodic benefit cost (income) | | 209 | | | 197 | | | 261 | | | | | 23 | | | 33 | | | 36 | | Net periodic benefit cost (income) from continuing operations | | 209 | | | 197 | | | 256 | | | | | 23 | | | 33 | | | 35 | | Net periodic benefit cost (income) from discontinued operations | | — | | | — | | | 5 | | | | | — | | | — | | | 1 | |
The assumptions for changes in healthcare costs have a significant impact on the valuations of commitments for coverage of medical expenses. A positive or negative change of one-percentage-point in the healthcare inflation rate would have approximately the following approximate impact:
| | (M€) | | 1% point
increase | | 1% point
decrease | | 1% point
increase | | 1% point
decrease | | Benefit obligation as of December 31, 2006 | | 65 | | (54) | | Benefit obligation as of December 31, 2008 | | | 69 | | (52 | ) | Net periodic benefit cost (income) | | 5 | | (4) | | 6 | | (4 | ) |
19.19) PROVISIONS AND OTHER NON-CURRENT LIABILITIES
| | As of December 31,(M€) | | 2006 | | 2005 | | 2008 | | 2007 | | 2006 | Litigations and accrued penalty claims | | 497 | | 839 | | Litigation and accrued penalty claims | | | 546 | | 601 | | 497 | Provisions for environmental contingencies | | 574 | | 768 | | 558 | | 552 | | 574 | Asset retirement obligations | | 3,893 | | 3,710 | | 4,500 | | 4,206 | | 3,893 | Other non-current provisions | | | 1,804 | | 1,188 | | 1,215 | Other non-current liabilities | | 1,215 | | 1,421 | | 450 | | 296 | | 288 | Deposits received | | 288 | | 313 | | Total | | 6,467 | | 7,051 | | 7,858 | | 6,843 | | 6,467 |
In 2006,2008, litigation reserves include a provision covering risks concerning antitrust investigations related to Arkema amounting to 85 M€ as of December 31, 2008. Other risks and commitments that give rise to contingent liabilities are described in Note 32 to the Consolidated Financial Statements. In 2008, other non current provisions include the contingency reserve related to the Toulouse-AZF plant explosion (civil liability) for 256 M€ as of December 31, 2008. In 2007, litigation reserves included a provision covering risks concerning antitrust investigations related to Arkema amounting to 138 M€ as of December 31, 2007. Other risks and commitments that give rise to contingent liabilities are described in Note 32 to the Consolidated Financial Statements. In 2007, the other non-current liabilities included namely:provisions mainly included: The contingency reserve related to the Toulouse-AZF plant explosion (civil liability) for 134 M€ as of December 31, 2007; and Provisions related to restructuring activities in the Chemicals segment for 49 M€ as of December 31, 2007. In 2006, litigation reserves included a provision covering risks concerning antitrust investigations related to Arkema amounting to 138 M€ as of December 31, 2006. In 2006, the other non-current provisions mainly included: The contingency reserve related to the Toulouse-AZF plant explosion (civil liability) for 176 M€ as of December 31, 2006; and provisionsProvisions related to restructuring activities in the Chemicals segment for 72 M€ as of December 31, 2006.
In 2005, the other non-current liabilities included namely:CHANGES IN PROVISIONS AND OTHER NON-CURRENT LIABILITIES
| | | | | | | | | | | | | | | | | (M€) | | As of January 1, | | Allowances | | Reversals | | | Currency
translation
adjustment | | | Other | | | As of December 31, | 2008 | | 6,843 | | 1,424 | | (864 | ) | | (460 | ) | | 915 | | | 7,858 | 2007 | | 6,467 | | 747 | | (927 | ) | | (303 | ) | | 859 | | | 6,843 | 2006 | | 7,051 | | 884 | | (821 | ) | | (273 | ) | | (374 | ) | | 6,467 |
In 2008, allowances of the period (1,424 M€) mainly include: asset retirement obligations for 229 M€ (accretion); the contingency reserve related to the Toulouse-AZF plant explosion (civil liability) for 133140 M€; environmental contingencies for 89 M€; an allowance of 48 M€ for litigation reserves in connection with antitrust investigations, as described in Note 32 to the Consolidated Financial Statements “Other risks and contingent liabilities”; and provisions related to restructuring of December 31, 2005;activities for 27 M€. In 2007, allowances of the period (747 M€) mainly included: provisions for asset retirement obligations for 189 M€ (accretion); an allowance of 100 M€ for litigation reserves in connection with antitrust investigations, as described in Note 32 to the Consolidated Financial Statements “Other risks and contingent liabilities”; environmental contingencies in the Chemicals segment for 23 M€; and provisions related to restructuring of activities in the Chemicals segment for 17115 M€ as of December 31, 2005.. VARIATION IN OTHER NON-CURRENT LIABILITIES(M€)
| | | | | | | | | | | | | | | | | | | As of January 1, | | Allowances | | Reversals | | | Currency
translation
adjustment | | | Other | | | As of December 31, | 2006 | | 7,051 | | 884 | | (821 | ) | | (273 | ) | | (374 | ) | | 6,467 | 2005 | | 6,274 | | 1,347 | | (1,025 | ) | | 375 | | | 80 | | | 7,051 |
In 2006, allowances of the period (884 M€) included mainly:mainly included: provisions for asset retirement obligations for 182 M€ (accretion); an additional allowance of the contingency reserve related to the Toulouse-AZF plant explosion (civil liability), for 100 M€; environmental contingencies in the Chemicals segment for 96 M€; provisions related to restructuring of activities in the Chemicals segment for 88 M€; and an allowance of 32 M€ for litigation reserves in connection with antitrust investigations, as described in Note 3032 to the Consolidated Financial Statements “Other risks and contingent liabilities”. In 2005, allowances2008, the main reversals of the period (1,347(864 M€) included mainly:relate to the incurred expenses, which mainly include: an additional allowance of provisions for asset retirement obligations for 280 M€;
163 M€ for litigation reserves in connection with antitrust investigations; environmental contingencies written back for 96 M€; the contingency reserve related to the Toulouse-AZF plant explosion (civil liability), written back for 10018 M€; and provisions for restructuring and social plans written back for 10 M€. In 2007, the main reversals of the period (927 M€) were related to the incurred expenses which mainly included: provisions for asset retirement obligations for 209 M€; environmental contingencies in the Chemicals segment written back for 28352 M€; provisionsthe contingency reserve related to restructuring of activities in the Chemicals segmentToulouse-AZF plant explosion (civil liability), written back for 10742 M€; and
an allowance of 292provisions for restructuring and social plans written back for 37 M€ for litigation reserves in connection with antitrust investigations, as described in Note 30 to the Consolidated Financial Statements “Other risks and contingent liabilities”.
In 2006, the main reversals of the period (821 M€) were related to the incurred expenses, which included notably:mainly included: provisions for asset retirement obligations for 174 M€; the contingency reserve related to the Toulouse-AZF plant explosion (civil liability), written back for 57 M€; environmental contingencies in the Chemicals segment written back for 56 M€; and provisions for restructuring and social plans written back for 43 M€; environmental contingencies in the Chemicals segment written back for 56 M€.
In 2005, the main reversals of the period (1,025 M€) were related to the incurred expenses which included notably:
the contingency reserve related to the Toulouse-AZF plant explosion (civil liability), written back for 77 M€;
provisions for restructuring and early retirement plans written back for 106 M€;
environmental contingencies in the Chemicals segment written back for 197 M€.
VARIATION OFCHANGES IN THE ASSET RETIREMENT OBLIGATION(M€)
| | | | As of
January 1, | | Accretion | | Revision in
estimates | | New
obligations | | Spending
on existing
obligations | | Currency
translation
adjustment | | Other | | As of
December 31, | | | (M€) | | | As of
January 1, | | Accretion | | Revision
in
estimates | | New
obligations | | Spending
on existing
obligations | | Currency
translation
adjustment | | Other | | As of
December 31, | 2008 | | | 4,206 | | 229 | | 563 | | 188 | | (280 | ) | | (414 | ) | | 8 | | | 4,500 | 2007 | | | 3,893 | | 189 | | 203 | | 371 | | (209 | ) | | (206 | ) | | (35 | ) | | 4,206 | 2006 | | 3,710 | | 182 | | 66 | | 274 | | (174 | ) | | (191 | ) | | 26 | | 3,893 | | 3,710 | | 182 | | 66 | | 274 | | (174 | ) | | (191 | ) | | 26 | | | 3,893 | 2005 | | 3,334 | | 162 | | 51 | | 86 | | (202 | ) | | 250 | | | 29 | | 3,710 | |
20.20) FINANCIAL DEBT AND RELATED FINANCIAL INSTRUMENTS
A.A) NON-CURRENT FINANCIAL DEBT AND RELATED FINANCIAL INSTRUMENTS
| | | | | | | | | | | | | | | | | | | | 2006 | | | 2005 | | | As of December 31,(M€) | | Secured | | Unsecured | | | Total | | | Secured | | Unsecured | | | Total | | (Assets)/Liabilities | | | | | | | | | | | | | | | | | | | | | | | | Non-current financial debt | | 771 | | 13,403 | | | 14,174 | | | 490 | | 13,303 | | | 13,793 | | of which hedging instruments of non-current financial debt (liabilities)(a) | | — | | 193 | | | 193 | | | — | | 128 | | | 128 | | | Hedging instruments of non-current financial debt (Assets)(a) | | — | | (486 | ) | | (486 | ) | | — | | (477 | ) | | (477 | ) | | Non-current financial debt - net of hedging instruments | | 771 | | 12,917 | | | 13,688 | | | 490 | | 12,826 | | | 13,316 | | | | | | | | | Debenture loans, net of hedging instruments | | — | | 11,120 | | | 11,120 | | | — | | 10,703 | | | 10,703 | | Bank and other, floating rate | | 398 | | 1,589 | | | 1,987 | | | 105 | | 1,715 | | | 1,820 | | Bank and other, fixed rate | | 2 | | 208 | | | 210 | | | 3 | | 408 | | | 411 | | Financial lease obligations | | 371 | | — | | | 371 | | | 382 | | — | | | 382 | | | Non-current financial debt - net of hedging instruments | | 771 | | 12,917 | | | 13,688 | | | 490 | | 12,826 | | | 13,316 | |
| | | | | | | | | | As of December 31, 2008(M€) | | Secured | | Unsecured | | | Total | | (Assets)/Liabilities | | | | | | | | | | | | | Non-current financial debt | | 895 | | 15,296 | | | 16,191 | | of which hedging instruments of non-current financial debt (liabilities) | | — | | 440 | | | 440 | | Hedging instruments of non-current financial debt (assets)(a) | | — | | (892 | ) | | (892 | ) | Non-current financial debt - net of hedging instruments | | 895 | | 14,404 | | | 15,299 | | Bonds, net of hedging instruments | | — | | 13,667 | | | 13,667 | | Bank and other, floating rate | | 553 | | 665 | | | 1,218 | | Bank and other, fixed rate | | 140 | | 6 | | | 146 | | Financial lease obligations | | 202 | | 66 | | | 268 | | Non-current financial debt - net of hedging instruments | | 895 | | 14,404 | | | 15,299 | |
| | | | | | | | | | As of December 31, 2007(M€) | | Secured | | Unsecured | | | Total | | (Assets)/Liabilities | | | | | | | | | | | | | Non-current financial debt | | 772 | | 14,104 | | | 14,876 | | of which hedging instruments of non-current financial debt (liabilities) | | — | | 369 | | | 369 | | Hedging instruments of non-current financial debt (assets)(a) | | — | | (460 | ) | | (460 | ) | Non-current financial debt - net of hedging instruments | | 772 | | 13,644 | | | 14,416 | | Bonds, net of hedging instruments | | — | | 11,650 | | | 11,650 | | Bank and other, floating rate | | 453 | | 1,781 | | | 2,234 | | Bank and other, fixed rate | | 2 | | 213 | | | 215 | | Financial lease obligations | | 317 | | — | | | 317 | | Non-current financial debt - net of hedging instruments | | 772 | | 13,644 | | | 14,416 | |
| | | | | | | | | | As of December 31, 2006(M€) | | Secured | | Unsecured | | | Total | | | (Assets)/Liabilities | | | | | | | | | | | | | Non-current financial debt | | 771 | | 13,403 | | | 14,174 | | of which hedging instruments of non-current financial debt (liabilities) | | — | | 193 | | | 193 | | Hedging instruments of non-current financial debt (assets)(a) | | — | | (486 | ) | | (486 | ) | Non-current financial debt - net of hedging instruments | | 771 | | 12,917 | | | 13,688 | | Bonds, net of hedging instruments | | — | | 11,120 | | | 11,120 | | Bank and other, floating rate | | 398 | | 1,589 | | | 1,987 | | Bank and other, fixed rate | | 2 | | 208 | | | 210 | | Financial lease obligations | | 371 | | — | | | 371 | | Non-current financial debt - net of hedging instruments | | 771 | | 12,917 | | | 13,688 | |
| (a) | See the description of these hedging instruments (paragraphin Note 1 paragraph M(iii) “Long-term financing” of Note 1and Notes 28 and 29 to the Consolidated Financial Statements).Statements. |
Fair value of debenture loans,bonds, as of December 31, 2006,2008, after taking into account hedgedhedging currency and interest rates swaps, can be detailed as follows (as the effect of the Group’s credit risk is not material, it has not been taken into account in the calculation of fair value):follows: | | | | | | | | | Fair value after hedging as of | | | | | | | | (M€) | | Year
of
issue | | Fair value after
hedging as of
December 31,
2005 | | Fair value after
hedging as of
December 31,
2006 | | Currency | | Maturity | | Initial rate before
hedging instruments | | Year of
issue | | December 31,
2008 | | December 31,
2007 | | December 31,
2006 | | Currency | | Maturity | | Initial rate before
hedging instruments | Parent company | | | | | | | | | | | | | | | | | | | | | | | | | | | Bond | | 1996 | | 166 | | | — | | | FRF | | 2006 | | 6.900% | | 1996 | | — | | | 324 | | | 362 | | | FRF | | 2008 | | 6.750% | Bond | | 1996 | | 404 | | | 362 | | | FRF | | 2008 | | 6.750% | | 1997 | | — | | | — | | | 75 | | | FRF | | 2007 | | 5.030% | Bond | | 1997 | | 83 | | | 75 | | | FRF | | 2007 | | 5.030% | | 1997 | | — | | | — | | | 63 | | | ESP | | 2007 | | 6.800% | Bond | | 1997 | | 70 | | | 63 | | | ESP | | 2007 | | 6.800% | | 1997 | | 124 | | | 118 | | | 126 | | | FRF | | 2009 | | 6.200% | Bond | | 1997 | | 146 | | | 126 | | | FRF | | 2009 | | 6.200% | | 1998 | | — | | | 26 | | | 29 | | | FRF | | 2008 | | Pibor 3 months + 0.380% | Bond | | 1998 | | 32 | | | 29 | | | FRF | | 2008 | | PIBOR 3 months + 0.380% | | 1998 | | 119 | | | 113 | | | 132 | | | FRF | | 2009 | | 5.125% | Bond | | 1998 | | 141 | | | 132 | | | FRF | | 2009 | | 5.125% | | 1998 | | 121 | | | 114 | | | 128 | | | FRF | | 2013 | | 5.000% | Bond | | 1998 | | 142 | | | 128 | | | FRF | | 2013 | | 5.000% | | 2000 | | 63 | | | 60 | | | 68 | | | EUR | | 2010 | | 5.650% | Current portion (less than one year) | | | | | (243 | ) | | (349 | ) | | (138 | ) | | | | | | | Total parent company | | | 184 | | | 406 | | | 845 | | | Elf Aquitaine S.A. | | | | | | | | | | | | | | | | Bond | | 1999 | | 275 | | | — | | | EUR | | 2006 | | 3.875% | | 1999 | | 1,003 | | | 998 | | | 996 | | | EUR | | 2009 | | 4.500% | Bond | | 2000 | | 107 | | | — | | | CHF | | 2006 | | 3.500% | | Bond | | 2000 | | 75 | | | 68 | | | EUR | | 2010 | | 5.650% | | Current (less than one year) | | (548 | ) | | (138 | ) | | | Total parent company | | | | 1,093 | | | 845 | | | | | | | | | | Elf Aquitaine SA | | | | | | | | | | | | | | Bond 1999 | | | | 998 | | | 996 | | | EUR | | 2009 | | 4.500% | | Current portion (less than one year) | | | | — | | | — | | | | | | | | | | | (1,003 | ) | | — | | | — | | | | | | | | Total Elf Aquitaine SA | | 998 | | | 996 | | | | Total Elf Aquitaine S.A. | | | — | | | 998 | | | 996 | | |
| | | | | | | | | | | | | | | | | | | | Fair value after hedging as of | | | | | | | | (M€) | | Year of
issue | | December 31,
2008 | | December 31,
2007 | | December 31,
2006 | | Currency | | Maturity | | Initial rate before hedging instruments | | TOTAL CAPITAL | | | | | | | | | | | | | | | Bond | | 2002 | | — | | — | | 276 | | CHF | | 2007 | | 3.000% | Bond | | 2002 | | — | | — | | 183 | | CHF | | 2007 | | 3.000% | Bond | | 2002 | | — | | — | | 101 | | CHF | | 2007 | | 2.500% | Bond | | 2002 | | — | | — | | 174 | | GBP | | 2007 | | 5.000% | Bond | | 2002 | | — | | — | | 90 | | GBP | | 2007 | | 5.000% | Bond | | 2002 | | — | | — | | 57 | | USD | | 2007 | | 4.740% | Bond | | 2002 | | — | | — | | 228 | | USD | | 2007 | | 5.125% | Bond | | 2002 | | 14 | | 14 | | 15 | | USD | | 2012 | | 5.890% | Bond | | 2002 | | — | | — | | 190 | | USD | | 2007 | | 4.750% | Bond | | 2002 | | — | | — | | 38 | | USD | | 2007 | | LIBOR USD 3 months + 0.060% | Bond | | 2002 | | — | | — | | 38 | | USD | | 2007 | | LIBOR USD 3 months + 0.065% | Bond | | 2003 | | — | | 39 | | 43 | | AUD | | 2008 | | 5.000% | Bond | | 2003 | | — | | 41 | | 46 | | AUD | | 2008 | | 5.000% | Bond | | 2003 | | 52 | | 49 | | 55 | | AUD | | 2009 | | 6.250% | Bond | | 2003 | | — | | 44 | | 50 | | CAD | | 2008 | | 4.250% | Bond | | 2003 | | — | | 148 | | 165 | | CHF | | 2008 | | 2.010% | Bond | | 2003 | | 154 | | 145 | | 162 | | CHF | | 2009 | | 2.385% | Bond | | 2003 | | — | | 98 | | 110 | | CHF | | 2008 | | 2.010% | Bond | | 2003 | | 166 | | 157 | | 175 | | CHF | | 2010 | | 2.385% | Bond | | 2003 | | — | | 360 | | 402 | | EUR | | 2008 | | 3.500% | Bond | | 2003 | | — | | 72 | | 81 | | EUR | | 2008 | | 3.500% | Bond | | 2003 | | — | | 113 | | 127 | | EUR | | 2008 | | 3.500% | Bond | | 2003 | | — | | — | | 61 | | GBP | | 2007 | | 5.000% | Bond | | 2003 | | 22 | | 20 | | 23 | | USD | | 2013 | | 4.500% | Bond | | 2003 | | — | | 170 | | 190 | | USD | | 2008 | | 3.250% | Bond | | 2003-2004 | | 395 | | 373 | | 418 | | USD | | 2009 | | 3.500% | Bond | | 2004 | | 57 | | 54 | | 60 | | AUD | | 2009 | | 6.000% |
| | | | | | | | | | | | | | | | | Fair value after hedging as of | | | | | | | | (M€) | | Year of issue | | Fair value
after hedging as of
December 31,
2005 | | Fair value
after hedging as of
December 31,
2006 | | Currency | | Maturity | | Initial rate before hedging instruments | | Year of
issue | | December 31,
2008 | | December 31,
2007 | | December 31,
2006 | | Currency | | Maturity | | Initial rate before hedging instruments | TOTAL CAPITAL | | | | | | | | | | | | | | Bond | | 2002 | | 309 | | 276 | | CHF | | 2007 | | 3.000% | | 2004 | | 28 | | 26 | | 29 | | AUD | | 2009 | | 6.000% | Bond | | 2002 | | 64 | | 57 | | USD | | 2007 | | 4.740% | | 2004 | | 55 | | 52 | | 58 | | AUD | | 2011 | | 5.750% | Bond | | 2002 | | 255 | | 228 | | USD | | 2007 | | 5.125% | | 2004 | | 55 | | 52 | | 58 | | CAD | | 2010 | | 4.000% | Bond | | 2002 | | 18 | | 15 | | USD | | 2012 | | 5.890% | | 2004 | | 111 | | 105 | | 118 | | CAD | | 2011 | | 4.875% | Bond | | 2002 | | 204 | | 183 | | CHF | | 2007 | | 3.000% | | 2004 | | 117 | | 110 | | 123 | | CHF | | 2010 | | 2.385% | Bond | | 2002 | | 213 | | 190 | | USD | | 2007 | | 4.750% | | 2004 | | 120 | | 114 | | 127 | | CHF | | 2012 | | 2.375% | Bond | | 2002 | | 43 | | 38 | | USD | | 2007 | | LIBOR USD 3 months +0.060% | | 2004 | | 454 | | 429 | | 479 | | EUR | | 2010 | | 3.750% | Bond | | 2002 | | 43 | | 38 | | USD | | 2007 | | LIBOR USD 3 months + 0.0650% | | 2004 | | 334 | | 316 | | 353 | | GBP | | 2010 | | 4.875% | Bond | | 2002 | | 195 | | 174 | | GBP | | 2007 | | 5.000% | | 2004 | | 132 | | 125 | | 140 | | GBP | | 2010 | | 4.875% | Bond | | 2002 | | 113 | | 101 | | CHF | | 2007 | | 2.500% | | 2004 | | 191 | | 181 | | 202 | | GBP | | 2010 | | 4.875% | Bond | | 2002 | | 101 | | 90 | | GBP | | 2007 | | 5.000% | | 2004 | | — | | — | | 103 | | GBP | | 2007 | | 5.000% | Bond | | 2003 | | 69 | | 61 | | GBP | | 2007 | | 5.000% | | 2004 | | 49 | | 46 | | 51 | | NZD | | 2014 | | 6.750% | Bond | | 2003 | | 52 | | 43 | | AUD | | 2008 | | 5.000% | | 2004 | | — | | 34 | | 38 | | USD | | 2008 | | 3.250% | Bond | | 2003 | | 450 | | 402 | | EUR | | 2008 | | 3.500% | | 2004 | | — | | 34 | | 38 | | USD | | 2008 | | 3.250% | Bond | | 2003 | | 56 | | 50 | | CAD | | 2008 | | 4.250% | | 2004 | | — | | 68 | | 76 | | USD | | 2008 | | 3.250% | Bond | | 2003 | | 26 | | 23 | | USD | | 2013 | | 4.500% | | 2004 | | 216 | | 204 | | 228 | | USD | | 2011 | | 4.125% | Bond | | 2003 | | 212 | | 190 | | USD | | 2008 | | 3.250% | | 2004 | | 72 | | 68 | | 76 | | USD | | 2011 | | 4.125% | Bond | | 2003 | | 49 | | 46 | | AUD | | 2008 | | 5.000% | | 2005 | | 55 | | 52 | | 58 | | AUD | | 2011 | | 5.750% | Bond | | 2003 | | 91 | | 81 | | EUR | | 2008 | | 3.500% | | 2005 | | 63 | | 63 | | 63 | | AUD | | 2012 | | 5.750% | Bond | | 2003 | | 142 | | 127 | | EUR | | 2008 | | 3.500% | | 2005 | | 58 | | 55 | | 61 | | CAD | | 2011 | | 4.000% | Bond | | 2003 | | 185 | | 165 | | CHF | | 2008 | | 2.010% | | 2005 | | 187 | | 177 | | 197 | | CHF | | 2012 | | 2.135% | Bond | | 2003 | | 181 | | 162 | | CHF | | 2009 | | 2.385% | | 2005 | | 116 | | 109 | | 122 | | CHF | | 2011 | | 1.625% | Bond | | 2003 | | 123 | | 110 | | CHF | | 2008 | | 2.010% | | 2005 | | 65 | | 65 | | 65 | | CHF | | 2012 | | 2.135% | Bond | | 2003 | | 61 | | 55 | | AUD | | 2009 | | 6.250% | | 2005 | | 226 | | 226 | | 226 | | CHF | | 2011 | | 1.625% | Bond | | 2003-2004 | | 467 | | 418 | | USD | | 2009 | | 3.500% | | 2005 | | 98 | | 97 | | 97 | | CHF | | 2012 | | 2.375% | Bond | | 2003 | | 196 | | 175 | | CHF | | 2010 | | 2.375% | | 2005 | | 376 | | 356 | | 397 | | EUR | | 2012 | | 3.250% | Bond | | 2004 | | 395 | | 353 | | GBP | | 2010 | | 4.875% | | 2005 | | 287 | | 286 | | 284 | | GBP | | 2012 | | 4.625% | Bond | | 2004 | | 138 | | 123 | | CHF | | 2010 | | 2.385% | | 2005 | | 36 | | 34 | | 38 | | USD | | 2009 | | 3.500% | Bond | | 2004 | | 535 | | 479 | | EUR | | 2010 | | 3.750% | | 2005 | | 144 | | 136 | | 152 | | USD | | 2011 | | 4.125% | Bond | | 2004 | | 67 | | 60 | | AUD | | 2009 | | 6.000% | | 2005 | | 57 | | 57 | | 57 | | NZD | | 2012 | | 6.500% | Bond | | 2004 | | 33 | | 29 | | AUD | | 2009 | | 6.000% | | 2006 | | 130 | | 130 | | 130 | | CHF | | 2016 | | 2.385% | Bond | | 2004 | | 156 | | 140 | | GBP | | 2010 | | 4.875% | | 2006 | | 62 | | 62 | | 62 | | AUD | | 2012 | | 5.625% | Bond | | 2004 | | 65 | | 58 | | AUD | | 2011 | | 5.750% | | 2006 | | 72 | | 72 | | 72 | | CAD | | 2012 | | 4.125% | Bond | | 2004 | | 65 | | 58 | | CAD | | 2010 | | 4.000% | | 2006 | | 100 | | 100 | | 100 | | EUR | | 2012 | | 3.250% | Bond | | 2004 | | 226 | | 202 | | GBP | | 2010 | | 4.875% | | 2006 | | — | | — | | 147 | | GBP | | 2007 | | 5.000% | Bond | | 2004 | | 42 | | 38 | | USD | | 2008 | | 3.250% | | 2006 | | 65 | | 65 | | 65 | | CHF | | 2016 | | 2.385% | Bond | | 2004 | | 42 | | 38 | | USD | | 2008 | | 3.250% | | 2006 | | 64 | | 64 | | 64 | | CHF | | 2016 | | 2.385% | Bond | | 2004 | | 115 | | 103 | | GBP | | 2007 | | 5.000% | | 2006 | | 64 | | 64 | | 63 | | CHF | | 2016 | | 2.385% | Bond | | 2004 | | 85 | | 76 | | USD | | 2008 | | 3.250% | | 2006 | | 129 | | 129 | | 129 | | CHF | | 2018 | | 3.135% | Bond | | 2004 | | 131 | | 118 | | CAD | | 2011 | | 4.875% | | 2006 | | 102 | | 100 | | 100 | | EUR | | 2010 | | 3.750% | Bond | | 2004 | | 255 | | 228 | | USD | | 2011 | | 4.125% | | 2006 | | 74 | | 74 | | 74 | | GBP | | 2012 | | 4.625% | Bond | | 2004 | | 58 | | 51 | | NZD | | 2014 | | 6.750% | | 2006 | | 300 | | 300 | | 300 | | EUR | | 2011 | | 3.875% | Bond | | 2004 | | 85 | | 76 | | USD | | 2011 | | 4.125% | | 2006 | | 50 | | 50 | | 50 | | EUR | | 2010 | | 3.750% | Bond | | 2004 | | 142 | | 127 | | CHF | | 2012 | | 2.375% | | 2006 | | 127 | | 127 | | 127 | | CHF | | 2014 | | 2.635% | Bond | | 2005 | | 337 | | 302 | | EUR | | 2012 | | 3.250% | | 2006 | | 473 | | 474 | | 474 | | USD | | 2011 | | 5.000% | Bond | | 2005 | | 220 | | 197 | | CHF | | 2012 | | 2.135% | | 2006 | | 100 | | 100 | | 100 | | EUR | | 2012 | | 3.250% | Bond | | 2005 | | 42 | | 38 | | USD | | 2009 | | 3.500% | | 2006 | | 42 | | 42 | | 42 | | EUR | | 2011 | | EURIBOR 3 months +0.040% | Bond | | 2005 | | 65 | | 58 | | AUD | | 2011 | | 5.750% | | 2006 | | 300 | | 300 | | 300 | | EUR | | 2011 | | 3.875% | Bond | | 2005 | | 68 | | 61 | | CAD | | 2011 | | 4.000% | | 2006 | | 150 | | 150 | | 151 | | EUR | | 2011 | | 3.875% | Bond | | 2005 | | 170 | | 152 | | USD | | 2011 | | 4.125% | | 2006 | | 120 | | 120 | | 120 | | USD | | 2011 | | 5.000% | Bond | | 2005 | | 106 | | 95 | | EUR | | 2012 | | 3.250% | | 2006 | | 75 | | 75 | | 74 | | GBP | | 2010 | | 4.875% | Bond | | 2005 | | 136 | | 122 | | CHF | | 2011 | | 1.625% | | 2006 | | 50 | | 50 | | 50 | | EUR | | 2010 | | 3.750% | Bond | | 2005 | | 63 | | 63 | | AUD | | 2012 | | 5.750% | | 2006 | | 300 | | 300 | | 300 | | EUR | | 2011 | | 3.875% |
| | | | | | | | | | | | | | (M€) | | Year of
issue | | Fair value after hedging as of
December 31,
2005 | | Fair value after hedging as of
December 31,
2006 | | Currency | | Maturity | | Initial rate before hedging instruments | Bond | | 2005 | | 57 | | 57 | | NZD | | 2012 | | 6.500% | Bond | | 2005 | | 65 | | 65 | | CHF | | 2012 | | 2.135% | Bond | | 2005 | | 226 | | 226 | | CHF | | 2011 | | 1.625% | Bond | | 2005 | | 98 | | 97 | | CHF | | 2012 | | 2.375% | Bond | | 2005 | | 295 | | 284 | | GBP | | 2012 | | 4.625% | Bond | | 2006 | | — | | 130 | | CHF | | 2016 | | 2.385% | Bond | | 2006 | | — | | 62 | | AUD | | 2012 | | 5.625% | Bond | | 2006 | | — | | 72 | | CAD | | 2012 | | 4.125% | Bond | | 2006 | | — | | 100 | | EUR | | 2012 | | 3.250% | Bond | | 2006 | | — | | 147 | | GBP | | 2007 | | 5.000% | Bond | | 2006 | | — | | 65 | | CHF | | 2016 | | 2.385% | Bond | | 2006 | | — | | 64 | | CHF | | 2016 | | 2.385% | Bond | | 2006 | | — | | 63 | | CHF | | 2016 | | 2.385% | Bond | | 2006 | | — | | 129 | | CHF | | 2018 | | 3.135% | Bond | | 2006 | | — | | 100 | | EUR | | 2010 | | 3.750% | Bond | | 2006 | | — | | 74 | | GBP | | 2012 | | 4.625% | Bond | | 2006 | | — | | 300 | | EUR | | 2011 | | 3.875% | Bond | | 2006 | | — | | 50 | | EUR | | 2010 | | 3.750% | Bond | | 2006 | | — | | 127 | | CHF | | 2014 | | 2.635% | Bond | | 2006 | | — | | 474 | | USD | | 2011 | | 5.000% | Bond | | 2006 | | — | | 100 | | EUR | | 2012 | | 3.250% | Bond | | 2006 | | — | | 42 | | EUR | | 2011 | | EURIBOR 3 months +0,040% | Bond | | 2006 | | — | | 300 | | EUR | | 2011 | | 3.875% | Bond | | 2006 | | — | | 151 | | EUR | | 2011 | | 3.875% | Bond | | 2006 | | — | | 120 | | USD | | 2011 | | 5.000% | Bond | | 2006 | | — | | 74 | | GBP | | 2010 | | 4.875% | Bond | | 2006 | | — | | 50 | | EUR | | 2010 | | 3.750% | Bond | | 2006 | | — | | 300 | | EUR | | 2011 | | 3.875% | Bond | | 2006 | | — | | 126 | | CHF | | 2013 | | 2.510% | Current portion (less than one year) | | 2006 | | — | | (1,686) | | | | | | | Total TOTAL CAPITAL(a) | | | | 8,501 | | 9,206 | | | | | | | | Other consolidated subsidiaries | | | | 111 | | 73 | | | | | | | Total | | | | 10,703 | | 11,120 | | | | | | |
| | | | | | | | | | | | | | | | | | | | Fair value after hedging as of | | | | | | | | (M€) | | Year of
issue | | December 31,
2008 | | December 31,
2007 | | December 31,
2006 | | Currency | | Maturity | | Initial rate before hedging instruments | Bond | | 2006 | | 125 | | 126 | | 126 | | CHF | | 2013 | | 2.510% | Bond | | 2007 | | 300 | | 301 | | | | EUR | | 2013 | | 4.125% | Bond | | 2007 | | 306 | | 305 | | | | GBP | | 2013 | | 5.500% | Bond | | 2007 | | 77 | | 77 | | | | USD | | 2011 | | 5.000% | Bond | | 2007 | | 248 | | 248 | | | | CHF | | 2014 | | 2.635% | Bond | | 2007 | | 370 | | 371 | | | | USD | | 2012 | | 5.000% | Bond | | 2007 | | 73 | | 74 | | | | GBP | | 2013 | | 5.500% | Bond | | 2007 | | 61 | | 61 | | | | AUD | | 2012 | | 6.500% | Bond | | 2007 | | 300 | | 302 | | | | EUR | | 2017 | | 4.700% | Bond | | 2007 | | 74 | | 74 | | | | GBP | | 2010 | | 4.875% | Bond | | 2007 | | 222 | | 222 | | | | USD | | 2012 | | 5.000% | Bond | | 2007 | | 49 | | 49 | | | | JPY | | 2014 | | 1.723% | Bond | | 2007 | | 121 | | 122 | | | | CHF | | 2015 | | 3.125% | Bond | | 2007 | | 76 | | 76 | | | | CHF | | 2018 | | 3.135% | Bond | | 2007 | | 71 | | 71 | | | | GBP | | 2012 | | 4.625% | Bond | | 2007 | | 61 | | 61 | | | | CHF | | 2014 | | 2.635% | Bond | | 2007 | | 74 | | 73 | | | | GBP | | 2013 | | 5.500% | Bond | | 2007 | | 72 | | 72 | | | | CAD | | 2012 | | 4.125% | Bond | | 2007 | | 60 | | 60 | | | | CHF | | 2010 | | 2.385% | Bond | | 2007 | | 60 | | 60 | | | | CHF | | 2018 | | 3.135% | Bond | | 2007 | | 31 | | 31 | | | | JPY | | 2014 | | 1.505% | Bond | | 2008 | | 92 | | | | | | AUD | | 2011 | | 7.500% | Bond | | 2008 | | 60 | | | | | | AUD | | 2013 | | 7.500% | Bond | | 2008 | | 61 | | | | | | AUD | | 2013 | | 7.500% | Bond | | 2008 | | 62 | | | | | | CHF | | 2012 | | 2.135% | Bond | | 2008 | | 124 | | | | | | CHF | | 2012 | | 3.635% | Bond | | 2008 | | 46 | | | | | | CHF | | 2012 | | 2.385% | Bond | | 2008 | | 92 | | | | | | CHF | | 2012 | | 2.385% | Bond | | 2008 | | 64 | | | | | | CHF | | 2012 | | 2.385% | Bond | | 2008 | | 128 | | | | | | CHF | | 2013 | | 3.135% | Bond | | 2008 | | 63 | | | | | | CHF | | 2013 | | 3.135% | Bond | | 2008 | | 61 | | | | | | CHF | | 2015 | | 3.135% | Bond | | 2008 | | 62 | | | | | | CHF | | 2015 | | 3.135% | Bond | | 2008 | | 62 | | | | | | CHF | | 2015 | | 3.135% | Bond | | 2008 | | 62 | | | | | | CHF | | 2018 | | 3.135% | Bond | | 2008 | | 100 | | | | | | EUR | | 2011 | | 3.875% | Bond | | 2008 | | 151 | | | | | | EUR | | 2011 | | 3.875% | Bond | | 2008 | | 50 | | | | | | EUR | | 2012 | | 3.250% | Bond | | 2008 | | 200 | | | | | | EUR | | 2013 | | 4.125% | Bond | | 2008 | | 100 | | | | | | EUR | | 2013 | | 4.125% | Bond | | 2008 | | 1,002 | | | | | | EUR | | 2013 | | 4.750% | Bond | | 2008 | | 50 | | | | | | EUR | | 2011 | | 3.875% | Bond | | 2008 | | 50 | | | | | | EUR | | 2011 | | 3.875% | Bond | | 2008 | | 63 | | | | | | GBP | | 2012 | | 4.625% | Bond | | 2008 | | 63 | | | | | | GBP | | 2010 | | 4.875% | Bond | | 2008 | | 66 | | | | | | GBP | | 2010 | | 4.875% | Bond | | 2008 | | 63 | | | | | | GBP | | 2012 | | 4.625% | Bond | | 2008 | | 64 | | | | | | GBP | | 2012 | | 4.625% | Bond | | 2008 | | 63 | | | | | | GBP | | 2013 | | 5.500% | Bond | | 2008 | | 60 | | | | | | JPY | | 2011 | | EURIBOR 6 months +0.018% | Bond | | 2008 | | 149 | | | | | | JPY | | 2013 | | EURIBOR 6 months +0.008% |
| | | | | | | | | | | | | | | | | | | | | | | | Fair value after hedging as of | | | | | | | | | | (M€) | | Year of
issue | | December 31,
2008 | | | December 31,
2007 | | | December 31,
2006 | | | Currency | | Maturity | | Initial rate before hedging instruments | | Bond | | 2008 | | 62 | | | | | | | | | NOK | | 2012 | | 6.000 | % | Bond | | 2008 | | 102 | | | | | | | | | USD | | 2011 | | 3.750 | % | Bond | | 2008 | | 69 | | | | | | | | | USD | | 2012 | | 5.000 | % | Bond | | 2008 | | 194 | | | | | | | | | USD | | 2013 | | 4.000 | % | Current portion (less than one year) | | | | (722 | ) | | (1,222 | ) | | (1,686 | ) | | | | | | | | Total TOTAL CAPITAL(a) | | | | 13,380 | | | 10,136 | | | 9,206 | | | | | | | | | | | | | | | | | | | | | | | | | | | | Other consolidated subsidiaries | | | | 103 | | | 110 | | | 73 | | | | | | | | | Total | | | | 13,667 | | | 11,650 | | | 11,120 | | | | | | | | |
(a) | TOTAL CAPITAL S.A. is a wholly-owned indirect subsidiary of the Company (with the exception of one share each held by the members of its boardBoard of directors,Directors, as required under French law). It acts as a financing vehicle for the Group. Its debt securities are fully and unconditionally guaranteed by the Company as to payment of principal, premium, if any, interest and any other amounts due. |
Loan repayment schedule (excluding current portion) | | | | | | | | | | | | | As of December 31, 2006 (M€) | | Non-current
financial debt | | of which hedging
instruments of
non-current
financial debt
(liabilities) | | Currency and
interest rate
swaps (assets) | | | Non-current
financial debt
after swaps | | % | | 2008 | | 2,604 | | 4 | | (245 | ) | | 2,359 | | 17 | % | 2009 | | 2,320 | | 14 | | (82 | ) | | 2,238 | | 16 | % | 2010 | | 3,083 | | 2 | | (104 | ) | | 2,979 | | 22 | % | 2011 | | 3,177 | | 75 | | (20 | ) | | 3,157 | | 23 | % | 2012 and beyond | | 2,990 | | 98 | | (35 | ) | | 2,955 | | 22 | % | Total | | 14,174 | | 193 | | (486 | ) | | 13,688 | | 100 | % |
| | | | | | | | | | | | As of December 31, 2008 (M€) | | Non-current
financial debt | | of which hedging
instruments of
non-current
financial debt
(liabilities) | | Hedging instruments
of non-current
financial debt (assets) | | | Non-current financial
debt - net of hedging
instruments | | % | 2010 | | 3,160 | | 170 | | (168 | ) | | 2,992 | | 20% | 2011 | | 3,803 | | 24 | | (145 | ) | | 3,658 | | 24% | 2012 | | 3,503 | | 115 | | (179 | ) | | 3,324 | | 22% | 2013 | | 3,430 | | 127 | | (198 | ) | | 3,232 | | 21% | 2014 and beyond | | 2,295 | | 4 | | (202 | ) | | 2,093 | | 13% | Total | | 16,191 | | 440 | | (892 | ) | | 15,299 | | 100% |
| | | | | | | | | | | | As of December 31, 2007
(M€) | | Non-current
financial debt | | of which hedging
instruments of
non-current
financial debt
(liabilities) | | Hedging instruments
of non-current
financial debt (assets) | | | Non-current financial
debt - net of hedging
instruments | | % | 2009 | | 2,137 | | 6 | | (114 | ) | | 2,023 | | 14% | 2010 | | 2,767 | | 16 | | (207 | ) | | 2,560 | | 18% | 2011 | | 3,419 | | 123 | | (65 | ) | | 3,354 | | 23% | 2012 | | 3,517 | | 90 | | (30 | ) | | 3,487 | | 24% | 2013 and beyond | | 3,036 | | 134 | | (44 | ) | | 2,992 | | 21% | Total | | 14,876 | | 369 | | (460 | ) | | 14,416 | | 100% |
| | | | | | | | | | | | As of December 31, 2006 (M€) | | Non-current
financial debt | | of which hedging
instruments of
non-current
financial debt
(liabilities) | | Hedging instruments
of non-current
financial debt (assets) | | | Non-current financial
debt - net of hedging
instruments | | % | 2008 | | 2,604 | | 4 | | (245 | ) | | 2,359 | | 17% | 2009 | | 2,320 | | 14 | | (82 | ) | | 2,238 | | 16% | 2010 | | 3,083 | | 2 | | (104 | ) | | 2,979 | | 22% | 2011 | | 3,177 | | 75 | | (20 | ) | | 3,157 | | 23% | 2012 and beyond | | 2,990 | | 98 | | (35 | ) | | 2,955 | | 22% | Total | | 14,174 | | 193 | | (486 | ) | | 13,688 | | 100% |
| | | | | | | | | | | | | As of December 31, 2005 (M€) | | Non-current
financial debt | | of which hedging
instruments of
non-current
financial debt
(liabilities) | | | Currency and
interest rate
swaps (assets) | | | Non-current
financial debt
after swaps | | % | 2007 | | 2,896 | | (12 | ) | | (223 | ) | | 2,673 | | 20% | 2008 | | 2,256 | | (10 | ) | | (117 | ) | | 2,139 | | 16% | 2009 | | 2,403 | | 1 | | | (94 | ) | | 2,309 | | 17% | 2010 | | 1,958 | | 50 | | | (22 | ) | | 1,936 | | 15% | 2011 and beyond | | 4,280 | | 99 | | | (21 | ) | | 4,259 | | 32% | Total | | 13,793 | | 128 | | | (477 | ) | | 13,316 | | 100% |
Analysis by currency and interest rate These analyses take into account interest rate and foreign currency swaps to hedge non-current financial debt. | | As of December 31, (M€) | | 2006 | | % | | 2005 | | % | | 2008 | | % | | 2007 | | % | | 2006 | | % | U.S. Dollar | | 6,981 | | 51% | | 9,778 | | 73% | | 3,990 | | 26% | | 4,700 | | 33% | | 6,981 | | 51% | Euro | | 5,382 | | 39% | | 2,324 | | 18% | | 10,685 | | 70% | | 8,067 | | 56% | | 5,382 | | 39% | Other currencies | | 1,325 | | 10% | | 1,214 | | 9% | | 624 | | 4% | | 1,649 | | 11% | | 1,325 | | 10% | Total | | 13,688 | | 100% | | 13,316 | | 100% | | 15,299 | | 100% | | 14,416 | | 100% | | 13,688 | | 100% |
| | | | | | | | | | As of December 31, (M€) | | 2006 | | % | | 2005 | | % | Fixed rates | | 896 | | 7% | | 1,089 | | 8% | Floating rates | | 12,792 | | 93% | | 12,227 | | 92% | Total | | 13,688 | | 100% | | 13,316 | | 100% |
Impact on net income
The amount of the cost of net debt after hedging instruments is disclosed in the consolidated statement of income under “Cost of net debt”.
The effective interest rate resulting from the cost of net debt approximates market conditions for the current debt. This effective rate may differ substantially from the interest rate of non-current loans as disclosed above, as the hedging instruments of interest rates are swaps that convert Group financing conditions to short-term market conditions (three-month average).
The 2006 gain for hedging instruments on debenture loans amounts to 18 M€ after tax ((23) M€ expense in 2005 and (12) M€ expense in 2004).
| | | | | | | | | | | | | | As of December 31,(M€) | | 2008 | | % | | 2007 | | % | | 2006 | | % | Fixed rate | | 633 | | 4% | | 893 | | 6% | | 896 | | 7% | Floating rate | | 14,666 | | 96% | | 13,523 | | 94% | | 12,792 | | 93% | Total | | 15,299 | | 100% | | 14,416 | | 100% | | 13,688 | | 100% |
B.B) CURRENT BORROWINGS, BANK OVERDRAFTSFINANCIAL ASSETS AND RELATED FINANCIAL INSTRUMENTSLIABILITIES
Current borrowings consist mainly of commercial paperpapers or treasury bills or drawingsdraws on bank loans. These instruments bear interest at rates that are close to market rates. | | As of December 31, (M€) | | 2006 | | 2005 | | | | | | | | Current financial debt and bank overdrafts | | 3,348 | | | 2,928 | | | | (Assets)/Liabilities | | | 2008 | | 2007 | | 2006 | | Current financial debt | | | 5,586 | | | 2,530 | | | 3,348 | | Current portion of non-current financial debt | | 2,510 | | | 992 | | | 2,136 | | | 2,083 | | | 2,510 | | Current borrowings and bank overdrafts | | 5,858 | | | 3,920 | | | Current borrowings | | | 7,722 | | | 4,613 | | | 5,858 | | Current portion of financial instruments for interest rate swaps liabilities | | — | | | 6 | | | 12 | | | 1 | | | — | | Other current financial instruments - liabilities | | 75 | | | 27 | | | 146 | | | 59 | | | 75 | | Other current financial liabilities (Note 27) | | 75 | | | 33 | | | Other current financial liabilities(note 28) | | | 158 | | | 60 | | | 75 | | Current deposits beyond three months | | (3,496 | ) | | — | | | (1 | ) | | (850 | ) | | (3,496 | ) | Current portion of financial instruments for interest rate swaps - assets | | (341 | ) | | (44 | ) | | (100 | ) | | (388 | ) | | (341 | ) | Other current financial instruments - assets | | (71 | ) | | (290 | ) | | (86 | ) | | (26 | ) | | (71 | ) | Current financial assets (Note 27) | | (3,908 | ) | | (334 | ) | | | | | | | Current borrowings, bank overdrafts and related financial assets and liabilities, net | | 2,025 | | | 3,619 | | | Current financial assets(note 28) | | | (187 | ) | | (1,264 | ) | | (3,908 | ) | Current borrowings and related financial assets and liabilities, net | | | 7,693 | | | 3,409 | | | 2,025 | |
C) NET-DEBT-TO-EQUITY RATIO Changes inFor its internal and external communication needs, the value of currentGroup calculates a debt ratio by dividing its net financial instruments are, in accordance with the methods described in paragraph M of Note 1 to the Consolidated Financial Statements, recognized in the net income of the period under “Financial interest on debt”, except for instruments qualified as net investment hedge, which are recognized directly in shareholders’debt by equity. Shareholders’ equity for an amount of (5) M€ as of December 31, 2006 ((146) M2008 is calculated after distribution of a dividend of 2.28€ asper share of December 31, 2005).which 1.14€ per share was paid on November 19, 2008.
The net-debt-to-equity ratio is calculated as follows: | | | | | | | | | | | As of December 31,(M€) | | | | | | | | | | | (Assets)/Liabilities | | 2008 | | | 2007 | | | 2006 | | Current borrowings | | 7,722 | | | 4,613 | | | 5,858 | | Other current financial liabilities | | 158 | | | 60 | | | 75 | | Current financial assets | | (187 | ) | | (1,264 | ) | | (3,908 | ) | Non-current financial debt | | 16,191 | | | 14,876 | | | 14,174 | | Hedging instruments of non-current financial debt | | (892 | ) | | (460 | ) | | (486 | ) | Cash and cash equivalents | | (12,321 | ) | | (5,988 | ) | | (2,493 | ) | Net financial debt | | 10,671 | | | 11,837 | | | 13,220 | | Shareholders’ equity - Group share | | 48,992 | | | 44,858 | | | 40,321 | | Estimated dividend payable | | (2,540 | ) | | (2,397 | ) | | (2,258 | ) | Minority interest | | 958 | | | 842 | | | 827 | | Total shareholder’s equity | | 47,410 | | | 43,303 | | | 38,890 | | Net-debt-to-equity ratio | | 22.5% | | | 27.3% | | | 34.0% | |
21.21) OTHER CREDITORS AND ACCRUED LIABILITIES
| As of December 31, (M€) | | 2006 | | 2005 | | 2008 | | 2007 | | 2006 | Advances from customers | | 1,430 | | 1,416 | | Accruals and deferred income | | 163 | | 253 | | 151 | | 137 | | 163 | Payable to states
(including taxes and duties) | | 7,204 | | 7,644 | | Payable to States (including taxes and duties) | | | 6,256 | | 7,860 | | 7,204 | Payroll | | 879 | | 1,015 | | 928 | | 909 | | 879 | Other | | 2,833 | | 2,741 | | Other operating liabilities | | | 4,297 | | 3,900 | | 4,263 | Total | | 12,509 | | 13,069 | | 11,632 | | 12,806 | | 12,509 |
22.22) LEASE CONTRACTS
The Group leases real estate, serviceretail stations, ships, and other equipmentequipments (see Note 11 to the Consolidated Financial Statements). The future minimum lease payments on operating and financialfinance leases to which the Group is committed are shown as follows: | As December 31, 2006 (M€) | | Operating
leases | | Financial
leases | | | 2007 | | 381 | | 52 | | | 2008 | | 378 | | 56 | | | For the year ended December 31,
2008(M€) | | | Operating
leases | | Finance
leases | | 2009 | | 307 | | 56 | | | 429 | | 47 | | 2010 | | 246 | | 51 | | | 306 | | 42 | | 2011 | | 153 | | 54 | | | 243 | | 42 | | 2012 and beyond | | 422 | | 218 | | | 2012 | | | 208 | | 42 | | 2013 | | | 166 | | 40 | | 2014 and beyond | | | 675 | | 148 | | Total minimum payments | | 1,887 | | 487 | | | 2,027 | | 361 | | Less financial expenses | | (87 | ) | | | | (70 | ) | Nominal value of contracts | | 400 | | | | | 291 | | Less current portion of
financial leases | | (29 | ) | | Outstanding liability | | 371 | | | Less current portion of finance lease contracts | | | | | (23 | ) | Outstanding liability of finance lease contracts | | | | | 268 | |
| | | | | | For the year ended December 31,
2007(M€) | | Operating
leases | | Finance
leases | | 2008 | | 427 | | 50 | | 2009 | | 352 | | 47 | | 2010 | | 291 | | 46 | | 2011 | | 210 | | 46 | | 2012 | | 149 | | 47 | | 2013 and beyond | | 492 | | 154 | | Total minimum payments | | 1,921 | | 390 | | Less financial expenses | | | | (47 | ) | Nominal value of contracts | | | | 343 | | Less current portion of finance lease contracts | | | | (26 | ) | Outstanding liability of finance lease contracts | | | | 317 | |
| | | | | | As December 31, 2005 (M€) | | Operating
leases | | Financial
leases | | 2006 | | 273 | | 51 | | 2007 | | 210 | | 47 | | 2008 | | 170 | | 50 | | 2009 | | 119 | | 41 | | 2010 | | 95 | | 41 | | 2011 and beyond | | 441 | | 199 | | Total minimum payments | | 1,308 | | 429 | | Less financial expenses | | | | 28 | | Nominal value of contracts | | | | 457 | | Less current portion of
financial leases | | | | (75 | ) | Outstanding liability | | | | 382 | |
| As of December 31, 2004 (M€) | | Operating
leases | | Financial
leases | | | 2005 | | 203 | | 52 | | | 2006 | | 169 | | 47 | | | For the year ended December 31,
2006(M€) | | | Operating
leases | | Finance
leases | | 2007 | | 116 | | 44 | | | 381 | | 52 | | 2008 | | 105 | | 46 | | | 378 | | 56 | | 2009 | | 68 | | 39 | | | 307 | | 56 | | 2010 and beyond | | 327 | | 231 | | | 2010 | | | 246 | | 51 | | 2011 | | | 153 | | 54 | | 2012 and beyond | | | 422 | | 218 | | Total minimum payments | | 988 | | 459 | | | 1,887 | | 487 | | Less financial expenses | | (104 | ) | | | | (87 | ) | Nominal value of contracts | | 355 | | | | | 400 | | Less current portion of
financial leases | | (30 | ) | | Outstanding liability | | 325 | | | Less current portion of finance lease contracts | | | | | (29 | ) | Outstanding liability of finance lease contracts | | | | | 371 | |
Net rental expense incurred under operating leases for the year ended December 31, 2006,2008, was 426 M€ (383 M€ in 2007 and 380 M€, 272 M€ in 2005 and 244 M€ in 2004.2006). 23.23) COMMITMENTS AND CONTINGENCIES
| | | | Maturity and installments | | Maturity and installments | | As of December 31, 2006(M€) | | Total | | Less than 1 year | | Between 1 and 5 years | | More than 5 years | | | As of December 31, 2008(M€) | | | Total | | Less than
1 year | | Between 1 and 5 years | | More than
5 years | Non-current debt obligations net of hedging instruments (Note 20) | | 13,317 | | — | | 10,548 | | 2,769 | | 15,031 | | — | | 13,064 | | 1,967 | Current portion of non-current debt obligations net of hedging instruments (Note 20) | | 2,140 | | 2,140 | | — | | — | | 2,025 | | 2,025 | | — | | — | Capital (financial) lease obligations (Note 22) | | 400 | | 29 | | 185 | | 186 | | Finance lease obligations(Note 22) | | | 291 | | 23 | | 142 | | 126 | Asset retirement obligations (Note 19) | | 3,893 | | 221 | | 576 | | 3,096 | | 4,500 | | 154 | | 653 | | 3,693 | Subtotal obligations recorded in the balance sheet | | 19,750 | | 2,390 | | 11,309 | | 6,051 | | Contractual obligations recorded in the balance sheet | | | 21,847 | | 2,202 | | 13,859 | | 5,786 | Operating lease obligations (Note 22) | | 1,887 | | 381 | | 1,084 | | 422 | | 2,027 | | 429 | | 923 | | 675 | Purchase obligations | | 37,327 | | 3,551 | | 9,696 | | 24,080 | | 60,226 | | 4,420 | | 13,127 | | 42,679 | Subtotal obligations not recorded in the balance sheet | | 39,214 | | 3,932 | | 10,780 | | 24,502 | | Contractual obligations not recorded in the balance sheet | | | 62,253 | | 4,849 | | 14,050 | | 43,354 | Total of contractual obligations | | 58,964 | | 6,322 | | 22,089 | | 30,553 | | 84,100 | | 7,051 | | 27,909 | | 49,140 | Guarantees given for excise taxes | | 1,807 | | 587 | | 22 | | 1,198 | | 1,720 | | 1,590 | | 58 | | 72 | Collateral given against borrowings | | 1,079 | | 16 | | 691 | | 372 | | 2,870 | | 1,119 | | 519 | | 1,232 | Indemnities related to sales of businesses | | 113 | | 38 | | 40 | | 35 | | 39 | | 3 | | 1 | | 35 | Other guarantees given | | 4,155 | | 1,694 | | 401 | | 2,060 | | Guarantees of current liabilities | | | 315 | | 119 | | 164 | | 32 | Guarantees to customers / suppliers | | | 2,866 | | 68 | | 148 | | 2,650 | Letters of credit | | | 1,080 | | 1,024 | | 17 | | 39 | Other operating commitments | | | 648 | | 246 | | 132 | | 270 | Total of other commitments given | | 7,154 | | 2,335 | | 1,154 | | 3,665 | | 9,538 | | 4,169 | | 1,039 | | 4,330 | Mortgages and liens received | | 329 | | 11 | | 77 | | 241 | | 321 | | 72 | | 110 | | 139 | Other commitments received | | 2,965 | | 2,089 | | 315 | | 561 | | 4,218 | | 2,440 | | 234 | | 1,544 | Total of commitments received | | 3,294 | | 2,100 | | 392 | | 802 | | 4,539 | | 2,512 | | 344 | | 1,683 |
| | | | Maturity and installments | | Maturity and installments | | As of December 31, 2005(M€) | | Total | | Less than 1 year | | Between 1 and 5 years | | More than 5 years | | | As of December 31, 2007(M€) | | | Total | | Less than
1 year | | Between
1 and 5 years | | More than
5 years | Non-current debt obligations net of hedging instruments (Note 20) | | 12,934 | | 0 | | 8,877 | | 4,057 | | 14,099 | | — | | 11,251 | | 2,848 | Current portion of non-current debt obligations net of hedging instruments (Note 20) | | 879 | | 879 | | 0 | | 0 | | 1,669 | | 1,669 | | — | | — | Capital (financial) lease obligations (Note 22) | | 457 | | 75 | | 180 | | 202 | | Finance lease obligations(Note 22) | | | 343 | | 26 | | 173 | | 144 | Asset retirement obligations (Note 19) | | 3,710 | | 174 | | 446 | | 3,090 | | 4,206 | | 189 | | 503 | | 3,514 | Subtotal obligations recorded in the balance sheet | | 17,980 | | 1,128 | | 9,503 | | 7,349 | | Contractual obligations recorded in the balance sheet | | | 20,317 | | 1,884 | | 11,927 | | 6,506 | Operating lease obligations (Note 22) | | 1,308 | | 273 | | 594 | | 441 | | 1,921 | | 427 | | 1,002 | | 492 | Purchase obligations | | 24,177 | | 3,402 | | 8,112 | | 12,663 | | 61,794 | | 3,210 | | 15,419 | | 43,165 | Subtotal obligations not recorded in the balance sheet | | 25,485 | | 3,675 | | 8,706 | | 13,104 | | Contractual obligations not recorded in the balance sheet | | | 63,715 | | 3,637 | | 16,421 | | 43,657 | Total of contractual obligations | | 43,465 | | 4,803 | | 18,209 | | 20,453 | | 84,032 | | 5,521 | | 28,348 | | 50,163 | Guarantees given for excise taxes | | 2,827 | | 2,552 | | 29 | | 246 | | 1,796 | | 590 | | 58 | | 1,148 | Collateral given against borrowings | | 1,089 | | 19 | | 823 | | 247 | | 781 | | 9 | | 624 | | 148 | Indemnities related to sales of businesses | | 221 | | 162 | | 32 | | 27 | | 40 | | — | | 3 | | 37 | Other guarantees given | | 5,252 | | 2,305 | | 1,841 | | 1,106 | | Guarantees of current liabilities | | | 97 | | 16 | | 48 | | 33 | Guarantees to customers/suppliers | | | 1,197 | | 23 | | 6 | | 1,168 | Letters of credit | | | 1,677 | | 1,677 | | — | | — | Other operating commitments | | | 1,280 | | 207 | | 151 | | 922 | Total of other commitments given | | 9,389 | | 5,038 | | 2,725 | | 1,626 | | 6,868 | | 2,522 | | 890 | | 3,456 | Mortgages and liens received | | 280 | | 10 | | 158 | | 112 | | 353 | | 7 | | 69 | | 277 | Other commitments received | | 3,587 | | 2,400 | | 561 | | 626 | | 3,887 | | 2,781 | | 377 | | 729 | Total of commitments received | | 3,867 | | 2,410 | | 719 | | 738 | | 4,240 | | 2,788 | | 446 | | 1,006 |
| | | | | | | | | | | | Maturity and installments | | As of December 31, 2006(M€) | | Total | | Less than
1 year | | Between
1 and 5 years | | More than 5 years | Non-current debt obligations net of hedging instruments(Note 20) | | 13,317 | | — | | 10,548 | | 2,769 | Current portion of non-current debt obligations net of hedging instruments(Note 20) | | 2,140 | | 2,140 | | — | | — | Finance lease obligations(Note 22) | | 400 | | 29 | | 185 | | 186 | Asset retirement obligations(Note 19) | | 3,893 | | 221 | | 576 | | 3,096 | Contractual obligations recorded in the balance sheet | | 19,750 | | 2,390 | | 11,309 | | 6,051 | Operating lease obligations(Note 22) | | 1,887 | | 381 | | 1,084 | | 422 | Purchase obligations | | 37,327 | | 3,551 | | 9,696 | | 24,080 | Contractual obligations not recorded in the balance sheet | | 39,214 | | 3,932 | | 10,780 | | 24,502 | Total of contractual obligations | | 58,964 | | 6,322 | | 22,089 | | 30,553 | Guarantees given for excise taxes | | 1,807 | | 587 | | 22 | | 1,198 | Collateral given against borrowings | | 1,079 | | 16 | | 691 | | 372 | Indemnities related to sales of businesses | | 113 | | 38 | | 40 | | 35 | Guarantees of current liabilities | | 68 | | 21 | | 15 | | 32 | Guarantees to customers/suppliers | | 1,544 | | 150 | | 181 | | 1,213 | Letters of credit | | 1,416 | | 1,416 | | — | | — | Other operating commitments | | 1,127 | | 107 | | 205 | | 815 | Total of other commitments given | | 7,154 | | 2,335 | | 1,154 | | 3,665 | Mortgages and liens received | | 329 | | 11 | | 77 | | 241 | Other commitments received | | 2,965 | | 2,089 | | 315 | | 561 | Total of commitments received | | 3,294 | | 2,100 | | 392 | | 802 |
A. CONTRACTUAL OBLIGATIONS Debt obligations “Non-current debt obligations” are included in the items “Non-current financial debt” and “Hedging instruments of non-current financial debt” onof the balance sheet.Consolidated Balance Sheet. It includes the non-current portion of issue swaps and swaps hedging debenture loans,bonds, and excludes non-current finance lease obligations of 371268 M€. The current portion of non-current debt is included in the items “Current borrowings”, “Current financial assets” and “Other current financial liabilities” onof the balance sheet.Consolidated Balance Sheet. It includes the current portion of issue swaps and swaps hedging debenture loansbonds and excludes the current portion of capitalfinance lease obligations of 2923 M€. The information regarding contractual obligations linked to indebtedness is presented in Note 20 to the Consolidated Financial Statements. Lease contracts The information regarding operating and finance leases is presented in Note 22 to the Consolidated Financial Statements. Asset retirement obligations This item represents the discounted present value of Upstream asset retirement obligations, primarily asset removal costs at the completion date. The information regarding contractual obligations linked to asset retirement obligations is presented in NoteNotes 1Q and 19 to the Consolidated Financial Statements. Purchase obligations Purchase obligations are obligations under contractual agreements to purchase goods or services, including capital projects, thatprojects. These obligations are enforceable and legally binding on the company and that specify all significant terms, including the amount and the timing of the payments. These obligations include mainly:mainly include: hydrocarbon unconditional hydrocarbon purchase contracts (except where an active, highly-liquid market exists and when the hydrocarbons are expected to be re-sold shortly after purchase), reservation of transport capacities in pipelines, unconditional exploration works and development workworks in the Upstream segment, and contracts for capital investment projects in the Downstream segment. B. OTHER COMMITMENTS GIVEN Guarantees given for excise taxes Guarantees given on customs duties, which amount to 1,807 M€ as of December 31, 2006, mainlyThey consist of guarantees given to other oil and gas companies in order to comply with French tax authorities’ requirements for oil and gas imports in France. A payment would be triggered by a failure of the guaranteed party with respect to the French tax authorities. The default of the guaranteed parties is however considered to be highly remote by the Group.
CollateralGuarantees given against borrowings
The Group guarantees bank debt and finance lease obligations of certain unconsolidatednon-consolidated companies and equity affiliates. ExpirationMaturity dates vary, and guarantees will terminate on payment and/or cancellation of the obligation. A payment would be triggered by failure of the guaranteed party to fulfill its obligation covered by the guarantee, and no assets are held as collateral for these guarantees. The amountAs of December 31, 2008, the maturities of these guarantees total approximately 1,079 M€ as of December 31, 2006 for debt guarantees with maturitiesare up to 2019.2023. Indemnities related to sales of businesses In the ordinary course of business, the Group executes contracts involving standard indemnities in the industry and indemnificationsindemnities specific to a transaction such as sale of a business. These indemnificationsindemnities might include claims against any of the following: environmental, tax and shareholder matters, intellectual property rights, governmental regulations and employment-related matters, dealer, supplier, and other commercial contractual relationships. Performance under these indemnities would generally be triggered by a breach of terms of the contract or by a third party claim. The Group regularly evaluates the probability of having to incur costs associated with these indemnifications. Guarantees related to business sales consist mainly of guarantees given for the sale of the Inks division in 1999 and the sale of the Paints business in 2003.indemnities.
The guarantees related to antitrust investigations granted as part of the agreement relating to the spin-off of Arkema are described in Note 3032 to the Consolidated Financial Statements. Other guarantees given Non-consolidated subsidiariescompanies The Group also guarantees the current liabilities of some ofcertain non-consolidated subsidiaries.companies. Performance under these guarantees would be triggered by a financial default of the entity. As of December 31, 2006, the total amount of these guarantees is estimated to be 68 M€. Other guarantees givenOperating agreements
In the ordinary courseAs part of normal ongoing business operations and consistent with generally and accepted and recognized industry practice, the
industry practices, the Group enters into numerous agreements with otherthird parties. These commitments are often entered into for commercial purposes, or for regulatory purposes and for other operating agreements. As of December 31, 2006, these other commitments include guarantees given to customers or suppliers for 1,544 M €24) RELATED PARTIES, guarantees on letters of credit for 1,416 M€
The main transactions and other operating commitments for 1,195 M€.balances with related parties (principally non-consolidated companies and equity affiliates) are detailed as follows: In line with the business practices of oil and gas companies
| | | | | | | Balance sheet As of December 31,(M€) | | 2008 | | 2007 | | 2006 | Receivables | | | | | | | Debtors and other debtors | | 244 | | 277 | | 411 | Loans (excl. loans to equity affiliates) | | 354 | | 378 | | 457 | Payables | | | | | | | Creditors and other creditors | | 136 | | 460 | | 424 | Debts | | 50 | | 28 | | 25 | Statement of income For the year ended
December 31,(M€) | | 2008 | | 2007 | | 2006 | | | | | Sales | | 3,082 | | 2,635 | | 1,996 | Purchases | | 4,061 | | 3,274 | | 3,123 | Financial expense | | — | | — | | — | Financial income | | 114 | | 29 | | 60 |
Compensation for the developmentadministration and management bodies The aggregate amount paid directly or indirectly by the French and foreign affiliates of gas fields,the Company as compensation to the executive officers of TOTAL (the members of the Management Committee and the Treasury) and to the members of the Board of Directors who are employees of the Group, is involveddetailed as follows: | | | | | | | For the year ended December 31,
(M€) | | 2008 | | 2007 | | 2006 | Number of people | | 30 | | 30 | | 32 | Direct or indirect compensation | | 20.4 | | 19.9 | | 19.8 | Share-based payment expense (IFRS 2)(a) | | 16.6 | | 18.4 | | 16.6 | Pension expenses(b) | | 11.9 | | 12.2 | | 14.0 |
| (a) | Share-based payments expense computed for the executive officers and the members of the Board of Directors who are employees of the Group as described in Note 25 paragraph E to the Consolidated Financial Statements and based on the principles of IFRS 2 “Share-based payments” described in Note 1 paragraph E to the Consolidated Financial Statements. |
| (b) | The benefits provided for executive officers and certain members of the Board of Directors, employees and former employees of the Group, include severance to be paid on retirement, supplementary pension schemes and insurance plans, which represent 98.0 M€ provisioned as of December 31, 2008, against 102.9 M€ as of December 31, 2007 and 113.2 M€ as of December 31, 2006. |
The compensation allocated to members of the Board of Directors for directors’ fees totaled 0.83 M€ in long-term sale agreements on quantities of natural gas. The price of these contracts is indexed to prices of petroleum products2008 (0.82 M€ in 2007 and other forms of energy.0.82 M€ in 2006). 24. SHARE-BASED25) SHARE BASED PAYMENTS
A. TOTAL SHARE SUBSCRIPTION OPTIONS PLANS | | | | | | | | | | | | | | | | | | | 2003 Plan(a) | | | 2004 Plan(b) | | | 2005 Plan(c) | | | 2006 Plan(d) | | | Total | | Exercise price until May 23, 2006 included (€)(e) | | 33.30 | | | 39.85 | | | 49.73 | | | — | | | | | Exercise price since May 24, 2006 (€)(e) | | 32.84 | | | 39.30 | | | 49.04 | | | 50.60 | | | | | Expiration date | | 07/16/2011 | | | 07/20/2012 | | | 07/19/2013 | | | 07/18/2014 | | | | | Number of options(f) | | | | | | | | | | | | | | | | Existing options as of January 1, 2004 | | 11,741,224 | | | — | | | — | | | — | | | 11,741,224 | | Granted | | — | | | 13,462,520 | | | — | | | | | | 13,462,520 | | Cancelled | | (8,400 | ) | | (48,000 | ) | | — | | | | | | (56,400 | ) | Exercised | | (3,800 | ) | | — | | | — | | | | | | (3,800 | ) | Existing options as of January 1, 2005 | | 11,729,024 | | | 13,414,520 | | | | | | | | | 25,143,544 | | Granted | | — | | | 24,000 | | | 6,104,480 | | | | | | 6,128,480 | | Cancelled | | (10,000 | ) | | (16,400 | ) | | (10,400 | ) | | | | | (36,800 | ) | Exercised | | (522,228 | ) | | (10,800 | ) | | — | | | | | | (533,028 | ) | Existing options as of January 1, 2006 | | 11,196,796 | | | 13,411,320 | | | 6,094,080 | | | | | | 30,702,196 | | Granted | | — | | | — | | | 134,400 | | | 5,727,240 | | | 5,861,640 | | Cancelled | | (22,200 | ) | | (57,263 | ) | | (43,003 | ) | | (1,080 | ) | | (123,546 | ) | Adjustment following the spin-off of Arkema(g) | | 163,180 | | | 196,448 | | | 90,280 | | | — | | | 449,908 | | Exercised | | (729,186 | ) | | (120,133 | ) | | — | | | — | | | (849,319 | ) | Existing options as of December 31, 2006 | | 10,608,590 | | | 13,430,372 | | | 6,275,757 | | | 5,726,160 | | | 36,040,879 | |
| | | | | | | | | | | | | | | | | | | | | | | | | | | 2003 Plan(a) | | | 2004 Plan(b) | | | 2005 Plan(c) | | | 2006 Plan(d) | | | 2007 Plan(e) | | | 2008 Plan(f) | | | Total | | | Weighted- average exercise price | Exercise price until May 23, 2006 included(g) | | 33.30 | | | 39.85 | | | 49.73 | | | | | | | | | | | | | | | | Exercise price since May 24, 2006(g) | | 32.84 | | | 39.30 | | | 49.04 | | | 50.60 | | | 60.10 | | | 42.90 | | | | | | | Expiration date | | 07/16/2011 | | | 07/20/2012 | | | 07/19/2013 | | | 07/18/2014 | | | 07/17/2015 | | | 10/09/2016 | | | | | | | Number of options(h) | | | | | | | | | | | | | | | | | | | | | | | | Outstanding options as of January 1, 2006 | | 11,196,796 | | | 13,411,320 | | | 6,094,080 | | | | | | | | | | | | 30,702,196 | | | 39.42 | Granted | | — | | | — | | | 134,400 | | | 5,727,240 | | | | | | | | | 5,861,640 | | | 50.58 | Cancelled | | (22,200 | ) | | (57,263 | ) | | (43,003 | ) | | (1,080 | ) | | | | | | | | (123,546 | ) | | 41.74 | Adjustment following the spin-off of Arkema(i) | | 163,180 | | | 196,448 | | | 90,280 | | | — | | | | | | | | | 449,908 | | | | Exercised | | (729,186 | ) | | (120,133 | ) | | — | | | — | | | | | | | | | (849,319 | ) | | 33.85 | Outstanding options as of January 1, 2007 | | 10,608,590 | | | 13,430,372 | | | 6,275,757 | | | 5,726,160 | | | | | | | | | 36,040,879 | | | 40.89 | Granted | | — | | | — | | | — | | | — | | | 5,937,230 | | | | | | 5,937,230 | | | 60.10 | Cancelled | | (22,138 | ) | | (20,093 | ) | | (11,524 | ) | | (13,180 | ) | | (17,125 | ) | | | | | (84,060 | ) | | 44.94 | Exercised | | (2,218,074 | ) | | (213,043 | ) | | (20,795 | ) | | (1,920 | ) | | — | | | | | | (2,453,832 | ) | | 33.55 | Outstanding options as of January 1, 2008 | | 8,368,378 | | | 13,197,236 | | | 6,243,438 | | | 5,711,060 | | | 5,920,105 | | | | | | 39,440,217 | | | 44.23 | Granted | | — | | | — | | | — | | | — | | | — | | | 4,449,810 | | | 4,449,810 | | | 42.90 | Cancelled | | (25,184 | ) | | (118,140 | ) | | (34,032 | ) | | (53,304 | ) | | (34,660 | ) | | (6,000 | ) | | (271,320 | ) | | 44.88 | Exercised | | (841,846 | ) | | (311,919 | ) | | (17,702 | ) | | (6,700 | ) | | — | | | — | | | (1,178,167 | ) | | 34.89 | Outstanding options as of December 31, 2008 | | 7,501,348 | | | 12,767,177 | | | 6,191,704 | | | 5,651,056 | | | 5,885,445 | | | 4,443,810 | | | 42,440,540 | | | 44.35 |
(a) | Grants decidedapproved by the Board of Directors on July 16, 2003 pursuant to the authorization given by the shareholders’ meeting held on May 17, 2001. The options are exercisable only after a two-year period from the date of the option is granted toBoard meeting awarding the individual employeeoptions and must be exercised within eight years from the date of grant.this date. Underlying shares may not be sold for four years from the date of grant. |
| (b) | Grants decidedapproved by the Board of Directors on July 20, 2004 pursuant to the authorization given by the shareholders’ meeting held on May 14, 2004. The options are exercisable only after a two-year period from the date of the option is granted toBoard meeting awarding the individual employeeoptions and must be exercised within eight years from this date.date. Underlying shares may not be sold for four years from the date of grant. |
| (c) | Grants decidedapproved by the Board of Directors on July 19, 2005 pursuant to the authorization given by the shareholders’ meeting held on May 14, 2004. The options are exercisable only after a two-year period from the date of the option is granted toBoard meeting awarding the individual employeeoptions and must be exercised within eight years from this date.date. Underlying shares may not be sold for four years from the date of grant. |
| (d) | Grants decidedapproved by the Board of Directors on July 18, 2006 pursuant to the authorization given by the shareholders’ meeting held on May 14, 2004. The options are exercisable only after a two-year period from the date of the option is granted toBoard meeting awarding the individual employeeoptions and must be exercised within eight years from this date. Underlying shares may not be sold for four years from the date of grant. |
| (e) | To reflectGrants approved by the Board of Directors on July 17, 2007 pursuant to the authorization given by the shareholders’ meeting held on May 11, 2007. The options are exercisable only after a two-year period from the date of the Board meeting awarding the options and must be exercised within eight years from this date. Underlying shares may not be sold for four years from the date of grant. Beneficiaries working for a non-French subsidiary as of July 17, 2007 are authorized to transfer the shares issued upon exercise of options starting from July 18, 2009. Furthermore, the Board of Directors decided that for each beneficiary of more than 25,000 stock options, one third of the options granted in excess of this number will definitely be awarded following the two-year vesting period, under a performance condition based on the return on equity of the Group and calculated on the Consolidated Financial Statements of the Group for the fiscal year 2008. The performance condition states that the grant rate is null if the return on equity is less than or equal to 10%, varies on a straight-line basis between 0% and 80% if the return on equity is more than 10% and less than 18%, varies on a straight-line basis between 80% and 100% if the return on equity is more than or equal to 18% and less than 30%, and is equal to 100% if the return on equity is more than or equal to 30% |
| (f) | Grants on October 9, 2008 approved by the Board of Directors on September 9, 2008 pursuant to the authorization given by the shareholders’ meeting held on May 11, 2007. The options are exercisable only after a two-year period from the date of the Board meeting awarding the options and must be exercised within eight years from this date. Underlying shares may not be sold for four years from the date of grant. Beneficiaries working for a non-French subsidiary as of October 9, 2008, are authorized to transfer the shares issued upon exercise of options starting from October 10, 2010. Furthermore, the Board of Directors decided that for each beneficiary of more than 25,000 stock options, one third of the options granted in excess of this number will finally be awarded following the two-year vesting period, under a performance condition based on the return on equity of the Group and calculated on the Consolidated Financial Statements of the Group for the fiscal year 2009 (performance condition described in footnote (e) above). |
| (g) | Exercise price in euro. The exercise prices of TOTAL subscription shares of the plans in force at that date were multiplied by 0.25 to take into account the four-for-one stock split the exercise prices of TOTAL share subscription options were divided by four.on May 18, 2006. Moreover, following the spin-off of Arkema, the exercise prices of TOTAL share subscription optionsshares of these plans were multiplied by an adjustment factor equal to 0.986147 with effect as of May 24, 2006. |
(f)(h) | The number of options awarded, outstanding, cancelled or exercised before May 23, 2006 included, was multiplied by four to reflect the four-for-one stock split.split approved by the shareholders’ meeting on May 12, 2006. |
(g)(i) | Adjustments decidedapproved by the Board of Directors on March 14, 2006, in application of Articles 174-9, 174-12 and 174-13 of the Decree No.67-236decree No. 67-236 of March 23, 1967 in force during this Board of Directors and during TOTAL S.A. shareholders’ meeting of May 12, 2006, as part of the spin-off of Arkema. These adjustments have been made on May 22, 2006 with effect as of May 24, 2006. |
B. TOTAL SHARE PURCHASE PLANOPTIONS PLANS | | | | | | | | | | | | | | | | | | | | | | 1998 Plan(a) | | | 1999 Plan(b) | | | 2000 Plan(c) | | | 2001 Plan(d) | | | 2002 Plan(e) | | | Total | | Exercise price until May 23, 2006 included (€)(f) | | 23.44 | | | 28.25 | | | 40.68 | | | 42.05 | | | 39.58 | | | | | Exercise price since May 24, 2006(€)(f) | | — | | | 27.86 | | | 40.11 | | | 41.47 | | | 39.03 | | | | | Expiration date | | 03/17/2006 | | | 06/15/2007 | | | 07/11/2008 | | | 07/10/2009 | | | 07/09/2010 | | | | | Number of options(g) | | | | | | | | | | | | | | | | | | | Existing options as of January 1, 2004 | | 2,890,152 | | | 5,626,468 | | | 9,636,180 | | | 10,734,500 | | | 11,452,800 | | | 40,340,100 | | Granted | | — | | | — | | | — | | | — | | | — | | | — | | Cancelled | | — | | | — | | | (5,200 | ) | | (10,800 | ) | | (3,200 | ) | | (19,200 | ) | Exercised | | (1,334,104 | ) | | (1,520,352 | ) | | (5,200 | ) | | — | | | (3,088 | ) | | (2,862,744 | ) | Existing options as of January 1, 2005 | | 1,556,048 | | | 4,106,116 | | | 9,625,780 | | | 10,723,700 | | | 11,446,512 | | | 37,458,156 | | Granted | | — | | | — | | | — | | | — | | | — | | | — | | Cancelled | | (400 | ) | | (1,200 | ) | | (7,000 | ) | | (4,000 | ) | | (9,800 | ) | | (22,400 | ) | Exercised | | (965,996 | ) | | (2,052,484 | ) | | (3,108,836 | ) | | (1,983,800 | ) | | (153,232 | ) | | (8,264,348 | ) | Existing options as of January 1, 2006 | | 589,652 | | | 2,052,432 | | | 6,509,944 | | | 8,735,900 | | | 11,283,480 | | | 29,171,408 | | Granted | | — | | | — | | | — | | | — | | | — | | | — | | Cancelled | | (72,692 | ) | | — | | | (7,272 | )(i) | | (15,971 | ) | | (26,694 | ) | | (122,629 | ) | Adjustment following the spin-off of Arkema(h) | | — | | | 25,772 | | | 84,308 | | | 113,704 | | | 165,672 | | | 389,456 | | Exercised | | (516,960 | ) | | (707,780 | ) | | (1,658,475 | ) | | (1,972,348 | ) | | (2,141,742 | ) | | (6,997,305 | ) | Existing options as of December 31, 2006 | | — | | | 1,370,424 | | | 4,928,505 | | | 6,861,285 | | | 9,280,716 | | | 22,440,930 | |
| | | | | | | | | | | | | | | | | | | | | | | | 1998 Plan(a) | | | 1999 Plan(b) | | | 2000 Plan(c) | | | 2001 Plan(d) | | | 2002 Plan(e) | | | Total | | | Weighted- average exercise price | Exercise price until May 23, 2006 included(f) | | 23.44 | | | 28.25 | | | 40.68 | | | 42.05 | | | 39.58 | | | | | | | Exercise price since May 24, 2006(f) | | | | | 27.86 | | | 40.11 | | | 41.47 | | | 39.03 | | | | | | | Expiration date | | 03/17/2006 | | | 06/15/2007 | | | 07/11/2008 | | | 07/10/2009 | | | 07/09/2010 | | | | | | | Number of options(g) | | | | | | | | | | | | | | | | | | | | | Outstanding options as of January 1, 2006 | | 589,652 | | | 2,052,432 | | | 6,509,944 | | | 8,735,900 | | | 11,283,480 | | | 29,171,408 | | | 39.44 | Granted | | — | | | — | | | — | | | — | | | — | | | — | | | — | Cancelled(h) | | (72,692 | ) | | — | | | (7,272 | ) | | (15,971 | ) | | (26,694 | ) | | (122,629 | ) | | 30.20 | Adjustment following the spin-off of Arkema(i) | | — | | | 25,772 | | | 84,308 | | | 113,704 | | | 165,672 | | | 389,456 | | | | Exercised | | (516,960 | ) | | (707,780 | ) | | (1,658,475 | ) | | (1,972,348 | ) | | (2,141,742 | ) | | (6,997,305 | ) | | 37.87 | Outstanding options as of January 1, 2007 | | — | | | 1,370,424 | | | 4,928,505 | | | 6,861,285 | | | 9,280,716 | | | 22,440,930 | | | 39.33 | Granted | | | | | — | | | — | | | — | | | — | | | — | | | — | Cancelled | | | | | (138,023 | ) | | (3,452 | ) | | (7,316 | ) | | (7,104 | ) | | (155,895 | ) | | 29.28 | Exercised | | | | | (1,232,401 | ) | | (1,782,865 | ) | | (1,703,711 | ) | | (2,210,429 | ) | | (6,929,406 | ) | | 37.92 | Outstanding options as of January 1, 2008 | | | | | — | | | 3,142,188 | | | 5,150,258 | | | 7,063,183 | | | 15,355,629 | | | 40.07 | Granted | | | | | | | | — | | | — | | | — | | | — | | | — | Cancelled | | | | | | | | (480,475 | ) | | (3,652 | ) | | (13,392 | ) | | (497,519 | ) | | 40.09 | Exercised | | | | | | | | (2,661,713 | ) | | (455,180 | ) | | (598,934 | ) | | (3,715,827 | ) | | 40.10 | Outstanding options as of December 31, 2008 | | | | | | | | — | | | 4,691,426 | | | 6,450,857 | | | 11,142,283 | | | 40.06 |
| (a) | Grants decidedapproved by the Board of Directors on March 17, 1998 pursuant to the authorization given by the shareholders’ meeting held on May 21, 1997. The options were exercisable only after a five-year period from the date of the option was granted toBoard meeting awarding the individual employeeoptions and had to be exercised within eight years from this date. This plan expired on March 17, 2006. |
| (b) | Grants decidedapproved by the Board of Directors on June 15, 1999 pursuant to the authorization given by the shareholders’ meeting held on May 21, 1997. The options arewere exercisable only after a five-year period from the date of the option is grantedBoard meeting awarding the options and had to the individual employee and must be exercised within eight years from this date. This plan has expired on June 15, 2007. |
| (c) | Grants decidedapproved by the Board of Directors on July 11, 2000 pursuant to the authorization given by the shareholders’ meeting held on May 21, 1997. The options arewere exercisable only after a four-year period from the date of the option is grantedBoard meeting awarding the options and has to the individual employee and must be exercised within eight years from this date. For beneficiaries holding contracts with French companies or working in France, the shares arising from the exercise of options may not be sold for five years from the date of grant. This plan expired on July 11, 2008. |
| (d) | Grants decidedapproved by the Board of Directors on July 10, 2001 pursuant to the authorization given by the shareholders’ meeting held on May 17, 2001. The options are exercisable only after January 1, 2005 and must be exercised within eight years from the date of grant. For beneficiaries holding contracts with French companies or working in France, the shares arising from the exercise of options may not be sold for four years from the date of grant. Underlying shares may not be sold for four years from the date of grant. |
| (e) | Grants decidedapproved by the Board of Directors on July 9, 2002 pursuant to the authorization given by the shareholders’ meeting held on May 17, 2001. The options are exercisable only after a two-year period from the date of the option is granted toBoard meeting awarding the individual employeeoptions and must be exercised within eight years from this date. Underlying shares may not be sold for four years from the date of grant. |
| (f) | To reflect the four-for-one stock split, theExercise price in euro. The exercise prices of TOTAL share purchase options of the plans at that date were dividedmultiplied by four.0.25 to take into account the four-for-one stock split on May 18, 2006. Moreover, following the spin-off of Arkema, the exercise prices of TOTAL share purchase options of these plans were multiplied by an adjustment factor equal to 0.986147 with effect as of May 24, 2006. |
| (g) | The number of options awarded, outstanding, cancelled or exercised before May 23, 2006 included, was multiplied by four to reflect the four-for-one stock split.split approved by the shareholders’ meeting on May 12, 2006. |
| (h) | Including the confirmation in 2006 by the Company of the award of 500 stock options, par value€10, that had been cancelled erroneously in 2001 (Plan 2000). |
| (i) | Adjustments decidedapproved by the Board of Directors on March 14, 2006 in application of Articles 174-9, 174-12 and 174-13 of the Decree No.67-236decree n°67-236 of March 23, 1967 in force during this Board of Directors and during TOTAL S.A. shareholders’ meeting of May 12, 2006, as part of the spin-off of Arkema. These adjustments have been made on May 22, 2006 with effect as of May 24, 2006. |
(i) | Including the confirmation in 2006 by the Company of the award of 500 stock options (for underlying shares with a par value of€10 per share) that had been cancelled erroneously in 2001. |
C. | | EXCHANGE GUARANTEE GRANTED TO THE HOLDERS OF ELF AQUITAINE SHARE SUBSCRIPTION OPTIONS |
C. EXCHANGE GUARANTEE GRANTED TO THE HOLDERS OF ELF AQUITAINE SHARE SUBSCRIPTION OPTIONS Pursuant to the public exchange offer for Elf Aquitaine shares which was made in 1999, the Group made a commitment to guarantee the holders of Elf Aquitaine share subscription options, at the end of the period referred to in Article 163 bis C of the French Tax Code (CGI), and until the end of the period for the exercise of the options, the possibility to exchange their future Elf Aquitaine shares for TOTAL shares, on the basis of the exchange ratio of the offer (19 TOTAL shares for 13 Elf Aquitaine shares). In order to take into account the spin-off of S.D.A. (Société de Développement Arkema) by Elf Aquitaine, the spin-off of Arkema by TOTAL S.A. and the four-for-one TOTAL stock split, the Board of Directors of TOTAL S.A., in accordance with the terms of the share exchange undertaking, decidedapproved on March 14, 2006 to adjust the exchange ratio described above.above (see pages 24 and 25 of the “Prospectus for the purpose of listing Arkema shares on Eurolist by Euronext in connection with the allocation of Arkema shares to TOTAL S.A. shareholders”). Following the approval by Elf Aquitaine shareholder’sshareholders’ meeting on May 10, 2006 of the spin-off of S.D.A. by Elf Aquitaine, the approval by TOTAL S.A. shareholder’sshareholders’ meeting on May 12, 2006 of the spin-off of Arkema by TOTAL S.A. and the four-for-one TOTAL stock split, the exchange ratio was adjusted to six TOTAL shares for one Elf Aquitaine share on May 22, 2006. As of December 31, 2006,2008, a maximum of 193,150101,681 Elf Aquitaine shares, either outstanding or to be created, were covered by this guarantee, as follows: | | | | | | | | Elf Aquitaine subscription plan(a) | | 1999 Plan No.1 | | 1999 Plan No.2 | | Total | Exercise price until May 23, 2006 included(€)(b) | | 115.60 | | 171.60 | | | Exercise price since May 24, 2006(€)(b) | | 114.76 | | 170.36 | | | Expiration date | | 03/30/2009 | | 12/9/2009 | | | Outstanding position as of December 31, 2006 | | 180,932 | | 6,044 | | 186,976 | | Outstanding Elf Aquitaine shares covered by the exchange guarantee as of December 31, 2006 | | 6,174 | | — | | 6,174 | | Total of Elf Aquitaine shares, either outstanding or to be created, covered by the exchange guarantee for TOTAL shares as of December 31, 2006 | | 187,106 | | 6,044 | | 193,150 | | TOTAL shares likely to be created within the scope of the application of the exchange guarantee as of December 31, 2006 | | 1,122,636 | | 36,264 | | 1,158,900 |
| | | | | | | | | | Elf Aquitaine subscription plan(a) | | 1999 Plan
n°1 | | 1999 Plan
n°2 | | Total | | Weighted-
average
exercise
price(b) | Exercise price until May 23, 2006 included(b) | | 115.60 | | 171.60 | | | | | Exercise price since May 24, 2006(b) | | 114.76 | | 170.36 | | | | | Expiration date | | 03/30/2009 | | 09/12/2009 | | | | | Outstanding position as of December 31, 2008 | | 90,342 | | 6,044 | | 96,386 | | 118.25 | | Outstanding Elf Aquitaine shares covered by the exchange guarantee as of December 31, 2008 | | 5,295 | | — | | 5,295 | | 114.76 | | Total of Elf Aquitaine shares, either outstanding or to be created, covered by the exchange guarantee for TOTAL shares as of December 31, 2008 | | 95,637 | | 6,044 | | 101,681 | | | | TOTAL shares likely to be created within the scope of the application of the exchange guarantee as of December 31, 2008 | | 573,822 | | 36,264 | | 610,086 | | |
| (a) | Adjustments of the number of options decidedapproved by the Board of Directors of Elf Aquitaine on March 10, 2006 in application of Articlesarticles 174-9, 174-12 and 174-13 of the Decree No.67-236decree No. 67-236 of March 23, 1967 in force on March 10, 2006 and during Elf Aquitaine shareholders’ meeting on May 10, 2006 , as part of the spin-off of S.D.A.SDA. These adjustments have been made on May 22, 2006 with effect as of May 24, 2006. |
| (b) | Exercise price in euro. To take into account the spin-off of SDA into account,S.D.A., the exercise prices of Elf Aquitaine share subscription sharesoptions were adjustedmultiplied by aan adjustment factor which equalsequal to 0.99927690.992769 with effect on May 24, 2006. |
Thus, as of December 31, 2006,2008, at most 1,158,900610,086 shares of the Group were likely to be created within the frameworkas part of the application of this exchange guarantee. D. GRANT OF TOTAL RESTRICTED SHARESrestricted share grants | | | | | | | | | | 2005 Plan(a)(b) | | | 2006 Plan(c) | | Date of Board of Directors meeting | | 07/19/2005 | | | 07/18/2006 | | Number of restricted shares | | | | | | | Outstanding as of January 1, 2005 | | — | | | — | | Notified | | 2,280,520 | | | — | | Cancelled | | (5,992 | ) | | — | | Finally granted | | — | | | — | | Outstanding as of January 1, 2006 | | 2,274,528 | | | — | | Notified | | — | | | 2,275,364 | | Cancelled | | (7,432 | ) | | (3,068 | ) | Finally granted | | — | | | — | | Outstanding as of December 31, 2006 | | 2,267,096 | | | 2,272,296 | |
| | | | | | | | | | | | | | | | | | | 2005 Plan(a)(b) | | | 2006 Plan(c) | | | 2007 Plan(d) | | | 2008 Plan(e) | | | Total | | Date of grant(f) | | 07/19/2005 | | | 07/18/2006 | | | 07/17/2007 | | | 10/9/2008 | | | | | Number of restricted shares | | | | | | | | | | | | | | | | Outstanding as of January 1, 2006 | | 2,274,528 | | | | | | | | | | | | 2,274,528 | | Notified | | — | | | 2,275,364 | | | | | | | | | 2,275,364 | | Cancelled | | (7,432 | ) | | (3,068 | ) | | | | | | | | (10,500 | ) | Finally granted | | — | | | — | | | | | | | | | — | | Outstanding as of January 1, 2007 | | 2,267,096 | | | 2,272,296 | | | | | | | | | 4,539,392 | | Notified | | — | | | — | | | 2,366,365 | | | | | | 2,366,365 | | Cancelled | | (38,088 | ) | | (6,212 | ) | | (2,020 | ) | | | | | (46,320 | ) | Finally granted(g) | | (2,229,008 | ) | | (2,128 | ) | | (1,288 | ) | | | | | (2,232,424 | ) | Outstanding as of January 1, 2008 | | — | | | 2,263,956 | | | 2,363,057 | | | | | | 4,627,013 | | Notified | | — | | | — | | | — | | | 2,791,968 | | | 2,791,968 | | Cancelled(h) | | 2,840 | | | (43,822 | ) | | (29,504 | ) | | (19,220 | ) | | (89,706 | ) | Finally granted(g)(h) | | (2,840 | ) | | (2,220,134 | ) | | (336 | ) | | — | | | (2,223,310 | ) | Outstanding as of December 31, 2008 | | — | | | — | | | 2,333,217 | | | 2,772,748 | | | 5,105,965 | |
| (a) | Grants decidedapproved by the Board of Directors on July 19, 2005 pursuant to the authorization given by the shareholders’ meeting held on May 17, 2005. The grant of these shares, which have been bought back in 2005 by the Company on the market, became final after a two-year vesting period (acquisition of the right to restricted shares) on July 20, 2007, and after fulfilling the performance condition (see below). The Board of Directors on May 3, 2007 noticed that the acquisition rate, linked to the performance condition amounted to 100%. Moreover, the transfer of the restricted shares, that were definitely granted, will not be permitted between the date of final grant and the end of a two-year mandatory holding period, i.e. from July 20, 2009. |
| (b) | The number of restricted shares was multiplied by four to take into account the four-for-one stock split approved by the shareholders’ meeting on May 12, 2006. |
| (c) | Grants approved by the Board of Directors on July 18, 2006 pursuant to the authorization given by the shareholders’ meeting held on May 17, 2005. The grant of these shares, which were bought back in 2006 by the Company on the market, became final after a two-year vesting period (acquisition of the right to restricted shares) on July 19, 2008, subject to a performance condition (see below). The Board of Directors on May 6, 2008 noticed that the acquisition rate, linked to the performance condition amounted to 100%. Moreover, the transfer of the restricted shares, that were finally granted, will not be permitted between the date of final grant and the end of a two-year mandatory holding period, i.e. from July 19, 2010. |
| (d) | Grants approved by the Board of Directors on July 17, 2007 pursuant to the authorization given by the shareholders’ meeting held on May 17, 2005. The grant of these shares, which were bought back in 2007 by the Company on the market, will become final after a two-year vesting period (acquisition of the right to restricted shares) on July 20, 2007,18, 2009, subject to a performance condition. This condition states that(see below). Moreover, the numbertransfer of the restricted shares, that might hence be finally granted, will not be basedpermitted between the date of final grant and the end of a two-year mandatory holding period, i.e. from July 18, 2011. |
| (e) | Grants on October 9, 2008, approved by the Board of Directors on September, 9 2008 pursuant to the authorization given by the shareholders’ meeting held on May 16, 2008. The grant of these shares, which have been bought back in 2008 by the Company on the Return On Equity (ROE)market, will become final after a two-year vesting period (acquisition of the Group. The ROE will be calculatedright to restricted shares) on the consolidated accounts published by TOTAL and relatedOctober 10, 2010, subject to the fiscal year preceding the year of the final grant, in the present case fiscal 2006.a performance condition (see below). Moreover, the transfer of the restricted shares, that might hence be finally granted, will not be permitted between the date of final grant and the end of a two-year mandatory holding period on July 20, 2009.October 10, 2012. |
(b)(f) | The numbergrant date corresponds to the date of the Board of Directors that approved the grant of restricted shares, was multiplied by four to reflectexcept for the four-for-one stock split. |
(c) | Grants decidedgrant of restricted shares approved by the Board of Directors on July 18, 2006 pursuant toSeptember, 9 2008 that decided the authorization given by the shareholders’ meeting held on May 17, 2005. The grant of theserestricted shares which have been bought back inon October 9, 2008. |
| (g) | Restricted shares finally granted following the death of their beneficiaries (2005, 2006 byand 2007 Plans for fiscal year 2007, and Plan 2007 for fiscal year 2008). |
| (h) | For the Company on the market, will become final after a two-year vesting period (acquisition of the right to restricted shares) on July 19, 2008, subject to a performance condition. This condition states that the number of2005 Plan: restricted shares finally granted, will be based onfor which the Return On Equity (ROE) of the Group. The ROE will be calculated on the consolidated accounts published by TOTAL and related to the fiscal year preceding the year of the final grant, in the present case fiscal 2007. Moreover, the transfer of the restricted shares, that might hence be finally granted, will not be permitted between the date of final grant and the end of a two-year mandatory holding period, on July 19, 2010.entitlement right had been cancelled erroneously. |
For the 2006, 2007 and 2008 Plans, the restricted share grants are subject to a performance condition, which states that the number of restricted shares finally granted is based on the Return On Equity (ROE) of the Group. The ROE is calculated on the consolidated accounts published by TOTAL and related to the fiscal year preceding the final grant. This acquisition rate: is equal to zero if the ROE is less than or equal to 10%; varies on a straight-line basis between 0% and 80% if the ROE is more than 10% and less than 18%; varies on a straight-line basis between 80% and 100% if the ROE is more than or equal to 18% and less than 30%; and is equal to 100% if the ROE is more than or equal to 30%. The 2005 Plan was subject to a performance condition that stated that the acquisition rate of the restricted shares granted was equal to zero if the ROE for 2006 was less than 10%, equal to 100% if the ROE was more than 20%, and varied on a straight-line basis between 0% and 100% when the ROE was between 10% and 20%. E. SHARE-BASED PAYMENT EXPENSESEXPENSE Share-based payment expensesexpense before tax for the year 2008 amounted to 154 M€ and can be broken down as follows: 61 M€ for TOTAL share subscription plans; 105 M€ for TOTAL restricted shares plans; (12) M€ for the adjustment to the expense booked in 2007 related to TOTAL capital increase reserved for employees (see Note 17 to the Consolidated Financial Statements). Share-based payment expense before tax for the year 2007 amounted to 196 M€ and can be broken down as follows: 65 M€ for TOTAL share subscription plans; 109 M€ for TOTAL restricted shares plans; 22 M€ for TOTAL capital increase reserved for employees (see Note 17 to the Consolidated Financial Statements). Share-based payment expense before tax for the year 2006 amountsamounted to 157 M€ and can be broken down as follow:follows: 74 M€ for TOTAL share subscription and share purchase plans; 83 M€ for TOTAL restricted shares plan. Share-based payment expenses for the year 2005 amounts to 131 M€ and can be broken down as follow:
86 M€ for TOTAL share subscription purchase plans;
25 M€ for TOTAL restricted shares plan;
20 M€ for TOTAL for capital increase reserved for employees (Note 17 to the Consolidated Financial Statements).
Share-based payment expenses for the year 2004 amounts to 138 M€ and can be broken down as follow:
118 M€ for TOTAL share subscription and share purchase plans;
20 M€ for TOTAL for capital increase reserved for employees.plans.
The fair value of the options granted in 2006, 20052008, 2007 and 20042006 has been valuedmeasured according to the Black-Scholes method and based on the following hypothesis:assumptions: | | | | | | | | For the year ended December 31, | | 2006 | | 2005 | | 2004 | Risk free interest rate (%) | | 4.1 | | 2.9 | | 3.8 | Expected dividends (%) | | 4.2 | | 3.7 | | 3.0 | Expected volatility (%)(a) | | 29.3 | | 23.2 | | 22.0 | Vesting period (years) | | 2.0 | | 2.0 | | 2.0 | Exercise period (years) | | 8.0 | | 8.0 | | 8.0 | | Weighted-average fair value of the granted options (€ per option)(b) | | 11.3 | | 10.0 | | 7.8 |
| | | | | | | | For the year ended December 31, | | 2008 | | 2007 | | 2006 | Risk free interest rate (%)(a) | | 4.3 | | 4.9 | | 4.1 | Expected dividends (%)(b) | | 8.4 | | 3.9 | | 4.2 | Expected volatility (%)(c) | | 32.7 | | 25.3 | | 29.3 | Vesting period (years) | | 2 | | 2 | | 2 | Exercise period (years) | | 8 | | 8 | | 8 | Fair value of the granted options
(€ per option) | | 5.0 | | 13.9 | | 11.3 |
| (a) | 6-year zero coupon Euro swap rate. |
| (b) | The expected dividends are based on the price of TOTAL share derivatives traded on the markets. |
| (c) | The expected volatility is based on the implied volatility of TOTAL sharesshare options and of share indices options traded on the markets. |
The cost of capital increases reserved for employees is reduced to take into account the nontransferability of the shares that could be subscribed by the employees over a period of five years. The valuation method of nontransferability of the shares is based on a strategy cost in two steps consisting, first, in a five years forward sale of the nontransferable shares, and second, in purchasing the same number of shares in cash with a loan financing reimbursablein fine. During the year 2007, the main assumptions used for the valuation of the cost of capital increase reserved for employees are the following: | | | | For the year ended December 31, | | 2007 | Date of the Board of Directors meeting that decided the issue | | November 6, 2007 | Subscription price (€) | | 44.4 | Share price at the date of the Board meeting (€) | | 54.6 | Number of shares (in millions)(a) | | 10.6 | Risk free interest rate (%)(b) | | 4.1 | Employees loan financing rate (%)(c) | | 7.5 | Non transferability cost (% of the share price at the date of the Board meeting) | | 14.9 | Expense amount (€ per share) | | 2.1 |
| (a) | The estimated expense as of December 31, 2007 was based on a subscription of the capital increase reserved for employees for 10.6 million shares. The subscription was opened from March 10 to 28, 2008 included, leading to the creation of 4,870,386 TOTAL shares in 2008 (see Note 17 to the Consolidated Financial Statements). |
| (b) | The 2004 and 2005 figures have been restated to reflectrisk-free interest rate is based on the four-for-one stock split on May 18, 2006.French Treasury bonds rate for the appropriate maturity. |
| (c) | The employees loan financing rate is based on a 5 year consumer’s credit rate. |
25.26) PAYROLL AND STAFF
| | | | | | | For the year ended
December 31, (M€) | | 2006 | | 2005 | | 2004 | PERSONNEL EXPENSES(a) | | | | | | | Wages and salaries
(including social charges) | | 5,828 | | 5,610 | | 5,057 | GROUP EMPLOYEES(a) | | | | | | | France | | | | | | | • Management | | 10,313 | | 9,958 | | 9,620 | • Other | | 27,518 | | 27,817 | | 28,149 | International | | | | | | | • Management | | 13,263 | | 13,455 | | 12,754 | • Other | | 43,976 | | 43,824 | | 42,494 | Total | | 95,070 | | 95,054 | | 93,017 |
| | | | | | | For the year ended
December 31,(M€) | | 2008 | | 2007 | | 2006 | Personnel expenses(a) | | | | | | | Wages and salaries (including social charges) | | 6,014 | | 6,058 | | 5,828 | Group employees(a) | | | | | | | France | | | | | | | • Management | | 10,688 | | 10,517 | | 10,313 | • Other | | 26,413 | | 26,779 | | 27,518 | International | | | | | | | • Management | | 14,709 | | 14,225 | | 13,263 | • Other | | 45,149 | | 44,921 | | 43,976 | Total | | 96,959 | | 96,442 | | 95,070 |
| (a) | Number of employees and personnel expenses of fully-consolidated subsidiaries (excluding Arkema).fully consolidated subsidiaries. |
26.27) STATEMENT OF CASH FLOWSFLOW
A. Non-current financial debtA) Cash flow from operating activities
The following table gives additional information on cash paid or received in the cash flow from operating activities: | | | | | | | | | | For the year ended
December 31,(M€) | | 2008 | | | 2007 | | | 2006 | | Interests paid | | (958 | ) | | (1,680 | ) | | (1,648 | ) | Interests received | | 505 | | | 1,277 | | | 1,261 | | Income tax paid | | (10,631 | ) | | (9,687 | ) | | (10,439 | ) | Dividends received | | 1,590 | | | 1,109 | | | 899 | |
Changes in working capital are detailed as follows: | | | | | | | | | | For the year ended
December 31,(M€) | | 2008 | | | 2007 | | | 2006 | | Inventories | | 4,020 | | | (2,706 | ) | | (500 | ) | Accounts receivable | | 3,222 | | | (2,963 | ) | | 494 | | Other current assets | | (982 | ) | | (1,341 | ) | | (1,425 | ) | Accounts payable | | (3,056 | ) | | 4,508 | | | 141 | | Other creditors and accrued liabilities | | (633 | ) | | 1,026 | | | 849 | | Net amount | | 2,571 | | | (1,476 | ) | | (441 | ) |
B) Cash flow used in financing activities Changes in non-current financial debt have been presented asare detailed in the following table under a net variationvalue due to reflect significant changes mainly related to revolving credit agreements. Thethe high number of multiple drawings: | | | | | | | | | | For the year ended December 31,
(M€) | | 2008 | | | 2007 | | | 2006 | | Issuance of non-current debt | | 5,513 | | | 3,313 | | | 3,857 | | Repayment of non-current debt | | (2,504 | ) | | (93 | ) | | (135 | ) | Net amount | | 3,009 | | | 3,220 | | | 3,722 | |
C) Cash and cash equivalents Cash and cash equivalents are detailed analysis is as follows: | | | | | | | For the year ended December 31, (M€) | | 2006 | | | 2005 | | Insuance of non-current debt | | 3,857 | | | 2,910 | | Repayment of non-current debt | | (135 | ) | | (32 | ) | Net amount | | 3,722 | | | 2,878 | |
| | | | | | | For the year ended December 31,
(M€) | | 2008 | | 2007 | | 2006 | Cash | | 1,836 | | 1,930 | | 1,823 | Cash equivalents | | 10,485 | | 4,058 | | 670 | Total | | 12,321 | | 5,988 | | 2,493 |
B. ChangesCash equivalents are mainly composed of deposits less than three months deposited in working capitalgovernment institutions or deposit banks selected in accordance with strict criteria.
| | | | | | | For the year ended December 31,
(M€) | | 2006 | | | 2005 | | Inventories | | (500 | ) | | (2,971 | ) | Accounts receivable | | 494 | | | (4,712 | ) | | Prepaid expenses and other current assets | | (1,425 | ) | | (991 | ) | Accounts payable | | 141 | | | 3,575 | | Other creditors and accrued liabilities | | 849 | | | 1,097 | | Net amount | | (441 | ) | | (4,002 | ) |
C. Additional information on cash flow
| | | | | | | For the year ended December 31,
(M€) | | 2006 | | | 2005 | | Interests paid | | (1,648 | ) | | (985 | ) | Interests received | | 1,261 | | | 826 | | Income tax on cashed out profits | | (10,439 | ) | | (8,159 | ) | Dividends received | | 899 | | | 758 | |
27. FAIR VALUE OF28) FINANCIAL INSTRUMENTS
A. FINANCIALASSETS AND LIABILITIES ANALYSIS PER INSTRUMENTS NOT RELATED TO COMMODITY CONTRACTSCLASS AND STRATEGY
The difference betweenfinancial assets and liabilities disclosed on the carrying amount inface of the balance sheet and the fair value of financial instruments isare detailed as follows: | | | | | | | | | | | | | | | | 2006 | | | 2005 | | ASSETS/(LIABILITIES) As of December 31,(M€) | | Carrying
amount | | | Fair
Value | | | Carrying
amount | | | Fair
Value | | Publicly traded equity securities | | 304 | | | 304 | | | 469 | | | 469 | | Other equity securities | | 946 | | | 946 | | | 1,047 | | | 1,047 | | Other investments (Note 13) | | 1,250 | | | 1,250 | | | 1,516 | | | 1,516 | | Loans and advances (Note 14) | | 1,025 | | | 1,025 | | | 1,202 | | | 1,202 | | Debenture loans (non-current portion, before swaps)(a) | | (11,413 | ) | | (11,413 | ) | | (11,025 | ) | | (11,025 | ) | Issue swaps and swap hedging debenture loans (liabilities)(a) | | (193 | ) | | (193 | ) | | (128 | ) | | (128 | ) | Issue swaps and swap hedging debenture loans (assets)(b) | | 486 | | | 486 | | | 450 | | | 450 | | Debenture loans after swaps (non-current portion) (Note 20A) | | (11,120 | ) | | (11,120 | ) | | (10,703 | ) | | (10,703 | ) | Bank and other loans, before swaps (non-current portion) - floating rate(a) | | (1,987 | ) | | (1,987 | ) | | (1,847 | ) | | (1,847 | ) | Non-current currency and interest rate swaps hedging bank loans(b) | | — | | | — | | | 27 | | | 27 | | Bank and other loans, after swaps - floating rate (non-current portion) (Note 20A) | | (1,987 | ) | | (1,987 | ) | | (1,820 | ) | | (1,820 | ) | Bank and other loans (non-current portion) - fixed rate(a) (Note 20A) | | (210 | ) | | (207 | ) | | (411 | ) | | (406 | ) | Finance lease obligations (non-current portion)(a) (Notes 20A and 22) | | (371 | ) | | (371 | ) | | (382 | ) | | (382 | ) | Debenture loans (current portion, before swaps) | | (2,320 | ) | | (2,320 | ) | | (624 | ) | | (624 | ) | Bank and other loans (except finance lease obligations) (current portion) | | (161 | ) | | (161 | ) | | (334 | ) | | (333 | ) | Finance lease obligations (current portion) (Note 22) | | (29 | ) | | (29 | ) | | (34 | ) | | (34 | ) | Issue swaps and swaps hedging debenture loans (fixed rate) (current portion) (assets) | | 341 | | | 341 | | | 44 | | | 44 | | Issue swaps and swaps hedging debenture loans (fixed rate) (current portion) (liabilities) | | — | | | — | | | (6 | ) | | (6 | ) | Current portion of non-current financial debt (Note 20B) after swaps | | (2,169 | ) | | (2,169 | ) | | (954 | ) | | (953 | ) | Current deposit beyond three months | | 3,496 | | | 3,496 | | | — | | | — | | Other interest rates swaps - assets | | 12 | | | 12 | | | 7 | | | 7 | | Currency swaps and forward exchange contracts - assets(c) | | 59 | | | 59 | | | 283 | | | 283 | | Current financial assets held for trading (Note 20B) | | 3,567 | | | 3,567 | | | 290 | | | 290 | | Other interest rates swaps - liabilities | | (8 | ) | | (8 | ) | | (4 | ) | | (4 | ) | Currency swaps and forward exchange contracts - liabilities(c) | | (67 | ) | | (67 | ) | | (23 | ) | | (23 | ) | Current financial liabilities held for trading (Note 20B) | | (75 | ) | | (75 | ) | | (27 | ) | | (27 | ) | Total | | (10,090 | ) | | (10,087 | ) | | (11,289 | ) | | (11,283 | ) | Total of fair value not recognized in the balance sheet | | | | | 3 | | | | | | 6 | |
| | | | | | | | | | | | | | | | | | | | | | | | | | As of December 31, 2008 (M€) Assets/(Liabilities) | | Financial instruments related to financing and trading activities | | Other financial
instruments | | | Total | | | Fair value | | | | | Amortized
cost | | | Fair value | | | | | | | | | | | | | | | | Available
for sale | | Held for
trading | | | Financial
debt(a) | | | Hedging of
financial debt | | | Net investment
hedge and other | | | | | | | | | | Equity affiliates: loans | | 2,005 | | | | | | | | | | | | | | | | | | | 2,005 | | | 2,005 | | Other investments | | | | | 1,165 | | | | | | | | | | | | | | | | 1,165 | | | 1,165 | | Hedging instruments of non-current financial debt | | | | | | | | | | | | | 892 | | | | | | | | 892 | | | 892 | | Other non-current assets | | 1,403 | | | | | | | | | | | | | | | | | | | 1,403 | | | 1,403 | | Accounts receivable, net | | | | | | | — | | | | | | | | | | | 15,287 | | | 15,287 | | | 15,287 | | Other operating receivables | | | | | | | 1,664 | | | | | | | | | | | 4,544 | | | 6,208 | | | 6,208 | | Current financial assets | | 1 | | | | | 86 | | | | | | 100 | | | — | | | | | 187 | | | 187 | | Cash and cash equivalents | | | | | | | | | | | | | | | | | | 12,321 | | | 12,321 | | | 12,321 | | Total financial assets | | 3,409 | | | 1,165 | | 1,750 | | | | | | 992 | | | — | | 32,152 | | | 39,468 | | | 39,468 | | Total non-financial assets | | | | | | | | | | | | | | | | | | | | | 78,842 | | | | | Total assets | | | | | | | | | | | | | | | | | | | | | 118,310 | | | | | | | | | | | | | | | Non-current financial debt | | (414 | ) | | | | | | | (15,337 | ) | | (440 | ) | | | | | | | (16,191 | ) | | (16,191 | ) | Accounts payable | | | | | | | — | | | | | | | | | | | (14,815 | ) | | (14,815 | ) | | (14,815 | ) | Other operating liabilities | | | | | | | (1,033 | ) | | | | | | | | | | (3,264 | ) | | (4,297 | ) | | (4,297 | ) | Current borrowings | | (5,721 | ) | | | | | | | (2,001 | ) | | | | | | | | | | (7,722 | ) | | (7,722 | ) | Other current financial liabilities | | | | | | | (146 | ) | | | | | (12 | ) | | | | | | | (158 | ) | | (158 | ) | Total financial liabilities | | (6,135 | ) | | | | (1,179 | ) | | (17,338 | ) | | (452 | ) | | | | (18,079 | ) | | (43,183 | ) | | (43,183 | ) | Total non-financial liabilities | | | | | | | | | | | | | | | | | | | | | (75,127 | ) | | | | Total liabilities | | | | | | | | | | | | | | | | | | | | | (118,310 | ) | | | |
| (a) | Included in “Non-currentThe financial debt” indebt is adjusted to the hedged risks value (currency and interest rate) as part of hedge accounting (see Note 20A1 paragraph Miii to the Consolidated Financial Statements.Statements). |
| | | | | | | | | | | | | | | | | | | | | | | | | | As of December 31, 2007 (M€) Assets/(Liabilities) | | Financial instruments related to financing and trading activities | | Other financial
instruments | | | Total | | | Fair value | | | | | Amortized
cost | | | Fair value | | | | | | | | | | | | | | | | Available
for sale | | Held for
trading | | | Financial
debt(a) | | | Hedging of
financial debt | | | Net investment
hedge and other | | | | | | | | | | Equity affiliates: loans | | 2,575 | | | | | | | | | | | | | | | | | | | 2,575 | | | 2,575 | | Other investments | | | | | 1,291 | | | | | | | | | | | | | | | | 1,291 | | | 1,291 | | Hedging instruments of non-current financial debt | | | | | | | | | | | | | 460 | | | | | | | | 460 | | | 460 | | Other non-current assets | | 851 | | | | | | | | | | | | | | | | | | | 851 | | | 851 | | Accounts receivable, net | | | | | | | 464 | | | | | | | | | | | 18,665 | | | 19,129 | | | 19,129 | | Other operating receivables | | | | | | | 519 | | | | | | | | | | | 3,911 | | | 4,430 | | | 4,430 | | Current financial assets | | 850 | | | | | 12 | | | | | | 388 | | | 14 | | | | | 1,264 | | | 1,264 | | Cash and cash equivalents | | | | | | | | | | | | | | | | | | 5,988 | | | 5,988 | | | 5,988 | | Total financial assets | | 4,276 | | | 1,291 | | 995 | | | | | | 848 | | | 14 | | 28,564 | | | 35,988 | | | 35,988 | | Total non-financial assets | | | | | | | | | | | | | | | | | | | | | 77,553 | | | | | Total assets | | | | | | | | | | | | | | | | | | | | | 113,541 | | | | | | | | | | | | | | | Non-current financial debt | | (532 | ) | | | | | | | (13,975 | ) | | (369 | ) | | | | | | | (14,876 | ) | | (14,876 | ) | Accounts payable | | | | | | | (243 | ) | | | | | | | | | | (17,940 | ) | | (18,183 | ) | | (18,183 | ) | Other operating liabilities | | | | | | | (490 | ) | | | | | | | | | | (3,410 | ) | | (3,900 | ) | | (3,900 | ) | Current borrowings | | (2,655 | ) | | | | | | | (1,958 | ) | | | | | | | | | | (4,613 | ) | | (4,613 | ) | Other current financial liabilities | | | | | | | (59 | ) | | | | | (1 | ) | | | | | | | (60 | ) | | (60 | ) | Total financial liabilities | | (3,187 | ) | | | | (792 | ) | | (15,933 | ) | | (370 | ) | | | | (21,350 | ) | | (41,632 | ) | | (41,632 | ) | Total non-financial liabilities | | | | | | | | | | | | | | | | | | | | | (71,909 | ) | | | | Total liabilities | | | | | | | | | | | | | | | | | | | | | (113,541 | ) | | | |
(b)(a) | Included in “Hedging instrumentsThe financial debt is adjusted to the hedged risks value (currency and interest rate) as part of non-current financial debt” inhedge accounting (see Note 20A1 paragraph Miii to the Consolidated Financial Statements. |
(c) | Currency swaps are used to manage TOTAL’s current position to be able to borrow or to invest on markets other than the euro market. Therefore their market values, when significant, are compensated by the value of the current financial loans and debts to which they relate.Statements). |
| | | | | | | | | | | | | | | | | | | | | | | | | | As of December 31, 2006 (M€) Assets/(Liabilities) | | Financial instruments related to financing and trading activities | | Other financial
instruments | | | Total | | | Fair value | | | | | Amortized
cost | | | Fair value | | | | | | | | | | | | | | | | Available
for sale | | Held for
trading | | | Financial
debt(a) | | | Hedging of
financial debt | | | Net investment
hedge and other | | | | | | | | | | Equity affiliates: loans | | 1,533 | | | | | | | | | | | | | | | | | | | 1,533 | | | 1,533 | | Other investments | | | | | 1,250 | | | | | | | | | | | | | | | | 1,250 | | | 1,250 | | Hedging instruments of non-current financial debt | | | | | | | | | | | | | 486 | | | | | | | | 486 | | | 486 | | Other non-current assets | | 1,025 | | | | | | | | | | | | | | | | | | | 1,025 | | | 1,025 | | Accounts receivable, net | | | | | | | 341 | | | | | | | | | | | 17,052 | | | 17,393 | | | 17,393 | | Other operating receivables | | | | | | | 311 | | | | | | | | | | | 3,956 | | | 4,267 | | | 4,267 | | Current financial assets | | 3,496 | | | | | 71 | | | | | | 341 | | | | | | | | 3,908 | | | 3,908 | | Cash and cash equivalents | | | | | | | | | | | | | | | | | | 2,493 | | | 2,493 | | | 2,493 | | Total financial assets | | 6,054 | | | 1,250 | | 723 | | | | | | 827 | | | | | 23,501 | | | 32,355 | | | 32,355 | | Total non-financial assets | | | | | | | | | | | | | | | | | | | | | 72,868 | | | | | Total assets | | | | | | | | | | | | | | | | | | | | | 105,223 | | | | | | | | | | | | | | | Non-current financial debt | | (581 | ) | | | | | | | (13,400 | ) | | (193 | ) | | | | | | | (14,174 | ) | | (14,171 | ) | Accounts payable | | | | | | | (426 | ) | | | | | | | | | | (14,654 | ) | | (15,080 | ) | | (15,080 | ) | Other operating liabilities | | | | | | | (203 | ) | | | | | | | | | | (4,060 | ) | | (4,263 | ) | | (4,263 | ) | Current borrowings | | (3,538 | ) | | | | | | | (2,320 | ) | | | | | | | | | | (5,858 | ) | | (5,858 | ) | Other current financial liabilities | | | | | | | (75 | ) | | | | | | | | | | | | | (75 | ) | | (75 | ) | Total financial liabilities | | (4,119 | ) | | | | (704 | ) | | (15,720 | ) | | (193 | ) | | | | (18,714 | ) | | (39,450 | ) | | (39,447 | ) | Total non-financial liabilities | | | | | | | | | | | | | | | | | | | | | (65,773 | ) | | | | Total liabilities | | | | | | | | | | | | | | | | | | | | | (105,223 | ) | | | |
| (a) | The financial debt is adjusted to the hedged risks value (currency and interest rate) as part of hedge accounting (see Note 1 paragraph Miii to the Consolidated Financial Statements). |
29) FAIR VALUE OF FINANCIAL INSTRUMENTS (EXCLUDING COMMODITY CONTRACTS) A) IMPACT ON THE STATEMENT OF INCOME PER NATURE OF FINANCIAL INSTRUMENTS Operating assets and liabilities The classification by strategyimpact on the statement of income is detailed as follows: | | | | | | | | | | For the year ended December 31, (M€) | | 2008 | | | 2007 | | | 2006 | | Assets available for sale (investments): | | | | | | | | | | — dividend income on non-consolidated companies | | 238 | | | 218 | | | 237 | | — gains (losses) on disposal of assets | | 15 | | | 170 | | | 428 | | — others | | (15 | ) | | (63 | ) | | (46 | ) | Loans and receivables | | 100 | | | (2 | ) | | 88 | | Impact on net operating income | | 338 | | | 323 | | | 707 | |
The impact in the statement of income mainly includes: Dividends and gains or losses on disposal of other investments classified as “Assets available for sale”; Financial gains and depreciation on loans related to equity affiliates, non-consolidated companies and on receivables reported in “Loans and receivables”. Assets and liabilities from financing activities The impact on the notional amountstatement of income of financing assets and liabilities is detailed as follows: | | | | | | | | | | For the year ended December 31, (M€) | | 2008 | | | 2007 | | | 2006 | | Loans and receivables | | 547 | | | 1,135 | | | 976 | | Financing liabilities and associated hedging instruments | | (996 | ) | | (1,721 | ) | | (1,597 | ) | Fair value hedge (ineffective portion) | | (4 | ) | | (26 | ) | | 25 | | Assets and liabilities held for trading | | (74 | ) | | 73 | | | 232 | | Impact on the cost of net debt | | (527 | ) | | (539 | ) | | (364 | ) |
The impact on the statement of income mainly includes: Financial income on cash, cash equivalents, and current financial assets (notably current deposits beyond three months) classified as “Loans and receivables”; Financial expense of long term subsidiaries financing, associated hedging instruments (excluding ineffective portion of the hedge detailed below) and financial expense of short term financing classified as “Financing liabilities and associated hedging instruments”; Ineffective portion of bond hedging; Financial income, financial expense and fair value of derivative instruments includedused for cash management purposes classified as “Assets and liabilities held for trading”. Financial derivative instruments used for cash management purposes (interest rate and foreign exchange) are considered to be held for trading. Based on practical documentation issues, the Group did not elect to set up hedge accounting for such instruments. The impact on income of the derivatives is offset by the impact of loans and current liabilities they are related to. Therefore these transactions taken as a whole do not have a significant impact on the Consolidated Financial Statements. B) IMPACT OF THE HEDGING STRATEGIES Fair value hedge The impact on the statement of income of the bond hedging instruments which is recorded in the item “Financial interest on debt” in the Consolidated Statement of Income is detailed as follows: | | | | | | | | | | For the year ended December 31, (M€) | | 2008 | | | 2007 | | | 2006 | | Revaluation at market value of bonds | | (66 | ) | | 137 | | | (221 | ) | Swap hedging of bonds | | 62 | | | (163 | ) | | 246 | | Ineffective portion of the fair value hedge | | (4 | ) | | (26 | ) | | 25 | |
The ineffective portion is not representative of the Group’s performance considering the Group’s objective to hold swaps to maturity. The current portion of the swaps valuation is not subject to active management. Net investment hedge These instruments are recorded directly in shareholders’ equity under “Currency translation adjustments”. The variations of the period are detailed in the table above is as follows:below: | | | | | | | | | | | | | | | | | | | As of December 31, 2006(M€) | | Notional amount(a) | | ASSETS/(LIABILITIES) | | Fair
Value | | | Total | | 2007 | | 2008 | | 2009 | | 2010 | | 2011 | | 2012 and
after | | Financial instruments hedging non-current financial debt | | | | | | | | | | | | | | | | | | Issue swaps and swap hedging debenture
issues - non-current (liabilities) | | (193 | ) | | 5,691 | | | | | | | | | | | | | Issue swaps and swap hedging debenture
issues - non-current (assets) | | 486 | | | 5,317 | | | | | | | | | | | | | Issue swaps and swap hedging debenture
issues - non-current | | 293 | | | 11,008 | | | | 1,756 | | 2,018 | | 1,870 | | 2,740 | | 2,624 | Non-current currency and interest rate swaps
hedging bank loans | | | | | | | | | | | | | | | | | | Issue swaps and swap hedging debenture
issues - less than one year (liabilities) | | | | | 475 | | | | | | | | | | | | | Issue swaps and swap hedging debenture
issues - less than one year (assets) | | 341 | | | 1,341 | | | | | | | | | | | | | Issue swaps and swap hedging debenture
issues - less than one year | | 341 | | | 1,816 | | 1,816 | | | | | | | | | | | | | | | | | | | | | Financial instruments hedging net investment | | | | | | | | | | | | | | | | | | N/A | | | | | | | | | | | | | | | | | | | | | | | | | | | | Financial instruments held for trading | | | | | | | | | | | | | | | | | | | | | | | | | | | Current deposits beyond three months | | 3,496 | | | 3,496 | | 3,496 | | | | | | | | | | | | Other interest rate swaps - assets | | 12 | | | 6,488 | | | | | | | | | | | | | Other interest rate swaps - liabilities | | (8 | ) | | 9,580 | | | | | | | | | | | | | Other swaps assets and liabilities | | 4 | | | 16,068 | | 16,062 | | — | | | | 4 | | — | | 2 | | Currency swaps and forward exchange contracts - assets | | 59 | | | 5,003 | | | | | | | | | | | | | Currency swaps and forward exchange contracts - liabilities | | (67 | ) | | 6,065 | | | | | | | | | | | | | | Currency swaps and forward exchange contracts - assets and liabilities | | (8 | ) | | 11,068 | | 10,513 | | 287 | | 201 | | 45 | | 22 | | — | | | As of December 31, 2005(M€) | | Notional amount(a) | | ASSETS/(LIABILITIES) | | Fair
Value | | | Total | | 2006 | | 2007 | | 2008 | | 2009 | | 2010 | | 2011 and
after | | | | | | | | | | Financial instruments hedging non-current financial debt | | | | | | | | | | | | | | | | | | | Issue swaps and swap hedging debenture issues - non-current (liabilities) | | (128 | ) | | 4,387 | | | | | | | | | | | | | | Issue swaps and swap hedging debenture issues - non-current (assets) | | 450 | | | 6,166 | | | | | | | | | | | | | | Issue swaps and swap hedging debenture issues - non-current | | 322 | | | 10,553 | | | | 1,854 | | 1,960 | | 2,137 | | 1,782 | | 2,820 | | Non-current currency and interest rate swaps hedging bank loans | | 27 | | | 76 | | | | 76 | | | | | | | | | | Issue swaps and swap hedging debenture issues - less than one year (liabilities) | | (6 | ) | | 167 | | | | | | | | | | | | | | Issue swaps and swap hedging debenture issues - less than one year (assets) | | 44 | | | 381 | | | | | | | | | | | | | | Issue swaps and swap hedging debenture issues - less than one year | | 38 | | | 548 | | 548 | | | | | | | | | | | | | | | | | | | | Financial instruments hedging net investment | | | | | | | | | | | | | | | | | | N/A | | | | | | | | | | | | | | | | | | | | | | | | | | | Financial instruments held for trading | | | | | | | | | | | | | | | | | | Other interest rate swaps - assets | | 7 | | | 4,960 | | | | | | | | | | | | | Other interest rate swaps - liabilities | | (4 | ) | | 9,022 | | | | | | | | | | | | | Other swaps assets and liabilities | | 3 | | | 13,982 | | 13,976 | | | | | | | | 5 | | 1 | Currency swaps and forward exchange contracts - assets | | 283 | | | 8,579 | | | | | | | | | | | | | Currency swaps and forward exchange contracts - liabilities | | (23 | ) | | 2,372 | | | | | | | | | | | | | | Currency swaps and forward exchange contracts - assets and liabilities | | 260 | | | 10,951 | | 10,542 | | 77 | | 44 | | 86 | | 16 | | 184 |
| | | | | | | | | | | | | For the year ended December 31,(M€) | | As of January 1, | | | Variations | | | Disposals | | As of December 31, | | 2008 | | 29 | | | 95 | | | — | | 124 | | 2007 | | (188 | ) | | 217 | | | — | | 29 | | 2006 | | (183 | ) | | (5 | ) | | — | | (188 | ) |
The fair value of the open instruments is equal to zero as of December 31, 2008 compared to 14 M€ in 2007. There was no open instrument as of December 31, 2006. Cash flow hedge These hedges are not significant considering the Group’s policy not to hedge future cash flows as of December 31, 2008, 2007 and 2006. C) MATURITY OF DERIVATIVE INSTRUMENTS The maturity of the notional amounts of derivatives instruments, excluding the commodity contracts, is detailed in the following table: | | | | | | | | | | | | | | | | | | | As of December 31, 2008 (M€) | | | | | Notional value(a) | | Assets/(Liabilities) | | Fair value | | | Total | | 2009 | | 2010 | | 2011 | | 2012 | | 2013 | | 2014
and
after | Fair value hedge | | | | | | | | | | | | | | | | | | Issue swaps and swaps hedging bonds
(liabilities) | | 440 | | | 9,309 | | | | | | | | | | | | | Issue swaps and swaps hedging bonds
(assets) | | (892 | ) | | 4,195 | | | | | | | | | | | | | Total issue swaps and swaps hedging bonds
(assets and liabilities) | | (452 | ) | | 13,504 | | | | 2,048 | | 3,373 | | 3,233 | | 3,032 | | 1,818 | Currency swaps hedging of bank and other loans | | | | | | | | | | | | | | | | | | Issue swaps and swaps hedging bonds
(current portion) (liabilities) | | 100 | | | 1,871 | | | | | | | | | | | | | Issue swaps and swaps hedging bonds
(current portion) (assets) | | (12 | ) | | 92 | | | | | | | | | | | | | Total issue swaps and swaps hedging bonds
(current portion) (assets and liabilities) | | 88 | | | 1,963 | | 1,963 | | | | | | | | | | | Net investment hedge | | | | | | | | | | | | | | | | | | Currency swaps and forward exchange contracts
(assets) | | — | | | 1,347 | | 1,347 | | | | | | | | | | | Cash flow hedge | | | | | | | | | | | | | | | | | | Other interest rate swaps (assets) | | — | | | 2,853 | | | | | | | | | | | | | Other interest rate swaps (liabilities) | | (4 | ) | | 5,712 | | | | | | | | | | | | | Other interest rate swaps (assets and liabilities) | | (4 | ) | | 8,565 | | 8,559 | | 4 | | | | | | | | 2 | Currency swaps and forward exchange contracts (assets) | | 86 | | | 5,458 | | | | | | | | | | | | | Currency swaps and forward exchange contracts (liabilities) | | (142 | ) | | 2,167 | | | | | | | | | | | | | Currency swaps and forward exchange contracts (assets and liabilities) | | (56 | ) | | 7,625 | | 6,595 | | 483 | | 114 | | 67 | | 76 | | 290 |
| (a) | These amounts set the levels of notional involvementcommitment and are not indicative of a contingent gain or loss. |
| | | | | | | | | | | | | | | | | | | As of December 31, 2007(M€) | | | | | Notional value(a) | | Assets/(Liabilities) | | Fair
value | | | Total | | 2008 | | 2009 | | 2010 | | 2011 | | 2012 | | 2013
and
after | Fair value hedge | | | | | | | | | | | | | | | | | | Issue swaps and swaps hedging bonds (liabilities) | | (369 | ) | | 7,506 | | | | | | | | | | | | | Issue swaps and swaps hedging bonds
(assets) | | 460 | | | 3,982 | | | | | | | | | | | | | Total issue swaps and swaps hedging bonds
(assets and liabilities) | | 91 | | | 11,488 | | | | 1,910 | | 1,836 | | 2,725 | | 2,437 | | 2,580 | Currency swaps hedging of bank and other loans | | | | | | | | | | | | | | | | | | Issue swaps and swaps hedging bonds
(current portion) (liabilities) | | (1 | ) | | 306 | | | | | | | | | | | | | Issue swaps and swaps hedging bonds
(current portion) (assets) | | 388 | | | 1,265 | | | | | | | | | | | | | Total issue swaps and swaps hedging bonds
(current portion) (assets and liabilities) | | 387 | | | 1,571 | | 1,571 | | | | | | | | | | | Net investment hedge | | | | | | | | | | | | | | | | | | Currency swaps and forward exchange contracts (assets) | | 14 | | | 695 | | 695 | | | | | | | | | | | Cash flow hedge | | | | | | | | | | | | | | | | | | Other interest rate swaps (assets) | | 1 | | | 8,249 | | | | | | | | | | | | | Other interest rate swaps (liabilities) | | — | | | 3,815 | | | | | | | | | | | | | Other interest rate swaps (assets and liabilities) | | 1 | | | 12,064 | | 12,058 | | | | 4 | | | | | | 2 | Currency swaps and forward exchange contracts (assets) | | 11 | | | 2,594 | | | | | | | | | | | | | Currency swaps and forward exchange contracts (liabilities) | | (59 | ) | | 3,687 | | | | | | | | | | | | | Currency swaps and forward exchange contracts (assets and liabilities) | | (48 | ) | | 6,281 | | 6,207 | | 42 | | 2 | | 6 | | 8 | | 16 |
| (a) | These amounts set the levels of notional commitment and are not indicative of a contingent gain or loss. |
| | | | | | | | | | | | | | | | | | | As of December 31, 2006 (M€) | | | | | Notional value(a) | | ASSETS/(LIABILITIES) | | Fair
value | | | Total | | 2007 | | 2008 | | 2009 | | 2010 | | 2011 | | 2012 and
after | Fair value hedge | | | | | | | | | | | | | | | | | | Issue swaps and swaps hedging bonds
(liabilities) | | (193 | ) | | 5,691 | | | | | | | | | | | | | Issue swaps and swaps hedging bonds
(assets) | | 486 | | | 5,317 | | | | | | | | | | | | | Total issue swaps and swaps hedging bonds (assets and liabilities) | | 293 | | | 11,008 | | | | 1,756 | | 2,018 | | 1,870 | | 2,740 | | 2,624 | Currency swaps hedging of bank and other loans | | | | | | | | | | | | | | | | | | Issue swaps and swaps hedging bonds
(current portion) (liabilities) | | | | | 475 | | | | | | | | | | | | | Issue swaps and swaps hedging bonds
(current portion) (assets) | | 341 | | | 1,341 | | | | | | | | | | | | | Total issue swaps and swaps hedging bonds (current portion) (assets and liabilities) | | 341 | | | 1,816 | | 1,816 | | | | | | | | | | | Net investment hedge | | | | | | | | | | | | | | | | | | N/A | | | | | | | | | | | | | | | | | | Cash flow hedge | | | | | | | | | | | | | | | | | | Other interest rate swaps (assets) | | 12 | | | 6,488 | | | | | | | | | | | | | Other interest rate swaps (liabilities) | | (8 | ) | | 9,580 | | | | | | | | | | | | | Other interest rate swaps (assets and liabilities) | | 4 | | | 16,068 | | 16,062 | | | | | | 4 | | | | 2 | Currency swaps and forward exchange contracts (assets) | | 59 | | | 5,003 | | | | | | | | | | | | | Currency swaps and forward exchange contracts (liabilities) | | (67 | ) | | 6,065 | | | | | | | | | | | | | Currency swaps and forward exchange contracts (assets and liabilities) | | (8 | ) | | 11,068 | | 10,513 | | 287 | | 201 | | 45 | | 22 | | |
| (a) | These amounts set the levels of notional commitment and are not indicative of a contingent gain or loss. |
B.30) FINANCIAL INSTRUMENTS RELATED TO COMMODITY CONTRACTS
These financialFinancial instruments related to oil, gas and power activities are recognizedrecorded at their fair value and recorded under “Accounts receivable and other“Other current assets” or “Accounts payable“Other creditors and other creditors”accrued liabilities” depending on whether they are assets or liabilities.
| | As of December 31, 2006(M€) | | | | | | | ASSETS / (LIABILITIES) | | Notional
value -
assets(a) | | Notional
value -
liabilities(a) | | Carrying
amount | | Fair
Value | | | Commodities instruments on crude oil, petroleum products and
freight rates | | | | | | | | | | | As of December 31, 2008(M€) | | | | | | | ASSETS/(LIABILITIES) | | | Notional
value -
purchase(a) | | Notional
value -
sale(a) | | Carrying
amount | | Fair
value(e) | | Crude oil, petroleum products and freight rates activities | | | | | | | | | | Petroleum products and crude oil swaps(a) | | 8,258 | | 9,459 | | (43 | ) | | (43 | ) | | 9,977 | | 10,530 | | 141 | | | 141 | | Swap freight agreements | | 56 | | 86 | | 2 | | | 2 | | | Freight rate swaps(a) | | | 5 | | 29 | | 8 | | | 8 | | Forwards(b) | | 5,145 | | 5,830 | | (11 | ) | | (11 | ) | | 4,398 | | 3,429 | | (120 | ) | | (120 | ) | Options(c) | | 6,046 | | 4,835 | | 66 | | | 66 | | | 6,132 | | 6,174 | | — | | | — | | Futures(d) | | 1,274 | | 2,434 | | 79 | | | 79 | | | 1,132 | | 3,053 | | 17 | | | 17 | | Options on futures(c) | | 143 | | 165 | | (4 | ) | | (4 | ) | | 435 | | 422 | | (7 | ) | | (7 | ) | Total - Commodities instruments on crude oil, petroleum products and freight rates | | | | | | 89 | | | 89 | | | | Commodities instruments on gas and power | | | | | | | | | | Total crude oil, petroleum products and freight rates | | | | | | | 39 | | | 39 | | Gas & Power activities | | | | | | | | | | Swaps(a) | | 890 | | 716 | | (25 | ) | | (25 | ) | | 3,180 | | 2,983 | | (48 | ) | | (48 | ) | Forwards | | 9,973 | | 9,441 | | (73 | ) | | (73 | ) | | Forwards(b) | | | 12,541 | | 10,483 | | 659 | | | 659 | | Options(c) | | 18 | | 58 | | 2 | | | 2 | | | 13 | | 9 | | — | | | — | | Futures(d) | | 92 | | 46 | | 31 | | | 31 | | | 632 | | 498 | | (19 | ) | | (19 | ) | Total - Commodities instruments on gas and power | | | | | | (65 | ) | | (65 | ) | | Total Gas & Power | | | | | | | 592 | | | 592 | | Total | | | | | | 24 | | | 24 | | | | | | | 631 | | | 631 | | Total of fair value not recognized in the balance sheet | | | | | | | — | | | Total of fair value non recognized in the balance sheet | | | | | | | | — | |
| | | | | | | | | | | | As of December 31, 2005(M€) | | | | | | | | | | | | ASSETS / (LIABILITIES) | | Notional
value -
assets(a) | | Notional
value -
liabilities(a) | | Carrying
amount | | | Fair
Value | | Commodities instruments on crude oil, petroleum products and
freight rates | | | | | | | | | | | Petroleum products and crude oil swaps(a) | | 5,474 | | 6,356 | | 13 | | | 13 | | Swap freight agreements | | 46 | | 47 | | — | | | — | | Forwards(b) | | 4,839 | | 5,156 | | (14 | ) | | (14 | ) | Options(c) | | 5,426 | | 3,770 | | 79 | | | 79 | | Futures(d) | | 627 | | 2,045 | | (35 | ) | | (35 | ) | Options on futures(c) | | 398 | | 178 | | 13 | | | 13 | | Total - Commodities instruments on crude oil, petroleum products
and freight rates | | | | | | 56 | | | 56 | | | | | | | Commodities instruments on gas and power | | | | | | | | | | | Swaps(a) | | 1,205 | | 1,017 | | 28 | | | 28 | | Forwards(b) | | 8,940 | | 9,133 | | 19 | | | 19 | | Options(c) | | 60 | | 41 | | — | | | — | | Futures(d) | | 177 | | 43 | | 35 | | | 35 | | Total - Commodities instruments on gas and power | | | | | | 82 | | | 82 | | Total | | | | | | 138 | | | 138 | | Total of fair value not recognized in the balance sheet | | | | | | | | | — | |
| | | | | | | | | | | | As of December 31, 2007(M€) | | | | | | | | | | | | ASSETS/(LIABILITIES) | | Notional
value -
purchase(a) | | Notional
value -
sale(a) | | Carrying
amount | | | Fair
value(e) | | Crude oil, petroleum products and freight rates activities | | | | | | | | | | | Petroleum products and crude oil swaps(a) | | 9,048 | | 9,671 | | (149 | ) | | (149 | ) | Freight rate swaps(a) | | 69 | | 93 | | (3 | ) | | (3 | ) | Forwards(b) | | 7,060 | | 7,233 | | (4 | ) | | (4 | ) | Options(c) | | 4,852 | | 4,143 | | 272 | | | 272 | | Futures(d) | | 1,734 | | 3,510 | | (97 | ) | | (97 | ) | Options on futures(c) | | 365 | | 280 | | (1 | ) | | (1 | ) | Total crude oil, petroleum products and freight rates | | | | | | 18 | | | 18 | | Gas & Power activities | | | | | | | | | | | Swaps(a) | | 1,496 | | 1,670 | | 4 | | | 4 | | Forwards(b) | | 9,558 | | 8,306 | | 213 | | | 213 | | Options(c) | | 3 | | 10 | | — | | | — | | Futures(d) | | 115 | | 94 | | 15 | | | 15 | | Total Gas & Power | | | | | | 232 | | | 232 | | Total | | | | | | 250 | | | 250 | | Total of fair value non recognized in the balance sheet | | | | | | | | | — | |
| (a) | Swaps (including “Contracts for differences”): the “Notional value” columns correspond to receive-fixed and pay-fixed swaps. |
| (b) | Forwards: contracts resulting in physical delivery are accounted for as derivative commodity contracts and included in the amounts shown. The 2005 amounts for commodities instruments on gas and power have been reclassified accordingly. |
| (c) | Options: the “Notional value” columns correspond to the nominal value of options (calls or puts) purchased and sold, valued based on the strike price. |
| (d) | Futures: the “Notional value” columns correspond to the net purchasing/selling positions, valued based on the closing ratetransaction historical price on the organized exchange market. |
| (e) | From 2008, when the fair value of derivatives listed on an organized exchange market (futures, options on futures and swaps) is offset with the margin call received or paid on the face of the balance sheet, this fair value is set to zero. |
Contracts | | | | | | | | | | | | As of December 31, 2006(M€) | | | | | | | | | | | | ASSETS/(LIABILITIES) | | Notional
value -
purchase(a) | | Notional
value -
sale(a) | | Carrying
amount | | | Fair
value(e) | | Crude oil, petroleum products and freight rates activities | | | | | | | | | | | Petroleum products and crude oil swaps(a) | | 7,987 | | 9,303 | | (30 | ) | | (30 | ) | Freight rate swaps(a) | | 56 | | 86 | | 2 | | | 2 | | Forwards(b) | | 5,145 | | 5,830 | | (11 | ) | | (11 | ) | Options(c) | | 6,046 | | 4,835 | | 66 | | | 66 | | Futures(d) | | 1,274 | | 2,434 | | 79 | | | 79 | | Options on futures(c) | | 143 | | 165 | | (4 | ) | | (4 | ) | Total crude oil, petroleum products and freight rates | | | | | | 102 | | | 102 | | Gas & Power activities | | | | | | | | | | | Swaps(a) | | 1,161 | | 872 | | (38 | ) | | (38 | ) | Forwards(b) | | 9,973 | | 9,441 | | (73 | ) | | (73 | ) | Options(c) | | 18 | | 58 | | 1 | | | 1 | | Futures(d) | | 92 | | 46 | | 31 | | | 31 | | Total Gas & Power | | | | | | (79 | ) | | (79 | ) | Total | | | | | | 23 | | | 23 | | Total of fair value non recognized in the balance sheet | | | | | | | | | — | |
| (a) | Swaps (including “Contracts for differences”): the “Notional value” columns correspond to receive-fixed and pay-fixed swaps. |
| (b) | Forwards: contracts resulting in physical delivery are accounted for as derivative commodity contracts and included in the amounts shown. |
| (c) | Options: the “Notional value” columns correspond to the nominal value of options (calls or puts) purchased and sold, valued based on the strike price. |
| (d) | Futures: the “Notional value” columns correspond to the net purchasing/selling positions, valued based on the transaction historical price on the organized exchange market. |
| (e) | From 2008, when the fair value of derivatives listed on an organized exchange market (futures, options on futures and swaps) is offset with the margin call received or paid on the face of the balance sheet, this fair value is set to zero. |
Most commitments on crude oil and petroleumrefined products have been primarily entered into on a short-term basisshort term maturity (less than one year). 28. RELATED PARTIES The maturity of most Gas & Power energy derivatives is less than three years forward.
The main transactions and balances withchanges in fair value of financial instruments related parties (principally all the investments carried under the equity method and subsidiaries excluded from consolidation)to commodity contracts are detailed as follows: | | | | | As of December 31,
(M€) | | 2006 | | 2005 | Balance Sheet | | | | | Receivables | | | | | Debtors and other debtors | | 411 | | 353 | Loans (excl. loans to equity companies) | | 457 | | 465 | Payables | | | | | Creditors and other creditors | | 424 | | 406 | Debts | | 25 | | 19 | | | | For the year ended December 31,
(M€) | | 2006 | | 2005 | Income Statement | | | | | Sales | | 1,996 | | 1,593 | Purchases | | 3,123 | | 2,482 | Financial expenses | | — | | — | Financial income | | 60 | | 56 |
DIRECTORS AND EXECUTIVE OFFICERS COMPENSATION | | | | | | | | | | | | | | | For the year ended December 31,(M€) | | Fair value as
of January 1, | | | Impact on
income | | Settled
contracts | | | Other | | | Fair value as of
December 31, | | Crude oil, petroleum products and freight rates activities | | 2008 | | 18 | | | 1,734 | | (1,715 | ) | | 2 | | | 39 | | 2007 | | 102 | | | 1,381 | | (1,460 | ) | | (5 | ) | | 18 | | 2006 | | 28 | | | 1,577 | | (1,496 | ) | | (7 | ) | | 102 | | | | | | | | Gas & Power activities | | | | | | | | | | | | | | | 2008 | | 232 | | | 787 | | (310 | ) | | (117 | ) | | 592 | | 2007 | | (79 | ) | | 489 | | (163 | ) | | (15 | ) | | 232 | | 2006 | | 110 | | | 557 | | (744 | ) | | (2 | ) | | (79 | ) |
The aggregate amount paid directly or indirectly by the French and foreign affiliates of the Company as compensation to the executive officers of TOTAL (the members of the Management Committee and the Treasurer) was 19.7 M€ in 2006 (31 persons) compared with 18.8 M€ in 2005 (30 persons).
The compensation allocated to members of the Board of Directors for directors’ fees totaled 0.82 M€ in 2006, pursuant to the resolution of the shareholders’ meeting of May 17, 2005.
The expense recorded for share-based payments to the executive officers of the Group was 16.6 M€ in 2006 (13 M€ in 2005).
The benefits provided for the executive officers, excluding employee severance packages or retirement plans, are post-retirement plans financed by the Company, which represent 109.7 M€ provisioned as of December 31, 2006 compared with 108.9 M€ as of December 31, 2005. In 2006, the expense recorded amounted to 13.7 M€ (9.2 M€ in 2005).
29.31) MARKET RISKS
A) Oil and gas market related risks
Due to the nature of its business, the Group has a significant involvement in oil and gas trading activities as part of its normalday-to-day operations to attemptin order to optimize revenues from its crude oil and gas production and to obtain favorable pricing for supplies forto supply its refineries. In its international oil trading activities, the Group follows a policy of not selling its future oil and gas production for future delivery. However, in connection with these trading activities, the Group, like most other oil companies, uses energy derivative instruments to adjust its exposure to price fluctuations of crude oil, refined products, natural gas and electricity. Furthermore, theThe Group also uses freight-ratefreight rate derivative contracts in its shipping activities to adjust its exposure to freight-rate fluctuations. To hedge against this risk, the Group uses various instruments such as futures, forwards, swaps and options on organized markets or over-the-counter markets. To measure market risks related The list of the different derivatives held by the Group in these markets is detailed in Note 30 to the prices of oil and gas products, the Group uses a “value at risk” method. Under this method, for the Group’s trading activities ofConsolidated Financial Statements.
The Trading & Shipping division measures its market risk exposure,i.e., potential loss in fair values, on its crude oil, refined products and freight rate derivatives, thererates trading activities using a value-at-risk technique. This technique is based on an historical model and makes an assessment of the market risk arising from possible future changes in market values over a 24-hour period. The calculation of the range of potential changes in fair values takes into account a snapshot of the end-of-day exposures and the set of historical price movements for the last 400 business days for all instruments and maturities in the global trading activities. Options are systematically reevaluated using appropriate models. The potential movement in fair values corresponds to a 97.5% probabilityvalue-at-risk type confidence level. This means that unfavorable daily market variations wouldthe Group’s portfolio result in ais likely to exceed the value-at-risk loss of less than 11.4 M€ per day, defined asmeasure once over 40 business days if the “value at risk”, based on positions as of December 31, 2006. Over the year 2006, the average value at risk was 8.6 M€, the lowest value at risk was 4.3 M€, the highest value at risk was 12.9 M€.portfolio exposures were left unchanged. Trading & Shipping: value-at-risk with a 97.5% probability | | | | | | | | | | As of December 31,(M€) | | High | | Low | | Average | | Year
end | 2008 | | 13.5 | | 2.8 | | 6.9 | | 11.8 | 2007 | | 11.6 | | 3.3 | | 6.7 | | 5.4 | 2006 | | 12.9 | | 4.3 | | 8.6 | | 11.4 |
As part of its gas and electricitypower trading activity, the Group also uses derivative instruments such as futures, forwards, swaps and options in both organized and over-the-counter markets. In general, the transactions are settled at maturity date through physical delivery. There The Gas & Power division measures its market risk exposure,i.e. potential loss in fair values, on its trading activities using a value-at-risk technique. This technique is based on an historical model and makes an assessment of the market risk arising from possible future changes in market values over a one day period. The calculation of the range of potential changes in fair values takes into account a snapshot of the end-of-day exposures and the set of historical price movements for the past two years for all instruments and maturities in the global trading activities. Gas & Power trading: value-at-risk with a 97.5% probability that unfavorable daily market variations would result in a loss of less than 6.0 M€ per day, based on positions as of December 31, 2006. Over the year 2006, the average value at risk was 9.1 M€, the lowest value at risk was 3.5 M€, and the highest value at risk was 21.7 M€. | | | | | | | | | | As of December 31,(M€) | | High | | Low | | Average | | Year
end | 2008 | | 16.3 | | 1.3 | | 5.0 | | 1.4 | 2007(a) | | 18.2 | | 3.2 | | 7.9 | | 4.3 | 2006(a) | | 21.7 | | 3.5 | | 9.1 | | 6.0 |
| (a) | These calculations are based on the set of historical price movements for the past year. |
The Group has implemented strict policies and procedures to manage and monitor these market risks. TradingThese are based on the splitting of supervisory functions from operational functions and financial controls are carried out separately andon an integrated information system that enables real-time monitoring of trading activities. Limits on trading positions are approved by the Group’s Executive Committee and are monitored daily. To increase flexibility and encourage liquidity, hedging operations are performed with numerous independent operators, including other oil companies, major energy producers or consumers and financial institutions. The Group has established counterparty limits for each counterpart, and monitors outstanding amounts forwith each counterpart are monitoredcounterparty on a regularan ongoing basis. B) Financial markets related risks
WithinAs part of its financing and cash management activities, the Group uses derivative instruments in order to manage its exposure to changes in interest rates and foreign exchange rates. This includes mainlyThese instruments are principally interest ratesrate and currency swaps. The Group mightmay also use, on an occasionala less frequent basis, futures, caps, floors and options contracts. The currentThese operations and their accounting treatment are detailed in Notes 1 paragraph M, of Note 120, 28 and Notes 20 and 2729 to the Consolidated Financial Statements.
Risks relative to cash management activities and to interest rate and foreign exchange financial instruments are managed in accordance withaccording to rules set by the Group’s Management.senior management and that provide for regular pooling of available cash balances, open positions and management of the financial instruments by the treasury/financing department. Excess cash of the Group is deposited in government institutions or deposit banks selected in accordance with strict criteria, or is used to buy deposit certificates issued by these banks. Liquidity positions and the management of financial instruments are centralized by the treasury/financing department, where they are managed by a team specialized in foreign exchange and interest rate market transactions. The cash monitoring/management team within the Treasury Department. Cash management activities are organized into a specializedtreasury/financing department for operations on financial markets. The Financial Control Department handles the daily monitoring ofmonitors limits and positions per bank on a daily basis and calculatesreports results. It values financial instrumentsThis team also prepares marked-to-market valuations and, ifwhen necessary, performs sensitivity analysis.
(i) ManagementCounterparty risk
The Group has established standards for market transactions under which bank counterparties must be approved in advance, based on an assessment of currencythe counterparty’s financial soundness and its ratings with Standard & Poor’s and Moody’s, which must be of high quality. An overall authorized credit limit is set for each bank and is allotted among the subsidiaries and the Group’s central treasury entities according to their needs. Due to the recent changes in the financial markets, the Group has taken additional measures to reinforce its management of its exposure to counterparty risk. The Group takes into account the banks’ financial situation, share price and Credit Default Swap (CDS) rate when selecting counterparties. Currency exposure The Group seeks to minimize the currency exposure of each exposed entity by reference to its functional currency (primarily the euro, U.S.the dollar, the pound sterling and the Norwegian krone). For currency exposure generated by commercial activity, the hedging of revenues and costs in foreign currencies is typically performed using currency operations on the spot market and in some cases on the forward market. The Group rarely hedges estimatedfuture cash flows, and, in this case,although it may use options.options to do so. With respect to currency exposure linked to non-current assets accounted forbooked in a currency other than the euro, the Group has a hedging policy which results inof reducing the associatedrelated currency exposure by financing these assets in the same currency. Short-term netNet short-term currency exposure is periodically monitored withagainst limits set by the Group’s executivesenior management.
The Group’s centralnon-current debt described in Note 20 to the Consolidated Financial Statements is generally raised by the corporate treasury entities manage this currency exposure and centralizes borrowing activities on the financial markets (the proceeds ofeither directly in dollars or euros, or in other currencies which are then systematically exchanged for dollars or euros through swaps issues to appropriately match general corporate needs. The proceeds from these debt issuances are loaned to affiliates whose accounts are kept in dollars or in euros. Thus, the borrowing subsidiaries), cash centralization for the Group companies and investmentsnet sensitivity of these funds onpositions to currency exposure is not significant. The Group’s short-term currency swaps, the monetary markets.notional value of which appears in Note 29 to the Consolidated Financial Statements, are used to attempt to optimize the centralized cash management of the Group. Thus, the sensitivity to currency fluctuations which may be induced is likewise considered negligible. (ii) Management of short-termShort-term interest rate exposure and cash
Cash balances, which are primarily composed of euros and U.S. dollars, are managed with three main objectives set outaccording to the guidelines established by the Group’s senior management (to maintain(maintain maximum liquidity, to optimize revenue from investments considering existing interest rate yield curves, and to minimize the cost of borrowing), over a horizon of less than 12 monthstwelve-month horizon and on the basis of a daily interest rate benchmark, primarily through short-term interest rate swaps and short-term currency swaps, without modification of themodifying currency exposure. (iii) Management of interestInterest rate risk on non-current debt
The Group’s policy consists of incurring non-current debt primarily at a floating rate, or, if the opportunity arises at the time of an issuance, at a fixed rate depending on opportunities at the issuance with regards to the level of interest rates,rate. Debt is incurred in dollars or in euros according to the general corporate purposes.needs. Long-term interest rate and currency swaps canmay be used to hedge debenture loansbonds at their issuance in order to create a variable rate synthetic debt. In order to partially modify the interest rate structure of the long-term debt, TOTAL canmay also enter into long-term interest rate swaps. (iv) Sensitivity analysis on interest rate and foreign exchange risk
The tables below present the potential impact of an increase or decrease of 10% in10 basis points on the interest rate yield curves infor each of the currencies on the fair value of the current financial instruments as of December 31, 2008, 2007 and 2006. | | | | | | | | | | | | | | As of December 31, 2006(M€) | | Carrying
amount | | | Estimated
fair value | | | Change in fair
value with a 10% interest
rate increase | | | Change in fair
value with a 10% interest
rate decrease | | ASSETS/(LIABILITIES) | | | | | | | | | | | | | Debenture loans (non-current portion, before swaps) | | (11,413 | ) | | (11,413 | ) | | 26 | | | (26 | ) | Issue swaps and swaps hedging debenture loans | | (193 | ) | | (193 | ) | | — | | | | | Issue swaps and swaps hedging debenture loans (assets) | | 486 | | | 486 | | | — | | | | | | Total issue swaps and swaps hedging debenture loans - assets and liabilities | | 293 | | | 293 | | | (26 | ) | | 26 | | Fixed-rate bank loans | | (210 | ) | | (207 | ) | | 6 | | | (6 | ) | | Current portion of non-current debt after swap (excluding capital lease obligations) | | (2,140 | ) | | (2,140 | ) | | 1 | | | (1 | ) | Other interest rates swaps | | 12 | | | 12 | | | (1 | ) | | 1 | | Currency swaps and forward exchange contracts | | (8 | ) | | (8 | ) | | 1 | | | (1 | ) | Currency options | | — | | | — | | | — | | | — | |
| | | | | | | | | | | | | | | | | | | | | | Change in fair value due to a
change in interest rate by | | | ASSETS/(LIABILITIES) | | Carrying
amount | | | Estimated
fair value | | | + 10 basis points | | | - 10 basis points | | As of December 31, 2008(M€) | | | | | | | | | | | | | Bonds (non-current portion, before swaps) | | (14,119 | ) | | (14,119 | ) | | 47 | | | (43 | ) | Issue swaps and swaps hedging bonds (liabilities) | | (440 | ) | | (440 | ) | | | | | | | Issue swaps and swaps hedging bonds (assets) | | 892 | | | 892 | | | | | | | | Total issue swaps and swaps hedging bonds (assets and liabilities) | | 452 | | | 452 | | | (44 | ) | | 44 | | | Current portion of non-current debt after swap (excluding capital lease obligations) | | (2,025 | ) | | (2,025 | ) | | 3 | | | (3 | ) | Other interest rates swaps | | (4 | ) | | (4 | ) | | 1 | | | (1 | ) | Currency swaps and forward exchange contracts | | (56 | ) | | (56 | ) | | — | | | — | | | | | | | | | | | | | | | | | As of December 31, 2007 (M€) | | | | | | | | | | | | | Bonds (non-current portion, before swaps) | | (11,741 | ) | | (11,741 | ) | | 37 | | | (37 | ) | Issue swaps and swaps hedging bonds (liabilities) | | (369 | ) | | (369 | ) | | | | | | | Issue swaps and swaps hedging bonds (assets) | | 460 | | | 460 | | | | | | | | Total issue swaps and swaps hedging bonds (assets and liabilities) | | 91 | | | 91 | | | (39 | ) | | 38 | | | Current portion of non-current debt after swap (excluding capital lease obligations) | | (1,669 | ) | | (1,669 | ) | | (1 | ) | | 1 | | Other interest rates swaps | | 1 | | | 1 | | | — | | | — | | Currency swaps and forward exchange contracts | | (34 | ) | | (34 | ) | | — | | | — | | | | | | | | | | | | | | | | | As of December 31, 2006 (M€) | | | | | | | | | | | | | Bonds (non-current portion, before swaps) | | (11,413 | ) | | (11,413 | ) | | 26 | | | (26 | ) | Issue swaps and swaps hedging bonds (liabilities) | | (193 | ) | | (193 | ) | | | | | | | Issue swaps and swaps hedging bonds (assets) | | 486 | | | 486 | | | | | | | | Total issue swaps and swaps hedging bonds (assets and liabilities) | | 293 | | | 293 | | | (26 | ) | | 26 | | | Current portion of non-current debt after swap (excluding capital lease obligations) | | (2,140 | ) | | (2,140 | ) | | 1 | | | (1 | ) | Other interest rates swaps | | 4 | | | 4 | | | (1 | ) | | 1 | | Currency swaps and forward exchange contracts | | (8 | ) | | (8 | ) | | 1 | | | (1 | ) |
The impact of changes in interest rate on the cost of net debt before tax is as follows: | | | | | | | | | | | | | | As of December 31, 2005(M€) | | Carrying
amount | | | Estimated
fair value | | | Change in fair
value with a 10% interest
rate increase | | | Change in fair
value with a 10% interest
rate decrease | | ASSETS/(LIABILITIES) | | | | | | | | | | | | | Debenture loans (non-current portion, before swaps) | | (11,025 | ) | | (11,025 | ) | | 126 | | | (129 | ) | Issue swaps and swaps hedging debenture loans | | (128 | ) | | (128 | ) | | — | | | — | | Issue swaps and swaps hedging debenture loans (assets) | | 450 | | | 450 | | | — | | | — | | | Total issue swaps and swaps hedging debenture loans - assets and liabilities | | 322 | | | 322 | | | (115 | ) | | 117 | | Fixed-rate bank loans | | (411 | ) | | (406 | ) | | 7 | | | (7 | ) | | Current portion of non-current debt after swap (excluding capital lease obligations) | | (920 | ) | | (919 | ) | | 1 | | | (1 | ) | Other interest rates swaps | | 3 | | | 3 | | | (3 | ) | | 3 | | Currency swaps and forward exchange contracts | | 260 | | | 260 | | | 4 | | | (4 | ) | Currency options | | — | | | — | | | — | | | — | |
| | | | | | | | | | | For the year ended December 31,(M€) | | 2008 | | | 2007 | | | 2006 | | Cost of net debt | | (527 | ) | | (539 | ) | | (364 | ) | Interest rate translation of + 10 basis points | | (11 | ) | | (12 | ) | | (12 | ) | Interest rate translation of - 10 basis points | | 11 | | | 12 | | | 12 | | Interest rate translation of + 100 basis points | | (113 | ) | | (116 | ) | | (118 | ) | Interest rate translation of - 100 basis points | | 113 | | | 116 | | | 118 | |
As a result of itsthe policy for the management of currency exposure previously described, the Group believes that its short-term currency exposure is not material. The Group’s sensitivity to long-term currency exposure is primarily influenced by the net equity of the subsidiaries whose functional accounting currency is the U.S. dollar and, to a lesser extent, the pound sterling and the Norwegian krone. This sensitivity is reflected byin the historical evolution of the currency translation adjustment imputedrecorded in the statement of changes in shareholders’ equity which, in the course of the last three fiscal years, is essentially related to the evolution of the U.S. dollar and pound sterling and is set forth in the table below: | | | | | | | | | Dollar/euro
exchange
rates | | Currency
translation
adjustments
(M€) | | As of December 31, 2006 | | 1.32 | | (1,383 | ) | As of December 31, 2005 | | 1.18 | | 1,421 | | As of December 31, 2004 | | 1.36 | | (1,429 | ) |
| | | | | | | | Euro / Dollar
exchange rates | | Euro / Pound sterling
exchange rates | As of December 31, 2008 | | 1.39 | | 0.95 | As of December 31, 2007 | | 1.47 | | 0.73 | As of December 31, 2006 | | 1.32 | | 0.67 |
The non-current debt in dollars described in Note 20 to the Consolidated Financial Statements is generally raised by the central treasury entities either in U.S. dollars or in euros, or in other currencies which are then systematically exchanged for dollars or euros according to the general corporate purposes, through issue swaps. The proceeds from these debt issuances are principally loaned to affiliates whose accounts are kept in U.S. dollars and any remaining balance is held in dollar-denominated investments. Thus, the net sensitivity of these positions to currency exposure is not material.
| | | | | | | | | | | | | | | | As of December 31, 2008(M€) | | Total | | | Euro | | Dollar | | | Pound
sterling | | | Other
currencies
and equity
affiliates | | Shareholders’ equity at historical exchange rate | | 53,868 | | | 25,084 | | 15,429 | | | 5,587 | | | 7,768 | | Currency translation adjustment before net investment hedge | | (4,876 | ) | | — | | (2,191 | ) | | (1,769 | ) | | (916 | ) | Net investment hedge — open instruments | | — | | | — | | — | | | — | | | — | | Shareholders’ equity at exchange rate as of December 31, 2008 | | 48,992 | | | 25,084 | | 13,238 | | | 3,818 | | | 6,852 | | | | | | | | | | | | | | | | | | As of December 31, 2007(M€) | | Total | | | Euro | | Dollar | | | Pound
sterling | | | Other
currencies
and equity
affiliates | | Shareholders’ equity at historical exchange rate | | 49,254 | | | 22,214 | | 12,954 | | | 5,477 | | | 8,609 | | Currency translation adjustment before net investment hedge | | (4,410 | ) | | — | | (3,501 | ) | | (289 | ) | | (620 | ) | Net investment hedge — open instruments | | 14 | | | — | | 14 | | | — | | | — | | Shareholders’ equity at exchange rate as of December 31, 2007 | | 44,858 | | | 22,214 | | 9,467 | | | 5,188 | | | 7,989 | | | | | | | | | | | | | | | | | | As of December 31, 2006(M€) | | Total | | | Euro | | Dollar | | | Pound
sterling | | | Other
currencies
and equity
affiliates | | Shareholders’ equity at historical exchange rate | | 41,704 | | | 17,253 | | 11,166 | | | 4,940 | | | 8,345 | | Currency translation adjustment before net investment hedge | | (1,383 | ) | | — | | (1,393 | ) | | 203 | | | (193 | ) | Net investment hedge — open instruments | | — | | | — | | — | | | — | | | — | | Shareholders’ equity at exchange rate as of December 31, 2006 | | 40,321 | | | 17,253 | | 9,773 | | | 5,143 | | | 8,152 | |
Short-term currency swaps for the nominal amounts appear in Note 27 to the Consolidated Financial Statements are used with the aim of optimizing the centralized management of the cash of the Group. Thus the sensitivity to currency fluctuations which may be induced is likewise considered negligible.
As a result of this policy, the impact of currency exchange rate fluctuations on consolidated income, as illustrated in Note 7 to the Consolidated Financial Statements, has not been significant over the last three fiscal years despite the considerable fluctuation of the dollar (loss(gain of 112 M€ in 2008, gain of 35 M€ in 2007, loss of 30 M€ in 2006, gain of 76 M€ in 2005 and loss of 75 M€ in 2004)2006). (v)Stock | Management of counterparty risk |
The Group has established standards for market transactions according to which bank counterparties must be approved in advance, based on an assessment of the counterparty’s financial soundness and its rating (Standard & Poors, Moody’s), which must be of high quality.
An overall authorized credit limit is set for each bank and is divided among the subsidiaries and the Group’s central treasury entities according to their needs.
The Group holds interests in a number of publicly-traded companies (see NoteNotes 12 and 13 to the Consolidated Financial Statements). The market valuesvalue of these holdings fluctuatefluctuates due to various factors, including the global economic environment, stock market trends, valuations of the sectors in which the companies operate, and the economic and financial condition of each individual company. (vii)Liquidity | Liquidity risk |
TOTAL S.A. has confirmed lines of credit granted by international banks, which wouldare calculated to allow it to manage its short-term liquidity needs as required. The total amountAs of December 31, 2008, these lines of credit as of December 31, 2006, was $7,701amounted to $8,966 million, of which $7,649$8,725 million waswere unused. The terms and availability of theseagreements for the lines of credit are
granted to TOTAL S.A. do not conditioned oncontain conditions related to the Company’s financial ratios, to its financial ratings from specialized agencies, or onto the absenceoccurrence of events that could have a material adverse impacteffect on its financial situation. The total amount, asposition. As of December 31, 2006,2008, the aggregate amount of the principal confirmed lines of credit granted by international banks to Group companies, including TOTAL S.A., was $11,638$9,621 million, of which $9,268$9,380 million was unused. LinesThe lines of credit given granted to Group companies other than TOTAL S.A. are not used for general Group purposes. They are usedintended to finance the Group’s general activitiesneeds; they are intended to finance either the general needs of that companythe borrowing subsidiary or fora specific projects.project. The following table showstables show the maturity of the financial assets and debtsliabilities of the Group as of December 31, 2008, 2007 and 2006 (see Note 20 to the Consolidated Financial Statements). | ASSETS/(LIABILITIES) As of December 31, 2006(M€) | | Less than
1 year | | Between 1 year
and 5 years | | More than
5 years | | Total | | | Financial debt after swaps | | (2,025 | ) | | (10,733 | ) | | (2,955 | ) | | (15,713 | ) | | ASSETS/(LIABILITIES) As of December 31, 2008(M€) | | | Less than
one year | | Between 1 year
and 5 years | | More than
5 years | | Total | | Non-current financial debt — net of hedging instruments | | | | | (13,206 | ) | | (2,093 | ) | | (15,299 | ) | Current borrowings | | | (7,722 | ) | | | | | | (7,722 | ) | Other current financial liabilities | | | (158 | ) | | | | | | (158 | ) | Current financial assets | | | 187 | | | | | | | 187 | | Cash and cash equivalents | | 2,493 | | | — | | | — | | | 2,493 | | | 12,321 | | | 12,321 | | Net amount before financial expense | | | 4,628 | | | (13,206 | ) | | (2,093 | ) | | (10,671 | ) | Financial expense | | | (436 | ) | | (1,021 | ) | | (181 | ) | | (1,638 | ) | Net amount | | 468 | | | (10,733 | ) | | (2,955 | ) | | (13,220 | ) | | 4,192 | | | (14,227 | ) | | (2,274 | ) | | (12,309 | ) | | | | | | | ASSETS/(LIABILITIES) As of December 31, 2005(M€) | | Less than
1 year | | Between 1 year
and 5 years | | More than
5 years | | Total | | | Financial debt after swaps | | (3,619 | ) | | (9,057 | ) | | (4,259 | ) | | (16,935 | ) | | | As of December 31, 2007(M€) | | | Less than
one year | | Between 1 year
and 5 years | | More than
5 years | | Total | | Non-current financial debt — net of hedging instruments | | | | | (11,424 | ) | | (2,992 | ) | | (14,416 | ) | Current borrowings | | | (4,613 | ) | | | | | | (4,613 | ) | Other current financial liabilities | | | (60 | ) | | | | | | (60 | ) | Current financial assets | | | 1,264 | | | | | | | 1,264 | | Cash and cash equivalents | | 4,318 | | | — | | | — | | | 4,318 | | | 5,988 | | | 5,988 | | Net amount before financial expense | | | 2,579 | | | (11,424 | ) | | (2,992 | ) | | (11,837 | ) | Financial expense | | | (561 | ) | | (1,389 | ) | | (270 | ) | | (2,220 | ) | Net amount | | 699 | | | (9,057 | ) | | (4,259 | ) | | (12,617 | ) | | 2,018 | | | (12,813 | ) | | (3,262 | ) | | (14,057 | ) | | | | | | | As of December 31, 2006(M€) | | | Less than
one year | | Between 1 year
and 5 years | | More than
5 years | | Total | | Non-current financial debt — net of hedging instruments | | | | | (10,733 | ) | | (2,955 | ) | | (13,688 | ) | Current borrowings | | | (5,858 | ) | | | | | | (5,858 | ) | Other current financial liabilities | | | (75 | ) | | | | | | (75 | ) | Current financial assets | | | 3,908 | | | | | | | 3,908 | | Cash and cash equivalents | | | 2,493 | | | 2,493 | | Net amount before financial expense | | | 468 | | | (10,733 | ) | | (2,955 | ) | | (13,220 | ) | Financial expense | | | (567 | ) | | (1,302 | ) | | (160 | ) | | (2,029 | ) | Net amount | | | (99 | ) | | (12,035 | ) | | (3,115 | ) | | (15,249 | ) |
Credit risk is defined as the risk of the counterparty to a contract failing to perform or pay the amounts due. The Group is exposed to credit risks in its operating and financing operations. The Group’s maximum exposure to credit risk is partially related to financial assets recorded on its balance sheet, including energy derivative instruments that have a positive market value. The following table presents the Group’s maximum credit risk exposure: | | | | | | | | As of December 31,(M€) | | | | | | | | ASSETS/(LIABILITIES) | | 2008 | | 2007 | | 2006 | Loans to equity affiliates
(Note 12) | | 2,005 | | 2,575 | | 1,533 | Loans and advances(Note 14) | | 1,403 | | 851 | | 1,025 | Hedging instruments of non-current financial debt(Note 20) | | 892 | | 460 | | 486 | Accounts receivable(Note 16) | | 15,287 | | 19,129 | | 17,393 | Other operating receivables (Note 16) | | 6,208 | | 4,430 | | 4,267 | Current financial assets
(Note 20) | | 187 | | 1,264 | | 3,908 | Cash and cash equivalents(Note 27) | | 12,321 | | 5,988 | | 2,493 | Total | | 38,303 | | 34,697 | | 31,105 |
The valuation allowance on loans and advances and on accounts receivable and other operating receivables is detailed respectively in Notes 14 and 16 to the Consolidated Financial Statements. Credit risk is managed by the Group’s business segments as follows: | - | Exploration & Production |
Risks arising under contracts with government authorities or other oil companies or under long-term supply contracts necessary for the development of projects are evaluated during the project approval process. The long-term aspect of these contracts and the high-quality of the other parties lead to a low level of credit risk. Risks related to commercial operations, other than those described above (which are, in practice, directly monitored by subsidiaries), are subject to procedures for establishing and reviewing credit. Customer receivables are subject to provisions on a case-by-case basis, based on prior history and management’s assessment of the facts and circumstances. The Gas & Power division deals with counterparties in the energy, industrial and financial sectors throughout the world, primarily in Europe and North America. Financial institutions providing credit risk coverage are highly rated international bank and insurance groups. Potential counterparties are subject to credit assessment and approval before concluding transactions and are thereafter subject to regular review, including re-appraisal and approval of the limits previously granted. The creditworthiness of counterparties is assessed based on an analysis of quantitative and qualitative data regarding financial standing and business risks, together with the review of any relevant third party and market information, such as data published by rating agencies. On this basis, credit limits are defined for each potential counterparty and, where appropriate, transactions are subject to specific authorizations. Credit exposure, which is essentially an economic exposure or an expected future physical exposure, is permanently monitored and subject to sensitivity measures. Credit risk is mitigated by the systematic use of industry standard contractual frameworks that permit netting, enable to require added security in case of adverse change in the counterparty risk, and allow for termination of the contract upon occurrence of certain events of default. Internal procedures for the Refining & Marketing division include rules on credit risk that describe the basis of internal control in this domain, including the separation of authority between commercial and financial operations. Credit policies are defined at the local level, complemented by the implementation of procedures to monitor customer risk (credit committees at the subsidiary level, the creation of credit limits for corporate customers, portfolio guarantees, etc.). Each entity also implements monitoring of its outstanding receivables. Risks related to credit may be mitigated or limited by requiring security or guarantees. Bad debts are provisioned on a case-by-case basis at a rate determined by management based on an assessment of the facts and circumstances. Trading & Shipping deals with commercial counterparties and financial institutions located throughout the world. Counterparties to physical and derivative transactions are primarily entities involved in the oil and gas industry or in the trading of energy commodities, or financial institutions. Credit risk coverage is concluded with financial institutions, international banks and insurance groups selected in accordance with strict criteria. The Trading & Shipping division has a strict policy of internal delegation of authority governing establishment of country and counterparty credit limits and approval of specific transactions. Credit exposures contracted under these limits and approvals are monitored on a daily basis. Potential counterparties are subject to credit assessment and approval prior to any transaction being concluded and all active counterparties are subject to regular reviews, including re-appraisal and approval of granted limits. The creditworthiness of counterparties is assessed based on an analysis of quantitative and qualitative data regarding financial standing and business risks, together with the review of any relevant third party and market information, such as ratings published by Standard & Poor’s, Moody’s Investors Service and other agencies. Contractual arrangements are structured so as to maximize the risk mitigation benefits of netting between transactions wherever possible and additional protective terms providing for the provision of security in the event of financial deterioration and the termination of transactions on the occurrence of defined default events are used to the greatest permitted extent. Credit risks in excess of approved levels are secured by means of letters of credit and other guarantees, cash deposits and insurance arrangements. In respect of derivative transactions, risks are secured by formal margining agreements wherever possible. Credit risk in the Chemicals segment is primarily related to commercial receivables. Each division implements procedures for managing and provisioning credit risk that differ based on the size of the subsidiary and the market in which it operates. The principal elements of these procedures are: implementation of credit limits with different authorization procedures for possible credit overruns; use of insurance policies or specific guarantees (letters of credit); regular monitoring and assessment of overdue accounts (aging balance), including collection procedures; and provisioning of bad debts on a customer-by-customer basis, according to payment delays and local payment practices. 30.32) OTHER RISKS AND CONTINGENT LIABILITIES
TOTAL is not currently aware of any event, litigation, risks or contingent liabilities that could materially adversely affecthave a material impact on the financial condition, assets, results or business of the Group. Antitrust Investigations 1) Following investigations into certain commercial practices in the chemicals industry in the United States, certain chemicalsome subsidiaries of the Arkema(1) group are involved in several civil liability lawsuits in the United States and Canada for violations of antitrust laws. TOTAL S.A. has been named in certain of these suits as the parent company. F-81 | (1) | Arkema is used in this section to designate those companies of the Arkema group whose ultimate parent company is Arkema S.A. Arkema became an independent company after being spun-off from TOTAL S.A. in May 2006. |
In Europe, the European Commission commenced investigations in 2000, 2003 and 2004 into alleged anti-competitive practices involving certain products sold by Arkema(1) or its subsidiaries.Arkema. In January 2005, under one of these investigations, the European Commission fined Arkema 13.5 M€ and jointly fined Arkema and Elf Aquitaine 45 M€. Arkema and Elf Aquitaine have appealed these decisions to the Court of First Instance of the European Union. The Commission notified Arkema, TOTAL S.A. and Elf Aquitaine of complaints concerning two other product lines in January and August 2005, respectively. Arkema has cooperated with the authorities in these procedures and investigations. As a result of these proceedings, inIn May 2006, the European Commission fined Arkema 78.7 M€and 219.1 M€, respectively.as a result of, respectively, each of these two proceedings. Elf Aquitaine was held jointly and severally liable for, respectively, 65.1 M€ and 181.35 M€ of these fines while TOTAL S.A. was held jointly and severally liable, respectively, for 42 M€ and 140.4 M€. TOTAL S.A., Arkema and Elf Aquitaine and Arkema have appealed these decisions to the Court of First Instance of the European Union. Arkema and Elf Aquitaine received a statement of objections from the European Commission in August 2007 concerning alleged anti-competitive practices related to another line of chemical products. As a result, Arkema and Elf Aquitaine have been jointly and severally fined in an amount of 22.7 M€ and individually in an amount of 20.43 M€ for Arkema and 15.89 M€ for Elf Aquitaine. The companies concerned appealed this decision to the relevant European court. No facts have been alleged that would implicate TOTAL S.A. or Elf Aquitaine in the practices questioned in these proceedings, and the fines received are based solely on their status as parent companies. Arkema began implementing compliance procedures in 2001 that are designed to prevent its employees from violating antitrust provisions. However, it is not possible to exclude the possibility that the relevant authorities could commence additional proceedings involving Arkema, andas well as TOTAL S.A. and Elf Aquitaine. 2) As part of the agreement relating to the spin-off of Arkema, TOTAL S.A. or certain other Group companies agreed to grant Arkema guarantees for certain risks related to antitrust proceedings arising from events prior to the spin-off. These guarantees cover, for a period of ten years that began in 2006, 90% of amounts paid by Arkema related to (i) fines imposed by European authorities or European member-statemember-states for competition law violations, (ii) fines imposed by AmericanU.S. courts or antitrust authorities for federal antitrust violations or violations of the competition laws of U.S. states, (iii) damages awarded in civil proceedings related to the government proceedings mentioned above, and (iv) certain costs related to these proceedings.
(1) | Arkema is used in this section to designate those companies of the Arkema group whose ultimate parent company is Arkema S.A. Arkema became an independent company after being spun-off from TOTAL S.A. in May 2006. |
The guarantee covering anticompetitionthe risks related to anti-competition violations in Europe applies to amounts that rise above a 176.5 M€ threshold. If one or more individuals or legal entities, acting alone or together, directly or indirectly holds more than one thirdone-third of the voting rights of Arkema, or if the Arkema transfers more than 50% of its assets (as calculated under the enterprise valuation method, as of the date of the transfer) to a third party or parties acting together, irrespective of the type or number of transfers, these guarantees will become void. On the other hand, the agreements provide that Arkema will indemnify TOTAL S.A. or any Group company for 10% of any amount that TOTAL S.A. or any such Group company isare required to pay under any of the proceedings covered by these guarantees. 3) The Group has recorded provisions amounting to 13885 M€ in its consolidated accountsfinancial statements as of December 31, 20062008 to cover the risks mentioned above. 4) Moreover, as a result of investigations started by the European Commission in October 2002 concerning certain Refining & Marketing subsidiaries of the Group, TOTALTotal Nederland N.V. and TOTAL S.A. received a statement of objections in October 2004. A statement of objections regarding these practices has also been addressed to TOTAL S.A. These proceedings resultingresulted, in September 2006, in Total Nederland NDVN.V. being fined 20.25 M€ and in TOTAL S.A. as its parent company being held jointly responsible for 13.5 M€ of this amount, although no facts implicating TOTAL S.A. in the practices under investigation were alleged. TOTAL S.A. and Total Nederland N.V. have appealed this decision to the Court of First Instance of the European Union. In addition, in May 2007, Total France and TOTAL S.A. received a statement of objections regarding alleged antitrust practices concerning another product line of the Refining & Marketing division. These proceedings resulted, in October 2008, in Total France being fined 128.2 M€ and in TOTAL S.A., as its parent company, being held jointly responsible although no facts implicating TOTAL S.A. in the practices under investigation were alleged. TOTAL S.A. and Total Raffinage & Marketing (the new corporate name of Total France) have appealed this decision to the Court of First Instance of the European Union. 5) Given the discretionary powers granted to the European Commission for determining fines relating to antitrust regulations, it is not currently possible to determine with certainty the outcome of these investigations and proceedings. TOTAL S.A. and Elf Aquitaine are contesting their liability and the method of determining these fines. Although it is not possible to predict the ultimate outcome of these proceedings, the Group believes that they will not have a material adverse affecteffect on its financial condition or results. BUNCEFIELD On December 11, 2005, several explosions, followed by a major fire, occurred at an oil storage depot at Buncefield, north of London, in an oil storage depot.London. This depot is operated by HOSL,Hertfordshire Oil Storage Limited (HOSL), a company in which the British subsidiary of TOTAL holds 60% and another oil group holds 40%. The explosion injured 40caused minor injuries to a number of people most of whom suffered slight injuries, and caused property damage to the depot and the buildings and homes located nearby. The HSEofficial Independent Investigation Board has indicated that the explosion was caused by the overflow of a tank at the depot. The Board’s final HSE report detailing the circumstances and the exact cause of the explosion is expected to bewas released before the end of this year.on December 11, 2008. At this stage, responsibility for the explosion has not yet been determined. The civil procedure for claims, which have not yet been settled, took place between October and December 2008. The decision of the trial court is expected in the first quarter 2009.
The Group is insuredcarries insurance for damage to its interests in these facilities, operating lossesbusiness interruption and civil liability claims from third parties, under its civil liability and believes that, based on the current information currently available, this accident should not have a significant impact on itsthe Group’s financial position, cash flowssituation or consolidated results. On December 1, 2008, the Health and Safety Executive (HSE) and the Environment Agency (EA) issued a Notice of prosecution against five companies, including the British subsidiary of TOTAL. An initial court hearing is expected in the second quarter 2009. VENEZUELA In Venezuela, on March 31, 2006,On February 26, 2007 the Venezuelan president signed a decree providing for the transformation of the Strategic Associations from the Faja region (including Sincor), into mixed companies with the government terminated all operating contracts signed in the 1990s and decided to transfer the managementhaving a minimum interest of fields concerned to new mixed companies60%. The legislation further stated
that operations were to be created withtransferred to PDVSA no later than May 1, 2007, and that the state-owned company PDVSA (Petroleos de Venezuela S.A.) as the majority owner. The government and the Group did notprivate companies were to have a four-month period to reach an agreement on the terms and conditions of their interest in the mixed companies. Within this framework, TOTAL signed two agreements with PDVSA and Statoil, with the approval of the ministry in charge of energy and oil: On April 25, 2007, an agreement according to which the control of Sincor operations was transferred temporarily, from May 1, 2007, to PDVSA; On June 26, 2007, heads of agreement providing for the transformation of the Sincor association into a mixed company. Pursuant to these heads of agreement, TOTAL’s share in the project decreased from 47% to 30.323%, PDVSA’s interest increased from 38% to 60% and Statoil’s interest decreased from 15% to 9.677%. This agreement also provides for compensation to be awarded to TOTAL, with the amount to be negotiated based on the value of the assets. The conditions of this transformation were approved by the National Assembly in October 2007. Presidential decrees regarding the creation of the mixed company, PetroCedeño and the transfer of operationthe rights to conduct the principal activities were published in the Venezuelan official gazette on November 9, 2007 and January 10, 2008, respectively. The finalization of the Jusepin field undertransformation process occurred on February 8, 2008. In the initial timetableGroup’s financial statements, PetroCedeño (formerly Sincor) was consolidated by the equity method as of December 31, 2007 at 30.323%; special items related to this transformation into a mixed company were booked as of the first quarter 2008. KAZAKHSTAN On January 14, 2008, members of NCSPSA (North Caspian Sea Production Sharing Agreement) and negotiationsthe Kazakh authorities signed a Memorandum of Understanding to resolveend the situationdispute among them that began at the end of August 2007. The final agreements, which are ongoing.necessary to the implementation of this Memorandum of Understanding and of the additional protocol signed on June 25, 2008, were signed on October 31, 2008. An update of the costs and schedule of the first development phase has been proposed to and accepted by the authorities. According to these protocols and agreements: A decrease in the foreign partners’ interest in favor of KMG (KazMunaiGas) decreases TOTAL’s share in this permit from 18.52% to 16.81%; and The financial terms are modified in favor of the Republic of Kazakhstan by (i) the implementation of a priority payment representing a percentage of the sales depending on crude oil prices, (ii) an increase in the production bonus, and (iii) a decrease in the interest rate on recoverable investments depending on crude oil prices. SINKING OF THE ERIKA Pursuant to a judgment issued on January 16, 2008, theTribunal de grande instance of Paris found that TOTAL S.A. was negligent in its vetting procedure for vessel selection. TOTAL S.A. was fined€375,000. The court also ordered compensation to be paid to the victims of pollution from the Erika up to an aggregate amount of 192 M€, declaring TOTAL S.A. jointly and severally liable for such payments together with the Erika’s inspection and classification firm, the Erika’s owner and the Erika’s manager. TOTAL believes that the finding of negligence and the related conviction for marine pollution are without substance as a matter of fact and as a matter of law. TOTAL also considers that this verdict is contrary to the intended aim of enhancing maritime transport safety. TOTAL has appealed the verdict of January 16, 2008. In the meantime, it has nevertheless proposed to pay third parties who so request definitive compensation as determined by the court. As of today, thirty-six third parties have received compensation payments, representing an aggregate amount of 170.1 M€. The government has expressedhearing of the appeal before the Court of Appeals of Paris is expected to begin in October 2009. At the current stage of the proceedings, TOTAL S.A. believes that, based on a reasonable estimate of its intention to applyliability, the law on hydrocarbons of 2001 to the “Strategic Associations” which operate the extra-heavy oil from the Orinoco region to create new mixed companies with PDVSA as the majority owner. Discussions regarding the Sincor project are underway. The Venezuelan government has modified the initial agreement for the Sincor project several times. In May, 2006, the organic law on hydrocarbons was amended with immediate effect to establishcase will not have a new extraction tax, calculatedmaterial impact on the same basis as for royalties and bringing the overall tax rate to 33.33%. In September, 2006, the corporate income tax was modified to increase the rate on oil activities (excluding natural gas) to 50%. This new tax rate will come into effect in 2007.
In 2006, the Group received two corporation tax adjustment notices. The first concerned the company holding the Group’s interest in the Jusepin operating contract, for which the 2001-2004 examination was closed in the first half 2006, whereas the examination for 2005 is still underway. The second is related to the company holding the Group’s interest in the Sincor project, for which the Group is awaiting an answer from the tax authorities regarding the observations provided by the Group concerning 2001.financial situation or consolidated results.
31.33) OTHER INFORMATION
A) RESEARCH AND DEVELOPMENT COSTS Research and development costs incurred by the Group in 20062008 amounted to 612 M€ (594 M€ in 2007 and 569 M€ in 2006), corresponding to 0.4%0.3% of the turnover.sales. The staff dedicated in 20062008 to these research and development activities are estimated at 4,285 people (4,216 in 2007 and 4,091 people.in 2006). B) TAXES PAID TO MIDDLE EAST OIL-PRODUCING COUNTRIES FOR THE PORTION WHICH TOTAL HELD HISTORICALLY AS CONCESSIONS Taxes paid for the portion that TOTAL held historically as concessions (Abu Dhabi offshore and onshore, Dubai offshore, Oman and Abu Al Bu Khoosh) included in operating expenses amounted to 3,301 M€ in 2008 (2,505 M€ in 2007 and 2,906 M€ in 2006 (2,242 M€ in 2005)2006). C) CARBON DIOXIDE EMISSION RIGHTS The principles governing the accounting for Emission Rightsemission rights are presented in Note 1 paragraph T of Note 1 to the consolidated financial statements.Consolidated Financial Statements. AtAs of December 31, 2006, the Emission Rights delivered to Group sites were sufficient with respect to the emissions in 2006. Thus,2008, the Group recognized no provisionssites’ position for allowances to be returned.emission rights is balanced between delivered or acquired emission rights and emissions for the year 2008.
32.34) SPIN-OFF OF ARKEMA (2006)
The spin-off of Arkema that took place in 2006 led to the distribution of Arkema shares to TOTAL shareholders (other than TOTAL S.A). This operation can be analyzed as an exchange of non-monetary assets for TOTAL S.A. shareholders. As IFRS doesdo not contain specific rules for this type of transaction, the accounting treatment offor the spin-off in TOTAL’s consolidated financial statementsConsolidated Financial Statements has been based on U.S. GAAP,Generally Accepted Accounting Principles in the United States (U.S. GAAP), and more particularly on opinion APB 29 (Accounting Principles Board Opinions) “Accounting for Non-monetary Transactions”. All assets and liabilities which were spun offspun-off have been derecognized on the basis of their net book value, with a corresponding decrease of consolidated shareholders’ equity and no impact on the Group’s consolidated net income.Consolidated Statement of Income. The spin-off of Arkema was approved by the shareholders’ meeting held on May 12, 2006. Since Arkema’s results for the period between April 1, 2006 and May 12, 2006, were not material, the deconsolidation has been completed on the basis of Arkema book values as of March 31, 2006, also taking into account the capital increase that took place in April 2006. In accordance with IFRS 5 “Non-current assets held for sale and discontinued operations”, the contribution of Arkema entities has been reported as discontinued operations since Arkema can be clearly distinguished and has been spun off in a single and coordinated plan. Financial information related to the Arkema’s contribution to the consolidated accounts of the GroupConsolidated Financial Statements is presented below. This contributive information is not directly comparable to the combined and pro-forma accounts filed by Arkema for the purpose of the public listing of its shares, as the latter have been based on specific conventions mainly related to the consolidation perimeter,scope, accounting options and indicators. Tax losses of Arkema entities, as they occurred, have been used in the consolidated tax return of the Group. | | | | | | | | | | Statement of income For the year ended December 31,(M€) | | 2006 | | | 2005 | | | 2004 | | Revenues from sales | | 1,497 | | | 5,561 | | | 5,156 | | Purchases and other operating expenses | | (1,377 | ) | | (5,274 | ) | | (4,869 | ) | Depreciation of tangible assets | | (53 | ) | | (404 | ) | | (627 | ) | | | | | Operating income | | 67 | | | (117 | ) | | (340 | ) | Equity in income (loss) of affiliates, others | | (42 | ) | | (325 | ) | | (325 | ) | Taxes | | (30 | ) | | (19 | ) | | (33 | ) | Net Income | | (5 | ) | | (461 | ) | | (698 | ) | | | | | | | | | | | | Balance sheet As of December 31, (M€) | | 2006(a) | | | 2005 | | | 2004 | | Non-current assets | | 1,995 | | | 2,011 | | | 2,160 | | Working capital | | 1,501 | | | 1,337 | | | 1,129 | | Provisions and other non-current liabilities | | (1,090 | ) | | (1,116 | ) | | (1,230 | ) | Capital employed | | 2,406 | | | 2,232 | | | 2,059 | | Net debt | | (144 | ) | | (551 | ) | | (1,221 | ) | Shareholders’ equity | | 2,262 | | | 1,681 | | | 838 | |
| | | | Statement of income As of December 31,(M€) | | 2006 | | Revenues from sales | | 1,497 | | Purchases and other operating expenses | | (1,377 | ) | Depreciation of tangible assets | | (53 | ) | | | Operating income | | 67 | | Equity in income (loss) of affiliates, others | | (42 | ) | Taxes | | (30 | ) | | | Net income | | (5 | ) | | | | | | | Balance sheet As of December 31,(M€) | | 2006(1) | | Non-current assets | | 1,995 | | Working capital | | 1,501 | | Provisions and other non-current liabilities | | (1,090 | ) | Capital employed | | 2,406 | | Net debt | | (144 | ) | Shareholders’ equity | | 2,262 | |
(a)(1) | Detailed assets and liabilities which have been spun-off as of May 12, 2006. |
| | | | | | | | | | | Statement of cash flows For the year ended December 31,(M€) | | 2006 | | | 2005 | | | 2004 | | Cash flow from operating activities | | 53 | | | (348 | ) | | (41 | ) | Cash flow used in investing activities | | (76 | ) | | (263 | ) | | (261 | ) | Cash flow from financing activities | | (109 | ) | | (18 | ) | | (17 | ) | Net increase/decrease in cash and cash equivalents | | (132 | ) | | (629 | ) | | (319 | ) | Effect of exchange rates and changes in reporting entity | | 113 | | | 622 | | | 327 | | Cash and cash equivalents at the beginning of the period | | 84 | | | 91 | | | 83 | | Cash and cash equivalent at the end of the period | | 65 | | | 84 | | | 91 | |
| | | | Statement of cash flow For the year ended December 31,(M€) | | 2006 | | Cash flow from operating activities | | 53 | | Cash flow used in investing activities | | (76 | ) | Cash flow from financing activities | | (109 | ) | Net increase/decrease in cash and cash equivalents | | (132 | ) | Effect of exchange rates and changes in consolidation scope | | 113 | | Cash and cash equivalents at the beginning of the period | | 84 | | Cash and cash equivalent at the end of the period | | 65 | |
Earnings per share and dilutedfully-diluted earnings per share are presented below for continuing and discontinued operations. | | | | | | | | | | Earnings per share(€) | | 2006 | | 2005 | | | 2004 | | Earnings per share of continuing operations | | 5.13 | | 5.42 | | | 4.78 | | Earnings per share of discontinued operations | | 0.00 | | (0.19 | ) | | (0.28 | ) | Earnings per share | | 5.13 | | 5.23 | | | 4.50 | | | | | | Diluted earnings per share(€) | | 2006 | | 2005 | | | 2004 | | Diluted earnings per share of continuing operations | | 5.09 | | 5.39 | | | 4.76 | | Diluted earnings per share of discontinued operations | | — | | (0.19 | ) | | (0.28 | ) | Diluted earnings per share | | 5.09 | | 5.20 | | | 4.48 | |
33. LIST OF THE PRINCIPAL CONSOLIDATED SUBSIDIARIES AS OF DECEMBER 31, 2006
As of December 31, 2006, 718 subsidiaries were consolidated of which 614 were fully consolidated, 13 were proportionately consolidated (P) and 91 were accounted for under the equity method (E).
The following is a list of the principal consolidated subsidiaries:
| | | | | | | | | | | | UPSTREAM | | UPSTREAM (continued) | Brass Holdings Company Ltd | | | | (99.8%) | | Total E & P Nederland B.V. | | | | (99.8%) | CDF Energie | | | | (100%) | | Total E & P Nigeria | | | | (100%) | Deer Creek Energy | | | | (100%) | | Total E & P Norge AS | | | | (99.8%) | Elf Exploration Production | | | | (99.5%) | | Total E & P Oman | | | | (99.8%) | Elf Petroleum Iran | | | | (99.8%) | | Total E & P Qatar | | | | (99.8%) | Elf Petroleum Nigeria Ltd. | | | | (99.8%) | | Total E & P Qatargas II Holdings Ltd | | | | (99.8%) | Qatar Liquefied Gas Co. Ltd II | | E | | (8.3%) | | Total E & P Russie | | | | (99.8%) | Qatar Liquefied Gas Company Ltd | | E | | (10.0%) | | Total E & P Syrie | | | | (99.8%) | Tepma Colombie | | | | (99.8%) | | Total E & P Thailand | | | | (99.8%) | Total (BTC) Ltd | | | | (99.8%) | | Total E & P USA, Inc. | | | | (100%) | Total Abu Al Bu Khoosh | | | | (99.8%) | | Total E & P Yémen | | | | (99.8%) | Total Austral | | | | (99.8%) | | Total Energie Développement | | | | (100%) | Total Coal International | | | | (100%) | | Total Energie Gaz | | | | (99.5%) | Total Coal South Africa Ltd | | | | (100%) | | Total Gabon | | | | (58.0%) | Total E & P Algérie | | | | (99.8%) | | Total Gas & Power North America | | | | (100%) | Total E & P Angola | | | | (99.8%) | | Total Gasandes S.A. | | | | (100%) | Total E & P Australia | | | | (100%) | | Total Gaz & Electricité Holdings France | | | | (99.5%) | Total E & P Azerbaidjan B.V. | | | | (99.8%) | | Total Holdings Nederland B.V. | | | | (99.8%) | Total E & P Bolivie | | | | (99.8%) | | Total Infrastructures Gaz France | | | | (99.5%) | Total E & P Bornéo B.V. | | | | (99.8%) | | Total LNG Angola | | | | (99.8%) | Total E & P Cameroun | | | | (75.4%) | | Total LNG Nigeria Ltd | | | | (99.5%) | Total E & P Canada Ltd | | | | (100%) | | Total Midstream UK Ltd | | | | (99.8%) | Total E & P Chine | | | | (100%) | | Total Oil & Gas Venezuela B.V. | | | | (99.8%) | Total E & P Congo | | | | (99.5%) | | Total Profils Pétroliers | | | | (99.8%) | Total E & P France | | | | (99.5%) | | Total Qatar Oil & Gas | | | | (99.8%) | Total E & P Indonésie | | | | (99.8%) | | Total Sirri | | | | (99.8%) | Total E & P Kazakhstan | | | | (100%) | | Total South Pars | | | | (99.8%) | Total E & P Libye | | | | (99.8%) | | Total Upstream UK Ltd | | | | (99.8%) | Total E & P Mauritanie | | | | (100%) | | Total Venezuela | | | | (100%) | Total E & P Myanmar | | | | (99.8%) | | | | | | |
| | | | | | | | | | | | DOWNSTREAM | | CHEMICALS | Air Total International | | | | (100%) | | Atotech BV | | | | (99.8%) | AS24 | | | | (99.8%) | | Bostik Holding S.A. | | | | (99.5%) | Atlantic Trading & Marketing | | | | (100%) | | Bostik S.A. | | | | (99.5%) | CEPSA | | E | | (48.6%) | | Cray Valley S.A. | | | | (100%) | Chartering & Shipping Services S.A. | | | | (100%) | | Grande Paroisse S.A. | | | | (99.5%) | S.A. de la Raffinerie des Antilles | | P | | (50.0%) | | Hutchinson Corporation | | | | (100%) | Socap International | | | | (99.5%) | | Hutchinson S.A. | | | | (100%) | Total (Africa) Ltd | | | | (99.5%) | | Qatar Petrochemical Company Ltd | | E | | (19.9%) | Total (China) Investments | | | | (100%) | | Qatofin Company Ltd | | E | | (48.8%) | Total (Philippines) Corp. | | | | (99.8%) | | Rosier | | | | (56.6%) | Total Belgium | | | | (100%) | | Samsung-Total Petrochemicals | | P | | (49.9%) | Total Deutschland GmbH | | | | (99.8%) | | Total Petrochemicals France | | | | (99.5%) | Total Fluides | | | | (99.8%) | | Total Petrochemicals Iberica | | | | (100%) | Total France | | | | (99.8%) | | Total Petrochemicals USA | | | | (100%) | Total International Ltd. | | | | (100%) | | | | | | | Total Italia | | | | (99.8%) | | CORPORATE AND OTHER ACTIVITIES | | | | | Total Kenya | | | | (78.3%) | | Elf Aquitaine | | | | (99.5%) | Total Lubrifiants S.A. | | | | (99.8%) | | Elf Aquitaine Fertilisants | | | | (99.5%) | Total Mineralöl und Chemie GmbH | | | | (99.8%) | | Omnium des Participations S.A. | | | | (100%) | Total Nederland N.V. | | | | (99.8%) | | Omnium Insurance and Reinsurance Cy | | | | (100%) | Total Nigeria | | | | (61.6%) | | Petrofina S.A. | | | | (100%) | Total Outre-Mer | | | | (100%) | | Sanofi-Aventis | | E | | (13.1%) | Total Raffinaderij Nederland | | P | | (55.0%) | | Socap Ltd | | | | (99.5%) | Total Raffinerie Mitteldeutschland | | | | (99.8%) | | Sofax Banque | | | | (99.5%) | Total Sénégal | | | | (94.9%) | | Total Capital | | | | (100%) | Total South Africa | | | | (66.8%) | | Total Chimie | | | | (100%) | Total South East Asia | | | | (99.8%) | | Total E & P Holdings | | | | (99.8%) | Total Turkiye | | | | (99.9%) | | Total Finance S.A. | | | | (100%) | Total UK Ltd | | | | (99.8%) | | Total Holdings Europe | | | | (99.8%) | TotalGaz | | | | (99.8%) | | Total Holdings UK Ltd | | | | (99.8%) | TotalGaz Argentina | | | | (99.8%) | | Total Holdings USA, Inc. | | | | (100%) | TOTSA Total Oil Trading S.A. | | | | (99.5%) | | Total Treasury | | | | (100%) | Urbaine des Pétroles | | | | (99.8%) | | | | | | |
34. SUMMARY OF DIFFERENCES BETWEEN ACCOUNTING PRINCIPLES FOLLOWED BY THE COMPANY AND UNITED STATES GENERALLY ACCEPTED ACCOUNTING PRINCIPLES
The accompanying consolidated financial statements have been prepared in accordance with IFRS, which differ in certain respects from accounting standards applicable in the United States of America (“U.S. GAAP”).
These differences have been reflected in the financial information set forth in paragraph M below and mainly relate to the following items.
A. Business combinations
Pursuant to an exemption provided by IFRS1 “First time adoption of International Financial Reporting Standards”, the Group elected not to restate business combinations completed prior to January 1, 2004, in accordance with IFRS 3 “Business Combinations”.
(i) Acquisition of PetroFina and Elf
Under U.S. GAAP, the acquisitions of PetroFina and Elf did not qualify as pooling-of-interests and therefore would have been accounted for as purchases. The cost of the acquisition was allocated on the basis of the estimated fair value of the assets acquired and liabilities assumed. Independent valuations were performed for the major subsidiaries of PetroFina and Elf; those valuations were validated by in-house analysis for determining the estimated fair value of oil and gas properties acquired.
The main differences between IFRS and U.S. GAAP resulting from the purchase price allocation of PetroFina and Elf were as follows:
Equity investees revaluations: Under IFRS, equity investees held by PetroFina and Elf were maintained at their carrying value in the consolidated financial statements as authorized under IFRS. Under U.S. GAAP, these investees were recorded at fair value as part of the purchase price allocation. This line item primarily includes the difference between the fair market value and the carrying value of Sanofi-Synthelabo and CEPSA at the date of acquisition of Elf. For U.S. GAAP purposes, this difference was amortized on a straight line basis over 30 years until December 31, 2001 when amortization was suspended upon adoption of FAS No. 141 and 142. U.S. GAAP adjustments to net income also include the impact of the sale of interest in these equity investees.
This caption also includes an additional net charge of 1,475 M€ for the year ended December 31, 2004 related to the Sanofi-Aventis gain on dilution as the carrying value of the equity interest under U.S. GAAP was higher than under IFRS.
Goodwill on consolidated companies: This line item includes the non-allocated portion of the purchase price of Elf and PetroFina. Under IFRS, no goodwill was recognized as a result of these acquisitions. Under U.S. GAAP, this goodwill was amortized on a straight line basis over 30 years until December 31, 2001 when amortization was suspended upon adoption of FAS No. 141 and 142. The remaining difference in net income for the years ended December 31, 2005 and 2004, between IFRS and U.S. GAAP corresponds to the subsequent realization of pre-acquisition tax losses carried forward.
This caption also includes impairment charges recorded in the Chemicals segment of 686 M€ and 1,245 M€ for the years ended December 31, 2005 and 2004, respectively (refer to paragraph A(ii)).
Property, plant and equipment revaluation: This line item represents the portion of the Elf and PetroFina purchase price that was allocated to fixed assets. It includes primarily Upstream properties, plant and equipment for which fair market value was determined based on future cash flows generated by proved reserves and risk adjusted probable reserves.
(ii) Business Combinations—Goodwill and Other Intangible Assets
Under U.S. GAAP and effective July 1, 2001, the Group adopted FASB Statement No. 141,“Business Combinations”(“FAS No. 141”) which requires that all business combinations be accounted for under the purchase method of accounting. FAS No. 141 also specifies the types of acquired intangible assets that are required to be recognized and reported separate from goodwill.
Effective January 1, 2002, the Group adopted for U.S. GAAP reporting purposes FASB Statement No. 142“Goodwill and Other Intangible Assets”(“FAS No. 142”) for all acquired goodwill and intangible assets. Under FAS No. 142, goodwill is no longer amortized but is tested for impairment on at least an annual basis. Intangible assets with indefinite lives are also no longer amortized but instead are tested for impairment at least annually. Intangible assets with finite lives are amortized over their estimated useful life. Goodwill acquired after June 30, 2001 has been subject to non-amortization provisions since the acquisition date.
Additionally, goodwill on equity method investments is no longer amortized in U.S. GAAP since January 1, 2002. However it continues to be tested for impairment in accordance with APB No. 18“The Equity Method of Accounting for Investments in Common Stock”. Under IFRS, goodwill amortization ceased from January 1, 2004.
In accordance with FAS No. 142, the impairment test for goodwill involves a two-step process. Step one consists of a comparison of a reporting unit’s fair value to its carrying value, the fair value being the sum of discounted future cash flows generated by the reporting unit. If the carrying value is greater than its fair value, then step two must also be completed. Step two requires a computation of the implied fair value of a reporting unit’s goodwill in comparison to the carrying amount of goodwill. Any excess of the carrying amount of goodwill over its implied fair value must be recorded as an impairment charge. The Group completed the annual goodwill impairment tests required by FAS No. 142 in the fourth quarters of 2004, 2005 and 2006.
As of December 31, 2004 and December 31, 2005, the fair values calculated exceeded their carrying values for all reporting units except in the Chemicals segment. In the Chemicals segment, impairments were triggered by a deterioration in the market conditions for commodity Chemicals. As a result, net impairment charges of 875 M€ and 1,245 M€ were recorded for the years ended December 31, 2005 and December 31, 2004 respectively.
When compared to the charge recorded under IAS 36, this represents additional impairment charges of 825 M€ and 1,245 M€ for 2005 and 2004, respectively, which is detailed as follows:
| | | | | | | | | | | | For the year ended
December 31, | | | (M€) | | 2006 | | 2005 | | | 2004 | | A(i) Business combinations—Acquisition of PetroFina and Elf Aquitaine | | — | | (686 | ) | | (1,245 | ) | A(ii) Business combinations—Goodwill and Other Intangible Assets | | — | | (139 | ) | | — | | Total | | — | | (825 | ) | | (1,245 | ) |
This additional impairment charge is explained by the higher carrying amount of goodwill under U.S.GAAP as compared to IFRS.
There are no other intangible assets with indefinite useful lives and all intangible assets other than goodwill are subject to amortization.
The components of other intangible assets were as follows:
| | | | | | | | | | | | | As of December 31, | | | (M€) | | 2006 | | | 2005 | | | 2004 | | Amortized intangible assets | | | | | | | | | | Gross carrying amount | | 2,386 | | | 2,851 | | | 2,670 | | Accumulated amortization | | (1,776 | ) | | (2,047 | ) | | (1,901 | ) | Total other intangible assets, net | | 610 | | | 804 | | | 769 | |
A summary of changes in the carrying amount of goodwill by business segment for the year ended December 31, 2006 is as follows (net of accumulated amortization):
| | | | | | | | | | | | | (M€) | | As of
January 1, 2006 | | Acquisitions | | Impairment | | Other(a) | | | As of
December 31, 2006 | Upstream | | 15,561 | | — | | — | | (9 | ) | | 15,552 | Downstream | | 11,406 | | 24 | | — | | (15 | ) | | 11,415 | Chemicals | | 2,970 | | 101 | | — | | (160 | ) | | 2,911 | Total | | 29,937 | | 125 | | — | | (184 | ) | | 29,878 |
(a) | The caption “Other” mainly consists of the impact of the foreign currency translation of (62) M€ and the impact of the Arkema spin-off for (106) M€. |
B. Financial Instruments
The difference between U.S. GAAP and IFRS relates to currency and interest rate swaps that were contracted by the Group as part of the issuance of most debenture loans issued to finance the Upstream activity. A significant portion of long-term debentures are issued in, or converted to U.S. dollars as the cash flows of the Upstream activity are mainly denominated in U.S. dollars. Depending on market conditions, debenture loans may be issued in euros or other European currencies at fixed rates which are immediately swapped into U.S. dollar floating rate debt.
Under IFRS, these currency and interest rate swaps qualify as fair value hedges:
of the corresponding debt for their interest rate component,
and of the associated U.S. dollar intercompany loan for their foreign currency component.
Such hedge accounting based on a split of a derivative into several components, is not allowed under FAS No. 133 “Accounting for Derivative Instruments and Hedging Activities”. In addition, these currency and interest rate swaps, which were entered into for hedging purposes do not meet the criteria for classification as hedges under FAS No. 133.
As a consequence, hedge accounting has not been applied to such derivatives in the reconciliation to U.S. GAAP.
C. Impairment of assets
Under IFRS, the Group follows IAS 36 “Impairment of Assets”, whereas under U.S. GAAP, it follows FAS No. 144 “Accounting for the Impairment or Disposal of Long-Lived Assets”. IAS 36 provides for assets to be tested for impairment purposes by comparing the assets’ carrying value with the higher of the fair value less costs to sell or its value in use. The value in use is based on the associated discounted future cash flows.
Under U.S. GAAP, an initial step is required whereby the carrying value is compared with the undiscounted future cash flows. An impairment is recognized only if the carrying value is greater than the undiscounted cash flows.
The different methods under the two standards result in the impairment of certain fixed assets under IFRS but not under U.S. GAAP. As a result, these assets are impaired under IFRS but are still being amortized under U.S. GAAP.
D. Employee benefit obligations
Pursuant to an exemption provided by IFRS 1 “First-time adoption of IFRS”, the Group has elected to record unrecognized actuarial gains and losses as of January 1, 2004 to retained earnings.
Under U.S. GAAP, this exemption is not applicable and generates a difference relating to the amortization of actuarial gains and losses recognized in income.
Under IFRS, in accordance with IAS 19, the Group applies the corridor method to amortize its actuarial gains and losses. The unrecognized gains and losses are amortized over the average expected remaining working lives of the employees participating in the plan.
Under U.S. GAAP, pursuant to the amendment provided by FAS 158 “Employers’ Accounting for Defined Benefit
Pension and Other Postretirement Plans—an amendment of FASB Statements No. 87, 88, 106, and 132(R)”, surpluses and deficits of funded schemes for pension and other post-retirement benefits are recognized as assets and liabilities in the financial statements and changes in that funded status are recognized through comprehensive income in the year in which the changes occur. Therefore, all unrecognized actuarial gains and losses, prior service costs and credits and net transition obligations as well as subsequent changes in the funded status are accounted for as a component of accumulated other comprehensive income, net of tax and are subsequently recognized as a component of net periodic benefit costs in accordance with FAS 87 “Employers’ Accounting for Pensions” and FAS 106 “Employers’ Accounting for Postretirement Benefits other than Pensions”, using the corridor method.
The provisions of FAS 158, which is effective as of December 31, 2006, amend the provisions of FAS 87 “Employers’ Accounting for Pensions” which notably required the recognition of a minimum liability adjustment when a pension plan had an unfunded accumulated benefit obligation.
The effect of the transition from the provisions of FAS 87 and FAS 106 to those of FAS 158, net of tax, is recognized as part of accumulated other comprehensive income as of December 31, 2006 and is reported below:
| | | | | | | | | | | (M€) | | Before Application of
Statement 158 | | | Adjustments | | | After Application of
Statement 158 | | Other non-current assets | | 18,324 | | | 515 | | | 18,839 | | Other non-current liabilities | | 17,161 | | | 1,526 | | | 18,687 | | Accumulated other comprehensive income | | (4,789 | ) | | (1,011 | ) | | (5,800 | ) | Total shareholders’ equity | | 72,895 | | | (1,011 | ) | | 71,884 | |
The estimated amount of actuarial losses, prior service cost and net transition asset that will be recognized as a component of net benefit cost in 2007 is 114 M€.
E. Stock Compensation
For the years ended December 31, 2006 and December 31, 2005
Under IFRS, the Group applies IFRS 2 “Share-based payment” to employee stock options and share purchase plans and to capital increases reserved for employees. The benefits are determined at fair value by reference to the granted instruments. The fair value of the options is calculated using the Black-Scholes method at the grant date. The expense is allocated on a straight-line basis between the grant date and vesting date. The cost of employee-reserved capital increases is immediately expensed.
Under U.S. GAAP, the Group elected to adopt FAS No. 123(R) “Share-Based Payments” on January 1, 2005, using the “modified prospective” method. This is a change in accounting principles as the Group previously accounted for stock-based compensation based on the provisions of APB No. 25. Compensation cost is recognized beginning with the effective date (January 1, 2005) (i) based on the requirements of Statement 123(R) for all share-based payments granted after the effective date and (ii) based on the requirements of Statement 123 for all awards granted to employees prior to the effective date of Statement 123(R) that remain unvested on the effective date.
The respective recognition and measurement provisions of IFRS 2 and FAS No. 123(R) did not generate a reconciling item for the years ended December 31, 2006 and 2005.
For the year ended December 31, 2004
Under IFRS, the Group applied IFRS 2 “Share-based payment” to employee stock option and share purchase plans and to capital increases reserved for employees.
Under U.S. GAAP, the Company elected to continue to account for stock-based compensation based on the provisions of APB No. 25. Compensation cost for share subscription plans, share purchase plans and capital increases reserved to employees, if any, was measured as the excess of the quoted market price of the Company’s stock at the date of grant over the amount an employee must pay to acquire the stock.
F. Trading Inventories
Under IFRS, inventories held by the Group for its energy trading activities are measured at fair value less costs to sell, based on the scope exception provided by paragraph 3 b) of IAS 2 “Inventories” for commodity broker-traders.
Under U.S. GAAP, EITF No.02-3 “Issues involved in Accounting for Derivative Contracts Held for Trading Purposes and Contracts Involved in Energy Trading and Risk Management Activities” prohibits measurement at fair value of physical inventories included in energy trading activities.
G. Tax effect of intercompany transfers
Profits resulting from inter-company transfers of inventories are eliminated from net income and from the carrying value of inventories that remain within the Group.
Under IFRS, a deferred tax asset is recognized for the difference between the new tax basis of the inventories in the buyer’s jurisdiction and their carrying value as reported in the consolidated financial statements. That deferred tax is computed using the buyer’s tax rate.
U.S. GAAP prohibits recognition of such a deferred tax asset, but requires taxes computed and paid by the seller to be deferred and recognized when inventories are sold to a third party.
H. Change in accounting policies
For the year ended December 31, 2005
Under IFRS, the Group has applied the component-based approach of IAS 16 “Property, Plant and Equipment” for tangible assets since January 1, 2004, which resulted in a change in accounting for major turnarounds at refineries and large petrochemical units as compared to the accounting previously applied under
French GAAP. Previously, the Group had accrued these costs in advance but under IAS 16 these costs are capitalized at the time of expenditure and amortized over the period between major turnarounds. This change also leads to the reclassification of the related cash flows from operating to investing activities in the consolidated statement of cash flows. These changes were effective January 1, 2005; thus the 2005 income statement is prepared under the new method. In addition, the 2004 comparatives (previously reported under French GAAP with turnarounds accrued in advance) are also restated to reflect the new accounting method.
Under U.S. GAAP, the Group changed its accounting policy from the accrual method to the built-in overhaul method as of January 1, 2005. The change in accounting represents a change in accounting policy as defined by APB No. 20 “Accounting Changes”, and a cumulative catch-up entry is recorded in the 2005 income statement.
This change primarily concerns the major refineries within the Downstream segment and, to a lesser extent, the petrochemical units within the Chemicals segment.
For the year ended December 31, 2005, the cumulative effect of this change had a positive impact under U.S. GAAP of 333 M€ on income before taxes and 238 M€ on net income.
I. Acquisition of Deer Creek
In 2005, TOTAL acquired 100% of Deer Creek Energy Ltd, a company whose sole asset is an 84% interest in the Joslyn permit in the Athabasca region of the Canadian Province of Alberta. The acquisition cost, net of cash acquired for all shares amounts to 1,104 M€. This cost primarily represents the fair value of the company’s leasehold rights that have been recognized under IFRS as intangible assets for 1,015 M€.
No deferred income tax liability has been recognized for the difference between the fair value of the leasehold rights acquired and their tax value in accordance with paragraph 15 of IAS 12 “Income taxes”.
However, as FAS 109—“Accounting for Income taxes” includes no initial recognition exception, a deferred income tax liability has been recognized in accordance with EITF 98-11 “Accounting for Acquired Temporary Differences in Certain Purchase Transactions That Are Not Accounted For As Business Combinations”.
Under U.S. GAAP, the amounts assigned to the leasehold rights and the related deferred income tax liability at the acquisition date was 1,562 M€ and (547) M€, respectively. This difference in accounting treatment has no impact on net equity.
J. Cumulative translation adjustment
Pursuant to an exemption provided by IFRS 1 “First-time adoption of IFRS”, the Group has elected to offset the cumulative translation adjustment (CTA) against retained earnings, as of January 1, 2004. That reclassification has no impact on shareholders’ equity, net income and their reconciliation to U.S. GAAP.
K. Leasehold rights
Under IAS 16, the Group has reclassified leasehold rights from “Property, plant and equipment” to “Intangible assets” as of January 1, 2004. Under U.S. GAAP, leasehold rights are accounted for as “Property, plant and equipment”, thus generating a classification difference between the IFRS and the U.S. GAAP balance sheet. This classification difference has no impact on the reconciliation of shareholders’ equity between IFRS and U.S. GAAP.
L. Arkema spin-off
The spin-off of Arkema led to the distribution of Arkema shares to TOTAL shareholders (other than TOTAL S.A itself). This operation is analyzed as a distribution of non monetary assets to TOTAL shareholders.
Due to certain U.S. GAAP adjustments described above, the amount of the assets and liabilities which were spun off under U.S. GAAP differs from that under IFRS. These differences have an impact on the reconciliation of
shareholders’ equity between IFRS and U.S. GAAP, which is summarized as follows:
| | | | Earnings per share For the year ended December 31,(M€) | | As of
December 31, 2006 | | Net assets distributed - IFRS
| | (2,254 | )2006 | ImpairmentEarnings per share of assets (C)continuing operations
| | (60 | )5.13 | Employee benefit obligations (D)Earnings per share of discontinued operations
| | (62 | ) | Tax effect of U.S. GAAP adjustments
| | 52 | | Cumulative translation adjustment of U.S. GAAP adjustments
| | 17 | 0.00 | Net assets distributed - U.S. GAAPEarnings per share
| | (2,307 | )5.13 |
In addition, under U.S. GAAP, the spin-off resulted in a reduction of the difference in cumulative translation adjustment between U.S. GAAP and IFRS amounting to (172) M€ and accumulated before January 1, 2004. Under IFRS, this cumulative translation adjustment had been offset against retained earnings as of January 1, 2004 as described in paragraph J. This reduction has no impact on shareholders’ equity and its reconciliation to U.S. GAAP as of December 31, 2006, December 31, 2005 and December 31, 2004.
The spin-off of Arkema was approved at the shareholders’ meeting held on May 12, 2006. Since Arkema’s results for the period between April 1, 2006 and May 12, 2006 were not material, they have only been consolidated up to March, 31, 2006.
Due to certain U.S. GAAP adjustments described above, income from discontinued operations under U.S. GAAP differs from that determined under IFRS:
| | | | | | | | | | | (M€) | | For the year
ended
December 31,
2006 | | | For the year
ended
December 31,
2005 | | | For the year
ended
December 31,
2004 | | Income (loss) from discontinued operations under IFRS | | (5 | ) | | (461 | ) | | (698 | ) | Business combinations - Acquisition of PetroFina and Elf (A)(i) | | — | | | (686 | ) | | (1,245 | ) | Business combinations - Goodwill and Other Intangible Assets (A)(ii) | | — | | | (139 | ) | | — | | Impairment of assets (C) | | (1 | ) | | (7 | ) | | 54 | | Employee benefit obligations (D) | | (3 | ) | | (5 | ) | | (28 | ) | Tax effect of U.S. GAAP adjustments | | 1 | | | 3 | | | (18 | ) | Income (loss) from discontinued operations under U.S. GAAP | | (8 | ) | | (1,295 | ) | | (1,935 | ) |
M. Reconciliation to U.S. GAAP
(i) Net Income and Shareholders’ equity
The following is a summary of the adjustments to net income for the years ended December 31, 2006, December 31, 2005, and December 31, 2004, as well as the shareholders’ equity for the periods ended December 31,2006, December 31, 2005, and December 31, 2004, which would be required if U.S. GAAP had been applied instead of IFRS.
These U.S. GAAP adjustments are presented net of the portion applicable to minority interests.
| | | | | | | | | | | | | Shareholders’ equity | | | | | As of December 31, | | | (M€) | | 2006 | | | 2005 | | | 2004 | | Amounts per accompanying consolidated financial statements | | 40,321 | | | 40,645 | | | 31,608 | | U.S. GAAP adjustments | | | | | | | | | | Increase (decrease) due to: | | | | | | | | | | Equity investees revaluations, net | | 1,550 | | | 1,506 | | | 1,256 | | Goodwill on consolidated companies | | 28,517 | | | 28,517 | | | 29,278 | | Property, plant and equipment revaluation | | 2,939 | | | 3,302 | | | 3,643 | | Total Acquisition of Petrofina and Elf (A)(i) | | 33,006 | | | 33,325 | | | 34,177 | | Business combinations—Goodwill and Other Intangible Assets (A)(ii) | | 404 | | | 407 | | | 537 | | Financial instruments (B) | | (64 | ) | | 200 | | | 296 | | Impairment of assets (C) | | 91 | | | 158 | | | 345 | | Employee benefit obligations (D) | | (597 | ) | | 240 | | | 676 | | Trading inventories (F) | | (18 | ) | | (28 | ) | | — | | Tax effect of intercompany transfers (G) | | 162 | | | — | | | — | | Effect of change in accounting policies (H) | | — | | | — | | | (333 | ) | Other | | — | | | (24 | ) | | 63 | | Tax effect of U.S. GAAP adjustments | | (1,380 | ) | | (1,887 | ) | | (2,238 | ) | Cumulative translation adjustment of U.S. GAAP adjustments | | (41 | ) | | 19 | | | (23 | ) | Amounts under U.S. GAAP | | 71,884 | | | 73,055 | | | 65,108 | |
| | | | | | | | | | | | | Net income | | | | | For the year ended
December 31, | | | (M€) | | 2006 | | | 2005 | | | 2004 | | Amounts per accompanying consolidated financial statements | | 11,768 | | | 12,273 | | | 10,868 | | U.S. GAAP adjustments | | | | | | | | | | Increase (decrease) due to: | | | | | | | | | | Equity investees revaluations, net | | (18 | ) | | 255 | | | (2,130 | ) | Goodwill on consolidated companies(a) | | — | | | (761 | ) | | (1,362 | ) | Property, plant and equipment revaluation | | (365 | ) | | (341 | ) | | (374 | ) | Other purchase accounting adjustments | | — | | | — | | | (23 | ) | Total Acquisition of Petrofina and Elf (A)(i) | | (383 | ) | | (847 | ) | | (3,889 | ) | Business combinations—Goodwill and Other Intangible Assets (A)(ii) | | (3 | ) | | (139 | ) | | — | | Financial instruments (B) | | (221 | ) | | (96 | ) | | (32 | ) | Impairment of assets (C) | | (7 | ) | | (189 | ) | | 70 | | Employee benefit obligations (D) | | (119 | ) | | (182 | ) | | (68 | ) | Stock compensation (E) | | — | | | — | | | 62 | | Trading inventories (F) | | 9 | | | (27 | ) | | — | | Tax effect of intercompany transfers (G) | | 162 | | | — | | | — | | Effect of change in accounting policies (H) | | — | | | 333 | | | — | | Other | | 11 | | | 11 | | | (77 | ) | Tax effect of U.S. GAAP adjustments | | 183 | | | 460 | | | 287 | | Amounts under U.S. GAAP | | 11,400 | | | 11,597 | | | 7,221 | |
(a) | | This caption includes impairment charges recorded inDiluted earnings per share
For the Chemicals segment of 686 M€ and 1,245 M€ for the yearsyear ended December 31, 2005 and 2004, respectively.(€) | | 2006 | Diluted earnings per share of continuing operations | | 5.09 | Diluted earnings per share of discontinued operations | | 0.00 | Diluted earnings per share | | 5.09 |
(ii) | U.S. GAAP Consolidated Statements of Income |
The U.S. GAAP summarized condensed consolidated statements of income for the years ended December 31, 2006, 2005, and 2004 presented below reflect the differences between U.S. GAAP and IFRS discussed above.
| | | | | | | | | | | | | For the year ended
December 31, | | | (M€) | | 2006 | | | 2005 | | | 2004 | | Sales and other income | | 132,689 | | | 117,057 | | | 95,325 | | Total revenues | | 132,689 | | | 117,057 | | | 95,325 | | Crude oil and product purchases | | 83,326 | | | 69,820 | | | 56,019 | | Production, selling, general and administrative expenses | | 18,989 | | | 17,386 | | | 16,652 | | Depreciation, depletion and amortization | | 5,650 | | | 5,722 | | | 5,791 | | Unsuccessful exploration costs | | 634 | | | 431 | | | 414 | | Dividends on subsidiaries’ redeemable preferred shares | | — | | | — | | | 6 | | Interest expense (income), net | | 453 | | | 352 | | | 144 | | Other financial expense (income), net | | 80 | | | (154 | ) | | 16 | | Taxes | | 1,079 | | | 854 | | | 683 | | Total expenses | | 110,211 | | | 94,411 | | | 79,725 | | Earnings from equity interests and affiliates | | 1,923 | | | 1,834 | | | 618 | | Gains (losses) on sales of assets | | 755 | | | 86 | | | 1,583 | | Income before taxes and minority interests | | 25,156 | | | 24,566 | | | 17,801 | | Income taxes | | 13,381 | | | 11,549 | | | 8,372 | | Income from continuing operations | | 11,775 | | | 13,018 | | | 9,429 | | Income (loss) from discontinued operations (Arkema) | | (8 | ) | | (1,295 | ) | | (1,935 | ) | Income before minority interests | | 11,767 | | | 11,723 | | | 7,494 | | Minority interests | | (367 | ) | | (364 | ) | | (273 | ) | Income before cumulative effect of accounting change | | 11,400 | | | 11,359 | | | 7,221 | | Cumulative effect of accounting change, net of tax | | — | | | 238 | | | | | Net income | | 11,400 | | | 11,597 | | | 7,221 | | Basic earnings per share(a) | | | | | | | | | | Net earnings per share from continuing operations | | 4.97 | | | 5.39 | | | 3.79 | | Net earnings (loss) per share from discontinued operations | | — | | | (0.55 | ) | | (0.80 | ) | Net earnings per share before cumulative effect of accounting change | | 4.97 | | | 4.84 | | | 2.99 | | Cumulative effect of accounting change, net of tax | | — | | | 0.10 | | | — | | Net earnings per share—basic(a) | | 4.97 | | | 4.94 | | | 2.99 | | Diluted earnings per share(a) | | | | | | | | | | Net earnings per share from continuing operations | | 4.93 | | | 5.36 | | | 3.78 | | Net earnings (loss) per share from discontinued operations | | — | | | (0.55 | ) | | (0.80 | ) | Net earnings per share before cumulative effect of accounting change | | 4.93 | | | 4.81 | | | 2.98 | | Cumulative effect of accounting change, net of tax | | — | | | 0.10 | | | — | | Net earnings per share—diluted(a) | | 4.93 | | | 4.91 | | | 2.98 | |
(a) | 2005 and 2004 amounts are restated as per the four-for-one stock split that took place on May 18, 2006. |
(iii) | U.S. GAAP Summarized Consolidated Balance Sheets |
The U.S. GAAP summarized condensed consolidated balance sheets as of December 31, 2006, 2005, and 2004 presented below reflect the differences between U.S. GAAP and IFRS discussed above:
| | | | | | | | | | | | | As of December 31, | | | (M€) | | 2006 | | | 2005 | | | 2004 | | Assets | | | | | | | | | | Current assets | | | | | | | | | | Cash and cash equivalents | | 2,493 | | | 4,321 | | | 3,858 | | Accounts receivable | | 17,393 | | | 19,603 | | | 13,987 | | Inventories | | 11,729 | | | 12,662 | | | 9,310 | | Other current assets | | 11,155 | | | 7,145 | | | 5,335 | | Total current assets | | 42,770 | | | 43,731 | | | 32,490 | | Property, plant and equipment, net | | 47,058 | | | 47,131 | | | 40,065 | | Intangibles, net | | 30,488 | | | 30,741 | | | 31,541 | | Other non-current assets | | 18,839 | | | 19,369 | | | 18,141 | | Total assets | | 139,155 | | | 140,972 | | | 122,237 | | Liabilities and shareholders’ equity | | | | | | | | | | Current liabilities | | | | | | | | | | Accounts payable | | 15,080 | | | 16,409 | | | 11,672 | | Other liabilities | | 18,442 | | | 17,030 | | | 14,919 | | Total current liabilities | | 33,522 | | | 33,439 | | | 26,591 | | Non-current liabilities | | | | | | | | | | Non-current debt, net of current portion | | 14,232 | | | 13,573 | | | 11,140 | | Other non-current liabilities | | 18,687 | | | 20,070 | | | 18,753 | | Total non-current liabilities | | 32,919 | | | 33,643 | | | 29,893 | | Minority interests | | 830 | | | 835 | | | 645 | | Shareholders’ equity: | | | | | | | | | | Common shares | | 6,064 | | | 6,151 | | | 6,350 | | Paid-in surplus | | 35,195 | | | 37,072 | | | 40,524 | | Retained earnings | | 42,245 | | | 36,884 | | | 28,756 | | Accumulated other comprehensive income | | (5,800 | ) | | (2,621 | ) | | (5,492 | ) | Treasury shares | | (5,820 | ) | | (4,431 | ) | | (5,030 | ) | Total shareholders’ equity | | 71,884 | | | 73,055 | | | 65,108 | | Total liabilities and shareholders’ equity | | 139,155 | | | 140,972 | | | 122,237 | |
(iv) | Additional information: income taxes |
Breakdown between current and deferred income taxes is as follows:
| | | | | | | | | | | | | For the year ended
December 31, | | | (M€) | | 2006 | | | 2005 | | | 2004 | | Current income taxes | | (12,997 | ) | | (11,362 | ) | | (7,641 | ) | Deferred income taxes | | (384 | ) | | (187 | ) | | (731 | ) | Total | | (13,381 | ) | | (11,549 | ) | | (8,372 | ) |
The components of deferred income tax balances under U.S. GAAP as of December 31, 2006, 2005, and 2004 are as follows:
| | | | | | | | | | | | | For the year ended
December 31, | | | (M€) | | 2006 | | | 2005 | | | 2004 | | Net operating losses and tax credit carryforwards | | 633 | | | 484 | | | 933 | | Employee benefits | | 1,045 | | | 845 | | | 841 | | Other temporarily non-deductible provisions | | 2,319 | | | 2,652 | | | 2,279 | | Gross deferred income tax assets | | 3,997 | | | 3,981 | | | 4,053 | | Valuation allowance | | (572 | ) | | (536 | ) | | (342 | ) | Net deferred income tax assets | | 3,425 | | | 3,445 | | | 3,711 | | Property, plant and equipment | | (10,270 | ) | | (10,012 | ) | | (8,667 | ) | Other temporary tax deductions | | (1,200 | ) | | (1,514 | ) | | (2,007 | ) | Gross deferred income tax liability | | (11,470 | ) | | (11,526 | ) | | (10,674 | ) | Net deferred income tax liabilities | | (8,045 | ) | | (8,081 | ) | | (6,963 | ) |
Analysis of tax items in the U.S. GAAP balance sheet is as follows:
| | | | | | | | | | | | | For the year ended
December 31, | | | (M€) | | 2006 | | | 2005 | | | 2004 | | Non-current deferred income tax assets | | 1,183 | | | 1,303 | | | 1,534 | | Current deferred income tax assets | | 94 | | | 126 | | | 232 | | Non-current deferred income tax liabilities | | (9,192 | ) | | (9,298 | ) | | (8,621 | ) | Current deferred income tax liabilities | | (130 | ) | | (212 | ) | | (108 | ) | Total | | (8,045 | ) | | (8,081 | ) | | (6,963 | ) |
The Company applies for U.S. GAAP purposes FAS No. 130, “Reporting Comprehensive Income”, which requires companies to report all changes in equity during a period, except those resulting from investment by owners and distribution to owners, in a financial statement for the period in which they are recognized. The Company discloses comprehensive income, which encompasses net income, foreign currency translation adjustments, unrealized gains or losses on the Company’s available for sale securities and the minimum pension liability adjustment, in the Consolidated Statement of Shareholders’ Equity.
| | | | | | | | | | | | | | | | | | | | | | | (M€) | | Comprehensive
income | | | Common
shares | | | Paid-in
surplus | | | Retained
earnings | | | Accumulated
other
comprehensive
income | | | Treasury
shares | | | Total
shareholders’
equity | | As of January 1, 2004 | | | | | 6,491 | | | 42,721 | | | 26,047 | | | (4,119 | ) | | (4,613 | ) | | 66,527 | | Net income(a) | | 7,221 | | | | | | | | | 7,221 | | | | | | | | | 7,221 | | Other comprehensive income, net of tax | | | | | | | | | | | | | | | | | | | | | | Unrealized foreign currency translation adjustments | | (1,406 | ) | | | | | | | | | | | | | | | | | | | Realized foreign currency translation adjustments | | — | | | | | | | | | | | | | | | | | | | | Unrealized gains on equity securities | | 48 | | | | | | | | | | | | | | | | | | | | Gains on equity securities included in net income | | (41 | ) | | | | | | | | | | | | | | | | | | | Minimum pension liability adjustment | | 26 | | | | | | | | | | | | | | | | | | | | Other comprehensive income | | (1,373 | ) | | | | | | | | | | | (1,373 | ) | | | | | (1,373 | ) | Comprehensive income | | 5,848 | | | | | | | | | | | | | | | | | | | | Cash dividend | | | | | | | | | | | (4,293 | ) | | | | | | | | (4,293 | ) | Issuances of common shares | | | | | 58 | | | 680 | | | (202 | ) | | | | | | | | 536 | | Stock compensation(a) | | | | | | | | | | | 76 | | | | | | | | | 76 | | Treasury shares(a) | | | | | (199 | ) | | (2,877 | ) | | 14 | | | | | | (417 | ) | | (3,479 | ) | Other | | | | | | | | | | | (107 | ) | | | | | | | | (107 | ) | As of December 31, 2004 | | | | | 6,350 | | | 40,524 | | | 28,756 | | | (5,492 | ) | | (5,030 | ) | | 65,108 | |
(a) | Stock compensation cost and elimination of gains on treasury shares are reflected in net income above. |
| | | | | | | | | | | | | | | | | | | | | | | (M€) | | Comprehensive
income | | | Common
shares | | | Paid-in
surplus | | | Retained
earnings | | | Accumulated
other
comprehensive
income | | | Treasury
shares | | | Total
shareholders’
equity | | As of January 1, 2005 | | | | | 6,350 | | | 40,524 | | | 28,756 | | | (5,492 | ) | | (5,030 | ) | | 65,108 | | Net income(a) | | 11,597 | | | | | | | | | 11,597 | | | | | | | | | 11,597 | | Other comprehensive income, net of tax | | | | | | | | | | | | | | | | | | | | | | Unrealized foreign currency translation adjustments | | 2,892 | | | | | | | | | | | | | | | | | | | | Realized foreign currency translation adjustments | | — | | | | | | | | | | | | | | | | | | | | Unrealized gains on equity securities | | 140 | | | | | | | | | | | | | | | | | | | | Gains on equity securities included in net income | | — | | | | | | | | | | | | | | | | | | | | Minimum pension liability adjustment | | (161 | ) | | | | | | | | | | | | | | | | | | | Other comprehensive income | | 2,871 | | | | | | | | | | | | 2,871 | | | | | | 2,871 | | Comprehensive income | | 14,468 | | | | | | | | | | | | | | | | | | | | Cash dividend | | | | | | | | | | | (3,510 | ) | | | | | | | | (3,510 | ) | Issuances of common shares | | | | | 12 | | | 195 | | | (107 | ) | | | | | | | | 100 | | Stock compensation(a) | | | | | | | | | | | 131 | | | | | | | | | 131 | | Treasury shares(a) | | | | | (211 | ) | | (3,647 | ) | | 34 | | | | | | 599 | | | (3,225 | ) | Other | | | | | | | | | | | (17 | ) | | | | | | | | (17 | ) | As of December 31, 2005 | | | | | 6,151 | | | 37,072 | | | 36,884 | | | (2,621 | ) | | (4,431 | ) | | 73,055 | |
(a) | Stock compensation cost and elimination of gains on treasury shares are reflected in net income above. |
| | | | | | | | | | | | | | | | | | | | | | | (M€) | | Comprehensive
income | | | Common
shares | | | Paid-in
surplus | | | Retained
earnings | | | Accumulated
other
comprehensive
income | | | Treasury
shares | | | Total
shareholders’
equity | | As of January 1, 2006 | | | | | 6,151 | | | 37,072 | | | 36,884 | | | (2,621 | ) | | (4,431 | ) | | 73,055 | | Net income(a) | | 11,400 | | | | | | | | | 11,400 | | | | | | | | | 11,400 | | Other comprehensive income, net of tax | | | | | | | | | | | | | | | | | | | | | | Unrealized foreign currency translation adjustments | | (2,686 | ) | | | | | | | | | | | | | | | | | | | Realized foreign currency translation adjustments | | 7 | | | | | | | | | | | | | | | | | | | | Unrealized gains on equity securities | | 104 | | | | | | | | | | | | | | | | | | | | Gains on equity securities included in net income | | (214 | ) | | | | | | | | | | | | | | | | | | | Minimum pension liability adjustment | | 621 | | | | | | | | | | | | | | | | | | | | Other comprehensive income | | (2,168 | ) | | | | | | | | | | | (2,168 | ) | | | | | (2,168 | ) | Comprehensive income | | 9,232 | | | | | | | | | | | | | | | | | | | | Cash dividend | | | | | | | | | | | (3,999 | ) | | | | | | | | (3,999 | ) | Issuances of common shares | | | | | 30 | | | 480 | | | (11 | ) | | | | | | | | 499 | | Adjustment to initially apply FAS 158, net of tax | | | | | | | | | | | | | | (1,011 | ) | | | | | (1,011 | ) | Minimum liability adjustment reversal: 452 | | | | | | | | | | | | | | | | | | | | | | Recognition of net actuarial gain (losses) and prior service credit (cost) on pension and other benefits: (1,463) | | | | | | | | | | | | | | | | | | | | | | Stock compensation(a) | | | | | | | | | | | 157 | | | | | | | | | 157 | | Treasury shares(a) | | | | | (117 | ) | | (2,341 | ) | | | | | | | | (1,405 | ) | | (3,863 | ) | Arkema spin-off | | | | | | | | (16 | ) | | (2,307 | ) | | | | | 16 | | | (2,307 | ) | Other | | | | | | | | | | | 121 | | | | | | | | | 121 | | As of December 31, 2006 | | | | | 6,064 | | | 35,195 | | | 42,245 | | | (5,800 | ) | | (5,820 | ) | | 71,884 | |
(a) | Stock compensation cost and elimination of gains on treasury shares are reflected in net income above. |
Disclosure of Accumulated Other Comprehensive Income Balances
The components of accumulated other comprehensive income (loss) balances are as follows:
| | | | | | | | | | | | | | | | | | | | | | | | | | | | | | | | | | | As of December 31, | | | | | 2006 | | | | | 2005 | | | | | 2004 | | | (M€) | | Pre-tax
Amount | | | Tax Exp.
(Credit) | | | Net
Amount | | | | | Pre-tax
Amount | | | Tax Exp.
(Credit) | | | Net
Amount | | | | | Pre-tax
Amount | | | Tax Exp.
(Credit) | | | Net
Amount | | Net foreign currency translation adjustments | | (4,507 | ) | | — | | | (4,507 | ) | | | | (1,828 | ) | | — | | | (1,828 | ) | | | | (4,720 | ) | | — | | | (4,720 | ) | Net unrealized gain (loss) | | 183 | | | (13 | ) | | 170 | | | | | 360 | | | (80 | ) | | 280 | | | | | 163 | | | (23 | ) | | 140 | | Minimum pension liability adjustment | | — | | | — | | | — | | | | | (1,624 | ) | | 551 | | | (1,073 | ) | | | | (1,353 | ) | | 441 | | | (912 | ) | Net actuarial gain (loss) and prior service credit (cost) on pension and other benefits | | (2,230 | ) | | 767 | | | (1,463 | ) | | | | | | | | | | | | | | | | | | | | | | | Accumulated other comprehensive (loss) income | | (6,554 | ) | | 754 | | | (5,800 | ) | | | | (3,092 | ) | | 471 | | | (2,621 | ) | | | | (5,910 | ) | | 418 | | | (5,492 | ) |
(vi)Gains on equity securities
Gross realized gains and gross realized losses on sales of available-for-sale securities were:
| | | | | | | | | | | | As of December 31, | | | (M€) | | 2006 | | | 2005 | | 2004 | | Gross realized gains | | 477 | | | 46 | | 105 | | Gross realized losses | | (6 | ) | | — | | (19 | ) |
The carrying amount of available-for-sale securities and their approximate fair value were as follows:
| | | | | | | | | | (M€) | | Cost | | Gross
Unrealized
Gains | | Gross
Unrealized
Losses | | Fair
Value | As of December 31, 2004 | | 126 | | 151 | | – | | 277 | As of December 31, 2005 | | 121 | | 348 | | — | | 469 | As of December 31, 2006 | | 86 | | 218 | | — | | 304 |
N. Accounting for exploratory drilling costs
In April 2005, the FASB issued a FASB Staff PositionFSP FAS 19-1, “Accounting for suspended well costs” to amend FAS No. 19 “Financial Accounting and Reporting by Oil and Gas Producing Companies”. The FSP is compatible with the IFRS accounting principles applied by TOTAL.
The FSP provides for continued capitalization of exploratory drilling costs past one year if a company is making sufficient progress on assessing the reserves and the economic and operating viability of the project. The FSP also provides certain disclosure requirements with respect to capitalized exploratory drilling costs.
As of January 1, 2005, TOTAL adopted FASB Staff Position FAS 19-1, “Accounting for Suspended Well Costs”. There were no capitalized exploratory well costs charged to expense upon the adoption of FSP 19-1.
When a discovery is made, exploratory drilling costs continue to be capitalized pending determination of whether potentially economic oil and gas reserves have been discovered by the drilling effort. The length of time necessary for this determination depends on the specific technical or economic difficulties in assessing the recoverability of the reserves. If a determination is made that the well did not encounter oil and gas in economically viable quantities, the well costs are expensed and are reported in exploration expense.
Exploratory drilling costs are temporarily capitalized pending determination of whether the well has found proved reserves if both of the following conditions are met:
The well has found a sufficient quantity of reserves to justify, if appropriate, its completion as a producing well, assuming that the required capital expenditure is made; and
Satisfactory progress toward ultimate development of the reserves is being achieved, with the Company making sufficient progress assessing the reserves and the economic and operating viability of the project.
The Company evaluates the progress made on the basis of regular project reviews which take into account the following factors:
First, if additional exploratory drilling or other exploratory activities (such as seismic work or
| other significant studies) are either underway or firmly planned, the Company deems there is satisfactory progress. For these purposes, exploratory activities are considered firmly planned only if they are included in the Company’s three-year exploration plan/budget. At December 31, 2006, the Company had capitalized 342 M€ of exploratory drilling costs on this basis, as further set forth below.
|
In cases where exploratory activity has been completed, the evaluation of satisfactory progress takes into account indicators such as the fact that costs for development studies are incurred in the current period, or that governmental or other third-party authorizations are pending or that the availability of capacity on an existing transport or processing facility awaits confirmation. At December 31, 2006, exploratory drilling costs capitalized on this basis amounted to 77 M€ and mainly related to three projects, as further describe below.
Capitalized exploratory costs
The following table sets forth the net changes in capitalized exploratory costs for 2006, 2005 and 2004:
| | | | | | | | | | | (M€) | | 2006 | | | 2005 | | | 2004 | | Beginning Balance | | 590 | | | 430 | | | 422 | | Additions pending determination of proved reserves | | 569 | | | 192 | | | 269 | | Amounts previously capitalized and expensed during the year | | (67 | ) | | (65 | ) | | (40 | ) | Amounts transferred to Development | | (127 | ) | | (22 | ) | | (196 | ) | Foreign exchange changes | | (73 | ) | | 55 | | | (25 | ) | Ending balance | | 892 | | | 590 | | | 430 | |
The following table sets forth a breakdown of capitalized exploratory costs at year end 2006, 2005 and 2004 by category of exploratory activity:
| | | | | | | | As of December 31,(M€) | | 2006 | | 2005 | | 2004 | Projects with recent or planned exploratory activity | | 815 | | 482 | | 389 | Wells for which drilling is not completed | | 132 | | 63 | | 91 | Wells with drilling in past 12 months | | 341 | | 200 | | 126 | Wells with future exploratory activity firmly planned(a) | | 342 | | 219 | | 172 | future exploratory drilling planned | | 248 | | 156 | | 148 | other exploratory activity planned(b) | | 94 | | 63 | | 24 | Projects with completed exploratory activity | | 77 | | 108 | | 41 | Projects not requiring major capital expenditures | | — | | — | | — | Projects requiring major capital expenditures | | 77 | | 108 | | 41 | Total | | 892 | | 590 | | 430 | Number of wells at end of year | | 117 | | 85 | | 56 |
(a) | All projects included in this line require major capital expenditures. |
(b) | At the end of 2006, this relates to six wells whose continuing capitalization is justified by firmly planned seismic activity for two wells (subject to the completion of legislative ratification of contracts regarding one well) and significant studies for the remaining four wells. |
At the end of 2006, there was no amount of capitalized exploratory drilling cost that was associated with areas not requiring major capital expenditures before production could begin, where more than one year had elapsed since the completion of drilling.
At the end of 2006, an amount of 77 M€ was associated with suspended wells in areas where major capital expenditures will be required and no future exploratory activity is firmly planned. This amount corresponds to seven projects (20 wells) and is mainly associated to the projects further described below:
The first project (Usan) relates to a deepwater oil discovery in Nigeria for which eight wells were drilled between 2001 and 2005 and 27 M€ were capitalised as at December 31, 2006. These exploration works allowed the Group to launch several development engineering studies in 2005 that went on in 2006. The state-owned oil company, NNPC, has approved a development plan based on the construction of a Floating Production Storage and Offloading (FPSO) facility for which a call for tenders was issued. Contractor bids are currently being evaluated.
The second project (Laggan) relates to a deepwater gas discovery in the UK (west of the Shetland Islands), for which one well has been drilled in 2004 for a capitalised amount of 17 M€ as at December 31, 2006. In 2006 TOTAL and its partners continued geoscience studies required for the definition of the field development concept and the appraisal of potential new exploration areas. A task force was created with the neighbouring permits operators in order to promote a global development strategy for the area.
The third project (Bonga SW) relates to a deepwater oil discovery in Nigeria for which three wells were drilled between 2001 and 2003 and for which 7 M€ were capitalized as at December 31, 2006. During 2006, together with operator and co-venturers, the Group worked on the elaboration of a field development plan and pursued negotiations aiming at possible unitization of the field with adjacent licenses. This led to the signature of a “pre-unitization” agreement with partners in 2006.
| | | | | | | | | | | | | As of December 31, (M€ and number of wells) | | 2006 | | 2005 | | 2004 | | | amount | | number | | amount | | number | | amount | | number | Wells for which drilling is not completed | | 132 | | 19 | | 63 | | 12 | | 91 | | 13 | Wells with completed drilling | | | | | | | | | | | | | Less than 1 year | | 341 | | 39 | | 200 | | 29 | | 126 | | 12 | Between 1 and 4 years | | 392 | | 53 | | 304 | | 40 | | 198 | | 29 | Between 4 years and 8 years | | 19 | | 4 | | 23 | | 4 | | 15 | | 2 | More than 8 years | | 8 | | 2 | | — | | — | | — | | — | Total | | 892 | | 117 | | 590 | | 85 | | 430 | | 56 |
O. Impact of New U.S. GAAP Accounting Standards
(i) Accounting for Certain Hybrid Financial Instruments
FAS No. 155 "Accounting for Certain Hybrid Financial Instruments, an amendment of FASB Statements No. 133 and No. 140" was issued in February 2006 and is effective for all financial instruments acquired, issued, or subject to a remeasurement event occurring after the beginning of an entity's first fiscal year that begins after September 15,2006. FAS No.155 provides entity with relief from having to separately determine the fair value of an embedded derivative that would otherwise be required to be bifurcated from its host contract in accordance with FAS No. 133. FAS No. 155 allows an entity to make an irrevocable election to measure such hybrid financial instrument at fair value in its entirety with changes in fair value recognized in earnings.
The adoption of FAS No. 155 will have no material effect on the Group's earnings and shareholder's equity, as determined under U.S GAAP.
(ii) Accounting for Servicing of Financial Assets
FAS No. 156 "Accounting for Servicing of Financial Assets, an amendment of FASB Statements No. 140" was issued in March 2006 and is effective prospectively to all transactions occurring after the beginning of an entity's first fiscal year that begins after September 15, 2006. FAS No. 156 requires that an entity separately recognize a servicing asset or a servicing liability when it undertakes an obligation to service a financial asset under a servicing contract in certain situations.
The adoption of FAS No. 156 will have no material effect on the Group's earnings and shareholder's equity, as determined under U.S GAAP.
(iii) Fair Value Measurements
FAS No. 157 “Fair Value Measurements” was issued in September 2006 and is effective prospectively for fiscal years beginning after November 15, 2007. FAS No. 157 provides a single definition of fair value, together with a
framework for measuring it, and requires additional disclosure about the use of fair value to measure assets and liabilities. The statement also sets out a fair value hierarchy.
The adoption of FAS No. 157 is not expected to have significant effect on the Group's earnings and shareholder's equity, as determined under U.S GAAP.
(iv) Accounting for Defined Benefit Pension and Other Postretirement Plans
FAS No. 158 “Employer’s Accounting for Defined Benefit Pension and Other Postretirement Plans—an amendment of FASB Statements No.87, 88, 106, 132(R)”, was issued in September 2006 and is effective for fiscal years ending after December 15,2006. FAS No. 158 requires a full recognition of the plan overfunded or underfunded status of its benefit plans in the balance sheet. Therefore, unrecognized actuarial gain and loss and prior service costs and credits need to be recognized in Other Comprehensive Income and are “recycled” to the income statement based on current amortization and recognition criteria. In addition, the statement also required a company to measure its plan assets and benefit obligations as of its year-end balance sheet date.
The provision to require measurement at the company’s entity’s balance sheet date will be effective for fiscal years ending after December 15, 2008.The adoption of the provisions of FAS No. 158 relating to the measurement date will have no material effect on the Group's earnings and shareholder's equity, as determined under U.S GAAP.
(v) FASB Interpretation No. 48, “Accounting for Uncertainty in Income Taxes”—an interpretation of FASB Statement No. 109
On July 2006, the FASB issued FIN No. 48 which is effective for fiscal years beginning after December 15, 2006, and should be applied to all tax positions upon initial adoption. FIN No. 48 clarifies the accounting for income taxes by prescribing a “more-likely-than-not” recognition threshold a tax position is required to meet before being recognized in the financial statements.
Once the recognition threshold has been met, FIN No. 48 requires to recognize the largest amount of tax benefit that is greater than 50 percent likely of being realized upon ultimate settlement with the taxing authority.
The Interpretation also requires making explicit disclosures about uncertainties in Company's income tax positions.
The adoption of FIN No. 48 is not expected to have significant effect on the Group's earnings and shareholder's equity, as determined under U.S GAAP.
(vi) Planned Major Maintenance Activities
On September 2006, the FASB issued FSP No. AUG AIR-1 “Accounting for Planned Major Maintenance Activities” which is effective for the fiscal year beginning after December 15, 2006 and should be applied retrospectively. The FSP prohibits the use of the accrue-in advance method of accounting for planned major maintenance activities. It continues to permit the application of the other three alternative methods of accounting for planned major maintenance activities: direct expense, built-in overhaul, and deferral.
The adoption of the FSP No. AUG AIR-1 will have no material effect on the Group's earnings and shareholder's equity, as determined under U.S GAAP, as the Group already applies the built-in overhaul method as described in paragraph H of this Note.
(vii) Fair Value Option for Financial Assets and Financial Liabilities
FAS No. 159 “The Fair Value Option for Financial Assets and Financial Liabilities” was issued in February 2007 and is effective as of the beginning of the first fiscal year that begins after November 15, 2007. FAS No. 159 offers an irrevocable option to carry the vast majority of financial assets and liabilities at fair value, with changes in fair value recorded in earnings. The adoption of FAS No. 159 is not expected to have significant effect on the Group's earnings and shareholder's equity, as determined under U.S. GAAP.
TOTAL35) CONSOLIDATION SCOPE
SCHEDULE II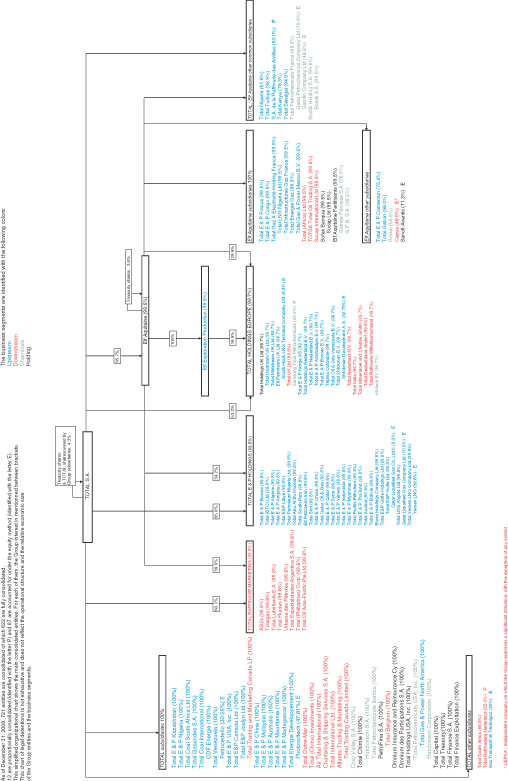
VALUATION AND QUALIFYING ACCOUNTS
| | | | | | | | | | | | | (M€) | | Balance at
beginning of
period | | Charged
to other
accounts(a) | | | Charged to
costs and
expenses | | Deductions(b) | | Balance at
end of
period | VALUATION AND QUALIFYING ACCOUNTS DEDUCTED FROM THE RELATED ASSETS ACCOUNTS | | | | | | | | | | | | 2006 | | | | | | | | | | | | Investments and other non-current assets(c) | | 1,405 | | (91 | ) | | 61 | | 219 | | 1,156 | Inventories | | 413 | | (91 | ) | | 118 | | — | | 440 | Accounts receivable | | 562 | | (66 | ) | | — | | 7 | | 489 | Other current assets | | 63 | | (24 | ) | | — | | — | | 39 | Total | | 2,443 | | (272 | ) | | 179 | | 226 | | 2,124 | 2005 | | | | | | | | | | | | Investments and other non-current assets(c) | | 1,416 | | 39 | | | 48 | | 98 | | 1,405 | Inventories | | 394 | | 31 | | | — | | 12 | | 413 | Accounts receivable | | 488 | | 37 | | | 37 | | — | | 562 | Other current assets | | 37 | | 27 | | | — | | 1 | | 63 | Total | | 2,335 | | 134 | | | 85 | | 111 | | 2,443 | 2004 | | | | | | | | | | | | Investments and other non-current assets(3) | | 1,334 | | 129 | | | 51 | | 98 | | 1,416 | Inventories | | 305 | | 49 | | | 40 | | — | | 394 | Accounts receivable | | 518 | | (18 | ) | | — | | 13 | | 487 | Other current assets | | 42 | | (2 | ) | | — | | 2 | | 38 | Total | | 2,199 | | 158 | | | 91 | | 113 | | 2,335 | | | | | | | LONG-TERM LIABILITIES | | | | | | | | | | | | 2006 | | | | | | | | | | | | Employee benefits | | 3,413 | | (490 | ) | | 359 | | 509 | | 2,773 | Other liabilities and deferred income taxes | | 13,715 | | (1,395 | ) | | 1,884 | | 886 | | 13,318 | Total | | 17,128 | | (1,885 | ) | | 2,243 | | 1,395 | | 16,091 | 2005 | | | | | | | | | | | | Employee benefits | | 3,607 | | 9 | | | 305 | | 508 | | 3,413 | Other liabilities and deferred income taxes | | 12,390 | | 888 | | | 2,319 | | 1,882 | | 13,715 | Total | | 15,997 | | 897 | | | 2,624 | | 2,390 | | 17,128 | 2004 | | | | | | | | | | | | Employee benefits | | 3,816 | | (17 | ) | | 442 | | 634 | | 3,607 | Other liabilities and deferred income taxes | | 11,555 | | 142 | | | 2,306 | | 1,613 | | 12,390 | Total | | 15,371 | | 125 | | | 2,748 | | 2,247 | | 15,997 |
(a) | Amounts charged to other accounts include (i) currency translation adjustments and (ii) the impact of the Arkema spin-off. |
(b) | Deductions correspond to (i) amounts reversed into income, which offset charges for which the reserves were created and (ii) adjustments to deferred income tax assets and liabilities. |
(c) | The breakdown between investments and other non-current assets is as follows: |
| | | | | | | | | | As of December 31, | | (M€) | | 2006 | | 2005 | | 2004 | Investments | | 668 | | 821 | | 809 | Other non-current assets | | 488 | | 584 | | 607 | | | | 1,156 | | 1,405 | | 1,416 |
TOTAL SUPPLEMENTAL OIL AND GAS INFORMATION (Unaudited) Information shown in the following tables is presented in accordance with Statement of Financial Accounting Standards No. 69 (FAS No. 69, “Disclosures About Oil and Gas Producing Activities”). As explained in Note 34 to the Consolidated Financial Statements (“Summary of Differences Between Accounting Principles followed by the Company and United States Generally Accepted Accounting Principles”), the consolidated financial statements have been prepared in accordance with IFRS, which differ in certain respects from those applicable in the United States of America (“U.S. GAAP”).
The acquisitions of Petrofina and Elf Aquitaine that were originally accounted for as pooling-of-interests in accordance with French GAAP, have not been restated under IFRS, pursuant to an exemption provided by IFRS 1 “First-time adoption of International Financial Reporting Standards.” Under U.S. GAAP, the acquisitions of PetroFina and Elf Aquitaine do not qualify as pooling-of-interests and therefore would have been accounted for as purchases.
Under IFRS, the Group follows IAS36 “Impairment of Assets”, whereas under U.S. GAAP, it follows FAS No. 144 “Accounting for the Impairment or Disposal of Long-Lived Assets”. Pursuant to an exemption provided by IFRS 1 “First-time adoption of IFRS”, the Group has elected to record unrecognized actuarial gains and losses as of January 1, 2004 to retained earnings. Under
U.S. GAAP, this exemption is not applicable and generates a difference relating to the amortization of actuarial gains and losses recognized in income.
Therefore, the FAS No. 69 disclosures, which are based on the Company’s primary financial statements prepared in accordance with IFRS, have been supplemented with an additional set of tables derived from U.S. GAAP figures.
For more detail about the differences between the accounting principles followed by the Company and United States Generally Accepted Accounting Principles, see Note 34 to the Consolidated Financial Statements (“Summary of Differences Between Accounting Principles followed by the Company and United States Generally Accepted Accounting Principles”) included elsewhere herein.
Capitalized costs
Capitalized costs represent the amounts of capitalized proved and unproved property costs, including support equipment and facilities, along with the related accumulated depreciation, depletion and amortization.
The following tables present details of capitalized costs related to the Group’s oil and gas exploration and production activities as of the dates and on the basis indicated.
| | | | | | | | | | | | | | | | | | | | | | Consolidated subsidiaries | | | (M€) | | Europe | | | Africa | | | North America | | | Asia | | | Rest of World | | | Total | | IFRS basis | | | | | | | | | | | | | | | | | | | December 31, 2006 | | | | | | | | | | | | | | | | | | | Proved properties | | 28,217 | | | 19,569 | | | 1,884 | | | 3,678 | | | 9,861 | | | 63,209 | | Unproved properties | | 89 | | | 807 | | | 193 | | | 243 | | | 181 | | | 1,513 | | Total capitalized costs | | 28,306 | | | 20,376 | | | 2,077 | | | 3,921 | | | 10,042 | | | 64,722 | | Accumulated depreciation | | (20,456 | ) | | (11,271 | ) | | (553 | ) | | (1,588 | ) | | (4,604 | ) | | (38,472 | ) | Net capitalized costs | | 7,850 | | | 9,105 | | | 1,524 | | | 2,333 | | | 5,438 | | | 26,250 | | Company’s share of equity affiliates’ net capitalized costs | | | | | 321 | | | | | | | | | 1,331 | | | 1,652 | | December 31, 2005 | | | | | | | | | | | | | | | | | | | Proved properties | | 26,922 | | | 19,227 | | | 2,209 | | | 3,524 | | | 9,825 | | | 61,707 | | Unproved properties | | 63 | | | 731 | | | 110 | | | 14 | | | 133 | | | 1,051 | | Total capitalized costs | | 26,985 | | | 19,958 | | | 2,319 | | | 3,538 | | | 9,958 | | | 62,758 | | Accumulated depreciation | | (19,190 | ) | | (11,708 | ) | | (1,216 | ) | | (1,453 | ) | | (4,646 | ) | | (38,213 | ) | Net capitalized costs | | 7,795 | | | 8,250 | | | 1,103 | | | 2,085 | | | 5,312 | | | 24,545 | | Company’s share of equity affiliates’ net capitalized costs | | | | | 296 | | | | | | | | | 409 | | | 705 | | December 31, 2004 | | | | | | | | | | | | | | | | | | | Proved properties | | 25,035 | | | 16,206 | | | 1,551 | | | 2,605 | | | 7,509 | | | 52,906 | | Unproved properties | | 51 | | | 544 | | | 113 | | | 17 | | | 104 | | | 829 | | Total capitalized costs | | 25,086 | | | 16,750 | | | 1,664 | | | 2,622 | | | 7,613 | | | 53,735 | | Accumulated depreciation | | (17,512 | ) | | (10,385 | ) | | (881 | ) | | (1,010 | ) | | (3,567 | ) | | (33,355 | ) | Net capitalized costs | | 7,574 | | | 6,365 | | | 783 | | | 1,612 | | | 4,046 | | | 20,380 | | Company’s share of equity affiliates’ net capitalized costs | | | | | 214 | | | | | | | | | 501 | | | 715 | | | | | | | | | U.S. GAAP basis | | | | | | | | | | | | | | | | | | | December 31, 2006 | | | | | | | | | | | | | | | | | | | Proved properties | | 30,971 | | | 21,429 | | | 1,994 | | | 3,678 | | | 9,861 | | | 67,933 | | Unproved properties | | 89 | | | 807 | | | 193 | | | 243 | | | 181 | | | 1,513 | | Total capitalized costs | | 31,060 | | | 22,236 | | | 2,187 | | | 3,921 | | | 10,042 | | | 69,446 | | Accumulated depreciation | | (21,758 | ) | | (11,839 | ) | | (657 | ) | | (1,588 | ) | | (4,604 | ) | | (40,446 | ) | Net capitalized costs | | 9,302 | | | 10,397 | | | 1,530 | | | 2,333 | | | 5,438 | | | 29,000 | | Company’s share of equity affiliates’ net capitalized costs | | | | | 321 | | | | | | | | | 1,331 | | | 1,652 | | December 31, 2005 | | | | | | | | | | | | | | | | | | | Proved properties | | 29,685 | | | 21,087 | | | 2,370 | | | 3,524 | | | 9,825 | | | 66,491 | | Unproved properties | | 63 | | | 731 | | | 110 | | | 14 | | | 133 | | | 1,051 | | Total capitalized costs | | 29,748 | | | 21,818 | | | 2,480 | | | 3,538 | | | 9,958 | | | 67,542 | | Accumulated depreciation | | (20,343 | ) | | (12,194 | ) | | (1,320 | ) | | (1,453 | ) | | (4,646 | ) | | (39,956 | ) | Net capitalized costs | | 9,405 | | | 9,624 | | | 1,160 | | | 2,085 | | | 5,312 | | | 27,586 | | Company’s share of equity affiliates’ net capitalized costs | | | | | 296 | | | | | | | | | 409 | | | 705 | | December 31, 2004 | | | | | | | | | | | | | | | | | | | Proved properties | | 27,798 | | | 18,146 | | | 1,712 | | | 2,605 | | | 7,540 | | | 57,801 | | Unproved properties | | 51 | | | 544 | | | 113 | | | 17 | | | 104 | | | 829 | | Total capitalized costs | | 27,849 | | | 18,690 | | | 1,825 | | | 2,622 | | | 7,644 | | | 58,630 | | Accumulated depreciation | | (18,492 | ) | | (10,774 | ) | | (970 | ) | | (1,012 | ) | | (3,457 | ) | | (34,705 | ) | Net capitalized costs | | 9,357 | | | 7,916 | | | 855 | | | 1,610 | | | 4,187 | | | 23,925 | | Company’s share of equity affiliates’ net capitalized costs | | | | | 214 | | | | | | | | | 501 | | | 715 | |
Costs incurred
The tables below present the costs incurred in the Group’s oil and gas property acquisition, exploration and development activities, including both capitalized and expensed amounts.
| | | | | | | | | | | | | | | | Consolidated subsidiaries | | (M€) | | Europe | | Africa | | North
America | | Asia | | Rest of
World | | Total | IFRS and U.S. GAAP basis | | | | | | | | | | | | | December 31, 2006 | | | | | | | | | | | | | Proved property acquisition | | 58 | | 3 | | 125 | | — | | 53 | | 239 | Unproved property acquisition | | — | | 20 | | 31 | | 240 | | 11 | | 302 | Exploration costs | | 229 | | 538 | | 112 | | 69 | | 204 | | 1,152 | Development costs(a) | | 1,284 | | 2,272 | | 403 | | 544 | | 1,251 | | 5,754 | | | | | | | | Total costs incurred | | 1,571 | | 2,833 | | 671 | | 853 | | 1,519 | | 7,447 | | | | | | | | December 31, 2005 | | | | | | | | | | | | | Proved property acquisition | | — | | 25 | | 17 | | — | | 74 | | 116 | Unproved property acquisition | | — | | 56 | | 3 | | — | | — | | 59 | Exploration costs | | 108 | | 298 | | 39 | | 15 | | 125 | | 585 | Development costs(a) | | 1,201 | | 1,907 | | 338 | | 491 | | 1,232 | | 5,169 | | | | | | | | Total costs incurred | | 1,309 | | 2,286 | | 397 | | 506 | | 1,431 | | 5,929 | | | | | | | | December 31, 2004 | | | | | | | | | | | | | Proved property acquisition | | — | | 2 | | — | | — | | 29 | | 31 | Unproved property acquisition | | — | | — | | 5 | | 3 | | — | | 8 | Exploration costs | | 99 | | 279 | | 94 | | 29 | | 142 | | 643 | Development costs(a) | | 1,084 | | 1,588 | | 203 | | 379 | | 874 | | 4,128 | | | | | | | | Total costs incurred | | 1,183 | | 1,869 | | 302 | | 411 | | 1,045 | | 4,810 |
(a) | Including asset retirement costs capitalized during the year and any gain or losses recognized upon settlement of asset retirement obligations during the year. |
Group’s share of equity affiliates’ costs of property acquisition, exploration and development:
| | | | | | | | | | | December 31, 2006 | | 71 | | | | | | 716 | | 787 | December 31, 2005 | | 45 | | | | | | 145 | | 190 | December 31, 2004 | | 56 | | | | | | 184 | | 240 |
Costs to develop Proved Undeveloped Reserves
The following table presents the amounts spent to develop the proved undeveloped reserves in 2004, 2005 and 2006, as well as the amounts included in the most recent standardized measure of future net cash flows to develop proved undeveloped reserves in each of the next three years.
| | | | | | | | | | | | | | | | | (M€) | | 2004 | | 2005 | | 2006 | | 2007 | | | 2008 | | | 2009 | | Costs to develop Proved Undeveloped Reserves (consolidated subsidiaries) | | 3,567 | | 4,751 | | 5,128 | | 6,064 | (a) | | 5,583 | (a) | | 3,796 | (a) |
Results of operations of oil and gas producing activities
The following tables include revenues and expenses associated directly with the Group’s oil and gas producing activities. They do not include any interest costs.
| | | | | | | | | | | | | | | | | | | | | | Consolidated subsidiaries | | | (M€) | | Europe | | | Africa | | | North
America | | | Asia | | | Rest of
World | | | Total | | IFRS basis | | | | | | | | | | | | | | | | | | | Year ended December 31, 2006 | | | | | | | | | | | | | | | | | | | Revenues | | | | | | | | | | | | | | | | | | | Sales to unaffiliated parties | | 3,285 | | | 2,550 | | | 1 | | | 2,276 | | | 2,457 | | | 10,569 | | Transfers to affiliated parties | | 7,333 | | | 8,179 | | | 167 | | | 374 | | | 1,124 | | | 17,177 | | Total Revenues | | 10,618 | | | 10,729 | | | 168 | | | 2,650 | | | 3,581 | | | 27,746 | | Production costs | | (910 | ) | | (731 | ) | | (57 | ) | | (184 | ) | | (307 | ) | | (2,189 | ) | Exploration expenses | | (140 | ) | | (246 | ) | | (40 | ) | | (58 | ) | | (149 | ) | | (633 | ) | Depreciation, depletion and amortization and valuation allowances | | (1,256 | ) | | (844 | ) | | (78 | ) | | (301 | ) | | (519 | ) | | (2,998 | ) | Other expenses(a) | | (227 | ) | | (1,274 | ) | | (3 | ) | | (25 | ) | | (881 | ) | | (2,410 | ) | Pretax income from producing activities | | 8,085 | | | 7,634 | | | (10 | ) | | 2,082 | | | 1,725 | | | 19,516 | | Income tax | | (5,115 | ) | | (5,335 | ) | | (14 | ) | | (1,008 | ) | | (803 | ) | | (12,275 | ) | Results of oil and gas producing activities | | 2,970 | | | 2,299 | | | (24 | ) | | 1,074 | | | 922 | | | 7,241 | | | | | | | | | Year ended December 31, 2005 | | | | | | | | | | | | | | | | | | | Revenues | | | | | | | | | | | | | | | | | | | Sales to unaffiliated parties | | 2,384 | | | 1,911 | | | 22 | | | 1,767 | | | 2,594 | | | 8,678 | | Transfers to affiliated parties | | 6,629 | | | 8,080 | | | 474 | | | 340 | | | 924 | | | 16,447 | | Total Revenues | | 9,013 | | | 9,991 | | | 496 | | | 2,107 | | | 3,518 | | | 25,125 | | Production costs | | (851 | ) | | (605 | ) | | (43 | ) | | (173 | ) | | (285 | ) | | (1,957 | ) | Exploration expenses | | (85 | ) | | (148 | ) | | (46 | ) | | (20 | ) | | (132 | ) | | (431 | ) | Depreciation, depletion and amortization and valuation allowances | | (1,164 | ) | | (851 | ) | | (184 | ) | | (273 | ) | | (543 | ) | | (3,015 | ) | Other expenses(a) | | (207 | ) | | (1,052 | ) | | (9 | ) | | (20 | ) | | (680 | ) | | (1,968 | ) | Pretax income from producing activities | | 6,706 | | | 7,335 | | | 214 | | | 1,621 | | | 1,878 | | | 17,754 | | Income tax | | (4,089 | ) | | (5,056 | ) | | (88 | ) | | (773 | ) | | (731 | ) | | (10,737 | ) | Results of oil and gas producing activities | | 2,617 | | | 2,279 | | | 126 | | | 848 | | | 1,147 | | | 7,017 | | | | | | | | | Year ended December 31, 2004 | | | | | | | | | | | | | | | | | | | Revenues | | | | | | | | | | | | | | | | | | | Sales to unaffiliated parties | | 2,027 | | | 1,163 | | | 40 | | | 1,446 | | | 1,820 | | | 6,496 | | Transfers to affiliated parties | | 4,917 | | | 6,081 | | | 548 | | | 250 | | | 645 | | | 12,441 | | Total Revenues | | 6,944 | | | 7,244 | | | 588 | | | 1,696 | | | 2,465 | | | 18,937 | | Production costs | | (783 | ) | | (578 | ) | | (49 | ) | | (162 | ) | | (248 | ) | | (1,820 | ) | Exploration expenses | | (40 | ) | | (146 | ) | | (90 | ) | | (31 | ) | | (107 | ) | | (414 | ) | Depreciation, depletion and amortization and valuation allowances | | (1,190 | ) | | (829 | ) | | (245 | ) | | (252 | ) | | (486 | ) | | (3,002 | ) | Other expenses(a) | | (176 | ) | | (764 | ) | | (5 | ) | | (15 | ) | | (288 | ) | | (1,248 | ) | Pretax income from producing activities | | 4,755 | | | 4,927 | | | 199 | | | 1,236 | | | 1,336 | | | 12,453 | | Income tax | | (2,700 | ) | | (3,233 | ) | | (88 | ) | | (591 | ) | | (250 | ) | | (6,862 | ) | Results of oil and gas producing activities | | 2,055 | | | 1,694 | | | 111 | | | 645 | | | 1,086 | | | 5,591 | |
(a) | Including production taxes and FAS No. 143 accretion expense (137 M€ in 2004, 146 M€ in 2005, 162 M€ in 2006). |
Group’s share of equity affiliates’ results of oil and gas producing activities:
| | | | | | | | | December 31, 2006 | | 125 | | | | 257 | | 382 | December 31, 2005 | | 113 | | | | 166 | | 279 | December 31, 2004 | | 80 | | | | 200 | | 280 |
| | | | | | | | | | | | | | | | | | | | | | Consolidated subsidiaries | | | (M€) | | Europe | | | Africa | | | North
America | | | Asia | | | Rest of
World | | | Total | | U.S. GAAP basis | | | | | | | | | | | | | | | | | | | | | | | | | | Year ended December 31, 2006 | | | | | | | | | | | | | | | | | | | Revenues | | | | | | | | | | | | | | | | | | | Sales to unaffiliated parties | | 3,285 | | | 2,550 | | | 1 | | | 2,276 | | | 2,457 | | | 10,569 | | Transfers to affiliated parties | | 7,333 | | | 8,179 | | | 167 | | | 374 | | | 1,124 | | | 17,177 | | Total Revenues | | 10,618 | | | 10,729 | | | 168 | | | 2,650 | | | 3,581 | | | 27,746 | | Production costs | | (910 | ) | | (731 | ) | | (57 | ) | | (184 | ) | | (307 | ) | | (2,189 | ) | Exploration expenses | | (140 | ) | | (246 | ) | | (40 | ) | | (58 | ) | | (149 | ) | | (633 | ) | Depreciation, depletion and amortization and valuation allowances | | (1,407 | ) | | (924 | ) | | (78 | ) | | (301 | ) | | (519 | ) | | (3,229 | ) | Other expenses(a) | | (227 | ) | | (1,274 | ) | | (3 | ) | | (25 | ) | | (881 | ) | | (2,410 | ) | Pretax income from producing activities | | 7,934 | | | 7,554 | | | (10 | ) | | 2,082 | | | 1,725 | | | 19,285 | | Income tax | | (5,131 | ) | | (5,290 | ) | | 6 | | | (1,008 | ) | | (802 | ) | | (12,225 | ) | Results of oil and gas producing activities | | 2,803 | | | 2,264 | | | (4 | ) | | 1,074 | | | 923 | | | 7,060 | | | | | | | | | Year ended December 31, 2005 | | | | | | | | | | | | | | | | | | | Revenues | | | | | | | | | | | | | | | | | | | Sales to unaffiliated parties | | 2,384 | | | 1,911 | | | 22 | | | 1,767 | | | 2,594 | | | 8,678 | | Transfers to affiliated parties | | 6,629 | | | 8,080 | | | 474 | | | 340 | | | 924 | | | 16,447 | | Total Revenues | | 9,013 | | | 9,991 | | | 496 | | | 2,107 | | | 3,518 | | | 25,125 | | Production costs | | (851 | ) | | (605 | ) | | (43 | ) | | (173 | ) | | (285 | ) | | (1,957 | ) | Exploration expenses | | (85 | ) | | (148 | ) | | (46 | ) | | (20 | ) | | (132 | ) | | (431 | ) | Depreciation, depletion and amortization and valuation allowances | | (1,358 | ) | | (974 | ) | | (199 | ) | | (273 | ) | | (677 | ) | | (3,481 | ) | Other expenses(a) | | (207 | ) | | (1,052 | ) | | (9 | ) | | (20 | ) | | (680 | ) | | (1,968 | ) | Pretax income from producing activities | | 6,512 | | | 7,212 | | | 199 | | | 1,621 | | | 1,744 | | | 17,288 | | Income tax | | (3,990 | ) | | (5,011 | ) | | (83 | ) | | (773 | ) | | (712 | ) | | (10,569 | ) | Results of oil and gas producing activities | | 2,522 | | | 2,201 | | | 116 | | | 848 | | | 1,032 | | | 6,719 | | | | | | | | | Year ended December 31, 2004 | | | | | | | | | | | | | | | | | | | Revenues | | | | | | | | | | | | | | | | | | | Sales to unaffiliated parties | | 2,027 | | | 1,163 | | | 40 | | | 1,446 | | | 1,820 | | | 6,496 | | Transfers to affiliated parties | | 4,917 | | | 6,081 | | | 548 | | | 250 | | | 645 | | | 12,441 | | Total Revenues | | 6,944 | | | 7,244 | | | 588 | | | 1,696 | | | 2,465 | | | 18,937 | | Production costs | | (787 | ) | | (578 | ) | | (49 | ) | | (162 | ) | | (247 | ) | | (1,823 | ) | Exploration expenses | | (40 | ) | | (146 | ) | | (90 | ) | | (31 | ) | | (107 | ) | | (414 | ) | Depreciation, depletion and amortization and valuation allowances | | (1,403 | ) | | (925 | ) | | (255 | ) | | (252 | ) | | (507 | ) | | (3,342 | ) | Other expenses(a) | | (176 | ) | | (764 | ) | | (5 | ) | | (15 | ) | | (288 | ) | | (1,248 | ) | Pretax income from producing activities | | 4,538 | | | 4,831 | | | 189 | | | 1,236 | | | 1,316 | | | 12,110 | | Income tax | | (2,574 | ) | | (3,179 | ) | | (81 | ) | | (591 | ) | | (247 | ) | | (6,672 | ) | Results of oil and gas producing activities | | 1,964 | | | 1,652 | | | 108 | | | 645 | | | 1,069 | | | 5,438 | |
(a) | Including production taxes and FAS No. 143 accretion expense (137 M€ in 2004, 146 M€ in 2005,162 M€ in 2006). |
Group’s share of equity affiliates’ results of oil and gas producing activities:
| | | | | | | | | December 31, 2006 | | 125 | | | | 257 | | 382 | December 31, 2005 | | 113 | | | | 166 | | 279 | December 31, 2004 | | 80 | | | | 200 | | 280 |
Oil and gas reserves The following tables present, for crude oil, condensates and natural gas liquids reserves and for natural gas reserves, an estimate of the Group’s oil and gas quantities by geographical areas atas of December 31, 2006, 20052008, 2007 and 2004.2006. Quantities shown concern: concern proved developed and undeveloped reserves together with changes in quantities for 2006, 20052008, 2007 and 2004.2006. proved developed reserves.
The definitions used for proved oil and gas reserves, proved developed oil and gas reserves and proved undeveloped reserves are in accordance with the applicable U.S.United States Securities & Exchange Commission (SEC) regulation, Rule 4-10 of Regulation S-X. Proved reserves are estimated using geological and engineering data to determine with reasonable certainty whether the crude oil or natural gas in known reservoirs is recoverable under existing economic and operating conditions. This process involves making subjective judgments; consequently, judgments. Consequently, estimates of reserves are not exact measurements and are subject to revision. The reserve estimates shown below do not include quantities that may or may not be produced, due to changes in economic conditions or pursuant to new technologies. For additional information on TOTAL’s reserves estimation process, see “Item 4. Information on the Company—Company — Exploration & Production—Production — Reserves” included elsewhere herein.. The percentage of proved developed reserves has remained relatively stable over the past fivethree years, indicating that proved reserves are consistently moved from undeveloped to developed status. Over time, undeveloped reserves will be reclassified to the developed category as new wells are drilled, existing wells are recompleted and/or facilities to produce from existing and future wells are installed. Major development projects typically take two to four years from the time of recording proved reserves to the start of production from these reserves. Estimated proved reserves of crude oil and natural gas The following tables reflect the estimated proved reserves of crude oil and natural gas as of December 31, 2004, 20052006, 2007 and 2006,2008, and the changes therein. | | | | Crude Oil, Condensate and Natural Gas Liquids (Mb) | | | Crude Oil, Condensate and Natural Gas Liquids (Mb) | | | | | Europe | | Africa | | North
America | | Asia | | Rest of
World | | Total | | Equity
Affiliates and Non-
Consolidated | | | Europe | | Africa | | North America | | Asia-
Pacific | | Rest of World(a) | | Total | | Equity Affiliates and Non- Consolidated | | Balance as of January 1, 2004 | | 1,073 | | | 2,948 | | | 99 | | | 79 | | | 1,952 | | | 6,151 | | | 1,172 | | | Revisions of previous estimates | | 93 | | | (26 | ) | | (13 | ) | | 11 | | | (119 | ) | | (54 | ) | | (15 | ) | | Extensions, discoveries and other | | 43 | | | 46 | | | — | | | — | | | 227 | | | 316 | | | 61 | | | Acquisitions of reserves in place | | 12 | | | — | | | — | | | — | | | — | | | 12 | | | — | | | Sales of reserves in place | | (1 | ) | | (18 | ) | | — | | | — | | | — | | | (19 | ) | | — | | | Production for the year | | (154 | ) | | (255 | ) | | (6 | ) | | (11 | ) | | (91 | ) | | (517 | ) | | (104 | ) | | Balance as of December 31, 2004 | | 1,066 | | | 2,695 | | | 80 | | | 79 | | | 1,969 | | | 5,889 | | | 1,114 | | | Revisions of previous estimates | | 32 | | | (15 | ) | | 96 | | | (7 | ) | | 6 | | | 112 | | | (4 | ) | | Extensions, discoveries and other | | 23 | | | 21 | | | — | | | — | | | — | | | 44 | | | — | | | Acquisitions of reserves in place | | — | | | 7 | | | 58 | | | — | | | — | | | 65 | | | — | | | Sales of reserves in place | | — | | | — | | | — | | | — | | | (36 | ) | | (36 | ) | | — | | | Production for the year | | (143 | ) | | (245 | ) | | (3 | ) | | (10 | ) | | (91 | ) | | (492 | ) | | (100 | ) | | Balance as of December 31, 2005 | | 978 | | | 2,463 | | | 231 | | | 62 | | | 1,848 | | | 5,582 | | | 1,010 | | | Balance as of January 1, 2006 | | | 978 | | | 2,463 | | | 231 | | | 62 | | | 1,848 | | | 5,582 | | | 1,010 | | Revisions of previous estimates | | 40 | | | 146 | | | 1 | | | 6 | | | 65 | | | 258 | | | 4 | | | 40 | | | 146 | | | 1 | | | 6 | | | 65 | | | 258 | | | 4 | | Extensions, discoveries and other | | 13 | | | 113 | | | — | | | — | | | — | | | 126 | | | 60 | | | 13 | | | 113 | | | — | | | — | | | — | | | 126 | | | 60 | | Acquisitions of reserves in place | | — | | | — | | | 22 | | | — | | | — | | | 22 | | | 3 | | | — | | | — | | | 22 | | | — | | | — | | | 22 | | | 3 | | Sales of reserves in place | | (6 | ) | | — | | | (2 | ) | | — | | | (21 | ) | | (29 | ) | | (16 | ) | | (6 | ) | | — | | | (2 | ) | | — | | | (21 | ) | | (29 | ) | | (16 | ) | Production for the year | | (132 | ) | | (220 | ) | | (2 | ) | | (11 | ) | | (78 | ) | | (443 | ) | | (106 | ) | | (132 | ) | | (220 | ) | | (2 | ) | | (11 | ) | | (78 | ) | | (443 | ) | | (106 | ) | Balance as of December 31, 2006 | | 893 | | | 2,502 | | | 250 | | | 57 | | | 1,814 | | | 5,516 | | | 955 | | | 893 | | | 2,502 | | | 250 | | | 57 | | | 1,814 | | | 5,516 | | | 955 | | Revisions of previous estimates | | | 108 | | | 149 | | | (4 | ) | | (1 | ) | | (550 | ) | | (298 | ) | | 525 | | Extensions, discoveries and other | | | 4 | | | 90 | | | 2 | | | 6 | | | 1 | | | 103 | | | 7 | | Acquisitions of reserves in place | | | — | | | — | | | — | | | — | | | — | | | — | | | — | | Sales of reserves in place | | | (3 | ) | | (2 | ) | | (6 | ) | | — | | | (459 | ) | | (470 | ) | | (9 | ) | Production for the year | | | (122 | ) | | (241 | ) | | (5 | ) | | (10 | ) | | (77 | ) | | (455 | ) | | (96 | ) | Balance as of December 31, 2007 | | | 880 | | | 2,498 | | | 237 | | | 52 | | | 729 | | | 4,396 | | | 1,382 | | Revisions of previous estimates | | | 15 | | | 297 | | | (32 | ) | | 21 | | | 112 | | | 413 | | | 21 | | Extensions, discoveries and other | | | 12 | | | 107 | | | — | | | 3 | | | — | | | 122 | | | 3 | | Acquisitions of reserves in place | | | 2 | | | — | | | — | | | — | | | — | | | 2 | | | 6 | | Sales of reserves in place | | | — | | | (74 | ) | | — | | | — | | | (43 | ) | | (117 | ) | | — | | Production for the year | | | (111 | ) | | (231 | ) | | (4 | ) | | (10 | ) | | (50 | ) | | (406 | ) | | (127 | ) | Balance as of December 31, 2008 | | | 798 | | | 2,597 | | | 201 | | | 66 | | | 748 | | | 4,410 | | | 1,285 | | | | Minority interests in proved developed and undeveloped reserves as of (Mb): | Minority interests in proved developed and undeveloped reserves as of (Mb): | | Minority interests in proved developed and undeveloped reserves as of (Mb): | | | December 31, 2004 | | 22 | | | | | 80 | | | — | | | — | | | — | | | 102 | | | December 31, 2005 | | 19 | | | | | 77 | | | — | | | — | | | — | | | 96 | | | December 31, 2006 | | 17 | | | | | 82 | | | — | | | — | | | — | | | 99 | | | 17 | | | 82 | | | — | | | — | | | — | | | 99 | | | | December 31, 2007 | | | 15 | | | 116 | | | — | | | — | | | — | | | 131 | | | | December 31, 2008 | | | 12 | | | 89 | | | — | | | — | | | — | | | 101 | | | | | | Proved developed and undeveloped reserves of equity and non-consolidated affiliates as of (Mb): | Proved developed and undeveloped reserves of equity and non-consolidated affiliates as of (Mb): | | Proved developed and undeveloped reserves of equity and non-consolidated affiliates as of (Mb): | | | December 31, 2004 | | | | | | 73 | | | | | | | 1,041 | | | 1,114 | | | December 31, 2005 | | | | | | 59 | | | | | | | 951 | | | 1,010 | | | December 31, 2006 | | | | | | 56 | | | | | | | 899 | | | 955 | | | — | | | 56 | | | — | | | — | | | 899 | | | | | 955 | | December 31, 2007 | | | — | | �� | 43 | | | — | | | — | | | 1,339 | | | | | 1,382 | | December 31, 2008 | | | — | | | 58 | | | — | | | — | | | 1,227 | | | | | 1,285 | | | | Proved developed reserves as of (Mb): | Proved developed reserves as of (Mb): | | Proved developed reserves as of (Mb): | | | December 31, 2004 | | 734 | | | 1,351 | | | 15 | | | 48 | | | 477 | | | 2,625 | | | 772 | | | December 31, 2005 | | 692 | | | 1,318 | | | 13 | | | 44 | | | 423 | | | 2,490 | | | 709 | | | December 31, 2006 | | 629 | | | 1,436 | | | 19 | | | 40 | | | 418 | | | 2,542 | | | 665 | | | 629 | | | 1,436 | | | 19 | | | 40 | | | 418 | | | 2,542 | | | 665 | | December 31, 2007 | | | 560 | | | 1,389 | | | 25 | | | 33 | | | 253 | | | 2,260 | | | 735 | | December 31, 2008 | | | 516 | | | 1,313 | | | 10 | | | 34 | | | 278 | | | 2,151 | | | 651 | | | | Proved developed reserves of equity and non-consolidated affiliates as of (Mb): | Proved developed reserves of equity and non-consolidated affiliates as of (Mb): | | Proved developed reserves of equity and non-consolidated affiliates as of (Mb): | | | December 31, 2004 | | | | | | 67 | | | | | | | 705 | | | 772 | | | December 31, 2005 | | | | | | 51 | | | | | | | 658 | | | 709 | | | December 31, 2006 | | | | | | 49 | | | | | | | 616 | | | 665 | | | — | | | 49 | | | — | | | — | | | 616 | | | | | 665 | | December 31, 2007 | | | — | | | 30 | | | — | | | — | | | 705 | | | | | 735 | | December 31, 2008 | | | — | | | 44 | | | — | | | — | | | 607 | | | | | 651 | |
| (a) | Including the Middle East. |
| | | | Natural Gas (Bcf) | | | Natural Gas (Bcf) | | | | | Europe | | Africa | | North
America | | Asia | | Rest of
World | | Total | | Equity
Affiliates and Non-
Consolidated | | | Europe | | Africa | | North America | | Asia-
Pacific | | Rest of World(a) | | Total | | Equity Affiliates and Non- Consolidated | | Balance as of January 1, 2004 | | 6,571 | | | 3,603 | | | 466 | | | 5,309 | | | 4,726 | | | 20,675 | | | 1,592 | | | Revisions of previous estimates | | 84 | | | 609 | | | (91 | ) | | (137 | ) | | 355 | | | 820 | | | 65 | | | Extensions, discoveries and other | | 148 | | | 728 | | | — | | | 18 | | | 450 | | | 1,344 | | | 63 | | | Acquisitions of reserves in place | | 68 | | | — | | | — | | | — | | | — | | | 68 | | | — | | | Sales of reserves in place | | (44 | ) | | — | | | (7 | ) | | — | | | — | | | (51 | ) | | — | | | Production for the year | | (812 | ) | | (161 | ) | | (88 | ) | | (448 | ) | | (188 | ) | | (1,697 | ) | | (94 | ) | | Balance as of December 31, 2004 | | 6,015 | | | 4,779 | | | 280 | | | 4,742 | | | 5,343 | | | 21,159 | | | 1,626 | | | Revisions of previous estimates | | 383 | | | 141 | | | 8 | | | (227 | ) | | 240 | | | 545 | | | (7 | ) | | Extensions, discoveries and other | | 145 | | | 27 | | | — | | | — | | | 43 | | | 215 | | | 2,954 | | | Acquisitions of reserves in place | | — | | | 3 | | | — | | | — | | | — | | | 3 | | | — | | | Sales of reserves in place | | — | | | — | | | — | | | — | | | — | | | — | | | — | | | Production for the year | | (753 | ) | | (152 | ) | | (64 | ) | | (458 | ) | | (225 | ) | | (1,652 | ) | | (93 | ) | | Balance as of December 31, 2005 | | 5,790 | | | 4,798 | | | 224 | | | 4,057 | | | 5,401 | | | 20,270 | | | 4,480 | | | Balance as of January 1st, 2006 | | | 5,790 | | | 4,798 | | | 224 | | | 4,057 | | | 5,401 | | | 20,270 | | | 4,480 | | Revisions of previous estimates | | 127 | | | 133 | | | (8 | ) | | 116 | | | (106 | ) | | 262 | | | (9 | ) | | 127 | | | 133 | | | (8 | ) | | 116 | | | (106 | ) | | 262 | | | (9 | ) | Extensions, discoveries and other | | 283 | | | 32 | | | — | | | — | | | — | | | 315 | | | 2,105 | | | 283 | | | 32 | | | — | | | — | | | — | | | 315 | | | 2,105 | | Acquisitions of reserves in place | | — | | | — | | | 12 | | | — | | | — | | | 12 | | | 1 | | | — | | | — | | | 12 | | | — | | | — | | | 12 | | | 1 | | Sales of reserves in place | | (31 | ) | | — | | | (160 | ) | | — | | | (1 | ) | | (192 | ) | | — | | | (31 | ) | | — | | | (160 | ) | | — | | | (1 | ) | | (192 | ) | | — | | Production for the year | | (717 | ) | | (176 | ) | | (16 | ) | | (470 | ) | | (222 | ) | | (1,601 | ) | | (104 | ) | | (717 | ) | | (176 | ) | | (16 | ) | | (470 | ) | | (222 | ) | | (1,601 | ) | | (104 | ) | Balance as of December 31, 2006 | | 5,452 | | | 4,787 | | | 52 | | | 3,703 | | | 5,072 | | | 19,066 | | | 6,473 | | | 5,452 | | | 4,787 | | | 52 | | | 3,703 | | | 5,072 | | | 19,066 | | | 6,473 | | Revisions of previous estimates | | | 487 | | | 805 | | | 2 | | | (61 | ) | | (95 | ) | | 1,138 | | | 155 | | Extensions, discoveries and other | | | 265 | | | 12 | | | 3 | | | 263 | | | — | | | 543 | | | 126 | | Acquisitions of reserves in place | | | — | | | — | | | — | | | — | | | — | | | — | | | — | | Sales of reserves in place | | | — | | | (1 | ) | | — | | | — | | | — | | | (1 | ) | | (4 | ) | Production for the year | | | (673 | ) | | (232 | ) | | (12 | ) | | (470 | ) | | (276 | ) | | (1,663 | ) | | (103 | ) | Balance as of December 31, 2007 | | | 5,531 | | | 5,371 | | | 45 | | | 3,435 | | | 4,701 | | | 19,083 | | | 6,647 | | Revisions of previous estimates | | | 145 | | | 381 | | | (17 | ) | | 415 | | | 726 | | | 1,650 | | | (13 | ) | Extensions, discoveries and other | | | 377 | | | 17 | | | — | | | 90 | | | — | | | 484 | | | 76 | | Acquisitions of reserves in place | | | 76 | | | — | | | — | | | — | | | — | | | 76 | | | — | | Sales of reserves in place | | | — | | | — | | | — | | | — | | | (15 | ) | | (15 | ) | | — | | Production for the year | | | (622 | ) | | (240 | ) | | (6 | ) | | (453 | ) | | (340 | ) | | (1,661 | ) | | (109 | ) | Balance as of December 31, 2008 | | | 5,507 | | | 5,529 | | | 22 | | | 3,487 | | | 5,072 | | | 19,617 | | | 6,601 | | | Minority interests in proved developed and undeveloped reserves as of (Bcf): | | Minority interests in proved developed and undeveloped reserves as of (Bcf): | | | | | | | | December 31, 2006 | | | 92 | | | 88 | | | — | | | — | | | — | | | 180 | | | | December 31, 2007 | | | 80 | | | 111 | | | — | | | — | | | — | | | 191 | | | | December 31, 2008 | | | 75 | | | 64 | | | — | | | — | | | — | | | 139 | | | | | | Proved developed and undeveloped reserves of equity and non-consolidated affiliates as of (Bcf): | | Proved developed and undeveloped reserves of equity and non-consolidated affiliates as of (Bcf): | | | | December 31, 2006 | | | — | | | 20 | | | — | | | — | | | 6,453 | | | | | 6,473 | | December 31, 2007 | | | — | | | 140 | | | — | | | — | | | 6,507 | | | | | 6,647 | | December 31, 2008 | | | — | | | 215 | | | — | | | — | | | 6,386 | | | | | 6,601 | | | | Proved developed reserves as of (Bcf): | | | | | | | | | | | | | | | | December 31, 2006 | | | 3,632 | | | 2,643 | | | 39 | | | 2,592 | | | 2,395 | | | 11,301 | | | 1,331 | | December 31, 2007 | | | 3,602 | | | 2,560 | | | 30 | | | 2,221 | | | 3,427 | | | 11,840 | | | 1,267 | | December 31, 2008 | | | 3,989 | | | 2,280 | | | 8 | | | 2,180 | | | 3,825 | | | 12,282 | | | 1,181 | | | Proved developed reserves of equity and non-consolidated affiliates as of (Bcf): | | Proved developed reserves of equity and non-consolidated affiliates as of (Bcf): | | | | | | December 31, 2006 | | | — | | | 20 | | | — | | | — | | | 1,311 | | | | | 1,331 | | December 31, 2007 | | | — | | | 14 | | | — | | | — | | | 1,253 | | | | | 1,267 | | December 31, 2008 | | | — | | | 12 | | | — | | | — | | | 1,169 | | | | | 1,181 | |
Minority interests
| (a) | Including the Middle East. |
Results of operations of oil and gas producing activities The following tables include revenues and expenses associated directly with the Group’s oil and gas producing activities. They do not include any interest costs. | | | | | | | | | | | | | | | | | | | | | | Consolidated subsidiaries | | | (M€) | | Europe | | | Africa | | | North
America | | | Asia-
Pacific | | | Rest of
World(a) | | | Total | | Year ended December 31, 2008 | | | | | | | | | | | | | | | | | | | Revenues | | | | | | | | | | | | | | | | | | | Sales to unaffiliated parties | | 4,521 | | | 2,930 | | | 94 | | | 2,785 | | | 2,205 | | | 12,535 | | Transfers to affiliated parties | | 6,310 | | | 11,425 | | | 89 | | | 403 | | | 903 | | | 19,130 | | Total Revenues | | 10,831 | | | 14,355 | | | 183 | | | 3,188 | | | 3,108 | | | 31,665 | | Production costs | | (1,280 | ) | | (1,055 | ) | | (117 | ) | | (210 | ) | | (398 | ) | | (3,060 | ) | Exploration expenses | | (185 | ) | | (209 | ) | | (99 | ) | | (156 | ) | | (115 | ) | | (764 | ) | Depreciation, depletion and amortization and valuation allowances | | (1,266 | ) | | (1,195 | ) | | (239 | ) | | (422 | ) | | (492 | ) | | (3,614 | ) | Other expenses(b) | | (260 | ) | | (1,214 | ) | | (3 | ) | | (34 | ) | | (605 | ) | | (2,116 | ) | Pretax income from producing activities | | 7,840 | | | 10,682 | | | (275 | ) | | 2,366 | | | 1,498 | | | 22,111 | | Income tax | | (5,376 | ) | | (7,160 | ) | | 74 | | | (1,199 | ) | | (677 | ) | | (14,338 | ) | Results of oil and gas producing activities | | 2,464 | | | 3,522 | | | (201 | ) | | 1,167 | | | 821 | | | 7,773 | | | | | | | | | Year ended December 31, 2007 | | | | | | | | | | | | | | | | | | | Revenues | | | | | | | | | | | | | | | | | | | Sales to unaffiliated parties | | 3,715 | | | 2,497 | | | — | | | 2,123 | | | 3,076 | | | 11,411 | | Transfers to affiliated parties | | 5,484 | | | 9,724 | | | 247 | | | 384 | | | 665 | | | 16,504 | | Total Revenues | | 9,199 | | | 12,221 | | | 247 | | | 2,507 | | | 3,741 | | | 27,915 | | Production costs | | (1,102 | ) | | (906 | ) | | (100 | ) | | (195 | ) | | (385 | ) | | (2,688 | ) | Exploration expenses | | (113 | ) | | (480 | ) | | (49 | ) | | (54 | ) | | (180 | ) | | (876 | ) | Depreciation, depletion and amortization and valuation allowances | | (1,287 | ) | | (932 | ) | | (136 | ) | | (340 | ) | | (616 | ) | | (3,311 | ) | Other expenses(b) | | (244 | ) | | (1,238 | ) | | — | | | (26 | ) | | (841 | ) | | (2,349 | ) | Pretax income from producing activities | | 6,453 | | | 8,665 | | | (38 | ) | | 1,892 | | | 1,719 | | | 18,691 | | Income tax | | (4,180 | ) | | (5,772 | ) | | 24 | | | (915 | ) | | (1,040 | ) | | (11,883 | ) | Results of oil and gas producing activities | | 2,273 | | | 2,893 | | | (14 | ) | | 977 | | | 679 | | | 6,808 | | | | | | | | | Year ended December 31, 2006 | | | | | | | | | | | | | | | | | | | Revenues | | | | | | | | | | | | | | | | | | | Sales to unaffiliated parties | | 3,285 | | | 2,550 | | | 1 | | | 2,276 | | | 2,457 | | | 10,569 | | Transfers to affiliated parties | | 7,333 | | | 8,179 | | | 167 | | | 374 | | | 1,124 | | | 17,177 | | Total Revenues | | 10,618 | | | 10,729 | | | 168 | | | 2,650 | | | 3,581 | | | 27,746 | | Production costs | | (910 | ) | | (731 | ) | | (57 | ) | | (184 | ) | | (307 | ) | | (2,189 | ) | Exploration expenses | | (140 | ) | | (246 | ) | | (40 | ) | | (58 | ) | | (149 | ) | | (633 | ) | Depreciation, depletion and amortization and valuation allowances | | (1,256 | ) | | (844 | ) | | (78 | ) | | (301 | ) | | (519 | ) | | (2,998 | ) | Other expenses(b) | | (227 | ) | | (1,274 | ) | | (3 | ) | | (25 | ) | | (881 | ) | | (2,410 | ) | Pretax income from producing activities | | 8,085 | | | 7,634 | | | (10 | ) | | 2,082 | | | 1,725 | | | 19,516 | | Income tax | | (5,115 | ) | | (5,335 | ) | | (14 | ) | | (1,008 | ) | | (803 | ) | | (12,275 | ) | Results of oil and gas producing activities | | 2,970 | | | 2,299 | | | (24 | ) | | 1,074 | | | 922 | | | 7,241 | |
| (a) | Including the Middle East. |
| (b) | Including production taxes and IAS 37 accretion expense (162 M€ in 2006, 169 M€ in 2007 and 223 M€ in 2008). |
Group’s share of equity affiliates’ results of oil and gas producing activities: | | | | | | | | | | | | | December 31, 2008 | | — | | 49 | | — | | — | | 532 | | 581 | December 31, 2007 | | — | | 95 | | — | | — | | 179 | | 274 | December 31, 2006 | | — | | 125 | | — | | — | | 257 | | 382 |
Costs incurred The tables below present the costs incurred in the Group’s oil and gas property acquisition, exploration and development activities, including both capitalized and expensed amounts. | | | | | | | | | | | | | | | | Consolidated subsidiaries | | (M€) | | Europe | | Africa | | North
America | | Asia- Pacific | | Rest of World(a) | | Total | December 31, 2008 | | | | | | | | | | | | | Proved property acquisition | | 269 | | 78 | | — | | — | | 26 | | 373 | Unproved property acquisition | | 24 | | 143 | | 19 | | 3 | | 8 | | 197 | Exploration costs | | 228 | | 493 | | 109 | | 222 | | 147 | | 1,199 | Development costs(b) | | 2,035 | | 3,121 | | 320 | | 689 | | 1,276 | | 7,441 | | | | | | | | Total costs incurred | | 2,556 | | 3,835 | | 448 | | 914 | | 1,457 | | 9,210 | | | | | | | | December 31, 2007 | | | | | | | | | | | | | Proved property acquisition | | — | | 50 | | — | | 1 | | 10 | | 61 | Unproved property acquisition | | — | | 265 | | 9 | | 18 | | 10 | | 302 | Exploration costs | | 230 | | 586 | | 49 | | 158 | | 172 | | 1,195 | Development costs(b) | | 1,762 | | 2,853 | | 429 | | 622 | | 1,159 | | 6,825 | | | | | | | | Total costs incurred | | 1,992 | | 3,754 | | 487 | | 799 | | 1,351 | | 8,383 | | | | | | | | December 31, 2006 | | | | | | | | | | | | | Proved property acquisition | | 58 | | 3 | | 125 | | — | | 53 | | 239 | Unproved property acquisition | | — | | 20 | | 31 | | 240 | | 11 | | 302 | Exploration costs | | 229 | | 538 | | 112 | | 69 | | 204 | | 1,152 | Development costs(b) | | 1,284 | | 2,272 | | 403 | | 544 | | 1,251 | | 5,754 | | | | | | | | Total costs incurred | | 1,571 | | 2,833 | | 671 | | 853 | | 1,519 | | 7,447 |
| (a) | Including the Middle East. |
| (b) | Including asset retirement costs capitalized during the year and any gains or losses recognized upon settlement of asset retirement obligations during the year. |
Group’s share of equity affiliates’ costs of property acquisition, exploration and development: | | | | | | | | | | | | | December 31, 2008(a) | | — | | 360 | | — | | — | | 612 | | 972 | December 31, 2007(a) | | — | | 48 | | — | | — | | 599 | | 647 | December 31, 2006(a) | | — | | 71 | | — | | — | | 716 | | 787 |
| (a) | Including 33 M€ of exploration costs in 2008, 58 M€ in 2007 and 56 M€ in 2006. |
Costs to develop Proved Undeveloped Reserves The following table presents the amounts spent to develop the proved developed and undeveloped reserves in 2006, 2007 and 2008, as well as the amounts included in the most recent standardized measure of future net cash flows to develop proved undeveloped reserves in each of the next three years. | | | | | | | | | | | | | | | | | (M€) | | 2006 | | 2007 | | 2008 | | 2009 | | | 2010 | | | 2011 | | Costs to develop Proved Undeveloped
Reserves (consolidated subsidiaries) | | 5,128 | | 6,035 | | 6,636 | | 7,702 | (a) | | 7,721 | (a) | | 6,417 | (a) |
Capitalized costs Capitalized costs represent the amounts of capitalized proved and unproved property costs, including support equipment and facilities, along with the related accumulated depreciation, depletion and amortization. The following tables present details of capitalized costs related to the Group’s oil and gas exploration and production activities as of (Bcf):the dates and on the basis indicated. | | | | | | | | | | | | | | | December 31, 2004 | | 111 | | 84 | | — | | — | | — | | 195 | | — | December 31, 2005 | | 101 | | 80 | | — | | — | | — | | 181 | | — | December 31, 2006 | | 92 | | 88 | | — | | — | | — | | 180 | | — |
Proved developed and undeveloped reserves of equity and non-consolidated affiliates as of (Bcf):
| | | | | | | | | | | | | | | | | | | | | | Consolidated subsidiaries | | | (M€) | | Europe | | | Africa | | | North America | | | Asia-
Pacific | | | Rest of World(a) | | | Total | | December 31, 2008 | | | | | | | | | | | | | | | | | | | Proved properties | | 26,030 | | | 25,136 | | | 2,400 | | | 4,857 | | | 10,911 | | | 69,334 | | Unproved properties | | 132 | | | 1,145 | | | 131 | | | 377 | | | 131 | | | 1,916 | | Total capitalized costs | | 26,162 | | | 26,281 | | | 2,531 | | | 5,234 | | | 11,042 | | | 71,250 | | Accumulated depreciation | | (18,382 | ) | | (12,339 | ) | | (660 | ) | | (2,265 | ) | | (5,144 | ) | | (38,790 | ) | Net capitalized costs | | 7,780 | | | 13,942 | | | 1,871 | | | 2,969 | | | 5,898 | | | 32,460 | | Company’s share of equity affiliates’ net capitalized costs | | — | | | 403 | | | — | | | — | | | 2,452 | | | 2,855 | | December 31, 2007 | | | | | | | | | | | | | | | | | | | Proved properties | | 29,263 | | | 20,035 | | | 2,112 | | | 3,891 | | | 9,246 | | | 64,547 | | Unproved properties | | 215 | | | 993 | | | 104 | | | 305 | | | 151 | | | 1,768 | | Total capitalized costs | | 29,478 | | | 21,028 | | | 2,216 | | | 4,196 | | | 9,397 | | | 66,315 | | Accumulated depreciation | | (21,092 | ) | | (10,484 | ) | | (432 | ) | | (1,737 | ) | | (4,380 | ) | | (38,125 | ) | Net capitalized costs | | 8,386 | | | 10,544 | | | 1,784 | | | 2,459 | | | 5,017 | | | 28,190 | | Company’s share of equity affiliates’ net capitalized costs | | — | | | 233 | | | — | | | — | | | 1,477 | | | 1,710 | | December 31, 2006 | | | | | | | | | | | | | | | | | | | Proved properties | | 28,217 | | | 19,569 | | | 1,884 | | | 3,678 | | | 9,861 | | | 63,209 | | Unproved properties | | 89 | | | 807 | | | 193 | | | 243 | | | 181 | | | 1,513 | | Total capitalized costs | | 28,306 | | | 20,376 | | | 2,077 | | | 3,921 | | | 10,042 | | | 64,722 | | Accumulated depreciation | | (20,456 | ) | | (11,271 | ) | | (553 | ) | | (1,588 | ) | | (4,604 | ) | | (38,472 | ) | Net capitalized costs | | 7,850 | | | 9,105 | | | 1,524 | | | 2,333 | | | 5,438 | | | 26,250 | | Company’s share of equity affiliates’ net capitalized costs | | — | | | 321 | | | — | | | — | | | 1,331 | | | 1,652 | |
| | | | | | | | | | | | | | | Year ended December 31, 2004 | | | | 18 | | | | | | | | 1,608 | | 1,626 | Year ended December 31, 2005 | | | | 17 | | | | | | | | 4,463 | | 4,480 | Year ended December 31, 2006 | | | | 20 | | | | | | | | 6,453 | | 6,473 |
Proved developed reserves as of (Bcf):
| | | | | | | | | | | | | | | December 31, 2004 | | 4,300 | | 2,071 | | 232 | | 2,862 | | 1,548 | | 11,013 | | 1,562 | December 31, 2005 | | 4,130 | | 2,285 | | 187 | | 2,910 | | 1,758 | | 11,270 | | 1,525 | December 31, 2006 | | 3,632 | | 2,643 | | 39 | | 2,592 | | 2,395 | | 11,301 | | 1,331 |
Proved developed reserves of equity and non-consolidated affiliates as of (Bcf):
| | | | | | | | | | | | | | | Year ended December 31, 2004 | | | | 18 | | | | | | | | 1,544 | | 1,562 | Year ended December 31, 2005 | | | | 17 | | | | | | | | 1,508 | | 1,525 | Year ended December 31, 2006 | | | | 20 | | | | | | | | 1,311 | | 1,331 |
| (a) | Including the Middle East. |
Standardized measure of discounted future net cash flows The standardized measure of discounted future net cash flows from production of proved reserves was developed as follows: | 1. | estimatesEstimates of proved reserves and the corresponding production profiles are based on technical and economic conditions at year end; |
| 2. | theThe estimated future cash flows from proved reserves are determined based on prices at December 31, with future price changes considered only to the extent provided by contractual arrangements in existence at year-end;year end; |
| 3. | theThe future cash flows incorporate estimated production costs (including production taxes), future |
| development costs and asset retirement costs. All |
| estimates are based on year-end technical and economic conditions; |
| 4. | futureFuture income taxes are computed by applying the year-end statutory tax rate to future net cash flows after consideration of permanent differences and future income tax credits; and |
| 5. | futureFuture net cash flows are discounted at a standard discount rate of 10 percent.10%. |
These principles applied are those required by FAS No. 69 and do not necessarily reflect the expectations of real revenues from these reserves, nor their present value; hence, they do not constitute criteria of investment decision. An estimate of the fair value of reserves should also take into account, among other things, the recovery of reserves not presently classified as proved, anticipated future changes in prices and costs and a discount factor more representative of the time value of money and the risks inherent in reserve estimates. The following is the projected standardized measure of discounted future net cash flows relating to proved oil and gas reserves: | | | | Consolidated subsidiaries | | | Consolidated subsidiaries | | | (M€) | | Europe | | Africa | | North America | | Asia | | Rest of World | | Total | | | Europe | | Africa | | North America | | Asia-
Pacific | | Rest of World(a) | | Total | | IFRS and U.S. GAAP basis | | | | | | | | | | | | | | December 31, 2004 | | | | | | | | | | | | | | Future cash inflows | | 49,233 | | | 76,576 | | | 2,695 | | | 13,737 | | | 42,437 | | | 184,678 | | | Future production costs | | (7,389 | ) | | (13,170 | ) | | (792 | ) | | (2,077 | ) | | (10,561 | ) | | (33,989 | ) | | Future development costs | | (6,448 | ) | | (10,001 | ) | | (356 | ) | | (2,316 | ) | | (4,436 | ) | | (23,557 | ) | | Future income taxes | | (23,711 | ) | | (33,859 | ) | | (304 | ) | | (4,091 | ) | | (8,613 | ) | | (70,578 | ) | | Future net cash flows, after income taxes | | 11,685 | | | 19,546 | | | 1,243 | | | 5,253 | | | 18,827 | | | 56,554 | | | Discount at 10% | | (4,085 | ) | | (8,919 | ) | | (455 | ) | | (2,167 | ) | | (12,091 | ) | | (27,717 | ) | | Standardized measure of discounted future net cash flows | | 7,600 | | | 10,627 | | | 788 | | | 3,086 | | | 6,736 | | | 28,837 | | | December 31, 2005 | | | | | | | | | | | | | | Future cash inflows | | 80,179 | | | 119,119 | | | 6,646 | | | 18,046 | | | 71,417 | | | 295,407 | | | Future production costs | | (8,842 | ) | | (19,402 | ) | | (3,213 | ) | | (2,381 | ) | | (17,709 | ) | | (51,547 | ) | | Future development costs | | (6,581 | ) | | (13,087 | ) | | (789 | ) | | (2,761 | ) | | (5,019 | ) | | (28,237 | ) | | Future income taxes | | (43,824 | ) | | (54,598 | ) | | (528 | ) | | (5,802 | ) | | (15,285 | ) | | (120,037 | ) | | Future net cash flows, after income taxes | | 20,932 | | | 32,032 | | | 2,116 | | | 7,102 | | | 33,404 | | | 95,586 | | | Discount at 10% | | (7,592 | ) | | (13,856 | ) | | (868 | ) | | (2,744 | ) | | (21,132 | ) | | (46,192 | ) | | Standardized measure of discounted future net cash flows | | 13,340 | | | 18,176 | | | 1,248 | | | 4,358 | | | 12,272 | | | 49,394 | | | December 31, 2006 | | | | | | | | | | | | | | | | | | | | | | | | | Future cash inflows | | 59,051 | | | 108,847 | | | 5,915 | | | 16,061 | | | 59,065 | | | 248,939 | | | 59,051 | | | 108,847 | | | 5,915 | | | 16,061 | | | 59,065 | | | 248,939 | | Future production costs | | (10,057 | ) | | (19,223 | ) | | (2,443 | ) | | (2,136 | ) | | (18,706 | ) | | (52,565 | ) | | (10,057 | ) | | (19,223 | ) | | (2,443 | ) | | (2,136 | ) | | (18,706 | ) | | (52,565 | ) | Future development costs | | (9,379 | ) | | (15,929 | ) | | (968 | ) | | (3,866 | ) | | (6,121 | ) | | (36,263 | ) | | (9,379 | ) | | (15,929 | ) | | (968 | ) | | (3,866 | ) | | (6,121 | ) | | (36,263 | ) | Future income taxes | | (28,069 | ) | | (45,714 | ) | | (459 | ) | | (4,522 | ) | | (12,271 | ) | | (91,035 | ) | | (28,069 | ) | | (45,714 | ) | | (459 | ) | | (4,522 | ) | | (12,271 | ) | | (91,035 | ) | Future net cash flows, after income taxes | | 11,546 | | | 27,981 | | | 2,045 | | | 5,537 | | | 21,967 | | | 69,076 | | | 11,546 | | | 27,981 | | | 2,045 | | | 5,537 | | | 21,967 | | | 69,076 | | Discount at 10% | | (4,545 | ) | | (12,171 | ) | | (1,092 | ) | | (1,927 | ) | | (14,293 | ) | | (34,028 | ) | | (4,545 | ) | | (12,171 | ) | | (1,092 | ) | | (1,927 | ) | | (14,293 | ) | | (34,028 | ) | Standardized measure of discounted future net cash flows | | 7,001 | | | 15,810 | | | 953 | | | 3,610 | | | 7,674 | | | 35,048 | | | 7,001 | | | 15,810 | | | 953 | | | 3,610 | | | 7,674 | | | 35,048 | | | | Minority interests in future net cash flows as of: | | | | Year ended December 31, 2004 | | 297 | | | 287 | | | | | | | | | 584 | | | Year ended December 31, 2005 | | 515 | | | 546 | | | | | | | | | 1,061 | | | Year ended December 31, 2006 | | 255 | | | 418 | | | | | | | | | 673 | | | | | Group’s share of equity affiliates’ future net cash flows as of: | | | | Year ended December 31, 2004 | | | | 494 | | | | | | | 1,101 | | | 1,595 | | | Year ended December 31, 2005 | | | | 598 | | | | | | | 2,930 | | | 3,528 | | | Year ended December 31, 2006 | | | | 549 | | | | | | | 3,545 | | | 4,094 | | | December 31, 2007 | | | | | | | | | | | | | | Future cash inflows | | | 87,540 | | | 157,199 | | | 8,585 | | | 20,268 | | | 46,282 | | | 319,874 | | Future production costs | | | (12,897 | ) | | (23,109 | ) | | (3,110 | ) | | (2,379 | ) | | (10,074 | ) | | (51,569 | ) | Future development costs | | | (10,764 | ) | | (19,012 | ) | | (1,641 | ) | | (4,225 | ) | | (4,525 | ) | | (40,167 | ) | Future income taxes | | | (43,851 | ) | | (75,557 | ) | | (887 | ) | | (6,200 | ) | | (9,284 | ) | | (135,779 | ) | Future net cash flows, after income taxes | | | 20,028 | | | 39,521 | | | 2,947 | | | 7,464 | | | 22,399 | | | 92,359 | | Discount at 10% | | | (8,070 | ) | | (17,474 | ) | | (1,511 | ) | | (2,664 | ) | | (14,176 | ) | | (43,895 | ) | Standardized measure of discounted future net cash flows | | | 11,958 | | | 22,047 | | | 1,436 | | | 4,800 | | | 8,223 | | | 48,464 | | December 31, 2008 | | | | | | | | | | | | | | Future cash inflows | | | 42,749 | | | 67,761 | | | 3,487 | | | 10,444 | | | 20,824 | | | 145,265 | | Future production costs | | | (8,593 | ) | | (15,372 | ) | | (1,638 | ) | | (2,003 | ) | | (7,565 | ) | | (35,171 | ) | Future development costs | | | (10,423 | ) | | (21,594 | ) | | (1,157 | ) | | (3,659 | ) | | (5,277 | ) | | (42,110 | ) | Future income taxes | | | (15,651 | ) | | (14,571 | ) | | 2 | | | (2,047 | ) | | (2,444 | ) | | (34,711 | ) | Future net cash flows, after income taxes | | | 8,082 | | | 16,224 | | | 694 | | | 2,735 | | | 5,538 | | | 33,273 | | Discount at 10% | | | (3,645 | ) | | (8,144 | ) | | (286 | ) | | (1,072 | ) | | (4,140 | ) | | (17,287 | ) | Standardized measure of discounted future net cash flows | | | 4,437 | | | 8,080 | | | 408 | | | 1,663 | | | 1,398 | | | 15,986 | |
| (a) | Including the Middle East. |
Minority interests in future net cash flows as of: | | | | | | | | | | | | | | December 31, 2006 | | 255 | | 418 | | | — | | — | | — | | 673 | December 31, 2007 | | 407 | | 654 | | | — | | — | | — | | 1,061 | December 31, 2008 | | 217 | | (50 | ) | | — | | — | | — | | 167 |
Group’s share of equity affiliates’ future net cash flows as of: | | | | | | | | | | | | | December 31, 2006 | | — | | 549 | | — | | — | | 3,545 | | 4,094 | December 31, 2007 | | — | | 526 | | — | | — | | 9,552 | | 10,078 | December 31, 2008 | | — | | 418 | | — | | — | | 4,883 | | 5,301 |
Changes in the standardized measure of discounted future net cash flows The following table indicates the changes in the standardized measure of discounted future net cash flows for the periods indicated. | | | | For the year ended
December 31, | | | For the year ended
December 31, | | | (M€) | | 2006 | | 2005 | | 2004 | | | 2008 | | 2007 | | 2006 | | Consolidated | | | | | | | | | | | | | Beginning of year | | 49,394 | | | 28,837 | | | 29,118 | | | 48,464 | | | 35,048 | | | 49,394 | | Sales and transfers, net of production costs | | (21,335 | ) | | (17,104 | ) | | (12,791 | ) | | (26,109 | ) | | (19,095 | ) | | (21,335 | ) | Net change in sales and transfer prices, net of production costs | | (11,481 | ) | | 52,711 | | | 12,919 | | | (81,358 | ) | | 56,678 | | | (11,481 | ) | Extensions, discoveries and improved recovery, net of future production and development costs | | 1,534 | | | 1,126 | | | 974 | | | 556 | | | 2,895 | | | 1,534 | | Changes in estimated future development costs | | (7,666 | ) | | (1,106 | ) | | (1,215 | ) | | (2,227 | ) | | (6,491 | ) | | (7,666 | ) | Previously estimated development costs incurred during the year | | 5,150 | | | 5,333 | | | 3,790 | | | 6,960 | | | 6,581 | | | 5,150 | | Revisions of previous quantity estimates | | (1,382 | ) | | 6,313 | | | (2,684 | ) | | 2,693 | | | (6,521 | ) | | (1,382 | ) | Accretion of discount | | 4,939 | | | 2,444 | | | 2,912 | | | 4,846 | | | 3,505 | | | 4,939 | | Net change in income taxes | | 16,268 | | | (28,943 | ) | | (4,255 | ) | | 63,611 | | | (22,585 | ) | | 16,268 | | Purchases of reserves in place | | 574 | | | 41 | | | 292 | | | 50 | | | — | | | 574 | | Sales of reserves in place | | (947 | ) | | (258 | ) | | (223 | ) | | (1,500 | ) | | (1,551 | ) | | (947 | ) | End of year | | 35,048 | | | 49,394 | | | 28,837 | | | 15,986 | | | 48,464 | | | 35,048 | |
S-11S-9
|
|
|
|
|
|
|