the possibility of default on its issued bonds if economic recovery abates and a new economic crisis emerges which could again have a material adverse effect on our results of operation and prospects.
The Argentine government continues to face significant exposure to litigation from holders of its defaulted debt that did not participate in the Argentine government’s exchange offer. At present, there are legal proceedings against the Argentine government in the United States, Italy and Germany. Although it is impossible to determine whatpredict the outcome of these proceedings will be, a judgment against the Argentine government in such cases could result in a reduction in funding sources and investment capital, which could have a significant effect on the Argentine government’s capacity to implement reforms and reinstate sustainable economic growth, all of which could adversely affect our results of operations.
Until December 2001, the Argentine peso was pegged 1-to-1 to the U.S. dollar. From January 1st,1st, 2002, the Argentine peso has been allowed to float freely against the U.S. dollar and other foreign currencies.
Since 2003 and following a series of restrictive measures in the money market and fund movements, the Argentine Central Bank removed several of the foreign exchange restrictions, including elimination of the requirement that the Argentine Central Bank approve the repayment of principal of financial indebtedness, extended the term for the repatriation of export proceeds, allowed earlier payments of imports, and as of Aprilbeginning 2004, increased up to US$2 million, the monthly amount that Argentine-domiciled individuals or corporations are allowed to purchase and transfer abroad.
There can be no assurance that the Argentine Central Bank will not once again require its prior authorization for the transfer of funds abroad in the form of dividends or payment of inter-company or third party loans. Any such inability to transfer funds outside of Argentina, in the form of dividends or otherwise, could adversely affect the value of our Argentine operations and the market value of our ADSs.
Argentina has experienced high levels of inflation in recent decades, resulting in large devaluations of its currency. Argentina’s historically high rates of inflation resulted mainly from its lack of control over fiscal policy and the money supply. The official annual rates of inflation (as(published by INDEC-Instituto Nacional de Estadisticas y Censos- National
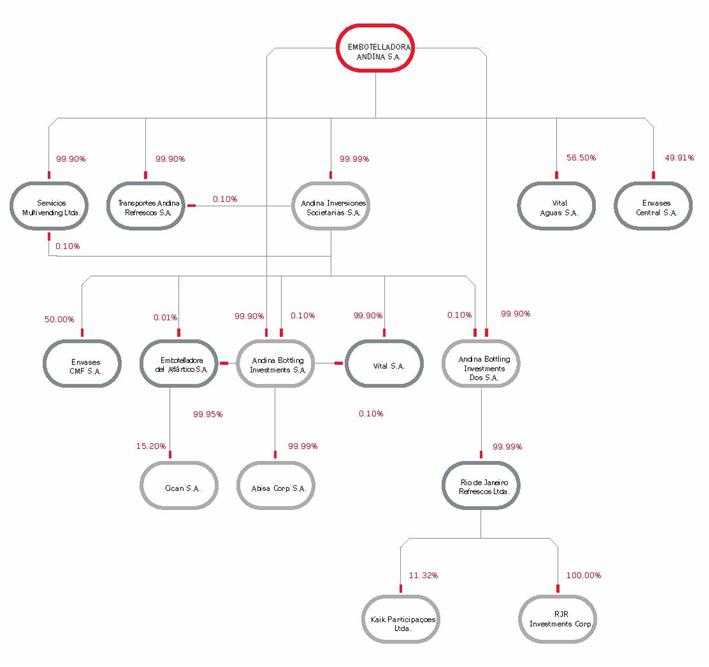
We are the largest producer of soft drinks in Chile and one of the largest soft drink producers in Brazil and Argentina. Our principal business is the production and distribution of Coca-Cola soft drinks, which accounted for 88.1%87.8% of our consolidated net sales in 2006.2007. Through Andina, we are the sole producer and distributor of Coca-Cola soft drinks in the Chilean territory; through Refrescos, the sole producer and distributor of Coca-Cola soft drinks in the Brazilian territory; and through Edasa, the sole producer and distributor of Coca-Cola soft drinks in the Argentine territory. In 2006,2007, we recorded consolidated net sales of Ch$481,700559,300 million and total sales volume of 381.9402.4 million unit cases of Coca-Cola soft drinks.
In addition to the Coca-Cola soft drinks business, through Vital S.A., we produce and distribute fruit juices and other fruit-flavored beverages in Chile under trademarks owned by The Coca-Cola Company. Also, throughThrough Vital Aguas S.A., we produce and sell mineral water and purified water in Chile under trademarks owned by The Coca-Cola Company. Through Envases Central S.A. we produce flavored waters. We also manufacture PET bottles primarily for our own use in the packaging of Coca-Cola soft drinks in Chile and Argentina. In Brazil, we also distribute the beer brands Kaiser, Heineken, Bavaria, Heineken, Santa Cerva, XinguXingú, Summer, Sol and Sol.
We produce, market and distribute the following Coca-Cola trademark beverages and brands licensed from third parties throughout our Chilean, Brazilian and Argentine franchise territories:
We believe that cash flow generated by operations, cash balances, available lines of credit, including from suppliers, and borrowings from third parties, are currently sufficient to meet our working capital, debt service and capital expenditure requirements.
Financing Activities
As of December 31, 2006,2007, we had Ch$120,998139,149 million invested in time deposits and other short-term and long-term investments not included as cash equivalents for purposes of Chilean GAAP.investments. As of that date, we had available short-term credit lines in an amount equivalent to approximately Ch$57,740102,327 million (US$108.5205.9 million). The aggregate unused portion of such lines of credit at that date was equivalent to Ch$56,93498,618 million (US$107198.5 million).
Our unused sources of liquidity include 15 lines of credit. In Chile, we havehad the equivalent of US$9.4Ch$6,611 million in credit available from twothree separate lines. In Brazil, we havehad the equivalent of US$86Ch$78,359 million in credit available with teneight lines. In Argentina, we havehad the equivalent of US$13.1Ch$17,357 million in credit available with threefour lines.
In 2006,2007, our available cash was principally used for investments in fixed assets of Ch$37,00456,024 million and dividend payments of Ch$73,68478,348 million. In 2005,2006, the principal uses of cash were investments in fixed assets of Ch$27,97039,743 million and dividend payments of Ch$74,07579,136 million.
Liabilities
Liabilities
For the period ending December 31, 2006,2007, our total liabilities, excluding minority interest, were Ch$237,695257,992 million, representing a 9.2% decrease1.1% increase compared to December 31, 2005.2006. The decreaseincrease in total liabilities resulted principally from a reduction in short and long-term bankbond debt, partially offset by higher income tax provision, deferred taxes and bond debt.accounts payable. As of December 31, 2006,2007, our long term liabilities included (i) long-term bank debt of Ch$418741 million, (ii) long-term bond debt of Ch$76,02573,598 million, (iii) long-term notes outstanding of Ch$13380 million, and (iv) long term notes and accounts payable to related companies of Ch$3,5503,341 million (v) long term deferred taxes of Ch$4,128
12,376 million, and (vi) other long-term accrued liabilities and provisions of Ch$27,17329,193 million, for a total of Ch$111,427119,327 million of long-term liabilities compared to total long-term liabilities of Ch$134,500119,673 million as of December 31, 2005.2006.
Our short term liabilities, as of December 31, 20062007 included (i) short-term bank debt of Ch$2,4903,951 million, (ii) current portion of long-term bank liabilities of Ch$439122 million, (iii) current portion of long-term bond debt of Ch$29,9726,914 million, (iv) trade accounts payable of Ch$42,86854,585 million, (v) notes payable to related companies of Ch$10,81319,157 million, and (vi) other short-term liabilities, principally provisions, withholdings and income tax payable, for Ch$39,68653,936 million, for a total of Ch$126,268138,665 million of short-term liabilities compared to total short-term liabilities of Ch$127,382135,612 million as of December 31, 2005.2006.
As of December 31, 2006,2007, our bond liabilities had a weighted average interest rate of 6.52%6.48% while our bank liabilities had a weighted average interest rate of 8.06%6.06%.
Summary of Significant Debt Instruments
The following is a brief summary of our significant long-term indebtedness outstanding as of December 31, 2006:2007:
Unsecured Notes. On October 1, 1997 we entered into an indenture pursuant to which we issued three series of bonds. The indenture imposes certain restrictions on liens, sale and leaseback transactions, assets sales and subsidiary indebtedness and certain conditions in the event of merger or consolidation.
The three series of bonds issued in 1997 under this indenture are the following:
·US$150 million of 7.00% Unsecured Notes due 2007;
·US$100 million of 7.625% Unsecured Notes due 2027; and
·US$100 million of 7.875% Unsecured Notes due 2097.
On July 10, 2001, through our subsidiary The Sterling Pacific Corp, S.A., (now Abisa Corp.), we made an offer to repurchase for cash at par value the notes outstanding and the following notes were tendered:
·US$118 million of the 7.00% Unsecured Notes due 2007;
·US$96 million of the 7.625% Unsecured Notes due 2027; and
·US$100 million of the 7.875% Notes due 2097.
43
On Novemeber 28, 2007, through our subsidiary Abisa Corp we purchased US$ 2 million of the 7.625% Unsecured Notes due 2027.
On June 13, 2001, Andina completed a local bond placement in the Chilean capital markets of two series of bonds as follows:
·UF 3.3 million series of bonds due 2008 with annual interest rate over inflation of 6.20% of which, UF 0.990.33 million was outstanding at December 31, 2006;2007; and
·UF 3.7 million series of bonds due 2026, with annual interest rate over inflation of 6.50%, being outstanding at December 31, 2006.
The bond issue and placement in the Chilean market is subject to the following restrictions:
·Andina must maintain a leverage ratio, defined as total debt/consolidated equity, of less than 1.20%. For purposes of calculating the leverage ratio, total debt includes (i) short-term bank liabilities, (ii) the current portion of long-term bank liabilities, (iii) short-term liabilities and promissory notes, (iv) the current portion of bonds payable, (v) long-term bank liabilities, and (vi) long-term bonds payable. Consolidated equity means total shareholders’ equity plus minority interest.
·Andina must maintain consolidated assets free of any pledge, mortgage or other encumbrances for an amount equal to at least 1.30 times the consolidated liabilities that are not guaranteed by the investee.
·Andina may not lease, sell, assign or dispose of the franchise territory in Chile.
·Andina may not lease, sell, deliver or dispose of its franchise territory in Argentina or Brazil, as long as either territory represents more than 40% of Andina’s consolidated operating cash flows.
C. | Research and development, patents and licenses |
C.Research and development, patents and licenses
Given the nature of the business and the support provided by The Coca-Cola Company as franchisor to its bottlers, the Company’s research and development expenses are not meaningful. For more information on patents and licenses, see “Item 4. Information on the Company — Part B. Business Overview — Patents and Licenses”.
D.Trend Information
Our results will likely continue to be influenced by changes in the level of consumer demand in the countries in which we operate, particularly Argentina and Brazil, resulting from economic measures that the governments of those countries have implemented, or may implement in the future, to solve present debt and fiscal deficit problems.future.
Additionally, principal raw materials used in the production of soft drinks, such as sugar and resin, may experience price increases in the future. Such price increases may affect our results if we are unable to pass the cost increases on to the sales price of our products due to depressed consumer demand and/or heightened competition.
Increased competition from low-price brands is another factor that could limit our ability to grow, and thus negatively affect our results.
Finally, exchange rate fluctuations, in particular the potential devaluations relative to the U.S. dollar of local currencies in the countries in which we operate, may adversely affect our results because of the impact on the cost of U.S. dollar-denominated raw materials and the conversion of monetary assets.
E. | Off-Balance Sheet Arrangements |
E.Off-Balance Sheet Arrangements
We do not have any off-balance sheet arrangements.
F. | Contractual Obligations |
F.Contractual ObligationsThe following table summarizes our contractual obligations and commercial commitments as of December 31, 2006:2007:
| | | | | | | | | | |
| | | | | Payments Due by Period |
| | | | | Years |
| | | Total | | Less than
1 Year | | 1-3
Years | | 3-5
Years | | More than
5 Years |
| | | (in millions of constant Ch$ as of December 31, 2006) |
| | | MCh$ | | MCh$ | | MCh$ | | MCh$ | | MCh$ |
Long-term bank debt(1) | | 857 | | 439 | | 418 | | 0 | | 0 |
Short-term bank debt | | 2,490 | | 2,490 | | 0 | | 0 | | 0 |
Bonds payable(2) | | 105,997 | | 29,972 | | 8,046 | | 7,982 | | 59,997 |
Purchase obligations | | 376 | | 213 | | 133 | | 30 | | 0 |
| | | | | | | | | | |
Subtotal-included in our balance sheet | | 109,720 | | 33,114 | | 8,597 | | 8,012 | | 59,997 |
| | | | | | | | | | |
Operating lease obligations | | 1,321 | | 1,232 | | 89 | | 0 | | 0 |
| | | | | | | | | | |
Purchase obligations | | 48,710 | | 22,187 | | 25,923 | | 600 | | 0 |
Subtotal-not included in our balance sheet | | 50,031 | | 23,419 | | 26,012 | | 600 | | 0 |
| | | | | | | | | | |
Total contractual obligations | | 159,751 | | 56,533 | | 34,609 | | 8,612 | | 59,997 |
| | | | | | | | | | |
44
(1) | See Notes 15(b) and 16 of the Notes to the Consolidated Financial Statements for additional information. |
| | | | Payments Due by Period | |
| | | | Years | |
| | Total | | Less than
1 Year | | 1-3
Years | | 3-5
Years | | More than
5 Years | |
| | (in millions of constant Ch$ as of December 31, 2007) | |
| | MCh$ | | MCh$ | | MCh$ | | MCh$ | | MCh$ | |
Long-term debt(1) | | 1,060 | | 208 | | 565 | | 287 | | — | |
Short-term debt | | 4,000 | | 4,000 | | — | | — | | — | |
Bonds payable(2) | | 130,098 | | 11,876 | | 15,753 | | 16,837 | | 85,632 | |
Operating lease obligations | | 1,465 | | 1,465 | | — | | — | | — | |
Purchase obligations | | 29,285 | | 19,105 | | 9,848 | | 332 | | — | |
Other short and long term obligations | | 13,194 | | 3,871 | | 6,870 | | 2,453 | | — | |
| | | | | | | | | | | |
Total contractual obligations | | 179,102 | | 40,525 | | 33,036 | | 19,909 | | 85,632 | |
(2) | See Note 17 of the Notes to the Consolidated Financial Statements for additional information. |
(1) See Notes 15(b) and 16 of the Notes to the Consolidated Financial Statements for additional information.
(2) See Note 17 of the Notes to the Consolidated Financial Statements for additional information.
The following table presents future expirations for the remaining long term liabilities. These expirations have been made based on accounting estimates because the liabilities do not have specific dates of future payment as allowance for severance indemnities, contingencies, deferred taxes and liabilities for container guarantees are included.
| | | | | | Maturity | | | | Maturity | |
| | | | | Years | | | | Years | |
| | | Total | | 1-3 Years | | 3-5 Years | | More than
5 Years | | Total | | 1-3 Years | | 3-5 Years | | More than
5 Years | |
| | | (in millions of constant Ch$ as of December 31, 2006) | | (in millions of constant Ch$ as of December 31, 2007) | |
| | | MCh$ | | MCh$ | | MCh$ | | MCh$ | | MCh$ | | MCh$ | | MCh$ | | MCh$ | |
Provisions | | 17,099 | | 12,153 | | 0 | | 4,946 | | 8,838 | | 3,175 | | | | 5,663 | |
Deferred taxes | | | 12,376 | | 12,376 | | | | | |
Other long-term liabilities | | 17,722 | | 7,052 | | 659 | | 10,011 | | 15,605 | | 7,865 | | 222 | | 7,518 | |
| | | | | | | | | |
Total long-term liabilities not included in contractual obligations | | 34,821 | | 19,205 | | 659 | | 14,957 | | 36,819 | | 23,416 | | 222 | | 13,181 | |
| | | | | | | | | |
U.S. GAAP Reconciliation
The principal differences between Chilean GAAP and U.S. GAAP as they relate to us are (i) inflation accounting under Chilean GAAP, which has not been reversed in the reconciliation to U.S. GAAP, (ii) the revaluation and depreciation of certain property, plant and equipment on the basis of a technical appraisal, (iii) different goodwill amounts and differences in amortization for goodwill, (iv) the treatment of mandatory minimum dividends, (v) difference in accounting for investments in related companies and joint ventures, (vi) the accounting for deferred income taxes, (vii) the treatment of investment securities, (viii) the accounting for the translation adjustment of foreign investments and translation of financial statements of non-Chilean operations; and, (ix) the accounting for derivative instruments.instruments, and (x) the reversal of impairment loss on fixed assets. Note 2930 of the notes to the Consolidated Financial Statements provides a description of the principal differences between Chilean GAAP and U.S. GAAP as they relate to us and a reconciliation to U.S. GAAP of net income and shareholders’ equity.
Net income after reconciliation to U.S. GAAP was Ch$12,069 million higher in 2004, Ch$19,54720,993 million higher in 2005, and Ch$2,4982,683 million higher in 2006, and Ch$3,970 million higher in 2007, in each case than net income as reported under Chilean GAAP for each respective year. See Note 29(n)30(o) of the notes to the Consolidated Financial Statements. Under Chilean GAAP, shareholders’ equity at December 31, 2005,2006, was Ch$274,074295,064 million, compared to Ch$295,658308,485 million under U.S. GAAP, representing a
45
difference of 7.9%4.5%. Under Chilean GAAP, shareholders’ equity as of December 31, 20062007 was Ch$274,733281,149 million, compared to Ch$287,230298,020 million under U.S. GAAP, representing a difference of 4.5%6.0%.
ITEM 6.DIRECTORS, SENIOR MANAGEMENT AND EMPLOYEES ITEM 6.
| DIRECTORS, SENIOR MANAGEMENT AND EMPLOYEES |
Management and Board of Directors
Pursuant to Chilean law, we are managed by a group of executive officers under the supervision of our board of directors. The Company’s operations in Chile, Brazil and Argentina report to the Corporate Office.
Principal Officers
The following table includes information regarding our senior executives:
Jaime García R. | | Chief Executive Officer | | Joined the Company in 1977, as head of the research-studies department. In 1978, he was appointed general manager of Embotelladora Talca (today part of Embonor S.A.). In 1979, he was appointed general manager of Embotelladora Concepción (today part of Embonor S.A.). In 1983, he became financial manager of Andina, a position he held until 1987, when he was appointed general manager of ISASA (a subsidiary of Andina). In 1990, he was appointed general manager of Andina, a position he held until 1993, when he became our chief executive officer. Date of birth: November 24, 1953 |
| | | | |
Michael Cooper A. | | Chief Operating Officer | | Joined the Company in May 2000, as chief operating officer. In 1989, he was appointed chief executive officer of Inchcape Coca-Cola bottling operations, with businesses in Chile, Peru and Russia. In 1999, Embonor S.A. bought Inchcape Chilean and Peruvian bottling operations and he became chief executive officer of the consolidated entity. Date of birth: May 15, 1948 |
| | | | |
Osvaldo Garay A. | | Chief Financial Officer | | Joined the Company in 1997, as controller of Andina. He was appointed as our chief financial officer on October 31, 2002. Prior to joining Andina, he held a similar position with Grupo Claro. Date of birth: April 20, 1948 |
| | | | |
Pedro Pellegrini R. | | Chief Legal & Communications Officer | | Joined the Company in June 1995, as chief legal & communications. From 1986 to 1992, he worked at Carey & Cia., the largest law firm in Chile. From 1992 to 1995, he served as a vice president of Citibank, N.A., and Citicorp-Chile and was in charge of legal corporate matters. Date of birth: January 13, 1965 |
| | | | |
Raúl Ramírez V. | | Chief Technical Officer | | Joined the Company in 1969 as deputy manager of operations from August 1969 until August 1995. In 1995, he was promoted to corporate manager of engineering, a position he held until December 1996. In January 1997, he was transferred to our operations in Argentina as technical manager until July 2000. Since 2000 until the present date he holds the position of chief technical officer. Date of birth: July 24, 1944 |
| | | | |
Gonzalo Vergara D. | | Chief CSR and Procurement Officer | | Joined the Company in 1995. He was previously Credit and Collections Manager of Almacenes Paris S.A. Within Andina he has served in several positions, as Chief Juices and Waters Corporate Officer and General Manager of the PET packaging facilities. Date of birth: June 17, 1948 |
46
German Garib N. | | Chief Information Officer | | Joined the Company in 1998, as chief information officer. Prior to Andina, he was the marketing manager of IBM Chile. Date of birth: August 28, 1961 |
| | | | |
Renato Ramírez F. | | General Manager of Chilean Soft Drink Operation | | Joined the Company in 1979, as general manager of Chilean soft drink operations. He began working as head of the budget and costs department and, in 1980, was appointed planning assistant manager. From January 1988 to August 1990, he was the commercial manager of Embotelladora Williamson Balfour. From September 1990 to October 1992, he served as marketing manager for Compañía de Telefonos de Chile. In August 1993, he returned to Andina as commercial manager, a position he held until 1997. In March of 1998 he became general manager of the Chilean Soft Drink Operation. Date of birth: July 27, 1952 |
| | | | |
Ricardo Gehrke | | General Manager of Rio de Janeiro Refrescos Ltda. | | Joined the company in January 2008. He began his professional career in 1981 at Esso Brasileira de Petróleo working in several areas, such as Finance, Planning, Sales, Supply, Transportation and Distribution. In 1995 he was appointed as Senior Counsel of European Affiliates of Exxon Company International. In 1996 he returned to Esso Brasileira de Petróleo and held several positions: Senior Counsel, Better Practices of Retail Operations, Director of Retail Sales and also as President and Director of Fuels until 2004. From 2004 until 2007 he worked at the Gerdau Group as Chief Executive Officer of Aços Longos Brasil and Member of the Executive Committee. Date of Birth: July 6, 1957 |
| | | | |
Alejandro A. Feuereisen | | General Manager of Embotelladora del Atlántico S.A. | | Joined the company in 1993. In August of 1998 he was appointed General Manager of EDASA. From September 1995 to July 1998, he served as the commercial manager of Embotelladora del Atlántico S.A. From 1993 to 1995, he was a sales manager at Andina and, from 1981 to 1992, an officer at Citibank, Santiago de Chile. During the last three years of his tenure at Citibank, he was vice president of the International Financial Institutions Group. From 1977 to 1980, he served as financial analyst at Leasing Andino S.A., a subsidiary of Banco de Chile. Date of birth: May 19, 1953 |
| | | | |
Cesar Vargas P. | | General Manager of Vital S.A. and Vital Aguas S.A. | | Joined the Company in 1978. Mr. Vargas began working as project engineer and head of electric maintenance. In 1985, he was appointed head of the juice division plant of Industrial Sud Andina S.A. in Santiago, a former subsidiary of Andina, where he was subsequently promoted to deputy production manager of the juice and mineral water division. In 1992, Vital S.A. was created and he was appointed operations manager, a position that he held until 1998, when he was appointed general manager. Date of birth: May 26, 1957 |
Compensation Principal Officers
The Company does not have any incentive plans other than salaries. The compensation system is a mixed one, composed by a base salary and participation, which are in accordance with each market and the competitive conditions of each one. For General Managers it also considers use of cash flow versus the budget and market share versus the established goals. Amounts are different depending on each officer, position and/or responsibility, but it is applicable to all of the Company. For the year ended December 31, 2007, compensation paid out to the principal officers of Embotelladora Andina S.A. amounted to Ch$3,751 million (Ch$3,268 million in 2006). Of the Ch$3,751 million paid to the main officers of Embotelladora Andina S.A., the variable portion was 53% and for the period ended December 31, 2006 of the Ch$3,268 million paid to the main officers of Embotelladora Andina S.A., the variable portion was 56%. There were no severance
47
payments to former managers or former principal officers for the period ended December 31, 2007. We do not make available pulic information as to the compensation of of our executive officers on an individual basis, as disclosure of such information is not required under Chilean law.
Board of Directors
In accordance with our bylaws, the board of directors must consist of seven regular directors and seven alternate directors. Each director is assigned a specific alternate director. The directors may or may not be shareholders and are elected for a term of three years subject to indefinite re-election. In the case of Series A shares, it is necessary to have 14.29% of the total shares represented in a shareholders’ meeting in order to elect one director assuming there is 100% shareholder vote participation. In the case of series B shares, it is necessary to have a total of 50.1% of the total shares represented in a shareholders’ meeting to elect a director if it is also assumed that there is 100% shareholder vote participation. All members of the board of directors are nominated and elected every three years by and during the ordinary annual shareholders’ meeting. Cumulative voting is permitted for the election of directors.
In the event of a vacancy, the designated alternate director fills the vacancy for the remaining period of the director’s term. If the alternate director is unable or unwilling to serve, the board of directors may appoint a replacement to fill the vacancy, and the entire board of directors must be elected or re-elected at the next regularly scheduled shareholders’ meeting.
As of December 31, 2006, our board of directors consisted of the following directors and alternate directors:
| | | | |
Juan Claro | | Chairman of the Board of Directors | | Has been a member of the board of directors since April 2004.
Principal occupation: Entrepreneur
Other directorships: Pesquera Friosur, Emel, Empresas Melón S.A.,
Antofagasta Minerals S.A., Antofagasta PLC, Empresas CMPC S.A.,
Red Televisa Chilevisión S.A., ENTEL Chile S.A.
Date of birth: November 7, 1950
|
| | |
José Antonio Garcés, Jr. | | Director | | Has been a member of the board of directors since May 1991.
Principal occupation: General manager of Inversiones San Andrés Ltda.
Other directorships: Banvida S.A.; Inmobiliaria FFV S.A. and Fundación Paternitas
Date of birth: March 1, 1966
|
| | |
Gonzalo Said(1) | | Director | | Has been a member of the board of directors since May 1993.
Principal occupation: General manager and director of Inversiones Santa Virginia Ltda.
Other directorships: BBVA Administradora de Fondos Mutuos BHIF S.A., Embotelladora Andina S.A., and of Inmobiliaria Don Aurelio Ltda.
Date of birth: October 16, 1964
|
| | |
Salvador Said(1) | | Director | | Has been a member of the board of directors since April 1992.
Principal occupation: Executive director of Said Holding Group
Other directorships: Edelpa S.A., Parque Arauco S.A., BBVA
|
| | | | |
| | | | Administradora de Fondos Mutuos BHIF S.A. and BHIF Administradora de Fondos de Inversión S.A., Inversiones Caburga S.A.; Inversiones Delfín S.A.; Grupo Eulen Chile S.A.
Date of birth: September 16, 1964
|
| | |
James Robert Quincey | | Director | | Has been a member of the board of directors since April 2006.
Principal occupation: President of Coca-Cola de Mexico
Other directorships: Coca-Cola Embonor S.A.
Date of birth: January 8, 1965
|
| | |
Arturo Majlis | | Director | | Has been a member of the board of directors since April 1997.
Principal occupation: Principal partner of the law offices of Grasty, Quintana, Majlis Compañía
Other directorships: Asesorías e Inversiones Til Til S.A.; Banchile Seguros de Vida and HNS Banco
Date of birth: April 7, 1962
|
| | |
Heriberto Urzúa(2) | | Director | | Has been a member of the board of directors since April 2006.
Principal occupation: Company directorships
Other directorships: Agrícola Ariztía S.A.,
Inversiones Alsacia S.A., Hortifrut S.A. Promoplan y Otros S.A., y RELSA S.A.
Date of birth: November 28, 1962
|
| | |
Ernesto Bertelsen | | Alternate Director to Juan Claro | | Has been a member of the board of directors since April 2005.
Principal occupation: Director Banco BBVA.
Other directorships: Factorline S.A.
Date of birth: March 18, 1945
|
| | |
Patricio Parodi | | Alternate Director to José Antonio Garcés | | Has been a member of the board of directors since April 2005.
Principal occupation: General manager Consorcio Financiero S.A. and subsidiaries
Other directorships: Banmédica S.A.; Isapre Vida Tres S.A.; Isapre Banmédica S.A., Help S.A.; Clínica Dávila S.A.; Sociedad Punta del Cobre S.A.; Pacífico V Región S.A.; Maderas Condor S.A., Salfacorp S.A., Invernnova S.A. and Moletto Hermanos
Date of birth: April 28, 1963
|
| | |
José María Eyzaguirre | | Alternate Director to Gonzalo Said | | Has been a member of the board of directors since April 2006.
Principal occupation: Lawyer, Partner at Estudio Claro y Cia.
Other directorships: N/A
Date of birth: May 22, 1962
|
| | |
José Domingo Eluchans | | Alternate Director to Salvador Said. | | Has been a member of the board of directors since April 2005.
Principal occupation: Partner at José Domingo Eluchans Asesorías Limitada
Other directorships: Banco BBVA, Envases del Pacífico S.A.
Date of birth: August 6, 1953
|
| | |
Jorge Hurtado G. | | Alternate Director to James Quincey B. | | Has been a member of the board of directors since January 1998.
Principal occupation: Directing Partner of Agrícola y Comercial Yerbas Buenas S.A.
Other directorships: CMPC Tissue S.A.; Vendomática S.A.; Adviser
Drilling S.A., Proemsa S.A., Trabajando.com Chile S.A., and Sociedad Anónima de Deportes Club de Golf Santiago
Date of birth: March 25, 1946
|
| | | | |
| | |
José Miguel Barros | | Alternate Director to Arturo Majlis A. | | Has been a member of the board of directors since April 2005.
Principal occupation: Director and Partner of Larrain Vial S.A.
Other directorships: Bata Chile S.A., Cerámica Santiago S.A., Viña Santa Carolina S.A. and Blanco y Negro S.A.
Date of birth: March 1, 1964
|
| | |
Pedro Vicente. (2) | | Alternate Director to Heriberto Urzúa S. | | Has been a member of the board of directors since April 2004.
Principal occupation: Director of Capital Consulting Services S.A.
Other directorship: Colbún S.A; Capital Care S.A.
Date of birth: August 11, 1951
|
(1) | Salvador Said S. is the cousin of Gonzalo Said H. |
(2) | Independent from controlling shareholder pursuant to Article 50 bis, paragraph 6 of the Chilean Public Company Law N° 18,045. |
Senior Executives
| | | | |
Jaime García R. | | Chief Executive Officer | | Mr. García joined the Company in 1977, as head of the research-studies department. In 1978, he was appointed general manager of Embotelladora Talca (today part of Embonor S.A.). In 1979, Mr. García was appointed general manager of Embotelladora Concepción (part of Embonor S.A.). In 1983, he became financial manager of Andina, a position he held until 1987, when he was appointed general manager of ISASA (a subsidiary of Andina). In 1990, Mr. García was appointed general manager of Andina, a position he held until 1993, when he became our chief executive officer.
Date of birth: November 24, 1953
|
| | |
Michael Cooper A. | | Chief Operating Officer | | Mr. Cooper joined the Company in May 2000, as chief operating officer. In 1989, Mr. Cooper was the chief executive officer of Inchcape Coca-Cola bottling operations, with businesses in Chile, Peru and Russia. In 1999, Embonor S.A. bought Inchcape Chilean and Peruvian bottling operations and Mr. Cooper became chief executive officer of the consolidated entity.
Date of birth: May 15, 1948
|
| | |
Osvaldo Garay A. | | Chief Financial Officer | | Mr. Garay joined the Company in 1997, as controller of Andina. Mr. Garay was appointed as our chief financial officer on October 31, 2002. Prior to joining Andina, he held a similar position with Grupo Claro.
Date of birth: April 20, 1948
|
| | |
Pedro Pellegrini R. | | Chief Legal & Communications Officer | | Mr. Pellegrini joined the Company in June 1995, as chief legal & communications officer of Andina. From 1986 to 1992, Mr. Pellegrini worked at Carey & Cia., the largest law firm in Chile. From 1992 to 1995, Mr. Pellegrini served as a vice president of Citibank, N.A., and Citicorp-Chile and was in charge of legal corporate matters.
Date of birth: January 13, 1965
|
| | |
Raúl Ramírez V. | | Chief Technical Officer | | Mr. Ramirez has held the position of chief technical officer, reporting directly to the chief operating officer since 1996. Mr. Ramirez held the position of deputy manager of operations from August 1969 until August 1995. In 1995, Mr. Ramirez was promoted to corporate manager of engineering, a position he held until December 1996. In January 1997, Mr. Ramirez was transferred to our operations in Argentina, Córdoba, Edasa, as technical manager until July 2000.
Date of birth: July 24, 1944
|
| | | | |
| | |
German Garib N. | | Chief Information Officer | | Mr. Garib joined the Company in 1998, as chief information officer. Prior to Andina, he was the marketing manager of IBM Chile.
Date of birth: August 28, 1961
|
| | |
Renato Ramírez F. | | General Manager of Chilean Soft Drink Operation | | Mr. Ramírez joined the Company in 1979, as general manager of Chilean soft drink operations. Mr. Ramírez began working as head of the budget and costs department and, in 1980, was appointed planning assistant manager. From January 1988 to August 1990, he was the commercial manager of Embotelladora Williamson Balfour. From September 1990 to October 1992, Mr. Ramírez served as marketing manager for Telephone Company of Chile. In August 1993, he returned to Andina as commercial manager, a position he held until 1997.
Date of birth: July 27, 1952
|
| | |
Carlos A. Lohmann | | General Manager of
Río de Janeiro Refrescos Ltda.
| | Mr. Lohmann joined the Company in August 1997, as general manager of Refrescos, our Brazilian subsidiary. He began his professional career in 1970 at IBM Brazil and throughout his approximately 25-year career at IBM, served in different positions, including human resources manager, commercial operations support manager, branch office operations manager, director of customer services in Brazil and in New York, director of customer financing and general manager of IBM Leasing. In 1992, he was appointed general manager of the PC Company, a joint venture between IBM and Machline Group, in Sáo Paulo, Brazil, and in 1995 he was appointed general manager of the PC Company in Florida, United States.
Date of birth: October 20, 1945
|
| | |
Alejandro A. Feuereisen | | General Manager of
Embotelladora del Atlántico S.A.
| | Mr. Feuereisen has been employed as general manager of Embotelladora del Atlántico S.A. From September 1995 to July 1998, Mr. Feuereisen was a commercial manager of Embotelladora del Atlántico S.A. From 1993 to 1995, he was a sales manager at Andina and, from 1981 to 1992, an officer at Citibank, Santiago de Chile. During the last three years of his tenure at Citibank, Mr. Feuereisen was vice president of the International Financial Institutions Group. From 1977 to 1980, he served as financial analyst at Leasing Andino S.A., a subsidiary of Banco de Chile.
Date of birth: May 19, 1953
|
| | |
Cesar Vargas P. | | General Manager of Vital S.A. and Vital Aguas S.A. | | Mr. Vargas is the general manager of Vital S.A. and Vital Aguas S.A. and joined the Company in 1978. Mr. Vargas began working as project engineer and head of electric maintenance. In 1985, he was appointed head of the juice division plant of Industrial Sud Andina S.A. in Santiago, a former subsidiary of Andina, where he was subsequently promoted to deputy production manager of the juice and mineral water division. In 1992, Vital S.A. was created and Mr. Vargas was appointed operations manager, a position that he held until 1998, when he was appointed general manager.
Date of birth: May 26, 1957
|
The majority shareholders’ agreement for the election of directors is contained in Inversiones Freire S.A.’s Shareholder Agreement and further explained on Item 7 “Major Shareholders and Related Companies”. In addition, pursuant to the terms and conditions of the Deposit Agreement, if no instructions are received by The Bank of New York, as depositary, it shall give a discretionary proxy to a person designated by the chairman of the board of directors of Embotelladora Andina with respect to the shares or other deposited securities that represent the ADRs.
As of December 31, 2007, our board of directors consisted of the following directors and alternate directors:
Name |
| Title |
| Information |
Juan Claro | | Chairman of the Board of Directors | | Has been a member of the board of directors since April 2004. Principal occupation: Entrepreneur Other directorships: Pesquera Friosur, Lafarge Chile S.A., Antofagasta Minerals S.A., Antofagasta PLC, Empresas CMPC S.A., Red Televisa Chilevisión S.A., Entel Chile S.A. Date of birth: November 7, 1950 |
| | | | |
Salvador Said (1) | | Vice Chairman of the Board of Directors | | Has been a member of the board of directors since April 1992. Principal occupation: Executive director of Said Holding Group Other directorships: Edelpa S.A., Parque Arauco S.A., The Endeavour Initiative Inc., Isapre Cruz Blanca S.A., BBVA Chile, Leasing, Mutual Funds and Financial Consulting Subsidiaries, Generación Empresarial y Telmex Chile. Date of birth: September 16, 1964 |
| | | | |
José Antonio Garcés, Jr. | | Director | | Has been a member of the board of directors since May 1991. Principal occupation: General manager of Inversiones San Andrés Ltda. Other directorships: Banvida S.A.; Inmobiliaria FFV S.A., Fundación Paternitas, Viña Montes, Viña Garcés Silva Ltda., and Carnes Ñuble Ltda. Date of birth: March 1, 1966 |
| | | | |
Arturo Majlis | | Director | | Has been a member of the board of directors since April 1997. Principal occupation: Principal partner of the law offices of Grasty, Quintana, Majlis Compañía Other directorships: Asesorías e Inversiones Til Til S.A.; Banchile Seguros de Vida. Date of birth: April 7, 1962 |
| | | | |
James Robert Quincey | | Director | | Has been a member of the board of directors since April 2006. Principal occupation: President of Coca-Cola de Mexico Other directorships: Coca-Cola Embonor S.A. Date of birth: January 8, 1965 |
| | | | |
Gonzalo Said (1) | | Director | | Has been a member of the board of directors since May 1993. Principal occupation: General manager and director of Inversiones Newport Ltda. |
48
Name |
| Title |
| Information |
| | | | Other directorships: BBVA Administradora General de Fondos S.A., Inmobiliaria Don Aurelio Ltda., y Telemercados Europa S.A. Date of birth: October 16, 1964 |
| | | | |
Heriberto Urzúa (2) | | Director | | Has been a member of the board of directors since April 2006. Principal occupation: Company directorships Other directorships: Agrícola Ariztía S.A., Inversiones Alsacia S.A., Hortifrut S.A. Promoplan y Otros S.A., RELSA S.A., Forus S.A., Telmex S.A., y La Polar S.A. Date of birth: November 28, 1962 |
| | | | |
Ernesto Bertelsen | | Alternate Director to Juan Claro | | Has been a member of the board of directors since April 2006. Principal occupation: Company directorships Other directorships: Banco BBVA and Factorline S.A. Date of birth: March 18, 1945 |
| | | | |
José Domingo Eluchans | | Alternate Director to Salvador Said. | | Has been a member of the board of directors since April 2005. Principal occupation: Partner at José Domingo Eluchans Asesorías Limitada Other directorships: Banco BBVA, Envases del Pacífico S.A. Date of birth: August 6, 1953 |
| | | | |
Patricio Parodi | | Alternate Director to José Antonio Garcés, Jr. | | Has been a member of the board of directors since April 2005. Principal occupation: General manager Consorcio Financiero S.A. and subsidiaries Other directorships: Banmédica S.A.; Isapre Vida Tres S.A.; Isapre Banmédica S.A., Help S.A.; Clínica Dávila S.A.; Sociedad Punta del Cobre S.A.; Pacífico V Región S.A.; Maderas Condor S.A., Salfacorp S.A., Invernova S.A. and Moletto Hermanos Date of birth: April 28, 1963 |
| | | | |
José Miguel Barros | | Alternate Director to Arturo Majlis | | Has been a member of the board of directors since April 2005. Principal occupation: Director and Partner of Larrain Vial S.A. Other directorships: Bata Chile S.A., Cerámica Santiago S.A., Viña Santa Carolina S.A. and Multiexport Foods S.A. Date of birth: March 1, 1964 |
| | | | |
Jorge Hurtado | | Alternate Director to James Quincey | | Has been a member of the board of directors since January 1998. Principal occupation: Directing Partner of Agrícola y Comercial Yerbas Buenas S.A. Other directorships: CMPC Tissue S.A.; Vendomática S.A.; Adviser Drilling S.A., Proemsa S.A., Trabajando.com Chile S.A., and Sociedad Anónima de Deportes Club de Golf Santiago Date of birth: March 25, 1946 |
| | | | |
José María Eyzaguirre | | Alternate Director to Gonzalo Said | | Has been a member of the board of directors since April 2006. Principal occupation: Lawyer, Partner at Estudio Claro y Cia. Other directorships: N/A Date of birth: May 22, 1962 |
| | | | |
Pedro Vicente (2) | | Alternate Director to Heriberto Urzúa | | Has been a member of the board of directors since April 2004. Principal occupation: Director of Capital Consulting Services S.A. Date of birth: August 11, 1951 |
(1) Salvador Said S. is the cousin of Gonzalo Said H.
(2) Independent from controlling shareholder pursuant to Article 50 bis, paragraph 6 of the Chilean Public Company Law N° 18,045.
49
Directors and alternate directors are paid an annual fee for attendance to meetings of the board of directors.directors and committees. The total compensation paid to each director or alternate director during 2006,2007, which was approved by our shareholders, was as follows:
| | |
|
|
| Compensation
(millions of Ch$)(1) )(1)
|
|
Juan Claro G. | | 8698 | |
Salvador Said S. | | 90 | |
José Antonio Garcés S. (junior) | | 8597 | |
Arturo Majlis A. | | 90 | |
James Quincey B. | | 45 | |
Gonzalo Said H. | | 81 |
Arturo Majlis A.
| | 79 |
Salvador Said S.90
| | 79 |
Heriberto Urzúa S. | | 35 |
James Quincey B.
| 52 | 29 |
Ernesto Bertelsen R. | | 1618 | |
José D. Eluchans U. | | 1618 | |
Patricio Parodi G. | | 18 | |
José M. Barros V. | | 1618 | |
Patricio ParodiJorge Hurtado G.
| | 1618 | |
José Eyzaguirre B. | | 18 | |
Pedro A. Vicente M. | | 16 |
Jorge Hurtado G.
| | 14 |
Albert J. Cussen M.(2)18
| | 12 |
José Eyzaguirre B.
| | 12 |
Glenn Jordan S.(2)
| | 7 |
Manuel E. Bezanilla U.(2)
| | 4 |
(1) | The amounts paid to each director and director’s alternate for attendance at board meetings varies in accordance with the position held and the time period during which such position was held. |
(2) | Member of the board of directors until April 2006. |
(1) The amounts paid to each director and director’s alternate for attendance at board meetings varies in accordance with the position held and the time period during which such position was held.
For the year that ended on December 31, 2006,2007, the aggregate amount of compensation we paid to all directors and executive officers as a group was Ch$3,4114,438 million of which Ch$2,8083,751 million was paid to our executive officers. We do not disclose to our shareholders or otherwise make available public information as to the compensation of our executive officers on an individual basis. We do not maintain any pension or retirement programs for our directors or executive officers. See “—Employees.”
Board Practices
Our board of directors has regularly scheduled meetings at least once a month, and extraordinary meetings are convened when called by the chairman or when requested by one or more directors. The quorum for a meeting of the board of directors is established by the presence of an absolute majority of its regular directors, without taking alternate directors into consideration, unless regular directors are absent. Resolutions are passed by the affirmative vote of an absolute majority of those directors present at the meeting, with the chairman determining the outcome of any tie vote.
1. Executive Committee
Company management
The Company’s Board of Directors is counseled by an executive committeeExecutive Committee that proposes Company policies and is comprised of four members ofby the board; the chairman of the board who participates by his or her own right, and the chief executive officer of the Company. This committee meets permanently throughout the year and it normally holds an average of two monthly sessions. As counselor to the board of directors, the executive committee proposes company policies in accordance with the results for the respective periods that have been disclosed in the annual reports. On April 25, 2006,following Directors: Mr. Salvador Said Somavía, Mr. José Antonio Garcés Silva (junior), Mr. Arturo Majlis Albala, and Mr. Gonzalo Said Handal, and Mr. Salvador Said Somavíawho were appointed memberselected during the Regular Board Session N° 1002 held April 24, 2007. It is also comprised by the Chairman of the executive committee.Board, Mr. Juan Claro González and by the Chief Executive Officer, Mr. Jaime García Rioseco, who participate by own right. This committee meets permanently throughout the year and normally holds one or two weekly sessions.
2. Directors’ Committee
By resolution approved at the regular shareholders’ meeting held on April 17, 2001, and in
In accordance with the requirements of the new article 50 bis of the Chilean Public Company Law No.N° 18,046 in addition to Law N° 19,705, we established a directors’ committee whose purpose has been the strengtheningto self regulate and self-regulation of the Company, exercisingstrengthen Companies incorporating more controlsupervision over management’s activities.activities, during the year 2001 a Directors’ Committee was created.
By resolution approved at the regular shareholders’ meeting held on April 19, 2006, and by resolution of board session N°988
50
In accordance with Shareholders’ Meeting held April 25, 2006,17, 2007 and during Board Session N° 1002 held April 24, 2007 the following Directors were ratified as members of this Committee: Mr. Juan Claro (chairman)González (Committee Chairman), Mr. José Antonio Garcés Silva (junior) and Mr. Heriberto Urzúa Sanchez were appointed as membersSánchez. Should any of the directors’ committee. In the event that any of them shouldmembers be unable to attend theya Committee session, their respective alternates will be replaced by:be: Mr. Ernesto Bertelsen Repetto, Mr. PatricioMr.Patricio Parodi Gil and Mr. PedroMr.Pedro Arturo Vicente Molina, respectively.
The mainduties developed by this Committee during 2007, following the same categorization of faculties and responsibilities established by Article 50 bis of Company Law N° 18,046 were the directors’ committee are:following:
toa. To examine the reports of external auditors and account inspectors, accordingly, of the balance sheets and other financial statements, presented by the administrators or our liquidators of the Company to the shareholders, and to take a position on such reports before they are presented to shareholders for their approval;approval.
tob. In 2007 these matters were addressed during Sessions: N° 45, on January 30; N°46 on March 26; N°47 on April 23; N° 48 on May 28; N°50, on July 20; N°51 on August 27; N° 52 on September 24; N° 53 on October 22; and N° 54 on November 22.
c. To propose the external auditorsExternal Auditors and the private risk rating agenciesPrivate Rating Agencies to the board, which are suggested atBoard of Directors that will then be submitted to the shareholders’ meeting.Shareholders’ Meeting. In the event of disagreements with the directors’ committee,Committee, the boardBoard of Directors may make its own suggestionproposals and both shallwill be submitted to consideration of the shareholders;Shareholders’ Meeting.
to reviewd. This matter was addressed during Session N° 46 on March 26, 2007.
e. Examine information regarding the operations as referred to by articlesArticles 44 and 89 of law 18,046 or the Chilean Public Company Law and to create a report concerning those operations to be sent to the chairman of the board;on these operations.
to examine the remunerationf. In 2007 these matters were addressed during Sessions: N°45 on January 30; N°46 on March 26; and N°50 on July 20.
g. Examine salary and compensation plans of senior managersfor Managers and executives; andPrincipal Officers.
anyh. This matter was addressed during Session N°54 on November 22, 2007.
i. All other matter specified in the Company’smatters required by company bylaws or that may be required by a regular shareholders’ meetingthe Shareholders’ Meeting or by the boardBoard of directors.
Directors. The directors’following matters were addressed during 2007:
· Review Anonymous Reports: Sessions: N° 45 on January 30; N°46 on March 26; N° 47 on April 23; N° 49 on June 22; N° 51 on August 27; N° 52 on September 24; N° 53 on October 22; N° 54 on November 22; and N° 55 on December 13.
· Review and approve 2006 Annual Report: Session N° 46 on March 26.
· Review and approve 2006 20F: Session N° 49 on June 22.
· Review Contingencies: Session N° 54 on November 22.
· Status of External Auditors Recommendations: Sessions: N° 46 on March 26; N° 47 on April 23; and N° 48 on May 28.
· Operating Budget 2007 Committee: Session N° 45 on January 30.
· Review 2007 Internal Audit Plan: Session N° 46 on March 26.
· Implementation Status of SAP in Brazil: Session N° 51 on August 27.
· Operations Related to Concentrate Price Increase of The Coca-Cola Company: Session N° 54 on November 22.
· Internal Control Model and Official Communication 422 of the SVS*: Session N° 55 on December 13.
We do not have a committee has examined several contingencies arising from the Company’s different operationsdedictated exclusivel to compensation matters, since review of salary and has followed internal procedures in order to comply with the new regulations imposedcompensation plans is already performed by the Sarbanes-Oxley Act of 2002 of the United States.
Directors’ Committee.3.Sarbanes-Oxley Audit Committee
On July 26, 2005, the boardBoard of directorsDirectors agreed that in order to comply with the requirements of the New York Stock Exchange or NYSE and the Securities and Exchange Commission or SEC, it was necessary to establish an audit committeeAudit Committee before July 31, 2005, so as to comply with the requirements of the Sarbanes-Oxley’s Act of 2002.Sarbanes-Oxley Act. During board sessionBoard Session N° 9881002 held April 25, 2006,24, 2007, Mr. Juan Claro González (chairman)(Committee Chairman), Mr. José Antonio Garcés Silva (junior) and Mr. Heriberto Urzúa Sánchez were electedratified as members of the audit committee.Audit Committee. Our boardBoard of directorsDirectors determined that Mr. Juan Claro González and Mr. Heriberto Urzúa Sánchez comply with the independence standards set forth in the Sarbanes-Oxley Act, of 2002, SEC and NYSE regulations. Mr. Heriberto Urzúa Sánchez has
51
been appointed by the Board of Directors as the financial expert in accordance with the definitions of the listing standards of the NYSE and the Sarbanes-Oxley Act.
The resolutions, agreements and organization of the audit committeeAudit Committee are governed when applicable, by the rules relating to board meetingsBoard Meetings and to the Company’s directors’ committee.Directors’ Committee. Since its creation, the sessions of the audit committeeAudit Committee have been held with the directors’ committee,Directors’ Committee, since some of the functions are very similar and the members of both of these committeesCommittees are the same.
The Audit Committee Charter defines the duties and responsibilities of the audit committee are defined in the audit committee charter, which is available to all interested parties through our website. Further, the audit committee this Committee. The Audit Committeeis responsible for analyzing the Company’s financial statements; supporting the financial supervision and rendering of accounts; ensuring management’s development of reliable internal controls; ensuring compliance by the audit department and external auditors with their respective roles; and reviewing of auditing practices.
Mr. Heriberto Urzúa Sánchez has been appointed by the board of directors as our “financial expert” as defined in the listing standards of the NYSE and the Sarbanes-Oxley Act of 2002.
Employees
On December 31, 2006,2007, we had approximately 4,8154,911 employees, including 1,0571,243 in Chile, 2,1602,116 in Brazil, and 1,5981,652 in Argentina. Of these employees, 140273 were temporary employees in Chile and 288305 in Argentina. During the South American summer, it is customary for us to increase the number of employees in order to meet peak demand.
On December 31, 2006, 597, 255,2007, 634, 290, and 1,0111,050 of our employees in Chile, Brazil and Argentina, respectively, were members of unions.
The following table represents a breakdown of our employees for the years ended December 31, 2007, 2006 2005 and 2004:2005:
| | | 2007 | |
| | | Chile | | Brazil | | Argentina | |
| | | Total | | Union | | Non-
Union | | Total | | Union | | Non-
Union | | Total | | Union | | Non-
Union | |
Executives | | | 35 | | 0 | | 35 | | 77 | | 0 | | 77 | | 69 | | 0 | | 69 | |
Technicians and professionals | | | 459 | | 238 | | 221 | | 1,136 | | 93 | | 1,043 | | 317 | | 0 | | 317 | |
Workers | | | 476 | | 396 | | 80 | | 803 | | 197 | | 606 | | 961 | | 765 | | 196 | |
Temporary workers | | | 273 | | 0 | | 273 | | 0 | | 0 | | 0 | | 305 | | 285 | | 20 | |
Total | | | 1,243 | | 634 | | 609 | | 2,016 | | 290 | | 1,726 | | 1,652 | | 1,050 | | 602 | |
| | | | | | | | | | | | | | | | | | | | | | | | | | | | | | | | | | | | | |
| | | 2006 | | 2006 | |
| | | Chile | | Brazil | | Argentina | | Chile | | Brazil | | Argentina | |
| | | Total | | Union | | Non-
Union | | Total | | Union | | Non-
Union | | Total | | Union | | Non-
Union | | Total | | Union | | Non-
Union | | Total | | Union | | Non-
Union | | Total | | Union | | Non-
Union | |
Executives | | 26 | | 0 | | 26 | | 70 | | 2 | | 68 | | 67 | | 0 | | 67 | | 26 | | 0 | | 26 | | 70 | | 2 | | 68 | | 67 | | 0 | | 67 | |
Technicians and professionals | | 429 | | 199 | | 230 | | 980 | | 121 | | 859 | | 325 | | 0 | | 325 | | 429 | | 199 | | 230 | | 980 | | 121 | | 859 | | 325 | | 0 | | 325 | |
Workers | | 462 | | 392 | | 70 | | 1,110 | | 132 | | 978 | | 918 | | 750 | | 168 | | 462 | | 392 | | 70 | | 1,110 | | 132 | | 978 | | 918 | | 750 | | 168 | |
Temporary workers | | 140 | | 6 | | 134 | | 0 | | 0 | | 0 | | 288 | | 261 | | 27 | | 140 | | 6 | | 134 | | 0 | | 0 | | 0 | | 288 | | 261 | | 27 | |
| | | | | | | | | | | | | | | | | | | |
Total | | 1,057 | | 597 | | 460 | | 2,160 | | 255 | | 1,905 | | 1,598 | | 1,011 | | 587 | | 1,057 | | 597 | | 460 | | 2,160 | | 255 | | 1,905 | | 1,598 | | 1,011 | | 587 | |
| | | | | | | | | | | | | | | | | | | | | | | | | | | | | | | | | | | | | |
| | | 2005 | |
| | | Chile | | Brazil | | Argentina | |
| | | Total | | Union | | Non-
Union | | Total | | Union | | Non-
Union | | Total | | Union | | Non-
Union | |
Executives | | | 23 | | 0 | | 23 | | 74 | | 2 | | 72 | | 40 | | 0 | | 40 | |
Technicians and professionals | | | 407 | | 154 | | 253 | | 1,008 | | 89 | | 919 | | 241 | | 0 | | 241 | |
Workers | | | 469 | | 370 | | 99 | | 1,018 | | 128 | | 890 | | 894 | | 734 | | 160 | |
Temporary workers | | | 153 | | 0 | | 153 | | 0 | | 0 | | 0 | | 279 | | 216 | | 63 | |
Total | | | 1,052 | | 524 | | 528 | | 2,100 | | 219 | | 1,881 | | 1,454 | | 950 | | 504 | |
| | | | | | | | | | | | | | | | | | |
| | | 2005 |
| | | Chile | | Brazil | | Argentina |
| | | Total | | Union | | Non-Union | | Total | | Union | | Non-Union | | Total | | Union | | Non-Union |
Executives | | 23 | | 0 | | 23 | | 74 | | 2 | | 72 | | 40 | | 0 | | 40 |
Technicians and professionals | | 407 | | 154 | | 253 | | 1,008 | | 89 | | 919 | | 241 | | 0 | | 241 |
Workers | | 469 | | 370 | | 99 | | 1,018 | | 128 | | 890 | | 894 | | 734 | | 160 |
Temporary workers | | 153 | | 0 | | 153 | | 0 | | 0 | | 0 | | 279 | | 216 | | 63 |
| | | | | | | | | | | | | | | | | | |
Total | | 1,052 | | 524 | | 528 | | 2,100 | | 219 | | 1,881 | | 1,454 | | 950 | | 504 |
| | | | | | | | | | | | | | | | | | |
| |
| | | 2004 |
| | | Chile | | Brazil | | Argentina |
| | | Total | | Union | | Non-Union | | Total | | Union | | Non-Union | | Total | | Union | | Non-Union |
Executives | | 21 | | 0 | | 21 | | 70 | | 2 | | 68 | | 38 | | 0 | | 38 |
Technicians and professionals | | 387 | | 155 | | 232 | | 947 | | 85 | | 862 | | 217 | | 0 | | 217 |
Workers | | 482 | | 338 | | 144 | | 994 | | 125 | | 869 | | 845 | | 675 | | 170 |
Temporary workers | | 126 | | 0 | | 126 | | 0 | | 0 | | 0 | | 300 | | 279 | | 21 |
| | | | | | | | | | | | | | | | | | |
Total | | 1,016 | | 493 | | 523 | | 2,011 | | 212 | | 1,799 | | 1,400 | | 954 | | 446 |
| | | | | | | | | | | | | | | | | | |
Management believes that it has good relations with its employees. For example, in Chile, Andina received two awards from independent organizations in 2003 highlighting our labor relations and the positive effects they have on our business. Andina has been awarded the “2005 National Quality Award” granted by the Ministry of Economy of the Chilean Government through the area of “Chile Calidad” (“Chile Quality”) every year. The process began in the year 2003 with an ambitious Quality Project enabling the unique achievement in Latin America of the four most relevant certifications in terms of quality (ISO). This award is framed within the philosophy of the company’s performance associated with the search of “excellence” aimed towards increasing the value contributed by all the parties involved with the business: clients, employees, suppliers and shareholders.
In Chile we have continued provisioningmake provision for severance indemnities for every year of employment to which employees are entitled in accordance with Andina’sour Collective Bargaining Agreements and labor legislations, and that is equal toin the amount of one month’s salary for every year of employment subject to certain restrictions. In addition, we benefitcomplement our employees through aemployees’ contribution to aour health insurance system, complementing the amount directly paid by the employee, thus decreasing health costs for the employees’ families. Employees are required to contribute funds for financing pension funds. These pension funds, which are mainly managed by private entities.
In Chile, 54%approximately 65% of employees are members of labor unions. During 2006,
On June 1, 2007, Andina successfully executed a frame agreement with the 4 Labor Unions, by which the Company and the Unions agreed to work together in mutual collaboration and to resolve conflicts as they arise. Additionally, on July 3, 2006, the Company anticipatively executedanticipatedly signed a new collective bargaining agreementCollective Bargaining Agreement with Union No. 3,N°2 that mainly representing sales personnel. This collective bargaining agreement hasrepresents personell from the areas of managements, logostics, and operations specialists, for a termperiod of 4 years beginning
(beginning June 1, 2007 until May 31, 2011). Additionally on June 26, 2007 Andina signed a new Collective Bargaining Agreement with Union N°1 that mainly represents employees from the Bottling area, for a period of 2 years (beginning June 1, 2007 until May 31, 2009) Said agreement was signed after a 20-day legal strike that affected 223 workers out of a total of 886 who work for the company.August 1, 2006 and expiring on July 31, 2010. As a result of the good relationship with the Unions, Andina did not experience any work stoppages or manifestations during 2006.
In Brazil, collective14% of employees are members of labor unions. Collective bargaining agreements are negotiated on an industry-wide basis. Individual companies can therefore negotiate special terms for their affiliates that apply to all employees in each jurisdiction where companies have a plant. Collective bargaining agreements are generally binding for one year. With respect to Refrescos, there are seven collective bargaining agreements currently in force: (1) five agreements for employees in the State of Rio de Janeiro; (a) the Soft Drink Industry Employees’ Union agreement from October 1, 20062007 to September 30, 2007;2008; (b) the Salesmen Union agreement from October 1, 20062007 to September 30, 2007;2008; (c) the “Stack Machine” Operator Union agreement from May 1, 20062007 to April 30, 2007;2008; (d) the Chemical Product Industry Employees’ of Nova Iguaçu Union agreement form February 1, 20062007 to August 31, 2007;2008; (e) the Driver and Helper of the Lagos Region Union agreement from May 1, 20062007 through April 30, 2007;2008; and (2) two agreements for employees in the State of Espirito Santo: (a) the Nourishment Union agreement from July 1, 20052007 to June 30, 2006 (currently in the process of being renewed);2008; (b) the Salesmen Union agreement from December 1, 20052007 to November 30, 2006 (currently in the process of being renewed).2008. Such agreements do not require us to increase wages on a collective basis. Selected increases were granted, however, mainly in the manufacturing area. We provide benefits to our employees according to the relevant legislation and to the collective bargaining agreements. Refrescos experienced its most recent work stoppages in January and October 1990, for eight days in each instance.
In Argentina, Edasa’s employees are parties to collective bargaining agreements and 64.8%64% of them (including the Packaging Division (ex Cipet) are represented by local workers’ unions associated with a national federation of unions. The Argentine Chamber of Non-Alcoholic Beverages of the Argentine Republic (Cámara Argentina de Industria de Bebidas sin Alcohol de la República Argentina (the “Chamber”) and the Argentine Workers Federation of Carbonated Water (Federación Argentina de Trabajadores de Aguas Gaseosas)(the “Federation”) are parties to collective bargaining agreements that expired in April 1997, but continue to be in effect until renegotiated. On March 31, 20052006 the Chamber and the Federation entered into a one-year term collective agreement, increasing the minimum wage. This agreement was extended until June 30, 2006 and re-negotiated during August of 2006 whichthat was in force until and including the month of March 2007. However, the terms of this agreement remain in effect notwithstanding the fact that it has not been formalized. Currently,On June 21, 2007 the Chamber and the Federation are negotiating the final terms ofentered into a new agreement.collective bargaining agreement establishing new salaries, new non-salary benefits and company contributions, that is in full force and effect until April 30, 2008.
Argentine law requires severance payments upon dismissal without cause in an amount at least equal to an average of one-month’s wages for each year of employment or a fraction thereof if employed longer than three months. Severance payments are subject to maximum and minimum amounts.
On January 6, 2001, the Argentine government, as a result of the Argentine economic crisis, enacted Law 25,561 which is designed to seriously limit dismissals of employees by employers for 180 days. Employers, however, can still dismiss their employees if they are willing to compensate the employee with twice the regular severance payment. The effects of these limits were extended until the end of December 2004.
On December 15, 2004, the Argentine government approved law 25,972 that forces employers to increase the quantity of regular severance payments for dismissals as long as the unemployment rate of Argentina is higher than 10%. Consequently, between January 1, 2005 and November 30, 2005, the quantity of regular severance payments for dismissals increased by 80%. As of December 1, 2005, this increase of regular severance payments for dismissals was reduced and fixed at 50%. However, the employer will be exemptedwas exempt from crediting the increase of regular severance payments for dismissals if the date of hiring of the dismissed employee iswas later than January 2003 and that his/her hiring had implied an increase in the total number of employees that the employer had as of December 31, 2002.
In September of 2007 the Argentine government fulfilled its goal to reduce the unemployment rate inIn 1999, Edasa built a new plant in53
Argentina to less than 10% and therefore the Provinceincrease of Córdoba withseverance indemnities became extinct and the latest technological advances consolidating its operations inapplicable regime is the new plant. During July 2002, Edasa performed a restructuring process aimed at transforming its productive centers in the Provinces of Santa Fe and Mendoza into logistic centers and at centralizing its production in the Province of Córdoba. Consolidated operations and centralized production in the new plant resulted in greater than normal labor turnover with extraordinary one-time labor costs.same one that existed prior to year 2001.
As of December 31, 2006,2007, Edasa had no pension fund liabilities. Employees contribute, on the basis of automatic withholding, to either the privately administered retirement funds or to the government social security system. Most of the health system in the Argentine territory is run by the unions through contributions from union and non-union employees.
Share Ownership of Directors, Members of the Directors’ Committee and Senior Executives
The following table sets forth the amount and percentage of our shares beneficially owned by our directors, members of the Directors’ Committee and senior executives as of December 31, 2006.2007.
| | | | | | | | | | | | | | | | | | | | | | | | |
| | | Series A | | Series B |
Shareholder | | Beneficial
Owner | | % Class | | Direct Owner | | % Class | | Indirect Owner | | % Class | | Beneficial
Owner | | % Class | | Direct Owner | | % Class | | Indirect Owner | | % Class |
José Antonio Garcés Silva (junior) | | — | | — | | — | | — | | — | | — | | — | | — | | — | | — | | 3,523,097 | | 0.9268 |
Arturo Majlis Albala | | — | | — | | — | | — | | 2,150 | | 0.0006 | | — | | — | | 5,220 | | 0.0014 | | — | | — |
Salvador Said Somavía | | — | | — | | — | | — | | 1,150 | | 0.0003 | | — | | — | | — | | — | | 3,539,295 | | 0.9311 |
Gonzalo Said Handal | | 50,001,651 | | 13.1536 | | — | | — | | — | | — | | 15,488,863 | | 4.0745 | | — | | — | | 5,585,787 | | 1.4694 |
| | Series A | | Series B | |
Shareholder | | Beneficial
Owner | | %
Class | | Direct
Owner | | %
Class | | Indirect
Owner | | %
Class | | Beneficial
Owner | | %
Class | | Direct
Owner | | %
Class | | Indirect
Owner | | %
Class | |
José Antonio Garcés Silva (junior) | | — | | — | | — | | — | | — | | — | | — | | — | | — | | — | | 5,033,002 | | 1.3240 | |
Arturo Majlis Albala | | — | | — | | — | | — | | 2,150 | | 0.0006 | | — | | — | | 5,220 | | 0.0014 | | — | | — | |
Salvador Said Somavía | | — | | — | | — | | — | | 1,022 | | 0.0003 | | — | | — | | — | | — | | 2,932,259 | | 0.7714 | |
Gonzalo Said Handal | | 50,001,651 | | 13.1536 | | — | | — | | — | | — | | 11,761,462 | | 3.0940 | | — | | — | | 4,241,565 | | 1.1158 | |
ITEM 7.MAJOR SHAREHOLDERS AND RELATED PARTY TRANSACTIONS
ITEM 7.
| MAJOR SHAREHOLDERS AND RELATED PARTY TRANSACTIONS |
Major Shareholders
The following table sets forth certain information concerning beneficial ownership of our capital stock at December 31, 2006,2007, with respect to the principal shareholders known to us who maintain at least a 5% beneficial ownership in our shares and with respect to all of our directors and executive officers as a group:
| | | | | | | | |
| | | Series A | | Series B |
Shareholder | | Shares | | % Class | | Shares | | % Class |
Freire(1)(2) | | 200,006,603 | | 52.61 | | 161,269,184 | | 42.42 |
The Bank of New York(3) | | 28,198,668 | | 7.42 | | 47,202,108 | | 12.42 |
The Coca-Cola Company, directly or through subsidiaries | | 41,962,864 | | 11.04 | | 41,962,864 | | 11.04 |
AFPs as a group (Chilean pension funds) | | 72,881,160 | | 19.17 | | 27,894,366 | | 7.34 |
Principal foreign mutual funds as a group | | 5,368,194 | | 1.41 | | 9,438,540 | | 2.48 |
Executive officers as a group | | 165,474 | | 0.04 | | 180,474 | | 0.05 |
Directors as a group(4) | | 50,004,951 | | 13.15 | | 28,142,262 | | 7.40 |
(1) | The ownership percentages listed above reflect the voting and economic interests of Andina’s shareholders. |
| | Series A | | Series B | |
Shareholder | | Shares | | % Class | | Shares | | % Class | |
Freire(1)(2) | | 200,006,603 | | 52.61 | | 161,070,784 | | 42.37 | |
The Bank of New York Mellon(3) | | 13,819,158 | | 3.64 | | 42,330,042 | | 11.14 | |
The Coca-Cola Company, directly or through subsidiaries | | 41,962,864 | | 11.04 | | 41,962,864 | | 11.04 | |
AFPs as a group (Chilean pension funds) | | 69,141,147 | | 19.19 | | 24,367,654 | | 6.41 | |
Principal foreign mutual funds as a group | | 5,360,475 | | 1.41 | | 6,624,912 | | 1.74 | |
Executive officers as a group | | 165,474 | | 0.04 | | 180,474 | | 0.05 | |
Directors as a group(4) | | 50,004,823 | | 13.15 | | 23,973,508 | | 6.31 | |
(2) | Freire does not hold either directly or indirectly any Series B shares. The amounts set forth correspond to Series B shares held by other companies, members of the controlling shareholder group, including: Inversiones Newport Ltda., Inversiones HB S.A, Inversiones Mar Adentro Ltda., Inversiones Caburga S.A., Inversiones San Andrés Limitada, and Inversiones Ledimor Chile Ltda. |
(1) The ownership percentages listed above reflect the voting and economic interests of Andina’s shareholders.
(3) | Acting as depositary for the ADRs. |
(2) Freire does not hold either directly or indirectly any Series B shares. The amounts set forth correspond to Series B shares held by other companies, members of the controlling shareholder group, including: Inversiones Newport Ltda., Inversiones HB S.A, Inversiones Mar Adentro Ltda., Inversiones Caburga S.A., Inversiones Nueva Sofía Ltda., and Inversiones Ledimor Chile Ltda.
(4) | Represents shares to which Gonzalo Said Handal, José Antonio Garcés Silva (junior), Salvador Said Somavía and Arturo Majlis Albala would claim direct and indirect. |
(3) Acting as depositary for the ADRs.
(4) Represents shares to which Gonzalo Said Handal, José Antonio Garcés Silva (junior), Salvador Said Somavía and Arturo Majlis Albala would claim direct and indirect.
Inversiones Freire S.A. holds a controlling interest in Andina. Freire is beneficially owned in equal interests by Alberto Hurtado F., José Said S., José Antonio Garcés S. (Senior), and Gonzalo Said Handal,H., the latter also a Director of Andina. Pursuant to an agreement among partners, dated May 29, 1992, which shall remain in effect for so long as Freire is in existence, each partner in Freire shall not, dispose of his pro rata portion of his shares of stock, unless in accordance with the previously mentioned Agreement.
At an extraordinary shareholders’ meeting held on September 30, 1996, our shareholders approved the Reclassification whereby each outstanding share of common stock was replaced by one newly issued Series A share and one Series B share. Series A shares have full voting power and are entitled to elect six of seven regular and alternate directors. Series B shares have no voting power besides the power to elect one regular and one alternate director and are entitled to a dividend equal to
54
10% more than any dividends received by Series A shareholders. The Reclassification was consummated on April 27, 1997. See “Item 4. Information on the Company—Part A. History and Development of the Company—History.” The Company’s major shareholders do not have different voting rights from those granted by the ownership of Series A shares and Series B shares.
In connection with The Coca-Cola Company’s investment in Andina, the Coca-Cola shareholders and Freire entered into a Shareholders’ Agreement dated September 2, 1996 (the “Shareholders’ Agreement”), providing for certain restrictions on the transfer of shares of Andina capital stock by the Coca-Cola Shareholders and Freire. Specifically, Freire is restricted from transferring its Series A shares
without the prior authorization of The Coca-Cola Company. The Shareholders’ Agreement also provides for certain corporate governance and other matters, including the right of the Coca-Cola shareholders collectively to elect one regular and one alternate member of our board of directors so long as The Coca-Cola Company and its subsidiaries collectively own, in aggregate, at least 4% of the Series A shares. In addition, in related agreements, Freire granted the Coca-Cola shareholders an option, exercisable upon the occurrence of certain changes in the beneficial ownership of Freire, to acquire, all but not part, of our Series A shares held by Freire at a price and in accordance with procedures established in such agreements.
The total number of registered ADR holders Andina had at December 20062007 was 24 (1218 (9 in the Series A ADRs and 129 in the Series B ADRs). At December 31, 2006,2007, the ADRs represented 9.9%7.4% of the total number of our issued and outstanding shares. The Bank of New York Mellon, as depositary, is the only U.S. shareholder of record.
Related Party Transactions
In the ordinary course of our business, we engage in a variety of transactions with certain of our affiliates and related parties. Financial information concerning these transactions is set forth in Note 6 to our Consolidated Financial Statements. Article 89 of theLey de Sociedades Anónimas (the “Chilean Companies Law”) requires that our transactions with related parties be on a market basis or on similar terms to those customarily prevailing in the market. We are required under Article 89, to compare the terms of any such transaction to those prevailing in the market at the date the transaction is to be entered into. Directors of companies that violate Article 89 are liable for losses resulting from such violation. In addition, Article 44 of the Chilean Public Companies Law, provides that any transaction in which a director has a personal interest or is acting on behalf of a third-party, must be previously approved by the board of directors, which will do so only when it has been informed of such director’s interest and the terms of such transaction are similar to those prevailing in the market.
Pursuant to an amendment introduced to the Chilean Public Companies Law in December 2000, if the proposed transaction involves material amounts, the board of directors must previously declare that such transaction is consistent with conditions prevailing in the market. If it is not possible to reach such a judgment, the board of directors may appoint two independent evaluators. The evaluators’ final conclusions must be presented to the shareholders’ and directors’ for their consideration for a period of 20 business days, during which shareholders representing 5% or more of the issued voting shares may request the board of directors to call a shareholders’ meeting to resolve the matter by a majority of two-thirds of the issued voting shares. For the purposes of this regulation, the Chilean Public Companies Law provides that the amount of a proposed transaction will be material when it exceeds 1% of the company’s paid in capital and reserves so long as the transaction is greater than UF 2,000. In all cases, a transaction is considered material when it exceeds UF 20,000. Our directors’ committee is charged with evaluating transactions with related parties and to report on these transactions to the full board of directors. See “Item 6. Directors, Senior Management and Employees—Directors’ Committee.”
All resolutions approving such transactions must be reported to the company’s shareholders at the next annual shareholders’ meeting. Violation of Article 44 may result in administrative or criminal sanctions and civil liability to shareholders or third parties who suffer losses as a result of such violation. However, the violation of Article 44 does not affect the validity of the transaction. Such a violation will grant the business entity, the shareholders or interested third parties the right to be indemnified for damages, and force the director involved in the transaction to make reparations to the business entity in an amount equivalent to the benefits that would have been derived for the business entity, absent negotiations by such director, his relatives, or his representatives, that do not imply other administrative or criminal sanctions.
Our management believes, to the best of its knowledge, that it has complied, in all material respects with Article 89 and Article 44 of the Chilean Public Company Law in all transactions with related parties. There can be no assurance, however, that the aforementioned regulations will not be modified in the future.
55
Bottler Agreements
In the course of our business, we have entered into agreements with The Coca-Cola Company. Bottler Agreements (as defined hereunder) are international standard contracts The Coca-Cola Company enters into with bottlers outside the United States for the sale of concentrates and beverage basis for certain Coca-Cola soft drinks and non-soft drink beverages. See “We rely heavily on our relationship with The Coca-Cola Company which has substantial influence over our business and operations.”
We are a party to the following bottler agreements: (i) with respect to the Chilean territory, a bottler agreement entered into between Andina and The Coca-Cola Company (the “Chilean Bottler Agreement”), which was extendedcelebrated on January 1, 2008 for a 5-year term of five years as of January 18, 2003;until December 31, 2012; (ii) with respect to the Brazilian territory, a bottler agreement between Refrescos and C-C Brazil with The Coca-Cola Company as an intervening party (collectively, the “Brazilian Bottler Agreement”), which is due towas executed in advance of its effecteive date and will expire on April 2, 2008;October 4, 2013; (iii) with respect to the Argentine territory, bottler agreements, between Edasa and The Coca-Cola Company (the “Argentine Bottler Agreements”), which will expire in February of 2012; and (iv) with respect to the Chilean territory, a Juice Bottling Agreement was subscribed on December 31, 1998, with Minute Maid International due to expire on December 31, 2008, renewable for a new 7- year period. This agreement was terminatedentered into on December 22, 2005 and on that same date a Juice Bottler Agreement was subscribed between Vital S.A. and The Coca-Cola Company for the production, processing, and bottling of products under the brands Andina Frut, Andina Hi-C and Kapo, which will expire on December 31, 2015; and (v) with respect to the Chilean territory, a Water Manufacturing and Packaging Agreement was subscribed on that same dateDecember 22, 2005 between The Coca-Cola Company and Vital Aguas S.A. (formerly VA S.A.1) for the preparation and packaging of beverages that will be in effect until December 31, 2015, regarding the brands Vital, Chanqueahue, Vital de Chanqueahue and DASANIDasani (purified water version) and (vi) with respect to the Argentine territory a juiceJuice and water bottler agreement. Water Bottler Agreement was subscribed on February 10, 2007 that will be in effect for two years.
Bottler Agreements are renewable upon request by the bottler and at the sole discretion of The Coca-Cola Company. We cannot assure you that the Bottler Agreements will be renewed upon their expiration, and even if they are renewed, we cannot assure you that the agreements will be renewed on the existing terms.
The Bottler Agreements provide that we will purchase our entire requirement of concentrates and beverage basis for Coca-Cola soft drinks and other Coca-Cola beverages from The Coca-Cola Company and other authorized suppliers. Although under the Bottler Agreements The Coca-Cola Company, in its sole discretion, may set the price of concentrates and beverage basis, among other terms, we set the price of products sold to retailers at our discretion, subject only to certain price restraints.
We are the sole producer of Coca-Cola soft drinks and other Coca-Cola beverages in itsour franchise territories. Although this right is not exclusive, The Coca-Cola Company has never authorized any other entity to produce or distribute Coca-Cola soft drinks or other Coca-Cola beverages in such territories, and we expect that it will not do so in the future, although we cannot assure you to that effect.in the future it will not do so. In the case of post-mix soft drinks, the Bottler Agreements explicitly establish such non-exclusive rights.
The Bottler Agreements include an acknowledgment by us that The Coca-Cola Company is the sole owner of the trademarks that identify the Coca-Cola soft drinks and other Coca-Cola beverages and of any secret formula used in concentrates.
All distribution must be in authorized containers. The Coca-Cola Company has the right to approve, at its sole discretion, any and all kinds of packages and containers for beverages, including their
size, shape and any of their attributes. The Coca-Cola Company has the authority at its sole discretion to redesign or discontinue any package of any of the Coca-Cola products, subject to certain limitations, so long as Coca-Cola soft drinks and other Coca-Cola beverages are not all discontinued at the same time. We are prohibited from producing or handling any other beverage products, other than those of The Coca-Cola Company, or other products or packages that would imitate, infringe or cause confusion with the products, trade dress, containers or trademarks of The Coca-Cola Company, or from acquiring or holding an interest in a party that engages in such activities. The Bottler Agreements also impose restrictions concerning the use of certain trademarks, authorized containers, packaging and labeling of The Coca-Cola Company and prohibit bottlers from distributing Coca-Cola soft drinks or other Coca-Cola beverages outside their designated territories.
The Bottler Agreements require us to maintain adequate production and distribution facilities; inventories of bottles, caps, boxes, cartons and other exterior packaging or materials; to undertake adequate quality control measures prescribed by The Coca-Cola Company; to develop, stimulate, and fully satisfy the demand for Coca-Cola soft drinks and other Coca-Cola beverages and to use all approved means, and spend such funds on advertising and other forms of marketing, as may be reasonably required to meet that objective; and to maintain such sound financial capacity as may be reasonably necessary to assure performance by us and our affiliates of our obligations to The Coca-Cola Company. All Bottler Agreements require us
56
annually to submit our business plans for such franchise territories to The Coca-Cola Company, including without limitation, marketing, management, promotional and advertising plans for the ensuing year.
The Coca-Cola Company has no obligation to contribute to our expenditures derived from advertising and marketing, but it may, at its discretion, contribute to such expenditures and undertake independent advertising and marketing activities, as well as cooperative advertising and sales promotion that would require our cooperation and support. In each of the franchise territories, The Coca-Cola Company has been contributing approximately 50% of advertising and marketing expenses, but no assurances can be given that equivalent contributions will be made in the future.
Each bottler is prohibited from, directly or indirectly, assigning, transferring or pledging its Bottler Agreement, or any interest therein, whether voluntarily, involuntarily or by operation of law, without the consent of The Coca-Cola Company, and each Bottler Agreement is subject to termination by The Coca-Cola Company in the event of default by us. Moreover, the bottler may not undergo a material change of ownership or control without the consent of The Coca-Cola Company.
The Coca-Cola Company may terminate a Bottler Agreement immediately, by written notice to the bottler, in the event that, inter alia, (i) the bottler suspends payments to creditors, declares bankruptcy, is declared bankrupt, is expropriated or nationalized, is liquidated, dissolved, changes its legal structure, or pledges or mortgages its assets; (ii) the bottler does not comply with instructions and standards established by The Coca-Cola Company relating to the production of its authorized soft drink products; (iii) the bottler ceases to be controlled by its controlling shareholders; or (iv) the terms of the Bottler Agreement come to violate applicable law.
Either party to any Bottler Agreement may, with 60 days’ notice thereof to the other party, terminate the Bottler Agreement in the event of non-compliance by the other party with the terms thereof so long as the party in non-compliance has not remedied such non-compliance during this period. In addition, if a bottler does not wish to pay the required price for concentrate for any Coca-Cola products, it must notify The Coca-Cola Company within 30 days of receipt of The Coca-Cola Company’s new prices. In the case of any Coca-Cola soft drink or other Coca-Cola beverages other than Coca-Cola concentrate, the franchise regarding such product shall be deemed automatically canceled three months after The Coca-Cola Company’s receipt of the bottler’s notice of refusal. In the case of Coca-Cola concentrate, the Bottler Agreements shall be deemed terminated three months after The Coca-Cola Company’s receipt of the bottler’s notice of refusal. The Coca-Cola Company may also terminate the Bottler Agreements if the
bottler or any individual or legal entity that controls, owns a majority share in or directly or indirectly influences the management of the bottler, engages in the production of any non-Coca-Cola beverage, whether through direct ownership of such operations or through control or administration thereof, provided that, upon request, the bottler shall be given six months to remedy such situation.
PET Agreements
Envases CMF produces returnable PET bottles pursuant to agreements with The Coca-Cola Company, which we refer to as the PET Contracts, which transfer The Coca-Cola Company’s license to manufacture such bottles using non-proprietary technology provided by Continental PET Technologies Inc., which we refer to as Continental, today known as Graham Packaging Company Inc. Multipack leased molds from The Coca-Cola Company for returnable PET bottles in the distinctive bottle shapes used for Coca-Cola soft drinks. In May 1995, Multipack obtained the license from Continental to produce non-returnable PET bottles with a high content of recycled material using “multilayer” technology developed by Continental. Multipack has transferred all of such rights to Envases CMF pursuant to the Cristalerías joint venture described below.
The PET Contracts expireexpired in July 2007 and are currently being negotiated may be automatically renewable for two additional years at the option of Envases CMF. The Coca-Cola Company may terminate the PET Contracts prior to that date if (i) Envases CMF is unable to produce bottles meeting contract specifications, (ii) Envases CMF breaches contract obligations, or (iii) PET bottle production has an adverse impact on The Coca-Cola Company’s trademarks, trade dress or reputation, or exposes The Coca-Cola Company to a material risk of liability. There can be no assurance that the PET Contracts will be renewed following the two-year renewal option.
On June 29, 2001, through our respective subsidiaries, Multipack and Crowpla Reicolite S.A., we and Cristalerías de Chile S.A. signed a series of contracts forming a joint venture for the development of a PET production facility in Chile through the formation of Envases CMF S.A. We contributed the assets necessary to further the development of the joint venture from Multipack. Our subsidiary Andina Inversiones Societarias S.A. holds a 50% stake in the joint venture while Cristalerías de Chile S.A. retains the other 50% interest.
EDASA produces returnable PET bottles in accordance with an agreement with C-C Argentina, which we refer to as the Argentine PET Agreement, which sublicensed to Edasa the C-C Argentina license to manufacture the PET bottles using
57
non-proprietary technology provided by Continental PetPET Technologies Inc., today known as Graham Packaging Company Inc. The Argentine PET Agreement will expiresubscribed in February 2012.December 1996 had a 10-year duration and is currently being negotiated. There can be no assurance that the Argentine PET Agreement will be renewed after the expiration date of the renewed agreement.
renewed.Transactions with related companies
Other transactions with related companies are outlined in the following table:
| | | | | | | | | | | | | | | | | | | |
| | | | | | | December 31, 2006
Effect on Income | | | December 31, 2005
Effect on Income | | | December 31, 2004
Effect on Income | |
Company | | Relation | | Transaction | | Amount | | (charge)
credit | | | Amount | | (charge)
credit | | | Amount | | (charge)
credit | |
| | | | | | | MCh$ | | MCh$ | | | MCh$ | | MCh$ | | | MCh$ | | MCh$ | |
ENVASES CENTRAL S.A. | | Equity investee | | Sales of raw materials and supplies | | 1,472 | | 0 | | | 1,024 | | 0 | | | 737 | | 30 | |
- | | - | | Finished product purchases | | 15,339 | | 0 | | | 14,081 | | 0 | | | 13,271 | | 0 | |
COCA-COLA DE CHILE S.A. | | Shareholder Related | | Concentrate purchases | | 40,624 | | 0 | | | 41,695 | | 0 | | | 38,872 | | 0 | |
- | | - | | Payment of advertising participation | | 1,818 | | (1,818 | ) | | 2,906 | | (2,906 | ) | | 1,821 | | (1,821 | ) |
- | | - | | Water source rental | | 1,346 | | (1,346 | ) | | 1,537 | | (1,537 | ) | | 1,445 | | (1,445 | ) |
- | | - | | Sales of advertisement | | 2,707 | | 0 | | | 3,258 | | 0 | | | 2,463 | | 0 | |
SERVICIOS Y PRODUCTOS PARA BEBIDAS REFRESCANTES S.R.L. | | Shareholder Related | | Concentrate purchases | | 22,696 | | 0 | | | 20,516 | | 0 | | | 17,930 | | 0 | |
ENVASES DEL PACIFICO S.A. | | Director in Common | | Purchase of raw materials | | 426 | | 0 | | | 797 | | 0 | | | 894 | | 0 | |
RECOFARMA INDUSTRIAS DO | | Shareholder Related | | Concentrate purchases | | 40,784 | | 0 | | | 30,158 | | 0 | | | 27,099 | | 0 | |
AMAZONAS LTDA. | | - | | Reimbursements and other purchases | | 540 | | 540 | | | 435 | | 435 | | | 282 | | 282 | |
- | | - | | Advertising participation payment | | 3,210 | | (3,210 | ) | | 3,194 | | (3,194 | ) | | 3,876 | | (3,558 | ) |
ENVASES CMF S.A. | | Equity investee | | Purchase of containers | | 16,467 | | 0 | | | 16,238 | | 0 | | | 14,190 | | 0 | |
- | | - | | Dividends payment | | 1,480 | | 0 | | | 1,274 | | 0 | | | 381 | | 0 | |
EMBONOR S.A. | | Shareholder Related | | Subsidiary sale of shares | | 0 | | 0 | | | 3,103 | | 2,413 | | | 0 | | 0 | |
| | - | | Sale of finished products | | 6,942 | | 2,511 | | | 0 | | 0 | | | 0 | | 0 | |
EMBOTELLADORA COCA-COLA POLAR S.A. | | Shareholder Related | | Subsidiary sale of shares | | 0 | | 0 | | | 2,006 | | 1,559 | | | 0 | | 0 | |
| | - | | Sale of finished products | | 4,316 | | 1,534 | | | 0 | | 0 | | | 0 | | 0 | |
INMOBILIARIA Y CONSTRUCTORA EL GOLF S.A | | Shareholder in common | | Purchase of real estate property | | 0 | | 0 | | | 16 | | 0 | | | 1,849 | | 0 | |
INVERSIONES CABURGA S.A. | | Shareholder | | Sale of real estate property | | 0 | | 0 | | | 1,045 | | 0 | | | 0 | | 0 | |
IANSAGRO S.A. | | Director in Common | | Purchase of sugar | | 9,796 | | 0 | | | 12,437 | | 0 | | | 10,651 | | 0 | |
CICAN S.A. | | Shareholder Related | | Purchase of finished products | | 1,276 | | 0 | | | 214 | | 0 | | | 77 | | 0 | |
VENDOMATICA S.A. | | Director related company | | Sale of finished products | | 1,443 | | 245 | | | 1,142 | | 194 | | | 0 | | 0 | |
BBVA ADMINISTRADORA GENERAL DE FONDOS S.A. | | Director related company | | Investment in mutual funds | | 79,154 | | 0 | | | 0 | | 0 | | | 0 | | 0 | |
- | | - | | Withdrawal of mutual fund | | 70,998 | | 305 | | | 0 | | 0 | | | 0 | | 0 | |
| | | | | | December 31, 2007
Effect on Income | | December 31, 2006
Effect on Income | | December 31, 2005
Effect on Income | |
Company | | Relation | | Transaction | | Amount | | (charge)
credit | | Amount | | (charge)
credit | | Amount | | (charge)
credit | |
| | | | | | MCh$ | | MCh$ | | MCh$ | | MCh$ | | MCh$ | | MCh$ | |
Envases Central S.A. | | Equity investee | | Sales of raw materials and supplies | | 1,677 | | 40 | | 1,581 | | 358 | | 1,100 | | 70 | |
— | | — | | Finished product purchases | | 16,867 | | 0 | | 16,474 | | 0 | | 15,123 | | 0 | |
Coca-Cola de Chile S.A. | | Shareholder | | Concentrate purchases | | 49,328 | | 0 | | 43,631 | | 0 | | 44,781 | | 0 | |
— | | — | | Payment of advertising participation | | 4,131 | | (4,131 | ) | 1,952 | | (1,952 | ) | 3,121 | | (3,121 | ) |
— | | — | | Water source rental | | 1,690 | | (1,690 | ) | 1,445 | | (1,445 | ) | 1,651 | | (1,651 | ) |
— | | — | | Sales of advertisement | | 3,550 | | 0 | | 2,907 | | 0 | | 3,499 | | 0 | |
Servicios y Productos para Bebidas Refrescantes S.R.L. | | Shareholder | | Concentrate purchases | | 27,115 | | 0 | | 24,375 | | 0 | | 22,034 | | 0 | |
Envases del Pacifico S.A. | | Shareholder related | | Purchase of raw materials | | 226 | | 0 | | 458 | | 0 | | 856 | | 0 | |
Recofarma Industrias do Amazonas Ltda. | | Shareholder related | | Concentrate purchases | | 54,839 | | 0 | | 43,802 | | 0 | | 32,389 | | 0 | |
| | — | | Payment of advertising participation | | 3,309 | | (3,309 | ) | 3,448 | | (3,448 | ) | 3,430 | | (3,430 | ) |
— | | — | | Reimbursements and other purchases | | 518 | | 518 | | 580 | | 580 | | 467 | | 467 | |
Envases CMF S.A. | | Equity investee | | Purchase of containers | | 16,122 | | 0 | | 17,686 | | 0 | | 17,439 | | 0 | |
| | | | Sale of finished products | | 216 | | | | | | | | | | | |
— | | — | | Dividend payment | | 3,210 | | 0 | | 1,590 | | 0 | | 1,368 | | 0 | |
Coca-Cola Embonor S.A. | | Shareholder related | | Subsidiary sale of shares | | 0 | | 0 | | 0 | | 0 | | 3,333 | | 2,592 | |
| | | | Purchase of products | | 280 | | | | | | | | | | | |
| | — | | Sale of finished products | | 8,712 | | 1,995 | | 7,455 | | 2,697 | | 0 | | 0 | |
Embotelladora Coca-Cola Polar S.A. | | Shareholder related | | Subsidiary sale of shares | | 0 | | 0 | | 0 | | 0 | | 2,154 | | 1,674 | |
| | — | | Sale of finished products | | 5,164 | | 1,036 | | 4,635 | | 1,648 | | 0 | | 0 | |
Inmobiliaria y Constructora El Golf S.A | | Shareholder in common | | Purchase of real estate property | | 0 | | 0 | | 0 | | 0 | | 18 | | 0 | |
Inversiones Caburga S.A. | | Shareholder | | Sale of real estate property | | 0 | | 0 | | 0 | | 0 | | 1,123 | | 0 | |
Iansagro S.A. | | Director in common | | Purchase of sugar | | 15,709 | | 0 | | 10,521 | | 0 | | 13,358 | | 0 | |
Cican S.A. | | Shareholder related | | Purchase of finished products | | 1,456 | | 0 | | 1,370 | | 0 | | 230 | | 0 | |
Vendomatica S.A. | | Sahreholder related | | Sale of finished products | | 1,463 | | 439 | | 1,550 | | 263 | | 1,227 | | 208 | |
BBVA Administradora General de Fondos S.A. | | Shareholder related | | Investment in mutual funds | | 44,511 | | 0 | | 85,011 | | 0 | | 0 | | 0 | |
— | | — | | Redemption of mutual fund | | 46,341 | | 0 | | 76,252 | | 328 | | 0 | | 0 | |
ITEM 8. | FINANCIAL INFORMATION |
ITEM 8.FINANCIAL INFORMATION
See “Item 18 ––Financial—Financial Statements” for our Consolidated Financial Statements filed as part of this annual report.
Legal Proceedings
The Company is part of
We are party to certain legal proceedings that have arisen during the normal course of business, and we believe none of which affects the Company’sthem are likely to have a material adverse effect on our financial condition, neither individually or in the aggregate.condition. The following is a summary of the main proceedings to which the Companywe and itsour subsidiaries are a party:
Embotelladora Andina S.A. (Chile)
As of December 31, 2006,2007, Embotelladora Andina S.A. faces, labor, tax, commercial and other lawsuits. Accounting provisions for potential loss contingencies stemming from these lawsuits amount to approximately ThCh$50,804.20,424. The Company considers it unlikely that the contingencies that are not provisioned for will adversely affect the results of the Company in a material manner.
58
Vital S.A. (Chile)
TheServicio de Impuestos Internos(Chilean Internal Revenue Service) filedcommenced a criminal investigation against our subsidiary Vital S.A., and against those ultimately responsible for the application of tax losses. A tax lawsuit was filed simultaneously with this claim for the recovery of income tax and application of accumulated losses. On May 10, 2007 the 33rd Criminal Court dictated“Sobreseimiento definitivo”(dismissal in full) of the criminal investigation based onwas dismissed because the court found that “the investigatedthe facts wereunder investigation did not crime constituent”.constitute a crime. During the month of May of 2007, the mentioned tax lawsuit was terminated where part of the accumulated losses of our subsidiary Vital S.A. were recognized, and the pertinent rectifications of the income tax statements were made.revised as necessary. The termination of these lawsuits will havehad a non-significant positive effect over the Company’sour results for the year 2007. On September 12, 2007 the Court of Appeals upheld the dismissal, and with this resolution the lawsuit was terminated.
Rio Janeiro Refrescos Ltda. (Brazil)
When the Companywe acquired Refrescos in 1994 and the Perma license in March 2000, there were several significant legal proceedings pending in Brazilian courts, mainly regarding certain potential tax liabilities. In accordance with the terms of the acquisition, the previous owners must compensate Refrescos with respect to the portion of those pending tax claims whichthat took place prior to the time the acquisition, mortgage guarantees and letters of credit were establishedacquisition. We have not made provisions for the benefit of Refrescos. The guarantees are sufficient and the Company has not provisioned any losses from these proceedings because they are covered by mortgage guarantees and letters of credit granted by the indicated guarantees.previous owners of Refresco.
Additionally, as of December 31, 2006, there are legal proceedings relating to2007, Refrescos forwas also involved in labor and tax lawsuits, andlitigation. Provisions in the amount of approximately ThCh$941.443 have been made for these proceedings in accordance with generally accepted accounting principles, the respective accounting provisions have been made. These provisions amounted to ThCh$1,120,467.principles.
Embotelladora del Atlántico S.A. (Argentina)
As of December 31, 2006,2007, Embotelladora del Atlántico S.A. faces,was involved in labor litigation and other lawsuits. Accountinglegal proceedings, for which provisions of approximately ThCh$1,538,745 were made. No provisions were made for potential loss contingencies stemming from these lawsuits amount to
ThCh$1,689,281. The Company considers it unlikely that thethose contingencies that in our opinion are not provisioned for will adversely affect theunlikely to have a material adverse effect on our results of the Company in a material manner.operations.
Provisions
In accordance with accounting principles, the provisions regarding legal proceedings must be recorded if said procedures are reasonably probable to be resolved against the Company. Management believes that the constituted provisions reasonably cover the risk exposures.
Dividend Policy
Pursuant to Chilean law, we must distribute cash dividends equal to at least 30% of our annual net income, calculated in accordance with Chilean GAAP, unless otherwise provided for by a unanimous vote of the Series A shareholders. If there is no net income in a given year, we are not legally required to distribute dividends from retained earnings. At the annual meeting of shareholders held in April 2006, the shareholders authorized the board of directors to distribute, at its discretion, interim dividends during July and October 2006 and January 2007. A U.S. holder of Series A or Series B ADSs may effectively be required to receive a cash dividend, in the absence of a registration statement in effect pursuant to the Securities Market Law of Chile or an effective exemption from the requirement for registration according to that law. Series B shareholders will be entitled to a dividend equal to 10% more than any dividend declared for holders of the Series A shares.
During 2004, 2005, 2006, and 2006,2007, the respective shareholders’ meetings approved extraordinary dividend payments to be paid from retained earnings fund in light of significant cash generation. There can be no assurance that dividend payments will be available in the future.
The following table sets forth the nominal amount in Chilean pesos of dividends declared and paid per share each year and the U.S. dollar amounts on a per share basis actually paid to holders of ADSs, on each of the respective payment dates:
| | | | | | | | | | | | |
| | | | | Fiscal Year with Respect | | Series A | | Series B |
Year | | Date Dividend Paid | | to which Dividend was
Declared | | Ch$ per Share
(nominal) | | US$ per share | | Ch$ per Share
(nominal) | | US$ per
share |
| 2007 | | January 31 | | 2006 | | 5.60 | | 0.01028 | | 6.16 | | 0.01131 |
| | April 26 | | 2006 | | 11.120 | | 0.02108 | | 12.232 | | 0.0232 |
| 2006 | | January 26 | | 2005 | | 4.80 | | 0.00907 | | 5.28 | | 0.00998 |
| | April 27 | | 2005 | | 6.48 | | 0.01249 | | 7.13 | | 0.01374 |
| | June 01 | | Retained earnings | | 70.00 | | 0.13158 | | 77.00 | | 0.14474 |
| | July 26 | | 2006 | | 5.60 | | 0.01032 | | 6.16 | | 0.01135 |
| | October 26 | | 2006 | | 5.60 | | 0.01068 | | 6.16 | | 0.01175 |
| 2005 | | January 27 | | 2004 | | 4.80 | | 0.00819 | | 5.28 | | 0.00901 |
| | April 28 | | 2004 | | 4.80 | | 0.00824 | | 5.28 | | 0.00906 |
| | May 19 | | Retained earnings | | 70.00 | | 0.12079 | | 77.00 | | 0.13287 |
| | July 28 | | 2005 | | 4.80 | | 0.00852 | | 5.28 | | 0.00937 |
| | October 26 | | 2005 | | 4.80 | | 0.00878 | | 5.28 | | 0.00966 |
| 2004 | | January 29 | | 2003 | | 4.80 | | 0.00804 | | 5.28 | | 0.00885 |
| | April 29 | | 2003 | | 4.80 | | 0.00768 | | 5.28 | | 0.00845 |
| | May 13 | | Retained earnings | | 40.00 | | 0.06225 | | 44.00 | | 0.06847 |
| | July 28 | | 2004 | | 4.80 | | 0.00747 | | 5.28 | | 0.00821 |
| | October 28 | | 2004 | | 4.80 | | 0.00780 | | 5.28 | | 0.00858 |
| | | | Fiscal Year with Respect | | Series A | | Series B | |
Year | | Date Dividend Paid | | to which Dividend was
Declared | | Ch$ per Share
(nominal) | | US$ per share | | Ch$ per Share
(nominal) | | US$ per
share | |
2008 | | January 24 | | 2007 | | 7.00 | | 0.01485 | | 7.70 | | 0.01633 | |
| | April 24 | | 2007 | | 9.13 | | 0.02036 | | 10.043 | | 0.02239 | |
| | May 14 | | Retained Earnings | | 60.00 | | 0.12806 | | 66.00 | | 0.14087 | |
2007 | | January 31 | | 2006 | | 5.60 | | 0.01028 | | 6.16 | | 0.01131 | |
| | April 26 | | 2006 | | 11.120 | | 0.02108 | | 12.232 | | 0.02319 | |
| | July 5 | | Retained Earnings | | 65.19 | | 0.12442 | | 71.709 | | 0.13686 | |
59
| | | | Fiscal Year with Respect | | Series A | | Series B | |
Year | | Date Dividend Paid | | to which Dividend was
Declared | | Ch$ per Share
(nominal) | | US$ per share | | Ch$ per Share
(nominal) | | US$ per
share | |
| | July 26 | | 2007 | | 7.00 | | 0.01337 | | 7.70 | | 0.01470 | |
| | October 24 | | 2007 | | 7.00 | | 0.01387 | | 7.70 | | 0.01526 | |
2006 | | January 26 | | 2005 | | 4.80 | | 0.00907 | | 5.28 | | 0.00998 | |
| | April 27 | | 2005 | | 6.48 | | 0.01249 | | 7.13 | | 0.01374 | |
| | June 01 | | Retained Earnings | | 70.00 | | 0.13158 | | 77.00 | | 0.14474 | |
| | July 26 | | 2006 | | 5.60 | | 0.01032 | | 6.16 | | 0.01135 | |
| | October 26 | | 2006 | | 5.60 | | 0.01068 | | 6.16 | | 0.01175 | |
2005 | | January 27 | | 2004 | | 4.80 | | 0.00819 | | 5.28 | | 0.00901 | |
| | April 28 | | 2004 | | 4.80 | | 0.00824 | | 5.28 | | 0.00906 | |
| | May 19 | | Retained Earnings | | 70.00 | | 0.12079 | | 77.00 | | 0.13287 | |
| | July 28 | | 2005 | | 4.80 | | 0.00852 | | 5.28 | | 0.00937 | |
| | October 26 | | 2005 | | 4.80 | | 0.00878 | | 5.28 | | 0.00966 | |
ITEM 9. | THE OFFER AND LISTING |
ITEM 9.THE OFFER AND LISTING
Shares of Andina’s common stock have traded in the United States on the New York Stock Exchange (“NYSE”) since July 14, 1994 in the form of ADSs, each representing six shares of common stock, with the ADSs in turn evidenced by ADRs. The Depositary for the ADSs is The Bank of New York. Shares of Andina’s common stock also trade in Chile on theBolsa de Comercio de Santiago, theBolsa de Valores Electrónica and theBolsa de Valores de Valparaíso.
The table below shows the high and low daily closing prices of the common stock in Chilean pesos and the trading volume of the common stock on the Santiago Stock Exchange for the periods indicated. It also shows the high and low daily closing prices of the ADSs and the volume traded in the New York Stock Exchange.
| | | | | | | | | | | | | | | | | |
| | | Share Volume (in thousands) | | Ch$ per Share | | Share Volume | | Ch$ per Share | |
| | | Series A | | Series B | | (in thousands) | | Series A | | Series B | |
| | | Series A | | Series B | | High | | Low | | High | | Low | | Series A | | Series B | | High | | Low | | High | | Low | |
2002 | | 43,783 | | 74,233 | | Ch$ | 1,100 | | Ch$ | 600 | | Ch$ | 900 | | Ch$ | 569 | |
| | | | | | | | | | | | | | |
2003 | | 28,270 | | 47,568 | | | 1,220 | | | 810 | | | 1,220 | | | 770 | | 37,157 | | 64,610 | | Ch$ | 1,150 | | Ch$ | 759 | | Ch$ | 1,151 | | Ch$ | 705 | |
2004 | | 33,520 | | 94,585 | | | 1,390 | | | 1,045 | | | 1,300 | | | 1,040 | | 42,141 | | 114,101 | | 1,311 | | 981 | | 1,227 | | 981 | |
2005 | | | | | | | | | | | | | | 56,477 | | 127,049 | | 1,400 | | 1,050 | | 1,505 | | 1,100 | |
2006 | | | | | | | | | | | | | | |
1st Quarter | | 14,979 | | 18,829 | | Ch$ | 1,300 | | Ch$ | 1,135 | | Ch$ | 1,370 | | Ch$ | 1,166 | | 10,405 | | 23,273 | | Ch$ | 1,240 | | Ch$ | 1,096 | | Ch$ | 1,330 | | Ch$ | 1,180 | |
2nd Quarter | | 14,372 | | 43,505 | | | 1,260 | | | 1,125 | | | 1,395 | | | 1,235 | | 15,719 | | 57,064 | | 1,275 | | 1,080 | | 1,380 | | 1,190 | |
3rd Quarter | | 5,696 | | 17,605 | | | 1,400 | | | 1,188 | | | 1,505 | | | 1,300 | | 13,679 | | 61,734 | | 1,250 | | 1,150 | | 1,335 | | 1,250 | |
4th Quarter | | 5,591 | | 19,795 | | | 1,384 | | | 1,050 | | | 1,455 | | | 1,140 | | 53,289 | | 8,720 | | 1,400 | | 1,180 | | 1,530 | | 1,270 | |
2006: | | | | | | | | | | | | | |
2007 | | | | | | | | | | | | | | |
1st Quarter | | 10,405 | | 23,273 | | Ch$ | 1,240 | | Ch$ | 1,096 | | Ch$ | 1,330 | | Ch$ | 1,180 | | 14,399 | | 30,311 | | Ch$ | 1,600 | | Ch$ | 1,390 | | Ch$ | 1,800 | | Ch$ | 1,500 | |
2nd Quarter | | 15,719 | | 57,064 | | | 1,275 | | | 1,080 | | | 1,380 | | | 1,190 | | 40,797 | | 84,860 | | 1,750 | | 1,590 | | 1,930 | | 1,690 | |
3rd Quarter | | 13,679 | | 61,734 | | | 1,250 | | | 1,150 | | | 1,335 | | | 1,250 | | 12,863 | | 68,915 | | 1,690 | | 1,400 | | 1,820 | | 1,480 | |
4th Quarter | | 53,289 | | 87,180 | | | 1,400 | | | 1,180 | | | 1,530 | | | 1,270 | | 13,728 | | 58,047 | | 1,600 | | 1,300 | | 1,750 | | 1,420 | |
Last six months: | | | | | | | | | | | | | | | | | | | | | | | | | |
December 2006 | | 1,327 | | 11,252 | | Ch$ | 1,400 | | Ch$ | 1,300 | | Ch$ | 1,530 | | Ch$ | 1,424 | |
January 2007 | | 3,712 | | 14,865 | | | 1,480 | | | 1,390 | | | 1,660 | | | 1,510 | |
February 2007 | | 3,577 | | 7,974 | | | 1,600 | | | 1,435 | | | 1,800 | | | 1,500 | |
March 2007 | | 7,110 | | 7,473 | | | 1,600 | | | 1,440 | | | 1,770 | | | 1,610 | |
April 2007 | | 12,899 | | 18,471 | | | 1,720 | | | 1,600 | | | 1,830 | | | 1,750 | |
May 2007 | | 2,579 | | 16,028 | | | 1,725 | | | 1,600 | | | 1,800 | | | 1,700 | |
Dec-07 | | | 4,260 | | 16,916 | | 1,450 | | 1,300 | | 1,590 | | 1,420 | |
Jan-08 | | | 6,327 | | 20,072 | | 1,340 | | 1,100 | | 1,525 | | 1,200 | |
Feb-08 | | | 4,860 | | 6,973 | | 1,525 | | 1,325 | | 1,660 | | 1,485 | |
Mar-08 | | | 2,155 | | 7,246 | | 1,445 | | 1,350 | | 1,520 | | 1,440 | |
Apr-08 | | | 2,897 | | 17,928 | | 1,535 | | 1,430 | | 1,700 | | 1,550 | |
May-08 | | | 21,938 | | 23,445 | | 1,504 | | 1,330 | | 1,670 | | 1,485 | |
| | | | ADS Volume (in thousands) | | US$ per ADS | |
| | | Series A | | Series B | | Series A | | Series B | |
| | | | | | | High | | Low | | High | | Low | |
2002 | | 29,960 | | 51,386 | | | 9.90 | | | 4.72 | | | 8.25 | | | 4.81 | |
2003 | | 19,690 | | 54,887 | | | 11.07 | | | 6.10 | | | 11.40 | | | 6.05 | |
2004: | | 35,578 | | 38,850 | | | 13.21 | | | 10.55 | | | 13.40 | | | 10.50 | |
2005: | | | | | | | | | | | | | |
1st Quarter | | 5,577 | | 15,944 | | | 13.29 | | | 11.80 | | | 14.14 | | | 12.15 | |
2nd Quarter | | 1,732 | | 11,858 | | | 13.00 | | | 11.50 | | | 14.65 | | | 12.47 | |
3rd Quarter | | 1,429 | | 4,743 | | | 15.62 | | | 12.25 | | | 17.00 | | | 13.50 | |
4th Quarter | | 2,665 | | 4,535 | | | 15.70 | | | 12.15 | | | 16.94 | | | 13.27 | |
2006 | | | | | | | | | | | | | |
1st Quarter | | 3,538 | | 7,542 | | | 14.18 | | | 12.35 | | | 15.40 | | | 13.35 | |
2nd Quarter | | 2,344 | | 4,524 | | | 14.65 | | | 11.52 | | | 16.20 | | | 13.00 | |
3rd Quarter | | 1,769 | | 6,113 | | | 14.18 | | | 12.60 | | | 15.00 | | | 13.79 | |
4th Quarter | | 3,031 | | 10,287 | | | 16.02 | | | 12.85 | | | 17.46 | | | 14.04 | |
Last six months: | | | | | | | | | | | | | |
December 2006 | | 915 | | 2,896 | | | 16.02 | | | 14.96 | | | 17.46 | | | 16.11 | |
January 2007 | | 965 | | 2,940 | | | 17.75 | | | 15.00 | | | 20.00 | | | 14.54 | |
February 2007 | | 3,098 | | 2,890 | | | 17.73 | | | 15.78 | | | 20.28 | | | 17.30 | |
March 2007 | | 923 | | 588 | | | 18.06 | | | 16.22 | | | 19.83 | | | 17.81 | |
April 2007 | | 1,406 | | 769 | | | 20.05 | | | 17.89 | | | 20.99 | | | 19.51 | |
May 2007 | | 337 | | 1,388 | | | 20.75 | | | 18.33 | | | 20.70 | | | 19.44 | |
60
| | ADS Volume | | US$ per ADS | |
| | (in thousands) | | Series A | | Series B | |
| | Series A | | Series B | | High | | Low | | High | | Low | |
2003 | | 3,282 | | 9,148 | | 11.07 | | 6.10 | | 11.40 | | 6.05 | |
2004 | | 4,478 | | 9,387 | | 13.21 | | 10.40 | | 13.59 | | 10.35 | |
2005 | | 3,091 | | 4,990 | | 15.70 | | 11.50 | | 17.00 | | 12.15 | |
2006 | | | | | | | | | | | | | |
1st Quarter | | 590 | | 1,257 | | 14.18 | | 12.35 | | 15.40 | | 13.35 | |
2nd Quarter | | 391 | | 754 | | 14.65 | | 11.52 | | 16.20 | | 13.00 | |
3rd Quarter | | 295 | | 1,019 | | 14.18 | | 12.60 | | 15.00 | | 13.79 | |
4th Quarter | | 505 | | 1,715 | | 16.02 | | 12.85 | | 17.46 | | 14.04 | |
2007 | | | | | | | | | | | | | |
1st Quarter | | 1,601 | | 1,560 | | 18.06 | | 15.00 | | 20.28 | | 14.54 | |
2nd Quarter | | 2,516 | | 2,478 | | 20.75 | | 17.88 | | 21.39 | | 19.22 | |
3rd Quarter | | 574 | | 866 | | 19.58 | | 14.50 | | 21.00 | | 15.78 | |
4th Quarter | | 389 | | 1,442 | | 20.69 | | 13.66 | | 22.55 | | 17.00 | |
Last six months: | | | | | | | | | | | | | |
Dec-07 | | 74 | | 337 | | 20.69 | | 14.95 | | 19.50 | | 17.00 | |
Jan-08 | | 126 | | 585 | | 17.90 | | 14.67 | | 19.32 | �� | 15.41 | |
Feb-08 | | 325 | | 132 | | 20.15 | | 15.84 | | 21.65 | | 17.80 | |
Mar-08 | | 243 | | 566 | | 19.25 | | 18.10 | | 21.05 | | 19.32 | |
Apr-08 | | 47 | | 233 | | 21.02 | | 19.25 | | 22.75 | | 20.15 | |
May-08 | | 140 | | 802 | | 19.6 | | 16.83 | | 21.69 | | 18.59 | |
Sources:Santiago Stock Exchange Official Quotations Bulletin and New York Stock Exchange.
On December 31, 2006,2007, the closing price for the Series A shares on the Santiago Stock Exchange was Ch$1,399 per share (US$15.49 per Series A ADR), and Ch$1,513 for the Series B shares (US$16.93 per Series B ADR). At December 31, 2006,2007, there were 4,699,7782,303,193 Series A ADSsADRs (equivalent to 28,198,66813,819,158 Series A shares) and 7,867,0187,055,007 Series B ADSsADRs (equivalent to 47,202,10842,330,042 Series B shares). Andina’s ADSs represented at such date 9.9%7.4% of the total number of our issued and outstanding shares.
On April 7, 1997, we completed the Reclassification of our common stock into Series A and Series B shares. See “Item 4. Information on the Company—Part A. History and Development of the Company—Reclassification of Capital Stock.” At that date, we amended the existing depositary agreement with Citibank N.A. relating to the ADR program for the common stock so as to cover the Series A shares and entered into a new depositary agreement with Citibank regarding the Series B shares. As of April 7, 1997, we had registered with the Securities and Exchange Commission and listed on the New York Stock Exchange, (i) the Series A shares in the form of Series A American Depositary Shares (the “Series A ADSs”), each representing six Series A shares, with the Series A ADSs in turn evidenced by Series A American Depositary Receipts (“Series A ADRs”) and (ii) the Series B shares in the form of Series B American Depositary Shares (the “Series B ADSs”), each representing six Series B shares, with the Series B ADSs in turn evidenced by Series B American Depositary Receipts.
On December 14, 2000 we executed a new depositary agreement with The Bank of New York which was renewed in January of 2005 for a five year period.
The Santiago Stock Exchange, established in 1893, is the principal equities exchange in Chile. The Chilean securities markets are substantially smaller, less liquid, and more volatile than major securities markets in the United States. The Santiago Stock Exchange had a market capitalization of approximately US$175,047213,364 million as of December 31, 20062007 and an average monthly trading volume of US$2,4194,363 million in 2006.2007. Trading activity on the Santiago Stock Exchange is on average substantially less than that on the principal national securities exchanges in the United States. We estimate that for the year ended December 31, 2006,2007, Andina’s shares were traded on the Santiago Stock Exchange on an average of approximately 96.4%95.12% and 100.0% of such trading days, for Series A and Series B shares respectively.
Pursuant to the terms of the Shareholders’ Agreement dated September 5, 1996 (the “Agreement”), among Inversiones Freire Ltda., and Inversiones Freire Dos Ltda. (together, the “Freire Shareholders”), the Company and the other parties thereto, none of the shareholders, party to the Agreement, may transfer Series A shares of the Company they hold unless it involves:
·Transfers to wholly-owned subsidiaries of any Freire Shareholder, provided that any shares transferred to such entities remain subject to the provisions of the Agreement;
·Acceptance by a Freire Shareholder party to the Agreement of a bona fide offer from a third party to purchase some or all of the shares held by such shareholder, so long as the Freire Shareholder first offers such shares for sale, on the same terms and conditions as those proposed to be sold to the third-party purchaser and to the other shareholder party to the Agreement; and
·A proposal by a shareholder party to the Agreement to sell its shares in a public offering or in a brokers’ transaction, so long as it first offers such shares to the other shareholders party to the Agreement at the price proposed in the public sale notice.
Other than as discussed above, we are not aware of any other existing contracts or documents that impose material limitations or qualifications on the rights of shareholders of our listed securities.
61
The Yankee Bonds
Our 7.00% Notes due 2007, 75/8% Notes due 2027 and 77/8% Notes due 2097 are not listed on any stock exchange or other regulated market. Trading in these notes takes place primarily in the over-the counter market and, accordingly, we are not able to obtain reliable information on trading in these notes.
Debt Securities
The Chilean Central Bank is responsible,inter alia, for theChile’s monetary policies and exchange control policies of Chile.controls. The Chilean Central Bank has authorized Chilean issuers to offer bonds in Chile and abroad under the terms of “Chapter XIV”Chapter XIV of the “CFER”.CFER. The following paragraphs lay out certain rulessummarize some of the Central Bank regarding bond issuancesrules on international markets.bond issuances. This summary does not intend to be complete and one mustthose interested in a full description should refer to the provisions in Chapter XIV in relation to debt issues.of the CFER.
Effective April 19, 2001 the new CFER only established certain information requirements and the obligation of carrying out certain payments or remittances the Formal Exchange Market in accordance with what is described ahead. The new Chapter XIV, therefore, greatly simplifiessimplified the procedure to register capital contributions, investments and foreign loans, including issuance of bonds. The Chilean Central Bank provides that paymentsbonds issuances. Payments or remittances of funds, to or from Chile, that arise or generate fromin connection with credits securedgranted abroad should be made through the Formal Exchange Market. For this purpose, whenMarket, which is composed by the main commercial banks that operate in Chile. When foreign currency resulting from loans or bonds is made available to the beneficiary in the country, the intervening bank should issue the pertinent “Form” and request certain information from the debtor and creditor, as the case may be, that all of these must provideapplicable, pursuant to Chapter XIV.
Payments or remittances of foreign currency as capital, interest, adjustments, profits and other benefits originating in the transactions regulated under Chapter XIV shallmust be reported to the Chilean Central Bank in the following way:as follows: (i) if the pertinentforeign currency represents a remittance made from Chile, the intervening Formal Exchange Market bank should issue the above form; (ii) the issuer or borrower should inform the Chilean Central Bank, within the first 10 days of the month following the executiondate of the operation,transaction, if the foreign currency used to make the pertinent payments is sourcedoriginates from credit transactions for which the foreign currency has been used directly abroad or if the corresponding payment obligation is fulfilled abroad using funds other than those indicated in Chapter XIV.
Any change in the terms of the transaction must be reported to the Central Bank within 10 days after formalization. This requirement applies, among others, to the substitution of the debtor or creditor, total or partial assignments of credits or rights and the modification of the financial terms of the respective credit regarding investments or capital contributions mustcontributions.
Exchange rule amendments dated April 2001 established that transactions recorded prior to April 19, 2001 will continue to be reportedgoverned by the rules in force at the time they were recorded, but that the parties may choose to apply the Chilean Central Bank within 10 days after formalization.new regulations.
Likewise, in the case of
These procedures also apply to foreign loans obtained through the placement of convertible bonds, in which case the issuer shall informreport to the Chilean Central Bank in the same manner and term mentioned above, of any increase or decrease in their registered amount as a result of the conversion of convertible bonds denominated and payable in Chilean pesos, for other convertible bonds denominated and payable in foreign currency or shares, as applicable, acquired by foreign investors with proceeds that had entered Chile under the terms of Chapter XIV.
According to Chapter XIV, the Chilean Central Bank established that credits relating to acts, agreements or contracts which create a direct obligation of payment or remittance of foreign currency abroad by persons domiciled or residing in Chile, that exceed on an individual basis the sum of US$100,000 or the equivalent in other foreign currencies, absent any special rule in the CFER, shall be reported to the Chilean Central Bank by the obligor either directly or through a Formal Exchange Market entity using the forms contained in the CFER, within 10 days from formalization.
In addition, transactions recorded prior to April 19, 2001 will continue to be governed by the rules in force at the time of their recordation, notwithstanding the right afforded to the parties thereto to subject them
to the new regulations, in which case any favorable or adverse effect that may arise by a change in the regulations applicable to this type of foreign exchange transaction need be considered.
In February 1999, withafter obtaining the requisite authorization from the Chilean Central Bank, the Companywe issued bonds in the international markets, subject to the exchange regulations governingin effect at that time.
The Chilean Central Bank unilaterally decides whether to grant authorizations for international bond offerings, and although other authorizations of the Central Bank have never been cancelled once issued, the Chilean Central Bank did request that lenders renegotiate the terms of their loans during the renegotiationrestructuring of theChile’s foreign debt of Chile in the eighties.
We cannot give any assurance that the Chilean Central Bank will not impose no future restrictions applicable to the holders of debt securities, nor can we make any evaluation of the duration or impact of thosesuch restrictions, if imposed.
62
ITEM 10.ADDITIONAL INFORMATION ITEM 10.
| ADDITIONAL INFORMATION |
Material Contracts
Pursuant to a Joint Venture Agreement or JV dated October 4, 2007 Refrescos and all Coca-Cola bottlers in Brazil entered into a joint venture to exploit the Brazilian juice market, through the incorporation of a company called “MAIS INDUSTRIA DE ALIMENTOS S.A.” or “Sucos Mais”. Sucos Mais was structured as follows: 50% of its capital was subscribed by the 18 Coca-Cola bottlers in Brazil and 50% by the company representing Coca-Cola in the country (called “Recofarma Industria do Amazonas Ltda.”). Refrescos holds an interest of 7.35% in the capital of Sucos Mais.
On October 17, 2005, Andina, Vital, Coca-Cola Embonor S.A. or Embonor and Embotelladoras Coca-Cola Polar S.A. or Polar entered into a letter of intent to carry out the transactions described below in order to re-structure production and packing of products in the business categories of Water, Juices and Non-Carbonated Beverages, licensed by The Coca-Cola Company in Chile.
On December 22,2005, the definitive agreements were implemented to give effect to the above referredthis letter of intent, resulted in the following:as described below:
a)In the category of Water, Andina, Embonor (through its subsidiary, Embonor S.A.) and Polar have taken an interest of 56.5%, 26.4% and 17.1%, respectively, in Vital Aguas S.A., originally incorporated under the name of VA S.A., which will conduct the business of the processing, production and bottling of theVital de Chanqueahue Mineral Water and other waters, according to the terms of the contracts and authorizations agreed upon by Vital Aguas S.A. and The Coca-Cola Company.
The equity interests of Embonor and Polar in Vital Aguas S.A. were acquired by purchase from Andina and its subsidiary, Andina Inversiones Societarias S.A., at prices equivalent to UF 169,306 and UF 109,428, respectively. Said amounts were adjusted and paid during January 2006.
In addition, Andina, Vital, Embonor and Polar agreed to the respective contracts and authorizations with The Coca-Cola Company to produce, bottle and sell the product named “Dasani.”“Dasani” water.
b)In the category of Juices and Non-carbonated Beverages, contracts were signed whereby Embonor and Polar have become the holders of the rights to acquire products from Vital S.A. under the brands “Kapo,” “Andina Nectar,” “Andina H-C,” “Andina Frut,” and other brands, according to the terms of the contracts agreed upon by each bottler and The Coca-Cola Company. The right to purchase these products from Vital S.A. will be at the prices and under the conditions applicable to volumes and maximum periods determined by the parties that will last, in all cases, until December 31, 2015.
Embonor and Polar agreed to pay to Andina’s subsidiary, Vital S.A., advances for the aforementioned rights, equal to UF 196,486 and UF 51,981, respectively. Said amounts were adjusted and paid during January 2006.
In addition, Andina, Vital, Embonor and Polar have agreed to the respective contracts and authorizations with The Coca-Cola Company to produce, bottle and sell these products at their respective plants.
In Brazil, On August 28, 2004, after completion of all operational transitions and adjustments provided for in the agreement, the parties formalized the transfers of their respective territories and Refrescos acquired all rights to produce and distribute Coca-Cola brand products in the Nova Iguaçu territory. As required by Brazilian law, all filings and registrations required in connection with this transaction were presented with the Commercial Board of Rio de Janeiro.
Refrescos entered into an agreement with Kaiser in December 1993 for the exclusive representation of the Kaiser and Heineken beers in Refrescos’ operating territory. The duration of said agreement was five years, with the possibility of renewal. In November 1998, that term was extended to December 27, 2000, renewable for two years. On December 19, 2000, Refrescos exercised its contractual rights to request the renewal of the agreement through March 31, 2003. Without prejudice to the foregoing, on March 19, 2002, The Coca-Cola Company, Kaiser, Molson and the Association of Brazilian Producers of Coca-Cola soft drinks (of which Refrescos is a member) executed a memorandum of understanding and an agreement with a term of 20 years. This agreement establishes the general principles and obligations applied by Kaiser and the distributors thereof to the distribution of beers produced or imported by Kaiser through the Coca-Cola distribution system with a term of 20 years and renewable for another 20-year period. On May 30, 2003, Kaiser and its distributors (including Refrescos) executed a new twenty-year distribution agreement which is renewable for another twenty-year period.
On August 10, 2004, Refrescos entered into an agreement with Recofarma Industria do Amazonas Ltda. or Recofarma, Refrigerantes Minas Gerais Ltda. or RMG and Companhia Mineira de Refrescos S.A. or CMR, and together with Recofarma and RMG, the Counterparties, pursuant to which the parties agreed to swap franchise territories for the production and distribution of Coca-Cola brand soft drinks. Pursuant to the terms of this transaction, which was approved by the respective votes of the shareholders of the companies, Refrescos sold its equity stake in a newly-formed company named Franquia 2299-Atendimento Personalisado Ltda., to which it had previously contributed all of the assets, production and distribution rights for Coca-Cola soft drinks in the territory denominated Governador Valadares in the State of Minas Gerais, to the Counterparties. In consideration for this transfer, Refrescos received all of the Counterparties’ equity interest in Zohhal Industria de Refrigerantes Ltda. or Zohhal, which owned all of the assets, production and distribution rights for Coca-Cola soft drinks in the territory known as Nova Iguaçú in the State of Rio de Janeiro. On August 28, 2004, after completion of all operational transitions and adjustments provided for in the agreement, the parties formalized the transfers of their respective territories and Refrescos acquired all rights to produce and distribute Coca-Cola brand products in the Nova Iguaçu territory. As required by Brazilian law, all filings and registrations required in connection with this transaction were presented with the Commercial Board of Rio de Janeiro.
On March 19, 2002, The Coca-Cola Company, Kaiser, Molson and the Association of Brazilian Producers of Coca-Cola soft drinks (of which Refrescos is a member) executed a memorandum of understanding and an agreement with a term of 20 years for the distribution of beers produced or imported by Kaiser through the Coca-Cola distribution system with a term of 20 years and renewable for another 20-year period. On May 30, 2003, Kaiser and its distributors (including Refrescos) executed a new twenty-year distribution agreement which is renewable for another twenty-year period.
63
Law 20,123: regulating Subcontracting, Regime WorkTemporary Labor Companies and the Hiring of Transitory Service Companies.Temporary Labor Agreements. Published on October 16, 2006, and which became effective on January 16, 2007.
Among others,
Law No. 20,123 brought significant changes to Chile’s employment law. First, it allowed companies (the “principal companies”) to engage a “contractor” or “contracting company” to hire employees, who would then be responsible for the main aspects of this Law are: a)employment relationship. The responsibility formerly maintained by the mainprincipal company remains jointly liable with the employees of its contractors. The main company has a solidarity responsibility regardingcontractor for labor and pension fund obligations that may affectowed to the contractors (also subcontractors) in favoremployees, including compensation for employment termination. The principal company’s liability will be merely subsidiary to that of the employeescontractor, however, if it monitors the contractor’s performance of its obligations and withholds payments from the contractorscontractor in case of violations, as described under the law. The principal company shall also comply with certain legal and subcontractors, expressly including the legal indemnities due as a result of termination of any labor relationship of the employees assigned for providing the services. Nevertheless, this responsibility could be subsidiary if the main company exerts the retentionregulatory requirements regarding health and information rights that the law indicates. ; b) The main company has an obligation in the sense of adopting the necessary measures in order to effectively protect the life and health of all the employees who worksafety conditions at the facility, company or site, whichever dependency it may be; c) The figure of transitory service companies isworkplace. Law No. 20,123 also created and these companies may have a“temporary labor companies”, entities with the exclusive corporate purpose of only providinghiring employees to provide services to third parties (“users”end-users”) foron a temporary basis.
During 2007, we engaged a contractor to hire employees under this new law and took the purpose of fulfilling temporary work services for the users d) Jurisdictional faculties are grantedrequisite measures to theDirección del Trabajo (Entity Controlling Labor Relations)ensure compliance with its requirements, including changes to commercial agreements and the resolutionscreation of this entity may be appealed at the respective Court of Appeals.
a new system to monitor labor conditions and obligationsForeign Investment and Exchange Controls in Chile
The Chilean Central Bank is responsible, among other things,matters, for setting monetary policies and exchange controls in Chile. Regarding exchange controls, the Chilean Central Bank has the faculty to impose certain restrictions regarding freedom of exchange controls. As of April 19, 2001, the Chilean Central Bank eliminated prior foreign exchange restrictions, imposingcontrols, imposed certain reporting requirements and the need to channeldetermined that certain operations be conducted through the Formal Exchange Market which is composed by the main commercial banks that operate in Chile.Market. The main purpose of these amendments, as declared by the Chilean Central Bank, is to easefacilitate the free flow of capital tointo Chile and from Chileoutside the country and to foster foreign investment.
Equity investments includingin Chile (including investments in shares of stockstock) by non-resident persons andor entities in Chile are generally subject to severalmust comply with some of the existing exchange control regulations that restrict the repatriation from Chile of investments and generated earnings. The registrar of foreign investments in Chile, including investments in common stock of Chilean companies, grant the investors access to the Formal Exchange Market in Chile.restrictions. Foreign investments may be registered with the Foreign Investment Committee (Comité de Inversiones Extranjeras) in accordance with Law N° 600 of 1974 and amendments or with the Chilean Central Bank in accordance with the Law of the Chilean Central Bank and they may enter the country in accordance with Decree Law No. 600 and Chapter XIV of the Compendium of Foreign Exchange Regulations (Compendio de Normas de Cambios Internacionales or CFER) of the Chilean Central Bank. In the case of a Decree Law N° 600, foreign investors execute a foreign investment agreement with the State of Chile, thus guaranteeing access the FEM. However, if the investor enters its investmentinvestors under Decree Law N° 600 he/she will only be able to repatriate capital one-year after a one year term subsequent to the entrance of funds.investment. Earnings obtained can be remitted abroad at any time. In the case of CFER, capital as well as earnings can be repatriated at any time.time, without an agreement with the Central Bank.
On April 16, 2001, the Chilean Central Bank agreed that, effective
As of April 19, 2001 prior foreign exchange restrictions were eliminated and a new CFER was enacted. The main purpose of these amendments, as declared by the Chilean Central Bank is to ease the free flow of capital to and from Chile and to foster foreign investment. The Chilean Central Bank deletedeliminated certain exchange controls. For instance, it revoked Chapter XXVI of the CFER, which regulated the issuance and placement of ADRs by Chilean corporations. Pursuant to the new rules, itthe Central Bank’s approval is no longer necessary to first seek the Chilean Central Bank’s approval to issue ADRs, nor to enter into a pre-condition for ADR issuances or foreign investment contractcontracts with the BCC. The issuance of ADRs isCentral Bank. ADR issuances are now regarded as an ordinary foreign investment, and simply requiresthe only requirements are that the Chilean Central Bank be informed of the transaction, pursuant toby fulfilling the rules of Chapter XIV of the CFER, and that the transaction be conductedmonies come in or leave the country exclusively through the Formal Exchange Market.Market, if the recipient of the investment decides to enter the foreign currency to the country or if it carries out payments or remittances from Chile.
Notwithstanding these changes, exchange transactions authorized prior to April 19, 2001 remained subject to the rules in force as of the date of such transactions. The new rules doexchange regime did not derogateaffect Chapter XXVI of the existingCFER and the Foreign Investment Contract or- FIC entered into between Andina, and the Chilean Central Bank. In the case of Andina, the ADR mechanism was subject to: (a) an agreement entered into between Andina,Bank and The Bank of New York (in its capacity asMellon (as depositary forof the shares represented by ADSs). The FIC is the ADSs)agreement by which access to the Foreign Exchange Market is given to the depositary and ADR holders. The FIC adopted the Chilean Central Bank,dispositions of Chapter XXVI and was celebrated pursuant to Article 47 of the Central BankConstitutional Organic Act under Chapter XXVI, Title I of the CFER (which, as stated, remained in force until April 18, 2001) governing the issuance of ADSs by Chilean corporations, and; (b) the FIC, which grants the depositary and holders of ADRs access to the Formal Exchange Market. Central Bank.
Banco de Chile had actedwas initally appointed as our custodian sincebank, beginning December 31, 2002. On May 5, 2003, Banco Santander Chile replaced Banco de Chile as custodian, as requested by The Bank of New York pursuantMellon later caused the FIC to an amendment of Chapter XII (in accordance with Title I of the CFER), which applies to our ADRs.be amended and on May 5, 2003 Banco de Chile was replaced by Banco Santander Chile as custodian.
Under Chapter XIVXXVI of the CFER, if the funds to purchase the common shares underlying the ADSs are brought into Chile, the depositary must deliver, on behalf of foreign investors, an annex providing information on the transaction to the Formal Exchange Market entity involved, together with a
letter instructing such entity to deliver the foreign currency or the equivalency in pesos, on or before the date the foreign currency is brought or is to be brought into Chile.
If foreign investors do not invest funds in Chile to purchase the common shares underlying the ADSs, the depositary, on behalf of the foreign investors, must provide the annex and letter, mentioned above, to the Chilean Central Bank directly or through the Formal Exchange Market entity within ten days following the date on which payment is made.
64
Repatriation of amounts received with respect to deposited common shares or common shares withdrawn from deposits on surrender of ADRs (including amounts received as cash dividends and proceeds from the sale in Chile of the underlying common shares and any rights arising there from) need be made through the Formal Exchange Market. The Formal Exchange Market entity intervening in the repatriation must provide certain information to the Chilean Central Bank on the following banking business day.
Furthermore, Chapter XIV of the CFER provides that payments and remittances of funds from Chile are governed by the rules in effect at the time payments or remittances are made. Therefore, any changes made to Chilean laws and regulations after the date hereof may affect foreign investors who have acquired ADSs. We cannot give any assurance that new regulations of the Chilean Central Bank or further legislative changes to the current foreign exchange control regime in Chile will not affect our ability to remit foreign currency to make the relevant payments.
Under Chapter XXVI and the FIC, the Chilean Central Bank agreed to grant to the depositary, on behalf of Series A and Series B ADR holders, and to any investor not residing nor domiciled in Chile who withdraws Series A shares or Series B shares upon surrender of Series A or Series B ADRs, which we refer to as the Withdrawn Shares, Formal Exchange Market access to convert Chilean pesos into U.S. dollars (and to remit those dollars outside Chile) with respect to Series A and Series B common shares represented by Series A and Series B ADSs or Withdrawn Shares, including amounts received as:
(1)cash dividends;
| (2) | proceeds from the sale in Chile of Withdrawn Shares; |
(2)proceeds from the sale in Chile of Withdrawn Shares;
| (3) | proceeds from the sale in Chile of preemptive rights to subscribe for additional Series A and Series B shares; |
(3)proceeds from the sale in Chile of preemptive rights to subscribe for additional Series A and Series B shares;
| (4) | proceeds from the liquidation, merger or consolidation of Andina; |
(4)proceeds from the liquidation, merger or consolidation of Andina;
| (5) | proceeds from the sale in Chile of common shares received as dividends; and |
(5)proceeds from the sale in Chile of common shares received as dividends; and
| (6) | other distributions, including those in respect of any re-capitalization resulting from holding Series A or Series B shares represented by Series A or Series B ADSs or by Withdrawn Shares. Investors that receive Withdrawn Shares in exchange of Series A or Series B ADRs shall be authorized to re-deposit them in exchange of Series A or Series B ADRs, provided the conditions necessary to re-deposit them are met. |
(6)other distributions, including those in respect of any re-capitalization resulting from holding Series A or Series B shares represented by Series A or Series B ADSs or by Withdrawn Shares. Investors that receive Withdrawn Shares in exchange of Series A or Series B ADRs shall be authorized to re-deposit them in exchange of Series A or Series B ADRs, provided the conditions necessary to re-deposit them are met.
The guarantee of Formal Exchange Market access under the FIC will extend to the participants of the ADS offering if the following requirements are met: (1) the funds to purchase the Series A shares or Series B shares underlying the ADSs are brought into Chile and converted into Chilean pesos through the Formal Exchange Market; (2) the purchase of the underlying Series A shares or Series B shares is made on a Chilean stock exchange; and (3) within five business days from the conversion of the funds into Chilean pesos, the Chilean Central Bank is informed that the funds thus converted were used to purchase the underlying Series A shares or Series B shares.
Chapter XXVI provides that Formal Exchange Market access in connection with dividend payments is conditioned to our certifying to the Chilean Central Bank that a dividend payment has been
made and that any applicable tax has been withheld. We agreed to provide this certification. Chapter XXVI also provides that Formal Exchange Market access in connection with the sale of Withdrawn Shares, or distribution thereon, is conditioned upon receipt by the Chilean Central Bank of (1) a certificate by the depositary or custodian, as the case may be, that the Series A shares or Series B shares have been withdrawn in exchange for delivery of the appropriate ADRs, and (2) a waiver of the benefits of the FIC with respect to ADRs (except in connection with the proposed sale of the Series A shares or Series B shares) until the Withdrawn Shares are re-deposited.
Chapter XXVI and the FIC provide that an entity or personwho is not domiciled in Chile nor a Chilean resident, who brings foreign currency into Chile to purchase Series A shares or Series B shares pursuant to the FIC must convert that foreign currency into Chilean pesos on the date of entry into Chile, and must invest in Series A or Series B shares within five banking business days in order to receive the benefits of the FIC. If that entity or person does not invest in Series A or Series B shares within that period, it can access the Formal Exchange Market to reacquire foreign currency, provided that the request is submitted to the Chilean Central Bank within seven banking business days of the initial conversion into pesos. Series A shares or Series B shares acquired as described above may be deposited in exchange for ADRs and the entity or person will receive the benefits of the FIC, subject to: (1) receipt by the Chilean Central Bank of a certificate from the depositary that the Series A or Series B shares have been deposited and that the related ADRs have been issued; and (2) receipt by the custodian of a declaration from the person making the deposit waiving the benefits granted by the FIC with respect to the deposited Series A or Series B shares.
FEM access under any of the circumstances described above is not automatic. Pursuant to Chapter XXVI, such access needs the Chilean Central Bank’s approval on a request submitted to that end through a banking institution established in Chile. The FIC provides that if the Chilean Central Bank has not acted upon the request within seven banking days, the request is deemed to have been granted.
Under current Chilean law, the Chilean Central Bank cannot unilaterally change the FIC. Judicial precedent (although not binding on future judicial decisions) also established that the FIC cannot be annulled by future legislative changes. No
65
assurance can be given, however, that additional Chilean restrictions applicable to the holders of ADRs, to the disposition of underlying Series A or Series B shares, or to the repatriation of proceeds from their disposition, will not be imposed in the future; nor can there be any assessment of the duration or impact of any restrictions that might be imposed. If for whatever reason, including changes in the FIC or Chilean law, the Depositary is prevented from converting Chilean pesos into U.S. dollars,dollars; the investors shall receive dividends or other payments in Chilean pesos, which shall subject the investors to exchange rate risks. It cannot be assured that the CFER, as amended, or any other exchange regulation will not be amended in the future, or that if new regulations are enacted that they shall have no material bearing on Andina or the holders of the ADS.
No assurance can be given that Andina will be able to purchase U.S. Dollars in the Informal Exchange Market at any time in the future, nor that any such purchase will be for the amounts necessary to pay any sum due under any of its debt instruments. Likewise, it is not possible to guarantee that changes to the regulations of the Chilean Central Bank or other legislative changes relating to exchange controls will not restrict nor impair Andina’s ability to purchase U.S. Dollars in order to make payment on its debt instruments.
All payments and distributions regarding the Series A or Series B ADSs must be transacted in the Formal Exchange Market.
Tax Considerations Relating to Equity Securities
Chilean Tax Considerations
The following discussion summarizes the material Chilean income tax consequences of an investment in Andina’s stock or ADSs by an individual who is not domiciled or resident in Chile or a
legal entity that is not organized under the laws of Chile and does not have a permanent establishment in Chile (a “foreign holder”). This discussion is based upon Chilean income tax laws presently in force, including Ruling No. 324 of January 29, 1990 of theServicio de Impuestos Internos (the Chilean Internal Revenue Service or “SII”) and other applicable regulations and rulings that are subject to change without notice. The discussion is not intended as a tax advice to any particular investor, which can be rendered only in light of that investor’s particular tax situation. Each investor or potential investor is encouraged to seek independent tax advice with respect to consequences of investing in Andina’s stock or the ADSs.
Under Chilean law, all matters regarding taxation such as tax rates (including tax rates applicable to foreign investors), the computation of taxable income for Chilean purposes, the manner in which Chilean taxes are imposed and collected, and others thereof, may only be imposed or amended by a law enacted by Congress. In addition, the SII is empowered to issue rulings and regulations of either general or specific application, and to interpret the provisions of Chilean tax law. Chilean tax may not be assessed retroactively against taxpayers who act in good faith relying on such rulings, regulations and interpretations, but the SII may change said rulings, regulations and interpretations prospectively. There is no income tax treaty in force between Chile and the United States.
Cash Dividends and Other Distributions
Dividends we pay with respect to the shares of stock held by a foreign holder will be subject to Chilean withholding tax at a rate of 35% (the “Withholding Tax”). The tax paid by the Company on profits from which the dividends are paid (the “First Category Tax”), imposed at a rate of 17%, will be credited against the Withholding Tax. The credit will increase the base upon which the Withholding Tax is imposed. Consequently, dividends that are attributable to current profits will be subject to an effective dividend withholding tax rate of 21.7%, calculated as follows:
|
| | |
| | Ch$ |
|
Company taxable income | | 100.0 | |
First Category Tax (17.0% of Ch$100) | | (17.0 | ) |
Net distributable income | | 83.0 | |
| | | |
Dividend distributed | | 83.0 | |
| | | |
Withholding Tax (35% of the sum of Ch$83.0 dividend plus Ch$17.0 First Category Tax paid) | | (35.0 | ) |
Credit for First Category Tax | | 17.0 | |
| | | |
Net additional tax withheld | | (18.0 | ) |
Net dividend received | | 65.0 | |
| | | |
Effective dividend withholding rate (18.0/83.0) | | 21.7 | % |
| | | |
66
For purposes of determining the amount of First Category Tax we pay on profits from which the dividends are paid, dividends are attributed to our oldest retained profits.
Dividend distributions made in property will be subject to the same Chilean tax rules as cash dividends. Our stock dividends are not subject to Chilean taxation.
Capital Gains
Gains recognized from the sale or exchange of ADSs (or ADRs evidencing ADSs) by a foreign holder outside Chile will not be subject to Chilean taxation.
Gains recognized on a sale or exchange of shares of stock (as distinguished from sales or exchanges of ADSs representing such shares) will be subject to both the First Category Tax and the
Withholding Tax (the former being credited against the latter) if either (i) the foreign holder has held the shares of common stock for less than one year since exchanging ADSs for the shares of common stock, (ii) the foreign holder acquired and disposed of the shares of common stock in the ordinary course of its business or as an habitual trader of shares or (iii) the foreign holder transfers shares of common stock to a related person, as defined by Chilean tax law. In all other cases, gain on the disposition of shares of common stock will be subject only to the First Category Tax, currently imposed at a rate of 17%, except if it is for shares resulting from an exchange of ADSs for shares (flow back) in which case, the Chilean Internal Revenue Service pursuant to Oficio 1,705 dated May 15, 2006 has interpreted that said shares may benefit from article 18 ter if the ADS were acquired through a stock broker or by any other circumstance stipulated by that norm.
The deposit or withdrawal of shares of common stock in exchange for ADSs is not subject to any Chilean taxes. The tax basis of shares of common stock received in exchange for ADSs will be determined in accordance with the valuation procedure set forth in the deposit agreement, which values shares of common stock at the highest reported sales price at which they trade on the Santiago Stock Exchange on the date of the withdrawal of the shares of common stock from the depositary. Consequently, the conversion of ADSs into shares of common stock, and the immediate sale of the shares for the value established under the deposit agreement, will not generate a capital gain subject to taxation in Chile. However, in the case where the sale of the shares is made on a day that is different than the date in which the exchange is recorded, capital gain subject to taxation in Chile may be generated. In connection thereto, on October 1, 1999 the Chilean Internal Revenue Service issued Ruling No. 3708 whereby it allowed Chilean issuers of ADSs to amend the deposit agreements to which they are parties in order to include a clause that states that, in the case that the exchanged shares are sold by the ADSs’ holders on a Chilean Stock Exchange either on the same day in which the exchange is recorded or within the two business days prior to such date, the acquisition price of such exchanged shares shall be the price registered in the invoice issued by the stock broker that participated in the sale transaction. Consequently, should this amendment be included in the deposit agreement, the capital gain that may be generated if the exchange date is different than the date in which the shares received in exchange for ADSs were sold, will not be subject to taxation. We reiterate that if a contributor in good faith adopts Oficio 1,705, then the excess value will not be subject to taxation in Chile.
The distribution and exercise of preemptive rights relating to the shares of common stock will not be subject to Chilean taxation. Any gain on the sale or assignment of preemptive rights relating to the shares of common stock will be subject to both the First Category Tax and the Withholding Tax (the former being credited against the latter).
Other Chilean Taxes
No Chilean inheritance, gift or succession taxes apply to the transfer or disposition of the ADSs by a foreign holder, but such taxes generally will apply to the transfer at death or by gift of shares of common stock by a foreign holder. No Chilean stamp, issue, registration or similar taxes or duties apply to foreign holders of ADSs or shares of common stock.
Withholding Tax Certificates
Upon request, we will provide to foreign holders appropriate documentation evidencing the payment of Chilean withholding taxes.
United States Tax Considerations
The following discussion summarizes certain U.S. federal income tax consequences of an investment in ADSs or shares of common stock. This discussion is based upon U.S. federal income tax laws presently in force. The discussion is not a full description of all tax considerations that may be relevant to a decision to purchase ADSs or shares of common stock. In particular, the discussion is
directed only to U.S. holders (as defined below) that hold ADSs or shares of common stock as capital assets, and it does not address the tax treatment of holders that are subject to special tax rules under the Internal Revenue Code of 1986 as amended (the “Code”), such as financial institutions, regulated investment companies, real estate
67
investment trusts, investors in pass-through entities, dealers in securities or currencies, traders in securities that elect to use a mark-to-market method of accounting for their securities holdings, insurance companies, tax-exempt entities, persons holding ADSs or shares of common stock as part of a hedging, integrated, conversion or constructive sale transaction or a straddle, holders of 10% or more of our voting shares, persons liable for alternative minimum tax or persons whose “functional currency” is not the U.S. dollar. Furthermore, the discussion below is based upon the provisions of the Code and regulations, rulings and judicial decisions there under as of the date hereof, and such authorities may be repealed, revoked or modified so as to result in U.S. federal income tax consequences different from those discussed below. In addition, the discussion below assumes that the Deposit Agreement, and all other related agreements, will be performed in accordance with their terms. If a partnership holds our ADSs or shares of common stock, the tax treatment of a partner will generally depend upon the status of the partner and the activities of the partnership. Partners in a partnership holding ADSs or shares of common stock should consult their tax advisors. This summary does not contain a detailed description of all the United States federal income tax consequences to a holder in light of its particular circumstances and does not address the effects of any state, local or non-United States tax laws.Prospective purchasers should consult their tax advisors about the federal, state, local and foreign tax consequences to them of the purchase, ownership and disposition of ADSs or shares of common stock.
As used herein, the term “U.S. holder” means a holder of ADSs or shares of common stock that is (i) an individual U.S. citizen or resident, (ii) a corporation (or any other entity treated as a corporation for U.S. federal income tax purposes) created or organized in or under the laws of the United States, any state thereof or the District of Columbia, (iii) an estate the income of which is subject to U.S. federal income taxation regardless of its source or (iv) a trust (x) that is subject to the primary supervision of a court within the United States and with respect to which one or more U.S. persons have the authority to control all substantial decisions of the trust or (y) that has a valid election in effect under applicable U.S. Treasury regulations to be treated as a U.S. person.
ADSs
If the obligations contemplated by the deposit agreement are performed in accordance with its terms, holders of ADSs (or ADRs evidencing ADSs) generally will be treated for U.S. federal income tax purposes as the owners of the shares of common stock represented by those ADSs. Deposits or withdrawals of shares of common stock by U.S. holders in exchange for ADSs will not result in the realization of gain or loss for U.S. federal income tax purposes. The U.S. Treasury has expressed concerns that parties to whom ADSs are released may be taking actions that are inconsistent with the claiming of foreign tax credits for U.S. holders of ADSs. Such actions would also be inconsistent with the claiming of the reduced rate of tax, described below, applicable to dividends received by certain non-corporate holders. Accordingly, the analysis of the creditability of Chilean taxes and the availability of the reduced tax rate for dividends received by certain non-corporate holders, each described below, could be affected by actions taken by parties to whom the ADSs are released.
Cash Dividends and Other Distributions
Cash dividends (including the amount of any Chilean taxes withheld) paid to U.S. holders with respect to the ADSs or shares of common stock generally will be treated as dividend income to such U.S. holders, to the extent paid out of current or accumulated earnings and profits, as determined under U.S. federal income tax principles. Such income will be includable in the gross income of a U.S. holder as ordinary income on the day received by the Depositary, in the case of ADSs, or by the U.S. holder, in the case of shares of common stock. The dividends will not be eligible for the dividends received deduction
allowed to corporations under the Code. With respect to non-corporate U.S. holders, certain dividends received before January 1, 2011 from a qualified foreign corporation may be subject to reduced rates of taxation. A foreign corporation is treated as a qualified foreign corporation with respect to dividends received from that corporation on shares (or ADSs backed by such shares) that are readily tradable on an established securities market in the United States. U.S. Treasury Department guidance indicates that our ADSs (which are listed on the New York Stock Exchange), but not our shares of common stock, are readily tradable on an established securities market in the United States. Thus, we do not believe that dividends that we pay on our shares of our common stock that are not backed by ADSs currently meet the conditions required for these reduced tax rates. There can be no assurance that our ADSs will be considered readily tradable on an established securities market in later years. Non-corporate holders that do not meet a minimum holding period requirement during which they are not protected from the risk of loss or that elect to treat the dividend income as “investment income” pursuant to section 163(d)(4) of the Code will not be eligible for the reduced rates of taxation regardless of our status as a qualified foreign corporation. In addition, the rate reduction will not apply to dividends if the recipient of a dividend is obligated to make related payments with respect to positions in substantially similar or related property. This disallowance applies even if the minimum holding period has been met. Non-corporate U.S. holders should consult their own tax advisors regarding the application of these rules given their particular circumstances.
Dividends paid in Chilean pesos will be includable in a U.S. dollar amount based on the exchange rate in effect on the day of receipt by the Depositary, in the case of ADSs, or by the U.S. holder in the case of shares of common stock, regardless
68
of whether the Chilean pesos are converted into U.S. dollars. If the Chilean pesos received as dividends are not converted into U.S. dollars on the date of receipt, a U.S. holder will have a basis in Chilean pesos equal to their U.S. dollar value on the date of receipt. Any gain or loss realized on a subsequent conversion or other disposition of the Chilean pesos will be treated as U.S. source ordinary income or loss, regardless of whether the pesos are converted into U.S. dollars.
The Chilean Withholding Tax (net of any credit for the First Category Tax) paid by or for the account of any U.S. holder may be eligible, subject to generally applicable limitations and conditions, for credit against the U.S. holder’s federal income tax liability. For purposes of calculating the foreign tax credit, dividends paid with respect to the ADSs or shares of common stock generally will be foreign source income and will generally constitute passive income. Further, in certain circumstances, a U.S. holder that (i) has held ADSs or shares of common stock for less than a specified minimum period during which it is not protected from risk of loss or (ii) is obligated to make payments related to the dividends will not be allowed a foreign tax credit for foreign taxes imposed on dividends paid on ADSs or shares of common stock. The rules governing the foreign tax credit are complex. Investors are urged to consult their tax advisors regarding the availability of the foreign tax credit under their particular circumstances.
Distributions to U.S. holders of additional shares of common stock or preemptive rights with respect to shares of common stock that are made as part of a pro rata distribution to all shareholders of the Company generally should not be subject to U.S. federal income tax.
To the extent that the amount of any distribution exceeds our current and accumulated earnings and profits for a taxable year, as determined under U.S. federal income tax principles, the distribution will first be treated as a tax-free return of capital, causing a reduction in the adjusted basis of the ADSs or shares of common stock (thereby increasing the amount of gain, or decreasing the amount of loss, to be recognized by the investor on a subsequent disposition of the ADSs or shares of common stock), and the balance in excess of adjusted basis will be taxed as capital gain recognized on a sale or exchange. Consequently, such distributions in excess of our current and accumulated earnings and profits generally would not give rise to foreign source income and a U.S. holder generally would not be able to use the foreign tax credit arising from any Chilean withholding tax imposed on such distributions unless such credit can be applied (subject to applicable limitations) against U.S. taxes due on other foreign source income in the appropriate category for foreign tax credit purposes. However, we do not expect to keep
earnings and profits in accordance with U.S. federal income tax principles. Therefore, a U.S. holder should expect that a distribution will generally by treated as a dividend (as discussed above).
We do not believe that we are, for U.S. federal income tax purposes, a passive foreign investment company (a “PFIC”), and expect to continue our operations in such a manner that we will not be a PFIC. If, however, we are or become a PFIC, U.S. holders could be subject to additional U.S. federal income taxes on gain recognized with respect to the ADSs or shares of common stock and on certain distributions, plus an interest charge on certain taxes treated as having been deferred by the U.S. holder under the PFIC rules of the U.S. federal income tax laws.
Non-corporate U.S. holders will not be eligible for reduced rates of taxation on any dividends received from us prior to January 1, 2011, if we are a PFIC in the taxable year in which such dividends are paid or in the preceding taxable year.
Capital Gains
U.S. holders that hold ADSs or shares of common stock as capital assets will recognize capital gain or loss for federal income tax purposes on the sale or other disposition of such ADSs or shares (or preemptive rights with respect to such shares) held by the U.S. holder or the Depositary. Capital gains of individuals derived with respect to capital assets held for more than one year are eligible for reduced rates of taxation. The deductibility of capital losses is subject to limitations. Any gain or loss recognized by a U.S. holder generally will be treated as U.S. source gain or loss. Consequently, in the case of a disposition of shares of common stock (which, unlike a disposition of ADSs, may be taxable in Chile), the U.S. holder may not be able to use the foreign tax credit for Chilean tax imposed on the gain unless it can apply (subject to applicable limitations) the credit against tax due on other income from foreign sources.
Estate and Gift Taxation
As discussed above under “Chilean Tax Considerations — Other Chilean Taxes,” there are no Chilean inheritance, gift or succession taxes applicable to the transfer or disposition of ADSs by a foreign holder, but such taxes generally will apply to the transfer at death or by gift of shares of common stock by a foreign holder. The amount of any inheritance tax paid to Chile may be eligible for credit against the amount of U.S. federal estate tax imposed on the estate of a U.S. holder. U.S. holders should consult their personal tax advisors to determine whether and to what extent they may be entitled to such credit. The Chilean gift tax generally will not be treated as a creditable foreign tax for U.S. tax purposes.
69
Information Reporting and Backup Withholding
In general, information reporting requirements will apply to dividends in respect of ADSs or the shares of common stock or the proceeds received on the sale, exchange, or redemption of the ADSs paid within the United States (and in certain cases, outside of the United States) to U.S. holders other than certain exempt recipients (such as corporations). A backup withholding tax may apply to such payments if the U.S. holder fails to provide an accurate taxpayer identification number or certification of other exempt status or fails to report interest and dividends required to be shown on its federal income tax returns. The amount of any backup withholding from a payment to a U.S. holder will be allowed as a credit against the U.S. holder’s U.S. federal income tax liability provided the required information is furnished to the Internal Revenue Service.
Tax Considerations Relating to Debt Securities
General
In October 1997, we issued US$150 million 7% Notes Due 2007 (the “2007 Notes”), US$100 million 75/8% Notes due 2027 (the “2027 Notes”) and US$100 million 77/8% Debentures Due 2097 (the
“2097 “2097 Debentures,” together with the 2007 Notes and the 2027 Notes, the “Debt Securities”). The following is a summary of certain Chilean tax and U.S. federal income tax considerations relating to the purchase, ownership and disposition of Debt Securities. The summary does not purport to be a comprehensive description of all tax considerations that may be relevant to a decision to purchase Debt Securities. This summary does not describe any tax consequences arising under the laws of any state, locality or taxing jurisdiction other than the United States and Chile.
This summary is based on the tax laws of Chile and the United States as in effect on the date hereof, as well as regulations, rulings and decisions of Chile and the United States available on or before such date and now in effect. All of the foregoing is subject to change, which change could apply retroactively and could affect the continued validity of this summary.
There is currently no tax treaty between the United States and Chile.
Chilean Tax Considerations
The following is a general summary of the material consequences under Chilean tax law, as currently in effect, of an investment in the Debt Securities made by a Foreign Holder. The term “Foreign Holder” means: (i) an individual, who is not a resident in Chile (for purposes of Chilean taxation, an individual is resident in Chile if he or she has resided in Chile for more than six months in one calendar year, or a total of more than six months in two consecutive fiscal years); or (ii) a legal entity that is not organized under the laws of Chile, unless the Debt Securities are assigned to a branch or an agent, representative or permanent establishment of such entity in Chile.
Under Chile’s Income Tax Law, because the issuance of the Debt Securities is registered with the Central Bank, payments of interest or premium, if any, that we make in respect of the Debt Securities to a Foreign Holder will generally be subject to a Chilean withholding tax (the “Chilean Interest Withholding Tax”) currently assessed at a rate of 4.0%. If the Debt Securities are issued through our offshore branch, payment to Foreign Holders of Debt Securities by such branch generally will not be subject to the Chilean withholding tax.
Chile’s Income Tax Law provides that any capital gains realized on the sale or other disposition by a Foreign Holder of the Debt Securities generally will not be subject to any Chilean income taxes provided that such sale or other disposition occurs outside of Chile (except that any premium payable on redemption of the Debt Securities will be treated as interest and subject to the Chilean Interest Withholding Tax as described above).
A Foreign Holder will not be liable for estate, gift, inheritance or similar taxes with respect to the Debt Securities unless such Debt Securities (i) are located in Chile at the time of such Foreign Holder’s death or (ii) were purchased or acquired with money obtained from Chilean sources.
The initial issuance of the Debt Securities is subject to stamp tax of 1.608% up to the year 2006, 1.5% for the year 2006, 1.35% for the year 2008, and 1.2% for the year 2009 forward, of the aggregate principal amount of the Debt Securities, which will be payable by the Company. If the Debt Securities are issued through our offshore branch and are not subsequently brought into Chile, no stamp tax will be payable. If the stamp tax is not paid when due, Chilean tax law imposes a penalty up to three times the amount of the tax due plus interest. In addition, until such tax (and any penalty) is paid, Chilean courts would not admit any action based on the Debt Securities. A Foreign Holder will not be liable for Chilean stamp, registration or similar taxes.
70
United States Tax Considerations
The following summary describes certain U.S. federal income tax consequences of the ownership of Debt Securities by U.S. holders (as defined below) as of the date hereof. Except where noted, it deals
only with Debt Securities held as capital assets and does not deal with special situations, such as those of dealers in securities or currencies, financial institutions, insurance companies, regulated investment companies, real estate investment trusts, tax-exempt entities, investors in pass-through entities, persons holding the Debt Securities as a part of a hedging, integrated, conversion or constructive sale transaction or a straddle, traders in securities that elect to use a mark-to-market method of accounting for their securities holdings, persons liable for the alternative minimum tax or holders of Debt Securities whose “functional currency” is notngot the U.S. dollar. Furthermore, the discussion below is based upon the provisions of the Code, and regulations, rulings and judicial decisions there under as of the date hereof, and such authorities may be repealed, revoked or modified so as to result in U.S. federal income tax consequences different from those discussed below. If a partnership holds our Debt Securities, the tax treatment of a partner will generally depend upon the status of the partner and the activities of the partnership. Partners in a partnership holding our Debt Securities should consult their tax advisors.
Persons considering the purchase, ownership or disposition of the Debt Securities should consult their own tax advisors concerning the federal income tax consequences in light of their particular situations as well as any consequences arising under the laws of any other taxing jurisdiction.
As used herein, a “U.S. holder” of the Debt Securities means a holder of the Debt Securities that is (i) an individual U.S. citizen or resident, (ii) a corporation (or any other entity treated as a corporation for U.S. federal income tax purposes) created or organized in or under the laws of the United States, any state thereof or the District of Columbia, (iii) an estate the income of which is subject to U.S. federal income taxation regardless of its source or (iv) a trust (x) that is subject to the primary supervision of a court within the United States and with respect to which one or more U.S. persons have the authority to control all substantial decision of the trust or (y) that has a valid election in effect under applicable U.S. Treasury regulations to be treated as a U.S. person.
Payments of Interest
Interest on the Debt Securities will generally be taxable to a U.S. holder as ordinary income at the time it is paid or accrued in accordance with the U.S. holder’s method of accounting for tax purposes. In addition to interest on the Debt Securities, a U.S. holder will be required to include in income any Additional Amounts and any tax withheld from interest payments notwithstanding that such withheld tax is not in fact received by such U.S. holder. A U.S. holder may be entitled to deduct or credit such tax, subject to applicable limitations in the Code, including that the election to deduct or credit foreign taxes applies to all of the U.S. holder’s foreign taxes for a particular year. Interest income, including Chilean taxes withheld there from and Additional Amounts on the Debt Securities, generally will constitute foreign source income and generally will be considered passive income, which is treated separately from other types of income in computing the foreign tax credit that may be allowable to U.S. holders under U.S. federal tax laws. A U.S. holder will generally be denied a foreign tax credit for Chilean taxes imposed with respect to the Debt Securities where such a holder does not meet a minimum holding period requirement during which the holder is not protected from risk of loss. The rules governing the foreign tax credit are complex. We urge investors to consult their tax advisors regarding the availability of the foreign tax credit under their particular circumstances.
Market Discount
If a U.S. holder purchases a Debt Security for an amount that is less than its principal amount, the amount of the difference will be treated as “market discount” for U.S. federal income tax purposes, unless that difference is less than a specified de minimis amount. Under the market discount rules, the U.S. holder will be required to treat any principal payment on, or any gain on the sale, exchange, retirement or other disposition of, a Debt Security as ordinary income to the extent of the market discount that the U.S. holder has not previously included in income and is treated as having accrued on the Debt Security at the time of its payment or disposition.
In addition, the U.S. holder may be required to defer, until the maturity of the Debt Security or its earlier disposition in a taxable transaction, the deduction of all or a portion of the interest expense on any indebtedness attributable to the Debt Security. A U.S. holder may elect, on a bond-by-bond basis, to deduct the deferred interest expense in a tax year prior to the year of disposition. U.S. holders should consult their own tax advisors before making this election.
Any market discount will be considered to accrue ratably during the period from the date of acquisition to the maturity date of the Debt Security, unless the U.S. holder elects to accrue on a constant interest method. A U.S. holder may elect to
71
include market discount in income currently as it accrues, on either a ratable or constant interest method, in which case the rule described above regarding deferral of interest deductions will not apply.
Amortizable Bond Premium
A U.S. holder that purchases a Debt Security for an amount in excess of its principal amount will be considered to have purchased the Debt Security at a “premium.” The U.S. holder may elect to amortize the premium over the remaining term of the Debt Security on a constant yield method as an offset to interest when includible in income under the holder’s regular accounting method. If the U.S. holder does not elect to amortize bond premium, that premium will decrease the gain or increase the loss the holder would otherwise recognize on disposition of the Debt Security.
Sale, Exchange and Retirement of Debt Securities
Upon the sale, exchange, retirement or other disposition of the Debt Securities, a U.S. holder will recognize gain or loss equal to the difference between the amount realized upon the sale, exchange, retirement or other disposition (less any accrued interest, which will be taxable as such if not previously included in income) and the U.S. holder’s adjusted tax basis in the Debt Securities. A U.S. holder’s tax basis in the Debt Securities generally will be the U.S. holder’s cost therefore, increased by market discount previously included in income, and reduced by any amortized premium. Except as described above with respect to market discount, gain or loss realized by a U.S. holder on the sale, exchange, retirement or other disposition of the Debt Securities will generally be capital gain or loss. Gain or loss realized by a U.S. holder on the sale, exchange, retirement or other disposition of the Debt Securities will generally be treated as U.S. source gain or loss. Consequently, a U.S. holder may not be able to claim a credit for any Chilean tax imposed on the sale, exchange, retirement or other disposition of the Debt Securities due to limitations on the foreign tax credit under the Code. Capital gains of individuals derived with respect to capital assets held for more than one year are eligible for reduced rates of taxation. The deductibility of capital losses is subject to limitations.
Information Reporting and Backup Withholding
In general, information reporting requirements will apply to certain payments of principal and interest on the Debt Securities and to the proceeds of the sale of the Debt Securities made to U.S. holders other than certain exempt recipients (such as corporations). A backup withholding tax will apply to such payments if the U.S. holder fails to provide its taxpayer identification number or a certification of exempt status, or, in the case of interest payments, fails either to report in full dividend and interest income or to make certain certifications.
Any amounts withheld under the backup withholding rules will be allowed as a refund or a credit against the U.S. holder’s U.S. federal income tax liability provided the required information is furnished to the Internal Revenue Service.
Special Tax Considerations Relating to 2097 Debentures
As a result of the 2097 Debentures’ 100 year term, it is not certain whether such Debentures will be treated as debt or as equity for U.S. federal income tax purposes. We have taken the position that the 2097 Debentures constitute debt for financial reporting and U.S. federal income tax purposes. Our position, however, is not binding on the Internal Revenue Service. Although classification of the 2097 Debentures as equity generally would not significantly affect a U.S. holder’s taxable income resulting from an investment in the 2097 Debentures, the discussion that follows also briefly describes certain U.S. federal income tax consequences that would arise if the 2097 Debentures were not treated as debt for U.S. federal income tax purposes.
If the 2097 Debentures are treated as equity for U.S. federal income tax purposes, the potential differences in the U.S. federal income tax treatment to U.S. holders of the 2097 Debentures that would result include (i) payments denominated as interest on the 2097 Debentures (including Additional Amounts) would be reclassified as dividends to the extent paid out of the current or accumulated earnings and profits of the Company (as determined using U.S. federal income tax principles) and (ii) U.S. holders would be required to report such payment amounts as ordinary income when actually or constructively received (instead of accruing such amounts as interest, even if such U.S. holders are accrual method taxpayers). To the extent any such payments exceed such earnings and profits, they would be treated as a return of capital or capital gain (although, as we do not expect to keep earnings and profits in accordance with U.S. federal income tax principles. U.S. holders should expect that such payments will generally be treated as dividends). Amounts treated as dividends will not be eligible for the dividends received deduction generally allowed U.S. corporations. In addition, because our 2097 Debentures are not readily tradable on an established securities market in the United States, we do not believe that any amounts treated as dividends currently meet the conditions required for the reduced tax rates that apply to qualified dividend income received by non-corporate U.S. holders.Persons considering the purchase, ownership or disposition of the 2097 Debentures should consult their own tax advisors concerning additional potential tax consequences, including those arising upon a sale,
72
exchange or redemption of the 2097 Debentures, which could result from the treatment of the 2097 Debentures as equity for U.S. federal income tax purposes.
Documents on Display
We are subject to the informational reporting requirements of the U.S. Securities Exchange Act of 1934, as amended, which requires that we file periodic reports and other information with the SEC. As a foreign private issuer, we file annual reports on Form 20-F as opposed to Form 10-K. We do not file quarterly reports on Form 10-Q but furnish reports in relation to material events on Form 6-K. As a foreign private issuer, we are exempt from the rules under the U.S. Securities Exchange Act of 1934, as amended, prescribing the furnishing and content of proxy statements and short-swing profit disclosure and liability.
You may read and copy all or any portion of the annual report or other information in our files in the SEC’s public reference room at 100 F Street, N.E., Washington, D.C. 20549. You can also access these documents through the SEC’s website at http://www.sec.gov. You can request copies of these documents upon payment of a duplicating fee, by writing to the SEC. Please call the SEC at 1-800-SEC-0330 for further information on the operation of the public reference rooms. In addition, reports and other information concerning us may be inspected at the offices of the New York Stock Exchange, Inc., 20 Broad Street, New York, New York 10005, on which our ADSs are listed.
We also file reports with the Chilean Superintendencia de Valores y Seguros. You may read and copy any materials filed with the SVS directly from its websitehttp://www.svs.cl of from our corporate websitehttp://www.koandina.com or request a hard copy toir@koandina.com. ir@koandina.com. The documents referred
to in this annual report can be inspected at El Golf 40 Oficina 401, Las Condes, Santiago, Chile. Chilean law may restrict our shareholders’ right of inspection to certain days and times.
NYSE and Chilean Corporate Governance Requirements
In accordance with Section 303A.11 of the NYSE’s Listed Company Manual, the following table sets forth significant differences between Chilean corporate governance practices and those corporate governance practices followed by domestic corporations under NYSE listing standards. Significant ways in which our corporate governance practices differ from those followed by U.S. companies under NYSE listing standards are also publicly available on our website atwww.koandina.com.
| | | | |
ITEM |
| NYSE REQUIREMENTS |
| CHILEAN LAW REQUIREMENTS |
| | | | |
303A.01
Independence
| | Members of the Board of Directors must be independent in their majority. | | There is no legal obligation to have a Board of Directors composed mainly of independent members. In addition, according to section 303A regarding Controlled Companies, the requirements of 303A do not apply to our Company. |
| | | | |
303A.02
Test of Independence
| | Members of the Board of Directors must meet the Test of Independence. | | No similar legal obligation exists under Chilean law. However, Chilean law defines a director as independent if he is elected by votes of shareholders who are not controlling shareholders or otherwise related to controlling shareholders. |
| | | | |
303A.03
Meetings of Non-Management Directors
| | Non-Management Directors must meet regularly without management of the company. | | No similar legal obligation exists under Chilean law. Under Chilean law, the position of director of a corporation is incompatible with the position of manager, auditor, accountant or president of the company. The Non-Management Director does not exist under Chilean law. Directors, however, are required to convene in legally established meetings to resolve matters required by Chilean Corporation Law. |
73
ITEM |
| NYSE REQUIREMENTS |
| CHILEAN LAW REQUIREMENTS |
| | | | |
303A.04
Corporate Governance Committee
| | Listed companies must have a Nominating/Corporate Governance Committee composed entirely of independent directors and must have a written charter addressing certain matters. | | There is no similar legal obligation under Chilean law. In addition, section 303 A regarding Controlled Companies does not apply to our Company. Chilean Andina has a Directors’ Committee whose functions are set by Chilean Corporation Law. |
| | | | |
303A.05
Compensation Committee
| | Listed companies must have a Compensation Committee composed entirely of independent directors, and must have a written charter addressing certain matters. | | There is no similar legal obligation under Chilean law. In accordance with Chilean law, the above-mentioned Directors’ Committee is in charge of reviewing management compensation. In addition, section 303 A regarding Controlled Companies does not apply to our Company. |
| | | | |
303A.06
Audit Committee
| | •· Listed companies must have an Audit Committee that satisfies the requirements of Rule 10A-3 under the Exchange Act.
•· The Audit Committee must have a minimum of three members.
•· In addition to any requirement of Rule 10A-3(b)(1), all Audit Committee members must satisfy the requirements for independence set out in Section 303 A.02.
•· The Audit Committee must have a written charter addressing certain matters.
•· An Audit Committee was appointed in accordance with the characteristics, composition and faculties established under Item 16-A of this document.
| | No similar legal obligation exists under Chilean law. However, in accordance with the Chilean Public Companies Law 18,046, public companies that have a net worth of more than 1.5 million UFs must have a Committee of Directors, formed by three independent board members and the controller. The Committee’s compensation is set by the ordinary shareholders’ meeting, and it performs the following functions: (1) examines reports of account inspectors and external auditors, financial statements and issues an opinion on these reports and statements; (2) proposes external auditors and rating agencies to the Board of Directors; (3) examines conflicts of interest and informs the Board regarding such conflicts; (4) examines compensation systems and plans for directors and executive officers; and (5) any other matters that the bylaws, the shareholders’ meeting or the Board of Directors decides. |
| | | | |
303A.07
Internal Audit Function
| | Listed companies must maintain an Internal Audit Function to provide management and the Audit Committee with ongoing assessments of the company’s risk management processes and systems of internal control. A listed company may choose to outsource this function to a third party service provider other than its independent auditor. | | There is no similar obligation under Chilean law. Chilean law requires that companies must have both account inspectors and external auditors. However, Andina designated an Audit Committee in accordance with Rule 10 A.3. |
| | | | |
303A.08
Voting on Compensation Plans
| | Shareholders must have the opportunity to vote on compensation plans regarding board members, executives and employees. | | Directors’ compensation is annually approved during the Company’s General Shareholders’ Meeting. |
74
| | | | |
ITEM |
| NYSE REQUIREMENTS |
| CHILEAN LAW REQUIREMENTS |
| | | | |
303A.09
Corporate Governance
| | Listed companies must adopt and disclose Corporate Governance Practices. | | Chilean Law does not require the adoption of Corporate Governance Practices because they have been established by Chilean Corporate Law. |
| | | | |
303A.10
Code of Business Conduct
| | A company must adopt a Code of Business Conduct for its directors, officers and employees. Such company must disclose any waiver of its code of conduct that is granted to an officer or director. | | There is no legal obligation to adopt a Code of Business Conduct. Chilean law requires that a company have a set of internal regulations which regulate the company and its relations with personnel. Such regulations must contain, among other things, regulations related to ethics and good behavior. Notwithstanding the above, a company may create internal codes of conduct, provided they do not require or prohibit behavior that contravenes Chilean law. In 1996, Andina created a Code of Business Conduct that applies to the entire Company, which does not require or prohibit behavior that contravenes Chilean Law. This Code of Business Conduct is available on our website athttp://www.koandina.com/www.koandina.com/. |
| | | | |
303A.11
Summary of Differences
| | A company must provide a summary description of significant differences between its home country corporate governance practices and the corporate governance requirements established by the NYSE as applicable to U.S. domestic listed companies | | No similar obligation exists under Chilean law. |
| | | | |
303A.12
CEO Certification
| | • Each listed company CEO must certify to the NYSE each year that he or she is not aware of any violation by the company of NYSE corporate governance listing standards. • Each listed company CEO must promptly notify the NYSE in writing after any executive officer of the listed company becomes aware of any material non-compliance with any of the applicable provisions of Section 303 A. • Each listed company must submit an executed Written Affirmation annually to the NYSE. In addition, each listed company must submit an interim Written Affirmation each time a change occurs to the Board of Directors or any of the committees subject to Section 303 A. The annual and interim Written Affirmations must be in the form specified by the NYSE. | | No similar obligation exists under Chilean law. However, in accordance with Chilean law, the directors of a company must annually submit for approval the company’s annual report and financial statements to its shareholders at the company’s annual shareholders’ meeting. Similarly, public companies must, from time to time, provide all relevant company information by means of the publications and notifications established by law. |
75
ITEM |
| NYSE REQUIREMENTS |
| CHILEAN LAW REQUIREMENTS |
| | | | |
303A.13
Public Reprimand
| | The NYSE may issue a Public Reprimand letter to any listed company, regardless of the type of security listed or country of incorporation if it determines the company has violated a NYSE listing standard. | | No similar obligation exists under Chilean law, with the exception of sanctions imposed by the Chilean Superintendence of Securities (SVS). |
ITEM 11. | QUANTITATIVE AND QUALITATIVE DISCLOSURES ABOUT MARKET RISK |
ITEM 11.QUANTITATIVE AND QUALITATIVE DISCLOSURES ABOUT MARKET RISK
Market risk generally represents the risk that losses may occur in the values of financial instruments as a result of movements in interest rates, foreign currency exchange rates and commodity prices. We are exposed to changes in financial market conditions in the normal course of our business due to our use of certain financial instruments as well as transacting in various foreign currencies and translation of our foreign subsidiaries’ financial statements into the Chilean peso.
Interest Rate Risk
Our primary interest rate exposures relate to U.S. dollar denominated and UF long-term fixed rate bond liabilities and other long-term variable and fixed rate bank liabilities. We also invest in certain medium-term bond securities that bear a fixed interest rate. We monitor our exposure to interest rate fluctuations regularly depending on market conditions.
The following table provides information about our long-term debt and bond investments that are sensitive to changes in market interest rates as of December 31, 2006.2007.
| | | | Expected Maturity Date | | Estimated Fair
Market Value | | Expected Maturity Date | | Estimated Fair
Market Value | |
| | | 2007 | | 2008 | | 2009 | | 2010 | | 2011 | | Thereafter | | Total | | Total | | 2008 | | 2009 | | 2010 | | 2011 | | 2012 | | Thereafter | | Total | | Total | |
| | | MCh$ | | MCh$ | | MCh$ | | MCh$ | | MCh$ | | MCh$ | | MCh$ | | MCh$ | | MCh$ | | MCh$ | | MCh$ | | MCh$ | | MCh$ | | MCh$ | | MCh$ | | MCh$ | |
Interest Earning Assets | | | | | | | | | | | | | | | | | | | | | | | | | | | | | | | | | |
Bonds | | 7,014 | | | 11,517 | | | 0 | | | 0 | | | 5,172 | | | 64,174 | | | 87,877 | | | 87,021 | | 1,004 | | 0 | | 0 | | 0 | | 0 | | 0 | | 1,004 | | 1,015 | |
Weighted average interest rate | | 7.85 | % | | 6.07 | % | | | | | | 8.00 | % | | 5.94 | % | | 6.2 | % | | | | 5.13 | % | | | | | | | | | | | 5.13 | % | | |
Time deposits and credit links | | 7,173 | | | 5,494 | | | 0 | | | 0 | | | 0 | | | 0 | | | 12,667 | | | 12,667 | | 49,088 | | 0 | | 0 | | 0 | | 0 | | 0 | | 49,088 | | 49,088 | |
Weighted average interest rate | | 7.80 | % | | 6.94 | % | | | | | | | | | | 7.43 | % | | | | 4.68 | % | 0 | % | | | | | | | | | 4.68 | % | | |
Interest Bearing Liabilities | | | | | | | | | | | | | | | | | | | | | | | | | | | | | | | | | |
Long-term debt | | 0 | | | 0 | | | 0 | | | 0 | | | 0 | | | 0 | | | 0 | | | 0 | | 6,914 | | 2,135 | | 4,271 | | 4,271 | | 4,271 | | 58,650 | | 80,512 | | 98,505 | |
Fixed Rate | | 0 | | | 0 | | | 0 | | | 0 | | | 0 | | | 0 | | | 0 | | | 0 | | 6.20 | % | 6.50 | % | 6.50 | % | 6.50 | % | 6.50 | % | 6.52 | % | 6.49 | % | | |
Bonds | | 29,972 | | | 6,051 | | | 1,995 | | | 3,991 | | | 3,991 | | | 59,998 | | | 105,998 | | | 124,290 | | 6,914 | | 2,135 | | 4,271 | | 4,271 | | 4,271 | | 58,650 | | 80,512 | | 98,505 | |
Weighted average interest rate | | 6.67 | % | | 6.20 | % | | 6.50 | % | | 6.50 | % | | 6.50 | % | | 6.54 | % | | 6.55 | % | | | | 6.20 | % | 6.50 | % | 6.50 | % | 6.50 | % | 6.50 | % | 6.52 | % | 6.49 | % | | |
Bank liabilities | | 2,490 | | | 0 | | | 0 | | | 0 | | | 0 | | | 0 | | | 2,490 | | | 2,490 | | 3,951 | | 0 | | 0 | | 0 | | 0 | | 0 | | 3,951 | | 3,951 | |
Weighted average interest rate | | 8.75 | % | | | | | | | | | | | | 8.75 | % | | | | 8.91 | % | | | | | | | | | | | 8.91 | % | | |
Variable Rate | | | | | | | | | | | | | | | | | | | | | | | | | | | | | | | | | |
Bank liabilities | | 439 | | | 388 | | | 30 | | | 0 | | | 0 | | | 0 | | | 857 | | | 857 | | 122 | | 118 | | 347 | | 166 | | 109 | | 0 | | 862 | | 862 | |
Weighted average interest rate | | 15.66 | % | | 15.59 | % | | 15.59 | % | | | | | | | | 15.63 | % | | | | 11.89 | % | 10.79 | % | 9.87 | % | 9.82 | % | 9.40 | % | | | 10.21 | % | | |
Foreign Currency Risk
At December 31, 2006,2007, the Company has long-term interest bearing debt subject to exchange rate fluctuations between the Chilean peso and the U.S. dollar. We manage such risk by maintaining cash, deposits, money market mutual funds and bonds in U.S. dollars amounting to Ch$112,01746,299 million at December 31, 2006, representing 573% of2007, which are higher than our total long-termlong term debt in U.S. dollar debtdollars amounting to Ch$45,200 million at such date. Notwithstanding the aforementioned, our dollar-denominated financial assets are protected against fluctuations in the exchange rate for U.S. dollars by means of a “cross currency swap” hedge agreement. The hedged amount totaled Ch$80,46727,600 million at December 31, 2006,2007, with which the Company’s dollar-denominated debt is hedged.
The following table summarizes the financial instruments denominated in US dollars we held as of December 31, 2006.2007.
| | | | | | | | | | | | | | | | | | | |
| | | Expected Maturity Date | | | Estimated Fair |
| | | 2007 | | | 2008 | | 2009 | | 2010 | | 2011 | | Thereafter | | | Total | | | Market Value |
| | | MCh$ | | | MCh$ | | MCh$ | | MCh$ | | MCh$ | | MCh$ | | | MCh$ | | | MCh$ |
Assets | | | | | | | | | | | | | | | | | | | |
US$ denominated: | | | | | | | | | | | | | | | | | | | |
Cash | | 554 | | | 0 | | 0 | | 0 | | 0 | | 0 | | | 554 | | | 554 |
Money market mutual funds | | 14,750 | | | 0 | | 0 | | 0 | | 0 | | 0 | | | 14,750 | | | 14,750 |
Time deposit and credit link | | 3,342 | | | 5,494 | | 0 | | 0 | | 0 | | 0 | | | 8,836 | | | 8,836 |
Bonds | | 7,014 | | | 11,517 | | 0 | | 0 | | 5,172 | | 64,174 | | | 87,877 | | | 87,021 |
Foreign currency contracts | | 13,331 | | | 14,644 | | 0 | | 0 | | 0 | | 3,258 | | | 31,233 | | | 31,233 |
Liabilities | | | | | | | | | | | | | | | | | | | |
US$ denominated: | | | | | | | | | | | | | | | | | | | |
Long-term liabilities: | | | | | | | | | | | | | | | | | | | |
Bonds | | 17,416 | | | 0 | | 0 | | 0 | | 0 | | 2,130 | | | 19,546 | | | 19,945 |
Weighted average interest rate | | 7.00 | % | | | | | | | | | | 7.63 | % | | 7.07 | % | | |
76
| | Expected Maturity Date | | Estimated
Fair Market | |
| | 2008 | | 2009 | | 2010 | | 2011 | | 2012 | | Thereafter | | Total | | Value | |
| | MCh$ | | MCh$ | | MCh$ | | MCh$ | | MCh$ | | MCh$ | | MCh$ | | MCh$ | |
Assets | | | | | | | | | | | | | | | | | |
US$ denominated: | | | | | | | | | | | | | | | | | |
Cash | | 2,541 | | 0 | | 0 | | 0 | | 0 | | 0 | | 2,541 | | 2,541 | |
Money market mutual funds | | 18 | | 0 | | 0 | | 0 | | 0 | | 0 | | 18 | | 18 | |
Time deposit and credit link | | 42,736 | | 0 | | 0 | | 0 | | 0 | | 0 | | 42,736 | | 42,736 | |
Bonds | | 1,004 | | 0 | | 0 | | 0 | | 0 | | 0 | | 1,004 | | 1,015 | |
Foreign currency contracts | | 17,322 | | 0 | | 0 | | 0 | | 0 | | 0 | | 17,322 | | 17,322 | |
Liabilities | | | | | | | | | | | | | | | | | |
US$ denominated: | | | | | | | | | | | | | | | | | |
Long-term liabilities: | | | | | | | | | | | | | | | | | |
Bonds | | 19 | | 0 | | 0 | | 0 | | 0 | | 994 | | 1,013 | | 1,099 | |
Weighted average interest rate | | 7.63 | % | 0 | | 0 | | 0 | | 0 | | 7.63 | % | 7.07 | % | | |
ITEM 12. | DESCRIPTION OF SECURITIES OTHER THAN EQUITY SECURITIES |
ITEM 12.DESCRIPTION OF SECURITIES OTHER THAN EQUITY SECURITIES
Not applicable.
PART II
ITEM 13. | DEFAULTS, DIVIDEND ARREARAGES AND DELINQUENCIES |
ITEM 13.DEFAULTS, DIVIDEND ARREARAGES AND DELINQUENCIES
Not applicable.
ITEM 14. | MATERIAL MODIFICATIONS TO THE RIGHTS OF SECURITY HOLDERS AND USE OF PROCEEDS |
ITEM 14.MATERIAL MODIFICATIONS TO THE RIGHTS OF SECURITY HOLDERS AND USE OF PROCEEDS
The information requested by this item has been previously provided in the annual report for the year 2004. See “Item 4. Information on the Company—Part A. History and Development of the Company.”
ITEM 15.CONTROLS AND PROCEDURES ITEM 15.
| CONTROLS AND PROCEDURES |
Evaluation of disclosure controls and procedures.
Under the supervision and with the participation of our management, including our Chief Executive Officer, Chief Financial Officer and Controller, we have evaluated the effectiveness of the design and operation of our disclosure controls and procedures as of December 31, 2006.2007. Based on that evaluation, our Chief Executive Officer, Chief Financial Officer and Controller have concluded that these controls and procedures are effective to ensure that information required to be disclosed in the reports that we file or submit under the Securities Exchange Act of 1934, as amended, is recorded, processed, summarized and reported within the time periods specified in the SEC’s rules and forms, and that such information is accumulated and communicated to management as appropriate to allow timely decisions regarding required disclosure.
Management’s Annual Report on Internal Control over Financial Reporting.
Company management is responsible for establishing and maintaining adequate internal control over financial reporting. Internal control over financial reporting is defined in Rule 13a-15(f) or 15d-15(f) promulgated under the Securities Exchange Act of 1934, as amended, as a process designed by, or under the supervision of, the Company’s Chief Executive Officer, Chief Financial Officer and Controller and effected by the Company’s Board of Directors, management and other personnel, to provide reasonable assurance regarding the reliability of financial reporting and the preparation of financial statements for external purposes in accordance with generally accepted accounting principles and includes those policies and procedures that:
·pertain to the maintenance of records that in reasonable detail accurately and fairly reflect the transactions and dispositions of the assets of the Company;
·provide reasonable assurance that transactions are recorded as necessary to permit preparation of financial statements in accordance with generally accepted accounting principles, and that receipts and
77
expenditures of the Company are being made only in accordance with authorizations of management and directors of the Company; and
·provide reasonable assurance regarding prevention or timely detection of unauthorized acquisitions, use or disposition of the Company’s assets that could have a material effect on the financial statements.
Because of its inherent limitations, internal control over financial reporting may not prevent or detect misstatements. Projections of any evaluation of effectiveness as to future periods are subject to the risk that controls may become inadequate because of changes in conditions, or that the degree of compliance with the policies or procedures may deteriorate.
The Company’s management assessed the effectiveness of the Company’s internal control over financial reporting as of December 31, 2006.2007. In making this assessment, the Company’s management used the criteria set forth by the Committee of Sponsoring Organizations of the Treadway Commission (COSO) in Internal Control-Integrated Framework. Based on our assessment, management concluded that, as of December 31, 2006,2007, the Company’s internal control over financial reporting was effective based on those criteria.
This annual report does not include an audit report
The effectiveness of the company’s registered public accounting firm regardingCompany’s internal control over financial reporting. Management’s report was not subject to auditreporting as of December 31, 2007 has been audited by the companyCompany’s registered publicindependent accounting firm, pursuant to temporary rules of the Securities and Exchange Commission that permit the company to provide only management’swhich opinion is stated in their report, in this annual report.included herein.
Changes in internal controls over financial reporting.
There were no changes in our internal control over financial reporting during the year ended December 31, 20062007 that materially affected, or are reasonably likely to materially affect, our internal control over financial reporting.
ITEM 16A. | AUDIT COMMITTEE FINANCIAL EXPERT |
ITEM 16A.AUDIT COMMITTEE FINANCIAL EXPERT
Our board of directors has determined that Mr. Heriberto Urzúa Sánchez is our “audit committee financial expert” as defined in Item 16A of Form 20-F. Our board of directors has also determined that Mr. Heriberto Urzúa Sánchez is an “independent director” as defined in Section 303A.02 of the NYSE’s Listed Company Manual.
ITEM 16B. CODE OF ETHICSWe have adopted a “Code of Business Conduct” that constitutes a code of ethics for our employees. This code applies to our chief executive officer and all senior financial officers of our Company, including the chief financial officer, controller, or any other persons performing similar functions, as well as to all other officers and employees of the Company. Our code of ethics is available on our websites, free of charge, atwww.koandina.com. If we make any substantive amendment to the code of ethics or grant any waivers, including any implicit waiver, from a provision of the codes of ethics, we will disclose the nature of such amendment or waiver on the above mentioned website.
ITEM 16C. | PRINCIPAL ACCOUNTANT FEES AND SERVICES |
ITEM 16C. PRINCIPAL ACCOUNTANT FEES AND SERVICES
Fees Paid To Independent Public Accountants
The following table sets forth, for each of the years indicated, the kinds of fees paid to our external auditors and the percentage of each of the fees out of the total amount paid to them.
| | | | Year Ended December 31, | | Year Ended December 31, | |
| | | 2006 | | 2005 | | 2007 | | 2006 | |
Services rendered | | Fees MCh$ | | % of Total
Fees | | Fees MCh$ | | % of Total
Fees | | Fees
MCh$ | | % of Total
Fees | | Fees
MCh$ | | % of
Total
Fees | |
Audit fees(1) | | 347 | | 87 | | 250 | | 88 | |
Audit-related fees(2) | | 32 | | 8 | | 17 | | 6 | |
Tax fees(3) | | 19 | | 5 | | 16 | | 6 | |
Audit fees(1) | | | 589 | | 96 | % | 373 | | 87 | % |
Audit-related fees(2) | | | 4 | | 1 | % | 34 | | 8 | % |
Tax fees(3) | | | 18 | | 3 | % | 20 | | 5 | % |
Total | | 398 | | 100 | | 283 | | 100 | | 611 | | 100 | % | 427 | | 100 | % |
(1) | Audit fees consist of services that would normally be provided in connection with statutory and regulatory filings or engagements, including services that generally only the independent accountant can reasonably provide. |
78
(2) | Audit-related fees relate to assurance and associated services that traditionally are performed by the independent accountant, including: attest services that are not required by statute or regulation; accounting consultation and audits in connection with mergers, acquisitions and divestitures; employee benefit plans audits; and consultation concerning financial accounting and reporting standards. |
(3) | Tax fees relate to services performed by the tax division for tax compliance, planning, and advice. |
Directors’ Committee and Audit Committee Pre-Approval Policies and Procedures
We have adopted pre-approval policies and procedures under which all audit and non-audit services provided by our external auditors must be pre-approved by our director’s committee and audit committee. Any service proposals submitted by external auditors need to be discussed and approved by the directors’ committee and audit committee during its meetings, which take place at least four times a year. Once the proposed service is approved, we or our subsidiaries formalize the engagement of services. In addition, the members of our board of directors are briefed on matters discussed by the different committees of our board of directors.
ITEM 16D. | EXEMPTIONS FROM THE LISTING STANDARDS FOR AUDIT COMMITTEES |
ITEM 16D. EXEMPTIONS FROM THE LISTING STANDARDS FOR AUDIT COMMITTEES
Not Applicable.
ITEM 16E. | PURCHASERS OF EQUITY SECURITIES BY THE ISSUER AND AFFILIATED PURCHASERS |
ITEM 16E. PURCHASERS OF EQUITY SECURITIES BY THE ISSUER AND AFFILIATED PURCHASERSDuring 2006,2007, no issuer or affiliated parties made purchases pursuant to publicly announced plans or programs or not pursuant to such plans.
PART III
ITEM 17. | FINANCIAL STATEMENTS |
ITEM 17.FINANCIAL STATEMENTS
Reference is made to Item 18 for a list of all financial statements filed as part of this annual report.
ITEM 18. | FINANCIAL STATEMENTS |
ITEM 18.FINANCIAL STATEMENTS
The following financial statements, together with the report of independent registered accounting firm, are filed as part of this annual report:
79
ITEM 19. EXHIBITS
The exhibits filed with or incorporated by reference in this annual report are listed in the exhibit index below.
EXHIBIT INDEX
| | |
Item | |
| Description |
| | |
1.1 | | English translation of our Bylaws (filed with the U.S. Securities and Exchange Commission in our annual report on Form 20-F for the fiscal year ended December 31, 1996 and incorporated herein by reference) |
| | |
8.1 | | List of our subsidiaries (filed herewith). |
| | |
12.1 | | Certification of Jaime Garcia pursuant to Rule 13-a14(a) (17 CFR 240.13a-12(a)) or Rule 15d-14(a) (17 CFR 240.15d-14(a)) (filed herewith). |
| | |
12.2 | | Certification of Osvaldo Garay pursuant to Rule 13-a14(a) (17 CFR 240.13a-12(a)) or Rule 15d-14(a) (17 CFR 240.15d-14(a)) (filed herewith). |
| | |
13.1 | | Certification of Jaime Garcia pursuant to 18 U.S.C. Chapter 63, Section 1350, (filed herewith). |
| | |
13.2 | | Certification of Osvaldo Garay pursuant to 18 U.S.C. Chapter 63, Section 1350, (filed herewith). |
80
SIGNATURE
Pursuant to the requirements of Section 12 of the Securities Exchange Act of 1934, the Registrant certifies that it meets all of the requirements for filing on Form 20-F and has duly caused this Annual Report on Form 20-F to be signed on its behalf by the undersigned, thereunto duly authorized, in the city of Santiago, Chile on June 28, 2007.27, 2008.
|
EMBOTELLADORA ANDINA S.A.
(ANDINA BOTTLING COMPANY)
|
| |
| /s/ Osvaldo Garay |
| Osvaldo Garay |
| Chief Financial Officer |
Date: June 28, 2007
27, 200881
EMBOTELLADORA ANDINA S.A. AND SUBSIDIARIES
Consolidated financial statements
As of December 31, 20062007 and 20052006 and for each
of the three years in the period ended December 31, 20062007
CONTENTS
| Ch$ | - | Chilean pesos | |
Ch$ | ThCh$ | - | | Chilean pesos |
ThCh$ | | - | | Thousands of Chilean pesos | |
US$ | US$ | - | | United States dollars | |
ThUS$ | ThUS$ | - | | Thousands of United States dollars | |
UF | UF | - | | Unidades de Fomento (Chilean government inflation-indexed monetary units) | |
A$ | A$ | - | | Argentine pesos | |
R$ | R$ | - | | Brazilian reals | |
€ | € | - | Euros | Euros |


Management’s Report on Internal Control over Financial ReportingREPORT OF INDEPENDENT REGISTERED PUBLIC ACCOUNTING FIRM
The management of Embotelladora Andina S.A. (the “Company”), including the Chief Executive Officer and the Chief Financial Officer, is responsible for establishing and maintaining adequate internal control over financial reporting, as such term is defined in Rules 13a-15(f) and 15d-15f under the Securities Exchange Act of 1934, as amended.
The Company’s internal control over financial reporting is a process designed to provide reasonable assurance regarding the reliability of financial reporting and the preparation of financial statements for external purposes in accordance with generally accepted accounting principles. The Company’s internal control over financial reporting includes those policies and procedures that (i) pertain to the maintenance of records that, in reasonable detail, accurately and fairly reflect the transactions and dispositions of the assets of the Company; (ii) provide reasonable assurance that transactions are recorded as necessary to permit preparation of financial statements in accordance with generally accepted accounting principles, and that receipts and expenditures of the company are being made only in accordance with authorizations of management and directors of the Company; and (iii) provide reasonable assurance regarding prevention or timely detection of unauthorized acquisition, use or disposition of the Company’s assets that could have a material effect on the financial statements.
Because of its inherent limitations, internal control over financial reporting may not prevent or detect misstatements. Also, projections of any evaluation of the effectiveness of internal control to future periods are subject to the risk that controls may become inadequate because of changes in conditions, and that the degree of compliance with the policies or procedures may deteriorate.
Embotelladora Andina’s management, including the Chief Executive Officer and the Chief Financial Officer, has assessed the effectiveness of the Company’s internal control over financial reporting as of December 31, 2007 based on the criteria established in Internal Control - “Integrated Framework” issued by the Committee of Sponsoring Organizations of the Treadway Commission (“COSO”) and, based on such criteria, Embotelladora Andina’s management has concluded that, as of December 31, 2007, the Company’s internal control over financial reporting is effective.
The Company’s internal control over financial reporting effectiveness as of December 31, 2007 has been audited by PricewaterhouseCoopers Consultores, Auditores y Compañía Limitada, an independent registered public accounting firm, as stated in their report which appears herein.
By | Jaime García Rioseco | |
| Chief Executive Officer | |
| Osvaldo Garay Arriola | |
| Chief Financial Officer | |
June 27, 2008
F-1
Report of Independent Registered Public Accounting Firm
To the Board of Directors and Shareholders of
Embotelladora Andina S.A.
1. | We have audited the accompanying Consolidated Balance Sheets of Embotelladora Andina S.A. and its subsidiaries (the “Company”) as of December 31, 2006 and 2005, and the related Consolidated Statements of Income and of Cash Flows for each of the three years in the period ended December 31, 2006, all expressed in thousands of constant Chilean pesos of December 31, 2006. These financial statements are the responsibility of the Company’s management. Our responsibility is to express an opinion on these financial statements based on our audits. |
In our opinion, the accompanying consolidated balance sheets and the related consolidated statements of income and of cash flows present fairly, in all material respects, the financial position of Embotelladora Andina S.A. and its subsidiaries at December 31, 2007 and 2006, and the results of their operations and their cash flows for each of the three years in the period ended December 31, 2007 in conformity with accounting principles generally accepted in Chile. Also in our opinion, the Company maintained, in all material respects, effective internal control over financial reporting as of December 31, 2007, based on criteria established in Internal Control - Integrated Framework issued by the Committee of Sponsoring Organizations of the Treadway Commission (COSO). The Company’s management is responsible for these financial statements, for maintaining effective internal control over financial reporting and for its assessment of the effectiveness of internal control over financial reporting, included in the accompanying Management’s Report on Internal Control over Financial Reporting. Our responsibility is to express opinions on these financial statements and on the Company’s internal control over financial reporting based on our audits (which was an integrated audit in 2007). We conducted our audits in accordance with the standards of the Public Company Accounting Oversight Board (United States) and auditing standards generally accepted in Chile. Those standards require that we plan and perform the audits to obtain reasonable assurance about whether the financial statements are free of material misstatement and whether effective internal control over financial reporting was maintained in all material respects. Our audits of the financial statements included examining, on a test basis, evidence supporting the amounts and disclosures in the financial statements, assessing the accounting principles used and significant estimates made by management, and evaluating the overall financial statement presentation. Our audit of internal control over financial reporting included obtaining an understanding of internal control over financial reporting, assessing the risk that a material weakness exists, and testing and evaluating the design and operating effectiveness of internal control based on the assessed risk. Our audits also included performing such other procedures as we considered necessary in the circumstances. We believe that our audits provide a reasonable basis for our opinions.
2. | We conducted our audits in accordance with auditing standards generally accepted in Chile and the standards of the Public Company Accounting Oversight Board (United States). Those standards require that we plan and perform the audit to obtain reasonable assurance about whether the financial statements are free of material misstatement. An audit includes examining, on a test basis, evidence supporting the amounts and disclosures in the financial statements. An audit also includes assessing the accounting principles used and significant estimates made by management, as well as evaluating the overall financial statement presentation. We believe that our audits provide a reasonable basis for our opinion. |
Accounting principles generally accepted in Chile vary in certain significant respects from accounting principles generally accepted in the United States of America (“U.S. GAAP”). Information relating to the nature and effect of such differences is presented in Note 30 to the consolidated financial statements.
3. | In our opinion, the consolidated financial statements referred to above present fairly, in all material respects, the financial position of Embotelladora Andina S.A. and its subsidiaries as of December 31, 2006 and 2005 and the results of their operations and their cash flows for each of the three years in the period ended December 31, 2006, in conformity with accounting principles generally accepted in Chile. |
F-2
4. | Accounting principles generally accepted in Chile vary in certain significant respects from accounting principles generally accepted in the United States of America. Information relating to the nature and effect of such differences is presented in Note 29 to the consolidated financial statements. |
A company’s internal control over financial reporting is a process designed to provide reasonable assurance regarding the reliability of financial reporting and the preparation of financial statements for external purposes in accordance with generally accepted accounting principles. A company’s internal control over financial reporting includes those policies and procedures that (i) pertain to the maintenance of records that, in reasonable detail, accurately and fairly reflect the transactions and dispositions of the assets of the company; (ii) provide reasonable assurance that transactions are recorded as necessary to permit preparation of financial statements in accordance with generally accepted accounting principles, and that receipts and expenditures of the company are being made only in accordance with authorizations of management and directors of the company; and (iii) provide reasonable assurance regarding prevention or timely detection of unauthorized acquisition, use, or disposition of the company’s assets that could have a material effect on the financial statements.
Because of its inherent limitations, internal control over financial reporting may not prevent or detect misstatements. Also, projections of any evaluation of effectiveness to future periods are subject to the risk that controls may become inadequate because of changes in conditions, or that the degree of compliance with the policies or procedures may deteriorate.
/s/PricewaterhouseCoopers
Santiago, Chile
June 29, 200727, 2008
F - 1F-3
EMBOTELLADORA ANDINA S.A. AND SUBSIDIARIES
CONSOLIDATED BALANCE SHEETS
(Restated for general price-level changes and expressed in
thousands of constant Chilean pesos of December 31, 2006)2007)
| | | | | At December 31, | | | | | At December 31, | |
| | | Note | | 2006 | | 2005 | | | Note | | 2007 | | 2006 | |
| | | | ThCh$ | | ThCh$ | | | | | ThCh$ | | ThCh$ | |
ASSETS | | | | | | | | | | | | | |
CURRENT ASSETS | | | | | | | | | | | | | |
Cash | | | | 16,342,273 | | | 14,715,194 | | | | | 24,754,142 | | 17,551,601 | |
Time deposits | | 3 | | | 7,173,319 | | | 26,240,283 | | | 3 | | 49,088,381 | | 7,704,145 | |
Marketable securities | | 4 | | | 26,043,350 | | | 14,297,351 | | | 4 | | 48,533,561 | | 27,970,558 | |
Trade accounts receivable (net) | | 5 | | | 36,137,487 | | | 34,925,430 | | | 5 | | 44,280,949 | | 38,811,661 | |
Notes receivable (net) | | 5 | | | 12,464,812 | | | 11,376,844 | | | 5 | | 14,553,358 | | 13,387,208 | |
Other receivables (net) | | 5 | | | 11,649,352 | | | 20,192,814 | | | 5 | | 16,031,584 | | 12,511,404 | |
Accounts receivable from related companies | | 6 | a) | | 2,893,571 | | | 5,704,490 | | | 6 a) | | 1,847,050 | | 3,107,695 | |
Inventories (net) | | 7 | | | 22,691,083 | | | 17,791,297 | | | 7 | | 27,298,620 | | 24,370,223 | |
Recoverable taxes | | | | 7,911,516 | | | 9,985,558 | | | | | 9,716,707 | | 8,496,968 | |
Prepaid expenses | | | | 1,610,638 | | | 1,641,415 | | | | | 1,904,080 | | 1,729,828 | |
Deferred income taxes | | 8 | b) | | 890,432 | | | — | | | 8 b) | | 5,234,679 | | 956,324 | |
Other current assets | | 9 | | | 18,316,976 | | | 8,547,164 | | | 9 | | 22,576,016 | | 19,672,432 | |
| | | | | | | | | |
Total current assets | | | | 164,124,809 | | | 165,417,840 | | | | | 265,819,127 | | 176,270,047 | |
| | | | | | | | | | | | | | | |
PROPERTY, PLANT AND EQUIPMENT | | 11 | | | | | | | 11 | | | | | |
Land | | | | 14,408,848 | | | 12,953,451 | | | | | 16,751,276 | | 15,475,103 | |
Buildings and improvements | | | | 85,054,927 | | | 81,212,921 | | | | | 98,502,738 | | 91,348,992 | |
Machinery and equipment | | | | 215,596,412 | | | 208,593,786 | | | | | 229,584,693 | | 231,550,546 | |
Other property, plant and equipment | | | | 207,321,528 | | | 200,677,474 | | | | | 217,489,779 | | 222,663,321 | |
Technical reappraisal of property, plant and equipment | | | | 2,056,207 | | | 2,056,333 | | | | | 2,208,110 | | 2,208,366 | |
Less: Accumulated depreciation | | | | (382,395,766 | ) | | (363,262,481 | ) | | | | (395,953,016 | ) | (410,693,053 | ) |
| | | | | | | | | |
Total property, plant and equipment | | | | 142,042,156 | | | 142,231,484 | | | | | 168,583,580 | | 152,553,275 | |
| | | | | | | | | | | | | | | |
OTHER ASSETS | | | | | | | | | | | | | |
Investments in unconsolidated affiliates | | 12 | | | 22,466,621 | | | 21,835,178 | | | 12 | | 24,961,690 | | 24,129,151 | |
Investments in other companies | | | | 55,945 | | | 55,716 | | | | | 133,944 | | 60,085 | |
Goodwill (net) | | 13 | | | 67,885,008 | | | 72,892,395 | | | 13 | | 57,062,478 | | 72,908,499 | |
Long-term receivables | | | | 51,353 | | | 112,794 | | | | | 37,511 | | 55,153 | |
Accounts receivable from related companies | | 6 | a) | | 36,176 | | | 22,964 | | | 6 a) | | 49,736 | | 38,853 | |
Intangibles (net) | | | | 167,452 | | | 179,542 | | | | | 162,478 | | 179,843 | |
Deferred income taxes | | 8 | b) | | — | | | 690,704 | | |
Long-term investments and other long-term assets | | 14 | | | 116,769,627 | | | 133,658,022 | | | 14 | | 23,617,723 | | 125,410,579 | |
| | | | | | | | | |
Total other assets | | | | 207,432,182 | | | 229,447,315 | | | | | 106,025,560 | | 222,782,163 | |
| | | | | | | | | |
Total assets | | | | 513,599,147 | | | 537,096,639 | | | | | 540,428,267 | | 551,605,485 | |
| | | | | | | | | |
The accompanying Notes 1 to 2930 are an integral part of these consolidated financial statements.
F - 2F-4
| | | | At December 31, | |
| | Note | | 2007 | | 2006 | |
| | | | ThCh$ | | ThCh$ | |
LIABILITIES, MINORITY INTEREST AND SHAREHOLDERS’ EQUITY | | | | | | | |
CURRENT LIABILITIES | | | | | | | |
Short-term bank borrowings | | 15 a) | | 3,950,822 | | 2,674,272 | |
Current portion of long-term bank borrowings | | 15 b) | | 122,361 | | 471,317 | |
Current portion of bonds payable | | 17 | | 6,914,470 | | 32,190,444 | |
Dividends payable | | | | 5,810,563 | | 5,061,518 | |
Trade accounts payable | | | | 54,585,035 | | 46,040,374 | |
Other creditors | | | | 4,988,474 | | 3,411,368 | |
Amounts payable to related companies | | 6 b) | | 19,157,342 | | 11,613,224 | |
Other accrued liabilities | | 18 | | 3,475,223 | | 3,098,739 | |
Withholdings | | | | 20,653,598 | | 21,168,418 | |
Income taxes payable | | | | 17,206,020 | | 4,330,722 | |
Unearned income | | | | 466,466 | | 536,513 | |
Other current liabilities | | | | 1,335,008 | | 5,014,867 | |
Total current liabilities | | | | 138,665,382 | | 135,611,776 | |
| | | | | | | |
LONG-TERM LIABILITIES | | | | | | | |
Long-term bank borrowings | | 16 | | 740,645 | | 448,971 | |
Bonds payable | | 17 | | 73,597,622 | | 81,651,038 | |
Other creditors | | | | 79,559 | | 143,150 | |
Amounts payable to related companies | | 6 b) | | 3,340,602 | | 3,812,304 | |
Other accrued liabilities | | 18 | | 16,927,953 | | 18,363,766 | |
Deferred income taxes | | 8 b) | | 12,375,536 | | 4,433,103 | |
Other long-term liabilities | | 20 | | 12,264,686 | | 10,820,242 | |
Total long-term liabilities | | | | 119,326,603 | | 119,672,574 | |
| | | | | | | |
MINORITY INTEREST | | 21 | | 1,287,144 | | 1,257,528 | |
| | | | | | | |
COMMITMENTS AND CONTINGENCIES | | 27 | | | | | |
| | | | | | | |
SHAREHOLDERS’ EQUITY | | 22 | | | | | |
Paid-in capital | | | | 217,013,513 | | 217,013,513 | |
Other reserves | | | | (11,443,442 | ) | 1,879,795 | |
Retained earnings from prior years | | | | 11,171,454 | | 10,745,409 | |
Net income for the year | | | | 81,601,944 | | 79,857,372 | |
Interim dividends | | | | (17,194,331 | ) | (14,432,482 | ) |
Total shareholders’ equity | | | | 281,149,138 | | 295,063,607 | |
Total liabilities and shareholders’ equity | | | | 540,428,267 | | 551,605,485 | |
The accompanying Notes 1 to 30 are an integral part of these consolidated financial statements.
F-5
EMBOTELLADORA ANDINA S.A. AND SUBSIDIARIES
CONSOLIDATED BALANCE SHEETSSTATEMENTS OF INCOME
(Restated for general price-level changes and expressed in
thousands of constant Chilean pesos of December 31, 2006)2007)
| | | | | | | | | |
| | | | | | At December 31, | |
| | | Note | | | 2006 | | | 2005 | |
| | | | | | ThCh$ | | | ThCh$ | |
LIABILITIES, MINORITY INTEREST AND SHAREHOLDERS’ EQUITY | | | | | | | | | |
CURRENT LIABILITIES | | | | | | | | | |
Short-term bank borrowings | | 15 | a) | | 2,490,011 | | | 28,521,971 | |
Current portion of long-term bank borrowings | | 15 | b) | | 438,843 | | | 494,267 | |
Current portion of bonds payable | | 17 | | | 29,972,480 | | | 13,971,623 | |
Dividends payable | | | | | 4,712,773 | | | 4,062,425 | |
Trade accounts payable | | | | | 42,868,132 | | | 38,672,141 | |
Other creditors | | | | | 3,176,320 | | | 2,885,037 | |
Amounts payable to related companies | | 6 | b) | | 10,813,058 | | | 8,505,764 | |
Other accrued liabilities | | 18 | | | 2,885,232 | | | 644,805 | |
Withholdings | | | | | 19,709,886 | | | 16,688,275 | |
Income taxes payable | | | | | 4,032,330 | | | 8,873,924 | |
Unearned income | | | | | 499,547 | | | 254,439 | |
Deferred income taxes | | 8 | b) | | — | | | 726,567 | |
Other current liabilities | | | | | 4,669,336 | | | 3,080,741 | |
| | | | | | | | | |
Total current liabilities | | | | | 126,267,948 | | | 127,381,979 | |
| | | | | | | | | |
LONG-TERM LIABILITIES | | | | | | | | | |
Long-term bank borrowings | | 16 | | | 418,036 | | | 464,046 | |
Bonds payable | | 17 | | | 76,025,175 | | | 103,940,040 | |
Other creditors | | | | | 133,287 | | | 149,660 | |
Amounts payable to related companies | | 6 | b) | | 3,549,631 | | | — | |
Other accrued liabilities | | 18 | | | 17,098,479 | | | 21,559,300 | |
Deferred income taxes | | 8 | b) | | 4,127,656 | | | — | |
Other long-term liabilities | | | | | 10,074,713 | | | 8,386,858 | |
| | | | | | | | | |
Total long-term liabilities | | | | | 111,426,977 | | | 134,499,904 | |
| | | | | | | | | |
MINORITY INTEREST | | 20 | | | 1,170,883 | | | 1,140,997 | |
COMMITMENTS AND CONTINGENCIES | | 26 | | | | | | | |
SHAREHOLDERS’ EQUITY | | 21 | | | | | | | |
Paid-in capital | | | | | 202,060,999 | | | 202,060,999 | |
Other reserves | | | | | 1,750,275 | | | (205,369 | ) |
Retained earnings from prior years | | | | | 10,005,036 | | | 26,887,376 | |
Net income for the year | | | | | 74,355,094 | | | 57,216,172 | |
Interim dividends | | | | | (13,438,065 | ) | | (11,885,419 | ) |
| | | | | | | | | |
Total shareholders’ equity | | | | | 274,733,339 | | | 274,073,759 | |
| | | | | | | | | |
Total liabilities and shareholders’ equity | | | | | 513,599,147 | | | 537,096,639 | |
| | | | | | | | | |
| | | | For the years ended December 31, | |
| | | | 2007 | | 2006 | | 2005 | |
| | Note | | ThCh$ | | ThCh$ | | ThCh$ | |
OPERATING INCOME | | | | | | | | | |
Net sales | | | | 636,689,030 | | 587,189,979 | | 511,301,050 | |
Cost of sales | | | | (351,451,736 | ) | (335,170,666 | ) | (301,774,918 | ) |
Gross profit | | | | 285,237,294 | | 252,019,313 | | 209,526,132 | |
Administrative and selling expenses | | | | (169,742,952 | ) | (149,922,624 | ) | (124,095,752 | ) |
Operating income | | | | 115,494,342 | | 102,096,689 | | 85,430,380 | |
| | | | | | | | | |
NON-OPERATING INCOME AND EXPENSE | | | | | | | | | |
Financial income | | | | 22,935,160 | | 13,459,664 | | 31,275,926 | |
Share of gain from unconsolidated affiliates | | 12 | | 668,498 | | 553,706 | | 843,838 | |
Other non-operating income | | 23 | | 12,130,183 | | 6,117,101 | | 8,019,084 | |
Amortization of goodwill | | 13 | | (6,502,674 | ) | (6,983,589 | ) | (6,830,343 | ) |
Financial expense | | | | (15,161,028 | ) | (16,510,471 | ) | (23,150,636 | ) |
Other non-operating expense | | 23 | | (6,534,893 | ) | (7,930,321 | ) | (8,485,280 | ) |
Price-level restatement | | | | (4,543,047 | ) | (339,154 | ) | (625,092 | ) |
Exchange gains (losses), net | | | | (9,971,405 | ) | 3,983,953 | | (15,666,567 | ) |
Non-operating expense | | | | (6,979,206 | ) | (7,649,111 | ) | (14,619,070 | ) |
Income before income tax expense and minority interest | | | | 108,515,136 | | 94,447,578 | | 70,811,310 | |
Income tax expense | | 8 c) | | (26,870,391 | ) | (14,558,419 | ) | (9,374,486 | ) |
Income before minority interest | | | | 81,644,745 | | 79,889,159 | | 61,436,824 | |
Income attributable to minority interest | | 21 | | (42,801 | ) | (31,787 | ) | 13,346 | |
Net income | | | | 81,601,944 | | 79,857,372 | | 61,450,170 | |
The accompanying Notes 1 to 2930 are an integral part of these consolidated financial statements.
F - 3F-6
EMBOTELLADORA ANDINA S.A. AND SUBSIDIARIES
CONSOLIDATED STATEMENTS OF INCOMECASH FLOWS
(Restated for general price-level changes and expressed in
thousands of constant Chilean pesos of December 31, 2006)2007
| | | | | | | | | | | | |
| | | | | | For the years ended December 31, | |
| | | Note | | | 2006 | | | 2005 | | | 2004 | |
| | | | | | ThCh$ | | | ThCh$ | | | ThCh$ | |
OPERATING INCOME | | | | | | | | | | | | |
Net sales | | | | | 546,731,824 | | | 476,071,741 | | | 427,480,547 | |
Cost of sales | | | | | (312,076,970 | ) | | (280,982,233 | ) | | (258,131,808 | ) |
| | | | | | | | | | | | |
Gross profit | | | | | 234,654,854 | | | 195,089,508 | | | 169,348,739 | |
Administrative and selling expenses | | | | | (139,592,760 | ) | | (115,545,393 | ) | | (102,830,633 | ) |
| | | | | | | | | | | | |
Operating income | | | | | 95,062,094 | | | 79,544,115 | | | 66,518,106 | |
| | | | | | | | | | | | |
NON-OPERATING INCOME AND EXPENSE | | | | | | | | | | | | |
Financial income | | | | | 12,532,277 | | | 29,120,975 | | | 24,663,477 | |
Share of gain from unconsolidated affiliates | | 12 | | | 515,553 | | | 785,696 | | | 1,045,366 | |
Other non-operating income | | 22 | | | 5,695,625 | | | 7,466,559 | | | 865,574 | |
Amortization of goodwill | | 13 | | | (6,502,411 | ) | | (6,359,723 | ) | | (7,337,071 | ) |
Financial expense | | | | | (15,372,876 | ) | | (21,555,527 | ) | | (20,245,960 | ) |
Other non-operating expense | | 22 | | | (7,383,912 | ) | | (7,900,633 | ) | | (6,528,863 | ) |
Price-level restatement | | | | | (315,786 | ) | | (582,022 | ) | | 968,085 | |
Exchange gains (losses), net | | | | | 3,709,452 | | | (14,587,122 | ) | | (13,295,111 | ) |
| | | | | | | | | | | | |
Non-operating expense | | | | | (7,122,078 | ) | | (13,611,797 | ) | | (19,864,503 | ) |
| | | | | | | | | | | | |
Income before income tax expense and minority interest | | | | | 87,940,016 | | | 65,932,318 | | | 46,653,603 | |
Income tax expense | | 8 | c) | | (13,555,325 | ) | | (8,728,572 | ) | | (4,172,638 | ) |
| | | | | | | | | | | | |
Income before minority interest | | | | | 74,384,691 | | | 57,203,746 | | | 42,480,965 | |
Income attributable to minority interest | | 20 | | | (29,597 | ) | | 12,426 | | | (2,832 | ) |
| | | | | | | | | | | | |
Net income | | | | | 74,355,094 | | | 57,216,172 | | | 42,478,133 | |
| | | | | | | | | | | | |
| | For the years ended December 31, | |
| | 2007 | | 2006 | | 2005 | |
| | ThCh$ | | ThCh$ | | ThCh$ | |
CASH FLOWS FROM OPERATING ACTIVITIES | | | | | | | |
Collection of trade receivables | | 861,758,139 | | 777,119,009 | | 743,104,037 | |
Financial income received | | 20,944,402 | | 12,002,443 | | 23,278,206 | |
Dividends and other distributions received | | 3,310,687 | | 1,593,786 | | 1,537,839 | |
Collection of other receivables | | 58,538 | | 19,204 | | 27,147 | |
Payments to suppliers and personnel | | (602,907,835 | ) | (528,278,609 | ) | (545,214,144 | ) |
Interest paid | | (17,398,601 | ) | (13,676,988 | ) | (21,942,444 | ) |
Income tax payments | | (21,337,617 | ) | (11,639,754 | ) | (5,465,418 | ) |
VAT and other similar items paid | | (107,288,665 | ) | (100,825,152 | ) | (89,153,316 | ) |
Net cash provided by operating activities | | 137,139,048 | | 136,313,939 | | 106,171,907 | |
| | | | | | | |
CASH FLOWS FROM FINANCING ACTIVITIES | | | | | | | |
Borrowings from banks | | 52,597,852 | | 47,761,041 | | 59,961,045 | |
Dividends paid | | (78,347,834 | ) | (79,136,331 | ) | (79,556,796 | ) |
Payments of loans | | (51,328,372 | ) | (76,446,381 | ) | (92,737,776 | ) |
Repayments of bonds | | (13,659,106 | ) | (12,804,970 | ) | (12,807,101 | ) |
Net cash used in financing activities | | (90,737,460 | ) | (120,626,641 | ) | (125,140,628 | ) |
| | | | | | | |
CASH FLOWS FROM INVESTING ACTIVITIES | | | | | | | |
Proceeds from sales of property, plant and equipment | | 698,325 | | 2,199,027 | | 3,717,806 | |
Proceeds from sales of permanent investments | | — | | 5,495,867 | | — | |
Proceeds from sales of other investments | | 108,329,808 | | 39,863,022 | | 66,010,652 | |
Additions to property, plant and equipment | | (56,024,449 | ) | (39,742,692 | ) | (30,040,247 | ) |
Permanent investments | | (3,651,700 | ) | — | | (350,351 | ) |
Purchases of other investments | | (17,906,465 | ) | (1,389,970 | ) | (27,376,796 | ) |
Net cash provided by investing activities | | 31,445,519 | | 6,425,254 | | 11,961,064 | |
Net cash flows from operating, financing and investing activities | | 77,847,107 | | 22,112,552 | | (7,007,657 | ) |
PRICE — LEVEL RESTATEMENT OF CASH AND CASH EQUIVALENTS | | (1,124,534 | ) | (654,338 | ) | (632,161 | ) |
NET INCREASE (DECREASE) IN CASH AND CASH EQUIVALENTS | | 76,722,573 | | 21,458,214 | | (7,639,818 | ) |
CASH AND CASH EQUIVALENTS AT BEGINNING OF YEAR | | 44,649,133 | | 23,190,919 | | 30,830,737 | |
CASH AND CASH EQUIVALENTS AT END OF YEAR | | 121,371,706 | | 44,649,133 | | 23,190,919 | |
The accompanying Notes 1 to 2930 are an integral part of these consolidated financial statements.
F - 4F-7
EMBOTELLADORA ANDINA S.A. AND SUBSIDIARIES
CONSOLIDATED STATEMENTS OF CASH FLOWS
(Restated for general price-level changes and expressed in
thousands of constant Chilean pesos of December 31, 2006)
| | | | | | | | | |
| | | For the years ended December 31, | |
| | | 2006 | | | 2005 | | | 2004 | |
| | | ThCh$ | | | ThCh$ | | | ThCh$ | |
CASH FLOWS FROM OPERATING ACTIVITIES | | | | | | | | | |
Collection of trade receivables | | 723,574,496 | | | 691,903,200 | | | 594,198,007 | |
Financial income received | | 11,175,459 | | | 21,674,307 | | | 10,727,373 | |
Dividends and other distributions received | | 1,483,972 | | | 1,431,880 | | | 3,637,024 | |
Collection of other receivables | | 17,881 | | | 25,277 | | | 25,663 | |
Payments to suppliers and personnel | | (491,879,524 | ) | | (507,648,179 | ) | | (436,869,176 | ) |
Interest paid | | (12,734,626 | ) | | (20,430,581 | ) | | (18,034,934 | ) |
Income tax payments | | (10,837,760 | ) | | (5,088,844 | ) | | (4,477,726 | ) |
Other expenses | | — | | | — | | | (20,568 | ) |
VAT and other similar items paid | | (93,878,168 | ) | | (83,010,536 | ) | | (74,837,378 | ) |
| | | | | | | | | |
Net cash provided by operating activities | | 126,921,730 | | | 98,856,524 | | | 74,348,285 | |
| | | | | | | | | |
CASH FLOWS FROM FINANCING ACTIVITIES | | | | | | | | | |
Borrowings from banks | | 44,470,243 | | | 55,829,651 | | | 63,560,991 | |
Other financing activities | | — | | | — | | | 8,686 | |
Dividends paid | | (73,683,735 | ) | | (74,075,229 | ) | | (48,398,734 | ) |
Payments of loans | | (71,179,126 | ) | | (86,348,022 | ) | | (49,586,929 | ) |
Repayments of bonds | | (11,922,691 | ) | | (11,924,675 | ) | | (11,912,576 | ) |
| | | | | | | | | |
Net cash used in financing activities | | (112,315,309 | ) | | (116,518,275 | ) | | (46,328,562 | ) |
| | | | | | | | | |
CASH FLOWS FROM INVESTING ACTIVITIES | | | | | | | | | |
Proceeds from sales of property, plant and equipment | | 2,047,511 | | | 3,461,644 | | | 905,204 | |
Proceeds from sales of permanent investments | | 5,117,195 | | | — | | | — | |
Proceeds from sales of other investments | | 37,116,408 | | | 61,462,432 | | | 23,731,343 | |
Additions to property, plant and equipment | | (37,004,369 | ) | | (27,970,435 | ) | | (26,698,808 | ) |
Purchases of territory | | — | | | — | | | (8,319,160 | ) |
Permanent investments | | — | | | (326,211 | ) | | (956,105 | ) |
Purchases of other investments | | (1,294,199 | ) | | (25,490,499 | ) | | (28,425,309 | ) |
| | | | | | | | | |
Net cash provided by (used in) investing activities | | 5,982,546 | | | 11,136,931 | | | (39,762,835 | ) |
| | | | | | | | | |
Net cash flows from operating, financing and investing activities | | 20,588,967 | | | (6,524,820 | ) | | (11,743,112 | ) |
| | | | | | | | | |
PRICE – LEVEL RESTATEMENT OF CASH AND CASH EQUIVALENTS | | (609,253 | ) | | (588,605 | ) | | (4,047,834 | ) |
| | | | | | | | | |
NET DECREASE IN CASH AND CASH EQUIVALENTS | | 19,979,714 | | | (7,113,425 | ) | | (15,790,946 | ) |
CASH AND CASH EQUIVALENTS AT BEGINNING OF YEAR | | 21,593,034 | | | 28,706,459 | | | 44,497,405 | |
| | | | | | | | | |
CASH AND CASH EQUIVALENTS AT END OF YEAR | | 41,572,748 | | | 21,593,034 | | | 28,706,459 | |
| | | | | | | | | |
| | For the years ended December 31, | |
| | 2007 | | 2006 | | 2005 | |
| | ThCh$ | | ThCh$ | | ThCh$ | |
RECONCILIATION BETWEEN NET INCOME AND NET CASH FLOWS PROVIDED BY OPERATING ACTIVITIES | | | | | | | |
Net income | | 81,601,944 | | 79,857,372 | | 61,450,170 | |
Income on sales of assets: | | | | | | | |
Loss (gain) on sale of property, plant and equipment | | 146,702 | | 2,285,690 | | (293,695 | ) |
Gain on divesture of Vital S.A | | — | | — | | (4,265,980 | ) |
Loss on divesture of Cican S.A. | | 85,549 | | — | | — | |
Loss (gain) on sale of other assets | | 84,741 | | — | | (2,369 | ) |
Adjustments to reconcile net income to net cash provided by operating activities: | | | | | | | |
Depreciation | | 29,147,969 | | 31,740,874 | | 31,840,657 | |
Amortization of intangibles | | 237,000 | | 210,268 | | 355,717 | |
Write-offs and provisions | | 1,088,696 | | 3,054,561 | | 1,786,571 | |
Share of gain from unconsolidated affiliates | | (668,498 | ) | (553,706 | ) | (843,838 | ) |
Amortization of goodwill | | 6,502,674 | | 6,983,589 | | 6,830,343 | |
Price-level restatement | | 4,543,047 | | 339,154 | | 625,092 | |
Exchange gains (losses), net | | 9,971,405 | | (3,983,953 | ) | 15,666,569 | |
Other credits to income that do not represent cash flows | | (2,812,986 | ) | (433,873 | ) | (3,189,550 | ) |
Other charges to income that do not represent cash flows | | 3,533,358 | | — | | — | |
(Increase) decrease in operating assets: | | | | | | | |
Trade accounts receivable | | (280,050 | ) | 1,722,221 | | (2,661,681 | ) |
Inventories | | (5,406,713 | ) | (5,048,033 | ) | 2,654,613 | |
Other assets | | (27,189,797 | ) | (16,285,209 | ) | (31,297,277 | ) |
Increase (decrease) in operating liabilities: | | | | | | | |
Accounts payable related to operating income | | 2,953,033 | | 10,364,880 | | (6,248,904 | ) |
Interest payable | | 9,339,661 | | 10,509,022 | | 13,916,252 | |
Income taxes payable | | 11,482,335 | | 8,591,816 | | 6,190,998 | |
Other accounts payable related to non-operating income | | 7,057,325 | | 4,694,966 | | 5,918,577 | |
VAT and other similar items | | 5,678,852 | | 2,232,513 | | 7,752,988 | |
Income attributable to minority interest | | 42,801 | | 31,787 | | (13,346 | ) |
Net cash provided by operating activities | | 137,139,048 | | 136,313,939 | | 106,171,907 | |
The accompanying Notes 1 to 2930 are an integral part of these consolidated financial statements.
F - 5F-8
EMBOTELLADORA ANDINA S.A. AND SUBSIDIARIES
CONSOLIDATED STATEMENTS OF CASH FLOWS
(Restated for general price-level changes and expressed in
thousands of constant Chilean pesos of December 31, 2006)
| | | | | | | | | |
| | | For the years ended December 31, | |
| | | 2006 | | | 2005 | | | 2004 | |
| | | ThCh$ | | | ThCh$ | | | ThCh$ | |
RECONCILIATION BETWEEN NET INCOME AND NET CASH FLOWS PROVIDED BY OPERATING ACTIVITIES | | | | | | | | | |
Net income | | 74,355,094 | | | 57,216,172 | | | 42,478,133 | |
Income on sales of assets: | | | | | | | | | |
Loss (gain) on sale of property, plant and equipment | | 2,128,203 | | | (273,459 | ) | | 297,633 | |
Gain on divesture of Vital S.A | | — | | | (3,972,048 | ) | | — | |
Gain on sale of other assets | | — | | | (2,206 | ) | | (5,558 | ) |
Adjustments to reconcile net income to net cash provided by operating activities: | | | | | | | | | |
Depreciation | | 29,553,886 | | | 29,646,794 | | | 33,265,599 | |
Amortization of intangibles | | 195,779 | | | 331,208 | | | 281,501 | |
Write-offs and provisions | | 2,844,093 | | | 1,663,474 | | | 5,137,502 | |
Share of gain from unconsolidated affiliates | | (515,553 | ) | | (785,696 | ) | | (1,045,366 | ) |
Amortization of goodwill | | 6,502,411 | | | 6,359,723 | | | 7,337,071 | |
Price-level restatement | | 315,786 | | | 582,022 | | | (968,085 | ) |
Exchange gains (losses), net | | (3,709,452 | ) | | 14,587,122 | | | 13,295,111 | |
Other credits to income that do not represent cash flows | | (403,979 | ) | | (2,969,786 | ) | | (465,422 | ) |
(Increase) decrease in operating assets: | | | | | | | | | |
Trade accounts receivable | | 1,603,558 | | | (2,478,288 | ) | | (3,302,122 | ) |
Inventories | | (4,700,217 | ) | | 2,471,708 | | | (2,232,143 | ) |
Other assets | | (15,163,135 | ) | | (29,140,854 | ) | | (19,584,646 | ) |
Increase (decrease) in operating liabilities: | | | | | | | | | |
Accounts payable related to operating income | | 9,650,726 | | | (5,818,346 | ) | | (7,269,266 | ) |
Interest payable | | 9,784,937 | | | 12,957,404 | | | 7,665,376 | |
Income taxes payable | | 7,999,829 | | | 5,764,430 | | | 755,608 | |
Other accounts payable related to non-operating income | | 4,371,477 | | | 5,510,779 | | | 3,253,813 | |
VAT and other similar items | | 2,078,690 | | | 7,218,797 | | | (4,549,286 | ) |
Income attributable to minority interest | | 29,597 | | | (12,426 | ) | | 2,832 | |
| | | | | | | | | |
Net cash provided by operating activities | | 126,921,730 | | | 98,856,524 | | | 74,348,285 | |
| | | | | | | | | |
The accompanying Notes 1 to 29 are an integral part of these consolidated financial statements.
F - 6
EMBOTELLADORA ANDINA S.A. AND SUBSIDIARIES
NOTES TO THE CONSOLIDATED FINANCIAL STATEMENTS
AT DECEMBER 31, 20062007 AND 20052006
NOTE 1 – NATURE OF OPERATIONS AND SUMMARY OF SIGNIFICANT ACCOUNTING POLICIES
Embotelladora Andina S.A. is registered under No. 00124 in the Securities Registry and is subject to the regulations of the Chilean Superintendency of Securities and Insurance Companies (the “SVS”).
The primary activity of Embotelladora Andina S.A. (“Andina”, and together with its subsidiaries, the “Company”) is the production and sale of Coca-Cola products and other beverages. The Company has bottling operations in Santiago, Chile and, through its subsidiaries, in Rio de Janeiro, Espíritu Santo and Nova Iguaçu, Brazil, and Mendoza, Córdoba, and Rosario, Argentina. The Company holds franchises from The Coca-Cola Company covering each of its Chilean, Brazilian and Argentine operations. The franchises for the Chilean Territories, Argentine Territories and for the ArgentineBrazilian Territories expire in 2007. The franchises for the Brazilian territories expire in 2008.2012. All these franchises may be extended at the option of The Coca-Cola Company. Such franchises are expected to be renewed upon expiration.
Legal reorganizations and joint ventures:
On June 5, 2006 Andina Inversiones Societarias S.A., a consolidated subsidiary of the Company was divided, creating “Andina Inversiones Societarias Dos S.A.” by the contribution at book value of Envases Multipack Ltda., a consolidated subsidiary. On August 15, 2006, Andina Inversiones Societarias Dos S.A. became a limited liability corporation and changed its name to Andina Inversiones Societarias Dos Ltda. On November 15, 2006, Andina Inversiones Societarias Dos Ltda. and Envases Multipack Ltda. were merged into Embotelladora Andina S.A.
On December 22, 2005 the production and packaging business of water, juices and non-carbonated beverages licensed by The Coca-Cola Company (“TCCC”) in Chile was restructured. Vital Aguas S.A. was created with the purpose of developing the process, production and packaging business of Vital Mineral Water and other water products according to the terms of the contracts and authorizations agreed upon by Vital Aguas S.A. and TCCC. Consequently, Vital S.A., a consolidated subsidiary of the Company which prior to the creation of Vital Aguas S.A developed and produced water products for the Company, will focus on juices and non-carbonated beverages. As part of the restructuring, Embotelladora Andina S.A., Embonor S.A. and Embotelladora Coca-Cola Polar S.A., have taken an interest of 56.5%, 26.4% and 17.1%, respectively, in the newly formed Vital Aguas S.A. See note 12.
F - 7F-9
Accounting policies
a) Presentation
The consolidated financial statements of the Company have been prepared in accordance with accounting principles generally accepted in Chile (“Chilean GAAP”) and regulations established by the SVS.
The preparation of financial statements in conformity with generally accepted accounting principles requires management to make estimates and assumptions that affect the reported amounts of assets and liabilities, revenues and expenses and disclosures of contingent liabilities. Management makes its best estimate of the ultimate outcome for these items based on historical trends and other information available when the financial statements are prepared. Changes in estimates are recognized in accordance with the accounting rules for the estimate, which is typically in the period when new information becomes available to management. Areas where the nature of the estimate makes it reasonably possible that actual results could materially differ from amounts estimated include: the carrying value of property, plant and equipment, the adequacy of the allowance for doubtful accounts, the carrying value of goodwill and investments in unconsolidated affiliates, the determination of the liability for deposits for bottles and containers and the valuation of deferred income tax assets.
The Company has issued its audited statutory consolidated financial statements in Spanish and in conformity with Chilean GAAP, which include certain notes and additional information required by the SVS for statutory purposes. Management believes that these additional notes and information are not essential for the complete understanding of the consolidated financial statements and accordingly, these notes and additional information have been excluded from the accompanying consolidated financial statements.
Certain minor reclassifications have been made in the 2004 and 2005 amounts to conform with the 2006 presentation.
b) Consolidation
The accompanying financial statements reflect the consolidated results of operations of Andina and its subsidiaries. All significant intercompany transactions have been eliminated on consolidation. The Company consolidates the financial statements of the companies in which it controls a majority of voting shares or has the ability, direct or indirect, to direct the management and policies of the company.
F - 8F-10
c) Price-level restatement
The financial statements, which are expressed in Chilean pesos, have been restated to reflect the effects of variations in the purchasing power of the Chilean peso during each year. For this purpose and in conformity with current Chilean regulations, non-monetary assets and liabilities and equity accounts have been restated by charges or credits to income. Furthermore, the income and expense accounts have been restated in terms of year-end constant pesos. In accordance with Chilean tax regulations and accounting practices, the restatements were calculated based on the official Chilean Consumer Price Index published by the National Institute of Statistics (the “CPI”), applied one month in arrears, which was 2.5%3.6%, 3.6%2.1% and 2.1%7.4% for the years ended November 30, 2004, 2005, 2006 and 2006,2007, respectively. This index is considered by the business community, the accounting profession and the Chilean government to be the index which most closely complies with the technical requirement to reflect the variation in the general level of prices in the country and, consequently, is widely used for financial reporting purposes in Chile. The above-mentioned price-level restatements do not purport to present appraisal or replacement values and are only intended to restate all non-monetary financial statement components in terms of local currency of a single purchasing power and to include in the net result for each year the gain or loss in purchasing power arising from the holding of assets and liabilities exposed to the effects of inflation.
Assets and liabilities that are denominated in inflation-indexed monetary units are stated at year-end values. The principal inflation-indexed monetary unit used in Chile is the UF that changes daily to reflect the changes in the CPI. Values for the UF are as follows (historical pesos per UF):
| | | | | | |
| | | December 31, |
| | | 2006 | | 2005 | | 2004 |
| | | Ch$ | | Ch$ | | Ch$ |
Unidades de Fomento (UF) | | 18,336.38 | | 17,974.81 | | 17,317.05 |
| | December 31, | |
| | 2007 | | 2006 | | 2005 | |
| | Ch$ | | Ch$ | | Ch$ | |
Unidades de Fomento (UF) | | 19,622.66 | | 18,336.38 | | 17,974.81 | |
All amounts in the financial statements and notes are expressed in Chilean pesos of December 31, 20062007 purchasing power, unless otherwise stated. For comparative purposes, the 20042005 and 20052006 financial statements, and the amounts disclosed in the related footnotes, have been restated in terms of Chilean pesos of December 31, 20062007 purchasing power. This updating does not change the prior year’s statements or information in any way except to update the amounts to Chilean pesos of similar purchasing power.
d) Assets and liabilities denominated in foreign currencies
Assets and liabilities denominated in foreign currencies were translated into Chilean pesos at the exchange rates reported by the Central Bank of Chile as follows:
| | | | December 31, | | December 31, | |
| | | 2006 | | 2005 | | 2004 | | 2007 | | 2006 | | 2005 | |
| | | Ch$ | | Ch$ | | Ch$ | | Ch$ | | Ch$ | | Ch$ | |
United States dollars (US$) | | 532.39 | | 512.50 | | 557.40 | | 496.89 | | 532.39 | | 512.50 | |
Argentine pesos (A$) | | 173.87 | | 169.03 | | 187.11 | | 157.79 | | 173.87 | | 169.03 | |
Brazilian Real (R$) | | 249.01 | | 222.37 | | 209.99 | | 280.52 | | 249.01 | | 222.37 | |
Euros (€) | | 702.08 | | 606.08 | | 760.13 | |
Euros (€) | | | 730.94 | | 702.08 | | 606.08 | |
F - 9F-11
e) Time deposits and marketable securities
Time deposits are shown at cost plus accrued interest, which approximates market value. Marketable securities include money market funds which are stated at market value based on year-end quoted values and bonds statedare valued at the lesser of restated cost plus accrued interest.interest and market value.
f) Allowance for doubtful accounts
The allowance for doubtful accounts consists of a provision determined on the basis of the aging of accounts receivable and additional allowances for specific customers where collection is doubtful. In the opinion of the Company’s management, the allowances are reasonable and the net balances are recoverable.
g) Securities purchased under agreements to resell
These securities represent investment in promissory notes issued by the Central Bank of Chile, which were purchased at a discount under agreements to resell at a fixed price. They are valued at their present value calculated on the basis of the interest yield used to determine the price of each instrument on the date of acquisition. Interest earned is recorded as financial income.
h) Inventories
Inventories are stated at purchase and/or production cost, adjusted for price-level restatements and are computed pursuant to the average cost method. Provisions are made for obsolescence on the basis of turnover of raw materials and finished products. The stated values of inventories do not exceed their estimated net realizable value.
i) Recoverable taxes
Recoverable taxes represent a net receivable related to value-added taxes on purchases and sales and prepayments based on anticipated income tax.
j) Income taxes and deferred income taxes
Effective January 1, 2000, the effects of deferred income taxes arising from temporary differences between the basis of assets and liabilities for tax and financial statement purposes are recorded in accordance with Technical Bulletins Nos. 60, 68 and 69 of the Chilean Institute of Accountants and Circular No. 1,466 of the SVS. The effects of deferred income taxes at January 1, 2000 that were not previously recorded, were recognized, in accordance with the transitional provision provided by Technical Bulletin No. 60, against asset or liability accounts (“complementary accounts”) and were recorded to offset the effects of the deferred tax assets and liabilities not recorded prior to January 1, 2000. Complementary accounts are amortized to income over the estimated average reversal periods corresponding to underlying temporary differences to which the deferred tax asset or liability related.
Deferred income tax assets are reduced by a valuation allowance if, based on the weight of available evidence, some portion or all of the deferred income tax assets will not be realized.
F - 10F-12
k) Property, plant and equipment and depreciation
Property, plant and equipment are carried at cost plus price-level restatements less accumulated depreciation. Expenditures for significant improvements, or replacement parts, which extend the useful life of an asset for more than one year are capitalized, while maintenance and repair costs are charged to operations as incurred. Gains and losses arising from normal retirement and disposal of property, plant and equipment are reflected in other non-operating income or expense in the consolidated statements of income.
Containers in the Company’s possession at plants and warehouses, as well as bottles and plastic containers held by third parties, are stated at cost plus price-level restatements, net of depreciation. Broken bottles or spoiled containers at warehouses or plants are expensed in each accounting period.
Software currently in use mainly corresponds to computer packages purchased from third parties and programs developed internally. Software purchased from third parties iswhich are capitalized and amortized over a maximum period of four years. Disbursements incurred for computer system development and for the use of Company resources are charged to expense.
During 1979, the SVS authorized a technical appraisal of certain property, plant and equipment, which is included in technical reappraisal of property, plant and equipment in the consolidated balance sheets.
Depreciation expense amounting to ThCh$ 29,553,886, ThCh$ 29,646,794 and ThCh$ 33,265,599 for 2006, 2005 and 2004, respectively, was determined using the straight-line method, based on the estimated useful lives of the assets, which are as follows:
|
| |
| | Years |
|
Buildings and improvements | | 25-60 | |
Machinery and equipment | | 10 | |
Containers | | 2-5 | |
Other | | 1-10 | |
l) Deposits for containers
The Company records a liability for cash guarantees received from customers for containers delivered with the purchase of its products. These guarantees are not adjusted for price-level restatements. If a customer did not return the containers in a five-year period as from the invoice date, the Company may cash the deposit partially or in all with no further proceeding. Theproceeding, the effect of this transactionwhich is recognized in the consolidated statements of income.
Considering that the number of new containers in circulation during a year is historically greater than the number of containers returned by clients in that same period, the liability for cash guarantees received, amounting to ThCh$ 8,701,3249,181,721 and ThCh$ 7,415,8899,345,222 as of December 31, 20062007 and 2005,2006, respectively, is presented under Other long-term liabilities in the balance sheet.
F - 11F-13
m) Investments in unconsolidated affiliates
Investments in companies in which the Company’s ownership interest exceeds 20% but is less than 50% are accounted for using the equity method. The Company’s proportionate share in net income and loss of unconsolidated affiliates is recognized in other non-operating income or expense in the consolidated statements of income, after eliminating any unrealized profits or losses from transactions between related companies.
Investments in which the Company’s ownership interest is below 20% are accounted for at cost plus price-level restatements, except for subsidiaries in which the Company has significant influence which are also accounted for using the equity method.
n) Long-term investments
Long-term investments mainly include investments in bonds and time deposits which are recorded at cost plus accrued interest.
o) Goodwill
Until December 31, 2003, the Company classified the cost in excess of book value of the net assets of companies acquired in purchase transactions as goodwill. Effective January 1, 2004, Technical Bulletin No. 72 requires the determination of goodwill and negative goodwill based on the fair value of the acquired company. Goodwill generated on acquisitions is amortized on a straight-line basis over 20 years. Amortization of goodwill amounted to ThCh$ 6,502,411, ThCh$ 6,359,723 and ThCh$ 7,337,071 for the years ended December 31, 2006, 2005 and 2004, respectively. The Company evaluates the recoverability of goodwill on a periodic basis.
p) Bonds payable
Bonds payable includes placement of Yankee Bonds in the US markets and placement of bonds in UF in Chile, which are carried at par value. The purchase discounts, the difference in the par value and the proceeds received, are included in other long-term assets in the consolidated balance sheets. This asset is amortized using the straight-line method over the term of the respective obligations.
The issuance and placement costs of bonds are shown in other current assets and other long-term assets in the consolidated balance sheets and are being amortized on a straight-line basis over the life of the respective instruments. Costs include legal fees, reports on risk classification, printing, and commissions on issuance and are presented net of accumulated amortization.
F - 12F-14
q) Staff severance indemnities and retention plan
The Company has recorded a liability for long-term severance indemnities in accordance with the collective bargaining agreements entered into with its employees in Chile. The indemnity is payable to employees at the rate of one full month’s salary for every year of service with the Company. This liability is shown at the present value of the projected benefits, considering the impacts of inflation, discounted at a rate of 7%. The benefit accrued as of the end of the year considers the average future service period for all employees covered by such agreements. The staff severance indemnities are included in short-term and long-term Other accrued liabilities in the consolidated balance sheets. Beginning in 2005 the Company also maintains a separate management retention plan which entitles certain selected executives to receive a fixed lump sum payment on a pre-determined date upon completion of service. The resulting obligation under the provisions of this plan is shown under Other accrued liabilities in the consolidated balance sheets.
r) Sales recognition
The Company records sales revenue based on the physical delivery of finished products to its customers, in accordance with Technical Bulletin No. 70 issued by the Chilean Institute of Accountants.
Value added taxes collected from customers and remitted to governmental authorities are accounted for on a net basis and therefore are excluded from revenues in the consolidated statements of income.
s) Franchise incentives
The Coca-Cola Company, in its sole discretion, provides the Company with various benefits and incentives, including advertising and promotional support. The amounts received from The Coca-Cola Company for such support are included within the captions that compose operating income, depending on the nature of the support given.
t) Derivative transactions
Derivative financial instruments are accounted for in accordance with Technical Bulletin No. 57 of the Chilean Institute of Accountants (“TB 57”). Under TB 57 all derivative financial instruments are recognized on the balance sheet at their fair value. In addition, TB 57 requires that derivative financial instruments be classified as hedging instruments and non-hedging (investment) instruments.
Hedging instruments are accounted for as follows:
Hedges of recognized assets, liabilities or firm commitments –— Futures contracts for the sale of sugar to hedge changes in the fair value of purchase commitments:
The difference resulting from the changes in the fair value of the hedged item and the derivative instrument should be accounted for as follows:
·If the net effect is a loss, it should be recognized in the statement of income in the period of change.
·If the net effect is a gain, it should be deferred and recognized in the income statement when the contract is settled.
F - 13F-15
Hedges of forecasted transactions – Foreign-currency forward exchange contracts and cross-currency swap agreements to hedge foreign exchange risk on forecasted cash flows in US dollars:
The derivative instrument is stated at its fair value on the consolidated balance sheets and any change in the fair value of the derivative instrument is recognized on the balance sheets as an unrealized gain or loss (Other liabilities or Other assets, respectively). When the contract is settled, the unrealized gain or loss on the instrument is recognized as a financial income or expense in the consolidated statements of income.
Non-hedging (investment) instruments are presented at their fair value, with changes in fair value reflected in earnings in the period in which the change in fair value occurs.
u) Raw materials purchase commitments
Probable losses arising from fixed-price purchase commitments of raw materials are recognized in the consolidated statements of income at their fair value.
v) Translation of financial statements in foreign currencies
The Company’s investments in subsidiaries located in Argentina and Brazil are recorded in accordance with Technical Bulletin No. 64 of the Chilean Institute of Accountants. Under this pronouncement, the financial statements of foreign subsidiaries, which operate in countries that are exposed to significant risks, restrictions or inflation/currency fluctuations must first be remeasured into U.S. dollars and then translated into Chilean pesos at the year-end exchange rate of the Chilean peso to the U.S. dollar. As a result, no effect is given to price-level restatements based on inflation in those countries and the U.S. dollar is considered to be the functional currency of these operations. Accordingly, the financial statements of these subsidiaries are prepared in accordance with Chilean GAAP, excluding the application of monetary correction, and then remeasured into U.S. dollars as follows:
·monetary assets and liabilities are translated at the closing exchange rate for the period;
·all other assets and liabilities and shareholders’ equity are translated at historical rates of exchange;
·income and expense accounts are translated at average rates during the period; and
·the resulting exchange adjustments are included in the results of statements of income.
The resulting foreign currency amounts are then translated to Chilean pesos at the closing exchange rate at the balance sheet date. The difference between the investments’ equity value arising from the financial statements remeasured as explained above and the net equity value at the beginning of the year restated by Chilean inflation, plus the proportional share of the investments’ income (or loss) for the year, is recorded as a “Cumulative Translation Adjustment” in shareholders’ equity in the consolidated balance sheets.
w) Cash flows
For purposes of the consolidated statement of cash flows, in accordance with Technical Bulletin No. 50 of the Chilean Institute of Accountants and Circular No. 1,501 of the Superintendencia de Valores y Seguros (Chilean Superintendency of Securities and Insurance) the Company has considered cash equivalents to be investments in fixed-income, money market funds, time deposits and securities purchased under agreements to resell, maturing within 90 days.
F - 14F-16
Cash flows from operating activities include all business-related cash flows as well as interest paid, financial income and, in general, all cash flows not defined as from financing or investing activities. The operating concept used in this statement is broader than that in the consolidated statements of income.
NOTE 2 - CHANGES IN ACCOUNTING PRINCIPLES
There are no changes in the application of generally accepted accounting principles in Chile in relation to the previous year which could significantly affect the comparability of these financial statements.
NOTE 3 - TIME DEPOSITS
Time deposits at each year-end consisted of the following:
| | | | | | At December 31, | |
| | | At December 31, | | 2007 | | 2006 | |
| | | 2006 | | 2005 | | ThCh$ | | ThCh$ | |
| | | ThCh$ | | ThCh$ | |
Local currency deposits | | | 48,971,392 | | — | |
Foreign currency deposits | | 7,173,319 | | 26,240,283 | | 116,989 | | 7,704,145 | |
| | | | | |
Total | | 7,173,319 | | 26,240,283 | | 49,088,381 | | 7,704,145 | |
| | | | | |
NOTE 4 - MARKETABLE SECURITIES
Marketable securities at each year-end consisted of the followings:
| | | | At December 31, | | At December 31, | |
| | | 2006 | | 2005 | | 2007 | | 2006 | |
| | | ThCh$ | | ThCh$ | | ThCh$ | | ThCh$ | |
Money market funds | | 20,412,981 | | 2,325,673 | | 47,529,183 | | 21,923,542 | |
Bonds Sudamericano Bank. | | 4,503,170 | | — | |
Bonds United States Treasury (restricted) (1) | | | 1,004,378 | | — | |
Bonds Sudamericano Bank. | | | — | | 4,836,405 | |
Bonds Petróleos Mexicanos S.A. | | 1,127,199 | | — | | — | | 1,210,611 | |
Credit link Enersis | | — | | 9,352,659 | |
Bonds Teléfonos de México S.A. | | — | | 2,619,019 | |
| | | | | |
Total | | 26,043,350 | | 14,297,351 | | 48,533,561 | | 27,970,558 | |
| | | | | |
(1) Collateral guarantee required for operating at the London International Financial Futures and Options Exchange.
F - 15F-17
NOTE 5 - RECEIVABLES
Of the portfolio of receivables at December 31, 2006, 98.1%2007 98.6% corresponded to the softdrinks and other beverage business and 1.9%1.4% to the container business. Details of receivables are as follows:
| | | | At December 31, | | | At December 31, | |
| | | 2006 | | 2005 | | | 2007 | | 2006 | |
| | | ThCh$ | | ThCh$ | | | ThCh$ | | ThCh$ | |
Trade accounts receivable | | 37,168,126 | | | 36,351,039 | | | 45,161,270 | | 39,918,567 | |
Allowance for doubtful accounts | | (1,030,639 | ) | | (1,425,609 | ) | | (880,321 | ) | (1,106,906 | ) |
| | | | | | | |
Subtotal trade accounts receivable (net) | | 36,137,487 | | | 34,925,430 | | | 44,280,949 | | 38,811,661 | |
| | | | | | | |
Notes receivable | | 12,924,880 | | | 11,774,163 | | | 15,041,566 | | 13,881,321 | |
Allowance for doubtful accounts | | (460,068 | ) | | (397,319 | ) | | (488,208 | ) | (494,113 | ) |
| | | | | | | |
Subtotal notes receivable (net) | | 12,464,812 | | | 11,376,844 | | | 14,553,358 | | 13,387,208 | |
| | | | | | | |
Other receivables | | 11,702,919 | | | 20,270,359 | | | 16,199,351 | | 12,568,935 | |
Allowance for doubtful accounts | | (53,567 | ) | | (77,545 | ) | | (167,767 | ) | (57,531 | ) |
| | | | | | | |
Subtotal other receivables | | 11,649,352 | | | 20,192,814 | | | 16,031,584 | | 12,511,404 | |
| | | | | | | |
Total receivables | | 61,795,925 | | | 68,395,561 | | | 76,402,187 | | 66,368,823 | |
Total allowance for doubtful accounts | | (1,544,274 | ) | | (1,900,473 | ) | | (1,536,296 | ) | (1,658,550 | ) |
| | | | | | | |
Total net receivables | | 60,251,651 | | | 66,495,088 | | | 74,865,891 | | 64,710,273 | |
| | | | | | | |
Notes receivable consisted primarily of post-dated checks for the purchases of goods. Other receivables consisted primarily of advance payments made to suppliers and amounts due from employees.
Gross balances outstanding for 90 days or less were ThCh$ 60,065,48775,025,687 and ThCh$ 66,676,21264,510,333 at December 31, 20062007 and 2005,2006, respectively. Gross balances outstanding for more than 90 days were ThCh$ 1,730,4381,376,500 and ThCh$ 1,719,3491,858,490 at December 31, 2007 and 2006, and 2005, respectively.
The Company’s bad debt expense totaled ThCh$210,925 318,227 in 2007, ThCh$ 226,533 in 2006 ThCh$ 599,422 in 2005 and ThCh$ 917,910643,779 in 2004.2005.
F - 16F-18
NOTE 6 - AMOUNTS AND TRANSACTIONS WITH RELATED COMPANIES
Amounts payable and receivable with related companies correspond to transactions made on market terms. These balances are generally due within approximately 45 days.
a) Amounts receivable
| | | | | | | | | | |
| | | | | At December 31, |
| | | | | Short – term | | Long – term |
Company | | Transaction | | 2006 | | 2005 | | 2006 | | 2005 |
| | | | | ThCh$ | | ThCh$ | | ThCh$ | | ThCh$ |
Coca Cola de Chile S.A. | | Advertising | | 1,516,466 | | 571,581 | | 36,176 | | 22,964 |
Embonor S.A. | | Sale of products | | 836,682 | | 3,103,242 | | — | | — |
Embotelladora Coca Cola Polar S.A. | | Sale of products | | 540,423 | | 2,005,727 | | — | | — |
Centralli Refrigerantes S.A. | | Sale of products | | — | | 23,940 | | — | | — |
| | | | | | | | | | |
Total | | | | 2,893,571 | | 5,704,490 | | 36,176 | | 22,964 |
| | | | | | | | | | |
| | | | | | | | | | |
| | | | | At December 31, |
| | | | | Short – term | | Long – term |
Company | | Transaction | | 2006 | | 2005 | | 2006 | | 2005 |
| | | | | ThCh$ | | ThCh$ | | ThCh$ | | ThCh$ |
Recofarma Industrias do Amazonas Ltda. | | Purchase of concentrate | | 4,512,543 | | 2,473,347 | | — | | — |
Envases CMF S.A. | | Purchase of raw materials | | 3,245,450 | | 3,915,421 | | — | | — |
SPBR S.R.L | | Purchase of concentrate | | 1,989,271 | | 914,100 | | — | | — |
Envases Central S.A. | | Raw materials and finished products transactions | | 697,582 | | 861,705 | | — | | — |
Cican S.A. | | Raw materials and finished products transactions | | 299,102 | | 45,132 | | — | | — |
Envases del Pacífico S.A. | | Purchase of raw materials | | 69,110 | | 296,059 | | — | | — |
Embonor S.A. | | Unearned income from sale commitments (1) | | — | | — | | 2,826,181 | | — |
Embotelladora Coca Cola Polar S.A. | | Unearned income from sale commitments (1) | | — | | — | | 723,450 | | — |
| | | | | | | | | | |
Total | | | | 10,813,058 | | 8,505,764 | | 3,549,631 | | — |
| | | | | | | | | | |
(1) | Corresponds to unearned income from sale commitments of Vital S.A.’s products to Embonor S.A. and Embotelladora Coca Cola Polar S.A., which will be realized along with future deliveries. |
| | | | At December 31, | |
| | | | Short – term | | Long – term | |
Company | | Transaction | | 2007 | | 2006 | | 2007 | | 2006 | |
| | | | ThCh$ | | ThCh$ | | ThCh$ | | ThCh$ | |
Coca Cola de Chile S.A. | | Advertising | | — | | 1,628,685 | | 49,736 | | 38,853 | |
Embonor S.A. | | Sale of products | | 1,298,769 | | 898,596 | | — | | — | |
Embotelladora Coca Cola Polar S.A. | | Sale of products | | 548,281 | | 580,414 | | — | | — | |
Total | | | | 1,847,050 | | 3,107,695 | | 49,736 | | 38,853 | |
F - 17b) Amounts payable
c) | Transactions with related companies, exceeding ThCh$ 200,000, were as follows: |
| | | | | At December 31, | |
| | | | | | | | | | | | | | Short – term | | Long – term | |
Company | | Relation | | Transaction | | 2006 | | 2005 | | 2004 | | Transaction | | 2007 | | 2006 | | 2007 | | 2006 | |
| | | | | | | ThCh$ | | ThCh$ | | ThCh$ | | | | ThCh$ | | ThCh$ | | ThCh$ | | ThCh$ | |
Recofarma Industrias do Amazonas Ltda. | | | Purchase of concentrate | | 7,380,961 | | 4,846,471 | | — | | — | |
Coca Cola de Chile S.A. | | | Advertising | | 5,943,519 | | — | | — | | — | |
Envases CMF S.A. | | | Purchase of raw materials | | 2,770,984 | | 3,485,613 | | — | | | |
SPBR S.R.L | | | Purchase of concentrate | | 1,785,694 | | 2,136,477 | | — | | | |
Envases Central S.A. | | Equity investee | | Sales of raw materials and supplies | | 1,472,017 | | 1,023,801 | | 737,500 | | Raw materials and finished products transactions | | 1,148,326 | | 749,203 | | — | | — | |
| | | | Finished product purchases | | 15,339,206 | | 14,080,772 | | 13,270,240 | |
Coca-Cola de Chile S.A. | | Related shareholder | | Concentrate purchases | | 40,624,461 | | 41,695,481 | | 38,871,548 | |
| | | | Collection of advertising participation | | 1,817,637 | | 2,905,918 | | 1,821,092 | |
| | | | Water source rental | | 1,345,582 | | 1,537,281 | | 1,444,953 | |
| | | | Sales of advertising | | 2,706,709 | | 3,257,907 | | 2,462,765 | |
SPBR S.R.L. | | Related shareholder | | Concentrate purchases | | 22,695,763 | | 20,516,311 | | 17,929,317 | |
Cican S.A. | | | Raw materials and finished products transactions | | — | | 321,236 | | — | | — | |
Envases del Pacífico S.A. | | Director in common | | Purchase of raw materials | | 426,042 | | 796,743 | | 894,088 | | Purchase of raw materials | | 127,858 | | 74,224 | | — | | | |
Recofarma Industrias do Amazonas Ltda. | | Related shareholder | | Concentrate purchases | | 40,784,146 | | 30,157,643 | | 27,099,079 | |
| | | | Payment of advertising participation | | 3,210,233 | | 3,194,094 | | 3,875,892 | |
| | | | Other | | 539,988 | | 435,160 | | 281,344 | |
Envases CMF S.A. | | Equity investee | | Container purchases | | 16,467,180 | | 16,237,818 | | 14,189,804 | |
| | | | Dividend paid | | 1,480,136 | | 1,274,208 | | 380,581 | |
Embonor S.A. | | Shareholder related | | Sale of shares | | — | | 3,103,242 | | — | | Unearned income from sale commitments (1) | | — | | — | | 2,655,346 | | 3,035,318 | |
| | | | Sale of finished products | | 6,941,530 | | — | | — | |
Embotelladora Coca Cola Polar S.A. | | Shareholder related | | Sale of shares | | — | | 2,005,727 | | — | | Unearned income from sale commitments (1) | | — | | — | | 685,256 | | 776,986 | |
| | | | Sale of finished products | | 4,315,718 | | — | | — | |
Inmobiliaria y Constructora El Golf S.A. | | Shareholder in common | | Real estate purchase | | — | | 16,444 | | 1,849,139 | |
Inversiones Caburga S.A. | | Shareholder | | Real estate sale | | — | | 1,045,276 | | — | |
Iansagro S.A. | | Director in common | | Sugar purchase | | 9,796,298 | | 12,437,373 | | 10,651,166 | |
Cican S.A. | | Shareholder related | | Finished product purchases | | 1,276,044 | | 214,156 | | 77,034 | |
Vendomática S.A. | | Director related | | Finished product purchases | | 1,442,931 | | 1,142,310 | | — | |
BBVA Administradora General de Fondos S.A. | | Director related | | Money market funds investments | | 79,154,000 | | — | | — | |
| | | | Money market funds distributions | | 70,998,000 | | — | | — | |
Total | | | | | 19,157,342 | | 11,613,224 | | 3,340,602 | | 3,812,304 | |
(1) Corresponds to unearned income from sale commitments of Vital S.A.’s products to Embonor S.A. and Embotelladora Coca Cola Polar S.A., which will be realized along with future deliveries.
F-19
c) Transactions with related companies, exceeding ThCh$ 200,000, were as follows:
Company | | Relation | | Transaction | | 2007 | | 2006 | | 2005 | |
| | | | | | ThCh$ | | ThCh$ | | ThCh$ | |
Coca-Cola de Chile S.A. | | Shareholder | | Concentrate purchases | | 49,328,091 | | 43,630,671 | | 44,780,947 | |
| | | | Payment of advertising participation | | 4,130,800 | | 1,952,142 | | 3,120,956 | |
| | | | Water source rental | | 1,690,491 | | 1,445,155 | | 1,651,040 | |
| | | | Sales of advertisement | | 3,550,348 | | 2,907,005 | | 3,498,992 | |
Recofarma Industrias do Amazonas Ltda. | | Shareholder related | | Concentrate purchases | | 54,838,897 | | 43,802,173 | | 32,389,309 | |
| | | | Payment of advertising participation | | 3,308,899 | | 3,447,790 | | 3,430,457 | |
| | | | Reimbursement and other purchases | | 518,321 | | 579,947 | | 467,362 | |
SPBR S.R.L. | | Shareholder | | Concentrate purchases | | 27,115,345 | | 24,375,249 | | 22,034,518 | |
Envases Central S.A. | | Equity investee | | Finished product purchases | | 16,866,737 | | 16,474,307 | | 15,122,749 | |
| | | | Sales of raw materials and supplies | | 1,677,076 | | 1,580,946 | | 1,099,562 | |
Envases CMF S.A. | | Equity investee | | Purchase of containers | | 16,121,863 | | 17,685,751 | | 17,439,417 | |
| | | | Sale of finished products | | 216,344 | | — | | — | |
| | | | Dividend payment | | 3,210,000 | | 1,589,666 | | 1,368,499 | |
Iansagro S.A. | | Director in common | | Purchase of sugar | | 15,709,142 | | 10,521,224 | | 13,357,739 | |
Coca Cola Embonor S.A. | | Shareholder related | | Sale of shares | | — | | — | | 3,332,882 | |
| | | | Sale of finished products | | 8,711,620 | | 7,455,203 | | — | |
| | | | Parchase of products | | 280,009 | | — | | — | |
Embotelladora Coca Cola Polar S.A. | | Shareholder related | | Sale of shares | | — | | — | | 2,154,151 | |
| | | | Sale of finished products | | 5,163,952 | | 4,635,081 | | — | |
Vendomática S.A. | | Director related | | Finished product purchases | | 1,462,596 | | 1,549,708 | | 1,226,841 | |
Cican S.A. | | Shareholder related | | Purchases of finished producst | | 1,456,354 | | 1,370,471 | | 230,004 | |
Envases del Pacífico S.A. | | Shareholder related | | Purchase of raw materials | | 225,946 | | 457,569 | | 855,702 | |
BBVA Administradora General de Fondos S.A. | | Shareholder related | | Investments in mutual funds | | 44,510,881 | | 85,011,396 | | — | |
| | | | Redemption of mutual funds | | 46,341,441 | | 76,251,852 | | — | |
Inmobiliaria y Constructora El Golf S.A. | | Shareholder in common | | Purchase of real estate property | | — | | — | | 17,661 | |
Inversiones Caburga S.A. | | Shareholder | | Sale of real estate property | | — | | — | | 1,122,626 | |
d) Other transactions
In 2006, the Company entered into a supply agreement with Empresas Iansa S.A. and Iansagro S.A. for the purchase of 172,000 tons of sugar for the period 2007-2009.sugar. This agreement will expire in January 2009. The agreement provides for the payment of a fixed price for part of the volume to be purchased and a variable price, determined in accordance with market values observed in international markets, for the remaining commitments.
For the year ended December 31, 2006, the Company recorded a loss of ThCh$ 748,463803,849 on purchase commitments stated at fixed prices, based on fair values at year-end.year-end (nil for the year ended December 31, 2007).
F - 18F-20
NOTE 7 - INVENTORIES
Inventories at each year-end consisted of the following:
| | | | At December 31, | | At December 31, | |
| | | 2006 | | 2005 | | 2007 | | 2006 | |
| | | Gross value | | Obsolescence provision | | Net value | | Gross value | | Obsolescence provision | | Net value | | Gross
value | | Obsolescence
provision | | Net value | | Gross
value | | Obsolescence
provision | | Net value | |
| | | ThCh$ | | ThCh$ | | ThCh$ | | ThCh$ | | ThCh$ | | ThCh$ | | ThCh$ | | ThCh$ | | ThCh$ | | ThCh$ | | ThCh$ | | ThCh$ | |
Finished products | | 10,841,490 | | (368,640 | ) | | 10,472,850 | | 8,442,282 | | (55,874 | ) | | 8,386,408 | | 14,753,515 | | (559,736 | ) | 14,193,779 | | 11,643,760 | | (395,919 | ) | 11,247,841 | |
Products in process | | 691,102 | | — | | | 691,102 | | 142,026 | | — | | | 142,026 | | 1,353,429 | | — | | 1,353,429 | | 742,244 | | — | | 742,244 | |
Raw materials | | 10,274,661 | | (167,834 | ) | | 10,106,827 | | 8,435,888 | | (97,904 | ) | | 8,337,984 | | 11,624,291 | | (249,308 | ) | 11,374,983 | | 11,034,986 | | (180,254 | ) | 10,854,732 | |
Raw materials in transit | | 1,420,304 | | — | | | 1,420,304 | | 924,879 | | — | | | 924,879 | | 376,429 | | — | | 376,429 | | 1,525,406 | | — | | 1,525,406 | |
| | | | | | | | | | | | | | | |
Total | | 23,227,557 | | (536,474 | ) | | 22,691,083 | | 17,945,075 | | (153,778 | ) | | 17,791,297 | | 28,107,664 | | (809,044 | ) | 27,298,620 | | 24,946,396 | | (576,173 | ) | 24,370,223 | |
| | | | | | | | | | | | | | | |
NOTE 8 - INCOME TAXES AND DEFERRED INCOME TAXES
a) General:
At December 31, 20062007 and 2005,2006, the Company has no accumulated taxable profits with shareholders credit.
b) | Deferred income taxes at each year-end were as follows: |
b) Deferred income taxes at each year-end were as follows:
| | | | December 31, 2006 | | December 31, 2005 | | | December 31, 2007 | | December 31, 2006 | |
| | | Assets | | Liabilities | | Assets | | Liabilities | | | Assets | | Liabilities | | Assets | | Liabilities | |
| | | Short-term | | Long-term | | Short-term | | Long-term | | Short-term | | Long-term | | Short-term | | Long-term | | | Short- term | | Long-term | | Short- term | | Long-term | | Short- term | | Long-term | | Short- term | | Long-term | |
| | | ThCh$ | | ThCh$ | | ThCh$ | | ThCh$ | | ThCh$ | | ThCh$ | | ThCh$ | | ThCh$ | | | ThCh$ | | ThCh$ | | ThCh$ | | ThCh$ | | ThCh$ | | ThCh$ | | ThCh$ | | ThCh$ | |
Temporary Differences | | | | | | | | | | | | | | | | | | | | | | | | | | | | | | | | | |
Allowance for doubtful accounts | | 211,753 | | 38,868 | | — | | — | | | 240,090 | | 95,419 | | | — | | — | | | 250,944 | | 86,243 | | — | | — | | 227,423 | | 41,744 | | — | | — | |
Vacation accrual | | 188,582 | | — | | — | | — | | | 159,313 | | — | | | — | | — | | | 215,299 | | — | | — | | — | | 202,537 | | — | | — | | — | |
Production expenses | | 8,876 | | — | | — | | — | | | 5,611 | | — | | | — | | — | | | 3,375 | | — | | — | | 98,465 | | 9,533 | | — | | — | | — | |
Depreciation of property, plant and equipment | | — | | 466 | | 117,444 | | 4,086,591 | | | — | | — | | | 122,967 | | 4,208,541 | | | — | | — | | 162,024 | | 5,738,902 | | — | | 500 | | 126,135 | | 4,388,999 | |
Staff severance indemnities | | 91,148 | | 6,629 | | 33,560 | | 219,527 | | | 40,383 | | — | | | 39,233 | | 271,456 | | | 53,874 | | — | | 22,096 | | 171,415 | | 97,893 | | 7,120 | | 36,043 | | 235,772 | |
Provision for assets written – off | | 327,430 | | 1,396,237 | | — | | — | | | 136,897 | | 846,366 | | | — | | — | | |
Impaired assets | | | 704,461 | | 665,978 | | — | | — | | 351,660 | | 1,499,559 | | — | | — | |
Provision for labor and commercial lawsuits | | — | | 1,256,687 | | — | | — | | | — | | 4,298,294 | | | — | | — | | | — | | 1,346,483 | | — | | — | | — | | 1,349,682 | | — | | — | |
Tax loss carryforwards | | 2,123,839 | | 3,817,479 | | — | | — | | | 1,008,525 | | 9,036,649 | | | — | | — | | | 2,392,586 | | 1,257,078 | | — | | — | | 2,281,003 | | 4,099,972 | | — | | — | |
Deposits in guarantee | | — | | — | | — | | 2,246,257 | | | — | | — | | | — | | 2,673,313 | | | — | | — | | — | | — | | — | | — | | — | | 2,412,480 | |
Local bond issue expenses | | — | | — | | — | | 156,020 | | | — | | — | | | — | | 211,733 | | | — | | — | | — | | 147,028 | | — | | — | | — | | 167,565 | |
Contingency allowance | | — | | 213,277 | | — | | — | | | — | | 1,752,262 | | | — | | — | | |
Contingency provision | | | — | | 223,046 | | — | | — | | — | | 229,059 | | — | | — | |
Social contributions | | 764,582 | | 1,255,356 | | — | | — | | | 363,069 | | 2,167,977 | | | — | | — | | | 861,331 | | 452,548 | | — | | — | | 821,161 | | 1,348,252 | | — | | — | |
Accrued interest foreign companies | | — | | — | | 3,962,637 | | — | | | — | | — | | | 3,433,646 | | — | | |
Accrued interest foreign Companies | | | — | | — | | — | | — | | — | | — | | 4,255,872 | | — | |
Exchange rate difference | | — | | — | | — | | 8,578,522 | | | — | | — | | | — | | — | | | — | | — | | — | | 12,604,169 | | — | | — | | — | | 9,213,333 | |
Income participation provision | | | 791,234 | | — | | — | | — | | 790,595 | | — | | — | | — | |
Other | | 1,287,863 | | 370,254 | | — | | — | | | 915,391 | | 1,754,892 | | | — | | 84,733 | | | 145,720 | | 362,817 | | 25 | | — | | 592,569 | | 397,653 | | — | | — | |
| | | | | | | | | | | | | | | | | | |
Others | | | | | | | | | | | | | | | | | | | | | | | | | | | | | | | | | |
Complementary accounts, net of amortization | | — | | — | | — | | (2,804,008 | ) | | — | | (3,997,073 | ) | | — | | (3,158,229 | ) | |
Valuation allowance (1) | | — | | — | | — | | — | | | — | | (10,972,535 | ) | | — | | — | | |
| | | | | | | | | | | | | | | | | | | | |
Complementary accounts, net of Amortization | | | — | | — | | — | | (1,990,250 | ) | — | | — | | — | | (3,011,505 | ) |
Total | | 5,004,073 | | 8,355,253 | | 4,113,641 | | 12,482,909 | | | 2,869,279 | | 4,982,251 | | | 3,595,846 | | 4,291,547 | | | 5,418,824 | | 4,394,193 | | 184,145 | | 16,769,729 | | 5,374,374 | | 8,973,541 | | 4,418,050 | | 13,406,644 | |
| | | | | | | | | | | | | | | | | | | | |
(1) | The decrease in the valuation allowance in 2006 is due to improved conditions related to the projected utilization of accumulated tax loss carry-forwards concerning our subsidiaries in Argentina and Brazil, for which the corresponding deferred tax asset had previously been provisioned. |
F - 19
Short-term deferred tax assets are presented net of short-term deferred tax liabilities. Long-term deferred tax liabilities are presented net of long-term deferred tax assets.
c) | Income tax expense for each year was as follows: |
F-21
| | | | | | | | | |
| | | For the year ended December 31, | |
| | | 2006 | | | 2005 | | | 2004 | |
| | | ThCh$ | | | ThCh$ | | | ThCh$ | |
Current income tax expense | | (9,571,745 | ) | | (9,148,881 | ) | | (4,168,509 | ) |
Tax expense adjustment (previous period) | | (115,569 | ) | | (160,055 | ) | | 574,214 | |
Deferred income tax expense over assets or liabilities | | (18,599,927 | ) | | (3,017,587 | ) | | (1,427,635 | ) |
Amortization of deferred income tax asset and liability complementary accounts | | 3,744,535 | | | (960,680 | ) | | (1,018,764 | ) |
Change in valuation allowance | | 11,163,934 | | | 4,718,154 | | | 2,115,704 | |
Other charges | | (176,553 | ) | | (159,523 | ) | | (247,648 | ) |
| | | | | | | | | |
Total | | (13,555,325 | ) | | (8,728,572 | ) | | (4,172,638 | ) |
| | | | | | | | | |
c) Income tax expense for each year was as follows:
d) | Total income (loss) before income taxes and minority interest arising from different geographic sources is as follows: |
| | For the year ended December 31, | |
| | 2007 | | 2006 | | 2005 | |
| | ThCh$ | | ThCh$ | | ThCh$ | |
Current income tax expense | | (23,554,651 | ) | (10,280,054 | ) | (9,825,898 | ) |
Tax expense adjustment (previous period) | | 373,906 | | (124,121 | ) | (171,899 | ) |
Deferred income tax expense over assets or liabilities | | (2,822,775 | ) | (19,976,322 | ) | (3,240,888 | ) |
Amortization of deferred income tax asset and liability complementary accounts | | (1,059,998 | ) | 4,021,631 | | (1,031,770 | ) |
Change in valuation allowance | | — | | 11,990,065 | | 5,067,297 | |
Other | | 193,127 | | (189,618 | ) | (171,328 | ) |
Total | | (26,870,391 | ) | (14,558,419 | ) | (9,374,486 | ) |
| | | | | | | | |
Year ended December 31, | | Chilean and others | | Brazil | | Argentina | | The
Company
(consolidated) |
| | | ThCh$ | | ThCh$ | | ThCh$ | | ThCh$ |
2006 | | 51,149,733 | | 30,314,461 | | 6,475,822 | | 87,940,016 |
2005 | | 52,650,946 | | 8,678,263 | | 4,603,109 | | 65,932,318 |
2004 | | 40,143,621 | | 6,364,565 | | 145,417 | | 46,653,603 |
d)Total income (loss) before income taxes and minority interest arising from the different geographic sources is as follows:
Year ended December 31, | | Chilean
and others | | Brazil | | Argentina | | The Company
(consolidated) | |
| | ThCh$ | | ThCh$ | | ThCh$ | | ThCh$ | |
2007 | | 54,741,580 | | 44,448,467 | | 9,325,089 | | 108,515,136 | |
2006 | | 54,934,814 | | 32,557,731 | | 6,955,033 | | 94,447,578 | |
2005 | | 56,547,117 | | 9,320,454 | | 4,943,739 | | 70,811,310 | |
NOTE 9 - OTHER CURRENT ASSETS
Other current assets at each year-end consisted of the following:
| | | | At December 31, | | At December 31, | |
| | | 2006 | | 2005 | | 2007 | | 2006 | |
| | | ThCh$ | | ThCh$ | | ThCh$ | | ThCh$ | |
Cross-currency swap current portion | | 12,056,881 | | 1,661,607 | | 17,394,865 | | 12,949,090 | |
Supplies | | 3,056,325 | | 4,986,862 | | 4,574,986 | | 3,282,493 | |
Securities purchased under agreements to resell | | 970,304 | | — | | — | | 1,042,106 | |
Futures contracts | | 252,773 | | — | | 90,964 | | 271,478 | |
Other | | 1,980,693 | | 1,898,695 | | 515,201 | | 2,127,265 | |
| | | | | |
Total | | 18,316,976 | | 8,547,164 | | 22,576,016 | | 19,672,432 | |
| | | | | |
F - 20F-22
NOTE 10 - SECURITIES PURCHASED UNDER AGREEMENTS TO RESELL
At December 31, 2006, the balance of financial instruments purchased under agreements to resell is as follows:
| | Dates | Dates | | Counterparty | | Currency | | Subscription Value | | Rate | | | Book
Value | | Value at
settlement | | Instrument Id. | Dates | | | | | | Subscription | | | | Book | | Value at | | | |
| Start | | Expiration | | | | | Expiration | | Counterparty | | Currency | | Value | | Rate | | Value | | settlement | | Instrument Id. | |
| | | | | | | | | ThCh$ | | % | | ThCh$ | | ThCh$ | | | | | | | | | | ThCh$ | | % | | ThCh$ | | ThCh$ | | | |
| Dec. 29, 2006 | | Jan. 3, 2007 | | Santander –Santiago | | Ch$ | | 400,000 | | 0.47 | % | | 400,125 | | 400,313 | | D$SAN 051207 | | Jan. 3, 2007 | | Santander —Santiago | | Ch$ | | 429,600 | | 0.47 | % | 429,734 | | 429,936 | | D$SAN 051207 | |
| Dec. 29, 2006 | | Jan. 4, 2007 | | Santander –Santiago | | Ch$ | | 300,000 | | 0.47 | % | | 300,094 | | 300,282 | | D$SAN 191207 | | Jan. 4, 2007 | | Santander —Santiago | | Ch$ | | 322,200 | | 0.47 | % | 322,301 | | 322,503 | | D$SAN 191207 | |
| Dec. 29, 2006 | | Jan. 4, 2007 | | Santander –Santiago | | Ch$ | | 270,000 | | 0.47 | % | | 270,085 | | 270,254 | | D$SAN 191207 | | Jan. 4, 2007 | | Santander —Santiago | | Ch$ | | 289,980 | | 0.47 | % | 290,071 | | 290,253 | | D$SAN 191207 | |
| | | | | | | | | | | | | | | | | | | | | | | | 1,041,780 | | | | 1,042,106 | | 1,042,692 | | | |
| | | | | | | | 970,000 | | | | 970,304 | | 970,849 | | | |
| | | | | | | | | | | | | | | | | |
NOTE 11 - PROPERTY, PLANT AND EQUIPMENT
Property, plant and equipment consists principally of land, buildings, improvements and machinery. Machinery and equipment includes production lines and supporting equipment, sugar processing and liquefying equipment, transportation machinery, and computer equipment. The Company has purchased insurance to cover its fixed assets and inventories. These assets are distributed as follows:
| | | | |
Chile | | : | | Chile : Santiago, Renca, Rancagua, San Antonio and Rengo Argentina : Buenos Aires, Mendoza, Córdoba, and Rosario Brazil : Rio de Janeiro, Niteroi, Campos, Cabo Frio, Nova Iguazú, Espíritu Santo and Vitoria During 2007 and Rengo |
Argentina | | : | | Buenos Aires, Mendoza, Córdoba, and Rosario |
Brazil | | : | | Rio de Janeiro, Niteroi, Campos, Cabo Frio, Nova Iguazú, Espíritu Santo and Vitoria |
As of December 31, 2006, the Company and its subsidiaries have adjusted property, plant and equipment that management deems willdeemed to remain inactive for an indefinite amount of time, to itstheir estimated realization value. These adjustmentsThe resulting write-downs were recorded as Other non-operating expense. Total write-downsexpense, as follows:
| | 2007 | | 2006 | |
| | ThCh$ | | ThCh$ | |
Computer software (Other property plant and equipment) | | — | | 2,460,652 | |
Riles plant (Machinery and equipment) | | — | | 1,169,815 | |
Containers (Other property, plant and equipment) | | 673,278 | | — | |
Others (Other property, plant and equipment) | | 352,371 | | 359,420 | |
Total | | 1,025,649 | | 3,989,887 | |
a) Principal components of property, plant and equipment at each year-end are as follows:
| | |
| | ThCh$ |
Computer software (Other property plant and equipment)
| | 2,291,110 |
Riles plant (Machinery and equipment)
| | 1,089,213 |
Pallet (Other property, plant and equipment)
| | 334,656 |
| | |
Total
| | 3,714,979 |
| | |
a) | Principal components of property, plant and equipment at each year-end are as follows: |
| | | | Balances at December 31, 2006 | | Balances at December 31, 2005 | | Balances at December 31, 2007 | | Balances at December 31, 2006 | |
| | | Assets | | Accumulated
depreciation | | Net property, plant and equipment | | Assets | | Accumulated
depreciation | | Net property, plant and equipment | | Assets | | Accumulated
depreciation | | Net property,
plant and
equipment | | Assets | | Accumulated
depreciation | | Net property,
plant and
equipment | |
| | | ThCh$ | | ThCh$ | | ThCh$ | | ThCh$ | | ThCh$ | | ThCh$ | | ThCh$ | | ThCh$ | | ThCh$ | | ThCh$ | | ThCh$ | | ThCh$ | |
Land | | 14,408,848 | | — | | | 14,408,848 | | 12,953,451 | | — | | | 12,953,451 | | 16,751,276 | | — | | 16,751,276 | | 15,475,103 | | — | | 15,475,103 | |
Buildings and improvements | | 85,054,927 | | (33,251,580 | ) | | 51,803,347 | | 81,212,921 | | (32,120,328 | ) | | 49,092,593 | | 98,502,738 | | (36,285,064 | ) | 62,217,674 | | 91,348,992 | | (35,712,197 | ) | 55,636,795 | |
Machinery and equipment | | 215,596,412 | | (172,928,009 | ) | | 42,668,403 | | 208,593,786 | | (159,733,334 | ) | | 48,860,452 | | 229,584,693 | | (178,948,855 | ) | 50,635,838 | | 231,550,546 | | (185,724,682 | ) | 45,825,864 | |
Other property, plant and equipment | | 207,321,528 | | (175,592,947 | ) | | 31,728,581 | | 200,677,474 | | (170,790,787 | ) | | 29,886,687 | | 217,489,779 | | (180,048,122 | ) | 37,441,657 | | 222,663,321 | | (188,586,825 | ) | 34,076,496 | |
Technical reappraisal of property, plant and equipment | | 2,056,207 | | (623,230 | ) | | 1,432,977 | | 2,056,333 | | (618,032 | ) | | 1,438,301 | | 2,208,110 | | (670,975 | ) | 1,537,135 | | 2,208,366 | | (669,349 | ) | 1,539,017 | |
| | | | | | | | | | | | | | | |
Total | | 524,437,922 | | (382,395,766 | ) | | 142,042,156 | | 505,493,965 | | (363,262,481 | ) | | 142,231,484 | | 564,536,596 | | (395,953,016 | ) | 168,583,580 | | 563,246,328 | | (410,693,053 | ) | 152,553,275 | |
| | | | | | | | | | | | | | | |
F - 21F-23
b) | Other property, plant and equipment at each year-end are as follows: |
| | | | |
| | | At December 31, |
| | | 2006 | | 2005 |
| | | ThCh$ | | ThCh$ |
Containers | | 117,981,015 | | 111,309,459 |
Refrigeration equipment and other assets | | 54,043,340 | | 55,149,901 |
Furniture and tools | | 7,413,454 | | 4,021,458 |
Other | | 27,883,719 | | 30,196,656 |
| | | | |
Total other property, plant and equipment | | 207,321,528 | | 200,677,474 |
| | | | |
b) Other property, plant and equipment at each year-end are as follows:
c) | Technical reappraisal of property, plant and equipment at each year-end was as follows: |
| | At December 31, | |
| | 2007 | | 2006 | |
| | ThCh$ | | ThCh$ | |
Containers | | 125,547,798 | | 126,711,610 | |
Refrigeration equipment and other assets | | 55,369,800 | | 58,042,547 | |
Furniture and tools | | 7,841,943 | | 7,962,050 | |
Other | | 28,730,238 | | 29,947,114 | |
Total other property, plant and equipment | | 217,489,779 | | 222,663,321 | |
| | | | | | | | | | | | | | |
| | | Balances at December 31, 2006 | | Balances at December 31, 2005 |
| | | Assets | | Accumulated
depreciation | | | Net property, plant and equipment | | Assets | | Accumulated depreciation | | | Net property,
plant and
equipment |
| | | ThCh$ | | ThCh$ | | | ThCh$ | | ThCh$ | | ThCh$ | | | ThCh$ |
Land | | 1,373,165 | | — | | | 1,373,165 | | 1,373,165 | | — | | | 1,373,165 |
Buildings and improvements | | 192,242 | | (134,404 | ) | | 57,838 | | 192,304 | | (129,856 | ) | | 62,448 |
Machinery and equipment | | 490,800 | | (488,826 | ) | | 1,974 | | 490,864 | | (488,176 | ) | | 2,688 |
| | | | | | | | | | | | | | |
Total | | 2,056,207 | | (623,230 | ) | | 1,432,977 | | 2,056,333 | | (618,032 | ) | | 1,438,301 |
| | | | | | | | | | | | | | |
c) Technical reappraisal of property, plant and equipment at each year-end was as follows:
d) | Depreciation charges for the period amounted to ThCh$ 29,553,886 (ThCh$ 29,646,794 and ThCh$ 33,265,599 in 2005 and 2004, respectively) of which ThCh$ 21,467,993 (ThCh$ 23,359,540 and ThCh$ 25,730,002 in 2005 and 2004, respectively) are included under Cost of sales and ThCh$8,085,893 (ThCh$ 6,287,254 and ThCh$ 7,535,597 in 2005 and 2004, respectively) under Administrative and selling expenses in the income statement. |
| | Balances at December 31, 2007 | | Balances at December 31, 2006 | |
| | Assets | | Accumulated
depreciation | | Net property,
plant and
equipment | | Assets | | Accumulated
depreciation | | Net property,
plant and
equipment | |
| | ThCh$ | | ThCh$ | | ThCh$ | | ThCh$ | | ThCh$ | | ThCh$ | |
Land | | 1,474,779 | | — | | 1,474,779 | | 1,474,779 | | — | | 1,474,779 | |
Buildings and improvements | | 206,469 | | (149,234 | ) | 57,235 | | 206,468 | | (144,350 | ) | 62,118 | |
Machinery and equipment | | 526,862 | | (521,741 | ) | 5,121 | | 527,119 | | (524,999 | ) | 2,120 | |
Total | | 2,208,110 | | (670,975 | ) | 1,537,135 | | 2,208,366 | | (669,349 | ) | 1,539,017 | |
d) Depreciation charges for the period amounted to ThCh$ 29,147,969 (ThCh$ 31,740,874 and ThCh$ 31,840,657 in 2006 and 2005, respectively) of which ThCh$ 21,471,798 (ThCh$ 23,056,625 and ThCh$ 25,088,146 in 2006 and 2005, respectively) are included under Cost of sales and ThCh$7,676,171 (ThCh$ 8,684,249 and ThCh$ 6,752,511 in 2006 and 2005, respectively) under Administrative and selling expenses in the income statement.
NOTE 12 - INVESTMENT IN UNCONSOLIDATED AFFILATES
Investments in related companies and the related direct participation in equity and unrealized results at each year-end were as follows:
| | | | Functional | | Ownership(*) interest | | Accrued income | | Participation in
Equity | | Unrealized losses | | Book value of investment | | | | Functional | | Ownership(*)
interest | | Accrued income | | Participation in Equity | | Unrealized losses | | Book value of
investment | |
Company | | Country | | Currency | | 2006 | | 2005 | | 2006 | | 2005 | | 2004 | | 2006 | | 2005 | | 2006 | | 2005 | | 2006 | | 2005 | | Country | | Currency | | 2007 | | 2006 | | 2007 | | 2006 | | 2005 | | 2007 | | 2006 | | 2007 | | 2006 | | 2007 | | 2006 | |
| | | % | | % | | ThCh$ | | ThCh$ | | ThCh$ | | ThCh$ | | ThCh$ | | ThCh$ | | ThCh$ | | ThCh$ | | ThCh$ | | | | | | % | | % | | ThCh$ | | ThCh$ | | ThCh$ | | ThCh$ | | ThCh$ | | ThCh$ | | ThCh$ | | ThCh$ | | ThCh$ | |
Envases CMF S.A. | | Chile | | Chilean pesos | | 50.00 | | 50.00 | | 379,530 | | | 278,713 | | | 231,668 | | 18,784,434 | | 18,542,598 | | (1,054,985 | ) | | (1,127,742 | ) | | 17,729,449 | | 17,414,856 | | Chile | | Chilean pesos | | 50.00 | | 50.00 | | 740,423 | | 407,617 | | 299,338 | | 18,761,269 | | 20,174,482 | | (1,054,912 | ) | (1,133,054 | ) | 17,706,357 | | 19,041,428 | |
Holdfab Participacoes Ltda. | | | Brazil | | US dollars | | 14.73 | | — | | 102,009 | | — | | — | | 4,001,117 | | — | | — | | — | | 4,001,117 | | — | |
Envases Central S.A. | | Chile | | Chilean pesos | | 49.91 | | 49.91 | | (22,483 | ) | | (374,508 | ) | | 86,020 | | 2,222,472 | | 2,240,008 | | (224,997 | ) | | (224,997 | ) | | 1,997,475 | | 2,015,011 | | Chile | | Chilean pesos | | 49.91 | | 49.91 | | 832 | | (24,147 | ) | (402,222 | ) | 2,391,671 | | 2,386,935 | | (241,646 | ) | (241,646 | ) | 2,150,025 | | 2,145,289 | |
Kaik Participacoes Ltda. | | Brazil | | US dollars | | 11.32 | | 11.32 | | 68,278 | | | 494,108 | | | 599,905 | | 1,554,235 | | 1,328,854 | | — | | | — | | | 1,554,235 | | 1,328,854 | | Brazil | | US dollars | | 11.32 | | 11.32 | | 103,040 | | 73,331 | | 530,673 | | 1,104,191 | | 1,669,248 | | — | | — | | 1,104,191 | | 1,669,248 | |
Cican S.A. | | Argentina | | US dollars | | 15.20 | | 15.20 | | 90,228 | | | 387,383 | | | 127,773 | | 1,185,462 | | 1,076,457 | | — | | | — | | | 1,185,462 | | 1,076,457 | | Argentina | | US dollars | | — | | 15.20 | | (277,806 | ) | 96,905 | | 416,049 | | — | | 1,273,186 | | — | | — | | — | | 1,273,186 | |
| | | | | | | | | | | | | | | | | | | | | | | | | | | | | | | |
Total | | | | | | | | | | 515,553 | | | 785,696 | | | 1,045,366 | | 23,746,603 | | 23,187,917 | | (1,279,982 | ) | | (1,352,739 | ) | | 22,466,621 | | 21,835,178 | | | | | | | | | | 668,498 | | 553,706 | | 843,838 | | 26,258,248 | | 25,503,851 | | (1,296,558 | ) | (1,374,700 | ) | 24,961,690 | | 24,129,151 | |
| | | | | | | | | | | | | | | | | | | | | | | | | | | | | | | |
(*) | Corresponds to the number of shares and rights of Andina over the total shares and rights in each of the companies. This percentage equals the voting right in each of entity, where there are no preferential shares. |
(*) Corresponds to the number of shares and rights of Andina over the total shares and rights in each of the companies. This percentage equals the voting right in each entity, where there are no preferential shares.
F - 22F-24
1 | The main changes that occurred in the reported periods are the following: |
1The main changes that occurred in the reported periods are the following:
·In November 2007, the Company´s subsidiary Embotelladora del Atlantico S.A. sold its 15.20% ownership interest in Cican S.A. to Femsa at ThCh$679.501. This sale resulted in a loss of ThCh$85,549 which was recorded in the Income Statement under other non-operating expenses.
·On October 4, 2007, the Company´s subsidiary Rio de Janeiro Refrescos Ltda (“Refrescos”), acquired a 14.732% ownership interest in Holdfab Participações Ltda. for ThR$12,831.63. In turn, Holdfab Participações Ltda. holds a 50% ownership interest in Amarantina Participações S.A.
·On June 5, 2006 Andina Inversiones Societarias S.A., a consolidated subsidiary of the Company was divided, creating “Andina Inversiones Societarias Dos S.A.” by the contribution at book value of Envases Multipack Ltda., a consolidated subsidiary. On August 15, 2006, Andina Inversiones Societarias Dos S.A. became a limited liability corporation and changed its name to Andina Inversiones Societarias Dos Ltda. On November 15, 2006, Andina Inversiones Societarias Dos Ltda. and Envases Multipack Ltda. were absorbed and merged into Embotelladora Andina S.A.
·On December 22, 2005 the production and packaging business of water, juices and non-carbonated beverages licensed by The Coca-Cola Company (“TCCC”) in Chile was restructured. Vital Aguas S.A. was created with the purpose of developing the process, production and packaging business of Vital de Chanqueahue Mineral Water and other water products according to the terms of the contracts and authorizations agreed upon by Vital Aguas S.A. and TCCC. Consequently, Vital S.A. will focus on juices and non-carbonated beverages.
Accordingly, the Company, Embonor S.A. and Embotelladora Coca-Cola Polar S.A. have taken an interest of 56.5%, 26.4% and 17.1%, respectively, in Vital Aguas S.A., which will conduct the business of the processing, production and bottling of theVital de Chanqueahue Mineral Water and other water and products, according to the terms of the contracts and authorizations agreed upon by Vital Aguas S.A. and TCCC.
The equity interests of Embonor and Polar in the newly created Vital Aguas S.A. were purchased from the Company, through its subsidiary, Andina Inversiones Societarias S.A., for UF 169,306 and UF 109,428, respectively. This sale by the Company of a portion of its ownership in Vital Aguas S.A. generated earnings of ThCh$ 3,972,0484,265,980 (UF 215,919), which is presented in Other Non-Operating Income in 2005.
·The equity investee Centralli Refrigerante S.A., Brazil, has negative shareholders´ equity, which is provisioned in the corresponding equity proportion. Ownership is 25%.
At the Extraordinary Shareholder’s Meeting As of Envases Central S.A., held on March 30, 2004, the shareholders approved a resolution to increase the company’s capitalDecember 31, 2007 and 2006, such provision amounted to ThCh$ 4,606,133 (historical Chilean pesos) through an issue of 1,743,555 shares of the same existing series, with no nominal value. Andina paid a total contribution of41,281 and ThCh$ 879,945 (historical Chilean pesos) for 929,838 shares, holding an ownership interest in Envases Central of 49.91%.41,830, respectively, and is included under Other long-term liabilities.
·The investment in Envases Central S.A. is presented net of unrealized income generated in December 1996 related to the sale of the property located in Renca. Total unrealized income amounted to ThCh$ 224,997241,646 and will be recognized upon the sale of the land to a third party.
F - 23F-25
·The investment in Envases CMF S.A. is presented net of unrealized income generatedof ThCh$1,054,912 originated in June 2001 from the purchase of machinery and equipment from the Company’s subsidiary Envases Multipack S.A. Total unrealizedUnrealized income will beis recognized in earnings over the remaining useful life of the assets sold to Envases CMF S.A. In 2007 and 2006, the Company realized ThCh$ 72,75778,142 each year for this concept.
·The equity gain recognized from the investment in Envases CMF S.A. is presented net of unrealized income related to the sale of bottles from Envases CMF S.A. to Andina. As of December 31, 20062007 this amounts to ThCh$ 1,342,4401,056,366 (ThCh$ 1,197,0871,441,781 and ThCh$ 912,7241,285,671 as of December 31, 2006 and 2005, and 2004, respectively).
·During 2006,2007, Envases CMF S.A. distributed dividends to Andina amounting to ThCh$ 1,480,1363,209,750 (ThCh$ 1,274,2081,589,666 during 2005)2006).
·During 2005,2007, Kaik Participacoes Ltda. distributed dividends to Refrescos amounting to ThCh$ 153,996.744,415.
2 | Income available to be remitted by subsidiaries abroad which have not been taxed in Chile amount to US$ 218 million. The Company does not have any current plans to remit such income to Chile. |
2Income available to be remitted by subsidiaries abroad which have not been taxed in Chile amount to US$ 286 million.
3 | The investments in Kaik Partipacoes Ltda. (Brazil) and Cican S.A. (Argentina), where the Company holds an indirect ownership of 11.32% and 15.2%, respectively, have been accounted for under the equity method, as described in Note 1 m), since the Company has the right to designate a director in each investee. |
3The investment in Kaik Partipacoes Ltda. (Brazil), where the Company holds an indirect ownership of 11.32%, has been accounted for under the equity method, as described in Note 1 m), since the Company has the right to designate a director.
NOTE 13 - - GOODWILL
Goodwill at each year-end and the corresponding amortization for each year were as follows:
| | | | | | | | | | | | | | At December 31, | |
| | | At December 31, | | 2007 | | 2006 | | 2005 | |
| | | 2006 | | 2005 | | 2004 | | Amortization
during the year | | Goodwill
balance | | Amortization
during the year | | Goodwill
balance | | Amortization
during the year | | Goodwill
balance | |
| | | Amortization during the
year | | Goodwill
balance | | Amortization during the
year | | Goodwill
balance | | Amortization during the
year | | Goodwill
balance | | ThCh$ | | ThCh$ | | ThCh$ | | ThCh$ | | ThCh$ | | ThCh$ | |
| | | ThCh$ | | ThCh$ | | ThCh$ | | ThCh$ | | ThCh$ | | ThCh$ | | | | | | | | | | | | | |
Rio de Janeiro Refrescos Ltda. | | 3,581,300 | | 41,513,689 | | 3,486,432 | | 44,090,860 | | 3,643,960 | | 53,066,197 | | 3,361,883 | | 35,545,203 | | 3,846,316 | | 44,585,702 | | 3,744,429 | | 47,353,584 | |
Embotelladora del Atlántico S.A. | | 2,789,230 | | 25,843,794 | | 2,741,411 | | 28,142,128 | | 3,088,921 | | 34,798,451 | | 2,603,243 | | 21,517,275 | | 2,995,633 | | 27,756,235 | | 2,944,275 | | 30,224,645 | |
Vital S.A. | | 131,881 | | 527,525 | | 131,880 | | 659,407 | | 527,525 | | 791,287 | | 537,548 | | — | | 141,640 | | 566,562 | | 141,639 | | 708,203 | |
Envases Central S.A. | | — | | — | | — | | — | | 76,665 | | — | |
| | | | | | | | | | | | | |
Total | | 6,502,411 | | 67,885,008 | | 6,359,723 | | 72,892,395 | | 7,337,071 | | 88,655,935 | | 6,502,674 | | 57,062,478 | | 6,983,589 | | 72,908,499 | | 6,830,343 | | 78,286,432 | |
| | | | | | | | | | | | | |
Accumulated amortization of goodwill was ThCh$ 93,718,402107,156,238 and ThCh$ 87,215,991100,653,564 at December 31, 20062007 and 2005,2006, respectively.
F - 24F-26
NOTE 14 - OTHER LONG-TERM ASSETS
Other long-term assets at each year-end were as follows:
| | | | At December 31, | | At December 31, | |
| | | 2006 | | 2005 | | 2007 | | 2006 | |
| | | ThCh$ | | ThCh$ | | ThCh$ | | ThCh$ | |
Long-term investments | | | | | | | | | |
Bonds: | | | | | | | | | |
Celulosa Arauco S.A. | | 12,136,561 | | 11,912,159 | | — | | 13,034,667 | |
Enap S.A. | | 9,417,191 | | 9,361,515 | | — | | 10,114,063 | |
Endesa S.A. | | 8,050,627 | | 7,969,998 | | — | | 8,646,373 | |
Soberano Chile | | 7,631,387 | | 7,529,474 | | — | | 8,196,110 | |
Petróleos Mexicanos S.A. | | 6,279,411 | | 7,434,144 | | — | | 6,744,087 | |
Compañía Manufacturera de Papeles y Cartones S.A. | | 7,373,046 | | 7,234,421 | | — | | 7,918,651 | |
Teléfonos de México S.A. | | 7,119,462 | | 6,996,256 | | — | | 7,646,302 | |
Codelco S.A. | | 5,420,293 | | 5,376,097 | | — | | 5,821,395 | |
Soberano México | | 4,943,205 | | 4,895,099 | | — | | 5,309,002 | |
Scotiabank Sud Americano | | — | | 4,396,168 | |
Federal Home Loan Bank (FHLB) | | 2,667,820 | | 2,623,096 | |
Federal Home Loan Bank (FHLB) | | | — | | 2,865,239 | |
Brasil Telecom S.A. | | 2,119,838 | | 2,141,906 | | — | | 2,276,706 | |
Raytheon Company | | 2,161,972 | | 2,129,523 | | — | | 2,321,958 | |
International Paper Company | | 2,129,560 | | 2,093,050 | | — | | 2,287,147 | |
Altria Group | | 1,216,801 | | 1,210,115 | | — | | 1,306,844 | |
United States Treasury Notes | | 1,106,877 | | — | |
United States Treasury (1) | | | — | | 1,188,786 | |
Alcoa Inc. | | 1,085,401 | | 1,069,801 | | — | | 1,165,721 | |
Credit link Endesa | | 5,494,271 | | 5,232,625 | | — | | 5,900,847 | |
Credit link GMAC | | — | | 1,695,371 | |
Credit link Ford | | — | | 1,569,788 | |
Cross currency swap receivable | | 14,776,849 | | 27,889,635 | | — | | 15,870,336 | |
| | | | | |
Subtotal long-term investments | | 101,130,572 | | 120,760,241 | | — | | 108,614,234 | |
| | | | | | | | | |
Other | | | | | | | | | |
Judicial deposits (Brazil) | | 4,985,594 | | 4,237,993 | | 6,949,232 | | 5,354,528 | |
Recoverable taxes | | | 5,451,956 | | 1,550,583 | |
Bond issuance expense and par value difference | | 2,989,778 | | 3,345,764 | | 2,898,159 | | 3,211,022 | |
Prepaid expenses | | 2,085,422 | | 1,733,109 | | 3,298,477 | | 2,239,743 | |
Non-operating assets | | | 2,406,482 | | 1,215,425 | |
Supplies | | 2,596,177 | | 992,751 | | 2,556,258 | | 2,788,294 | |
Recoverable taxes | | 1,443,746 | | 1,235,704 | |
Non-operating assets | | 1,131,681 | | 929,909 | |
Other | | 406,657 | | 422,551 | | 57,159 | | 436,750 | |
| | | | | |
Subtotal Other | | 15,639,055 | | 12,897,781 | | 23,617,723 | | 16,796,345 | |
| | | | | |
Total | | 116,769,627 | | 133,658,022 | | 23,617,723 | | 125,410,579 | |
| | | | | |
(1)Collateral guarantee required for operating at the London International Financial Futures and Options Exchange.
F - 25F-27
NOTE 15 - SHORT-TERM BANK BORROWINGS
a)Short-term bank borrowings were as follows:
a) | Short-term bank borrowings were as follows: |
| | At December 31, | |
| | Currency or indexation adjustment | | | | | |
| | Foreign currencies | | Non-indexed Ch$ | | Total | |
| | 2007 | | 2006 | | 2007 | | 2006 | | 2007 | | 2006 | |
| | ThCh$ | | ThCh$ | | ThCh$ | | ThCh$ | | ThCh$ | | ThCh$ | |
Banco Galicia | | 1,671,991 | | — | | — | | — | | 1,671,991 | | — | |
Banco do Brasil | | 1,009,882 | | 2,674,260 | | — | | — | | 1,009,882 | | 2,674,260 | |
Banco BBVA. | | — | | — | | 1,268,949 | | | | 1,268,949 | | — | |
Citibank N.A. | | — | | — | | — | | 12 | | — | | 12 | |
Total | | 2,681,873 | | 2,674,260 | | 1,268,949 | | 12 | | 3,950,822 | | 2,674,272 | |
Principal due | | 2,650,134 | | 2,674,260 | | 1,268,949 | | 12 | | 3,919,083 | | 2,674,272 | |
Weighted average annual interest rate | | | | | | | | | | 8.91 | | 8.75 | |
| | | | | | | | | | | | | | | | |
| | | At December 31, |
| | | Currency or indexation adjustment | | | | |
| | | Dollars | | Other foreign currencies | | Non-Indexed Ch$ | | Total |
| | | 2006 | | 2005 | | 2006 | | 2005 | | 2006 | | 2005 | | 2006 | | 2005 |
| | | ThCh$ | | ThCh$ | | ThCh$ | | ThCh$ | | ThCh$ | | ThCh$ | | ThCh$ | | ThCh$ |
Dexia Bank Belgium | | — | | 21,452,597 | | — | | — | | — | | — | | — | | 21,452,597 |
Banco Rio | | — | | — | | — | | 2,809,593 | | — | | — | | — | | 2,809,593 |
Banco BBVA Francés | | — | | — | | — | | 1,872,639 | | — | | — | | — | | 1,872,639 |
Banco Chile | | — | | — | | — | | — | | — | | 1,456,308 | | — | | 1,456,308 |
Banco HSBC Roberts | | — | | — | | — | | 930,834 | | — | | — | | — | | 930,834 |
Banco do Brasil | | — | | — | | 2,490,000 | | — | | — | | — | | 2,490,000 | | — |
Citibank N.A. | | — | | — | | — | | — | | 11 | | — | | 11 | | |
| | | | | | | | | | | | | | | | |
Total | | — | | 21,452,597 | | 2,490,000 | | 5,613,066 | | 11 | | 1,456,308 | | 2,490,011 | | 28,521,971 |
| | | | | | | | | | | | | | | | |
Principal due | | — | | 20,930,500 | | 2,490,000 | | 5,177,399 | | 11 | | 1,456,308 | | 2,490,011 | | 27,564,207 |
| | | | | | | | | | | | | | | | |
Weighted average annual interest rate | | 8.75 | | 6.62 |
| | | | | | | | | | | | | | | | |
At December 31, 20062007 and 2005,2006, the Company had approximately Ch$57,740 and102,327and Ch$105,39162,013 million, respectively, available through short-term lines of credit. The aggregate outstanding amount of these lines of credit at December 31, 20062007 and 20052006 was approximately Ch$8063.709 million and Ch$6,384866 million, respectively.
b) | Current portion long-term bank borrowings: |
b)Current portion of long-term bank borrowings:
| | | | At December 31, | | |
| | | Currency or indexation adjustment | | | | At December 31, | |
| | | US dollars | | Other foreign
currencies | | Total | | | Currency or indexation adjustment:
Foreign currencies | |
Bank | | 2006 | | 2005 | | 2006 | | 2005 | | 2006 | | 2005 | | | 2007 | | 2006 | |
| | | ThCh$ | | ThCh$ | | ThCh$ | | ThCh$ | | ThCh$ | | ThCh$ | | | ThCh$ | | ThCh$ | |
| | | | | | |
Banco Alfa | | | 118,264 | | 5,040 | |
BankBoston | | | 2,168 | | 11,344 | |
Banco Votorantim | | | 1,929 | | — | |
Banco Santander | | — | | — | | 423,588 | | 330,211 | | 423,588 | | | 330,211 | | | — | | 454,933 | |
BankBoston | | — | | — | | 10,562 | | 164,056 | | 10,562 | | | 164,056 | | |
Banco Alfa | | — | | — | | 4,693 | | — | | 4,693 | | | — | | |
| | | | | | | | | | | | | | | |
Total | | — | | — | | 438,843 | | 494,267 | | 438,843 | | | 494,267 | | | 122,361 | | 471,317 | |
| | | | | | | | | | | | | | | |
Principal due | | — | | — | | 361,407 | | 488,319 | | 361,407 | | | 488,319 | | | 119,201 | | 388,151 | |
| | | | | | | | | | | | | | | |
Weighted average annual interest rate | | | | | | | | | | 15.66 | % | | 13.26 | % | | 11.89 | % | 15.66 | % |
| | | | | | | | | | | | | | | |
F - 26F-28
NOTE 16 - LONG-TERM BANK BORROWINGS
Long –— term bank borrowings were as follows:
| | | | | | At December 31, | | | | At December 31, | |
| | | | | Current year-end | | Prior year-end | | | | Current year-end | | Prior year-end | |
| | | | | Years to maturity | | Total long-term | | Average annual interest | | Total long-term | | Average
annual
interest | | | | Years to maturity | | | | | | | | | |
Bank | | Currency | | 2008 | | 2009 | | 2010 | | 2011 | | at year-end | | rate | | at year-end | | rate | | Currency | | 2009 | | 2010 | | 2011 | | 2012 | | Total
long-term
at year-end | | Average
annual
interest
rate | | Total
long-term
at year-end | | Average
annual
interest
rate | |
| | | | | ThCh$ | | ThCh$ | | ThCh$ | | ThCh$ | | ThCh$ | | % | | ThCh$ | | % | | | | ThCh$ | | ThCh$ | �� | ThCh$ | | ThCh$ | | ThCh$ | | % | | ThCh$ | | % | |
| | | | | | | | | | | | | | | | | | | | |
Banco Votorantim | | | R$ | | — | | 229,187 | | 116,136 | | 109,469 | | 454,792 | | 9.40 | | — | | — | |
Banco Alfa | | R$ | | 385,094 | | 29,547 | | 527 | | 3 | | 415,171 | | 15.59 | | — | | — | | R$ | | 118,100 | | 118,100 | | 49,653 | | — | | 285,853 | | 10.79 | | 445,894 | | 15.59 | |
Banco Boston | | R$ | | 2,865 | | — | | — | | — | | 2,865 | | 16.02 | | 13,387 | | 13.68 | | R$ | | — | | — | | — | | — | | — | | — | | 3,077 | | 16.02 | |
Banco Santander | | R$ | | — | | — | | — | | — | | — | | — | | 450,659 | | 13.27 | |
| | | | | | | | | | | | | | | | | | | |
Total | | | | 387,959 | | 29,547 | | 527 | | 3 | | 418,036 | | 15.59 | | 464,046 | | 13.28 | | | | 118,100 | | 347,287 | | 165,789 | | 109,469 | | 740,645 | | 9.94 | | 448,971 | | 15.59 | |
| | | | | | | | | | | | | | | | | | | |
NOTE 17 - BONDS PAYABLE
1Details of bonds payable are as follows:
1 | Details of bonds payable are as follows: |
| | | | | | | | | | | | | | Next | | | | Placement | |
Instrument subscription or | | | | Nominal | | | | Interest | | | | Interest | | capital | | Par value | | in Chile | |
identification number | | Series | | value | | Currency | | rate | | Maturity date | | paid | | amortization | | 2007 | | 2006 | | or abroad | |
| | | | | | | | % | | | | | | | | ThCh$ | | ThCh$ | | | |
| | | | | | | | | | | | | | | | | | | | | |
Current portion of bonds payable | | | | | | | | | | | | | | | | | | | | | |
Yankee bonds | | A | | — | | US$ | | 7.000 | | October 1, 2007 | | Half -yearly | | Oct. 2007 | | — | | 18,661,596 | | Foreign | |
Yankee bonds | | B | | 2,000,000 | | US$ | | 7.625 | | October 1, 2027 | | Half -yearly | | Oct. 2027 | | 18,944 | | 43,600 | | Foreign | |
Register 254 SVS June 13, 2001 | | A | | 330,000 | | UF | | 6.200 | | June 1, 2008 | | Half -yearly | | June 2008 | | 6,508,446 | | 13,096,776 | | Chile | |
Register 254 SVS June 13, 2001 | | B | | 3,700,000 | | UF | | 6.500 | | June 1, 2026 | | Half -yearly | | Dec. 2009 | | 387,080 | | 388,472 | | Chile | |
Total current maturities | | | | | | | | | | | | | | | | 6,914,470 | | 32,190,444 | | | |
| | | | | | | | | | | | | | | | | | | | | |
Long - term portion of bonds payable | | | | | | | | | | | | | | | | | | | | | |
Yankee bonds | | B | | 2,000,000 | | US$ | | 7.625 | | October 1, 2027 | | Half -yearly | | Oct. 2027 | | 993,780 | | 2,287,152 | | Foreign | |
Register 254 SVS June 13, 2001 | | A | | 330,000 | | UF | | 6.200 | | June 1, 2008 | | Half -yearly | | June 2008 | | — | | 6,498,779 | | Chile | |
Register 254 SVS June 13, 2001 | | B | | 3,700,000 | | UF | | 6.500 | | June 1, 2026 | | Half -yearly | | Dec. 2009 | | 72,603,842 | | 72,865,107 | | Chile | |
Total long-term | | | | | | | | | | | | | | | | 73,597,622 | | 81,651,038 | | | |
| | | | | | | | | | | | | | | | | | | | |
Instrument subscription or
identification number | | Series | | Nominal value | | Currency | | Interest rate | | Maturity date | | Interest paid | | Next capital amortization | | Par value | | Placement in Chile or abroad |
| | | | | | | | | 2006 | | 2005 | |
| | | | | | | | | % | | | | | | | | ThCh$ | | ThCh$ | | |
Current portion of bonds payable | | | | | | | | | | | | | | | | | | | | |
Yankee bonds | | A | | 32,076,000 | | US$ | | 7.000 | | October 1, 2007 | | Half yearly | | Oct. 2007 | | 17,375,788 | | 293,723 | | Foreign |
Yankee bonds | | B | | 4,000,000 | | US$ | | 7.625 | | October 1, 2027 | | Half yearly | | Oct. 2027 | | 40,595 | | 39,899 | | Foreign |
Register 254 SVS June 13, 2001 | | A | | 990,000 | | UF | | 6.200 | | June 1, 2008 | | Half yearly | | June 2007 | | 12,194,391 | | 13,275,981 | | Chile |
Register 254 SVS June 13, 2001 | | B | | 3,700,000 | | UF | | 6.500 | | June 1, 2026 | | Half yearly | | Dec. 2009 | | 361,706 | | 362,020 | | Chile |
| | | | | | | | | | | | | | | | | | | | |
Total current maturities | | | | | | | | | | | | | | | | 29,972,480 | | 13,971,623 | | |
| | | | | | | | | | | | | | | | | | | | |
Long - term portion of bonds payable | | | | | | | | | | | | | | | | | | | | |
Yankee bonds | | A | | 32,076,000 | | US$ | | 7.000 | | October 1, 2007 | | Half yearly | | Oct. 2007 | | — | | 16,784,168 | | Foreign |
Yankee bonds | | B | | 4,000,000 | | US$ | | 7.625 | | October 1, 2027 | | Half yearly | | Oct. 2027 | | 2,129,564 | | 2,093,050 | | Foreign |
Register 254 SVS June 13, 2001 | | A | | 990,000 | | UF | | 6.200 | | June 1, 2008 | | Half yearly | | June 2007 | | 6,051,005 | | 17,159,382 | | Chile |
Register 254 SVS June 13, 2001 | | B | | 3,700,000 | | UF | | 6.500 | | June 1, 2026 | | Half yearly | | Dec. 2009 | | 67,844,606 | | 67,903,440 | | Chile |
| | | | | | | | | | | | | | | | | | | | |
Total long-term | | | | | | | | | | | | | | | | 76,025,175 | | 103,940,040 | | |
| | | | | | | | | | | | | | | | | | | | |
Accrued interest included in current portion of bonds payable on the consolidated balance sheets amounted to ThCh$ 793,528438,992 and ThCh$ 849,743852,249 at December 31, 2007 and 2006, and 2005, respectively.
2 | Scheduled maturities of the long-term bonds payable at December 31, 2006 were as follows: |
2Scheduled maturities of the long-term bonds payable at December 31, 2007 were as follows:
| | | | | | | | | | | | | | | | Years to maturity | | Total
long-term | |
| | | | | Years to maturity | | Total long-term | | Series | | 2009 | | 2010 | | 2011 | | 2012 | | Thereafter | | at year-end | |
| | | Series | | 2008 | | 2009 | | 2010 | | 2011 | | Thereafter | | at year-end | | | | ThCh$ | | ThCh$ | | ThCh$ | | ThCh$ | | ThCh$ | | ThCh$ | |
| | | | | ThCh$ | | ThCh$ | | ThCh$ | | ThCh$ | | ThCh$ | | ThCh$ | | | | | | | | | | | | | | | |
Yankee Bonds | | B | | — | | — | | — | | — | | 2,129,564 | | 2,129,564 | | B | | — | | — | | — | | — | | 993,780 | | 993,780 | |
Register 254 SVS June 13, 2001 | | A | | 6,051,005 | | — | | — | | — | | — | | 6,051,005 | | B | | 2,135,407 | | 4,270,814 | | 4,270,814 | | 4,270,814 | | 57,655,993 | | 72,603,842 | |
Register 254 SVS June 13, 2001 | | B | | — | | 1,995,430 | | 3,990,859 | | 3,990,859 | | 57,867,458 | | 67,844,606 | |
| | | | | | | | | | | | | | | |
Total | | | | 6,051,005 | | 1,995,430 | | 3,990,859 | | 3,990,859 | | 59,997,022 | | 76,025,175 | | | | 2,135,407 | | 4,270,814 | | 4,270,814 | | 4,270,814 | | 58,649,773 | | 73,597,622 | |
| | | | | | | | | | | | | | | |
F - 27F-29
The Company’s restrictions regarding the issue of bonds are set forth in Note 26.
3 | Risk classification of bonds of the Company currently outstanding is as follows: |
3The risk classification of outstanding bonds is as follows:
Bonds issued in the US market:
A- | : | Rating issued by Fitch Ratings |
BBB+ | : | Rating issued by Standard & Poor’s |
Bonds issued in the local market:
AA | : | Rating issued by Fitch Chile |
AA | : | Rating issued by Feller & Rate |
4Bond repurchases
During 2000, 2001, 2002 and 2002,2007, the Company repurchased bonds it issued in the U.S. market, through its subsidiary Abisa Corp S.A.(formerly Pacific Sterling), for a total amount of US$ 314198 million of the US$ 350200 million aggregate principal amount issued. The bonds purchased by Abisa Corp S.A. have not been canceled and remain outstanding. The related asset and liability have been eliminated on consolidation.
5 | Bonds issued by Rio de Janeiro Refrescos Ltda. (“Refrescos”) |
5Bonds issued by Rio de Janeiro Refrescos Ltda.
The Company’s subsidiary Refrescos issued bonds for US$ 75 million maturing in December 2012 which requires semiannual interest payments. At December 31, 20062007 and 2005,2006, those bonds are owned by the Company’s subsidiary Abisa Corp S.A. (formerly Pacific Sterling). Consequently, the related asset and liability have been eliminated on consolidation.
NOTE 18 - OTHER ACCRUED LIABILITIES
Other accrued liabilities at each year-end consisted of the following:
| | | | | | | | |
| | | At December 31, |
| | | Short – term | | Long – term |
| | | 2006 | | 2005 | | 2006 | | 2005 |
| | | ThCh$ | | ThCh$ | | ThCh$ | | ThCh$ |
Staff severance indemnities and retention plan | | 634,122 | | 568,759 | | 5,593,845 | | 5,015,736 |
Contingency provisions | | 80,345 | | 75,908 | | 2,780,207 | | 8,391,496 |
Contingency provision-Brazilian banking taxes (1) | | 2,170,765 | | — | | 8,724,427 | | 8,152,068 |
Other | | — | | 138 | | — | | — |
| | | | | | | | |
Total | | 2,885,232 | | 644,805 | | 17,098,479 | | 21,559,300 |
| | | | | | | | |
Write-offs during the period amounted to ThCh$ 266,406.
| | At December 31, | |
| | Short – term | | Long – term | |
| | 2007 | | 2006 | | 2007 | | 2006 | |
| | ThCh$ | | ThCh$ | | ThCh$ | | ThCh$ | |
| | | | | | | | | |
Staff severance indemnities and retention plan | | 708,748 | | 681,047 | | 6,425,121 | | 6,007,790 | |
Contingency provisions | | 47,660 | | 86,291 | | 2,480,194 | | 2,985,941 | |
Provision for Brazilian banking taxes (1) | | 2,718,815 | | 2,331,401 | | 8,022,638 | | 9,370,035 | |
Total | | 3,475,223 | | 3,098,739 | | 16,927,953 | | 18,363,766 | |
F - 28F-30
(1) | In 1999 our subsidiary Rio Janeiro Refrescos Ltda. brought a tax lawsuit against the Brazilian Treasury for alleged unconstitutionality in the collection of the tax called CPMF (Contribuição Provisória sobre Movimentação Financeira) on the debits and credits to bank current accounts. While the subsidiary obtained a provisional suspension of said payments from the Courts of Justice, the corresponding tax obligation was still provisioned. In November 2006, the Courts of Justice ruled the constitutionality of the referred tax and Refrescos came to an agreement with the Brazilian Treasury to divide payments in 60 installments. Accordingly, as of December 31, 2006, the portion payable during 2007 was reclassified in the short term. |
(1)In 1999, the Company’s subsidiary Rio Janeiro Refrescos Ltda. brought a tax lawsuit against the Brazilian Treasury for alleged unconstitutionality in the collection of the tax called CPMF (Contribuição Provisória sobre Movimentação Financeira) on the debits and credits to bank current accounts. While the subsidiary obtained a provisional suspension of said payments from the Courts of Justice, the corresponding tax obligation was still provisioned. In November 2006, the Courts of Justice ruled the constitutionality of the referred tax and Refrescos came to an agreement with the Brazilian Treasury to divide payments in 60 installments.NOTE 19 - STAFF SEVERANCE INDEMNITIES AND RETENTION PLAN
Movements in the provision for staff severance indemnities and retention plan were as follows:
| | | | | | | | 2007 | | 2006 | | 2005 | |
| | | 2006 | | 2005 | | 2004 | | | ThCh$ | | ThCh$ | | ThCh$ | |
| | | ThCh$ | | ThCh$ | | ThCh$ | | | | | | | | |
Beginning balance | | 5,469,632 | | | 2,774,489 | | | 2,614,867 | | | 6,227,968 | | 5,874,385 | | 2,979,801 | |
Provision for the period | | 932,150 | | | 3,051,022 | | | 501,519 | | | 1,074,404 | | 1,001,129 | | 3,276,798 | |
Payments | | (173,815 | ) | | (241,016 | ) | | (242,232 | ) | | (168,503 | ) | (186,677 | ) | (258,851 | ) |
| | | | | | | | | | |
Ending balance | | 6,227,967 | | | 5,584,495 | | | 2,874,154 | | | 7,133,869 | | 6,688,837 | | 5,997,748 | |
| | | | | | | | | | |
NOTE 20 - OTHER LONG-TERM LIABILITIES
Other long – term liabilities at each year-end consisted of the following:
| | At December 31, | |
| | 2007 | | 2006 | |
| | ThCh$ | | ThCh$ | |
| | | | | |
Deposits for containers | | 9,181,721 | | 9,345,222 | |
Other | | 3,082,965 | | 1,475,020 | |
Total | | 12,264,686 | | 10,820,242 | |
F-31
NOTE 2021 - MINORITY INTEREST
| | | | | | | | For the year ended December 31, | |
| | | For the year ended December 31, | | | 2007 | | 2006 | | 2005 | |
| | | 2006 | | 2005 | | 2004 | | | ThCh$ | | ThCh$ | | ThCh$ | |
| | | ThCh$ | | ThCh$ | | ThCh$ | | | | | | | | |
Composition of Minority interest: | | | | | | | | | | | | | |
| | | | | | | | |
Vital Aguas S.A. | | 1,150,866 | | | 1,123,015 | | | — | | | 1,278,073 | | 1,236,030 | | 1,206,118 | |
Embotelladora del Atlántico S.A. | | 19,980 | | | 17,924 | | | — | | | 9,055 | | 21,458 | | 19,250 | |
Andina Inversiones Societarias S.A. | | 37 | | | 58 | | | 54,878 | | | 16 | | 40 | | 62 | |
| | | | | | | | | | |
Total | | 1,170,883 | | | 1,140,997 | | | 54,878 | | | 1,287,144 | | 1,257,528 | | 1,225,430 | |
| | | | | | | | | | |
Composition of Income attributable to minority interest: | | | | | | | |
Vital Aguas S.A. | | (27,850 | ) | | 13,917 | | | — | | |
Embotelladora del Atlántico S.A. | | (1,744 | ) | | (1,489 | ) | | — | | |
Andina Inversiones Societarias S.A. | | (3 | ) | | (2 | ) | | (2,832 | ) | |
| | | | | | | | | | |
Total | | (29,597 | ) | | 12,426 | | | (2,832 | ) | |
| | | | | | | | | | |
F - 29
Composition of Income attributable to minority interest: | | | | | | | |
| | | | | | | |
Vital Aguas S.A. | | (42,044 | ) | (29,911 | ) | 14,947 | |
Embotelladora del Atlántico S.A. | | (751 | ) | (1,873 | ) | (1,599 | ) |
Andina Inversiones Societarias S.A. | | (6 | ) | (3 | ) | (2 | ) |
Total. | | (42,801 | ) | (31,787 | ) | 13,346 | |
F-32
NOTE 2122 - SHAREHOLDERS’ EQUITY
a)The movements in shareholders’ equity of the Company during each of the three years ended December 31, 2007 were as follows:
a) | The movements in shareholders’ equity of the Company during each of the three years ended December 31, 2006 were as follows: |
| | Paid-in
capital | | Other
reserves | | Retained
earnings
from
prior years | | Net income
for the
year | | Interim
dividends | | Total | |
| | ThCh$ | | ThCh$ | | ThCh$ | | ThCh$ | | ThCh$ | | ThCh$ | |
| | | | | | | | | | | | | |
At January 1, 2005 | | 191,027,986 | | 14,574,144 | | 56,671,256 | | 40,158,726 | | (11,583,482 | ) | 290,848,630 | |
Prior year income allocation | | — | | — | | 28,575,244 | | (40,158,726 | ) | 11,583,482 | | — | |
Dividends paid | | — | | — | | (59,711,964 | ) | — | | (11,495,351 | ) | (71,207,315 | ) |
Price-level restatement of equity | | 6,877,008 | | 524,669 | | 799,819 | | — | | (145,608 | ) | 8,055,888 | |
Cumulative translation adjustment of foreign investments | | — | | (15,299,958 | ) | — | | — | | — | | (15,299,958 | ) |
Net income for the year | | — | | — | | — | | 56,039,346 | | — | | 56,039,346 | |
At December 31, 2005 | | 197,904,994 | | (201,145 | ) | 26,334,355 | | 56,039,346 | | (11,640,959 | ) | 268,436,591 | |
| | | | | | | | | | | | | |
Balance at December 31, 2005 restated in constant Chilean pesos of December 31, 2007 | | 217,013,513 | | (220,566 | ) | 28,877,042 | | 61,450,170 | | (12,764,940 | ) | 294,355,219 | |
| | | | | | | | | | | | | |
At January 1, 2006 | | 197,904,994 | | (201,145 | ) | 26,334,355 | | 56,039,346 | | (11,640,959 | ) | 268,436,591 | |
Prior year income allocation | | — | | — | | 44,398,387 | | (56,039,346 | ) | 11,640,959 | | — | |
Dividends paid | | — | | — | | (61,053,087 | ) | — | | (13,411,243 | ) | (74,464,330 | ) |
Price-level restatement of equity | | 4,156,005 | | (4,224 | ) | 325,381 | | — | | (26,822 | ) | 4,450,340 | |
Cumulative translation adjustment of foreign investments | | — | | 1,955,644 | | — | | — | | — | | 1,955,644 | |
Net income for the year | | — | | — | | — | | 74,355,094 | | — | | 74,355,094 | |
At December 31, 2006 | | 202,060,999 | | 1,750,275 | | 10,005,036 | | 74,355,094 | | (13,438,065 | ) | 274,733,339 | |
| | | | | | | | | | | | | |
Balance at December 31, 2006 restated in constant Chilean pesos of December 31, 2007 | | 217,013,513 | | 1,879,795 | | 10,745,409 | | 79,857,372 | | (14,432,482 | ) | 295,063,607 | |
| | | | | | | | | | | | | |
At January 1, 2007 | | 202,060,999 | | 1,750,275 | | 10,005,036 | | 74,355,094 | | (13,438,065 | ) | 274,733,339 | |
Prior year income allocation | | — | | — | | 60,917,029 | | (74,355,094 | ) | 13,438,065 | | — | |
Dividends paid | | — | | — | | (60,917,378 | ) | — | | (16,764,054 | ) | (77,681,432 | ) |
Price-level restatement of equity | | 14,952,514 | | 129,522 | | 1,166,767 | | — | | (430,277 | ) | 15,818,526 | |
Cumulative translation adjustment of foreign investments | | — | | (13,323,239 | ) | — | | — | | — | | (13,323,239 | ) |
Net income for the year | | — | | — | | — | | 81,601,944 | | — | | 81,601,944 | |
At December 31, 2007 | | 217,013,513 | | (11,443,442 | ) | 11,171,454 | | 81,601,944 | | (17,194,331 | ) | 281,149,138 | |
| | | | | | | | | | | | | | | | | |
| | | Paid-in capital | | Other
reserves | | | Retained earnings from prior years | | | Net income
for the year | | | Interim dividends | | | Total | |
| | | ThCh$ | | ThCh$ | | | ThCh$ | | | ThCh$ | | | ThCh$ | | | ThCh$ | |
At January 1, 2004 | | 186,368,767 | | 25,478,595 | | | 86,808,880 | | | 15,754,549 | | | (11,476,192 | ) | | 302,934,599 | |
Prior year income allocation | | — | | — | | | 4,278,357 | | | (15,754,549 | ) | | 11,476,192 | | | — | |
Dividends paid | | — | | — | | | (35,763,316 | ) | | — | | | (11,495,351 | ) | | (47,258,667 | ) |
Price-level restatement of equity | | 4,659,219 | | 636,965 | | | 1,347,335 | | | — | | | (88,131 | ) | | 6,555,388 | |
Cumulative translation adjustment of foreign investments | | — | | (11,541,416 | ) | | — | | | — | | | — | | | (11,541,416 | ) |
Net income for the year | | — | | — | | | — | | | 40,158,726 | | | — | | | 40,158,726 | |
| | | | | | | | | | | | | | | | | |
At December 31, 2004 | | 191,027,986 | | 14,574,144 | | | 56,671,256 | | | 40,158,726 | | | (11,583,482 | ) | | 290,848,630 | |
| | | | | | | | | | | | | | | | | |
Balance at December 31, 2004 restated in constant Chilean pesos of December 31, 2006 | | 202,060,999 | | 15,415,888 | | | 59,944,361 | | | 42,478,133 | | | (12,252,498 | ) | | 307,646,883 | |
| | | | | | | | | | | | | | | | | |
At January 1, 2005 | | 191,027,986 | | 14,574,144 | | | 56,671,256 | | | 40,158,726 | | | (11,583,482 | ) | | 290,848,630 | |
Prior year income allocation | | — | | — | | | 28,575,244 | | | (40,158,726 | ) | | 11,583,482 | | | — | |
Dividends paid | | — | | — | | | (59,711,964 | ) | | — | | | (11,495,351 | ) | | (71,207,315 | ) |
Price-level restatement of equity | | 6,877,008 | | 524,669 | | | 799,819 | | | — | | | (145,608 | ) | | 8,055,888 | |
Cumulative translation adjustment of foreign investments | | — | | (15,299,958 | ) | | — | | | — | | | — | | | (15,299,958 | ) |
Net income for the year | | — | | — | | | — | | | 56,039,346 | | | — | | | 56,039,346 | |
| | | | | | | | | | | | | | | | | |
At December 31, 2005 | | 197,904,994 | | (201,145 | ) | | 26,334,355 | | | 56,039,346 | | | (11,640,959 | ) | | 268,436,591 | |
| | | | | | | | | | | | | | | | | |
Balance at December 31, 2005 restated in constant Chilean pesos of December 31, 2006 | | 202,060,999 | | (205,369 | ) | | 26,887,376 | | | 57,216,172 | | | (11,885,419 | ) | | 274,073,759 | |
| | | | | | | | | | | | | | | | | |
At January 1, 2006 | | 197,904,994 | | (201,145 | ) | | 26,334,355 | | | 56,039,346 | | | (11,640,959 | ) | | 268,436,591 | |
Prior year income allocation | | — | | — | | | 44,398,387 | | | (56,039,346 | ) | | 11,640,959 | | | — | |
Dividends paid | | — | | — | | | (61,053,087 | ) | | — | | | (13,411,243 | ) | | (74,464,330 | ) |
Price-level restatement of equity | | 4,156,005 | | (4,224 | ) | | 325,381 | | | — | | | (26,822 | ) | | 4,450,340 | |
Cumulative translation adjustment of foreign investments | | — | | 1,955,644 | | | — | | | — | | | — | | | 1,955,644 | |
Net income for the year | | — | | — | | | — | | | 74,355,094 | | | — | | | 74,355,094 | |
| | | | | | | | | | | | | | | | | |
At December 31, 2006 | | 202,060,999 | | 1,750,275 | | | 10,005,036 | | | 74,355,094 | | | (13,438,065 | ) | | 274,733,339 | |
| | | | | | | | | | | | | | | | | |
b)Number of shares:
Series | | Subscribed
shares | | Paid-in
shares | | Shares with
voting rights | |
| | | | | | | |
A | | 380,137,271 | | 380,137,271 | | 380,137,271 | |
B | | 380,137,271 | | 380,137,271 | | 380,137,271 | |
| | | | | | |
Series | | Subscribed shares | | Paid-in
shares | | Shares with voting rights |
A | | 380,137,271 | | 380,137,271 | | 380,137,271 |
B | | 380,137,271 | | 380,137,271 | | 380,137,271 |
The preferential rights of each series of shares are as follows:
·Series A:The right to elect 6 of the 7 directors and their respective alternates.
·Series B:The right to receive 10% more of all dividend distributions than Series A shareholders and to elect 1 of the 7 directors.
F - 30F-33
| | | | |
Series | | Subscribed capital | | Paid-in capital |
| | | ThCh$ | | ThCh$ |
A | | 101,030,500 | | 101,030,500 |
B | | 101,030,499 | | 101,030,499 |
| | | | |
Total | | 202,060,999 | | 202,060,999 |
| | | | |
b)Capital:
Series | | Subscribed
capital | | Paid-in
capital | |
| | ThCh$ | | ThCh$ | |
| | | | | |
A | | 108,506,756 | | 108,506,756 | |
B | | 108,506,757 | | 108,506,757 | |
| | | | | |
Total | | 217,013,513 | | 217,013,513 | |
d)Other reserves:
Other reserves at each year-end were as follows:
| | | | | | | | 2007 | | 2006 | | 2005 | |
| | | 2006 | | 2005 | | 2004 | | ThCh$ | | ThCh$ | | ThCh$ | |
| | | ThCh$ | | ThCh$ | | ThCh$ | | | | | | | |
Reserve for cumulative translation adjustments (1) | | 741,240 | | (1,214,405 | ) | | 14,406,852 | | (12,527,145 | ) | 796,092 | | (1,304,271 | ) |
Reserve for technical reappraisal of property, plant and equipment | | 169,987 | | 169,987 | | | 169,987 | | 67,287 | | 182,566 | | 182,566 | |
Other reserves | | 839,048 | | 839,049 | | | 839,049 | | 1,016,416 | | 901,137 | | 901,139 | |
| | | | | | | | | | | | | | |
Total | | 1,750,275 | | (205,369 | ) | | 15,415,888 | | (11,443,442 | ) | 1,879,795 | | (220,566 | ) |
| | | | | | | | |
(1) | The reserve for cumulative translation adjustments complies with Technical Bulletin No. 64 of the Chilean Institute of Accountants and Official letter No. 5,294 issued by the SVS. |
(1)The reserve for cumulative translation adjustments complies with Technical Bulletin No. 64 of the Chilean Institute of Accountants and Official letter No. 5,294 issued by the SVS.
The composition of this reserve was as follows:
Subsidiary | | | Balance at
January 1, 2007 | | Foreign exchange
losses generated
during the year | | Release /
transfers of
reserve(*) | | Balance at
December 31,
2007 | |
| | | | | | | | | | ThCh$ | | ThCh$ | | ThCh$ | | ThCh$ | |
Subsidiary | | Balance at January 1,
2006 | | Foreign exchange gains generated during the year | | Release / transfers of reserve(*) | | Balance at December 31, 2006 | | |
| | | ThCh$ | | ThCh$ | | ThCh$ | | ThCh$ | | | | | | | | | | |
Rio de Janeiro Refrescos Ltda | | (2,276,984 | ) | | 1,360,918 | | 133,499 | | (782,567 | ) | | (840,476 | ) | (9,366,852 | ) | 2,632,526 | | (7,574,802 | ) |
Embotelladora del Atlántico S.A. | | 1,062,579 | | | 461,228 | | — | | 1,523,807 | | | 1,636,568 | | (7,533,072 | ) | 944,161 | | (4,952,343 | ) |
| | | | | | | | | | | | | | | | | | | |
Total | | (1,214,405 | ) | | 1,822,146 | | 133,499 | | 741,240 | | | 796,092 | | (16,899,924 | ) | 3,576,687 | | (12,527,145 | ) |
| | | | | | | | | | | |
(*) | In March and June 2006, the Company received dividends paid by its subsidiary Rio de Janeiro Refrescos Ltda. for a total amount of ThUS$ 34,907. The dividends distribution triggered a pro-rata recognition in income of the cumulative translation reserve of ThCh$ 133,499. |
(*)During 2007, the Company received dividend payments from its subsidiary Rio de Janeiro Refrescos Ltda. for ThCh$31,040,621. In 2007 it also received capital remittances from Embotelladora del Atlántico S.A. for ThCh$26,657,617. The dividends distribution and the capital remittances triggered a pro-rata recognition in income of the cumulative translation reserve.
| | | | | | | | | | |
Subsidiary | | Balance at January 1,
2005 | | Foreign exchange
gains generated
during the year | | | Release / transfers of reserve | | Balance at
December 31,
2005 | |
| | | ThCh$ | | ThCh$ | | | ThCh$ | | ThCh$ | |
Rio de Janeiro Refrescos Ltda | | 8,143,077 | | (10,420,061 | ) | | — | | (2,276,984 | ) |
Embotelladora del Atlántico S.A. | | 6,263,775 | | (5,201,196 | ) | | — | | 1,062,579 | |
| | | | | | | | | | |
Total | | 14,406,852 | | (15,621,257 | ) | | — | | (1,214,405 | ) |
| | | | | | | | | | |
F - 31F-34
Subsidiary | | Balance at
January 1, 2006 | | Foreign exchange
gains generated
during the year | | Release /
transfers of
reserve (*) | | Balance at
December 31,
2006 | |
| | ThCh$ | | ThCh$ | | ThCh$ | | ThCh$ | |
| | | | | | | | | |
Rio de Janeiro Refrescos Ltda | | (2,445,480 | ) | 1,461,626 | | 143,378 | | (840,476 | ) |
Embotelladora del Atlántico S.A. | | 1,141,209 | | 495,359 | | — | | 1,636,568 | |
| | | | | | | | | |
Total | | (1,304,271 | ) | 1,956,985 | | 143,378 | | 796,092 | |
(*)During 2006, the Company received dividend payments from its subsidiary Rio de Janeiro Refrescos Ltda. for ThCh$18,535,847. The dividends distribution triggered a pro-rata recognition in income of the cumulative translation reserve.
Subsidiary | | Balance at
January 1, 2005 | | Foreign exchange
losses generated
during the year | | Release /
transfers of
reserve | | Balance at
December 31,
2005 | |
| | ThCh$ | | ThCh$ | | ThCh$ | | ThCh$ | |
| | | | | | | | | |
Rio de Janeiro Refrescos Ltda | | 8,745,665 | | (11,191,145 | ) | — | | (2,445,480 | ) |
Embotelladora del Atlántico S.A. | | 6,727,294 | | (5,586,085 | ) | — | | 1,141,209 | |
| | | | | | | | | |
Total | | 15,472,959 | | (16,777,230 | ) | — | | (1,304,271 | ) |
F-35
| | | | | | | | | |
Subsidiary | | Balance at January 1,
2004 | | Foreign exchange
gains generated
during the year | | | Release / transfers of reserve | | Balance at
December 31,
2004 |
| | | ThCh$ | | ThCh$ | | | ThCh$ | | ThCh$ |
Rio de Janeiro Refrescos Ltda | | 16,228,533 | | (8,085,456 | ) | | — | | 8,143,077 |
Embotelladora del Atlántico S.A. | | 10,386,321 | | (4,122,546 | ) | | — | | 6,263,775 |
| | | | | | | | | |
Total | | 26,614,854 | | (12,208,002 | ) | | — | | 14,406,852 |
| | | | | | | | | |
NOTE 2223 - OTHER NON-OPERATING INCOME AND EXPENSES
Other non-operating income during each year was as follows:
| | | | For the year ended December 31, | | For the year ended December 31, | |
| | | 2006 | | 2005 | | 2004 | | 2007 | | 2006 | | 2005 | |
| | | ThCh$ | | ThCh$ | | ThCh$ | | ThCh$ | | ThCh$ | | ThCh$ | |
Reversal of PIS - COFINS tax provision (1) | | 4,179,585 | | — | | — | | — | | 4,488,874 | | — | |
Tax recoveries - Pis Cofins | | | 1,371,898 | | — | | — | |
Recovery of prior year taxes | | | 2,712,775 | | — | | — | |
Reversal of impairment loss on fixed asset (2) | | | 4,596,549 | | — | | — | |
Adjustments to guarantees received for containers | | 490,075 | | — | | — | | 351,022 | | 526,341 | | — | |
Gain on sale of Vital Aguas S.A.’s shares | | — | | 3,972,048 | | — | | — | | — | | 4,265,980 | |
Gain on sale of plant, property and equipment | | — | | 273,459 | | — | | — | | — | | 293,695 | |
Lease of property (offices) | | — | | — | | 29,726 | |
Other income | | 621,986 | | 251,266 | | 370,426 | | 299,723 | | 668,013 | | 269,859 | |
| | | | | | | |
Subtotal | | 5,291,646 | | 4,496,773 | | 400,152 | | 9,331,967 | | 5,683,228 | | 4,829,534 | |
Translation adjustment (2)(3) | | 403,979 | | 2,969,786 | | 465,422 | | 2,798,216 | | 433,873 | | 3,189,550 | |
| | | | | | | | | | | | | |
Total | | 5,695,625 | | 7,466,559 | | 865,574 | | 12,130,183 | | 6,117,101 | | 8,019,084 | |
| | | | | | | |
Other non-operating expenses during each year were as follows:
| | | | | | | | | |
| | | For the year ended December 31, | |
| | | 2006 | | | 2005 | | | 2004 | |
| | | ThCh$ | | | ThCh$ | | | ThCh$ | |
Obsolescence and write-offs of property, plant and equipment | | (3,714,979 | ) | | (1,136,813 | ) | | (130,828 | ) |
Loss on sale of property, plant and equipment | | (2,128,203 | ) | | — | | | (297,633 | ) |
Provision for labor, tax and commercial lawsuits | | (747,737 | ) | | (555,882 | ) | | (1,752,974 | ) |
Lawsuit fees | | (437,859 | ) | | (513,467 | ) | | — | |
Cumulative translation reserve realized (3) | | (133,499 | ) | | — | | | — | |
Provision for equity investee Centralli Refrigerantes S.A. | | (64,458 | ) | | (62,094 | ) | | (83,776 | ) |
Provision for PIS - COFINS | | — | | | (2,328,102 | ) | | — | |
Provision for staff severance indemnities and retention plan | | — | | | (2,454,488 | ) | | (2,434 | ) |
Provision for property, plant and equipment Itaoca | | — | | | — | | | (3,058,618 | ) |
Provision for investment in Transora | | — | | | — | | | (648,580 | ) |
Other expenses | | (157,177 | ) | | (849,787 | ) | | (554,020 | ) |
| | | | | | | | | |
Total | | (7,383,912 | ) | | (7,900,633 | ) | | (6,528,863 | ) |
| | | | | | | | | |
(1) | The Company’s subsidiary Rio de Janeiro Refrescos Ltda. contested in the courts the increase in the calculation basis of Social Integration Program – (“PIS”) and Social Contribution on Revenues (“COFINS”). As of December 31, 2005, the Company maintained a provision based on the adjusted amounts due for these concepts. The final sentence for this case was passed on November 6, 2006 by the Supreme Court of last resort and was favorable to the Company. Based on this decision, the Company reversed the provision recorded of ThCh$ 4,179,585. |
| | For the year ended December 31, | |
| | 2007 | | 2006 | | 2005 | |
| | ThCh$ | | ThCh$ | | ThCh$ | |
| | | | | | | |
Obsolescence and write-offs of property, plant and equipment | | (1,025,649 | ) | (3,989,887 | ) | (1,220,937 | ) |
Loss on sale of property, plant and equipment | | (146,702 | ) | (2,285,690 | ) | — | |
Provision for labor, tax and commercial lawsuits | | (703,079 | ) | (803,070 | ) | (597,017 | ) |
Lawsuit fees | | — | | (470,261 | ) | (551,464 | ) |
Cumulative translation reserve realized (4) | | (3,580,267 | ) | (143,378 | ) | — | |
Provision for equity investee Centralli Refrigerantes S.A. | | — | | (69,228 | ) | (66,689 | ) |
Provision for PIS - COFINS | | — | | — | | (2,500,382 | ) |
Provision for staff severance indemnities and retention plan | | — | | — | | (2,636,120 | ) |
Other expenses | | (1,079,196 | ) | (168,807 | ) | (912,671 | ) |
| | | | | | | |
Total | | (6,534,893 | ) | (7,930,321 | ) | (8,485,280 | ) |
F - 32F-36
(2) | Refers to the effects of the translation of the financial statements corresponding to investment in foreign companies (translation of local currency to US dollars), in accordance with Technical Bulletin No. 64 issued by the Chilean Institute of Accountants, which are recorded on the consolidated statements of income under Other non-operating income or expenses, as appropriate. |
(3) | In March and June 2006, the Company received dividends paid by its subsidiary Rio de Janeiro Refrescos Ltda. for a total amount of ThUS$ 34,907. The dividends distribution triggered a pro-rata recognition in income of the cumulative translation reserve of ThCh$ 133,499. |
(1)The Company’s subsidiary Rio de Janeiro Refrescos Ltda. contested in the courts the increase in the calculation basis of Social Integration Program – (“PIS”) and Social Contribution on Revenues (“COFINS”). The final sentence for this case was passed on November 6, 2006 by the Supreme Court of last resort and was favorable to the Company. Based on this decision, the Company reversed the provision recorded.
(2)During 2007, the Company evaluated the estimated future cash flows expected from its plants. As a result of the evaluation, the Company concluded that a previous impairment provision on some of its plants was no longer required. Accordingly, such provision was reversed with effect in earnings.
(3)Refers to the effects of the translation of the financial statements corresponding to investment in foreign companies (translation of local currency to US dollars), in accordance with Technical Bulletin No. 64 issued by the Chilean Institute of Accountants, which are recorded on the consolidated statements of income under Other non-operating income or expenses, as appropriate.
(4)During 2007 and 2006, the Company received dividend payments from its subsidiary Rio de Janeiro Refrescos Ltda. for ThCh$31,040,621 and ThCh$18,535,847 respectively. In 2007 it also received capital remittances from Embotelladora del Atlántico S.A. for ThCh$26,657,617. The dividends distribution and the capital remittances triggered a pro-rata recognition in income of the cumulative translation reserve.
NOTE 2324 - FOREIGN CURRENCY
At December 31, 20062007 and 2005,2006, the Company had the following assets and liabilities denominated or measured in U.S. dollars, Brazilian reals and Argentine pesos, and Euros, which have been translated into Chilean pesos in accordance with Note 1 d) and 1t)1 t):
| | | | 2006 | | 2005 | | 2007 | | 2006 | |
| | US dollars | | Brazilian
reals | | Argentine pesos | | Euros | | US dollars | | Brazilian
reals | | Argentine pesos | | Euros | | US
dollars | | Brazilian
reals | | Argentine
pesos | | US
dollars | | Brazilian
reals | | Argentine
pesos | |
| | | (in thousands) | | (in thousands) | | (in thousands) | | (in thousands) | |
| Assets | | | | | | | | | | | | | | | | | | | | | | | | | | | | | |
Cash | | 1,040 | | 37,293 | | 7,728 | | | — | | 5,554 | | 20,637 | | 18,029 | | | — | | 5,113 | | 45,492 | | 12,361 | | 1,040 | | 37,293 | | 7,728 | |
Time deposits | | 6,277 | | 11,198 | | 6,000 | | | — | | 41,479 | | 19,979 | | — | | | — | | 36 | | 353 | | — | | 6,277 | | 11,198 | | 6,000 | |
Marketable securities (net) | | 38,280 | | — | | — | | | — | | 7,791 | | 3,823 | | — | | | — | | 88,027 | | — | | 11,391 | | 38,280 | | — | | — | |
Receivables (net) | | 4,496 | | 105,879 | | 19,891 | | | — | | 5,138 | | 87,360 | | 22,032 | | | — | | 253 | | 122,784 | | 40,789 | | 4,496 | | 105,879 | | 19,891 | |
Notes and receivables from related companies | | — | | — | | — | | | — | | — | | 105 | | — | | | — | |
Inventories | | 2,649 | | 40,625 | | 34,144 | | | — | | 6,095 | | 24,588 | | 18,577 | | | — | | 2,054 | | 44,980 | | 34,841 | | 2,649 | | 40,625 | | 34,144 | |
Other current assets | | 28,010 | | 31,721 | | 11,658 | | | — | | 7,594 | | 42,618 | | 15,060 | | | — | | 36,196 | | 53,677 | | 8,286 | | 28,010 | | 31,721 | | 11,658 | |
Property, plant and equipment | | 151,114 | | — | | — | | | — | | 147,031 | | — | | — | | | — | | 164,178 | | — | | — | | 151,114 | | — | | — | |
Investments in unconsolidated affiliates | | 2,227 | | 6,242 | | — | | | — | | 2,057 | | 5,853 | | — | | | — | | — | | 18,199 | | — | | 2,227 | | 6,242 | | — | |
Investments in other companies | | 25 | | — | | — | | | — | | 25 | | — | | — | | | — | | 178 | | — | | — | | 25 | | — | | — | |
Goodwill (net) | | 126,519 | | — | | — | | | — | | 138,044 | | — | | — | | | — | | 112,655 | | — | | — | | 126,519 | | — | | — | |
Other long-term assets | | 190,270 | | 25,692 | | 23,007 | | | — | | 231,126 | | 23,570 | | 17,945 | | | 15,114 | | 1,086 | | 53,173 | | 18,887 | | 190,270 | | 25,692 | | 23,007 | |
| | | | | | | | | | | | | | | | | | | |
Total assets | | 550,907 | | 258,650 | | 102,428 | | | — | | 591,934 | | 228,533 | | 91,643 | | | 15,114 | | 409,776 | | 338,658 | | 126,555 | | 550,907 | | 258,650 | | 102,428 | |
| | | | | | | | | | | | | | | | | | | |
| | | | 2006 | | 2005 | |
| | US Dollars | | Brazilian
reals | | Argentine pesos | | Euros | | US dollars | | Brazilian
reals | | Argentine pesos | | Euros | |
| | | (in thousands) | | (in thousands) | |
| Liabilities | | | | | | | | | | | | | | | | | |
Obligations with banks and financial institutions | | — | | 13,441 | | — | | | — | | 40,998 | | 4,221 | | 32,524 | | | — | |
Accounts payable | | 3,219 | | 89,122 | | 60,785 | | | — | | 4,937 | | 62,857 | | 41,142 | | | — | |
Other accrued liabilities | | — | | 48,254 | | 9,716 | | | — | | — | | 64,986 | | 10,367 | | | — | |
Bonds payable | | 36,714 | | — | | — | | | — | | 36,714 | | — | | — | | | — | |
Other | | 872 | | 37,015 | | 43,490 | | | — | | — | | 54,018 | | 42,719 | | | — | |
| | | | | | | | | | | | | | | | | | | |
Total liabilities | | 40,805 | | 187,832 | | 113,991 | | | — | | 82,649 | | 186,082 | | 126,752 | | | — | |
| | | | | | | | | | | | | | | | | | | |
Total net assets (liabilities) | | 510,102 | | 70,818 | | (11,563 | ) | | — | | 509,285 | | 42,451 | | (35,109 | ) | | 15,114 | |
| | | | | | | | | | | | | | | | | | | |
F - 33F-37
| | 2007 | | 2006 | |
| | US
Dollars | | Brazilian
Reals | | Argentine
pesos | | US
dollars | | Brazilian
reals | | Argentine
pesos | |
| | (in thousands) | | (in thousands) | |
Liabilities | | | | | | | | | | | | | |
Obligations with banks and financial institutions | | — | | 6,676 | | 10,596 | | — | | 13,441 | | — | |
Accounts payable | | 5,322 | | 100,034 | | 94,079 | | 3,219 | | 89,122 | | 60,785 | |
Other accrued liabilities | | — | | 41,647 | | 9,752 | | — | | 48,254 | | 9,716 | |
Bonds payable | | 2,038 | | — | | — | | 36,714 | | — | | — | |
Other | | — | | 108,438 | | 63,922 | | 872 | | 37,015 | | 43,490 | |
Total liabilities | | 7,360 | | 256,795 | | 178,349 | | 40,805 | | 187,832 | | 113,991 | |
Total net assets (liabilities) | | 402,416 | | 81,863 | | (51,794 | ) | 510,102 | | 70,818 | | (11,563 | ) |
NOTE 2425 - CONSOLIDATED STATEMENT OF CASH FLOWS
For the projection of future cash flows, there are no transactions or events to consider which have not been revealed in these financial statements and accompanying notes.
The following are investing and financing activities during the period that affect recognized assets or liabilities but that do not result in cash receipts or cash payments:
| | | | For the years ended December 31, | | For the years ended December 31, | |
| | | 2006 | | 2005 | | 2004 | | 2007 | | 2006 | | 2005 | |
| | | ThCh$ | | ThCh$ | | ThCh$ | | ThCh$ | | ThCh$ | | ThCh$ | |
Investing activities: | | | | | | | | | | | | | |
Fixed assets additions | | 5,001,591 | | 3,040,122 | | 3,085,382 | | 5,982,941 | | 5,371,709 | | 3,265,091 | |
Sale of property, plant and equipment | | 13,378 | | 67,294 | | 44,318 | | 3,015 | | 14,368 | | 72,274 | |
| | | | | | | | |
Financing activities: | | | | | | | | | | | | | |
Dividend payment | | 4,470,414 | | 3,912,251 | | 4,053,092 | | 5,588,018 | | 4,801,225 | | 4,201,758 | |
NOTE 2526 - DERIVATIVE CONTRACTS
For the year ended December 31, 2006,2007, the Company recorded a net gain from derivative instruments of ThCh$ 1,068,97913,383,114 as Financial income in the consolidated statements of income (ThCh$ 9,440,0061,148,083 for the year ended December 31, 20052006 and ThCh$ 10,010,56510,138,566 for the year ended December 31, 2004)2005).
The Company had the following derivative contracts at December 31, 2007 (individual contracts are aggregated and presented according to the quarter they will mature):
| | | | | | Net carrying | | Deferred | |
Derivative | | Maturity | | Description | | values | | gain/(loss) | |
| | | | | | ThCh$ | | ThCh$ | |
Cross-Currency Swap | | I Quarter 2008 | | Currency exchange US$/UF | | 4,741,627 | | — | |
Cross-Currency Swap | | II Quarter 2008 | | Currency exchange US$/UF | | 4,778,401 | | — | |
Cross-Currency Swap | | III Quarter 2008 | | Currency exchange US$/UF | | 7,874,837 | | 13,042 | |
Forward contract | | I Quarter 2008 | | Currency exchange US$ | | — | | (89,507 | ) |
Forward contract | | II Quarter 2008 | | Currency exchange US$ | | — | | (131,057 | ) |
Forward contract | | III Quarter 2008 | | Currency exchange US$ | | — | | (19,765 | ) |
Forward contract | | IV Quarter 2008 | | Currency exchange US$ | | — | | (56,982 | ) |
Forward contract | | I Quarter 2009 | | Currency exchange US$ | | — | | (19,953 | ) |
Futures contract | | I Quarter 2008 | | Sugar sales | | 90,964 | | 140,019 | |
Total | | | | | | 17,485,829 | | (164,203 | ) |
F-38
As of December 31, 2007, total notional amounts for derivative contracts outstanding were:
Cross-currency swaps: | US$54,210,000 and UF 2,253,744 |
Forward contracts: | US$94,630,000 (Buy) and US$21,000,000 (Sell) |
Futures contracts: | 4,150 tons. |
The Company had the following derivative contracts at December 31, 2006 (individual contracts are aggregated and presented according to the quarter they will mature):
| | | | | | | | | | | | | | Net carrying | | Deferred | |
Derivative | | Maturity | | Description | | Net carrying
values | | Deferred
income/(loss) | | | Maturity | | Description | | values | | gain/(loss) | |
| | | | | | | ThCh$ | | ThCh$ | | | | | | | ThCh$ | | ThCh$ | |
Cross-Currency Swap | | I Quarter 2007 | | Currency exchange US$/UF | | 1,186,229 | | 5,493 | | | I Quarter 2007 | | Currency exchange US$/UF | | 1,274,010 | | 5,899 | |
Cross-Currency Swap | | III Quarter 2007 | | Currency exchange US$/UF | | 1,189,882 | | 112,721 | | | III Quarter 2007 | | Currency exchange US$/UF | | 1,277,933 | | 121,062 | |
Cross-Currency Swap | | IV Quarter 2007 | | Currency exchange US$/UF | | 9,347,546 | | 1,212,573 | | | IV Quarter 2007 | | Currency exchange US$/UF | | 10,039,264 | | 1,302,303 | |
Cross-Currency Swap | | I Quarter 2008 | | Currency exchange US$/UF | | 3,546,502 | | 436,531 | | | I Quarter 2008 | | Currency exchange US$/UF | | 3,808,943 | | 468,834 | |
Cross-Currency Swap | | II Quarter 2008 | | Currency exchange US$/UF | | 3,523,581 | | 570,262 | | | II Quarter 2008 | | Currency exchange US$/UF | | 3,784,326 | | 612,461 | |
Cross-Currency Swap | | III Quarter 2008 | | Currency exchange US$/UF | | 5,667,548 | | 748,739 | | | III Quarter 2008 | | Currency exchange US$/UF | | 6,086,947 | | 804,146 | |
Cross-Currency Swap | | I Quarter 2013 | | Currency exchange US$/UF | | 2,372,443 | | 885,903 | | | I Quarter 2013 | | Currency exchange US$/UF | | 2,548,004 | | 951,460 | |
Forward contract | | I Quarter 2007 | | Currency exchange US$ | | — | | (72,615 | ) | | I Quarter 2007 | | Currency exchange US$ | | — | | (77,988) | |
Forward contract | | II Quarter 2007 | | Currency exchange US$ | | — | | (62,539 | ) | | II Quarter 2007 | | Currency exchange US$ | | — | | (67,167) | |
Forward contract | | III Quarter 2007 | | Currency exchange US$ | | — | | 31,828 | | | III Quarter 2007 | | Currency exchange US$ | | — | | 34,183 | |
Forward contract | | IV Quarter 2007 | | Currency exchange US$ | | — | | 50,687 | | | IV Quarter 2007 | | Currency exchange US$ | | — | | 54,439 | |
Futures contract | | I Quarter 2007 | | Sugar sales | | — | | 36,309 | | | I Quarter 2007 | | Sugar sales | | — | | 38,996 | |
Futures contract | | II Quarter 2007 | | Sugar sales | | 24,984 | | 34,234 | | | II Quarter 2007 | | Sugar sales | | 26,833 | | 36,767 | |
Futures contract | | III Quarter 2007 | | Sugar sales | | 73,980 | | 32,901 | | | III Quarter 2007 | | Sugar sales | | 79,455 | | 35,336 | |
Futures contract | | IV Quarter 2007 | | Sugar sales | | 70,415 | | 56,296 | | | IV Quarter 2007 | | Sugar sales | | 75,626 | | 60,462 | |
Futures contract | | I Quarter 2008 | | Sugar sales | | 83,394 | | 67,526 | | | I Quarter 2008 | | Sugar sales | | 89,565 | | 72,523 | |
| | | | | | | | | | |
Total | | | | | | 27,086,504 | | 4,146,849 | | | | | | | 29,090,906 | | 4,453,716 | |
| | | | | | | | | | |
As of December 31, 2006, total notional amounts for derivative contracts outstanding were:
Cross-currency swaps: | | US$ 149,210,000 and UF 5,773,977 |
Cross-currency swaps: | | US$149,210,000 and UF5,773,977 |
Forward contracts: | | US$38,289,000 (Buy) and US$38,067,470 (Sell) |
Futures contracts: | | 17,150 tons. |
F - 34
The Company had the following derivative contracts at December 31, 2005 (individual contracts are aggregated and presented according to the quarter they will mature):
| | | | | | | | | |
Derivative | | Maturity | | Description | | Net carrying
values | | Deferred
income/(loss) | |
| | | | | | | ThCh$ | | ThCh$ | |
Cross-Currency Swap | | I Quarter 2006 | | Currency exchange US$/UF | | 1,244,257 | | 3,864 | |
Cross-Currency Swap | | I Quarter 2007 | | Currency exchange US$/UF | | 1,236,277 | | 147,347 | |
Cross-Currency Swap | | III Quarter 2007 | | Currency exchange US$/UF | | 1,240,109 | | 56,161 | |
Cross-Currency Swap | | IV Quarter 2007 | | Currency exchange US$/UF | | 10,075,300 | | 1,276,211 | |
Cross-Currency Swap | | I Quarter 2008 | | Currency exchange US$/UF | | 3,696,463 | | 348,583 | |
Cross-Currency Swap | | II Quarter 2008 | | Currency exchange US$/UF | | 3,673,356 | | 981,538 | |
Cross-Currency Swap | | III Quarter 2008 | | Currency exchange US$/UF | | 5,912,254 | | 912,814 | |
Cross-Currency Swap | | I Quarter 2013 | | Currency exchange US$/UF | | 2,473,226 | | 644,269 | |
Forward contract | | I Quarter 2006 | | Currency exchange US$ | | — | | (165,328 | ) |
Forward contract | | II Quarter 2006 | | Currency exchange US$ | | — | | (166,343 | ) |
Forward contract | | III Quarter 2006 | | Currency exchange US$ | | — | | (111,767 | ) |
Forward contract | | IV Quarter 2006 | | Currency exchange US$ | | — | | (70,858 | ) |
| | | | | | | | | |
Total | | | | | | 29,551,242 | | 3,856,491 | |
| | | | | | | | | |
As of December 31, 2005, total notional amounts for derivative contracts outstanding were:
| | |
Cross-currency swaps: | | US$154,210,000 and UF5,982,270 |
Forward contracts: | | US$65,296,000 (Buy) and US$21,650,000 (Sell) |
NOTE 2627 - COMMITMENTS AND CONTINGENCIES
a.Litigation and other legal actions:
a. | Litigation and other legal actions: |
There are various judicial actions and other out-of-court claims pending against the Company incidental to its business and operations. Management believes, based on the opinion of its legal counsel, that none of these proceedings will have a material adverse effect on the Company’s financial position or results of operations. Current lawsuits are described below:
1)
| The Chilean Internal Revenue Service commenced a penal lawsuit against the Company’s subsidiary Vital S.A. and against those ultimately responsible for the application of tax losses. Simultaneously with this claim, a tax lawsuit was filed by the Company for the recovery of income taxes and the application of accumulated tax losses. On May 10, 2007 the 33rd Criminal Court of Santiago dismissed the criminal action on the grounds that the investigated facts did not constitute criminal activity. In addition, during the month of May 2007, the aforementioned tax lawsuit was terminated and part of the accumulated tax losses were recognized, thus the pertinent rectifications of the income tax returns of Vital S.A. were made. The resolution of these lawsuits had a non-significant positive effect over the Company’s results for the year 2007.1)Embotelladora del Atlántico S.A. faces labor and other lawsuits. Accounting provisions at December 31, 2007 for any probable loss contingency arising from these lawsuits amounted to ThCh$ 1,538,745. Management believes, based on the opinion of its legal counsel, that these lawsuits will not materially affect the Company’s consolidated financial position, operating results or cash flows when resolved in the future.
|
2) | Embotelladora del Atlántico S.A. faces labor and other lawsuits. Accounting provisions at December 31, 2006 for any probable loss contingency arising from these lawsuits amounted to ThCh$ 1,689,281. Management believes, based on the opinion of its legal counsel, that these lawsuits will not materially affect the Company’s consolidated financial position, operating results or cash flows when resolved in the future. |
F - 35F-39
3) | Refrescos faces labor, tax and other legal proceedings. Accounting provisions at December 31, 2006 for any probable loss contingency arising from these lawsuits amounted to ThCh$ 1,120,467. Management believes, based on the opinion of its legal counsel, that these matters will not materially affect the Company’s consolidated financial position, operating results or cash flows when resolved in the future. |
4) | Andina faces labor, tax, commercial and other legal proceedings. Accounting provisions for any probable loss contingency arising from these lawsuits amounted to ThCh$ 50,804 at December 31, 2006. Management believes, based on the opinion of its legal counsel, that these matters will not materially affect the Company’s consolidated financial position, operating results or cash flows when resolved in the future. |
2)Refrescos faces labor, tax and other legal proceedings. Accounting provisions at December 31, 2007 for any probable loss contingency arising from these lawsuits amounted to ThCh$ 941,439. Management believes, based on the opinion of its legal counsel, that these matters will not materially affect the Company’s consolidated financial position, operating results or cash flows when resolved in the future.
3)Andina faces labor, tax, commercial and other legal proceedings. Accounting provisions for any probable loss contingency arising from these lawsuits amounted to ThCh$ 20,424 at December 31, 2007. Management believes, based on the opinion of its legal counsel, that these matters will not materially affect the Company’s consolidated financial position, operating results or cash flows when resolved in the future.
b.Restrictions
The issue and placement of bonds in the US market of US$ 350 million imposes certain restrictions on liens, sale and leaseback transactions, assets sales and subsidiary indebtedness and certain other conditions in the event of a merger or consolidation.
The bond issue and placement by Andina in the Chilean market in 2001 of UF 7,000,000 is subject to the following restrictions:
·Andina must maintain a leverage ratio, defined as total debt/consolidated equity lower than 1.20. For purposes of calculating the leverage ratio, total debt includes; (i) short-term bank liabilities, (ii) the current portion of long-term bank liabilities, (iii) short-term liabilities and promisory notes, (iv) the current portion of bonds payable, v) long-term bank liabilities, and (vi) long-term bonds payable. Consolidated equity means total shareholders’ equity plus minority interest.
·Andina must maintain consolidated assets free of any pledge, mortgage or other encumbrance for an amount equal to at least 1.30 times the consolidated liabilities that are not guaranteed by the investee.
·Andina must retain and, in no way, sell, assign or dispose of, to a third party, the geographical zone denominated “Region Metropolitana”, as a franchised territory in Chile of The Coca-Cola Company, for the preparation, production, sale and distribution of the products and brands in accordance with the Bottler Agreement with Andina, renewable from time to time.
·The Company must retain and, in no way, sell, assign or dispose of to a third party, the franchised territory in Argentina or Brazil by The Coca-Cola Company, for the preparation, production, sale, and distribution of the products and brands of The Coca-Cola Company, as long as the referred territory represents more than 40% of the Company’s consolidated operating cash flows.
F - 36F-40
At December 31, 20062007 and 20052006 the Company was in compliance with the aforementioned covenants.
c. | Direct guarantees and restricted assets |
c. Direct guarantees and restricted assets
Direct guarantees and restricted assets at December 31, 20062007 were as follows:
| | | | Debtor | | Assets involved | | Book | | Balances pending payment at year end | | Year of expiration December 31, | | Debtor | | Assets involved | | Book | | Balances pending
payment
at year end | | Year of
expiration
December 31, | |
Guarantee creditor | | Name | | Relation | | Guarantee | | Type | | Value | | 2006 | | 2005 | | 2009 | | Name | | Relation | | Guarantee | | Type | | Value | | 2007 | | 2006 | | 2008 | | 2009 | |
| | | | | | | | | | | ThCh$ | | ThCh$ | | ThCh$ | | ThCh$ | | | | | | | | | | ThCh$ | | ThCh$ | | ThCh$ | | ThCh$ | | ThCh$ | |
União Federal | | Rio de Janeiro Refrescos Ltda. | | Subsidiary | | Mortgage | | Real estate property | | — | | — | | 61,588 | | — | |
| | | | | | | | | | | | | | | | | | | | |
Estado Rio de Janeiro | | Rio de Janeiro Refrescos Ltda. | | Subsidiary | | Mortgage | | Real estate property | | 11,990,295 | | — | | — | | — | | Rio de Janeiro Refrescos Ltda. | | Subsidiary | | Mortgage | | Real estate property | | 11,190,568 | | 11,391,888 | | 10,860,605 | | — | | — | |
| | | | | | | | | | | | | | | | | | | | |
Poder Judiciario | | Rio de Janeiro Refrescos Ltda. | | Subsidiary | | Judicial deposit | | Judicial deposit | | 7,031,344 | | — | | — | | — | | Rio de Janeiro Refrescos Ltda. | | Subsidiary | | Judicial deposit | | Judicial deposit | | 9,575,388 | | — | | — | | — | | — | |
| | | | | | | | | | | | | | | | | | | | |
Aduana Buenos Aires | | Embotelladora del Atlántico S.A. | | Subsidiary | | Insurance guarantee | | Inventories | | 2,988,327 | | — | | — | | — | |
| Aga S.A. | | Embotelladora Andina S.A. | | Parent company | | Performance bond | | — | | 159,717 | | — | | — | | 159,717 | | Embotelladora Andina S.A. | | Parent company | | Performance bond | | Perfomance bond | | — | | — | | 171,536 | | — | | 149,067 | |
| | | | | | | | | | | | | | | | | | | | |
Municipalidad de Santiago | | Embotelladora Andina S.A. | | Parent company | | Performance bond | | — | | 10,260 | | — | | — | | 10,260 | | Embotelladora Andina S.A. | | Parent company | | Performance bond | | Perfomance bond | | — | | — | | 11,019 | | — | | 10,981 | |
| | | | | | | | | | | | | | | | | | | | |
Serv. Nac. de Aduanas | | Embotelladora Andina S.A. | | Parent company | | Performance bond | | — | | — | | — | | 94,187 | | — | |
Escuela Militar | | | Embotelladora Andina S.A. | | Parent company | | Performance bond | | Performance bond | | — | | — | | — | | 328 | | — | |
| | | | | | | | | | | | | | | | | | | | |
Aduana de Ezeiza | | | Embotelladora del Atlántico S.A. | | Subsidiary | | Guaranty insurance | | Inventories | | 9,152 | | — | | — | | — | | — | |
| | | | | | | | | | | | | | | | | | | | |
Aduana de CBA | | | Embotelladora del Atlántico S.A. | | Subsidiary | | Guaranty insurance | | Inventories | | 534 | | — | | — | | — | | — | |
| | | | | | | | | | | | | | | | | | | | |
Municipalidad de Maipú | | | Embotelladora Andina S.A. | | Parent Company | | Performance bond | | Performance bond | | — | | — | | — | | — | | — | |
| | | | | | | | | | | | | | | | | | | | |
Financial Futures and Options Exchange | | | Embotelladora Andina S.A. | | Parent Company | | Collateral guarantee | | United States Treasury Notes | | 74,235 | | — | | — | | 74,235 | | — | |
d. | Contractual obligations |
d. Contractual obligations
The following table summarizes our contractual obligations and commercial commitments as of December 31, 2006:2007:
| | | | | | | | | | | | | | Payments due by period | | | |
| | | Payments due by period | | Total | | Maturity | | | |
| | | Maturity | | | | | | | | | | | More than | | | |
| | | 2007 | | 2008 | | 2009 | | 2010 | | 2011 | | | 2008 | | 2009 | | 2010 | | 2011 | | 4 years | | Total | |
| | | ThCh$ | | ThCh$ | | ThCh$ | | ThCh$ | | ThCh$ | | ThCh$ | | ThCh$ | | ThCh$ | | ThCh$ | | ThCh$ | | ThCh$ | | ThCh$ | |
| | | | | | | | | | | | | | |
Long-term debt | | | 122,361 | | 118,100 | | 347,287 | | 165,789 | | 109,469 | | 863,006 | |
Short-term debt | | | 3,950,822 | | — | | — | | — | | — | | 3,950,822 | |
Bonds payable | | | 6,914,470 | | 2,135,407 | | 4,270,814 | | 4,270,814 | | 62,920,587 | | 80,512,092 | |
Purchase obligations | | 212,836 | | 74,217 | | 59,457 | | 29,732 | | — | | 376,242 | | 577,632 | | 84,450 | | 44,835 | | 16,833 | | — | | 723,750 | |
Brazilian banking taxes | | | 2,718,815 | | 2,831,519 | | 2,831,519 | | 2,359,600 | | — | | 10,741,453 | |
| | | | | | | | | | | | | | | | | | | | | | | | | |
Subtotal-included in our balance sheet | | 212,836 | | 74,217 | | 59,457 | | 29,732 | | — | | 376,242 | | 14,284,100 | | 5,169,476 | | 7,494,455 | | 6,813,036 | | 63,030,056 | | 96,791,123 | |
| | | | | | | | | | | | | | | | | | | | | | | | | |
Operating lease obligations | | 1,232,407 | | 52,283 | | 36,565 | | — | | — | | 1,321,255 | | 1,464,983 | | — | | — | | — | | — | | 1,464,983 | |
Purchase obligations | | 22,186,756 | | 16,790,221 | | 9,132,274 | | 408,493 | | 192,485 | | 48,710,229 | | 18,526,934 | | 9,012,828 | | 705,805 | | 315,149 | | — | | 28,560,716 | |
| | | | | | | | | | | | | |
Subtotal-not included in our balance sheet | | 23,419,163 | | 16,842,504 | | 9,168,839 | | 408,493 | | 192,485 | | 50,031,484 | |
Other | | | 6,249,675 | | 5,633,863 | | 5,020,203 | | 4,391,211 | | 30,990,516 | | 52,285,468 | |
Subtotal-not included in our | | | | | | | | | | | | | | |
balance sheet | | | 26,241,592 | | 14,646,691 | | 5,726,008 | | 4,706,360 | | 30,990,516 | | 82,311,167 | |
| | | | | | | | | | | | | | | | | | | | | | | | | |
Total contractual obligations | | 23,631,999 | | 16,916,721 | | 9,228,296 | | 438,225 | | 192,485 | | 50,407,726 | | 40,525,692 | | 19,816,167 | | 13,220,463 | | 11,519,396 | | 94,020,572 | | 179,102,290 | |
| | | | | | | | | | | | | |
F - 37F-41
NOTE 2728 - GUARANTEES RECEIVED FROM THIRD PARTIES
Guarantees received from third parties at December 31, 20062007 were as follows:
| | | | | | | | |
Guarantor |
| Type of Guarantee |
| Amount |
| Currency | |
| Transaction |
|
Soc de Restaurantes Tuesday Ltda.
| | Policy | | 45,000 | | U.F. | | Advertising agreement | |
Soc de Restaurantes Tuesday Ltda.Russel W. Coffin
| | PolicyLetter of credit | | 30,00052,113,600 | | U.F.US$ | | Advertising agreementPurchase of Nitvitgov Refrigerantes S.A. | |
Soc de Restaurantes Tuesday Ltda.Confab
| | Policy | | 30,000 | | U.F. | | Advertising agreement |
AGA S.A.
| | Receipt | | 600,000 | | US$ | | Supply agreement |
Soc. Las ÑipasMortgage
| | Policy | | 6,971 | | U.F. | | Advertising agreement |
CONFAB
| 30,000,000 | Mortgage | US$ | 30,000,000 | | USD | | Purchase of Rio de Janeiro Refrescos Ltda. | |
Russel W. CoffinOther Clients
| | Letter of CreditDeposits | | 43,175,3133,223,190 | | USDUS$ | | Purchase of Nitvitgov Refrigerantes S.A.Guaranty over containers | |
Compañía Azucarera Concepción | | Guaranty insurance | | 2,940,314 | | US$ | | Supplier | |
Soc. Com. Champfer | | Mortgage | | 1,677,103 | | US$ | | Distributor credit | |
Mac Coke Dist. Beb. | | Mortgage | | 561,2721,179,924 | | USDUS$ | | Distributor credit |
Tigresa Com. Beb.
| | Mortgage | | 397,568 | | USD | | Distributor credit |
Dist. Real Cola (Apucarana)
| | Mortgage | | 486,436 | | USD | | Distributor credit |
Soc. Com. Champfer
| | Mortgage | | 996,258 | | USD | | Distributor credit |
MBM Distribuidora de Beb
| | Mortgage | | 304,022 | | USD | | Distributor credit |
Franciscana Dist. | | Mortgage | | 495,790824,253 | | USDUS$ | | Distributor credit |
Dibejon Dist Beb. João Neiva
| | Mortgage | | 140,318 | | USD | | Distributor credit |
Clauver Nova Dist Beb Ltda
| | Mortgage | | 163,704 | | USD | | Distributor credit |
Aguiar Distrib.de Bebidas Ltda
| | Mortgage | | 280,636 | | USD | | Distributor credit |
Dist União De ItaperunaReal Cola -229628 | | Mortgage | | 266,604796,026 | | USDUS$ | | Distributor credit | |
Zulemar Comercio de Bebidas | | Mortgage | | 663,355 | | US$ | | Distributor credit | |
Asxt Fluminense Dist. Bebidas | | Mortgage | | 660,532 | | US$ | | Distributor credit | |
Aga S.A. | | Receipt | | 600,000 | | US$ | | Supplier agreement | |
Rosas de Casimiro | | Mortgage | | 336,763491,165 | | USDUS$ | | Distributor credit | |
ASXT Fluminense Distrib.BebidasMotta Distribuidora de Bebidas
| | Mortgage | | 4,429,373479,874 | | USDUS$ | | Distributor credit | |
Aguiar Dist. de Bebidas | | Mortgage | | 462,937 | | US$ | | Distributor credit | |
Atanor - S.C.A | | Guaranty insurance | | 330,785 | | US$ | | Supplier | |
Ledesma – S.A.A.I. | | Guaranty insurance | | 632,837 | | US$ | | Supplier | |
Soberana De Carmo Dist Beb | | Mortgage | | 282,279 | | US$ | | Distributor credit | |
Catering Argentina S.A. | | GuaranteeGuaranty insurance | | 125,112116,769 | | USDUS$ | | Supplier | |
NOTE 2829 - SUBSEQUENT EVENTS
·On January 31, 2008 Embotelladora Andina S.A. (“Andina”) signed a new Bottler Agreement for its Chilean operations, for a 5 year-term beginning January 1, 2008. The new agreement, called NEW BA, does not significantly differ from the agreements previously signed by Andina´s bottlers in the other countries where it has operations.
·On April 26, 2007, a24, 2008, final dividend N° 155160 was paid from 20062007 revenues as follows:
a) Ch$9.13 for each series A share; and
b) Ch$10.043 for each series B share.
On May 14, 2008, final additional dividend number 161 was paid from retained earnings as follows:
a) | Ch$11.12 for each series A share; and |
a)Ch$60.00 for each series A share; and
b) Ch$66.00 for each series B share.
b) | Ch$12.23 for each series B share. |
·No other significant events have occurred between December 31, 20062007 and the issuance date of these financial statements that could significantly affect the presentation of these financial statements.
F - 38F-42
NOTE 29 -30 – DIFFERENCES BETWEEN CHILEAN AND UNITED STATES GENERALLY ACCEPTED ACCOUNTING PRINCIPLES
Chilean GAAP varies in certain significant respects from the accounting principles generally accepted in the United States (“U.S. GAAP”). Such differences involve methods for measuring the amounts shown in the financial statements as well as additional disclosures required by U.S. GAAP.
The principal methods applied in the preparation of the accompanying financial statements which have resulted in amounts that differ from those that would have otherwise been determined under U.S. GAAP are as follows:
1 | Differences in measurement methods |
1 Differences in measurement methods
a) Inflation accounting
The cumulative inflation rate in Chile as measured by the CPI in the three-year period ended December 31, 20062007 was approximately 8.4%13.7%.
Chilean GAAP requires that the financial statements be restated to reflect the full effects of the loss in the purchasing power of the Chilean peso on the financial position and results of operations of reporting entities. The method, described in Note 1 c), is based on a model which enables calculation of net inflation gains or losses caused by monetary assets and liabilities exposed to changes in the purchasing power of local currency. The model prescribes that the historical cost of all non-monetary accounts be restated for general price-level changes between the date of origin of each item and the year-end.
The inclusion of price-level adjustments in these financial statements is considered appropriate under the prolonged inflationary conditions affecting the Chilean economy even though the cumulative inflation rate for the last-three years does not exceed 100%. Accordingly, the effect of price-level changes is not eliminated in the reconciliation to U.S. GAAP included under paragraph (n) below.
The price-level restatement was determined under Chilean GAAP by restating the following non-monetary assets and liabilities as follows:
| | | | | | | | For the year ended December 31, | |
| | | For the year ended December 31, | | | 2007 | | 2006 | | 2005 | |
| | | 2006 | | 2005 | | 2004 | | | ThCh$ | | ThCh$ | | ThCh$ | |
| | | ThCh$ | | ThCh$ | | ThCh$ | | | | | | | | |
Shareholders’ equity | | (4,450,340 | ) | | (8,225,062 | ) | | (6,934,001 | ) | | (15,818,526 | ) | (4,779,665 | ) | (8,833,717 | ) |
Liabilities | | (3,152,506 | ) | | (5,977,848 | ) | | (3,815,154 | ) | | (9,849,762 | ) | (3,385,792 | ) | (6,420,209 | ) |
Property, plant and equipment | | 1,489,804 | | | 2,755,193 | | | 2,063,489 | | | 6,122,335 | | 1,600,049 | | 2,959,077 | |
Current assets | | 780,495 | | | 2,608,857 | | | 1,684,390 | | | 3,229,058 | | 838,252 | | 2,801,912 | |
Other assets | | 5,528,699 | | | 9,903,404 | | | 8,476,900 | | | 13,884,646 | | 5,937,823 | | 10,636,257 | |
| | | | | | | | | | | | | | | | |
Adjustment of balance sheet accounts | | 196,152 | | | 1,064,544 | | | 1,475,624 | | | (2,432,249 | ) | 210,667 | | 1,143,320 | |
Adjustment of income statement accounts | | (511,938 | ) | | (1,646,566 | ) | | (507,539 | ) | | (2,110,798 | ) | (549,821 | ) | (1,768,412 | ) |
| | | | | | | | | | |
Price level restatement (expense) income | | (315,786 | ) | | (582,022 | ) | | 968,085 | | |
| | | | | | | | | | |
Price level restatement expense | | | (4,543,047 | ) | (339,154 | ) | (625,092 | ) |
F - 39F-43
b) | Translation of financial statements of non-Chilean operations |
b) Translation of financial statements of non-Chilean operationsIn accordance with Technical Bulletin No. 64 of the Chilean Institute of Accountants, the financial statements of foreign subsidiaries whose activities do not constitute an extension of the Chilean company’s operations, or which operate in countries that are exposed to significant risks, restrictions or inflation/exchange fluctuations must be remeasured into U.S. dollars and translated into Chilean pesos at the year-end exchange rate. Accordingly, the financial statements of the Company’s subsidiaries in Argentina and Brazil were considered to be operating in countries that are exposed to significant risks, restrictions and exchange fluctuations and were prepared in accordance with Chilean GAAP, with the exception of monetary correction, and then were remeasured into U.S. dollars as follows:
·Monetary assets and liabilities were translated at year-end rates of exchange between the U.S. dollar and the local currency.
·All non-monetary assets and liabilities and shareholders’ equity were translated at historical rates of exchange between the U.S. dollar and the local currency.
·Income and expense accounts were translated at average rates of exchange between the U.S. dollar and the local currency.
·Any exchange differences were included in the results of operations for the period.
The resulting foreign currency amounts are then translated to Chilean pesos at the closing exchange rate at the balance sheet date. The difference between the investments’ equity value arising from the financial statements remeasured as explained above and the net equity value at the beginning of the year restated by Chilean inflation, plus the proportional share of the investments’ income (or loss) for the year, is recorded as other reserves in shareholders’ equity in the consolidated balance sheets.
In the opinion of management of the Company, the Chilean GAAP procedures described above are part of the comprehensive basis of preparation of price-level adjusted financial statements required by Chilean GAAP. Inclusion of inflation and translation effects in the financial statements is considered appropriate under the inflationary conditions that have historically affected the Chilean economy and, accordingly, are not eliminated in the reconciliation to U.S. GAAP.
c) | Revaluation of property, plant and equipment |
c) Revaluation of property, plant and equipment
As described in Note 1 k), certain property, plant and equipment has been reported in the financial statements at amounts determined in accordance with a technical appraisal. The revaluation of property, plant and equipment is an accounting principle not generally accepted under U.S. GAAP. The effects of the reversal of this revaluation as well as the related accumulated depreciation and depreciation expense for the year is shown in the Chilean GAAP to U.S. GAAP reconciliation below under paragraph (n)(o).
F - 40F-44
d) Income taxesUnder Chilean GAAP, effective January 1, 2000, the Company began applying Technical Bulletin No. 60 of the Chilean Institute of Accountants (“TB 60”) concerning deferred income taxes. TB 60 requires the recognition of deferred income taxes for all temporary differences, whether recurring or not, using an asset and liability approach. The effects of deferred income taxes at January 1, 2000 that were not previously recorded, were recognized, in accordance with the transitional provision provided by TB 60, against asset or liability accounts (“complementary accounts”) and were recorded to offset the effects of the deferred tax assets and liabilities not recorded prior to January 1, 2000. Complementary accounts are amortized to income over the estimated average reversal periods corresponding to underlying temporary differences to which the deferred tax asset or liability related. A valuation allowance is provided if, based on the weight of available evidence, some portion, or all, of the deferred income tax assets will not be realized.
For U.S. GAAP purposes, the Company applied SFAS No. 109, “Accounting for Income Taxes”, whereby income taxes are also recognized using substantially the same asset and liability approach, with deferred income tax assets and liabilities established for temporary differences between the financial reporting basis and tax basis of the Company’s assets and liabilities at enacted rates expected to be in effect when such amounts will be realized. A valuation allowance is provided against deferred tax assets that are not recoverable on a more-likely-than-not basis. In this regard, in 2005 the Company released its valuation allowance related to the net operating losses of its Brazilian subsidiary Refrescos.
The effect of provisioning for deferred income taxes for the differences between the amounts shown for assets and liabilities in the consolidated balance sheets and the tax bases of those assets and liabilities under US GAAP and the remaining effects from the implementation of TB 60 are included in paragraph (n)(o) below and certain disclosures required under SFAS No. 109 are set forth under paragraph 2 a) below.
e) | Accounting for investments in related companies |
e) Accounting for investments in related companies
The Company began accounting for its 11.32% interest in Kaik Participacoes Ltda. under the equity method in 1999 as described in Note 12. In prior years, as appropriate financial information was not available, the Company accounted for this investment under the cost method. Under U.S. GAAP, as the Company only holds 11.32% interest and the investee’s shares do not trade on any exchange, the cost method has been applied for all years presented. The effects for the difference in accounting for this investment pursuant to the cost method of accounting for U.S. GAAP for all periods presented are included in the reconciliation of Chilean GAAP to U.S. GAAP included under paragraph (n)(o) below.
f) Goodwill
Under Chilean GAAP, until December 31, 2003, the excess of cost over the net book value of a purchased company was recorded as goodwill (the book value purchase method), which is then amortized to income over a maximum period of twenty years. Amortization of goodwill may be accelerated if the acquired company generates sufficient income to absorb the additional amortization in any given year. The excess of net book value over the cost of an investment is considered to be negative goodwill under Chilean GAAP and is also amortized to income over a maximum period of twenty years. The amortization of negative goodwill may be accelerated if the acquired company sustains losses. Effective January 1, 2004, Technical Bulletin No. 72 requires the determination of goodwill and negative goodwill based on the fair value of the acquired company.
F - 41F-45
Under U.S. GAAP, goodwill and other intangibles are accounted for under SFAS No. 141, “Business Combinations” and SFAS No. 142, “Goodwill and Other Intangible Assets”. SFAS No. 141 requires that the purchase method of accounting be used for all business combinations initiated after June 30, 2001 and prohibits the use of the pooling-of-interests method of accounting after this date. With respect to the purchase method of accounting, the cost of an investment is assigned to the tangible and identified intangible assets acquired and liabilities assumed on the basis of their fair values at the date of acquisition. Any excess of cost over the fair value of net assets acquired is recorded as goodwill. If an excess of acquired net assets over cost arises, the excess is allocated to reduce proportionally the values assigned to noncurrent assets (except long-term investments in marketable securities) in determining their fair values. If the allocation reduces the noncurrent assets to zero value, the remainder of the excess over cost (negative goodwill) is written off immediately as an extraordinary gain. SFAS No. 141 establishes specific criteria for the recognition of intangible assets separately from goodwill and requires unallocated negative goodwill to be written off immediately as an extraordinary gain (instead of being deferred and amortized).
SFAS No. 142, “Goodwill and Other Intangible Assets” establishes the following:
·The accounting for a recognized intangible asset is based on its useful life to the reporting entity. An intangible asset with a finite useful life is amortized over the life of the asset, but goodwill and other intangible assets with indefinite useful lives are not amortized.
·The remaining useful lives of intangible assets being amortized are evaluated each reporting period to determine whether events and circumstances warrant a revision to the remaining period of amortization. If the estimate of an intangible asset’s remaining useful life is changed, the remaining carrying value of the intangible asset is amortized prospectively over the revised remaining useful life.
·Goodwill and other intangible assets with indefinite useful lives that are not subject to amortization are tested for impairment at least annually.
·All goodwill must be assigned to a reporting unit, which is defined as an operating segment or one level below an operating segment.
SFAS No. 142 became effective for years beginning after December 15, 2001. Accordingly, goodwill amortization was ceased for U.S. GAAP purposes beginning in 2002. The effects of eliminating goodwill amortization recognized for Chilean GAAP purposes are included in the reconciliation of Chilean GAAP to U.S. GAAP under paragraph (n)(o) below.
g) | Joint venture accounting |
g) Joint venture accounting
In accordance with Chilean GAAP, in June 2001 the Company recognized a gain of ThCh$ 6,518,8017,001,192 on the sale of property, plant and equipment to CMF upon the formation of this joint venture with Cristalerías. In addition, the Company wrote-off the basis difference of ThCh$ 1,927,2642,069,881 between its investment in and its share of the net equity of the joint venture. Accordingly, the Company recognized a net gain before income taxes of ThCh$ 4,591,537.4,931,311.
Under U.S. GAAP, a gain can be recognized only if appreciated assets (excluding land) are contributed to a venture, cash or near-cash assets are received, and no other factors exist that could impact realization of the gain (such as guarantees of debt, puts or calls that may result in acquisition of the venture, etc.). Additionally, the gain would be limited to the proportion of the assets deemed sold and any basis difference would be amortized based on the lives of the assets that gave rise to the difference. Finally, all contributions of appreciated assets to the venture would generally be recorded at the carrying value of the joint venture shareholder.
F - 42F-46
The shareholders’ agreement for CMF that establishes joint control of the venture by the Company and Cristalerías also contains provisions that could require the Company to purchase Cristalerías’ shares of CMF. Accordingly, the gain recognized for Chilean GAAP purposes is not considered realized under U.S. GAAP. The effects of reversing the gain and write-off of the basis difference in the investment, amortizing the basis difference in accordance with U.S. GAAP and adjusting the results of CMF for the Company’s share of the amortization of excess value assigned to the assets of CMF under Chilean GAAP are included in paragraph (n)(o) below.
h) Investment securities
Under Chilean GAAP, long-term investments in bonds and time deposits held by the Company are carried at cost plus accrued interest. Under SFAS No. 115, “Accounting for Certain Investments in Debt and Equity Securities”, investment securities, which include debt and certain equity securities, are accounted for as follows:
·Debt securities that the Company has the positive intent and ability to hold to maturity are classified as held-to-maturity securities and are reported at amortized cost.
·Debt and equity securities that are bought and held principally for the purpose of selling them in the near term are classified as trading securities and are reported at fair value, with unrealized gains and losses included in earnings.
·Debt and equity securities not classified as either held-to-maturity or trading securities are classified as available-for-sale securities and reported at fair value, with unrealized gains and losses excluded from earnings and reported in a separate component of shareholders’ equity.
For the purposes of SFAS No. 115, the Company’s long-term investments in bonds are classified as available for sale securities and time deposits are classified as held-to-maturity. The effect of the difference between Chilean GAAP and U.S. GAAP in accounting for the Company’s long-term investments in bonds is included in the reconciliation of Chilean GAAP to U.S. GAAP in paragraph (n)(o) below.
i) | Staff severance indemnities |
i) Staff severance indemnities
Under Chilean GAAP, the Company has recorded a liability for long-term severance indemnities in accordance with the collective bargaining agreements entered into with its employees in Chile. This liability is shown at the present value of the projected benefits, considering the effects of inflation. The benefit accrued as of the end of the year considers the average future service period for all employees covered by such agreements.agreements.
F - 43F-47
Under U.S. GAAP, the liability for staff severance indemnities would be measured by projecting future expected severance payments using an assumed salary progression rate and discounting the resulting amounts to their present value. In practice, the Company believes that the salary progression rate will not differ significantly from the general inflation rate. In the opinion of management of the Company, the application of U.S. GAAP would not have produced results materially different from the accepted method under Chilean GAAP.
j) | Accumulated translation adjustment of foreign investments |
j) Accumulated translation adjustment of foreign investments
As described in Notes 2122 and 22,23, the Company recognized a gain upon the realization of a portion of its accumulated translation adjustment of foreign investments account in accordance with Technical Bulletin No. 64. Under Chilean GAAP, a partial liquidation of an investment in a foreign entity is deemed to have occurred upon the repatriation of capital or of earnings in excess of net income for the year. In the case of a partial liquidation, the proportionate share of the accumulated translation adjustment of foreign investments account related to the foreign investment should be reversed and recorded in the results of the period.
At December 31, 2006,
During 2007, the dividenddividends paid by the Company’s subsidiary RioRío de Janeiro Refrescos Ltda. and the capital remittances from Embotelladora del Atlántico S.A., of ThUS$ 34,907, generated a loss of ThCh$ 133,4993,576,687 due to the reversal of the cumulative translation reserve.
Under U.S. GAAP as set forth in SFAS No. 52, “Foreign Currency Translation”, the accumulated translation adjustment of foreign investments account is realized in the results of the period only upon the sale or upon the complete or substantially complete liquidation of an investment in a foreign entity. The effect of reversing this gainloss is included in the reconciliation of Chilean GAAP to U.S. GAAP in paragraph (n)(o) below.
k) | Derivative financial instruments |
k) Derivative financial instruments
At December 31, 2007, 2006 2005 and 2004,2005, the Company had derivative contracts consisting of forward contracts to purchase US dollars and cross-currency swap agreements (UF/US$). The forward contracts were obtained to protect the Company from foreign exchange risk, mainly with respect to future purchases of raw materials denominated in US dollars. The cross-currency swap agreements were obtained to mitigate foreign exchange risk with respect to the US dollar-denominated bond investments held by the Company. In 2006, the Company also entered into futures contracts for the sale of sugar. This contracts will expire in March 2008. These contracts were obtained to hedge the changes in the fair value of purchase commitments originated by market fluctuations in the price of sugar.
Under Chilean GAAP, derivatives are accounted for in accordance with Technical Bulletin N° 57. Under TB 57, all derivative financial instruments are recognized on the balance sheet at their fair value. In addition, TB 57 requires that derivative financial instruments be classified as non-hedging (investment) instruments and hedging instruments, the latter further divided into those covering assets, liabilities or firm commitments and those covering forecasted transactions.
F - 44F-48
Contracts to hedge assets, liabilities or firm commitments act as hedging instruments against the risk of a change in the fair value of a hedged item. The differences resulting from the changes in the fair value of both the hedged item and the derivative instrument should be accounted for as follows:
a. | If the net effect is a loss, it should be recognized in the statements of income in the period of change. |
a.If the net effect is a loss, it should be recognized in the statements of income in the period of change.
b.If the net effect is a gain, it should be recognized when the contract is closed and accordingly deferred on the balance sheet.
c.If the net effect is a gain and net losses were recorded on the transaction in prior years, a gain should be recognized in the statements of income in the current period up to the amount of net losses recorded previously.
d.If the effect is a net loss and net gains were recorded (as a deferred revenue) on the transaction in prior years, the gain should be utilized to offset the net loss before recording the remaining loss in the statements of income for the year.
b. | If the net effect is a gain, it should be recognized when the contract is closed and accordingly deferred on the balance sheet. |
c. | If the net effect is a gain and net losses were recorded on the transaction in prior years, a gain should be recognized in the statements of income in the current period up to the amount of net losses recorded previously. |
d. | If the effect is a net loss and net gains were recorded (as a deferred revenue) on the transaction in prior years, the gain should be utilized to offset the net loss before recording the remaining loss in the statements of income for the year. |
Contracts to hedge forecasted transactions are those that have the objective of protecting cash flow risks of a transaction expected to occur in the future (a cash flow hedge). The hedging instrument should be recorded at its fair value and the changes in fair value should be stated on the balance sheet as unrealized gains or losses. When the contract is closed, the unrealized gains or losses on the derivative instrument should be recognized in earnings without affecting the cost or sales price of the asset acquired or sold in the transaction.
Non-hedging (investment) instruments are also presented at their fair value, with changes in fair value reflected in the earnings of the period in which the change in fair value occurs.
Under Chilean GAAP in accordance with TB 57, the Company has designated certain futures contracts as hedges of firm commitments. Forward contracts and cross-currency swap agreements have been designated as hedges of forecasted transactions.
For U.S. GAAP reconciliation purposes only, the Company has adopted SFAS No. 133 “Accounting for Derivative Instruments and Hedging Activities”, as amended by SFAS 137, SFAS 138 and SFAS 149 on the same matter (collectively referred to herein as “SFAS 133”). SFAS 133 establishes accounting and reporting standards for derivative instruments, including certain derivative instruments embedded in other contracts, and for hedging activities. It requires that an entity recognized all derivatives as either assets or liabilities in its consolidated balance sheet and measure those instruments at fair value. If certain conditions are met, a derivative may be specifically designated as (a) a hedge of the exposure to changes in the fair value of a recognized asset or liability or an unrecognized firm commitment, (b) a hedge of the exposure to variable cash flows of a forecasted transaction or to the variability of the cash flows that are to be received or paid in connection with a recognized asset or liability or (c) a hedge of the foreign currency exposure of a net investment in a foreign operation, an unrecognized firm commitment, an available-for-sale security, a foreign-currency-denominated forecasted transaction or a recognized asset or liability.
The accounting for changes in the fair value of a derivative depends on the intended use of the derivative and the resulting designation.
F - 45F-49
The Company has not completed the documentation necessary to qualify the contracts designated as hedges for Chilean GAAP purpose, as hedges for U.S. GAAP purposes. Accordingly, the unrealized gainloss deferred under Chilean GAAP of ThCh$ 4,146,849164,203 in 2006 (ThCh$ 3,856,4912007 (gain deferred of ThCh$ 4,453,716 in 2005)2006) represents a difference from U.S. GAAP that is included in paragraph (n)(o) below. Additional information concerning derivative financial instruments that is required to be disclosed under SFAS 133 is set forth below in paragraph 2 e).
l) Mandatory dividend
As required by the Chilean Company law, unless otherwise decided by the holders of a majority of the shares represented at the General Shareholders’ Meeting, the Company has to distribute a cash dividend in an amount equal to at least 30% of the Company’s net income under Chilean GAAP. Since the payment of the dividend out of each year’s net income is a legal requirement in Chile, an accrual would have been made for US GAAP purposes to recognize the dividend obligation under Chilean law. The effect of this accrual would be to decrease Shareholders’ equity by ThCh$ 8,868,4637,286,252 and ThCh$ 5,279,4339,524,730 at December 31, 2007 and 2006 and 2005 respectively. At December 31, 2004
m) Reversal of impairment loss on fixed assets
In previous years the Company has not recorded an accrualasset impairment related to some of its plants. The impairment considered a projection of losses associated with the use of certain production lines and on-going cash flows deficits. In 2007, the Company’s estimates of future cash flows associated with these plants’ existing service potencial resulted in the reversal of impairment losses previously recognized amounting to ThCh$ 4,596,549, with the effect being included in Other non-operating income in the consolidated statement of income. Under USGAAP, the restoration of a previously recognized impairment loss for this concept as anticipated dividends were paid during the year.a depreciable long-lived asset is prohibited.
m) | Initial application of SAB 108 |
n) Initial application of SAB 108
In September 2006, the SEC staff issued Staff Accounting Bulletin No. 108, “Considering the Effects of Prior Year Misstatements when Quantifying Misstatements in Current Year Financial Statements”. SAB 108 was issued in order to eliminate the diversity of practice surrounding how public companies quantify financial statement misstatements.
Traditionally, there have been two widely-recognized methods for quantifying the effects of financial statement misstatements: the “roll-over” method and the “iron curtain” method. The roll-over method focuses primarily on the impact of a misstatement on the income statement—including the reversing effect of prior year misstatements—but its use can lead to the accumulation of misstatements in the balance sheet. The iron-curtain method, on the other hand, focuses primarily on the effect of correcting the period-end balance sheet with less emphasis on the reversing effects of prior year errors on the income statement. Prior to our application of the guidance in SAB 108, the Company used the roll-over method for quantifying financial statement misstatements.
In SAB 108, the SEC staff established an approach that requires quantification of financial statement misstatements based on the effects of the misstatements on each of the company’s financial statements and the related financial statement disclosures. This model is commonly referred to as a “dual approach” because it requires quantification of errors under both the iron curtain and the roll-over methods.
F - 46F-50
SAB 108 permits existing public companies to initially apply its provisions either by (i) restating prior financial statements as if the “dual approach” had always been applied or (ii) recording the cumulative effect of initially applying the “dual approach” as adjustments to the carrying values of assets and liabilities as of January 1, 2006 with an offsetting adjustment recorded to the opening balance of retained earnings. The Company elected to record the effects of applying SAB 108 using the cumulative effect transition method. The following table summarizes the effects (up to January 1, 2006) of applying the guidance in SAB 108 under U.S. GAAP:
| | | | | | | | | | Period in which the
misstatement originated(1) | | | |
| | | Period in which the
misstatement originated(1) | | | | Cumulative
prior to
January 1, | | Year ended
December 31, | | Adjustment
recorded as of
January 1, | |
| | | Cumulative prior to January 1, | | Year ended December 31, | | Adjustment recorded as of January 1, | | 2004 | | 2004 | | 2005 | | 2006 | |
| | | 2004 | | 2004 | | 2005 | | 2006 | | ThCh$ | | ThCh$ | | ThCh$ | | ThCh$ | |
| | | ThCh$ | | ThCh$ | | ThCh$ | | ThCh$ | | | | | | | | | |
Deferred tax liability(2) | | 3,377,434 | | 1,328,873 | | 1,952,296 | | 6,658,603 | | 3,627,363 | | 1,427,210 | | 2,096,766 | | 7,151,339 | |
Impact on other comprehensive income(2) | | — | | 207,037 | | 379,105 | | 586,142 | |
Impact on other comprehensive income (2) | | | — | | 222,358 | | 407,159 | | 629,517 | |
Impact on net income(3) | | 3,377,434 | | 1,535,910 | | 2,331,401 | | 7,244,745 | | 3,627,363 | | 1,649,568 | | 2,503,925 | | 7,780,856 | |
Retained earnings(4) | | | | | | | | 6,658,603 | | | | | | | | 7,151,339 | |
(1) | The Company previously quantified this misstatement under the roll-over method and concluded that it was immaterial. |
(1) The Company previously quantified this misstatement under the roll-over method and concluded that it was immaterial.
(2) | Under U.S. GAAP, the Company’s subsidiary Refrescos was not recognizing a deferred tax liability on foreign exchange gains generated by its US$75 million bonds maturing in December 2012 as required by SFAS 109. As a result of this misstatement, the Company’s income tax expense was understated by ThCh$ 3,377,434 in years prior to 2004, by ThCh$ 1,535,910 in 2004 and by ThCh$ 2,331,401 in 2005 and the cumulative translation adjustment (included in other comprehensive income) was understated by ThCh$ 207,037 in 2004 and by ThCh$ 379,105 in 2005. The Company recorded a ThCh$ 6,658,603 increase in its deferred tax liability as of January 1, 2006 with a corresponding reduction in retained earnings to correct this misstatement. |
(2) Under U.S. GAAP, the Company’s subsidiary Refrescos was not recognizing a deferred tax liability on foreign exchange gains generated by its US$75 million bonds maturing in December 2012 as required by SFAS 109. As a result of this misstatement, the Company’s income tax expense was understated by ThCh$ 3,627,364 in years prior to 2004, by ThCh$ 1,649,568 in 2004 and by ThCh$ 2,503,925 in 2005 and the cumulative translation adjustment (included in other comprehensive income) was understated by ThCh$ 222,358 in 2004 and by ThCh$ 407,159 in 2005. The Company recorded a ThCh$ 7,151,339 increase in its deferred tax liability as of January 1, 2006 with a corresponding reduction in retained earnings to correct this misstatement.
(3) | Represents the net over-statement of net income for the indicated periods resulting from this misstatement. |
(3) Represents the net over-statement of net income for the indicated periods resulting from this misstatement.
(4) | Represents the net reduction to retained earnings recorded under U.S. GAAP as of January 1, 2006 to give effect to the initial application of SAB 108. |
(4) Represents the net reduction to retained earnings recorded under U.S. GAAP as of January 1, 2006 to give effect to the initial application of SAB 108.
Under Chilean GAAP, the deferred tax liability on the referred foreign exchange gain was recorded with a corresponding charge to the income tax expense in the consolidated statement of income for the year 2006. Before 2006, the initial difference between taxable income and accounting income related to the aforementioned foreign exchange was not deemed to reverse until indefinite future periods or was never deemed to reverse, thus, no deferred tax liability was recorded under Chilean GAAP. The effect of the difference in accounting between Chilean GAAP and U.S. GAAP for deferred taxes on the related foreign exchange gain and the initial application of SAB 108 is included in the reconciliation of Chilean GAAP to U.S. GAAP in paragraph (m)(o) below.
F - 47F-51
n) | Effects of conforming to U.S. GAAP |
o) Effects of conforming to U.S. GAAPThe adjustments to reported net income for the periods indicated required to conform with U.S. GAAP are as follows:
| | | | For the year ended December 31, | | | For the year ended December 31, | |
| | | 2006 | | 2005 | | 2004 | | | 2007 | | 2006 | | 2005 | |
| | | ThCh$ | | ThCh$ | | ThCh$ | | | ThCh$ | | ThCh$ | | ThCh$ | |
Net income as shown in the Chilean GAAP financial statements | | 74,355,094 | | | 57,216,172 | | | 42,478,133 | | | 81,601,944 | | 79,857,372 | | 61,450,170 | |
Reversal of additional depreciation on revaluation of property, plant and equipment (paragraph c) | | 5,324 | | | 10,267 | | | 10,353 | | | 1,882 | | 5,718 | | 11,027 | |
Adjustment to deferred income tax provision (paragraph d) | | (11,881,372 | ) | | 8,585,785 | | | 389,709 | | | 2,077,902 | | (12,760,594 | ) | 9,221,133 | |
Difference in accounting for investments in related companies (paragraph e) | | (225,381 | ) | | (373,071 | ) | | 1,747,847 | | | 565,057 | | (242,059 | ) | (400,678 | ) |
Amortization of goodwill (paragraph f) | | 6,502,411 | | | 6,359,723 | | | 7,337,071 | | | 6,502,674 | | 6,983,589 | | 6,830,343 | |
Joint venture accounting (paragraph g) | | 428,715 | | | 428,715 | | | 428,715 | | | 460,440 | | 460,440 | | 460,440 | |
Accumulated translation adjustment of foreign investments (paragraph j) | | 133,499 | | | — | | | — | | | 3,576,687 | | 143,378 | | — | |
Derivative financial instruments (paragraph k) | | 290,358 | | | 4,535,365 | | | 2,155,394 | | | (4,617,919 | ) | 311,844 | | 4,870,982 | |
Initial application of SAB 108 (paragraph m) | | 7,244,745 | | | — | | | — | | |
Reversal of impairment loss on fixed assets (paragraph m) | | | (4,596,549 | ) | — | | — | |
Initial application of SAB 108 (paragraph n) | | | — | | 7,780,856 | | — | |
| | | | | | | | | | | | | | | | |
Net income in accordance with U.S. GAAP | | 76,853,393 | | | 76,762,956 | | | 54,547,222 | | | 85,572,118 | | 82,540,544 | | 82,443,417 | |
| | | | | | | | | | |
| | | | For the year ended December 31, | | |
| | | 2006 | | 2005 | | 2004 | | |
| | | ThCh$ | | ThCh$ | | ThCh$ | | |
Components of other comprehensive (loss) income: | | | | | | | |
Cumulative translation adjustment for foreign investments | | 1,822,146 | | | (15,621,257 | ) | | (12,208,002 | ) | |
Effect on cumulative translation adjustment of initial application of SAB 108 (paragraph m) | | (586,142 | ) | | — | | | — | | |
Unrealized (loss) gain on investment securities, net of applicable income tax expense (benefit) of ThCh$ 2,570 in 2006, ThCh$ (690,537) in 2005 and ThCh$ 60,197 in 2004 (paragraph h) | | (618,799 | ) | | (3,338,239 | ) | | 314,733 | | |
| | | | | | | | | | |
Subtotal other comprehensive income (loss) | | 617,205 | | | (18,959,496 | ) | | (11,893,269 | ) | |
| | | | | | | | | | |
Comprehensive income (loss) in accordance with U.S. GAAP (paragraph 2 b) | | 77,470,598 | | | 57,803,460 | | | 42,653,953 | | |
| | | | | | | | | | |
| | For the year ended December 31, | |
| | 2007 | | 2006 | | 2005 | |
| | ThCh$ | | ThCh$ | | ThCh$ | |
Components of other comprehensive (loss) income: | | | | | | | |
Cumulative translation adjustment for foreign investments | | (16,899,924 | ) | 1,956,985 | | (16,777,230 | ) |
Effect on cumulative translation adjustment of initial application of SAB 108 (paragraph m) | | — | | (629,517 | ) | — | |
Unrealized (loss) gain on investment securities, net of applicable income tax expense (benefit) of ThCh$ 52,680 in 2007, ThCh$ 2,760 in 2006 and ThCh$ (741,637) in 2005 (paragraph h) | | 877,234 | | (664,590 | ) | (3,585,269 | ) |
| | | | | | | |
Subtotal other comprehensive income (loss) | | (16,022,690 | ) | 662,878 | | (20,362,499 | ) |
| | | | | | | |
Comprehensive income (loss) in accordance with U.S. GAAP (paragraph 2 b) | | 69,549,428 | | 83,203,422 | | 62,080,918 | |
Accumulated other comprehensive income amounted to ThCh$ 27,627,347,13,649,081, ThCh$ 27,010,14229,671,771 and ThCh$ 45,969,63829,008,893 as of December 31, 2007, 2006 2005 and 2004,2005, respectively.
F - 48F-52
The changes in other comprehensive income (loss) determined under U.S. GAAP were as follows:
| | | | For the year ended December 31, | | | For the year ended December 31, | |
| | | 2006 | | 2005 | | 2004 | | | 2007 | | 2006 | | 2005 | |
| | | ThCh$ | | ThCh$ | | ThCh$ | | | ThCh$ | | ThCh$ | | ThCh$ | |
Other comprehensive income (loss), before income tax: | | | | | | | | | | | | | |
Cumulative translation adjustment for foreign investments | | 1,822,146 | | | (15,621,257 | ) | | (12,208,002 | ) | | (16.899,924 | ) | 1,956,985 | | (16,777,230 | ) |
Effect on cumulative translation adjustment of initial application of SAB 108 | | (586,142 | ) | | — | | | — | | | — | | (629,517 | ) | — | |
Unrealized gains (losses) on securities | | | | | | | | | | | | | |
Unrealized holding gains (losses) arising during period | | (616,229 | ) | | (1,463,558 | ) | | 720,674 | | | 929,914 | | (661,830 | ) | (1,571,861 | ) |
Less: Reclassification adjustment for losses included in net income | | — | | | (2,565,218 | ) | | (345,744 | ) | | — | | — | | (2,755,044 | ) |
| | | | | | | | | | |
Other comprehensive income (loss), before income tax | | 619,775 | | | (19,650,033 | ) | | (11,833,072 | ) | | (15,970,010 | ) | 665,638 | | (21,104,135 | ) |
| | | | | | | | | | |
Income tax related to items of other comprehensive income | | (2,570 | ) | | 690,537 | | | (60,197 | ) | | (52,680 | ) | (2,760 | ) | 741,637 | |
| | | | | | | | | | |
Other comprehensive income (loss), net of income tax | | 617,205 | | | (18,959,496 | ) | | (11,893,269 | ) | | (16,022,690 | ) | 662,878 | | (20,362,498 | ) |
| | | | | | | | | | |
The Company’s earnings per share under U.S. GAAP are as follows:
| | | | | | | | | | | | | | For the year ended December 31, | |
| | | For the year ended December 31, | | 2007 | | 2006 | | 2005 | |
| | | 2006 | | 2005 | | 2004 | | ThCh$ | | ThCh$ | | ThCh$ | | ThCh$ | | ThCh$ | | ThCh$ | |
| | | ThCh$ | | ThCh$ | | ThCh$ | | ThCh$ | | ThCh$ | | ThCh$ | | Series A | | Series B | | Series A | | Series B | | Series A | | Series B | |
| | | Series A | | Series B | | Series A | | Series B | | Series A | | Series B | | | | | | | | | | | | | |
Basic and diluted net income per share | | 96.27 | | 105.90 | | 96.16 | | 105.77 | | 68.33 | | 75.16 | | 107.20 | | 117.91 | | 103.40 | | 113.73 | | 103.28 | | 113.60 | |
| | | | | | | | | | | | | |
Weighted average number of common stock outstanding (thousands of shares) | | 380,137 | | 380,137 | | 380,137 | | 380,137 | | 380,137 | | 380,137 | | 380,137 | | 380,137 | | 380,137 | | 380,137 | | 380,137 | | 380,137 | |
| | | | | | | | | | | | | |
Since Series B shares are entitled to a 10% higher dividend than Series A shares, Series B shareholders are entitled to 52.38% of earnings, and Series A shareholders are entitled to 47.62% of earnings. In accordance withto this calculation, earnings per share are composed as follows for the periods indicated:
| | | | | | | | For the year ended December 31, | |
| | | For the year ended December 31, | | | 2007 | | 2006 | | 2005 | |
| | | 2006 | | 2005 | | 2004 | | | ThCh$ | | ThCh$ | | ThCh$ | |
| | | ThCh$ | | ThCh$ | | ThCh$ | | | | | | | | |
Net income in accordance with U.S. GAAP | | 76,853,393 | | | 76,762,956 | | | 54,547,222 | | | 85,572,118 | | 82,540,544 | | 82,443,417 | |
(less): Income available to Series B | | (40,255,807 | ) | | (40,208,436 | ) | | (28,571,835 | ) | | (44,822,675 | ) | (43,234,737 | ) | (43,183,861 | ) |
| | | | | | | | | | |
Basic EPS | | | | | | | | | | | | | |
Income available to Series A | | 36,597,586 | | | 36,554,520 | | | 25,975,387 | | | 40,749,443 | | 39,305,807 | | 39,259,556 | |
| | | | | | | | | | |
Weighted average number of common shares outstanding (thousands of shares) Series A | | 380,137 | | | 380,137 | | | 380,137 | | | 380,137 | | 380,137 | | 380,137 | |
| | | | | | | | | | |
Basic and diluted net income per share Series A | | 96.27 | | | 96.16 | | | 68.33 | | | 107.20 | | 103.40 | | 103.28 | |
| | | | | | | | | | |
Basic EPS | | | | | | | | | | | | | |
Income available to Series B | | 40,255,807 | | | 40,208,436 | | | 28,571,835 | | | 44,822,675 | | 43,234,737 | | 43,183,861 | |
| | | | | | | | | | |
Weighted average number of preferred shares outstanding (thousands of shares) Series B | | 380,137 | | | 380,137 | | | 380,137 | | | 380,137 | | 380,137 | | 380,137 | |
| | | | | | | | | | |
Basic and diluted net income per share Series B | | 105.90 | | | 105.77 | | | 75.16 | | | 117.91 | | 113.73 | | 113.60 | |
| | | | | | | | | | |
F - 49F-53
The adjustments required to conform shareholders’ equity to U.S. GAAP are as follows:
| | | | At December 31, | | | At December 31, | |
| | | 2006 | | 2005 | | | 2007 | | 2006 | |
| | | ThCh$ | | ThCh$ | | | ThCh$ | | ThCh$ | |
Shareholders’ equity as shown in the Chilean GAAP financial statements | | 274,733,339 | | | 274,073,759 | | | 281,149,138 | | 295,063,607 | |
Reversal of revaluation of property, plant and equipment, net of depreciation (paragraph c) | | (1,432,977 | ) | | (1,438,301 | ) | | (1,537,135 | ) | (1,539,017 | ) |
Adjustment to deferred income tax provision (paragraph d) | | (2,212,441 | ) | | 9,671,501 | | | (350,940 | ) | (2,376,162 | ) |
Difference in accounting for investments in related companies (paragraph e) | | 1,111,103 | | | 1,336,484 | | | 1,758,383 | | 1,193,326 | |
Amortization of goodwill (paragraph f) | | 22,752,292 | | | 16,249,881 | | | 30,938,636 | | 24,435,962 | |
Joint venture accounting (paragraph g) | | (2,143,570 | ) | | (2,572,285 | ) | | (1,841,754 | ) | (2,302,194 | ) |
Unrealized loss on investment securities (paragraph h) | | (856,278 | ) | | (240,049 | ) | |
Unrealized gain (loss) on investment securities (paragraph h) | | | 10,271 | | (919,643 | ) |
Derivative financial instruments (paragraph k) | | 4,146,849 | | | 3,856,491 | | | (164,203 | ) | 4,453,716 | |
Minimum dividend (paragraph l) | | (8,868,463 | ) | | (5,279,433 | ) | | (7,286,252 | ) | (9,524,730 | ) |
| | | | | | | |
Reversal of impairment loss on fixed assets (paragraph m) | | | (4,596,549 | ) | — | |
Shareholders’ equity in accordance with U.S. GAAP | | 287,229,854 | | | 295,658,048 | | | 298,079,595 | | 308,484,864 | |
| | | | | | | |
The changes in shareholders’ equity determined under U.S. GAAP were as follows:
|
| | |
| | ThCh$ |
|
BALANCE AT DECEMBER 31, 20032004 | | 326,713,017341,856,415 | |
| | | |
Distribution of dividends | | (51,064,90980,730,475 | ) |
Increase in cumulative translation adjustment of foreign investments | | (12,208,00216,777,230 | ) |
Decrease in net unrealized losses on investment securities | | 314,733(3,585,269 | ) |
Minimum dividend | | (5,670,111 | ) |
Net income for the year | | 54,547,22282,443,416 | |
| | | |
BALANCE AT DECEMBER 31, 2004
| | 318,302,061 | |
Distribution of dividends
| | (75,168,040 | ) |
Increase in cumulative translation adjustment of foreign investments
| | (15,621,257 | ) |
Increase in net unrealized losses on investment securities
| | (3,338,239 | ) |
Minimum dividend
| | (5,279,433 | ) |
Net income for the year
| | 76,762,956 | |
| | | |
BALANCE AT DECEMBER 31, 2005 | | 295,658,048317,536,746 | |
| | | |
Adjustment to retained earnings for initial application of SAB 108 (paragraph m)n) | | (6,658,603629,517 | ) |
Distribution of dividends | | (75,651,15981,249,347 | ) |
Increase in cumulative translation adjustment of foreign investments | | 1,822,1461,956,985 | |
Effect on cumulative translation adjustment for initial application of SAB 108 (paragraph m)n) | | (586,1427,151,339 | ) |
Increase in net unrealized losses on investment securities | | (618,799664,590 | ) |
Minimum dividend | | (3,589,0303,854,618 | ) |
Net income for the year | | 76,853,39382,540,544 | |
| | | |
BALANCE AT DECEMBER 31, 2006 | | 287,229,854308,484,864 | |
| | | |
Distribution of dividends | | (82,193,175 | ) |
Increase in cumulative translation adjustment of foreign investments | | (16,899,924 | ) |
Increase in net unrealized gains on investment securities | | 877,234 | |
Minimum dividend | | 2,238,478 | |
Net income for the year | | 85,572,118 | |
| | | |
BALANCE AT DECEMBER 31, 2007 | | 298,079,595 | |
F - 50F-54
2 | Additional disclosure requirements: |
2 Additional disclosure requirements:
a) Income taxes
The accounting for income taxes under Chilean GAAP and U.S. GAAP differs for deferred income taxes. Under U.S. GAAP, as set forth in SFAS No. 109, “Accounting for Income Taxes”, all temporary differences arising from transactions that have different accounting and tax treatments are recognized as deferred tax assets and liabilities as of the balance sheet date. A valuation allowance is provided against deferred tax assets that are not recoverable on a more-likely-than-not basis. Under Chilean GAAP, effective January 1, 2000, the Company began applying Technical Bulletin No. 60 of the Chilean Institute of Accountants concerning deferred income taxes. Prior to the implementation of Technical Bulletin No. 60, only deferred tax assets and liabilities that were expected to materialize in the future were recognized in these consolidated financial statements.
The provisions for income taxes included in the consolidated statements of income were as follows:
| | | | | | | | For the year ended December 31, | |
| | | For the year ended December 31, | | | 2007 | | 2006 | | 2005 | |
| | | 2006 | | 2005 | | 2004 | | | ThCh$ | | ThCh$ | | ThCh$ | |
| | | ThCh$ | | ThCh$ | | ThCh$ | | | | | | | | |
Current tax expense as per tax returns | | (9,863,867 | ) | | (9,468,459 | ) | | (3,841,943 | ) | | (22,987,618 | ) | (10,593,793 | ) | (10,169,125 | ) |
Deferred tax expense as previously calculated under Chilean GAAP | | (3,691,458 | ) | | 739,887 | | | (330,695 | ) | | (3,882,773 | ) | (3,964,626 | ) | 794,639 | |
Charge for the year under Chilean GAAP | | | (26,870,391 | ) | (14,558,419 | ) | (9,374,486 | ) |
| | | | | | | | | | | | | | | | |
Charge for the year under Chilean GAAP | | (13,555,325 | ) | | (8,728,572 | ) | | (4,172,638 | ) | |
U.S. GAAP adjustments: | | | | | | | |
Deferred tax effect of applying SFAS 109 to Chilean GAAP results | | (11,881,372 | ) | | 8,585,785 | | | 389,709 | | |
| | | | | | | | | | |
U.S. GAAP adjustments: Deferred tax effect of applying SFAS 109 to Chilean GAAP results | | | 2,077,902 | | (12,760,594 | ) | 9,221,133 | |
Charge from continuous operations for the year under U.S. GAAP | | (25,436,697 | ) | | (142,787 | ) | | (3,782,929 | ) | | (24,792,489 | ) | (27,319,013 | ) | (153,353 | ) |
| | | | | | | | | | |
F - 51F-55
The above table can be broken down into geographic sources as follows:
2007 | | | Chilean
and others | | Brazil | | Argentina | | The Company
(consolidated) | |
| | | | | | | | | | ThCh$ | | ThCh$ | | ThCh$ | | ThCh$ | |
2006 | | Chilean and others | | Brazil | | Argentina | | The Company
(consolidated) | | |
| | | ThCh$ | | ThCh$ | | ThCh$ | | ThCh$ | | | | | | | | | | |
Current tax expense as per tax return | | (5,920,361 | ) | | (3,943,506 | ) | | — | | | (9,863,867 | ) | | (12,439,732 | ) | (6,577,486 | ) | (3,970,400 | ) | (22,987,618 | ) |
Deferred tax expense as previously calculated under Chilean GAAP | | (117,990 | ) | | (1,452,277 | ) | | (2,121,191 | ) | | (3,691,458 | ) | | 5,861,097 | | (7,985,586 | ) | (1,758,284 | ) | (3,882,773 | ) |
| | | | | | | | | | | | | |
Charge for the year under Chilean GAAP | | (6,038,351 | ) | | (5,395,783 | ) | | (2,121,191 | ) | | (13,555,325 | ) | | (6,578,635 | ) | (14,563,072 | ) | (5,728,684 | ) | (26,870,391 | ) |
U.S. GAAP adjustments: | | | | | | | | | | | | | | | | | |
Deferred tax effect of applying SFAS 109 | | 864,728 | | | (12,730,959 | ) | | (15,141 | ) | | (11,881,372 | ) | | 804,522 | | 305,691 | | 967,689 | | 2,077,902 | |
| | | | | | | | | | | | | |
Charge from continuous operations for the year under U.S. GAAP | | (5,173,623 | ) | | (18,126,742 | ) | | (2,136,332 | ) | | (25,436,697 | ) | | (5,774,113 | ) | (14,257,381 | ) | (4,760,995 | ) | (24,792,489 | ) |
| | | | | | | | | | | | | |
| 2005 | | Chilean and others | | Brazil | | Argentina | | The Company
(consolidated) | | |
| | | ThCh$ | | ThCh$ | | ThCh$ | | ThCh$ | | |
Current tax expense as per tax return | | (5,936,473 | ) | | (2,867,663 | ) | | (664,323 | ) | | (9,468,459 | ) | |
Deferred tax (expense) benefit as previously calculated under Chilean GAAP | | 36,362 | | | 925,947 | | | (222,422 | ) | | 739,887 | | |
| | | | | | | | | | | | | |
Charge for the year under Chilean GAAP | | (5,900,111 | ) | | (1,941,716 | ) | | (886,745 | ) | | (8,728,572 | ) | |
U.S. GAAP adjustments: | | | | | | | | | |
Deferred tax effect of applying SFAS 109 | | (323,183 | ) | | 8,798,924 | | | 110,044 | | | 8,585,785 | | |
| | | | | | | | | | | | | |
(Charge) benefit from continuous operations for the year under U.S. GAAP | | (6,223,294 | ) | | 6,857,208 | | | (776,701 | ) | | (142,787 | ) | |
| | | | | | | | | | | | | |
| 2004 | | Chilean and others | | Brazil | | Argentina | | The Company
(consolidated) | | |
| | | ThCh$ | | ThCh$ | | ThCh$ | | ThCh$ | | |
Current tax expense as per tax return | | (2,125,257 | ) | | (1,541,905 | ) | | (174,781 | ) | | (3,841,943 | ) | |
Deferred tax (expense) benefit as previously calculated under Chilean GAAP | | (2,206,522 | ) | | 456,635 | | | 1,419,192 | | | (330,695 | ) | |
| | | | | | | | | | | | | |
(Charge) benefit for the year under Chilean GAAP | | (4,331,779 | ) | | (1,085,270 | ) | | 1,244,411 | | | (4,172,638 | ) | |
U.S. GAAP adjustments: | | | | | | | | | |
Deferred tax effect of applying SFAS 109 | | 91,787 | | | (5,618 | ) | | 303,540 | | | 389,709 | | |
| | | | | | | | | | | | | |
(Charge) benefit from continuous operations for the year under U.S. GAAP | | (4,239,992 | ) | | (1,090,888 | ) | | 1,547,951 | | | (3,782,929 | ) | |
| | | | | | | | | | | | | |
2006 | | Chilean
and others | | Brazil | | Argentina | | The Company
(consolidated) | |
| | ThCh$ | | ThCh$ | | ThCh$ | | ThCh$ | |
| | | | | | | | | |
Current tax expense as per tax return | | (6,358,468 | ) | (4,235,325 | ) | — | | (10,593,793 | ) |
Deferred tax (expense) benefit as previously calculated under Chilean GAAP | | (126,721 | ) | (1,559,745 | ) | (2,278,160 | ) | (3,964,626 | ) |
Charge for the year under Chilean GAAP | | (6,485,189 | ) | (5,795,070 | ) | (2,278,160 | ) | (14,558,419 | ) |
U.S. GAAP adjustments: | | | | | | | | | |
Deferred tax effect of applying SFAS 109 | | 928,718 | | (13,673,050 | ) | (16,262 | ) | (12,760,594 | ) |
(Charge) benefit from continuous operations for the year under U.S. GAAP | | (5,556,471 | ) | (19,468,120 | ) | (2,294,422 | ) | (27,319,013 | ) |
2005 | | Chilean
and others | | Brazil | | Argentina | | The Company
(consolidated) | |
| | ThCh$ | | ThCh$ | | ThCh$ | | ThCh$ | |
| | | | | | | | | |
Current tax expense as per tax return | | (6,375,772 | ) | (3,079,870 | ) | (713,483 | ) | (10,169,125 | ) |
Deferred tax (expense) benefit as previously calculated under Chilean GAAP | | 39,053 | | 994,467 | | (238,881 | ) | 794,639 | |
(Charge) benefit for the year under Chilean GAAP | | (6,336,719 | ) | (2,085,403 | ) | (952,364 | ) | (9,374,486 | ) |
U.S. GAAP adjustments: | | | | | | | | | |
Deferred tax effect of applying SFAS 109 | | (347,098 | ) | 9,450,044 | | 118,187 | | 9,221,133 | |
(Charge) benefit from continuous operations for the year under U.S. GAAP | | (6,683,817 | ) | 7,364,641 | | (834,177 | ) | (153,353 | ) |
F - 52F-56
Deferred tax assets (liabilities) as of balance sheet dates are summarized as follows:
| | | | For the year ended December 31, | | | For the year ended December 31, | |
| | | 2006 | | 2005 | | | 2007 | | 2006 | |
| | | ThCh$ | | ThCh$ | | | ThCh$ | | ThCh$ | |
Deferred tax assets: | | | | | | | | | |
Tax loss carryforwards | | 5,941,318 | | | 10,045,174 | | | 3,649,664 | | 6,380,975 | |
Social contribution | | 2,019,938 | | | 2,531,046 | | | 1,313,879 | | 2,169,413 | |
Tax-credits Argentina currency devaluation | | — | | | 490,076 | | |
Provision for labor and trade lawsuits | | 1,469,964 | | | 6,050,556 | | | 1,569,529 | | 1,578,741 | |
Provision for assets written-off | | 1,723,667 | | | 1,868,241 | | | 2,262,273 | | 1,851,218 | |
Allowance for doubtful accounts | | 250,621 | | | 335,509 | | | 337,187 | | 269,167 | |
Vacation accrual | | 188,582 | | | 159,313 | | | 215,299 | | 202,537 | |
Provisions for employee benefits | | 736,121 | | | 507,139 | | | 791,234 | | 790,594 | |
Joint venture accounting | | 554,099 | | | 664,918 | | | 476,081 | | 595,102 | |
Fair value of derivatives not considered to be hedge | | | 51,962 | | — | |
Unrealized loss on investments securities | | 47,425 | | | 49,995 | | | — | | 50,934 | |
Other | | 1,029,115 | | | 834,083 | | | 786,966 | | 1,105,270 | |
Less: Valuation allowance | | — | | | (2,199,187 | ) | |
| | | | | | | | | | | |
Total deferred tax assets | | 13,960,850 | | | 21,336,863 | | | 11,454,074 | | 14,993,951 | |
| | | | | | | | | | | |
Deferred tax liabilities: | | | | | | | | | |
Depreciation | | 4,204,035 | | | 4,331,508 | | | 5,900,926 | | 4,515,134 | |
Guarantees on bottles | | 2,246,257 | | | 2,673,313 | | | — | | 2,412,480 | |
Staff severance indemnities | | 253,087 | | | 310,689 | | | 193,511 | | 271,815 | |
Financial expenses | | 3,962,637 | | | 3,433,646 | | | — | | 4,255,872 | |
Fair value of derivatives not considered to be hedge | | 9,956 | | | 655,603 | | | — | | 10,693 | |
Unrealized loss on investments securities | | | 1,747 | | — | |
Exchange rate difference | | 8,578,522 | | | — | | | 12,604,169 | | 9,213,333 | |
Other | | 156,021 | | | 296,466 | | | 245,518 | | 167,565 | |
| | | | | | | | | | | |
Total deferred tax liabilities | | 19,410,515 | | | 11,701,225 | | | 18,945,871 | | 20,846,892 | |
| | | | | | | | | | | |
Net deferred tax (liabilities) assets under U.S. GAAP | | (5,449,665 | ) | | 9,635,638 | | | (7,491,797 | ) | (5,852,941 | ) |
| | | | | | | | | | | |
Net deferred tax liabilities under Chilean GAAP | | (3,237,224 | ) | | (35,863 | ) | | (7,140,857 | ) | (3,476,779 | ) |
| | | | | | | | | | | |
Effect of U.S. GAAP adjustments on deferred income taxes | | (2,212,441 | ) | | 9,671,501 | | | (350,940 | ) | (2,376,162 | ) |
| | | | | | | |
F - 53F-57
The provision for income taxes differs from the amount of income tax determined by applying the applicable Chilean statutory income tax rate to pretax income calculated according to U.S. GAAP as a result of the following:
| | | | | | | | For the year ended December 31, | |
| | | For the year ended December 31, | | | 2007 | | 2006 | | 2005 | |
| | | 2006 | | 2005 | | 2004 | | | ThCh$ | | ThCh$ | | ThCh$ | |
| | | ThCh$ | | ThCh$ | | ThCh$ | | | | | | | | |
Income tax provision at statutory Chilean tax rates | | 17,389,315 | | | 13,073,976 | | | 9,916,127 | | | 18,761,983 | | 18,676,124 | | 14,041,450 | |
Increase (decrease) in provision resulting from: | | | | | | | | | | | | | |
Tax effects resulting from foreign operations | | 6,319,106 | | | 2,020,617 | | | 1,108,148 | | | 9,234,755 | | 6,786,720 | | 2,170,143 | |
Permanent differences | | 6,206,034 | | | (185,459 | ) | | (3,287,300 | ) | | (354,146 | ) | 6,665,281 | | (199,183 | ) |
Effect of remeasurement to U.S. dollars (Brazil and Argentina) | | (130,145 | ) | | (1,010,975 | ) | | (155,817 | ) | | (950,758 | ) | (139,776 | ) | (1,085,787 | ) |
Change in valuation allowance | | (2,390,586 | ) | | (13,491,502 | ) | | (2,115,704 | ) | | — | | (2,567,489 | ) | (14,489,873 | ) |
Adjustments in prior year income taxes | | 115,569 | | | 160,055 | | | (574,214 | ) | | (373,906 | ) | 124,121 | | 171,899 | |
Other | | (2,072,596 | ) | | (423,925 | ) | | (1,108,311 | ) | | (1,525,439 | ) | (2,225,968 | ) | (455,295 | ) |
| | | | | | | | | | |
Effective tax provision | | 25,436,697 | | | 142,787 | | | 3,782,929 | | | 24,792,489 | | 27,319,013 | | 153,354 | |
| | | | | | | | | | |
The Chilean statutory first category (corporate) income tax rate was 17.0% for 2007, 2006 2005 and 2004.2005. In accordance with Chilean law, the Company and each of its subsidiaries computes and pays income taxes on a separate basis.
The Brazilian federal statutory income tax rate was approximately 25% for 2007, 2006 2005 and 2004.2005. Additionally, an additional surtax of 9% for 2007, 2006 2005 and 20042005 is charged in Brazil on net income with respect to a social contribution similar in nature to income tax.
The Argentine income tax rate was 35% for 2007, 2006 2005 and 20042005 in accordance with currently enacted tax legislation.
The Company had net operating tax loss carryforwards related to its Brazilian subsidiaries of approximately ThCh$ 22,443,75914,598,628 at December 31, 20062007 that can be carried forward indefinitely. The Company had net operating tax
Tax loss carryforwards related to itsthe Argentinean subsidiaries of approximately ThCh$ 943,933. The tax losses in Argentina can be imputed to future tax gains up to a 5 year term. Since the total tax loss in Argentina was generated by the devaluation of the Argentine peso in 2002, the expiration of the tax benefit iswere fully utilized during 2007.
F - 54
Tax years that remain subject to income tax audits by taxing authorities by country are as follows:
b)Chile | Comprehensive income (loss)From 2005 |
Argentina | From 2003 |
Brazil | From 2002 |
Interest and penalties related to income tax liabilities are included in income tax expense.
F-58
b) Comprehensive income (loss)
Comprehensive income (loss) is the change in equity of a business enterprise during a period from transactions and other events and circumstances from non-owner sources. For U.S. GAAP purposes, companies are required to report comprehensive income and its components in a full set of general purpose financial statements. U.S. GAAP requires that all items that are required to be recognized under accounting standards as components of comprehensive income be reported in a financial statement that is displayed with the same prominence as other financial statements. The information required by this standard is shown in paragraph 1 n), above.
c) | Statements of cash flows |
c) Statements of cash flows
i) | For the purpose of the statements of cash flows using U.S. GAAP classifications, the Company considers all highly liquid investments purchased with an original maturity of three months or less to be cash equivalents. In accordance with the Company’s policy, certain cash equivalents that are managed as part of the Company’s investment portfolio are excluded from the amount shown as cash and cash equivalents in the statements of cash flows. The detail of cash and cash equivalents is as follows: |
| | | | | | |
| | | For the year ended December 31, |
| | | 2006 | | 2005 | | 2004 |
| | | ThCh$ | | ThCh$ | | ThCh$ |
Cash | | 16,342,273 | | 14,715,194 | | 14,625,581 |
Time deposits | | 7,173,319 | | 4,552,167 | | 7,998,326 |
Money market funds | | 17,086,852 | | 2,325,673 | | 6,082,552 |
Securities purchased under agreements to resell | | 970,304 | | — | | — |
| | | | | | |
Total cash and cash equivalents | | 41,572,748 | | 21,593,034 | | 28,706,459 |
| | | | | | |
ii) | Additional cash flow disclosures required under U.S. GAAP that are shown net in Chilean GAAP are as follows: |
| | | | | | | | | |
| | | For the year ended December 31, | |
| | | 2006 | | | 2005 | | | 2004 | |
| | | ThCh$ | | | ThCh$ | | | ThCh$ | |
Short-term borrowings with banks and financial institutions | | 44,062,985 | | | 55,829,651 | | | 63,560,991 | |
Long-term borrowings with banks and financial institutions | | 407,258 | | | — | | | — | |
Repayment of short-term bank borrowings | | (49,122,812 | ) | | (64,114,129 | ) | | (48,255,261 | ) |
Repayment of long-term bank borrowings | | (22,056,314 | ) | | (22,233,893 | ) | | (1,331,668 | ) |
| | | | | | | | | |
Net bank borrowings | | (26,708,883 | ) | | (30,518,371 | ) | | 13,974,062 | |
| | | | | | | | | |
F - 55
i) For the purpose of the statements of cash flows using U.S. GAAP classifications, the Company considers all highly liquid investments purchased with an original maturity of three months or less to be cash equivalents. In accordance with the Company’s policy, certain cash equivalents that are managed as part of the Company’s investment portfolio are excluded from the amount shown as cash and cash equivalents in the statements of cash flows. The detail of cash and cash equivalents is as follows: | | For the year ended December 31, | |
| | 2007 | | 2006 | | 2005 | |
| | ThCh$ | | ThCh$ | | ThCh$ | |
| | | | | | | |
Cash | | 24,754,142 | | 17,551,601 | | 15,804,118 | |
Time deposits | | 49,088,381 | | 7,704,145 | | 4,889,027 | |
Money market funds | | 47,529,183 | | 18,351,281 | | 2,497,774 | |
Securities purchased under agreements to resell | | — | | 1,042,106 | | — | |
Total cash and cash equivalents | | 121,371,706 | | 44,649,133 | | 23,190,919 | |
ii) Additional cash flow disclosures required under U.S. GAAP that are shown net in Chilean GAAP are as follows:
| | For the year ended December 31, | |
| | 2007 | | 2006 | | 2005 | |
| | ThCh$ | | ThCh$ | | ThCh$ | |
| | | | | | | |
Short-term borrowings with banks and financial institutions | | 52,564,680 | | 47,323,646 | | 59,961,045 | |
Long-term borrowings with banks and financial institutions | | 33,172 | | 437,395 | | — | |
Repayment of short-term bank borrowings | | (50,806,948 | ) | (52,757,900 | ) | (68,858,575 | ) |
Repayment of long-term bank borrowings | | (521,424 | ) | (23,688,481 | ) | (23,879,201 | ) |
Net bank borrowings | | 1,269,480 | | (28,685,340 | ) | (32,776,731 | ) |
F-59
d) Segment information
The Company operates principally in three segments which comprise the production and sales of goods for (i) Coca-Cola soft drinks, (ii) Other beverages (juices, mineral water and beer), and (iii) Packaging. Total revenues by segment include sales to unaffiliated customers, as reported in the Company’s consolidated income statements, and inter-segment sales, which are accounted for at invoice price.
The Company measures its reportable segments and evaluates their performance based on operating income under Chilean GAAP.
The Coca-Cola soft drink segment comprises the production and sales of Coca-Cola, Sprite, Fanta and other Coca-Cola soft drinks. The Other beverages segment includes the sales of mineral water, fruit juices and, in Brazil, beer. The Packaging segment consists of the production of PET containers.
The accounting policies for the segments are the same as those described in “Note 1 - Nature of operations and summary of significant accounting policies”.
F - 56F-60
A summary of the Company’s operations by segment calculated under Chilean GAAP is as follows:
| | | | For the year ended December 31, | | | For the year ended December 31, | |
| | | 2006 | | 2005 | | 2004 | | | 2007 | | 2006 | | 2005 | |
| | | ThCh$ | | ThCh$ | | ThCh$ | | | ThCh$ | | ThCh$ | | ThCh$ | |
Revenue: | | | | | | | | | | | | | |
Sales to unaffiliated customers: | | | | | | | | | | | | | |
Soft drinks | | 481,700,151 | | | 414,672,528 | | | 372,976,926 | | | 559,300,469 | | 517,345,962 | | 445,358,295 | |
Other beverages | | 58,499,679 | | | 49,109,427 | | | 43,962,930 | | | 71,014,867 | | 62,828,656 | | 52,743,524 | |
Packaging | | 6,531,994 | | | 12,289,786 | | | 10,540,691 | | | 6,373,694 | | 7,015,361 | | 13,199,231 | |
| | | | | | | | | | |
Subtotal | | 546,731,824 | | | 476,071,741 | | | 427,480,547 | | | 636,689,030 | | 587,189,979 | | 511,301,050 | |
| | | | | | | | | | | | | | | | |
Intersegment sales: | | | | | | | | | | | | | |
Soft drinks | | — | | | — | | | — | | | — | | — | | — | |
Other beverages | | 16,221,448 | | | 15,836,684 | | | 14,906,258 | | | 20,041,944 | | 17,421,835 | | 17,008,599 | |
Packaging | | 10,979,710 | | | 10,152,727 | | | 9,130,402 | | | 11,388,770 | | 11,792,209 | | 10,904,029 | |
Eliminations | | (27,201,158 | ) | | (25,989,411 | ) | | (24,036,660 | ) | | (31,430,714 | ) | (29,214,044 | ) | (27,912,628 | ) |
| | | | | | | | | | |
Subtotal | | — | | | — | | | — | | | — | | — | | — | |
| | | | | | | | | | |
Total revenue | | 546,731,824 | | | 476,071,741 | | | 427,480,547 | | | 636,689,030 | | 587,189,979 | | 511,301,050 | |
| | | | | | | | | | | | | | | | |
Operating income: | | | | | | | | | | | | | |
Soft drinks | | 85,556,882 | | | 70,291,076 | | | 58,766,686 | | | 107,000,601 | | 91,888,091 | | 75,492,615 | |
Other beverages | | 7,513,799 | | | 7,104,161 | | | 5,734,172 | | | 6,774,564 | | 8,069,820 | | 7,629,869 | |
Packaging | | 1,991,413 | | | 2,148,878 | | | 2,017,248 | | | 1,719,177 | | 2,138,778 | | 2,307,896 | |
| | | | | | | | | | |
Total operating income | | 95,062,094 | | | 79,544,115 | | | 66,518,106 | | | 115,494,342 | | 102,096,689 | | 85,430,380 | |
| | | | | | | | | | | | | | | | |
Financial income: | | | | | | | | | | | | | |
Soft drinks | | 12,518,674 | | | 29,115,591 | | | 24,660,959 | | | 22,871,516 | | 13,445,056 | | 31,270,144 | |
Other beverages | | 8,589 | | | 2,875 | | | 333 | | | 63,644 | | 9,225 | | 3,088 | |
Packaging | | 5,014 | | | 2,509 | | | 2,185 | | | — | | 5,383 | | 2,694 | |
| | | | | | | | | | |
Total financial income | | 12,532,277 | | | 29,120,975 | | | 24,663,477 | | | 22,935,160 | | 13,459,664 | | 31,275,926 | |
| | | | | | | | | | | | | | | | |
Financial expenses: | | | | | | | | | | | | | |
Soft drinks | | 15,259,633 | | | 21,453,748 | | | 20,016,716 | | | 14,967,080 | | 16,388,846 | | 23,041,326 | |
Other beverages | | 6,510 | | | 3,060 | | | 85,514 | | | 91,688 | | 6,992 | | 3,285 | |
Packaging | | 106,733 | | | 98,719 | | | 143,730 | | | 102,260 | | 114,633 | | 106,025 | |
| | | | | | | | | | |
Total financial expenses | | 15,372,876 | | | 21,555,527 | | | 20,245,960 | | | 15,161,028 | | 16,510,471 | | 23,150,636 | |
| | | | | | | | | | |
F - 57F-61
| | | | For the year ended December 31, | | For the year ended December 31, | |
| | | 2006 | | 2005 | | 2004 | | 2007 | | 2006 | | 2005 | |
| | | ThCh$ | | ThCh$ | | ThCh$ | | ThCh$ | | ThCh$ | | ThCh$ | |
Share of income from unconsolidated affiliates: | | | | | | | | | | | | | |
Soft drinks | | 67,745 | | | 12,875 | | 213,793 | | (276,974 | ) | 72,758 | | 13,827 | |
Other beverages | | 68,278 | | | 494,108 | | 599,905 | | 205,049 | | 73,331 | | 530,673 | |
Packaging | | 379,530 | | | 278,713 | | 231,668 | | 740,423 | | 407,617 | | 299,338 | |
| | | | | | | | |
Total share of income from unconsolidated affiliates Subtotal | | 515,553 | | | 785,696 | | 1,045,366 | | 668,498 | | 553,706 | | 843,838 | |
| | | | | | | | | | | | | | |
Income tax expenses: | | | | | | | | | | | | | |
Soft drinks | | 13,207,934 | | | 6,223,337 | | 3,809,135 | | 25,823,581 | | 14,185,321 | | 6,683,864 | |
Other beverages | | 368,432 | | | 1,855,432 | | 140,166 | | 377,836 | | 395,696 | | 1,992,734 | |
Packaging | | (21,041 | ) | | 649,803 | | 223,337 | | 668,974 | | (22,598 | ) | 697,888 | |
| | | | | | | | |
Total income tax expenses | | 13,555,325 | | | 8,728,572 | | 4,172,638 | | 26,870,391 | | 14,558,419 | | 9,374,486 | |
| | | | | | | | | | | | | | |
Depreciation: | | | | | | | | | | | | | |
Soft drinks | | 27,455,971 | | | 27,550,693 | | 30,644,816 | | 27,085,609 | | 29,487,713 | | 29,589,444 | |
Other beverages | | 1,096,784 | | | 1,148,209 | | 1,277,817 | | 1,215,103 | | 1,177,946 | | 1,233,176 | |
Packaging | | 1,001,131 | | | 947,892 | | 1,342,966 | | 847,257 | | 1,075,215 | | 1,018,037 | |
| | | | | | | | |
Total depreciation | | 29,553,886 | | | 29,646,794 | | 33,265,599 | | 29,147,969 | | 31,740,874 | | 31,840,657 | |
| | | | | | | | | | | | | | |
Segment assets: | | | | | | | | | | | | | |
Soft drinks | | 347,396,186 | | | 360,567,305 | | 466,784,359 | | 281,628,830 | | 373,103,504 | | 387,249,286 | |
Other beverages | | 9,533,485 | | | 14,108,173 | | 11,349,753 | | 10,665,332 | | 10,238,963 | | 15,152,178 | |
Packaging | | 6,554,713 | | | 11,202,878 | | 13,346,108 | | 4,163,227 | | 7,039,762 | | 12,031,891 | |
| | | | | | | | |
Total segment assets | | 363,484,384 | | | 385,878,356 | | 491,480,220 | | 296,457,389 | | 390,382,229 | | 414,433,355 | |
| | | | | | | | | | | | | | |
Capital expenditures: | | | | | | | | | | | | | |
Soft drinks | | 35,020,441 | | | 26,997,195 | | 25,302,338 | | 53,880,905 | | 37,611,954 | | 28,994,987 | |
Other beverages | | 1,673,225 | | | 679,705 | | 894,117 | | 1,569,174 | | 1,797,043 | | 730,003 | |
Packaging | | 310,703 | | | 293,535 | | 502,353 | | 574,370 | | 333,695 | | 315,257 | |
| | | | | | | | |
Total capital expenditures | | 37,004,369 | | | 27,970,435 | | 26,698,808 | | 56,024,449 | | 39,742,692 | | 30,040,247 | |
| | | | | | | | |
F - 58F-62
A geographical summary of the Company’s operations by segment calculated under Chilean GAAP is as follows:
| | | | For the year ended December 31, | | | For the year ended December 31, | |
| | | 2006 | | 2005 | | 2004 | | | 2007 | | 2006 | | 2005 | |
| | | ThCh$ | | ThCh$ | | ThCh$ | | | ThCh$ | | ThCh$ | | ThCh$ | |
Revenue: | | | | | | | | | | | | | |
Sales to unaffiliated customers: | | | | | | | | | | | | | |
Chile | | 219,791,281 | | 212,050,410 | | | 203,144,812 | | | 244,655,928 | | 236,055,836 | | 227,742,140 | |
Brazil | | 218,904,483 | | 165,922,845 | | | 135,348,579 | | | 269,999,017 | | 235,103,415 | | 178,201,135 | |
Argentina | | 108,036,060 | | 98,098,486 | | | 88,987,156 | | | 122,034,085 | | 116,030,728 | | 105,357,775 | |
| | | | | | | | | |
Total revenue | | 546,731,824 | | 476,071,741 | | | 427,480,547 | | | 636,689,030 | | 587,189,979 | | 511,301,050 | |
| | | | | | | | | | | | | | | |
Operating income: | | | | | | | | | | | | | |
Chile | | 48,148,694 | | 47,470,772 | | | 42,840,816 | | | 52,114,557 | | 51,711,697 | | 50,983,609 | |
Brazil | | 34,929,708 | | 20,910,375 | | | 14,025,313 | | | 49,437,206 | | 37,514,506 | | 22,457,743 | |
Argentina | | 11,983,692 | | 11,162,968 | | | 9,651,977 | | | 13,942,579 | | 12,870,486 | | 11,989,028 | |
| | | | | | | | | |
Total operating income | | 95,062,094 | | 79,544,115 | | | 66,518,106 | | | 115,494,342 | | 102,096,689 | | 85,430,380 | |
| | | | | | | | | | | | | | | |
Financial income: | | | | | | | | | | | | | |
Chile | | 7,226,132 | | 24,556,120 | | | 21,903,423 | | | 20,421,952 | | 7,760,866 | | 26,373,273 | |
Brazil | | 5,220,036 | | 3,748,456 | | | 2,695,306 | | | 2,170,107 | | 5,606,319 | | 4,025,841 | |
Argentina | | 86,109 | | 816,399 | | | 64,748 | | | 343,101 | | 92,479 | | 876,812 | |
| | | | | | | | | |
Total financial income | | 12,532,277 | | 29,120,975 | | | 24,663,477 | | | 22,935,160 | | 13,459,664 | | 31,275,926 | |
| | | | | | | | | | | | | | | |
Financial expenses: | | | | | | | | | | | | | |
Chile | | 9,006,856 | | 13,671,252 | | | 10,976,941 | | | 9,497,447 | | 9,673,363 | | 14,682,925 | |
Brazil | | 3,903,129 | | 3,233,204 | | | 4,762,470 | | | 3,626,265 | | 4,191,961 | | 3,472,461 | |
Argentina | | 2,462,891 | | 4,651,071 | | | 4,506,549 | | | 2,037,316 | | 2,645,147 | | 4,995,250 | |
| | | | | | | | | |
Total financial expenses | | 15,372,876 | | 21,555,527 | | | 20,245,960 | | | 15,161,028 | | 16,510,471 | | 23,150,636 | |
| | | | | | | | | | | | | | | |
Share of income from unconsolidated affiliates: | | | | | | | | | | | | | |
Chile | | 357,047 | | (95,795 | ) | | 317,688 | | | 741,255 | | 383,470 | | (102,883 | ) |
Brazil | | 68,278 | | 494,108 | | | 599,905 | | | 205,049 | | 73,331 | | 530,672 | |
Argentina | | 90,228 | | 387,383 | | | 127,773 | | | (277,806 | ) | 96,905 | | 416,049 | |
| | | | | | | | | |
Total share of income from unconsolidated affiliates | | 515,553 | | 785,696 | | | 1,045,366 | | | 668,498 | | 553,706 | | 843,838 | |
| | | | | | | | | | | | | | | |
Income tax expenses (benefit): | | | | | | | | | | | | | |
Chile | | 6,038,351 | | 5,900,111 | | | 4,331,779 | | | 6,578,635 | | 6,485,189 | | 6,336,719 | |
Brazil | | 5,395,783 | | 1,941,716 | | | 1,085,270 | | | 14,563,072 | | 5,795,071 | | 2,085,403 | |
Argentina | | 2,121,191 | | 886,745 | | | (1,244,411 | ) | | 5,728,684 | | 2,278,159 | | 952,364 | |
| | | | | | | | | |
Total income tax expenses | | 13,555,325 | | 8,728,572 | | | 4,172,638 | | | 26,870,391 | | 14,558,419 | | 9,374,486 | |
| | | | | | | | | |
F - 59F-63
| | At December 31, | |
| | 2007 | | 2006 | | 2005 | |
| | ThCh$ | | ThCh$ | | ThCh$ | |
| | | | | | | |
Depreciation: | | | | | | | |
Chile | | 12,724,082 | | 13,964,156 | | 14,646,095 | |
Brazil | | 9,912,275 | | 10,455,348 | | 9,877,850 | |
Argentina | | 6,511,612 | | 7,321,370 | | 7,316,712 | |
Total depreciation | | 29,147,969 | | 31,740,874 | | 31,840,657 | |
| | | | | | | |
Identificable long-lived assets: | | | | | | | |
Chile | | 107,252,416 | | 162,942,470 | | 191,100,482 | |
Brazil | | 109,547,869 | | 138,066,891 | | 129,496,751 | |
Argentina | | 57,808,855 | | 74,326,077 | | 78,585,797 | |
Total identificable long-lived assets | | 274,609,140 | | 375,335,438 | | 399,183,030 | |
| | | | | | |
| | | At December 31, |
| | | 2006 | | 2005 | | 2004 |
| | | ThCh$ | | ThCh$ | | ThCh$ |
Depreciation: | | | | | | |
Chile | | 13,002,007 | | 13,636,960 | | 14,847,320 |
Brazil | | 9,734,961 | | 9,197,253 | | 10,802,884 |
Argentina | | 6,816,918 | | 6,812,581 | | 7,615,395 |
| | | | | | |
Total depreciation | | 29,553,886 | | 29,646,794 | | 33,265,599 |
| | | | | | |
Identifiable long-lived assets: | | | | | | |
Chile | | 151,715,521 | | 177,933,410 | | 253,214,932 |
Brazil | | 128,553,902 | | 120,574,256 | | 128,483,314 |
Argentina | | 69,204,915 | | 73,171,133 | | 91,551,503 |
| | | | | | |
Total identifiable long-lived assets | | 349,474,338 | | 371,678,799 | | 473,249,749 |
| | | | | | |
A reconciliation of total segment assets by product, and long-lived assets by country to total consolidated assets for the years ended December 31, 2007, 2006 2005 and 20042005 is as follows:
| | | | At December 31, | | At December 31, | |
Industry | | 2006 | | 2005 | | 2004 | | 2007 | | 2006 | | 2005 | |
| | | ThCh$ | | ThCh$ | | ThCh$ | |
| | | ThCh$ | | ThCh$ | | ThCh$ | | | | | | | |
Total segment assets | | 363,484,384 | | 385,878,355 | | 491,480,219 | | 296,457,389 | | 390,382,229 | | 414,433,355 | |
Cash | | 16,342,273 | | 14,715,194 | | 14,625,581 | | 24,754,142 | | 17,551,601 | | 15,804,118 | |
Financial instruments | | 33,216,669 | | 40,537,634 | | 25,008,857 | | 97,621,942 | | 35,674,703 | | 43,537,419 | |
Amounts due from related parties | | 2,929,747 | | 5,727,454 | | 122,410 | | 1,896,786 | | 3,146,548 | | 6,151,286 | |
Recoverable taxes | | 7,911,516 | | 9,985,558 | | 5,894,839 | | 9,716,707 | | 8,496,968 | | 10,724,489 | |
Deferred income taxes | | 890,432 | | 690,704 | | — | | 5,234,679 | | 956,324 | | 741,816 | |
Investments in related companies | | 22,466,621 | | 21,835,178 | | 21,168,707 | | 24,961,690 | | 24,129,151 | | 23,450,981 | |
Investment in other companies | | 55,945 | | 55,716 | | 57,382 | | 133,944 | | 60,085 | | 59,839 | |
Intangible assets (net) | | 167,452 | | 179,542 | | 227,314 | | 162,478 | | 179,843 | | 192,828 | |
Liabilities deducted from segment assets | | 66,134,108 | | 57,491,304 | | 54,628,847 | | 79,488,510 | | 71,028,033 | | 61,745,659 | |
| | | | | | | |
Total assets | | 513,599,147 | | 537,096,639 | | 613,214,156 | | 540,428,267 | | 551,605,485 | | 576,841,790 | |
| | | | | | | | | | | | | |
Identifiable long-lived assets | | 349,474,338 | | 371,678,799 | | 473,249,749 | | 274,609,140 | | 375,335,438 | | 399,183,030 | |
Current assets | | 164,124,809 | | 165,417,840 | | 139,964,407 | | 265,819,127 | | 176,270,047 | | 177,658,760 | |
| | | | | | | |
Total assets | | 513,599,147 | | 537,096,639 | | 613,214,156 | | 540,428,267 | | 551,605,485 | | 576,841,790 | |
| | | | | | | |
F - 60F-64
e) | Derivative financial instruments |
e) Derivative financial instrumentsDerivative financial instruments are used by the Company principally in the management of foreign currency risk and its exposure to changes in the price of sugar. The Company does not hold or issue derivative financial instruments for trading purposes. See Note 2526 above for the detail of the derivative instruments outstanding at December 31, 20062007 and 2005.2006.
As described in paragraph 1k), under U.S. GAAP, the Company applies SFAS 133. SFAS 133 requires that all derivative instruments be recognized on the balance sheet at fair value and that changes in the fair value be recognized in income when they occur, the only exception being derivatives that qualify as hedges. To qualify the derivative instrument as a hedge, the Company must meet strict hedge effectiveness and contemporaneous documentation requirements at the initiation of the hedge and assess the hedge effectiveness on an ongoing basis over the life of the hedge. None of the Company’s derivative financial instruments were designated as hedges for U.S. GAAP reconciliation purposes.
The financial instruments used by the Company involve elements of market risk and credit risk. Market risk is the possibility that future changes in foreign exchange may make the financial instruments more or less valuable. Credit risk is the possibility of default by the counterparties. The loss that the Company would incur if a counterparty defaulted is significantly less than the instruments’ notional value and the loss exposure is the fair value of the instrument. The Company does not require collateral or other security for the instruments except for operations undertaken on the London International Financial Futures and Options Exchange futures market, for which a margin deposit of US$ 1,800 for each 50 tons of sugar transacted is required.
F - 61F-65
f) Operating incomeUnder Chilean GAAP, the following income and expenses arising during the years ended 2007, 2006 2005 and 20042005 are classified as “Non-operating income and expense” whereas under U.S. GAAP they would be included within “Operating income”:
| | | | | | | | At December 31, | |
| | | At December 31, | | | 2007 | | 2006 | | 2005 | |
| | | 2006 | | 2005 | | 2004 | | | ThCh$ | | ThCh$ | | ThCh$ | |
| | | ThCh$ | | ThCh$ | | ThCh$ | | | | | | | | |
Operating income as reported under Chilean GAAP | | 95,062,094 | | | 79,544,115 | | | 66,518,106 | | | 115,494,342 | | 102,096,689 | | 85,430,380 | |
Gain on sale of, plant property and equipment | | — | | | 273,459 | | | — | | | — | | — | | 293,695 | |
Lease of property (offices) | | — | | | — | | | 29,726 | | |
Reversal of Pis Cofin provision | | 4,179,585 | | | — | | | — | | |
Provision for property, plant and equipment Itaoca | | — | | | — | | | (3,058,618 | ) | |
Reversal of Pis Cofins provision | | | — | | 4,488,874 | | — | |
Tax recoveries - Pis Cofins | | | 1,371,898 | | — | | — | |
Staff severance indemnities | | — | | | (2,454,488 | ) | | (2,434 | ) | | — | | — | | (2,636,120 | ) |
Lawsuit fees | | (437,859 | ) | | (513,467 | ) | | — | | | — | | (470,261 | ) | (551,464 | ) |
Realization of deposits in guaranty over containers | | 490,075 | | | — | | | — | | | 351,022 | | 526,341 | | — | |
Provision PIS Coffins | | — | | | (2,328,102 | ) | | — | | |
Provision PIS Cofins | | | — | | — | | (2,500,382 | ) |
Provision for labor, tax and commercial lawsuits | | (747,737 | ) | | (555,882 | ) | | (1,752,974 | ) | | (703,079 | ) | (803,070 | ) | (597,017 | ) |
Obsolescence and write-off of property, plant and equipment | | (3,714,979 | ) | | (1,136,813 | ) | | (130,828 | ) | | (1,025,649 | ) | (3,989,887 | ) | (1,220,937 | ) |
Loss on sale of property, plant and equipment | | (2,128,203 | ) | | — | | | (297,633 | ) | | (146,702 | ) | (2,285,690 | ) | — | |
Provision for loss of investment in Transora | | — | | | — | | | (648,580 | ) | |
Provision for equity investee in Centralli Refrigerantes S.A. | | (64,458 | ) | | (62,094 | ) | | (83,776 | ) | | — | | (69,228 | ) | (66,689 | ) |
| | | | | | | | | | |
Operating income under U.S. GAAP format | | 92,638,518 | | | 72,766,728 | | | 60,572,989 | | | 115,341,832 | | 99,493,768 | | 78,151,466 | |
| | | | | | | | | | |
g) | Concentrations of credit risk |
g) Concentrations of credit risk
The assets of the Company that are potentially subject to significant concentrations of credit risk are deposits held with banks and financial institutions, investments in derivative instruments and trade accounts receivable.
The Company holds accounts with a variety of banks and does not hold significant deposits or derivative instruments with any single bank. The Company has a wide customer base and trades with a large number of small customers. Consequently, the Company does not believe that it had any significant concentrations of credit risk at December 31, 2006.2007.
F - 62F-66
h) | Disclosures regarding the fair values of financial instruments |
h) Disclosures regarding the fair values of financial instrumentsThe estimated fair values of the Company’s financial instruments were as follows:
| | | | At December 31, | | | At December 31, | |
| | | 2006 | | 2005 | | | 2007 | | 2006 | |
| | | Carrying value | | Fair value | | Carrying value | | Fair value | | | Carrying
value | | Fair
value | | Carrying
value | | Fair
value | |
| | | ThCh$ | | ThCh$ | | ThCh$ | | ThCh$ | | | ThCh$ | | ThCh$ | | ThCh$ | | ThCh$ | |
Cash | | 16,342,273 | | | 16,342,273 | | | 14,715,194 | | | 14,715,194 | | | 24,754,142 | | 24,754,142 | | 17,551,601 | | 17,551,601 | |
Time deposits | | 7,173,319 | | | 7,173,319 | | | 26,240,283 | | | 26,240,283 | | | 49,088,381 | | 49,088,381 | | 7,704,145 | | 7,704,745 | |
Marketable securities | | 26,043,350 | | | 26,032,970 | | | 14,297,351 | | | 14,299,877 | | | 48,533,561 | | 48,543,838 | | 27,970,558 | | 27,959,410 | |
Trade accounts receivable (net) | | 36,137,487 | | | 36,137,487 | | | 34,945,430 | | | 34,945,430 | | | 44,280,949 | | 44,280,949 | | 38,811,661 | | 38,811,661 | |
Notes receivable (net) | | 12,464,812 | | | 12,464,812 | | | 11,376,844 | | | 11,376,844 | | | 14,553,358 | | 14,553,358 | | 13,387,208 | | 13,387,208 | |
Other receivables (net) | | 11,649,352 | | | 11,649,352 | | | 20,192,814 | | | 20,192,814 | | | 16,031,584 | | 16,031,584 | | 12,511,404 | | 12,511,404 | |
Long-term credits | | 5,494,271 | | | 5,494,271 | | | 8,669,179 | | | 8,669,179 | | | — | | — | | 5,900,847 | | 5,900,847 | |
Long-term investment in bonds | | 82,246,668 | | | 81,400,770 | | | 85,896,918 | | | 85,654,343 | | | — | | — | | 88,332,921 | | 87,424,427 | |
Long-term receivables | | 51,353 | | | 51,353 | | | 112,794 | | | 112,794 | | | 37,511 | | 37,511 | | 55,153 | | 55,153 | |
Cross-currency swaps | | 30,805,953 | | | 30,805,953 | | | 33,922,029 | | | 33,922,029 | | | 17,407,907 | | 17,407,907 | | 33,085,594 | | 33,085,594 | |
Foreign-currency forward contracts. | | (52,639 | ) | | (52,639 | ) | | (514,296 | ) | | (514,296 | ) | |
Foreign-currency forward contracts | | | (317,264 | ) | (317,264 | ) | (56,534 | ) | (56,534 | ) |
Futures contracts | | 480,039 | | | 480,039 | | | — | | | — | | | 230,983 | | 230,983 | | 515,562 | | 515,562 | |
| | | | At December 31, | | |
| | | 2006 | | 2005 | | |
| | | Carrying value | | Fair value | | Carrying value | | Fair value | | |
| | | ThCh$ | | ThCh$ | | ThCh$ | | ThCh$ | | |
Short and long-term term bank borrowings | | 3,346,890 | | | 3,346,890 | | | 29,480,284 | | | 29,480,284 | | |
Bonds payable | | 105,997,655 | | | 124,290,448 | | | 117,911,663 | | | 130,861,918 | | |
Dividends payable | | 4,712,773 | | | 4,712,773 | | | 4,062,425 | | | 4,062,425 | | |
Accounts payable | | 42,868,132 | | | 42,868,132 | | | 38,672,141 | | | 38,672,141 | | |
Other creditors short and long-term | | 3,309,607 | | | 3,309,607 | | | 3,034,697 | | | 3,034,697 | | |
| | At December 31, | |
| | 2007 | | 2006 | |
| | Carrying
value | | Fair
value | | Carrying
value | | Fair
value | |
| | ThCh$ | | ThCh$ | | ThCh$ | | ThCh$ | |
Short and long-term term bank borrowings | | 4,813,828 | | 4,813,828 | | 3,594,560 | | 3,594,560 | |
Bonds payable | | 80,512,092 | | 98,505,383 | | 113,841,482 | | 133,487,941 | |
Dividends payable | | 5,810,563 | | 5,810,563 | | 5,061,518 | | 5,061,518 | |
Accounts payable | | 54,585,035 | | 54,585,035 | | 46,040,374 | | 46,040,374 | |
Other creditors short and long-term | | 5,068,033 | | 5,068,033 | | 3,554,518 | | 3,554,518 | |
Cash, receivables and account payable: the carrying amounts approximate fair value due to the short-term maturity of these instruments.
Time deposits, marketable securities and deposit credits: Fair value of time deposits and deposit credits was determined using rates currently available in the market and the fair value of marketable securities is based on quoted market prices for the marketable securities.
Long-term investment in bonds: The fair value of the investment in bonds was determined based on quoted market prices.
Bonds payable: The fair value of bonds payable, including current portion, is estimated based on the quoted market price of the Company’s US dollar - denominated bonds payable.
Foreign currency contracts: The estimated fair values of the forward and swaps contracts are based on quoted market prices at year end.
Futures contracts: The estimated fair values of the forward and swaps contracts are based on quoted market prices at year end.
F - 63F-67
i) | Available-for-sale securities |
A decline in the market value of any available-for-sale or held-to-maturity security below cost that is deemed to be other-than-temporary results in an impairment to reduce the carrying amount to fair value. The impairment is charged to earnings and a new cost basis for the security is established. To determine whether an impairment is other-than-temporary, the Company considers whether it has the ability and intent to hold the investment until a market price recovery and considers whether evidence indicating the cost of the investment is recoverable outweighs evidence to the contrary. Evidence considered in this assessment includes the reasons for the impairment, the severity and duration of the impairment, changes in value subsequent to year-end, forecasted performance of the investee, and the general market condition in the geographic area or industry the investee operates in.Premiums and discounts are amortized or accreted over the life of the related held-to-maturity or available-for-sale security as an adjustment to yield using the effective-interest method. Such amortization and accretion is included in the “Interest Expense” line item in the statements of income. Dividend and interest income are recognized when earned.
i) Available-for-sale securities
The following are required disclosures for investments classified as available for-sale in accordance with SFAS 115. Realized gains and losses are determined using the proceeds from sale less the cost of the investments identified to be sold. Gross gains and losses realized on the sale of available-for-sale securities for the year ended December 31, 2007, 2006 2005 and 20042005 are as follows:
| | | | Years ended December 31, | | Years ended December 31, | |
| | | 2006 | | 2005 | | 2004 | | 2007 | | 2006 | | 2005 | |
| | | ThCh$ | | ThCh$ | | ThCh$ | | ThCh$ | | ThCh$ | | ThCh$ | |
Proceeds on realized gains | | — | | 31,642,955 | | 16,577,909 | | 8,617,648 | | — | | 33,984,534 | |
Realized gains | | — | | 2,565,219 | | 345,743 | | 90,684 | | — | | 2,755,045 | |
Proceeds on realized losses | | — | | — | | — | | 70,970,565 | | — | | — | |
Realized losses | | — | | — | | — | | (815,327 | ) | — | | — | |
The carrying value and market value of securities available-for-sale as of December 31, 2007, 2006 2005 and 20042005 are as follows:
| | | | Year ended December 31, 2006 | | Year ended December 31, 2007 | |
| | | Cost | | Gross Unrealized Gains | | Gross Unrealized Losses | | Estimated Fair Value | | Cost | | Gross
Unrealized
Gains | | Gross
Unrealized
Losses | | Estimated
Fair
Value | |
| | | ThCh$ | | ThCh$ | | ThCh$ | | ThCh$ | | ThCh$ | | ThCh$ | | ThCh$ | | ThCh$ | |
Available-for-sale-investments: | | | | | | | | | | | | | | | | | |
Chilean treasury bonds | | 7,819,276 | | — | | (95,939 | ) | | 7,723,337 | |
Other securities of Chilean institutions | | 47,601,682 | | 252,938 | | (924,567 | ) | | 46,930,053 | |
Foreign investments | | 32,456,079 | | 196,853 | | (285,563 | ) | | 32,367,369 | | 1,004,378 | | 10,271 | | — | | 1,014,649 | |
| | | | | | | | | | |
Total | | 87,877,037 | | 449,791 | | (1,306,069 | ) | | 87,020,759 | | 1,004,378 | | 10,271 | | — | | 1,014,649 | |
| | | | | | | | | | |
| | | | Year ended December 31, 2005 | |
| | | Cost | | Gross Unrealized Gains | | Gross Unrealized Losses | | Estimated Fair Value | |
| | | ThCh$ | | ThCh$ | | ThCh$ | | ThCh$ | |
Available-for-sale-investments: | | | | | | | | | |
Chilean treasury bonds | | 7,713,022 | | — | | (46,296 | ) | | 7,666,726 | |
Other securities of Chilean institutions | | 47,091,118 | | 337,414 | | (529,716 | ) | | 46,898,816 | |
Foreign investments | | 33,804,131 | | 198,009 | | (199,460 | ) | | 33,802,680 | |
| | | | | | | | | | |
Total | | 88,608,271 | | 535,423 | | (775,472 | ) | | 88,368,222 | |
| | | | | | | | | | |
| | | | Year ended December 31, 2004 | |
| | | Cost | | Gross
Unrealized
Gains | | Gross Unrealized
Losses | | Estimated
Fair Value | |
| | | ThCh$ | | ThCh$ | | ThCh$ | | ThCh$ | |
Available-for-sale-investments: | | | | | | | | | |
Chilean treasury bonds | | 8,723,341 | | 156,273 | | — | | | 8,879,614 | |
Other securities of Chilean institutions | | 62,769,518 | | 1,707,378 | | (41,332 | ) | | 64,435,564 | |
Foreign investments | | 34,580,745 | | 2,123,701 | | (157,293 | ) | | 36,547,153 | |
| | | | | | | | | | |
Total | | 106,073,604 | | 3,987,352 | | (198,625 | ) | | 109,862,331 | |
| | | | | | | | | | |
| | Year ended December 31, 2006 | |
| | Cost | | Gross
Unrealized
Gains | | Gross
Unrealized
Losses | | Estimated
Fair Value | |
| | ThCh$ | | ThCh$ | | ThCh$ | | ThCh$ | |
Available-for-sale-investments: | | | | | | | | | |
Chilean treasury bonds | | 8,397,902 | | — | | (103,038 | ) | 8,294,864 | |
Other securities of Chilean institutions | | 51,124,206 | | 271,655 | | (992,985 | ) | 50,402,876 | |
Foreign investments | | 34,857,829 | | 211,420 | | (306,695 | ) | 34,762,554 | |
Total | | 94,379,937 | | 483,075 | | (1,402,718 | ) | 93,460,294 | |
F - 64F-68
| | Year ended December 31, 2005 | |
| | Cost | | Gross
Unrealized
Gains | | Gross
Unrealized
Losses | | Estimated
Fair
Value | |
| | ThCh$ | | ThCh$ | | ThCh$ | | ThCh$ | |
Available-for-sale-investments: | | | | | | | | | |
Chilean treasury bonds | | 8,283,786 | | — | | (49,722 | ) | 8,234,064 | |
Other securities of Chilean institutions | | 50,575,861 | | 362,383 | | (568,915 | ) | 50,369,329 | |
Foreign investments | | 36,305,637 | | 212,662 | | (214,220 | ) | 36,304,079 | |
Total | | 95,165,284 | | 575,045 | | (832,857 | ) | 94,907,472 | |
F-69
The contractual maturities of securities classified by the Company as available-for-sale are as follows:
| | | | Year ended December 31, 2006 | | Year ended December 31, 2006 | |
| | | Within one
year | | After one year but within five years | | After five years but within ten years | | After
ten
years | | Total | | Within one
year | | After one
year but
within five
years | | After five
years but
within ten
years | | After ten
years | | Total | |
| | | ThCh$ | | ThCh$ | | ThCh$ | | ThCh$ | | ThCh$ | | ThCh$ | | ThCh$ | | ThCh$ | | ThCh$ | | ThCh$ | |
Available-for-sale-investments: | | | | | | | | | | | | | | | | | | | | | |
Chilean treasury bonds | | 187,889 | | — | | 7,631,387 | | — | | 7,819,276 | |
Other securities of Chilean institutions | | 5,203,965 | | 5,361,137 | | 37,036,580 | | — | | 47,601,682 | |
Foreign investments | | 1,621,881 | | 11,328,565 | | 19,505,633 | | — | | 32,456,079 | | 1,004,378 | | — | | — | | — | | 1,004,378 | |
| | | | | | | | | | | |
Total | | 7,013,735 | | 16,689,702 | | 64,173,600 | | — | | 87,877,037 | | 1,004,378 | | — | | — | | — | | 1,004,378 | |
| | | | | | | | | | | |
j) Goodwill
The Company has performed the impairment test of goodwill as required by SFAS No.142, which did not result in any impairment.
Total carrying value of goodwill, net of accumulated amortization calculated up to December 31, 2001, amounts to ThCh$ 90,637,30088,001,114 as of December 31, 20062007 and has been allocated to the Softdrinks business segment.
k) | Concentrations of other risks |
k) Concentrations of other risks
The majority of the Company’s net sales are derived from the distribution of Coca-Cola soft drinks. The Company produces, markets and distributes Coca-Cola soft drinks through standard bottler agreements between the Company’s individual bottler subsidiaries and The Coca-Cola Company. Under the bottler agreements, The Coca-Cola Company unilaterally sets the prices for Coca-Cola soft drink concentrates sold to the Company.
The Company is dependent on The Coca-Cola Company to renew such bottler agreements. The bottler agreements are subject to termination by The Coca-Cola Company in the event of default by the Company or upon expiration in accordance with their respective terms. No assurance can be given that the bottler agreements will be renewed upon their expiration. Termination or non-renewal of the bottler agreements would have a material adverse effect on the Company’s business.
The soft drink and non-alcoholic beverage business is highly competitive in each of the Company’s franchise territories. In each of its franchise territories, the Company competes with bottlers of PepsiCo Inc. as well as bottlers of regional brands. The Company’s soft drink products also compete generally with other non-alcoholic beverages.
F - 65F-70
l) | Consolidated valuation and qualifying accounts |
| | | | | | | | | | |
Description | | Balance at Beginning of period | | Additions (charged to costs and expenses) | | | Deductions (debits to the allowance) | | | Balance at end of
period |
| | | ThCh$ | | ThCh$ | | | ThCh$ | | | ThCh$ |
Allowance for doubtful accounts (1): | | | | | | | | | | |
Year ended December 31, 2004 | | 3,329,694 | | 917,910 | | | (617,604 | ) | | 3,630,000 |
Year ended December 31, 2005 | | 3,630,000 | | 599,422 | | | (2,328,949 | ) | | 1,900,473 |
Year ended December 31, 2006 | | 1,900,473 | | 210,925 | | | (567,124 | ) | | 1,544,274 |
Allowance for obsolescence of inventories: | | | | | | | | | | |
Year ended December 31, 2004 | | 231,583 | | 359,810 | | | (355,727 | ) | | 235,666 |
Year ended December 31, 2005 | | 235,666 | | 293,455 | | | (375,343 | ) | | 153,778 |
Year ended December 31, 2006 | | 153,778 | | 917,437 | | | (534,741 | ) | | 536,474 |
Valuation allowance for deferred tax assets (2): | | | | | | | | | | |
Year ended December 31, 2004 | | 21,542,147 | | (3,862,447 | ) | | — | | | 17,679,700 |
Year ended December 31, 2005 | | 17,679,700 | | (6,707,165 | ) | | — | | | 10,972,535 |
Year ended December 31, 2006 | | 10,972,535 | | (10,972,535 | ) | | — | | | — |
(1) | Includes allowances for trade, non-trade and other receivables. |
(2) | The balances and changes in the valuation allowance for deferred tax assets are expressed in accordance with Chilean GAAP. |
F - 66
l) Consolidated valuation and qualifying accounts
Description | | Balance at
Beginning
of period | | Additions
(charged to
costs and
expenses) | | Deductions
(debits to
the
allowance) | | Balance at
end of period | |
| | ThCh$ | | ThCh$ | | ThCh$ | | ThCh$ | |
Allowance for doubtful accounts (1): | | | | | | | | | |
Year ended December 31, 2005 | | 3,898,620 | | 643,779 | | (2,501,291 | ) | 2,041,108 | |
Year ended December 31, 2006 | | 2,041,108 | | 226,533 | | (609,091 | ) | 1,658,550 | |
Year ended December 31, 2007 | | 1,658,550 | | 318,227 | | (440,481 | ) | 1,536,296 | |
| | | | | | | | | |
Allowance for obsolescence of inventories: | | | | | | | | | |
Year ended December 31, 2005 | | 253,105 | | 315,171 | | (403,118 | ) | 165,158 | |
Year ended December 31, 2006 | | 165,158 | | 985,327 | | (574,312 | ) | 576,173 | |
Year ended December 31, 2007 | | 576,173 | | 706,815 | | (473,944 | ) | 809,044 | |
| | | | | | | | | |
Valuation allowance for deferred tax assets (2): | | | | | | | | | |
Year ended December 31, 2005 | | 18,987,998 | | (7,203,495 | ) | — | | 11,784,503 | |
Year ended December 31, 2006 | | 11,784,503 | | (11,784,503 | ) | — | | — | |
Year ended December 31, 2007 | | — | | — | | — | | — | |
m) | Recent accounting pronouncements |
(1) Includes allowances for trade, non-trade and other receivables.
(2) The balances and changes in the valuation allowance for deferred tax assets are expressed in accordance with Chilean GAAP.
F-71
m) Recent accounting pronouncements
(a) Recently Issued Accounting Standards
In JulyDecember 2007, the FASB issued FASB Statement No. 141R, Business Combinations (Statement 141R) and FASB Statement No. 160, Noncontrolling Interests in Consolidated Financial Statements – an amendment to ARB No. 51 (Statement 160). Statements 141R and 160 require most identifiable assets, liabilities, noncontrolling interests, and goodwill acquired in a business combination to be recorded at “full fair value” and require noncontrolling interests (previously referred to as minority interests) to be reported as a component of equity, which changes the accounting for transactions with noncontrolling interest holders. Both Statements are effective for periods beginning on or after December 15, 2008, and earlier adoption is prohibited. Statement 141R will be applied to business combinations occurring after the effective date. Statement 160 will be applied prospectively to all noncontrolling interests, including any that arose before the effective date. The Company is currently evaluating the impact of adopting Statement 141R and Statement 160 on its results of operations and financial position.
In February 2007, the FASB issued Statement of Financial Accounting Standards No. 159, The Fair Value Option for Financial Assets and Financial Liabilities – including an amendment of FASB Statement No. 115 (Statement 159). Statement 159 gives the Company the irrevocable option to carry most financial assets and liabilities at fair value that are not currently required to be measured at fair value. If the fair value option is elected, changes in fair value would be recorded in earnings at each subsequent reporting date. SFAS 159 is effective for the Company’s 2008 fiscal year. The Company is currently evaluating the impact the adoption of this statement could have on its financial condition, results of operations and cash flows.
In September 2006, the FASB issued FASB Interpretation No. 48, “Accounting for Uncertainty in Income Taxes, an Interpretation of FASB Statement No. 109” (“157, Fair Value Measurement (Statement 157). Statement 157 defines fair value, establishes a framework for the measurement offair value, and enhances disclosures about fair value measurements. The Statement does not require any new fair value measures. The Statement is effective for fair value measures already required or permitted by other standards for fiscal years beginning after November 15, 2007. The Company is required to adopt Statement 157 beginning on January 1, 2008. Statement 157 is required to be applied prospectively, except for certain financial instruments. Any transition adjustment will be recognized as an adjustment to opening retained earnings in the year of adoption. In November 2007, the FASB proposed a one-year deferral of Statement 157’s fair-value measurement requirements for nonfinancial assets and liabilities that are not required or permitted to be measured at fair value on a recurring basis. The Company is currently evaluating the impact of adopting Statement 157 on its results of operations and financial position.
(b)Recently Adopted Accounting Standards
Effective January 1, 2007, the Company adopted provisions of FIN 48”).48. FIN 48 provides guidance onaddresses the accounting for uncertainty in income taxes recognized in an enterprise’s financial statementstatements and prescribes a threshold of more-likely-than-not for recognition and measurementderecognition of a tax positionpositions taken or expected to be taken in a tax return. FIN 48 requires that the Company recognize in the financial statements the impact of a tax position if that position will more likely than not be sustained on audit, based on the technical merits of the position. FIN 48 also provides related guidance on derecognition,measurement, classification, interest and penalties, accounting in interim periods, disclosures, and transition provisions. Any transition adjustment recognizeddisclosure. The adoption of FIN 48 had no effect on the date of adoption will be recorded as an adjustment to retained earnings as of the beginning of the adoption period. FIN 48 is effective for fiscal years beginning after December 15, 2006. Based on current evaluation, the Company does not expect the adoption of this interpretation to have a material impact on its financial position orCompany’s results of operations.
In September 2006, the FASB issued SFAS No. 157, “Fair Value Measurements” (“SFAS No. 157”). SFAS No. 157 defines fair value, establishes a framework for measuring fair value in accordance with generally accepted accounting principles,operations and expands disclosures about fair value measurements. This statement does not require any new fair value measurements; rather, it applies to other accounting pronouncements that require or permit fair value measurements. The provisions of this statement are to be applied prospectively as of the beginning of the fiscal year in which this statement is initially applied, with any transition adjustment recognized as a cumulative-effect adjustment to the opening balance of retained earnings. The provisions of SFAS No. 157 are effective for the fiscal years beginning after November 15, 2007; therefore, the Company anticipates adopting this standard as of January 1, 2008. It has not determined the effect, if any, the adoption of this statement will have on its financial condition or results of operations.position.
F - 67F-72
EXHIBIT INDEX
| | |
Item | | Description
|
| |
1.1 | | English translation of our Bylaws (filed with the U.S. Securities and Exchange Commission in our annual report on Form 20-F for the fiscal year ended December 31, 1996 and incorporated herein by reference) |
| |
8.1 | | List of our subsidiaries (filed herewith). |
| |
12.1 | | Certification of Jaime Garcia pursuant to Section 302 of the Sarbanes-Oxley Act of 2002 (filed herewith). |
| |
12.2 | | Certification of Osvaldo Garay pursuant to Section 302 of the Sarbanes-Oxley Act of 2002 (filed herewith). |
| |
13.1 | | Certification of Jaime Garcia pursuant to 18 U.S.C. Section 1350, as adopted pursuant to Section 906 of the Sarbanes-Oxley Act of 2002 (filed herewith). |
| |
13.2 | | Certification of Osvaldo Garay pursuant to 18 U.S.C. Section 1350, as adopted pursuant to Section 906 of the Sarbanes-Oxley Act of 2002 (filed herewith). |