As filed with the Securities and Exchange Commission on December 18, 2009.
UNITED STATES
SECURITIES AND EXCHANGE COMMISSION
¨ | | |
| o | | REGISTRATION STATEMENT PURSUANT TO SECTION 12(B) OR 12(G) OF THE SECURITIES EXCHANGE ACT OF 1934 |
x | | |
| þ | | ANNUAL REPORT PURSUANT TO SECTION 13 OR 15(D) OF THE SECURITIES EXCHANGE ACT OF 1934 |
For the fiscal year ended August 31, 20072009
¨ | | |
| o | | TRANSITION REPORT PURSUANT TO SECTION 13 OR 15(D) OF THE SECURITIES EXCHANGE ACT OF 1934 |
For the transition period from or ¨ | | |
| o | | SHELL COMPANY REPORT PURSUANT TO SECTION 13 OR 15(D) OF THE SECURITIES EXCHANGE ACT OF 1934 |
Date of event requiring this shell company report
Commission file number: 333-11012
City Telecom (H.K.) Limited (Exact name of registrant as Specified in its Charter)
Hong Kong Special Administrative Region,
The People’s Republic of China
(Jurisdiction of Incorporation or Organization)
Level 39,Tower 1, Metroplaza
No. 223 Hing Fong Road
Kwai Chung, New Territories
Hong Kong
(Address of Principal Executive Offices)
Mr. Lai Ni Quiaque
12th Floor, Trans Asia Centre
No.18 Kin Hong Street
Kwai Chung, New Territories
Hong Kong
Telephone : (852) 3145 6068
Facsimile : (852) 2199 8445
(Name, Telephone, E-mail and/or Facsimile number and Address of Company Contact Person)
Securities registered or to be registered pursuant to Section 12(b) of the Act:N/A
| | |
| Title Of Each Class | | Name Of Each Exchange On Which Registered |
| American Depositary Shares, each representing 20 Ordinary Shares, par value HK$0.10 per share | | The Nasdaq Stock Market LLC |
| Ordinary Shares, par value HK$0.10 per share* | | The Nasdaq Stock Market LLC* |
Securities registered or to be registered pursuant to Section 12(g) of the Act:American Depositary Shares, representing 20 Ordinary Shares, par value HK$0.10 per share
None
Securities for which there is a reporting obligation pursuant to Section 15(d) of the Act:N/A
8.75% Senior Notes due 2015
Indicate the number of outstanding shares of each of the issuer’s classes of capital or common stock as at the close of August 31, 2007: 616,503,404
the period covered by the annual report:664,179,970 Ordinary Shares, par value HK$0.10 per share
Indicate by check mark if the registrant is a well-known seasoned issuer, as defined in Rule 405 of the Securities Act.
If this report is an annual or transition report, indicate by check mark if the registrant is not required to file reports pursuant to section 13 or 15(d) of the Securities Exchange Act of 1934.
Yes Yes o No¨þ No xIf this report is an annual report, indicate by check mark whether the registrant is a shell company (as defined in Rule 12b-2 of the Exchange Act).
Yes ¨ No x
Indicate by check mark whether the registrant: (1) has filed all reports required to be filed by Section 13 or 15(d) of the Securities Exchange Act of 1934 during the preceding 12 months (or for such shorter period that the registrant was required to file such reports), and (2) has been subject to such filing requirements for the past 90 days.
Yes Yes xþ Noo
Indicate by check mark whether the registrant has submitted electronically and posted on its corporate Web site, if any, every Interactive Data File required to be submitted and posted pursuant to Rule 405 of Regulation S-T (§232.405 of this chapter) during the preceding 12 months (or for such shorter period that registrant was required to submit and post such files.)
Indicate by check mark whether the registrant is a large accelerated filer, an accelerated filer,
a non-accelerated filer, or a
non-accelerated filer.smaller reporting company. See
definitionthe definitions of
“large accelerated filer,” “accelerated
filer or large accelerated filer”
and “smaller reporting company” in Rule 12b-2 of the Exchange
Act (CircleAct. (Check one):
Large accelerated filer ¨ Accelerated Filer ¨ Non-accelerated filer x
| | | | | | |
| Large accelerated filero | | Accelerated filero | | Non-accelerated filerþ
(Do not check if a smaller reporting company) | | Smaller reporting companyo |
Indicate by check mark which basis of accounting the registrant has used to prepare the financial statements included in this filing:
| | | | |
| US GAAPo | | International Financial Reporting Standards as issued by the International Accounting Standards Boardþ | | Othero |
If “Other” has been checked in response to the previous question, indicate by check mark which financial statement item the registrant has selected to follow.
Item 17o¨ Item 18xo
If this report is an annual report, indicate by check mark whether the registrant is a shell company (as defined in Rule 12b-2 of the Exchange Act).
Yeso Noþ
| * | | Not for trading, but only in connection with the registration of the American Depositary Shares |
Use of defined and technical terms
Except as otherwise indicated by the context, references in this annual report to:
We publish our consolidated financial statements in Hong Kong dollars. In this annual report, references to “Hong Kong dollars” or “HK$” are to the currency of Hong Kong, and references to “U.S. dollars” or “US$” are to the currency of the United States. This annual report contains translations of Hong Kong dollar amounts into U.S. dollar amounts, solely for your convenience. Unless otherwise indicated, the translations have been made at US$1.00 = HK$7.7968,7.7505, which was the noon buyingexchange rate set forth in The Citythe H.10 statistical release of New York for cable transfers in Hong Kong dollars as certified for customs purposes by the Federal Reserve Bank of New YorkBoard on August 31, 2007.2009. On January 23, 2008December 14, 2009 the noon buyingexchange rate was US$1.00=1.00 = HK$7.8075.7.7515. You should not construe these translations as representations that the Hong Kong dollar amounts actually represent such U.S. dollar amounts or could have been or could be converted into U.S. dollars at the rates indicated or at any other rates.
1
FORWARD-LOOKING STATEMENTSNote regarding forward-looking statements This annual report contains forward-looking statements that are, by their nature, subject to significant risks and uncertainties. These include statements with respect to City Telecom
(H.K.) Limited (“City Telecom” or the
“Company”)Company and our plans, strategies and beliefs and other statements that are not historical facts. These statements can be identified by the use of forward-looking terminology such as “may”, “will”, “expect”, “anticipate”, “intend”, “estimate”, “continue”, “plan”, “predict”, “project” or other similar words. The statements are based on management’s assumptions and beliefs in light of the information currently available to us.
These assumptions involve risks and uncertainties which may cause the actual results, performance or achievements to be materially different from any future results, performance or achievements expressed or implied by such forward looking statements. Potential risks and uncertainties include, without limitation:
technology changes;
| • | | technological changes; |
|
| • | | changes in our regulatory environment, including changes in rules and policies promulgated by regulatory agencies from time to time; |
|
| • | | increasing competition in the telecommunications, Internet access, local VoIP, pay-television and corporate data markets; |
|
| • | | the benefits we expect to derive from our Next Generation Network, which utilize Metro Ethernet and GPON technologies, in which we have been making significant capital investments; |
|
| • | | our ability to maintain growth and successfully introduce new services; |
|
| • | | the continued development and stability of our technological infrastructure, a platform through which our local and international telecommunications, Internet access, local VoIP, IP-TV and corporate data services are offered; and |
|
| • | | changes in the local and global economic environment. |
changes in the regulatory environment in which we operate, or changes in the rules and policies that government regulators apply to our businesses;
increased competition in the local or international telecommunications, Internet access, local VOIP or pay-television (“pay-TV”) markets;
the benefits we expect to receive from our continuing capital expenditure on our Next Generation Network (refer to our Metro Ethernet Network and our newly deployed Gigabit Passive Optical Network (“GPON”));
our ability to maintain growth and successfully introduce new products and services; and
the continued development and stability of the technological infrastructure we use to provide our telecommunications, Internet access, local VOIP and pay-TV using Internet Protocol, which we refer to as IP-TV, services.
When considering such forward-looking statements, you should keep in mind the factors described in Item 3 “Key Information—Risk Factors”information — risk factors” and other cautionary statements appearing in Item 5 “Operating and Financial Reviewfinancial review and Prospects”prospects” of this annual report. Such risk factors and statements describe circumstances that could cause actual results to differ materially from those contained in any forward-looking statement.
2
***********
Special note on our financial information presented in this annual report
Our consolidated financial statements as of and for the years ended August 31, 2008 and 2009 included in this annual report on Form 20-F have been prepared in accordance with International Financial Reporting Standards, or IFRSs, as issued by the International Accounting Standards Board, or the IASB. Pursuant to the requirement under IFRS 1: First-Time Adoption of International Financial Reporting Standards, or IFRS 1, the date of our transition to IFRS was September 1, 2007, which is the beginning of the earliest period for which we present full comparative information in our consolidated financial statements. With due regard to our accounting policies in previous periods and the requirements of IFRS 1, we have concluded that no adjustments were required to the amounts reported under HKFRSs as at September 1, 2007 or in respect of the year ended August 31, 2008.
In accordance with rule amendments adopted by the U.S. Securities and Exchange Commission, or the SEC, which became effective on March 4, 2008, we are not required to provide a reconciliation to generally accepted accounting principles in the United States, or U.S. GAAP. Furthermore, pursuant to the transitional relief granted by the SEC in respect of the first-time application of IFRS, no audited consolidated financial statements and financial information prepared under IFRSs for the year ended August 31, 2007 have been included in this annual report on Form 20-F.
Our consolidated financial statements included in our annual reports on Form 20-F previously filed with the SEC in respect of the year ended August 31, 2007 were prepared in accordance with Hong Kong Financial Reporting Standards, or HKFRSs, which collective term includes all applicable individual Hong Kong Financial Reporting Standards, Hong Kong Accounting Standards and Interpretations issued by the Hong Kong Institute of Certified Public Accountants and accounting principles generally accepted in Hong Kong, or Hong Kong GAAP. For additional information, please refer to our annual reports on Form 20-F previously filed with the SEC.
3
ITEM 1.1 IDENTITY OF DIRECTORS, SENIOR MANAGEMENT AND ADVISERS ITEM 2.2 OFFER STATISTICS AND EXPECTED TIMETABLE ITEM 3.3 KEY INFORMATIONA. Selected financial data A.
| Selected Financial Data |
City Telecom’s Historical Financial Information
historical financial information
The following table presents the selected consolidated financial informationdata and operating informationdata of City Telecom as of and for the years ended August 31, 2003, 2004, 2005, 20062008 and 2007.2009. The selected financial informationdata should be read in conjunction with, and is qualified in its entirety by reference to, the consolidated financial statements included elsewhere in this annual report, the accompanying notes thereto and Item 5 “Operating and Financial Reviewfinancial review and Prospects”prospects”. As disclosed above under “Special note on our financial information presented in this annual report”, our consolidated financial statements as of and for the years ended August 31, 2008 and 2009 have been prepared and presented in accordance with IFRSs.
Selected consolidated statement of operations data:
| | | | | | | | | | | | | |
| | | As of and for the year ended August 31, | |
| | | 2008 | | | 2009 | | | 2009 | |
| | | HK$ | | | HK$ | | | US$ | |
| | | (Amounts in thousands except per share data) | |
| Revenue: | | | | | | | | | | | | |
| - FTNS business | | | 1,011,038 | | | | 1,230,880 | | | | 158,813 | |
| - IDD business | | | 291,943 | | | | 247,359 | | | | 31,915 | |
| | | | | | | | | | |
| Total operating revenue | | | 1,302,981 | | | | 1,478,239 | | | | 190,728 | |
| | | | | | | | | | |
| | | | | | | | | | | | | |
| Network costs: | | | | | | | | | | | | |
| - FTNS business | | | (103,524 | ) | | | (107,670 | ) | | | (13,892 | ) |
| - IDD business | | | (74,843 | ) | | | (67,459 | ) | | | (8,704 | ) |
| | | | | | | | | | |
| Total network costs | | | (178,367 | ) | | | (175,129 | ) | | | (22,596 | ) |
| | | | | | | | | | |
| | | | | | | | | | | | | |
| Other operating expenses | | | (966,094 | ) | | | (1,037,964 | ) | | | (133,922 | ) |
| | | | | | | | | | | | | |
| Interest expense, net | | | (59,541 | ) | | | (50,258 | ) | | | (6,484 | ) |
| Other income, net | | | 9,393 | | | | 36,671 | | | | 4,731 | |
| Income taxes benefit/(expense) | | | 16,818 | | | | (38,730 | ) | | | (4,997 | ) |
| | | | | | | | | | |
| Net income | | | 125,190 | | | | 212,829 | | | | 27,460 | |
| | | | | | | | | | |
| | | | | | | | | | | | | |
| Basic earnings per share (HK cents) | | | 19.7 | | | | 32.4 | | | | 4.2 | |
| Diluted earnings per share (HK cents) (note 1) | | | 19.0 | | | | 31.8 | | | | 4.1 | |
| Dividends per share attributable to the year (HK cents) | | | 6.0 | | | | 19.0 | | | | 2.5 | |
| Weighted average number of ordinary shares | | | 634,015 | | | | 657,201 | | | | 657,201 | |
| Diluted weighted average number of ordinary shares (note 2) | | | 657,997 | | | | 668,384 | | | | 668,384 | |
4
| | | | | | | | | | | | | | | | | | |
| | | As of and for the year ended August 31, | |
| | | 2003 | | | 2004 | | | 2005(8) | | | 2006(8) | | | 2007 | | | 2007 | |
| | | HK$ | | | HK$ | | | HK$ | | | HK$ | | | HK$ | | | US$ | |
| | | (Amounts in thousands except per share data) | |
Consolidated Statement of Operations Data: | | | | | | | | | | | | | | | | | | |
Hong Kong Financial Reporting Standards (“HKFRSs”) | | | | | | | | | | | | | | | | | | |
Revenues: | | | | | | | | | | | | | | | | | | |
Fixed telecommunications network services | | 423,107 | | | 541,902 | | | 629,464 | | | 716,600 | | | 816,800 | | | 104,761 | |
International telecommunications | | 875,802 | | | 627,978 | | | 532,595 | | | 418,276 | | | 324,470 | | | 41,616 | |
| | | | | | | | | | | | | | | | | | |
Total Operating Revenue | | 1,298,909 | | | 1,169,880 | | | 1,162,059 | | | 1,134,876 | | | 1,141,270 | | | 146,377 | |
| | | | | | | | | | | | | | | | | | |
Network Costs: | | | | | | | | | | | | | | | | | | |
Fixed telecommunications network services | | (76,845 | ) | | (122,476 | ) | | (118,383 | ) | | (125,639 | ) | | (103,795 | ) | | (13,313 | ) |
International telecommunications | | (245,908 | ) | | (208,932 | ) | | (221,019 | ) | | (174,954 | ) | | (110,796 | ) | | (14,210 | ) |
| | | | | | | | | | | | | | | | | | |
Total Network Costs | | (322,753 | ) | | (331,408 | ) | | (339,402 | ) | | (300,593 | ) | | (214,591 | ) | | (27,523 | ) |
Other Operating Expenses | | (704,796 | ) | | (793,212 | ) | | (958,031 | ) | | (919,795 | ) | | (834,104 | ) | | (106,981 | ) |
Income/(loss) from operations | | 271,360 | | | 45,260 | | | (135,374 | ) | | (85,512 | ) | | 92,575 | | | 11,873 | |
Interest income/(expense), net | | 2,562 | | | 3,578 | | | (40,884 | ) | | (68,259 | ) | | (64,833 | ) | | (8,315 | ) |
Other income, net | | 1,678 | | | 2,668 | | | 6,037 | | | 4,465 | | | 3,149 | | | 404 | |
Income taxes (expense)/credit | | (17,857 | ) | | (2,043 | ) | | 6,725 | | | 7,244 | | | (2,026 | ) | | (260 | ) |
Income/(loss) after taxation | | 257,743 | | | 49,463 | | | (163,496 | ) | | (142,062 | ) | | 28,865 | | | 3,702 | |
Minority interest | | — | | | — | | | — | | | — | | | — | | | — | |
Net income/(loss) | | 257,743 | | | 49,463 | | | (163,496 | ) | | (142,062 | ) | | 28,865 | | | 3,702 | |
Net income/(loss) per share (cents) | | 46.6 | | | 8.1 | | | (26.6 | ) | | (23.1 | ) | | 4.7 | | | 0.6 | |
Diluted net income/(loss) per share (cents)(1) | | 41.9 | | | 8.1 | | | (26.6 | ) | | (23.1 | ) | | 4.6 | | | 0.6 | |
Dividends declared per share (cents) | | 5.0 | | | 9.0 | | | — | | | — | | | 8.0 | | | 1.0 | |
Weighted average number of shares | | 552,600 | | | 610,095 | | | 613,525 | | | 614,134 | | | 614,840 | | | 614,840 | |
Diluted weighted average number of shares(2) | | 615,102 | | | 614,365 | | | 613,525 | | | 614,134 | | | 631,319 | | | 631,319 | |
| | | | | | | | | | | | | | | | | | |
| | | As of and for the year ended August 31, | |
| | | 2003 | | | 2004 | | | 2005 | | | 2006 | | | 2007 | | | 2007 | |
| | | HK$ | | | HK$ | | | HK$ | | | HK$ | | | HK$ | | | US$ | |
| | | (Amounts in thousands except per share data) | |
U.S. GAAP | | | | | | | | | | | | | | | | | | |
Total operating revenue | | 1,291,119 | | | 1,169,880 | | | 1,162,059 | | | 1,134,876 | | | 1,141,270 | | | 146,377 | |
Total operating expenses | | (1,015,900 | ) | | (1,123,198 | ) | | (1,289,014 | ) | | (1,220,388 | ) | | (1,048,695 | ) | | (134,504 | ) |
Net income/(loss) from continuing operations | | 264,151 | | | 51,565 | | | (149,148 | ) | | (142,062 | ) | | 28,865 | | | 3,702 | |
Net income/(loss) from continuing operations per share (cents) | | 47.8 | | | 8.5 | | | (24.3 | ) | | (23.1 | ) | | 4.7 | | | 0.6 | |
Net income from discontinued operations | | 83 | | | — | | | — | | | — | | | — | | | — | |
Loss arising from disposal of discontinued operations | | (2,695 | ) | | — | | | — | | | — | | | — | | | — | |
Net loss from discontinued operations per share (cents) | | (0.5 | ) | | — | | | — | | | — | | | — | | | — | |
Diluted net income/(loss) from continuing operations per share (cents)(3) | | 42.9 | | | 8.4 | | | (24.3 | ) | | (23.1 | ) | | 4.6 | | | 0.6 | |
Diluted net loss from discontinued operations per share (cents)(4) | | (0.4 | ) | | — | | | — | | | — | | | — | | | — | |
Dividends declared per share (cents) | | 5.0 | | | 9.0 | | | — | | | — | | | 8.0 | | | 1.0 | |
Weighted average number of shares | | 552,600 | | | 610,095 | | | 613,525 | | | 614,134 | | | 614,840 | | | 614,840 | |
Diluted weighted average number of shares(2) | | 615,102 | | | 614,365 | | | 613,525 | | | 614,134 | | | 631,319 | | | 631,319 | |
| | | | | | | | | | | | | | | | | | |
| | | As of and for the year ended August 31, | |
| | | 2003 | | | 2004 | | | 2005 | | | 2006 | | | 2007 | | | 2007 | |
| | | HK$ | | | HK$ | | | HK$ | | | HK$ | | | HK$ | | | US$ | |
| | | (Amounts in thousands) | |
Consolidated Balance Sheet Data: | | | | | | | | | | | | | | | | | | |
HKFRSs | | | | | | | | | | | | | | | | | | |
Total assets | | 1,548,534 | | | 1,683,408 | | | 2,347,428 | | | 2,124,215 | | | 2,161,133 | | | 277,182 | |
Debt | | (18,174 | ) | | (119,170 | ) | | (945,348 | ) | | (948,027 | ) | | (952,593 | ) | | (122,177 | ) |
Finance lease obligation | | — | | | — | | | (3,135 | ) | | (2,373 | ) | | (1,210 | ) | | (155 | ) |
Other liabilities | | (351,185 | ) | | (388,540 | ) | | (378,491 | ) | | (282,161 | ) | | (303,448 | ) | | (38,920 | ) |
| | | | | | | | | | | | | | | | | | |
Total liabilities | | (369,359 | ) | | (507,710 | ) | | (1,326,974 | ) | | (1,232,561 | ) | | (1,257,251 | ) | | (161,252 | ) |
| | | | | | | | | | | | | | | | | | |
Net assets | | 1,179,175 | | | 1,175,698 | | | 1,020,454 | | | 891,654 | | | 903,882 | | | 115,930 | |
Minority interest | | — | | | — | | | — | | | — | | | — | | | — | |
| | | | | | | | | | | | | | | | | | |
Net assets employed | | 1,179,175 | | | 1,175,698 | | | 1,020,454 | | | 891,654 | | | 903,882 | | | 115,930 | |
| | | | | | | | | | | | | | | | | | |
Share capital | | 60,496 | | | 61,057 | | | 61,412 | | | 61,417 | | | 61,650 | | | 7,907 | |
Share premium | | 615,886 | | | 617,986 | | | 619,408 | | | 620,298 | | | 622,433 | | | 79,832 | |
Reserves | | 502,793 | | | 496,655 | | | 339,634 | | | 209,939 | | | 219,799 | | | 28,191 | |
| | | | | | | | | | | | | | | | | | |
Total shareholders’ equity | | 1,179,175 | | | 1,175,698 | | | 1,020,454 | | | 891,654 | | | 903,882 | | | 115,930 | |
| | | | | | | | | | | | | | | | | | |
| | | | | | | | | | | | | | | | | | |
| | | As of and for the year ended August 31, | |
| | | 2003 | | | 2004 | | | 2005 | | | 2006 | | | 2007 | | | 2007 | |
| | | HK$ | | | HK$ | | | HK$ | | | HK$ | | | HK$ | | | US$ | |
| | | (Amounts in thousands) | |
U.S. GAAP | | | | | | | | | | | | | | | | | | |
Total assets | | 1,552,021 | | | 1,688,640 | | | 2,385,556 | | | 2,154,305 | | | 2,189,086 | | | 280,767 | |
Total liabilities | | (369,359 | ) | | (507,710 | ) | | (1,352,876 | ) | | (1,257,034 | ) | | (1,279,587 | ) | | (164,117 | ) |
Total shareholders’ equity | | 1,182,662 | | | 1,180,930 | | | 1,032,680 | | | 897,271 | | | 909,499 | | | 116,650 | |
| | | | | | | | | | | | | | | | | | |
| | | As of and for the year ended August 31, | |
| | | 2003 | | | 2004 | | | 2005(8) | | | 2006(8) | | | 2007 | | | 2007 | |
| | | HK$ | | | HK$ | | | HK$ | | | HK$ | | | HK$ | | | US$ | |
| | | (Amounts in thousands) | |
Other Financial Data: | | | | | | | | | | | | | | | | | | |
EBITDA(5) | | 449,058 | | | 244,945 | | | 108,377 | | | 195,417 | | | 353,827 | | | 45,381 | |
Net cash provided by operating activities | | 414,500 | | | 203,763 | | | 77,383 | | | 184,151 | | | 383,999 | | | 49,251 | |
Net cash (used in) / generated from investing activities | | (309,634 | ) | | (406,244 | ) | | (557,440 | ) | | (492,742 | ) | | 114,053 | | | 14,628 | |
Net cash provided by (used in) financing activities | | (10,274 | ) | | 47,221 | | | 792,216 | | | (86,432 | ) | | (109,504 | ) | | (14,045 | ) |
Capital expenditures(6) | | 250,209 | | | 410,046 | | | 419,126 | | | 322,935 | | | 132,250 | | | 16,962 | |
Selected consolidated balance sheet data:
| | | | | | | | | | | | | |
| | | As of the year ended August 31, | |
| | | 2008 | | | 2009 | | | 2009 | |
| | | HK$ | | | HK$ | | | US$ | |
| | | (Amounts in thousands) |
| Total assets | | | 2,080,416 | | | | 1,785,044 | | | | 230,313 | |
| | | | | | | | | | | | | |
| Long-term debt and other liabilities | | | (683,242 | ) | | | (162,586 | ) | | | (20,977 | ) |
| Finance lease obligations | | | (376 | ) | | | (732 | ) | | | (94 | ) |
| Other liabilities | | | (364,191 | ) | | | (393,199 | ) | | | (50,733 | ) |
| | | | | | | | | | |
| Total liabilities | | | (1,047,809 | ) | | | (556,517 | ) | | | (71,804 | ) |
| | | | | | | | | | |
| Net assets | | | 1,032,607 | | | | 1,228,527 | | | | 158,509 | |
| | | | | | | | | | |
| | | | | | | | | | | | | |
| Share capital | | | 65,062 | | | | 66,418 | | | | 8,570 | |
| Share premium | | | 670,717 | | | | 681,208 | | | | 87,892 | |
| Reserves | | | 296,828 | | | | 480,901 | | | | 62,047 | |
| | | | | | | | | | |
| Total shareholders’ equity | | | 1,032,607 | | | | 1,228,527 | | | | 158,509 | |
| | | | | | | | | | |
Other financial data:
| | | | | | | | | | | | | |
| | | For the year ended August 31, | |
| | | 2008 | | | 2009 | | | 2009 | |
| | | HK$ | | | HK$ | | | US$ | |
| | | (Amounts in thousands) | |
| EBITDA (note 3) | | | 377,964 | | | | 508,058 | | | | 65,551 | |
| Net cash inflow from operating activities | | | 378,563 | | | | 535,886 | | | | 69,142 | |
| Net cash outflow from investing activities | | | (147,750 | ) | | | (176,488 | ) | | | (22,771 | ) |
| Net cash outflow from financing activities | | | (342,550 | ) | | | (560,407 | ) | | | (72,306 | ) |
| Capital expenditures (note 4) | | | 211,684 | | | | 286,734 | | | | 36,996 | |
As a measure of our operating performance or liquidity, we believe that the most directly comparable measure to EBITDA is net cash provided by operating activities. The following table reconciles our net cash provided byinflow from operating activities, under HKFRSsthe most directly comparable financial measure calculated and presented in accordance with IFRSs, to our definition of EBITDA on a consolidated basis for each of fiscal 2003, 2004, 2005, 20062008 and 2007.2009.
| | | | | | | | | | | | | |
| | | For the year ended August 31, | |
| | | 2008 | | | 2009 | | | 2009 | |
| | | HK$ | | | HK$ | | | US$ | |
| | | (Amounts in thousands) | |
| EBITDA | | | 377,964 | | | | 508,058 | | | | 65,551 | |
| Depreciation and amortization | | | (210,051 | ) | | | (206,241 | ) | | | (26,610 | ) |
| Interest expense, net | | | (59,541 | ) | | | (50,258 | ) | | | (6,484 | ) |
| Income taxes benefit/(expense) | | | 16,818 | | | | (38,730 | ) | | | (4,997 | ) |
| | | | | | | | | | |
| Net income | | | 125,190 | | | | 212,829 | | | | 27,460 | |
| Depreciation and amortization | | | 210,051 | | | | 206,241 | | | | 26,610 | |
| Amortization of deferred expenditure | | | 33,777 | | | | 53,160 | | | | 6,859 | |
| Income taxes (benefit)/expense | | | (16,818 | ) | | | 38,730 | | | | 4,997 | |
| Interest income | | | (15,596 | ) | | | (4,869 | ) | | | (628 | ) |
| Interest element of finance lease | | | 34 | | | | 27 | | | | 3 | |
| Interest, amortization and exchange difference on senior notes | | | 72,640 | | | | 49,214 | | | | 6,350 | |
| Realized gain on long term bank deposit | | | (1,185 | ) | | | — | | | | — | |
| Loss on disposal of fixed assets | | | 1,431 | | | | 1,016 | | | | 131 | |
| Equity settled share-based transaction | | | 4,204 | | | | 4,768 | | | | 615 | |
| Realized loss on derivatives financial instruments | | | 1,039 | | | | — | | | | — | |
| Realized and unrealized gain on other financial assets | | | (3,284 | ) | | | (189 | ) | | | (24 | ) |
| Gain on extinguishment of senior notes | | | (2,582 | ) | | | (31,371 | ) | | | (4,048 | ) |
| Taxation paid | | | (4,250 | ) | | | (1,732 | ) | | | (223 | ) |
| Change in long term receivable and prepayments | | | 1,346 | | | | (505 | ) | | | (65 | ) |
| Change in working capital, net | | | (27,434 | ) | | | 8,567 | | | | 1,105 | |
| | | | | | | | | | |
| Net cash inflow from operating activities | | | 378,563 | | | | 535,886 | | | | 69,142 | |
| | | | | | | | | | |
5
| | | | | | | | | | | | | | | | | | |
| | | As of and for the year ended August 31, | |
| | | 2003 | | | 2004 | | | 2005 | | | 2006 | | | 2007 | | | 2007 | |
| | | HK$ | | | HK$ | | | HK$ | | | HK$ | | | HK$ | | | US$ | |
| | | (Amounts in thousands) | |
EBITDA | | 449,058 | | | 244,945 | | | 108,377 | | | 195,417 | | | 353,827 | | | 45,381 | |
Depreciation and amortization | | (176,020 | ) | | (197,017 | ) | | (237,714 | ) | | (276,464 | ) | | (258,103 | ) | | (33,104 | ) |
Interest income/(expense), net | | 2,562 | | | 3,578 | | | (40,884 | ) | | (68,259 | ) | | (64,833 | ) | | (8,315 | ) |
Income taxes (expense)/credit | | (17,857 | ) | | (2,043 | ) | | 6,725 | | | 7,244 | | | (2,026 | ) | | (260 | ) |
| | | | | | | | | | | | | | | | | | |
Net income/(loss) | | 257,743 | | | 49,463 | | | (163,496 | ) | | (142,062 | ) | | 28,865 | | | 3,702 | |
Depreciation and amortization | | 176,020 | | | 197,017 | | | 237,714 | | | 276,464 | | | 258,103 | | | 33,104 | |
Impairment loss on investment property | | — | | | — | | | — | | | 1,131 | | | — | | | — | |
Amortization of deferred expenditure | | — | | | 1,828 | | | 12,927 | | | 13,973 | | | 15,580 | | | 1,998 | |
Income taxes expense/(credit) | | 17,857 | | | 2,043 | | | (6,725 | ) | | (7,244 | ) | | 2,026 | | | 260 | |
Interest income | | (3,163 | ) | | (3,753 | ) | | (13,578 | ) | | (20,378 | ) | | (22,671 | ) | | (2,908 | ) |
Interest, amortization and exchange difference on senior notes | | — | | | — | | | 54,065 | | | 86,664 | | | 89,879 | | | 11,528 | |
Other borrowing costs | | — | | | — | | | — | | | 1,919 | | | (739 | ) | | (95 | ) |
Minority interest | | — | | | — | | | — | | | — | | | — | | | — | |
Gain / loss on disposal of fixed assets | | 427 | | | (34 | ) | | (134 | ) | | 9,621 | | | 1,714 | | | 220 | |
Equity settled share-based transaction | | — | | | 87 | | | 6,965 | | | 6,823 | | | 5,727 | | | 735 | |
Realized and unrealized loss on derivatives financial instruments | | — | | | — | | | — | | | 125 | | | 806 | | | 103 | |
Unrealized losses/(gain) on other investments | | — | | | 1,696 | | | (300 | ) | | (668 | ) | | (1,887 | ) | | (242 | ) |
Loss on disposal of a subsidiary | | 2,695 | | | — | | | — | | | — | | | — | | | — | |
Taxation paid | | (19,861 | ) | | (24,819 | ) | | (1,393 | ) | | (2,532 | ) | | (2,171 | ) | | (278 | ) |
Change in long term receivable | | — | | | (6,206 | ) | | (6,893 | ) | | 567 | | | 5,600 | | | 718 | |
Change in working capital, net | | (17,218 | ) | | (13,559 | ) | | (41,769 | ) | | (40,252 | ) | | 3,167 | | | 406 | |
| | | | | | | | | | | | | | | | | | |
Net cash flow provided by operating activities | | 414,500 | | | 203,763 | | | 77,383 | | | 184,151 | | | 383,999 | | | 49,251 | |
| | | | | | | | | | | | | | | | | | |
| | | | | | | | | | |
| | | As of and for the year ended August 31, |
| | | 2003 | | 2004 | | 2005 | | 2006 | | 2007 |
Operating Data: | | | | | | | | | | |
Fixed Telecommunications Network Services Subscriptions: | | | | | | | | | | |
Broadband Internet Access | | 172,000 | | 197,000 | | 229,000 | | 220,000 | | 247,000 |
Local VOIP | | 140,000 | | 237,000 | | 293,000 | | 281,000 | | 308,000 |
IP-TV | | — | | 31,000 | | 109,000 | | 116,000 | | 128,000 |
| | | | | | | | | | |
Total | | 312,000 | | 465,000 | | 631,000 | | 617,000 | | 683,000 |
| | | | | | | | | | |
Registered International Telecommunications Accounts(7) | | 1,589,188 | | 1,916,235 | | 2,054,036 | | 2,201,963 | | 2,331,000 |
IDD Outgoing Minutes (in thousands) | | 888,000 | | 1,007,000 | | 947,100 | | 788,000 | | 659,000 |
Operating data:
| | | | | | | | | | | | | |
| | | As of and for the year ended August 31, | |
| | | 2007 | | | 2008 | | | 2009 | |
| FTNS subscriptions: | | | | | | | | | | | | |
| - Broadband Internet access | | | 247,000 | | | | 316,000 | | | | 391,000 | |
| - Local VoIP | | | 308,000 | | | | 329,000 | | | | 382,000 | |
| - IP-TV | | | 128,000 | | | | 156,000 | | | | 170,000 | |
| | | | | | | | | | |
| Total | | | 683,000 | | | | 801,000 | | | | 943,000 | |
| | | | | | | | | | |
| Registered international telecommunications accounts (note 5) | | | 2,331,000 | | | | 2,336,000 | | | | 2,383,000 | |
| | | | | | | | | | |
| IDD outgoing minutes (in thousands) | | | 659,000 | | | | 574,000 | | | | 487,000 | |
| | | | | | | | | | |
(1)
| | |
| Notes: |
|
| (1) | | Diluted net income/(loss)earnings per share is computed by dividing the net income/(loss)income by the diluted weighted average number of ordinary shares during the year. |
|
| (2) | | For fiscal 2003, 20042008 and 2007,2009, the diluted weighted average number of ordinary shares was the weighted average number of ordinary shares outstanding during the respective years, plus the weighted average number of additional ordinary shares which would have been outstanding assuming all the outstanding share options and share warrants (if any) have been exercised at the beginning of the respective years or on the date of issue, whichever is earlier. For fiscal 2005 and 2006, the diluted weighted average number of shares was equal to the weighted average number of ordinary shares outstanding during the respective years because the incremental effect of share options and share warrants was anti-dilutive in a loss-making year. |
|
| (3) | Diluted net income/(loss) from continuing operations per share is computed by dividing the net income/(loss) from continuing operations by the diluted weighted average number of ordinary shares during the year.
|
(4)
| Diluted net loss from discontinued operations per share is computed by dividing the net loss from discontinued operations by the diluted weighted average number of ordinary shares during the year.
|
(5)
| EBITDA for any period means, without duplication, net income/(loss)income for such period, plus the following to the extent deducted in calculating such net income/(loss):income: interest expense, income taxes, depreciation and amortization expense (excluding any such non cashnon-cash charge to the extent it represents an accrual of or reserve for cash charges in any future period or amortization of a |
| prepaid cash expense that was paid in a prior period not included in the calculation), less interest income. EBITDA is not a measure of performance under HKFRSs or U.S. GAAP.IFRSs. We believe that EBITDA is an additional measure utilized by investors in determining a borrower’s ability to meet debt service requirements. However, EBITDA does not represent, and should not be used as a substitute for, net earnings or cash flows from operations as determined in accordance with HKFRSs or U.S. GAAP,IFRSs, and EBITDA is not necessarily an indication of whether cash flow will be sufficient to fund our cash requirements. In addition, our definition of EBITDA may differ from that of other companies. |
(6)
|
| (4) | | Capital expenditures represent additions to fixed assets and include non-cash transactions. |
(7)
|
| (5) | | Registered accounts refer to international telecommunications customers that have a valid account. Account holders may or may not be active users of our services. |
(8)
| Due to additional evidence and information received with respect to the collectibility of the mobile interconnection charges prior to the filing of our annual report on Form 20-F for fiscal 2005 on January 30, 2006, we were required to reassess the conditions on which the estimates on bad debt provision for mobile interconnection charges receivables were based. As a result, our Hong Kong statutory financial statements for the year ended August 31, 2005 differ from the amounts reported in the consolidated financial statements reported in our annual report on Form 20-F for fiscal 2005. The effect of the reassessment was reflected in our consolidated financial statements as of and for the year ended August 31, 2005 included in our annual report on Form 20-F for fiscal 2005 and in our Hong Kong statutory financial statements as of and for the year ended August 31, 2006.
|
Our reassessment had the following effects on our consolidated statement of operations for the years ended August 31, 2005 and 2006:6
| | | | | | | | | | | | |
| | | As previously
reported in 2005 Hong
Kong statutory
financial statements | | | As reported
in 2005 Form
20-F | | | As previously
reported in
2006 Hong Kong
statutory
financial
statements | | | As reported
in 2006
Form 20-F | |
| | | HK$ | | | HK$ | | | HK$ | | | HK$ | |
| | | (Amounts in thousands except per share data) | |
Revenue from provision of telecommunications and other services, net | | 1,137,356 | | | 1,162,059 | | | 1,159,579 | | | 1,134,876 | |
Provision for doubtful accounts | | (60,563 | ) | | (35,445 | ) | | 7,668 | | | (17,450 | ) |
Net loss after tax | | (206,352 | ) | | (156,531 | ) | | (92,241 | ) | | (142,062 | ) |
Loss per share - Basic and Diluted | | (33.6) cents | | | (25.5) cents | | | (15.0) cents | | | (23.1) cents | |
Exchange Rate Informationrate information
The Hong Kong dollar is freely convertible into other currencies (including the U.S. dollar). Since 1983, the Hong Kong dollar has been officially linked to the U.S. dollar and the current rate is US$1.00 to HK$7.80.
However, even with this official exchange rate, and despiteDespite the efforts of the Hong Kong Monetary
Authority’s (“HKMA”) currency boardAuthority, or HKMA, to keep
suchthe official exchange rate stable, the market exchange rate of the Hong Kong dollar against the U.S. dollar continues to be influenced by the forces of supply and demand in the foreign exchange markets. Furthermore, the official exchange rate is itself subject to fluctuations and can be reset in circumstances where the secondary foreign exchange markets move beyond the HKMA’s ability to back the official rate with foreign reserves.
Exchange rates between the Hong Kong dollar and other currencies are influenced by the rate between the U.S. dollar and the Hong Kong dollar.
The following table sets forth the average, high, low and period-end
noon buyingexchange rate between the Hong Kong dollar and the U.S. dollar (in Hong Kong dollars per U.S. dollar) for the
fiscal periods indicated:
| | | | | | | | |
| | | Average(1) | | High | | Low | | Period-End |
| | | HK$ | | HK$ | | HK$ | | HK$ |
2002 | | 7.7996 | | 7.8095 | | 7.7970 | | 7.7988 |
2003 | | 7.7864 | | 7.8001 | | 7.7085 | | 7.7640 |
2004 | | 7.7891 | | 7.8010 | | 7.7632 | | 7.7723 |
2005 | | 7.7775 | | 7.7999 | | 7.7514 | | 7.7718 |
2006 | | 7.7681 | | 7.7928 | | 7.7506 | | 7.7767 |
2007 | | 7.8019 | | 7.8289 | | 7.7497 | | 7.7975 |
July 2007 | | 7.8197 | | 7.8264 | | 7.8129 | | 7.8264 |
August 2007 | | 7.8155 | | 7.8289 | | 7.7968 | | 7.7968 |
September 2007 | | 7.7816 | | 7.7947 | | 7.7591 | | 7.7689 |
October 2007 | | 7.7544 | | 7.7694 | | 7.7497 | | 7.7502 |
November 2007 | | 7.7773 | | 7.7890 | | 7.7573 | | 7.7874 |
December 2007 | | 7.7983 | | 7.8073 | | 7.7879 | | 7.7984 |
January 2008 (through January 23, 2008) | | 7.8043 | | 7.8107 | | 7.7989 | | 7.8075 |
| | | | | | | | | | | | | | | | | |
| | | Average | | | High | | | Low | | | Period-end | |
| | | (note) | | | | | | | | | | |
| | | HK$ | | | HK$ | | | HK$ | | | HK$ | |
| Fiscal 2005 | | | 7.7869 | | | | 7.8002 | | | | 7.7684 | | | | 7.7718 | |
| Fiscal 2006 | | | 7.7601 | | | | 7.7796 | | | | 7.7506 | | | | 7.7767 | |
| Fiscal 2007 | | | 7.8029 | | | | 7.8289 | | | | 7.7665 | | | | 7.7968 | |
| Fiscal 2008 | | | 7.7915 | | | | 7.8159 | | | | 7.7497 | | | | 7.8036 | |
| Fiscal 2009 | | | 7.7550 | | | | 7.8094 | | | | 7.7495 | | | | 7.7505 | |
| July 2009 | | | 7.7500 | | | | 7.7505 | | | | 7.7495 | | | | 7.7500 | |
| August 2009 | | | 7.7506 | | | | 7.7516 | | | | 7.7500 | | | | 7.7505 | |
| September 2009 | | | 7.7503 | | | | 7.7514 | | | | 7.7498 | | | | 7.7500 | |
| October 2009 | | | 7.7497 | | | | 7.7502 | | | | 7.7495 | | | | 7.7497 | |
| November 2009 | | | 7.7497 | | | | 7.7501 | | | | 7.7495 | | | | 7.7500 | |
December 2009
(through December 14, 2009) | | | 7.7501 | | | | 7.7515 | | | | 7.7495 | | | | 7.7515 | |
(1) | | |
| Note: | | The average of the noon buying rates on the last business day of each month during the relevant annualfiscal year period or the average noon buying rates for each business day during the relevant monthly period. |
|
| Source: | | For all periods prior to January 1, 2009, the exchange rate refers to noon buying rate as reported by the Federal Reserve Bank of New York. For periods beginning on or after January 1, 2009, the exchange rate refers to the exchange rate as set forth in the H.10 statistical release of the Federal Reserve Board. |
Source: Federal Reserve Bank of New York.
B. Capitalization and indebtedness Not
applicableapplicable.
C. Reasons for the offer and use of proceeds You should carefully consider the risks described below and other information contained in this annual report before making an investment decision. The risks and uncertainties described below are not the only ones we face. Additional risks and uncertainties not presently known to us, or that we currently deem immaterial, may also impair our business operations. We cannot assure you that any of the events discussed in the risk factors below will not occur. If they do, our business, financial condition or results of operations could be materially adversely affected. Risks Relatingrelating to Our Businessour business and Operationsoperations
WeIn light of the intense competition in our target markets, we cannot assure you that we will be able to maintain an increase in totalour revenues and operating resultsnet profit will continue to grow.In fiscal 2007,
We derive our total revenues from our FTNS business and our IDD business. Our FTNS business primarily consists of broadband Internet access, local VoIP, IP-TV and corporate data services, while our IDD business primarily consists of direct dial, international calling cards and mobile call forwarding services. Our total revenues increased by 13.4% to HK$1,141.3 million from HK$1,134.91,478.2 million in fiscal 2006, and we recorded a net profit of2009 from HK$28.9 million versus a net loss of HK$142.11,303.0 million in fiscal 2006.2008, and our net profit increased by 70.0% to HK$212.8 million in fiscal 2009 from HK$125.2 million in fiscal 2008. The increase in net profit in fiscal 20072009 was mainly due to our focus on increasing the average revenue per userincreased contribution from our fixed telecommunications networkFTNS business, which carries high incremental margins than our IDD business, and also from enhancing operating efficiency over the last 18 months. Moreover, the shift in thea gain of HK$31.4 million on extinguishment of a portion of our outstanding senior notes.
Although revenue composition from our international telecommunications services to our fixed telecommunications networkFTNS business also represents a transition to a higher margin business model. However,increased by 21.8% in fiscal 2009, we cannot assure you that we will be able to maintain such revenue and profit growth. The increase in revenue of our FTNS business was primarily due to an increase in our subscription base of 17.7%, driven by growing demand for high bandwidth broadband Internet access service. Any further increase in such subscription base will highly depend on our ability to continue expand our network coverage and compete successfully in an intensely competitive market.
7
On November 1, 2009, we launched our “Member-Get-Member” series of marketing programs. Under this series of programs, our existing customers may refer a new customer to use our broadband Internet access services and both will enjoy access to our bb100 service for HK$99 per month under a 24-month contract. In addition, new customers are also entitled to this new discounted rate. As the
profitsresults of such programs will highly depend on the response from the markets and
business growth.Revenuesour competitors, we cannot assure you that our revenues and net profit will continue to grow due to more intense competition and uncertain price elasticity.
Further, revenue from our international telecommunicationsIDD business decreased by 22.4%15.3% in fiscal 2009. The decrease was primarily due to a decrease in the total number of airtime minutes by 16.4%15.2%, which reflected a reduction in the scale of operations. On our IDD service, our strategy is to focus on cash flow and the intentional drop out of low profit margin subscribers. With the drop in averageprofitability rather than market share. Due to increasing competition, we expect our IDD business will continue to experience pressure on tariff rates and to contribute to a reduced operating scale, we expectsmaller portion of our revenue and net profit margins from our international telecommunications services willover time.
Our ability to continue to
be under pressuregrow our total revenues and
less revenue will be generatednet profit in
future.Revenues fromthe rapidly evolving telecommunications industry depends on many factors, including our fixed telecommunications network business increased by 14.0% in fiscal 2007, primarily dueability to an increase in our average revenue per useraccurately identify and an increase in our subscription base of 10.7%. This increase was mainly driven by the growingrespond to demand for high bandwidthnew services, success in developing new services on a timely basis, quality and cost competitiveness of our services, effectiveness of our sales and marketing efforts, and the number and nature of competitors in a given market segment. The global economic downturn has resulted in decreased consumer confidence and overall slower economic activity, which may dampen the demand for broadband Internet access service. However,services or affect our customers’ ability to continue with existing services. We cannot assure you that we can maintain the current level of revenue growth and profitability.
Given the pace of change in the telecommunications industry and the characteristics of our target markets, we cannot assure you that our fixed telecommunications network serviceFTNS business will continue to be profitable as we will continue to expand substantial resources in developing and marketing broadband Internet access, local VOIP, IP-TV and corporate data services.We have substantially less financial and human resources to apply to the development ofprofitable.
The main target market for our
FTNS business
than some of our main competitors.The telecommunications and pay-TV markets inis Hong Kong are highly competitive. Some of our main competitors for Internet access, local telephony, pay-TV and international telecommunications services have longer operating histories and others are subsidiaries of large business conglomerates. Consequently, our competitors may have resource advantages over us including as follows:
greater financial, technical, marketing and other resources;
greater existing infrastructure;
greater name recognition; and
In addition, certain areas of the fixed telecommunications network services business are very capital intensive. Our competitors may be able to devote more human and financial resources to research and development, network improvement and marketing than we can.
Our growth and profitability could be affected by an increasing number of local and foreign entrants in the international and local telecommunications, Internet access and television broadcasting markets.
Kong. The Hong Kong government continues to liberalize access into the telecommunications industry in Hong Kong, including issuing new wireless and wire-line fixed telecommunications network services licenses, which we refer to as FTNS Licenses. We expect the Hong Kong government to continue to open the telecommunications market in the next several years. Some of these changes may impact our Company:
As of January 4, 2008, 253 public non-exclusive telecommunications service licenses, which we refer to as PNETS Licenses, for the provision of external telecommunications services had been issued in Hong Kong. Some of these licenses are held by subsidiaries of major foreign telecommunications providers, which have competitive advantage due to their global presence and size.
On December 31, 2007, TVB and ATV launched digital terrestrial television, which will expand the public’s access to free channels in both standard and high definition. This improvement in the quality of free television may result in a reduction in the number of subscribers for pay-television services. If the number of subscribers to our pay-television service declines, it could adversely affect our results of operations.
Increasing liberalization of the telecommunications market in Hong Kong may continue to attract new local and foreign entrants to the market, which may broaden the variety of telecommunications services supplied by existing service providers, thereby heightening the overall level of competition in our industry. Increasedis intensely competitive. The intense competition could result in price reductions, reduced gross margins or loss of market share, any of which could adversely affect our future growth and profitability.
We expect competition to continue to increase for the following reasons:
| • | | Increasing liberalization of the telecommunications industry in Hong Kong may continue to attract new local and foreign entrants and broaden the variety of telecommunications services available in the market, thereby increasing the overall level of competition in our industry. |
|
| • | | The Hong Kong government may continue to issue new wireless and wire-line FTNS Licenses. For instance, 261 PNETS Licenses had been issued in Hong Kong as of October 31, 2009 for the provision of “external telecommunications services” (as defined in the Telecommunications Authority’s Determination as of December 30, 1998). Some of these licenses are held by subsidiaries of major foreign telecommunications providers, which have competitive advantages over us due to their global presence and size. |
|
| • | | Around December 31, 2007, Television Broadcasts Limited and Asia Television Limited, commonly known as TVB and ATV, respectively, the only two licensed domestic territorial broadcasters in Hong Kong, launched their digital terrestrial television services and have since broadened such services to cover an increasingly large percentage of the viewing public in Hong Kong. As of December 15, 2009, their services offered a total of 11 free channels in both standard and high definition. This improvement in the quality of free television may result in a reduction in the number of subscribers for pay-television services. |
As some of our main competitors have longer operating histories and others are subsidiaries of large business conglomerates, they may have greater financial, technical, marketing and other resources; a more sophisticated infrastructure; better brand recognition; and a larger subscription base and may be able to devote more human and financial resources to research and development, network improvement and marketing than we can. Our competitive position varies significantly by service type because each service is characterized by a different market. If we cannot compete effectively in a major market, our business, operating results and financial condition could be adversely affected.
Our services may become obsolete if we cannot address the changing needs of our customers.
The telecommunications industry is characterized by rapidly changing technology and industry standards, evolving subscriber needs and the changing nature of services with increasingly short life cycles. We cannot assure you that we will be able to respond successfully to technological advances and stay ahead of the evolving industry standards, for the following reasons:
| • | | To compete successfully, we must constantly increase the diversity and sophistication of the services we offered and upgrade our telecommunications technologies. We may be required to make substantial capital expenditures and may not be successful in modifying our network infrastructure in a timely and cost-effective manner in response to these changes. |
|
| • | | New technology or trends in the telecommunications industry could have an adverse effect on the services we currently offer. For example, traditional fixed line home telephones are being replaced by mobile telephones and/or VoIP services. Technology substitution from global VoIP providers, some of which offer free PC-to-PC based international calls, is also becoming more prevalent. Both may lead to a decline in our revenues from international telecommunications services and local telephony services. |
|
| • | | Changing our services in response to market demand may require the adoption of new technologies that could render many of the technologies that we are currently implementing less competitive or obsolete. We may also need to gain access to related or enabling technologies in order to integrate the new technology with our existing technology. Our new services may contain design flaws or other defects when first introduced to the market. |
If we cannot offer the new services demanded by our customers in a timely manner, our business, operating results or financial condition could be adversely affected.
The development of our Next Generation Network requires significant capital expenditures. These capital expenditures, which may vary materially from those currently planned andnot be available on terms satisfactory to us or may impose a burden on our financing and operatingother business activities.
8
Our business is capital intensive,intensive. We need to continue to devote substantial resources in infrastructure construction and upgrade to provide consistent and high quality services. In particular, because we deliver our capital expenditures may not have the positive effect onfixed telecommunications network services through our business and revenues thatself-owned Next Generation Network, we expect. We have made, and will continue to make, capital investments in the expansion and upgrade of our self-owned Next Generation Network,this network and the development of ourvarious telecommunications services. We incurred total capital expenditures of approximately HK$132.3286.7 million in fiscal 2007. For the three fiscal years ending August 31, 2010, we2009.
We expect to incur
a total capital
expenditureexpenditures of approximately HK$
850300 million
theto HK$350 million per year in fiscal 2010 and 2011, a large majority of which will be spent on the continued expansion and upgrade of our network.
While we intend to fund such expenditures by using our currently available cash as well as cash flow from operations, we may not have adequate capital to fund our projected capital expenditures. Future,Our ability to fund operating and capital expenditures depends significantly on our ability to generate cash from operations. In fiscal 2009, we generated cash from operations of HK$535.9 million. However, we cannot assure you that we will be able to sustain our operations in order to generate sufficient cash flows to meet our future requirements. Our ability to generate cash from operations is subject to general economic, financial, industry, legal and other factors and conditions, many of which are outside our control. In particular, our operations are subject to price and demand volatility in the telecommunications industry.
If we cannot finance our operations and capital expenditure using cash generated from operations, we may be required to, among other things, incur additional
debt, reduce capital expenditures, sell assets, or raise equity. The recent global economic crisis has caused a general tightening in the credit markets, lower levels of liquidity, increases in the rates of default and bankruptcy, and volatility in the capital markets. Although we have sufficient cash to meet our anticipated cash needs for at least the next 12 months, the current market conditions may affect our ability to obtain further financing to support our network expansion in the future. Any failure to do so will negatively impact our business and slow down our network deployment, in that we may not be able to continue expanding our network infrastructure to cover substantial area of the Hong Kong territory. Additional debt or equity financing may not be available, and debt financing, if available, may involve restrictions on our investing, financing and operating activities.
We mayIf any of our new services are not realize the commercial benefitssuccessful, our operating results could be adversely affected.
New telecommunications services are introduced by our competitors from time to time. If we
expect from our investments, which may adversely impact our business.We have made significant investments in our network infrastructure to provide the services we offer. The launch ofdo not anticipate these changes and rapidly adopt new and commercially viable products andinnovative services is important to compete in our business. Commercial acceptance by consumers of the new services we offer may not occur at the rate or level expected, andresponse, we may not be able to successfully adaptfully capture the opportunities in the market. Development of new services, effectively and economicallyhowever, exposes us to meet consumers’ demand, which could limit the return from our investments.following risks:
| • | | Developing new telecommunications services can be complex. We may not be able to adapt the new services effectively and economically to meet customer demand. |
|
| • | | In developing new services, we are required to continue to make significant investments in our network infrastructure in order to support these services. If we exceed our budgeted capital expenditure and cannot meet the additional capital requirements in time through operating cash flow and planned financings, we may have to delay the project. |
|
| • | | Any of our new services may not be commercially successful. The failure of any of our services to achieve commercial acceptance could result in additional capital expenditures or, to the extent that we are required under the applicable accounting standards to recognize a charge for the impairment of assets. Any impairment charges could materially and adversely affect our financial condition and the results of our operations. |
Specifically, we cannot assure you that
any services enabled by upgrading and expanding our Next Generation Network will
be accepted by the public to the extent required to generateprovide us with an acceptable rate of return.
Furthermore, we cannot assure you thatThis would depend on our
estimate of the necessary capital expenditureability to
offer such services will not be exceeded. The failure of any of our servicesaccurately identify and respond to
achieve commercial acceptance could result in additional capital expenditures or a reduction in profitability to the extent that we are required under the applicable accounting standards to recognize a charge for the impairment of assets. Any such charge could materiallyemerging consumer trends and
adversely affect our financial condition and the results of our operations.Although we have expressed our interest in Singapore’s Next Generation National Broadband Network project, wedemand. We cannot assure you that we will be capable of participating in the projectcan generate satisfactory investment returns on any new service.
We may need to improve our internal controls over financial reporting and if we will, that this project will be successful.We are exploring the possibility of bidding for Singapore’s Next Generation National Broadband Network project. See “Business Overview—Developments in Fiscal Year 2007”. To participate in this project, weour independent auditors may be required to structure the transactions to comply with certain restrictive covenants under the 8.75% notes that we issued in January 2005. No assurance can be given that we willnot be able to successfully structure the transactions. We may also require financing, which might include the issuance of equity securities and issuance of debt instruments, among other alternatives. Raising additional funds by issuing common stock or other types of equity securities would dilute our existing stockholders.
If we electattest to submit a bid for the project, we cannot assure you that our bid will be accepted or, if accepted, that the awarded contract will generate sufficient revenues to result in profitability. Because the Infocomm Development Authority of Singapore (“IDA”) requires a bid on this project in advance of the completion of the relevant design, we are subject to the risks of unforeseen software development or other technological difficulties and/or cost overruns.
We are in the process of instituting changes to our internal controls and management systems in order to satisfy the requirements of Section 404 of the Sarbanes Oxley Act of 2002. Our failure to timely and successfully institute these changes and to maintain the adequacy of our internal controls could subject us to regulatory actions and may adversely affect our stock price and our ability to raise additional capital.their effectiveness.
The United States Securities and Exchange Commission, or the SEC, as required by Section 404 of the Sarbanes-Oxley Act of 2002, adopted rules requiring every public company to include a management report on such company’s internal controls over financial reporting in its annual report, which contains management’s assessment of the effectiveness of the company’s internal controls over financial reporting. In addition, an independent registered public accounting firm must attest to and report on the effectiveness of the
company’sCompany’s internal controls over financial reporting. As a non-accelerated filer, we are required to file management’s
first report on internal controls over financial reporting for
the fiscal
year ending August 31, 20082009 and our first auditor’s
attestation report on the effectiveness of our internal controls over financial reporting for
the fiscal
year ending August 31, 2009.2010.
We
are in the process of instituting changes tohave evaluated our internal controls
surrounding the financial reporting process for the current fiscal period so that management can attest to the effectiveness of these controls, as required by Section 404 of the Sarbanes-Oxley Act of 2002. We have implemented appropriate steps to strengthen the internal controls. However, we may identify conditions that could result in significant deficiencies or material weaknesses in the future. As a result, we could experience a negative reaction in the financial markets and
management systems to comply withincur additional costs in improving the
requirements. Among others, we are designing procedures to document variouscondition of our internal controls. For a detailed discussion of controls and
relevant testing procedures,
under requirements stipulated by the Public Company Accounting Oversight Board in the United States. We have assigned an internal audit manager to oversee this compliance process, who reports to our Audit Committee, Chairmansee Item 15 “Controls and
other senior management on a periodic basis. In addition, we hired external consultants to perform a high-level internal control gap analysis and we would hire external consultants for advisory services whenever necessary.procedures.”
Notwithstanding our efforts, our management may
subsequently conclude that our internal controls over
our financial reporting are not effective.
Moreover,Further, for fiscal 2010, even if our management concludes that our internal controls over
our financial reporting are effective, our independent registered public accounting firm may conclude that our internal control over financial reporting is not effective.
If we do not successfully design and implement changes to our internal controls and management systems, or if we fail to maintain the adequacy of these controls as such standards are modified or amended from time to time, we may not be able to comply with Section 404 of the Sarbanes OxleySarbanes-Oxley Act of 2002. This could subject us to regulatory scrutiny and penalties that may result in a loss of public confidence in our management, which could, among other things, adversely affect our customer and vendor confidence, stock price and our ability to raise additional capital and operate our business as projected.
9
OurIf we cannot manage the growth and expansion may impactin our ability to manage our operations, increase our costs of operation and adversely affectFTNS business, the quality of our services.services and our operating results could be adversely affected.We have pursued and continue to pursue abeen pursuing an aggressive strategy of aggressive growth in growing our fixed telecommunications network servicesFTNS business. As part of this strategy, we intend to continue to expand and invest in theour Next Generation Network infrastructure we use to deliversupport our range of broadband Internet access, local VOIP,VoIP, IP-TV and corporate data services. The deployment of these projects has resulted and will result in significant demands on our systems and controls and may impact our administrative, operational and financial resources. These projects will also place significant demands on us to maintain the quality of our services to ensure that our brand does not suffer as a result of any deviations, whether actual or perceived, in the quality of our services.
Our ability to manage
the growth in our
future growthFTNS business will depend upon our ability to:
simultaneously manage implementation of our infrastructure development and marketing plans;
| • | | improve our existing operational, administrative and technological systems and our financial and management controls; |
|
| • | | enhance our infrastructure to support the expansion; |
|
| • | | develop effective marketing plans; |
|
| • | | control operational costs and maintain effective quality controls; and |
|
| • | | offer competitive prices to customers for our services. |
effectively monitor our operations so as to contain costs and maintain effective quality controls; and
continue to offer competitive prices to customers for our services.
Our failure to achieve any of the above in an efficient manner and at a pace consistent with the growth of our fixed telecommunications network servicesFTNS business could have an adverse effect on the quality of our services and increase our costs of operation.
We depend on certain key personnel, and our business and growth prospects may be disrupted by the loss of their services. Our future success is dependent upon the continued service of our key executives and employees.
We rely extensively on the services of our executive officers, including Wong Wai Kay, Ricky, our Chairman, and Cheung Chi Kin, Paul, our Chief Executive Officer. While we have employment agreements with members of our senior management staff, we cannot assure you that we will be able to retain these executives and employees. If one or more of our key personnel were unable or unwilling to continue in their present positions, or if they joined a competitor or formed a competing company, or if they shifted their focus away from Hong Kong operations, we may not be able to replace them easily, our business may be significantly disrupted and our financial condition and results of operations may be materially and adversely affected. Furthermore, as our industry is characterized by high demand and increased competition for talent, we may need to offer higher compensation and other benefits in order to attract and retain key personnel in the future. We cannot assure you that we will be able to attract and retain the key personnel that we will need to achieve our business objectives.
ExpansionOur ability to further expand the coverage of our Next Generation Network into certain buildings and residences may be limited by the physical limitations or our ability to obtain access permits.rights in certain buildingsExpanding our.
Our Next Generation Network coverage requires us to install fiber-to-the-home, or fiber-to-the-building, as well as install Category 5e copper wiring within residentialhas the capability of providing value-added broadband services and commercial buildings to reach the subscriber’s premises, which we refer to as in-building-wiring. Onecontent that combine voice, data and images with increased efficiency and flexibility. As part of our competitors has already installed in-building-wiring in virtually all buildings, andstrategy to grow our FTNS business, we along with other fixed telecommunications network service providers may encounter a bottleneck when installing our own in-building-wiring because many buildings have limited physical space for additional in-building wiring. In addition, owners of certain single-owner commercial buildings may grant rights of accessplan to our competitors while barring us from installing our own in-building-wiring. Furthermore, certain developers may have affiliations with our competitors and may attempt to delay our wiring installations. These constraints may hinderincrease the expansioncoverage of our Next Generation Network from the current 1.4number of 1.6 million home passes coverageresidential homes pass as of August 31, 2009 to our three-year target of 2.0 million home passes. Failureresidential homes pass by the end of 2011. To connect our Next Generation Network to a new physical site, we need to install fiber-to-the-home or fiber-to-the-building with Category-5e copper wiring, which we refer to as “in-building wiring”. Our expansion plan may be hindered because the installation of in-building wiring is subject to the following constraints:
| • | | Because at least one of our competitors has already installed in-building wiring in virtually all buildings and many buildings have limited physical space for additional in-building wiring, other FTNS providers, including us, may encounter a bottleneck when installing our own in-building wiring. |
|
| • | | Some single-owner commercial buildings may grant rights of access to our competitors while barring us from installing our own in-building wiring. |
|
| • | | Certain developers may have affiliations with our competitors and may attempt to delay our wiring installations. |
We may be unable to capitalize on any economy of scale benefits if we fail to expand our network coverage
will limitin our
projected rate. Our growth opportunities
and reduce our ability to benefit from economics of scale.will also be limited as a result.
Internet security concerns could limitadversely affect our ability to develop revenues from Internet access services.We intend
To remain competitive, we must continue to
continue developingupgrade our broadband Internet access, local
VOIP,VoIP, IP-TV and corporate data services. Computer viruses, break-ins and other inappropriate or unauthorized uses of our Next Generation Network could affect the provision of our full suite of Internet Protocol
or IP, services. Computer viruses, break-ins or other problems couldservices and have the following effects on our
fixed telecommunications network servicesFTNS business:
result in
| • | | interruption, delays or cessation in services to our customers; |
|
| • | | a threat to the security of confidential information stored in the computer system of our customers; and |
|
| • | | illegal viewing or download of our contents. |
To protect our customers;
jeopardize the security of confidential information stored in thebusiness from computer system of our customers;viruses and
allow for illegal viewing or download of our content.
We other harmful attacks, we may need to incur significant costs to protect us against the threat of security breaches or to alleviate problems caused by such breaches. In addition, alleviatingWe intend to continue to strengthen our network security to alleviate these problemsproblems. Our efforts, however, may cause interruptions, delays or cessation in service tocessations of our users, which could cause them toservices, and our customers may stop using our service or assert claims against us. While we continue to strengthen our network security, there is no assurance that computer viruses and other harmful attacks could not affect our business.us as a result.
10
Risks Relating to Our Technological Infrastructure
We willmay be limited inunable to further expand the scope of our ability to continue to expand our internetInternet access businessservices unless we obtain additional network capacity.Our internet access network has limited capacity.
Our ability to
continuetransition from time to
increase internet service depends ontime to more advanced technologies for faster Internet access is critical to our sustained competitiveness. Because our Next Generation Network has limited capacity, our ability to expand the network bandwidth on a timely basis
which in turn is subject
to:�� | • | | the expansion and development of our own international telecommunications facilities;
|
to the following factors:the expansion and development of our own international telecommunications facilities;
the availability of leased capacity from third party carriers at favorable rates; and
the possible termination or cancellation of our existing contracts.
If we fail to increase the capacity of our international bandwidth, our ability to increase our
internet access business market share and
revenuesrevenue in the Internet access market segment will be limited.
We are vulnerable to naturalNatural disasters and other disruptive regional events which could cause damage to our network and result in lost revenueadversely affect our business and perhaps lost customers.operating results.Our network is vulnerable to damage or cessation of operations from fire, earthquakes, severe storms,
heavy rainfall, power loss, telecommunications failures, network software flaws, vandalism, transmission cable cuts and other catastrophic events. We may experience failures or
shutdownsshut downs relating to individual points of presence or even catastrophic failure of our entire network.
Hong Kong’s weather patterns often result in heavy rainfall during certain periods of the year. Any sustained failure of our network, our servers, or any link in the delivery chain, whether from operational disruption, natural disaster or otherwise,
resulting in an interruption in our operations, could have a material adverse effect on our business, financial condition and results of operations.
The loss of key suppliers or their failure to deliver equipment on a timely basis could negatively impact our business prospects.business. We rely on our key suppliers Cisco Systems Inc., Nortel Networks Limited and other suppliers to provide equipment, underground cables and other necessary componentsthird parties for the supply of network equipment. Further, because an IP set-top-box must be installed in building our Next Generation Network infrastructure, and for our VOIP equipment. In order for new subscribers to access our IP-TV services, we must install an IP set-top-box in their homes. We must have an adequate supply of such installation equipment on hand for delivery to respond to new customer subscriptionsour customers in a timely manner.
We purchase all of our IP set-top boxes and other equipment from our suppliers on a purchase order basis and have no long-term contracts. If our suppliers are unable to supply us with these products in a timely manner or the costs of these products increase due to unforeseen causes, this could negatively impact our operating results, especially if we are unable to
acquire new subscribersspread the costs over a larger subscription base or effectively
appropriate ourpass the additional costs on to our
customers. In addition, if Cisco Systems, Inc. or Nortel is unable or is delayed in providing us with the hardware required for building our fiber-based backbone infrastructure or VOIP equipment, this could negatively impact our operating results.subscribers.
Our relianceBecause we rely on third parties to provide maintenance and repairs forin delivering services through our Next Generation Network, could adversely affect our operating results could be adversely affected if their services are not timely or do not meet our standards.We depend on
Cisco Systems, Inc. and other third parties for
the ongoing
support and assistance with respect to maintenance and
repairs.repair of our Next Generation Network. Further, although our Next Generation Network is operated essentially as an independent network, a small portion of it is connected to the network of other providers under interconnection agreements. We are also dependent on certain Hong Kong rail transport providers to maintain and provide us with access to their infrastructure to support the proper functioning of our equipment and fiber-based backbone. If these third parties fail to
provide us the equipment we require, or fail to respond or are untimely in their response to our maintenance and repair needs, our customers may experience interruptions or variations in the quality of our fixed telecommunications network
services, which mayservices. Any service interruptions or variations could adversely affect our operating results and our ability to retain or add new customers.
If we are unable to stay ahead of technology trends and evolving industry standards, our services may become obsolete.Telecommunications businesses are characterized by rapidly changing technology and industry standards, evolving subscriber needs and the introduction of new services. The continuously changing nature of these services, and their increasingly shorter life cycles require us to continually improve our performance, services and network in order to compete successfully with the services offered by our competitors. Further, new technology or trends in the telecommunications industry could have an adverse effect on the services we currently offer. For example, the replacement of traditional fixed line home telephones with mobile telephones and/or VOIP services may lead to a decline in our international telecommunications services revenues. Further, technology substitution from global VOIP providers, some of which offer free PC-to-PC based international calls, is also becoming more prevalent. Changing our services in response to market demand may require the adoption of new technologies that could render many of the technologies that we are currently implementing less competitive or obsolete. In addition, our new products and services may contain design flaws or other defects that could have a material adverse effect on our business, operating results or financial condition. To respond successfully to technological advances and emerging industry standards, we may require substantial capital expenditure and access to related or enabling technologies in order to integrate the new technology with our existing technology. We may not be successful in modifying our network infrastructure in a timely and cost-effective manner in response to these changes, which will affect our ability to continue to offer the products and services demanded by our customers.
Risks Relatingrelating to the Regulatory, Politicalregulatory, political and Economic Environment
economic environment
Regulatory reforms and currently contemplated regulatory initiatives in the telecommunications industry may adversely affect us. The Hong Kong telecommunications industry is undergoing continuous regulatory reform. Our business and results of operations may be adversely affected by changes in the telecommunications regulations, especially in the following areas:
In July 2004, a new provision of the Telecommunications Ordinance came into force. This anti-competition provision specifically regulates the conduct of all carrier licensees (in particular merger and acquisition transactions) in the Hong Kong telecommunications industry by giving the Telecommunications Authority the power to review the conductconducts and transactions concerning carrier licensees and to take appropriate actions if it determines that the transaction would, or is likely to, prevent or substantially lessen competition in a telecommunications market. The Telecommunications Authority has the power under this provision to conduct an investigation into any questionable transaction. It might consent to the transaction (unconditionally or subject to any conditions it deems appropriate) or reject the transaction outright. The decision of the Telecommunications Authority will take into account of whether the transaction will adversely affect the public interest and benefit. This provision may have an adverse effect on our ability to grow our business through mergers and acquisitions.
We offer local VOIPVoIP services through our Next Generation Network.Network under HKBN’s FTNS License. Following the conclusion of a public consultation on the regulation of Internet Protocol Telephony Services, the Telecommunications Authority issued a statement on June 20, 2005, setting out its views and decisions on the regulatory and licensing framework for the provision of VOIPVoIP services, including the creation of a licensing framework, conformance to the existing system of assigning telephone numbers, imposition of interconnection charges and establishing guidelines with respect to the quality of services.
11
We offer fixed but not mobile telecommunications network services. The Telecommunications Authority is currently in the process of developinghas implemented a new Fixed-Mobile Convergence, or FMC,fixed-mobile convergence licensing practice by way of the UC License. The UC License regime, which may supersede the existing distinctions between fixed-line and mobile operator licensing. This effectively means thatbegan on August 1, 2008, seeks to replace the existing four classes of carrier licenses are proposedfor the provision of fixed and mobile services with a simple license. Going forward the UC License will be the only carrier license to be replaced byissued for the provision of fixed, mobile and/or converged services. Existing carrier licenses will remain effective until their expiry date. Licensees can choose to apply to convert their existing licenses to UC Licenses before then or apply for a single Unified CarrierUC License or UCL.upon expiry. This regulatory change, together with the development of new technologies, may further accelerate the convergence of fixed and mobile telecommunications services, resulting in more structural competition between fixed-line and mobile telecommunications operators. As we do not have a wirelessmobile license, and are not currently authorized to provide mobile services, our ability to compete may be hindered by our inability to offer such services independently.
We provide our IP-TV services over our Next Generation Network under HKBN’s FTNS License. The Hong Kong government has indicated that because our IP-TV services are carried over the Internet, we are exemptexempted under the Broadcasting Ordinance from the requirement to obtain a domestic pay-television program service license. However, the government’s Communications and Technology Branch has informed us that the government is considering a review of the broadcasting regulatory regime and may introduce changes to the existing regulatory framework, including the existing exemption in the Broadcasting Ordinance. However, we cannot predict whether the government may require us to obtain a pay-television program service license in the future.
We require licenses from the Telecommunications Authority to provide our services. If one of these licenses is revoked or not renewed or there are substantial changes in its terms and conditions, we wouldmay be unable to deliver the services authorized by that license. We require licenses from the Telecommunications Authority to provide our international telecommunications and fixed telecommunications network and international telecommunications services. Our business operations therefore are susceptible to the following changes in the regulatory environment in particular:
Our ability to adjust the tariffs for different services are governed by the terms and conditions of the relevant licenses. The licenses, however, are issued under different regulatory frameworks. The differences in regulatory structure for these licenses may constrain our flexibility to respond to market conditions, competition or cost structure.
We have been granted a waiver by the Telecommunications Authority to comply with the tariff restrictions contained in HKBN’s FTNS License. If the waiver is revoked, our ability to adjust the tariffs for our fixed telecommunication network services, including our offer of discounts to subscribers from time to time, will be restricted.
Our PNETS License is subject to the Telecommunications Authority’s annual renewal. On October 19, 2009, the Telecommunications Authority announced the replacement of the PNETS License by a new class of Services-Based Operator License, Class 3 Modified Services-Based Operator License. On December 1, 2009, the PNETS License of City Telecom was replaced by a Class 3 Modified Services-Based Operator License. It is expected that the PNETS License of HKBN would also be replaced by a Class 3 Modified Services-Based Operator License on January 1, 2010 through the renewal andprocedure. HKBN’s FTNS License awardedwas initially granted in 2000 is initially granted for a term of 15 years whichand may be renewed for such further period not exceeding 15 years at the discretion of the Telecommunications Authority.
The Telecommunications Authority’s failure to renew or its revocation of any of these
licenses or its amendment of any of the terms and conditions contained in such licenses for any reason would prohibit us from continuing to offer the services authorized by
that license,those licenses, which would have a significant adverse impact on our revenues and profitability. In addition,
there may be future changes in Hong Kong’s telecommunications regulations or policies that would require us to obtain additional licenses,
which could have an adverse impact on our operations.
Our international telecommunications revenues may be adversely affected by increases in tariffscarrier charges in China. In China,
the Ministry of Information Industry, or the MII, and the State Development Planning Commission jointly set tariffs for all domestic and international long distance services
in China usingoffered through public switched telephone networks, leased lines and data
services.services are jointly set by the Ministry of Information Industry and the State Development Planning Commission. Certain tariffs payable by us to our carrier partners are based, among other things, on the tariffs set by these agencies with respect to the calls our subscribers make to persons in China. In fiscal
2007,2009, approximately
75%78% of our international call traffic volume was to China. We cannot predict the timing, likelihood or magnitude of any tariff adjustments that may be imposed by the
MIIMinistry of Information Industry and the State Development Planning Commission, nor can we predict the extent or potential impact upon our business of any future tariff increases. Such increases may lead to a decrease in traffic, reduce our revenues and adversely affect our business and results of operations. In addition, if we are unable to effectively manage the increased network costs,
it would have an adverse effect on ourthe profit margins
for international telecommunications services.of our IDD business could be adversely affected.
We haveAs approximately 47%48% of our staff located in Guangzhou, China, and changes in Chinese labor or business laws may significantly affect our operations and our ability to serviceserve our Hong Kong based customers.Our call center in Guangzhou employs over
1,200 persons1,500 employees and is an important resource
forto us. We are therefore
subject, to a significant degree, tosignificantly affected by the laws and regulations
that governgoverning foreign companies with operations in China. As the Chinese legal system develops, changes in such laws and regulations, their interpretation or their enforcement may lead to restrictions on our ability to hire and retain our employees in China, which could impact our ability to provide
serviceservices to our Hong
Kong basedKong-based customers.
Currency fluctuations of the Hong Kong dollar, our functional currency, may increase our operating costs and long term liability.
12
A major portion
We are exposed to a certain amount of our operating costs is interconnection charges paid to overseas carriers for the delivery of our international calls. Substantially all of these interconnection charges are denominated in U.S. dollars or other currencies other than Hong Kong dollars. In addition, the equipment and hardware we purchase for the expansion of our Next Generation Network constitutes a large portion of our capital expenditure and is also denominated in U.S. dollars. Finally, payment of interest, principal and any other amounts due under the 8.75% notes issued in January 2005 are made in U.S. dollars. However,foreign exchange risk because our revenues are predominantly denominated in Hong Kong dollars, while a major portion of our operating costs are denominated in U.S. dollars, Renminbi or other foreign currencies. Our foreign currency-denominated expenses primarily consist of the following:
| • | | A major portion of our operating costs of interconnection charges payable to overseas carriers for the delivery of our international calls. Substantially all of these interconnection charges are denominated in U.S. dollars or other foreign currencies. |
|
| • | | The equipment and hardware we purchase for the expansion of our Next Generation Network constitutes a large portion of our capital expenditures and is also denominated in U.S. dollars. |
|
| • | | Payment of interest, principal and any other amounts due under the 10-year senior notes due 2015 are made in U.S. dollars. |
|
| • | | Expenses incurred for the operation of our call center located in Guangzhou, China are denominated exclusively in Renminbi, the official currency of the People’s Republic of China. These include salaries paid to our personnel as well as various operating expenses that we incur to maintain our operations. |
Since October 17, 1983, the Hong Kong dollar has been linked to the U.S. dollar at the rate of HK$7.80 per US$1.00. We,
however, cannot assure you the link will be
maintained.In addition, the expenses that we incurmaintained in relation to our call center located in Guangzhou, China are denominated exclusively in Renminbi, the official currencyfuture. Any depreciation of the People’s Republic of China. These include the salaries that we pay to our personnel as well as various operating expenses that we incur to maintain our operations. As a result, we are exposed to a certain amount of foreign exchange risk based on fluctuations between the Hong Kong dollar against the U.S. dollar, Renminbi or other currencies would increase our operating costs, including our debt servicing costs, make our capital expenditure plans more expensive, and the Renminbi.adversely affect our profitability.
The Renminbi is presently pegged to a basket of currencies, and there remains significant international pressure on the PRC government to further liberalize its currency policy. This could result in a further and more significant appreciation in the value of the Renminbi against the Hong Kong dollar, which would increase the cost of operating our call center.
Any depreciation of the Hong Kong dollar against the U.S. dollar, Renminbi or other currencies, would increase our operating costs, including our debt servicing costs, make our capital expenditure plans more expensive, and adversely affect our profitability.
Risks Relating to our Securities
We cannot assure you that we will be able to generate sufficient cash from operations to fund our operations.Our ability to fund operating and capital expenditures and to service debt will depend significantly on our ability to generate cash from operations. In fiscal 2007, we were able to generate cash from operations of HK$384.0 million. However, we cannot assure you that we will be able to sustain our operations in order to generate sufficient cash flows to meet our future debt service requirements.
Our ability to generate cash from operations is subject to general economic, financial, industry, legal and other factors and conditions, many of which are outside our control. In particular, our operations are subject to price and demand volatility in the telecommunications industry. If we cannot finance our operations and capital expenditure using cash generated from operations, we may be required to (among other things) incur additional debt, reduce capital expenditures, sell assets, or raise equity. We may not be successful in taking these actions. Further, our ability to take many of these steps may be subject to approval by future creditors in addition to holders of the 8.75% notes issued in January 2005.
The 8.75% notes that we issued in January 2005 contain covenants that limit our financial and operating flexibility.
Covenants under the 8.75% notes that we issued in January 2005 restrict our ability to, among other things:
pay dividends, make distributions, redeem capital stock and make certain other restricted payments or investments;
incur additional indebtedness or issue certain equity interests;
merge, consolidate or sell all or substantially all of our assets;
issue or sell capital stock of some of our subsidiaries;
sell or exchange assets or enter into new businesses;
create any restrictionsItem 4 Information on the payment of dividends, the making of distributions, the making of loans and the transfer of assets;
Companyenter into sale and lease back transactions; and
enter into certain transactions with affiliates or related persons.
All of these limitations are subject to exceptions and qualifications specified in the indenture governing the 8.75% notes. These restrictive covenants could limit our ability to pursue our growth plan, restrict our flexibility in planning for, or reacting to, changes in our business and industry and increase our vulnerability to general adverse economic and industry conditions.
ITEM 4. INFORMATION ON THE COMPANY
A. History and Developmentdevelopment of the Company
The legal and commercial name of the Company is City Telecom (H.K.) Limited.
The Company was incorporated in Hong Kong.
The Company was incorporated on May 19, 1992 under the Hong Kong Companies Ordinance (Chapter 32 of the laws of Hong Kong) (the “Companies Ordinance”).and is a limited liability company. Our registered office is located at Level 39, Tower 1, Metroplaza, No. 223 Hing Fong Road, Kwai Chung, New Territories, Hong Kong, telephone (852) 3145-6888. Our agent for U.S. federal securities laws purposes is CT Corporation System, 111 Eighth Avenue, New York, NY 10011.
Important events in the development of our business are as follows:
We began offering international telecommunications services in September 1992. From that date,In our early stage of development, we focused on increasing our subscription base and amount of international traffic, and on building the CTI brand name as a low cost provider of international telecommunications services. In addition to our operations in Hong Kong, we also provide international telecommunications and Internet access services in Canada through two telecommunications companies in Canada, City Telecom Inc. and City Telecom (B.C.) Inc. We acquired our interests in these companies in December 1998 as part of our efforts to increase our market share of the telecommunications traffic between Canada and Hong Kong.
In January 1999, we became the first
company in Hong Kong
company to obtain
a public non-exclusive telecommunications servicesthe first PNETS License. The license
which we refergives us the right to
in this annual report as a PNETS License, covering the provision ofoffer international telecommunications services using international simple resale
whichand has had a significant positive impact on our international telecommunications revenues. We incorporated
Hong Kong Broadband Network Limited (“HKBN”)HKBN in Hong Kong in August 1999 and launched our broadband Internet access services in March 2000. In addition, we began providing local
VOIPVoIP services in April 2002, IP-TV services in August 2003, and corporate data services in July 2004 using our Next Generation Network.
The network has the capability of providing value-added broadband services and content that combine voice, data and images with increased efficiency and flexibility.
We believe that one of the cornerstones of our success has been our ability to quickly expand our service offerings when changes in regulation or technology have provided us with an opportunity to do so. Some of the key events in our history and development
include:include the following:In January 2008, HKBN launched “Dual Mode High Definition Terrestrial TV Receiver and IPTV Set-Top Box” to all customers in Hong Kong.
| • | | In October 2006, our Liu Xiang “Be Ahead of Yourself” marketing campaign won the “Certificate of Excellence” of HKMA/TVB Awards for Marketing Excellence 2006. |
|
| • | | In February 2007, we launched our “bb50 and bb200” symmetric residential broadband service supported by “SDU” personalized customer care service. |
|
| • | | In June 2007, we were awarded “Best Retention Strategies” at the Hong Kong HR Awards 2007. |
|
| • | | In July 2007, we were awarded “Integrated Support Team” of the year at the Asia Pacific Customer Service Consortium Customer Relationship Excellence Awards. |
|
| • | | In September 2007, we launched “Fiber-To-The-Home” residential broadband service, “FiberHome100”, “FiberHome200” and “FiberHome1000”. As the same time, we upgraded our entry level service broadband Internet access from 10 Mbps to 25 Mbps. |
|
| • | | In January 2008, we began to offer our “Dual Mode High Definition Terrestrial TV Receiver and IPTV Set-Top Box” to all of our customers in Hong Kong. |
|
| • | | In February 2008, we were awarded contract for the provision of payphone service at the Hong Kong International Airport. |
In September 2007, HKBN launched “Fiber-To-The-Home” residential broadband service, “FiberHome100”, “FiberHome200” and “FiberHome1000”. As the same time, we upgraded our entry level service broadband Internet access from 10 Mbps to 25 Mbps.
In July 2007, HKBN was awarded “Integrated Support Team” of the year at the Asia Pacific Customer Service Consortium Customer Relationship Excellence Awards
In June 2007, CTI Group was awarded “Best Retention Strategies” at the Hong Kong HR Awards 2007
In February 2007, HKBN launched bb50 and bb200 symmetric residential broadband service supported by “SDU” personalized customer care service.
In October 2006, Liu Xiang “Be Ahead of Yourself” marketing campaign won the “Certificate of Excellence” of HKMA/TVB Awards for Marketing Excellence 2006.
In July 2006, HKBN was conferred “Call Center of the Year” & “Customer Service Center of the Year” awards at the Customer Relationship Excellence Awards 2005.
In March 2006, HKBN launched our “bb25” Internet access service with symmetric 25 Mbps access for the residential mass market. This supplemented our existing bb10, bb100 and bb1000 service offerings.13
In November 2005, we announced cooperation with China Telecom Hong Kong Limited to provide Pan-China Internet Protocol Virtual Private Network services to corporate customers.
In October 2005, HKBN became the first service provider in the world to achieve the Cisco Powered Network Metro Ethernet QoS Certified status.
| • | | In September 2008, we launched the National Geographic Channel’s first ever Interactive Channel. |
|
| • | | In June 2009, we launched the first Online Broadband Service Registration Platform in Hong Kong. |
|
| • | | In July 2009, we were awarded the 2009 Hong Kong Management Association Quality Award — Bronze. |
|
| • | | In November 2009, we accepted the Innovation in Recruitment award and Champion of HR award at the Hong Kong HRM Awards 2009. |
In October 2005, HKBN launched our “2b” Broadband Phone Service, providing VOIP services to local and overseas users via a software-based broadband phone.
In September 2005, HKBN was conferred as the winner of the Global Entrepolis@Singapore Award 2005, which was presented by the Asian Wall Street Journal in association the Economic Development Board of Singapore. This award recognizes innovation in the application of technology to a strong business model with commercial potential to be an industry or market leader.
B. Business Overviewoverview
We are a
Hong Kong-based provider of residential and corporate fixed telecommunications network and international telecommunications
servicesservices. We specialize in
Hong Kong. Using our self-owned Next Generation Network, we deliver fixed telecommunications network services to the residential mass market and small-to-medium corporate and enterprise market
segments, at competitive prices while simultaneously offering a larger bandwidth over comparable offerings by our competitors. Our integrated suite of services includes the following:high-speed broadband Internet access services that provide our customers with symmetric upstream and downstream access speeds with options for 25 Mbps, 50 Mbps, 100 Mbps, 200 Mbps and 1,000 Mbps;
fixed line local telephony through our voice-over-Internet-Protocol technology;
pay television, where we deliver more than 83 channels including self-produced news, children’s programming, international drama and movies and local interest programming using our IP platform; and
corporate data services, which includes provision of dedicated bandwidth to corporate customers.
As of August 31, 2007, we had a total of approximately 683,000 fixed telecommunications network services subscriptions, consisting of 247,000 broadband Internet access, 308,000 local VOIP and 128,000 IP-TV services subscriptions.
In addition to providing fixed telecommunications network services, we also offer international telecommunications services in Hong Kong and Canada. We offer a variety of international telecommunications services and products including direct dial services, international calling cards and mobile call forwarding services. Our total international telecommunications services customer database comprises approximately 2.3 million registered accounts. Our international telecommunications business contributed 28.4% to our total revenues in fiscal 2007 as compared to 36.9% in fiscal 2006.
Recent Developments
On February 9, 2007, we signed a Memorandum of Understanding with MobileOne Limited to work together to participate in Singapore’s Next Generation National Broadband Network project (“NGN”).segments. The Project relates to the provision of ultra-high speed national connectivity in Singapore at competitive prices by 2015.
Since then we have submitted our indication of interest in response to an invitation by the IDA to participate in the Pre-Qualification Exercise and Competitve Dialogue for the NGN project.
On December 11, 2007, the IDA released the terms of Request-For-Proposal (“RFP”) for the Network Company. Under this RFP, a company will be selected to design, build and operate the passive infrastructure layer of the project. The deployment of active electronics will be done by an operating company which will also be the entity that offers wholesale broadband access to downstream retail service providers.
Under the terms of the RFP, the Singapore Government is prepared to provide a grant of up to Singapore dollar 750 million for the project and will evaluate proposals based on four key criteria:
| 1. | Attractiveness of business plan to industry |
| 2. | Quality of network infrastructure |
| 3. | Level of Government grant |
| 4. | Financial proposition and strength of bidder |
It is expect that the IDA will award the winning bid in the third quarter of 2008.
We are now exploring the viability of this project and are in the process of assessing if we will submit the bid. For uncertainties relating to our participation in this project, see “Risks Relating to Our Business and Operations – “Although we have expressed our interest in Singapore’s Next Generation National Broadband Network project, we cannot assure you that we will be capable of participating in the project, and, if we will, that the project will be successful.””
Revenues
A significant majority of our revenues are derived from business conducted in Hong Kong.
We derive our revenues from two business segments: FTNS and IDD. A breakdown of
our revenues
by category of activity is as follows:
| | | | | | |
| | | Year ended August 31, |
Revenue | | 2005 | | 2006 | | 2007 |
| | | HK$ | | HK$ | | HK$ |
| | | (Amounts in thousands) |
Fixed telecommunications network services(1) | | 629,464 | | 716,600 | | 816,800 |
International telecommunications services | | 532,595 | | 418,276 | | 324,470 |
| | | | | | |
Total operating revenue | | 1,162,059 | | 1,134,876 | | 1,141,270 |
| | | | | | |
| | | | | | | | | |
| | | For the year ended August 31, | |
| | | 2008 | | | 2009 | |
| | | HK$ | | | HK$ | |
| | | (Amounts in thousands) | |
Revenue | | | | | | | | |
| FTNS business | | | 1,011,038 | | | | 1,230,880 | |
| IDD business | | | 291,943 | | | | 247,359 | |
| | | | | | | |
| Total operating revenue | | | 1,302,981 | | | | 1,478,239 | |
| | | | | | | |
FTNS business.Our FTNS business involves the provision of fixed telecommunications network services through our self-owned Next Generation Network. Such services include the following:
(1)
| Includes-
| | high-speed broadband Internet access services at symmetric upstream and downstream access speeds of 25 Mbps to 1,000 Mbps; |
|
| - | | fixed line local telephony services pay-TVusing VoIP technology; |
|
| - | | pay television services consisting of more than 80 channels, including self-produced news, children’s programming, international drama, movies and documentary and local interest programming, using our IP platform; and |
|
| - | | corporate data services.services, including the provision of dedicated bandwidth to corporate customers. |
We
As of August 31, 2009, we had a total of approximately 943,000 subscriptions for our fixed telecommunications network services, consisting of 391,000 broadband Internet access, 382,000 local VoIP and 170,000 IP-TV services subscriptions.
IDD business.Our IDD business involves the provision of international telecommunications services. Such services include direct dial services, international calling cards and mobile call forwarding services in Hong Kong and Canada. As of August 31, 2009, the customer base for our total international telecommunications services consisted of approximately 2.4 million registered accounts.
Strategy and Competitive Strengths
Our strategy is to market multiple fixed telecommunications network services by capitalizing on the new in-building blockwiring we have done on a mass scale for our Next Generation Network and will
continuefocus on growing our
business strategy to grow market share,
increaseincreasing our network coverage and
introduceintroducing new services through our IP platform. We believe that our success will continue to depend on our ability to capitalize on our focus on the residential mass and
small to mediumsmall-to-medium corporate and enterprise market segments, our leading-edge Next Generation Network, and our first mover advantage in
an industry withthe fixed line telecommunications market, which have a high
barriers to entry.Seasonality
Our operations are not generally subject to significant seasonal fluctuations. Our international telecommunications business typically experience a slight decrease in revenue during the second fiscal quarter of each year (December through February) in connection with the Christmas holiday and Chinese New Year holiday. We do not believe that seasonality has had a material effect on our business, financial condition or results of operations.
Network infrastructure
Our self-owned network is one of the world’s largest Next Generation Networks and is cited as a global reference case by our two primary vendors, Cisco Systems, Inc. and Nortel Networks Limited. Our Next Generation Network conforms to the industry standards for 10/100/1000 Mbps Internet access speeds, and covers 1.4 million home passes, which represents coverage of approximately 60% of Hong Kong’s population. The coverage of our network is concentrated in Hong Kong’s most densely populated areas.
In most other markets, Metro Ethernet technology is primarily used in commercial buildings in metropolitan areas, as the technology is most cost effective in dense user populations where a provider can service a large number of users in a single building or cluster of buildings. We have deployed Metro Ethernet technology in densely populated residential areas in Hong Kong, where most of our customers live in high-rise apartment buildings with multiple apartments on each floor. Our strategy is to sell multiple fixed telecommunications network services using our Next Generation Network. All of our fixed telecommunications network services are offered through our single IP platform, unlike our competitors who use multiple platforms to provide comparable services. In addition, unlike most other new entrants, we operate an “end-to-end” network that extends from our IP network hub sites and our switching centers in Hong Kong to our subscribers’ premises.
In November 2007, we have collaborated with one of the largest network solution providers for the deployment of the GPON in Hong Kong to deliver advanced triple play services to our subscribers and enlarge our FTTH network coverage in Hong Kong.
Our Competitive Strengths
entry barrier.
We believe that our demonstrated success is primarily due to our ability to capitalize on the following key strengths:
| • | | Focus on the Residential Mass and Small-To-Medium Corporate and Enterprise Market Segments.We focus on offering high-bandwidth services to the residential mass and small-to-medium enterprise markets in Hong Kong, which we believe have significant growth potential. We price our services attractively on a value-for-bandwidth basis and at the same time offer bandwidth advantages over comparable service offerings by our competitors. Our IP-TV services focus on the residential mass market by providing Chinese-language content that targets the Chinese-speaking population of Hong Kong. We have also strengthened our English language contents over the past year to increase our competitiveness by adding National Geographic, AXN, Bloomberg and other channels. Our focus on the residential mass and small-to-medium corporate and enterprise markets has enabled us to quickly grow our subscription base, and we believe this will help us to up-sell our services. |
|
| • | | Leading-Edge Next Generation Network.We believe our self-owned Next Generation Network, a fiber-based backbone, gives us an inherent cost and performance advantage over our competitors. The high capacity of this network has enabled us to offer a suite of services on a single IP network platform. This IP platform is highly scalable, enabling us |
14
Focus on the Residential Mass and Small-To-Medium Corporate and Enterprise Market Segments. We focus on offering high-bandwidth services to the residential mass and small-to-medium enterprise markets, which we believe have significant growth potential. We price our services attractively and at the same time offer bandwidth advantages over comparable service offerings by our competitors. Our IP-TV services focus on the residential mass market by providing Chinese-language content that targets the Chinese-speaking population of Hong Kong, which we believe to be largely under served. Our focus on the residential mass and small-to-medium corporate and enterprise markets has enabled us to quickly grow our subscription base and we believe this will help us to up-sell our services.
| | | to offer broadband Internet access, local VoIP, IP-TV and corporate data services over a single network. It is also capable of providing up to 1,000 Mbps symmetric broadband Internet access. Whereas our competitors are on a linear improvement path, we can upgrade our fiber based services logarithmically from 100Mbps to 1,000Mbps on our existing passive fiber infrastructure which existing technology cannot accomplish using legacy telephone lines. |
Leading-Edge Next Generation Network. Our network deploys Ethernet technology provided by Cisco Systems, Inc. We believe our Next Generation Network gives us an inherent cost and performance advantage over our competitors. Our IP platform is highly scalable, enabling us to offer broadband Internet access, local VOIP, IP-TV and corporate data services over a single network while still leaving us with capacity to offer more services in the future. It is also capable of providing up to 1,000 Mbps symmetric broadband Internet access. During fiscal 2007, we launched our “Fiber-To-The-Home” (“FTTH”) residential broadband service providing 100 Mbps, 200Mbps and 1000 Mbps service. Our promotions during fiscal 2006 and 2007 highlighted the bandwidth advantage of our Next Generation Network over xDSL or cable modem services. Ethernet technology is “off-the-shelf” and has long been deployed for large enterprises, but we believe we are one of the first to deploy this technology for the residential market on a mass scale.
First Mover Advantage and High Barriers to Entry. Our first mover advantage andDespite the intense competition in the Hong Kong telecommunications industry, the inherent characteristics of the Hong Kongfixed line telecommunications infrastructure, which presentmarket create a natural barrier tohigh entry make it difficult forbarrier. Accordingly, we believe that our competitorsNext Generation Network’s current coverage of 1.6 million residential homes pass, substantially all in densely populated areas, gives us a first mover advantage over our competitors. Competitors who want to replicate our business model. Metro Ethernet technology is not appropriate for our competitors who intendmodel to offerprovide a full coverage network that includes remote and difficult to reachdifficult-to-reach areas of Hong Kong.Kong may encounter technological difficulties. Attempting to deploy Metro Ethernet technology in such locations would significantly increase costs and completion time of such a network. While other telecommunications operators may lay their own fiber-to-the-building, we believe theysome would encounter significant in-building bottlenecks when attempting to complete an end-to-end network. This is because thea majority of Hong Kong’s residential properties have limited space for in-building wiring leading to subscribers’ residences, making it difficult for new entrants to replicate our end-to-end network build.
Recent Development
Update on Fixed Telecommunications NetworkMobile Interconnection Charge
On November 25, 2009, the TA issued a Preliminary Analysis (the “2009 PA”) in relation to the 2008 Determination (see note 2(c) to our consolidated financial statements) for mobile interconnection charges. TA invited HKBN and the mobile operators covered by the 2008 Determination to make representations in relation to the 2009 PA on or before December 25, 2009. As of December 15, 2009, the final level of mobile interconnection charges for the period from April 1, 2002 to April 26, 2009 was still subject to representations that could be made by HKBN and the mobile operators, and accordingly, the related financial effect of the 2008 Determination to the consolidated financial statements cannot be reasonably estimated.
Buyback of 10-year Senior Notes
Between September 1, 2009 and December 15, 2009, the Group repurchased the 10-year senior notes with a cumulative principal value of US$1.5 million (equivalent to HK$11.6 million) in the open market. The total consideration paid including accrued interest was approximately US$1.6 million (equivalent to HK$12.1 million). The loss on extinguishment was approximately US$41,000 (equivalent to HK$318,000) which is expected to be recorded in the consolidated income statement for the year ending August 31, 2010. The principal value of the 10-year senior notes remaining in issue after the repurchases is US$19,863,000 (equivalent to HK$153,948,000).
Fixed telecommunications network services
We offer our fixed telecommunications network services through our Next Generation
Network InfrastructureOur Next Generation Network is formed by using our own fiber-based backbone, wireless technology or leased wireline-based backbone to connect our in-building Ethernet infrastructures to our IP hub sites and switching centers in Hong Kong. Our Ethernet infrastructure is a system of Category-5e copper wiring that connects our subscribers’ premises to our local area network, or LAN, switches within a residential or commercial building.
Network. The high capacity of our fiber-based backbone has enabled us to offer a suite of services on a single IP network platform. These services include our broadband Internet access, local VOIP,VoIP, IP-TV and corporate data services. We incurred capital expenditures forOur strategy is to leverage our broadband subscription base to up-sell our other fixed telecommunications network services such as local VoIP and IP-TV.
The table below shows the profile the subscriptions of our fixed telecommunications network infrastructure of approximately HK$309.1 million in fiscal 2006 and HK$132.3 million in fiscal 2007. In fiscal 2008 to fiscal 2010, we plan to further incur total capital expenditures of HK$850.0 million to continue increasingservices over the capacitypast three years:
| | | | | | | | | | | | | |
| | | As of August 31, | |
| | | 2007 | | | 2008 | | | 2009 | |
| Broadband Internet access | | | 247,000 | | | | 316,000 | | | | 391,000 | |
| Local VoIP | | | 308,000 | | | | 329,000 | | | | 382,000 | |
| IP-TV | | | 128,000 | | | | 156,000 | | | | 170,000 | |
| | | | | | | | | | |
| | |
| Total FTNS subscriptions | | | 683,000 | | | | 801,000 | | | | 943,000 | |
| | | | | | | | | | |
Broadband Internet Access
| • | | Scope of service.Our broadband Internet access services in Hong Kong are offered through HKBN. We currently offer our residential and corporate customers broadband Internet access speeds of up to 1,000 Mbps, but the majority of our customers currently have access speeds between 25 Mbps and 100 Mbps. We also offer Fiber-to-the-Home, or FTTH, broadband service for 100 Mbps, 200 Mbps and 1,000 Mbps. Rather than using Category-5e copper wiring for the last mile, optical fiber is used in FTTH broadband service. Currently, all of our broadband Internet access packages include free e-mail and for additional charges, offer customers for a variety of value added services, such as “bbDrive,” an on-line virtual hard drive with up to 10Gb of storage; “bbGuard,” an anti-spam and anti-virus package; and “bbWatch,” a full-screen IP-TV service that is viewed with a desktop or laptop computer; “bbWi-Fi”, a service in which subscribers can have wireless Internet access through more than 2,000 hotspots; and “getFAXEASY”, a service in which subscribers can simply receive fax by their email address in Hong Kong and worldwide. A unique fax number is assigned to each subscriber. We frequently alter our promotions in response to changing market conditions or as a way of attracting additional subscribers. |
15
| • | | Pricing.We currently offer broadband service for bb25, bb50, bb100, FiberHome200 and FiberHome1000 at monthly fees ranging from HK$99 to HK$1,688 for unlimited service access. On November 1, 2009, we launched our “Member-Get-Member” series of marketing programs. Under this series, our existing customers may refer a new customer to use our broadband Internet Access services and both will enjoy access to our bb100 services for HK$99 per month. Our strategy is to reduce the market price to a more affordable level such that customers can focus on quality. When our broadband service becomes more affordable, we believe that our customers will not change their provider merely for a lower price. |
|
| | | In addition to the residential packages described above, we have also developed broadband promotions that target corporate customers. We offer prepackaged plans that provide access at speeds of up to 1,000 Mbps. Corporate customers that subscribe to prepackaged plans pay fixed monthly subscription fees ranging from HK$128 to HK$24,000. Our prepackaged plans include on-site training, on-site maintenance support, high capacity data transfer and e-mail services. |
|
| • | | Competition.There have been many new entrants to the Internet access business, but our main competitors are PCCW-HKT, i-Cable and HGC. PCCW-HKT has been offering broadband Internet access services since May 1998 and mainly uses asymmetric digital subscriber line technology, or ADSL, over its telephone network to provide asymmetric Internet access at speeds up to 6 Mbps/8 Mbps downstream and 640 Kbps/800 Kbps upstream. In November 2007, PCCW-HKT announced the provision of 100 Mbps and 1,000 Mbps fiber direct broadband Internet access service to two-thirds of Hong Kong’s households. i-Cable began providing broadband Internet access services in March 2000 using its hybrid fiber coaxial network that provides symmetric typical access speeds up to 8 Mbps shared by a cluster of buildings. HGC predominantly uses VDSL technology and typically provides access speeds up to 100 Mbps. |
|
| | | Our main competitors have been in operation longer and may have greater market presence, brand recognition and more financial, technical and personnel resources. In addition, they may have greater network coverage in terms of number of homes pass. |
|
| • | | Market share.We had approximately 391,000 broadband Internet access subscriptions as at August 31, 2009, which represented a market share of approximately 20% with respect to the total number of broadband Internet access subscribers in Hong Kong. |
Local VoIP
| • | | Scope of service.We offer our on-network local VoIP services in Hong Kong by installing IP-based voice switching equipment in locations covered by our Next Generation Network. Voice signals are transmitted through our Ethernet network by the VoIP switches installed in the subscriber’s building. The quality of our local VoIP service is comparable to traditional fixed line local telephony services, and customers are able to use their existing telephone equipment. In addition, with portability of fixed line numbers, fixed line telephony subscribers switching to our local VoIP services are able to retain their existing local telephone number. |
|
| | | We also offer hardware-based off-network local VoIP services, or “Broadband Phone” services, via the broadband network of other operators. In October 2005, we launched our global software-based VoIP services under the brand “2b”. This service is primarily targeted at the overseas Chinese community, which we believe will enable us to access a wider addressable market with higher tariff compared to the Hong Kong market. For HK$98 per month, “2b” provides broadband users around the world with a standard Hong Kong 8-digit fixed line number to make and receive unlimited calls to/from Hong Kong. Moreover, we offer a full range of value added services, including call waiting, voice mail and conference call features. |
|
| • | | Pricing.We currently charge HK$118 per month, on standalone basis, for our local VoIP services depending on the service plan, and we offer a full range of value added services, including call waiting, caller display and conference call services. |
|
| • | | Competition.PCCW-HKT is the incumbent and largest fixed telecommunications network operator in Hong Kong. Based on public information, PCCW-HKT had a market share of approximately 70% with respect to local telephony services as of June 30, 2009. The remainder of the market is shared among ourselves and three other alternative carriers: HGC, New World and Wharf T&T. The principal basis of competition for local telephony is price and brand name recognition. PCCW-HKT has the highest brand name recognition, but we and the other operators are contending by offering competitively priced local telephony services that provide comparable quality to PCCW-HKT. |
|
| • | | Market share.As of August 31, 2009, we had 382,000 local VoIP subscriptions. Our market share with respect to local residential telephony services was approximately 20% as of August 31, 2009. |
IP-TV
| • | | Scope of service.Our IP-TV services began in August 2003 and include the provision of standard definition and high definition video via our Next Generation Network to an IP set-top-box connected to the subscriber’s television set. In May 2007, we renamed our IP-TV services as “bbTV”. “bbTV” currently consists of 80 channels, including a self-produced 24-hour news channel and education and recreation channels (including children’s programming) and channels whose content is obtained from other content-providers. Since the launch of our IP-TV services in August 2003, we have progressively adjusted our content offerings and valued added components of the services. We consider our IP-TV to be an incremental component of our broadband and VoIP service offerings, rather than a large standalone business. |
|
| • | | Pricing.We currently charge HK$168 per month for this subscription-based pay television service. Because of the scalability of our Next Generation Network infrastructure, the current cost of adding IP-TV services to an existing broadband Internet access or local VoIP subscriber is small. |
16
| • | | Competition.Our two main competitors in the pay-television business are i-Cable and PCCW-HKT. The pay-television services of i-Cable and PCCW-HKT include a significant amount of exclusive contents, such as English Premier League Football until June 2010, HBO, Cinemax, ESPN and others. We target a different market than these competitors by offering predominantly Chinese language contents and attractive pricing, both of which we consider critical for successful penetration in the residential mass market. We have also strengthened our English language contents over the past year to increase our competitiveness by adding National Geographic, AXN, Bloomberg and other channels. |
|
| | | TVB and ATV are indirect competitors of our pay-TV services. TVB and ATV account for a substantial proportion of Hong Kong’s television viewership and we market our services as supplemental to theirs. Because TVB and ATV offer primarily subscription-free television services supported by advertising revenues, we expect that their programming is designed to attract the widest possible audience. In contrast, we and the other pay-TV operators rely on monthly subscription fees for most of our revenues. Other competitors include satellite TV operators, such as Star TV, as well as potential competition from direct-to-home broadcasters and broadcasters using digital terrestrial delivery methods. |
|
| • | | Market share. As of August 31, 2009, we had 170,000 subscriptions representing approximately 7% of the total pay-television subscription base in Hong Kong |
International telecommunications services
| • | | Scope of services.We began providing international telecommunications services in 1992 and were among the first companies to be granted a PNETS License. Our international telecommunications services are offered to our FTNS business customers via our Next Generation Network and to other carriers’ customers via indirect access. Indirect access allows any pre-registered telecom user in Hong Kong to access our services via our two primary access codes “1666” and “0030”. By dialing our access code, our registered customers can access any destination in the world through our network, by paying us a usage charge. |
|
| | | We have greatly expanded our range of services over the years to include a variety of international direct dial services at competitive rates. We believe that our ability to deliver a range of calling plans with varying features that cater to different customer needs has been one of the key factors of our success. We market our international telecommunications services under the IDD 1666 and IDD 0030 brand names. These two brands provide us with flexibility in our marketing strategies. The primary international telecommunications services that we currently offer our customers are the following: |
| | | |
| Service | | Description |
| IDD 1666 | | Provides subscribers with international direct dial using the access code 1666 in Hong Kong. |
| | | |
| IDD 0030 | | Provides subscribers with international direct dial using the access code 0030 in Hong Kong. |
| | | |
| Mobile call forwarding services | | Allows call forwarding of Hong Kong mobile numbers to any overseas telephone number so that subscribers can receive calls while in overseas. |
| • | | Pricing.We charge our IDD 1666 and IDD 0030 users a per minute tariff rate that varies according to the destination of the call and the calling prefix, with discounts depending on the time of day or day of the week when the call is placed as well as monthly plans. To maintain our market share in a market segment with increasingly intense competition, we have significantly reduced some of our international telecommunications rates and introduce new marketing and promotional offers from time to time. To offset the effects of these price reductions, we have taken steps to reduce our cost base, such as using our relatively large traffic volume to negotiate lower prices from our international partners, establishing a call center in Guangzhou to provide customer service and back office support services, and developing our own international telecommunications infrastructure. Our employment of two separate brand names, IDD 1666 and IDD 0030, also provide us with flexibility in our marketing strategies. |
|
| • | | Competition.PCCW-HKT, HGC, New World, and Wharf T&T are our main competitors in the international telecommunications business. As in previous years, we experienced fierce price competition in Hong Kong during fiscal 2009. This competition drove down the average tariff rates per minute and we expect this price competition to continue in fiscal 2010. |
|
| | | Further, technology substitution from global VoIP providers such as Skype, which offers free PC-to-PC based international calls, is becoming more prevalent. |
|
| • | | Market share.We experienced a reduction in total traffic volume of 12.9% to 574 million minutes in fiscal 2008 and a further reduction of 15.2% to 487 million minutes in fiscal 2009. The continuing reduction in traffic volume was mainly due to intense competition as some of our integrated competitors offered free or very low cost international direct dial minutes as a customer incentive to gain local fixed line and mobile market share. |
Our network infrastructure
Fixed telecommunications network
Our fixed telecommunications network services are delivered over our existing network coverage and extending the reach of ourself-owned Next Generation Network.Network, which allows us to deliver multiple services, including the triple play service of voice, broadband and IP-TV. The service areacoverage of our Next Generation Network is concentrated in Hong Kong’s most densely populated areas, characterized by high-rise apartment buildings with multiple apartments on each floor. The network currently includescovers approximately 1.41.6 million home passes,residential homes pass, representing
17
approximately
60%70% of Hong Kong’s
population.population and also 1,230 commercial buildings. We plan to extend
the coverage of our Next Generation Network
coverage, over the next three years, to 2.0 million
home passes, coveringresidential homes pass, representing approximately 90% of Hong Kong’s
population.population, and to 1,800 commercial buildings by the end of 2011. As we expand the reach and coverage of our Next Generation Network, we plan to continue introducing new services.
Our Next Generation Network is deployed using Metro Ethernet technology. Metro Ethernet technology is highly cost-effective when access is to be provided to a large number of users in a single building or cluster of buildings and is typically used in commercial buildings in metropolitan areas in other geographical markets. Our Ethernet infrastructure is a system of Category-5e copper wiring that connects our subscribers’ premises to our local area network, or LAN, switches within a residential or commercial building. By keeping our Category-5e copper distance to less than 100 meters we are able to deliver bandwidth of up to 1,000Mbps to our subscribers.
The first step in expanding the reach of our fixed telecommunications network infrastructure is to select buildings that we believe will provide sufficient economic returns to justify our investment based on several factors, including population density, proximity of the building to our existing fiber loop and our projected ability to sell services. We then perform a site visit to analyze the feasibility of installing our Ethernet technology. Once we are satisfied with the prospects of a particular building, we must obtain access rights from the building’s management, which may take several weeks or months. After receiving the required access rights, we employ a combination of our full-time staff and contractors to begin installation of our in-building Ethernet. The length of time required for the installation process depends on the size and structural features of the building and can be completed in as little as three weeks or take several months. As we install our in-building Ethernet infrastructure we simultaneously connect the building to our fiber-based backbone.
Unlike many of our competitors, which use multiple platforms to provide comparable services, all of our fixed telecommunications network services are offered through a single IP platform. In addition, unlike many new entrants to the industry, we operate an “end-to-end” network that extends from our IP network hub sites and our switching centers in Hong Kong to our subscribers’ premises. All the buildings
that we reach through our expansion efforts will becovered by us are served by our self-owned infrastructure.
The following table shows the profile of our fixed telecommunications network subscriptions over the past three years:
| | | | | | |
| | | As of August 31, |
| | | 2005 | | 2006 | | 2007 |
Fixed Telecommunications Network Services Subscriptions: | | | | | | |
Broadband Internet Access | | 229,000 | | 220,000 | | 247,000 |
Local VOIP | | 293,000 | | 281,000 | | 308,000 |
IP-TV | | 109,000 | | 116,000 | | 128,000 |
| | | | | | |
Total | | 631,000 | | 617,000 | | 683,000 |
| | | | | | |
Internet Access
HKBN offers our broadband Internet access services in Hong Kong over our Next Generation Network. We use our broadband subscription base to up-sell our other fixed telecommunications network services such as local VOIP and IP-TV. In addition to broadband Internet access services, we maintain on a limited scale for the 56k dial-up Internet access and corporate Internet access via resale of another carrier’s service. However, we are focusing exclusively on growing our subscription base for our high bandwidth broadband Internet access services and are making no further investments in dial-up or resale services.
We currently offer broadband Internet access to our residential and corporate customers at access speeds of up to 1,000 Mbps, but the majority of our customers currently have access speeds of between 25 Mbps and 100 Mbps. We currently offer broadband service for bb25, bb50, bb100, bb200 and bb1000 at monthly fees ranging from HK$208 to HK$1,688 for unlimited service. Moreover, we also offer FTTH broadband service for 100 Mbps, 200 Mbps and 1000 Mbps at monthly fees ranging from HK$378 to HK$1,688 for unlimited service. Currently, all of our broadband Internet access packages offer a free e-mail service and a variety of value added services, such as “bbDrive,” an on-line virtual hard drive with up to 10Gb of storage, “bbGuard,” an anti-spam and anti-virus package, and “bbWatch,” a full-screen IP-TV service that is viewed on a personal computer. We frequently change our promotions in response to market conditions or as a way of attracting additional subscribers.
In addition to the residential packages described above, we have also developed broadband promotions that target corporate customers. We offer prepackaged plans that provide access at speeds up to 1,000 Mbps, which include on-site training, on-site maintenance support, high capacity data transfer and e-mail services. Corporate customers that subscribe to prepackaged plans pay fixed monthly subscription fees that range from HK$150 to HK$17,000.
Competition
There have been many new entrants to the Internet access business, but our main competitors are PCCW-HKT (through its current subsidiary PCCW-IMS Limited), i-Cable and HGC. PCCW-HKT has been offering broadband Internet access services since May 1998 and uses asymmetric digital subscriber line technology, or ADSL, over its telephone network to provide asymmetric Internet access typically at speeds up to 6 Mbps downstream and 640 Kbps upstream.
In November 2007,
PCCW-HKT announced the provision of 100 Mbps and 1000 Mbps fiber direct broadband Internet access service to two-thirds of Hong Kong’s households. i-Cable began providing broadband Internet access services in March 2000 using its hybrid fiber coaxial network that provides symmetric typical access speeds up to 8 Mbps shared by a cluster of buildings. HGC predominantly uses VDSL technology and typically provides symmetric access speeds up to 10 Mbps.Our main competitorswe have been in operation longer and may have greater market presence, brand recognition and more financial, technical and personnel resources. In addition, they may have greatercollaborating with one of the largest network coverage in terms of homes passed.
We had approximately 247,000 broadband Internet access subscriptions as of August 31, 2007, which represented a market share of approximately 13% with respect tosolution providers for the total number of broadband Internet access subscribers in Hong Kong.
Local VOIP
We offer our on-network local VOIP services in Hong Kong. To provide local telephony service, we install IP-based voice switching equipment in locations already covered by our Next Generation Network. Voice signals are transmitted by the VOIP switches into the Ethernet network installed in the subscriber’s building. The capital cost of installing VOIP switches is small
because the scalabilitydeployment of our Next Generation Network allows ususing GPON technology. As the reach of GPON is considerably more than 100 meters, it can be a more cost effective solution to provide new services over existing infrastructureexpand our Next Generation Network than our Ethernet setup for lower density deployments.
We incurred capital expenditures of approximately HK$211.7 million in fiscal 2008 and HK$286.7 million in fiscal 2009, substantially all of which were made in connection with
only minimal additional equipment. In addition, we now install such voice switching equipment together with our new installations of broadband equipment in some buildings.The qualitythe construction and upgrade of our local VOIP service is indistinguishable from traditional fixed line local telephony services and customers are able to use their existing telephone equipment. In addition, fixed line telephony subscribers switching to our local VOIP services are able to retain their existing local telephone number via fixed line number portability.
We currently charge from HK$58 to HK$99 per monthinfrastructure for our local VOIP services depending on the service plan, and we offer a full rangeprovision of value added services, including call waiting, caller display and conference call services.
We also offer hardware-based off-network local VOIP services, which we refer to as “bb Phone” services. “bb Phone” allows subscribers to use our local VOIP services via the broadband network of other operators. In October 2005, we launched our global software-based VOIP services branded as “2b”, which provides a global Hong Kong-telephone number service. This service is primarily targeted at the overseas Chinese community, which we believe will enable us to access a wider addressable market compared to the Hong Kong market for international telecommunications services. For HK$168 per month, “2b” provides broadband users around the world with a standard Hong Kong 8-digit fixed line number to make and receive unlimited calls within Hong Kong and to other “2b” users around the world. Moreover, we offer a full range of value added services, including call waiting, voice mail and conference call features.
Competition
PCCW-HKT, the incumbent and largest fixed telecommunications network operator in Hong Kong, announced that it had a market shareservices. In fiscal 2010 and fiscal 2011, we plan to further incur total capital expenditures about HK$300 million to HK$350 million per year to continue increasing the capacity of approximately 67% with respect to local telephony services asour existing network coverage and extending the coverage of June 30, 2007. As the incumbent operator, PCCW-HKT is required to allow interconnection to its fixed telecommunications network to other licensed fixed telecommunications network operators. The remainder of the market is shared among ourselves and three other alternative carriers: HGC, New World and Wharf T&T. The principal basis of competition for local telephony is price and brand name recognition. PCCW-HKT has the highest brand name recognition, but we and the other operators are contending by offering competitively priced local telephony services that provide comparable quality to PCCW-HKT. As of August 31, 2007, we had 308,000 local VOIP subscriptions. Our market share with respect to local residential telephony services amounts to approximately 14% as of August 31, 2007.
IP-TV
In August 2003 we introduced our IP-TV service that provides DVD quality video delivered via our Next Generation Network to an IP set-top-box connected to the subscriber’s television set. In May 2007, we renamed our IP-TV service as “bbTV”. This monthly subscription-based pay television service offers 83 channels consisting of a self-produced 24-hour news channel2.0 million residential homes pass and education and recreation channels (including children’s programming), and channels whose content is obtained from other content-providers. Our news production team consists of a staff of 78 employees and produces an average of 70-80 news stories per day for our 24-hour news cycle.
Because of the scalability of our Next Generation Network infrastructure, the current cost of adding IP-TV services to an existing broadband Internet access or local VOIP subscriber is small. Since the launch of our IP-TV services in August 2003 we have progressively adjusted our content offerings and valued added components of the services. We consider our IP-TV to be an incremental component of our broadband and VOIP service offerings, rather than a large standalone business. As of August 31, 2007, we had 128,000 subscriptions representing approximately 8% of the total Pay-TV subscription base in Hong Kong.
Competition
Our two main competitors in the pay-TV business are i-Cable and PCCW-HKT. The pay-TV services of i-Cable and PCCW-HKT include a significant amount of English language content such as English Premier League Football, HBO, Cinemax, ESPN and others. PCCW-HKT, in particular, has signed long-term exclusive content contracts with English Premier League Football, HBO, ESPN, and Star among others. We target a different market than these competitors by offering predominantly Chinese language content, and pricing our IP-TV service attractively to the residential mass market.
Television Broadcasts Limited and Asia Television Limited, commonly known as TVB and ATV, respectively, are indirect competitors to our pay-TV services in the Hong Kong television market. TVB and ATV account for a substantial proportion of Hong Kong’s television viewership and we market our services as supplemental to theirs. TVB and ATV are supported by advertising revenues and, therefore, must design their programming to attract the widest possible audience. In contrast, we and the other pay-TV operators rely on monthly subscription fees for most of our revenues. Other competitors include satellite TV operators, such as Star TV, as well as potential competition from direct-to-home broadcasters and broadcasters using digital terrestrial delivery methods.
On December 31, 2007, TVB and ATV launched digital terrestrial television (“DTT”) to bring viewers a wide array of free programme choices, better reception and to open up new creativity platforms for television production. New free channels on standard definition television and high definition television were launched on December 31, 2007. TVB and ATV have pledged to speed up the construction of the six transmission stations to advance the target of providing coverage to 75% of the population of Hong Kong by August 2008. As DTT signals are broadcasted on new frequency channels, building management offices of each building may need to upgrade their communal aerial broadcast distribution systems for reception and distribution of DTT programmes. Viewers are also required to maintain a digital set-top-box, or buy an integrated digital television set with a built-in decoder for receiving DTT programmes. The launch of DTT by TVB and ATV may decrease the demand for pay television service.
1,800 commercial buildings.
International Telecommunications ServicesWe were among the first companies to be granted a PNETS License by the Telecommunications Authority to provide international calling card services in Hong Kong. Since we first began providing international telecommunications services in 1992, we have greatly expanded the range of services that we offer. We now offer a variety of international direct dial services to our customers at competitive rates and are one of the largest providers of international direct dial services in Hong Kong. We believe that our ability to deliver a range of calling plans with varying features that cater to different customer needs has been one of the key factors of our success.
The primary international telecommunications services that we currently offer our customers are the following:
| | |
Service
| | Description |
IDD 1666 | | Provides subscribers with international direct dial using the access
number 1666 in Hong Kong. |
| |
IDD 0030 | | Provides subscribers with international direct dial using the access
number 0030 in Hong Kong. |
| |
Mobile Call Forwarding Services | | Allows call forwarding of Hong Kong mobile numbers so
that subscribers can receive calls while overseas. |
We offer our international telecommunications service under the IDD 1666 and IDD 0030 brand names. These two brands provide us with flexibility in our marketing strategies. We charge our IDD 1666 and IDD 0030 users a per minute tariff rate that varies according to the destination of the call and calling prefixes, while users of services are also provided discounts depending on the time of day or day of the week when the call is placed.
In fiscal 2006, we experienced a reduction in total traffic volume of 16.8% to 788 million minutes and in fiscal 2007, a further reduction in total traffic volume of 16.4% to 659 million minutes. The continuing reduction in traffic volume was mainly due to intense competition as some of our integrated competitors offered free or very low cost international direct dial minutes as a customer incentive to gain local fixed line and mobile market share. Further, technology substitution from global VOIP providers such as Skype, which offers free PC-to-PC based international calls, is becoming more prevalent. We are proactively migrating our legacy international telecommunications services to our “2b” services, which we believe will enable us to achieve higher margins and access a wider addressable market.
International Telecommunications Networknetwork
Our international telecommunications network infrastructure isconsists of a system of switches, self-owned and leased backbone capacity, interconnection arrangements and undersea cables that connectfor the subscriber’s telephone call to its destination.transmission of long distance calls.
| • | | Undersea cables. In March 2002, we received our license to provide undersea cable-based FTNS. This license allows us to purchase and operate our own undersea cables. In 2000, we entered into contracts with two large consortia of international telecommunications companies to acquire undersea cable capacity. Pursuant to the first contract, we completed the construction of a Japan-U.S. undersea cable in August 2001. Pursuant to the second contract, we agreed to jointly construct and maintain the Asia-Pacific Cable Network 2 undersea cable as an international transmission facility. Construction of the cable was completed in May 2002, and commercial operation began immediately thereafter. We spent a total of HK$120 million on these two projects. We believe the utilization of these undersea cables provides capacity for significant future growth of our international and fixed-network telecommunications services. |
|
| | | Having our own undersea cables and our fiber-based backbone have enabled us to better control international transmission quality, reduce the costs associated with international transmission and reduce our reliance on third party infrastructure. Our international telecommunications network currently has a monthly handling capacity of approximately 140 million minutes. We believe that the continuing improvement of our international telecommunications network is important in supporting the growth of our subscription base and the expansion of our range of services. |
| • | | Interconnection arrangements.We have entered into interconnection arrangements with other local fixed network operators in Hong Kong and overseas carriers to transmit calls between Hong Kong and overseas destinations for our customers. We take into account a number of factors in choosing the local fixed network operators and overseas carriers with whom we cooperate, including the level of termination charges and transmission efficiency and quality. We evaluate the performance of parties with whom we have interconnection arrangements periodically. We believe that we will not have difficulty in finding alternative overseas carriers if performance standards are not being met or a change is otherwise necessary. We have not experienced any disruption in the provision of our services as a result of a change of arrangements with overseas carriers or local fixed network operators. |
|
| | | We pay a fixed monthly fee to local fixed network operators for connection between our switches and their networks and a variable access fee payable on a per-minute basis when accessing their network. For customers using our own network, no interconnection fee is charged. We negotiate the termination charges we pay with the overseas carriers, and the termination charges vary from one overseas carrier to another. All of the interconnection and termination charges we pay to local fixed network operators and overseas carriers, respectively, are made on an open account basis with credit terms ranging from 10 to 30 days. The interconnection charges we pay to local fixed network operators are denominated in Hong Kong dollars and substantially all the interconnection charges we pay to overseas carriers are denominated in U.S. dollars. |
18
In March 2002, we received our license to provide undersea cable-based fixed telecommunications network services. This license allows us to purchase and operate our own undersea cables. In 2000, we entered into contracts with two large consortia of international telecommunications companies to acquire undersea cable capacity. Through the first contract, we invested in the Japan-U.S. undersea cable, which was completed in August 2001. Pursuant to the second contract, we agreed to jointly construct and maintain the Asia-Pacific Cable Network 2 undersea cable as an international transmission facility. Construction of the APCN 2 cable was completed, and commercial operation began, in May 2002. We spent a total of HK$120 million on these two projects. We believe the utilization of these undersea cables provides capacity for significant future growth of our international and fixed-network telecommunications services.
Having our own undersea cables and our fiber-based backbone has enabled us to better control international transmission quality, reduced the costs associated with international transmission and reduced our reliance on third party infrastructure. Our international telecommunications network currently has a monthly handling capacity of approximately 150 million minutes. We believe that the continuing improvement of our international telecommunications network is important in supporting the growth in our subscription base and the expansion of our range of services.
| • | | International telecommunications switching systems.We own five international telecommunications switching systems: three in Hong Kong and two in Canada, one in Vancouver and one in Toronto. |
|
| | | Our three international telecommunications switching systems in Hong Kong handle telephone calls originating or terminating in Hong Kong as well as transit traffic. Our telecommunications network mainly consists of switching equipment by Nortel Networks Limited and compression units supplied Cisco Systems, Inc. and ECI Telecom Ltd. These systems are programmed to automatically choose the optimal routing for each transmission. Optimal routing is a function of a variety of factors, such as country or territory of origination and destination, communication quality, efficiency and costs, and the capacity of the various communication methods available. |
|
| | | Because our three international telecommunications switching systems in Hong Kong operate independently of each other, if one system breaks down, all transmissions are immediately diverted to another switching system. We have never experienced a period where all systems experienced a failure at the same time since we commenced operations in 1992. |
Interconnection ArrangementsWe have entered into interconnection arrangements with other local fixed network operators in Hong Kong and overseas carriers to transmit calls between Hong Kong and overseas destinations for our customers. In choosing the local fixed network operators and overseas carriers with whom we cooperate, we take into account a number of factors including the level of termination charges and transmission efficiency and quality. We evaluate the performance of parties with whom we have interconnection arrangements periodically. We believe that we will not have difficulty in finding alternative overseas carriers if performance standards are not being met or a change is otherwise necessary. We have not experienced any disruption in the provision of our services as a result of a change of arrangements with overseas carriers or local fixed network operators.
We pay a fixed monthly fee to local fixed network operators for connection between our switches and their networks and a variable access fee payable on a per-minute basis when accessing their network. For customers using our own network, no interconnection fee is charged. We negotiate the termination charges we pay with the overseas carriers, and the termination charges vary from one overseas carrier to another. All of the interconnection and termination charges we pay to local fixed network operators and overseas carriers, respectively, are made on an open account basis with credit terms ranging from 15 to 30 days. The interconnection charges we pay to local fixed network operators are denominated in Hong Kong dollars and substantially all the interconnection charges we pay to overseas carriers are denominated in U.S. dollars.
International Telecommunications Switching Systems
We own three international telecommunications switching systems in Hong Kong and two in Canada, comprising one in each of Vancouver and Toronto.
Our three international telecommunications switching systems in Hong Kong handle telephone calls originating or terminating in Hong Kong. Our telecommunications network mainly consists of Nortel Networks Limited switching equipment and compression units supplied by Cisco Systems, Inc. and ECI Telecom Ltd. These systems are programmed to automatically choose the optimal routing for each transmission. Optimal routing is a function of a variety of factors, such as country or territory of origination and destination, communication quality, efficiency and costs, and the capacity of the various communication methods available.
Furthermore, since our three international telecommunications switching systems in Hong Kong operate independently of each other, if one system breaks down, all transmissions are immediately diverted to another switching system. We have never experienced a period where all systems experienced a failure at the same time since we commenced operations in 1992.
Competition
PCCW-HKT, HGC, New World, and Wharf T&T are our main competitors in the international telecommunications business. As in previous years, we experienced fierce price competition in Hong Kong during fiscal 2007. This competition drove down the average tariff rates per minute and we expect this price competition to continue in fiscal 2008. In order to maintain our market share and high traffic volume, we have significantly reduced some of our international telecommunications rates and introduce new marketing and promotional offers from time to time. We also employ two brand names, IDD 1666 and IDD 0030, to provide us with flexibility in our marketing strategies. However, to offset these price reductions, we have taken steps to reduce our cost base, such as using our relatively large traffic volume to negotiate lower prices from our international partners, establishing a call center in Guangzhou to provide customer service and back office support services, and developing our own international telecommunications infrastructure.
Sales and Marketing
marketing
We advertise our products and services through our
“Fibre Shops”, “on-the-street” marketing kiosks, telemarketing and direct mailing, as well as through Chinese language television, radio, print media and on the Internet.
In fiscal 2009, we grew our retail presence to 14 “Fibre Shops” and a customer service center. We have developedplanned to open more shops in the future. We believe these shops can offer our customers convenient access to our wide range of services.
We have an extensive sales network in Hong Kong. Our senior marketing personnel closely oversee our sales network to ensure that a consistent image is presented by all of
theour sales representatives
we use to promotein promoting City Telecom and HKBN. We provide commission based incentives to our residential sales force
that sellfor our
international and fixed telecommunications network
services and international telecommunications services.
We have
a sales division responsible for coordinating our corporate marketing and sales efforts. We believe our dedicated corporate and small-to-medium enterprise sales force is one of the largest sales forces targeted at corporate users of telecommunications and Internet services in Hong Kong. In addition, our dedicated corporate staff designs marketing and sales promotions specifically tailored to address the concerns of business users. This division also organizes seminars for current and prospective customers to promote new products and services and to raise
the public awareness of our various corporate offerings.
Maintenance and Monitoringmonitoring
To ensure reliability of our fixed telecommunications network, we continue to maintain our monitoring system, which involves:
a year round, 24-hour, 7 days a week network operation center for real-time service monitoring and maintenance that is supported by about 120 operational and field staff;
| • | | two separate network operation centers in two different locations operate 24 hours a day, 7 days a week, network operation center providing real-time service monitoring and maintenance services and supported by about 130 operational and field staff; |
|
| • | | individual self-reporting mechanisms and centralized performance monitoring systems for our switches and equipment; |
|
| • | | an emergency self-reporting system that automatically contacts designated personnel; and |
|
| • | | back-up systems for our switches, critical software and hardware components. |
individual self-reporting mechanisms and centralized performance monitoring systems for our switches and equipment;
an emergency self-reporting system that automatically contacts designated personnel; and
back-up systems for our switches, critical software and hardware components.
Once a network fault is detected by our control room, we will either remotely rectify the situationproblem remotely or dispatch field staff to that location should physical interaction be required. After the situationproblem has been resolved, we will continue to monitor network performance as well as track customer service feedback until we are assured of the fault being fully rectified.
Research and Development ActivitiesWe commit considerable resources to our research and development department in order to continuously improve our services and improve our market position.activities
As of August 31,
2007,2009, our research and development department in Hong Kong consisted of approximately
3021 staff members experienced in systems design, engineering, telecommunications and computer programming. Our research and development department is primarily responsible for assessing and adapting the technology that we employ in upgrading and expanding our Next Generation Network. To identify and develop new market opportunities,
theour research and development department
assessesevaluates new services offered by telecommunications and Internet companies in the United States and elsewhere and works closely with our marketing
department.department for product development. Our research and development expenditures were approximately HK$
11.0 million, HK$9.6 million and HK$
5.010.8 million for fiscal
2005, 20062008 and
2007,2009, respectively.
We believe that
providing excellent customer service and support is essential to
our building and retaining
of a large and loyal
subscribersubscription base. We therefore have committed considerable personnel and financial resources to establishing a reliable and accessible customer service system.
Our customer service department provides integrated support to our internationalsubscribers of FTNS business and fixed telecommunications network services subscribers.IDD business. We provide a hotline to handle complaints, subscription applications and queries relating to account balances, pricing, billing, service and technical information. Complaints and in-depth queries from subscribers that cannot be immediately remedied or answered are forwarded to a customer care team, which is responsible for answering such complaints and queries. We also have a dedicated customer service team to provide service to our corporate subscribers, which includes access to a highly skilled technical team that may go to the customer site for trouble shooting and repairs.
19
In February 2007, to further enhance customer experiences, we established a “Special Duty Unit” (“SDU”) customer care system whereby residential broadband customers are assigned a designated personal customer care executive for service account matters.
Our centralized customer service call center is located in Guangzhou, which provides our customer service
functions and back office support services at that location. This enables us to lower our operating costs while continuing to increase our customer service capabilities. As of August 31,
2007,2009, our Guangzhou customer service facility had
1,2641,520 employees.
Billing and Collectioncollection
Our credit and
controlcollection team is responsible for securing prompt payment from subscribers. Invoices are issued on a monthly or quarterly basis with a specified payment due date.
VarietyA variety of payment methods are
used for payment collectionmade available to our subscribers, including cash, check, credit card, payment by telephone service, automatic transfer from subscribers’ bank accounts or through Internet banking. Our bad
debts expense represented approximately 3.1%,1.5%1.1% and 0.6%0.8% of our revenue for each of fiscal 2005, 20062008 and 2007,2009, respectively. Bad debts expense for fiscal 2005 was higher compared to fiscal 2006 and 2007 due to the recognition of a provision of HK$19.5 million for mobile interconnection charges in 2005. The lower bad debt expenses in fiscal 2007 was due to the reversal of HK$9.4 million of a previously recognized provision for doubtful accounts as a result of the issuance of the Final Determination for the mobile interconnection charges. For more information regarding our provision for mobile interconnection charges, see “Our Revenues – Fixed Telecommunications Network Services” above in this annual report.
We maintain tight collection procedures, including periodic reminder notices,
late paymentand impose a charge of HK$10 or a fee of 1.5% per month on outstanding overdue amount
for late payment. We have the right to charge the outstanding overdue amount to the subscriber’s pre-registered credit card account
for any amount overdue or if applicable, deduct
the outstanding overduesuch amount from the subscriber’s application deposit. Moreover, we generally suspend an account
if the outstandingwhen amount overdue
amount is not settled within our prescribed period. If payment is still not settled after we suspend the account, further recovery actions including court proceedings and/or the use of collection agencies will be taken.
Seasonality
Our operations are not subject to significant seasonal fluctuations generally. Our IDD business typically experiences a slight decrease in revenue during the second quarter of each fiscal year (i.e. December through February) in connection with the Christmas holiday and Chinese New Year holiday. We do not believe that seasonality has had a material effect on our business, financial condition or results of operations.
Environmental Mattersmatters
Since our date of incorporation, we have not violated any environmental laws, ordinances or regulations, and believe that all of our operations comply fully with applicable environmental laws.
Intellectual Property Rightsproperty rights
We have registered our trademarks with the Trademarks Registry of the Intellectual Property Department in Hong Kong. We have no other material intellectual property.
C. Regulatory framework
The following is a brief summary of the Hong Kong laws and regulations that currently materially affect our business. This section does not purport to be a comprehensive summary of all present and proposed regulations and legislation relating to the industries in which we operate.C. Regulatory Framework
As a provider of broadband Internet access, local VoIP, IP-TV and international telecommunications services in Hong Kong, our operations are subject to the Telecommunications Ordinance and the Broadcasting Ordinance and their respective subsidiary legislation, regulations and codes of practice. The Telecommunications Ordinance provides the legislative and regulatory framework for the provision of telecommunications services and facilities in Hong Kong. The Broadcasting Ordinance governs the content and scope of television programming and the licensing of television broadcasters.
Our primary regulator is the Telecommunications Authority, whose responsibility and functions include regulating and licensing telecommunications network services and regulating the telecommunications markets in Hong Kong, including the
issuingissuance of non-exclusive licenses; the determination of terms of interconnection; promotion of fair competition in the telecommunications sector; management of the frequency spectrum; development of technical standards and customer equipment testing; protection of consumer interests; and the control and administration of the Hong Kong numbering plans (including allocation of numbers or codes). The Telecommunications Authority is also responsible for the administration of the Telecommunications Ordinance. We are also regulated by the Broadcasting Authority, which administers the Broadcasting Ordinance and makes recommendations to the Chief Executive-in-Council on applications for broadcasting licenses, as well as on the renewal, suspension and revocation of licenses.
Telecommunications Industryindustry
It is unlawful to establish or maintain any means of telecommunications, or possess, use or deal with telecommunications apparatus in Hong Kong without a license. The Telecommunications Authority has the authority to grant licenses for all means of telecommunications services and facilities in Hong Kong, including the provision of fixed wireline, public mobile telephone,
internetInternet and satellite services. Furthermore, the Telecommunications Authority has the authority to require a licensee to comply with the terms of its license and any applicable legislation or regulations or codes of practice, and to suspend or revoke licenses to enforce the Telecommunications Ordinance or other rules or regulations or codes of practice to protect the public interest.
Currently, there are four Class Licenses within the telecommunications regulatory framework, one relating
Prior to
August 1, 2008 the operation of
in-building telecommunications systems, the second relating to the provision of public wireless local area network services, the third relating to the operation of Citizen Band Radio by the public for recreational and other communications purposes and the fourth relating to the provision of telecommunications services to the general public without establishment, operation or maintenance of telecommunications equipment.The Telecommunications Authority recognizes that fixed and mobile services will convergewere regulated separately under four types of carrier license. Further, a number of other types of licenses permitted a licensee to establish facilities or services of a similar kind.
However, in recognition of the convergence of fixed and mobile services enabling voice, data and multimedia applications to be provided over common core networks, delivered through a range of wireline and wireless customer access networks and which will be accessible from common end-user devices irrespective of whether the users are at fixed locations or on the move. As it will becomemove with the result that is becoming more difficult to classify a service as a “fixed” or “mobile”, the Telecommunications Authority is now proposingamendment legislation has been passed to abolish the distinction between fixed and mobile carrier licenses and establishingcreate a single Unified CarrierUC License or UCL which would encompassencompassing both fixed and mobile carrier services. The UC License regime came into operation on August 1, 2008. After that date the Telecommunications Authority has jointly withwill not issue any further fixed or mobile carrier licenses (save for a Mobile
20
Carrier License which the
Commerce and Economic Department Bureau issued a consultation paper inviting public submissions on this issue. The Telecommunications Authority
had already committed to grant to the successful bidder of the spectrum in the 850 MHz band to provide CDMA2000 service). Instead the UC License is
currently expectedthe only carrier license to
make its decision afterbe issued for the
consultations close in February 2008.provision of fixed, mobile and/or converged services. In the meantime, existing fixed and mobile licenses continue to be effective until their expiry date. License holders may convert existing fixed or mobile licenses into UC Licenses before their expiry on a voluntary basis or apply for UC Licenses upon the expiry of existing fixed or mobile licenses.
General Licensing Requirements Generally, a licensee is required to be a company incorporated in Hong Kong (which can be wholly owned by a foreign company) or a foreign company registered in Hong Kong. Currently, there is no foreign ownership restriction on the holder of a telecommunications license under the current regulatory regime.
Non-compliance with the Telecommunications Ordinance, any subsidiary legislation made pursuant to it, any of the license conditions or any direction issued by the Telecommunications Authority by a telecommunications licensee, could result in the revocation or suspension of the relevant license. The Telecommunications Ordinance contains a set of provisions setting forth the procedural steps which the Telecommunications Authority must adhere to prior to revoking or suspending any telecommunications licenses. In addition, the Chief Executive in Council has the authority, at the recommendation of the Telecommunications Authority, to revoke a telecommunications license at any time if it is in the public interest to do so.
Public Non-Exclusive Telecommunications Services License A PNETS License is used by the Telecommunications Authority to cover the provision of a number of different telecommunications services where the service provider provides the service to the public using the network of a licensed carrier or by establishing or maintaining transmission facilities within the boundary of a building or property. In practice, the PNETS License is also used as a “sweep-up” license category, where a license is required by virtue of the Telecommunications Ordinance but none of the existing categories are applicable to the means of telecommunications or telecommunications service for which the license is required.
With effect from November 30, 2009, the Telecommunications Authority no longer issue PNETS License to service-based providers using the network of a licensed carrier. As a replacement, all PNETS License will be gradually replaced by the modified Services-Based Operator License, i.e. Class 3 Services-Based Operator License. Holder of Class 1 & 2 Services-Based Operator License is allowed to provide Internet Protocol based telephony services making use of Hong Kong telephone numbers, while Class 3 Services-Based Operator is not allowed. Existing PNETS License will remain in force until their next anniversary date when they would be replaced by the Class 3 Services-Based Operator License.
A
PNETSClass 3 Services-Based Operator License has a validity period of 12 months and is renewable at the discretion of the Telecommunications Authority on an annual basis upon the payment of a prescribed annual fee, which is currently set at HK$750. Where radio communications apparatus is used, there is an additional variable component calculated by reference to the number of base stations and mobile stations involved.
We currently hold
Since the expiry of PNETS License in December 2009, the Telecommunications Authority granted us a
PNETS ETSClass 3 Services-Based operator License. The Class 3 Services-Based Operator License
which was issued to us in November 1998. This PNETS ETS License has been subsequently amended twice and presently gives us the right to provide calling card services, international simple resale services for facsimile and data services, virtual private network services and external telecommunications services over the external telecommunications facilities of other licensed external facilities
providers. Weproviders, the scope of service under the Class 3 Services-Based operator License is similar to the PNETS License previously granted to us by the Telecommunications Authority. HKBN also
holdholds a PNETS IVANS License, which was issued to us in December 1993. This PNETS IVANS License allows us to act as an Internet Service Provider.
Under the terms of the
Class 3 Services-Based Operator License, PNETS ETS and PNETS IVANS Licenses, we and
IDD 1600IDD1600 Company Limited, or
IDD 1600,IDD1600, our wholly owned subsidiary, are required to comply with certain license conditions relating to technical and reporting matters.
Fixed Telecommunications Network ServicesFTNS LicenseA FTNS License authorizes the licensee, among other things:
to provide a public fixed telecommunications network service, covering internal services or external services, or both; and
| - | | to provide a public fixed telecommunications network service, covering internal services or external services, or both; and |
|
| - | | to establish and maintain a fixed telecommunications network, which may be wireline-based or wireless-based (Wi-Fi spectrum included), or a combination of both. |
to establish and maintain a fixed telecommunications network, which may be wireline-based or wireless-based (Wi-Fi spectrum included), or a combination of both.
A FTNS License is valid for a period of 15 years and is renewable for a further period of not exceeding 15 years at the Telecommunications Authority’s discretion. The amount of license fee payable by a holder of a FTNS License comprises (i) a fixed annual amount of HK$1.0 million; (ii) a variable amount calculated on the basis of the number of customer connections (which is currently set at HK$700 for each 100 customer connections); and (iii) a variable fee calculated by reference to the radio spectrum assigned and used by the license holder.
HKBN
our wholly-owned subsidiary, currently holds a FTNS License, which was issued to it in February 2000 initially for the operation of a local fixed wireless network. This FTNS License has been subsequently amended three times and presently, HKBN is authorized to operate both local fixed telecommunications networks (wireline and wireless based) and external telecommunications facilities.
The Telecommunications Authority divides interconnection into two main types:types. The first type is “Type I Interconnection”, which is interconnection between network gateways, such as tandem exchanges, local exchanges or dedicated interconnection gateways, which allowsallow end users on different networks to “communicate” with each other. The second type is “Type II Interconnection”, which is a connection to a fixed carrier’s network at points of the customer access network level (more often referred to as local access or local loop unbundling) allowing the end customer requesting the interconnection to use the customer
21
access network of the fixed carrier to obtain fixed telecommunications services.FTNS. The Telecommunications Authority introduced the Type II interconnection policy in 1995 that the fixed carriers have obligation to provide Type II interconnection at regulated terms and conditions. But, in
On July
6, 2004 the
Hong Kong Government
decidedannounced that the
mandatory Type II Interconnection policy
applicable to telephone exchanges for individual buildings covered by such exchanges, would be gradually withdrawn on a building-by-building basis, applying to buildings already connected to at
the telephone exchange levelleast two self-built customer access networks, such withdrawal to be
withdrawn beforefully implemented by a final sunset date of June 30, 2008.
After that time, mandatory Type II Interconnection will be maintained only in buildings for which it is technically not feasible or economically not viable for an operator to roll out its customer access network.
On July 3, 2008, the Telecommunications Authority issued a statement to confirm that the mandatory Type II Interconnection policy has been successfully withdrawn as from July 1, 2008 as well as to set out the issues to be followed up after its withdrawal. After this date, interconnection terms including charges will be determined by commercial negotiation between carriers.
Competition Provisionsprovisions Regulation of Anti-Competitive Conductanti-competitive conduct Although Hong Kong has never had a general competition code, historically, holders of FTNS Licenses
wereare prohibited from engaging in anti-competitive conduct, abusing its dominant position in a telecommunications market, or engaging in any discriminatory conduct by certain competition-related license conditions contained in the FTNS Licenses issued by the Telecommunications Authority. In June 2000, the competition provisions of the Telecommunications Ordinance became operational and, as from that time, anti-competitive conduct was prohibited by legislation as well as under the relevant
licencelicense conditions.
The Telecommunications Ordinance provides an appeal mechanism by the establishment of a Telecommunications (Competition Provisions) Appeal Board. A person or a licensee aggrieved by a decision made by the Telecommunications Authority relating to the competition provisions may appeal to the Board. Additionally, a third party suffering loss or damage from breach of such competition provisions may bring an action for damages or seek other appropriate remedies against the offending licensee.
Control on Mergersmergers and Acquisitionsacquisitions If the Telecommunications Authority determines that the relevant merger and acquisition activity has, or is likely to have, the effect of preventing or substantially lessening competition in a telecommunications market, the Telecommunications Authority is empowered to direct a carrier licensee to take such actions, such as the complete or partial divestiture of the relevant parties’ interests in the merged entity, as the Telecommunications Authority considers necessary, to eliminate or avoid any anti-competitive effect. However, the Telecommunications Authority may not issue such a direction if
heit takes the view that the public benefit of the merger and acquisition outweighs any detriment caused by a reduction in competition. Any decision made or direction issued by the Telecommunications Authority under the
mergersmerger and acquisition provision is subject to appeal to the Telecommunications (Competition Provisions) Appeal Board.
The regulatory regime on mergers and acquisitions only applies to carrier licensees, which includes HKBN as a holder of a FTNS License, which is regarded as a carrier license for the purpose of the Telecommunications Ordinance.
Consumer Protectionprotection The Telecommunications Ordinance also contains a statutory provision that is primarily aimed at protecting consumers. This provision prohibits a licensee from engaging in any misleading or deceptive conduct.
The Telecommunications Authority has taken an active role in enforcing this prohibition and has developed voluntary codes to assist in this respect. For instance, in November 2004, the Telecommunications Authority issued a “Code of Practice for the Service Contracts for the Provision of Public Telecommunications Services” which sets out guidelines on the preparation of service contracts. The code states that important terms of a service contract (e.g. a compensation clause for early termination by the customer) should be presented in a prominent place and should be highlighted in the contract. The code is applicable to all service providers (except
for mobile network operators which are subject to a separate code of practice) including holders of FTNS Licenses, such as HKBN, and holders of
Class 3 Services-Based Operator License, PNETS ETS Licenses and IVANS Licenses, such as ourselves and
IDD 1600.IDD1600. Although the guidelines are voluntary in
nature, the Telecommunications Authority has indicated that the extent of a licensee’s compliance with the guidelines will be taken into account in assessing if a licensee has complied with the statutory provision mentioned above.
Apart from the Telecommunications Ordinance, like any
companiescompany carrying on business in Hong Kong, telecommunications operators are required to comply with applicable Hong Kong consumer protection laws, for example, the Sale of Goods Ordinance (Cap 26), Control of Exemption Ordinance (Cap 71), Supply of Services (Implied Terms) Ordinance (Cap 457), the Unconscionable Contracts Ordinance (Cap 458) , Personal Data (Privacy) Ordinance (Cap 486), and the Unsolicited Electronic Messages Ordinance (Cap 593).
Regulation of Pricingpricing Currently, the pricing of both
fixed telecommunications network servicesFTNS and public non-exclusive external telecommunications services in Hong Kong is regulated by license conditions. However, the regulatory frameworks of each type of services are different.
All
Services-Based Operator License and PNETS Licenses contain license conditions requiring the licensees to publish their tariffs and to charge no more than the published tariffs.
Similarly, holders of FTNS Licenses are prohibited by license conditions from charging more than their published tariffs for their services. The FTNS License conditions prohibit licensees from offering discounts to their published tariffs and require the licensees to seek approval from the Telecommunications Authority in connection with (i) any revision of published tariffs, (ii) tariffs for any new services or products or (iii) tariffs for any trial services. However, the Telecommunications Authority may grant a
22
waiver of the application of any or all of these restrictions in relation to a relevant telecommunications market if, in the opinion of the Telecommunications Authority, the licensee is not “dominant” in such market. This is known as an ex ante regime.
HKBN has been granted a waiver from all the tariff revision prohibitions contained in its FTNS License and is able to provide discounts and revise its tariffs in all the
fixed telecommunications network servicesFTNS markets.
Universal Service Contributionservice contribution and Local Access Chargelocal access charge Under the current regulatory regime, PCCW-HKT has a universal service obligation to provide good, efficient and continuous basic telecommunications services at reasonable cost on a non-discriminatory basis to all persons in Hong Kong. To compensate PCCW-HKT for the expenses of this obligation, certain licensees are required to contribute to such cost, which is referred to as the universal service contribution.
On June 8, 2007, the Telecommunications Authority issued a Statement entitled “Review of the Regulatory Framework for Universal Service Arrangement”, which announced the new universal service contribution
(“USC”). Holdersarrangement for funding the cost of
FTNS LicensesUniversal Service Obligation. Commencing from May 1, 2009, the USC sharing arrangement based on external traffic volume has been migrated to that based on the number of all telephone numbers allocated which may be assigned to customer for voice services, non-voice services or both voice and
PNETS ETS Licenses, including ourselves,non-voice services. Under the new arrangement, local fixed carrier license, local fixed telecommunications network service licensee, mobile carrier licensee, unified carrier licensee authorized to provide local fixed or mobile services, mobile virtual network operator licensee and services-based operator licensee authorized to provide Class 1 or 2 services are the USC contributing parties. In respect of the above, HKBN
as a local fixed telecommunications network service licensee is classified as a USC contributing party and
IDD1600 areis required to pay
USC.USC under the new regime.
The level of USC is determined by the Telecommunications Authority and is reviewed periodically based on actual cost and revenue and on a customer-by-customer basis. The average rate has declined over the past several years. In accordance with a statement dated
December 28, 2007April 8, 2009 issued by the Telecommunications Authority, the level for the period from
JanuaryJuly 1,
20052007 to June 30,
20072008 is confirmed to be zero cent per minute.
In the circumstances, PCCW-HKT must refund to all USC contributing parties HK 0.3 cent per minute already paid before and there will not be any interest payment for the adjustment of those USC. The level of USC from July 1,
20072008 onwards
is to be determined by the Telecommunications Authority.
Additionally, providers of external telecommunications services, such as holders of
Class 3 Services-Based Operator License and PNETS ETS Licenses, including ourselves and
IDD 1600,IDD1600, are required to pay a local access charge,
(“LAC”),or LAC, to the local network operators whose network facilities holders of PNETS ETS Licenses use to transmit calls to and from their customers’ sites. The level of the LAC is calculated on a per-minute basis and its arrangement is based on the statement dated November 25, 1998 issued by the Telecommunications Authority. Recently, based on the conclusion from the statement dated April 27, 2007 issued by the Telecommunications Authority, the Telecommunications Authority will not, for the time being, proceed with the complete deregulation of LAC.
Fixed Mobile Interconnection Chargemobile interconnection charge Fixed Mobile Interconnection Charge, or FMIC, is an interconnection charge for circuit-switched traffic between a Fixed Network Operator and a Mobile Network Operator. The
rate of FMIC is currently set by the Telecommunications Authority. The current level of FMIC charged by the incumbent Fixed Network Operator, PCCW Limited is HK$4.36 cents per occupancy minute, as determined by the Telecommunications Authority
in November 2004. In June 2007, the Telecommunications Authority determined the FMIC rates for Hong Kong Broadband Network Limited, or HKBN, our wholly owned subsidiary which is a Fixed NetworkOperator, with one of its Mobile Network Operators, China Resources Peoples Telephone Company Limited, or Peoples, at a rate of HK$4.8 cents per occupancy minute from April 1, 2002 to August 31, 2002, HK$4.22 cents per occupancy minute from September 1, 2002 to August 31, 2003 and HK$2.89 cents per occupancy minute from September 1, 2004 to August 31, 2004. However,has indicated in its statement published on April 27, 2007, the Telecommunications Authority has indicated that it will de-regulate the existing FMIC arrangement with effect from April 27, 2009. When this occurs the Fixed and Mobile Network Operators would have to adopt a more market driven approach in that parties are expected bilaterally to negotiate a commercially agreed FMIC without the Telecommunications Authority’s intervention.
Since the deregulation of FMIC arrangement on April 27, 2009, HKBN reached agreements with some of the mobile operators on the settlement arrangements of FMIC. As of December 15, 2009, the discussion with remaining mobile operators on FMIC is still in progress.
In June 2007, the Telecommunications Authority determined the FMIC rates for HKBN, which is a Fixed Network Operator, with one of its Mobile Network Operators, China Resources Peoples Telephone Company Limited, or Peoples, at a rate of HK4.8 cents per occupancy minute for interconnection from April 1, 2002 to August 31, 2002, HK4.22 cents per occupancy minute for interconnection from September 1, 2002 to August 31, 2003 and HK2.89 cents per occupancy minute for interconnection from September 1, 2004 to August 31, 2004. In February 2008, HKBN requested Telecommunication Authority to make a new determination with four Mobile Network Operators on the rate of FMIC payable by these Mobile Network Operators for mobile interconnection service In September 2008 the Telecommunications Authority indicated that it accepted HKBN’s request for determination. On November 25, 2009, the Telecommunications Authority sent its Preliminary Analysis to parties for response. As of December 15, 2009, the new determination is still in process.
Television Broadcasting Industrybroadcasting industry
At present, Hong Kong has two licensed domestic terrestrial broadcasters, TVB and ATV, providing free-to-air broadcasting services. In addition, there are also three licensed domestic pay-TV broadcasters, namely
HKCTV,Hong Kong Cable Television Limited, PCCW Media Limited and
TVB Pay Vision Limited (formerly known as Galaxy Satellite Broadcasting
Limited.Limited). HKBN provides TV services over the Internet under its FTNS License, while Star TV continues to provide its services through satellite means under its satellite television uplink and downlink license.
It is unlawful to offer any “television programmeprogram service” in Hong Kong without a license. “Television programmeprogram service” is broadly defined to mean the provision of television programs for transmission by telecommunications that are readily accessible to the general public in or outside Hong Kong or to persons in 2 or more specified premises simultaneously or on demand, whether on a
23
point-to-point or a point-to-multipoint basis. The Broadcasting Ordinance exempts certain categories of television program services from the current licensing regime, including television program services provided on the service commonly known as the “Internet”. The Broadcasting Ordinance itself, however, does not contain a definition of “Internet”.
The Secretary for Commerce, Industry and Technology has indicated that on the condition that HKBN continues to provide its service on the platform currently deployed by HKBN, the Government does not dispute that HKBN’s service is provided on the “Internet” and is thus exempt. On this basis, HKBN has not obtained a pay-television broadcasting license and provides IP-TV services under its FTNS License.
Cross Media Ownership Restrictionsmedia ownership restrictions As with other television regulatory regimes, there are detailed cross-media ownership restrictions in the Broadcasting Ordinance. The restrictions are only applicable to domestic free and domestic pay television program service licenses.
The Broadcasting Ordinance essentially provides that a company which is either a “disqualified person” or has a “disqualified person” exercising control over it will not be eligible to be granted a broadcasting license unless it discloses the disqualification in its license application. “Disqualified person” includes, for example, a company which is an existing domestic free or domestic pay television program licensee; an advertising agent; a sound broadcasting licensee; or a proprietor of newspaper printed or produced in Hong Kong.
Generally, a disqualified person who has complied with the disclosure requirement may apply for a broadcasting license. The Broadcasting Ordinance provides that the Chief Executive in Council may grant a broadcasting license to a company, including a disqualified person or to a company which has a disqualified person exercising control, over it or to a disqualified person in which another disqualified person exercises control subject to such conditions as the Chief Executive in Council sees fit.
Foreign Ownership Restrictionsownership restrictions In addition to the cross-media ownership restrictions outlined above, the Broadcasting Ordinance also imposes restrictions on foreign ownership of a holder of a domestic free television program service license. The restrictions do not prohibit the ownership of any voting shares in a domestic free television program service licensee but rather take the form of prohibiting the exercise of any voting rights attached to such voting shares.
Competition Provisionsprovisions The Broadcasting Ordinance also contains competition provisions, which are aimed at prohibiting a licensee from engaging in “anti-competitive conduct” and a licensee who is in a dominant position from abusing its position. “Anti-competitive conduct” is defined as conduct that has the purpose or effect of preventing, distorting or substantially restricting competition in a television program service market.
The Broadcasting Ordinance provides that a breach of any of the competition statutory provisions may lead to the relevant contractual provisions in an agreement being regarded as void.
Unlike the regulatory regime for the telecommunications industry, there is no equivalent of a specialized competition appeal board for the television broadcasting industry. A licensee aggrieved by a decision made by the Broadcasting Authority however may lodge an appeal to the Chief Executive in Council.
Program Standardsstandards and Advertising Standardsadvertising standards A broadcasting licensee is required to comply with the program standards and the advertising standards published by the Broadcasting Authority. The latest program standards and the advertising standards were both issued on May 4, 2007.December 12, 2008.
24
D. Organizational Structurestructure The following chart sets forth our principal subsidiaries as of
January 21, 2008: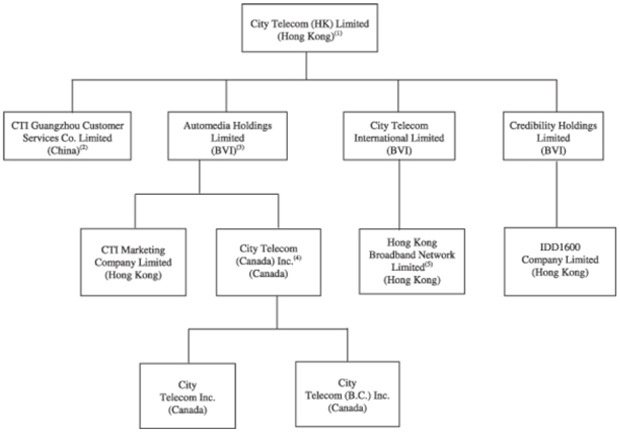
December 15, 2009:City Telecom (H.K.) Limited(1) (Hong Kong) CTI Guangzhou Customer Services Company Limited(2) (People’s Republic of China) Automedia Holdings Limited(3) (British Virgin Islands) City Telecom International Limited (British Virgin Islands) Hong Kong Broadband Network Limited(4) (Hong Kong) Credibility Holdings Limited (British Virgin Islands) IDD1600 Company Limited (Hong Kong) CTI Marketing Company Limited (Hong Kong) City Telecom (Canada) Inc. (Canada) 963673 Ontario Limited (Canada) City Telecom Inc. (Canada) City Telecom (B.C.) Inc. (Canada) |
| | |
| Notes: |
|
| (1) | | The other immediate subsidiarysubsidiaries of City Telecom (H.K.) Limited isare SGBN Singapore Broadband Network Pte. Limited and Golden Trinity Holdings Limited. The immediate subsidiaries of Golden Trinity Holdings Limited which hasare Warwick Gold Enterprises Limited and Attitude Holdings Limited as its immediate subsidiaries.Limited. |
|
| (2) | | The companyCompany has only registered its Chinese name. The English name is an unregistered translation. |
|
| (3) | | The other immediate subsidiaries of Automedia Holdings Limited are Global Courier Company Limited, CTI International Limited, BBTV Company Limited, City Telecom (U.S.A.) Inc., City Telecom (Vancouver) Inc. and City Telecom (Toronto) Inc. |
|
| (4) | The other subsidiary of City Telecom (Canada) Inc. is 963673 Ontario Ltd.
|
(5)
| The immediate subsidiaries of Hong Kong Broadband Network Limited are Excel Billion Profits Limited, Hong Kong Television Network Limited, Hong Kong Broadband Television Company Limited, and Hong Kong Broadband Phone Limited and Hong Kong Broadband Digital TV Limited. |
25
The jurisdiction of incorporation and our ownership percentage of each these subsidiaries as of
January 21, 2008December 15, 2009 were as follows:
| | | | | | | | | | |
| | | | | Percentage of interest
| |
| | | | held by City Telecom
(%) | |
Name
| | Jurisdiction of Incorporation | | Direct | | | Indirect | |
Name | | incorporation | | % | | | % | |
| 963673 Ontario Limited | | Canada | | | — | | | | 100 | |
Attitude Holdings Limited | | British Virgin Islands | | | — | | | | 100 | |
Automedia Holdings Limited | | British Virgin Islands | | | 100 | | | — | |
BBTV Company Limited | | Hong Kong | | | — | | | | 100 | |
City Telecom (B.C.) Inc. | | Canada | | | — | | | | 100 | |
City Telecom (Canada) Inc. | | Canada | | | — | | | | 100 | |
City Telecom (Toronto) Inc. | | Canada | | | — | | | | 100 | |
City Telecom (U.S.A.) Inc. | | The United States of America | | | — | | | | 100 | |
City Telecom (Vancouver) Inc. | | Canada | | | — | | | | 100 | |
City Telecom Inc. | | Canada | | | — | | | | 100 | |
City Telecom International Limited | | British Virgin Islands | | | 100 | | | — | |
Credibility Holdings Limited | | British Virgin Islands | | | 100 | | | — | |
CTI Guangzhou Customer
Services Co.Company Limited(1) (note) | | People’s Republic of China | | | 100 | | | — | |
CTI International Limited | | Hong Kong | | | — | | | | 100 | |
CTI Marketing Company Limited | | Hong Kong | | | — | | | | 100 | |
Excel Billion Profits Limited | | Hong Kong | | | — | | | | 100 | |
Global Courier Company Limited | | Hong Kong | | | — | | | | 100 | |
Golden Trinity Holdings Limited | | British Virgin Islands | | | 100 | | | — | |
Hong Kong Broadband Digital TV Limited | | Hong Kong | | | — | | | | 100 | |
Hong Kong Broadband Network Limited | | Hong Kong | | | — | | | | 100 | |
Hong Kong Broadband Phone Limited | | Hong Kong | | | — | | | | 100 | |
Hong Kong Broadband Television Company Limited | | Hong Kong | | | — | | | | 100 | |
Hong Kong Television Network Limited | | Hong Kong | | | — | | | | 100 | |
IDD1600 Company Limited | | Hong Kong | | | — | | | | 100 | |
SGBN Singapore Broadband Network Pte. Limited | | Singapore | | | 100 | | | — | |
Warwick Gold Enterprises Limited | | Hong Kong | | | — | | | | 100 |
(1)
| The company has only registered its Chinese name. The English name is an unregistered translation.
|
Note: The Company has only registered its Chinese name. The English name is an unregistered translation.
26
E. Property, Plantsplant and Equipmentequipment For the provision of fixed
telecommunicationstelecommunication network services, we own, or control through long-term leases, equipment consisting of switching, transmission and power equipment and connecting lines comprised of in-building wiring, fiber-based backbone, wireless and leased wire-line backbone and other support structures, conduits and similar items that comprise our Next Generation Network. The majority of the fiber-based backbone connecting our services are under public road, highways and streets.
HKBN, our whollyIn Hong Kong, we owned
subsidiary, owns two offices with an aggregate of
147,000160,300 square feet
and two switching centers comprisedpredominately for self use as of
six switching systems in Hong Kong.August 31, 2009.
For the provision of international telecommunications services, we own three switching systems in Hong Kong and two in Canada (one
each in Vancouver and
the other in Toronto). We have invested and have rights to dedicated capacity in two undersea cables, the Japan-U.S. cable and the APCN 2 cable, for use as international transmission facilities, both of which were completed and have been operational since May 2002.
In addition, we
lease propertyhave leased properties in Hong Kong for
two14 retail shops and for a 3,500 square
footfeet customer service center in
Mongkok.Mongkok, Kowloon, Hong Kong.
We rely on
key supplier Cisco Systems Inc., Nortel Networks Limited and other suppliers to provide equipment, underground cables and other necessary components
in buildingfor the construction and upgrade of our Next Generation Network,
infrastructure, and for our
VOIPVoIP equipment. In order for new subscribers to be able to access our IP-TV services, we must install an IP set-top-box in their homes. We must have an adequate supply of such installation equipment on hand to respond to new customer subscriptions in a timely manner. We purchase all of our IP set-top boxes and other equipment from our suppliers on a purchase order basis and have no long-term contracts. If our suppliers are unable to supply us with these products in a timely manner or the costs of these products increase due to unforeseen causes, this could negatively impact our operating results, especially if we are unable to acquire new subscribers or effectively appropriate our costs on to our customers.
We depend on Cisco Systems, Inc.
Item 5 Operating and other third parties for ongoing supportfinancial review and assistance with respect to maintenance and repairs. We are also dependent on certain Hong Kong rail transport providers to maintain and provide us with access to their infrastructure to support the proper functioning of our equipment and fiber-based backbone.ITEM 5. OPERATING AND FINANCIAL REVIEW AND PROSPECTSprospects
You should read the following discussion together with the rest of this annual report, including the consolidated financial statements and related notes included elsewhere in this annual report. The results discussed below are not necessarily indicative of the results to be expected in any future periods. Since these are our first consolidated financial statements prepared in accordance with IFRSs, pursuant to the transitional relief granted by the SEC in respect of the first-time application of IFRSs, the following is limited to a discussion of our financial condition and results of operations for the years ended August 31, 2009 and 2008, and no comparative information for the year ended August 31, 2007 have been included. For further details, please see “Special Note on Our Financial Information Presented in This Annual Report” above. We are a provider of residential and corporate fixed telecommunications network services in Hong Kong. We offer our customers an integrated suite of broadband Internet access, local
VOIP,VoIP, IP-TV and corporate data services through our self-owned Next Generation Network.
AsOur network covered 1.6 million residential homes pass as of August 31,
2007 we had a total2009, representing approximately 70% of
approximately 683,000 fixed telecommunications network services subscriptions. In addition to providing fixed telecommunications network services, we are a provider of international telecommunications servicesthe population in Hong
Kong. We offer a variety of international telecommunications servicesKong, and
products including direct dial services, international calling cards and mobile call forwarding services. Our total international telecommunications services customer database comprises approximately 2.3 million registered accounts.Our self-owned network is one of the world’s largest Next Generation Networks and is cited as a global reference case by our primary vendors, Cisco Systems, Inc. and Nortel Networks Limited. Our Next Generation Network has a current coverage of 1.4 million home passes, which represents approximately 60% of Hong Kong’s population. The coverage of our network is concentrated in Hong Kong’s most densely populated areas, which reduces our cost of network deployment per home pass.
Unlike other new entrant operators, we operate an “end-to-end” network that transmits data between our subscribers’ premises, our IP network hub sites and our switching centers in Hong Kong.
We also offer international telecommunications services to our FTNS customers and to other carriers’ customers via indirect access. Indirect access allows any pre-registered telecom user in Hong Kong to access our services via our two primary access codes “1666” and “0030”. By dialing our access code, our registered customers can access any destination in the World, allowing us to generate a usage charge.
Factors Affecting Our Results of Operations
Our Revenues
Fixed Telecommunications Network Services. We charge our customers a monthly service charge for each of the fixed telecommunications network services that we provide, and the scalability of our network allows us to sell additional services to our existing customers, for example adding local VOIP or IP-TV services to our current broadband Internet subscribers, with minimal additional network and operating costs. As a result, each new service we add to our existing subscription base contributes significantly to our profitability. We have not generally sold our fixed telecommunications network services bundled together at discounted rates. Instead, we have focused on increasing our subscription base by offering a single service to new subscribers at an attractive entry price. After the customer has begun to use our service, we then try to up-sell additional services to the customer.
In addition to the monthly service charges generated by our fixed telecommunications network business, we also receive interconnection charges from other telecommunications operators in Hong Kong that use our network to deliver their customers’ telecommunications traffic.
As a Fixed Telecommunications Network Services, or FTNS, licensee, HKBN, a wholly-owned subsidiary of the Company, is obliged to provide interconnection services to enable delivery of telecommunications service to customers of different operators, including mobile network operators. Unless an agreement cannot be reached, the rate of such interconnection charges are subject to commercial agreement between interconnecting parties. Since the issuance of its FTNS license, HKBN has been charging mobile network operators for its interconnection services using the available rates under the existing calculation model (fully distributed cost model) for interconnection services between fixed and mobile operators, which are based on historical cost data of PCCW-HKT, the incumbent FTNS operator. We have recognized all such mobile interconnection charges as revenue. As of August 31, 2007, the majority2009, our FTNS business had a subscription base of theapproximately 943,000 subscriptions. In addition, we offer a variety of international telecommunications services, including direct dial services, international calling cards and mobile interconnectioncall forwarding services, in Hong Kong. As of August 31, 2009, our IDD business had a subscription base of approximately 2.4 million registered accounts.
A. Factors affecting our results of operations
Our revenues
Our revenues are derived from two business segments: our FTNS business and our IDD business. Our FTNS business primarily consists of broadband Internet access, local VoIP, IP-TV and corporate data services, while our IDD business primarily consists of direct dial services, international calling cards and mobile call forwarding services.
FTNS business.Revenues from our FTNS business primarily consist of monthly service charges
billed to mobile network operators had not been collected.In May 2004, the Telecommunications Authority confirmed that mobile network operators are obliged to pay interconnection charges to HKBN in accordance with the charging principles promulgatedpayable by the Telecommunications Authority. Certain mobile network operators, however, disputed the basis of our calculation. In August 2004, to resolve our dispute with one mobile network operator, we asked the Telecommunications Authority to make a determination on the level ofsubscribers and interconnection charges payable by such mobile network operator to HKBN and the effective date of the determined interconnection charges.
In November 2005, HKBN entered into contractual agreements with two other mobile network operators, who agreed to pay to HKBN on interim mobile interconnection charges at a rate based on PCCW-HKT’s published fully distributed cost model of HK$0.0436 per occupancy minute until the Telecommunications Authority issued its final ruling.
In March 2006, the Telecommunications Authority, or TA, made a confidential preliminary analysis (the “2006 PA”) on the Determination with respect to the rates of mobile interconnection charges payable by mobile operators under dispute and the timing of the Determination. The final level of mobile interconnection charges was then subject to the Determination to be issued by TA. As a result of the foregoing, in fiscal 2006, we recognized mobile interconnection charges of HK$46.7 million, which included mobile interconnection charges for fiscal 2005 previously not recognized due to the uncertainties existing at that time and charges for fiscal 2006, both of which were measured based on the 2006 PA.
In March 2007, the TA issued a revised confidential preliminary analysis (the “2007 PA”) which superseded the 2006 PA. The 2007 PA set out the rates of mobile interconnection charges, which are different from those rates stated in the 2006 PA. In June 2007, the TA issued a final determination (the “Final Determination”) which set out the rates of mobile interconnection charges payable by the mobile operator under dispute, which approximate the rates stated in the 2007 PA.
Based on the Final Determination, we recorded mobile interconnection charges of HK$40.9 million in fiscal 2007 which include charges for the current fiscal year and additional charges for fiscal 2005 and 2006 previously measured based on the 2006 PA. We have also reversed a portion of the provision for doubtful accounts for mobile interconnection charges receivables of HK$9.4 million based on the amount we expected to collect for billings outstanding through August 31, 2007.
International telecommunications.
Our total international telecommunications services customer database comprises approximately 2.3 million registered accounts. During fiscal 2007, we experienced a reduction in total traffic volume of 16.4% to 659 million minutes. Competition during the year was intense as some of our integrated competitors offered free or very low cost international direct dial minutes as a customer incentive to gain local fixed line and mobile market share. Further, technology substitution from global VOIP providers such as Skype, which offer free PC-to-PC based international calls, is also becoming more prevalent. As a consequence of reduced minutes and lower revenues per minute, our total international telecommunications revenues decreased by 22.4% to HK$324.5 million in fiscal 2007.
operators.
| - | | Monthly service charges.We charge our subscribers a monthly service charge, which generally varies by the number and nature of the fixed telecommunications network services subscribed. Our strategy is to market additional services to our subscribers by leveraging our broadband Internet access subscription base of 391,000 as of August 31, 2009 and the scalability of our Next Generation Network. |
|
| - | | Interconnection charges.We offer fixed telecommunications network services through our self-owned Next Generation Network. Under the terms of HKBN’s fixed telecommunications network services license, we are required to provide interconnection services to other network operators, including mobile network operators. Because certain local mobile network operators disagreed with the level of interconnection charges computed by us, certain amount of these charges had not been collected as of August 31, 2009. |
IDD business.Substantially all of our international telecommunications revenues are generated by the per minute tariff rate that we chargefrom our IDD customers. For eachbusiness consists of our 1666 and 0030 calling plans, these charges vary according totariffs, which generally varies by the destination of the call and we also provide certainthe calling prefix, with discounts that dependdepending on the time of day or day of the week at whichwhen the call is placed.
27
Our Expensesoperating expensesNetwork Costs. Network costs vary according to either our network capacity or our traffic volume. Such costs mainly include leased line rentals, program fees and production costs for the IP-TV service and costs of inventories sold, local interconnection charges payable to other local fixed network operators and interconnection charges payable to international bandwidth providers and do not include depreciation charge which is included in general and administration expenses.
Other Operating Expenses.We have incurred significant operating costs related to our efforts to promote our broadband Internet access, local VOIP, IP-TV and corporate data services. As a result, our sales and marketing costs in subscription acquisition activities have been relatively high. We expect that we will be required to continue to invest significant financial and human resources in our sales and marketing efforts as we strive to build our subscription base, particularly as we work towards enhancing our brand value.
Other
Our operating expenses include salaries and related costs, office, general and administrativeconsist of network costs and other operating expenses.
| • | | Network costs.Network costs vary according to either our network capacity or our traffic volume. Such costs mainly include leased line rentals, program fees and production costs for our IP-TV services and interconnection charges payable to other local fixed network operators and international bandwidth providers. Network costs do not include depreciation charge, which is included in other operating expenses. |
|
| • | | Other operating expenses.Other operating expenses mainly consist of staff costs, advertising and marketing expenses, depreciation of owned fixed assets. |
| - | | Staff costs. Salaries and related costs incurred for services rendered by employees. |
|
| - | | Advertising and marketing expenses.Due to our efforts in promoting our FTNS services, our advertising and marketing expenses incurred in connection with subscription acquisition activities have been relatively high. We expect that we will be required to continue to invest significant financial and human resources in our sales and marketing efforts as we strive to build our subscription base and to enhance our brand value. |
|
| - | | Depreciation.Depreciation is calculated to write off the cost of fixed assets less their estimated residual value, if any, using straight line method over their estimated useful lives. We expect that we will continue to invest in our Next Generation Network to expand our network coverage. In addition, any technological advancement or obsolescence might affect the estimated useful lives of our fixed assets. |
Critical accounting policies
The following discussion and amortization. Salaries and related costs include those employees workinganalysis is based on our various service offerings and on maintaining and operating our Next Generation Network.Critical Accounting Policies
Introduction
Our consolidated financial statements, which have been prepared in accordance with HKFRSs. Accounting principles generally accepted in Hong Kong differ in certain significant respects from accounting principles generally accepted inIFRSs for the United States of America (“U.S. GAAP”), details of which are set out in note 29 to our consolidated financial statements.fiscal years ended August 31, 2008 and 2009. Our significant accounting policies are more fully described in note 21 to our consolidated financial statements.
The preparation of our
consolidated financial statements in conformity with
HKFRSsIFRSs requires management to make estimates and judgments that affect the reported amounts of assets, liabilities, revenues and expenses and the disclosure of contingent assets and liabilities. We continually evaluate our estimates and judgments including those related to fixed assets, provision for doubtful accounts, deferred taxes, USC charges and certain revenue items. We base our estimates and judgments on historical experience and on various other factors we believe to be reasonable under the circumstances. This forms the basis for making judgments about the carrying values of assets and liabilities that are not readily apparent from other sources. Actual results may differ from these estimates as facts, circumstances and conditions change. The estimates and underlying assumptions are reviewed on an ongoing basis.
RevisionsChanges to accounting estimates are recognized in the period in which the estimate is
revisedchanged if the
revisionchange affects only that period or in the period of the
revisionchange and future periods if the
revisionchange affects both current and future periods.
Our accounting policies have been developed over many years as the telecommunications industry and generally accepted accounting principles have evolved. As our financial statements are prepared under
HKFRSs,IFRSs, our accounting policies are necessarily compliant with all aspects of
HKFRSs. HKFRSs isIFRSs. IFRSs are based on a “substance over form” conceptual framework that requires us to look through the legal interpretation of an arrangement or transaction to its underlying purpose and to reflect it in our
consolidated financial statements on that basis.
In developing accounting policies, in addition to HKFRSs requirements, we also consider telecommunications industry practice in other countries. Where there is no conflict with HKFRSs we also align our accounting policies with U.S. GAAP. In all material respects our accounting policies are applied consistently across City Telecom. The critical accounting policies discussed below generally apply to all segments of City Telecom.
The following are the most significant accounting estimates and judgments we apply in producing our consolidated financial statements.
Revenue recognition
Revenue for the provision of telecommunications services is recognized when an arrangement exists, service is rendered, fee is fixed or determinable and collectability is probable. Revenue received in advance is deferred and recognized as revenue on a straight-line basis over the stated period of time in the subscriber agreement.
A portion of revenue from our FTNS business is derived from network interconnection charges. Network interconnection charges are recorded as revenue based on usage of our fixed telecommunications network by mobile and other fixed telecommunications network operators. The determination of the rates on mobile interconnection charges at which revenue is recognized involved significant estimates by management. Significant changes in management estimates may result in material revenue adjustments.
Prior to April 27, 2009, mobile network operators were obliged to pay interconnection charges to us in accordance with the charging principles promulgated by the Telecommunications Authority. Because certain local mobile network operators disagreed with the level of charges computed by us, certain amount of the mobile interconnection charges billed by us had not been collected as of August 31, 2009. We recognize revenue related to mobile interconnection charges at amounts we believe to be realizable after consideration of the uncertainty regarding the timing and amount of the ultimate collection of amounts due. Specifically:
28
| • | | The amount recognized for fiscal 2004 and before was determined using the available rates under the then-existing calculation model (fully distributed cost model) for interconnection service between fixed and mobile operators, which are based on historical cost data of PCCW-HKT Telephone Limited. In May 2004, the Telecommunications Authority confirmed that mobile network operators are obliged to pay interconnection charges to us in accordance with the charging principles promulgated by the Telecommunications Authority. A number of mobile network operators, however, disputed the basis of our calculation. In August 2004, we requested the Telecommunications Authority to make a determination (the “2004 Determination”) on the level of mobile interconnection charges payable by one of the mobile network operators to us and the effective date of the determined mobile interconnection charges. |
|
| • | | The amount recognized in fiscal 2005 reflected a discount from the amounts billed which was determined based on our assessment of the range of likely outcomes of the 2004 Determination. In November 2005, we entered into contractual agreements with one of the mobile network operators who agreed to pay interim mobile interconnection charges at a rate based on PCCW-HKT’s published fully distributed cost model of HK$0.0436 per occupancy minute until the Telecommunications Authority issued its final ruling. |
|
| • | | The amount recognized in fiscal 2006 was based on the preliminary rates published by the Telecommunications Authority in March 2006 as we awaited a final ruling by the Telecommunications Authority on the 2004 Determination. |
|
| • | | The amount recognized in fiscal 2007 was based on the 2004 Determination issued by the Telecommunications Authority in June 2007, which set out the rates of mobile interconnection charge payable by the mobile operator under dispute for interconnection services provided by us for the period from April 1, 2002 to August 31, 2004. |
|
| • | | The amount recognized in fiscal 2008 was based also on the 2004 Determination issued by the Telecommunications Authority in June 2007. In February 2008, we requested the Telecommunications Authority to make a new determination with four mobile operators on the rates of mobile interconnection charge and interest thereon. We subsequently entered into contractual agreements with some of these mobile operators, which agreed to pay mobile interconnection charges based on the 2004 Determination for the period from April 1, 2002 to August 31, 2004 and with respect to the period after August 31, 2004 at the interim rates stated in the agreements, which will be adjusted based on further determination to be issued by the Telecommunications Authority. |
|
| • | | The amount recognized in fiscal 2009 was based also on the 2004 Determination issued by the Telecommunications Authority in June 2007. In September 2008, the Telecommunications Authority indicated that it accepted our request for determination on the rate of mobile interconnection charge for the period from April 1, 2002 to April 26, 2009 payable by the mobile operators that have not reached contractual agreements with us, and the rate for period from September 1, 2004 to April 26, 2009 payable by those mobile operators that have reached contractual agreements with us and the interest thereon (the “2008 Determination”). On November 25, 2009, the Telecommunications Authority issued a Preliminary Analysis in relation to the 2008 Determination. As of December 15, 2009, the 2008 Determination is still in process. |
For a discussion of our revenue recognition of mobile interconnection charges, please refer to note 2(c) to our consolidated financial statements. Actual amounts realized could be different from our estimate.
Useful lives of fixed assets We estimate the useful lives of fixed assets in order to determine the amount of depreciation expense to be recorded. The useful
lives arelife of an asset is estimated at the time the asset is acquired based on historical experience, the expected usage, wear and tear of the
assets,asset, as well as technical obsolescence arising from changes in the market demands or service output of the
assets.asset. Changes in technology or industry conditions may cause the estimated period of use or the value of these assets to change.
We started providing broadband Internet access service in 2000 and substantially completedperform periodic reviews to confirm the constructionappropriateness of the fibre backbone network in fiscal 2005. With only a short history of operating the broadband business, we assessed the estimated economic useful lives for each class of our networkfixed assets. For the two years ended August 31, 2009, no changes in assets based on our knowledge and expected usage at that time. As we have gained more experience and knowledge of the broadband business, our expected usage of the assets and the impact of certain new telecommunication technologies indicated that we should re-evaluate the estimated useful lives of our network assets.
During the second half of fiscal 2007, we reviewed the estimated useful lives of fixed assets based on technology considerations, actual business experience, consultation with internal experts and external valuation firm and industry benchmarks. Based on such review, certain classes of network assets are expected to operate beyond their original estimated useful lives and as such the estimated useful lives of the fibre network and related peripherals have been revised from 4-15 years to 6-20 years effective from June 1, 2007.recorded.
29
The change in the estimated useful lives is a change in accounting estimate that is accounted for prospectively from June 1, 2007. As a result of such change, the depreciation expense decreased by HK$15.9 million, and both income before taxation and net income after taxation increased by HK$15.9 million for fiscal 2007. The increase in net income resulted in a HK$2.6 cents increase in both basic earnings per share and diluted earnings per share. This change also increased each of total assets, retained profits and total shareholders’ equity for fiscal 2007 by HK$15.9 million.
Impairment of fixed assets Under
HKFRSs and U.S. GAAP,IFRSs, if a triggering event occurs indicating that the carrying amount of an asset may not be recoverable, a new assessment of the carrying amount of that asset is required. Triggering events include significant adverse changes in the market value of an asset, changes in the business or regulatory environment, or certain legal events. The interpretation of such events requires judgment from the management with respect to whether such an event has occurred and whether
the management feels that reassessment of the carrying value of the asset is required. If an event occurs that could affect the carrying value of the asset and
the management does not identify it as a triggering event and identify the asset as impaired, future operations could be adversely affected if this asset is subsequently written off or sold for less than its carrying value due to sudden downturns in the business environment.
Upon the occurrence of triggering events, the carrying amounts of fixed assets are reviewed to assess whether their recoverable amounts have declined below their carrying amounts. Under
HKFRSs,IFRSs, the recoverable amount is the present value of estimated net future cash flows which we expect to recover from the future use of the asset, plus the asset’s residual value on disposal, discounted at the financial asset’s original effective interest rate. Where the recoverable amount of fixed and other long-lived assets is less than their carrying value, an impairment loss is recognized to write down the assets to their recoverable amount, which is based on the fair value or discounted estimated cash flows.
Under U.S. GAAP, recoverability of assets is measured by a comparison of the carrying amount of an asset to estimated undiscounted future cash flows, an impairment charge is recognized by the amount by which the carrying amount of the asset exceeds the fair value of the asset which is the amount the asset can be bought and sold in a current transaction between willing parties.
Estimation of cash flows arising from future use of the asset requires careful analysis regarding what we expect to recover from its future use. This includes consideration of our target market share and
customersubscription base, market competition, future changes to our cost structure and technological change. In addition, the residual value of the asset on disposal requires judgment, as the estimated fair value of the asset at the time of disposal could change in response to market conditions and changes in expected use of the asset prior to disposal. Changes in the estimate of cash flows arising from expected future use of the asset or its residual value on disposal — based on changes in market conditions, changes in the use of assets, management plan, foreseeable technological changes or otherwise — could significantly change the calculation of the fair value or recoverable amount of the asset and the resulting impairment loss. This in turn could significantly affect the results of our operations.
For the
three fiscaltwo years ended August 31,
2007, except for investment property,2009, no impairment
loss was recognized based on the estimated recoverable amount of our long-lived assets. The Company has assessed the open market value of the investment property and based on such assessment, the carrying amount hasfixed assets have been
written down by HK$1.1 million for the year ended August 31, 2006. There was no difference between HKFRSs and U.S. GAAP in the accounting for the impairment in our investment property because the investment property represents the lowest level at which cash flows can be identified that are largely independent of the cash flows of other asset groups and its carrying value before the recognition of an impairment loss was higher than its recoverable amount.recognized.
Accounts Receivablereceivable Under
HKFRSs and U.S. GAAP,IFRSs, provision is made against accounts receivable to the extent they are considered to be doubtful. This provision requires judgment regarding the
collectibilitycollectability of certain receivables both as they are incurred and as they age. We
determineassess bad debt
provisionsprovision by type of customers, namely residential, corporate and carrier, based on past experience of recovery of old receivables, the aging of the accounts receivable balance and historical write-off experience. Certain receivables may be initially identified as collectible, yet subsequently become uncollectible and result in a subsequent write-off of the related receivable to the consolidated statement of operations. Changes in the
collectibilitycollectability of accounts receivable for which provisions are not made could affect our future results of operations.
Included in the accounts receivable balance (net of
provisionallowance for doubtful
accounts) aredebts) were receivables for mobile interconnection charges of HK$
49.8 million, HK$62.171.9 million and HK$
103.868.8 million as of August 31,
2005, 20062008 and
2007,2009 respectively. The balance represented mobile interconnection charges we billed to the local mobile network operators, and
the majoritysome of
which, however,these charges had not been collected.
Changes in the
provisionallowance for doubtful
accountsdebts consist of:
| | | | | | | | | |
| | | Year ended August 31, | |
| | | 2005 | | | 2006 | | | 2007 | |
| | | (Thousands of HK$) | |
Balance at beginning of the year | | 22,959 | | | 48,316 | | | 55,745 | |
Additions charged to expense(1)(2) | | 35,445 | | | 17,450 | | | 15,973 | |
Revesals | | — | | | — | | | (9,404 | ) |
Write-off(2) | | (10,088 | ) | | (10,021 | ) | | (39,922 | ) |
| | | | | | | | | |
Balance at the end of the year | | 48,316 | | | 55,745 | | | 22,392 | |
| | | | | | | | | |
(1) | Provision for doubtful accounts as at August 31, 2005 and 2006 includes provision for mobile interconnection charges receivables of HK$19.5 million and 20.8 million respectively (For more information regarding our provision for mobile interconnection charges, see “Our Revenues—Fixed Telecommunications Network Services” above in this annual report.). |
(2) | Following the TA’s Final Determination issued in June 2007, the Company has reversed HK$9.4 million of the provision for doubtful accounts previously recognized for mobile interconnection charges to the consolidated statement of operations and has written off the remaining balance of the provision of HK$11.4 million against the accounts receivable relating to mobile interconnection charges. |
| | | | | | | | | |
| | | For the year ended August 31, | |
| | | 2008 | | | 2009 | |
| | | HK$ | | | HK$ | |
| | | (Amounts in thousands) | |
| Balance at beginning of the year | | | 22,392 | | | | 11,944 | |
| Additions charged to expense | | | 14,293 | | | | 12,103 | |
| Write-off | | | (24,741 | ) | | | (20,887 | ) |
| | | | | | | |
| | | | | | | | | |
| Balance at the end of the year | | | 11,944 | | | | 3,160 | |
| | | | | | | |
Deferred TaxationtaxationUnder HKFRSs, we
We recognized deferred tax assets for all deductible temporary differences and operating loss carry forwards to the extent it is probable that future taxable profits will be available against which the asset can be utilized.
In assessing whether a deferred tax asset is expected to be utilized in the foreseeable future, we considerour management considers all available evidence, including projected future taxable profit by taking into consideration of the effect of our capital expenditures and other plans, such as the existing network capacity, technological changes, future market trends and projected fixed network coverage.
30
Under U.S. GAAP, a valuation allowance against deferred tax assets is recorded if we determine it is more likely than not that we will not be able to utilize such benefits in the future.
The recognition of deferred tax assets requires judgment regarding the results of future operations, including the assumption that there will be sufficient future operations to allow us to utilize the related deferred tax asset.
Our management projects future taxable income by considering all available information, including tax planning strategies, historical taxable incomes, and the expiration period of the unused tax losses carry forwards of each of the Company and its subsidiaries. During the year ended August 31, 2008, taking into consideration of the current results of operations, our management assessed that it was probable that sufficient future taxable profits would be generated to utilize the unused tax losses of HK$159.6 million, which resulted in the recognition of deferred tax assets of HK$26.3 million. As at August 31, 2008 and 2009, we had not recognized deferred tax assets in respect of unused tax losses of HK$8.2 million and HK$9.5 million respectively, because it was not probable that future taxable profits could be generated to utilize the tax losses. All tax losses are subject to agreement with local tax authorities. Any changes in the estimate of future operations could change the recognition of
suchour deferred tax assets, which could significantly affect
theour results of
our operations.
A change in judgment regarding the likelihood of the generation of future taxable income necessary to realize deferred tax assets could result in a change in the valuation allowance on deferred tax assets which would impact our results under both HKFRSs and U.S. GAAP.
Our management makes their best estimates for
the universal service contribution charges,
of theor USC, payable to PCCW-HKT in order to fund the
costs of network development
costs incurred by PCCW-HKT in remote areas in Hong
Kong (the “Development”).Kong. Such estimated costs are included as part of our costs of rendering services. The estimate is made based on the provisional rates announced by the Telecommunications Authority and is effective up to the date of the release of our
consolidated financial statements. The Telecommunications Authority periodically reviews the actual costs incurred by PCCW-HKT in the
Developmentdevelopment and adjusts the amounts owed to PCCW-HKT, or to be refunded by it, to the respective USC contributing parties, including
our company (the “Rate Revisions”).us. Accordingly, the estimate made by our management
for a financial year is subject to changes based on the
Rate Revisions identified during a financial year andrevisions published by the Telecommunications Authority up to the date prior to the release of our
consolidated financial statements. We adjust such differences as an addition to, or reduction of, the corresponding costs of services in that particular reporting period.
Any sum received in advance from PCCW-HKT as an estimated refund of USC on a provisional basis, which is subject to the final confirmation and determination of the Telecommunications Authority, is recorded in other payables and accrued charges in our balance sheet.
Revenue RecognitionRevenue for the provision of telecommunications services is recognized when an arrangement exists, service is rendered, fee is fixed or determinable and collectibility is probable. Revenue received in advance is deferred and recognized as revenue on a
straight-line basis over the stated period of time in the subscriber agreement. Network interconnection charges are recorded as revenue based on usage of the fixed telecommunications network of the Company by mobile and other fixed telecommunications network operators. The determination of the rates on mobile interconnection charges at which revenue is recognized involved significant estimates by management. Significant changes in management estimates may result in material revenue adjustments.
Mobile network operators are obliged to pay interconnection charges to HKBN in accordance with the charging principles promulgated by the Telecommunications Authority. Because certain local mobile network operators disagreed with the level of charges computed by HKBN, the majority of the mobile interconnection charges billed by HKBN had not been collected as of August 31, 2007. We recognize revenue related to mobile interconnection charges at amounts we believe to be realizable after consideration of the uncertainty regarding the timing and amount of the ultimate collection of amounts due. The amount recognized for the fiscal 2004 or before was determined using the available rates under the existing calculation model (fully distributed cost model) for interconnection service between fixed and mobile operators, which are based on historical cost data of PCCW-HKT Telephone Limited. The amount recognized in fiscal year 2005 reflects a discount from the amount billed which is determined based on our assessment of the range of likely outcomes from the determination process. The amount recognized in fiscal year 2006 is based on the preliminary rates from the Telecommunications Authority as we await a final ruling by the Telecommunications Authority on the level of charges payable by one of the operators. The amount recognized in fiscal year 2007 is based on the final determination which set out the rates payable by a mobile operator under dispute. For a discussion of our revenue recognition of mobile interconnection charges, please refer to “Our Revenues-Fixed Telecommunications Network Services” above in this Item 5 of this annual report and notes 25(c) to our consolidated financial statements. Actual amounts realized could be different from our estimate.
Fair value of share options
In assessing the value of the share options granted, Black-Scholes option pricing model (the “Black-Scholes Model”) has been used. The Black-Scholes Model is one of the most generally accepted methodologies used to calculate the value of options and the assumptions used in the Black-Scholes Model include expected life of the options, risk-free interest rate, expected volatility, expected dividend yield and the market value of the ordinary shares of the Company.
The Black-Scholes Model, applied for determination of the estimated fair value of the share options granted under the Company’s share option scheme was developed for use in estimating the fair value of traded options that are fully transferable and have no vesting restrictions. Such an option pricing model requires input of assumptions, including the expected stock volatility, and expected dividend yield. As the Company’s share options have characteristics significantly different from those of traded options, the determination of fair value of the options granted is sensitive to certain assumptions used in the valuation model, in particular the expected volatility.
Legal contingencies
We are currently involved in certain legal proceedings. The assessment of the ultimate outcome of those proceedings is derived from consultation with outside counsel, as well as an assessment of litigation and settlement strategies. A future event or change in the facts and circumstances may require us to make accruals which would be charged to our income statement in the future.
A. Operating Results
In addition to our operations in Hong Kong, we also provide international telecommunications and Internet access services in Canada. We own all of the share capital of two telecommunications companies in Canada, City Telecom Inc. and City Telecom (B.C.) Inc., through a wholly owned subsidiary. We acquired our interests in these companies in December 1998 as part of our efforts to increase our market share of the telecommunications traffic between Canada and Hong Kong.
Our consolidated financial statements reflect the consolidated results of operations and financial position of these subsidiary companies from the date of their acquisition by us. However, as of August 31, 2007, none of these subsidiary companies located outside of Hong Kong has made a material contribution to our revenues or results of operations, and in fiscal 2007, they contributed approximately 1.8% to our revenues.
The following table sets forth, for the years indicated, a summary of our results of operations.
| | | | | | | | | | | | | |
| | | For the year ended August 31, | |
| | | 2008 | | | 2009 | | | 2009 | |
| | | HK$ | | | HK$ | | | US$ | |
| | | (Amounts in thousands) | |
| Revenue | | | | | | | | | | | | |
| FTNS business | | | 1,011,038 | | | | 1,230,880 | | | | 158,813 | |
| IDD business | | | 291,943 | | | | 247,359 | | | | 31,915 | |
| | | | | | | | | | |
| | | | | | | | | | | | | |
| | | | 1,302,981 | | | | 1,478,239 | | | | 190,728 | |
| | | | | | | | | | |
| | | | | | | | | | | | | |
| Network costs | | | (178,367 | ) | | | (175,129 | ) | | | (22,596 | ) |
| | | | | | | | | | | | | |
| Other operating expenses | | | (966,094 | ) | | | (1,037,964 | ) | | | (133,922 | ) |
| | | | | | | | | | | | | |
| Other revenues | | | 24,989 | | | | 41,540 | | | | 5,359 | |
| | | | | | | | | | | | | |
| Finance costs | | | (75,137 | ) | | | (55,127 | ) | | | (7,112 | ) |
| | | | | | | | | | | | | |
| | | | | | | | | | |
| | | | | | | | | | | | | |
| Profit before taxation | | | 108,372 | | | | 251,559 | | | | 32,457 | |
| Income taxes benefit/(expense) | | | 16,818 | | | | (38,730 | ) | | | (4,997 | ) |
| | | | | | | | | | |
| | | | | | | | | | | | | |
| Net income | | | 125,190 | | | | 212,829 | | | | 27,460 | |
| | | | | | | | | | |
31
| | | | | | | | | | | | |
| | | Year Ended August 31, | |
| | | 2005 | | | 2006 | | | 2007 | | | 2007 | |
| | | HK$ | | | HK$ | | | HK$ | | | US$ | |
| | | (In thousands) | |
HKFRSs | | | | | | | | | | | | |
Revenues | | | | | | | | | | | | |
Fixed telecommunications network services | | 629,464 | | | 716,600 | | | 816,800 | | | 104,761 | |
International telecommunications | | 532,595 | | | 418,276 | | | 324,470 | | | 41,616 | |
| | | | | | | | | | | | |
| | 1,162,059 | | | 1,134,876 | | | 1,141,270 | | | 146,377 | |
| | | | | | | | | | | | |
Operating Expenses: | | | | | | | | | | | | |
Network costs | | (339,402 | ) | | (300,593 | ) | | (214,591 | ) | | (27,523 | ) |
Other operating expenses | | | | | | | | | | | | |
Salaries and related costs | | (259,392 | ) | | (256,721 | ) | | (221,102 | ) | | (28,358 | ) |
Sales and marketing expenses | | (267,983 | ) | | (204,952 | ) | | (219,253 | ) | | (28,121 | ) |
Office, general and administrative expenses | | (157,497 | ) | | (164,208 | ) | | (129,077 | ) | | (16,555 | ) |
Depreciation and amortization | | (237,714 | ) | | (276,464 | ) | | (258,103 | ) | | (33,104 | ) |
Provision for doubtful accounts | | (35,445 | ) | | (17,450 | ) | | (6,569 | ) | | (843 | ) |
| | | | | | | | | | | | |
Total other operating expenses | | (958,031 | ) | | (919,795 | ) | | (834,104 | ) | | (106,981 | ) |
| | | | | | | | | | | | |
Total Operating Expenses | | (1,297,433 | ) | | (1,220,388 | ) | | (1,048,695 | ) | | (134,504 | ) |
| | | | | | | | | | | | |
Income/(loss) from operations | | (135,374 | ) | | (85,512 | ) | | 92,575 | | | 11,873 | |
Interest income | | 13,578 | | | 20,378 | | | 22,671 | | | 2,908 | |
Interest expense | | (54,462 | ) | | (88,637 | ) | | (87,504 | ) | | (11,223 | ) |
Other income, net | | 6,037 | | | 4,465 | | | 3,149 | | | 404 | |
| | | | | | | | | | | | |
Income/(loss) before taxation | | (170,221 | ) | | (149,306 | ) | | 30,891 | | | 3,962 | |
Income taxes (expense)/credit | | 6,725 | | | 7,244 | | | (2,026 | ) | | (260 | ) |
| | | | | | | | | | | | |
Net income/(loss) | | (163,496 | ) | | (142,062 | ) | | 28,865 | | | 3,702 | |
| | | | | | | | | | | | |
Year Ended August 31, 2007
Fiscal 2009 Compared to Year Ended August 31, 2006Fiscal 2008
Revenues. Our total revenuesRevenues increased by
0.6%13.4% to HK$
1,141.31,478.2 million in fiscal
2007. The 22.4% decline in our international telecommunications services revenues to2009 from HK$
324.5 million1,303.0 in fiscal
2007 offset our 14.0%2008, reflecting an increase in
FTNS revenues to HK$816.8 million in fiscal 2007.Our fixed telecommunications network services continued to record significant revenue growth and increased their contribution to our total revenues, accounting for 71.6% of total revenues in fiscal 2007, compared to 63.1% and 54.2% in fiscal 2006 and fiscal 2005, respectively. During fiscal 2007, our FTNS subscription base increased 10.7% to 683,000. This return to growth is an indicator that the market has now accepted a premium pricing positioning.
With respect to voice services, our VOIP subscription base rose by 9.6%, to 308,000 subscriptions due to improved branding and crossing selling from our broadband customers.
With respect to broadband services, our subscription base rose by 12.3%, to 247,000 subscriptions. During fiscal 2007, we focused on differentiating our services by emphasizing our ultra high Internet access speeds, which allow us to increase our average revenue per user. By providing stable and high speed broadband services and reliable customer service, we aim to acquire and retain customers with longer subscription period at higher price. This has significantly increased our revenue from our fixed telecommunications network services.
With respectFTNS business, the effects of which were partially offset by a decrease in revenue from our IDD business. Revenue contribution from our FTNS business increased to IP-TV services, our subscription base increased by 10.3% to 128,000 subscriptions, with the majority of the new subscriptions coming from existing broadband and voice customers.
Our international telecommunications business revenues decreased by 22.4% to HK$324.5 million83.3% in fiscal 2007 due to the combined effects of lower volumes and lower revenue per minute. Competition during the year was intense as some of our integrated competitors offered international direct dial minutes for free or at very low cost as a marketing incentive to gain local fixed line and mobile market share. Further, technology2009 from global VOIP providers such as Skype, which offer free PC-to-PC based international calls, is also becoming more prevalent.
77.6% in fiscal 2008.
| • | | FTNS business.Revenues from our FTNS business increased by 21.8% to HK$1,230.9 million in fiscal 2009 from HK$1,011.0 million in fiscal 2008. The increase was primarily caused by an increase of 17.7% of our FTNS subscription base to 943,000 as of August 31, 2009 from 801,000 as of August 31, 2008 and, to a lesser extent, an increase in the average revenue per user for our Internet access services. We believe that there was growing market acceptance of premium pricing in fiscal 2009. |
| o | | Broadband Internet access.The subscription base for our Internet access services increased by 23.7%, to 391,000 as of August 31, 2009 from 316,000 as of August 31, 2008. During fiscal 2009, partly as a result of our success in differentiating our services by emphasizing our ultra high Internet access speed, we were able to acquire and retain customers who are willing to enter into subscription contracts with a long service period. Revenues from our Internet access services increased as a result. |
|
| o | | Local VoIP.The subscription base for our local VoIP services rose by 16.1%, to 382,000 as of August 31, 2009 from 329,000 as of August 31, 2008, mainly due to improved branding and our greater success in cross selling our VoIP services to subscribers of our Internet access services. |
|
| o | | IP-TV.The subscription base for our IP-TV services increased by 9.0% to 170,000 subscriptions, with the majority of the new subscriptions coming from existing subscribers of our Internet access and local VoIP services. |
| | | Also as included in revenue from our FTNS business were mobile interconnection charges of HK$20.6 million in fiscal 2009. The mobile interconnection charges in fiscal 2009 decreased by 30.5% compared to fiscal 2008 due to the withdrawal of regulatory guidance on FMIC in favor of Mobile Party’s Network Pay on April 26, 2009. Prior to April 26, 2009, the mobile network operators were required to pay interconnection charges for all calls originating to and from the mobile users. After April 26, 2009, the chargeability of interconnection charges is subject to commercial negotiation. |
|
| • | | IDD business.Revenues from our IDD business decreased by 15.3% to HK$247.4 million in fiscal 2009 from HK$292.0 million in fiscal 2008. The decrease was primarily due to the reduction in IDD traffic volume. Competition during the fiscal year was intense as some of our integrated competitors offered international direct dial minutes for free or at very low cost as a marketing incentive to gain local fixed line and mobile market shares. Further, technology from global VoIP providers such as Skype, which offer free PC-to-PC based international calls, was also becoming more prevalent. |
Network costs.Network costs decreased by
28.6%1.8% to HK$
214.6175.1 million in fiscal
20072009 from HK$178.4 million in fiscal 2008 mainly due to a reduction in
international tariff volume and less reliancecarrier costs as IDD traffic decreased. The effects of the foregoing, however, were partially offset by the recovery of HK$7.6 million universal services contribution charges from PCCW-HK in fiscal 2008 pursuant to the TA Statement issued by the Telecommunications Authority on
third parties backhaul for our FTNS business.December 28, 2007. No similar recovery was recorded in fiscal 2009.
Other operating expenses. Our otherOther operating expenses
excluding network costs, decreasedincreased by
9.3%7.4% to HK$
834.11,038.0 million in fiscal
2007.Salaries and related costs. Salaries and related costs decreased by 16.1% to HK221.12009 from HK$966.1 million in fiscal 2007. During fiscal 2007, we increased our total work force by 4.9% to 2,692 employees due to the expansion of operations in fixed telecommunications network services. The reduction in salaries and related costs was2008 mainly due to the flow over benefits from streamliningfollowing:
Set forth below is a table summarizing the work forcedetails of our other operating expenses in fiscal 2006.2008 and 2009:
| | | | | | | | | | | | | |
| | | For the year ended August 31, | |
| | | 2008 | | | 2009 | | | 2009 | |
| | | HK$ | | | HK$ | | | US$ | |
| | | (Amounts in thousands) | |
| Staff costs | | | (247,460 | ) | | | (302,279 | ) | | | (39,001 | ) |
| Advertising and marketing expenses | | | (307,743 | ) | | | (299,794 | ) | | | (38,681 | ) |
| Depreciation | | | (210,051 | ) | | | (206,241 | ) | | | (26,610 | ) |
| Others | | | (200,840 | ) | | | (229,650 | ) | | | (29,630 | ) |
| | | | | | | | | | |
| | | | | | | | | | | | | |
| Other operating expenses | | | (966,094 | ) | | | (1,037,964 | ) | | | (133,922 | ) |
| | | | | | | | | | |
| • | | Staff costs.Staff costs increased by 22.1% to HK$302.3 million in fiscal 2009 from HK$247.5 in fiscal 2008. We increased our total work force by 4.0% to 3,173 employees as of August 31, 2009 from 3,051 employees as of August 31, 2008, primarily due to the increased scale of operations in our FTNS business and the increasing scope in investing and developing our talents through staff education partnership and talent infinity program. |
|
| • | | Advertising and marketing expenses.Advertising and marketing expenses decreased by 2.6% to HK$299.8 million in fiscal 2009 from HK$307.7 million in fiscal 2008. Our salaries and commissions for our sales and marketing |
32
| | | employees were increased by HK$19.5 million due to increases in total contract sum from substantial growth in subscription base. Moreover, our opening of more new shops caused shop related operating costs increased by HK$11.4 million. The effects of the foregoing, however, were partially offset by a decrease in mass media advertising costs of HK$34.4 million. |
|
| • | | Depreciation.Depreciation decreased by 1.9% to HK$206.2 million in fiscal 2009. Notwithstanding our purchase of additional fixed assets for our network infrastructure as we increased the scale of operations in our FTNS business, a portion of our owned fixed assets were fully depreciated and a lower depreciation expenses was incurred as a result. |
Sales and marketing expenses.Other revenues.Our sales and marketing expensesOther revenues increased
by 6.9% to HK$
219.241.5 million in fiscal
2007 as we increased our sales and marketing efforts in brand building through mass media advertising. We started a strategy of promoting the brand to a wider audience. A series of 1 minute mini programs were shown to educate viewers on the merits of HKBN’s high bandwidth Next Generation Network.Office, general and administrative expenses. Office, general and administrative expenses decreased by 21.4% to2009 from HK$129.125.0 million in fiscal 20072008. The increase was mainly contributed by the gain on extinguishment of our 10-year senior notes of HK$31.4 million, the effects of which were partially offset by a decrease in interest income from HK$15.6 million in fiscal 2008 to HK$4.8 million in fiscal 2009 as a result of last year’s operational efficiency plan and cost savingsthe decrease in our average cash balance in fiscal 2009 mainly due to the decentralization of authority to department heads.
senior notes buyback actions.
Depreciation and amortization.Finance costs. Depreciation and amortization expensesFinance costs decreased by
6.7%26.6% to HK$
258.155.1 million in fiscal
2007 mainly due to changes2009 from HK$75.1 million in
the estimated useful lives of certain assets amounting to HK$15.9 million.During the second half of fiscal 2007, we reviewed the estimated useful lives of fixed assets based on technology considerations, actual business experience, consultation with external valuation firm and industry benchmark. Based on the review, the estimated useful lives of certain classes of network assets have been extended from 4-15 years to 6-20 years effective from June 1, 2007.
The change in the estimated useful lives is a change in accounting estimate that is accounted for prospectively from June 1, 2007. As2008 as a result of such change, depreciation expense decreased by HK$15.9the redemption and cancellation of an aggregate principal amount of US$68.0 million forof our 10-year senior notes from the year ended August 31, 2007. Earning per share is also increased by 2.6 cents. This change does not have any effect on the total depreciation charges of those assets during their remaining useful lives.
Provision for doubtful accounts. Overall, our provision for doubtful accounts decreased to HK$6.6 millionmarket in fiscal 2007 mainly due to the reversal of previously recognized provisions for mobile interconnection charges receivable. In fiscal 2006, we recorded a provision of HK$20.8 million for mobile interconnection charges receivable accumulated from previous years following our assessment of the collectibility of these charges. In fiscal 2007, we have reversed a portion of this provision by HK$9.4 million based on the rates set by the TA in the final determination issued in June 2007. Our provision for other trade receivables recorded in fiscal 2007 was HK$16.0 million compared to the HK$17.5 million in fiscal 2006. For more information regarding our provisions for mobile interconnection charges, see “Our Revenues—Fixed Telecommunications Network Services” above in this annual report.
2009.
Income from operations.tax benefit/(expense).We recorded an income from operationstax expense of HK$92.638.8 million in fiscal 2007,2009, compared to a loss from operationsan income tax benefit of HK$85.516.8 million in fiscal 2006.2008. Included in the income tax benefit in fiscal 2008 was a tax credit of HK$26.3 million related to the deferred tax assets recognized in respect of the tax loss carryforwards of our major operating subsidiary as at August 31, 2008. Based on the results of operations of our major operating subsidiary in recent years and our forecast for future years, we concluded it was probable that the subsidiary would generate sufficient taxable income to utilize the tax loss carryforwards. If such effect was excluded, the income tax expenses increase by HK$29.3 million, which was primarily caused by the increase of our income before taxation.
Net income.For the foregoing reasons, net income increased to HK$212.8 million in fiscal 2009 from HK$125.2 million in fiscal 2008. Net margin increased to 14.4% in fiscal 2009 from 9.6% in fiscal 2008. The
income from operations isincrease in net margin was primarily due to higher revenue contribution from
fixed telecommunications network servicesour FTNS business and the
increasebetter margin achieved in
margin from our
internationalIDD business
services as a result of the
drop off of low margin customers.Interest income and expense. Our interest income was HK$22.7 million in fiscal 2007 compared to HK$20.4 million in fiscal 2006. The increase in interest income was due to a strong net cash inflow from our operations and a favorable interest rate environment. We derive interest income from our deposit of surplus capital in interest-bearing accounts at commercial banks. Our interest expense in fiscal 2007 was HK$87.5 million which is comparable to HK$88.6 million in fiscal 2006. Such interest expense was predominantly due to the interest expense of our 8.75% notes issued in January 2005.
Other income, net. Our other income, net consists of the roaming charges we receive from overseas carriers that deliver traffic over our network, exchange gains and losses and management and other fees we received in the ordinary course of our business. Other income, net of expenses was HK$3.1 million in fiscal 2007 compared to HK$4.5 million in fiscal 2006. The other income, net in fiscal 2007 mainly includes and net realized and unrealized gains on investment securities and derivative financial instruments of HK$1.8 million.
Income tax (expense)/credit. We recognized income tax expense of HK$2.0 million for fiscal 2007 compared to an income tax credit of HK$7.2 million in fiscal 2006. Our income tax expense in fiscal 2007 was mainly due to the tax paid by one of our subsidiaries in Guangzhou. Our income tax credits in fiscal 2006 were mainly related to the recognition of deferred tax assets in respect of the tax losses from our fixed telecommunications network services business offset by the income tax expense associated with the profit generated from our international telecommunications services.
Net income. For the foregoing reasons, we had a net income of HK$28.9 million in fiscal 2007 compared to a net loss of HK$142.1 million in fiscal 2006.
Year Ended August 31, 2006 Compared to Year Ended August 31, 2005
Revenues. Our total revenues decreased by 2.3% to HK$1,134.9 million in fiscal 2006 due to a significant decrease in revenues from our international telecommunications services. The 21.5% decline in our international telecommunications services revenues to HK$418.3 million in fiscal 2006 offset our 13.8% increase in FTNS revenues to HK$716.6 million in fiscal 2006.
Our fixed telecommunications network services continued to record significant revenue growth and increased their contribution to our total revenues, accounting for 63.1% of total revenues in fiscal 2006, compared to 54.2% and 46.3% in fiscal 2005 and fiscal 2004, respectively. During fiscal 2006, our FTNS subscription base declined 2.2% to 617,000 as of August 31, 2006 as we placed a priority on revenue yields by increasing revenue per user over subscription growth.
With respect to voice services, our VOIP subscription base fell by 4.1% year-on-year, to 281,000 subscriptions due to intensive competition.
With respect to broadband services, our subscription base fell by 3.9% year-on-year, to 220,000 subscriptions. During fiscal 2006, we focused on differentiating our services by emphasizing our high internet access speeds, which allow us to increase our revenue per user. By providing stable and high speed broadband services and good quality of customer service, we are able to acquire and retain customers with longer subscription period at higher price. This has significantly increased our revenue in fixed telecommunications network services despite a decrease in our subscription base.
With respect to IP-TV services, we grew our subscription base by 6.4% to 116,000 subscriptions, with the majority of the new subscriptions being an upsell to existing broadband and voice customers.
Our international telecommunications business revenues decreased by 21.5% to HK$418.3 million in fiscal 2006 due to the combined effectsphasing out of lower volumes and lower revenues per minute. Competition during the year was intense as some of our integrated competitors offered international direct dial minutes free or at very low cost as a marketing incentive to gain local fixed line and mobile market share. Further, technology substitution from global VOIP providers such as Skype, which offer free PC-to-PC based international calls, is also becoming more prevalent. As a result, we expect that our international telecommunications business continues to decline in future.
margin customers.
Network costs. Network costs decreased 11.4% to HK$300.6 million in fiscal 2006 mainly due to a reduction in international tariff volume.Other operating expenses. Our other operating expenses, excluding network costs, decreased by 4.0% to HK$919.8 in fiscal 2006.
Salaries and related costs. Salaries and related costs decreased by 1.0% to HK256.7 million in fiscal 2006. During fiscal 2006, we reduced our total work force by 34.2% to 2,565 employees with the majority of the reductions occurring towards the end of the fiscal year. The reduction in our work force was a result of our efforts to eliminate duplication of operational procedures and to enhance efficiency and improve quality of our work flows. The aggregate amount of severance payments made was not significant, as most of the terminations of employment were voluntary.
Sales and marketing expenses.Our sales and marketing expenses decreased by 23.5% to HK$205.0 million in fiscal 2006 as we switched our sales and marketing efforts from costlier mass media advertising to word-of-mouth efforts. Word-of-mouth results from existing customers sharing their positive service experience with their associates, thereby enhancing our brand value without the need for direct advertising expenditure.
Office, general and administrative expenses. Office, general and administrative expenses increased by 4.3% to HK$164.2 million in fiscal 2006 mainly due to increase in rental expenses as a result of inflationary pressures.
Depreciation and amortization. Depreciation and amortization expenses increased by 16.3% to HK$276.5 million in fiscal 2006 mainly due to expansion of our Next Generation Network.
Provision for doubtful accounts. Overall, our provision for doubtful accounts decreased by 50.8% to HK$17.4 million in fiscal 2006 mainly due to the decrease in provision for mobile interconnection charges receivable. In fiscal 2005, we recorded a provision of HK$19.5 million for mobile interconnection charges receivable accumulated from previous years following our assessment of the collectibility of these charges. In fiscal 2006, we increased such provision by HK$1.3 million to HK$20.8 million based on the preliminary rates from the Telecommunications Authority. Provision for other trade receivables recorded in fiscal 2006 was HK$16.1 million which is comparable to the HK$15.9 million in fiscal 2005. For more information regarding our provision for mobile interconnection charges, see “Our Revenues—Fixed Telecommunications Network Services” above in this annual report.
Loss from operations. We suffered loss from operations of HK$85.5 million in fiscal 2006, compared to loss from operations of HK$135.4 million in fiscal 2005. The loss from operations is due to reduced profitability of our international telecommunications business as a result of intense competition from local telecommunications services companies and global VOIP providers and losses from our FTNS business.
Interest income and expense. Our interest income was HK$20.4 million in fiscal 2006 compared to HK$13.6 million in fiscal 2005. The increase in interest income was due to the full year impact of investment return on proceeds from our 8.75% notes issued in January 2005 and a higher overall interest rate environment. We derive interest income from our deposit of surplus capital in interest-bearing accounts at commercial banks. Our interest expense increased to HK$88.6 million in fiscal 2006 compared to HK$54.5 million in fiscal 2005, predominantly due to the full year impact of interest expense of our 8.75% notes issued in January 2005.
Other income, net. Our other income, net consists of the roaming charges we receive from overseas carriers that deliver traffic over our network, exchange gains and losses, small penalties we have received from time to time from contractors that we employ, and management and other fees we receive from other fixed line operators in the ordinary course of our business. Other income, net of expenses was HK$4.5 million in fiscal 2006 compared to HK$6.0 million in fiscal 2005. The other income, net in 2006 mainly includes net exchange gains of HK$1.1 million, net realized and unrealized gains on investment securities and derivative financial instruments of HK$0.6 million and penalty received from contractors of HK$0.3 million.
Income tax( expense)/credit. We recognized income tax credit of HK$7.2 million for fiscal 2006 compared to income tax credit of HK$6.7 million in fiscal 2005. Our income tax credits in fiscal 2006 and fiscal 2005 were mainly related to the recognition of deferred tax assets in respect of the tax losses from our fixed telecommunications network services business offset by the income tax expense associated with the profit generated from our international telecommunications services.
Net loss. For the foregoing reasons, we incurred a net loss of HK$142.1 million in fiscal 2006 compared to a net loss of HK$163.5 million in fiscal 2005.
Year Ended August 31, 2005 Compared to Year Ended August 31, 2004
Revenues. Our total revenues decreased by 0.7% from HK$1,169.9 million in fiscal 2004 to HK$1,162.1 million in fiscal 2005, due to a significant decrease in revenues from our international telecommunications services. The 15.2% decline in our international telecommunications services revenues from HK$628.0 million in fiscal 2004 to HK$532.6 million in fiscal 2005 offset our 16.2% increase in FTNS revenues from HK$541.9 million in fiscal 2004 to HK$629.5 million in fiscal 2005.
Our fixed telecommunications network services continued to record significant revenue growth and increased contribution to our total revenues. Revenue from FTNS accounted for 54.2% of our total revenues in fiscal 2005, compared to 46.3% and 32.6% in fiscal 2004 and fiscal 2003, respectively. Revenues increased from HK$541.9 million in fiscal 2004 to HK$629.5 million in fiscal 2005, representing 16.2% growth. During the year we grew our FTNS subscription base by 166,000, or 35.7% year-on-year, to 631,000 as of August 31, 2005.
With respect to voice services, we grew our VOIP subscription base by 56,000, or 23.6% year-on-year, to 293,000 subscriptions.
With respect to broadband services, we grew our subscription base by 32,000, or 16.2% year-on-year, to 229,000 subscriptions. During fiscal 2005, we focused on differentiating our services by emphasizing our high bandwidth with the commercial launch of our “bb100” and “bb1000” supported by the Liu Xiang advertising campaign. Furthermore, we introduced value-added services such as “bbDrive” (an on-line virtual hard drive with up to 10 Gbps storage), “bbGuard” (an anti-spam and anti-virus package) and “bbWatch” (a full screen IP-TV experience via the PC).
With respect to IP-TV services, we grew our subscription base by 78,000, or 251.6% year-on-year, to 109,000 subscriptions, although the majority of the new subscriptions were from our free trial promotions for periods of six to twelve months.
Our international telecommunications business revenues decreased by 15.2% from HK$628.0 million in fiscal 2004 to HK$532.6 million in fiscal 2005 due to the combined effects of lower volumes and lower revenues per minute. Competition during the year was intense as some of our integrated competitors offered international direct dial minutes free or at very low cost as a marketing incentive to gain local fixed line and mobile market share. Further, technology substitution from global VOIP providers such as Skype, which offer free PC-to-PC based international calls, is also becoming more prevalent.
Network costs. Network costs increased by 2.4% from HK$331.4 million in fiscal 2004 to HK$339.4 million in fiscal 2005. Our fixed telecommunications network costs declined by 3.3% from HK$122.5 million in fiscal 2004 to HK$118.4 million in fiscal 2005. The decline was mainly due to reduction in our backbone expenses as our network became more self-reliant as we continue to roll out self-owned fiber based backbone. International telecommunications network costs increased by 5.8% from HK$208.9 million in fiscal 2004 to HK$221.0 million in fiscal 2005, which was principally due to an increase in sales volume for products offered through CTImall and INCmall.
Other operating expenses. Our other operating expenses, excluding network costs, increased by 20.8% from HK$793.2 million during fiscal 2004 to HK$958.0 million during fiscal 2005.
Salaries and related costs. Salaries and related costs increased by 14.4% from HK$226.7 million during fiscal 2004 to HK$259.4 million during fiscal 2005. Our total number of permanent full time employees increased from 3,583 as of August 31, 2004 to 3,896 as of August 31 2005.
Sales and marketing expenses. Our sales and marketing expenses increased by 17.4% from HK$228.2 million during fiscal 2004 to HK$268.0 million during fiscal 2005. Sales and marketing increased due to several marketing programs that we utilized to grow our FTNS subscription base. We also increased the number of sales and marketing personnel in marketing and servicing our various service offerings and launched a large scale branding campaign for our broadband Internet access and IP-TV services. This investment in sales and marketing was important to the continued expansion of our customer base for fixed telecommunications network services, which we believe will increase our revenues in the future. Additionally, during fiscal 2005 we introduced our “Liu Xiang” series of television, radio and print branding promotions. Liu Xiang is the first Chinese man to win an Olympic gold medal in a track and field event, having secured this honor in the 110 meter hurdles at the 2004 Olympic Games.
Office, general and administrative expenses. Office, general and administrative expenses increased by 21.4% from HK$129.8 million in fiscal 2004 to HK$157.5 million in fiscal 2005 due mainly to our expanded office and warehouse space and higher equipment maintenance costs.
Depreciation and amortization. Depreciation and amortization expenses increased by 20.7% from HK$197.0 million in fiscal 2004 to HK$237.7 million in fiscal 2005 due to the increased capital expenditures that we incurred for the upgrade and expansion of our Next Generation Network.
Provision for doubtful accounts. Our provision for doubtful accounts increased by 208.2% from HK$11.5 million in fiscal 2004 to HK$35.4 million in fiscal 2005, which included a provision of HK$19.5 million for mobile interconnection charge receivables. We recorded a provision of HK$19.5 million for mobile interconnection charges receivable in fiscal 2005 given the uncertainty regarding the timing and amount of the ultimate collection of amounts due. For more information regarding our provision for mobile interconnection charges, see “Our Revenues—Fixed Telecommunications Network Services” above in this annual report. Provision for other trade receivables recorded in fiscal 2005 was HK$15.9 million compared to HK$11.5 million in fiscal 2004. The provision as a percentage of revenue was approximately 1% of our revenue for both years.
Loss from operations. We suffered loss from operations of HK$135.4 million in fiscal 2005, compared to profit from operations of HK$45.3 million in fiscal 2004. The loss from operations is due to reduced profitability of our international telecommunications business, provisions for mobile interconnection charges, increased acquisition and marketing costs for new fixed telecommunications network services subscriptions and early-stage operations of IP-TV services.
Interest income and expense. Our interest income was HK$13.6 million in fiscal 2005 compared to HK$3.8 million in fiscal 2004. We derive interest income from our deposit of surplus capital in interest-bearing accounts at commercial banks. The substantial increase in fiscal 2005 interest income is due to the temporary surplus cash from our US$125 million 8.75% senior notes issued in January 2005. Our interest expense increased to HK$54.5 million in fiscal 2005 compared to HK$0.2 million in fiscal 2004, predominantly due to the interest expense of our 8.75% notes issued in January 2005. We also capitalized our borrowing costs of HK$2.0 million of the funding for our network rollout.
Other income, net. Our other income, net consists of the roaming charges we receive from overseas carriers that deliver traffic over our network, exchange gains and losses, small penalties we have received from time to time from contractors that we employ, and management and other fees we receive from other fixed line operators in the ordinary course of our business. Other income, net of expenses was HK$6.0 million in fiscal 2005 compared to HK$2.7 million in fiscal 2004.
Income tax (expense)/credit. We recorded income tax credit of HK$6.7 million for fiscal 2005 compared to income tax expense of HK$2.0 million during fiscal 2004. Income tax is calculated based on our estimated assessable profit during each period, and our income tax credit in fiscal 2005 was mainly related to the recognition of deferred tax assets on current year’s unrecognized tax losses from our fixed telecommunications network services business that offset by the income tax expense associated with profit generated from our international telecommunications services in fiscal 2005.
Net loss. For the foregoing reasons, we incurred a net loss of HK$163.5 million in fiscal 2005 compared to a net income of HK$49.5 million in fiscal 2004.
U.S. GAAP Reconciliation
Our financial statements are prepared in accordance with HKFRSs, which differs in certain significant respects from U.S. GAAP. The following tables provide a comparison of our net income/(loss) and shareholders’ equity in accordance with HKFRSs and U.S. GAAP
| | | | | | | | | | |
| | | As of and for the Year Ended August 31, |
| | | 2005 (restated) | | | 2006 | | | 2007 | | 2007 |
| | | HK$ | | | HK$ | | | HK$ | | US$ |
| | | (in thousands) |
Net income/(loss) in accordance with: | | | | | | | | | | |
HKFRSs | | (163,496 | ) | | (142,062 | ) | | 28,865 | | 3,702 |
Net income/(loss) under U.S. GAAP | | (149,148 | ) | | (142,062 | ) | | 28,865 | | 3,702 |
| | | | |
Shareholders’ Equity | | | | | | | | | | |
HKFRSs | | 1,020,454 | | | 891,654 | | | 903,882 | | 115,930 |
Total shareholders’ equity under U.S. GAAP | | 1,032,680 | | | 897,271 | | | 909,499 | | 116,650 |
Differences between HKFRSs and U.S. GAAP for the periods presented relate primarily to:
Share-based compensation cost;
Disclosure relating to those differences can be found in note 30 to our consolidated financial statements. In addition, our condensed consolidated statement of operations, changes in shareholders’ equity and comprehensive (loss)/ income have been included in note 29 to our consolidated financial statements to reflect the impact of the significant differences between HKFRSs and U.S. GAAP.
Recent Accounting Pronouncements
Recentlyaccounting pronouncements
Recent issued and adopted accounting pronouncements under
HKFRSs and U.S. GAAPIFRSs have been included in note
2831 to our consolidated financial statements.
B. Liquidity and Capital Resourcescapital resourcesAs of August 31, 2007, we had a total cash position of HK$634.5 million and outstanding borrowings of HK$953.8 million. Our long term liability consists mainly of our 8.75% senior notes due 2015, which amounted to HK$952.6 million. Our total cash position of HK$634.5 million consisted of HK$532.9 million in cash and bank balances, HK$87.2 million in pledged bank deposits and HK$14.4 million in long term bank deposits.
We expect cash
flows generatedflow from
operations willoperating activities to continue to be our principal source of liquidity.
As of August 31, 2009, we had cash and bank balance of HK$221.1 million and pledged bank deposits of HK$15.0 million. Our day-to-day operations are also supported by HK$205.0 million banking facilities, of which only HK$7.8 million was utilized as at August 31, 2009.
We believe that our current cash and cash equivalents and cash flow from operations will be sufficient to meet our anticipated cash needs, including working capital requirements, capital expenditures, repayment of our indebtedness when fall due and various contractual obligations, for at least the next 12 months. Our cash flows from operations, however, may decrease due to lower customer demand resulting from rapid technological changes, increasing competition resulting from new local and foreign entrants into the market, or our failure to obtain or renew the necessary telecommunication licenses. A decrease in our operating cash flow could adversely affect our ability to make planned capital expenditures, to comply with our obligations under various operating and capital leases and to repay amounts due under banking facilities.
The following table summarizes our cash flows for each of fiscal 2005, 20062008 and 2007:2009:
| | | | | | | | | | | | | |
| | | For the year ended August 31, | |
| | | 2008 | | | 2009 | | | 2009 | |
| | | HK$ | | | HK$ | | | US$ | |
| | | (Amounts in thousands) | |
| Net cash inflow from operating activities | | | 378,563 | | | | 535,886 | | | | 69,142 | |
| Net cash outflow from investing activities | | | (147,750 | ) | | | (176,488 | ) | | | (22,771 | ) |
| Net cash outflow from financing activities | | | (342,550 | ) | | | (560,407 | ) | | | (72,306 | ) |
| | | | | | | | | | |
| | | | | | | | | | | | | |
| Decrease in cash and bank balances | | | (111,737 | ) | | | (201,009 | ) | | | (25,935 | ) |
| Cash at bank and in hand, at the beginning of year | | | 532,894 | | | | 421,610 | | | | 54,398 | |
| Effect of foreign exchange rate changes on cash | | | 453 | | | | 451 | | | | 58 | |
| | | | | | | | | | |
| | | | | | | | | | | | | |
| Cash at bank and in hand, at the end of the year | | | 421,610 | | | | 221,052 | | | | 28,521 | |
| | | | | | | | | | |
33
| | | | | | | | | | | | |
| | | Year Ended August 31, | |
| | | 2005 | | | 2006 | | | 2007 | | | 2007 | |
| | | HK$ | | | HK$ | | | HK$ | | | US$ | |
| | | (In thousands) | |
Net cash flow from operating activities | | 77,383 | | | 184,151 | | | 383,999 | | | 49,251 | |
Net cash (used in) / generated from investing activities | | (557,440 | ) | | (492,742 | ) | | 114,053 | | | 14,628 | |
Net cash (used in) provided by financing activities | | 792,216 | | | (86,432 | ) | | (109,504 | ) | | (14,045 | ) |
| | | | | | | | | | | | |
(Decrease)/increase in cash and bank balances | | 312,159 | | | (395,023 | ) | | 388,548 | | | 49,834 | |
Cash and bank balances, at the beginning of year | | 228,347 | | | 539,591 | | | 144,917 | | | 18,587 | |
Effect of foreign exchange rate changes | | (915 | ) | | 349 | | | (571 | ) | | (73 | ) |
| | | | | | | | | | | | |
Cash and bank balances, at the end of the year | | 539,591 | | | 144,917 | | | 532,894 | | | 68,348 | |
| | | | | | | | | | | | |
Operating Activitiesactivities Our
net cash flow from operating activities for fiscal 2007, 2006 and 2005 was an inflow of HK$384.0 million, HK$184.2 million and HK$77.4 million, respectively. The principal source of cash
flowwas cash generated from our FTNS business. Net cash inflow from operating activities
in each of these fiscal years was the cash flow we generate from our fixed telecommunications network services and international telecommunications businesses.In fiscal 2007, we generated a net cash inflow from our operating activities that amountedincreased to HK$384.0 million.535.9 million in fiscal 2009 from HK$378.6 million in fiscal 2008. The net increase in operating cash flow was mainlyprimarily due to the increased revenue from our fixed telecommunications network services and lower network costs as a resultFTNS business because of the decreaseincrease in our international telecommunications services. Moreover, leveraging on last year’s operating efficiency plan and decentralizating of authority to individual department heads helped to increase our operatingthe subscription base.
Investing activities
Net cash
flow.Inoutflow from investing activities in fiscal 2006, we generated a2009 was HK$176.5 million. The net cash inflow from our operating activities that amounted to HK$184.2 million. The increase in operating cash flowoutflow was mainly due to lower network costs as a resultour purchase of fixed assets of HK$289.9 million, the completioneffect of our fiber backbone network, which reduced our network costs paid to third party network operators. Moreover,were partially offset by leveraging on the large scale salesan decrease in pledged bank deposits of HK$72.3 million and marketingnet proceeds from maturity of investment in debt securities of HK$28.1 million.
Net cash outflow from investing activities in fiscal
2005 which has enhanced brand image and improved customer experience, less sales and marketing expenses were incurred in fiscal 2006, which also helped to increase the operating cash flow.In fiscal 2005, we generated a2008 was HK$147.8 million. The net cash inflow in our operating activities that amounted to HK$77.4 million. The reduced operating cash flow when compared with fiscal 2004outflow was principallymainly due to the significant cash we spent in sales and marketing expenses in offering incentives to acquire new subscriptions and retain our growing subscription base. Since such expenses were incurred before cash receipts from customers, it significantly reduced our operating cash flow. Moreover, increases in staff costs due to the expansion of our fixed telecommunications network services operations and increases in home equipment installation necessitated by the growth of our customer base also reduced our cash flow from operations. Cash from operating activities also decreased due to increased spending for early stage operations of our IP-TV service.
Investing Activities
In fiscal 2007, net cash generated from investing activities was HK$114.1 million, whereas in fiscal 2006 and 2005, net cash used in investing activities was HK$492.7 million and HK$557.4 million respectively. In 2006 and 2005, investing activities consisted primarily of purchasespurchase of fixed assets of HK$189.9 million for the development of our Next Generation Network and upgrading of our international telecommunications facilities of HK$382.2 and HK$415.4 respectively. An increase in term deposits of HK$144.6 million and HK$92.9 million respectively further increased theNetwork.
Financing activities
Net cash outflow
for investingfrom financing activities in
2006 and 2005 respectively. In fiscal
2007, the2009 was HK$560.4 million. The net cash
generatedoutflow was mainly due to
the receipt in term depositsour repurchase of 10-year senior notes for an aggregate consideration of HK$
237.5485.8 million
and lower level in purchase of fixed assets of HK$149.3 million.Financing Activities
Net cash used in financing activities was HK$109.5 million in fiscal 2007 consisting mainly(including transaction cost), payment of interest paid on our 8.75%the 10-year senior notes of HK$85.352.7 million and interim dividendpayment of cash dividends of HK$24.623.0 million.
Net cash
used inoutflow from financing activities
was HK$86.4 million in fiscal
2006 which2008 was HK$342.6 million. The net cash outflow was mainly
consisteddue to our repurchase of 10-year senior notes for an aggregate consideration of HK$269.4 million, payment of interest
paid on
our 8.75%the 10-year senior notes of HK$
85.270.0 million and payment of cash dividends of HK$17.3 million.
Net cash provided by financing activities was
Indebtedness
As of August 31, 2009, we had outstanding debt of HK$792.2163.3 million, in fiscal 2005,most of which mainly consistedconsisting of our net proceeds of US$121.010-year senior notes due 2015, which amounted to HK$162.6 million from our 8.75%stated at amortized cost and were classified as non-current debt.
10-year senior notes issued in the amount of HK$943.7 million and a bank loan of HK$100.0 million. The cash inflow was offset by our repayment of a bank loan in the amount of HK$200.0 million and interest payments for the 8.75% notes in the aggregate amount of HK$52.4 million.Net cash provided by financing activities was HK$47.2 million in fiscal 2004, which consisted of our draw down of HK$100.0 million on our loan facility with HSBC, offset by our payment of HK$54.9 million in dividends during fiscal 2004.
Indebtedness
On January 20, 2005 we issued unsecured 10-year senior fixed rate notes in the aggregate principle amount of US$125 million at par value.value and received net proceeds in the amount of US$121.0 million after deduction of expenses and commissions. The 10-year senior notes were rated BB- (stable) by Standard & Poor’s Rating Services and Ba3 (stable) by Moody’s Investors Services. A significant portion of the net proceeds were used to repay in full an existing bank loan in the outstanding amount of HK$196.7 million and to finance capital expenditures, including costs incurred in expanding and upgrading our Next Generation Network. As of August 31, 2009, the 10-year senior notes were stated at the amortized cost of US$21.0 million (HK$162.6 million), compared with the amortized costs of US$87.5 million (HK$683.2 million) as of August 31, 2008.
The notes mature on February 1, 2015 and bear interest at the fixed rate of 8.75% per annum. Interest on the notes are payable semi-annually in arrears on February 1 and August
1.1 of each year. The notes are irrevocably and unconditionally guaranteed, jointly and severally, on a senior unsecured basis by all of our existing and future subsidiaries (other than, as of the issue date of the notes, CTI Guangzhou and, subsequently, any other subsidiary prohibited by applicable law, regulation or order from issuing a guarantee of the notes).
We may redeem all but not less than all of the 8.75% notes in the event we have to pay additional amounts
On June 17, 2009, as a result of our tender offer and consent for amendments to the indenture, substantially all of the restrictive covenants in the indenture have been eliminated. Consequently, certain changesevents that would have constituted a violation of such covenants in taxation.the past will no longer constitute event of default. We also repurchased an aggregate principal amount of US$68.0 million of the 10-year senior notes from the market for an aggregate consideration (including transaction cost and accrued interest) of US$65.1 million. As of December 15, 2009, an aggregate principal amount of US$21.4 million of the 10-year senior notes remained outstanding.
On or after February 1, 2010, we may redeem the notes, in whole or in part,
on or after February 1, 2010, at the redemption prices set forth in the indenture governing
the notes. In addition, prior to February 1, 2008, we may redeem up to a maximum of 35% of the original aggregate principal amount of the notes with the proceeds from one or more specified public or private offerings of our common stock at a redemption price equal to 108.75% of the principal amount of the notes. In all cases of optional redemption, we will pay principal at the redemption price specified plus accrued and unpaid interest, additional amounts, if any, thereon to, but not including, the date of redemption.
The indenture governing the 8.75% notes contains covenants that limit, among other things, our ability and the ability of certain of our existing and future subsidiaries to:
pay dividends, make distributions, redeem capital stock and make certain other restricted payments or investments;
Banking facilitiesincur additional indebtedness or issue certain equity interests;
merge, consolidate or sell all or substantially all of our assets;
issue or sell capital stock of some of our subsidiaries;
sell or exchange assets or enter into new businesses;
create any restrictions on the payment of dividends, the making of distributions, the making of loans and the transfer of assets;
enter into certain transactions with affiliates or related persons; and
enter into sale and lease back transactions.
The net proceeds of the 8.75% notes were approximately US$121.0 million after deduction of expenses and commissions. We used the net proceeds, in part, to repay in full an existing bank loan in the outstanding amount of HK$196.7 million. The remaining net proceeds has been and will continue to be used for capital expenditures, including costs incurred in expanding and upgrading our Next Generation Network in Hong Kong, and for additional working capital and general corporate purposes.
As of August 31, 2007, the 8.75% notes were stated at the amortized cost of US$122.1 million (HK$952.6 million), compared with the amortized costs of US$121.9 million (HK$948.0 million) as of August 31, 2006.
As of August 31, 2007,2009, we had available banking facilities of HK$80.2205.0 million of which HK$78.67.8 million was unutilized.
During December 2007 and January 2008, we have bought back cumulative principal value of 8.75% notes of US$21.9 million by way of market acquisition. The total consideration (including accrued interest) paid was US$22.1 million. The principal value of 8.75% notes remaining in issue after the buy-back is US$103.2 million. The 8.75% notes bought back have been cancelled subsequently in December 2007 and January 2008.
utilized.
In order to further develop our Next Generation Network and maintaincontinue to increase the scale of operations of our international telecommunicationsFTNS business, we plan to make total capital expenditures of approximately HK$850300 million over the next three yearsto HK$350 million per year in fiscal 2010 and 2011 to increase the coverage of our homeNext Generation Network from 1.6 million residential homes pass to 2.0 million residential homes pass and from 1.4 million to 1.8 million and to increase our fiber-connected1,230 commercial buildings from 600 to 1,800. Our required1,800 commercial buildings. The budgeted capital expenditures will be financed by the company’s freeour internally generated cash flow in the respective year.years.
34
Contractual Obligations and Commercial Commitments
As of August 31, 2007, we had capital commitments contracted but not provided for relating to the purchase of telecommunications, computer and office equipment of HK$54.2 million. In addition, we had commitments under non-cancelable operating leases relating to land, buildings, telecommunications facilities and computer equipment of HK$83.6 million, of which HK$43.6 million is due in fiscal 2008. We also had commitments on program fees of HK$14.0 million, of which HK$10.3 million is due in fiscal 2008. As of August 31, 2007 we utilized HK$1.6 million of the HK$80 million available banking facilities.
The following table sets forth information regarding our aggregate payment obligations in future years of the contractual obligations and commercial commitments that we had as of August 31, 2007.
| | | | | | | | | | |
| | | Payments due by period |
Contractual Obligations | | Total | | Within 1 year | | More than 1
year but
within 3
years | | More than
3 years but within 5
years | | More than 5 years |
| | | (Thousands of HK$) |
Capital expenditure items | | 54,165 | | 54,165 | | — | | — | | — |
Operating leases | | 83,600 | | 43,566 | | 13,758 | | 9,892 | | 16,384 |
Short-term and long-term debt (principal and interest payments) | | 1,615,464 | | 86,146 | | 170,839 | | 170,685 | | 1,187,794 |
Programming fees (IP-TV) | | 13,981 | | 10,345 | | 3,636 | | — | | — |
| | | | | | | | | | |
Total | | 1,767,210 | | 194,222 | | 188,233 | | 180,577 | | 1,204,178 |
| | | | | | | | | | |
During December 2007 and January 2008, we have bought back and cancelled cumulative principal value of the 8.75% notes of US$21.9 million (equivalent to HK$170.7 million) by way of market acquisition. As a result of the buy-back of the 8.75% notes, our contractual obligations in respect of the short-term and long-term debt (principal and interest payments) has decreased by US$36.3 million (equivalent to HK$283.0 million).
Our working capital as of August 31, 2007 was HK$563.9 million, which we believe is sufficient for our current requirements. Further, we believe that our current cash and cash equivalents and cash flow from operations will be sufficient to meet our anticipated cash needs, including for working capital, capital expenditure, repayment of our indebtedness and various contractual obligations, for at least the next 12 months. However, if our customer demand changes significantly due to rapid technological changes, if we are not able to successfully compete with local and foreign entrants into the market, or if we fail to maintain or obtain the necessary license renewals from the Telecommunications Authority, this could have a significant adverse impact on our cash flows from operations, which could effect our ability to make planned capital expenditures as well as meet scheduled payments on the 8.75% notes, our various operating and capital leases commitments and amounts due under banking facilities.
C. Research and development, patents and licenses We commit considerable resources to our research and development department in order to continuously improve our services and improve our market position. As of August 31,
2007,2009, our research and development team consisted of approximately
3021 staff members experienced in systems design, engineering, telecommunications and computer programming. Our research and development department is primarily responsible for assessing and adapting the technology that we employ in upgrading and expanding our Next Generation Network. To identify and develop new market opportunities, the research and development team assesses new services offered by telecommunications and
internetInternet companies in the United States and elsewhere and works closely with our marketing department. Our research and development expenditures were approximately HK$
11.0 million, HK$9.6 million and HK$
5.010.8 million for fiscal
2005, 20062008 and
2007,2009, respectively.
D. Trend informationDuring fiscal 2007,
Revenue from our international telecommunicationsIDD business experienced a 16.4% decline in volumedecreased by 15.3% to 659.0 million minutes, which combined with the lower revenue per minute, resulted in a 22.4% reduction in our international telecommunications revenues to HK$324.5247.4 million in fiscal 2007.2009 from HK$292.0 million in fiscal 2008. The principal reason for this declinedecrease was the intense competition, as our key competitors introduced highly aggressive price cuts. Partly as a result, the traffic volume of our IDD business decreased by 15.2% to 487.0 million minutes in fiscal 2009 from 574.0 million minutes in fiscal 2008. We expect that such declinecompetition will continue to increase in future. Rather than directly competingthe future, creating further pressure on price, our strategy is to proactively migrate our international telecommunications customers tovolume and also pricing.
Revenue from our FTNS
global “2b” VOIP service which we believe will enable us to obtain higher margins and provide us with access to a wider addressable market.Our revenues from our fixed telecommunications network servicesbusiness grew by 14.0%21.8% to HK$816.81,230.9 million in fiscal 20072009 from HK$1,011.0 million in fiscal 2008. The principal reason for this increase was due to a rise in the subscription basegrowth of our fixed telecommunications network services of 10.7%17.7% to 683,000 subscriptions943,000 accounts as of August 31, 2007.2009 from 801,000 subscription accounts as of August 31, 2008 and, to a lesser extent, an increase in average revenue per subscription account.
The
revenue growth was attributable toglobal economic downturn has had a dampening effect on consumer sentiment and business activities across the globe. We believe that the impact of the downturn on our
success in raising revenue yields per subscription.E Off-Balance Sheet Arrangements
Other thanoperations has been limited because our FTNS and IDD services are regarded as described above in “— Critical Accounting Policies” and note 27 to“semi-utility” services. However, if the global economic downturn continues for a long period of time, demand for our Consolidated Financial Statements, weservices may decrease.
E. Off-balance sheet arrangements
We have not entered into any off-balance-sheet arrangements with any entities or individuals.
F. Tabular disclosure of contractual obligations.obligations
The following table sets forth information regarding our aggregate payment obligations in future years of the contractual obligations and commercial commitments that we had as of August 31, 2009.
| | | | | | | | | | | | | | | | | | | | | |
| | | Payments due by period | |
| | | | | | | | | | | More than | | | More than | | | | |
| | | | | | | | | | | 1 year | | | 3 years | | | | |
| | | | | | | Within | | | but within | | | but within | | | More than | |
| | | Total | | | 1 year | | | 3 years | | | 5 years | | | 5 years | |
| Contractual obligations | | HK$ | | | HK$ | | | HK$ | | | HK$ | | | HK$ | |
| | | (Amounts in thousands) | |
| Capital expenditure items | | | 150,099 | | | | 150,099 | | | | — | | | | — | | | | — | |
| Operating leases | | | 96,381 | | | | 66,708 | | | | 19,284 | | | | 4,118 | | | | 6,271 | |
| 10-year senior notes | | | 244,117 | | | | 14,489 | | | | 28,978 | | | | 28,978 | | | | 171,672 | |
| Obligation under finance leases | | | 820 | | | | 237 | | | | 320 | | | | 192 | | | | 71 | |
| Other current liabilities | | | 262,420 | | | | 262,420 | | | | — | | | | — | | | | — | |
| Programming fees (IP-TV) | | | 15,332 | | | | 9,094 | | | | 6,238 | | | | — | | | | — | |
| | | | | | | | | | | | | | | | |
| | | | | | | | | | | | | | | | | | | | | |
| Total | | | 769,169 | | | | 503,047 | | | | 54,820 | | | | 33,288 | | | | 178,014 | |
| | | | | | | | | | | | | | | | |
G. Safe Harbor
See “Note regarding forward-looking statements”.
35
See “Liquidity
Item 6 Directors, senior management and Capital Resources” above in this Item 5.employees
ITEM 6. DIRECTORS, SENIOR MANAGEMENT AND EMPLOYEESA. Directors and Senior Managementsenior management
Our board of directors consists of
seveneight directors, three of whom,
are independent non-executive directors and one of whom is a non-executive director. Three are executive directors, namely, Mr. Wong Wai Kay, Ricky, Mr. Cheung Chi Kin, Paul, and Mr. Lai Ni Quiaque. The non-executive director is Mr. Cheng Mo Chi, Moses. The three independent non-executive directors are Mr. Lee Hon Ying, John, Dr. Chan Kin Man and Mr. Peh Jefferson Tun
Lu.Lu, are independent non-executive directors and one of whom, Dr. Cheung Mo Chi, Moses, is a non-executive director. The remaining four, Mr. Wong Wai Kay, Ricky, Mr. Cheung Chi Kin, Paul, Mr. Yeung Chu Kwong, William and Mr. Lai Ni Quiaque, are executive directors.
The following table sets forth certain information concerning our directors and senior management as of
January 21, 2008. | | | | | | |
Name | | Age | | Position | | Date
Joined City
Telecom |
Board of Directors: | | | | | | |
WONG Wai Kay, Ricky | | 46 | | Chairman | | 1992 |
CHEUNG Chi Kin, Paul | | 50 | | Chief Executive Officer | | 1992 |
LAI Ni Quiaque | | 38 | | Chief Financial Officer & Company Secretary | | 2004 |
CHENG Mo Chi, Moses | | 57 | | Non-Executive Director | | 1997 |
CHAN Kin Man | | 48 | | Independent Non-Executive Director | | 1997 |
LEE Hon Ying, John | | 61 | | Independent Non-Executive Director | | 1997 |
PEH Tun Lu, Jefferson | | 48 | | Independent Non-Executive Director | | 2004 |
| | | |
Senior Management: | | | | | | |
CHANG Wing Fu, Stephen | | 44 | | Chief Technology Officer | | 2006 |
CHONG Kin Chun, John | | 45 | | Director, Corporate Division | | 1996 |
LO Sui Lun | | 43 | | Director, Singapore NGNBN | | 1998 |
TO Wai Bing | | 45 | | Managing Director, Business Development | | 2007 |
YEUNG Chu Kwong, William | | 47 | | Chief Operating Officer | | 2005 |
December 15, 2009.
| | | | | | | | | | | |
| | | | | | | | | Date |
| | | | | | | | | joined City |
| Name | | Age | | Position | | Telecom |
Board of directors: | | | | | | | | | | |
| | | | | | | | | | | |
| WONG Wai Kay, Ricky | | | 48 | | | Chairman | | | 1992 | |
| | | | | | | | | | | |
| CHEUNG Chi Kin, Paul | | | 52 | | | Vice Chairman | | | 1992 | |
| | | | | | | | | | | |
| YEUNG Chu Kwong, William | | | 49 | | | Executive Director and Chief Executive Officer | | | 2005 | |
| | | | | | | | | | | |
| LAI Ni Quiaque | | | 40 | | | Executive Director, Chief Financial Officer,
Company Secretary and Head of Talent Engagement | | | 2004 | |
| | | | | | | | | | | |
| CHENG Mo Chi, Moses | | | 59 | | | Non-Executive Director | | | 1997 | |
| | | | | | | | | | | |
| LEE Hon Ying, John | | | 63 | | | Independent Non-Executive Director | | | 1997 | |
| | | | | | | | | | | |
| CHAN Kin Man | | | 50 | | | Independent Non-Executive Director | | | 1997 | |
| | | | | | | | | | | |
| PEH Jefferson Tun Lu | | | 50 | | | Independent Non-Executive Director | | | 2004 | |
| | | | | | | | | | | |
Senior management: | | | | | | | | | | |
| | | | | | | | | | | |
| CHONG Kin Chun, John | | | 47 | | | Managing Director of Corporate Division | | | 1996 | |
| | | | | | | | | | | |
| LO Sui Lun | | | 45 | | | Director of Corporate Affairs Department | | | 1998 | |
| | | | | | | | | | | |
| TAM Ming Chit | | | 44 | | | Chief Technology Officer | | | 2008 | |
| | | | | | | | | | | |
| TO Wai Bing | | | 47 | | | Managing Director of Business Development | | | 2007 | |
Executive Directorsdirectors
Mr. WONG Wai Kay, Ricky, aged
46,48, is the co-founder and Chairman of
City Telecom.the Group. He is responsible for our overall strategic planning and management. Mr. Wong
holds a bachelor’s degree in science from The Chinese University of Hong Kong and has over 20 years’ experience in the telecommunications and computer industries.
Mr. WongHe had worked at a major US-listed computer company as a marketing representative and was responsible for marketing and distribution of computer products in Hong Kong from 1985 to 1989. He was also a co-founder and director of a company principally engaged in
the import and distribution of computer systems in Canada prior to co-founding of
City Telecom.the Group. Mr. Wong
holds a Bachelor’s Degree in Science and a Master of Business Administration Degree (Executive MBA Program) from The Chinese University of Hong Kong. He is a first cousin of Mr. Cheung Chi Kin, Paul,
ourChief Executive Officer.the Vice Chairman of the Group. Currently, heMr. Wong is a member of Commission on Youth, a member of the Zhejiang Committee, Chinese People’s Political Consultative Conference, an independent non-executive director of Bossini International Holdings Limited and a member of the Board of Trustees, United College, The Chinese University of Hong Kong.
Kong and a member of the executive committee of the Digital Solidarity Fund of Hong Kong Council of Social Service.
Mr. CHEUNG Chi Kin, Paul, aged 50,52, is the co-founder and Vice Chairman of the Group. Mr. Cheung is responsible for overall strategic planning and management of the Group. Prior to that, Mr. Cheung was appointed as the Chief Executive Officer of City Telecom. He isand was responsible for our day-to-day operations and technological research, development and support activities. Mr. Cheung graduated with a diploma of advanced programming and system concepts design from Herzing Institute, Canada. He has more than 2628 years’ experience in the telecommunications and computer industries. Mr. CheungHe had worked in companies engaged in application software development and computer consultancy prior to co-founding of City Telecom.the Group. Mr. Cheung graduated with a Diploma of Advanced Programming and System Concepts Design from Herzing Institute, Canada. Mr. Cheung is a first cousin of Mr. Wong Wai Kay, Ricky, the Chairman of the Group.
36
Mr. YEUNG Chu Kwong, William, aged 49, was appointed as the Executive Director and Chief Executive Officer of the Group in November 2008 with the responsibilities for developing corporate strategies and overseeing the operations of the entire Group. Before that, Mr. Yeung joined the Group as Chief Operating Officer in October 2005. He was in charge of our
Chairman.Customer Engagement Department overseeing customer relationship management and was also in charge of our Network Development Department. Mr. Yeung has more than 18 years’ experience in the telecommunications industry. Prior to joining the Group, Mr. Yeung was the Director of Customers Division in Smartone-Vodafone, the General Manager of Personal Communications and Retail Division in Tricom Telecom Limited, and was also an Inspector of Police in the Hong Kong Police Force. Mr. Yeung holds a Bachelor of Arts Degree from Hong Kong Baptist University, a Master of Business Administration Degree from University of Strathclyde, UK and a Master of Science Degree in Electronic Commerce and Internet Computing from The University of Hong Kong. He is also a graduate of the Senior Executive Program of the Columbia University Graduate School of Business in New York.
Mr. LAI Ni Quiaque, aged
38,40, is
our Chief Financial Officer, Company Secretary and Head of
StaffTalent Engagement. Mr. Lai joined
City Telecomthe Group in May 2004. Mr. Lai has extensive experience in telecommunications industry, research and finance, being highly rated in this field. Prior to joining
City Telecom,the Group, Mr. Lai was
a Director and Head of Asia Telecom Research for Credit Suisse
, having spent 8 years with the firm. During his tenure with Credit Suisse, heand was involved in global fund raisings for a wide range of Asian Telecom carriers such as China Mobile, China Telecom, China Unicom, China Netcom, SK Telecom, PCCW, Telekom Malaysia, etc. Before that, Mr. Lai held positions with Hongkong Telecom and Kleinwort Benson Securities (Asia). Mr. Lai holds a Bachelor of Commerce degree from the University of Western Australia
and an Executive Master of Business Administration Degree from Kellogg-HKUST. Mr. Lai is a
fellowFellow member of
HKICPA and CPA Australia and
is a
memberMember of
the Hong Kong Institute of Directors. Mr. Lai has
also been
accepted intoappointed as a member of the
Kellogg-HKUST EMBA program commencing in January 2008.Non-Executive Director
Mr. CHENGRemuneration Committee of the Company.
Non-executive director
Dr. Cheng Mo Chi, Moses, aged
57,59, was
appointed as an Independent Non-executive Director of the Group since June 17, 1997 and has been re-designated as a
non-executive directorNon-executive Director of
City Telecomthe Group with effect from September 30, 2004.
He wasDr. Cheng has also been appointed as
an independent non-executive directora member of the
Company since June 17, 1997. HeRemuneration Committee of the Company. Dr. Cheng is
a practicing solicitor and the senior partner of
Messrs. P.C. Woo &
Co.,Co.. Dr. Cheng was, a
firmmember of
solicitors and notaries inthe Legislative Council of Hong
Kong,Kong. He is the Founder Chairman of the Hong Kong Institute of Directors of which he is now the Honorary President and Chairman
Emeritus and the Chairman of the Betting and Lotteries Commission. Mr.Emeritus. Dr. Cheng
was appointed as a member of the Legislative Council ofcurrently holds directorships in K. Wah International Holdings Limited, China COSCO Holdings Company Limited, China Mobile Limited, China Resources Enterprise, Limited, Towngas China Company Limited, Hong Kong
from 1991 to 1995.Independent Non-Executive Directors
Dr. CHAN Kin Man, aged 48, is an associate professorExchanges and Clearing Limited, Kader Holdings Company Limited, Liu Chong Hing Investment Limited, Guangdong Investment Limited and Tian An China Investments Company Limited, all being public listed companies in Hong Kong. His other directorships in public listed companies in the Department of Sociology of The Chinese University of Hong Kong, specializinglast 3 years include Beijing Capital International Airport Company Limited, Galaxy Entertainment Group Limited and Shui On Construction and Materials Limited, all being public listed companies in state-society relations in Mainland China and Hong Kong. He received a Bachelor of Social Science degree from The Chinese University of Hong Kong in 1983 and a doctor of philosophy degree from Yale University in the U.S. in 1995. Dr. Chan has been ais also an independent non-executive director of City Telecom since June 1997.
ARA Assets Management Limited, a company whose shares are listed on Singapore Exchange Limited, and an independent director of ARA Assets Management (Singapore) Limited, which manages Fortune Real Estate Investment Trust, a real estate investment trust listed on Singapore Exchange Limited.
Independent non-executive directors
Mr. LEE Hon Ying, John, aged
61,63, is the managing director of Cyber Networks Consultants Company in Hong Kong. He was the Regional Director, Asia Pacific of Northrop
Grumman — Canada,Grumman-Canada, Ltd. He was previously the director of network services of Digital Equipment (HK) Limited and prior to that, worked for Cable
&and Wireless
HKT(HK) Limited and Hong Kong Telecom. He is a chartered engineer and a member of each of
the Institution of Engineering and Technology, the United Kingdom, and the Hong Kong Institution of Engineers and the Hong Kong Computer Society. He received a
master’s degreeMaster’s Degree in
information systemsInformation System from The Hong Kong Polytechnic University in 1992. In addition, he is the Territory
Vice-PresidentVice-president of the Society of St. Vincent de Paul of Asia and Oceania, which is an international charity body. He is the Commission member of Catholic Diocese of Hong Kong Diocesan for Hospital Pastoral Care. Mr. Lee has been a
directorDirector of
City Telecomthe Group since June 1997.
Mr. Lee is also the chairman of the Audit Committee and Remuneration Committee of the Company.
Dr. CHAN Kin Man, aged 50, is Director of Centre for Civil Society Studies and Associate Professor of the Department of Sociology of The Chinese University of Hong Kong. He received a Bachelor of Social Science Degree from The Chinese University of Hong Kong in 1983 and a Doctor of Philosophy Degree from Yale University in the U.S. in 1995. Dr. Chan has been a Director of the Group since June 1997. Dr. Chan has also been appointed as a member of the Audit Committee and Remuneration Committee of the Company.
Mr. PEH
Jefferson Tun Lu,
Jefferson, aged
48,50, is a Certified Public Accountant of the Hong Kong Institute of Certified Public Accountants and a Certified Practicing Accountant of CPA Australia. Mr. Peh holds a
master’s degreeMaster Degree in
businessBusiness from the University of Technology, Sydney. He has over
2527 years of experience in finance, accounting and management from listed and private companies in Hong Kong and Australia. Mr. Peh has been a
directorDirector of
City Telecomthe Group since September 2004.
Senior Management
Mr. CHANG Wing Fu, Stephen, aged 44, is our Chief Technology Officer. Mr Chang joined the Company in July 2006 as Chief Information Officer andPeh has also been the Company’s Chief Technology Officer since December 2006. He provides advice and assistance to the Company, to ensure that information and communications technologies are acquired and managed inappointed as a manner that is aligned with business strategy, supporting the goals and objectivesmember of the CompanyAudit Committee and its various business units. Mr Chang graduated from Australia and holds a Masters in Information Systems degree and a BachelorRemuneration Committee of Science degree from Monash University. Mr Chang has 19 years of experience in Systems Development, Project Management, Consulting and Information Technology Management. Prior to joining the Company, Mr Chang was the Asia Pacific/Japan Vice-President of Worldwide Support for a U.S. software company. Before that he was the General Manager of Information Technology at SmarTone-Vodafone.
Company.
Senior management
Mr. CHONG Kin Chun, John, aged 45,47, is the directorManaging Director of the corporate division.Corporate Division of the Group. He is responsible for sales, marketingservicing and servicingnetwork expansion development of the Company’sGroup’s international telecommunications services and fixed telecommunications network services for business and corporate customers. Mr. Chong joined City Telecomthe Group in February 1996 and holds a bachelor’s degreeBachelor’s Degree in artsArts from The University of Hong Kong. Mr. Chong worked as a general manager overseeing product management and the sales force of a listed telecommunications products company in Hong Kong from 1987 to 1996.
37
Mr. LO Sui Lun, aged
43,45, is
a directorthe Director of
Hong Kong Broadband Network Limited (HKBN).Corporate Affairs Department of the Group. He is
now in chargeprimarily responsible for regulatory and carrier relations matters of the
Company’s participation inGroup. In addition, Mr. Lo is also responsible for overseeing the
Next Generation National Broadband Network (NGNBN) project in Singapore. That project is to develop a FTTH network forlegal and company secretarial functions of the
whole country.Group. Before
that,taking up his current position, Mr. Lo was in charge of regulatory, carrier business, international business, network operation and network development for
HKBN. HeHong Kong Broadband Network Limited, the wholly-owned subsidiary of the Company. Mr. Lo joined
City Telecomthe Group in September 1998. Prior to that, Mr. Lo worked for PCCW (formerly known as “Hong Kong Telecom”) for 9 years, gaining experience in network planning and undersea cable investment. Mr. Lo holds a
bachelor’s degreeBachelor’s Degree in
sciencesSciences in
electronicsElectronics from The Chinese University of Hong Kong and a
master’s degreeMaster’s Degree in
business administrationBusiness Administration from the University of Strathclyde,
UK.U.K.
Dr. TAM Ming Chit, aged 44, is Chief Technology Officer of the Group. He is responsible for the Group’s network, information system development and operations including broadband networking, IPTV, wireless applications, as well as VoIP networks. Prior to joining the Group in 2008, Dr. Tam held various technical positions in various institutions in Hong Kong and overseas, such as Alcatel-Lucent, Citibank and SRA. He has over 16 years of operational experience in the information technologies and telecom industry. Dr. Tam holds a Bachelor of Science (Hons) in Computer Science from Imperial College, University of London, U.K. and a Doctor of Philosophy in Computer Science from the University of Pennsylvania, U.S.A.
Ms. TO Wai Bing, aged
45,47, is
our managing directorthe Managing Director of
business development.Business Development of the Group. Ms. To is
a member of the management committee of the Company andalso in charge of
the International Business Department,
and the Carrier Business
Department and Pay TV Department. She is responsible for the control of cost of services,
carrier relations, sales of carrier business,
exploringdevelopment of Pay TV business, explore and
securingsecure business partnerships to strengthen the
Company’sGroup’s business operations and development. Before joining the
Company,Group, Ms. To had worked
forin the Hong Kong Telecom
CompanyGroup for 16 years after graduating from
The Hong Kong Polytechnic University with a Diploma in Electronic Engineering and subsequently a Higher Certificate in Electronic Engineering. Ms. To rejoined the
CompanyGroup in May 2007 after her previous
servicesservice with the
CompanyGroup from September 1998 to July 2006.
Mr. YEUNG Chu Kwong, William, aged 47, is our Chief Operating Officer. Mr. Yeung joined City Telecom in October 2005 and is responsible to head our Customer Engagement Department to oversee customer relationship management. Mr. Yeung is also responsible to head Network Development Department. He holds a Bachelor of Arts degree from Hong Kong Baptist University, a Master of Business Administration degree from University of Strathclyde, UK and a Master of Science Degree in Electronic Commerce and Internet Computing from The University of Hong Kong. Mr. Yeung has more than 15 years’ experience in the telecom industry. Prior to joining City Telecom, Mr. Yeung was the Director of Customers Division in SmarTone-Vodafone, the General Manager of Personal Communications and Retail Division at Tricom Telecom Limited, and was also an Inspector of Police in the Hong Kong Police Force.
Directors’ and Senior Management’s Compensationsenior management’s compensation
Our directors and senior management receive compensation in the form of salaries, housing allowances, discretionary bonuses, other allowances and benefits in kind, including our contribution to the pension schemes for such individuals.
The aggregate amount We also granted share options to various directors and members of salaries or other compensation, housing allowances, discretionary bonuses, share-based payment, other allowancesour senior management. For more information regarding share options granted to directors and benefitsmembers of our senior management, see Item 6 “Directors, senior management and employees — Share ownership” below in kind paid by us to our directors (not including our non-executive directors) during fiscal 2007 was approximately HK$19.4 million. We paid approximately HK$1.4 million as our contribution to the pension schemes of the directors during fiscal 2007. In addition we paid our fiscal non-executive directors fees in the aggregate amount of approximately HK$605,000 during fiscal 2007.
Each executive director is entitled to receive anthis annual discretionary bonus of such amount as shall be determined by the board of directors upon recommendation and approval by the Remuneration Committee (as defined below). Additionally, ourreport.
Our senior management and employees are entitled to receive an annual discretionary bonus based on their individual performance and our financial performance during the year in question.
As of January 21, 2008, the Company granted share options to various directors and members of our senior management. For details, please refer to Item 6EShare Ownership herein.
Except as discussed herein, no other payments have been paid or are payable, in respect of fiscal 2007, by us or any of our subsidiaries to our directors and senior management.
The aggregate amount of salaries or other compensation, housing allowances, other allowances and benefits in kind paid by us to our
directors and senior management
during the fiscal 2007 was approximately HK$
13.4 million.For38.8 million for fiscal 2007, the2009, compared with HK$32.5 million for fiscal 2008. The aggregate amount accrued by usof contribution that we made to provide pensionthe retirement or similar benefits for our directors and members of our senior management was HK$2.6 million for fiscal 2009, compared with HK$2.4 million for fiscal 2008.
Except as discussed herein, no other payments have been paid or are payable, in respect of fiscal 2009, by us or any of our subsidiaries to our directors and
other employees was approximately HK$23.9 million. (please refer to the second paragraph of this section)senior management.
C. Board Practicespractices Service Contractscontracts
We entered into service agreements with our
threefour executive directors,
Messrs Wong Wai Kay, Ricky, Cheung Chi Kin, Paul,
Yeung Chu Kwong, William and Lai Ni Quiaque, respectively. These service agreements include non-competition clauses under which our executive directors agree not to compete with us in accordance with the terms and conditions therein and shall continue to be effective unless and until terminated by either party of the respective service agreements. None of the agreements provide for any benefits or compensation upon termination of employment.
“Controlled company” exemption
We are a “controlled company” within the meaning of the NASDAQ Marketplace Rules, since Top Group International Limited holds more than 50% of our voting power. As such, we are exempt from the NASDAQ Marketplace Rules requirement that a majority of a company’s board of directors must qualify as independent directors within the meaning of the NASDAQ Marketplace Rules. We are also exempt from the NASDAQ Marketplace Rules requirement regarding nominations and remuneration. In accordance with the laws of Hong Kong, the nomination and remuneration of our directors are governed by our Articles of Association. Pursuant to our Articles of Association, our directors are appointed by our shareholders in general meeting, and our directors’ fees are recommended by the remuneration committee of our board of directors and determined by our shareholders at the annual general meeting
Our board of directors established an Audit Committeeaudit committee in March 1999 to ensure the impartial supervision of our accounting and business operations. The Audit Committeeaudit committee is comprised of three independent non-executive directors, namely, Mr. Lee Hon Ying, John (the Chairman of the Audit Committee)audit committee), Dr. Chan Kin Man and Mr. Peh Jefferson Tun Lu, Jefferson.Lu. Mr. Peh was appointed to the Audit Committeeaudit committee on September 1, 2004 and is a “financial expert” within the meaning of, and as required by the U.S. Sarbanes-Oxley Act of 2002.
38
The
Audit Committeeaudit committee is governed by
ouran audit committee charter, which was adopted by our board of directors at a meeting held in August 2004. It is responsible for
overseeing the
accounting and financial reporting process of the Company and the audits of the Company’s financial statements on behalf of the Board of Directors.Additionally, the Audit Committee is directly responsible for the appointment, compensation, retention and oversight of the work of City Telecom’s independent auditors (including resolution of disagreements between management and the auditors regarding financial reporting) for the purpose of preparing or issuing an audit report or performing other audit, review or attest services for City Telecom.
following:
| • | | overseeing the accounting and financial reporting process of the Company and the audits of the Company’s consolidated financial statements on behalf of the board of directors; and |
|
| • | | the appointment, compensation, retention and oversight of the work of the Company’s independent auditors (including resolution of disagreements between management and the auditors regarding financial reporting) for the purpose of preparing or issuing an audit report or performing other audit, review or attest services for the Company. |
As provided in our audit committee charter, the
Audit Committee shallaudit committee is required to meet in person or telephonically at least twice a year and
shall havehas the resources and authority appropriate to discharge its responsibilities as required by law, including the authority to engage independent counsel and other advisors as the
Audit Committeeaudit committee deems necessary to carry out its duties.
The
Audit Committeeaudit committee met
threefour times in fiscal
2007.2009. The major works performed by the
Committeecommittee from September 1,
20062008 to August 31,
2007 included:2009 included the following:| - | a. | Reviewed the Company’s consolidated financial statements for the year ended August 31, 20062008 and for the six months ended February 28, 2007;2009; |
| - | b. | Reviewed the internal audit progress, especially onincluding the procedures required for the compliance ofwith the Sarbanes-Oxley Act; |
| - | c. | Reviewed the external auditor’s report on the review of the Company’s interim financial report for the six months ended February 28, 20072009 and the Company’s audited consolidated financial statements for the year ended August 31, 2006;2008; and |
| - | d. | Pre-approved the audit and non-audit services provided by KPMG, the Company’s external auditor of the Company.auditor. |
Remuneration Committeecommittee
Our board of directors established a
Remuneration Committeeremuneration committee in August 2001 to
manage our offer ofoversee the Company’s remuneration packages
tofor executive directors.
Among others, each of our executive directors is entitled to receive an annual discretionary bonus of such amount as determined by the board of directors upon recommendation and approval by the remuneration committee. The
Remuneration Committeeremuneration committee is comprised of six members with three independent non-executive directors,
Mr. Lee Hon Ying, John, Mr. Peh Tun Lu, Jefferson and Dr. Chan Kin Man and Mr. Peh Jefferson Tun Lu, the non-executive director, Mr.Dr. Cheng Mo Chi, Moses, Mr. Lai Ni Quiaque, ourthe executive director, Chief Financial Officer, Company Secretary and Head of StaffTalent Engagement and our director of Talent Management. The Remuneration Committee’s main dutiesremuneration committee’s objectives are set out as follows:-
| - | | (a) | to make recommendations to the Board on City Telecom’sEstablish formal, fair and transparent procedures for developing policy and structure forof all remuneration of directors and senior managementmanagement. |
| - | | Review and onconsider the establishmentCompany’s policy for remuneration of a formaldirectors and transparent procedure for development policy on such remuneration;senior management. |
| |
(b)- | to have | Recommend the delegated responsibility to determine the specific remuneration packages of all executivenon-executive directors (including independent non-executive directors). |
The remuneration committee held one meeting during fiscal 2009. The major works performed by the committee from September 1, 2008 to August 31, 2009 included the following:
| - | | Reviewed and seniorapproved the proposed discretionary performance bonus for the management including benefits in kind, pension rights, shortcommittee members; |
|
| - | | Reviewed and long term incentives and compensation payments, including any compensation payable for loss or termination of their office or appointment, and make recommendations to the Board ofapproved the remuneration of non-executive directors (whether independent or otherwise);packages for management committee members; and |
| |
(c)- | to review and approve performance-based remuneration by reference to corporate goals and objectives resolved by the Board from time to time; |
| | (d) | to reviewReviewed and approveapproved the compensation payable to executive directors and senior management in connection with any loss or termination of their office or appointment to ensure that such compensation is determined in accordance with relevant contractual terms and that such compensation is otherwise fair and not excessiveremuneration for City Telecom;the directors. |
| (e) | to review and approve compensation arrangements relating to dismissal or removal of directors for misconduct to ensure that such arrangements are determined in accordance with relevant contractual terms and that any compensation payment is otherwise reasonable and appropriate; |
| (f) | to ensure that no director or any of his associates is involved in deciding his own remuneration |
| (g) | to consider other issues as may be assigned from time to time by the Board; and |
| (h) | to advise shareholders on how to vote with respect to any service contracts of directors that require shareholders’ approval under the Listing Rules. |
The following
charttable sets forth the number of our employees by functional area as of August 31,
2007.2009. | | | | |
| | | Employees | |
Information technology and engineering | | 479 | 437 | |
Sales and marketing, customer service and “Special Duty Unit” (“SDU”) , or SDU | | 1,897 | 2,433 | |
General administration and others | | 316 | 303 | |
| | | |
Total
| | 2,692 | | |
| Total | | | 3,173 | |
| | | |
The following
charttable sets forth the number of our employees by geographical region as of August 31,
2007.2009. | | | | |
| | | Employees | |
Hong Kong | | 1,401 | 1,633 | |
Guangzhou | | 1,264 | 1,520 | |
Canada | | 27 | 20 | |
| | | |
Total
| | 2,692 | | |
| Total | | | 3,173 | |
| | | |
39
As of August 31,
2005, 20062008 and
2007,2009, we had
3,896, 2,5653,051 and
2,6923,173 employees, respectively.
In connection with the transfer of our calling center operations to Guangzhou, China, we have hired over 1,200 customer service representatives and back office employees to staff that facility. The
slight increase in our total number of employees in fiscal
20072009 was mainly due to the expansion in our
fixed telecommunications networkFTNS business.
E. Share Ownershipownership The following
charttable sets forth the share ownership of our directors and senior management as of
January 21, 2008. | | | | | | | | | | |
Title of Class | | Identity of Person or Group | | Number of Shares Beneficially Owned(11) | | | Percentage of Shares Beneficially Owned (%)(3) | | Outstanding Share
Options | |
Ordinary Shares | | Wong Wai Kay, Ricky | | 318,771,261 | (1) | | 50.82 | | 14,000,000 | (4) |
Ordinary Shares | | Cheung Chi Kin, Paul | | 352,792,737 | (2) | | 56.25 | | 14,000,000 | (5) |
Ordinary Shares | | Lai Ni Quiaque | | 9,670,000 | | | 1.54 | | 2,000,000 | (6) |
Ordinary Shares | | Chang Wing Fu, Stephen | | Nil | | | Nil | | 700,000 | (10) |
Ordinary Shares | | Chong Kin Chun, John | | 1,124,000 | | | Less than 1.0 | | 3,000,000 | (7) |
Ordinary Shares | | Lo Sui Lun | | 628,000 | | | Less than 1.0 | | 2,000,000 | (8) |
Ordinary Shares | | Yeung Chu Kwong, William | | 2,000,000 | | | Less than 1.0 | | 2,000,000 | (9) |
December 15, 2009.| | | | | | | | | | | | | | | |
| | | | | Number | | | Percentage | | | | |
| | | | | of shares | | | of shares | | | Outstanding | |
| | | Identity of person | | beneficially | | | beneficially | | | share | |
| Title of class | | or Group | | owned | | | owned | | | options | |
| | | | | (note 4) | | | (note 3) | | | | |
| | | | | | | | % | | | | |
| Ordinary shares | | Wong Wai Kay, Ricky | | 346,959,573
(note 1) | | | | 51.05 | | | | 8,091,604 | |
| | | | | |
| Ordinary shares | | Cheung Chi Kin, Paul | | 382,100,443
(note 2) | | | | 56.22 | | | | 8,091,604 | |
| | | | | |
| Ordinary shares | | Yeung Chu Kwong, William | | | 3,000,000 | | | Less than 1.0 | | | | 7,062,956 | |
| | | | | |
| Ordinary shares | | Lai Ni Quiaque | | | 10,392,506 | | | | 1.53 | | | | 8,067,690 | |
| | | | | |
| Ordinary shares | | Chong Kin Chun, John | | | 2,777,089 | | | Less than 1.0 | | | | 2,022,900 | |
| | | | | |
| Ordinary shares | | Lo Sui Lun | | Nil | | | Nil | | | | 2,022,901 | |
| | | | | |
| Ordinary shares | | Tam Ming Chit | | Nil | | | Nil | | | | 1,007,465 | |
| | | | | |
| Ordinary shares | | To Wai Bing | | Nil | | | Nil | | | | 1,007,465 | |
(1)
| | |
| Notes: |
|
| (1) | | Of the 318,771,261346,959,573 shares, 318,516,999339,814,284 shares are beneficially owned through Mr.Mr Wong’s 42.12 % interest in Top Group International Ltd.,Limited, or Top Group, and 254,2627,145,289 shares are owned directly by Mr.Mr Wong. |
|
| (2) | | Of the 352,792,737382,100,443 shares, 318,516,999339,814,284 shares are beneficially owned through Mr.Mr Cheung’s 27.062%27.06% interest in Top Group,10,508,000Group, 17,361,820 shares are owned directly by Mr. Cheung and 23,767,73824,924,339 shares are beneficially owned through Mr. Cheung’s 50% interest in Worship Limited. |
|
| (3) | | Percentage ownership is based on 627,218,404679,594,047 shares issued as of January 21, 2008.December 15, 2009. |
(4)
| Options to subscribe for 8,000,000 shares were granted to Mr. Wong for a purchase price of HK$1.00, at an exercise price of HK$1.54 per share and exercisable on or before October 20, 2014 in the following manner: (i) 4,000,000 on or after January 5, 2005, (ii) 2,000,000 on or after January 1, 2006 and (iii) 2,000,000 on or after January 1, 2007. The grant of options was proposed on October 21, 2004 and approved by shareholders at our annual general meeting held on December 29, 2004. Options to subscribe for 6,000,000 shares were granted to Mr. Wong on May 22, 2006 for a purchase price of HK$1.00, at an exercise price of HK$0.66 per share and exercisable on or before May 21, 2016 in the following manner: (i) 2,000,000 on or after May 22, 2007, (ii) 2,000,000 on or after May 22, 2008; and (iii) 2,000,000 on or after May 22, 2009.
|
(5)
| Options to subscribe for 8,000,000 shares were granted to Mr. Cheung for a purchase price of HK$1.00, at an exercise price of HK$1.54 per share and exercisable on or before October 20, 2014 in the following manner: (i) 4,000,000 on or after January 5, 2005, (ii) 2,000,000 on or after January 1, 2006 and (iii) 2,000,000 on or after January 1, 2007. The grant of options was proposed on October 21, 2004 and approved by shareholders at our annual general meeting held on December 29, 2004. Options to subscribe for 6,000,000 shares were granted to Mr. Cheung on May 22, 2006 for a purchase price of HK$1.00, at an exercise price of HK$0.66 per share and exercisable on or before May 21, 2016 in the following manner: (i) 2,000,000 on or after May 22, 2007, (ii) 2,000,000 on or after May 22, 2008; and (iii) 2,000,000 on or after May 22, 2009.
|
(6)
| Options to subscribe for 6,000,000 shares were granted to Mr. Lai on June 3, 2004 for a purchase price of HK$1.00, at an exercise price of HK$1.47 per share and exercisable on or before June 2, 2014 in the following manner: (i) 5,000,000 on or after May 1, 2005, and (ii) 1,000,000 on or after May 1, 2006. Options to subscribe for 3,000,000 shares were granted to Mr. Lai on May 22, 2006 for a purchase price of HK$1.00, at an exercise price of HK$0.66 per share and exercisable on or before May 21, 2016 in the following manner: (i) 1,000,000 on or after May 22, 2007, (ii) 1,000,000 on or after May 22, 2008; and (iii) 1,000,000 on or after May 22, 2009. On October 17, 2007, Mr. Lai exercised options to acquire 7,000,000 shares for a total amount of consideration of HK$9,480,000.
|
(7)
| Options to subscribe for 2,000,000 shares were granted to Mr. Chong on October 21, 2004 for a purchase price of HK$1.00, at an exercise price of HK$1.54 per share and exercisable on or before October 20, 2014 in the following manner: (i) 1,000,000 on or after January 1, 2005, (ii) 500,000 on or after January 1, 2006, and (iii) 500,000 on or after January 1, 2007. Options to subscribe for 1,500,000 shares were granted to Mr. Chong on May 22, 2006 for a purchase price of HK$1.00, at an exercise price of HK$0.66 per share and exercisable on or before May 21, 2016 in the following manner: (i) 500,000 on or after May 22, 2007, (ii) 500,000 on or after May 22, 2008; and (iii) 500,000 on or after 22 May 2009. On December 13, 2007, Mr. Chong exercised options to acquire 500,000 shares for a total amount of consideration of HK$330,000.
|
(8)
| Options to subscribe for 500,000 shares were granted to Mr. Lo on October 21, 2004 for a purchase price of HK$1.00, at an exercise price of HK$1.54 per share and exercisable on or before October 20, 2014 in the following manner: (i) 200,000 on or after January 1, 2005, (ii) 200,000 on or after January 1, 2006, and (iii) 100,000 on or after January 1, 2007. Options to subscribe for 1,500,000 shares were granted to Mr. Lo on May 22, 2006 for a purchase price of HK$1.00, at an exercise price of HK$0.66 per share and exercisable on or before May 21, 2016 in the following manner: (i) 500,000 on or after May 22, 2007, (ii) 500,000 on or after May 22, 2008; and (iii) 500,000 on or after May 22, 2009.
|
(9)
| Options to subscribe for 1,000,000 shares were granted to Mr. Yeung on October 3, 2005 for a purchase price of HK$1.00, at an exercise price of HK$0.81 per share and exercisable from October 1, 2006 to September 30, 2015. Options to subscribe for 3,000,000 shares were granted to Mr. Yeung on May 22, 2006 for a purchase price of HK$1.00, at an exercise price of
|
| | HK$0.66 per share and exercisable on or before May 21, 2016 in the following manner: (i) 1,000,000 on or after May 22, 2007, (ii) 1,000,000 on or after May 22, 2008; and (iii) 1,000,000 on or after May 22, 2009. On November 22, 2007, Mr. Yeung exercised options to acquire 2,000,000 shares for a total amount of consideration of HK$1,470,000.
|
(10)
(4) | Options to subscribe for 1,000,000 shares were granted to Mr. Chang on July 3, 2006 for a purchase price of HK$1.00, at an exercise price of HK$0.68 per share and exercisable on or before July 2, 2016 in the following manner: (i) 300,000 on or after July 3, 2007, (ii) 300,000 on or after July 3, 2008; and (iii) 400,000 on or after July 3, 2009. On July 9, 2007, Mr. Chang exercised options to acquire 300,000 shares for a total amount of consideration of HK$204,000.
|
(11)
| Beneficial ownership is determined in accordance with the rules of the SEC. |
40
Item 6 Directors, senior management and employees (continued)
Share ownership (continued)
The following table sets forth the share options for the details of the share options held by the directors and senior management of the Company as at December 15, 2009:
| | | | | | | | | | | | | | | | | | | | | | | | | | | |
| | | | | | | | | | | | | | | Adjustment | | | | | | | | | |
| | | | | | | | | | | Options | | | | to number | | | Options | | | Options | | | |
| | | | | | | Balance | | | granted | | | | of options | | | exercised | | | cancelled/ | | Balance | |
| | | | | | | as at | | | during | | | | for 2008 | | | during | | | lapsed | | as at | |
| | | Date of | | Exercise | | January 9, | | | the | | Exercise | | Final | | | the | | | during | | December 15, | |
| | | grant | | price | | 2009 | | | period | | period | | dividend | | | period | | | the period | | 2009 | |
| | | | | | | | | | | | | | | (note 1) | | | | | | | | | | | |
| | | | | HK$ | | | | | | | | | | | | | | | | | | | | | | |
| Directors | | | | | | | | | | | | | | | | | | | | | | | | | | |
| Mr. Wong Wai Kay, Ricky | | January 5, 2005 | | 1.5224
(note 4) | | | 8,053,478 | | | — | | January 5, 2005 to October 20, 2014 | | | 38,126 | | | | — | | | — | | | 8,091,604 | |
| | | | | |
| | | May 22, 2006 | | 0.6523
(note 5) | | | 6,040,108 | | | — | | May 22, 2007 to May 21, 2016 | | | 28,593 | | | | 6,068,701 | | | — | | — |
| | | | | |
| Mr. Cheung Chi Kin, Paul | | January 5, 2005 | | 1.5224
(note 4) | | | 8,053,478 | | | — | | January 5, 2005 to October 20, 2014 | | | 38,126 | | | | — | | | — | | | 8,091,604 | |
| | | | | |
| | | May 22, 2006 | | 0.6523
(note 5) | | | 6,040,108 | | | — | | May 22, 2007 to May 21, 2016 | | | 28,593 | | | | 6,068,701 | | | — | | — |
| | | | | |
| Mr. Yeung Chu Kwong, William | | May 22, 2006 | | 0.6523
(note 5) | | | 1,013,369 | | | — | | May 22, 2007 to May 21, 2016 | | | 4,796 | | | | — | | | — | | | 1,018,165 | |
| | | | | |
| | | February 6, 2008 | | 1.7568
(note 6) | | | 6,016,309 | | | — | | (note 2) | | | 28,482 | | | | — | | | — | | | 6,044,791 | |
| | | | | |
| Mr. Lai Ni Quiaque | | May 22, 2006 | | 0.6523
(note 5) | | | 2,013,369 | | | — | | May 22, 2007 to May 21, 2016 | | | 9,530 | | | | — | | | — | | | 2,022,899 | |
| | | | | |
| | | February 11, 2008 | | 1.8660
(note 7) | | | 6,016,309 | | | — | | (note 3) | | | 28,482 | | | | — | | | — | | | 6,044,791 | |
| | | | | |
Senior management | | | | | | | | | | | | | | | | | | | | | | | | | | |
| | | | | |
| Mr. Chong Kin Chun, John | | October 21, 2004 | | 1.5224
(note 4) | | | 2,013,368 | | | — | | January 1, 2005 to October 20, 2014 | | | 9,532 | | | | — | | | — | | | 2,022,900 | |
| | | | | |
| | | May 22, 2006 | | 0.6523
(note 5) | | | 503,342 | | | — | | May 22, 2007 to May 21, 2016 | | | 2,383 | | | | 505,725 | | | — | | — |
| | | | | |
| Mr. Lo Sui Lun | | October 21, 2004 | | 1.5224
(note 4) | | | 503,343 | | | — | | January 1, 2005 to October 20, 2014 | | | 2,383 | | | | — | | | — | | | 505,726 | |
| | | | | |
| | | May 22, 2006 | | 0.6523
(note 5) | | | 1,510,026 | | | — | | May 22, 2007 to May 21, 2016 | | | 7,149 | | | | — | | | — | | | 1,517,175 | |
| | | | | |
| Dr. Tam Ming Chit | | May 2, 2008 | | 1.7866
(note 8) | | | 1,002,718 | | | — | | (note 2) | | | 4,747 | | | | — | | | — | | | 1,007,465 | |
| | | | | |
| Ms. To Wai Bing | | February 15, 2008 | | 1.7568
(note 6) | | | 1,002,718 | | | — | | (note 2) | | | 4,747 | | | | — | | | — | | | 1,007,465 | |
| | | | | |
41
Item 6 Directors, senior management and employees (continued)
Share ownership (continued)
| | |
| Notes: |
|
| (1) | | As a result of allotment of 12,212,142 new shares to shareholders of the Company who elected to receive the 2008 Final Dividend in shares on February 25, 2009, the exercise price of and the number of share subject to the 60,299,426 share options outstanding on December 19, 2008 (being the Record Date for determining the entitlement of 2008 Final Dividend) were adjusted pursuant to the 2002 Share Option Scheme with effect from February 25, 2009. The closing price per share immediately before the date of the grant of the Options was HK$0.88. |
|
| (2) | | The exercise of the Options is subject to certain conditions that must be achieved by the grantees. The Options shall be exercised not later than December 23, 2012. |
|
| (3) | | The exercise of the Options is subject to the performance of the Company’s share. The Options shall be exercised not later than December 23, 2012. |
|
| (4) | | Exercise price of the share options was adjusted from HK$1.5297 to HK$1.5224 per ordinary share as a result of our payment of the 2008 Final Dividend (see note 1). |
|
| (5) | | Exercise price of the share options was adjusted from HK$0.6554 to HK$0.6523 per ordinary share as a result of our payment of the 2008 Final Dividend (see note 1). |
|
| (6) | | Exercise price of the share options was adjusted from HK$1.7652 to HK$1.7568 per ordinary share as a result of our payment of the 2008 Final Dividend (see note 1). |
|
| (7) | | Exercise price of the share options was adjusted from HK$1.8749 to HK$1.8660 per ordinary share as a result of our payment of the 2008 Final Dividend (see note 1). |
|
| (8) | | Exercise price of the share options was adjusted from HK$1.7951 to HK$1.7866 per ordinary share as a result of our payment of the 2008 Final Dividend (see note 1). |
All shareholders own ordinary shares and enjoy the same voting rights with respect to each share.
We adopted a second share option scheme, which we refer to as the 2002
Share Option Scheme, on December 23, 2002 and terminated the share option scheme adopted
and in effect sinceon July 12, 1997, which we refer to as the 1997
Share Option Scheme. Upon termination of the 1997
Share Option Scheme, no further options can be granted under the 1997
Share Option Scheme. Options granted under the 1997
Share Option Scheme that are not exercised
have lapsed automatically on July 12, 2007. Under the terms of the 2002
Share Option Scheme, our board of directors
or the Board, may, in its discretion from time to time, and subject to such conditions as the
Boardboard may determine, within ten years beginning on December 23, 2002, grant any employee or executive or officer of the Company or any of its subsidiaries (including executive, non-executive and independent non-executive directors of each of the abovementioned companies) and any suppliers or professional advisers who will or have provided services to the Company and/or its subsidiaries to subscribe for our ordinary shares.
The maximum number of ordinary shares which may be issued upon exercise of all options to be granted under our 2002
Share Option Scheme and any of our other share option scheme(s) must not exceed 10% of the ordinary shares in issue as of the date of approval or adoption of the scheme by the shareholders
which wason December 23,
2002 for the 2002 Scheme.2002. Ordinary shares which would have been issuable pursuant to options which have lapsed in accordance with the terms of such share option schemes will not be counted for the purpose of the 10% limit. Such limit may be refreshed upon approval by shareholders and compliance with all requirements under the Rules Governing the Listing of Securities on The Stock Exchange of Hong Kong Limited, which we refer to as the Listing Rules. Pursuant thereto, such limit was refreshed with the approval of our shareholders in our annual general meeting held on December 24, 2007 up to a maximum limit equal to 10% of our total number of issued shares as at December 24, 2007. Notwithstanding the foregoing, the number of ordinary shares which may be issued upon exercise of all outstanding options granted and yet to be exercised under our 2002
Share Option Scheme and any of our other share option scheme(s) at any time shall not exceed 30% of the total number of ordinary shares in issue from time to time.
The total number of ordinary shares issued and which may be issued upon exercise in full of the options granted under our 2002
Share Option Scheme and any of our other share option scheme(s) (including exercised, cancelled and outstanding options) to each eligible participant in any
12 month12-month period up to and including the date of grant shall not exceed 1% of the outstanding ordinary shares as at the date of grant. Any further grant of options in excess of this 1% limit must be approved by shareholders.
The subscription price for an ordinary share payable by a participant upon the exercise of any option granted under the 2002 Share Option Scheme will be determined by the Board in its absolute discretion, except that such price will not be less than the highest of (a) the closing price of the ordinary shares as stated in The Stock Exchange of Hong Kong Limited’s daily quotations sheet on the date of grant, which must be a business day; (b) the average of the closing prices of the ordinary shares as stated in The Stock Exchange of Hong Kong Limited’s daily quotations sheets for the 5 business days immediately preceding the date of grant; and (c) the nominal value of an ordinary share.
42
Any grant of options to any of our directors, chief executives or substantial shareholders or any of their respective associates (as defined in the Listing Rules) is required to be approved by our non-grantee independent non-executive directors. If we propose to grant options to a substantial shareholder or any of its independent non-executive directors, or their respective associates, which will result in the number of ordinary shares issued and to be issued upon exercise of options granted and to be granted under our 2002
Share Option Scheme and any of our other share option scheme(s) (including options exercised, cancelled and outstanding) to such person in the
12 month12-month period up to and including the date of such grant (a) representing in aggregate over 0.1% of the outstanding ordinary shares; and (b) having an aggregate value in excess of HK$5 million, based on the closing price of the ordinary shares at the date of each grant, such further grant of options will be subject to approval by shareholders and all requirements under the Listing Rules.
A grant of options may not be made after a price sensitive event has occurred or a price sensitive matter has been the subject of a decision until such price sensitive information, including annual and interim results, has been made public.
The period during which an option may be exercised will be determined by
the Boardour board of directors in its absolute discretion, except that no option may be exercised later than ten years from the date of grant. No option may be granted more than ten years after December 23, 2002. Subject to our earlier termination, the 2002
Share Option Scheme shall be valid and effective for a period of ten years after the date of adoption, that is, until December 23, 2012. In addition and to the extent not already exercised, an option will automatically lapse and not be exercisable upon the occurrence of any of the following events:
| (a) | (i) | the expiry date relevant to that option; |
| |
(ii)(b) | | one month following the date a grantee ceases to be an eligible participant for any reason other than death or termination of his relationship with us (or the relevant subsidiary, as the case may be) on any of the grounds specified in (vii)(g) below; |
| |
(iii)(c) | | 12 months, or such longer period as the Board may determine, following the death of a grantee whose relationship with us (or the relevant subsidiary, as the case may be) would not have been terminated on any of the grounds specified in (vii)(g) below; |
| |
(iv)(d) | | 21 days following the date an effective resolution is passed for our voluntary winding-up; |
| |
(v)(e) | | subject to (iv)(d) above, the date of commencement of such winding-up; |
| |
(vi)(f) | | the date on which any compromise or arrangement between us and our members or creditors in connection with a scheme for our reconstruction or our amalgamation with any other company or companies becomes effective; |
| |
(vii)(g) | | the date on which the grantee ceases to be an eligible participant by reason of the termination of his or her relationship with us or the relevant subsidiary on any one or more of the grounds of serious misconduct or breach, bankruptcy, insolvency, composition with his or her creditors or conviction of any criminal offence involving his or her integrity or honesty or, in the case of a grantee-employee and if so determined by the Board, on any other common law, statutory or contractual ground on which an employer would be entitled to terminate such grantee’s employment; |
| |
(viii)(h) | | 14 days following the date a general offer (which has been made to shareholders by way of take-over offer, share repurchase offer or scheme of arrangement or otherwise in like manner) becomes, or is declared unconstitutional; and |
| |
(ix)(i) | | the date on which we cancel the options by reason that the grantee in any way sells, transfers, charges, mortgages, encumbers or creates any interest in favorfavour of any third party over or in relation to any of his or her options or attempt to do so. |
As of January 21, 2008,December 15, 2009, a total number of 72,280,00090,247,857 options were granted, 12,625,00032,792,350 options were exercised, 8,020,00013,902,353 options were lapsed and 51,635,00043,553,154 options remain outstanding and unexercised. In our annual general meeting held on December 24, 2007, our shareholders approved the refreshment of the 2002 Scheme limit, i.e. 62,704,840 shares representing 10% of the issued share capital of the Company as at December 24, 2007. A totalTotal number of 62,704,84050,619,336 options isare available for issue as of January 21, 2008.December 15, 2009.
43
ITEM 7. MAJOR SHAREHOLDERS AND RELATED PARTY TRANSACTIONSItem 7 Major shareholders and related party transactions A. Major Shareholdersshareholders The following table sets forth certain information regarding ownership of our ordinary shares as of
January 21, 2008December 15, 2009 by all persons who are known to us to own beneficially 5% or more of our ordinary shares.
| | | | | | | |
Title of Class | | Identity of Person or Group | | Beneficially
Owned(6) | | | Percentages of Shares Beneficially Owned
(%)(1) |
Ordinary Shares | | Wong Wai Kay, Ricky | | 318,771,261 | (2) | | 50.82 |
Ordinary Shares | | Cheung Chi Kin, Paul | | 352,792,737 | (3) | | 56.25 |
Ordinary Shares | | Top Group International Ltd. | | 318,516,999 | | | 50.78 |
Ordinary Shares | | Leung Ka Pak | | 318,516,999 | (4) | | 50.78 |
Ordinary Shares | | Yau Ming Yan, Andrew | | 318,516,999 | (4) | | 50.78 |
Ordinary Shares | | EK Investment Management Limited | | 55,542,000 | (5) | | 8.86 |
| | | | | | | | | | | | | |
| | | | | | | | | | | Percentages | |
| | | | | | | | | | | of shares | |
| | | Identity of person | | | Beneficially | | | beneficially | |
| Title of class | | or Group | | | owned | | | owned | |
| | | | | | | (note 5) | | | (note 1) | |
| | | | | | | | | | | % | |
| Ordinary shares | | Wong Wai Kay, Ricky | | | 346,959,573
(note 2) | | | | 51.05 | |
| | | | | |
| Ordinary shares | | Cheung Chi Kin, Paul | | | 382,100,443
(note 3) | | | | 56.22 | |
| | | | | |
| Ordinary shares | | Top Group International Limited | | | 339,814,284 | | | | 50.00 | |
| | | | | |
| Ordinary shares | | Leung Ka Pak | | | 339,814,284
(note 4) | | | | 50.00 | |
| | | | | |
| Ordinary shares | | Yau Ming Yan, Andrew | | | 339,814,284
(note 4) | | | | 50.00 | |
(1)
| | |
| Notes: |
|
| (1) | | Percentage ownership is based on 627,218,404679,594,047 shares issued as of January 21, 2008.December 15, 2009. |
|
| (2) | | Of the 318,771,261346,959,573 shares, 318,516,999339,814,284 shares are beneficially owned through Mr. Wong’s 42.12 % interest in Top Group International Limited or Top Group, and 254,2627,145,289 shares are owned directly by him. Top Group International Limited, Top Group is a holding company incorporated in British Virgin Islands with no active operations. Top Group has two directors, Mr. Wong Wai Kay, Ricky and Mr. Cheung Chi Kin, Paul, who are our chairman and vice chairman respectively. They are two of shareholders of Top Group. Mr. Leung Ka Pak and Mr. Yau Ming Yan, Andrew are the two other shareholders of Top Group. |
|
| (3) | | Of the 352,792,737382,100,443 shares, 318,516,999339,814,284 shares are beneficially owned through Mr. Cheung’s 27.062%27.06% interest in Top Group, 10,508,00017,361,820 shares are owned directly by Mr. Cheung and 23,767,73824,924,339 shares are beneficially owned through Mr. Cheung’s 50% interest in Worship Limited. |
|
| (4) |
| The 318,516,999339,814,284 shares are beneficially owned through Mr. Leung’s 21%21.00% and Mr. Yau’s 9.8%9.82% interest in Top Group. Mr. Leung Ka Pak was a director and the president of all of the Company’s subsidiaries in Canada (other than City Telecom (Canada) Inc.). He resigned as a director and president in October 2005. After Mr. Leung resigned, Mr. Yau Ying Yan, Andrew was a director and the president of all subsidiaries in Canada (other than City Telecom (Canada) Inc.). He resigned as a director and president in July 2006. |
(5)
|
| (5) | The 55,542,000 shares owned by EK Investment Management Limited is the number of shares as notified to us by EK Investment Management Limited as of December 18, 2007.
|
(6)
| Beneficial ownership is determined in accordance with the rules of the SEC. |
As of
January 21, 2008,December 15, 2009, there were
1113 registered holders of
2,586,1273,295,700 American Depositary Shares in the United States, consisting of
8.25 %9.70% of our outstanding shares.
All shareholders own ordinary shares and enjoy the same voting rights with respect to each share.
Top Group International Ltd. is a holding company incorporated in British Virgin Islands with no active operations. Top Group has two directors, Mr. Wong Wai Kay, Ricky and Mr. Cheung Chi Kin, Paul, who are our chairman and chief executive officer respectively. They are two of shareholders of Top Group. Mr. Leung Ka Pak and Mr. Yau Ming Yan, Andrew are the two other shareholders of Top Group.
Mr. Leung Ka Pak was a director and the president of all subsidiaries in Canada other than City Telecom (Canada) Inc.. He resigned as a director and president in October 2005. After Mr. Leung resigned, Mr. Yau Ming Yan, Andrew was a director and the president of all our subsidiaries in Canada other than City Telecom (Canada) Inc.. He resigned as a director and president in July 2006.
EK Investment Management Limited is not affiliated with us or our officers or directors.
Except as disclosed above, we are not directly or indirectly owned or controlled by any other person, corporation or foreign government.
We are not aware of any arrangement the operation of which may at a subsequent date result in a change of control of City Telecom.
B. Related Party Transactionsparty transactions For the period since the beginning of our preceding three financial years up to the date of this document, we were a party to the following related party transactions.
Contracts with Our Directorsour directors and Senior Managementsenior management
All of our directors and senior management have employment service agreements with us. Certain of our directors and senior management receive housing allowances, pensions, bonuses and bonuses.commissions. In addition, some of our directors are also senior management of City Telecom and these persons may also have the ability to make significant business decisions effecting our operations. See Item 6 “Directors and Senior Management”senior management” above of this annual report for details concerning these arrangements.
44
C. Interests of Expertsexperts and Counselcounsel ITEM 8. FINANCIAL INFORMATIONItem 8 Financial information A. Consolidated Statementsstatements and Other other financial information
Financial InformationstatementsFinancial Statements
See pages F-1 –
F-90F-51 following Item 19.
Legal and Regulatory Proceedingsregulatory proceedings
We are currently involved in
twoa material legal or regulatory
proceedings. They areproceeding relating to Fixed Mobile Interconnection Charges, or FMIC, as described below:
People’s Telecom.
In
March 2004,February 2008, our wholly owned subsidiary,
Hong Kong Broadband Network Limited (“HKBN”)HKBN, requested the Telecommunications Authority to make a determination, pursuant to section 36A of the Telecommunications Ordinance (Cap 106), in respect of the level of fixed-mobile interconnection charge,
(“FMIC”)or FMIC, to be paid by
four mobile operators including China
Resources PeoplesMobile Hong Kong Company Limited, CSL Limited, Hutchison Telephone Company Limited,
(“Peoples”)and SmarTone Mobile Communications Limited on the rate of FMIC and the
effective date of such charges.interest thereon. This FMIC is paid by a mobile network operator to the interconnecting fixed network operator for telephony traffic both from a fixed line to a mobile phone and from a mobile phone to a fixed line. In
May 2004,September 2008, the Telecommunications Authority
confirmed to Peoplesindicated that it accepted HKBN’s request for determination and
HKBN that mobile operators (in this case Peoples) should pay interconnection charges to fixed network operators (in this case HKBN) in accordance with the existing charging principles stated clearly in the relevant Statementson November 25, 2009 issued
by the Telecommunications Authority, particular in Statements No. 5 & 7. In August 2004, the Telecommunications Authority agreed to commence a determination regarding the level and effective date of FMIC payable to HKBN by Peoples. In March 2006, the Telecommunications Authority issued a preliminary analysis and requested comments from HKBN. HKBN submitted its
response to the Telecommunications Authority in July 2006 and September 2006 respectively. Finally, in June 2007, the Telecommunications Authority made a determination on the level of FMIC payable by Peoples to HKBNPreliminary Analysis for the
period from April 2002 to August 2004.PCCW caseOn December 24, 2007, PCCW IMS Limited filed a Writ together with an Endorsement of Claim with the High Court of Hong Kong, alleging a claim against the Company in respect of an advertisement published by the Company on December 19, 2007, seeking damages of no less than HK$1,000,000 and an injunction preventing further publication of the advertisement, based on defamation and malicious falsehood.parties’ comments. The Company is now waiting for the detailed Statement of Claim to be filed by PCCW IMS Limited and shall contest this claim accordingly.
determination proceedings will progress into 2010.
Unless the relevant provisions of the
Hong Kong Companies Ordinance require otherwise, we may by ordinary resolution (being a resolution passed by a majority of our shareholders who attend and vote at a meeting of shareholders) from time to time declare dividends, but no dividend shall exceed the amount recommended by our board of directors. Our Articles contain provisions on apportioning dividends where shares are not or were not fully paid for during the period covered by the dividend.
Unless the relevant provisions of the
Hong Kong Companies Ordinance require otherwise, our board of directors may pay such interim dividends as appears to them to be justified by our financial position and pay any dividend payable at a fixed rate at intervals decided upon by our board of directors, whatever our financial position, if the board of directors feels that this payment is justified.
Any dividend not claimed by a shareholder after a period of six years from the date when it was first due to be paid shall be forfeited and shall revert to us. The payment by our board of directors of any unclaimed dividend, interest or other sum payable on or in respect of a share into a separate account shall not make us responsible as a trustee for such sums.
For fiscal 2007,2009, an interim dividend was declared andat HK3 cents per ordinary share. The total amount of HK$19,904,437.98 was paid as cash dividend on June 26, 2009.
A final dividend of
HK4HK16 cents per ordinary share
totaling of HK$24,635,000. A final dividend of HK4 cents per ordinary share together with a script alternative was proposed on November
22, 2007,5, 2009, which was subsequently approved by shareholders in the annual general meeting held on December
24, 2007.18, 2009. The 2009 Final Dividend will be paid on or about December 30, 2009.
B. Significant ChangeschangesNone
None.
ITEM 9. THE OFFER AND LISTINGItem 9 The offer and listing A. Offer and Listing Detailslisting details Our ordinary shares
werehave been listed under the number “1137” on
theThe Stock Exchange of Hong Kong Limited,
(the “SEHK”) onor the HKSE, since August 4, 1997. Our American depositary shares, each representing 20 ordinary shares,
werehave been listed under the symbol “CTEL” on
the Nasdaq
onsince November 3, 1999. Our
8.75%10-year senior notes were listed under the ISIN codes of US178677AA87 and USY16599AA30 on the Singapore Exchange Securities Trading Limited,
(“SGX-ST”)or SGX-ST, on January 24, 2005. The
8.75%10-year senior notes were subsequently exchanged for registered notes with ISIN code US178677AB60 pursuant to a registration statement under the U.S. Securities Act of 1933 on June 24, 2005.
The price of our ordinary shares on the SEHKHKSE as of its close of trading on January 21, 2008December 15, 2009 was HK$1.923.590 per share. The table below shows the high and low closing prices of the shares on the SEHKHKSE since listing.
| | | | | | | | | |
| | | Price | |
| | | High | | | Low | |
| | | (In HK$) | |
| 2004 | | | 2.975 | | | | 1.310 | |
| 2005 | | | 1.530 | | | | 0.550 | |
| 2006 | | | 0.830 | | | | 0.570 | |
| 2007 | | | 3.670 | | | | 0.830 | |
45
| | | | |
| | | Price |
| | | High | | Low |
| | | (In HK$) |
2003 | | 3.375 | | 1.320 |
2004 | | 2.975 | | 1.310 |
2005 | | 1.530 | | 0.550 |
2006 | | 0.830 | | 0.570 |
2007 | | 3.670 | | 0.830 |
| | |
2006 | | | | |
January to March | | 0.770 | | 0.570 |
April to June | | 0.820 | | 0.600 |
July to September | | 0.710 | | 0.630 |
October to December | | 0.830 | | 0.600 |
| | |
2007 | | | | |
January to March | | 1.560 | | 0.830 |
April to June | | 2.200 | | 1.250 |
July to September | | 2.120 | | 1.780 |
October to December | | 3.670 | | 1.930 |
| | |
2007 | | | | |
August | | 2.000 | | 1.780 |
September | | 2.020 | | 1.900 |
October | | 3.670 | | 1.960 |
November | | 3.140 | | 1.930 |
December | | 2.450 | | 2.060 |
| | |
2008 | | | | |
January (through January 21, 2008) | | 2.170 | | 2.100 |
| | | | | | | | | |
| | | Price | |
| | | High | | | Low | |
| | | (In HK$) | |
| 2008 | | | 2.170 | | | | 0.750 | |
| | | | | | | | | |
2007 | | | | | | | | |
| | | | | | | | | |
| January to March | | | 1.560 | | | | 0.830 | |
| April to June | | | 2.200 | | | | 1.250 | |
| July to September | | | 2.120 | | | | 1.780 | |
| October to December | | | 3.670 | | | | 1.930 | |
| | | | | | | | | |
2008 | | | | | | | | |
| | | | | | | | | |
| January to March | | | 2.170 | | | | 1.620 | |
| April to June | | | 2.090 | | | | 1.670 | |
| July to September | | | 1.950 | | | | 1.340 | |
| October to December | | | 1.360 | | | | 0.750 | |
| | | | | | | | | |
2009 | | | | | | | | |
| | | | | | | | | |
| January to March | | | 1.140 | | | | 0.840 | |
| April to June | | | 1.780 | | | | 1.100 | |
| July to September | | | 2.630 | | | | 1.630 | |
| October to December (through December 15, 2009) | | 3.950 | | | 2.500 | |
| | | | | | | | | |
2009 | | | | | | | | |
| | | | | | | | | |
| June | | | 1.780 | | | | 1.610 | |
| July | | | 1.860 | | | | 1.630 | |
| August | | | 2.070 | | | | 1.850 | |
| September | | | 2.630 | | | | 2.030 | |
| October | | | 2.880 | | | | 2.550 | |
| November | | 3.920 | | | 2.500 | |
| December (through December 15, 2009) | | 3.950 | | | 3.440 | |
The price of our American depositary shares on Nasdaq as of its close of trading on January 18, 2008December 15, 2009 was US$4.709.249 per American depositary share. The table below shows the high and low closing prices of the American depositary shares on Nasdaq since listing.
| | | | | | | | | |
| | | Price | |
| | | High | | | Low | |
| | | (In US$) | |
| 2004 | | | 7.720 | | | | 3.320 | |
| 2005 | | | 3.980 | | | | 1.370 | |
| 2006 | | | 2.009 | | | | 1.380 | |
| 2007 | | | 10.750 | | | | 2.010 | |
| 2008 | | | 5.750 | | | | 1.915 | |
| | | | | | | | | |
2007 | | | | | | | | |
| | | | | | | | | |
| January to March | | | 4.350 | | | | 2.010 | |
| April to June | | | 5.830 | | | | 3.100 | |
| July to September | | | 5.600 | | | | 4,050 | |
| October to December | | | 10.750 | | | | 4.830 | |
| | | | | | | | | |
2008 | | | | | | | | |
| | | | | | | | | |
| January to March | | | 5.580 | | | | 4.250 | |
| April to June | | | 5.750 | | | | 4.370 | |
| July to September | | | 4.910 | | | | 2.950 | |
| October to December | | | 3.380 | | | | 1.915 | |
| | | | | | | | | |
2009 | | | | | | | | |
| | | | | | | | | |
| January to March | | | 2.870 | | | | 2.000 | |
| April to June | | | 4.650 | | | | 2.870 | |
| July to September | | | 7.023 | | | | 4.050 | |
| October to December (through December 15, 2009) | | 10.300 | | | 6.610 | |
| | | | | | | | | |
2009 | | | | | | | | |
| | | | | | | | | |
| June | | | 4.650 | | | | 4.010 | |
| July | | | 4.830 | | | | 4.050 | |
46
| | | | |
| | | Price |
| | | High | | Low |
| | | (In HK$) |
2003 | | 9.550 | | 3.100 |
2004 | | 7.720 | | 3.320 |
2005 | | 3.980 | | 1.370 |
2006 | | 2.009 | | 1.380 |
2007 | | 10.750 | | 2.010 |
| | |
2006 | | | | |
January to March | | 1.900 | | 1.440 |
April to June | | 1.970 | | 1.380 |
July to September | | 1.760 | | 1.540 |
October to December | | 2.009 | | 1.400 |
| | |
2007 | | | | |
January to March | | 4.350 | | 2.010 |
April to June | | 5.830 | | 3.100 |
July to September | | 5.600 | | 4.050 |
October to December | | 10.750 | | 4.830 |
| | |
2007 | | | | |
August | | 5.020 | | 4.050 |
September | | 5.140 | | 4.750 |
October | | 10.750 | | 4.830 |
November | | 7.530 | | 4.950 |
December | | 6.470 | | 5.240 |
| | |
2008 | | | | |
January (through January 18, 2008) | | 5.580 | | 4.690 |
| | | | | | | | | |
| | | Price | |
| | | High | | | Low | |
| | | (In US$) | |
| August | | | 5.240 | | | | 4.560 | |
| September | | | 7.023 | | | | 5.290 | |
| October | | | 7.750 | | | | 6.750 | |
| November | | 10.000 | | | 6.610 | |
| December (through December 15, 2009) | | 10.300 | | | 8.800 | |
Not
applicableapplicable.
C. MarketsOur ordinary shares of common stock were listed under the number “1137” on the SEHK on August 4, 1997. Our American depositary shares, each representing 20 ordinary shares, were listed under the symbol “CTEL” on the Nasdaq on November 3, 1999. Our 8.75% notes were listed under the ISIN codes of US178677AA87 and USY16599AA30 on the SGX-ST on January 24, 2005. The 8.75% notes were subsequently exchanged for registered notes with ISIN code US178677AB60 pursuant to a registration statement under the U.S. Securities Act of 1933 on June 24, 2005.
See Item 9A above.
Not
applicableapplicable.
Not
applicableapplicable.
Not
applicableapplicable.
ITEM 10. ADDITIONAL INFORMATIONItem 10 Additional information Not
applicableapplicable.
B. Memorandum and Articles of Association Described below is a summary of certain provisions of our existing Memorandum and Articles of Association (the “Articles”) and, where relevant, the
Hong Kong Companies
Ordinance (Chapter 32 of the laws of Hong Kong) (the “Companies Ordinance”).Ordinance. As this is a summary, it does not contain all the information that may be important to you. You should therefore read our complete Articles if you would like additional information, which were filed with the U.S. Securities and Exchange Commission as an exhibit 1 to the annual report on Form 20-F for fiscal 2005 and is incorporated by reference herein.
City Telecom was incorporated in Hong Kong on May 19, 1992 under the
Hong Kong Companies Ordinance. Clause 3 of the Memorandum of Association states that the
Company’ sCompany’s objects are to carry on the business of telecommunications services in addition to various other related and unrelated business activities.
Directors’ Interestsinterests
A director shall not vote on, or be counted in the quorum in relation to, any resolution of our board of directors in respect of any contract in which the director or any of his associate(s) (within the meaning of the Listing Rules) has a material interest. This prohibition shall not apply to the following:
| (a) | (a) | the giving of any security or indemnity to him or his associates(s) in respect of money lent or obligations incurred or undertaken by him or any of them at the request of or for the benefit of the Company or any of its subsidiaries; |
| (b) | (b) | the giving of any security or indemnity to a third party in respect of a debt or obligation of the Company or any of its subsidiaries for which he or his associate(s) has himself/themselves assumed responsibility in whole or in part and whether alone or jointly under a guarantee or indemnity or by the giving of security; |
| (c) | (c) | any proposal concerning an offer of shares, debentures or other securities of or by the Company or any other company which the Company may promote or be interested in for subscription or purchase in which offer he or his associate(s) is/are or is/are to be interested as a participant in the underwriting or sub-underwriting thereof; |
| (d) | (d) | any proposal concerning any other company in which he or his associate(s) is/are interested only, whether directly or indirectly, as an officer, executive or shareholder or in which he or his associate(s) is/are beneficially interested in shares of that company,Company, provided that he and any of his associate(s) are not in aggregate beneficially interested in five per cent.cent or more of the issued shares of any class of such companyCompany (or of any third company through which his interest or that of his associate(s) is derived) or of the voting rights; |
| (e) | (e) | any proposal or arrangement concerning the benefit of employees of the Company or its subsidiaries, including the adoption, modification or operation of any employees’ share scheme or any share incentive or share option scheme under which the director or his associate(s) may benefit; |
47
| (f) | (f) | any proposal or arrangement concerning the benefit of employees of the Company or its subsidiaries, including the adoption, modification or operation of a pension fund or retirement, death or disability benefits scheme which relates both to directors (or his associate(s)) and employees of the Company or any of its subsidiaries and does not provide in respect of any director or his associate(s), as such any privilege or advantage not generally accorded to the class of persons to which such scheme or fund relates; and |
| (g) | (g) | any contract or arrangement in which he or his associate(s) is/are interested in the same manner as other holders of shares or debentures or other securities of the Company by virtue only of his/their interest in shares or debentures or other securities of the Company. |
Additionally, there is no shareholding qualification required to be a director.
DividendsUnless the relevant provisions of the Companies Ordinance require otherwise,
In accordance with our Articles, we may by ordinary resolution (being a resolution passed by a majority of
ourthose votes cast by the shareholders who attend and vote at a
meeting of shareholders)general meeting) from time to time declare dividends, but no dividend shall exceed the amount recommended by our board of directors. Our Articles contain provisions on apportioning dividends
whereaccording to the amounts paid up on the shares
are not or were not fullyin respect of which dividend is paid
forunder pro rata basis during the period covered by the dividend.
Unless the relevant provisions of the Companies Ordinance require otherwise,
In accordance with our Articles, our board of directors may pay such interim dividends
as appears to themthat appear to be justified by our financial position and
may also pay any dividend payable at a fixed rate at intervals decided upon by our board of directors, whenever our financial position,
ifin the
opinion of our board of directors,
feels that this payment is justified.justifies the payment.
In respect of any dividend proposed to be paid or declared,
by our board of directors or by us in a general meeting, our board of directors may further propose and announce prior to or at the same time as the payment or declaration of such dividend either that:
| (a) | (a) | such dividend be madesatisfied in whole or in part in the form of an allotment of shares to the shareholders, credited as being fully paid up. However,up, provided that all the shareholders entitled to receive these new sharesthe dividend will also be entitled to choose to receive the dividend (or a part of it) in cash ;cash; or |
| (b) | (b) | the shareholders entitled to such dividend are entitled to elect to receive an allotment of shares credited as fully paid up instead of the whole or that part of the cash dividend as theour board of directors may decide upon. |
Any general meeting declaring a dividend may, upon the recommendation of our board of directors, by ordinary resolution, direct that the dividend shall be met, wholly or partly, by the distribution of our assets.
Any dividend not claimed by a shareholder after a period of six years from the date when it was first due to be paid shall be forfeited and shall revert to us. The payment by our board of directors of any unclaimed dividend, interest or other sum payable on or in respect of a share into a separate account shall not make us responsible ascreate any trustee relationship in respect of such sums.
Liquidation
Subject to the requirements under the Hong Kong Companies Ordinance, in the event of a
trustee for such sums.Liquidation
If the Company commences liquidation,members’ winding up, the liquidator may, with the sanction of a special resolution of the Company and any other sanction required by the Companies Ordinance:
Company: | (a) | (a) | divide among the shareholders the whole or any part of the assets of the Company and set such value as the liquidator deems fair upon any property to be divided and determine how the division shall be carried out between the shareholders; or |
| (b) | (b) | vest the whole or any part of such assets in trustees upon such trusts for the benefit of the contributories as the liquidator shall think fit, |
|
| | but no shareholder shall be compelled to accept any shares or other assets upon which there is any liability. |
but no shareholder shall be compelled to accept any shares or other assets upon which there is any liability.
Annual and Extraordinary General Meetingextraordinary general meeting of Shareholdersshareholders
The
Hong Kong Companies Ordinance requires our board of directors to hold an annual general meeting of our shareholders once every
calendar year and not more than 15 months after our previous annual general meeting. The annual general meeting and any other general meeting of our
shareholdersshareholder held for the passing of a special resolution (being a resolution passed by
a majority of not less than 75% of those
votes cast by the shareholders who attend and vote at a
meeting of shareholders)general meeting) should be convened by not less than 21 clear days’ notice in writing. The notice shall specify the place, date and time of meeting and the general nature of the business to be transacted. An annual general meeting may be called by
not less than
2120 clear
business days’ notice if it is agreed by all shareholders entitled to attend and vote at the meeting. The business of the annual general meeting will include:
| (a) | (a) | the declaration and sanctioning of dividends; |
| |
| (b) | | the consideration and adoption of the accounts, and balance sheet and the reportreports of the directors and auditors and other documents required to be attached to the financial statements; |
| |
| (c) | | the appointment of directors in place of those retiring (by rotation or otherwise); |
| |
| (d) | | the appointment of auditors; and |
| |
| (e) | | the fixing of, or the determining of the method of fixing, the remuneration of the directors and of the auditors. |
Our board of directors may convene an extraordinary general meeting (which is any general meeting of the shareholders other than the yearly annual general meeting) whenever it thinks fit and must do so upon the request in writing of shareholders holding not less than one-twentieth of our paid-up capital carrying the right to vote at thea general meeting. All extraordinary general meetings (other than those convened for the passing of a special resolution referred to above) should be convened by at not less than 1410 clear business days’ notice in writing. Extraordinary general meetings may be called by less than 1410 clear business days’ notice by a
48
majority in number of the shareholders having the right to attend and vote at the meeting, being a majority together holding not less than 95% in nominal value of the shares giving that right.
Except as otherwise provided by our Articles, two shareholders present in person or by proxy and entitled to vote shall be a quorum for all purposes.
NoWhilst no business shall be transacted at any general meeting unless a quorum is present when the meeting proceeds to business,
but the absence of a quorum shall not preclude the choice or appointment of a chairman which shall not be treated as part of the business of the meeting.
The Nasdaq marketplace rules also provide that a foreign private issuer such as
the Companyourselves may be granted an exemption from such requirements if it follows the practice of its home country.
Restrictions on Ownershipownership of Sharesshares
There are no restrictions, either pursuant to our Articles or
pursuant to the laws of Hong Kong, on the rights of non-residents of Hong Kong or foreign persons to hold or exercise voting rights with respect to our ordinary shares.
Any
business to be transacteddecisions that are made by the shareholders in a general meeting
requiresrequire the passing of either an ordinary or a special resolution at such meeting.
Generally, resolutionsThe type of resolution required to be passed depends upon the provisions of the
shareholders are passed by ordinary resolution. However, theHong Kong Companies Ordinance and our Articles
provide thatas certain matters may only be
passed asdecided by the passing of a special resolutions.
Unless any shares have special terms as to voting, on a show of hands every shareholder who is present in person at a general meeting, shall have one vote
irrespective of the number of shares he holds and on a poll every shareholder
member who is present in person or by proxy shall have one vote for every share of which he is the holder. Our Articles set out the circumstances in which a poll can be demanded.
Pursuant to Rule 13.39(4) of the Listing Rules which became effective on January 1, 2009, any votes of the Shareholders at a general meeting must be taken by poll.
Any shareholder that is a recognized clearing house within the meaning of the Securities and Futures Ordinance of Hong Kong may authorize such person or persons as it thinks fit to act as its representative (or representatives) at any general meeting or at any separate meeting of any class of shareholders (if relevant). However, if more than one person is authorized, the authorization must specify the number and class of shares in respect of which each person is in fact authorized. The authorized person will be entitled to exercise the same power on behalf of the recognized clearing house as that clearing house (or its nominees) could exercise if it were an individual shareholder of the Company.
Under the Companies Ordinance, our board of directors may, without the prior approval of the shareholders, offer to issue new shares to existing shareholders in proportion to their current shareholdings. Our board of directors may not issue new shares in any other way without the prior approval of the
shareholders in a general meeting.shareholders. Any such approval given in a general meeting shall continue in force until the earlier of: (1) the conclusion of the next annual general meeting; or (2) the expiration of the period within
which the next annual general meeting is required by law to be held; or (3) when revoked or varied by an ordinary resolution of the shareholders in a general meeting. IfWhere such shareholders’ approval is given, subject to the Listing Rules and any conditions attached to such approval, our unissued shares shallmay be at the disposal of our board of directors, which may offer, allot, grant options over or otherwise dispose of them to such persons, at such times and for such consideration and upon such terms and conditions as the directors may decide.
Unless specifically restricted by
Subject to the provisions of our Articles, any shareholder may transfer all or any of his shares by an instrument of transfer in the usual or common form or in such other form as our board of directors may accept and may approve. Such
transferinstrument may be signed by hand or, if the buyer or seller is a clearing house or its nominee(s), signed by hand or by a machine imprinted signature or by such other manner as our board of directors may approve from time to time.
The instrument of transfer of a share shall be
signedexecuted by or on behalf of both the buyer and the seller of that share provided that our board of directors may dispense with the signing of the instrument of transfer by the buyer in any case which it thinks fit in its discretion to do so. Except as provided in the paragraph above, our board of directors may also decide, either generally or in any particular case, upon request by either the buyer or seller of shares to accept mechanically signed transfers. The seller shall be deemed to remain the holder of the share until the name of the buyer is entered into our register in respect of that share. All instruments of transfer, when registered, may be retained by us. Nothing in our Articles
shall preventprevents our board of directors from recognizing a renunciation of the allotment or provisional allotment of any share by the person to whom the shares were to be allotted in favor of some other person.
Our board of directors may in its absolute discretion and without giving any reason, decline to register any transfer of any share which is not a fully paid share.
Our board of directors may also decline to register any transfer unless:
| (a) | (a) | the instrument of transfer, duly stamped, is lodged with us accompanied by the certificate for the shares to which it relates and such other evidence as our board of directors may reasonably require to show the right of the seller to make the transfer; |
| (b) | (b) | such fee, not more than the maximum amount allowed by theThe Stock Exchange of Hong Kong Limited from time to time, as our board of directors may from time to time require is paid to us in respect of it; |
| (c) | (c) | the instrument of transfer is in respect of only one class of share; |
49
| (d) | (d) | in the case of a transfer of a share to be registered injointly held by two or more than one name (i.e. there are joint holders),holders, the number of joint holders to whom the share is to be transferred does not exceed four; and |
| (e) | (e) | the shares concerned are free of any lien in favor of us. |
If our board of directors declines to register a transfer of any share, it shall, within two months after the date on which the instrument of transfer was lodged, send to the buyer notice of the refusal.
In accordance with our Articles, only persons who are registered in our register of members are recognized by us as shareholders and absolute owners of the shares. The register of members may be closed by our board of directors at such times and for such periods as it may from time to time decide
by giving notice by advertisement in a newspaper circulating generally in Hong Kong, but the register shall
not be closed in any year for more than 30 days (excluding Sundays and public holidays)
. unless extended by ordinary resolution.
C. Material Contractscontracts Other than such contracts as are described in our disclosure in Item 7 “Major Shareholdersshareholders and Related Party Transactions – Related Party Transactions”related party transactions — related party transactions”, we have not entered into any material contracts outside the ordinary course of our business within the two years preceding the date of this annual report.
50
D. Exchange Controlscontrols The Basic Law of Hong Kong provides that the Hong Kong dollar will remain the legal tender in Hong Kong after July 1, 1997. The Basic Law also provides that no foreign exchange control policies will be applied in Hong Kong and that the Hong Kong dollar will be freely convertible. During the Asia regional economic crisis in 1998, however, the Hong Kong Government intervened on several occasions in the foreign exchange market by purchasing the Hong Kong dollar and selling the U.S. dollar to support the value of the Hong Kong dollar.
There are no restrictions, either pursuant to our Articles, or pursuant to the laws of Hong Kong, on the rights of non-residents of Hong Kong or foreign persons to hold or exercise voting rights with respect to our ordinary shares, or export or import capital.
The following provides a general outline of the material tax considerations that may be relevant to a decision to own or dispose of our American depositary shares or shares but does not purport to deal with the tax consequences applicable to all categories of investors. Prospective investors should consult their own professional advisers on the Hong Kong, United States and overall tax implications of investing, holding or disposing the American depositary shares or shares under the laws of the countries in which they are liable to taxation. The discussion below is applicable to both U.S. and non-U.S. citizens as an investor.
No tax is payable in Hong Kong by withholding or otherwise in respect of dividends paid by City Telecom.
No tax is imposed in Hong Kong in respect of gains from the sale of our shares and American depositary shares, unless all the following
three factors are present:
| (i) | | (i) | such gain isprofits are derived from or arisingarise in Hong Kong; |
| |
| (ii) | | such gain isprofits are attributable to a trade, profession or business carried on in Hong Kong; and |
| |
| (iii) | | the property in question, such as shares and American depositary shares, wasare not a capital assetassets of that trade, profession or business. |
Taxable
gains will beprofits are subject to Hong Kong profits tax
which is currently imposed on corporations at the rate of
17.5%16.5% and on unincorporated businesses or individuals at the rate of
16%15%.
Gains
Profits from
the sales of our shares, which are effected on the Hong Kong Stock Exchange, will be considered to be derived from or arising in Hong Kong.
Liability to Hong KongSuch profits
tax in respect of such gains would ariseare taxable if the shares
wereare not held as capital assets and the
gainsprofits are attributable to a business, trade or profession carried out in Hong Kong.
Gains
Profits from
the sales of our American depositary shares will be considered to be derived from or arising in Hong Kong if the relevant purchase or sales contracts are effected in Hong
Kong, and such gains will be subject to Hong Kong profits tax inKong. In the
case ofevent that those persons dealing or trading in the American depositary shares
are doing so as part of their trade, profession or business
that is being carried out in Hong
Kong.Kong and the shares are not capital assets of such trade of business, then such profits will be subject to Hong Kong profits tax. In any case of an exchange of any American depositary receipts evidencing American depositary shares for certificates representing shares, any
gainprofit gained on subsequent disposition of such shares will be the difference between the initial price of American depositary shares and the market value of such shares at the date of disposition.
The sale
orand purchase of shares is subject to Hong Kong stamp duty which is payable by
each ofboth the seller and
thepurchase. Both seller and purchaser
in equal sharesmust pay stamp duty at
thea rate of
HK$1.00 per HK$1,000 or part thereof by reference to0.1% each, totaling 0.2%, of the
total value of the
greater of (i) the consideration paid or
(ii) the market value of the shares on the Hong Kong Stock Exchange, or otherwise, on the date the contract note for the sale or purchase is
executed, whichever is greater.executed. If, in the case of a sale or purchase of
the shares
effected by a person who is not resident in Hong Kong, the stamp duty on either or both of the contract notes is not paid, the transferee will be liable to
stamp the instrument of transfer and pay stamp duty on the instrument
of transfer in an amount equal to the unpaid duty. If the
stamp dutyinstrument is not
paid onstamped before or
beforewithin the
due date,time for stamping such instrument, a penalty of up to ten times the duty payable may be imposed. In addition, a fixed duty of HK$5.00 is currently payable on any instrument of transfer of shares.
In addition to the depositary’s charges, if any, the withdrawal of the shares upon the surrender of American depositary receipts evidencing American depositary shares, and the issuance of American depositary receipts evidencing American depositary shares upon the deposit of the shares, will be subject to Hong Kong stamp duty at the rate described above for sale and purchase
transactions, unlesstransactions. In the event the withdrawal or deposit does not result in
a change in the beneficial ownership of the shares under Hong Kong
law.law, only the nominal fixed duty of HK$5.00 will be payable. Investors are not liable for stamp duty on the issuance of the American depositary shares upon the initial deposit of shares issued directly to the depositary or for the account of the depositary. No Hong Kong stamp duty is payable upon the transfer of American depositary receipts evidencing our American depositary shares if such American depositary receipts are not maintained on a register in Hong Kong.
There is currently no reciprocal tax treaty between Hong Kong and the U.S. regarding withholding.
51
Certain U.S. Federal Income Tax Considerations The following is a summary of certain United States federal income tax considerations that are anticipated to be material to the purchase, ownership, and disposition of our shares or American depositary shares by U.S. Holders, as defined below. This summary is based on the U.S. Internal Revenue Code of 1986, as amended (the “Code”), its legislative history, existing and proposed U.S. Treasury regulations, published rulings and court decisions, all as in effect on the date hereof. These laws are all subject to change or different interpretation, possibly on a retroactive basis. This summary does not discuss all aspects of United States federal income taxation which may be important to particular investors in light of their individual investment circumstances, such as investors subject to special tax rules including: partnerships, financial institutions, insurance companies,
regulated investment companies, real estate investment trusts, broker-dealers, tax-exempt organizations, and, except as described below, non-U.S. Holders, or to persons that will hold our shares or American depositary shares as part of a straddle, hedge, conversion, or constructive sale transaction for United States federal income tax purposes or that have a functional currency other than the United States dollar, all of whom may be subject to tax rules that differ significantly from those summarized below. In addition, this summary does not discuss any foreign, state, or local tax considerations. This summary assumes that investors will hold our shares or American depositary shares as “capital assets” (generally, property held for investment) under the
United States Internal Revenue Code.
Each prospective investor is urged to consult its own tax advisor regarding the United States federal, state, local, and foreign income and other tax considerations of the purchase, ownership, and disposition of our shares or American depositary shares.
For purposes of this summary, a U.S. Holder is a beneficial owner of shares or American depositary shares that is for United States federal income tax purposes:
an individual who is a citizen or resident of the United States;
a corporation, or other entity that is taxable as a corporation, created in or organized under the laws of the United States or any State or political subdivision thereof;
| - | | an individual who is a citizen or resident of the United States; |
|
| - | | a corporation, or other entity that is taxable as a corporation, created in or organized under the laws of the United States or any State or political subdivision thereof; |
|
| - | | an estate the income of which is includible in gross income for United States federal income tax purposes regardless of its source; |
|
| - | | a trust the administration of which is subject to the primary supervision of a United States court and which has one or more United States persons who have the authority to control all substantial decisions of the trust; or |
|
| - | | a trust that was in existence on August 20, 1996, was treated as a United States person, for United States federal income tax purposes, on the previous day, and elected to continue to be so treated. |
If a partnership or other entity or arrangement treated as a partnership for United States federal income tax purposes regardless of its source;
a trustholds our shares or American depositary receipts, the administration of which is subject to the primary supervisiontax treatment of a United States court and which has one or more United States persons who havepartner will generally depend upon the authority to control all substantial decisionsstatus of the trust;partner and the activities of the partnership. A U.S. Holder that is a partner in a partnership holding our shares or
a trust that was in existence on August 20, 1996, was treated as a United States person, for American depositary receipts is urged to consult its own tax advisor concerning the United States federal income tax purposes, onconsequences of purchasing, owning and disposing of our shares or American depositary receipts by the previous day, and elected to continue to be so treated.
partnership.A beneficial owner of our shares or American depositary shares that is not a U.S. Holder is referred to herein as a “Non-U.S. Holder.”
A foreign corporation will be treated as a “passive foreign investment company” or “PFIC”, for United States federal income tax purposes, if 75% or more of its gross income consists of certain types of “passive” income or 50% or more of
the fair market value of its assets are
passive“passive” for any
taxable year. Based on our current and projected income, assets, and activities, we presently believe that we are not a PFIC in the current
taxable year and do not anticipate becoming a PFIC in the future.
This is,The PFIC status of a foreign corporation for any taxable year, however,
a factual determination made on an annual basis.will not be determinable until after the end of that taxable year. Because the classification of certain of our assets for United States federal income tax purposes is uncertain, the PFIC rules are subject to administrative interpretation, and the relevant facts may change in the future, however, no assurance can be given that we are not or will not be treated as a PFIC. The discussion below under “U.S. Holders-Dividends” and “U.S. Holders-Sale or Other Disposition of Shares or American depositary shares,” assumes that we will not be subject to treatment as a PFIC for United States federal income tax purposes. If we were currently or were to become a PFIC, U.S. Holders would be subject to special rules and a variety of potentially adverse tax consequences under the Code. See “PFIC Considerations” below.
For United States federal income tax purposes, a U.S. Holder of an American depositary share will be treated as the owner of the proportionate interest of the shares held by the depositary that is represented by an American depositary share and evidenced by such
American depositary share. Accordingly, no gain or loss will be recognized upon the exchange of an American depositary share for the holders’ proportionate interest in the shares. A U.S. Holder’s tax basis in the withdrawn shares will be the same as the tax basis in the American depositary share surrendered therefore, and the holding period in the withdrawn shares will include the period during which the holder held the surrendered American depositary share.
DividendsDividends.. Any cash distributions paid by us out of our earnings and profits, as determined under United States federal income tax principles,rules, will be subject to tax as ordinary dividend income and will be includible in the gross income of a U.S. Holder upon actual or constructive receipt. Cash distributions paid by us in excess of our earnings and profits will be treated first as a tax-free return of capital to the extent of the U.S. Holder’s adjusted tax basis in our shares or American depositary shares, and thereafter as gain from the sale or exchange of a capital asset. Dividends paid in Hong Kong dollars will be includible in income in a United States dollar amount based on the United States dollar to Hong Kong dollar “spot” exchange rate prevailing at the time of receipt of such dividends by the depositary, in the case of American depositary shares, or by the U.S. Holder, in the case of shares held directly by
52
such U.S. Holder. U.S. Holders should consult their own tax advisors regarding the United States federal income tax treatment of any foreign currency gain or loss recognized on the subsequent conversion of Hong Kong dollars received as dividends to United States dollars. Dividends received on shares or American depositary shares will not be eligible for the dividends received deduction allowed to corporations.
Under current law, “qualified dividend income” received by an individual
after December 31, 2002 and beforeprior to January 1, 2011 is subject to United States federal income tax rates lower than those applicable to ordinary income. The
topmaximum federal income tax rate on such qualifying dividends received by an individual is 15%, or 5% for those individuals whose incomes fall in the
10-10% or
15- percent15% tax brackets. Based upon our existing and anticipated future operations and current assets,
and the anticipation that our American depository shares are and will be listed on the NASDAQ, we believe that we are a “qualified foreign corporation” and that our dividends paid to U.S. Holders who are individuals will be eligible to be treated as “qualified dividend income”, provided that such Holders satisfy applicable holding period requirements with respect to the American depositary shares and other application requirements. Dividends paid by foreign corporations that are classified as PFICs are not “qualified dividend income”. See “PFIC Considerations” below.
Dividends received on shares or American depositary shares generally will be treated, for United States federal income tax purposes, as income from non-U.S. sources. Such non-U.S. source income generally will be “passive
income” or “financial services income” for taxable years beginning on or before December 31, 2006, and as “passive category income”, or in certain cases “general category income”,
for taxable years beginning after December 31, 2006, which is treated separately from other types of income for purposes of computing the
U.S. foreign tax credit. A U.S. Holder may be eligible, subject to a number of complex limitations, to claim a foreign tax credit in respect of any foreign withholding taxes imposed on dividends received on shares or American depositary shares. U.S. Holders who do not elect to claim a
U.S. foreign tax credit for
federalforeign income tax withheld may instead claim a deduction, for United States federal income tax purposes, in respect of such withholdings, but only for a year in which the U.S. Holder elects to do so for all creditable foreign income taxes.
In addition, the United States Treasury has expressed concerns that parties to whom depositary shares are pre-released may be taking actions that are inconsistent with the claiming of
U.S. foreign tax credits by the holders of American depositary shares.
Accordingly, theThe analysis of the creditability of foreign withholding taxes could be affected by future actions that may be taken by the United States Treasury.
Sale or Other Disposition of Shares or American depositary
shares.shares. A U.S. Holder will recognize capital gain or loss upon the sale or other disposition of shares or American depositary shares in an amount equal to the difference between the amount realized upon the disposition and the U.S. Holder’s adjusted tax basis in such shares or American depositary shares, as each is determined in U.S. dollars. Any such capital gain or loss will be long-term if the shares or American depositary shares have been held for more than one year and will generally be United States source gain or loss.
Certain non-corporate U.S. Holders (including individuals) may qualify for preferential rates of United States federal income taxation in respect of long-term capital gains for taxable years beginning before January 1, 2011. The claim of a deduction in respect of a capital loss, for United States federal income tax purposes, may be subject to limitations. If a U.S. Holder receives Hong Kong dollars for any such disposition, such U.S. Holder should consult its own tax advisor regarding the United States federal income tax treatment of any foreign currency gain or loss recognized on the subsequent conversion of the Hong Kong dollars to United States dollars.
PFIC Considerationsconsiderations If we were to be classified as a PFIC for any taxable year, a U.S. Holder would be subject to special rules generally intended to reduce or eliminate any benefits from the deferral of United States federal income tax that a U.S. Holder could derive from investing in a foreign company that does not distribute all of its earnings on a current basis. In such event, a U.S. Holder of the shares or American depositary shares may be subject to tax at ordinary income tax rates on (i) any gain recognized on the sales of the shares or American depositary shares and (ii) any “excess distribution” paid on the shares or American depositary shares (generally, a distribution in excess of 125% of the average annual distributions paid by us in the three preceding taxable years). In addition, a U.S. Holder may be subject to an interest charge on such gain or excess distribution. Prospective investors are urged to consult their own tax advisors regarding the potential tax consequences to them if we are or do become a PFIC, as well as certain elections that may be available to them to mitigate such consequences.
An investment in shares or American depositary shares by a Non-U.S. Holder will not give rise to any United States federal income tax consequences unless:
| - | | the dividends received or gain recognized on the sale of the shares or American depositary shares by such person is treated as effectively connected with the conduct of a trade or business by such person in the United States as determined under United States federal income tax law, and the dividends are attributable to a permanent establishment (or in the case of an individual, a fixed place of business) that you maintain in the United States if that is required by an applicable income tax treaty as a condition for subjecting you to U.S. taxation on a net income basis. In such cases you generally will be taxed in the same manner as a U.S. holder. If you are a corporate non-U.S. Holder, “effectively connected” dividends may, under certain circumstances, be subject to an additional “branch profits tax” at a 30% rate or a lower rate if you are eligible for the benefits of an income tax treaty that provides for a lower rate, or |
| - | | in the case of gains recognized on a sale of shares or American depositary shares by an individual, such individual is present in the United States for 183 days or more and certain other conditions are met. The non-U.S. Holder will be subject to United States federal income tax at a rate of 30% on the amount by which the U.S. — source capital gains exceed non-U.S. — source capital losses. |
Backup withholding and the dividends are attributable to a permanent establishment (or in the case of an individual, a fixed place of business) that you maintain in the United States if that is required by an applicable income tax treaty as a condition for subjecting you to U.S. taxation on a net income basis. In such cases you generally will be taxed in the same manner as a U.S. holder. If you are a corporate non-U.S. Holder, “effectively connected” dividends may, under certain circumstances, be subject to an additional “branch profits tax” at a 30% rate or a lower rate if you are eligible for the benefits of an income tax treaty that provides for a lower rate, orinformation reporting
in the case of gains recognized on a sale of shares or American depositary shares by an individual, such individual is present in the United States for 183 days or more and certain other conditions are met. The non-U.S. Holder will be subject to United States federal income tax at a rate of 30% on the amount by which the U.S.-source capital gains exceed non-U.S.-source capital losses.
Backup Withholding and Information Reporting
In general, information reporting requirements will apply to dividends on or the proceeds received on the sale, exchange or redemption of shares or American depositary shares paid within the United States (and, in certain cases, outside the United States) to U.S. Holders other than certain exempt recipients, such as corporations, and backup withholding tax at the rate of 28% may apply to such amounts if the U.S. Holder fails to provide an accurate taxpayer identification number (or otherwise establishes, in the manner provided by law,
53
an exemption from backup withholding) or to report dividends required to be shown on the U.S. Holder’s United States
Federalfederal income tax returns.
Backup withholding is not an additional income tax, and the amount of any backup withholding from a payment to a U.S. Holder will be allowed as credit against the U.S. Holder’s United States
Federalfederal income tax liability provided that the appropriate returns are filed.
A non-U.S. Holder generally may eliminate the requirement for information reporting and backup withholding by providing certification of its foreign status to the
payor,payer, under penalties of perjury, on IRS Form W-8BEN.
THE ABOVE DISCUSSION OF CERTAIN UNITED STATES FEDERAL INCOME TAX CONSIDERATIONS IS FOR GENERAL INFORMATION ONLY, DOES NOT PURPORT TO BE A COMPLETE DESCRIPTION OF THE POTENTIAL TAX CONSIDERATIONS RELATING TO OUR SHARES OR AMERICAN DEPOSITARY RECEIPTS AND IS NOT INTENDED TO BE CONSTRUED AS TAX ADVICE. ACCORDINGLY, PROSPECTIVE INVESTORS SHOULD CONSULT THEIR OWN TAX ADVISORS AS TO THE PARTICULAR TAX CONSEQUENCES TO THEM OF PURCHASING, OWNING AND DISPOSING OF OUR SHARES OR AMERICAN DEPOSITARY RECEIPTS, INCLUDING THE APPLICABILITY AND EFFECT OF ANY UNITED STATES FEDERAL, STATE, LOCAL OR NON-UNITED STATES TAX LAWS, AND OF ANY PROPOSED CHANGES IN APPLICABLE LAW.
F. Dividends and paying agents Not
applicableapplicable.
Not
applicableapplicable.
H. Documents on Displaydisplay We filed with Securities and Exchange Commission in Washington, D.C. a registration statement on Form F-1 (Registration No. 333-11012) under the Securities Act in connection with our global offering of American depositary shares in November 1999. The registration statement contains exhibits and schedules. For further information with respect to City Telecom and the American
depositary shares, please refer to the registration statement and to the exhibits and schedules filed with the registration statement. In addition, whenever a reference is made in this annual report to a contract or other document of City Telecom, you should be aware that such reference is not necessarily complete and that you should refer to the exhibits and schedules that are a part of the registration statement for a copy of the contract or other document.
I. Subsidiary Information
Not applicable
ITEM 11. QUANTITATIVE AND QUALITATIVE DISCLOSURES ABOUT MARKET RISK
Our functional currency is the Hong Kong dollar, the currency in which the majority of our revenue
The Company’s registration statements may be inspected and
related accounts receivablecopied, including exhibits and
expenses are denominated. Certain of the expenses of our telecommunications business are payable in other currencies, primarily the U.S. dollar. Since the exchange rate between the Hong Kongschedules, and the
U.S. dollar is pegged, our operations have not been significantly affected by exchange rate fluctuations. Therefore, we do not use derivative financial instruments to manage our exchange rate exposures.Inreports and other information as filed with the normal course of business, we also face other risks such as country risk, credit riskSecurities and legal risk and we do not use derivative financial instruments to hedge such risks.
We are exposed to market risk from changesExchange Commission in currency exchange rates and interest rates.
Foreign Currency Risk
The functional currency of our operations, and our financial statement reporting currency, isaccordance with the Hong Kong dollar. Our monetary assets and liabilities are primarily denominated in Hong Kong dollars, substantially all our net sales are denominated and received in Hong Kong dollars, and our labor and administrative costs are incurred primarily in Hong Kong dollars. However, we have certain current and long-term bank deposits, other investments and short-term bank loans which are primarily denominated in U.S. dollars.
As of August 31, 2007, we had the following significant foreign currencies denominated account balances:
| | |
| | As of August 31, 2007 |
| | (Thousands of HK$) |
Cash and bank balances:
| | |
Denominated in U.S. dollars
| | 165,226 |
Denominated in Chinese renminbi
| | 9,136 |
Denominated in Canadian dollars
| | 5,981 |
Long-term bank deposits:
| | |
Denominated in U.S. dollars
| | 14,415 |
Other investments:
| | |
Denominated in U.S. dollars
| | 28,577 |
Further, our principal long-term debt obligations are the US$125.0 million 8.75% senior notes issued in January 2005, which are denominated in U.S. dollars.
As the exchange rate of the Hong Kong dollar to the U.S. dollar has remained close to the current pegged rate of HK$7.80=$1.00 since 1983, we have not experienced significant foreign exchange gains or losses associated with that currency. The Hong Kong government could, however, change the pegged rate or abandon the peg altogether. Depreciation of the Hong Kong dollar against the U.S. dollar would generally increase our U.S. dollar expenses, and increase the amount of Hong Kong dollar revenue that we would be required to earn to meet our payment obligations under the 8.75% notes.
We also incur expenses denominated in Renminbi, the official currency of the People’s Republic of China, in connection with our Guangzhou call centre. These include the salaries that we pay to our personnel as various operating expenses that we incur to maintain our operations. As a result, we are exposed to a certain amount of foreign exchange risk based on fluctuations between the Hong Kong dollar and the Renminbi. If the Renminbi appreciates against the Hong Kong dollar, the amount of Hong Kong dollars we would be required to spend to maintain our call center would increase. Therefore, in order to limit our foreign currency risk exposure on the Renminbi, we maintain Renminbi cash balance that approximates three months’ operating cash flow.
Interest Rate Risk
Prior to our repayment in full of our floating interest rate loan facility with HSBC, we were exposed to interest rate risks. In connection with this facility, we entered into an interest rate swap agreement to hedge the impact of fluctuations in interest rates, under which we make a monthly interest payment at a fixed rate of 2.675% per annum on a notional amount of HK$100.0 million (which is reduced by the principal repayment schedule during the loan period), and will receive monthly interest payments calculated at HIBOR during the period from March 2004 to December 2009 or until the facility is repaid and we terminate the swap agreement.
In prior years, no recognition of such instrument is required under HKFRS. However, with effect from September 1, 2005, such interest rate swap instrument must be recorded at fair value, which we determined to be approximately HK$1.8 million as of August 31, 2006 and HK$1.0 million as of August 31, 2007. Under U.S. GAAP reporting, such interest rate swap instrument is and has been recorded at fair value. As of August 31, 2007, the interest rate swap agreement remains outstanding following the full repayment of our loan facility with HSBC. On January 24, 2008, the interest rate swap agreement has been unwound.
ITEM 12. DESCRIPTION OF SECURITIES OTHER THAN EQUITY SECURITIES
None
PART II
ITEM 13. DEFAULTS, DIVIDEND ARREARAGES AND DELINQUENCIES
None.
ITEM 14. MATERIAL MODIFICATIONS TO THE RIGHTS OF SECURITY HOLDERS AND USE OF PROCEEDS
None.
ITEM 15. CONTROLS AND PROCEDURES
We maintain a set of disclosure controls and procedures designed to ensure that information required to be disclosed by City Telecom in reports that we file or submit under the U.S. Securities Exchange Act of 1934 as amended, is recorded, processed, summarized and reported withinat the time periods specified inpublic reference facilities maintained by the Securities and Exchange Commission’s rules and forms. WithCommission at Judiciary Plaza, 450 Fifth Street, Room 1024, N.W., Washington, D.C. 20549. Copies of such material may also be obtained from the passingPublic Reference Section of the U.S. Sarbanes-Oxley ActSecurities and Exchange Commission at 450 Fifth Street, N.W., Washington, D.C. 20549, at prescribed rates. Information may be obtained regarding the Washington D.C. Public Reference Room by calling the Securities and Exchange Commission at 1-800-SEC-0330 or by contacting the Securities and Exchange Commission over the Internet at its website at http://www.sec.gov.
I. Subsidiary information
Not applicable.
Item 11 Quantitative and qualitative disclosures about market risk
Quantitative and qualitative disclosures about market risk have been included in note 24 to our consolidated financial statements.
54
Item 12 Description of 2002, we have adopted additional measures to strengthen the internal controls within City Telecom, including the following: | • | | Education.We asked our legal advisor to prepare a comprehensive memorandum explaining the requirements of Sarbanes Oxley and the Nasdaq Corporate Governance requirements and a memorandum discussing disclosure controls and procedures in public companies. The memoranda were circulated to members of our management. Our legal advisor also gave the following presentations: (a) a presentation to our board of directors discussing Sarbanes Oxley and the requirements placed on City Telecom as a public company in the Sarbanes Oxley era; (b) a presentation to our Chief Executive Officer, Chief Financial Officer and other senior officers discussing the “Section 302” and “Section 906” certifications and other more technical aspects of Sarbanes Oxley compliance; and (c) a presentation to our Audit Committee to discuss the unique responsibilities placed on the Audit Committee by the Sarbanes Oxley Act.
|
| • | | Disclosure Controls and Procedures. We asked our legal advisor to enhance the system of disclosure controls and procedures within City Telecom. To accomplish this goal, our legal advisor worked with selected executives to educate them on the requirements of Form 6-K and Form 20-F and the obligations to disclose to investors and the SEC material developments that may have an impact on City Telecom or its share capital and engaged in similar discussions about these requirements with our directors and executive officers. As a result, a new process for information management has been established so that any information required to be disclosed will be recorded, processed, summarized and reported in a timely fashion and that the information will be accumulated and communicated to our management to allow timely decisions regarding required disclosure. Under the new process, the Legal Department will take responsibility for identifying these material developments and determining whether to involve our legal advisor.
|
| • | | Board Committees. We adopted amendments to our Audit Committee Charter and Terms of Reference of Remuneration Committee, to provide more detailed operational, financial and management control procedures and guidelines.
|
Within the 90-day period priorsecurities other than equity securities
Not applicable.
PART II
Item 13 Defaults, dividend arrearages and delinquencies
None.
Item 14 Material modifications to the filingrights of this report, ansecurity holders and use of proceeds
None.
Item 15 Controls and procedures
A. Disclosure controls and procedures
An evaluation was carried out under the supervision and with the participation of our management, including our Chief Executive Officer and Chief Financial Officer, of the effectiveness of our disclosure controls and procedures. BasedAs of the end of the period covered by this annual report, based on that evaluation, our Chief Executive Officer and Chief Financial Officer have concluded that our disclosure controls and procedures are effective. to provide reasonable assurance that information the Company is required to disclose in reports that the Company files or submits under the Securities Exchange Act of 1934 is recorded, processed, summarized and reported within the time periods specified in SEC rules and forms, and that such information is accumulated and communicated to the Company’s management, including the Company’s Chief Executive Officer and Chief Financial Officer, as appropriate, to allow timely decisions regarding required disclosure. In designing and evaluating the disclosure controls and procedures, management recognizes that any controls and procedures, no matter how well designed and operated, can provide only reasonable assurance of achieving the desired control objectives. In addition, the design of disclosure controls and procedures must reflect the fact that there are resource constraints and that management is required to apply its judgment in evaluating the benefits of possible controls and procedures relative to their costs. Subsequent to the date of their evaluation, there have been no significant changes in our internal controls or in other factors that could significantly affect these controls.
B. Management’s report on internal control over financial reporting
Our management is responsible for establishing and maintaining adequate internal control over financial reporting for the Company, as defined in Rules 13a-15(f) under the Securities Exchange Act of 1934, as amended. The Company’s internal control over financial reporting is designed to provide reasonable assurance regarding the reliability of financial reporting and the preparation of consolidated financial statements for external purpose in accordance with generally accepted accounting principles. Under Section 404(a) of the Sarbanes-Oxley Act of 2002, our management is required to include its assessment of the effectiveness of our internal control procedures over financial reporting in our annual report on Form 20-F beginning in the fiscal year ended August 31, 2009. With the assistance of Company’s internal audit department and external consultants, our management organized and conducted a comprehensive assessment of internal control over financial reporting based on the control criteria in COSO framework. As of the date of this annual report, our management is not aware of any instances of material weaknesses on our internal control over financial reporting and our internal control over financing reporting is effective.
C. Changes in internal control over financial reporting
During fiscal 2009, the period covered by this annual report, no change has occurred in our internal controls over financial reporting that has materially affected, or is reasonably likely to materially affect, our internal controls over financial reporting.
55
ITEM 16A. AUDIT COMMITTEE FINANCIAL EXPERTItem 16A Audit committee financial expert Our board of directors established an
Audit Committeeaudit committee to ensure the impartial supervision of our accounting and business operations. The
Audit Committeeaudit committee is comprised of three independent non-executive directors, namely, Mr. Lee Hon Ying, John, Dr. Chan Kin Man and Mr. Peh
Jefferson Tun
Lu Jefferson.Lu. Mr. Peh was appointed to the
Audit Committeeaudit committee on September 1, 2004 and is a “financial expert” within the meaning of, and as required by, the U.S. Sarbanes-Oxley Act of 2002.
All of our employees, officers and directors are bound by our code of business ethics and conduct. We adopted our code of ethics and modified it following the passage of, and to comply with, the U.S. Sarbanes Oxley Act of 2002. Copies of our code of ethics are available for viewing on our website at
http://www.ctigroup.com.hk and free of charge upon request made to our company secretary. We have not made any amendment to our code of ethics since our most recently completed fiscal year. We have never granted a waiver for non-compliance with the policies and procedures set forth in the code of ethics for any employee of our
companyCompany or any of our subsidiaries.
ITEM 16C. PRINCIPAL ACCOUNTANT FEES AND SERVICESItem 16C Principal accountant fees and servicesWith effect from May 13, 2005, PricewaterhouseCoopers, or PwC, tendered its resignation.
The following table sets forth the remuneration that we paid to KPMG, was appointed as our independent auditor to fill the casual vacancy caused by the resignationin each of PwC until the conclusion of the annual general meeting held on December 29, 2005. A resolution was passed in the annual general meeting to reappoint KPMG as our auditor. Theprevious two fiscal years.
| | | | | | | | | |
| | | 2008 | | | 2009 | |
| Nature of the service | | HK$ million | | | HK$ million | |
| Audit fees | | | 2.8 | | | | 2.6 | |
| Audit-related fees | | | 0.4 | | | | 0.4 | |
| | | | | | | |
| | | | | | | | | |
| Total | | | 3.2 | | | | 3.0 | |
| | | | | | | |
Audit fees for the professional services rendered by KPMG in fiscal 2006 and in fiscal 2007, are set forth in the table below.For KPMG
| | | | |
Nature of the service | | 2006 | | 2007 |
| | | (HK$ million) | | (HK$ million) |
Audit fees | | 1.8 | | 2.2 |
Audit-related fees | | 0.3 | | 0.4 |
All other fees | | 0.7 | | — |
| | | | |
Total | | 2.8 | | 2.6 |
| | | | |
Audit Fees
Audit fees are the aggregate fees billed by our independent auditors for the annual financial statement audit, subsidiary audits and other procedures required to be performed for the auditors to form an opinion on our consolidated financial statements.
Audit-Related Fees
Audit-related fees
Audit-related fees are the aggregate fees billed by our independent auditors for
accounting and advisory services fees and generally include support for the interpretation and implementation of new accounting and reporting standards and acquisition accounting. It also includes the review of
the Statement on Details of Contribution of the Occupational Retirement Scheme, and the auditour interim financial statements and review of reports for compliance with telecommunications regulations and debt obligations.
All Other Fees
All other fees are the aggregate fees for agreed upon procedures performed in respect of our internal control procedures over financial reporting.
Pre-approval Policespolices
The engagement of PwC and KPMG and the services provided pursuant to such engagement were approved by our audit committee in accordance with paragraph (c)(7)(i) of Rule 2-01 of Regulation S-X. The fees for all such services have been pre-approved by our audit committee. Our audit committee has satisfied itself that the provision of the above-stated non-audit services has not impaired the independence of KPMG.
Item 16D Exemptions from the listing standards for audit committees
Not applicable.
56
ITEM 16D. EXEMPTIONS FROM THE LISTING STANDARDS FOR AUDIT COMMITTEESItem 16E Purchase of equity securities by the issuer and affiliated purchasersNone.
ITEM 16E. PURCHASE OF EQUITY SECURITIES BY THE ISSUER AND AFFILIATED PURCHASERS
By way of a general mandate granted to our directors, the maximum aggregate nominal amount of shares that may be purchased pursuant to a mandate corresponds to 10% of the aggregate nominal amount of our issued share capital at the date the mandate was granted. During the year ended August 31, 2009, we had repurchased 70,000 ordinary shares on the HKSE, details of which are as follows:-
| | | | | | | | | | | | | | | | | |
| | | | | | | Highest price | | | Lowest price | | | Total | |
| | | Number of | | | paid per | | | paid per | | | consideration | |
| Date of repurchase | | Ordinary Shares | | | Ordinary Share | | | Ordinary Share | | | paid | |
| | | | | | HK$ | | | HK$ | | | HK$ | |
| August 11, 2009 | | | 70,000 | | | | 1.92 | | | | 1.91 | | | | 134,197 | |
Item 16F Change in Registrant’s Certifying Accountant
Not applicable.
Item 16G Corporate Governance
As our ordinary shares are listed on the HKSE and American depositary shares representing our ordinary shares are listed on the Nasdaq Global Market, we are subject to applicable Hong Kong laws and regulations, including the HKSE Listing Rules, and the Hong Kong Companies Ordinance, as well as applicable U.S. federal securities laws, including the Exchange Act and the Sarbanes-Oxley Act. In fiscal 2007, no shares were purchased underaddition, we are subject to the mandate thencorporate governance requirements imposed by Nasdaq to the extent they apply to foreign private issuers. Under Nasdaq Stock Market Rule 5615(a)(3), a foreign private issuer such as us may follow its home country corporate governance practices in force.lieu of certain of the Nasdaq Stock Market Rules corporate governance requirements. Our current corporate governance practices differ from Nasdaq corporate governance requirements for U.S. companies in certain respects, as summarized below:
| • | | Nasdaq Stock Market Rule 5605(b)(1) requires a Nasdaq listed company to have a board of directors consisting of a majority of independent members, In this regard we have elected to adopt the practices of our home country, As a listed company in Hong Kong, we are subject to the requirement under the HKSE Listing Rules that at least three members of our board of directors be independent as determined under the HKSE Listing Rules. In compliance with our home country practices, we currently have three independent directors out of a total of eight directors. The standards for establishing independence under the HKSE Listing Rules also differ from those set forth in the Nasdaq Stock Market Rules. |
|
| • | | Nasdaq Stock Market Rule 5605(b)(2) requires a Nasdaq listed company to schedule regular executive sessions in which non-management directors meet without management participation. In this regard we have elected to adopt the practices of our home country. Under the applicable Hong Kong law, our board of directors is required to meet regularly and at least four times a year and we are required to ensure that there is active participation by a majority of the directors and afford all directors an opportunity to include matters on the agenda. In addition, when a board meeting considers a matter in which a substantial shareholder or a director has a conflict of interest, the independent directors with no material interest in such matter must be present. In compliance with our home country practices, we do not organize exclusive meetings for our independent non-executive directors on a regular basis. |
|
| • | | Nasdaq Stock Market Rule 5605(d)(1) requires a Nasdaq listed company to have the compensation of the chief executive officer and the other executive officers be determined, or recommended to the Board for determination, by a compensation committee comprised solely of independent directors. In this regard we have elected to adopt the practices of our home country. Under the HKSE Listing Rules, listed companies are required to establish a remuneration committee with a majority of independent non-executive directors. The compensation of our executive officers is determined by a remuneration committee consisting of six directors, three of whom are independent non-executive directors. |
|
| • | | Nasdaq Stock Market Rule 5605(e)(1) requires a Nasdaq listed company to have a nominations committee consisting solely of independent directors to select or recommend for selection director nominees. In this regard we have elected to adopt the practices of our home country and do not have a nominations committee consisting solely of independent directors. Under the HKSE Listing Rules, listed companies are recommended but not required to establish a nomination committee consisting of the independent non-executive directors with majority vote. Our director nominees are selected by or recommended for selection by the Board. Our current practice is not inconsistent with our home country practices. |
Other than the above, we have followed and intend to continue to follow the applicable Nasdaq corporate governance standards.
57
ITEM 17. FINANCIAL STATEMENTSItem 17 Financial statementsCity Telecom has
We have selected to provide the financial statements and related information specified in Item 18 in lieu of Item 17.
ITEM 18. FINANCIAL STATEMENTSItem 18 Financial statements See pages F-1 to
F-88F-51 following Item 19.
| (a) | (a) | Exhibit 12.1 –— Section 302 Certifications of the Chairman.Chief Executive Officer. |
| |
| (b) | | Exhibit 12.2 –— Section 302 Certifications of the Chief Financial Officer. |
| |
| (c) | | Exhibit 13 –— Section 906 Certification of ChairmanChief Executive Officer and Chief Financial Officer. |
58
Index to Consolidated Financial Statements
Report of Independent Registered Public Accounting Firm The Board of Directors and Shareholders
City Telecom (H.K.) Limited
We have audited the accompanying consolidated balance sheets of City Telecom (H.K.) Limited and its subsidiaries
(collectively referred to as the “Group”) as of August 31,
20062008 and
2007,2009, and the related consolidated
income statements, the consolidated statements of
operations, changes in
shareholders’ equity and
the consolidated cash
flowsflow statements for
each of the years
in the three-year period ended August 31,
2007.2008 and 2009. These consolidated financial statements are the responsibility of the
Group’sCompany’s management. Our responsibility is to express an opinion on these consolidated financial statements based on our audits.
We conducted our audits in accordance with the standards of the Public Company Accounting Oversight Board (United States). Those standards require that we plan and perform the audit to obtain reasonable assurance about whether the financial statements are free of material misstatement. An audit includes examining, on a test basis, evidence supporting the amounts and disclosures in the financial
statements. An audit also includesstatements, assessing the accounting principles used and significant estimates made by management, as well as evaluating the overall financial statement presentation. We believe that our audits provide a reasonable basis for our opinion.
In our opinion, the consolidated financial statements referred to above present fairly, in all material respects, the financial position of City Telecom (H.K.) Limited and its subsidiaries as of August 31,
20062008 and
2007,2009, and the results of their operations and their cash flows for
each of the years
in the three-year period ended August 31,
2007,2008 and 2009, in conformity with
Hong Kong Financial Reporting Standards.Hong Kongthe International Financial Reporting Standards vary in certain significant respects from accounting principles generally accepted inas issued by the United States of America. Information relating to the nature and effect of such differences is presented in note 29 to the consolidated financial statements.
International Accounting Standards Board.
Hong Kong, China
November 5, 2009
F-1
November 22, 2007, except as to note 30 which is as of January 22, 2008
City Telecom (H.K.) Limited
Consolidated financial statements for the year ended August 31, 2007
City Telecom (H.K.) Limited and its subsidiaries
Consolidated
income statements
of operations(
AmountsExpressed in
thousands except per share data) | | | | | | | | | | | |
| | | | | Year ended August 31, | |
| | | Note | | 2005 | | | 2006 | | | 2007 | |
| | | | | HK$ | | | HK$ | | | HK$ | |
Revenue | | | | 1,162,059 | | | 1,134,876 | | | 1,141,270 | |
| | | | |
Operating expenses | | | | | | | | | | | |
| | | | |
Network costs | | 3 | | (339,402 | ) | | (300,593 | ) | | (214,591 | ) |
Salaries and related costs | | | | (259,392 | ) | | (256,721 | ) | | (221,102 | ) |
Sales and marketing expenses | | | | (267,983 | ) | | (204,952 | ) | | (203,673 | ) |
General and administrative expenses | | | | (395,211 | ) | | (440,672 | ) | | (402,760 | ) |
Provision for doubtful accounts | | | | (35,445 | ) | | (17,450 | ) | | (6,569 | ) |
| | | | | | | | | | | |
(Loss)/income from operations | | | | (135,374 | ) | | (85,512 | ) | | 92,575 | |
| | | | |
Interest income | | | | 13,578 | | | 20,378 | | | 22,671 | |
Interest expense | | 4 | | (54,462 | ) | | (88,637 | ) | | (87,504 | ) |
Other income, net | | 4 | | 6,037 | | | 4,465 | | | 3,149 | |
| | | | | | | | | | | |
(Loss)/income before taxation | | 4 | | (170,221 | ) | | (149,306 | ) | | 30,891 | |
Income tax credit/(expense) | | 5 | | 6,725 | | | 7,244 | | | (2,026 | ) |
| | | | | | | | | | | |
Net (loss)/income | | | | (163,496 | ) | | (142,062 | ) | | 28,865 | |
| | | | | | | | | | | |
(Loss)/Earnings per share | | | | | | | | | | | |
Basic | | 6 | | (26.6) cents | | | (23.1) cents | | | 4.7 cents | |
| | | | | | | | | | | |
Diluted | | 6 | | (26.6)cents | | | (23.1)cents | | | 4.6 cents | |
| | | | | | | | | | | |
Hong Kong dollars)
| | | | | | | | | | | | | |
| | | | | | | For the year ended August 31, | |
| | | Note | | | 2009 | | | 2008 | |
| | | | | | | HK$’000 | | | HK $’000 | |
Revenue | | | 2 | | | | 1,478,239 | | | | 1,302,981 | |
| Network costs | | | 3 | | | | (175,129 | ) | | | (178,367 | ) |
| Other operating expenses | | | 4 | (a) | | | (1,037,964 | ) | | | (966,094 | ) |
| Other revenues | | | 4 | (b) | | | 41,540 | | | | 24,989 | |
| Finance costs | | | 4 | (c) | | | (55,127 | ) | | | (75,137 | ) |
| | | | | | | | | | | |
Profit before taxation | | | 4 | | | | 251,559 | | | | 108,372 | |
| Income tax (expense)/ benefit | | | 5 | | | | (38,730 | ) | | | 16,818 | |
| | | | | | | | | | | |
Profit attributable to shareholders | | | | | | | 212,829 | | | | 125,190 | |
| | | | | | | | | | | |
Dividends | | | 6 | | | | 126,173 | | | | 38,614 | |
| | | | | | | | | | | |
Basic earnings per share | | | 7 | | | HK32.4 cents | | | HK19.7 cents | |
| | | | | | | | | | | |
Diluted earnings per share | | | 7 | | | HK31.8 cents | | | HK19.0 cents | |
| | | | | | | | | | | |
The accompany notes are an integral part of these consolidated financial statements.
F-2
City Telecom (H.K.) Limited
Consolidated financial statements for the year ended August 31, 2007
City Telecom (H.K.) Limited and its subsidiaries
Consolidated balance sheets
(Expressed in Hong Kong dollars)
| | | | | | | | | | | | | |
| | | | | | | As at August 31, | |
| | | Note | | | 2009 | | | 2008 | |
| | | | | | | HK$’000 | | | HK$’000 | |
Non-current assets | | | | | | | | | | | | |
| Goodwill | | | 11 | | | | 1,066 | | | | 1,066 | |
| Fixed assets | | | 12 | | | | 1,302,380 | | | | 1,231,399 | |
| Long term receivable and prepayment | | | | | | | 6,091 | | | | 5,586 | |
| Deferred expenditure | | | 15 | | | | 12,786 | | | | 15,391 | |
| Deferred tax assets | | | 21 | | | | — | | | | 26,335 | |
| | | | | | | | | | | |
| | | | | | | | 1,322,323 | | | | 1,279,777 | |
| | | | | | | | | | | |
Current assets | | | | | | | | | | | | |
| | | | | | | | | | | | | |
| Accounts receivable | | | 16 | | | | 120,192 | | | | 140,283 | |
| Other receivables, deposits and prepayments | | | 16 | | | | 69,765 | | | | 82,726 | |
| Deferred expenditure | | | 15 | | | | 36,674 | | | | 40,704 | |
| Other financial assets | | | 14 | | | | — | | | | 27,997 | |
| Pledged bank deposits | | | 27 | | | | 15,038 | | | | 87,319 | |
| Cash at bank and in hand | | | 17 | | | | 221,052 | | | | 421,610 | |
| | | | | | | | | | | |
| | | | | | | | 462,721 | | | | 800,639 | |
| | | | | | | | | | | |
Current liabilities | | | | | | | | | | | | |
| | | | | | | | | | | | | |
| Accounts payable | | | 18 | | | | 37,555 | | | | 52,324 | |
| Other payables and accrued charges | | | 18 | | | | 206,487 | | | | 178,114 | |
| Deposits received | | | | | | | 16,385 | | | | 16,264 | |
| Deferred service revenue | | | 19 | | | | 115,070 | | | | 110,449 | |
| Tax payable | | | | | | | 1,993 | | | | 2,103 | |
| Current portion — obligations under finance leases | | | 22 | | | | 202 | | | | 121 | |
| | | | | | | | | | | |
| | | | | | | | 377,692 | | | | 359,375 | |
| | | | | | | | | | | |
| | | | | | | | | | | | | |
Net current assets | | | | | | | 85,029 | | | | 441,264 | |
| | | | | | | | | | | |
| | | | | | | | | | | | | |
Total assets less current liabilities | | | | | | | 1,407,352 | | | | 1,721,041 | |
| | | | | | | | | | | |
| | | | | | | | | | | | | |
Non-current liabilities | | | | | | | | | | | | |
| | | | | | | | | | | | | |
| Deferred tax liabilities | | | 21 | | | | 15,709 | | | | 4,937 | |
| Long-term debt and other liabilities | | | 22 | | | | 163,116 | | | | 683,497 | |
| | | | | | | | | | | |
| | | | | | | | 178,825 | | | | 688,434 | |
| | | | | | | | | | | |
| | | | | | | | | | | | | |
Net assets | | | | | | | 1,228,527 | | | | 1,032,607 | |
| | | | | | | | | | | |
Capital and reserves | | | | | | | | | | | | |
| | | | | | | | | | | | | |
| Share capital | | | 20 | | | | 66,418 | | | | 65,062 | |
| Reserves | | | 20 | | | | 1,162,109 | | | | 967,545 | |
| | | | | | | | | | | |
| | | | | | | | | | | | | |
Total equity attributable to equity shareholders of the Company | | | | | | | 1,228,527 | | | | 1,032,607 | |
| | | | | | | | | | | |
The accompany notes are integral part of these consolidated financial statements.
F-3
(Amounts in thousands except number of shares and per share amounts)
| | | | | | |
| | | | | August 31, |
| | | Note | | 2006 | | 2007 |
| | | | | HK$ | | HK$ |
ASSETS | | | | | | |
| | | |
Current assets | | | | | | |
| | | |
Cash and bank balances | | 19 | | 144,917 | | 532,894 |
Term bank deposits | | 19 | | 237,496 | | — |
Pledged bank deposits | | 15 | | 87,022 | | 87,220 |
Investment securities | | | | — | | 3,779 |
Trade receivables, net | | 7(a) | | 140,598 | | 170,551 |
Other receivables, deposits and prepayments | | 7(b) | | 77,583 | | 59,372 |
Inventories | | | | 856 | | 477 |
Deferred expenditure | | 12 | | 10,808 | | 13,584 |
Income tax receivable | | | | 347 | | — |
| | | | | | |
Total current assets | | | | 699,627 | | 867,877 |
| | | |
Goodwill | | 8 | | 1,066 | | 1,066 |
Fixed assets, net | | 9 | | 1,367,234 | | 1,237,223 |
Investment securities | | 16 | | 40,274 | | 39,213 |
Derivative financial instrument | | 17 | | 1,845 | | 1,039 |
Long term receivables and prepayment | | | | 12,532 | | 6,932 |
Deferred expenditure | | 12 | | 1,637 | | 7,783 |
| | | | | | |
Total assets | | | | 2,124,215 | | 2,161,133 |
| | | | | | |
LIABILITIES AND SHAREHOLDERS’ EQUITY | | | | | | |
| | | |
Current liabilities | | | | | | |
| | | |
Trade payables | | | | 86,385 | | 76,019 |
Deposits received | | | | 16,230 | | 16,188 |
Current portion of deferred services income | | | | 33,743 | | 64,202 |
Other payables and accrued charges | | 10 | | 143,486 | | 145,267 |
Income tax payable | | | | 1,964 | | 1,481 |
Current portion of obligations under finance leases | | 13 | | 1,297 | | 835 |
| | | | | | |
Total current liabilities | | | | 283,105 | | 303,992 |
| | | |
Long-term liabilities | | | | | | |
| | | |
Deferred taxation | | 11 | | 353 | | 291 |
Long-term debt and other liabilities | | 13 | | 949,103 | | 952,968 |
| | | | | | |
Total liabilities | | | | 1,232,561 | | 1,257,251 |
City Telecom (H.K.) Limited
Consolidated financial statements for the year ended August 31, 2007
City Telecom (H.K.) Limited and its subsidiaries
Consolidated
balance sheets (continued)(Amountsstatements of changes in thousands except number of shares and per share amounts)
| | | | | | |
| | | | | August 31, |
| | | Note | | 2006 | | 2007 |
| | | | | HK$ | | HK$ |
Commitments and contingencies | | 14 | | | | |
| | | |
Shareholders’ equity | | | | | | |
| | | |
Ordinary shares, par value HK$0.10 per share | | | | | | |
- 2,000,000,000 shares authorised | | | | | | |
- 614,175,404 and 616,503,404 shares issued and outstanding at August 31, 2006 and 2007, respectively | | 18 | | 61,417 | | 61,650 |
Share premium | | | | 620,298 | | 622,433 |
Retained profits | | | | 196,289 | | 200,519 |
Capital reserve | | | | 12,993 | | 18,109 |
Translation reserve | | | | 657 | | 1,171 |
| | | | | | |
Total shareholders’ equity | | | | 891,654 | | 903,882 |
| | | | | | |
Total liabilities and shareholders’ equity | | | | 2,124,215 | | 2,161,133 |
| | | | | | |
equity
(Expressed in Hong Kong dollars)
| | | | | | | | | | | | | |
| | | | | | | For the year ended August 31, | |
| | | Note | | | 2009 | | | 2008 | |
| | | | | | | HK$’000 | | | HK$’000 | |
Total equity as at beginning of the year | | | | | | | 1,032,607 | | | | 903,882 | |
| | | | | | | | | | | |
Net profit recognized directly in equity: | | | | | | | | | | | | |
| | | | | | | | | | | | | |
| Exchange adjustments on translation of the financial statements of subsidiaries | | | | | | | 70 | | | | 1,619 | |
| | | | | | | | | | | | | |
Net profit for the year | | | | | | | 212,829 | | | | 125,190 | |
| | | | | | | | | | | |
| | | | | | | | | | | | | |
Total recognized profit for the year | | | | | | | 212,899 | | | | 126,809 | |
| | | | | | | | | | | |
| | | | | | | | | | | | | |
Dividends declared and paid in respect of the current year | | | | | | | (19,904 | ) | | | (11,371 | ) |
Dividends declared and paid in respect of the previous year | | | | | | | (3,108 | ) | | | (5,915 | ) |
| | | | | | | | | | | |
| | | | | | | | | | | | | |
| | | | | | | | (23,012 | ) | | | (17,286 | ) |
| | | | | | | | | | | |
Movements in equity arising from capital transactions: | | | | | | | | | | | | |
| | | | | | | | | | | | | |
| Repurchase and cancellation of ordinary shares | | | | | | | (134 | ) | | | — | |
| Equity settled share-based transactions | | | 10 | | | | 4,768 | | | | 4,204 | |
| Shares issued upon exercise of options | | | | | | | 1,399 | | | | 14,998 | |
| | | | | | | | | | | |
| | | | | | | | | | | | | |
| | | | | | | | 6,033 | | | | 19,202 | |
| | | | | | | | | | | |
| | | | | | | | | | | | | |
Total equity as at the end of the year | | | | | | | 1,228,527 | | | | 1,032,607 | |
| | | | | | | | | | | |
The accompany notes are an integral part of these consolidated financial statements.
F-4
City Telecom (H.K.) Limited
Consolidated financial statements for the year ended August 31, 2007
City Telecom (H.K.) Limited and its subsidiaries
Consolidated cash flow statements of changes
(Expressed in shareholders’ equity(Amounts in thousands)
| | | | | | | | | | | |
| | | | | Year ended August 31, | |
| | | Note | | 2005 | | | 2006 | | | 2007 | |
| | | | | HK$ | | | HK$ | | | HK$ | |
Total equity as at beginning of the year | | | | | | | | | | | |
| | | | |
As previously reported | | | | 1,175,698 | | | 1,020,454 | | | 891,654 | |
Adjustment arising from adoption of HKAS 39 | | 18(a) | | — | | | 6,609 | | | — | |
| | | | | | | | | | | |
After opening balance adjustment | | | | 1,175,698 | | | 1,027,063 | | | 891,654 | |
| | | | |
Net (loss)/gain recognized directly in equity: | | | | | | | | | | | |
| | | | |
Foreign currency translation adjustment | | | | (143 | ) | | (183 | ) | | 514 | |
| | | | |
(Loss)/profit attributable to shareholders | | | | (163,496 | ) | | (142,062 | ) | | 28,865 | |
| | | | |
2007 interim dividends declared and paid | | | | — | | | — | | | (24,635 | ) |
| | | | |
Movements in equity arising fromcapital transactions: | | | | | | | | | | | |
| | | | |
Equity settled share-based compensation | | | | 6,965 | | | 6,823 | | | 5,727 | |
Shares issued upon exercise of options and warrant | | | | 1,430 | | | 13 | | | 1,757 | |
| | | | | | | | | | | |
Total equity as at the end of the year | | 18 | | 1,020,454 | | | 891,654 | | | 903,882 | |
| | | | | | | | | | | |
Hong Kong dollars)
| | | | | | | | | | | | | |
| | | | | | | For the year ended August 31, | |
| | | Note | | | 2009 | | | 2008 | |
| | | | | | | HK$’000 | | | HK$’000 | |
Net cash inflow from operations | | | 23 | (a) | | | 537,618 | | | | 382,813 | |
| | | | | | | | | | | | | |
| Hong Kong profits tax recovered | | | | | | | — | | | | 42 | |
| Overseas tax paid | | | | | | | (1,732 | ) | | | (4,292 | ) |
| | | | | | | | | | | |
| | | | | | | | | | | | | |
Net cash inflow from operating activities | | | | | | | 535,886 | | | | 378,563 | |
| | | | | | | | | | | |
Investing activities | | | | | | | | | | | | |
| | | | | | | | | | | | | |
| Increase in pledged bank deposits | | | | | | | 72,281 | | | | — | |
| Interest received | | | | | | | 4,869 | | | | 15,596 | |
| Purchases of fixed assets | | | | | | | (289,938 | ) | | | (189,903 | ) |
| Net proceeds from maturity of investment in debt securities | | | | | | | 28,051 | | | | 3,900 | |
| Net proceeds from redemption of long-term bank deposit | | | | | | | — | | | | 15,600 | |
| Proceeds from disposal of fixed assets | | | | | | | 8,249 | | | | 7,057 | |
| | | | | | | | | | | |
| | | | | | | | | | | | | |
Net cash outflow from investing activities | | | | | | | (176,488 | ) | | | (147,750 | ) |
| | | | | | | | | | | |
| | |
Net cash inflow before financing activities | | | | | | | 359,398 | | | | 230,813 | |
| | | | | | | | | | | |
Financing activities | | | | | | | | | | | | |
| | | | | | | | | | | | | |
| Repurchase of ordinary shares | | | | | | | (134 | ) | | | — | |
| Proceeds from issuance of new shares | | | 23 | (b) | | | 1,399 | | | | 14,998 | |
| Repayment of capital element of finance leases | | | 23 | (b) | | | (138 | ) | | | (834 | ) |
| Interest element of finance leases | | | | | | | (27 | ) | | | (34 | ) |
| Interest paid on 10-year senior notes | | | | | | | (52,670 | ) | | | (70,010 | ) |
| Repurchase of 10-year senior notes | | | 23 | (b) | | | (485,829 | ) | | | (269,399 | ) |
| Dividends paid | | | | | | | (23,008 | ) | | | (17,271 | ) |
| | | | | | | | | | | |
| | | | | | | | | | | | | |
Net cash outflow from financing activities | | | | | | | (560,407 | ) | | | (342,550 | ) |
| | | | | | | | | | | |
| | | | | | | | | | | | | |
Decrease in cash at bank and in hand | | | | | | | (201,009 | ) | | | (111,737 | ) |
| | | | | | | | | | | | | |
Cash at bank and in hand at September 1 | | | | | | | 421,610 | | | | 532,894 | |
| | | | | | | | | | | | | |
Effect of foreign exchange rate changes | | | | | | | 451 | | | | 453 | |
| | | | | | | | | | | |
| | | | | | | | | | | | | |
Cash at bank and in hand at August 31 | | | | | | | 221,052 | | | | 421,610 | |
| | | | | | | | | | | |
The accompany notes are an integral part of these consolidated financial statements.
F-5
City Telecom (H.K.) LimitedConsolidated financial statements for the year ended August 31, 2007
City Telecom (H.K.) Limited and its subsidiaries
Consolidated statements of cash flows
(Amounts in thousands)
| | | | | | | | | | | |
| | | | | Year ended August 31, | |
| | | Note | | 2005 | | | 2006 | | | 2007 | |
| | | | | HK$ | | | HK$ | | | HK$ | |
Cash flows from operating activities | | | | | | | | | | | |
| | | | |
(Loss)/income before taxation | | | | (170,221 | ) | | (149,306 | ) | | 30,891 | |
| | | | |
Adjustments to reconcile | | | | | | | | | | | |
| | | | |
(Loss)/income before taxation to net cash inflow from operating activities: | | | | | | | | | | | |
| | | | |
-Amortization of goodwill | | | | 1,065 | | | — | | | — | |
-Depreciation of purchased fixed assets | | | | 236,269 | | | 275,538 | | | 257,052 | |
-Depreciation of fixed assets held under finance leases | | | | 380 | | | 926 | | | 1,051 | |
-Impairment loss on investment property | | | | — | | | 1,131 | | | — | |
-Amortization of deferred expenditure | | | | 12,927 | | | 13,973 | | | 15,580 | |
-Interest income | | | | (13,578 | ) | | (20,378 | ) | | (22,671 | ) |
-Interest expense | | | | 374 | | | — | | | — | |
-Interest element of finance leases | | | | 23 | | | 54 | | | 62 | |
-(Gain)/loss on disposal of fixed assets | | | | (134 | ) | | 9,621 | | | 1,714 | |
-Unrealized loss on investment securities | | | | (300 | ) | | (668 | ) | | (1,887 | ) |
-Interest, amortisation and exchange difference on senior notes | | | | 54,065 | | | 86,664 | | | 89,879 | |
-Other borrowing costs | | | | — | | | 1,919 | | | (739 | ) |
-Equity settled share-based compensation | | | | 6,965 | | | 6,823 | | | 5,727 | |
-Realized and unrealized loss on derivative financial instruments | | | | — | | | 125 | | | 806 | |
-(Increase)/decrease in long-term receivable and prepayment | | | | (6,893 | ) | | 567 | | | 5,600 | |
City Telecom (H.K.) Limited
Consolidated financial statements for the year ended August 31, 2007
City Telecom (H.K.) Limited and its subsidiaries
Consolidated statements of cash flows (continued)
(Amounts in thousands)
| | | | | | | | | | | |
| | | | | Year ended August 31, | |
| | | Note | | 2005 | | | 2006 | | | 2007 | |
| | | | | HK$ | | | HK$ | | | HK$ | |
Cash flows from operating activities(continued) | | | | | | | | | | | |
| | | | |
Adjustments to reconcile (continued) | | | | | | | | | | | |
| | | | |
Changes in operating assets and liabilities: | | | | | | | | | | | |
| | | | |
- Increase in trade receivables, other receivables, deposits and prepayments | | | | (29,890 | ) | | (9,413 | ) | | (11,742 | ) |
- (Increase)/decrease in inventories | | | | (1,957 | ) | | 1,101 | | | 379 | |
- Increase in deferred expenditure | | | | (12,495 | ) | | (5,287 | ) | | (24,502 | ) |
- Increase/(decrease) in trade payables, other payables, accrued charges, and deposits received | | | | 5,258 | | | (23,652 | ) | | 8,573 | |
- (Decrease)/increase in deferred service income | | | | (2,685 | ) | | (3,001 | ) | | 30,459 | |
| | | | | | | | | | | |
Net cash inflow generated from operations | | | | 79,173 | | | 186,737 | | | 386,232 | |
| | | | | | | | | | | |
| | | | |
Interest paid | | | | (374 | ) | | — | | | — | |
Interest element of finance leases | | | | (23 | ) | | (54 | ) | | (62 | ) |
Hong Kong profits tax paid | | | | (805 | ) | | (961 | ) | | (263 | ) |
Overseas tax paid | | | | (588 | ) | | (1,571 | ) | | (1,908 | ) |
| | | | | | | | | | | |
Net cash inflow from operating activities | | | | 77,383 | | | 184,151 | | | 383,999 | |
| | | | | | | | | | | |
Investing activities | | | | | | | | | | | |
| | | | |
(Increase)/decrease in pledged bank deposits | | | | (63,642 | ) | | 3,425 | | | (198 | ) |
(Increase)/decrease in term bank deposits | | | | (92,850 | ) | | (144,646 | ) | | 237,496 | |
Purchases of fixed assets | | | | (415,494 | ) | | (382,214 | ) | | (149,300 | ) |
Interest received | | | | 13,578 | | | 20,378 | | | 22,671 | |
Proceeds from disposal of fixed assets | | | | 968 | | | 5,676 | | | 3,384 | |
Net proceeds from maturity of derivative financial instruments | | | | — | | | 4,639 | | | — | |
| | | | | | | | | | | |
Net cash (outflow)/inflow from investing activities | | | | (557,440 | ) | | (492,742 | ) | | 114,053 | |
| | | | | | | | | | | |
Net cash (outflow)/inflow before financing activities | | | | (480,057 | ) | | (308,591 | ) | | 498,052 | |
| | | | | | | | | | | |
City Telecom (H.K.) Limited
Consolidated financial statements for the year ended August 31, 2007
City Telecom (H.K.) Limited and its subsidiaries
Consolidated statements of cash flows (continued)
(Amounts in thousands)
| | | | | | | | | | | |
| | | | | Year ended August 31, | |
| | | Note | | 2005 | | | 2006 | | | 2007 | |
| | | | | HK$ | | | HK$ | | | HK$ | |
Financing activities | | | | | | | | | | | |
| | | | |
Proceeds from exercise of share options and warrants | | | | 1,430 | | | 13 | | | 1,757 | |
Net proceeds from issuance of senior notes | | | | 943,655 | | | — | | | — | |
Interest paid on senior notes | | | | (52,372 | ) | | (85,235 | ) | | (85,313 | ) |
Proceeds from bank loan | | | | 100,000 | | | — | | | — | |
Repayment of bank loan | | | | (200,000 | ) | | — | | | — | |
Repayment of capital element of finance Leases | | | | (497 | ) | | (1,210 | ) | | (1,321 | ) |
Dividends paid | | | | — | | | — | | | (24,627 | ) |
| | | | | | | | | | | |
Net cash inflow/(outflow) from financing Activities | | | | 792,216 | | | (86,432 | ) | | (109,504 | ) |
| | | | | | | | | | | |
Increase/(decrease) in cash and bankbalances | | | | 312,159 | | | (395,023 | ) | | 388,548 | |
| | | | |
Cash and bank balances at thebeginning of year | | | | 228,347 | | | 539,591 | | | 144,917 | |
| | | | |
Effect of foreign exchange rate changes on cash and bank balances | | | | (915 | ) | | 349 | | | (571 | ) |
| | | | | | | | | | | |
Cash and bank balances at the endof year | | 19 | | 539,591 | | | 144,917 | | | 532,894 | |
| | | | | | | | | | | |
The accompany notes are an integral part of these consolidated financial statements.
City Telecom (H.K.) Limited
Consolidated financial statements for the year ended August 31, 2007
| 1 | Description | Significant accounting policies |
|
| (a) | | Statement of businesscompliance |
|
| | City Telecom (H.K.) Limited (the “Company”) was incorporated in Hong Kong on May 19, 1992 under the Hong Kong Companies Ordinance. City Telecom (H.K.) Limited and its subsidiaries (collectively referred to as the “Group”) are engaged in the provision of international telecommunications services and fixed telecommunications network services to customers in Hong Kong and Canada. |
|
| | The accompanying consolidated financial statements have been prepared in accordance with all applicable International Financial Reporting Standards (“IFRSs”) issued by the International Accounting Standards Board (“IASB”), which collective term includes all applicable individual International Financial Reporting Standards, International Accounting Standards (“IASs”) and Interpretations issued by the IASB. |
|
| | In prior periods, the Company prepared its consolidated financial statements in accordance with Hong Kong Financial Reporting Standards (“HKFRSs”), which collective term includes all applicable individual Hong Kong Financial Reporting Standards, Hong Kong Accounting Standards (“HKASs”) and Interpretations issued by the Hong Kong Institute of Certified Public Accountants (“HKICPA”) and accounting principles generally accepted in Hong Kong. Although HKFRSs have been fully converged with IFRSs in all material respects since January 1, 2005, the accompanying consolidated financial statements are the first published financial statements in which the Company makes an explicit and unreserved statement of compliance with IFRSs. Therefore, in preparing these financial statements management has given due consideration to the requirements of IFRS 1, First-time Adoption of International Financial Reporting Standards. The date of the Company’s transition to IFRSs was determined to be September 1, 2007, being the beginning of the earliest period for which the Company presents full comparative information in these financial statements. |
|
| | With due regard to the Company’s accounting policies in previous periods and the requirements of IFRS 1, management has concluded that no adjustments to the amounts reported under HKFRSs as at the date of transition to IFRSs, or in respect of the year ended August 31, 2008, were required in order to enable the Company to make an explicit and unreserved statement of compliance with IFRSs in the first IFRS financial statements which included these amounts as comparatives. |
|
| | The IASB has issued a number of new or revised IFRSs that are first effective or available for early adoption for the current accounting period of the Company. However, none of these developments are relevant to the Company’s operations. |
|
| | The Group has not applied any new standard or interpretation that is not yet effective for the current accounting period (see note 31). |
|
| | The consolidated financial statements were authorized for issue by the Board of Directors on November 5, 2009. |
|
| (b) | | Basis of preparation of the financial statements |
|
| | The measurement basis used in the preparation of the financial statements is the historical cost basis except that certain financial assets are stated at their fair values or amortized costs as explained in the accounting policies set out below (see notes 1(j), 1(k) and 1(r)). |
|
| | The preparation of financial statements in conformity with IFRSs requires management to make judgments, estimates and assumptions that affect the application of policies and reported amounts of assets, liabilities, income and expenses. The estimates and associated assumptions are based on historical experience and various other factors that are believed to be reasonable under the circumstances, the results of which form the basis of presentationmaking the judgments about the carrying values of assets and liabilities that are not readily apparent from other sources. Actual results may differ from these estimates. |
|
| | The estimates and underlying assumptions are reviewed on an ongoing basis. Revisions to accounting estimates are recognized in the period in which the estimate is revised if the revision affects only that period, or in the period of the revision and future periods if the revision affects both current and future periods. |
|
| | Judgments made by management in the application of IFRSs that have significant effect on the financial statements and estimates with a significant risk of material adjustment in the next year are discussed in note 30. |
|
| (c) | | Subsidiaries and controlled entities |
|
| | Subsidiaries are entities controlled by the Group. Control exists when the Group has the power to govern the financial and operating policies of an entity so as to obtain benefits from its activities. In assessing control, potential voting rights that presently are exercisable are taken into account. |
City Telecom (H.K.) Limited (the “Company”) was incorporated in Hong Kong on May 19, 1992 under the Hong Kong Companies Ordinance. City Telecom (H.K.) Limited and its subsidiaries (collectively referred to as the “Group”) are engaged in the provision of international telecommunications services and fixed telecommunications network services to customers in Hong Kong and Canada.F-6
The following is a list of principal subsidiaries which principally affect the results, assets or liabilities of the Group as at August 31, 2007:
| 1 | | Significant accounting policies (continued) |
|
| (d) | | Group accounting |
|
| (i) | | Consolidation |
|
| | An investment in a subsidiary is consolidated into the consolidated financial statements from the date that control commences until the date that control ceases. |
|
| | Intra-group balances and transactions and any unrealized profits arising from intra-group transactions are eliminated in full in preparing the consolidated financial statements. Unrealized losses resulting from intra-group transactions are eliminated in the same way as unrealized gains but only to the extent that there is no evidence of impairment. |
|
| (ii) | | Translation of foreign currencies |
|
| | Transactions in foreign currencies are translated at exchange rates ruling at the transaction dates. Monetary assets and liabilities denominated in foreign currencies are translated at exchange rates ruling at the balance sheet date. Exchange differences arising in these cases are dealt with in profit or loss. |
|
| | For consolidation purposes, the balance sheets of foreign subsidiaries are translated at the rates of exchange ruling at the balance sheet date whilst the income statement is translated at an average rate for the year. Exchange differences are dealt with as a movement in reserves. |
|
| | The accompanying consolidated financial statements are presented in Hong Kong Dollars, which is the Company’s functional currency. All financial information have been rounded to the nearest thousand. |
|
| (e) | | Goodwill |
|
| | Goodwill represents the excess of the cost of a business combination or an investment in an associate or a jointly controlled entity over the Group’s interest in the net fair value of the acquiree’s identifiable assets, liabilities and contingent liabilities. |
|
| | Goodwill is stated at cost less accumulated impairment losses. Goodwill is allocated to cash-generating units and is tested annually for impairment (see note 1(i)). In respect of associates or jointly controlled entities, the carrying amount of goodwill is included in the carrying amount of the interest in the associate or jointly controlled entity. |
|
| | Any excess of the Group’s interest in the net fair value of the acquiree’s identifiable assets, liabilities and contingent liabilities over the cost of a business combination or an investment in an associate or a jointly controlled entity is recognized immediately in profit or loss. |
|
| | On disposal of a cash generating unit, an associate or a jointly controlled entity during the year, any attributable amount of goodwill is included in the calculation of the profit or loss on disposal. |
|
| (f) | | Investment property |
|
| | Investment properties are buildings which are owned and held to earn rental income and/or for capital appreciation. |
|
| | Investment properties are stated in the balance sheet at cost less accumulated depreciation (see note 1(g)) and impairment losses (see note 1(i)) if any. Any gain or loss arising from the retirement or disposal of an investment property is recognized in the income statement. Rental income from investment property is accounted for in accordance with the accounting policy as set out in note 1(t)(v). |
|
| (g) | | Fixed assets |
|
| | Fixed assets are stated at cost less accumulated depreciation and accumulated impairment losses. |
|
| | Depreciation is calculated to write off the cost of items of property, plant and equipment, less their estimated residual value, if any, using the straight-line method over their estimated useful lives as follows: |
| - | | Buildings situated on leasehold land are depreciated over the shorter of the unexpired term of lease and their estimated useful lives of 50 years |
| | |
| - Furniture, fixtures and fittings | | 4 years |
| | | |
| - Telecommunications, computer and office equipment | | 4 years – 20 years |
Percentage
holding
| | |
Name
- Motor vehicles | | Place and date of
establishment/ operation
4 years |
| - | | Issued capital
| | Directly | | Indirectly | | Nature of
business
|
963673 Ontario Limited | | Canada
November 12, 1991
| | Common Canadian dollar (“CAD”) 502,000 | | — | | 100 | | Investment holding
in Canada |
| | | | | |
Attitude Holdings Limited | | British Virgin Islands November 3, 1997 | | Ordinary US$1 | | — | | 100 | | Inactive |
| | | | | |
Automedia Holdings Limited | | British Virgin Islands
January 23, 2001
| | Ordinary US$1 | | 100 | | — | | Investment holding
in Hong Kong |
| | | | | |
City Telecom (B.C.) Inc. | | Canada
February 25, 1992
| | Common CAD501,000 | | — | | 100 | | Provision of
international
telecommunications
and dial-up Internet
access services in
Canada |
| | | | | |
City Telecom (Canada) Inc. | | Canada
October 6, 1997
| | Common CAD100 | | — | | 100 | | Leasing and
maintenance of
switching
equipment and
provision of
operational services
in Canada |
City Telecom (H.K.) Limited
Consolidated financial statements for the year ended August 31, 2007
1 | Description of business and basis of presentation (continued) |
| | | | | | | | | | |
| | Place and
date of establishment/
operation
| | | | Percentage
holding
| | Nature of
business
|
Name
| | | Issued capital | | Directly | | Indirectly | |
City Telecom Inc.
| | Canada September 19, 1991 | | Common
CAD1,000
| | — | | 100 | | Provision of
international
telecommunications
and dial-up Internet
access services in
Canada |
City Telecom International Limited
| | British Virgin Islands
May 8, 1997
| | Ordinary
US$5,294
| | 100 | | — | | Investment holding
in Hong Kong |
City Telecom (U.S.A.) Inc.
| | USA May 5, 1997 | | Common
US$1
| | — | | 100 | | Inactive |
Credibility Holdings Limited
| | British Virgin Islands December 18, 1998 | | Ordinary
US$1
| | 100 | | — | | Investment holding
in Hong Kong |
CTI Guangzhou Customer Service Co. Ltd (translated from the registered name in Chinese)
| | The People’s Republic of
China (“the
PRC”)
April 29, 2002
| | Paid in capital of
HK$8,000,000 | | 100 | | —
| | Provision of
administrative
support services in
the PRC |
CTI International Limited
| | Hong Kong August 23, 1999 | | Ordinary
HK$10,000,000
| | — | | 100 | | Inactive |
CTI Marketing Company Limited
| | Hong Kong August 23, 1999 | | Ordinary
HK$10,000
| | — | | 100 | | Provision of media
marketing services
in Hong Kong |
Golden Trinity Holdings Limited
| | British Virgin
Islands
June 11, 1997
| | Ordinary
US$1
| | 100 | | — | | Investment holding
in Hong Kong |
City Telecom (H.K.) Limited
Consolidated financial statements for the year ended August 31, 2007
1 | Description of business and basis of presentation (continued) |
| | | | | | | | | | |
| | Place and
date of establishment/
operation
| | | | Percentage
holding
| | Nature of
business
|
Name
| | | Issued capital
| | Directly | | Indirectly | |
Hong Kong Broadband Network Limited
| | Hong Kong August 23, 1999 | | Ordinary
HK$383,049
| | — | | 100 | | Provision of international telecommunications and fixed telecommunications network services in Hong Kong |
IDD 1600 Company Limited
| | Hong Kong November 4, 1998 | | Ordinary
HK$2
| | — | | 100 | | Provision of international telecommunications services in Hong Kong |
Global Courier Company Limited (formerly known as iStore.com Limited)
| | Hong Kong September 17, 1999 | | Ordinary HK$10,000 | | — | | 100 | | Inactive |
SGBN Singapore Broadband Network Pte. Limited
| | Singapore
March 29, 2007
| | Ordinary Singapore dollar 1 | | 100 | | — | | Inactive |
2 | Basis of preparation and principal accounting policies |
(a) | Statement of compliance |
The accompanying consolidated financial statements have been prepared in accordance with all applicable Hong Kong Financial Reporting Standards (“HKFRSs”) which collective term includes all applicable individual Hong Kong Financial Reporting Standards, Hong Kong Accounting Standards (“HKASs”) and Interpretations issued by the Hong Kong Institute of Certified Public Accountants (“HKICPA”), as well as accounting principles generally accepted in Hong Kong and the requirements of the Hong Kong Companies Ordinance. HKFRSs differ in certain significant respects from accounting principles generally accepted in the United States of America (“U.S. GAAP”), details of which are set out in note 29.
City Telecom (H.K.) Limited
Consolidated financial statements for the year ended August 31, 2007
2 | Basis of preparation and principal accounting policies (continued) |
The consolidated financial statements consist of the balance sheets of the Company and all its subsidiaries as of August 31, 2006, and 2007 and the related statements of operations, cash flows and changes in shareholders’ equity for the years ended August 31, 2005, 2006 and 2007.
The measurement basis used in the preparation of the consolidated financial statements is the historical cost basis except that certain financial assets are stated at their fair value or amortized cost as explained in the accounting policies set out below (see notes 2(j) and 2(k)).
The preparation of financial statements in conformity with HKFRSs requires management to make judgements, estimates and assumptions that affect the application of policies and reported amounts of assets, liabilities, income and expenses. The estimates and associated assumptions are based on historical experience and various other factors that are believed to be reasonable under the circumstances, the results of which form the basis of making the judgements about the carrying values of assets and liabilities that are not readily apparent from other sources. Actual results may differ from these estimates. The estimates and underlying assumptions are reviewed on an ongoing basis. Revisions to accounting estimates are recognized in the period in which the estimate is revised if the revision affects only that period, or in the period of the revision and future periods if the revision affects both current and future periods.
All amounts are expressed in Hong Kong Dollars, the functional currency of City Telecom (H.K.) Limited. Unless indicated otherwise, amounts in Hong Kong Dollars have been rounded to the nearest thousand.
(c) | Subsidiaries and controlled entities |
Subsidiaries are entities controlled by the Company. Control exists when the Company has the power to govern the financial and operating policies of an entity so as to obtain benefits from its activities. In assessing control, potential voting rights that presently exercisable are taken into account.
City Telecom (H.K.) Limited
Consolidated financial statements for the year ended August 31, 2007
2 | Basis of preparation and principal accounting policies (continued) |
A controlled subsidiary is consolidated into the consolidated financial statements from the date that control commences until the date that control ceases.
Intercompany balances and transactions and any unrealized profits arising from intercompany transactions are eliminated in full in preparing the consolidated financial statements. Unrealized losses resulting from intercompany transactions are eliminated in the same way as unrealized gains but only to the extent that there is no evidence of impairment.
(ii) | Translation of foreign currencies |
Transactions in foreign currencies are translated at exchange rates ruling at the transaction dates. Monetary assets and liabilities expressed in foreign currencies at the balance sheet date are translated at rates of exchange ruling at the balance sheet date. Exchange differences arising from these transactions are dealt with in the consolidated statement of operations.
For consolidation purposes, the balance sheets of subsidiaries with functional currencies other than Hong Kong Dollars are translated at the rate of exchange ruling at the balance sheet date. Revenues and expenses are translated at the average rate prevailing during the year. The resulting exchange differences are dealt with in the consolidated statement of shareholders’ equity as translation reserves.
Goodwill represents the excess of the cost of a business combination or an investment in an associate or a jointly controlled entity over the Group’s interest in the net fair value of the acquiree’s identifiable assets, liabilities and contingent liabilities at the acquisition date. Any excess of the Group’s interest in the net fair value of the acquiree’s identifiable assets, liabilities and contingent liabilities over the cost of a business combination or an investment in an associate of a jointly controlled entity is recognized immediately in the consolidated statement of operations.
Goodwill is stated at cost less accumulated impairment losses, if any. Goodwill is allocated to cash-generating units and is tested annually for impairment (see note 2(i)). In respect of associates or jointly controlled entities, the carrying amount of goodwill is included in the carrying amount of the interest in the associate or jointly controlled entity.
On disposal of a cash generating unit, an associate or a jointly controlled entity during the year, any attributable amount of purchased goodwill is included in the calculation of the profit or loss on disposal.
City Telecom (H.K.) Limited
Consolidated financial statements for the year ended August 31, 2007
2 | Basis of preparation and principal accounting policies (continued) |
Investment properties are land and/or buildings held to earn rental income and/or for capital appreciation.
Investment properties are stated in the balance sheet at cost less accumulated depreciation (see note 2(g)) and impairment losses (see note 2(i)), if any. Any gain or loss arising from the retirement or disposal of an investment property is recognized in the consolidated statement of operations. Rental income from investment property is accounted for as described in note 2(t)(vi).
Fixed assets are stated at cost less accumulated depreciation and impairment losses.
Depreciation is calculated to write off the cost of items of property, plant and equipment, less their estimated residual value, if any, using the straight-line method over their estimated useful lives as follows:
| | |
- Buildings and investment property situated on leasehold land
| | Leasehold improvements are depreciated over the shorter of the unexpired term of the leases and their estimated useful lives of 50 yearslives. |
| |
- Furniture, fixtures and fittings
| | 4 yearsWhere the parts of an item of property, plant and equipment have different useful lives, the cost of the item is allocated on a reasonable basis between the parts and each part is depreciated separately. Both the useful life of an asset and its residual value, if any, are reviewed annually. |
F-7
| |
- Telecommunications, computer and office equipment
1 | | 4 - 20 yearsSignificant accounting policies (continued) |
| |
- Motor vehicles
(g) | | 4 years |
| |
- Leasehold improvements
| | over the shorter of the unexpired term of the leases and their estimated useful lives |
Where the parts of an item of property, plant and equipment have different useful lives, the cost of the item is allocated on a reasonable basis between the parts and each part is depreciated separately. Both the useful life of an asset and its residual value, if any, are reviewed annually.
Major costs incurred in restoring fixed assets to their normal working condition are charged to the consolidated statement of operations. Major improvements are capitalized and depreciated over the expected useful lives of the related asset.
City Telecom (H.K.) Limited
Consolidated financial statements for the year ended August 31, 2007
2 | Basis of preparation and principal accounting policies (continued) |
(g) | Fixed assets (continued) |
The gain or loss on disposal of a fixed asset is the difference between the net sales proceeds and the carrying amount of the relevant asset, and is recognized in the consolidated statement of operations on the date of disposal.
During the year ended August 31, 2007, the Group changed the estimated useful lives of certain telecommunications equipment. The effect of such change is set out in note 9(d).
Under certain circumstances, the Group may have obligation to dismantle part of its network upon request by concerned parties. Owing to the absence of such history, no reliable estimate can be reasonably made in respect of such potential obligation.
|
| | Major costs incurred in restoring fixed assets to their normal working condition are charged to profit or loss. Major improvements are capitalized and depreciated over their expected useful lives to the Group. |
|
| | The gain or loss on disposal of a fixed asset is the difference between the net sales proceeds and the carrying amount of the relevant asset, and is recognized in profit or loss on the date of disposal. |
|
| (h) | | Assets held under leases |
An arrangement, comprising a transaction or a series of transactions, is or contains a lease if the Group determines that the arrangement conveys a right to use a specific asset or assets for an agreed period of time in return for a payment or a series of payments. Such a determination is made based on an evaluation of the substance of the arrangement and is regardless of whether the arrangement takes the legal form of a lease.
|
| | An arrangement, comprising a transaction or a series of transactions, is or contains a lease if the Group determines that the arrangement conveys a right to use a specific asset or assets for an agreed period of time in return for a payment or a series of payments. Such a determination is made based on an evaluation of the substance of the arrangement and is regardless of whether the arrangement takes the legal form of a lease. |
|
| (i) | | Classification of assets leased assetsto the Group |
Assets held under leases which transfer to the Group substantially all the risks and rewards of ownership are classified as being held under finance leases. Leases which do not transfer substantially all the risks and rewards of ownership to the Group are classified as operating leases.
Land held for own use under an operating lease which its fair value cannot be measured separately from the fair value of a building situated thereon at the inception of the lease, is accounted for as being held under a finance lease, unless the building is also clearly held under an operating lease (see note 2(h)(iii)).
|
| | Assets that are held by Group under leases which transfer to the Group substantially all the risks and rewards of ownership are classified as being held under finance leases. Leases which do not transfer substantially all the risks and rewards of ownership to the Group are classified as operating leases. |
|
| | Land held for own use under an operating lease for which its fair value cannot be measured separately from the fair value of a building situated thereon at the inception of the lease, is accounted for as being held under a finance lease, unless the building is also clearly held under an operating lease (see note 1(h)(iii)). |
|
| (ii) | | Finance leases |
Where the Group acquired the use of assets under finance leases, the amounts representing the lower of the fair value of the leased asset, or the present value of the minimum lease payments is recorded in fixed assets with the corresponding liability, net of finance charges, recorded as obligations under finance leases. Depreciation and impairment losses are accounted for in accordance with the accounting policy in note 2(g) and note 2(i). Finance charges implicit in the lease payments are charged to the consolidated statement of operations over the period of the leases so as to produce an approximate constant periodic rate of charge on the remaining balance of the obligations.
City Telecom (H.K.) Limited
Consolidated financial statements for the year ended August 31, 2007
2 |
| Basis | Where the Group acquired the use of preparationassets under finance leases, the amounts representing the fair value of the leased asset or, if lower, the present value of the minimum lease payments of such assets, are included in fixed assets with the corresponding liabilities, net of finance charges, recorded as obligations under finance leases. Depreciation and principalimpairment losses are accounted for in accordance with the accounting policies (continued)policy as set out in note 1(g) and note 1(i). Finance charges implicit in the lease payments are charged to profit or loss over the period of the leases so as to produce an approximately constant periodic rate of charge on the remaining balance of the obligations for each accounting period. |
(h) | Assets held under leases (continued) |
Leases where substantially all the risks and rewards of ownership of assets remain with the lessor are accounted for as operating leases. Receipts and payments made under operating leases, net of any incentives, are credited/ charged to the consolidated statement of operations on a straight-line basis over the lease periods.
|
| | Leases where substantially all the risks and rewards of ownership of assets remain with the lessor are accounted for as operating leases. Receipts and payments made under operating leases net of any incentives received by/from the lessor are credited/charged to profit or loss on a straight-line basis over the lease periods. |
|
| (i) | | Impairment of assets |
|
| (i) | | Impairment of investmentinvestments in debt and equity securities and accounts receivable and other receivables |
|
| | Investments in debt and equity securities that are stated at cost or amortized cost or are classified as available-for-sale securities, and other current and non-current receivables that are stated at cost or amortized cost are reviewed at each balance sheet date to determine whether there is objective evidence of impairment. Objective evidence of impairment includes observable data that comes to the attention of the Group about one or more of the following loss events: |
Investments securities and other current and non-current receivables that are stated at cost or amortized cost are reviewed at each balance sheet date to determine whether there is objective evidence of impairment. If any such evidence exists, any impairment loss is determined and recognized as follows:
| | - | For | significant financial difficulty of the debtor; |
|
| - | | a breach of contract, such as a default or delinquency in interest or principal payments; |
|
| - | | it becoming probable that a debtor will enter bankruptcy or other financial reorganization; and |
|
| - | | a significant or prolonged decline in the fair value of an investment securities carried at amortized cost, thein an equity instrument below its cost. |
| | If any such evidence exists, any impairment loss is measureddetermined and recognized as the difference between the asset’s carrying amount and the estimated future cash flows, discounted at the financial asset’s original effective interest rate (i.e. the effective interest rate computed at initial recognition of the asset).follows: |
If in a subsequent period the amount of an impairment loss decreases and the decrease can be linked objectively to an event occurring after the impairment loss was recognized, the impairment loss is reversed through the consolidated statement of operations. A reversal of an impairment loss shall not result in the asset’s carrying amount exceeding that which would have been determined had no impairment loss been recognized in prior years.
| | - | | For unquoted equity securities and current and non-current receivables that are carried at cost, the impairment loss is measured as the difference between the asset’s carrying amount of the financial asset and the estimated future cash flows, discounted at the current market rate of return for a similar financial asset where the effect of discounting is material. Impairment losses for current and non-current receivables that are carried at cost are reversed if in a subsequent period the amount of the impairment loss decreases. Impairment losses for equity securities are not reversed. |
|
| - | | For financial assets carried at amortized cost, the impairment loss is measured as the difference between the asset’s carrying amount and the present value of estimated future cash flows, discounted at the financial asset’s original effective interest rate (i.e. the effective interest rate computed at initial recognition of these assets). This assessment is made collectively where financial assets carried at amortized cost share similar risk characteristics, such as similar past due status, and have not been individually assessed as impaired. Future cash flows for financial assets which are assessed for impairment collectively are based on historical loss experience for assets with credit risk characteristics similar to the collective group. |
F-8
| 1 | | Significant accounting policies (continued) |
|
| (i) | | Impairment of assets (continued) |
|
| (i) | | Impairment of investments in debt and equity securities and accounts receivable and other receivables (continued) |
| | | If in a subsequent period the amount of an impairment loss decreases and the decrease can be linked objectively to an event occurring after the impairment loss was recognized, the impairment loss is reversed through profit or loss. A reversal of an impairment loss shall not result in the asset’s carrying amount exceeding that would have been determined had no impairment loss been recognized in prior years. |
|
| - | | For available-for-sale securities, the cumulative loss that has been recognized directly in equity is removed from equity and is recognized in profit or loss. The amount of the cumulative loss that is recognized in profit or loss is the difference between the acquisition cost (net of any principal repayment and amortization) and current fair value, less any impairment loss on that asset previously recognized in profit or loss. |
|
| | | Impairment losses recognized in profit or loss in respect of available-for-sale equity securities are not reversed through profit or loss. Any subsequent increase in the fair value of such assets is recognized directly in equity. |
|
| | | Impairment losses in respect of available-for-sale debt securities are reversed if the subsequent increase in fair value can be objectively related to an event occurring after the impairment loss was recognized. Reversals of impairment losses in such circumstances are recognized in profit and loss. |
| | Impairment losses are written off against the corresponding assets directly, except for impairment losses recognized in respect of accounts receivable, whose recovery is considered doubtful but not remote. In this case, the impairment losses for doubtful debts are recorded using an allowance account. When the Group is satisfied that recovery is remote, the amount considered irrecoverable is written off against accounts receivable and any amounts held in the allowance account relating to that debt are reversed. Subsequent recoveries of amounts previously charged to the allowance account are reversed against the allowance account. Other changes in the allowance account and subsequent recoveries of amounts previously written off directly are recognized in profit or loss. |
|
| (ii) | | Impairment of other assets |
|
| | Internal and external sources of information are reviewed at each balance sheet date to identify indications that the following assets may be impaired or, except in the case of goodwill, an impairment loss previously recognized no longer exists or may have decreased: |
Internal and external sources of information are reviewed at each balance sheet date to identify indications that the following assets may be impaired or, except in the case of goodwill, an impairment loss previously recognized no longer exists or may have decrease:
| | - | | fixed assets; |
|
| - | | investment property; and |
|
| - | | goodwill. |
| | If any such indication exists, the asset’s recoverable amount is estimated. In addition, for goodwill, the recoverable amount is estimated annually whether or not there is any indication of impairment. |
| | - | investment property; and |
City Telecom (H.K.) Limited
Consolidated financial statements for the year ended August 31, 2007
2 | Basis of preparation and principal accounting policies (continued) |
(i) | Impairment of assets (continued) |
(ii) | Impairment of other assets (continued) |
If any such indication exists, the asset’s recoverable amount is estimated. In addition, for goodwill, the recoverable amount is estimated annually whether or not there is any indication of impairment.
| - | Calculation of recoverable amount |
The recoverable amount of an asset is the greater of its net selling price and value in use. In assessing value in use, the estimated future cash flows are discounted to their present value using a pre-tax discount rate that reflects current market assessments of time value of money and the risks specific to the asset. Where an asset does not generate cash inflows largely independent of those from other assets, the recoverable amount is determined for the smallest group of assets that generates cash inflows independently (i.e. a cash-generating unit).
|
| | | The recoverable amount of an asset is the greater of its net selling price and value in use. In assessing value in use, the estimated future cash flows are discounted to their present value using a pre-tax discount rate that reflects current market assessments of time value of money and the risks specific to the asset. Where an asset does not generate cash inflows largely independent of those from other assets, the recoverable amount is determined for the smallest group of assets that generates cash inflows independently (i.e. a cash-generating unit). |
|
| | - | | Recognition of impairment losses |
An impairment loss is recognized in consolidated statement of operations whenever the carrying amount of an asset, or the cash-generating unit to which it belongs, exceeds its recoverable amount. Impairment losses recognized in respect of cash-generating units are allocated first to reduce the carrying amount of any goodwill allocated to the cash-generating unit (or group of units) and then, to reduce the carrying amount of the other assets in the unit (or group of units) on a pro rata basis, except that the carrying value of an asset will not be reduced below its individual fair value less costs to sell, or value in use, if determinable.
|
| | | An impairment loss is recognized in profit or loss whenever the carrying amount of an asset, or the cash-generating unit to which it belongs, exceeds its recoverable amount. Impairment losses recognized in respect of cash-generating units are allocated first to reduce the carrying amount of any goodwill allocated to the cash-generating unit (or group of units) and then, to reduce the carrying amount of the other assets in the unit (or group of units) on a pro rata basis, except that the carrying value of an asset will not be reduced below its individual fair value less costs to sell, or value in use, if determinable. |
|
| | - | | Reversals of impairment losses |
Except in the case of goodwill, an impairment loss is reversed if there has been a favorable change in the estimate
|
| | | In respect of assets other than goodwill, an impairment loss is reversed if there has been a favorable change in the estimates used to determine the recoverable amount. An impairment loss in respect of goodwill is not reversed. |
|
| | | A reversal of an impairment loss is limited to the asset’s carrying amount that would have been determined had no impairment loss been recognized in prior years. Reversals of impairment losses are credited to profit or loss in the year in which the reversals are recognized. |
F-9
A reversal of an impairment loss is limited to the asset’s carrying amount that would have been determined had no impairment loss been recognized in prior years. Reversals of impairment losses are credited to consolidated statement of operations in the year in which the reversals are recognized.
City Telecom (H.K.) Limited
Consolidated financial statements for the year ended August 31, 2007
21 | Basis of preparation and principal | Significant accounting policies (continued) |
|
| (j) | | InvestmentOther financial assets |
|
| | The Group accounts for investments in debt and equity securities are as follows: |
|
| | Financial assets held for trading and those designated as at fair value through profit or loss at inception are accounted for at fair value. Such financial assets are initially stated at fair value and are classified as current assets, if they are expected to be realized within 12 months. At each balance sheet date the fair value of the financial assets is remeasured, with any resultant gain or loss being recognized in profit or loss. The net gain or loss recognized in profit or loss does not include any interest earned on these investments. Interest income is recognized in accordance with the policies set out in note 1(t)(iv). |
|
| | Held-to-maturity securities are dated debt securities that the Group has the positive ability and intent to hold to maturity. Such securities are initially recognized in the balance sheet at fair value plus transaction costs. Subsequently, they are stated in the balance sheet at amortized cost less impairment losses (see note 1(i)(i)). |
|
| | Financial assets that are not classified as held for trading, financial assets at fair value through profit or loss or, held-to-maturity securities, are classified as available-for-sale securities. Available-for-sale securities are initially recognized at fair value plus transaction costs. At each balance sheet date the fair value of the assets is remeasured, with any resultant gain or loss recognized directly in equity, except for impairment losses (see note 1(i)(i)) and foreign exchange gains and losses, which are recognized directly in profit or loss. Where these investments are interest-bearing, interest calculated using the effective interest method is recognized in profit or loss. When these investments are derecognized, the cumulative gain or loss previously recognized directly in equity is recognized in profit or loss. |
|
| | Investments are recognized on the date the Group commits to purchase the investments. Investments are derecognized when: |
The Group’s accounting policy for investments securities is as follows:
Financial assets at fair value through profit or loss comprise of financial assets held for trading and those designated as at fair value through profit or loss at inception. They are initially stated at fair value and are classified as current assets, if they are expected to be realized within 12 months. At each balance sheet date the fair value is remeasured, with any resultant gain or loss being recognized in the consolidated statement of operations. The net gain or loss recognized in the consolidated statement of operations does not include any interest earned on these investments as these are recognized in accordance with the policies set out in notes 2(t)(v).
Held-to-maturity securities are dated debt securities that the Group has the positive ability and intention to hold to maturity. They are initially recognized in the balance sheet at fair value plus transaction costs. Subsequently, they are stated in the balance sheet at amortized cost less impairment losses (see note 2(i)(i)).
Investment securities that are not classified as held for trading, financial assets at fair value through profit or loss, or held-to-maturity securities, are classified as available-for-sale securities. Available-for sale securities are initially recognized at fair value plus transaction costs. At each balance sheet date the fair value is remeasured, with any resultant gain or loss being recognized directly in equity, except for impairment losses (see note 2(i)(i)) and, in the case of monetary items such as debt securities, foreign exchange gains and losses that are recognized directly in the consolidated statement of operations. Where these investments are interest-bearing, interest calculated using the effective interest method is recognized in the consolidated statement of operations. When these investments are derecognized, the cumulative gain or loss previously recognized directly in equity is recognized in the consolidated statement of operations.
Investments are recognized on the date the Group commits to purchase the investments. Investments are derecognized when:
| | (i) | | the contractual rights to the cash flows from the investment securities expire; or |
|
| | (ii) | | the Group transfers the contractual rights to receive the cash flows of the investment securities. |
| (k) | | Derivative financial instruments |
Derivative financial instruments are recognized initially at fair value. At each balance sheet date the fair value is remeasured. The gain or loss on remeasurement to fair value is charged immediately to the consolidated statement of operations, except where the derivative qualify for cash flow hedge accounting or hedge the net investment in a foreign operation, in which case recognition of any resultant gain or loss depends on the nature of the item being hedged.
City Telecom (H.K.) Limited
Consolidated financial statements for the year ended August 31, 2007
|
| | Derivative financial instruments that are not designated or do not qualify as hedges are recognized initially at fair value. At each balance sheet date the fair value of the derivative financial instruments is remeasured. The gain or loss on remeasurement to fair value is charged immediately to profit or loss. |
|
| (l) | | Deferred expenditure |
Deferred expenditure represents customer acquisition costs incurred for successful acquisition or origination of a service subscription agreement with a customer. Such costs are deferred and amortized on a straight-line basis over the period of the underlying service subscription agreement.
City Telecom (H.K.) Limited
Consolidated financial statements for the year ended August 31, 2007
2 |
| Basis | Deferred expenditure represents customer acquisition costs incurred for successful acquisition or origination of preparationa service subscription agreement with a customer. Such costs are deferred and principal accounting policies (continued)amortized on a straight-line basis over the period of the underlying service subscription agreements. |
|
| (m) | | Accounts receivablesreceivable |
Trade and other receivables are initially recognized at fair value and thereafter stated at amortized cost less impairment losses for doubtful debts (see note 2(i)(i)), except where the receivables are interest-free loans made to related parties without any fixed repayment terms or the effect of discounting would be immaterial. In such cases, the receivables are stated at cost less impairment losses for bad and doubtful debts.
|
| | Accounts receivable and other receivables are initially recognized at fair value and thereafter stated at amortized cost less allowance for impairment of doubtful debts (see note 1(i)(i)), except where the receivables are interest-free loans made to related parties without any fixed repayment terms or the effect of discounting would be immaterial. In such cases, the receivables are stated at cost less impairment of doubtful debts (see note 1(i)(i)). |
|
| (n) | Inventories |
Inventories are carried at the lower of cost or net realizable value.
Cost is determined using the first in, first out method and comprises all costs of purchase.
Net realizable value is the estimated selling price in the ordinary course of business less the estimated costs of completion and the estimated costs necessary to make the sale.
When inventories are sold, the carrying amount of the inventory is recognized as an expense in the period in which the related revenue is recognized. The amount of any write-down of inventories to net realizable value is recognized as an expense in the period the write-down occurs. The amount of any reversal of any write-down of inventories, arising from an increase in net realizable value, is recognized as a reduction in the amount of inventories recognized as an expense in the period in which the reversal occurs.
For the years ended August 31, 2005, 2006 and 2007, there was no write-down of inventories.
(o) | Cash, bank balances and pledged bank deposits |
Cash and bank balances consist of cash on hand, cash in bank accounts and interest-bearing savings accounts. Cash that is restricted for use or pledged as security is disclosed separately on the face of the consolidated balance sheet, and is not included in the cash and bank balances total in the consolidated statements of cash flows. The pledged bank deposits represent cash maintained at a bank as security for bank facility and bank guarantees issued by the bank to third party suppliers and utility vendors (see note 15).
City Telecom (H.K.) Limited
Consolidated financial statements for the year ended August 31, 2007
2 |
| Basis | Cash and bank balances consist of preparationcash on hand, cash in bank accounts and principal accounting policies (continued)interest-bearing savings accounts. Cash that is restricted for use or pledged as security is disclosed separately on the face of the balance sheet, and is not included in the cash and bank balances total in the consolidated statements of cash flows. The pledged bank deposits represent cash maintained at a bank as security for bank facility and bank guarantees issued by the bank to third party suppliers and utility vendors (see note 27). |
|
(p)(o) | | ProvisionsFinancial guarantees issued, provisions and contingent liabilities |
|
| (i) | | Financial guarantees issued |
|
| | Financial guarantees are contracts that require the issuer (i.e. the guarantor) to make specified payments to reimburse the beneficiary of the guarantee (the “holder”) for a loss the holder incurs because a specified debtor fails to make payment when due in accordance with the terms of a debt instrument. |
|
| | Where the Group issues a financial guarantee, the fair value of the guarantee (being the transaction price, unless the fair value can otherwise be reliably estimated) is initially recognized as deferred income within trade and other payables. Where consideration is received or receivable for the issuance of the guarantee, the consideration is recognized in accordance with the Group’s policies applicable to that category of asset. Where no such consideration is received or receivable, an immediate expense is recognized in profit or loss on initial recognition of any deferred income. |
Provisions are recognized for other liabilities of uncertain timing or amount when the Group has a legal or constructive obligation arising as a result of a past event, it is probable that an outflow of economic benefits will be required to settle the obligation and a reliable estimate can be made. Where the time value of money is material, provisions are stated at the present value of the expenditure expected to settle the obligation.F-10
Where it is not probable that an outflow of economic benefits will be required, or the amount cannot be estimated reliably, the obligation is disclosed as a contingent liability, unless the probability of outflow of economic benefits is remote. Possible obligations, whose existence will only be confirmed by the occurrence or non-occurrence of one or more future events are also disclosed as contingent liabilities unless the probability of outflow of economic benefits is remote.
City Telecom (H.K.) Limited
Consolidated financial statements for the year ended August 31, 2007
21 | Basis of preparation and principal | Significant accounting policies (continued) |
|
(q)(o) | | Financial guarantees issued, provisions and contingent liabilities (continued) |
|
| (i) | | Financial guarantees issued (continued) |
|
| | The amount of the guarantee initially recognized as deferred income is amortized in profit or loss over the term of the guarantee as income from financial guarantees issued. In addition, provisions are recognized in accordance with note 1(o)(ii) if and when (i) it becomes probable that the holder of the guarantee will call upon the Group under the guarantee, and (ii) the amount of that claim on the Group is expected to exceed the amount currently carried in trade and other payables in respect of that guarantee i.e. the amount initially recognized, less accumulated amortization. |
|
| (ii) | | Other provisions and contingent liabilities |
|
| | Provisions are recognized for other liabilities of uncertain timing or amount when the Group has a legal or constructive obligation arising as a result of a past event, it is probable that an outflow of economic benefits will be required to settle the obligation and a reliable estimate can be made. Where the time value of money is material, provisions are stated at the present value of the expenditure expected to settle the obligation. |
|
| | Where it is not probable that an outflow of economic benefits will be required, or the amount cannot be estimated reliably, the obligation is disclosed as a contingent liability, unless the probability of outflow of economic benefits is remote. Possible obligations, whose existence will only be confirmed by the occurrence or non-occurrence of one or more future events are also disclosed as contingent liabilities unless the probability of outflow of economic benefits is remote. |
|
| (p) | | Employee benefits |
|
| (i) | | Employee leave entitlements |
Employee entitlements to annual leave and long service leave are recognized when they accrue to employees. A provision is made for the estimated liability for annual leave and long-service leave as services are rendered by employees. Employee entitlements to sick leave and maternity or paternity leave are not recognized until the time of leave.
|
| | Employee entitlements to annual leave and long service leave are recognized when they accrue to employees. A provision is made for the estimated liability for annual leave and long-service leave as a result of services rendered by employees up to the balance sheet date. |
|
| | Employee entitlements to sick leave and maternity or paternity leave are not recognized until the time of leave. |
|
| (ii) | | Profit sharing and bonus plans |
Provisions for profit sharing and bonus plans are recognized when the Group has a present legal or constructive obligation as a result of services rendered by employees and a reliable estimate of the obligation can be made.
|
| | Provisions for profit sharing and bonus plans are recognized when the Group has a present legal or constructive obligation as a result of services rendered by employees and a reliable estimate of the obligation can be made. |
|
| (iii) | | Retirement benefit costs |
The Group contributes to defined contribution retirement schemes which are available to certain employees. Contributions to the schemes by the Group are calculated as a percentage of employees’ basic salaries and charged to the consolidated statement of operations. The Group’s contributions are reduced by contributions forfeited by those employees who leave the scheme prior to being fully vested in the Group’s contributions.
The assets of the scheme are held in an independently administered fund that is separated from the Group’s assets.
|
| | The Group contributes to defined contribution retirement schemes which are available to certain employees. Contributions to the schemes by the Group are calculated as a percentage of employees’ basic salaries and charged to profit or loss. The Group’s contributions are reduced by contributions forfeited by those employees who leave the scheme prior to vesting fully in the contributions. |
|
| | The assets of the scheme are held in an independently administered fund that is separated from the Group’s assets. |
|
| (iv) | | Share-based payments |
|
| | The fair value of share options granted to employees is recognized as an employee cost with a corresponding increase in a capital reserve within equity. The fair value is measured at grant date using the Black-Scholes option pricing model or Monte Carlo model, taking into account the terms and conditions upon which the options were granted. Where the employees have to meet vesting conditions before becoming unconditionally entitled to the share options, the total estimated fair value of the share options is spread over the vesting period, taking into account the probability that the options will vest. |
|
| | During the vesting period, the number of share options that is expected to vest is reviewed. Any adjustment to the cumulative fair value recognized in prior years is charged/credited to profit or loss, unless the original employee expenses qualify for recognition as an asset, with a corresponding adjustment to the capital reserve. On vesting date, the amount recognized as an expense is adjusted to reflect the actual number of share options that vest (with a corresponding adjustment to the capital reserve) except where forfeiture is only due to not achieving vesting conditions that relate to the market price of the Company’s shares. The amount related to share options expense is recorded in the capital reserve until either the option is exercised or the option expires. |
F-11
During the vesting period, the number of share options that is expected to vest is reviewed. Any adjustment to the cumulative fair value recognized in prior years is charged/credited to the consolidated statement of operations in the year of the review, unless the original employee cost qualified for recognition as an asset, with a corresponding adjustment to the capital reserve. On vesting date, the amount recognized as an expense is adjusted to reflect the actual number of share options that vest (with a corresponding adjustment to the capital reserve) except where forfeiture is only due to not achieving vesting conditions that relate to the market price of the Company’s shares. The amount relating to share options expense is recorded in the capital reserve until either the option is exercised or the option expires.
City Telecom (H.K.) Limited
Consolidated financial statements for the year ended August 31, 2007
21 | Basis of preparation and principal | Significant accounting policies (continued) |
Deferred tax assets and liabilities arise from deductible and taxable temporary differences respectively, being the differences between the carrying amounts of assets and liabilities for financial reporting purposes and their tax bases. Deferred tax assets also arise from unused tax losses and unused tax credits.
Deferred tax assets are recognized to the extent that it is probable that future taxable profit will be available against which the temporary differences can be utilized.
Deferred taxation is provided on temporary differences arising on investments in subsidiaries except where the timing of the reversal of the temporary difference can be controlled and it is probable that the temporary difference will not be reversed in the foreseeable future.
|
| | Deferred taxation is provided in full, using the liability method, on temporary differences arising between the tax bases of assets and liabilities and their carrying amounts in the financial statements. Taxation rates enacted or substantively enacted at the balance sheet date are used to measure deferred tax assets and liabilities. |
|
| | Deferred tax assets are recognized to the extent that it is probable that future taxable profit will be available against which the temporary differences can be utilized. |
|
| | Deferred taxation is provided on temporary differences arising on investments in subsidiaries except where the timing of the reversal of the temporary difference can be controlled and it is probable that the temporary difference will not be reversed in the foreseeable future. |
|
(s)(r) | | Senior notes |
Senior notes are recognized initially at fair value less direct and incremental issuance costs. Subsequent to initial recognition, the senior notes are stated at amortized cost. The difference between the original issuance price and redemption price of the notes is recognized in the consolidated statement of operations over the period of the notes using the effective interest method.
In the event that the senior notes are redeemed prior to the maturity date, the unamortized notes issuance costs are charged immediately to the consolidated statement of operations.
|
| | Long-term debt, representing senior notes, is recognized initially at fair value less incidental costs of issuance. Subsequent to initial recognition, the senior notes are stated at amortized cost with the difference between amortized cost and redemption value recognized in profit or loss over the period of borrowings using the effective interest method. |
|
| (s) | | Trade and other payables |
|
| | Trade and other payables are initially recognized at fair value. Except for financial guarantee liabilities measured in accordance with note 1(o), trade and other payables are subsequently stated at amortized cost unless the effect of discounting would be immaterial, in which case they are stated at cost. |
|
| (t) | | Revenue recognition |
|
| (i) | | Revenue for the provision of international telecommunications and fixed telecommunications network services is recognized, when an arrangement exists, service is rendered, the fee is fixed or determinable, and collectibility is probable. |
|
| (ii) | | Tariff-free period granted to subscribers of fixed telecommunications network services are recognized in the consolidated statement of operationsprofit or loss rateably over the term of the service subscription agreement. Unbilled revenue represents revenue recognized in accordance with the requirementsrequirement in 2(t)note 1(t)(i) that has not been billed to the subscriber. |
|
| (iii) | | Amount received in advance for the provision of fixed telecommunications network services is deferred and included under deferred services income,service revenue, and subsequently recognized as revenue on a straight-line basis over the agreed period of time stipulated in the terms of the subscription agreement.related service period. |
|
| (iv) | Revenue from the sales of products is recognized upon the transfer of risks and rewards of ownership to the customer, which generally coincides with the time when the goods are delivered to the customer and title has passed. |
City Telecom (H.K.) Limited
Consolidated financial statements for the year ended August 31, 2007
2 | Basis of preparation and principal accounting policies (continued) |
(t) | Revenue recognition (continued) |
(v) | Interest income is recognized as it accrues using the effective interest method. |
(vi) |
| (v) | | Rental income receivable under operating leases is recognized in the consolidated statement of operationsprofit or loss in equal instalmentsinstallments over the periods covered by the lease term. Lease incentives granted are recognized in the consolidated statement of operationsprofit or loss as an integral part of the aggregate net lease payments receivable. |
Borrowing costs are expensed in the consolidated statement of operations in the period which they are incurred, except to the extent that they are capitalized as being directly attributable to the acquisition, construction or production of an asset.
The capitalization of borrowing costs as part of the cost of a qualifying asset commences when expenditure for the asset is being incurred, borrowing costs are being incurred and activities that are necessary to prepare the asset for its intended use or sale are in progress. Capitalization of borrowing costs is suspended or ceases when substantially all the activities necessary to prepare the qualifying asset for its intended use or sale are interrupted or complete.
Borrowing costs of $2,047,000, nil and nil was capitalized for the years ended August 31, 2005, 2006 and 2007, respectively.
|
| | Borrowing costs that are directly attributable to the acquisition, construction or production of an asset that necessarily takes a substantial period of time to get ready for its intended use or sale are capitalized as part of the cost of that asset. |
|
| | All other borrowing costs are charged to profit or loss in the year in which they are incurred. |
|
| (v) | | Segment reporting |
|
| | In accordance with the Group’s internal financial reporting, the Group has determined that the primary reporting format is business segment and secondary reporting format is geographical segment. |
|
| | Segment assets consist primarily of goodwill, fixed assets, receivables and cash. Segment liabilities comprise operating liabilities and exclude items such as taxation and certain corporate borrowings. Capital expenditure comprises additions to fixed assets. |
|
| | In respect of geographical segment reporting, sales are reported based on the country in which the customer is located. Total assets and capital expenditure are reported based on where the assets are located. |
In accordance with the Group’s internal financial reporting, the Group has determined that business segment is the primary reporting format and geographical is the secondary reporting format.F-12
Segment assets consist primarily of goodwill, fixed assets, trade and other receivables and cash and bank deposits. Segment liabilities comprise operating liabilities and exclude items such as taxation and senior notes. Capital expenditure comprises purchases of fixed assets.
In respect of geographical segment reporting, sales are reported based on the country in which the customer is located. Total assets and capital expenditure are reported based on where the assets are located.
City Telecom (H.K.) Limited
Consolidated financial statements for the year ended August 31, 2007
21 | Basis of preparation and principal | Significant accounting policies (continued) |
|
| (w) | | Accounting for barter transactions |
When goods or services are exchanged for goods or services which are of a similar nature and value, the exchange is not regarded as a revenue generating transaction.
When goods are sold or services are rendered in exchange for dissimilar goods or services, the exchange is regarded as a transaction which generates revenue. The revenue is measured at the fair value of the consideration received or receivable adjusted by the amount of any cash or cash equivalents transferred. When the fair value of the goods or services received cannot be measured reliably, the revenue is measured at the fair value of the goods or services provided, adjusted by the amount of any cash or cash equivalents transferred.
|
| | When goods or services are exchanged for goods or services which are of a similar nature and value, the exchange is not regarded as a revenue generating transaction. |
|
| | When goods are sold or services are rendered in exchange for dissimilar goods or services, the exchange is regarded as a transaction which generates revenue. The revenue is measured at the fair value of the goods or services received, adjusted by the amount of any cash or cash equivalents transferred. When the fair value of the goods or services received cannot be measured reliably, the revenue is measured at the fair value of the goods or services rendered, adjusted by the amount of any cash or cash equivalents transferred. |
|
| (x) | | Related parties |
|
| | For the purposes of these financial statements, a party is considered to be related to the Group if: |
For the purposes of these financial statements, a party is considered to be related to the Group if:
| | (i) | | the party has the ability, directly or indirectly through one or more intermediaries, to control the Group or exercise significant influence over the Group in making financial and operating policy decisions, or has joint control over the Group; |
|
| | (ii) | | the Group and the party are subject to common control; |
|
| | (iii) | | the party is an associate of the Group or a joint venture in which the Group is a venturer; |
|
| | (iv) | | the party is a member of key management personnel of the Group or the Group’s parent, or a close family member of such an individual, or is an entity under the control, joint control or significant influence of such individuals; |
|
| | (v) | | the party is a close family member of a party referred to in (i) or is an entity under the control, joint control or significant influence of such individuals; or |
|
| | (vi) | | the party is a post-employment benefit plan which is for the benefit of employees of the Group or of any entity that is a related party of the Group. |
Close family members of an individual are those family members who may be expected to influence, or be influenced by, that individual in their dealings with the entity.
City Telecom (H.K.) Limited
Consolidated financial statements for the year ended August 31, 2007
Network costs mainly include interconnection charges paid to local and overseas carriers, leased line rentals, program fees, production costs for the pay-TV using Internet Protocol service and costs of inventories sold, and exclude depreciation charge which is included in general and administration expenses.
Hong Kong Broadband Network Limited (“HKBN”), a wholly-owned subsidiary of the Group, as a Fixed Telecommunications Network Services (“FTNS”) licensee, is obligated to contribute Universal Services Contributions (“USC”) as compensation to PCCW-HKT Telephone Limited (“PCCW-HKT”) for the cost of network development in remote areas in Hong Kong.
The Group estimates the USC payable to PCCW-HKT based on the provisional rates announced by the TA. The TA periodically reviews the actual costs incurred by PCCW-HKT in the network development and revises the amounts owed to, or be refunded by, PCCW-HKT to the respective USC contributing parties, including the HKBN (“the Rate Revisions”). Accordingly, the estimate made by the HKBN’s management is subject to change based on the Rate Revisions identified during a financial year and up to the date prior to the release of the financial statements of the Group. The Group adjusts such differences as an addition or reduction of the corresponding costs of services in that particular reporting period.
Any sum received in advance from PCCW-HKT as an estimated refund of the USC on a provisional basis, which is subject to the final confirmation and determination of TA, is recorded in other payables and accrued expenses in the Group’s consolidated balance sheet.
On November 11, 2005, the TA issued a statement on the USC and confirmed the actual contribution level for calendar year 2003. In aggregate, an amount of $6,448,000 was recorded as a reduction against the network cost of the Group for the year ended August 31, 2005.
On November 13, 2006, TA issued a statement (the “2006 TA”) on the USC and confirmed the actual contribution level for calendar year 2004. In aggregate, an amount of $1,365,088 was recorded as a reduction against the network costs of the Group for the year ended August 31, 2006.
The actual contribution level for calendar year 2005, 2006 and 2007 had not yet been confirmed by the TA as of the date of issuance of the Group’s financial statements for the year ended August 31, 2007 for Hong Kong statutory purposes. For the year ended August 31, 2007, the Group recorded USC charges based on the provisional rates set out in the 2006 TA.
See note 30 for discussion of Rate Revisions issued by TA subsequent to the date of issuance of the Group’s financial statements for the year ended August 31, 2007 for Hong Kong statutory purposes.
City Telecom (H.K.) Limited
Consolidated financial statements for the year ended August 31, 2007
4 | (Loss)/income before taxation |
| | | | | | | | |
| | | Year ended August 31, | |
| | | 2005 | | | 2006 | | 2007 | |
| | | HK$’000 | | | HK$’000 | | HK$’000 | |
(Loss)/income before taxation isarrived at after charging: | | | | | | | | |
| | | |
Goodwill amortization | | 1,065 | | | — | | — | |
Amortization of deferred expenditure | | 12,927 | | | 13,973 | | 15,580 | |
Depreciation of purchased fixed assets | | 236,269 | | | 275,538 | | 257,052 | |
Depreciation of fixed assets held under finance leases | | 380 | | | 926 | | 1,051 | |
Impairment loss - investment property | | — | | | 1,131 | | — | |
Operating lease charges in respect of: | | | | | | | | |
- Land and buildings | | 13,081 | | | 17,556 | | 13,879 | |
- Computer equipment | | 914 | | | 840 | | 32 | |
Research and development costs | | 11,023 | | | 9,605 | | 4,977 | |
Retirement benefit costs - defined contribution plans (note 23) | | 27,437 | | | 27,956 | | 23,933 | |
Interest expense comprises: | | | | | | | | |
| | | |
Interest element of finance leases | | 23 | | | 54 | | 62 | |
Interest on senior notes | | 52,372 | | | 85,235 | | 85,313 | |
Interest on bank overdrafts | | 2,421 | | | — | | — | |
Amortization of debt issuance cost | | 1,693 | | | 1,429 | | 2,129 | |
Other borrowing costs | | — | | | 1,919 | | — | |
| | | | | | | | |
| | 56,509 | | | 88,637 | | 87,504 | |
Less: Amount capitalized as fixed assets - Interest capitalized | | (2,047 | ) | | — | | — | |
| | | | | | | | |
Total interest expense | | 54,462 | | | 88,637 | | 87,504 | |
| | | | | | | | |
Other income net, comprises: | | | | | | | | |
| | | |
Net exchange gain/(loss) | | 3,300 | | | 1,044 | | (114 | ) |
Others | | 2,737 | | | 3,421 | | 3,263 | |
| | | | | | | | |
| | 6,037 | | | 4,465 | | 3,149 | |
| | | | | | | | |
City Telecom (H.K.) Limited
Consolidated financial statements for the year ended August 31, 2007
5 | Income tax credit/(expense) |
(Loss)/income before taxation by geographical location is as follows:
| | | | | | | | |
| | | Year ended August 31, |
| | | 2005 | | | 2006 | | | 2007 |
| | | HK$’000 | | | HK$’000 | | | HK$’000 |
Hong Kong (loss)/income | | (167,416 | ) | | (150,624 | ) | | 24,574 |
Overseas (loss)/income | | (2,805 | ) | | 1,318 | | | 6,317 |
| �� | | | | | | | |
(Loss)/income before taxation | | (170,221 | ) | | (149,306 | ) | | 30,891 |
| | | | | | | | |
Income tax credit/(expense) consist of the following:
| | | | | | | | | |
| | | Year ended August 31, | |
| | | 2005 | | | 2006 | | | 2007 | |
| | | HK$’000 | | | HK$’000 | | | HK$’000 | |
Hong Kong income tax | | | | | | | | | |
- current (note (a)) | | (147 | ) | | (24 | ) | | (121 | ) |
- under-provision of current tax in prior years | | (333 | ) | | (552 | ) | | — | |
- deferred (note 11) | | 8,325 | | | 10,046 | | | 47 | |
Overseas taxation | | | | | | | | | |
- current (note (b)) | | (919 | ) | | (2,367 | ) | | (1,964 | ) |
- deferred (note 11) | | (201 | ) | | 141 | | | 12 | |
| | | | | | | | | |
| | 6,725 | | | 7,244 | | | (2,026 | ) |
| | | | | | | | | |
Notes:
| | (a) | The Company and its subsidiaries operatingClose family members of an individual are those family members who may be expected to influence, or be influenced by, that individual in Hong Kong are subject to tax on an entity basis on income arising in or derived from Hong Kong. The rate of taxation of subsidiaries operating in Hong Kong fortheir dealings with the years ended August 31, 2005, 2006 and 2007 was 17.5%.entity. |
| | (b) | Taxation on overseas profits has been calculated on the estimated assessable profit for the year at the rate of taxation prevailing in the countries in which the foreign subsidiaries operate. |
City Telecom (H.K.) Limited
Consolidated financial statements for the year ended August 31, 2007
52 | Income tax credit/(expense) (continued) |
The income tax credit/ (expense) for the years ended August 31, 2005, 2006 and 2007 differs from the amounts determined by applying the applicable statutory rate in Hong Kong of 17.5% to income/ (loss) before taxation as a result of the following differences:
| | | | | | | | | |
| | | Year ended August 31, | |
| | | 2005 | | | 2006 | | | 2007 | |
| | | HK$’000 | | | HK$’000 | | | HK$’000 | |
Computed “expected” income tax credit/(expense) | | 29,789 | | | 26,129 | | | (5,406 | ) |
Difference in statutory tax rates of foreign subsidiaries | | (137 | ) | | (459 | ) | | (1,006 | ) |
Effect of expenses not deductible for income taxes | | (1,788 | ) | | (883 | ) | | (772 | ) |
Effect of bank interest income not subject to income taxes | | 2,262 | | | 2,944 | | | 3,533 | |
Effect of other income not subject to income taxes | | 1,701 | | | 548 | | | 686 | |
Under-provision for Hong Kong current income tax in prior years | | (333 | ) | | (552 | ) | | — | |
Effect of prior year tax losses utilized | | 4,981 | | | 2,416 | | | 6,678 | |
Effect of tax loss not recognized | | (28,464 | ) | | (20,597 | ) | | (4,539 | ) |
Effect of share based payment not recognized | | (1,219 | ) | | (2,305 | ) | | (1,125 | ) |
Others | | (67 | ) | | 3 | | | (75 | ) |
| | | | | | | | | |
Income tax credit/(expense) | | 6,725 | | | 7,244 | | | (2,026 | ) |
| | | | | | | | | |
City Telecom (H.K.) Limited
Consolidated financial statements for the year ended August 31, 2007
6 | (Loss)/earnings per share |
| | | | | | |
| | | Year ended August 31, |
| | | 2005 | | 2006 | | 2007 |
| | | HK$’000 | | HK$’000 | | HK$’000 |
Net (loss)/income | | (163,496) | | (142,062) | | 28,865 |
| | | | | | |
| |
| | | Number of shares in thousands |
Weighted average number of shares in issue | | 613,525 | | 614,134 | | 614,840 |
Incremental shares from assumed exercise of share options | | — | | — | | 16,479 |
| | | | | | |
Diluted weighted average number of shares | | 613,525 | | 614,134 | | 631,319 |
| | | | | | |
Basic (loss)/earnings per share | | HK(26.6) cents | | HK(23.1) cents | | HK4.7 cents |
| | | | | | |
Diluted (loss)/earnings per share | | HK(26.6) cents | | HK(23.1) cents | | HK4.6 cents |
| | | | | | |
Basic earnings/(loss) per share is calculated based on the weighted average number of issued ordinary shares and the related income/(loss) amount. Diluted earning/(loss) per share is calculated based on the weighted average number of issued ordinary shares and the number of incremental shares from assumed exercise of share options and warrants has been determined using the treasury stock method and the related income/(loss) amount.
For the years ended August 31, 2005 and 2006, the number of shares used in the calculation of diluted loss per share was equal to the number of shares used to calculate basic loss per share as the incremental effect of share options and warrants was anti-dilutive in a loss-making year.
City Telecom (H.K.) Limited
Consolidated financial statements for the year ended August 31, 2007
(a) | Trade receivables, net |
| | | | | | |
| | | August 31, | |
| | | 2006 | | | 2007 | |
| | | HK$’000 | | | HK$’000 | |
Trade receivables (note (i)) | | 196,343 | | | 192,943 | |
Less: Provision for doubtful accounts (note (ii)) | | (55,745 | ) | | (22,392 | ) |
| | | | | | |
| | 140,598 | | | 170,551 | |
| | | | | | |
Notes:
| | (i) | Trade receivables include receivable relating to mobile interconnection charges of $103,847,000 for the year ended August 31, 2007 (2006: $82,864,000). See note 25(c) for detailed discussion of mobile interconnection charges.Revenue and segment information |
| | (ii) | Provision for doubtful accounts as at August 31, 2006 includes provision for mobile interconnection charges receivables of $20,809,000. Following TA’s Final Determination issued in June 2007 (note 25(c)), the Group has reversed $9,404,000 of the provision for mobile interconnection charges to the consolidated statement of operations (note 25(c)) and has written off the remaining balance of the provision of $11,405,000 against the related accounts receivable. |
Changes in the provision for doubtful accounts consist of:
| | | | | | | | | |
| | | Year ended August 31, | |
| | | 2005 | | | 2006 | | | 2007 | |
| | | HK$’000 | | | HK$’000 | | | HK$’000 | |
Balance at beginning of the year | | 22,959 | | | 48,316 | | | 55,745 | |
Additions charged to expense | | 35,445 | | | 17,450 | | | 15,973 | |
Reversals | | — | | | — | | | (9,404 | ) |
Write-off | | (10,088 | ) | | (10,021 | ) | | (39,922 | ) |
| | | | | | | | | |
Balance at the end of the year | | 48,316 | | | 55,745 | | | 22,392 | |
| | | | | | | | | |
City Telecom (H.K.) Limited
Consolidated financial statements for the year ended August 31, 2007
(b) | Other receivables, deposits and prepayments |
| | | | |
| | | August 31, |
| | | 2006 | | 2007 |
| | | HK$’000 | | HK$’000 |
Deposits for purchase of fixed assets | | 8,636 | | 6,007 |
Deposits for lease of land and building | | 9,237 | | 7,256 |
Interest receivable | | 1,503 | | 1,344 |
Prepayments | | 17,207 | | 19,895 |
USC refund receivable | | 1,364 | | — |
Unbilled revenue | | 35,700 | | 15,572 |
Others | | 3,936 | | 9,298 |
| | | | |
| | 77,583 | | 59,372 |
| | | | |
City Telecom (H.K.) Limited
Consolidated financial statements for the year ended August 31, 2007
| | | | | |
| | | August 31, |
| | | 2006 | | | 2007 |
| | | HK$’000 | | | HK$’000 |
Cost: | | | | | |
| | |
Beginning of the year | | 5,326 | | | 1,066 |
Opening balance adjustment to eliminate accumulated amortization | | (4,260 | ) | | — |
| | | | | |
At the end of the year | | 1,066 | | | 1,066 |
| | | | | |
Accumulated amortization: | | | | | |
| | |
Beginning of the year | | 4,260 | | | — |
Eliminated against cost at the beginning of the year | | (4,260 | ) | | — |
| | | | | |
At the end of the year | | — | | | — |
| | | | | |
Net book value: | | | | | |
| | |
At the end of the year | | 1,066 | | | 1,066 |
| | | | | |
With effect from September 1, 2005, goodwill is no longer amortized in accordance with HKFRS 3 but tested for impairment on an annual basis. The amount of accumulated amortization as at September 1, 2005 has been offset against the cost of goodwill.
Goodwill has been allocated to the Group’s fixed telecommunications network services cash-generating unit (“CGU”) for purposes of the goodwill impairment test.
Based on management’s goodwill impairment test, the carrying amount of the fixed telecommunications network services CGU was lower than its recoverable amount. The recoverable amount was determined based on the value-in-use methodology. This methodology uses cash flow projections based on financial budgets approved by management covering a three-year period. Cash flows for the three-year period were estimated based on growth rates between 10% to 16% and a pre-tax discount rate of 14%. Cash flows beyond the three year period were assumed to remain constant. The estimated growth rates used were comparable to the growth rate for the industry. The key assumption used in the value-in-use methodology was the annual growth of the revenue of the fixed telecommunications network services CGU which is determined based on the past performance and management’s expectation for future performance. In assessing value in use, the estimated future cash flows are discounted to their present value using a pre-tax discount rate that reflects the current market assessment of the time value of money and the risks specific to the fixed telecommunications services CGU. Any adverse change in the key assumption could reduce the recoverable amount below carrying amount.
City Telecom (H.K.) Limited
Consolidated financial statements for the year ended August 31, 2007
| | | | | | | | | | | | | | | | | | | | |
| | | Investment
property | | Leasehold
land and
buildings | | | Leasehold
improvements | | | Furniture,
fixtures
and
fittings | | | Tele-
communications,
computer and
office equipment | | | Motor
vehicles | | | Total | |
| | | HK$’000 | | HK$’000 | | | HK$’000 | | | HK$’000 | | | HK$’000 | | | HK$’000 | | | HK$’000 | |
| | | (Note (a)) | | (Note (a)) | | | | | | | | | | | | | | | | |
Cost: | | | | | | | | | | | | | | | | | | | | |
| | | | | | | |
At September 1, 2005 | | — | | 84,170 | | | 68,618 | | | 15,492 | | | 2,067,146 | | | 8,372 | | | 2,243,798 | |
Exchange adjustments | | — | | — | | | 281 | | | 126 | | | 2,180 | | | — | | | 2,587 | |
Additions | | — | | 625 | | | 9,342 | | | 2,880 | | | 309,744 | | | 344 | | | 322,935 | |
Disposals | | — | | — | | | — | | | (728 | ) | | (26,817 | ) | | (1,760 | ) | | (29,305 | ) |
Transfer to investment property | | 5,197 | | (5,197 | ) | | — | | | — | | | — | | | — | | | — | |
| | | | | | | | | | | | | | | | | | | | |
At August 31, 2006 | | 5,197 | | 79,598 | | | 78,241 | | | 17,770 | | | 2,352,253 | | | 6,956 | | | 2,540,015 | |
| | | | | | | | | | | | | | | | | | | | |
At September 1, 2006 | | 5,197 | | 79,598 | | | 78,241 | | | 17,770 | | | 2,352,253 | | | 6,956 | | | 2,540,015 | |
Exchange adjustments | | — | | — | | | 773 | | | 253 | | | 2,560 | | | — | | | 3,586 | |
Additions | | — | | — | | | 1,627 | | | 496 | | | 129,950 | | | 177 | | | 132,250 | |
Disposals | | — | | — | | | (3 | ) | | (1,100 | ) | | (8,988 | ) | | (315 | ) | | (10,406 | ) |
| | | | | | | | | | | | | | | | | | | | |
At August 31, 2007 | | 5,197 | | 79,598 | | | 80,638 | | | 17,419 | | | 2,475,775 | | | 6,818 | | | 2,665,445 | |
| | | | | | | | | | | | | | | | | | | | |
Accumulated depreciation: | | | | | | | | | | | | | | | | | | | | |
| | | | | | | |
At September 1, 2005 | | — | | 6,702 | | | 30,225 | | | 10,509 | | | 853,325 | | | 6,494 | | | 907,255 | |
Exchange adjustments | | — | | — | | | 223 | | | 74 | | | 1,642 | | | — | | | 1,939 | |
Charge for the year | | — | | 1,695 | | | 9,980 | | | 2,190 | | | 261,819 | | | 780 | | | 276,464 | |
Disposals | | — | | — | | | — | | | (326 | ) | | (11,922 | ) | | (1,760 | ) | | (14,008 | ) |
Transfer to investment property | | 866 | | (866 | ) | | — | | | — | | | — | | | — | | | — | |
Impairment loss (note (a)) | | 1,131 | | — | | | — | | | — | | | — | | | — | | | 1,131 | |
| | | | | | | | | | | | | | | | | | | | |
At August 31, 2006 | | 1,997 | | 7,531 | | | 40,428 | | | 12,447 | | | 1,104,864 | | | 5,514 | | | 1,172,781 | |
| | | | | | | | | | | | | | | | | | | | |
At September 1, 2006 | | 1,997 | | 7,531 | | | 40,428 | | | 12,447 | | | 1,104,864 | | | 5,514 | | | 1,172,781 | |
Exchange adjustments | | — | | — | | | 612 | | | 160 | | | 1,874 | | | — | | | 2,646 | |
Charge for the year | | 104 | | 1,592 | | | 9,269 | | | 2,028 | | | 244,581 | | | 529 | | | 258,103 | |
Disposals | | — | | — | | | — | | | (683 | ) | | (4,465 | ) | | (160 | ) | | (5,308 | ) |
| | | | | | | | | | | | | | | | | | | | |
At August 31, 2007 | | 2,101 | | 9,123 | | | 50,309 | | | 13,952 | | | 1,346,854 | | | 5,883 | | | 1,428,222 | |
| | | | | | | | | | | | | | | | | | | | |
Net book value: | | | | | | | | | | | | | | | | | | | | |
| | | | | | | |
At August 31, 2007 | | 3,096 | | 70,475 | | | 30,329 | | | 3,467 | | | 1,128,921 | | | 935 | | | 1,237,223 | |
| | | | | | | | | | | | | | | | | | | | |
At August 31, 2006 | | 3,200 | | 72,067 | | | 37,813 | | | 5,323 | | | 1,247,389 | | | 1,442 | | | 1,367,234 | |
| | | | | | | | | | | | | | | | | | | | |
City Telecom (H.K.) Limited
Consolidated financial statements for the year ended August 31, 2007
9 | Fixed assets (continued) |
Notes:
| (a) | The interests in leasehold land and buildings and investment property situated in Hong Kong at their net book values are analyzed as follows: |
| | | | |
| | | August 31, |
| | | 2006 | | 2007 |
| | | HK$’000 | | HK$’000 |
Leases of between 10 to 50 years | | 75,267 | | 73,571 |
| | | | |
Representing:
| | | | |
| | | August 31, |
| | | 2006 | | 2007 |
| | | HK$’000 | | HK$’000 |
Leasehold land and building carried at cost | | 72,067 | | 70,475 |
Investment property at cost less accumulated depreciation and impairment loss | | 3,200 | | 3,096 |
| | | | |
| | 75,267 | | 73,571 |
| | | | |
During the year ended August 31, 2006, a property which had been held for own use was leased to a third party to earn rental income. Upon adoption of HKAS 40, the Group assessed the open market value of the property and based on such assessment, wrote down the carrying amount of the property by $1,131,000 (included in “other operating expenses”). The estimate of open market value was made by reference to net rental income allowing for reversionary income potential.
The estimated fair value of the investment property held by the Group as of August 31, 2006 and 2007 amounted to HK$3,200,000 and HK$3,096,000, respectively.
| (b) | The Group’s future aggregate lease income receivable under non-cancellable operating lease of the investment property is as follows: |
| | | | |
| | | August 31, |
| | | 2006 | | 2007 |
| | | HK$’000 | | HK$’000 |
Within 1 year | | 228 | | 228 |
In the second year | | 228 | | — |
| | | | |
| | 456 | | 228 |
| | | | |
City Telecom (H.K.) Limited
Consolidated financial statements for the year ended August 31, 2007
9 | Fixed assets (continued) |
Notes: (continued)
| (c) | The Group leases telecommunications, computer and office equipment for terms ranging from one to five years. At the end of the lease term the Group has the option to purchase the equipment at a price deemed to be a bargain purchase option and accordingly the lease arrangements have been classified as finance leases. None of the leases included contingent rental. The total cost of these assets and the related accumulated depreciation are as follows: |
| | | | |
| | | August 31, |
| | | 2006 | | 2007 |
| | | HK$’000 | | HK$’000 |
Cost | | 4,079 | | 4,236 |
Accumulated depreciation | | 1,307 | | 2,238 |
| | | | |
| | 2,772 | | 1,998 |
| | | | |
| (d) | Management reviews the estimated useful lives of fixed assets annually and, if there has been a significant change in the expected pattern of consumption of the future economic benefits embodied in the asset, the estimate is changed to reflect the changed pattern. The depreciation expense for future period is adjusted if there are significant changes from previous estimates. Management determines the useful life of the Group’s fixed assets based on its historical experience with similar assets, expected usage of the assets and anticipated technological changes with respect to those assets. Estimates and assumptions used in setting depreciable lives require both judgement and estimation. |
During the second half of fiscal 2007, taking into consideration of the current conditions and expected usage of existing telecommunications equipment, management engaged an external valuation firm to assist with its assessment of the estimated useful lives of such asset. As a result of this assessment, management revised the estimated useful lives of the fibre network and related peripherals from 4-15 years to 6-20 years.
The change in the estimated useful lives is a change in accounting estimate that is accounted for prospectively from June 1, 2007. As a result of such change, depreciation expense decreased by HK$15,930,000, and both income before taxation and net income after taxation decreased by HK$15,930,000 for the year ended August 31, 2007. The increase in net income resulted in a HK2.6 cents increase in both the basic earnings per share and diluted earnings per share. Such change also increased each of total assets, retained profits and total shareholders’ equity at August 31, 2007 by HK$15,930,000.
City Telecom (H.K.) Limited
Consolidated financial statements for the year August 31, 2007
10 | Other payables and accrued charges |
| | | | |
| | | August 31, |
| | | 2006 | | 2007 |
| | | HK$’000 | | HK$’000 |
Accrual for staff salaries and bonus | | 27,747 | | 33,833 |
Accrual for customer reward program | | 2,636 | | 6,567 |
Accrual for carrier fees and charges | | 10,705 | | 11,264 |
Accrual for international call forwarding service charges | | 4,793 | | 5,784 |
Payable for purchase of fixed assets | | 51,862 | | 34,749 |
Payable for advertising and promotional expenses | | 11,966 | | 15,972 |
Interest payable on senior notes | | 7,109 | | 7,164 |
Others accrual (note) | | 26,668 | | 29,934 |
| | | | |
| | 143,486 | | 145,267 |
| | | | |
Note: Amount of other accruals consisted of primarily accruals for utilities, rent and other administrative charges.
The movement of deferred tax liabilities is as follows:
| | | | | | |
| | | August 31, | |
| | | 2006 | | | 2007 | |
| | | HK$’000 | | | HK$’000 | |
At the beginning of the year | | 10,539 | | | 353 | |
Exchange differences | | 1 | | | (3 | ) |
Deferred taxation credited to consolidated statement of operations | | (10,187 | ) | | (59 | ) |
| | | | | | |
At the end of the year | | 353 | | | 291 | |
| | | | | | |
City Telecom (H.K.) Limited
Consolidated financial statements for the year August 31, 2007
11 | Deferred taxation (continued) |
As of August 31, 2006 and 2007, the Group had accumulated tax losses amounting to HK$1,159,787,000 and HK$1,037,141,000, respectively that can be carried forward to reduce future taxable income derived in Hong Kong, Canada and the United States, as applicable. As of August 31, 2006 and 2007, the tax effect of the accumulated tax losses amounted to HK$204,300,000 and HK$182,739,000, respectively. These tax losses expire in the following periods:
| | | | |
| | | August 31, |
| | | 2006 | | 2007 |
| | | HK$’000 | | HK$’000 |
Within one year | | — | | 737 |
In the second year | | 1,512 | | 395 |
In the third year | | 396 | | — |
In the fourth year | | — | | — |
After five years | | 4,344 | | 4,313 |
No expiry date | | 1,153,535 | | 1,031,696 |
| | | | |
| | 1,159,787 | | 1,037,141 |
| | | | |
The tax losses of the Company and its Hong Kong subsidiaries can be carried forward indefinitely while tax losses of subsidiaries in Canada and the United States expire within periods ranging from 2 to 20 years.
Deferred tax assets are recognized to the extent that realization of the related tax benefit is probable. The Group has unrecognized tax losses carried forward from prior years of HK$279,199,000 and HK$268,004,000 at August 31, 2006 and 2007 respectively which can offset against future taxable income. Accumulated tax losses for which deferred tax assets were not recognized expire in the following periods:
| | | | |
| | | August 31, |
| | | 2006 | | 2007 |
| | | HK$’000 | | HK$’000 |
Within one year | | 1,513 | | 737 |
In the second year | | 396 | | 395 |
In the third year | | — | | — |
In the fourth year | | — | | — |
After five years | | 4,130 | | 4,313 |
No expiry date | | 273,160 | | 262,559 |
| | | | |
| | 279,199 | | 268,004 |
| | | | |
City Telecom (H.K.) Limited
Consolidated financial statements for the year August 31, 2007
11 | Deferred taxation (continued) |
The movements in deferred tax assets and liabilities (prior to offsetting of balances within the same taxation jurisdiction) during the years ended August 31, 2006 and 2007, are as follows:
| | | | | | | | | | | | | | | | | |
| | | Accelerated
depreciation allowances | | | Others | | Total | |
| | | 2006 | | | 2007 | | | 2006 | | | 2007 | | 2006 | | | 2007 | |
| | | HK$’000 | | | HK$’000 | | | HK$’000 | | | HK$’000 | | HK$’000 | | | HK$’000 | |
Deferred tax liabilities: | | | | | | | | | | | | | | | | | |
At the beginning of the year | | 158,477 | | | 154,678 | | | 85 | | | — | | 158,562 | | | 154,678 | |
Credited to consolidated statement of operations | | (3,805 | ) | | (19,772 | ) | | (86 | ) | | — | | (3,891 | ) | | (19,772 | ) |
Exchange differences | | 6 | | | 4 | | | 1 | | | — | | 7 | | | 4 | |
| | | | | | | | | | | | | | | | | |
At the end of the year | | 154,678 | | | 134,910 | | | — | | | — | | 154,678 | | | 134,910 | |
| | | | | | | | | | | | | | | | | |
| | | | | | | | | | | | | | | | | | |
| | | Share-based payment | | | Tax losses | | | Total | |
| | | 2006 | | | 2007 | | | 2006 | | | 2007 | | | 2006 | | | 2007 | |
| | | HK$’000 | | | HK$’000 | | | HK$’000 | | | HK$’000 | | | HK$’000 | | | HK$’000 | |
Deferred tax assets: | | | | | | | | | | | | | | | | | | |
At the beginning of the year | | — | | | (123 | ) | | (148,023 | ) | | (154,202 | ) | | (148,023 | ) | | (154,325 | ) |
Charged/ (credited) to consolidated statement of operations | | (123 | ) | | 123 | | | (6,173 | ) | | 19,590 | | | (6,296 | ) | | 19,713 | |
Exchange differences | | — | | | — | | | (6 | ) | | (7 | ) | | (6 | ) | | (7 | ) |
| | | | | | | | | | | | | | | | | | |
At the end of the year | | (123 | ) | | — | | | (154,202 | ) | | (134,619 | ) | | (154,325 | ) | | (134,619 | ) |
| | | | | | | | | | | | | | | | | | |
Deferred income tax assets and liabilities are offset when there is a legally enforceable rights to set off current tax assets against current tax liabilities and when the deferred income tax assets and liabilities relate to the same fiscal authority. The following amounts, determined after appropriate offsetting, are reported in the consolidated balance sheet:
| | | | |
| | | August 31, |
| | | 2006 | | 2007 |
| | | HK$’000 | | HK$’000 |
Deferred tax assets | | — | | — |
Deferred tax liabilities | | 353 | | 291 |
| | | | |
| | 353 | | 291 |
| | | | |
City Telecom (H.K.) Limited
Consolidated financial statements for the year August 31, 2007
| | | | | | |
| | | August 31, | |
| | | 2006 | | | 2007 | |
| | | HK$’000 | | | HK$’000 | |
Balance at the beginning of the year | | 21,131 | | | 12,445 | |
Additions during the year | | 5,287 | | | 24,502 | |
Less: Amortization charge for the year (note 4) | | (13,973 | ) | | (15,580 | ) |
| | | | | | |
Balance at the end of the year | | 12,445 | | | 21,367 | |
Current portion | | (10,808 | ) | | (13,584 | ) |
| | | | | | |
| | 1,637 | | | 7,783 | |
| | | | | | |
13 | Long-term debt and other liabilities |
The Group’s long-term debt and other liabilities were repayable as follows:
| | | | | | |
| | | August 31, | |
| | | 2006 | | | 2007 | |
| | | HK$’000 | | | HK$’000 | |
8.75% senior notes due 2015 | | 948,027 | | | 952,593 | |
| | | | | | |
Obligation under finance leases | | | | | | |
- Within one year | | 1,297 | | | 835 | |
- In the second year | | 806 | | | 121 | |
- In the third year | | 270 | | | 254 | |
| | | | | | |
| | 2,373 | | | 1,210 | |
Less: Current portion of obligation under finance leases | | (1,297 | ) | | (835 | ) |
| | | | | | |
| | 1,076 | | | 375 | |
| | | | | | |
| | 949,103 | | | 952,968 | |
| | | | | | |
City Telecom (H.K.) Limited
Consolidated financial statements for the year August 31, 2007
13 | Long-term debt and other liabilities (continued) |
On January 20, 2005, the Company issued unsecured 10-year senior fixed rates notes (the “10-year senior notes”) with a principle amount of US$125 million at par value. The 10-year senior notes mature on February 1, 2015 and bear interest at the fixed rate of 8.75% per annum and is payable semi-annually on February 1 and August 1 of each year, commencing August 1, 2005.
The 10-year senior notes are fully, irrevocably and unconditionally guaranteed, jointly and severally, on a senior unsecured basis by all of the subsidiaries of City Telecom (H.K.) Limited (collectively defined as “Guarantor Subsidiaries”), except CTI Guangzhou Customer Services Co. Ltd. in the PRC (“Non-guarantor Subsidiary”).
The net proceeds of 10-year senior notes were approximately US$121 million after issuance costs and commission. The Group used the net proceeds, in part, to repay in full an existing bank loan in the outstanding amount of HK$196.7 million. The remaining net proceeds is to be used for capital expenditures, including expanding and upgrading the Group’s Metro Ethernet network in Hong Kong, and for additional working capital and general corporate purposes.
The Company may redeem the 10-year senior notes, in whole or in part, on or after February 1, 2010, at the redemption price set forth in the indenture governing the 10-year senior notes. In addition, prior to February 1, 2008, using the proceeds from one or more specified public or private offerings of the Company’s common stock, the Company may redeem up to a maximum of 35% of the original aggregate principal amount of the 10-year senior notes at a redemption price equal to 108.75% of the principal amount of the 10-year senior notes. In all cases of redemption, the Company will pay principal at the redemption price specified plus accrued and unpaid interest through the date of redemption.
The indenture governing the 10-year senior notes contains covenants that limit, among other things, the Group’s ability and the ability of certain of its existing and future subsidiaries to:
| (i) | pay dividends, make distributions, redeem capital stock and make certain other restricted payments or investments; |
| (ii) | incur additional indebtedness or issue certain equity interests; |
| (iii) | merge, consolidate or sell substantially all assets; |
| (iv) | issue or sell capital stock of certain subsidiaries; |
| (v) | sell or exchange assets or enter into new businesses; |
| (vi) | create any restrictions on the payment of dividends, the making of distributions, the making of loans and the transfer of assets; |
| (vii) | create liens on assets; |
| (viii) | enter into certain transactions with affiliates or relates persons; and |
| (ix) | enter into sale and lease back transactions. |
At August 31, 2006 and 2007, the 10-year senior notes were stated at the amortized cost of US$121,854,000 (equivalent to HK$948,027,000) and US$122,127,000 (equivalent to HK$952,593,000), respectively.
City Telecom (H.K.) Limited
Consolidated financial statements for the year August 31, 2007
14 | Commitments and contingencies |
| | | | |
| | | August 31, |
| | | 2006 | | 2007 |
| | | HK$’000 | | HK$’000 |
Purchases of telecommunications, computer and office equipment contracted but not provided for | | 80,240 | | 54,165 |
| | | | |
(b) | Commitments under operating leases |
(i) | As of August 31, 2006 and 2007, the Group had future aggregate lease income receivable under non-cancellable operating leases as follows: |
| | | | |
| | | August 31, |
| | | 2006 | | 2007 |
| | | HK$’000 | | HK$’000 |
Leases in respect of telecommunications and computer equipment: | | | | |
- within one year | | 1,980 | | 1,065 |
- in the second year | | 798 | | 214 |
| | | | |
| | 2,778 | | 1,279 |
| | | | |
(ii) | As of August 31, 2006 and 2007, the Group had future aggregate minimum lease payments under non-cancellable operating leases as follows: |
| | | | |
| | | August 31, |
| | | 2006 | | 2007 |
| | | HK$’000 | | HK$’000 |
Leases in respect of land and buildings: | | | | |
- within one year | | 15,212 | | 12,562 |
- in the second year | | 8,041 | | 2,484 |
- in the third year | | 760 | | — |
- in the fourth year | | 431 | | — |
- in the fifth year | | 138 | | — |
| | | | |
| | 24,582 | | 15,046 |
| | | | |
City Telecom (H.K.) Limited
Consolidated financial statements for the year August 31, 2007
14 | Commitments and contingencies (continued) |
(b) | Commitments under operating leases (continued) |
(ii) | At August 31, 2006 and 2007, the Group had future aggregate minimum lease payments under non-cancellable operating leases as follows: (continued) |
| | | | |
| | | August 31, |
| | | 2006 | | 2007 |
| | | HK$’000 | | HK$’000 |
Leases in respect of telecommunications and computer equipment: | | | | |
- within one year | | 24,881 | | 31,004 |
- in the second year | | 3,100 | | 6,258 |
- in the third year | | 875 | | 5,016 |
- in the fourth year | | 800 | | 4,946 |
- in the fifth year | | 800 | | 4,946 |
- within sixth year to twelve years | | 6,400 | | 16,384 |
| | | | |
| | 36,856 | | 68,554 |
| | | | |
| | 61,438 | | 83,600 |
| | | | |
(c) | Program fee commitments |
The Group entered into several agreements with program content providers with respect to the Group’s IP-TV services. The amount of program fees payable by the Group is as follows:
| | | | |
| | | August 31, |
| | | 2006 | | 2007 |
| | | HK$’000 | | HK$’000 |
Program fee payable: | | | | |
- within one year | | 7,638 | | 10,345 |
- in the second year | | 4,340 | | 3,633 |
- in the third year | | 548 | | 3 |
| | | | |
| | 12,526 | | 13,981 |
| | | | |
City Telecom (H.K.) Limited
Consolidated financial statements for the year August 31, 2007
14 | Commitments and contingencies (continued) |
(d) | Contingent liabilities |
| | | | |
| | | August 31, |
| | | 2006 | | 2007 |
| | | HK$’000 | | HK$’000 |
Bank guarantees provided to suppliers (note 15(i) and (ii)) | | 6,303 | | 5,903 |
Bank guarantee in lieu of payment of utility deposits (note 15(iii)) | | 5,272 | | 5,272 |
| | | | |
| | 11,575 | | 11,175 |
| | | | |
As of August 31, 2007 and 2006, the Group had pledged bank deposits of US$9,900,000 (equivalent to HK$77,220,000 and HK$77,022,000, respectively) and HK$10,000,000 as security for the following banking facilities:
| (i) | bank facility of US$9,000,000 (equivalent to HK$70,200,000) granted by the bank for issuance of bank guarantees to third party suppliers, letters of credit, short term loan, overdraft, foreign exchange and interest rate hedging arrangements. As of August 31, 2007 and 2006, bank guarantees of HK$1,603,000 and HK$2,003,000, respectively were issued against this bank facility; |
| (ii) | bank guarantees of HK$4,300,000 issued by a bank to third party suppliers of the Company and one of its subsidiaries as of August 31, 2007 and 2006 for payment of certain products and services procured by the Company from these third party suppliers; and |
| (iii) | bank guarantees of HK$5,272,000 issued by a bank to certain utility vendors of the Company as of August 31, 2007 and 2006 in lieu of payment of utility deposits. |
City Telecom (H.K.) Limited
Consolidated financial statements for the year August 31, 2007
| | | | | |
| | | August 31, | |
| | | 2006 | | 2007 | |
| | | HK$’000 | | HK$’000 | |
Debt securities, at fair value and unlisted outside Hong Kong (note (a)) | | 26,633 | | 28,577 | |
Long term bank deposit, at amortized cost (note (b)) | | 13,641 | | 14,415 | |
| | | | | |
| | 40,274 | | 42,992 | |
Less: Current portion | | — | | (3,779 | ) |
| | | | | |
| | 40,274 | | 39,213 | |
| | | | | |
Notes:
| (a) | The Group maintained an investment portfolio of HK$26,633,000 and HK$28,577,000 as of August 31, 2007 and 2006, respectively, which primarily consisted of equity-linked mutual fund securities. |
For the years ended August 31, 2005, 2006 and 2007 the net unrealized investment gains/(losses) were HK$300,000, HK$698,000 and HK$1,887,000 respectively. No realized investment gains or losses were recognized during the years ended August 31, 2005, 2006 and 2007.
| (b) | Represents a ten-year US$2 million (equivalent to HK$15,600,000 at August 31, 2007) deposit placed with a bank for which the Group receives a floating rate deposit interest. The deposit has a 10-year term maturing on August 22, 2013. An interest rate of 10% per annum has been guaranteed for the first year from the inception date on August 22, 2003. The deposit will terminate or mature once the cumulative interest reaches the predetermined accrued interest cap at 13% of the principal amount or an aggregate sum of US$260,000 (equivalent to HK$2,028,000 at August 31, 2007). |
17 | Derivative financial instrument |
| | | | |
| | | August 31, |
| | | 2006 | | 2007 |
| | | HK$’000 | | HK$’000 |
Non-current assets | | | | |
Interest rate swap, at fair value through profit or loss (note 26(e)) | | 1,845 | | 1,039 |
| | | | |
As of August 31, 2007 and 2006, the Group has an outstanding interest rate swap contract with notional principal amount of HK$46,666,667 and HK$66,666,667, respectively. Under this arrangement, the Group pays a fixed rate interest of 2.675% per annum on the notional amount on a monthly basis, and receives a floating interest rate based on HIBOR rate. The maturity date of the contract is December 1, 2009.
City Telecom (H.K.) Limited
Consolidated financial statements for the year August 31, 2007
| | | | | | | | | | | | | | | | | | | | | |
| | | | | Ordinary shares | | | | | | | | | | | | | | | |
| | | Number of
shares
outstanding | | Amount
outstanding | | Share
premium | | Capital
reserve | | | Warrant
reserve | | | Translation
reserve | | | Retained
profits | | | Total
shareholders’
equity | |
| | | | | HK$ | | HK$ | | HK$ | | | HK$ | | | HK$ | | | HK$ | | | HK$ | |
| | | | | (Amounts in thousands, except number of shares) | |
Balance at September 1, 2004 | | 610,573,361 | | 61,057 | | 617,986 | | 87 | | | 365 | | | 983 | | | 495,220 | | | 1,175,698 | |
Release of warrant reserve upon warrant expiration | | — | | — | | — | | — | | | (18 | ) | | — | | | 18 | | | — | |
Shares issued upon exercise of warrants | | 3,500,043 | | 350 | | 1,397 | | — | | | (347 | ) | | — | | | — | | | 1,400 | |
Shares issued upon exercise of share options | | 52,000 | | 5 | | 25 | | — | | | — | | | — | | | — | | | 30 | |
Equity settled share-based compensation | | — | | — | | — | | 6,965 | | | — | | | — | | | — | | | 6,965 | |
Net loss | | — | | — | | — | | — | | | — | | | — | | | (163,496 | ) | | (163,496 | ) |
Foreign currency translation adjustment | | — | | — | | — | | — | | | — | | | (143 | ) | | — | | | (143 | ) |
| | | | | | | | | | | | | | | | | | | | | |
Balance at August 31, 2005 | | 614,125,404 | | 61,412 | | 619,408 | | 7,052 | | | — | | | 840 | | | 331,742 | | | 1,020,454 | |
Changes in accounting policy - opening balance adjustment arising from adoption of HKAS 32 and HKAS 39 (note (a)) | | — | | — | | — | | — | | | — | | | — | | | 6,609 | | | 6,609 | |
| | | | | | | | | | | | | | | | | | | | | |
Balance at September 1, 2005 | | 614,125,404 | | 61,412 | | 619,408 | | 7,052 | | | — | | | 840 | | | 338,351 | | | 1,027,063 | |
Shares issued upon exercise of share options | | 50,000 | | 5 | | 8 | | — | | | — | | | — | | | — | | | 13 | |
Equity settled share-based compensation | | — | | — | | 882 | | 5,941 | | | — | | | — | | | — | | | 6,823 | |
Net loss | | — | | — | | — | | — | | | — | | | — | | | (142,062 | ) | | (142,062 | ) |
Foreign currency translation adjustment | | — | | — | | — | | — | | | — | | | (183 | ) | | — | | | (183 | ) |
| | | | | | | | | | | | | | | | | | | | | |
Balance at August 31, 2006 | | 614,175,404 | | 61,417 | | 620,298 | | 12,993 | | | — | | | 657 | | | 196,289 | | | 891,654 | |
2007 interim dividends declared and paid | | — | | — | | — | | — | | | — | | | — | | | (24,635 | ) | | (24,635 | ) |
Shares issued upon exercise of share options | | 2,328,000 | | 233 | | 2,135 | | (611 | ) | | — | | | — | | | — | | | 1,757 | |
Equity settled share-based compensation | | — | | — | | — | | 5,727 | | | — | | | — | | | — | | | 5,727 | |
Net income | | — | | — | | — | | — | | | — | | | — | | | 28,865 | | | 28,865 | |
Foreign currency translation adjustment | | — | | — | | — | | — | | | — | | | 514 | | | — | | | 514 | |
| | | | | | | | | | | | | | | | | | | | | |
Balance at August 31, 2007 | | 616,503,404 | | 61,650 | | 622,433 | | 18,109 | | | — | | | 1,171 | | | 200,519 | | | 903,882 | |
| | | | | | | | | | | | | | | | | | | | | |
City Telecom (H.K.) Limited
Consolidated financial statements for the year August 31, 2007
18 | Capital and reserves (continued) |
| | | | |
| | | Authorized ordinary shares of HK$0.10 each |
| | | No. of Shares | | Amount |
| | | | | HK$’000 |
At August 31, 2006 and August 31, 2007 | | 2,000,000,000 | | 200,000 |
| | | | |
| | | | | | | | | | | | |
| | | Issued and fully paid (ordinary shares of HK$0.10 each) |
| | | August 31, 2005 | | August 31, 2006 | | August 31, 2007 |
| | | No. of shares | | Amount | | No. of shares | | Amount | | No. of shares | | Amount |
| | | | | HK$’000 | | | | HK$’000 | | | | HK$’000 |
At the beginning of the year | | 610,573,361 | | 61,057 | | 614,125,404 | | 61,412 | | 614,175,404 | | 61,417 |
Exercise of share options (note (b)) | | 52,000 | | 5 | | 50,000 | | 5 | | 2,328,000 | | 233 |
Exercise of warrants (note (c)) | | 3,500,043 | | 350 | | — | | — | | — | | — |
| | | | | | | | | | | | |
At the end of the year | | 614,125,404 | | 61,412 | | 614,175,404 | | 61,417 | | 616,503,404 | | 61,650 |
| | | | | | | | | | | | |
Notes:
| (a) | With effect from September 1, 2005, the Group adopted HKAS 32 “Financial instruments: Disclosure and presentation” and HKAS 39 “Financial instruments: Recognition and measurement”. The adoption of the HKAS 32 and HKAS 39 resulted in recognition of derivative financial instruments as assets of HK$6,609,000 and a corresponding increase in opening balance of retained profits at September 1, 2005. |
| (b) | During the years ended August 31, 2005, 2006 and 2007, 52,000, 50,000 and 2,328,000 ordinary shares were issued at a weighted average price of HK$0.58 per share, HK$0.26 per share and HK$0.75 per share respectively, to share option holders who had exercised their subscription rights. These shares issued rank pari passu with the then existing ordinary shares in issue. |
| (c) | The Company effected a warrant issue at a price of HK$0.11 per warrant to certain qualifying shareholders (shareholders domiciled in Hong Kong) for cash during the year ended August 31, 2002. One warrant was offered for every five existing ordinary shares held on the date of record. The warrants entitled the holders to subscribe for ordinary shares of the Company (on a one to one basis) at a price of HK$0.40 per share (subject to adjustment), totalling HK$39,325,920 in cash at any time on or before November 1, 2004. If the warrants were fully exercised, the Company would be required to issue 98,314,800 additional ordinary shares. During the year ended August 31, 2005, 3,500,043 warrants were exercised for an equivalent number of ordinary shares at a price of HK$0.40 per share. The shares issued rank pari passu with the then existing ordinary shares in issue. The remaining outstanding warrants of 135,396 expired on November 1, 2004. |
| (d) | Details of the share option scheme of the Group, the share options granted by the Group during the relevant years and options outstanding at August 31, 2005, 2006 and 2007 are set out in note 24. |
| | | | |
| | | August 31, |
| | | 2006 | | 2007 |
| | | HK$’000 | | HK$’000 |
Cash at bank and in hand | | 44,717 | | 50,164 |
Time deposits with banks and other financial institution (note (a)) | | 100,200 | | 482,730 |
| | | | |
| | 144,917 | | 532,894 |
| | | | |
Term deposits with banks and other financial institution (note (b)) | | 237,496 | | — |
| | | | |
Notes:
| (a) | Amounts represented time deposits with original maturities of less than three months. |
| (b) | Amounts represented term deposits with original maturities of more than three months. |
City Telecom (H.K.) Limited
Consolidated financial statements for the year August 31, 2007
| | | | | | |
| | | The Group is principally engaged in the provision of international telecommunications services and fixed telecommunications network services to customers in Hong Kong and Canada. Revenues recognized during the year are as follows: |
| | | | | | | | | |
| | | 2009 | | | 2008 | |
| | | HK$’000 | | | HK$’000 | |
Revenue | | | | | | | | |
| | | | | | | | | |
| International telecommunications services | | | 247,359 | | | | 291,943 | |
| Fixed telecommunications network services (note 2(c)) | | | 1,230,880 | | | | 1,011,038 | |
| | | | | | | |
| | | | | | | | | |
| | | | 1,478,239 | | | | 1,302,981 | |
| | | | | | | |
Year ended August 31,(a) | | Primary reporting format — business segments |
|
| | | 2005 | | 2006 | | 2007The Group is organized on a worldwide basis into two business segments: |
| | HK$’000 | | HK$’000 | | HK$’000 |
Interim dividend, declared and paid, of HK4 cents (2006: HK$Nil, 2005: HK$Nil) per ordinary share
| | — | | — | | 24,635 |
Final dividend proposed after the balance sheet date of HK4 cents (2006: HK$Nil, 2005: HK$Nil) per ordinary shares
| | — | | — | | 24,660 |
| | | | | | |
| - International telecommunications | | — : | | — | | 49,295 |
| | | | | | |
The Group’s banking facilities were denominated in Hong Kong dollars as follows:
| | | | | | | | | | |
| | | Amount available August 31, | | Amount utilized August 31, | | Terms of facilities as
at August 31, 2007
Interest rate |
| | | 2006 | | 2007 | | 2006 | | 2007 | | |
| | | HK$’000 | | HK$’000 | | HK$’000 | | HK$’000 | | |
Bank overdrafts/ bank loans | | 80,020 | | 80,200 | | 2,003 | | 1,603 | | HIBOR or cost of
Funds + 0.8% per
annum |
| | | | | | | | | | |
| | | | | | | | | | |
The amounts utilized as of August 31, 2006 and 2007 represented bank guarantees and letter of credit issued against the banking facilities (see note 15) which the Group has not drawn upon. The utilized banking facilities as of August 31, 2006 and 2007 were denominated in Hong Kong dollar.
22 | Related party transactions |
In addition to the transactions and balances disclosed elsewhere in these financial statements, the Group entered into the following material related party transactions.
Key management personnel remuneration
Remuneration for key management personnel, including amounts paid to the Group’s directors and certain of the highest paid employees, is as follows:
| | | | |
| | | Year ended August 31, |
| | | 2006 | | 2007 |
| | | HK$’000 | | HK$’000 |
Short-term employee benefits | | 21,443 | | 26,791 |
Post-employment benefits | | 1,916 | | 2,197 |
Equity compensation benefits | | 4,571 | | 4,388 |
| | | | |
| | 27,930 | | 33,376 |
| | | | |
City Telecom (H.K.) Limited
Consolidated financial statements for the year August 31, 2007
The Group contributes to, the Occupational Retirement Scheme (“the ORSO Scheme”), a defined contribution retirement scheme, which is available to certain employees. Under the ORSO Scheme, the employees are required to contribute 5% of their monthly salaries, while the Group’s contributions are calculated at 10% and 5% of the monthly salaries of senior management staff and all other staff, respectively. The employees are entitled to 100% of the employer’s contributions after 10 years of completed service, or at a reduced scale after completion of 3 to 9 years of service. Contributions to the ORSO Scheme are reduced by amounts forfeited by employees who leave the ORSO Scheme prior to vesting fully in the Group’s contributions.
In December 2000, the Group established a defined contribution retirement scheme, Mandatory Provident Fund Scheme (“the MPF Scheme”), under the Hong Kong Mandatory Provident Fund Scheme Ordinance where the then existing employees of the Group in Hong Kong could elect to join the MPF Scheme. All new employees who join the Group in Hong Kong after December 2000 are required to join the MPF Scheme. Both the Group and the employees are required to contribute 5% of each individual’s relevant income subject to a maximum amount of contribution of HK$1,000 per month. The employee is fully vested in the Group’s mandatory contributions. Senior employees who are under MPF Scheme may also elect to join a Mutual Voluntary Plan (“the Mutual Plan”) whereby both the Group and the employees make additional voluntary contributions, so that the total amount of contributions made under the MPF Scheme and the Mutual Plan is similar to the contribution made under the ORSO Scheme.
The Group also contributes to defined contribution pension schemes for staff in overseas countries as required by the respective local statutory requirements.
The aggregate employer’s contributions, net of forfeited contributions, which have been dealt with in the consolidated statement of operations during the year are as follows:
| | | | | | | | | |
| | | Year ended August 31, | |
| | | 2005 | | | 2006 | | | 2007 | |
| | | HK$’000 | | | HK$’000 | | | HK$’000 | |
Gross contributions | | 27,789 | | | 28,912 | | | 24,545 | |
Less: Forfeited contributions utilized to offset the Group’s contributions during the year | | (352 | ) | | (956 | ) | | (612 | ) |
| | | | | | | | | |
Net contributions charged to the consolidated statement of operations | | 27,437 | | | 27,956 | | | 23,933 | |
| | | | | | | | | |
At August 31, 2007, there is no forfeited contribution available to offset future contributions by the Group to the ORSO scheme and the Mutual Plan.
City Telecom (H.K.) Limited
Consolidated financial statements for the year August 31, 2007
24 | Equity settled share-based transactions |
2002 Share Option Scheme
The Company operates a share option scheme (the “2002 Share Option Scheme”) which was adopted by the shareholders of the Company on December 23, 2002 and where the directors may, at their discretion, invite eligible participants to take up options to subscribe for shares subject to the terms and conditions stipulated therein.
Under the 2002 Share Option Scheme, the Company may grant options to employees (including executive, non-executive and independent non-executive directors), suppliers and professional advisers to subscribe for shares of the Company. The maximum number of options authorized under the 2002 Share Option Scheme may not, when aggregated with any shares subject to any other executive and employee share option scheme, exceed 10% of the Company’s issued share capital on the date of adoption. The exercise price of the option is determined by the Company’s board of directors at a price not less than the highest of (a) the par value of a share; (b) the average closing price of the Company’s shares for five trading days preceding the grant date; and (c) the closing price of the Company’s shares on the date of grant. The 2002 Share Option Scheme is valid and effective for a ten year period up to December 22, 2012 subject to earlier termination by the Company by resolution in general meeting or by the board of directors. The period during which the option may be exercised will be determined by the board of directors at its discretion, save that no option may be exercised after more than ten years from the date of grant. During the year ended August 31, 2007, options were granted under the 2002 Share Option Scheme to eligible participants for the subscription of 300,000 shares (2006: 34,310,000 shares) of the Company at a weighted average exercise price of HK$1.16 (2006: HK$0.67) each.
1997 Share Option Scheme
The Company also had a previous share option scheme (the “1997 Share Option Scheme”) adopted by shareholders on July 12, 1997 which was terminated on December 23, 2002 upon the adoption of the 2002 Share Option Scheme. Unexercised options granted under the 1997 Share Option Scheme lapsed automatically on 12 July 2007.
Each option issued under the 2002 Share Option Scheme or the 1997 Share Option Scheme entitles the holder to subscribe for one ordinary share in the Company at a predetermined exercise price.
Prior to September 1, 2005, under Hong Kong GAAP, no compensation cost was required to be recognized in respect of the grant of share options. At the time of exercise of the options, proceeds from issue of shares were credited to share capital and share premium account.
City Telecom (H.K.) Limited
Consolidated financial statements for the year August 31, 2007
24 | Equity settled share-based transactions (continued) |
1997 Share Option Scheme (continued)
Effective from September 1, 2005, upon the adoption of HKFRS 2 “Share-based payment”, the Group recognizes the fair value of share options granted over the vesting period, or as an asset, if the cost qualifies for recognition as an asset. The fair value of share option is measured at the date of grant. The Group has taken advantage of the transitional provisions set out in paragraph 53 of HKFRS 2 under which the new recognition and measurement policies have not been applied to the following options:
| (i) | share options granted under the 1997 Share Option Scheme since all options were granted to employees before November 7, 2002; and |
| (ii) | share options granted under the 2002 Share Option Scheme and vested before September 1, 2005. |
Details of share options granted pursuant to the 2002 Share Option Scheme and 1997 Share Option Scheme that were outstanding at August 31, 2005, 2006 and 2007, are as follows:
1997 Share Option Scheme
| | | | | | | | | |
Date of grant | | September 3,
1998 | | | September 10,
1999 | | | October 20,
2000 | |
Exercise price per share (HK$) | | 0.26 | | | 2.10 | | | 0.58 | |
| | | | | | | | | |
Market price per share (HK$) at date of grant | | 0.26 | | | 2.10 | | | 0.58 | |
| | | | | | | | | |
Outstanding at September 1, 2004 | | 190,000 | | | 60,000 | | | 350,000 | |
Exercised | | — | | | — | | | (52,000 | ) |
| | | | | | | | | |
Outstanding at August 31, 2005 | | 190,000 | | | 60,000 | | | 298,000 | |
Exercised | | (50,000 | ) | | — | | | — | |
Lapsed upon resignation of employees | | — | | | (20,000 | ) | | (20,000 | ) |
| | | | | | | | | |
Outstanding at August 31, 2006 | | 140,000 | | | 40,000 | | | 278,000 | |
Exercised | | (140,000 | ) | | — | | | (278,000 | ) |
Lapsed upon expiry of the options | | — | | | (40,000 | ) | | — | |
| | | | | | | | | |
Outstanding at August 31, 2007 | | — | | | — | | | — | |
| | | | | | | | | |
City Telecom (H.K.) Limited
Consolidated financial statements for the year August 31, 2007
24 | Equity settled share-based transactions (continued) |
2002 Share Option Scheme
| | | | | | | | | | | | | | | | | | | | | | |
Date of grant | | June 3,
2004 | | October 21,
2004 | | | January 5,
2005 | | October 3,
2005 | | May 22, 2006 | | | July 3,
2006 | | | August 3,
2006 | | | November 22,
2006 | | May 23,
2007 |
| | | (note (a)) | | (note (b)) | | | (note (c)) | | (note (d)) | | (note (e)) | | | (note (f)) | | | (note(g)) | | | (note(h)) | | (note(i)) |
Exercise price per share (HK$) | | 1.47 | | 1.54 | | | 1.54 | | 0.81 | | 0.66 | | | 0.68 | | | 0.71 | | | 0.73 | | 2.03 |
| | | | | | | | | | | | | | | | | | | | | | |
Market price per share (HK$) at date of grant | | 1.47 | | 1.49 | | | 1.48 | | 0.81 | | 0.64 | | | 0.68 | | | 0.71 | | | 0.73 | | 2.10 |
| | | | | | | | | | | | | | | | | | | | | | |
Outstanding at September 1, 2004 | | 6,000,000 | | — | | | — | | — | | — | | | — | | | — | | | — | | — |
Granted | | — | | 14,670,000 | | | 16,000,000 | | — | | — | | | — | | | — | | | — | | — |
Exercised | | — | | — | | | — | | — | | — | | | — | | | — | | | — | | — |
| | | | | | | | | | | | | | | | | | | | | | |
Outstanding at August 31, 2005 | | 6,000,000 | | 14,670,000 | | | 16,000,000 | | — | | — | | | — | | | — | | | — | | — |
Granted | | — | | — | | | — | | 1,000,000 | | 32,210,000 | | | 1,000,000 | | | 100,000 | | | — | | — |
Lapsed upon resignation of employees | | — | | (5,220,000 | ) | | — | | — | | — | | | — | | | — | | | — | | — |
| | | | | | | | | | | | | | | | | | | | | | |
Outstanding at August 31, 2006 | | 6,000,000 | | 9,450,000 | | | 16,000,000 | | 1,000,000 | | 32,210,000 | | | 1,000,000 | | | 100,000 | | | — | | — |
Granted | | — | | — | | | — | | — | | — | | | — | | | — | | | 200,000 | | 100,000 |
Exercised | | — | | (330,000 | ) | | — | | — | | (1,250,000 | ) | | (300,000 | ) | | (30,000 | ) | | — | | — |
Lapsed upon resignation of employees | | — | | (780,000 | ) | | — | | — | | (2,020,000 | ) | | — | | | — | | | — | | — |
| | | | | | | | | | | | | | | | | | | | | | |
Outstanding at August 31, 2007 | | 6,000,000 | | 8,340,000 | | | 16,000,000 | | 1,000,000 | | 28,940,000 | | | 700,000 | | | 70,000 | | | 200,000 | | 100,000 |
| | | | | | | | | | | | | | | | | | | | | | |
Notes:
| (a) | On June 3, 2004, an employee was granted options to subscribe for 6,000,000 shares at a price of HK$1.47 per share. The vesting period for the options is June 3, 2004 to April 30, 2006. |
| (b) | On October 21, 2004, employees, including executive directors, were granted options to subscribe for 14,670,000 shares at a price of HK$1.54 per share. The vesting period for the options is October 21, 2004 to December 31, 2006. |
| (c) | On January 5, 2005, executive directors were granted options to subscribe for 16,000,000 shares at a price of HK$1.54 per share. The vesting period for the options is January 5, 2005 to December 31, 2006. |
| (d) | On October 3, 2005, an employee was granted options to subscribe for 1,000,000 shares at a price of HK$0.81 per share. The vesting period for the options is October 3, 2005 to September 30, 2006. |
| (e) | On May 22, 2006, employees, including executive directors, were granted options to subscribe for 32,210,000 shares at a price of HK$0.66 per share. The vesting period for the options is May 22, 2006 to May 21, 2009. |
| (f) | On July 3, 2006, an employee was granted options to subscribe for 1,000,000 shares at a price of HK$0.68 per share. The vesting period for the options is July 3, 2006 to July 2, 2009. |
City Telecom (H.K.) Limited
Consolidated financial statements for the year August 31, 2007
24 | Equity settled share-based transactions (continued) |
2002 Share Option Scheme (continued)
Notes: (continued)
| (g) | On August 3, 2006, an employee was granted options to subscribe for 100,000 shares at a price of HK$0.71 per share. The vesting period of the option is August 3, 2006 to August 2, 2009. |
| (h) | On November 22, 2006, an employee was granted options to subscribe for 200,000 shares at a price of HK$0.73 per share. The vesting period of the option is November 22, 2006 to November 14, 2009. |
| (i) | On May 23, 2007, an employee was granted options to subscribe for 100,000 shares at a price of HK$2.03 per share. The vesting period of the option is May 23, 2007 to June 11, 2010. |
| (j) | The share options outstanding in respect of the 1997 Share Option Scheme and 2002 Share Options Scheme as of August 31, 2005, 2006 and 2007 is summarized as follows: |
| | | | | | | |
| | | Number of
share
options
outstanding | | | Weighted
average
exercise
prices per
share | | Weighted
average
market price
at the date
of grant |
| | | (thousands) | | | HK$’000 | | HK$’000 |
Balance at September 1, 2004 | | 6,600 | | | 1.39 | | 1.36 |
Granted during the year | | 30,670 | | | 1.54 | | 1.48 |
Exercised during the year | | (52 | ) | | 0.58 | | N/A |
| | | | | | | |
Balance at August 31, 2005 | | 37,218 | | | 1.51 | | 1.46 |
Granted during the year | | 34,310 | | | 0.67 | | 0.74 |
Exercised during the year | | (50 | ) | | 0.26 | | N/A |
Lapsed during the year | | (5,260 | ) | | 1.54 | | N/A |
| | | | | | | |
Balance at August 31, 2006 | | 66,218 | | | 1.08 | | 1.04 |
Granted during the year | | 300 | | | 1.16 | | 1.19 |
Exercised during the year | | (2,328 | ) | | 0.76 | | 0.74 |
Lapsed during the year | | (2,840 | ) | | 0.93 | | 0.89 |
| | | | | | | |
Balance at August 31, 2007 | | 61,350 | | | 1.09 | | 1.06 |
| | | | | | | |
City Telecom (H.K.) Limited
Consolidated financial statements for the year August 31, 2007
24 | Equity settled share-based transactions (continued) |
2002 Share Option Scheme (continued)
Notes: (continued)
| (k) | The following table summarizes the information about share options outstanding at August 31, 2007: |
| | | | | | | | |
Date of grant | | Exercise
price at
August 31,
2007 | | Number of
outstanding
at August 31,
2007 | | Remaining
life | | Exercisable
options at
August 31,
2007 |
| | | | | (thousands) | | (months) | | (thousands) |
June 3, 2004 | | 1.47 | | 6,000 | | 81 | | 6,000 |
October 21, 2004 | | 1.54 | | 8,340 | | 86 | | 8,340 |
January 5, 2005 | | 1.54 | | 16,000 | | 86 | | 16,000 |
October 3, 2005 | | 0.81 | | 1,000 | | 97 | | 1,000 |
May 22, 2006 | | 0.66 | | 28,940 | | 105 | | 9,120 |
July 3, 2006 | | 0.68 | | 700 | | 106 | | — |
August 3, 2006 | | 0.71 | | 70 | | 107 | | — |
November 22, 2006 | | 0.73 | | 200 | | 110 | | — |
May 23, 2007 | | 2.03 | | 100 | | 117 | | — |
| | | | | | | | |
| | | | 61,350 | | | | 40,460 |
| | | | | | | | |
| (l) | Fair value of share options and assumptions: |
In determining the fair value of the share options granted, the Black-Scholes option pricing model (the “Black-Scholes Model”) has been used. The Black-Scholes Model is one of the most generally accepted methodologies used to calculate the value of options and is one of the recommended option pricing models as set out in Chapter 17 of the Rules Governing the Listing of Securities on the Stock Exchange of Hong Kong Limited. The variables of the Black-Scholes Model include expected life of the options, risk-free interest rate, expected volatility and expected dividend yield of the shares of the Company.
City Telecom (H.K.) Limited
Consolidated financial statements for the year August 31, 2007
24 | Equity settled share-based transactions (continued) |
2002 Share Option Scheme (continued)
Notes: (continued)
| (l) | Fair value of share options and assumptions: (continued) |
In determining the fair value of the share options granted during the year, the following variables have been applied to the Black-Scholes Model:
| | | | | | | | | | | | | | | | | | | | | | | | | | | |
Measurement date | | June 3,
2004 | | | October 21,
2004 | | | January 5,
2005 | | | October 3,
2005 | | | May 22,
2006 | | | July 3,
2006 | | | August 3,
2006 | | | November 22,
2006 | | | May 23,
2007 | |
Variables | | | | | | | | | | | | | | | | | | | | | | | | | | | |
- Expected life (i) | | 5 years | | | 5 years | | | 5 years | | | 5 years | | | 5 years | | | 5 years | | | 5 years | | | 5 years | | | 5 years | |
- Risk-free rate (ii) | | 3.78 | % | | 2.65 | % | | 2.75 | % | | 4.41 | % | | 4.63 | % | | 4.45 | % | | 4.06 | % | | 3.76 | % | | 4.45 | % |
- Expected volatility (iii) | | 59.04 | % | | 72.06 | % | | 69.37 | % | | 58.29 | % | | 55.04 | % | | 53.56 | % | | 52.71 | % | | 51.02 | % | | 56.01 | % |
- Expected dividend yield (iv) | | 1 | % | | 1 | % | | 1 | % | | 0 | % | | 0 | % | | 0 | % | | 0 | % | | 0 | % | | 0 | % |
The above variables were determined as follows:
| (i) | The expected life is estimated to be 5 years from the date of grant (the “Measurement Date”). |
| (ii) | The risk-free rate represents the yield of the Hong Kong Exchange Fund Notes corresponding to the expected life of the options as at the Measurement Date. |
| (iii) | The expected volatility represents the annualized standard deviation of the continuously compounded rates of return on the shares of the most recent period from the Measurement Date that is generally commensurate with the expected term of option (taking into account the remaining contractual life of the option and the effect of the expected early exercise of the option). |
| (iv) | Dividend yield has been assumed as 1% for options granted in fiscal years 2004 and 2005 and 0% for fiscal years 2006 and 2007. |
Using the Black-Scholes Model, the estimated fair value per share option is as follows:
| | | | | | | | | | | | | | | | | | |
Date of grant | | June 3,
2004 | | October 21,
2004 | | January 5,
2005 | | October 3,
2005 | | May 22,
2006 | | July 3,
2006 | | August 3
2006 | | November 22,
2006 | | May 23,
2007 |
| | | HK$ | | HK$ | | HK$ | | HK$ | | HK$ | | HK$ | | HK$ | | HK$ | | HK$ |
Fair value per share option | | 0.70 | | 0.84 | | 0.80 | | 0.44 | | 0.33 | | 0.35 | | 0.36 | | 0.35 | | 1.13 |
The Black-Scholes Model, was developed for use in estimating the fair value of traded options that are fully transferable and have no vesting restrictions. Such an option pricing model requires input of highly subjective assumptions, including the expected stock volatility. As the Company’s share options have characteristics significantly different from those of traded options, changes in subjective inputs may materially affect the estimated fair value of the options granted.
City Telecom (H.K.) Limited
Consolidated financial statements for the year August 31, 2007
25 | Revenues and segmental information |
Revenue recognized during the year is as follows:
| | | | | | |
| | | Year ended August 31, |
| | | 2005 | | 2006 | | 2007 |
| | | HK$’000 | | HK$’000 | | HK$’000 |
Revenue | | | | | | |
International telecommunications services | | 532,595 | | 418,276 | | 324,470 |
Fixed telecommunications network services (note (c)) | | 629,464 | | 716,600 | | 816,800 |
| | | | | | |
| | 1,162,059 | | 1,134,876 | | 1,141,270 |
| | | | | | |
Other income | | | | | | |
Interest income | | 13,578 | | 20,378 | | 22,671 |
Other income | | 6,037 | | 4,465 | | 3,149 |
| | | | | | |
| | 19,615 | | 24,843 | | 25,820 |
| | | | | | |
(a) | Primary reporting format - business segments |
The Group is organized on a worldwide basis into two business segments:
| - | International telecommunications - provision of international long distance calls services.services |
| |
| - | Fixed telecommunications network - | | : | | provision of dial up and broadband Internet access services , local voice-over-IP services, IP-TV services and IP-TV services.corporate data services |
The Group’s reportable segments are strategic business units that offer different type of telecommunications services. Each of these business units are operated and managed separately.F-13
The Group’s inter-segment transactions mainly consist of provision of leased lines services.
City Telecom (H.K.) Limited
Consolidated financial statements for the year August 31, 2007
252 | Revenues | Revenue and segmentalsegment information (continued) |
|
| (a) | | Primary reporting format -— business segments (continued) |
|
| | The Group’s inter-segment transactions mainly consist of provision of leased lines services. These transactions were entered into on similar terms as those contracted with third parties. |
| | | | | | | | | | | | | | | | | |
| | | 2009 | |
| | | International | | | Fixed | | | | | | | |
| | | tele- | | | tele- | | | | | | | |
| | | communications | | | communications | | | | | | | |
| | | services | | | network services | | | Elimination | | | Group | |
| | | HK$’000 | | | HK$’000 | | | HK$’000 | | | HK$’000 | |
| Revenue | | | | | | | | | | | | | | | | |
| - External sales | | | 247,359 | | | | 1,230,880 | | | | — | | | | 1,478,239 | |
| - Inter-segment sales | | | 5,669 | | | | 19,784 | | | | (25,453 | ) | | | — | |
| | | | | | | | | | | | | |
| | | | | | | | | | | | | | | | | |
| | | | 253,028 | | | | 1,250,664 | | | | (25,453 | ) | | | 1,478,239 | |
| | | | | | | | | | | | | |
| | | | | | | | | | | | | | | | | |
| Segment results | | | 61,631 | | | | 203,515 | | | | | | | | 265,146 | |
| | | | | | | | | | | | | | | |
| Other revenues | | | | | | | | | | | | | | | 41,540 | |
| Finance costs | | | | | | | | | | | | | | | (55,127 | ) |
| | | | | | | | | | | | | | | | |
| | | | | | | | | | | | | | | | | |
| Profit before taxation | | | | | | | | | | | | | | | 251,559 | |
| Income tax expense | | | | | | | | | | | | | | | (38,730 | ) |
| | | | | | | | | | | | | | | | |
| | | | | | | | | | | | | | | | | |
| Net profit | | | | | | | | | | | | | | | 212,829 | |
| | | | | | | | | | | | | | | | |
| | | | | | | | | | | | | | | | | |
| | | 2008 | |
| | | International | | | Fixed | | | | | | | |
| | | tele- | | | tele- | | | | | | | |
| | | communications | | | communications | | | | | | | |
| | | services | | | network services | | | Elimination | | | Group | |
| | | HK$’000 | | | HK$’000 | | | HK$’000 | | | HK$’000 | |
| Revenue | | | | | | | | | | | | | | | | |
| - External sales | | | 291,943 | | | | 1,011,038 | | | | — | | | | 1,302,981 | |
| - Inter-segment sales | | | 5,692 | | | | 22,680 | | | | (28,372 | ) | | | — | |
| | | | | | | | | | | | | |
| | | | | | | | | | | | | | | | | |
| | | | 297,635 | | | | 1,033,718 | | | | (28,372 | ) | | | 1,302,981 | |
| | | | | | | | | | | | | |
| | | | | | | | | | | | | | | | | |
| Segment results | | | 63,225 | | | | 95,295 | | | | | | | | 158,520 | |
| | | | | | | | | | | | | | | |
| Other revenues | | | | | | | | | | | | | | | 24,989 | |
| Finance costs | | | | | | | | | | | | | | | (75,137 | ) |
| | | | | | | | | | | | | | | | |
| | | | | | | | | | | | | | | | | |
| Profit before taxation | | | | | | | | | | | | | | | 108,372 | |
| Income tax benefit | | | | | | | | | | | | | | | 16,818 | |
| | | | | | | | | | | | | | | | |
| | | | | | | | | | | | | | | | | |
| Net profit | | | | | | | | | | | | | | | 125,190 | |
| | | | | | | | | | | | | | | | |
Segment results are income/(loss) from operations excluding interest expense and interest income, but includes other income, net. All segment measures are based on accounting policies that are consistent with those used in the preparation of the consolidated financial statements.F-14
| | | | | | | | | | | |
| | | Year ended August 31, 2005 | |
| | | International
tele-
communications
services | | Fixed tele-
communications
network services | | | Elimination | | | Group | |
| | | HK$’000 | | HK$’000 | | | HK$’000 | | | HK$’000 | |
Revenue (note (c)) | | | | | | | | | | | |
- External sales | | 532,595 | | 629,464 | | | — | | | 1,162,059 | |
- Inter-segment sales | | 4,108 | | 33,188 | | | (37,296 | ) | | — | |
| | | | | | | | | | | |
| | 536,703 | | 662,652 | | | (37,296 | ) | | 1,162,059 | |
| | | | | | | | | | | |
Segment results | | 89,835 | | (219,172 | ) | | | | | (129,337 | ) |
| | | | | | | | | | | |
Interest income | | 13,240 | | 338 | | | — | | | 13,578 | |
Interest expense | | | | | | | | | | (54,462 | ) |
| | | | | | | | | | | |
Loss before taxation | | | | | | | | | | (170,221 | ) |
| | | | | | | | | | | |
Segment assets | | 942,304 | | 1,404,589 | | | — | | | 2,346,893 | |
Unallocated assets | | | | | | | | | | 535 | |
| | | | | | | | | | | |
Total assets | | | | | | | | | | 2,347,428 | |
| | | | | | | | | | | |
Segment liabilities | | 130,011 | | 721,748 | | | — | | | 851,759 | |
Unallocated liabilities | | | | | | | | | | 475,215 | |
| | | | | | | | | | | |
Total liabilities | | | | | | | | | | 1,326,974 | |
| | | | | | | | | | | |
Capital expenditure | | 11,582 | | 407,544 | | | — | | | 419,126 | |
Depreciation | | 24,928 | | 211,721 | | | — | | | 236,649 | |
Goodwill amortization | | — | | 1,065 | | | — | | | 1,065 | |
City Telecom (H.K.) Limited
Consolidated financial statements for the year August 31, 2007
252 | Revenues | Revenue and segmentalsegment information (continued) |
|
| (a) | | Primary reporting format -— business segments (continued) |
| | | | | | | | | | | | | |
| | | 2009 | |
| | | International | | | Fixed | | | | |
| | | tele- | | | tele- | | | | |
| | | communications | | | communications | | | | |
| | | services | | | network services | | | Group | |
| | | HK$’000 | | | HK$’000 | | | HK$’000 | |
| Segment assets | | | 297,516 | | | | 1,487,528 | | | | 1,785,044 | |
| | | | | | | | | | | | |
| | | | | | | | | | | | | |
| Segment liabilities | | | 81,194 | | | | 295,035 | | | | 376,229 | |
| Unallocated liabilities | | | | | | | | | | | 180,288 | |
| | | | | | | | | | | | |
| | | | | | | | | | | | | |
| Total liabilities | | | | | | | | | | | 556,517 | |
| | | | | | | | | | | | |
| | | | | | | | | | | | | |
| Capital expenditure incurred during the year | | | 1,820 | | | | 284,914 | | | | 286,734 | |
| Depreciation for the year | | | 15,154 | | | | 191,087 | | | | 206,241 | |
| | | | | | | | | | | | | |
| | | 2008 | |
| | | International | | | Fixed | | | | |
| | | tele- | | | tele- | | | | |
| | | communications | | | communications | | | | |
| | | services | | | network services | | | Group | |
| | | HK$’000 | | | HK$’000 | | | HK$’000 | |
| Segment assets | | | 426,781 | | | | 1,627,300 | | | | 2,054,081 | |
| Unallocated assets | | | | | | | | | | | 26,335 | |
| | | | | | | | | | | | |
| | | | | | | | | | | | | |
| Total assets | | | | | | | | | | | 2,080,416 | |
| | | | | | | | | | | | |
| | | | | | | | | | | | | |
| Segment liabilities | | | 80,756 | | | | 276,771 | | | | 357,527 | |
| Unallocated liabilities | | | | | | | | | | | 690,282 | |
| | | | | | | | | | | | |
| | | | | | | | | | | | | |
| Total liabilities | | | | | | | | | | | 1,047,809 | |
| | | | | | | | | | | | |
| | | | | | | | | | | | | |
| Capital expenditure incurred during the year | | | 4,293 | | | | 207,391 | | | | 211,684 | |
| Depreciation for the year | | | 19,587 | | | | 190,464 | | | | 210,051 | |
F-15
| | | | | | | | | | | |
| | | Year ended August 31, 2006 | |
| | | International
tele-
communications
services | | Fixed tele-
communications
network services | | | Elimination | | | Group | |
| | | HK$’000 | | HK$’000 | | | HK$’000 | | | HK$’000 | |
Revenue (note (c)) | | | | | | | | | | | |
- External sales | | 418,276 | | 716,600 | | | — | | | 1,134,876 | |
- Inter-segment sales | | 5,670 | | 31,275 | | | (36,945 | ) | | — | |
| | | | | | | | | | | |
| | 423,946 | | 747,875 | | | (36,945 | ) | | 1,134,876 | |
| | | | | | | | | | | |
Segment results | | 25,677 | | (106,724 | ) | | | | | (81,047 | ) |
| | | | | | | | | | | |
Interest income | | 17,728 | | 2,650 | | | — | | | 20,378 | |
Interest expense | | | | | | | | | | (88,637 | ) |
| | | | | | | | | | | |
Loss before taxation | | | | | | | | | | (149,306 | ) |
| | | | | | | | | | | |
Segment assets | | 626,480 | | 1,497,388 | | | — | | | 2,123,868 | |
Unallocated assets | | — | | — | | | — | | | 347 | |
| | | | | | | | | | | |
Total assets | | | | | | | | | | 2,124,215 | |
| | | | | | | | | | | |
Segment liabilities | | 114,847 | | 921,230 | | | — | | | 1,036,077 | |
Unallocated liabilities | | | | | | | | | | 196,484 | |
| | | | | | | | | | | |
Total liabilities | | | | | | | | | | 1,232,561 | |
| | | | | | | | | | | |
Capital expenditure | | 13,838 | | 309,097 | | | — | | | 322,935 | |
Depreciation | | 23,598 | | 252,866 | | | — | | | 276,464 | |
City Telecom (H.K.) Limited
Consolidated financial statements for the year August 31, 2007
252 | Revenues | Revenue and segmentalsegment information (continued) |
(a)(b) | | PrimarySecondary reporting format -— geographical segments |
|
| | The Group’s two business segments (continued)are managed in two main geographical areas: |
| | | | | | | | | | |
| | | Year ended August 31, 2007 | |
| | | International tele- communications services | | Fixed tele- communications network services | | Elimination | | | Group | |
| | | HK$’000 | | HK$’000 | | HK$’000 | | | HK$’000 | |
Revenue (note (c)) | | | | | | | | | | |
- External sales | | 324,470 | | 816,800 | | — | | | 1,141,270 | |
- Inter-segment sales | | 5,699 | | 27,633 | | (33,332 | ) | | — | |
| | | | | | | | | | |
| | 330,169 | | 844,433 | | (33,332 | ) | | 1,141,270 | |
| | | | | | | | | | |
Segment results | | 53,673 | | 42,051 | | | | | 95,724 | |
| | | | | | | | | | |
Interest income | | 15,032 | | 7,639 | | — | | | 22,671 | |
Interest expense | | | | | | | | | (87,504 | ) |
| | | | | | | | | | |
Profit before taxation | | | | | | | | | 30,891 | |
| | | | | | | | | | |
Segment assets | | 541,502 | | 1,619,631 | | — | | | 2,161,133 | |
Unallocated assets | | | | | | | | | — | |
| | | | | | | | | | |
Total assets | | | | | | | | | 2,161,133 | |
| | | | | | | | | | |
Segment liabilities | | 101,148 | | 955,598 | | — | | | 1,056,746 | |
Unallocated liabilities | | | | | | | | | 200,505 | |
| | | | | | | | | | |
Total liabilities | | | | | | | | | 1,257,251 | |
| | | | | | | | | | |
Capital expenditure | | 4,060 | | 128,190 | | — | | | 132,250 | |
Depreciation | | 21,707 | | 236,396 | | — | | | 258,103 | |
City Telecom (H.K.) Limited
Consolidated financial statements for the year August 31, 2007
25 | Revenues and segmental information (continued) |
Although the Group’s two business segments are managed on a worldwide basis, they operate in two main geographical areas:
- Hong Kong
- Canada
| | - | Hong KongIn disclosing information on the basis of geographical segments, revenue and segment results are disclosed based on the geographical location of customers. Total assets and capital expenditure are disclosed based on the geographical location of the assets. |
| | - | CanadaThere were no sales between the geographical segments. |
| | | | | | | | | | | | | | | | | |
| | | 2009 | |
| | | | | | | Segment | | | Total | | | Capital | |
| | | Revenue | | | results | | | assets | | | expenditure | |
| | | HK$’000 | | | HK$’000 | | | HK$’000 | | | HK$’000 | |
| Hong Kong | | | 1,461,715 | | | | 264,859 | | | | 1,768,643 | | | | 286,193 | |
| Canada | | | 16,524 | | | | 287 | | | | 16,401 | | | | 541 | |
| | | | | | | | | | | | | |
| | | | | | | | | | | | | | | | | |
| | | | 1,478,239 | | | | 265,146 | | | | 1,785,044 | | | | 286,734 | |
| | | | | | | | | | | | | |
| | | | | | | | | | | | | | | | | |
| | | 2008 | |
| | | | | | | Segment | | | Total | | | Capital | |
| | | Revenue | | | results | | | assets | | | expenditure | |
| | | HK$’000 | | | HK$’000 | | | HK$’000 | | | HK$’000 | |
| Hong Kong | | | 1,281,069 | | | | 157,485 | | | | 2,040,496 | | | | 211,482 | |
| Canada | | | 21,912 | | | | 1,035 | | | | 13,585 | | | | 202 | |
| | | | | | | | | | | | | |
| | | | | | | | | | | | | | | | | |
| | | | 1,302,981 | | | | 158,520 | | | | 2,054,081 | | | | 211,684 | |
| | | | | | | | | | | | | | |
| Unallocated assets | | | | | | | | | | | 26,335 | | | | | |
| | | | | | | | | | | | | | | | |
| | | | | | | | | | | | | | | | | |
| Total assets | | | | | | | | | | | 2,080,416 | | | | | |
| | | | | | | | | | | | | | | | |
In presenting information on the basis of geographical segments, revenue and segment results are based on the geographical location of customers. Total assets and capital expenditure are based on the geographical location of the assets.F-16
There were no sales between the geographical segments.
| | | | | | | | |
| | | August 31, 2005 |
| | | Revenue | | Total assets | | Capital expenditure | | Fixed assets, net |
| | | HK$’000 | | HK$’000 | | HK$’000 | | HK$’000 |
Hong Kong | | 1,138,821 | | 2,337,793 | | 418,981 | | 1,332,172 |
Canada | | 23,238 | | 9,100 | | 145 | | 4,371 |
| | | | | | | | |
| | 1,162,059 | | 2,346,893 | | 419,126 | | 1,336,543 |
| | | | | | | | |
Unallocated assets | | | | 535 | | | | |
| | | | | | | | |
| | | | 2,347,428 | | | | |
| | | | | | | | |
| |
| | | August 31, 2006 |
| | | Revenue | | Total assets | | Capital expenditure | | Fixed assets, net |
| | | HK$’000 | | HK$’000 | | HK$’000 | | HK$’000 |
Hong Kong | | 1,114,452 | | 2,114,018 | | 321,708 | | 1,362,359 |
Canada | | 20,424 | | 9,850 | | 1,227 | | 4,875 |
| | | | | | | | |
| | 1,134,876 | | 2,123,868 | | 322,935 | | 1,367,234 |
| | | | | | | | |
Unallocated assets | | | | 347 | | | | |
| | | | | | | | |
| | | | 2,124,215 | | | | |
| | | | | | | | |
City Telecom (H.K.) Limited
Consolidated financial statements for the year August 31, 2007
252 | Revenues | Revenue and segmentalsegment information (continued) |
(b) | Geographical segments (continued) |
| | | | | | | | |
| | | August 31, 2007 |
| | | Revenue | | Total assets | | Capital expenditure | | Fixed assets, net |
| | | HK$’000 | | HK$’000 | | HK$’000 | | HK$’000 |
Hong Kong | | 1,120,538 | | 2,149,728 | | 132,031 | | 1,233,100 |
Canada | | 20,732 | | 11,405 | | 219 | | 4,123 |
| | | | | | | | |
| | 1,141,270 | | 2,161,133 | | 132,250 | | 1,237,223 |
| | | | | | | | |
Unallocated assets | | | | — | | | | |
| | | | | | | | |
| | | | 2,161,133 | | | | |
| | | | | | | | |
| (c) | | Hong Kong Broadband Network Limited (“HKBN”), a wholly-owned subsidiary of the Group, asCompany, is a FTNSFixed Telecommunications Network Services (“FTNS”) licensee and provides interconnection services to enable delivery of telecommunications service to customers of different operators. Since the FTNS license was granted by the Telecommunication Authority (“TA”) and interconnection services have been provided, in accordance with the FTNS license granted by the Telecommunications Authority (the “TA”), HKBN has been billing mobile operators for the interconnection services provided to them and recognizing revenue (“mobile interconnection charges”) based on management’s best estimate of the amounts it expected to collect. Abe collected. In prior years, majority of the mobile operators however, rejected HKBN’s demand for payment.payment of the mobile interconnection charges. As a result of non-payment by certain mobile operators, in 2004, the Group askedrequested the TA to make a determination (the “Determination”“2004 Determination”) on the level of mobile and fixed interconnection charges payable by one of the mobile operators (“mobile operator under dispute”) to HKBN; and the effective date of the determined mobile interconnection charges. |
|
| | In June 2007, TA issued the 2004 Determination which set out the rates of mobile interconnection charge payable by the mobile operator under dispute for interconnection services provided by HKBN for the period from April 1, 2002 to August 31, 2004 and the mobile operator under dispute paid mobile interconnection charge for the relevant period accordingly. |
|
| | Subsequent to June 2007, HKBN entered into contractual agreements with several mobile operators which agreed to pay mobile interconnection charges based on the 2004 Determination for the period from April 1, 2002 to August 31, 2004 and with respect to the period after August 31, 2004 at the interim rate stated in the contractual agreements. The interim rate is subject to adjustment based on further determination to be issued by the TA. |
|
| | In February 2008, since certain mobile operators had still not yet settled their mobile interconnection charges for interconnection services provided by HKBN, HKBN requested TA to make a new determination on the rate of mobile interconnection charge and interest thereon with those operators. |
|
| | In September 2008, TA indicated that it accepted HKBN’s request for determination on the rate of mobile interconnection charges for the period from April 1, 2002 to April 26, 2009 payable by the mobile operators that have not reached contractual agreements with HKBN, and the rate for the period from September 1, 2004 to April 26, 2009 payable by those mobile operators that have reached contractual agreements with HKBN, and the interest rate thereon (the “2008 Determination”). As at August 31, 2009, the 2008 Determination was still in progress. |
|
| | For the year ended August 31, 2009, the Group recognized revenue related to mobile interconnection charges of HK$20,558,000 (2008: HK$29,568,000) representing the amount of mobile interconnection charges management expects to collect. |
|
| 3 | | Network costs |
|
| | Network costs mainly include interconnection charges paid to local and overseas carriers, leased line rentals, program fees, and production costs for the IP-TV service, and do not include depreciation charge which is included in other operating expenses. |
|
| | The Group estimates the Universal Services Contributions (“USC”) payable to PCCW-HKT to fund the costs of network development in remote areas in Hong Kong and includes such estimated costs as part of the network costs. TA periodically reviews that actual costs of such developments and revises the amounts owed to PCCW-HKT or to be refunded by PCCW-HKT to the USC contributing parties. |
|
| | On December 28, 2007, TA issued a statement (the “2007 TA Statement”) on the USC and confirmed the actual contribution level for the period from January 1, 2005 to June 30, 2007. Based on the 2007 TA Statement, HK$7,617,000 was recorded as a reduction against the network costs of the Group for the year ended August 31, 2008. |
|
| | On April 8, 2009, TA issued a statement (the “2009 TA Statement”) on the USC and confirmed the actual contribution level for the period from July 1, 2007 to June 30, 2008. Based on the 2009 TA Statement, no additional payment or refund of USC from PCCW-HKT was required. |
|
| | The actual contribution level for the period subsequent to June 30, 2008 has not yet been confirmed by TA. |
In November 2005, HKBN entered into a contractual agreement with one of the mobile operators, which agreed to pay mobile interconnection charges at an interim rate. The final rate to be paid by this mobile operator was subject to adjustment based on the Determination to be issued by the TA.F-17
In March 2006, the TA issued a preliminary analysis (the “2006 PA”) on the Determination with respect to the rates of mobile interconnection charges payable by the mobile operator under dispute and the timing of the Determination. The final level of mobile interconnection charges was still subject to the Determination by the TA as of August 31, 2006.
For the year ended August 31, 2005, the Group recognized revenue for mobile interconnection charges of HK$24,703,000, based on the Group’s best estimate of the amount it expected to collect. For the year ended August 31, 2006, the Group recognized mobile interconnection charges of HK$22,037,000 based on the 2006 PA.
City Telecom (H.K.) Limited
Consolidated financial statements for the year August 31, 2007
254 | Revenues and segmental information (continued) | Profit before taxation |
|
| | Profit before taxation is arrived at after charging/(crediting) the following: |
In March 2007, TA issued a revised preliminary analysis (the “2007 PA”) which superseded the 2006 PA. The 2007 PA set out the rates of mobile interconnection charges, which are different from those rates stated in the 2006 PA.
In June 2007, TA issued a final determination (the “Final Determination”) which set out the rates of mobile interconnection charges payable by the mobile operator under dispute, which approximate the rates stated in the 2007 PA.
For the year ended August 31, 2007, the Group recognized revenue for mobile interconnection charges of HK$40,877,000 based on the rates set forth in the Final Determination. The amount recognized includes charges for the fiscal year ended August 31, 2007 and additional charges for the years ended August 31, 2005 and 2006 in excess of amounts previously recognized based on the 2006 PA. As a result of the Final Determination, the Group has also reversed a portion of a previously recognized bad debt provision for mobile interconnection charges receivables of HK$9,404,000 to the consolidated statement of operations (note 7(a)(ii)) based on the amount it expected to collect for billings outstanding through that date.
Exposure to credit, liquidity, interest rate and currency risks arises in the normal course of the Group’s business. These risks are limited by the Group’s financial management policies and practices described below.
The Group’s credit risk is primarily attributable to trade and other receivables, investments securities, derivative financial instruments and term bank deposits. Management has a credit policy in place and the exposure to credit risk is monitored on an ongoing basis. The maximum exposure to credit risk is represented by the carrying amount of financial asset, including derivative financial instruments. Except for the financial guarantee issued by the Group as disclosed in note 14(d), the Group does not provide any other guarantees which expose the Group to credit risk.
In respect of trade receivables, credit evaluations are performed on all customers requiring credit over a certain amount. Trade receivables are generally due within 30 days from the date of billing. Subscribers with receivables that are more than 3 months overdue are requested to settle all outstanding balances before any further credit is granted. The Group generally does not obtain collateral from customers.
Cash deposits and transactions involving derivative financial instruments with counterparties are placed or limited to high credit-quality financial institutions. The Group has policies that limit the amount of credit exposure to any financial institution. Given the high credit ratings of these financial institutions, management does not expect any of the financial institutions not to meet their obligations.
City Telecom (H.K.) Limited
Consolidated financial statements for the year August 31, 2007
26 | Financial instruments (continued) |
Management is responsible for the cash management of the Group, including the short term investment of cash surplus and the raising of funds to cover expected cash demands. Management regularly monitors current and expected liquidity requirements and compliance with lending covenants to ensure the Group maintains sufficient cash, readily realizable marketable securities and has adequate amount of committed credit facilities to meet the Group’s liquidity requirements in the short and long term.
The Group’s interest-rate risk arises mainly from its 10-year senior notes which bear interest at the fixed rate of 8.75% per annum. Details of the 10-year senior notes are disclosed in note 13.
All of the Group’s monetary assets and liabilities are primarily denominated in either Hong Kong dollars or United States dollars. Given the exchange rate of Hong Kong dollar to the U.S. dollar has been pegged at the rate of HK$7.8 = US$1.00 since 1983, management does not expect significant foreign exchange gains or losses between the Hong Kong dollar and the United States dollar.
The Group is exposed to a certain amount of foreign exchange risk in relation to fluctuations between the Hong Kong dollars and the Renminbi arising from its operations in the PRC. In order to limit this foreign currency risk exposure, the Group maintains Renminbi cash balance that approximates three months’ operating cash flows.
The carrying amount of trade receivables less impairment loss for doubtful debts and account payables approximate their fair values. The carrying value and the fair value of the Group’s investment securities, derivative financial instruments and the senior notes as at August 31, 2006 and 2007 are as follows:
| | | | | | | | | | | | | | |
| | | Note | | 2006 | | | 2007 | |
| | | | Carrying amount | | | Fair value | | | Carrying amount | | | Fair value | |
| | | | | HK$’000 | | | HK$’000 | | | HK$’000 | | | HK$’000 | |
Long-term bank deposit | | (a) | | 13,641 | | | 13,459 | | | 14,415 | | | 14,277 | |
Debt securities | | (b) | | 26,633 | | | 26,633 | | | 28,577 | | | 28,577 | |
Interest rate swap | | (c) | | 1,845 | | | 1,845 | | | 1,039 | | | 1,039 | |
8.75% senior notes | | (b) | | (948,027 | ) | | (722,081 | ) | | (952,593 | ) | | (970,125 | ) |
| | | | | | | | | | | | | | |
City Telecom (H.K.) Limited
Consolidated financial statements for the year August 31, 2007
26 | Financial instruments (continued) |
(e) | Fair values (continued) |
Notes:
| | (a) | The fair value of the long term bank deposit is based on issuer’s quoted market price. | Other operating expenses |
| | | | | | | | | |
| | | 2009 | | | 2008 | |
| | | HK$’000 | | | HK$’000 | |
| Advertising and marketing expenses | | | 299,794 | | | | 307,743 | |
| Amortization of deferred expenditure (note 15) | | | 53,160 | | | | 33,777 | |
| Auditors’ remuneration | | | 3,455 | | | | 3,687 | |
| Depreciation of owned fixed assets | | | 205,624 | | | | 209,464 | |
| Depreciation of fixed assets held under finance lease | | | 617 | | | | 587 | |
| Operating lease charges in respect of land and buildings | | | 17,010 | | | | 13,296 | |
| Operating lease charges in respect of equipment | | | 42 | | | | 50 | |
| Provision for doubtful debts (note 16(b)) | | | 12,103 | | | | 14,293 | |
| Loss on disposal of fixed assets | | | 1,016 | | | | 1,431 | |
| Staff costs (note 4(d)) | | | 302,279 | | | | 247,460 | |
| Others | | | 142,864 | | | | 134,306 | |
| | | | | | | |
| | | | | | | | | |
| | | | 1,037,964 | | | | 966,094 | |
| | | | | | | |
| | | | | | | | | |
| | | 2009 | | | 2008 | |
| | | HK$’000 | | | HK$’000 | |
| Interest income | | | (4,869 | ) | | | (15,596 | ) |
| Other income (note) | | | (36,671 | ) | | | (9,393 | ) |
| | | | | | | |
| | | | | | | | | |
| | | | (41,540 | ) | | | (24,989 | ) |
| | | | | | | |
| | |
| Note: | | Included in other income was the gain on extinguishment of the 10-year senior notes of HK$31,371,000 (2008: HK$2,582,000) for the year ended August 31, 2009. |
| | | | | | | | | |
| | | 2009 | | | 2008 | |
| | | HK$’000 | | | HK$’000 | |
| Interest element of finance leases | | | 27 | | | | 34 | |
| Interest on 10-year senior notes | | | 52,670 | | | | 70,010 | |
| Amortization of incidental issuance costs | | | 1,545 | | | | 1,665 | |
| Other borrowing cost | | | 885 | | | | 3,428 | |
| | | | | | | |
| | | | | | | | | |
| | | | 55,127 | | | | 75,137 | |
| | | | | | | |
| | | | | | | | | |
| | | 2009 | | | 2008 | |
| | | HK$’000 | | | HK$’000 | |
| Wages and salaries | | | 278,905 | | | | 226,097 | |
| Provision for annual leave | | | 613 | | | | 2,642 | |
| Equity settled share-based transaction | | | 4,768 | | | | 4,114 | |
| Retirement benefit costs — defined contribution plans (note 8) | | | 34,614 | | | | 29,738 | |
| Less: staff costs capitalized as fixed assets | | | (16,621 | ) | | | (15,131 | ) |
| | | | | | | |
| | | | | | | | | |
| | | | 302,279 | | | | 247,460 | |
| | | | | | | |
| | | Staff costs include directors’ emoluments and research and development cost of HK$10,824,000 (2008: HK$9,593,000) but exclude staff costs of HK$13,461,000 (2008: HK$14,482,000) recorded in network costs and HK$214,272,000 (2008: HK$194,724,000) recorded in advertising and marketing expenses. |
F-18
| 4 | | Profit before taxation (continued) |
| | | | | | | | | |
| | | 2009 | | | 2008 | |
| | | HK$’000 | | | HK$’000 | |
| Gain on extinguishment of 10-year senior notes (note 22(a)) | | | (31,371 | ) | | | (2,582 | ) |
| Net exchange gain | | | (3,038 | ) | | | (1,923 | ) |
| Realized and unrealized gain on other financial assets | | | (189 | ) | | | (3,284 | ) |
| Realized loss on derivative financial instruments | | | — | | | | 1,039 | |
| Realized gain on long-term bank deposit | | | — | | | | (1,185 | ) |
| | | | | | | |
| 5 | | Income tax (expense)/ benefit |
|
| | Hong Kong profits tax has been provided at the rate of 16.5% (2008: 16.5%) on the estimated assessable profit for the year. Taxation on overseas profits has been calculated on the estimated assessable profit for the year at the income tax rates prevailing in the overseas countries in which the Group operates. |
|
| | The fair valueamount of debt securitiesincome tax (expense)/ benefit in the consolidated income statement represents: |
| | | | | | | | | |
| | | 2009 | | | 2008 | |
| | | HK$’000 | | | HK$’000 | |
| Current taxation: | | | | | | | | |
| - Hong Kong profits tax | | | — | | | | (391 | ) |
| - Overseas taxation | | | (1,622 | ) | | | (1,929 | ) |
| - Under-provision of overseas taxation in prior years | | | — | | | | (2,552 | ) |
| Deferred taxation: | | | | | | | | |
| - Origination and reversal of temporary differences (note 21) | | | (37,108 | ) | | | (4,645 | ) |
| - Recognition of previously unrecognized tax losses (note 21) | | | — | | | | 26,335 | |
| | | | | | | |
| | | | | | | | | |
| Income tax (expense)/ benefit | | | (38,730 | ) | | | 16,818 | |
| | | | | | | |
| | The Group’s income tax (expense)/ benefit differs from the theoretical amount that would arise using profits before taxation at applicable tax rates as follows: |
| | | | | | | | | |
| | | 2009 | | | 2008 | |
| | | HK$’000 | | | HK$’000 | |
| Profit before taxation | | | 251,559 | | | | 108,372 | |
| | | | | | | |
| | | | | | | | | |
| Notional tax on profit before taxation, calculated at the prevailing tax rates applicable to profit in the countries concerned | | | (42,240 | ) | | | (18,927 | ) |
| Effect of gain on extinguishment of 10-year senior notes not subject to taxation | | | 5,176 | | | | 426 | |
| Effect of non-taxable income | | | 1,466 | | | | 3,452 | |
| Effect of non-deductible expenses | | | (3,648 | ) | | | (6,353 | ) |
| Effect of recognition of prior year unrecognized tax losses (note) | | | — | | | | 26,335 | |
| Effect of utilization of prior year unrecognized tax losses | | | 518 | | | | 12,013 | |
| Under-provision in prior years | | | — | | | | (2,552 | ) |
| Effect of share based payment | | | — | | | | 2,324 | |
| Effect of tax losses not recognized | | | — | | | | (74 | ) |
| Others | | | (2 | ) | | | 174 | |
| | | | | | | |
| | | | | | | | | |
| Income tax (expense)/ benefit | | | (38,730 | ) | | | 16,818 | |
| | | | | | | |
| | |
| Note: | | Management projects future taxable income by considering all available information, including tax planning strategies, historical taxable income, and the 8.75% senior notesexpiration period of the unused tax losses carry forwards of each of the Company and its subsidiaries. During the year ended August 31, 2008, taking into consideration of the results of operations, management assessed that it is based on quoted market pricesprobable that sufficient future taxable profits will be generated to utilize the unused tax losses of HK$159,606,000 which resulted in the recognition of deferred tax assets of HK$26,335,000. |
F-19
| 6 | | Dividends |
|
| (a) | | Dividends payable to equity shareholders of the Company attributable to the year |
| | | | | | | | | |
| | | 2009 | | | 2008 | |
| | | HK$’000 | | | HK$’000 | |
| Interim dividend declared and paid of HK3 cents per ordinary share (2008: HK4 cents per ordinary share) | | | 19,904 | | | | 25,602 | |
| Final dividend proposed after the balance sheet date, of 16 cents per ordinary share (2008: HK2 cents per ordinary share) | | | 106,269 | | | | 13,012 | |
| | | | | | | |
| | | | | | | | | |
| | | | 126,173 | | | | 38,614 | |
| | | | | | | |
| | The final dividend proposed after the balance sheet date has not been recognized as a liability at the balance sheet date. |
|
| (b) | | Dividends attributable to the previous financial year, approved and paid during the year: |
| | | | | | | | | |
| | | 2009 | | | 2008 | |
| | | HK$’000 | | | HK$’000 | |
| Final dividend in respect of the financial year ended August 31, 2008, approved and paid of HK2 cents per ordinary share (2008: HK4 cents per ordinary share in respect of financial year ended August 31, 2007) | | | 13,014 | | | | 25,082 | |
| | | | | | | |
| | (c) | The fair value of the interest rate swap is the estimated amount that the Group would receive or pay to terminate the swap at the balance sheet, taking into account current interest rates and the current creditworthiness of the counterparties. |
(a) | During the year ended August 31, 2004,2009, a scrip dividend option was offered to all shareholders excluding shareholders with registered addresses outside Hong Kong Broadband Network (“HKBN”), a subsidiarywho were entitled to the final dividend in respect of the Company entered into two agreements with a third party (the “Contract Party 1”). Pursuant to first agreement (“First Agreement”), the Contract Party 1 agreed to sell to HKBN an telecommunications facility (the “Facility”) for cash consideration of approximately HK$42.4 million (the “Facility Consideration”), which was paid by HKBNfinancial year ended August 31, 2008. 12,212,142 shares were issued during the year ended August 31, 2004. In conjunction with2009 to the First Agreement, HKBN also entered intoshareholders who had elected to receive all or part of their entitlement to dividends in the form of scrip. |
|
| 7 | | Earnings per share |
| | | | | | | | | |
| | | 2009 | | | 2008 | |
| | | HK$’000 | | | HK$’000 | |
| Profit attributable to shareholders | | | 212,829 | | | | 125,190 | |
| | | | | | | |
| | Weighted average number of ordinary shares |
| | | | | | | | | |
| | | 2009 | | | 2008 | |
| | | Number | | | Number | |
| | | of shares | | | of shares | |
| | | ’000 | | | ’000 | |
| Issued ordinary shares at the beginning of the year | | | 650,622 | | | | 616,503 | |
| Effect of scrip dividend issued | | | 6,256 | | | | 7,353 | |
| Effect of share options exercised | | | 329 | | | | 10,159 | |
| Effect of shares repurchased and cancelled | | | (6 | ) | | | — | |
| | | | | | | |
| | | | | | | | | |
| Weighted average number of ordinary shares at the end of the year (basic) | | | 657,201 | | | | 634,015 | |
| Incremental shares from assumed exercise of share options | | | 11,183 | | | | 23,982 | |
| | | | | | | |
| | | | | | | | | |
| Weighted average number of ordinary shares at the end of the year (diluted) | | | 668,384 | | | | 657,997 | |
| | | | | | | |
| | | | | | | | | |
| Basic earnings per share | | HK32.4 | cents | | HK19.7 | cents |
| | | | | | | |
| | | | | | | | | |
| Diluted earnings per share | | HK31.8 | cents | | HK19.0 | cents |
| | | | | | | |
F-20
| 8 | | Retirement benefit costs |
|
| | The Group contributes to an operationsOccupational Retirement Scheme (the “ORSO Scheme”), a defined contribution retirement scheme, which is available to some of its employees in Hong Kong. Under the ORSO Scheme, the employees are required to contribute 5% of their monthly salaries, while the Group’s contributions are calculated at 10% and maintenance agreement with5% of the Contract Party 1 formonthly salaries of senior management staff and all other staff respectively. The employees are entitled to 100% of the provisionemployer’s contributions after 10 years of ongoing operations and maintenance services for the Facilitycompleted service, or at a feereduced scale after completion of approximately3 to 9 years’ service. Contributions to the ORSO Scheme are reduced by contributions forfeited by those employees who leave the ORSO Scheme prior to vesting fully in the Group’s contributions. |
|
| | A mandatory provident fund scheme (the “MPF Scheme”) has been established under the Hong Kong Mandatory Provident Fund Scheme Ordinance in December 2000. The then existing employees of the Group in Hong Kong could elect to join the MPF Scheme, while all new employees joining the Group in Hong Kong from then onwards are required to join the MPF Scheme. Both the Group and the employees are required to contribute 5% of each individual’s relevant income with a maximum amount of HK$1 million1,000 per annum, commencing September 1, 2007 onwards.month as a mandatory contribution. Employer’s mandatory contributions are 100% vested in the employees as soon as they are paid to the MPF Scheme. Senior employees may also elect to join a Mutual Voluntary Plan (the “Mutual Plan”) in which both the Group and the employee, on top of the MPF Scheme mandatory contributions, make a voluntary contribution to the extent of contributions that would have been made under the ORSO Scheme. |
|
| | Pursuant to the relevant regulations in People’s Republic of China (the “PRC”), the Group contributes to a defined contribution retirement scheme organized by the local social security bureau for each employee of the subsidiary in PRC at the rate of 20% of a standard salary base as determined by the local social security bureau. The Group has no other obligation to make payments in respect of retirement benefits of these employees. |
|
| | The retirement schemes for staff of the Group in other countries follow the local statutory requirements of the respective countries. |
|
| | The aggregate employer’s contributions, net of forfeited contributions, which have been dealt with in the consolidated income statement during the year are as follows: |
A second agreement (“Second Agreement”) was entered into on the same date by both parties whereby HKBN agree to provide certain telecommunications services to the Contract Party 1 (the “Services”) for an amount equal to the unit service charges specified in the Second Agreement. The Contract Party 1 is required to pay to HKBN a guarantee minimum service fee of approximately HK$42.4 million over a period of three years, commencing September 1, 2004. A prepayment of the service charges of HK$36.5 million (the “Prepaid Charges”) was paid by the Contract Party 1 to HKBN during the year ended August 31, 2004.
The directors of the Group made an assessment of the fair values of the goods and services exchanged and concluded that no fair values could be assigned to them. Accordingly, the Facility was not recognized as an asset and no revenue or deferred revenue was recognized in the consolidated financial statements as at and for any of the periods presented. The difference between the Facility Consideration and the Prepaid Charges, amounting to approximately HK$5.9 million, was included in long-term receivable balance, and other receivables, deposits and prepayments as at August 31, 2006 and 2007 respectively. In accordance with the terms of agreement, the unpaid portion of the HK$42.2 million guarantee minimum service fee, amounting to approximately HK$5.9 million has been billed to the Contract Party 1 upon the end of service period on September 1, 2007.
City Telecom (H.K.) Limited
Consolidated financial statements for the year August 31, 2007
| | | | | | | | | |
| | | 2009 | | | 2008 | |
| | | HK$’000 | | | HK$’000 | |
| Gross contributions | | | 34,614 | | | | 29,738 | |
| | | | | | | |
27 | Barter transaction (continued) | At August 31, 2009, there was no forfeited contribution available to offset future contributions by the Group to the ORSO Scheme (2008: Nil). |
|
| 9 | | Directors’ and senior management’s emoluments |
|
(b)(a) | | Directors’ remunerationDuring |
|
| | The remuneration of each director for the year ended August 31, 2005, HKBN entered into an agreement with a third party (“the Contract Party 2”). Pursuant to the agreement:2009 is set out below: |
| | | | | | | | | | | | | | | | | | | | | | | | | |
| | | | | | | | | | | | | | | | | | | Employer’s | | | | |
| | | | | | | | | | | | | | | | | | | contribution | | | | |
| | | | | | | | | | | | | | | | | | | to defined | | | | |
| | | | | | | Discretionary | | | Share-based | | | contribution | | | | |
| Name of director | | Fee | | | Salary | | | bonuses | | | payment | | | scheme | | | Total | |
| | | HK$’000 | | | HK$’000 | | | HK$’000 | | | HK$’000 | | | HK$’000 | | | HK$’000 | |
| Wong Wai Kay, Ricky | | | — | | | | 6,712 | | | | 1,500 | | | | 193 | | | | 670 | | | | 9,075 | |
| Cheung Chi Kin, Paul | | | — | | | | 6,714 | | | | 1,500 | | | | 193 | | | | 670 | | | | 9,077 | |
| Yeung Chu Kwong, William | | | — | | | | 7,049 | | | | 1,000 | | | | 1,764 | | | | 456 | | | | 10,269 | |
| Lai Ni Quiaque | | | — | | | | 2,403 | | | | 550 | | | | 1,141 | | | | 240 | | | | 4,334 | |
| Cheng Mo Chi, Moses | | | 160 | | | | — | | | | — | | | | — | | | | — | | | | 160 | |
| Lee Hon Ying, John | | | 176 | | | | — | | | | — | | | | — | | | | — | | | | 176 | |
| Chan Kin Man | | | 165 | | | | — | | | | — | | | | — | | | | — | | | | 165 | |
| Peh Jefferson Tun Lu | | | 165 | | | | — | | | | — | | | | — | | | | — | | | | 165 | |
| | | | | | | | | | | | | | | | | | | |
| | | | | | | | | | | | | | | | | | | | | | | | | |
| Total | | | 666 | | | | 22,878 | | | | 4,550 | | | | 3,291 | | | | 2,036 | | | | 33,421 | |
| | | | | | | | | | | | | | | | | | | |
F-21
| 9 | | Directors’ and senior management’s emoluments (continued) |
|
| (a) | | Directors’ remuneration (continued) |
|
| | The remuneration of each director for the year ended August 31, 2008 is set out below: |
| | | | | | | | | | | | | | | | | | | | | | | | | |
| | | | | | | | | | | | | | | | | | | Employer’s | | | | |
| | | | | | | | | | | | | | | | | | | contribution | | | | |
| | | | | | | | | | | | | | | | | | | to defined | | | | |
| | | | | | | Discretionary | | | Share-based | | | contribution | | | | |
| Name of director | | Fee | | | Salary | | | bonuses | | | payment | | | scheme | | | Total | |
| | | HK$’000 | | | HK$’000 | | | HK$’000 | | | HK$’000 | | | HK$’000 | | | HK$’000 | |
| Wong Wai Kay, Ricky | | | — | | | | 6,482 | | | | 1,054 | | | | 558 | | | | 648 | | | | 8,742 | |
| Cheung Chi Kin, Paul | | | — | | | | 6,482 | | | | 1,054 | | | | 558 | | | | 648 | | | | 8,742 | |
| Lai Ni Quiaque | | | — | | | | 2,250 | | | | 225 | | | | 809 | | | | 225 | | | | 3,509 | |
| Cheng Mo Chi, Moses | | | 152 | | | | — | | | | — | | | | — | | | | — | | | | 152 | |
| Lee Hon Ying, John | | | 168 | | | | — | | | | — | | | | — | | | | — | | | | 168 | |
| Chan Kin Man | | | 158 | | | | — | | | | — | | | | — | | | | — | | | | 158 | |
| Peh Jefferson Tun Lu | | | 158 | | | | — | | | | — | | | | — | | | | — | | | | 158 | |
| | | | | | | | | | | | | | | | | | | |
| | | | | | | | | | | | | | | | | | | | | | | | | |
| Total | | | 636 | | | | 15,214 | | | | 2,333 | | | | 1,925 | | | | 1,521 | | | | 21,629 | |
| | | | | | | | | | | | | | | | | | | |
| | (i) | HKBNNo director waived any emoluments in respect of the years ended August 31, 2008 and 2009. |
|
| | The share-based payment represents the Contract Party 2 agreedexpenses determined based on the fair value of share options granted to make available certain telecommunications services (the “Services Component”)directors under the Company’s share option scheme. Fair value of share options is estimated in accordance with the Group’s significant accounting policies in note 1. The details of the benefits in kind are disclosed in note 10. |
|
| (b) | | Five highest paid individuals |
|
| | The five individuals whose emoluments were the highest in the Group for the year include four (2008: three) directors whose emoluments are reflected in the analysis presented above. The emoluments payable to each other on a barter basis for no consideration for a period of ten years, commencing January 1, 2005.the remaining one (2008: two) individual during the year are as follows: |
| | | | | | | | | |
| | | 2009 | | | 2008 | |
| | | HK$’000 | | | HK$’000 | |
| Basic salaries, other allowances and benefits in kind | | | 2,515 | | | | 8,512 | |
| Discretionary bonuses | | | 150 | | | | 1,137 | |
| Share-based payments | | | 332 | | | | 1,316 | |
| Retirement benefit costs – defined contribution plans | | | 106 | | | | 589 | |
| | | | | | | |
| | | | | | | | | |
| | | | 3,103 | | | | 11,554 | |
| | | | | | | |
| | (ii) | HKBN agreedThe emoluments fell within the following band: |
| | | | | | | | |
| | Number of individual | |
| | 2009 | | | 2008 | |
| HK$2,500,001 – HK$3,000,000 | | | — | | | | 1 | |
| HK$3,000,001 – HK$4,000,000 | | | 1 | | | | — | |
| HK$9,000,001 – HK$10,000,000 | | | — | | | | 1 | |
F-22
| 10 | | Equity settled share-based transactions |
|
| | The Company operates a share option scheme (the “2002 Share Option Scheme”) which was adopted by shareholders of the Company on December 23, 2002 whereby the directors may, at their discretion, invite eligible participants to provide network capacityreceive options to subscribe for shares subject to the Contract Party 2terms and conditions stipulated therein. |
|
| | Under the 2002 Share Option Scheme, the Company may grant options to employees (including executive, non-executive and independent non-executive directors), suppliers and professional advisers to subscribe for shares of the Company. The maximum number of options authorized under the 2002 Share Option Scheme may not, when aggregated with any shares subject to any other executive and employee share option scheme, exceed 10% of the Company’s issued share capital on the date of adoption. The exercise price of the option is determined by the Company’s board of directors at a price not less than the highest of (a) the par value of a share; (b) the average closing price of the Company’s shares for five trading days preceding the grant date; and (c) the closing price of the Company’s shares on the date of grant. The 2002 Share Option Scheme is valid and effective for a service termten year period up to December 22, 2012 subject to earlier termination by the Company by resolution in general meeting or by the board of fifteendirectors. The period during which the option may be exercised will be determined by the board of directors at its discretion, save that no option may be exercised after more than ten years from the respective activationdate of grant. |
|
| (a) | | The terms and conditions of the relevant network capacity, and, in exchange,options |
|
| | Options that existed during the Contract Party 2 agreed to provide HKBN the right to use telecommunications facilities (the “Capacity Component”) for a termyear ended August 31, 2009 are as follows, whereby all options are settled by physical delivery of fifteen years from the respective activation of the relevant facilities. The transaction was entered into on a barter basis with no consideration being exchanged.shares: |
The Directors of the Group made an assessment and concluded that since the Services Component and Capacity Component involve an exchange of services of a similar nature and value, the exchange is not regarded as a transaction which generates revenue. Accordingly, both components have not been recognized as an asset or expense and no revenue or deferred revenue was recognized in the financial statements of the Group since inception of the agreement.
28 | New effective standards/recent accounting pronouncements | | | | | | | | | | | |
(a) | | HKFRSsNumber | | | Vesting | | | Exercisable | |
Up to the date of issuance of the accompanying consolidated financial statements, the HKICPA has issued a number of amendments, new standards and interpretations which are not yet effective for the year ended August 31, 2007 and which have not been adopted in the accompanying consolidated financial statements.
The Group is in the process of making an assessment of what the impact of these amendments, new standards and new interpretations is expected to be in the period of initial application. So far it has concluded that the adoption of the following developments may result in new or amended disclosure in its consolidated financial statements:
| | of option | | | conditions | | | period | |
2002 Share Option Scheme | | | | | | | | | | | | |
| | | | | | | | | | | | | |
Options granted to directors: | | | | | | | | | | | | |
| | | | | | | | | | | | |
| -January 5, 2005 | | | 16,183,208 | | | Condition 1 | | On or prior to October 20, 2014 |
| -May 22, 2006 | | | 15,178,466 | | | Condition 1 | | On or prior to May 21, 2016 |
| -February 6, 2008 | | | 6,044,791 | | | Condition 3 | | On or prior to December 23, 2012 |
| -February 11, 2008 | | | 6,044,791 | | | Condition 2 | | On or prior to December 23, 2012 |
| | | | | | | | | | | | |
Options granted to employees: | | | | | | | | | | | | |
| | | | | | | | | | | | |
| -October 21, 2004 | | | 7,606,712 | | | Condition 1 | | On or prior to October 20, 2014 |
| -May 22, 2006 | | | 7,314,455 | | | Condition 1 | | On or prior to May 21, 2016 |
| -August 3, 2006 | | | 40,540 | | | Condition 1 | | On or prior to August 2, 2016 |
| -November 22, 2006 | | | 136,545 | | | Condition 1 | | On or prior to November 14, 2016 |
| -February 15, 2008 | | | 1,007,465 | | | Condition 3 | | On or prior to December 23, 2012 |
| -March 11, 2008 | | | 302,240 | | | Condition 1 | | On or prior to December 23, 2012 |
| -May 2, 2008 | | | 1,007,465 | | | Condition 3 | | On or prior to December 23, 2012 |
| | | | | | | | | | | |
| | | | | | | | | | | | |
Total share options | | | 60,866,678 | | | | | | | | | |
| | | | | | | | | | | |
F-23
| 10 | | Equity settled share-based transactions (continued) |
|
Effective(a) | | The terms and conditions of the options (continued) |
|
| | Options that existed during the year ended August 31, 2008 are as follows, whereby all options are settled by physical delivery of shares: |
| | | | | | | | | | | | |
| | Number | | | Vesting | | | Exercisable | |
| | of option | | | conditions | | | period | |
2002 Share Option Scheme | | | | | | | | | | | | |
| | | | | | | | | | | | |
Options granted to directors: | | | | | | | | | | | | |
| | | | | | | | | | | | |
| -June 3, 2004 | | | 6,000,000 | | | Condition 1 | | On or prior to June 2, 2014 |
| -January 5, 2005 | | | 16,106,956 | | | Condition 1 | | On or prior to October 20, 2014 |
| -May 22, 2006 | | | 15,093,585 | | | Condition 1 | | On or prior to May 21, 2016 |
| -February 11, 2008 | | | 6,016,309 | | | Condition 2 | | On or prior to December 23, 2012 |
| | | | | | | | | | | | |
Options granted to employees: | | | | | | | | | | | | |
| | | | | | | | | | | | |
| -October 21, 2004 | | | 8,393,399 | | | Condition 1 | | On or prior to October 20, 2014 |
| -October 3, 2005 | | | 1,000,000 | | | Condition 1 | | On or prior to September 30, 2015 |
| -May 22, 2006 | | | 14,012,937 | | | Condition 1 | | On or prior to May 21, 2016 |
| -July 3, 2006 | | | 702,769 | | | Condition 1 | | On or prior to July 2, 2016 |
| -August 3, 2006 | | | 70,468 | | | Condition 1 | | On or prior to August 2, 2016 |
| -November 22, 2006 | | | 200,902 | | | Condition 1 | | On or prior to November 14, 2016 |
| -May 23, 2007 | | | 100,396 | | | Condition 1 | | On or prior to June 11, 2017 |
| -December 12, 2007 | | | 1,003,956 | | | Condition 1 | | On or prior to December 23, 2012 |
| -February 6, 2008 | | | 6,016,309 | | | Condition 3 | | On or prior to December 23, 2012 |
| -February 15, 2008 | | | 4,010,873 | | | Condition 3 | | On or prior to December 23, 2012 |
| -March 11, 2008 | | | 300,816 | | | Condition 1 | | On or prior to December 23, 2012 |
| -May 2, 2008 | | | 1,002,718 | | | Condition 3 | | On or prior to December 23, 2012 |
| | | | | | | | | | | |
| | | | | | | | | | | | |
Total share options | | | 80,032,393 | | | | | | | | | |
| | | | | | | | | | | |
| | The vesting conditions of the respective share option grant are as follows: |
|
| | Condition 1 |
|
| | Options granted will be vested in one year or evenly vested over a period of two to three years. Options are awarded without performance conditions and are exercisable provided the participants have remained employed by the end of respective vesting periods. |
|
| | Condition 2 |
|
| | Vesting of the options is conditional upon the market price of the Company’s shares reaching a target level over the period from the close of trading in Hong Kong on November 22, 2007 to November 21, 2010. Options granted are vested immediately or evenly over a period of three years from the date of fulfillment of the market condition. |
|
| | Condition 3 |
|
| | Vesting of the options is conditional upon the performance of the participants. Options granted are vested over a period of three to four years from the date of fulfillment of the performance condition. |
F-24
| 10 | | Equity settled share-based transactions (continued) |
|
| (b) | | The number and weighted average exercise prices of share options are as follows: |
| | | | | | | | | | | | | | | | | |
| | | 2009 | | | 2008 | |
| | | Weighted | | | | | | | Weighted | | | | |
| | | average | | | | | | | average | | | | |
| | | exercise | | | Number of | | | exercise | | | Number of | |
| | | price | | | options | | | price | | | options | |
| | | HK$ | | | | | | | HK$ | | | | | |
2002 Share Option Scheme | | | | | | | | | | | | | | | | |
| | | | | | | | | | | | | | | | | |
| Outstanding at the beginning of the year | | | 1.27 | | | | 60,581,214 | | | | 1.09 | | | | 61,350,000 | |
| Adjustment to number of options for 2007 Final Dividend (note (i)) | | | — | | | | — | | | | 1.10 | | | | 204,922 | |
| Adjustment to number of options for 2008 Interim Dividend (note (ii)) | | | — | | | | — | | | | 1.28 | | | | 177,471 | |
| Adjustment to number of options for 2008 Final Dividend (note (iii)) | | | 1.27 | | | | 285,464 | | | | — | | | | — | |
| Granted during the year | | | — | | | | — | | | | 1.84 | | | | 18,300,000 | |
| Exercised during the year | | | 0.99 | | | | (1,416,005 | ) | | | 1.07 | | | | (14,052,268 | ) |
| Lapsed during the year | | | 1.65 | | | | (483,442 | ) | | | 1.63 | | | | (5,398,911 | ) |
| | | | | | | | | | | | | | | |
| | | | | | | | | | | | | | | | | |
| Outstanding at the end of the year | | | 1.27 | | | | 58,967,231 | | | | 1.27 | | | | 60,581,214 | |
| | | | | | | | | | | | | | | |
| | | | | | | | | | | | | | | | | |
| Exercisable at the end of the year | | | 1.12 | | | | 45,849,756 | | | | 1.22 | | | | 36,463,198 | |
| | | | | | | | | | | | | | | |
| | The weighted average share price at the date of exercise for
accounting periods
beginning on or after the share options exercised during the year was HK$0.99 (2008: HK$1.07). |
|
| | The options outstanding at August 31, 2009 had a weighted exercise price of HK$1.27 (2008: HK$1.27) and a weighted average remaining contractual life of 5 years (2008: 7 years). |
Notes:
| | |
Amendments(i) | | As a result of allotment of 11,227,213 new shares to HKAS shareholders who elected to receive the 2007 Final Dividend in shares on February 4, 2008, the exercise price of and the number of share subject to the 51,805,000 share options outstanding on December 21, 2007 (being the Record Date for determining the entitlement of 2007 Final Dividend) were adjusted pursuant to the 2002 Share Option Scheme with effect from February 4, 2008. |
|
| (ii) | | As a result of allotment of 8,838,938 new shares to shareholders who elected to receive the 2008 Interim Dividend in shares on July 23, 2008, the exercise price of and the number of share subject to the 65,296,047 share options outstanding on June 6, 2008 (being the Record Date for determining the entitlement of 2008 Interim Dividend) were adjusted pursuant to the 2002 Share Option Scheme with effect from July 23, 2008. |
|
| (iii) | | As a result of allotment of 12,212,142 new shares to shareholders who elected to receive the 2008 Final Dividend in shares on February 25, 2009, the exercise price of and the number of share subject to the 60,299,426 share options outstanding on December 19, 2008 (being the Record Date for determining the entitlement of 2008 Final Dividend) were adjusted pursuant to the 2002 Share Option Scheme with effect from February 25, 2009. |
| (c) | | Fair value of share options and assumptions |
|
| | In determining the value of the share options granted, the Black-Scholes Model has been used except for the option granted on February 11, 2008 which has adopted the Monte Carlo Model. Both models are one of the most generally accepted methodologies used to calculate the value of options. The variables of the models include expected life of the options, risk-free interest rate, expected volatility and expected dividend of the shares of the Company. |
|
| | Both models require input of highly subjective assumptions, including the expected stock volatility. Since the Company’s share options have characteristics significantly different from those of traded options, changes in subjective inputs may materially affect the estimated fair value of the options granted. |
F-25
| | | | |
| | HK$’000 | |
Cost and carrying amount: | | | | |
| At August 31, 2009/2008 | | | 1,066 | |
| | | |
| | Impairment tests for cash-generating units containing goodwill |
|
| | Goodwill is allocated to the Group’s cash-generating units (“CGU”) identified according to country of operation and business segment as follows: |
| | | | | | | | | |
| | | 2009 | | | 2008 | |
| | | HK$’000 | | | HK$’000 | |
| Fixed telecommunications network service segment | | | 1,066 | | | | 1,066 | |
| | | | | | | |
| | The recoverable amount of the CGU exceeds its carrying amount. The recoverable amount of the CGU is determined based on value-in-use calculations. These calculations use cash flow projections based on financial budgets approved by management covering a five-year period. Cash flows for the five-year period are estimated based on average growth rates of 15% and a pre-tax discount rate of 18%. Cash flows beyond the five year period are assumed to remain constant. The estimated growth rates used are comparable to the growth rate for the industry. |
|
| | The key assumption used in the value-in-use calculation is the annual growth of the turnover of the fixed telecommunications network services, which is determined based on the past performance and management’s expectation for market development. The discount rate used is pre-tax and reflects specific risks relating to the fixed telecommunication services segment. |
|
| | Any adverse change in the key assumption could reduce the recoverable amount below carrying amount. |
F-26
| | | | | | | | | | | | | | | | | | | | | | | | | | | | | |
| | | | | | | | | | | | | | | | | | | Telecom- | | | | | | | |
| | | | | | | | | | | | | | | | | | | munications, | | | | | | | |
| | | | | | | Leasehold | | | | | | | Furniture, | | | computer | | | | | | | |
| | | Investment | | | land and | | | Leasehold | | | fixtures | | | and office | | | Motor | | | | |
| | | property | | | buildings | | | improvements | | | and fittings | | | equipment | | | vehicles | | | Total | |
| | | HK$’000 | | | HK$’000 | | | HK$’000 | | | HK$’000 | | | HK$’000 | | | HK$’000 | | | HK$’000 | |
Cost: | | | | | | | | | | | | | | | | | | | | | | | | | | | | |
| | | | | | | | | | | | | | | | | | | | | | | | | | | | | |
| At September 1, 2008 | | | 5,197 | | | | 84,244 | | | | 84,577 | | | | 19,575 | | | | 2,644,281 | | | | 12,624 | | | | 2,850,498 | |
| Additions | | | — | | | | 6,667 | | | | 16,663 | | | | 416 | | | | 262,796 | | | | 192 | | | | 286,734 | |
| Disposals | | | — | | | | — | | | | (630 | ) | | | (30 | ) | | | (55,118 | ) | | | (43 | ) | | | (55,821 | ) |
| Exchange adjustments | | | — | | | | — | | | | (163 | ) | | | (76 | ) | | | (1,515 | ) | | | — | | | | (1,754 | ) |
| | | | | | | | | | | | | | | | | | | | | | |
| | | | | | | | | | | | | | | | | | | | | | | | | | | | | |
| At August 31, 2009 | | | 5,197 | | | | 90,911 | | | | 100,447 | | | | 19,885 | | | | 2,850,444 | | | | 12,773 | | | | 3,079,657 | |
| | | | | | | | | | | | | | | | | | | | | | |
| | | | | | | | | | | | | | | | | | | | | | | | | | | | | |
Accumulated depreciation: | | | | | | | | | | | | | | | | | | | | | | | | | | | | |
| | | | | | | | | | | | | | | | | | | | | | | | | | | | | |
| At September 1, 2008 | | | 2,205 | | | | 10,727 | | | | 61,269 | | | | 15,596 | | | | 1,522,739 | | | | 6,563 | | | | 1,619,099 | |
| Charge for the year | | | 104 | | | | 1,739 | | | | 8,286 | | | | 1,508 | | | | 192,925 | | | | 1,679 | | | | 206,241 | |
| Disposals | | | — | | | | — | | | | (294 | ) | | | (29 | ) | | | (46,214 | ) | | | (19 | ) | | | (46,556 | ) |
| Exchange adjustments | | | — | | | | — | | | | (159 | ) | | | (58 | ) | | | (1,290 | ) | | | — | | | | (1,507 | ) |
| | | | | | | | | | | | | | | | | | | | | | |
| | | | | | | | | | | | | | | | | | | | | | | | | | | | | |
| At August 31, 2009 | | | 2,309 | | | | 12,466 | | | | 69,102 | | | | 17,017 | | | | 1,668,160 | | | | 8,223 | | | | 1,777,277 | |
| | | | | | | | | | | | | | | | | | | | | | |
| | | | | | | | | | | | | | | | | | | | | | | | | | | | | |
Net book value: | | | | | | | | | | | | | | | | | | | | | | | | | | | | |
| | | | | | | | | | | | | | | | | | | | | | | | | | | | | |
| At August 31, 2009 | | | 2,888 | | | | 78,445 | | | | 31,345 | | | | 2,868 | | | | 1,182,284 | | | | 4,550 | | | | 1,302,380 | |
| | | | | | | | | | | | | | | | | | | | | | |
| | | | | | | | | | | | | | | | | | | | | | | | | | | | | |
Cost: | | | | | | | | | | | | | | | | | | | | | | | | | | | | |
| | | | | | | | | | | | | | | | | | | | | | | | | | | | | |
| At September 1, 2007 | | | 5,197 | | | | 79,598 | | | | 80,638 | | | | 17,419 | | | | 2,475,775 | | | | 6,818 | | | | 2,665,445 | |
| Additions | | | — | | | | 4,646 | | | | 2,469 | | | | 2,189 | | | | 196,230 | | | | 6,150 | | | | 211,684 | |
| Disposals | | | — | | | | — | | | | — | | | | (478 | ) | | | (30,564 | ) | | | (344 | ) | | | (31,386 | ) |
| Exchange adjustments | | | — | | | | — | | | | 1,470 | | | | 445 | | | | 2,840 | | | | — | | | | 4,755 | |
| | | | | | | | | | | | | | | | | | | | | | |
| | | | | | | | | | | | | | | | | | | | | | | | | | | | | |
| At August 31, 2008 | | | 5,197 | | | | 84,244 | | | | 84,577 | | | | 19,575 | | | | 2,644,281 | | | | 12,624 | | | | 2,850,498 | |
| | | | | | | | | | | | | | | | | | | | | | |
| | | | | | | | | | | | | | | | | | | | | | | | | | | | | |
Accumulated depreciation: | | | | | | | | | | | | | | | | | | | | | | | | | | | | |
| | | | | | | | | | | | | | | | | | | | | | | | | | | | | |
| At September 1, 2007 | | | 2,101 | | | | 9,123 | | | | 50,309 | | | | 13,952 | | | | 1,346,854 | | | | 5,883 | | | | 1,428,222 | |
| Charge for the year | | | 104 | | | | 1,604 | | | | 9,626 | | | | 1,617 | | | | 196,198 | | | | 902 | | | | 210,051 | |
| Disposals | | | — | | | | — | | | | — | | | | (286 | ) | | | (22,390 | ) | | | (222 | ) | | | (22,898 | ) |
| Exchange adjustments | | | — | | | | — | | | | 1,334 | | | | 313 | | | | 2,077 | | | | — | | | | 3,724 | |
| | | | | | | | | | | | | | | | | | | | | | |
| | | | | | | | | | | | | | | | | | | | | | | | | | | | | |
| At August 31, 2008 | | | 2,205 | | | | 10,727 | | | | 61,269 | | | | 15,596 | | | | 1,522,739 | | | | 6,563 | | | | 1,619,099 | |
| | | | | | | | | | | | | | | | | | | | | | |
| | | | | | | | | | | | | | | | | | | | | | | | | | | | | |
Net book value: | | | | | | | | | | | | | | | | | | | | | | | | | | | | |
| | | | | | | | | | | | | | | | | | | | | | | | | | | | | |
| At August 31, 2008 | | | 2,992 | | | | 73,517 | | | | 23,308 | | | | 3,979 | | | | 1,121,542 | | | | 6,061 | | | | 1,231,399 | |
| | | | | | | | | | | | | | | | | | | | | | |
F-27
| 12 | | Fixed assets (continued) |
|
| (a) | | The Group’s total future aggregate lease income receivable under non-cancellable operating lease are as follows: |
| | | | | | | | | |
| | | 2009 | | | 2008 | |
| | | HK$’000 | | | HK$’000 | |
| Leases in respect of investment property which are receivable: | | | | | | | | |
| - Within 1 year | | | 258 | | | | 258 | |
| - After 1 year but within 5 years | | | — | | | | 258 | |
| | | | | | | |
| | | | | | | | | |
| | | | 258 | | | | 516 | |
| | | | | | | |
| Leases in respect of telecommunications facilities and computer equipment which are receivable: | | | | | | | | |
| - Within 1 year | | | 1,566 | | | | 979 | |
| - After 1 year but within 5 years | | | 1,071 | | | | 292 | |
| | | | | | | |
| | | | | | | | | |
| | | | 2,637 | | | | 1,271 | |
| | | | | | | |
| | | | | | | | | |
| | | | 2,895 | | | | 1,787 | |
| | | | | | | |
| (b) | | At August 31, 2009, the fair value of the investment property approximates its carrying value. Management estimated the fair value of the investment property based on its open market value. |
|
| (c) | | The net book value of interests in leasehold land and buildings and investment property situated in Hong Kong are analyzed as follows: |
| | | | | | | | | |
| | | 2009 | | | 2008 | |
| | | HK$’000 | | | HK$’000 | |
| Leases of between 10 to 50 years | | | 81,333 | | | | 76,509 | |
| | | | | | | |
| | | | | | | | | |
| | | 2009 | | | 2008 | |
| | | HK$’000 | | | HK$’000 | |
| Leasehold land and building carried at cost | | | 78,445 | | | | 73,517 | |
| Investment property carried at cost less impairment loss | | | 2,888 | | | | 2,992 | |
| | | | | | | |
| | | | 81,333 | | | | 76,509 | |
| | | | | | | |
| (d) | | In addition to the leasehold land and buildings classified as being held under a finance lease, the Group leases telecommunications, computer and office equipment under finance leases expiring from one to six years. At the end of the lease term the Group has the option to purchase the equipment at a price deemed to be a bargain purchase option. None of the leases included contingent rental. |
|
| | At August 31, 2009, the net book value of telecommunications, computer and office equipment under finance lease held by the Group amounted to HK$1,289,000 (2008: HK$1,411,000). |
F-28
| 13 | | Principal subsidiaries |
|
| | The following is a list of the principal subsidiaries which principally affected the results, assets or liabilities of the Group at August 31, 2009: |
| | | | | | | | | | |
| | | | Principal | | | | |
| | | | activities | | Particulars | | |
| | Place of | | and place of | | of issued | | Percentage of |
| Name | | incorporation | | operations | | share capital | | interest held |
| Attitude Holdings Limited | | British Virgin
Islands | | Inactive | | Ordinary
US$1 | | Presentation of financial statements:
capital disclosures
| 100 | |
| | January 1, 2007 | | | | | | | | |
| Automedia Holdings Limited | | British Virgin
Islands | | Investment holding in Hong Kong | | Ordinary
US$1 | | | * 100 | |
| | | | | | | | | | |
| City Telecom (B.C.) Inc. | | Canada | | Provision of international telecommunications and dial-up internet access services in Canada | | Common
Canadian
dollar
(“CAD”)
501,000 | | | 100 | |
| | | | | | | | | | |
| City Telecom (Canada) Inc. | | Canada | | Leasing and maintenance of switching equipment and provision of operational services in Canada | | Common
CAD100 | | | 100 | |
| | | | | | | | | | |
| City Telecom Inc. | | Canada | | Provision of international telecommunications and dial-up internet access services in Canada | | Common
CAD1,000 | | | 100 | |
| | | | | | | | | | |
| City Telecom International Limited | | British Virgin
Islands | | Investment holding in Hong Kong | | Ordinary
US$5,294 | | | * 100 | |
| | | | | | | | | | |
| Credibility Holdings Limited | | British Virgin
Islands | | Investment holding in Hong Kong | | Ordinary
US$1 | | | * 100 | |
F-29
| 13 | | Principal subsidiaries (continued) |
|
| | The following is a list of the principal subsidiaries which principally affected the results, assets or liabilities of the Group at August 31, 2009: (continued) |
| | | | | | | | | | |
| | | | Principal | | | | |
| | | | activities | | Particulars | | |
| | Place of | | and place of | | of issued | | Percentage of |
| Name | | incorporation | | operations | | share capital | | interest held |
| CTI Guangzhou Customer Services Co. Ltd. (translated from the registered name in Chinese) | | PRC | | Provision of administrative support services in the PRC | | Paid in capital of HK$8,000,000 | | | * 100 | |
| | | | | | | | | | |
CTI Marketing
Company Limited | | Hong Kong | | Inactive | | Ordinary
HK$10,000 | | | 100 | |
| | | | | | | | | | |
Golden Trinity
Holdings Limited | | British Virgin
Islands | | Investment holding in
Hong Kong | | Ordinary
US$1 | | | * 100 | |
| | | | | | | | | | |
Hong Kong
Broadband
Network Limited | | Hong Kong | | Provision of international telecommunications and fixed telecommunications network services in Hong Kong | | Ordinary
HK$383,049 | | | 100 | |
| | | | | | | | | | |
IDD 1600 Company
Limited | | Hong Kong | | Provision of international telecommunications services in Hong Kong | | Ordinary
HK$2 | | | 100 | |
| | | | | | | | | | |
| SGBN Singapore Broadband Network Pte. Limited | | Singapore | | Inactive | | Ordinary
Singapore
dollar
(“SG$”) 1 | | | * 100 | |
| | |
HKFRS 7* | | Shares held directly by the Company. |
F-30
| | | | | | | | |
| | 2009 | | | 2008 | |
| | HK$’000 | | | HK$’000 | |
| Debt securities, at fair value and unlisted outside Hong Kong | | | — | | | | 27,997 | |
| | | | | | |
| | Note: |
|
| | The balance as at August 31, 2008 was an investment in debt security with principal amount of US$3,000,000. During the year ended August 31, 2009, the debt security matured. |
|
| 15 | | Deferred expenditure |
| | | | | | | | | |
| | | 2009 | | | 2008 | |
| | | HK$’000 | | | HK$’000 | |
| Balance as at the beginning of the year | | | 56,095 | | | | 21,367 | |
| Additions during the year | | | 46,525 | | | | 68,505 | |
| Less: amortization charge for the year (note 4(a)) | | | (53,160 | ) | | | (33,777 | ) |
| | | | | | | |
| | | | | | | | | |
| | | | 49,460 | | | | 56,095 | |
| Current portion | | | (36,674 | ) | | | (40,704 | ) |
| | | | | | | |
| | | | | | | | | |
| Balance as at the end of the year | | | 12,786 | | | | 15,391 | |
| | | | | | | |
| | Deferred expenditure represents costs incurred to acquire subscribers of the services offered by the Group, which is treated as customer acquisition costs and are amortized over the period of the underlying service subscription agreements. |
|
| 16 | | Accounts receivable, other receivables, deposits and prepayments |
| | | | | | | | | |
| | | 2009 | | | 2008 | |
| | | HK$’000 | | | HK$’000 | |
| Accounts receivable | | | 123,352 | | | | 152,227 | |
| Less: Allowance for doubtful debts | | | (3,160 | ) | | | (11,944 | ) |
| | | | | | | |
| | | | | | | | | |
| | | | 120,192 | | | | 140,283 | |
| Other receivables, deposits and prepayments | | | 69,765 | | | | 82,726 | |
| | | | | | | |
| | | | | | | | | |
| | | | 189,957 | | | | 223,009 | |
| | | | | | | |
F-31
| 16 | | Accounts receivable, other receivables, deposits and prepayments (continued) |
|
| (a) | | Aging analysis |
|
| | The aging analysis of accounts receivable is as follows: |
| | | | | | | | | |
| | | 2009 | | | 2008 | |
| | | HK$’000 | | | HK$’000 | |
| Current - 30 days | | | 32,427 | | | | 45,462 | |
| 31 - 60 days | | | 13,663 | | | | 17,507 | |
| 61 - 90 days | | | 3,953 | | | | 7,249 | |
| Over 90 days | | | 73,309 | | | | 82,009 | |
| | | | | | | |
| | | | | | | | | |
| | | | 123,352 | | | | 152,227 | |
| | | | | | | |
| | The majority of the Group’s accounts receivable are due within 30 days from the date of billings. Subscribers with receivable that are more than 3 months overdue are requested to settle all outstanding balance before further credit is granted. |
|
| (b) | | Impairment of accounts receivable |
|
| | Impairment losses in respect of accounts receivable are recorded using an allowance account unless the Group is satisfied that recovery of the amount is remote, in which case the impairment loss is written off against accounts receivable directly (see note 1(i)(i)). |
|
| | The movement in the allowance for doubtful debts during the year including both specific and collective loss components is as follows: |
| | | | | | | | | |
| | | 2009 | | | 2008 | |
| | | HK$’000 | | | HK$’000 | |
| Balance as at the beginning of the year | | | 11,944 | | | | 22,392 | |
| Impairment loss recognized | | | 12,103 | | | | 14,293 | |
| Uncollectible amounts written off | | | (20,887 | ) | | | (24,741 | ) |
| | | | | | | |
| | | | | | | | | |
| Balance as at the end of the year | | | 3,160 | | | | 11,944 | |
| | | | | | | |
| (c) | | Accounts receivable that are not impaired |
|
| | The aging analysis of accounts receivable that are neither individually nor collectively considered to be impaired are as follows: |
| | | | | | | | | |
| | | 2009 | | | 2008 | |
| | | HK$’000 | | | HK$’000 | |
| Neither past due nor impaired | | | 32,427 | | | | 45,462 | |
| 0 - 30 past due | | | 13,663 | | | | 17,507 | |
| 31 - 60 past due | | | 3,953 | | | | 7,249 | |
| Over 60 past due | | | 70,149 | | | | 70,065 | |
| | | | | | | |
| | | | | | | | | |
| | | | 120,192 | | | | 140,283 | |
| | | | | | | |
| | Receivables that were neither past duenor impaired relate to a wide range of customers for whom there was no recent history of default. |
|
| | The amounts over 60 days past due for the Group included receivable relating to mobile interconnection charges of HK$68,802,000 as at August 31, 2009 (August 31, 2008: HK$64,407,000) (see note 2(c)). |
F-32
| 16 | | Accounts receivable, other receivables, deposits and prepayments (continued) |
|
| (c) | | Accounts receivable that are not impaired (continued) |
|
| | Other accounts receivable that were past due but not impaired relate to a number of independent customers that have a good track record with the Group. Based on past experience, management believes that no impairment allowance is necessary in respect of these balances as there has not been a significant change in credit quality and the balances are still considered fully recoverable. The Group does not hold collateral over these balances. |
|
| (d) | | Other receivables, deposits and prepayments |
|
| | Other receivables, deposits and prepayments consist of deposits for purchase of fixed assets, rental deposit, interest receivable, unbilled revenue, prepayment and other receivables. |
|
| 17 | | Cash at bank and in hand |
| | | | | | | | | |
| | | 2009 | | | 2008 | |
| | | HK$’000 | | | HK$’000 | |
| Time deposits with banks and other financial institutions | | | 77,500 | | | | 264,943 | |
| Cash at bank and in hand | | | 143,552 | | | | 156,667 | |
| | | | | | | |
| | | | | | | | | |
| Cash at bank and in hand in the balance sheet | | | 221,052 | | | | 421,610 | |
| | | | | | | |
| 18 | | Accounts payable, other payables and accrued charges |
| | | | | | | | | |
| | | 2009 | | | 2008 | |
| | | HK$’000 | | | HK$’000 | |
| Accounts payable | | | 37,555 | | | | 52,324 | |
| Other payables and accrued charges | | | 206,487 | | | | 178,114 | |
| | | | | | | |
| | | | | | | | | |
| | | | 244,042 | | | | 230,438 | |
| | | | | | | |
| (a) | | The aging analysis of the accounts payable was as follows: |
| | | | | | | | | |
| | | 2009 | | | 2008 | |
| | | HK$’000 | | | HK$’000 | |
| Current - 30 days | | | 12,621 | | | | 18,802 | |
| 31 - 60 days | | | 1,778 | | | | 4,025 | |
| 61 - 90 days | | | 189 | | | | 8,334 | |
| Over 90 days | | | 22,967 | | | | 21,163 | |
| | | | | | | |
| | | | | | | | | |
| | | | 37,555 | | | | 52,324 | |
| | | | | | | |
| (b) | | Other payables and accrued charges |
|
| | Other payables and accrued charges primarily consist of accrual for staff salaries and bonus, carrier fees and charges, payable for purchase of fixed assets, advertising and promotional expenses as well as interest payable in respect of the 10-year senior notes. |
|
| 19 | | Deferred service revenue |
|
| | Deferred service revenue primarily includes service fees received from customers in advance for the Group’s fixed telecommunications network services. Service fees received in advance is deferred and recognized as revenue on a straight-line basis over the related contract period. |
F-33
| | | | | | | | | | | | | | | | | | | | | | | | | | | | | |
| | | | | | | | | | | | | | | Capital | | | | | | | | | | |
| | | Share | | | Share | | | Capital | | | redemption | | | Retained | | | Exchange | | | | |
| | | capital | | | premium | | | reserve | | | reserve | | | profits | | | reserve | | | Total | |
| | | HK$’000 | | | HK$’000 | | | HK$’000 | | | HK$’000 | | | HK$’000 | | | HK$’000 | | | HK$’000 | |
| At September 1, 2008 | | | 65,062 | | | | 670,717 | | | | 19,013 | | | | — | | | | 275,025 | | | | 2,790 | | | | 1,032,607 | |
| Profit attributable to shareholders | | | — | | | | — | | | | — | | | | — | | | | 212,829 | | | | — | | | | 212,829 | |
| Dividend paid in respect of previous year | | | — | | | | — | | | | — | | | | — | | | | (3,108 | ) | | | — | | | | (3,108 | ) |
| Shares issued in respect of scrip dividend of previous year | | | 1,221 | | | | 8,685 | | | | — | | | | — | | | | (9,906 | ) | | | — | | | | — | |
| Dividend paid in respect of current year | | | — | | | | — | | | | — | | | | — | | | | (19,904 | ) | | | — | | | | (19,904 | ) |
| Shares issued upon exercise of share option | | | 142 | | | | 1,806 | | | | (549 | ) | | | — | | | | — | | | | — | | | | 1,399 | |
| Equity settled share-based transactions | | | — | | | | — | | | | 4,768 | | | | — | | | | — | | | | — | | | | 4,768 | |
| Exchange adjustments on translation of the financial statements of subsidiaries | | | — | | | | — | | | | — | | | | — | | | | — | | | | 70 | | | | 70 | |
| Repurchase and cancellation of ordinary shares | | | (7 | ) | | | — | | | | — | | | | 7 | | | | (134 | ) | | | — | | | | (134 | ) |
| | | | | | | | | | | | | | | | | | | | | | |
| | | | | | | | | | | | | | | | | | | | | | | | | | | | | |
| At August 31, 2009 | | | 66,418 | | | | 681,208 | | | | 23,232 | | | | 7 | | | | 454,802 | | | | 2,860 | | | | 1,228,527 | |
| | | | | | | | | | | | | | | | | | | | | | |
| | | | | | | | | | | | | | | | | | | | | | | | | |
| | | Share | | | Share | | | Capital | | | Retained | | | Exchange | | | | |
| | | capital | | | premium | | | reserve | | | profits | | | reserve | | | Total | |
| | | HK$’000 | | | HK$’000 | | | HK$’000 | | | HK$’000 | | | HK$’000 | | | HK$’000 | |
| At September 1, 2007 | | | 61,650 | | | | 622,433 | | | | 18,109 | | | | 200,519 | | | | 1,171 | | | | 903,882 | |
| Profit attributable to shareholders | | | — | | | | — | | | | — | | | | 125,190 | | | | — | | | | 125,190 | |
| Dividend paid in respect of previous year | | | — | | | | — | | | | — | | | | (5,915 | ) | | | — | | | | (5,915 | ) |
| Shares issued in respect of scrip dividend of previous year | | | 1,123 | | | | 18,044 | | | | — | | | | (19,167 | ) | | | — | | | | — | |
| Dividend paid in respect of current year | | | — | | | | — | | | | — | | | | (11,371 | ) | | | — | | | | (11,371 | ) |
| Shares issued in respect of scrip dividend of current year | | | 884 | | | | 13,347 | | | | — | | | | (14,231 | ) | | | — | | | | — | |
| Shares issued upon exercise of share option | | | 1,405 | | | | 16,893 | | | | (3,300 | ) | | | — | | | | — | | | | 14,998 | |
| Equity settled share-based transactions | | | — | | | | — | | | | 4,204 | | | | — | | | | — | | | | 4,204 | |
| Exchange adjustments on translation of the financial statements of subsidiaries | | | — | | | | — | | | | — | | | | — | | | | 1,619 | | | | 1,619 | |
| | | | | | | | | | | | | | | | | | | |
| | | | | | | | | | | | | | | | | | | | | | | | | |
| At August 31, 2008 | | | 65,062 | | | | 670,717 | | | | 19,013 | | | | 275,025 | | | | 2,790 | | | | 1,032,607 | |
| | | | | | | | | | | | | | | | | | | |
F-34
| 20 | | Capital and reserves (continued) |
|
| | Nature and purpose of reserves |
|
| (i) | | Share premium |
|
| | The application of the share premium account is governed by Sections 48B of the Hong Kong Companies Ordinance. |
|
| (ii) | | Capital reserve |
|
| | The capital reserve comprises the fair value of the actual or estimated number of unexercised share options granted to employees of the Group that was recognized in accordance with the accounting policy adopted for share based payment in note 1(p). |
|
| (iii) | | PRC statutory reserve |
|
| | In accordance with Accounting Regulations for Business Enterprises, foreign investment enterprises in the PRC are required to transfer at least 10% of their profit after taxation, as determined under accounting principles generally accepted in the PRC (“PRC GAAP”) to the general reserve until the balance of the general reserve is equal to 50% of their registered capital. |
|
| | For the year ended August 31, 2009, CTI Guangzhou Customer Services Co Ltd (“CTIGZ”), a wholly-owned subsidiary of the Group, made appropriation to the statutory reserve of RMB510,000 (2008: RMB324,000). The accumulated balance of the statutory reserve maintained at the CTIGZ as at August 31, 2009 was RMB1,415,000 (2008: RMB905,000). The statutory reserve can be used to reduce previous years’ losses and to increase the capital of the subsidiary. |
|
| (iv) | | Exchange reserve |
|
| | The exchange reserve comprises all foreign exchange differences arising from the translation of the financial statements of foreign operations. The reserve is dealt with in accordance with the accounting policies set out in note 1(d)(ii). |
|
| (a) | | Share capital |
| | | | | | | | | | | | | | | | | |
| | | 2009 | | | 2008 | |
| | | No. of | | | Amount | | | No. of | | | Amount | |
| | | Shares | | | HK$’000 | | | shares | | | HK$’000 | |
Authorized: | | | | | | | | | | | | | | | | |
| Ordinary shares of HK$0.10 each | | | 2,000,000,000 | | | | 200,000 | | | | 2,000,000,000 | | | | 200,000 | |
| | | | | | | | | | | | | |
| | | | | | | | | | | | | | | | | |
Issued and fully paid: | | | | | | | | | | | | | | | | |
| Ordinary shares of HK$0.10 each | | | | | | | | | | | | | | | | |
| At the beginning of the year | | | 650,621,823 | | | | 65,062 | | | | 616,503,404 | | | | 61,650 | |
| Shares issued in respect of scrip dividend of the previous year (note (i)) | | | 12,212,142 | | | | 1,221 | | | | 11,227,213 | | | | 1,123 | |
| Shares issued in respect of scrip dividend of the current year (note (ii)) | | | — | | | | — | | | | 8,838,938 | | | | 884 | |
| Shares issued upon exercise of share options (note (iii)) | | | 1,416,005 | | | | 142 | | | | 14,052,268 | | | | 1,405 | |
| Repurchase and cancellation of ordinary shares | | | (70,000 | ) | | | (7 | ) | | | — | | | | — | |
| | | | | | | | | | | | | |
| | | | | | | | | | | | | | | | | |
| At the end of the year | | | 664,179,970 | | | | 66,418 | | | | 650,621,823 | | | | 65,062 | |
| | | | | | | | | | | | | |
The holders of ordinary shares are entitled to receive dividends as declared from time to time and are entitled to one vote per ordinary share at meetings of the Company. All ordinary shares rank equally with regard to the Company’s residual assets.
Notes:
| (i) | | On February 25, 2009, the Company issued and allotted 12,212,142 ordinary shares to shareholders who elected to receive the 2008 final dividend in shares pursuant to the scrip dividend scheme announced by the Company on January 9, 2009. These shares rank pari passu with the existing shares of the Company in all respects. |
|
| | On February 4, 2008, the Company issued and allotted 11,227,213 ordinary shares to shareholders who elected to receive, the 2007 final dividend in shares pursuant to the scrip dividend scheme announced by the Company on January 4, 2008. These shares rank pari passu with the existing shares of the Company in all respects. |
F-35
| 20 | | Capital and reserves (continued) |
|
| (a) | | Share capital (continued) |
|
| | Notes: (continued) |
| (ii) | | On July 23, 2008, the Company issued and allotted 8,838,938 ordinary shares to shareholder, who elected to receive the 2008 interim dividend in shares pursuant to the scrip dividend scheme announced by the Company on June 19, 2008. These shares rank pari passu with the existing shares of the Company in all respects. |
|
| (iii) | | During the year ended August 31, 2009, 1,416,005 ordinary shares (2008: 14,052,268 ordinary shares) were issued at a weighted average price of HK$0.99 per ordinary share (2008: HK$1.07 per ordinary share) to share option holders who had exercised their options. These shares so issued rank pari passu with the then existing ordinary shares in issue. |
|
| (iv) | | The movement of outstanding share options during the year was as follows: |
| | | | | | | | | | | | | | | | | | | | | | | | | | | | | |
| | | | | | | | | | | | | | | Adjustment | | | | | | | | | | | | |
| | | | | | | Number | | | | | | | to number | | | | | | | | | | | Number | |
| | | | | | | of share | | | | | | | of options | | | | | | | | | | | of share | |
| | | | | | | options | | | | | | | for 2008 | | | | | | | | | | | options | |
| | | Exercise | | | outstanding at | | | | | | | final | | | | | | | | | | | outstanding | |
| | | price | | | September 1, | | | | | | | dividend | | | | | | | | | | | at August 31, | |
| Date of grant | | per share | | | 2008 | | | Granted | | | (note (i)) | | | Exercised | | | Lapsed | | | 2009 | |
| October 21, 2004 | | HK$1.5224 | | | 7,571,582 | | | | — | | | | 35,130 | | | | 546,184 | | | | 151,001 | | | | 6,909,527 | |
| January 5, 2005 | | HK$1.5224 | | | 16,106,956 | | | | — | | | | 76,252 | | | | — | | | | — | | | | 16,183,208 | |
| May 22, 2006 | | HK$0.6523 | | | 22,387,555 | | | | — | | | | 105,366 | | | | 869,821 | | | | 30,201 | | | | 21,592,899 | |
| August 3, 2006 | | HK$0.7018 | | | 40,349 | | | | — | | | | 191 | | | | — | | | | — | | | | 40,540 | |
| November 22, 2006 | | HK$0.7216 | | | 135,902 | | | | — | | | | 643 | | | | — | | | | — | | | | 136,545 | |
| February 6, 2008 | | HK$1.7568 | | | 6,016,309 | | | | — | | | | 28,482 | | | | — | | | | — | | | | 6,044,791 | |
| February 11, 2008 | | HK$1.8660 | | | 6,016,309 | | | | — | | | | 28,482 | | | | — | | | | — | | | | 6,044,791 | |
| February 15, 2008 | | HK$1.7568 | | | 1,002,718 | | | | — | | | | 4,747 | | | | — | | | | — | | | | 1,007,465 | |
| March 11, 2008 | | HK$1.8164 | | | 300,816 | | | | — | | | | 1,424 | | | | — | | | | 302,240 | | | | — | |
| May 2, 2008 | | HK$1.7866 | | | 1,002,718 | | | | — | | | | 4,747 | | | | — | | | | — | | | | 1,007,465 | |
| | | | | | | | | | | | | | | | | | | | | | | |
| | | | | | | | | | | | | | | | | | | | | | | | | | | | | |
| | | | | | | | 60,581,214 | | | | — | | | | 285,464 | | | | 1,416,005 | | | | 483,442 | | | | 58,967,231 | |
| | | | | | | | | | | | | | | | | | | | | | | |
| | During the year ended August 31, 2009, no options were granted under the 2002 Share Option Scheme. |
|
| | Each option entitles the holder to subscribe for one share of HK$0.10 each in the Company at a predetermined exercise price. |
F-36
| 20 | | Capital and reserves (continued) |
|
| (b) | | Capital management |
|
| | The Group’s primary objectives when managing capital are to maintain a reasonable capital structure, safeguard the Group’s ability to continue as a going concern, and to provide returns for shareholders. |
|
| | The Group manages the amount of capital in proportion to risk, and makes adjustments to its capital structure through the amount of dividend payment to shareholders, issuance of scrip and new shares, and managing its debt portfolio in conjunction with cash flow requirements, taking into account its future financial obligations and commitments. |
|
| | The Group monitors its capital structure by reviewing its net debt to net asset gearing ratio. For this purpose, the Group defines net debt as total loans less cash at bank and in hand and long-term bank deposits. |
|
| | The net debt to net asset gearing ratio as at August 31, 2009 and 2008 are as follows: |
| | | | | | | | | |
| | | 2009 | | | 2008 | |
| | | HK$’000 | | | HK$’000 | |
| Unsecured | | | | | | | | |
| - 10-year senior notes due 2015 | | | 162,586 | | | | 683,242 | |
| - Obligation under finance lease | | | 732 | | | | 376 | |
| | | | | | | |
| | | | | | | | | |
| Total loans | | | 163,318 | | | | 683,618 | |
| Less: Cash and bank balances | | | (221,052 | ) | | | (421,610 | ) |
| | | | | | | |
| | | | | | | | | |
| Net (cash)/debt | | | (57,734 | ) | | | 262,008 | |
| Net asset | | | 1,228,527 | | | | 1,032,607 | |
| | | | | | | |
| | | | | | | | | |
| Net debt to net asset gearing ratio | | | — | | | | 0.25 | |
| | | | | | | |
| | The decrease in net debt to net asset gearing ratio is mainly due to the repurchase of the 10-year senior notes (see note 22(a)). |
|
| | Neither the Company nor any of its subsidiaries are currently subject to externally imposed capital requirements. |
|
| 21 | | Deferred taxation |
|
| | Deferred tax assets are recognized to the extent it is probable that future taxable profits will be generated against which the temporary differences can be utilized. |
|
| | The components of deferred tax assets/(liabilities) recognized in the balance sheet and the movements are as follows: |
| | | | | | | | | |
| | | 2009 | | | 2008 | |
| | | HK$’000 | | | HK$’000 | |
| Balance as at the beginning of the year | | | 21,398 | | | | (291 | ) |
| Exchange differences | | | 1 | | | | (1 | ) |
| Deferred taxation (charged)/credited to income statement | | | | | | | | |
| - relating to the origination and reversal of temporary differences (note 5) | | | (37,108 | ) | | | (4,645 | ) |
| - relating to the recognition of unrecognized tax losses in prior years (note 5) | | | — | | | | 26,335 | |
| | | | | | | |
| | | | | | | | | |
| Balance as at the end of the year | | | (15,709 | ) | | | 21,398 | |
| | | | | | | |
F-37
| 21 | | Deferred taxation (continued) |
|
| | As at August 31, 2009, the Group has not recognized deferred tax assets in respect of unused tax losses of HK$8,154,000 (2008: HK$9,518,000) because it is not probable that future taxable profits can be generated to utilize the tax losses. All tax losses are subject to agreement with local tax authorities. |
| | | | | | | | | |
| | | 2009 | | | 2008 | |
| | | HK$’000 | | | HK$’000 | |
| After 5 years | | | 2,455 | | | | 3,810 | |
| No expiry date | | | 5,699 | | | | 5,708 | |
| | | | | | | |
| | | | 8,154 | | | | 9,518 | |
| | | | | | | |
| | The movement in deferred tax assets and liabilities (prior to offsetting of balances within the same taxation jurisdiction) during the year is as follows: |
| | | | | | | | | |
| | | Accelerated depreciation allowance | |
| | | 2009 | | | 2008 | |
| | | HK$’000 | | | HK$’000 | |
Deferred tax liabilities | | | | | | | | |
| | | | | | | | | |
| At the beginning of the year | | | (126,447 | ) | | | (134,910 | ) |
| (Charged)/credited to consolidated income statement | | | (5,326 | ) | | | 8,463 | |
| Exchange differences | | | 7 | | | | — | |
| | | | | | | |
| | | | | | | | | |
| At the end of the year | | | (131,766 | ) | | | (126,447 | ) |
| | | | | | | |
| | | | | | | | | |
| | | Tax losses | |
| | | 2009 | | | 2008 | |
| | | HK$’000 | | | HK$’000 | |
Deferred tax assets | | | | | | | | |
| | | | | | | | | |
| At the beginning of the year | | | 147,845 | | | | 134,619 | |
| (Charged)/credited to consolidated income statement | | | (31,782 | ) | | | 13,227 | |
| Exchange differences | | | (6 | ) | | | (1 | ) |
| | | | | | | |
| |
| At the end of the year | | | 116,057 | | | | 147,845 | |
| | | | | | | |
| | Deferred tax assets and deferred tax liabilities are offset when there is a legally enforceable right to set off current tax assets against current tax liabilities and when the deferred tax assets and the deferred tax liabilities relate to income taxes levied by the same taxation authority on the same taxable entity. The following amounts, determined after appropriate offsetting, are shown in the balance sheet: |
| | | | | | | | | |
| | | 2009 | | | 2008 | |
| | | HK$’000 | | | HK$’000 | |
| Deferred tax assets | | | — | | | | 26,335 | |
| Deferred tax liabilities | | | (15,709 | ) | | | (4,937 | ) |
| | | | | | | |
| | | | | | | | | |
| | | | (15,709 | ) | | | 21,398 | |
| | | | | | | |
F-38
| 22 | | Long-term debt and other liabilities |
| | | | | | | | | |
| | | 2009 | | | 2008 | |
| | | HK$’000 | | | HK$’000 | |
| 10-year senior notes due 2015 (note (a)) | | | 162,586 | | | | 683,242 | |
| Obligation under finance lease (note (b)) | | | 732 | | | | 376 | |
| | | | | | | |
| | | | | | | | | |
| | | | 163,318 | | | | 683,618 | |
| | | | | | | | | |
| Current portion of - - obligation under finance lease | | | (202 | ) | | | (121 | ) |
| | | | | | | |
| | | | | | | | | |
| | | | 163,116 | | | | 683,497 | |
| | | | | | | |
| | At August 31, 2009, the Group’s long-term debt and other liabilities were repayable as follows: |
| | | | | | | | | |
| | | 2009 | | | 2008 | |
| | | HK$’000 | | | HK$’000 | |
| Long-term debt and other liabilities, repayable: | | | | | | | | |
| - 10-year senior notes due 2015 | | | | | | | | |
| - after the fifth year | | | 162,586 | | | | 683,242 | |
| | | | | | | |
| | | | | | | | | |
| Obligations under finance lease | | | | | | | | |
| - Within 1 year | | | 202 | | | | 121 | |
| - After 1 year but within 2 years | | | 197 | | | | 129 | |
| - After 2 years but within 5 years | | | 263 | | | | 126 | |
| - After 5 years | | | 70 | | | | — | |
| | | | | | | |
| | | | | | | | | |
| | | | 732 | | | | 376 | |
| | | | | | | | | |
| Less: Current portion of obligations under finance lease | | | (202 | ) | | | (121 | ) |
| | | | | | | |
| | | | | | | | | |
| | | | 530 | | | | 255 | |
| | | | | | | |
| | | | | | | | | |
| | | | 163,116 | | | | 683,497 | |
| | | | | | | |
Notes:
| (a) | | On January 20, 2005, the Company issued unsecured 10-year senior fixed rates notes (the “10-year senior notes”) with a principle amount of US$125 million at an issue price equal to 100 per cent of the principal amount. The 10-year senior notes mature on February 1, 2015 and bear interest at the fixed rate of 8.75% per annum payable semi-annually on February 1 and August 1 of each year, commencing August 1, 2005. |
|
| | The 10-year senior notes are unconditionally and irrevocably guaranteed on a joint and several basis by the Company’s subsidiaries (other than CTI Guangzhou Customer Services Company Limited) as subsidiary guarantors. |
|
| | During the year ended August 31, 2009, the Group repurchased a portion of the 10-year senior notes with a cumulative principal value of US$67,990,000 through tender offers in April 2009 and July 2009. The total consideration paid including transaction cost and accrued interest was approximately US$65,139,000. The gain on extinguishment of the 10-year senior notes was US$4,048,000 (equivalent to HK$31,371,000) which has been recorded in other revenues of the consolidated income statement. |
|
| | As at August 31, 2009, the principal amount of the 10-year senior notes remaining in issue after the repurchase was US$21,363,000 (equivalent to HK$165,563,000). The amortized cost of the 10-year senior notes was US$20,979,000 (equivalent to HK$162,586,000) as at August 31, 2009. |
|
| | The effective interest rate of the 10-year senior notes for the year ended August 31, 2009 is 9.2% (2008: 9.2%) per annum. |
F-39
| 22 | | Long-term debt and other liabilities (continued) |
|
| | Notes: (continued) |
| (b) | | At August 31, 2009, the Group had obligations under finance leases repayable as follows: |
| | | | | | | | | | | | | | | | | | | | | | | | | |
| | | 2009 | | | 2008 | |
| | | Present | | | | | | | | | | | Present | | | | | | | |
| | | value | | | Interest | | | | | | | value | | | Interest | | | | |
| | | of the | | | expense | | | Total | | | of the | | | expense | | | Total | |
| | | minimum | | | relating to | | | minimum | | | minimum | | | relating to | | | minimum | |
| | | lease | | | future | | | lease | | | lease | | | future | | | lease | |
| | | payments | | | periods | | | payments | | | payments | | | periods | | | payments | |
| | | HK$’000 | | | HK$’000 | | | HK$’000 | | | HK$’000 | | | HK$’000 | | | HK$’000 | |
| Within 1 year | | | 202 | | | | 35 | | | | 237 | | | | 121 | | | | 21 | | | | 142 | |
| | | | | | | | | | | | | | | | | | | |
| | | | | | | | | | | | | | | | | | | | | | | | | |
| After 1 year but within 2 years | | | 197 | | | | 22 | | | | 219 | | | | 129 | | | | 13 | | | | 142 | |
| After 2 years but within 5 years | | | 263 | | | | 30 | | | | 293 | | | | 126 | | | | 4 | | | | 130 | |
| After 5 years | | | 70 | | | | 1 | | | | 71 | | | | — | | | | — | | | | — | |
| | | | | | | | | | | | | | | | | | | |
| | | | | | | | | | | | | | | | | | | | | | | | | |
| | | | 530 | | | | 53 | | | | 583 | | | | 255 | | | | 17 | | | | 272 | |
| | | | | | | | | | | | | | | | | | | |
| | | | | | | | | | | | | | | | | | | | | | | | | |
| | | | 732 | | | | 88 | | | | 820 | | | | 376 | | | | 38 | | | | 414 | |
| | | | | | | | | | | | | | | | | | | |
| 23 | | Notes to the consolidated cash flow statement |
|
| (a) | | Reconciliation of profit before taxation to net cash inflow from operations |
| | | | | | | | | |
| | | 2009 | | | 2008 | |
| | | HK$’000 | | | HK$’000 | |
| Profit before taxation | | | 251,559 | | | | 108,372 | |
| Depreciation of owned fixed assets | | | 205,624 | | | | 209,464 | |
| Depreciation of fixed assets held under finance lease | | | 617 | | | | 587 | |
| Amortization of deferred expenditure | | | 53,160 | | | | 33,777 | |
| Interest income | | | (4,869 | ) | | | (15,596 | ) |
| Interest element of finance lease | | | 27 | | | | 34 | |
| Loss on disposal of fixed assets | | | 1,016 | | | | 1,431 | |
| Realized and unrealized gain on other financial assets | | | (189 | ) | | | (3,284 | ) |
| Realized gain on long term bank deposit | | | — | | | | (1,185 | ) |
| Realized loss on derivative financial instrument | | | — | | | | 1,039 | |
| Equity settled share-based transactions | | | 4,768 | | | | 4,204 | |
| Gain on extinguishment of 10-year senior notes | | | (31,371 | ) | | | (2,582 | ) |
| Interest, amortization and exchange difference on 10-year senior notes | | | 49,214 | | | | 72,640 | |
| | | | | | | |
| | | | | | | | | |
| Net cash inflow before working capital changes | | | 529,556 | | | | 408,901 | |
| (Increase)/ decrease in long-term receivable and prepayment | | | (505 | ) | | | 1,346 | |
| Decrease in accounts receivable, other receivables, deposits and prepayments | | | 33,052 | | | | 6,914 | |
| Decrease in inventories | | | — | | | | 477 | |
| Increase in deferred expenditure | | | (46,525 | ) | | | (68,505 | ) |
| Increase/ (decrease) in accounts payable, other payables, accrued charges and deposits received | | | 17,419 | | | | (12,567 | ) |
| Increase in deferred service revenue | | | 4,621 | | | | 46,247 | |
| | | | | | | |
| | | | | | | | | |
| Net cash inflow from operations | | | 537,618 | | | | 382,813 | |
| | | | | | | |
F-40
| 23 | | Notes to the consolidated cash flow statement (continued) |
|
| (b) | | Analysis of changes in financing during the year |
| | | | | | | | | | | | | |
| | | Share capital | | | | | | | |
| | | (including share | | | Obligations | | | | |
| | | premium and | | | Under finance | | | 10-year | |
| | | capital reserve) | | | lease | | | senior notes | |
| | | HK$’000 | | | HK$’000 | | | HK$’000 | |
| Balance at September 1, 2007 | | | 702,192 | | | | 1,210 | | | | 952,593 | |
| Issue of new shares | | | 14,998 | | | | — | | | | — | |
| Share issued in respect of scrip dividend | | | 33,398 | | | | — | | | | — | |
| Repayment of capital element of finance lease | | | — | | | | (834 | ) | | | — | |
| Repurchase of 10-year senior notes | | | — | | | | — | | | | (269,399 | ) |
| Gain on extinguishment of 10-year senior notes | | | — | | | | — | | | | (2,582 | ) |
| Amortization of incidental issuance costs | | | — | | | | — | | | | 1,665 | |
| Equity settled share-based transactions | | | 4,204 | | | | — | | | | — | |
| Effect of foreign exchange rate changes | | | — | | | | — | | | | 965 | |
| | | | | | | | | | |
| Balance at August 31, 2008 | | | 754,792 | | | | 376 | | | | 683,242 | |
| | | | | | | | | | |
| Balance at September 1, 2008 | | | 754,792 | | | | 376 | | | | 683,242 | |
| Issue of new shares | | | 1,399 | | | | — | | | | — | |
| Repurchase and cancellation of ordinary shares | | | (7 | ) | | | — | | | | — | |
| Share issued in respect of scrip dividend | | | 9,906 | | | | — | | | | — | |
| Purchase of fixed assets under finance lease | | | — | | | | 494 | | | | — | |
| Repayment of capital element of finance lease | | | — | | | | (138 | ) | | | — | |
| Repurchase of 10-year senior notes | | | — | | | | — | | | | (485,829 | ) |
| Gain on extinguishment of 10-year senior notes | | | — | | | | — | | | | (31,371 | ) |
| Amortization of incidental issuance costs | | | — | | | | — | | | | 1,545 | |
| Equity settled share-based transactions | | | 4,768 | | | | — | | | | — | |
| Effect of foreign exchange rate changes | | | — | | | | — | | | | (5,001 | ) |
| | | | | | | | | | |
| Balance at August 31, 2009 | | | 770,858 | | | | 732 | | | | 162,586 | |
| | | | | | | | | | |
| 24 | | Financial instruments:instruments |
|
| | Exposure to credit, liquidity, interest rate and currency risks arises in the normal course of the Group’s business. These risks are limited by the Group’s financial management policies and practices described below. |
|
| (a) | | Credit risk |
|
| | The Group’s credit risk is primarily attributable to accounts receivable and other receivables, and debt investments. Management has a credit policy in place and the exposure to the credit risk is monitored on an ongoing basis. |
|
| | In respect of accounts receivable and other receivables, credit evaluations are performed on all customers requiring credit over a certain amount. These evaluations focus on the customer’s past history of making payments when due and current ability to pay, and take into account information specific to the customer as well as pertaining to the economic environment in which the customer locates. These receivables are due within 30 days from the date of billing. Subscribers with receivables that are more than 3 months overdue are requested to settle all outstanding balances before any further credit is granted. The Group generally does not obtain collateral from customers. |
|
| | The Group’s exposure to credit risk is influenced mainly by individual characteristics of each customer. The default risk of the country in which customer locates also has an influence on credit risk but to a lesser extent. Concentrations of credit risk with respect to accounts receivable are limited due to the Group’s customer base being large and unrelated. As such, management does not expect any significant losses of accounts receivable that have not been provided for by way of allowances as disclosed in note 16. |
|
| | The maximum exposure to credit risk is represented by the carrying amount of each financial asset after deducting any impairment allowance, in the balance sheet. Except for the financial guarantee given by the Group as disclosed in note 25, the Group does not provide any other guarantees which expose the Group to credit risk. The maximum exposure to credit risk in respect of these financial guarantees at the balance sheet date is disclosed in note 25. |
|
| | Further quantitative disclosures in respect of the Group’s exposure to credit risk arising from accounts receivable are set out in note 16. |
F-41
| 24 | | Financial instruments (continued) |
|
| (b) | | Liquidity risk |
|
| | The Group has a cash management policy, which includes the short term investment of cash surpluses and the raising of loans and other borrowings to cover expected cash demands. The Group’s policy is to regularly monitor current and expected liquidity requirements and its compliance with lending covenants, to ensure that it maintains sufficient cash and readily realizable marketable securities and adequate amount of committed credit facilities from major financial institutions to meet its liquidity requirements in the short and long term. Due to the dynamic nature of the underlying business, the Group aims to maintain flexibility in funding by maintaining committed credit lines available. |
|
| | The following table details the remaining contractual maturities at the balance sheet date of the Group’s financial liabilities, which are based on undiscounted cash flows (including interest) and the earliest date the Group are required to pay. |
| | | | | | | | | | | | | | | | | | | | | | | | | | | | | | | | | | | | | | | | | | | | | | | | | |
| | | 2009 | | | 2008 | |
| | | | | | | Total | | | | | | | More than | | | More than | | | | | | | | | | | Total | | | | | | | More than | | | More than | | | | |
| | | | | | | contractual | | | Within | | | 1 year but | | | 2 years but | | | | | | | | | | | contractual | | | Within | | | 1 year but | | | 2 years but | | | | |
| | | Carrying | | | undiscounted | | | 1 year or | | | less than | | | less than | | | More than | | | Carrying | | | undiscounted | | | 1 year or | | | less than | | | Less than | | | More than | |
| | | amount | | | cash flow | | | on demand | | | 2 years | | | 5 years | | | 5 years | | | amount | | | cash flow | | | on demand | | | 2 years | | | 5 years | | | 5 years | |
| | | HK$’000 | | | HK$’000 | | | HK$’000 | | | HK$’000 | | | HK$’000 | | | HK$’000 | | | HK$’000 | | | HK$’000 | | | HK$’000 | | | HK$’000 | | | HK$’000 | | | HK$’000 | |
Current liabilities | | | | | | | | | | | | | | | | | | | | | | | | | | | | | | | | | | | | | | | | | | | | | | | | |
| | | | | | | | | | | | | | | | | | | | | | | | | | | | | | | | | | | | | | | | | | | | | | | | | |
| Accounts payable | | | 37,555 | | | | 37,555 | | | | 37,555 | | | | — | | | | — | | | | — | | | | 52,324 | | | | 52,324 | | | | 52,324 | | | | — | | | | — | | | | — | |
| Other payables and accrued charges | | | 206,487 | | | | 206,487 | | | | 206,487 | | | | — | | | | — | | | | — | | | | 178,114 | | | | 178,114 | | | | 178,114 | | | | — | | | | — | | | | — | |
| Deposits received | | | 16,385 | | | | 16,385 | | | | 16,385 | | | | — | | | | — | | | | — | | | | 16,264 | | | | 16,264 | | | | 16,264 | | | | — | | | | — | | | | — | |
| Obligations under finance leases | | | 202 | | | | 237 | | | | 237 | | | | — | | | | — | | | | — | | | | 121 | | | | 142 | | | | 142 | | | | — | | | | — | | | | — | |
| Tax payable | | | 1,993 | | | | 1,993 | | | | 1,993 | | | | — | | | | — | | | | — | | | | 2,103 | | | | 2,103 | | | | 2,103 | | | | — | | | | — | | | | — | |
| | | | | | | | | | | | | | | | | | | | | | | | | | | | | | | | | | | | | | | | | | | | | | | | | |
Non current liabilities | | | | | | | | | | | | | | | | | | | | | | | | | | | | | | | | | | | | | | | | | | | | | | | | |
| | | | | | | | | | | | | | | | | | | | | | | | | | | | | | | | | | | | | | | | | | | | | | | | | |
| 10-year senior notes | | | 162,586 | | | | 244,117 | | | | 14,489 | | | | 14,489 | | | | 43,467 | | | | 171,672 | | | | 683,242 | | | | 1,093,852 | | | | 61,012 | | | | 61,012 | | | | 183,036 | | | | 788,792 | |
| Obligation under finance leases | | | 530 | | | | 583 | | | | — | | | | 219 | | | | 293 | | | | 71 | | | | 255 | | | | 272 | | | | — | | | | 142 | | | | 130 | | | | — | |
| | | | | | | | | | | | | | | | | | | | | | | | | | | | | | | | | | | | | |
| | | | | | | | | | | | | | | | | | | | | | | | | | | | | | | | | | | | | | | | | | | | | | | | | |
| | | | 425,738 | | | | 507,357 | | | | 277,146 | | | | 14,708 | | | | 43,760 | | | | 171,743 | | | | 932,423 | | | | 1,343,071 | | | | 309,959 | | | | 61,154 | | | | 183,166 | | | | 788,792 | |
| | | | | | | | | | | | | | | | | | | | | | | | | | | | | | | | | | | | | |
F-42
| 24 | | Financial instruments (continued) |
|
| (c) | | Interest rate risk |
|
| | The Group’s interest-rate risk arises mainly from its 10-year senior notes which bear interest at the fixed rate of 8.75% per annum. Borrowings issued at fixed rate expose the Group to fair value interest-rate risk. |
|
| (i) | | Interest rate profile |
|
| | The following table details the interest rate profile of the Group’s borrowings at the balance sheet date. |
| | | | | | | | | | | | | | | | | |
| | | 2009 | | | 2008 | |
| | | Effective | | | | | | | Effective | | | | |
| | | interest | | | | | | | interest | | | | |
| | | rate | | | | | | | rate | | | | |
| | | % | | | HK$’000 | | | % | | | HK$’000 | |
Fixed rate borrowings: | | | | | | | | | | | | | | | | |
| | | | | | | | | | | | | | | | | |
| 10-year senior notes | | | 9.2 | | | | 162,586 | | | | 9.2 | | | | 683,242 | |
| Obligations under finance lease | | | 5.6 | | | | 732 | | | | 6.8 | | | | 376 | |
| | | | | | | | | | | | | | | |
| | | | | | | | | | | | | | | | | |
| | | | | | | | 163,318 | | | | | | | | 683,618 | |
| | | | | | | | | | | | | | | |
| (ii) | | Sensitivity analysis |
|
| | Management determines that the Group’s exposure of interest rate risk was not significant and hence no sensitivity analysis is prepared. |
|
| (d) | | Foreign currency risk |
|
| | All the Group’s monetary assets and liabilities are primarily denominated in either Hong Kong dollars or United States dollars. Given the exchange rate of the Hong Kong dollar to the U.S. dollar has remained close to the current pegged rate of HKD7.80 = USD1.00 since 1983, management does not expect significant foreign exchange gains or losses between the two currencies. |
|
| | The Group is also exposed to a certain amount of foreign exchange risk based on fluctuations between the Hong Kong dollars and the Renminbi arising from its operations in the PRC. In order to limit this foreign currency risk exposure, the Group maintained Renminbi cash balance that approximate two to three months’ of operating cash flows. |
|
| (i) | | Exposure to currency risk |
|
| | The following table details the Group’s exposure at the balance sheet date to currency risk arising from recognized assets or liabilities denominated in a currency other than the functional currency of the entity to which they relate. |
| | | | | | | | | | | | | | | | | | | | | | | | | |
| | | 2009 | | | 2008 | |
| | | United | | | | | | | | | | | United | | | | | | | |
| | | States | | | Japanese | | | Canadian | | | States | | | Japanese | | | Canadian | |
| | | Dollars | | | Yen | | | Dollars | | | Dollars | | | Yen | | | Dollars | |
| | | ‘000 | | | ‘000 | | | ‘000 | | | ‘000 | | | ‘000 | | | ‘000 | |
| Cash at bank and in hand and pledged bank deposits | | | 11,599 | | | | 696 | | | | 282 | | | | 22,330 | | | | 1,099 | | | | 176 | |
| Accounts payable | | | (3,183 | ) | | | — | | | | — | | | | (2,500 | ) | | | — | | | | — | |
| Other payables and accrued charges | | | (390 | ) | | | — | | | | — | | | | (3,390 | ) | | | — | | | | — | |
| 10-year senior notes | | | (20,979 | ) | | | — | | | | — | | | | (87,483 | ) | | | — | | | | — | |
| | | | | | | | | | | | | | | | | | | |
| | | | | | | | | | | | | | | | | | | | | | | | | |
| Overall net exposure | | | (12,953 | ) | | | 696 | | | | 282 | | | | (71,043 | ) | | | 1,099 | | | | 176 | |
| | | | | | | | | | | | | | | | | | | |
| (ii) | | Sensitivity analysis |
|
| | Management determines that the Group’s exposure of foreign currency risk was not significant and hence no sensitivity analysis is prepared. |
F-43
| 24 | | Financial instruments (continued) |
|
| (e) | | Fair values |
|
| | Except for the following instruments, all financial instruments are carried at amounts not materially different from their fair values as at August 31, 2009 and 2008: |
| | | | | | | | | | | | | | | | | |
| | | 2009 | | | 2008 | |
| | | Carrying | | | | | | | Carrying | | | | |
| | | amount | | | Fair value | | | amount | | | Fair value | |
| | | HK$’000 | | | HK$’000 | | | HK$’000 | | | HK$’000 | |
| 10-year senior notes | | | 162,586 | | | | 157,285 | | | | 683,242 | | | | 672,236 | |
| | | | | | | | | | | | | |
| (f) | | Estimation of fair values |
|
| | Fair value of financial instruments is estimated as follows: |
| (i) | | The fair value of the 10-year senior notes is determined based on quoted market price. |
|
| (ii) | | Accounts receivable, other receivables, deposits and prepayments, pledged bank deposit, cash at bank and in hand, accounts payable, and other payables and accrued charges are assumed to approximate their fair values as they can be realized or settled within twelve months after the balance sheet date. |
| | | | | | | | | |
| | | 2009 | | | 2008 | |
| | | HK$’000 | | | HK$’000 | |
| Bank guarantees provided to suppliers (notes 27(i) and (ii)) | | | 2,490 | | | | 24,671 | |
| Bank guarantee in lieu of payment of utility deposits (note 27(iii)) | | | 5,272 | | | | 5,272 | |
| | | | | | | |
| | | | 7,762 | | | | 29,943 | |
| | | | | | | |
| 26 | | Commitments |
|
| (a) | | Capital commitments |
| | | | | | | | | |
| | | 2009 | | | 2008 | |
| | | HK$’000 | | | HK$’000 | |
| Purchase of telecommunications, computer and office equipment | | | | | | | | |
| - contracted but not provided for | | | 150,099 | | | | 143,888 | |
| | | | | | | |
| (b) | | Commitments under operating leases |
|
| | At August 31, 2009 and 2008, the Group has future aggregate minimum lease payments under non-cancellable operating leases as follows: |
| | | | | | | | | |
| | | 2009 | | | 2008 | |
| | | HK$’000 | | | HK$’000 | |
| Leases in respect of land and buildings which are payable: | | | | | | | | |
| - Within 1 year | | | 21,387 | | | | 16,472 | |
| - After 1 year but within 5 years | | | 13,802 | | | | 11,645 | |
| | | | | | | |
| | | | 35,189 | | | | 28,117 | |
| | | | | | | |
| | | | | | | | | |
| Leases in respect of telecommunications facilities and computer equipment which are payable | | | | | | | | |
| - Within 1 year | | | 45,321 | | | | 38,623 | |
| - After 1 year but within 5 years | | | 9,600 | | | | 12,876 | |
| - After 5 years | | | 6,271 | | | | 7,384 | |
| | | | | | | |
| | | | 61,192 | | | | 58,883 | |
| | | | | | | |
| | | | 96,381 | | | | 87,000 | |
| | | | | | | |
F-44
| 26 | | Commitments (continued) |
|
| (c) | | Program fee commitments |
|
| | The Group entered into several long-term agreements with program content providers for the rights to use certain program contents in the Group’s IP-TV services. Minimum amounts of program fees to be paid by the Group are as follows: |
| | | | | | | | | |
| | | 2009 | | | 2008 | |
| | | HK$’000 | | | HK$’000 | |
| Program fee in respect of program rights which are payable: | | | | | | | | |
| - Within 1 year | | | 9,094 | | | | 6,583 | |
| - After 1 year but within 5 years | | | 6,238 | | | | 279 | |
| | | | | | | |
| | | | | | | | | |
| | | | 15,332 | | | | 6,862 | |
| | | | | | | |
| 27 | | Pledge of assets |
|
| | As at August 31, 2009, the Group has pledged bank deposits of US$650,000 (equivalent to HK$5,038,000) and HK$10,000,000 as security for the following significant banking facilities: |
| (i) | | bank facility of US$650,000 (equivalent to HK$5,038,000) granted by a bank for issuance of bank guarantees to third party suppliers, letters of credit, short-term loan, overdraft, foreign exchange and interest rate hedging arrangements. As of August 31, 2009, bank guarantees of HK$500,000 were issued against this bank facility (2008: HK$20,371,000); |
|
| (ii) | | bank guarantees of HK$1,990,000 (2008: HK$4,300,000) issued by the bank to third party suppliers of the Company and one of its subsidiaries for payment of certain products and services procured by the Group from these third party suppliers; and |
|
| (iii) | | bank guarantees of HK$5,272,000 (2008: HK$5,272,000) issued by the bank to certain utility vendors of the Group in lieu of payment of utility deposits. |
| | As at August 31, 2008, the Group had pledged bank deposits of US$9,900,000 (equivalent of HK$77,319,000) and HK$10,000,000 as security of the above significant banking facilities. |
|
| 28 | | Material related party transactions |
|
| | In addition to the transactions and balances disclosed elsewhere in these financial statements, the Group entered into the following material related party transactions. |
|
| | Key management personnel remuneration |
|
| | Remuneration for key management personnel, including amounts paid to the Company’s directors as disclosed in note 9(a) and certain of the highest paid employees as disclosed in note 9(b), is as follows: |
| | | | | | | | | |
| | | 2009 | | | 2008 | |
| | | HK$’000 | | | HK$’000 | |
| Short-term employee benefits | | | 34,687 | | | | 28,850 | |
| Post-employment benefits | | | 2,614 | | | | 2,425 | |
| Equity compensation benefits | | | 4,071 | | | | 3,664 | |
| | | | | | | |
| | | | | | | | | |
| | | | 41,372 | | | | 34,939 | |
| | | | | | | |
| 29 | | Comparative figure |
|
| | Certain comparative figures have been reclassified to conform with the current year’s presentation. |
F-45
| 30 | | Accounting estimates and judgments |
| | Key sources of estimation uncertainty |
|
| | Notes 10 and 24 contain information about the assumptions and risk factors relating to fair value of share options and financial instruments. Other key sources of estimation uncertainty are as follows: |
|
| | Impairment loss for doubtful accounts |
|
| | The Group maintains impairment loss for doubtful accounts based upon evaluation of the recoverability of the accounts receivable and other receivables which takes into account the historical write-off experience and recovery rates. If the financial condition of the customers were to deteriorate, additional impairment may be required. |
|
| | Depreciation |
|
| | Depreciation is calculated to write off the cost of items of property, plant and equipment, less their estimated residual value, if any, using the straight-line method over their estimated useful lives. The Group reviews the estimated useful lives of the assets annually in order to determine the amount of depreciation expense to be recorded during any reporting period. The useful lives are based on the Group’s historical experience with similar assets and takes into account anticipated technological changes. The depreciation expense for future periods is adjusted if there are significant changes from previous estimates. |
|
| | Deferred tax |
|
| | At August 31, 2009, the Group has recognized a deferred tax asset in relation to tax losses carry forward as set out in note 21. The realisability of the deferred tax asset depends on whether it is probable that future taxable profits will be available against which the asset can be utilized. In assessing the need to recognize a deferred tax asset, management consider all available evidence, including projected future taxable income, tax planning strategies, historical taxable income, and the expiration periods of the tax losses. In cases where the actual future taxable profits are less than expected, a reversal of deferred tax asset may arise, which will be recognized in the income statement for the period in which such a reversal takes place. |
| 31 | | Possible impact of amendments, new standards and interpretations issued but not yet effective for the year ended August 31, 2009 |
| | Up to the date of issue of these financial statements, the IASB has issued a number of amendments, new standards and interpretations which are not yet effective for the year ended August 31, 2009 and which have not been adopted in these financial statements. |
|
| | The Group is in the process of making an assessment of what the impact of these amendments, new standards and new interpretations is expected to be in the period of initial application. So far it has concluded that the adoption of the following developments is unlikely to have significant impact on the Group’s results of operations and financial position. |
| | | | |
| | | | Effective for |
| | | | accounting periods |
| | | | beginning on or after |
| IAS 1 (Revised) | | Presentation of financial statements | | January 1, 20072009 |
| | | | |
HKFRSIAS 23 (Revised) | | Borrowing costs | | January 1, 2009 |
| | | | |
| IFRS 8 | | Operating segments
| | January 1, 2009 |
In respect of other amendments, new standards and new interpretations, the Group is not yet in a position to state whether they would have a significant impact on the Group’s results of operations and financial position.F-46
City Telecom (H.K.) Limited
Consolidated financial statements for the year August 31, 2007
28 | New effective standards/recent accounting pronouncements (continued) |
FASB Interpretation No. 48 (“FIN 48”)
In June 2006, the FASB issued FIN 48, Accounting for Uncertainty in Income Taxes—an Interpretation of FASB Statements No. 109, which clarifies the accounting for uncertainty in tax positions. This interpretation requires that the Group recognizes in the consolidated financial statements the impact of a tax position, if that position is more likely than not of being sustained upon examination, based on the technical merits of the position. FIN 48 will be effective for the accounting period from September 1, 2007. Management does not expect the adoption of this interpretation to have a material effect on the Group’s consolidated financial statements.
Statement of Financial Accounting Standards No. 157 (“SFAS 157”)
In September 2006, the FASB issued SFAS 157, “Fair Value Measurements”, which defines fair value, provides a framework for measuring the fair value, and expands the disclosures required for fair value measurements. SFAS 157 does not require any new fair value measurement. SFAS 157 is effective for fiscal years beginning after November 15, 2007. The Group is in the process of evaluating the impact of this standard.
Statement of Financial Accounting Standards No. 159 (“FAS 159”)
In February 2007, the FASB issued SFAS 159, “Fair Value Option for Financial Assets and Financial Liabilities”. SFAS 159 permits companies to measure certain financial instruments and certain other items at fair value. The standard requires that unrealized gains or losses on items for which the fair value option has been elected be reported in earnings. SFAS 159 is effective for the Company on 1 September 2008. The Group is in the process of evaluating the impact of this standard.
City Telecom (H.K.) Limited
Consolidated financial statements for the year August 31, 2007
29 | Summary of significant differences between HKFRSs and U.S. GAAP |
The Group’s consolidated financial statements are prepared in accordance with HKFRSs, which differ in certain significant respects from U.S. GAAP. The following are significant differences between HKFRSs and U.S. GAAP which pertain to the Group:
City Telecom (H.K.) Limited
Consolidated financial statements for the year August 31, 2007
29 | Summary of significant differences between HKFRSs and U.S. GAAP (continued) |
Net income/(loss)
| | | | | | | | | | |
| | | | | Year ended 31 August, |
| | | Note | | 2005 | | | 2006 | | | 2007 |
| | | | | HK$’000 | | | HK$’000 | | | HK$’000 |
As reported under HKFRSs | | | | (163,496 | ) | | (142,062 | ) | | 28,865 |
| | | | |
U.S. GAAP adjustments: | | | | | | | | | | |
- Share-based compensation under intrinsic Value method | | (a) | | 389 | | | — | | | — |
- Reversal of retrospective HK GAAP adjustment in respect of share-based compensation | | (a) | | 6,965 | | | — | | | — |
- Reversal of amortization of goodwill (acquired after June 30, 2001) | | (b) | | 1,065 | | | — | | | — |
- Fair value of interest rate swap | | (c) | | 1,890 | | | — | | | — |
- Fair value of foreign forward exchange contracts | | (c) | | 4,039 | | | — | | | — |
- Tax effect of U.S. GAAP adjustments | | (d) | | — | | | — | | | — |
| | | | | | | | | | |
Net income/(loss) under U.S. GAAP | | | | (149,148 | ) | | (142,062 | ) | | 28,865 |
| | | | | | | | | | |
Basic weighted average common shares issued and outstanding (in 000’s) | | | | 613,525 | | | 614,134 | | | 614,840 |
Incremental shares from assumed exercise of share options (in 000’s) | | | | — | | | — | | | 16,479 |
| | | | | | | | | | |
Diluted weighted average common and potential shares issued and outstanding (in 000’s) | | ‘’ | | 613,525 | | | 614,134 | | | 631,319 |
| | | | | | | | | | |
Earnings/(loss) per share under U.S. GAAP (note) | | | | | | | | | | |
- Basic | | | | (24.3) cents | | | (23.1) cents | | | 4.7 cents |
| | | | | | | | | | |
- Diluted | | | | (24.3) cents | | | (23.1) cents | | | 4.6 cents |
| | | | | | | | | | |
| Note: | The number of incremental shares from assumed exercise of stock options and warrants is determined using the treasury stock method. At August 31, 2005 and 2006, the number of shares used in the calculation of diluted loss per share is equal to the basic weighted average common shares issued and outstanding as the incremental effect of outstanding share options would be anti-dilutive in a loss making year. |
City Telecom (H.K.) Limited
Consolidated financial statements for the year August 31, 2007
29 | Summary of significant differences between HKFRSs and U.S. GAAP (continued) |
Total shareholders’ equity
| | | | | | | | | | | |
| | | | | Year ended August 31, | |
| | | Note | | 2005 | | | 2006 | | | 2007 | |
| | | | | HK$’000 | | | HK$’000 | | | HK$’000 | |
Total shareholders’ equity | | | | | | | | | | | |
| | | | |
As reported under HKFRSs | | | | 1,020,454 | | | 891,654 | | | 903,882 | |
| | | | |
U.S. GAAP adjustments: | | | | | | | | | | | |
- Goodwill | | (b) | | 5,092 | | | 5,092 | | | 5,092 | |
- Accumulated amortization of goodwill | | (b) | | (3,735 | ) | | (3,735 | ) | | (3,735 | ) |
- Reversal of amortization of goodwill | | (b) | | 4,260 | | | 4,260 | | | 4,260 | |
- Fair value of interest rate swap | | (c) | | 2,570 | | | — | | | — | |
- Fair value of forward foreign exchange contracts | | (c) | | 4,039 | | | | | | | |
- Tax effect of U.S. GAAP adjustments | | (d) | | — | | | — | | | — | |
| | | | | | | | | | | |
Total shareholders’ equity under U.S. GAAP | | | | 1,032,680 | | | 897,271 | | | 909,499 | |
| | | | | | | | | | | |
Condensed consolidated statements of operations
| | | | | | | | | |
| | | Year ended August 31, | |
| | | 2005 | | | 2006 | | | 2007 | |
| | | HK$’000 | | | HK$’000 | | | HK$’000 | |
Revenue, net | | 1,162,059 | | | 1,134,876 | | | 1,141,270 | |
| | | | | | | | | |
Operating expenses: | | | | | | | | | |
- Network costs | | (550,029 | ) | | (554,136 | ) | | (451,080 | ) |
- Sales and marketing expenses | | (267,423 | ) | | (204,952 | ) | | (203,673 | ) |
- General and administrative expenses | | (436,117 | ) | | (443,850 | ) | | (387,373 | ) |
- Provision for doubtful accounts | | (35,445 | ) | | (17,450 | ) | | (6,569 | ) |
| | | | | | | | | |
Income/(loss) from operations | | (126,955 | ) | | (85,512 | ) | | 92,575 | |
Interest income | | 13,578 | | | 20,378 | | | 22,671 | |
Interest expense | | (54,462 | ) | | (88,637 | ) | | (87,504 | ) |
Other income, net | | 11,966 | | | 4,465 | | | 3,149 | |
| | | | | | | | | |
Income/(loss) before income taxes | | (155,873 | ) | | (149,306 | ) | | 30,891 | |
Income tax (expense)/credit | | 6,725 | | | 7,244 | | | (2,026 | ) |
| | | | | | | | | |
Net income/(loss) | | (149,148 | ) | | (142,062 | ) | | 28,865 | |
| | | | | | | | | |
City Telecom (H.K.) Limited
Consolidated financial statements for the year August 31, 2007
29 | Summary of significant differences between HKFRSs and U.S. GAAP (continued) |
Statement of changes in shareholders’ equity
| | | | | | | | | | | | | | | | | | | | | |
| | | Ordinary shares | | Additional paid-in capital | | | | | | | | | | | | | |
| | | Number of
shares
outstanding | | Amount
outstanding | | Share premium | | Warrant
reserve | | | Cumulative foreign
currency
translation
reserve | | | Capital
reserve | | | Retained profits | | | Total
shareholders’
equity | |
| | | | | HK$ | | HK$ | | HK$ | | | HK$ | | | HK$ | | | HK$ | | | HK$ | |
| | | | | (Amounts in thousands, except number of shares) | |
Balance at August 31, 2004 | | 610,573,361 | | 61,057 | | 617,986 | | 365 | | | 983 | | | 28,204 | | | 472,335 | | | 1,180,930 | |
Shares issued upon exercise of share options | | 52,000 | | 5 | | 25 | | — | | | — | | | — | | | — | | | 30 | |
Compensation cost for share options | | — | | — | | — | | — | | | — | | | (389 | ) | | — | | | (389 | ) |
Release of warrant reserve upon warrant expiration | | — | | — | | — | | (18 | ) | | — | | | — | | | 18 | | | — | |
Shares issued upon exercise of warrants | | 3,500,043 | | 350 | | 1,397 | | (347 | ) | | — | | | — | | | — | | | 1,400 | |
Net loss | | — | | — | | — | | — | | | — | | | — | | | (149,148 | ) | | (149,148 | ) |
Foreign currency translation adjustment | | — | | — | | — | | — | | | (143 | ) | | — | | | — | | | (143 | ) |
| | | | | | | | | | | | | | | | | | | | | |
Balance at August 31, 2005 | | 614,125,404 | | 61,412 | | 619,408 | | — | | | 840 | | | 27,815 | | | 323,205 | | | 1,032,680 | |
Shares issued upon exercise of share options | | 5,000 | | 5 | | 8 | | — | | | — | | | — | | | — | | | 13 | |
Compensation cost for share options | | — | | — | | 251 | | — | | | — | | | 6,572 | | | — | | | 6,823 | |
Net loss | | — | | — | | — | | — | | | — | | | — | | | (142,062 | ) | | (142,062 | ) |
Foreign currency translation adjustment | | — | | — | | — | | — | | | (183 | ) | | — | | | — | | | (183 | ) |
| | | | | | | | | | | | | | | | | | | | | |
Balance at August 31, 2006 | | 614,175,404 | | 61,417 | | 619,667 | | — | | | 657 | | | 34,387 | | | 181,143 | | | 897,271 | |
Shares issued upon exercise of share options | | 2,328,000 | | 233 | | 2,135 | | — | | | — | | | (611 | ) | | — | | | 1,757 | |
Compensation cost for share options | | — | | — | | — | | — | | | — | | | 5,727 | | | — | | | 5,727 | |
Net income | | — | | — | | — | | — | | | — | | | — | | | 28,865 | | | 28,865 | |
2007 interim dividend declared and paid | | — | | — | | — | | — | | | — | | | — | | | (24,635 | ) | | (24,635 | ) |
Foreign currency translation adjustment | | — | | — | | — | | — | | | 514 | | | — | | | — | | | 514 | |
| | | | | | | | | | | | | | | | | | | | | |
Balance at August 31, 2007 | | 616,503,404 | | 61,650 | | 621,802 | | — | | | 1,171 | | | 39,503 | | | 185,373 | | | 909,499 | |
| | | | | | | | | | | | | | | | | | | | | |
City Telecom (H.K.) Limited
Consolidated financial statements for the year August 31, 2007
29 | Summary of significant differences between HKFRSs and U.S. GAAP (continued) |
Comprehensive (loss)/income
The comprehensive (loss)/income of the Group, determined in accordance with Statement of Financial Accounting Standards (“SFAS”) No. 130 “Reporting Comprehensive Income”, is set out as follows:
| | | | | | | | |
| | | Year ended August 31, |
| | | 2005 | | | 2006 | | | 2007 |
| | | HK$’000 | | | HK$’000 | | | HK$’000 |
(Loss)/Net income under U.S. GAAP | | (149,148 | ) | | (142,062 | ) | | 28,865 |
Foreign currency translation adjustment | | (143 | ) | | (183 | ) | | 514 |
| | | | | | | | |
Comprehensive (loss)/income | | (149,291 | ) | | (142,245 | ) | | 29,379 |
| | | | | | | | |
Condensed consolidated statement of cash flows
Under HKFRSs, in adopting HKAS 7, three categories of activities are reported: operating activities; investing activities and financing activities, which is similar to U.S. GAAP. However, under HKFRSs, the difference is that cash flows from interest income would be included in investing activities whereas under U.S. GAAP it would be included in operating activities.
Summary cash flow information under U.S. GAAP is as follows:
| | | | | | | | | |
| | | Year ended August 31, | |
| | | 2005 | | | 2006 | | | 2007 | |
| | | HK$’000 | | | HK$’000 | | | HK$’000 | |
Net cash provided by operating activities | | 90,984 | | | 204,583 | | | 406,732 | |
Net cash (used in)/provided by investing activities | | (571,018 | ) | | (513,120 | ) | | 91,382 | |
Net cash provided by/(used in) financing activities | | 773,023 | | | (86,486 | ) | | (109,566 | ) |
| | | | | | | | | |
Increase/(decrease) in cash and bank balances | | 292,989 | | | (395,023 | ) | | 388,548 | |
Cash and bank balances at the beginning of year | | 247,517 | | | 539,591 | | | 144,917 | |
Effect of foreign exchange rate changes | | (915 | ) | | 349 | | | (571 | ) |
| | | | | | | | | |
Cash and bank balances at the end of year | | 539,591 | | | 144,917 | | | 532,894 | |
| | | | | | | | | |
City Telecom (H.K.) Limited
Consolidated financial statements for the year August 31, 2007
29 | Summary of significant differences between HKFRSs and U.S. GAAP (continued) |
(a) | Share-based compensation |
Prior to HKFRS 2 “Share-based payment” becoming effective for the fiscal year beginning on September 1, 2005, no staff compensation cost was recognized in respect of the grant of share options. Proceeds from the issuance of shares upon the exercise of share options were credited to share capital and share premium accounts. With effect from September 1, 2005, in order to comply with HKFRS 2, the Group recognizes the fair value of share options as compensation expense, or an asset, if the cost qualifies for recognition as an asset with the corresponding increase to capital reserve. The new accounting policy has been applied retrospectively with comparatives restated in accordance with HKFRS 2. The impact of the restatement for the year ended August 31, 2005 was HK$6,965,000 which was reversed under U.S. GAAP.
Under U.S. GAAP, for periods ended on or prior to August 31, 2005, the Group applied the provisions of Accounting Principles Board Opinion No. 25, “Accounting for Stock Issued to Employees” (“APB 25”) and related interpretations to account for share options. Under APB 25, share-based compensation was recorded on the date of grant only if the then market price of the underlying stock exceeded the exercise price of the share options.
For the year ended August 31, 2005, under U.S. GAAP, the Group recognized share-based compensation expenses of HK$389,000 because options were granted when the then market price of the underlying ordinary share exceeded the exercise price of the share options as described in the following. On October 21, 2004, the Company issued 14,670,000 share options to employees at an exercise price of HK$1.54 each when the market value of the ordinary shares on that date was HK$1.49. The difference of HK$0.05 between the exercise price and the market value of the ordinary shares was recognized in the consolidated statement of operations over the vesting period. On January 4, 2005, the Company issued 16,000,000 share options to certain directors of the Group at an exercise price of HK$1.54 each when the market value of the ordinary shares of the Company was HK$1.48. The difference of HK$0.06 between the exercise price and the market value of the ordinary shares was recognized in the consolidated statement of operations over the vesting period.
City Telecom (H.K.) Limited
Consolidated financial statements for the year August 31, 2007
29 | Summary of differences between HKFRSs and U.S. GAAP (continued) |
(a) | Share-based compensation (continued) |
On September 1, 2005, the Group adopted SFAS No. 123 (revised 2004) (“SFAS No. 123(R)”). SFAS No. 123(R) replaces SFAS No.123 “Accounting for Stock-Based Compensation” and supersedes APB 25. Under SFAS No. 123(R), the Group is required to measure the cost of employee services received in exchange for an award of equity instruments based on the grant-date fair value of the award and to recognize the cost over the period during which an employee is required to provide service in exchange for the award. In applying the transition provisions of SFAS No.123(R), the Group used the modified prospective method in which the grant-date fair values of unvested awards that are outstanding on the date of adoption are charged to expense over their remaining vesting periods.
As a result of the adoption of HKFRS 2 and SFAS No. 123(R) on September 1, 2005, there was no difference arising from the recognition of share-based compensation because there was no difference in the results of applying the transitional provisions under HKFRSs and U.S. GAAP and the methods used to determined the share-based compensation were the same under HKFRSs and U.S. GAAP.
The following table illustrates the pro forma effect on net income as if the fair-value-based method under SFAS No. 123 had been applied to all outstanding and unvested share options for the year ended August 31, 2005.
| | | |
| 32 | | Year ended
August 31, 2005Supplemental guarantors consolidated financial information |
| |
| | | HK$’000 | The senior notes mentioned above in note 22 are fully, irrevocably and unconditionally guaranteed, jointly and severally, on a senior unsecured basis by all of the subsidiaries of City Telecom (H.K.) Limited (collectively defined as “Guarantor Subsidiaries”), except CTI Guangzhou Customer Services Co. Ltd. in the PRC (“Non-guarantor Subsidiary”). |
Net loss
| | | |
| |
As reported
| | (149,148 | ) |
Less: Total share-based compensation expense determined under intrinsic value method for all awards
| | (389 | ) |
Less: Total share-based compensation expense determined under fair value method for all awards, net of tax
| | (20,547 | ) |
| | | |
| | (170,084 | ) |
| | | |
Basic loss per share
| | | |
| |
As reported
| | HK(24.3) cents | |
Pro forma
| | HK(27.7) cents | |
| |
Diluted loss per share
| | | |
| |
As reported
| | HK(24.3) cents | |
Pro forma
| | HK(27.7) cents | |
City Telecom (H.K.) Limited
Consolidated financial statements for the year August 31, 2007
29 | Summary of differences between HKFRSs and U.S. GAAP (continued) |
(a) | Share-based compensation (continued) |
The weighted average fair value of share options at the date of grant was HK$0.82 per option for the year ended August 31, 2005. The value was estimated using the Black-Scholes option pricing model with the following weighted average assumptions:
| | | |
| | Year ended
August 31, 2005 | |
| | | HK$’000The condensed consolidated financial information is presented below and should be read in connection with the consolidated financial statements of City Telecom (H.K.) Limited prepared under IFRSs. Separate financial statements of the Guarantor Subsidiaries are not presented because the Guarantor Subsidiaries are wholly-owned and have fully and unconditionally guaranteed the Notes on a joint and several basis. |
| |
Weighted average
| | | The following condensed consolidated financial information presents the consolidated balance sheets as of August 31, 2008 and 2009 and the related consolidated income statements and cash flow statements for the years ended August 31, 2008 and 2009 of (a) City Telecom (H.K.) Limited, the parent; (b) the Guarantor Subsidiaries on a combined basis; (c) the Non-guarantor Subsidiary; (d) eliminating entries; and (e) the total consolidated amounts. |
F-47
| |
Risk-free interest rates
32 | | 2.7 | % |
Dividend yield
| | 1 | % |
Volatility factor of the expected market price of the Company’s shares
| | 70.66 | % |
Expected life of the options
| | 5 years | |
Prior to September 1, 2001, goodwill arising from a business combination was charged against available reserves. In January 2001, HKICPA issued Statement of Standard Accounting Practice (“SSAP”) No. 30 “Business Combinations” which applied to business combinations for which the agreement date is on or after September 1, 2001. As a result of the adoption of this SSAP in the fiscal year ended August 31, 2002 and up to September 1, 2005, goodwill on acquisitions occurring on or after September 1, 2001 was shown separately on the consolidated balance sheet and amortized using the straight-line method over its estimated useful life.
On September 1, 2005, the Group adopted HKFRS 3 “Business Combinations”. Under HKFRS 3, goodwill is recorded at cost less any accumulated impairment losses and is no longer amortized. Goodwill is subject to an annual impairment test and when there is an indication of impairment. An impairment loss is recognized when the carrying amount of the cash generating unit to which the goodwill has been allocated exceeds its recoverable amounts. In accordance with the transitional arrangements under HKFRS 3, goodwill which had previously been taken directly to reserves (i.e. goodwill which arose before September 1, 2001) is not recognized in the consolidated statement of operations on disposal or impairment of the acquired business, or under any other circumstances. The adoption of HKFRS 3 did not result in any restatement in the consolidated financial statements of prior years and therefore had no impact on U.S. GAAP adjustments of prior years.
City Telecom (H.K.) Limited
Consolidated financial statements for the year August 31, 2007
29 | Summary of differences between HKFRSs and U.S. GAAP (continued) |
Under U.S. GAAP, goodwill arising from a business combination is not amortized and is required to be tested annually for impairment in accordance with SFAS No. 142 “Goodwill and Other Intangible Assets”.
As a result of the adoption of HKFRS 3, there were no U.S. GAAP adjustments pertaining to goodwill for the years ended August 31, 2006 and 2007.
(c) | Derivative instruments |
Prior to September 1, 2005, derivative financial instruments entered into by the Group to hedge the interest rate risk of a recognized asset or liability or the foreign currency risk of a committed future transaction were recognized on an accrual basis with reference to the timing of the recognition of the hedged transaction.
With effect from September 1, 2005, and in accordance with HKAS 39, all derivative financial instruments entered into by the Group are stated at fair value. Changes in the fair value of derivatives that are designated and qualified as a cash flow hedge are recognized in equity to the extent that the hedge is effective and until the hedged transaction occurs. Any changes in fair value of derivative financial instruments which do not qualify as cash flow hedges are recognized in the consolidated statement of operations. The adoption of HKAS 39 did not result in any restatement in the consolidated financial statements of prior years and therefore had no impact on U.S. GAAP adjustments of prior years.
Under U.S. GAAP, the Group follows SFAS No. 133 “Accounting for Derivative Instruments and Hedge Activities”, as amended by SFAS No. 138 “Accounting for Certain Derivative Instruments and Certain Hedging Activities”, which requires all derivative instruments be recognized on the balance sheet at fair value. The accounting for changes in fair value depends on whether the derivative instrument qualifies as a hedge. Gains or loss on a derivative instrument designated and qualifying as a fair value hedge as well as the offsetting loss or gain on the hedged item attributable to the hedged risk shall be recognized currently in the consolidated statement of operations. The effective portion of the gain or loss on a derivative instrument designated and qualifying as a cash flow hedging instrument shall be reported as a component of other comprehensive income and reclassified into earnings in the same period or periods during which the hedged forecasted transaction impacts earnings. The ineffective portion of gain or loss on the derivative instrument, if any, shall be recognized currently in earnings. For derivative that does not qualify as a hedge, the gain or loss reflecting changes in fair value is recognized in earnings. As of the periods presented, none of the financial derivatives of the Group qualified as hedges.
As a result of the adoption of HKAS 39, there were no reconciling differences pertaining to derivative instruments for the years ended August 31, 2006 and 2007.
City Telecom (H.K.) Limited
Consolidated financial statements for the year August 31, 2007
29 | Summary of differences between HKFRSs and U.S. GAAP (continued) |
Under HKFRSs, deferred taxes are provided in full, using the liability method, on temporary differences arising between the tax bases of assets and liabilities and their carrying amounts in the financial statements.
Deferred tax assets are recognized to the extent that it is probable that future taxable profit will be available against which the temporary differences can be utilised.
Under U.S. GAAP, the Group is required to recognize deferred tax assets and liabilities for the expected future tax consequences of all events that have been included in the account or tax returns. Under this method, deferred tax assets and liabilities are determined based on the temporary differences between the financial reporting basis and tax basis of assets and liabilities using enacted tax rates in effect for the year in which the differences are expected to reverse. Future tax benefits in respect of tax losses carry forward are also required to be recognized in full. A valuation allowance is required to be established for such assets if it is more likely than not that the Group will not be able to utilize such benefits in the future.
There were no differences in the amount of deferred tax assets recognised under HKFRSs and U.S. GAAP. For the years ended August 31, 2005, 2006 and 2007, no adjustment was made for tax effects of U.S. GAAP adjustments because the U.S. GAAP adjustments in those years had no tax consequences under Hong Kong tax laws.
The following additional financial statements disclosures are required under U.S. GAAP and are presented on a U.S. GAAP basis.
| | | | | | |
| | | August 31, | |
| | | 2006 | | | 2007 | |
| | | HK$’000 | | | HK$’000 | |
Deferred tax assets: | | | | | | |
| | |
Tax losses | | 204,300 | | | 182,739 | |
Share-based payment | | 2,429 | | | — | |
| | | | | | |
Total gross deferred tax assets | | 206,729 | | | 182,739 | |
Valuation allowance | | (52,404 | ) | | (48,120 | ) |
| | | | | | |
Net deferred tax assets | | 154,325 | | | 134,619 | |
| | | | | | |
Deferred tax liabilities: | | | | | | |
| | |
Accelerated depreciation allowance | | (154,678 | ) | | (134,910 | ) |
| | | | | | |
Total gross deferred tax liabilities | | (154,678 | ) | | (134,910 | ) |
| | | | | | |
Net deferred tax liabilities | | (353 | ) | | (291 | ) |
| | | | | | |
City Telecom (H.K.) Limited
Consolidated financial statements for the year August 31, 2007
29 | Summary of differences between HKFRSs and U.S. GAAP (continued) |
(d) | Deferred taxes (continued) |
The tax effect on accumulated tax losses amounted to HK$182,739,000 (2006: HK$204,300,000). Realization of deferred tax assets associated with tax loss carrying forwards is dependent upon generating sufficient taxable income. As of August 31, 2007, a valuation allowance of HK$48,120,000 (2006: HK$52,404,000) has been provided against deferred tax assets since management believes it is more likely than not the Group will not be able to utilise such benefits in the foreseeable future.
Changes in the valuation allowance consist of:
| | | | | | | |
| | | Year ended August 31, | |
| | | 2005 | | 2006 | | 2007 | |
| | | HK$’000 | | HK$’000 | | HK$’000 | |
Balance at beginning of the year | | 7,633 | | 29,804 | | 52,404 | |
Addition/(reduction) to income tax expense | | 22,171 | | 22,600 | | (1,979 | ) |
Valuation allowance written off | | — | | — | | (2,305 | ) |
| | | | | | | |
Balance at end of the year | | 29,804 | | 52,404 | | 48,120 | |
| | | | | | | |
The Group’s investment securities consist of equity-indexed mutual fund securities and long-term bank deposits.
Under HKFRSs, the equity-linked mutual fund securities have been designated as financial asset at fair value through profit or loss as permitted under HKAS 39 “Financial Instruments: Recognition and Measurement”.
Under U.S. GAAP, the Group follows SFAS No. 133 “Accounting for Derivative Instruments and Hedging Activities” which requires the embedded derivative in the equity-linked mutual fund securities to be separated and accounted for as a derivative instrument, and the host contract to be accounted for based on generally accepted accounting principles applicable to the instruments of that type that do not contain derivative instruments. Accordingly, the host contracts of the equity-linked mutual fund securities are classified as held-to-maturity securities under SFAS No. 115 “Accounting for Certain Investments in Debt and Equity Securities” and measured at amortized cost while the embedded derivatives are accounted for in accordance with SFAS No. 133 and measured at fair value.
For the periods presented, there were no differences between i) the fair value of the equity-indexed debt securities; and ii) the aggregate of the amortized cost of the host contracts and the fair value of the embedded derivative instruments.
City Telecom (H.K.) Limited
Consolidated financial statements for the year August 31, 2007
29 | Summary of differences between HKFRSs and U.S. GAAP (continued) |
(f) | Deposits for purchase of fixed assets and lease of land and building |
Under HKFRSs, deposits for purchase of fixed assets and lease of land and buildings are classified as current assets if the amounts are expected to be realized within twelve months after the balance sheet date. Under U.S. GAAP, such deposits are classified as non-current assets. As at August 31, 2006 and 2007, deposits for purchase of fixed assets and lease of land and building were HK$17,873,000 and HK$13,263,000, respectively.
Under HKFRSs, debt issue costs are reported as a reduction against the related debt proceeds and amortized over the life of the related debt using effective interest method. Under U.S. GAAP, such costs are disclosed separately as non-current asset and are similarly amortized. As at August 31, 2006 and 2007, the unamortized debt issue costs were HK$24,473,000 and HK$22,336,000, respectively.
On December 28, 2007, subsequent to the issuance of the Group’s consolidated financial statements for the year ended August 31, 2007 for Hong Kong statutory purposes, the TA issued a statement (“TA statement”) on the USC and confirmed the actual contribution level for the period from January 1, 2005 to June 30, 2007. Based on the TA statement, management estimated that there will be a refund of previously contributed USC of HK$7,617,000, which is expected to be recorded as a reduction against the Group’s network costs for the fiscal year ending August 31, 2008.
Between September 1, 2007 and January 22, 2008, the Group repurchased the 8.75% senior notes with a cumulative principal value of US$21,850,000 (equivalent to HK$170,430,000) in the open market. The total consideration paid including accrued interest was approximately US$22,057,000 (equivalent to HK$172,044,600). The gain on extinguishment was approximately US$46,000 (equivalent to HK$359,000) which is expected to be recorded in the consolidated statement of operations for the year ending August 31, 2008. The principal value of the 8.75% notes remaining in issue after the repurchases is US$103,150,000 (equivalent to HK$804,570,000).
City Telecom (H.K.) Limited
Consolidated financial statements for the year August 31, 2007
31 | Supplemental guarantors consolidated financial information |
The senior notes mentioned above in note 13 are fully, irrevocably and unconditionally guaranteed, jointly and severally, on a senior unsecured basis by all of the subsidiaries of City Telecom (H.K.) Limited (collectively defined as “Guarantor Subsidiaries”), except CTI Guangzhou Customer Services Co. Ltd. in the PRC (“Non-guarantor Subsidiary”).
The condensed consolidated financial information is presented below and should be read in connection with the consolidated financial statements of City Telecom (H.K.) Limited prepared under HKFRSs. Separate financial statements of the Guarantor Subsidiaries are not presented because the Guarantor Subsidiaries are wholly-owned and have fully and unconditionally guaranteed the Notes on a joint and several basis. Reconciliations to U.S. GAAP are not presented because the majority of the reconciling items relate to City Telecom (H.K.) Limited and Guarantor Subsidiaries are already disclosed and explained in Note 29.
The following condensed consolidated financial information presents the condensed consolidated balance sheets as of August 31, 2006 and 2007 and the related condensed consolidated statements of operations and statements of cash flows for the years ended August 31, 2005, 2006 and 2007 of (a) City Telecom (H.K.) Limited, the parent; (b) the Guarantor Subsidiaries on a combined basis; (c) the Non-guarantor Subsidiary; (d) eliminating entries; and (e) the total consolidated amounts.
City Telecom (H.K.) Limited
Consolidated financial statements for the year August 31, 2007
31 | Supplemental guarantors consolidated financial information (continued) |
Condensed consolidated balance sheet as of August 31, 2007
| | | | | | | | | | | | |
| | | City Telecom (H.K.) Limited | | Guarantor subsidiaries | | Non- guarantor subsidiary | | | Eliminating entries | | | Consolidated total |
| | | HK$’000 | | HK$’000 | | HK$’000 | | | HK$’000 | | | HK$’000 |
Current assets | | | | | | | | | | | | |
| | | | | |
Cash and bank balances | | 220,531 | | 303,227 | | 9,136 | | | | | | 532,894 |
Pledged bank deposits | | 87,220 | | — | | — | | | | | | 87,220 |
Trade receivables, net | | 12,105 | | 158,446 | | — | | | | | | 170,551 |
Other receivables, deposits and prepayments | | 4,579 | | 56,290 | | 2,207 | | | (3,704 | ) | | 59,372 |
Inventories | | 477 | | — | | — | | | | | | 477 |
Investment securities | | — | | 3,779 | | — | | | | | | 3,779 |
Deferred expenditure | | — | | 13,584 | | — | | | | | | 13,584 |
| | | | | | | | | | | | |
Total current assets | | 324,912 | | 535,326 | | 11,343 | | | | | | 867,877 |
Fixed assets, net | | 100,201 | | 1,126,870 | | 10,152 | | | | | | 1,237,223 |
Investments in subsidiaries (note) | | 1,495,935 | | 274,449 | | — | | | (1,770,384 | ) | | — |
Investment securities | | 39,213 | | — | | — | | | | | | 39,213 |
Other long-term assets | | — | | 33,645 | | — | | | (16,825 | ) | | 16,820 |
| | | | | | | | | | | | |
Total assets | | 1,960,261 | | 1,970,290 | | 21,495 | | | | | | 2,161,133 |
| | | | | | | | | | | | |
Current liabilities | | | | | | | | | | | | |
| | | | | |
Amounts due to subsidiaries/ fellow subsidiaries | | 10,830 | | 1,490,567 | | (4,771 | ) | | (1,496,626 | ) | | — |
Trade payables | | 37,477 | | 38,542 | | — | | | | | | 76,019 |
Deposits received | | 7,876 | | 8,312 | | — | | | | | | 16,188 |
Current portion of deferred service income | | 11,380 | | 56,532 | | — | | | (3,710 | ) | | 64,202 |
Other payables and accrued charges | | 18,694 | | 119,642 | | 6,931 | | | | | | 145,267 |
Income tax payable | | 356 | | 62 | | 1,063 | | | | | | 1,481 |
Current portion of obligation under finance leases | | 104 | | 731 | | — | | | | | | 835 |
| | | | | | | | | | | | |
Total current liabilities | | 86,717 | | 1,714,388 | | 3,223 | | | | | | 303,992 |
Long-term liabilities | | 970,833 | | 386 | | (70 | ) | | (17,890 | ) | | 953,259 |
| | | | | | | | | | | | |
Total liabilities | | 1,057,550 | | 1,714,774 | | 3,153 | | | | | | 1,257,251 |
| | | | | | | | | | | | |
City Telecom (H.K.) Limited
Consolidated financial statements for the year August 31, 2007
31 | Supplemental guarantors consolidated financial information (continued) |
Condensed consolidated balance sheet as of August 31, 2007 (continued)
| | | | | | | | | | | | |
| | | City Telecom (H.K.) Limited | | Guarantor subsidiaries | | | Non- guarantor subsidiary | | Eliminating entries | | | Consolidated total |
| | | HK$’000 | | HK$’000 | | | HK$’000 | | HK$’000 | | | HK$’000 |
Commitments andcontingencies | | | | | | | | | | | | |
| | | | | |
Shareholders’ equity | | | | | | | | | | | | |
- Ordinary shares, par value | | | | | | | | | | | | |
HK$0.1 per share | | | | | | | | | | | | |
- 2,000,000,000 shares authorized | | | | | | | | | | | | |
- 616,503,404 shares issued and outstanding at August 31, 2007 | | 61,650 | | 15,485 | | | 8,131 | | (23,616 | ) | | 61,650 |
Share premium | | 622,433 | | 470,836 | | | — | | (470,836 | ) | | 622,433 |
Retained profits/(accumulated losses) | | 200,519 | | (230,666 | ) | | 9,033 | | 221,633 | | | 200,519 |
Other reserves | | 18,109 | | (139 | ) | | 1,178 | | 132 | | | 19,280 |
| | | | | | | | | | | | |
Total shareholders’ equity | | 902,711 | | 255,516 | | | 18,342 | | | | | 903,882 |
| | | | | | | | | | | | |
Total liabilities and shareholders’ equity | | 1,960,261 | | 1,970,290 | | | 21,495 | | | | | 2,161,133 |
| | | | | | | | | | | | |
| | | Consolidated balance sheet as of August 31, 2009 |
| | | | | | | | | | | | | | | | | | | | | |
| | | City | | | | | | | | | | |
| | | Telecom | | | | | | Non- | | | | |
| | | (H.K.) | | Guarantor | | guarantor | | Eliminating | | Consolidated |
| | | Limited | | subsidiaries | | subsidiary | | entries | | total |
| | | HK$’000 | | HK$’000 | | HK$’000 | | HK$’000 | | HK$’000 |
Non-current assets | | | | | | | | | | | | | | | | | | | | |
| | | | | | | | | | | | | | | | | | | | | |
| Investments in subsidiaries (note) | | | 1,258,726 | | | | 228,875 | | | | — | | | | (1,487,601 | ) | | | — | |
| Goodwill | | | — | | | | — | | | | — | | | | 1,066 | | | | 1,066 | |
| Fixed assets | | | 74,688 | | | | 1,221,172 | | | | 6,520 | | | | | | | | 1,302,380 | |
| Long term receivable and prepayment | | | — | | | | 16,573 | | | | — | | | | (10,482 | ) | | | 6,091 | |
| Deferred expenditure | | | — | | | | 12,786 | | | | — | | | | | | | | 12,786 | |
| | | | | | | | | | | | | | | | | | | | | |
| | | | | | | | | | | | | | | | | | | | | |
| | | | 1,333,414 | | | | 1,479,406 | | | | 6,520 | | | | | | | | 1,322,323 | |
| | | | | | | | | | | | | | | | | | | | | |
| | | | | | | | | | | | | | | | | | | | | |
Current assets | | | | | | | | | | | | | | | | | | | | |
| | | | | | | | | | | | | | | | | | | | | |
| Accounts receivable | | | 9,220 | | | | 110,972 | | | | — | | | | | | | | 120,192 | |
| Other receivables, deposits and prepayments | | | 3,393 | | | | 67,584 | | | | 2,492 | | | | (3,704 | ) | | | 69,765 | |
| Deferred expenditure | | | — | | | | 36,674 | | | | — | | | | | | | | 36,674 | |
| Pledged bank deposits | | | 15,038 | | | | — | | | | — | | | | | | | | 15,038 | |
| Cash at bank and in hand | | | 119,419 | | | | 74,197 | | | | 27,436 | | | | | | | | 221,052 | |
| | | | | | | | | | | | | | | | | | | | | |
| | | | | | | | | | | | | | | | | | | | | |
| | | | 147,070 | | | | 289,427 | | | | 29,928 | | | | | | | | 462,721 | |
| | | | | | | | | | | | | | | | | | | | | |
| | | | | | | | | | | | | | | | | | | | | |
Current liabilities | | | | | | | | | | | | | | | | | | | | |
| | | | | | | | | | | | | | | | | | | | | |
| Amounts due to subsidiaries/ fellow subsidiaries | | | 10,830 | | | | 905,460 | | | | 4,427 | | | | (920,717 | ) | | | — | |
| Accounts payable | | | 20,484 | | | | 17,071 | | | | — | | | | | | | | 37,555 | |
| Other payables and accrued charges | | | 23,530 | | | | 172,676 | | | | 10,281 | | | | | | | | 206,487 | |
| Deposits received | | | 7,886 | | | | 8,499 | | | | — | | | | | | | | 16,385 | |
| Deferred service revenue | | | 10,848 | | | | 107,904 | | | | — | | | | (3,682 | ) | | | 115,070 | |
| Tax payable | | | 356 | | | | 496 | | | | 1,141 | | | | | | | | 1,993 | |
| Current portion — obligation under finance leases | | | 193 | | | | 9 | | | | — | | | | | | | | 202 | |
| | | | | | | | | | | | | | | | | | | | | |
| | | | | | | | | | | | | | | | | | | | | |
| | | | 74,127 | | | | 1,212,115 | | | | 15,849 | | | | | | | | 377,692 | |
| | | | | | | | | | | | | | | | | | | | | |
| | | | | | | | | | | | | | | | | | | | | |
Net current assets/ (liabilities) | | | 72,943 | | | | (922,688 | ) | | | 14,079 | | | | | | | | 85,029 | |
| | | | | | | | | | | | | | | | | | | | | |
| | | | | | | | | | | | | | | | | | | | | |
Total assets less current liabilities | | | 1,406,357 | | | | 556,718 | | | | 20,599 | | | | | | | | 1,407,352 | |
| | | | | | | | | | | | | | | | | | | | | |
| | | | | | | | | | | | | | | | | | | | | |
Non-current liabilities | | | | | | | | | | | | | | | | | | | | |
| Deferred tax liabilities | | | 7,047 | | | | 8,662 | | | | — | | | | | | | | 15,709 | |
| Long-term deferred service revenue | | | 10,535 | | | | — | | | | — | | | | (10,535 | ) | | | — | |
| Long-term debt and other liabilities | | | 163,108 | | | | 8 | | | | — | | | | | | | | 163,116 | |
| | | | | | | | | | | | | | | | | | | | | |
| | | | | | | | | | | | | | | | | | | | | |
| | | | 180,690 | | | | 8,670 | | | | — | | | | | | | | 178,825 | |
| | | | | | | | | | | | | | | | | | | | | |
| | | | | | | | | | | | | | | | | | | | | |
Net assets | | | 1,225,667 | | | | 548,048 | | | | 20,599 | | | | | | | | 1,228,527 | |
| | | | | | | | | | | | | | | | | | | | | |
| | | | | | | | | | | | | | | | | | | | | |
Capital and reserves | | | | | | | | | | | | | | | | | | | | |
| | | | | | | | | | | | | | | | | | | | | |
| Share capital | | | 66,418 | | | | 15,485 | | | | 8,131 | | | | (23,616 | ) | | | 66,418 | |
| Reserves | | | 1,159,249 | | | | 532,563 | | | | 12,468 | | | | (542,171 | ) | | | 1,162,109 | |
| | | | | | | | | | | | | | | | | | | | | |
| | | | | | | | | | | | | | | | | | | | | |
| Total equity attributable to equity shareholders of the Company | | | 1,225,667 | | | | 548,048 | | | | 20,599 | | | | | | | | 1,228,527 | |
| | | | | | | | | | | | | | | | | | | | | |
| | |
| Note: | | The amounts of investment in subsidiaries and retained profits at City Telecom (H.K.) Limited level have included the share of net assets of its subsidiaries using the equity method of accounting. |
F-48
City Telecom (H.K.) Limited
Consolidated financial statements for the year August 31, 2007
3132 | | Supplemental guarantors consolidated financial information (continued) |
Condensed consolidated balance sheet as of August 31, 2006
| | | | | | | | | | | | |
| | | City Telecom (H.K.) Limited | | Guarantor subsidiaries | | Non- guarantor subsidiary | | | Eliminating entries | | | Consolidated total |
| | | HK$’000 | | HK$’000 | | HK$’000 | | | HK$’000 | | | HK$’000 |
Current assets | | | | | | | | | | | | |
| | | | | |
Cash and bank balances | | 86,670 | | 31,349 | | 26,898 | | | | | | 144,917 |
Term deposit | | 121,037 | | 65,000 | | 51,459 | | | | | | 237,496 |
Pledged bank deposits | | 87,022 | | — | | — | | | | | | 87,022 |
Trade receivables, net | | 12,506 | | 128,092 | | — | | | | | | 140,598 |
Other receivables, deposits and prepayments | | 5,210 | | 73,785 | | 2,292 | | | (3,704 | ) | | 77,583 |
Inventories | | 812 | | 44 | | — | | | | | | 856 |
Deferred expenditure | | — | | 10,808 | | — | | | | | | 10,808 |
Tax recoverable | | — | | 347 | | — | | | | | | 347 |
| | | | | | | | | | | | |
Total current assets | | 313,257 | | 309,425 | | 80,649 | | | | | | 699,627 |
Fixed assets, net | | 115,014 | | 1,236,269 | | 15,951 | | | | | | 1,367,234 |
Investments in subsidiaries (note) | | 1,502,480 | | 245,819 | | — | | | (1,748,299 | ) | | — |
Investment securities | | 36,645 | | 3,629 | | — | | | | | | 40,274 |
Other long-term assets | | — | | 37,609 | | — | | | (20,529 | ) | | 17,080 |
| | | | | | | | | | | | |
Total assets | | 1,967,396 | | 1,832,751 | | 96,600 | | | | | | 2,124,215 |
| | | | | | | | | | | | |
Current liabilities | | | | | | | | | | | | |
| | | | | |
Amounts due to subsidiaries/ fellow subsidiaries | | 10,830 | | 1,428,297 | | 75,315 | | | (1,514,442 | ) | | — |
Trade payables | | 59,143 | | 27,242 | | — | | | | | | 86,385 |
Deposits received | | 8,283 | | 7,947 | | — | | | | | | 16,230 |
Current portion of deferred service income | | 8,157 | | 29,282 | | — | | | (3,696 | ) | | 33,743 |
Other payables and accrued charges | | 19,116 | | 117,734 | | 6,636 | | | | | | 143,486 |
Income tax payable | | 908 | | 18 | | 1,038 | | | | | | 1,964 |
Current portion of obligation under finance leases | | 71 | | 1,226 | | — | | | | | | 1,297 |
| | | | | | | | | | | | |
Total current liabilities | | 106,508 | | 1,611,746 | | 82,989 | | | | | | 283,105 |
Long-term liabilities | | 969,891 | | 1,166 | | (56 | ) | | (21,545 | ) | | 949,456 |
| | | | | | | | | | | | |
Total liabilities | | 1,076,399 | | 1,612,912 | | 82,933 | | | | | | 1,232,561 |
| | | | | | | | | | | | |
City Telecom (H.K.) Limited
Consolidated financial statements for the year August 31, 2007
31 | Supplemental guarantors consolidated financial information (continued) |
Condensed consolidated balance sheet as of August 31, 2006 (continued)
| | | | | | | | | | | | |
| | | City Telecom (H.K.) Limited | | Guarantor subsidiaries | | | Non- guarantor subsidiary | | Eliminating entries | | | Consolidated total |
| | | HK$’000 | | HK$’000 | | | HK$’000 | | HK$’000 | | | HK$’000 |
Commitments andcontingencies | | | | | | | | | | | | |
| | | | | |
Shareholders’ equity | | | | | | | | | | | | |
- Ordinary shares, par value | | | | | | | | | | | | |
HK$0.1 per share | | | | | | | | | | | | |
- 2,000,000,000 shares authorised | | | | | | | | | | | | |
- 614,175,404 shares issued and outstanding at August 31, 2006 | | 61,417 | | 15,485 | | | 8,131 | | (23,616 | ) | | 61,417 |
Share premium | | 620,298 | | 470,836 | | | — | | (470,836 | ) | | 620,298 |
Retained profits/(accumulated losses) | | 196,289 | | (266,477 | ) | | 5,217 | | 261,260 | | | 196,289 |
Other reserves | | 12,993 | | (5 | ) | | 319 | | 343 | | | 13,650 |
| | | | | | | | | | | | |
Total shareholders’ equity | | 890,997 | | 219,839 | | | 13,667 | | | | | 891,654 |
| | | | | | | | | | | | |
Total liabilities and shareholders’ equity | | 1,967,396 | | 1,832,751 | | | 96,600 | | | | | 2,124,215 |
| | | | | | | | | | | | |
| | | Consolidated balance sheet as of August 31, 2008 |
| | | | | | | | | | | | | | | | | | | | | |
| | | City | | | | | | | | | | |
| | | Telecom | | | | | | Non- | | | | |
| | | (H.K.) | | Guarantor | | guarantor | | Eliminating | | Consolidated |
| | | Limited | | subsidiaries | | subsidiary | | entries | | total |
| | | HK$’000 | | HK$’000 | | HK$’000 | | HK$’000 | | HK$’000 |
Non-current assets | | | | | | | | | | | | | | | | | | | | |
| | | | | | | | | | | | | | | | | | | | | |
| Investments in subsidiaries (note) | | | 1,499,437 | | | | 260,399 | | | | — | | | | (1,759,836 | ) | | | — | |
| Goodwill | | | — | | | | — | | | | — | | | | 1,066 | | | | 1,066 | |
| Fixed assets | | | 87,483 | | | | 1,135,394 | | | | 8,522 | | | | | | | | 1,231,399 | |
| Long term receivable and prepayment | | | — | | | | 19,773 | | | | — | | | | (14,187 | ) | | | 5,586 | |
| Deferred expenditure | | | — | | | | 15,391 | | | | — | | | | | | | | 15,391 | |
| Deferred tax assets | | | — | | | | 26,335 | | | | — | | | | | | | | 26,335 | |
| | | | | | | | | | | | | | | | | | | | | |
| | | | | | | | | | | | | | | | | | | | | |
| | | | 1,586,920 | | | | 1,457,292 | | | | 8,522 | | | | | | | | 1,279,777 | |
| | | | | | | | | | | | | | | | | | | | | |
| | | | | | | | | | | | | | | | | | | | | |
Current assets | | | | | | | | | | | | | | | | | | | | |
| | | | | | | | | | | | | | | | | | | | | |
| Accounts receivable | | | 11,418 | | | | 128,865 | | | | — | | | | | | | | 140,283 | |
| Other receivables, deposits and prepayments | | | 3,378 | | | | 80,293 | | | | 2,759 | | | | (3,704 | ) | | | 82,726 | |
| Deferred expenditure | | | — | | | | 40,704 | | | | — | | | | | | | | 40,704 | |
| Other financial assets | | | 27,997 | | | | — | | | | — | | | | | | | | 27,997 | |
| Pledged bank deposits | | | 87,319 | | | | — | | | | — | | | | | | | | 87,319 | |
| Cash at bank and in hand | | | 90,386 | | | | 263,386 | | | | 67,838 | | | | | | | | 421,610 | |
| | | | | | | | | | | | | | | | | | | | | |
| | | | | | | | | | | | | | | | | | | | | |
| | | | 220,498 | | | | 513,248 | | | | 70,597 | | | | | | | | 800,639 | |
| | | | | | | | | | | | | | | | | | | | | |
| | | | | | | | | | | | | | | | | | | | | |
Current liabilities | | | | | | | | | | | | | | | | | | | | |
| | | | | | | | | | | | | | | | | | | | | |
| Amounts due to subsidiaries/ fellow subsidiaries | | | 10,830 | | | | 1,316,410 | | | | 51,059 | | | | (1,378,299 | ) | | | — | |
| Accounts payable | | | 26,440 | | | | 25,884 | | | | — | | | | | | | | 52,324 | |
| Other payables and accrued charges | | | 17,831 | | | | 149,548 | | | | 10,735 | | | | | | | | 178,114 | |
| Deposits received | | | 7,943 | | | | 8,321 | | | | — | | | | | | | | 16,264 | |
| Deferred service revenue | | | 11,172 | | | | 102,678 | | | | — | | | | (3,401 | ) | | | 110,449 | |
| Tax payable | | | 356 | | | | 496 | | | | 1,251 | | | | | | | | 2,103 | |
| Current portion — obligation under finance leases | | | 112 | | | | 9 | | | | — | | | | | | | | 121 | |
| | | | | | | | | | | | | | | | | | | | | |
| | | | | | | | | | | | | | | | | | | | | |
| | | | 74,684 | | | | 1,603,346 | | | | 63,045 | | | | | | | | 359,375 | |
| | | | | | | | | | | | | | | | | | | | | |
| | | | | | | | | | | | | | | | | | | | | |
Net current assets/ (liabilities) | | | 145,814 | | | | (1,090,098 | ) | | | 7,552 | | | | | | | | 441,264 | |
| | | | | | | | | | | | | | | | | | | | | |
| | | | | | | | | | | | | | | | | | | | | |
Total assets less current liabilities | | | 1,732,734 | | | | 367,194 | | | | 16,074 | | | | | | | | 1,721,041 | |
| | | | | | | | | | | | | | | | | | | | | |
| | | | | | | | | | | | | | | | | | | | | |
Non-current liabilities | | | | | | | | | | | | | | | | | | | | |
| Deferred tax liabilities | | | 4,937 | | | | — | | | | — | | | | | | �� | | 4,937 | |
| Long-term deferred service revenue | | | 14,500 | | | | — | | | | — | | | | (14,500 | ) | | | — | |
| Long-term debt and other liabilities | | | 683,480 | | | | 17 | | | | — | | | | | | | | 683,497 | |
| | | | | | | | | | | | | | | | | | | | | |
| | | | 702,917 | | | | 17 | | | | — | | | | | | | | 688,434 | |
| | | | | | | | | | | | | | | | | | | | | |
| | | | | | | | | | | | | | | | | | | | | |
Net assets | | | 1,029,817 | | | | 367,177 | | | | 16,074 | | | | | | | | 1,032,607 | |
| | | | | | | | | | | | | | | | | | | | | |
| | | | | | | | | | | | | | | | | | | | | |
Capital and reserves | | | | | | | | | | | | | | | | | | | | |
| | | | | | | | | | | | | | | | | | | | | |
| Share capital | | | 65,062 | | | | 15,485 | | | | 8,131 | | | | (23,616 | ) | | | 65,062 | |
| Reserves | | | 964,755 | | | | 351,692 | | | | 7,943 | | | | (356,845 | ) | | | 967,545 | |
| | | | | | | | | | | | | | | | | | | | | |
| | | | | | | | | | | | | | | | | | | | | |
| Total equity attributable to equity shareholders of the Company | | | 1,029,817 | | | | 367,177 | | | | 16,074 | | | | | | | | 1,032,607 | |
| | | | | | | | | | | | | | | | | | | | | |
| | |
| Note: | | The amounts of investment in subsidiaries and retained profits at City Telecom (H.K.) Limited level have included the share of net assets of its subsidiaries using the equity method of accounting. |
F-49
City Telecom (H.K.) Limited
Consolidated financial statements for the year August 31, 2007
3132 | | Supplemental guarantors consolidated financial information (continued) |
Condensed consolidated statement of operations for the year ended August 31, 2007
| | | | | | | | | | | | | | | |
| | | City Telecom
(H.K.) Limited | | | Guarantor
subsidiaries | | | Non-
guarantor
subsidiary | | | Eliminating
entries | | | Consolidated
Total | |
| | | HK$’000 | | | HK$’000 | | | HK$’000 | | | HK$’000 | | | HK$’000 | |
Revenue | | 124,017 | | | 1,186,356 | | | 108,692 | | | (277,795 | ) | | 1,141,270 | |
Network costs | | (50,522 | ) | | (203,506 | ) | | — | | | 39,437 | | | (214,591 | ) |
Operating expenses: | | | | | | | | | | | | | | | |
- Salaries and related costs | | (30,475 | ) | | (209,065 | ) | | (77,594 | ) | | 96,032 | | | (221,102 | ) |
- Sales and marketing expenses | | (12,601 | ) | | (362,975 | ) | | — | | | 171,903 | | | (203,673 | ) |
- General and administrative expenses | | (43,149 | ) | | (344,162 | ) | | (26,050 | ) | | 10,601 | | | (402,760 | ) |
- Provision for doubtful accounts | | (796 | ) | | (5,773 | ) | | — | | | | | | (6,569 | ) |
| | | | | | | | | | | | | | | |
Income/(loss) from operations | | (13,526 | ) | | 60,875 | | | 5,048 | | | | | | 92,575 | |
Interest income | | 13,390 | | | 8,606 | | | 675 | | | | | | 22,671 | |
Interest expense | | (87,474 | ) | | (68,161 | ) | | — | | | 68,131 | | | (87,504 | ) |
Other income, net | | 50,031 | | | 59,200 | | | 43 | | | (106,125 | ) | | 3,149 | |
Share of net losses from subsidiaries (note) | | 66,444 | | | — | | | — | | | (66,444 | ) | | — | |
| | | | | | | | | | | | | | | |
Income before taxation | | 28,865 | | | 60,520 | | | 5,766 | | | | | | 30,891 | |
Income tax credit | | — | | | (75 | ) | | (1,951 | ) | | | | | (2,026 | ) |
| | | | | | | | | | | | | | | |
Net income | | 28,865 | | | 60,445 | | | 3,815 | | | | | | 28,865 | |
| | | | | | | | | | | | | | | |
|
| | | Consolidated income statement for the year ended August 31, 2009 |
| | | | | | | | | | | | | | | | | | | | | |
| | | City | | | | | | | | | | |
| | | Telecom | | | | | | Non- | | | | |
| | | (H.K.) | | Guarantor | | guarantor | | Eliminating | | Consolidated |
| | | Limited | | subsidiaries | | subsidiary | | entries | | Total |
| | | HK$’000 | | HK$’000 | | HK$’000 | | HK$’000 | | HK$’000 |
| Revenue | | | 95,386 | | | | 1,390,697 | | | | 142,603 | | | | (150,447 | ) | | | 1,478,239 | |
| Network costs | | | (29,973 | ) | | | (177,655 | ) | | | — | | | | 32,499 | | | | (175,129 | ) |
| Other operating expenses | | | (90,557 | ) | | | (959,960 | ) | | | (136,750 | ) | | | 149,303 | | | | (1,037,964 | ) |
| Other revenues | | | 108,933 | | | | 31,684 | | | | 576 | | | | (99,653 | ) | | | 41,540 | |
| Finance costs | | | (54,241 | ) | | | (69,017 | ) | | | — | | | | 68,131 | | | | (55,127 | ) |
| Share of net profit from subsidiaries (note) | | | 185,391 | | | | — | | | | — | | | | (185,391 | ) | | | — | |
| | | | | | | | | | | | | | | | | | | | | |
| | | | | | | | | | | | | | | | | | | | | |
| Profit before taxation | | | 214,939 | | | | 215,749 | | | | 6,429 | | | | | | | | 251,559 | |
| Income tax expense | | | (2,110 | ) | | | (34,998 | ) | | | (1,622 | ) | | | | | | | (38,730 | ) |
| | | | | | | | | | | | | | | | | | | | | |
| | | | | | | | | | | | | | | | | | | | | |
| Net profit | | | 212,829 | | | | 180,751 | | | | 4,807 | | | | | | | | 212,829 | |
| | | | | | | | | | | | | | | | | | | | | |
| | |
| Note: | | The net (loss)/incomeprofit amounts at City Telecom (H.K.) Limited level have included the share of net (losses)/incomeprofit of its subsidiaries using the equity method of accounting. |
City Telecom (H.K.) Limited
Consolidated financial statements for the year August 31, 2007
31 | Supplemental guarantors consolidated financial information (continued) |
Condensed consolidated statement of operations for the year ended August 31, 2006
| | | | | | | | | | | | | | | |
| | | City Telecom (H.K.) Limited | | | Guarantor
subsidiaries | | | Non-
guarantor
subsidiary | | | Eliminating
entries | | | Consolidated
total | |
| | | HK$’000 | | | HK$’000 | | | HK$’000 | | | HK$’000 | | | HK$’000 | |
Revenue | | 174,113 | | | 1,110,256 | | | 116,355 | | | (265,848 | ) | | 1,134,876 | |
Network costs | | (87,849 | ) | | (254,740 | ) | | — | | | 41,996 | | | (300,593 | ) |
Operating expenses: | | | | | | | | | | | | | | | |
- Salaries and related costs | | (44,254 | ) | | (233,105 | ) | | (81,887 | ) | | 102,525 | | | (256,721 | ) |
- Sales and marketing expenses | | (20,567 | ) | | (336,985 | ) | | — | | | 152,600 | | | (204,952 | ) |
- General and administrative expenses | | (56,366 | ) | | (366,635 | ) | | (30,353 | ) | | 12,682 | | | (440,672 | ) |
- Provision for doubtful accounts | | (1,090 | ) | | (16,360 | ) | | — | | | | | | (17,450 | ) |
| | | | | | | | | | | | | | | |
(Loss)/income from operations | | (36,013 | ) | | (97,569 | ) | | 4,115 | | | | | | (85,512 | ) |
Interest income | | 16,594 | | | 2,946 | | | 838 | | | | | | 20,378 | |
Interest expense | | (88,584 | ) | | (60,454 | ) | | — | | | 60,401 | | | (88,637 | ) |
Other income, net | | 67,672 | | | 39,201 | | | 2,245 | | | (104,653 | ) | | 4,465 | |
Share of net losses from subsidiaries (note) | | (111,171 | ) | | — | | | — | | | 111,171 | | | — | |
| | | | | | | | | | | | | | | |
(Loss)/income before taxation | | (151,502 | ) | | (115,876 | ) | | 7,198 | | | | | | (149,306 | ) |
Income tax expense/(credit) | | 9,440 | | | 11 | | | (2,207 | ) | | | | | 7,244 | |
| | | | | | | | | | | | | | | |
Net (loss)/income | | (142,062 | ) | | (115,865 | ) | | 4,991 | | | | | | (142,062 | ) |
| | | | | | | | | | | | | | | |
| | | Consolidated income statement for the year ended August 31, 2008 |
| | | | | | | | | | | | | | | | | | | | | |
| | | City | | | | | | | | | | |
| | | Telecom | | | | | | Non- | | | | |
| | | (H.K.) | | Guarantor | | guarantor | | Eliminating | | Consolidated |
| | | Limited | | subsidiaries | | subsidiary | | entries | | Total |
| | | HK$’000 | | HK$’000 | | HK$’000 | | HK$’000 | | HK$’000 |
| Revenue | | | 116,130 | | | | 1,283,296 | | | | 135,374 | | | | (231,819 | ) | | | 1,302,981 | |
| Network costs | | | (28,398 | ) | | | (184,851 | ) | | | — | | | | 34,882 | | | | (178,367 | ) |
| Other operating expenses | | | (87,551 | ) | | | (978,990 | ) | | | (130,481 | ) | | | 230,928 | | | | (966,094 | ) |
| Other revenues | | | 93,494 | | | | 37,752 | | | | 1,336 | | | | (107,593 | ) | | | 24,989 | |
| Finance costs | | | (71,702 | ) | | | (71,753 | ) | | | — | | | | 68,318 | | | | (75,137 | ) |
| Share of net profit from subsidiaries (note) | | | 108,154 | | | | — | | | | — | | | | (108,154 | ) | | | — | |
| | | | | | | | | | | | | | | | | | | | | |
| | | | | | | | | | | | | | | | | | | | | |
| Profit before taxation | | | 130,127 | | | | 85,454 | | | | 6,229 | | | | | | | | 108,372 | |
| Income tax (expense)/benefit | | | (4,937 | ) | | | 26,306 | | | | (4,551 | ) | | | | | | | 16,818 | |
| | | | | | | | | | | | | | | | | | | | | |
| | | | | | | | | | | | | | | | | | | | | |
| Net profit | | | 125,190 | | | | 111,760 | | | | 1,678 | | | | | | | | 125,190 | |
| | | | | | | | | | | | | | | | | | | | | |
| | |
| Note: | | The net (loss)/incomeprofit amounts at City Telecom (H.K.) Limited level have included the share of net (losses)/incomeprofit of its subsidiaries using the equity method of accounting. |
F-50
City Telecom (H.K.) Limited
Consolidated financial statements for the year August 31, 2007
3132 | | Supplemental guarantors consolidated financial information (continued) |
|
| | Condensed consolidated cash flow statement for the year ended August 31, 2009 |
Condensed consolidated statement of operations for the year ended August 31, 2005
| | | | | | | | | | | | | | | |
| | | City
Telecom
(H.K.)
Limited | | | Guarantor
subsidiaries | | | Non-
guarantor
subsidiary | | | Eliminating
entries | | | Consolidated
total | |
| | | HK$’000 | | | HK$’000 | | | HK$’000 | | | HK$’000 | | | HK$’000 | |
Revenue | | 227,045 | | | 1,104,389 | | | 122,054 | | | (291,429 | ) | | 1,162,059 | |
Network costs | | (111,836 | ) | | (271,203 | ) | | — | | | 43,637 | | | (339,402 | ) |
Operating expenses: | | | | | | | | | | | | | | | |
- Salaries and related costs | | (50,705 | ) | | (224,799 | ) | | (94,120 | ) | | 110,232 | | | (259,392 | ) |
- Sales and marketing expenses | | (25,506 | ) | | (416,728 | ) | | — | | | 174,251 | | | (267,983 | ) |
- General and administrative expenses | | (65,552 | ) | | (316,284 | ) | | (26,132 | ) | | 12,757 | | | (395,211 | ) |
- Provision for doubtful accounts | | (1,814 | ) | | (33,631 | ) | | — | | | | | | (35,445 | ) |
| | | | | | | | | | | | | | | |
(Loss)/income from operations | | (28,368 | ) | | (158,256 | ) | | 1,802 | | | | | | (135,374 | ) |
Interest income | | 13,061 | | | 403 | | | 114 | | | | | | 13,578 | |
Interest expense | | (54,167 | ) | | (17,354 | ) | | — | | | 17,059 | | | (54,462 | ) |
Other income, net | | 25,617 | | | 43,515 | | | 99 | | | (63,194 | ) | | 6,037 | |
Share of net losses from subsidiaries (note) | | (128,156 | ) | | — | | | — | | | 128,156 | | | — | |
| | | | | | | | | | | | | | | |
(Loss)/income before taxation | | (172,013 | ) | | (131,692 | ) | | 2,015 | | | | | | (170,221 | ) |
Income tax expense/(credit) | | 8,517 | | | (854 | ) | | (938 | ) | | | | | 6,725 | |
| | | | | | | | | | | | | | | |
Net (loss)/income | | (163,496 | ) | | (130,546 | ) | | 1,077 | | | | | | (163,496 | ) |
| | | | | | | | | | | | | | | |
| | | | | | | | | | | | | | | | | | | | | |
| | | City | | | | | | | | | | |
| | | Telecom | | | | | | Non- | | | | |
| | | (H.K.) | | Guarantor | | guarantor | | Eliminating | | Consolidated |
| | | Limited | | subsidiaries | | subsidiary | | entries | | total |
| | | HK$’000 | | HK$’000 | | HK$’000 | | HK$’000 | | HK$’000 |
| Net cash inflow/(outflow) from operating activities | | | 487,691 | | | | 87,358 | | | | (38,930 | ) | | | (233 | ) | | | 535,886 | |
| Net cash inflow/(outflow) from investing activities | | | 101,605 | | | | (276,843 | ) | | | (1,250 | ) | | | | | | | (176,488 | ) |
| Net cash outflow from financing activities | | | (560,397 | ) | | | (10 | ) | | | — | | | | | | | | (560,407 | ) |
| | | | | | | | | | | | | | | | | | | | | |
| | | | | | | | | | | | | | | | | | | | | |
| Increase/(decrease) in cash at bank and in hand | | | 28,899 | | | | (189,495 | ) | | | (40,180 | ) | | | | | | | (201,009 | ) |
| Cash at bank in hand at September 1, 2008 | | | 90,386 | | | | 263,386 | | | | 67,838 | | | | | | | | 421,610 | |
| Effects of foreign exchange rates changes | | | 134 | | | | 306 | | | | (222 | ) | | | 233 | | | | 451 | |
| | | | | | | | | | | | | | | | | | | | | |
| | | | | | | | | | | | | | | | | | | | | |
| Cash at bank and in hand at August 31, 2009 | | | 119,419 | | | | 74,197 | | | | 27,436 | | | | | | | | 221,052 | |
| | | | | | | | | | | | | | | | | | | | | |
| | Note: | The net loss amounts at City Telecom (H.K.) Limited level have includedCondensed consolidated cash flow statement for the share of net income/(losses) of its subsidiaries using the equity method of accounting.year ended August 31, 2008 |
| | | | | | | | | | | | | | | | | | | | | |
| | | City | | | | | | | | | | |
| | | Telecom | | | | | | Non- | | | | |
| | | (H.K.) | | Guarantor | | guarantor | | Eliminating | | Consolidated |
| | | Limited | | subsidiaries | | subsidiary | | entries | | total |
| | | HK$’000 | | HK$’000 | | HK$’000 | | HK$’000 | | HK$’000 |
| Net cash inflow from operating activities | | | 193,028 | | | | 125,511 | | | | 59,866 | | | | 158 | | | | 378,563 | |
| Net cash inflow/(outflow) from investing activities | | | 18,775 | | | | (164,222 | ) | | | (2,303 | ) | | | | | | | (147,750 | ) |
| Net cash outflow from financing activities | | | (341,813 | ) | | | (737 | ) | | | — | | | | | | | | (342,550 | ) |
| | | | | | | | | | | | | | | | | | | | | |
| | | | | | | | | | | | | | | | | | | | | |
| (Decrease)/increase in cash at bank and in hand | | | (130,010 | ) | | | (39,448 | ) | | | 57,563 | | | | | | | | (111,737 | ) |
| Cash at bank and in hand at September 1, 2007 | | | 220,531 | | | | 303,227 | | | | 9,136 | | | | | | | | 532,894 | |
| Effects of foreign exchange rates changes | | | (135 | ) | | | (393 | ) | | | 1,139 | | | | (158 | ) | | | 453 | |
| | | | | | | | | | | | | | | | | | | | | |
| | | | | | | | | | | | | | | | | | | | | |
| Cash at bank and in hand at August 31, 2008 | | | 90,386 | | | | 263,386 | | | | 67,838 | | | | | | | | 421,610 | |
| | | | | | | | | | | | | | | | | | | | | |
F-51
City Telecom (H.K.) Limited
Consolidated financial statements for the year August 31, 2007
31 | Supplemental guarantors consolidated financial information (continued) |
Condensed consolidated statement of cash flows for the year ended August 31, 2007SIGNATURE | | | | | | | | | | | | | | | |
| | | City Telecom (H.K.) Limited | | | Guarantor
subsidiaries | | | Non-
guarantor
subsidiary | | | Eliminating
entries | | | Consolidated
total | |
| | | HK$’000 | | | HK$’000 | | | HK$’000 | | | HK$’000 | | | HK$’000 | |
Net cash provided/(used in) by operating activities | | 110,190 | | | 342,627 | | | (69,035 | ) | | 217 | | | 383,999 | |
Net cash generated from/ (used in) investing activities | | 132,039 | | | (69,197 | ) | | 51,211 | | | | | | 114,053 | |
Net cash (used in)/provided by financing activities | | (108,277 | ) | | (1,227 | ) | | — | | | | | | (109,504 | ) |
| | | | | | | | | | | | | | | |
Net increase/(decrease) in cash and bank balances | | 133,952 | | | 272,203 | | | (17,824 | ) | | | | | 388,548 | |
Cash and bank balances at beginning of year | | 86,670 | | | 31,349 | | | 26,898 | | | | | | 144,917 | |
Effects of foreign exchange rates changes | | (91 | ) | | (325 | ) | | 62 | | | (217 | ) | | (571 | ) |
| | | | | | | | | | | | | | | |
Cash and bank balances at end of year | | 220,531 | | | 303,227 | | | 9,136 | | | | | | 532,894 | |
| | | | | | | | | | | | | | | |
Condensed consolidated statement of cash flows for the year ended August 31, 2006
| | | | | | | | | | | | | | | |
| | | City
Telecom
(H.K.)
Limited | | | Guarantor
subsidiaries | | | Non-
guarantor
subsidiary | | | Eliminating
entries | | | Consolidated
total | |
| | | HK$’000 | | | HK$’000 | | | HK$’000 | | | HK$’000 | | | HK$’000 | |
Net cash (used in)/provided by operating activities | | (278,174 | ) | | 403,086 | | | 58,994 | | | 245 | | | 184,151 | |
Net cash used in investing activities | | (12,087 | ) | | (425,348 | ) | | (55,307 | ) | | | | | (492,742 | ) |
Net cash provided by financing activities | | (85,238 | ) | | (1,248 | ) | | — | | | 54 | | | (86,432 | ) |
| | | | | | | | | | | | | | | |
Net (decrease)/increase in cash and bank balances | | (375,499 | ) | | (23,510 | ) | | 3,687 | | | | | | (395,023 | ) |
Cash and bank balances at beginning of year | | 461,001 | | | 55,309 | | | 23,281 | | | | | | 539,591 | |
Effects of foreign exchange rates changes | | 1,168 | | | (450 | ) | | (70 | ) | | (299 | ) | | 349 | |
| | | | | | | | | | | | | | | |
Cash and bank balances at end of year | | 86,670 | | | 31,349 | | | 26,898 | | | | | | 144,917 | |
| | | | | | | | | | | | | | | |
City Telecom (H.K.) Limited
Consolidated financial statements for the year August 31, 2007
31 | Supplemental guarantors consolidated financial information (continued) |
Condensed consolidated statement of cash flows for the year ended August 31, 2005
| | | | | | | | | | | | | | | |
| | | City
Telecom
(H.K.)
Limited | | | Guarantor
subsidiaries | | | Non-
guarantor
subsidiary | | | Eliminating
entries | | | Consolidated
total | |
| | | HK$’000 | | | HK$’000 | | | HK$’000 | | | HK$’000 | | | HK$’000 | |
| | | | | | | | | | | | (Note (a)) | | | | |
Net cash (used in)/provided by operating activities | | (75,334 | ) | | 129,263 | | | 23,094 | | | 360 | | | 77,383 | |
Net cash used in investing activities | | (536,911 | ) | | (497,143 | ) | | (5,786 | ) | | 482,400 | | | (557,440 | ) |
Net cash provided by financing activities | | 892,713 | | | 381,903 | | | — | | | (482,400 | ) | | 792,216 | |
| | | | | | | | | | | | | | | |
Net increase in cash and bank balances | | 280,468 | | | 14,023 | | | 17,308 | | | | | | 312,159 | |
Cash and bank balances at beginning of year | | 180,473 | | | 41,691 | | | 6,183 | | | | | | 228,347 | |
Effects of foreign exchange rates changes | | 60 | | | (405 | ) | | (210 | ) | | (360 | ) | | (915 | ) |
| | | | | | | | | | | | | | | |
Cash and bank balances at end of year | | 461,001 | | | 55,309 | | | 23,281 | | | | | | 539,591 | |
| | | | | | | | | | | | | | | |
SIGNATURE
The registrant hereby certifies that it meets all of the requirements for filing on Form 20-F and that it has duly caused and authorized the undersigned to sign this annual report on its behalf.
| | | | | | |
| | CITY TELECOM (H.K.) LIMITED | | |
| | | | | | |
| | By: | | /s/ Yeung Chu Kwong, William | | |
| | Name: | | Yeung Chu Kwong, William | | |
| | Title: | | Chief Executive Officer | | |
| | | | | | |
| | By: | | /s/ Lai Ni Quiaque | | |
| | Name: | | Lai Ni Quiaque | | |
| | Title: | | Chief Financial Officer | | |
Date: January 28, 2008December 18, 2009